- nevadagrant.nv.gov/uploadedfiles/grantnvgov/content/advisorycouncil/for... · 0 guinn center for...
TRANSCRIPT

www.guinncenter.org
www.guinncenter.org
0
www.guinncenter.org
Guinn Center for Policy Priorities Meredith A. Levine, Director of Economic Policy | [email protected]
The Role of Grant Funding in Nevada’s 2017-2019 Budget
Nevada Advisory Council on Federal Assistance Meeting November 1, 2017
1
www.guinncenter.org
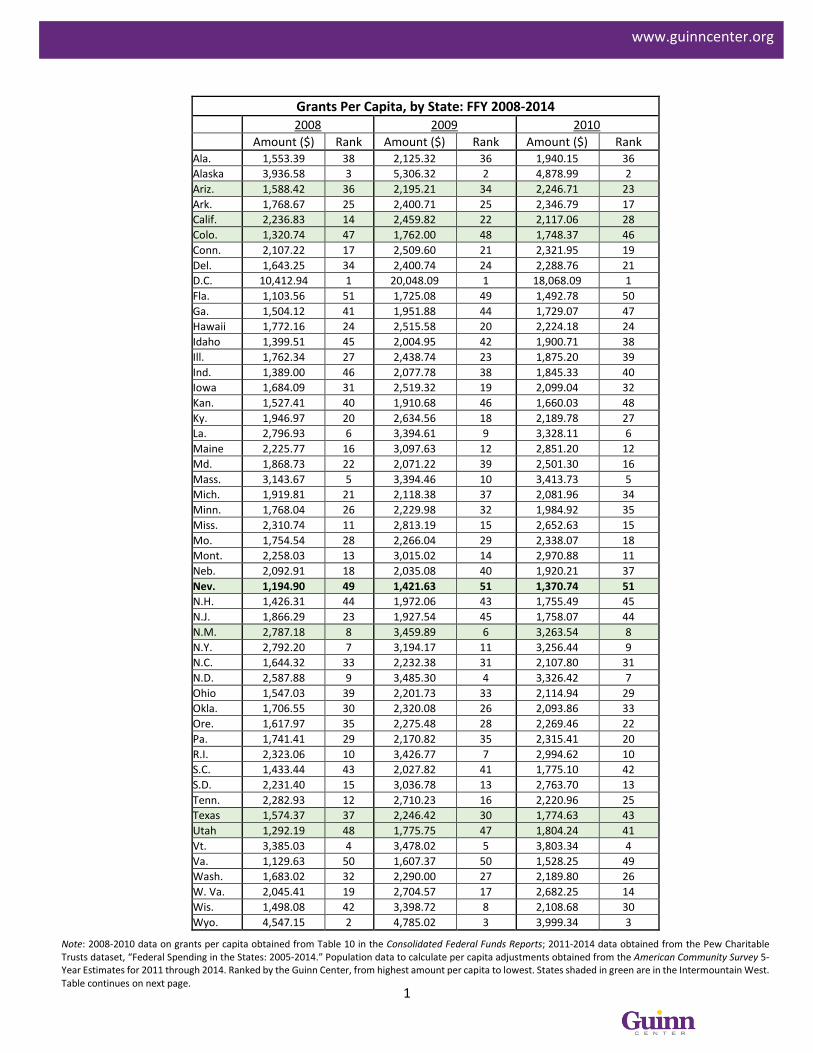
Grants Per Capita, by State: FFY 2008-2014 2008 2009 2010 Amount ($) Rank Amount ($) Rank Amount ($) Rank Ala. 1,553.39 38 2,125.32 36 1,940.15 36 Alaska 3,936.58 3 5,306.32 2 4,878.99 2 Ariz. 1,588.42 36 2,195.21 34 2,246.71 23 Ark. 1,768.67 25 2,400.71 25 2,346.79 17 Calif. 2,236.83 14 2,459.82 22 2,117.06 28 Colo. 1,320.74 47 1,762.00 48 1,748.37 46 Conn. 2,107.22 17 2,509.60 21 2,321.95 19 Del. 1,643.25 34 2,400.74 24 2,288.76 21 D.C. 10,412.94 1 20,048.09 1 18,068.09 1 Fla. 1,103.56 51 1,725.08 49 1,492.78 50 Ga. 1,504.12 41 1,951.88 44 1,729.07 47 Hawaii 1,772.16 24 2,515.58 20 2,224.18 24 Idaho 1,399.51 45 2,004.95 42 1,900.71 38 Ill. 1,762.34 27 2,438.74 23 1,875.20 39 Ind. 1,389.00 46 2,077.78 38 1,845.33 40 Iowa 1,684.09 31 2,519.32 19 2,099.04 32 Kan. 1,527.41 40 1,910.68 46 1,660.03 48 Ky. 1,946.97 20 2,634.56 18 2,189.78 27 La. 2,796.93 6 3,394.61 9 3,328.11 6 Maine 2,225.77 16 3,097.63 12 2,851.20 12 Md. 1,868.73 22 2,071.22 39 2,501.30 16 Mass. 3,143.67 5 3,394.46 10 3,413.73 5 Mich. 1,919.81 21 2,118.38 37 2,081.96 34 Minn. 1,768.04 26 2,229.98 32 1,984.92 35 Miss. 2,310.74 11 2,813.19 15 2,652.63 15 Mo. 1,754.54 28 2,266.04 29 2,338.07 18 Mont. 2,258.03 13 3,015.02 14 2,970.88 11 Neb. 2,092.91 18 2,035.08 40 1,920.21 37 Nev. 1,194.90 49 1,421.63 51 1,370.74 51 N.H. 1,426.31 44 1,972.06 43 1,755.49 45 N.J. 1,866.29 23 1,927.54 45 1,758.07 44 N.M. 2,787.18 8 3,459.89 6 3,263.54 8 N.Y. 2,792.20 7 3,194.17 11 3,256.44 9 N.C. 1,644.32 33 2,232.38 31 2,107.80 31 N.D. 2,587.88 9 3,485.30 4 3,326.42 7 Ohio 1,547.03 39 2,201.73 33 2,114.94 29 Okla. 1,706.55 30 2,320.08 26 2,093.86 33 Ore. 1,617.97 35 2,275.48 28 2,269.46 22 Pa. 1,741.41 29 2,170.82 35 2,315.41 20 R.I. 2,323.06 10 3,426.77 7 2,994.62 10 S.C. 1,433.44 43 2,027.82 41 1,775.10 42 S.D. 2,231.40 15 3,036.78 13 2,763.70 13 Tenn. 2,282.93 12 2,710.23 16 2,220.96 25 Texas 1,574.37 37 2,246.42 30 1,774.63 43 Utah 1,292.19 48 1,775.75 47 1,804.24 41 Vt. 3,385.03 4 3,478.02 5 3,803.34 4 Va. 1,129.63 50 1,607.37 50 1,528.25 49 Wash. 1,683.02 32 2,290.00 27 2,189.80 26 W. Va. 2,045.41 19 2,704.57 17 2,682.25 14 Wis. 1,498.08 42 3,398.72 8 2,108.68 30 Wyo. 4,547.15 2 4,785.02 3 3,999.34 3
Note: 2008-2010 data on grants per capita obtained from Table 10 in the Consolidated Federal Funds Reports; 2011-2014 data obtained from the Pew Charitable Trusts dataset, “Federal Spending in the States: 2005-2014.” Population data to calculate per capita adjustments obtained from the American Community Survey 5-Year Estimates for 2011 through 2014. Ranked by the Guinn Center, from highest amount per capita to lowest. States shaded in green are in the Intermountain West. Table continues on next page.
2
www.guinncenter.org
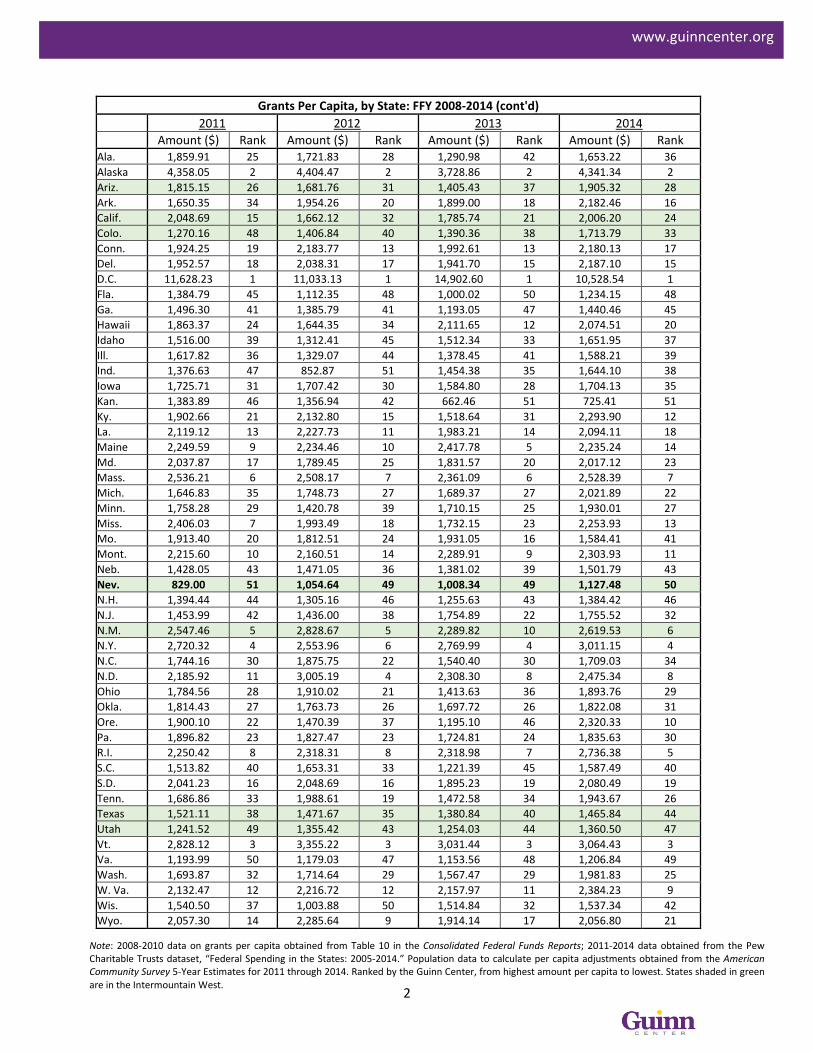
Grants Per Capita, by State: FFY 2008-2014 (cont'd) 2011 2012 2013 2014 Amount ($) Rank Amount ($) Rank Amount ($) Rank Amount ($) Rank Ala. 1,859.91 25 1,721.83 28 1,290.98 42 1,653.22 36 Alaska 4,358.05 2 4,404.47 2 3,728.86 2 4,341.34 2 Ariz. 1,815.15 26 1,681.76 31 1,405.43 37 1,905.32 28 Ark. 1,650.35 34 1,954.26 20 1,899.00 18 2,182.46 16 Calif. 2,048.69 15 1,662.12 32 1,785.74 21 2,006.20 24 Colo. 1,270.16 48 1,406.84 40 1,390.36 38 1,713.79 33 Conn. 1,924.25 19 2,183.77 13 1,992.61 13 2,180.13 17 Del. 1,952.57 18 2,038.31 17 1,941.70 15 2,187.10 15 D.C. 11,628.23 1 11,033.13 1 14,902.60 1 10,528.54 1 Fla. 1,384.79 45 1,112.35 48 1,000.02 50 1,234.15 48 Ga. 1,496.30 41 1,385.79 41 1,193.05 47 1,440.46 45 Hawaii 1,863.37 24 1,644.35 34 2,111.65 12 2,074.51 20 Idaho 1,516.00 39 1,312.41 45 1,512.34 33 1,651.95 37 Ill. 1,617.82 36 1,329.07 44 1,378.45 41 1,588.21 39 Ind. 1,376.63 47 852.87 51 1,454.38 35 1,644.10 38 Iowa 1,725.71 31 1,707.42 30 1,584.80 28 1,704.13 35 Kan. 1,383.89 46 1,356.94 42 662.46 51 725.41 51 Ky. 1,902.66 21 2,132.80 15 1,518.64 31 2,293.90 12 La. 2,119.12 13 2,227.73 11 1,983.21 14 2,094.11 18 Maine 2,249.59 9 2,234.46 10 2,417.78 5 2,235.24 14 Md. 2,037.87 17 1,789.45 25 1,831.57 20 2,017.12 23 Mass. 2,536.21 6 2,508.17 7 2,361.09 6 2,528.39 7 Mich. 1,646.83 35 1,748.73 27 1,689.37 27 2,021.89 22 Minn. 1,758.28 29 1,420.78 39 1,710.15 25 1,930.01 27 Miss. 2,406.03 7 1,993.49 18 1,732.15 23 2,253.93 13 Mo. 1,913.40 20 1,812.51 24 1,931.05 16 1,584.41 41 Mont. 2,215.60 10 2,160.51 14 2,289.91 9 2,303.93 11 Neb. 1,428.05 43 1,471.05 36 1,381.02 39 1,501.79 43 Nev. 829.00 51 1,054.64 49 1,008.34 49 1,127.48 50 N.H. 1,394.44 44 1,305.16 46 1,255.63 43 1,384.42 46 N.J. 1,453.99 42 1,436.00 38 1,754.89 22 1,755.52 32 N.M. 2,547.46 5 2,828.67 5 2,289.82 10 2,619.53 6 N.Y. 2,720.32 4 2,553.96 6 2,769.99 4 3,011.15 4 N.C. 1,744.16 30 1,875.75 22 1,540.40 30 1,709.03 34 N.D. 2,185.92 11 3,005.19 4 2,308.30 8 2,475.34 8 Ohio 1,784.56 28 1,910.02 21 1,413.63 36 1,893.76 29 Okla. 1,814.43 27 1,763.73 26 1,697.72 26 1,822.08 31 Ore. 1,900.10 22 1,470.39 37 1,195.10 46 2,320.33 10 Pa. 1,896.82 23 1,827.47 23 1,724.81 24 1,835.63 30 R.I. 2,250.42 8 2,318.31 8 2,318.98 7 2,736.38 5 S.C. 1,513.82 40 1,653.31 33 1,221.39 45 1,587.49 40 S.D. 2,041.23 16 2,048.69 16 1,895.23 19 2,080.49 19 Tenn. 1,686.86 33 1,988.61 19 1,472.58 34 1,943.67 26 Texas 1,521.11 38 1,471.67 35 1,380.84 40 1,465.84 44 Utah 1,241.52 49 1,355.42 43 1,254.03 44 1,360.50 47 Vt. 2,828.12 3 3,355.22 3 3,031.44 3 3,064.43 3 Va. 1,193.99 50 1,179.03 47 1,153.56 48 1,206.84 49 Wash. 1,693.87 32 1,714.64 29 1,567.47 29 1,981.83 25 W. Va. 2,132.47 12 2,216.72 12 2,157.97 11 2,384.23 9 Wis. 1,540.50 37 1,003.88 50 1,514.84 32 1,537.34 42 Wyo. 2,057.30 14 2,285.64 9 1,914.14 17 2,056.80 21
Note: 2008-2010 data on grants per capita obtained from Table 10 in the Consolidated Federal Funds Reports; 2011-2014 data obtained from the Pew Charitable Trusts dataset, “Federal Spending in the States: 2005-2014.” Population data to calculate per capita adjustments obtained from the American Community Survey 5-Year Estimates for 2011 through 2014. Ranked by the Guinn Center, from highest amount per capita to lowest. States shaded in green are in the Intermountain West.

3
www.guinncenter.org
Total Federal Government Expenditures Per Capita, by State: FFY 2008-2014 2008 2009 2010 Amount ($) Rank Amount ($) Rank Amount ($) Rank Ala. 10,288.89 14 11,611.33 12 11,819.83 12 Alaska 13,729.86 4 20,351.13 2 17,762.29 2 Ariz. 8,355.77 31 9,555.96 32 10,079.26 28 Ark. 8,355.00 32 9,448.88 36 9,912.49 31 Calif. 8,159.68 37 9,360.24 37 8,960.37 45 Colo. 7,696.15 42 9,514.08 34 9,879.68 32 Conn. 11,104.18 10 12,104.94 10 15,662.23 5 Del. 7,585.36 45 9,192.90 42 8,994.35 43 D.C. 79,757.02 1 83,196.12 1 102,904.18 1 Fla. 8,177.07 36 9,476.98 35 9,930.36 30 Ga. 7,657.09 43 8,537.55 49 9,536.58 34 Hawaii 11,651.37 7 19,000.95 4 15,331.33 6 Idaho 7,367.81 46 9,637.63 31 9,091.54 40 Ill. 7,803.05 41 8,990.43 45 8,570.70 48 Ind. 8,282.01 35 9,520.22 33 9,038.43 42 Iowa 7,969.03 38 9,763.93 30 9,315.67 36 Kan. 8,967.80 24 12,312.36 9 10,180.27 27 Ky. 12,242.03 5 11,592.63 13 13,197.90 8 La. 10,088.02 16 10,764.99 24 11,738.34 14 Maine 9,095.91 23 10,802.92 23 11,024.05 19 Md. 13,828.71 3 16,169.03 5 16,672.74 4 Mass. 11,098.08 11 12,722.98 8 12,592.89 10 Mich. 8,290.48 34 9,228.20 40 9,199.15 39 Minn. 7,326.22 47 8,676.32 48 8,366.58 50 Miss. 10,242.11 15 11,127.42 18 10,588.38 23 Mo. 10,289.77 13 11,347.24 16 11,746.36 13 Mont. 9,140.58 22 11,205.69 17 10,873.52 21 Neb. 8,824.98 26 9,198.58 41 9,051.87 41 Nev. 6,637.98 50 7,148.49 51 7,321.11 51 N.H. 7,836.62 40 8,942.06 46 8,610.37 47 N.J. 8,302.19 33 9,261.51 39 9,211.90 38 N.M. 12,017.05 6 13,669.99 6 13,577.73 7 N.Y. 8,931.16 25 9,977.52 29 10,437.87 25 N.C. 7,612.22 44 9,042.86 44 9,515.69 35 N.D. 11,415.11 8 13,322.99 7 12,929.83 9 Ohio 7,887.23 39 9,354.41 38 9,227.12 37 Okla. 8,718.97 27 10,175.03 27 10,256.30 26 Ore. 7,263.78 48 8,781.11 47 8,868.03 46 Pa. 9,764.48 19 10,764.70 25 11,488.70 17 R.I. 9,365.41 21 10,935.55 19 11,172.13 18 S.C. 8,668.16 28 10,283.23 26 10,070.16 29 S.D. 10,634.48 12 11,693.12 11 11,676.28 15 Tenn. 9,440.60 20 10,886.77 20 10,851.62 22 Texas 8,632.58 29 9,164.11 43 8,976.73 44 Utah 6,255.31 51 7,434.65 50 8,518.87 49 Vt. 9,786.55 18 11,407.02 15 11,833.69 11 Va. 15,256.19 2 19,733.90 3 17,008.19 3 Wash. 8,617.14 30 9,987.70 28 10,474.69 24 W. Va. 9,921.61 17 10,884.65 21 11,608.56 16 Wis. 7,131.65 49 10,836.92 22 9,647.65 33 Wyo. 11,206.77 9 11,534.43 14 11,019.09 20
Note: 2008-2010 data on total federal government expenditures per capita obtained from Table 10 in the Consolidated Federal Funds Reports; 2011-2014 data obtained from the Pew Charitable Trusts dataset, “Federal Spending in the States: 2005-2014.” Population data to calculate per capita adjustments obtained from the American Community Survey 5-Year Estimates for 2011 through 2014. Ranked by the Guinn Center, from highest amount per capita to lowest. States shaded in green are in the Intermountain West. Table continues on next page.

4
www.guinncenter.org
Total Federal Government Expenditures Per Capita, by State: FFY 2008-2014 (cont'd) 2011 2012 2013 2014 Amount ($) Rank Amount ($) Rank Amount ($) Rank Amount ($) Rank Ala. 12,675.12 8 12,333.57 7 11,632.00 8 12,291.30 7 Alaska 16,341.15 3 16,637.51 3 14,652.12 4 15,578.13 4 Ariz. 11,134.34 14 10,938.20 19 10,294.87 20 10,562.14 21 Ark. 9,463.03 38 9,725.14 32 9,759.54 29 10,251.70 27 Calif. 9,630.28 33 9,073.82 41 9,076.95 38 9,346.94 41 Colo. 9,838.31 32 10,044.38 29 9,425.81 34 9,843.31 33 Conn. 12,110.68 10 11,505.73 11 11,428.22 11 12,234.64 8 Del. 9,923.22 30 10,054.24 28 10,051.54 24 10,712.50 18 D.C. 86,714.12 1 82,129.23 1 80,408.27 1 77,186.77 1 Fla. 10,505.69 22 10,057.70 27 10,024.96 25 10,464.86 24 Ga. 9,537.17 34 9,058.41 42 8,861.66 40 9,368.19 40 Hawaii 14,686.26 5 14,284.52 5 13,986.86 5 14,320.40 5 Idaho 9,886.50 31 9,116.90 40 9,512.99 32 9,716.22 34 Ill. 8,776.08 45 8,461.42 47 8,245.85 50 8,577.84 49 Ind. 8,701.10 46 7,919.19 48 8,507.76 43 8,881.99 43 Iowa 8,663.21 47 8,536.83 46 8,400.07 47 8,665.38 46 Kan. 9,531.14 35 9,280.60 36 8,450.81 46 8,624.58 48 Ky. 11,567.46 12 11,380.22 13 11,021.84 13 11,892.31 10 La. 9,978.84 29 10,353.46 23 9,791.98 28 10,036.68 31 Maine 14,069.40 6 11,547.19 9 12,032.68 7 11,801.97 11 Md. 15,986.41 4 15,934.40 4 15,546.71 3 16,069.78 3 Mass. 12,041.14 11 11,668.98 8 11,403.27 12 11,264.99 14 Mich. 9,521.22 37 9,531.46 33 9,509.97 33 9,999.35 32 Minn. 8,331.66 49 7,890.46 49 8,320.33 49 9,045.56 42 Miss. 12,605.52 9 11,218.58 14 11,501.72 9 11,505.25 13 Mo. 10,974.57 16 11,523.38 10 10,840.15 16 10,521.75 22 Mont. 10,119.52 26 10,094.30 26 10,170.93 21 10,505.41 23 Neb. 8,634.81 48 8,591.99 44 8,501.96 44 8,862.04 44 Nev. 8,285.32 50 8,582.83 45 8,618.13 42 8,636.18 47 N.H. 9,068.55 43 9,223.14 37 9,264.39 36 9,603.35 36 N.J. 9,527.66 36 9,132.58 38 9,363.77 35 9,384.43 38 N.M. 13,872.64 7 14,055.31 6 13,255.23 6 14,062.97 6 N.Y. 10,052.68 28 9,840.84 31 10,102.99 23 10,307.98 26 N.C. 10,166.99 24 10,141.01 25 9,751.03 31 10,074.97 29 N.D. 10,142.65 25 11,177.33 16 9,892.47 27 10,074.19 30 Ohio 9,234.31 41 9,296.84 35 8,797.59 41 9,394.75 37 Okla. 10,459.56 23 10,331.08 24 10,024.39 26 10,345.88 25 Ore. 9,295.07 40 8,820.23 43 8,481.82 45 9,704.37 35 Pa. 10,708.57 20 10,589.82 22 10,366.65 19 10,614.07 20 R.I. 11,084.04 15 10,961.53 18 11,018.93 14 11,687.72 12 S.C. 10,847.36 18 10,914.73 20 10,413.02 18 10,989.20 17 S.D. 10,099.86 27 9,964.93 30 9,751.44 30 10,115.46 28 Tenn. 10,518.13 21 10,659.40 21 10,109.25 22 10,634.38 19 Texas 9,334.18 39 9,131.18 39 9,001.83 39 8,794.77 45 Utah 7,949.95 51 7,825.29 50 7,268.99 51 7,523.78 51 Vt. 10,713.44 19 11,217.29 15 10,935.73 15 11,231.60 15 Va. 17,947.88 2 17,096.03 2 16,553.59 2 16,696.18 2 Wash. 10,957.83 17 11,065.50 17 10,675.73 17 11,122.84 16 W. Va. 11,219.50 13 11,403.69 12 11,445.16 10 11,940.17 9 Wis. 8,958.80 44 7,757.85 51 8,394.79 48 8,399.51 50 Wyo. 9,225.06 42 9,483.54 34 9,101.93 37 9,381.90 39
Note: 2008-2010 data on total federal government expenditures per capita obtained from Table 10 in the Consolidated Federal Funds Reports; 2011-2014 data obtained from the Pew Charitable Trusts dataset, “Federal Spending in the States: 2005-2014.” Population data to calculate per capita adjustments obtained from the American Community Survey 5-Year Estimates for 2011 through 2014. Ranked by the Guinn Center, from highest amount per capita to lowest. States shaded in green are in the Intermountain West.

5
www.guinncenter.org
Figure Notes 1. 2008-2010 data on grants per capita and total federal government expenditures per capita obtained from Table
10 in the Consolidated Federal Funds Reports; 2011-2014 data obtained from the Pew Charitable Trusts dataset, “Federal Spending in the States: 2005-2014.” Population data to calculate per capita adjustments obtained from the American Community Survey 5-Year Estimates for 2011 through 2014.
2. Federal government expenditures in Table 10 of the Consolidated Federal Fund Reports (i.e., major object
categories) are: retirement and disability; other direct payments; grants; procurement; and salaries and wages. Federal spending in the Pew Charitable Trusts dataset is categorized as: contracts; grants; nonretirement; retirement; and salaries and wages. Given the lack of comparability across major object categories, the Guinn Center broke out grants and classified the rest as “All Other Federal Money.”
3. “Grants” and “All Other Federal Money” calculated by the Guinn Center as grants per capita/total federal
government expenditures per capita. The percentage difference (from 100 percent) is “All Other Federal Money” received by Nevada.
4. Grants per capita as a percentage of total federal government expenditures per capita ranked by the Guinn
Center for Nevada, relative to all other states, in order of highest to lowest.
6
www.guinncenter.org
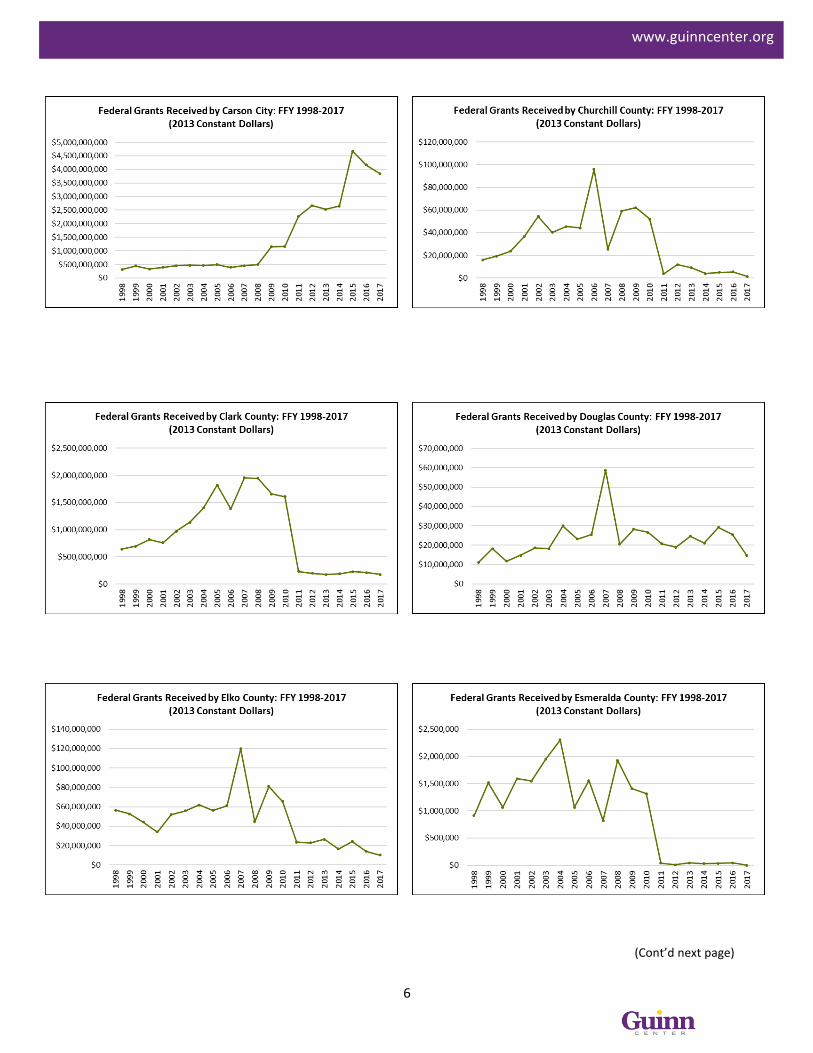
(Cont’d next page)

7
www.guinncenter.org
(Cont’d next page)

8
www.guinncenter.org
Note: 1998-2010 data on grants, by county, obtained from Table 15 in the Consolidated Federal Funds Reports; 2011-2017 data on grants, by county, obtained from USAspending.gov. Data is adjusted by inflation using the Consumer Price Index for All Urban Consumers (CPI-U; 1998-2017), U.S. Department of Labor, Bureau of Labor Statistics.
9
www.guinncenter.org
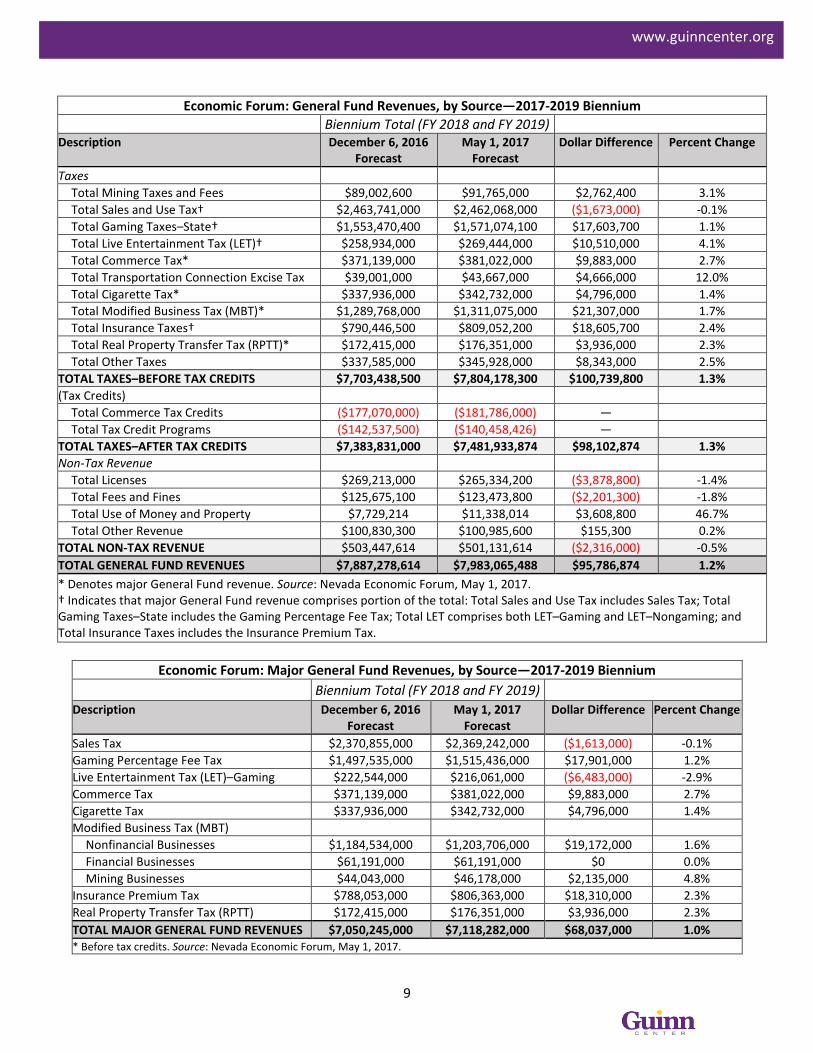
Economic Forum: General Fund Revenues, by Source—2017-2019 Biennium Biennium Total (FY 2018 and FY 2019)
Description December 6, 2016 Forecast
May 1, 2017 Forecast
Dollar Difference Percent Change
Taxes Total Mining Taxes and Fees $89,002,600 $91,765,000 $2,762,400 3.1% Total Sales and Use Tax† $2,463,741,000 $2,462,068,000 ($1,673,000) -0.1% Total Gaming Taxes–State† $1,553,470,400 $1,571,074,100 $17,603,700 1.1% Total Live Entertainment Tax (LET)† $258,934,000 $269,444,000 $10,510,000 4.1% Total Commerce Tax* $371,139,000 $381,022,000 $9,883,000 2.7% Total Transportation Connection Excise Tax $39,001,000 $43,667,000 $4,666,000 12.0% Total Cigarette Tax* $337,936,000 $342,732,000 $4,796,000 1.4% Total Modified Business Tax (MBT)* $1,289,768,000 $1,311,075,000 $21,307,000 1.7% Total Insurance Taxes† $790,446,500 $809,052,200 $18,605,700 2.4% Total Real Property Transfer Tax (RPTT)* $172,415,000 $176,351,000 $3,936,000 2.3% Total Other Taxes $337,585,000 $345,928,000 $8,343,000 2.5%
TOTAL TAXES–BEFORE TAX CREDITS $7,703,438,500 $7,804,178,300 $100,739,800 1.3% (Tax Credits)
Total Commerce Tax Credits ($177,070,000) ($181,786,000) — Total Tax Credit Programs ($142,537,500) ($140,458,426) —
TOTAL TAXES–AFTER TAX CREDITS $7,383,831,000 $7,481,933,874 $98,102,874 1.3% Non-Tax Revenue
Total Licenses $269,213,000 $265,334,200 ($3,878,800) -1.4% Total Fees and Fines $125,675,100 $123,473,800 ($2,201,300) -1.8% Total Use of Money and Property $7,729,214 $11,338,014 $3,608,800 46.7% Total Other Revenue $100,830,300 $100,985,600 $155,300 0.2%
TOTAL NON-TAX REVENUE $503,447,614 $501,131,614 ($2,316,000) -0.5% TOTAL GENERAL FUND REVENUES $7,887,278,614 $7,983,065,488 $95,786,874 1.2% * Denotes major General Fund revenue. Source: Nevada Economic Forum, May 1, 2017. † Indicates that major General Fund revenue comprises portion of the total: Total Sales and Use Tax includes Sales Tax; Total Gaming Taxes–State includes the Gaming Percentage Fee Tax; Total LET comprises both LET–Gaming and LET–Nongaming; and Total Insurance Taxes includes the Insurance Premium Tax.
Economic Forum: Major General Fund Revenues, by Source—2017-2019 Biennium
Biennium Total (FY 2018 and FY 2019) Description December 6, 2016
Forecast May 1, 2017
Forecast Dollar Difference Percent Change
Sales Tax $2,370,855,000 $2,369,242,000 ($1,613,000) -0.1% Gaming Percentage Fee Tax $1,497,535,000 $1,515,436,000 $17,901,000 1.2% Live Entertainment Tax (LET)–Gaming $222,544,000 $216,061,000 ($6,483,000) -2.9% Commerce Tax $371,139,000 $381,022,000 $9,883,000 2.7% Cigarette Tax $337,936,000 $342,732,000 $4,796,000 1.4% Modified Business Tax (MBT)
Nonfinancial Businesses $1,184,534,000 $1,203,706,000 $19,172,000 1.6% Financial Businesses $61,191,000 $61,191,000 $0 0.0% Mining Businesses $44,043,000 $46,178,000 $2,135,000 4.8%
Insurance Premium Tax $788,053,000 $806,363,000 $18,310,000 2.3% Real Property Transfer Tax (RPTT) $172,415,000 $176,351,000 $3,936,000 2.3% TOTAL MAJOR GENERAL FUND REVENUES $7,050,245,000 $7,118,282,000 $68,037,000 1.0% * Before tax credits. Source: Nevada Economic Forum, May 1, 2017.

10
www.guinncenter.org

11
www.guinncenter.org

www.guinncenter.org
12
www.guinncenter.org
www.guinncenter.org
13
www.guinncenter.org