( ~12~ 7....earthquake design and evaluation of concrete hydraulic structures. etl 1110-2-533...
TRANSCRIPT

CECW-CE Technical Letter No. 1110-2-568
DEPARTMENT OF THE ARMY U.S. Army Corps of Engineers Washington, DC 20314-1000
Engineering and Design SEISMIC EVALUATION PROCEDURES FOR EXISTING
CIVIL WORKS POWERHOUSES
ETL 1110-2-568
31 October 2006
1. Purpose. The purpose ofthis guidance is to provide an evaluation procedure to be followed to properly assess the seismic performance of existing USACE civil works powerhouses. This evaluation procedure is needed to identify those powerhouse superstructures that may need remediation to assure that they can continue to provide electrical generation critical to postearthquake on-site emergency response and to the post-earthquake recovery of communities.
2. Applicability. This ETL applies to HQUSACE elements, major subordinate commands, districts, laboratories, and separate field operating activities having responsibilities for the seismic performance of civil works powerhouses.
3. Distribution Statement. Approved for public release, distribution is unlimited.
4. References. References are provided in Appendix A.
5. Background/Discussion. Earthquake evaluation of civil works powerhouses is a performancebased process similar to that used for existing buildings. The seismic evaluation process as it applies to existing powerhouse superstructures is described in Appendix B. The performancebased evaluation process and its application to buildings is described in FEMA 356, Prestandard and Commentary for the Seismic Evaluation of Buildings. A discussion regarding the potential for amplification in powerhouse superstructure members is provided in Appendix C. Procedures used to evaluate powerhouse superstructures with older, low-bond-type reinforcement are pro_ vided in Appendix D. An example describing all steps in the evaluation process is demonstrated in Appendix E. The notation used throughout this document is listed in Appendix F.
FOR THE COMMANDER:
6 Appendixes Appendix A - References Appendix B - Seismic Evaluation Procedures
for Existing Civil Works Powerhouses Appendix C - Amplification Discussion Appendix D - Evaluating Older Powerhouses Appendix E - Example Appendix F- Notation
(_~12~ if v DONALD 7. BASHAM, PE
Chief, Engineering & Construction Directorate of Civil Works

ETL 1110-2-568 31 Oct 06
APPENDIX A
References
A-1. Required Publications. EM 1110-2-6050 Response Spectra and Seismic Analysis for Concrete Hydraulic Structures. American Concrete Institute (2002) American Concrete Institute. 2002. Building Code Requirements for Structural Concrete. ACI 318. Box 19150, Redford Station, Detroit, MI 48219. Concrete Reinforcing Steel Institute (2001) Concrete Reinforcing Steel Institute. 2001. Evaluation of Reinforcing Bars in Old Reinforced Concrete Structures. Engineering Data Report Number 48. Ebeling, Perez-Marcial, and Yule (2006) Ebeling, R. M., E. J. Perez-Marcial, and D. E. Yule. 2006. Response Amplification of Idealized Powerhouse Substructures to Earthquake Ground Motions. Department of the Army, Army Corps of Engineers, Engineer Research and Development Center, Information Technology Laboratory, Vicksburg, MS. ERDC TR-06-3. Federal Emergency Management Agency (2000) Federal Emergency Management Agency. November 2000. Prestandard and Commentary for the Seismic Rehabilitation of Buildings. FEMA-356. Washington, DC. Federal Emergency Management Agency (2003) Federal Emergency Management Agency. 2003. NEHRP Recommended Provisions for Seismic Regulation of New Buildings and Other Structures – Part 1 Provisions. FEMA-450-1. Washington, DC. Federal Emergency Management Agency (2003) Federal Emergency Management Agency. 2003. NEHRP Recommended Provisions for Seismic Regulation of New Buildings and Other Structures – Part 2 Commentary. FEMA-450-2. Washington, DC. Federal Emergency Management Agency (2005) Federal Emergency Management Agency. June 2005. Improvement of Nonlinear Static Seismic Analysis Procedures. FEMA-440. Washington, DC. United States Geological Survey (2002) United States Geological Survey. 2002. Integrated Probabilistic Ground Motion for the Conterminous 48 States by Latitude-Longitude. http://eqhazmaps.usgs.gov.
A-1

DEPARTMENT OF THE ARMY ETL 1110-2-568 U.S. Army Corps of Engineers CECW-CE Washington, DC 20314-1000 Technical Letter No. 1110-2-568 31 October 2006
Engineering and Design SEISMIC EVALUATION PROCEDURES FOR EXISTING
CIVIL WORKS POWERHOUSES
TABLE OF CONTENTS
PARAGRAPH PAGE 1 Purpose.................................................................................................................... 1 2 Applicability ........................................................................................................... 1 3 Distribution Statement ............................................................................................ 1 4 References............................................................................................................... 1 5 Background/Discussion .......................................................................................... 1 APPENDICES Appendix A References.............................................................................................................................. A-1 A-1 Required Publications ................................................................................................... A-1 A-2 Related Publications...................................................................................................... A-2 Appendix B Seismic Evaluation Procedures for Existing Civil Works Powerhouses ............................... B-1 B-1 Overview....................................................................................................................... B-1 a. General.................................................................................................................... B-1 (1) Purpose (2) Scope b. Background............................................................................................................. B-2 (1) Basis of program (2) Powerhouse performance requirements c. Powerhouse evaluation process .............................................................................. B-2 (1) General (2) Evaluation procedures (3) Performance-based analysis (4) Limits on the use of linear procedures and DCR evaluations d. Evaluation process .................................................................................................. B-4 (1) Field investigation (2) Performance-based analyses e. Analysis decision making process .......................................................................... B-6 (1) General
i

ETL 1110-2-568 31 Oct 06 PARAGRAPH PAGE (2) Actions based on the results of the field investigation (3) Selection of analysis method (4) Special analysis (5) Progressive analysis per Figure B-2 flowchart f. Reporting the findings............................................................................................. B-9 g. Qualifications of investigators ................................................................................ B-9 B-2 Design Criteria .............................................................................................................. B-9 a. Earthquake hazard levels ........................................................................................ B-9 (1) General (2) BSE-2 (3) BSE-1A b. Performance Levels ............................................................................................... B-9 (1) General (2) LS performance level (3) IO performance level (4) CP performance level c. Performance Requirements..................................................................................... B-10 (1) General (2) Loading combinations d. Performance Evaluation.......................................................................................... B-11 B-3 Estimating Earthquake Ground Motion Demands........................................................ B-11 a. Specification of earthquake ground motions .......................................................... B-11 (1) General (2) Using response spectra to estimate earthquake demand b. Multi-directional effects.......................................................................................... B-12 (1) General (2) Orthogonal combination method (3) SRSS and CQC methods c. Earthquake demands on inelastic systems .............................................................. B-13 d. Interaction between bays in response to longitudinal direction demands............... B-13 B-4 Methods of Seismic Analysis and Structural Modeling ............................................... B-13 a. Introduction............................................................................................................. B-13 (1) General (2) Criteria b. Field investigation................................................................................................... B-14 c. Analytical models and amplification effects........................................................... B-15 (1) General (2) Superstructure-only models (3) Tributary mass assumptions (4) Mass for overhead crane, switchgear, and other roof attachments d. Effective stiffness.................................................................................................... B-23 e. Damping.................................................................................................................. B-24
ii

ETL 1110-2-568 31 Oct 06
PARAGRAPH PAGE f. Linear static procedure (LSP) analysis ................................................................... B-24 (1) Introduction (2) Simple-LSP analysis (3) LSP analysis g. Linear Dynamic Procedure (LDP) Analysis ........................................................... B-34 h. Special Analysis...................................................................................................... B-35 (1) Displacement ductility evaluation (2) Finite element analysis of composite substructure-superstructure system (3) Site-specific ground motion study (4) 3D analysis of superstructure i. Demand-to-capacity ratio evaluations .................................................................... B-39 B-5 Force and Displacement Capacities .............................................................................. B-39 a. Introduction............................................................................................................. B-39 b. Shear (diagonal tension) ......................................................................................... B-41 c. Sliding shear............................................................................................................ B-43 d. Reinforcing steel anchorage.................................................................................... B-43 e. Reinforcing steel splices and hooked bars .............................................................. B-43 f. Fracture of reinforcing steel.................................................................................... B-44 g. Flexural strength ..................................................................................................... B-44 h. Displacement ductility capacity.............................................................................. B-44 (1) Curvature capacity (2) Rotational capacity (3) Displacement ductility capacity of cantilever structures (4) Estimating displacement ductility i. Loss of support for roof system and overhead crane .............................................. B-49 j. Substructure system components............................................................................ B-50 B-6 Analysis Procedures and Evaluation of Seismic Analysis Results............................... B-50 a. Introduction............................................................................................................. B-50 b. Seismic evaluation using the DCR method ............................................................ B-50 (1) General (2) Flexural performance (3) Shear performance c. Displacement ductility evaluation........................................................................... B-52 B-7 Reporting Findings from Field Inspection and Performance-Based Analyses............. B-53 a. General.................................................................................................................... B-53 b. Field inspection reporting ....................................................................................... B-53 (1) Field data collection trip (2) Field data collection checklist (3) True/false evaluation statements c. Final report ............................................................................................................. B-58
iii
ETL 1110-2-568 31 Oct 06 PARAGRAPH PAGE Appendix C Amplification Discussion....................................................................................................... C-1 C-1 General.......................................................................................................................... C-1 C-2 Discussion of Ebeling, Perez-Marcial, and Yule (2006) .............................................. C-3 C-3 Height-wise amplification ............................................................................................ C-11 C-4 Resonance-related amplification................................................................................... C-14 C-5 Amplification provisions contained in FEMA 356 (2000) ........................................... C-14 C-6 Estimating the period of the substructure and superstructure....................................... C-16 C-7 Estimating superstructure amplification effects............................................................ C-19 C-8 Amplification by time-history analysis......................................................................... C-20 Appendix D Evaluating Older Powerhouses .............................................................................................. D-1 D-1 General.......................................................................................................................... D-1 D-2 FEMA 356 (2000) ductility demand classifications ..................................................... D-2 D-3 FEMA 356 (2000) requirements for non-conforming splice and development lengths .......................................................................................................................... D-2 a. Splice length requirements...................................................................................... D-2 b. Embedment length requirements ............................................................................ D-4 D-4 Splice and development length requirements for “low bond” deformation bars.......... D-4 D-5 Default values for use in LSP, LDP, and Special analyses........................................... D-5 Appendix E Example ................................................................................................................................. E-1 E-1 Introduction................................................................................................................... E-1 E-2 Evaluation ..................................................................................................................... E-2 E-3 Field data collection checklist....................................................................................... E-3 E-4 True/false checklist ....................................................................................................... E-3 E-5 Simple-LSP and LSP analyses...................................................................................... E-3 E-6 Standard response spectrum.......................................................................................... E-3 E-7 Simple-LSP and LSP analyses for a transverse-direction earthquake .......................... E-16 E-8 Simple-LSP and LSP analyses for a longitudinal-direction earthquake....................... E-30 E-9 Element capacities ........................................................................................................ E-34 E-10 Comparison of earthquake demands to element capacity............................................. E-37 E-11 Conclusions based on LSP analysis.............................................................................. E-38 E-12 Linear dynamic procedure analysis .............................................................................. E-38 E-13 Special displacement ductility capacity evaluation ...................................................... E-46 E-14 Seismic evaluation of connections................................................................................ E-48 E-15 Conclusions................................................................................................................... E-50 Appendix F Notation.................................................................................................................................. F-1
iv

ETL 1110-2-568 31 Oct 06 A-2. Related Publications. PL 101-614 National Earthquake Hazards Reduction Program (NEHRP) Reauthorization Act, November 1990. Executive Order 12941, 1 December 1994 Seismic Safety of Existing Federally Owned or Leased Buildings. ER 1110-2-100 Periodic Inspection and Continuing Evaluation of Completed Civil Works Structures. ER 1110-2-1155 Dam Safety Assurance. ER 1110-2-1806 Earthquake Design and Evaluation for Civil Works Projects. EM 1110-2-2400 Structural Design and Evaluation of Outlet Works. EM 1110-2-3001 Planning and Design of Hydroelectric Power Plant Structures. EM 1110-2-6063 Earthquake Design and Evaluation of Concrete Hydraulic Structures. ETL 1110-2-533 Lifeline Report Number 1, Systems at Risk from Earthquakes, Hydroelectric Power Plant Facilities. Federal Emergency Management Agency (1998) Federal Emergency Management Agency. January 1998. Handbook for the Seismic Evaluation of Buildings-A Prestandard. FEMA-310. Washington, DC. Federal Highway Administration (1995) Federal Highway Administration. May 1995. Seismic Retrofitting Manual for Highway Bridges. U.S. Department of Transportation. FHWA-RD-94-052. Ebeling (1992) Ebeling, R. M. 1992. Introduction to the Computation of Response Spectrum for Earthquake Loading. Department of the Army, Army Corps of Engineers, Information Technology Laboratory, Vicksburg, MS. Technical Report ITL-92-4.
A-2

ETL 1110-2-568 31 Oct 06
Fenves and Chopra (1985) Fenves, G., and A. K. Chopra. June 1985. Simplified Analysis for Earthquake Resistant Design of Concrete Gravity Dams. Earthquake Engineering Research Center, University of California, Berkeley, CA. UCB/EERC-85-10. Hines, Dazio, and Seible (2006) Hines, E. M., A. Dazio, and F. Seible. January-February 2006. Structural Testing of New East Bay Skyway Piers. ACI Structural Journal. International Building Code (2003) International Building Code. 2003. International Code Council, Inc., 5203 Leesburg Pike, Suite 708, Falls Church, VA. Lukose, Gergely, and White (1982) Lukose, K., P. Gergely, and R. N. White. September-October 1982. Behavior of Reinforced Concrete Lapped Splices for Inelastic Cyclic Loading. ACI Structural Journal. p. 355-365. Moehle (1992) Moehle, J. P. 1992. Displacement-Based Design of RC Structures Subjected to Earthquakes. Earthquake Spectra, Vol. 8, No. 3, p. 403-428. National Center for Earthquake Engineering Research (1993) National Center for Earthquake Engineering Research. March 1993. Assessment of the 1991 NEHRP Provisions for Nonstructural Components and Recommended Revisions. State University of New York at Buffalo, Red Jacket Quadrangle, Buffalo, NY. Report NCEER-93-0003. National Institute of Standards and Technology (1994) National Institute of Standards and Technology. February 1994. Standards of Seismic Safety for Existing Federally Owned or Leased Buildings, and Commentary. ICSSC RP 4. National Institute of Standards and Technology (1995) National Institute of Standards and Technology. October 1995. ICSSC Guidance on Implementing Executive Order 12941 on Seismic Safety of Existing Federally Owned or Leased Buildings. ICSSC RP 5. Newmark and Hall (1982) Newmark, N. M., and W. J. Hall. 1982. Earthquake Spectra and Design. Earthquake Engineering Research Institute. EERI Monograph Series. Paulay (1980) Paulay, T. May-June 1980. Earthquake-Resisting Shearwalls--New Zealand Design Trends. ACI Structural Journal.
A-3

ETL 1110-2-568 31 Oct 06 Paulay and Priestley (1992) Paulay, T., and M. J. N. Priestley. 1992. Seismic Design of Reinforced Concrete and Masonry Buildings. John Wiley and Sons, Inc. Priestley and Park (1987) Priestley, M. J. N., and R. Park. January-February 1987. Strength and Ductility of Concrete Bridge Columns under Seismic Loading. ACI Structural Journal. Priestley, Seibel, and Calvi (1996) Priestley, M. J. N., F. Seible, and G. M. Calvi. 1996. Seismic Design and Retrofit of Bridges. John Wiley and Sons, Inc. Priestley, Verma, and Xaio (1994) Priestley, M. J. N., R. Verma, and Y. Xaio. August 1994. Seismic Shear Strength of Reinforced Concrete Columns. ASCE Journal of Structural Engineering, Vol. 120, No. 8. Qi and Moehle (1991) Qi, X. and J. P. Moehle. January 1991. Displacement Design Approach for Reinforced Concrete Structures Subjected to Earthquakes. Report No. Earthquake Engineering Research Center, University of California, Berkeley, CA. EERC 91/02. Rosenbloeth and Contreas (1977) Rosenbloeth, E., and H. Contreas. October 1977. Approximate Design for Multicomponent Earthquakes. ASCE Journal of the Engineering Mechanics Division. Seed, Ugas, and Lysmer (1976) Seed, H. B., C. Ugas, and J. Lysmer. 1976. Site-Dependent Spectra for Earthquake-Resistant Design. Bulletin of the Seismological Society of America, p. 221-243. Structural Engineering Institute (2003) Structural Engineering Institute. 2003. Seismic Evaluation of Existing Buildings. SEI/ASCE 31-03. Strom and Ebeling (2005) Strom, R. W., and R. M. Ebeling. 2005. Seismic Structural Considerations for the Stem and Base of Retaining Walls Subjected to Earthquake Ground Motions. Department of the Army, Army Corps of Engineers, Engineer Research and Development Center, Information Technology Laboratory, Vicksburg, MS. EDRC/ITL-05-3. Watson, Zahn, and Park (1994) Watson, F., F. A. Zahn, and R. Park. June 1994. Confining Reinforcement for Concrete Columns. ASCE Journal of Structural Engineering, Vol. 120, No. 6.
A-4

ETL 1110-2-568 31 Oct 06
Wilson, Suharwardy, and Habibullah (1995) Wilson, E. L., I. Suharwardy, and A. Habibullah. November 1995. A Clarification of the Orthogonal Effects in a Three-Dimensional Seismic Analysis. Earthquake Spectral, Volume 11, No.4. Wood (1989) Wood, S. L. September-October 1989. Minimum Tensile Reinforcement Requirements in Walls. ACI Structural Journal, Vol. 86, No. 4. Wood (1990) Wood, S. L. January-February 1990. Shear Strength of Low-Rise Reinforced Concrete Walls. ACI Structural Journal.
A-5
ETL 1110-2-568 31 Oct 06
APPENDIX B
Seismic Evaluation Procedures for Existing Civil Works Powerhouses
B-1. Overview. a. General. (1) Purpose. This ETL describes methods used to evaluate the seismic performance of existing powerhouse superstructures. Although the influence of the substructure with respect to the amplification of superstructure force and displacement demands is considered in the various analyses, the seismic performance of the substructure itself is not addressed. (2) Scope. (a) On-site inspections and performance-base evaluation techniques used for the seismic evaluation of powerhouse superstructures are described. The evaluation process consists of a visual structural assessment conducted on-site followed by a performance-based analytical investigation. The performance-based evaluation may be a simple linear static procedure (Simple-LSP), a linear static procedure (LSP) evaluation, a linear dynamic procedure (LDP) evaluation, or a special analysis. The analysis procedures described herein will be unfamiliar and may seem unduly complex to those who have not as yet undertaken a performance-based analysis in accordance with the FEMA 356 methodologies. However, many powerhouse superstructures can be eliminated from further analytical investigation by performing a Simple-LSP evaluation. Therefore, it is recommended that inexperienced evaluators first become familiar with the conduct of a Simple-LSP evaluation as described in Paragraph B-4f and Figure B-8 before undertaking one of the more complex evaluation methodologies. (b) Since most powerhouse roof systems are incapable of performing as diaphragms, the walls supporting the roof must carry the lateral forces generated by earthquake ground motions by acting as independent structural elements. In the various performance-based evaluation pro-cedures, it is assumed the powerhouse walls are cantilever beam elements subject to out-of-plane loadings, with the principal bending and shear occurring about the weak axis. For systems other than a cantilever wall out-of-plane-loading system, the evaluator is referred to FEMA 356 (2000) for guidance in developing a suitable analytical model and seismic analysis procedure. (c) The evaluation described in this document is solely for the powerhouse super-structure walls and roof and does not address architectural, mechanical, electrical, or other nonstructural components. All structural evaluations, however, must be supplemented with a nonstructural evaluation that addresses the impact of potential nonstructural seismic failures on the post-earthquake operability of the powerhouse and on project emergency response systems. The nonstructural evaluation process for powerhouses is currently described in ETL 1110-2-533. Rehabilitation of powerhouse superstructures is not specifically covered by this guidance. How-ever, rehabilitation measures used to improve the seismic performance of building systems are applicable to powerhouse superstructures. Rehabilitation and strengthening of structural and nonstructural systems are covered in FEMA 356 (2000).
B-1
ETL 1110-2-568 31 Oct 06 b. Background. (1) Basis of program. The Earthquake Hazards Reduction Act of 1977 as amended by Public Law 101-614 on 16 November 1990 required that each Federal Agency determine the seriousness of the seismic risk to their existing buildings and to report the findings to Congress. USACE began addressing seismic safety standards of existing buildings in FY 1992 with the establishment of the Corps of Engineers Earthquake Hazards Reduction Program (CEHRP). Also in response to the public law, the Standards of Seismic Safety for Existing Federally Owned and Leased Buildings were developed by the Interagency Committee on Seismic Safety in Construc-tion (ICSSC) and adopted by Executive Order (EO) 12941 on 1 December 1994. The Standards were subsequently updated on 18 January 2002 in ICSSC RP6 and are required to be updated at least every 5 years. Situations requiring evaluations are identified in ICSSC RP6. This manual describes the seismic evaluation process for civil works powerhouse superstructures. (2) Powerhouse performance requirements. Electrical power generated at Corps projects is considered to be essential when responding to on-site or off-site post-earthquake emergencies. Corps powerhouses, because they are important to post-earthquake emergency response, are required to meet immediate occupancy (IO) performance requirements. Powerhouses must also meet collapse prevention (CP) performance and life safety (LS) performance. Compliance with IO performance requirements, however, will automatically assure compliance with LS perfor-mance requirements. Therefore, guidance related to LS performance is not specifically addressed in subsequent sections of the ETL. A complete description of all performance requirements can be found in Section B-2 and FEMA 356 (2000). The design earthquakes used to evaluate perfor-mance objectives are also defined in Section B-2. c. Powerhouse evaluation process. (1) General. The evaluation process for powerhouse superstructures consists of a perfor-mance-based analysis as described in this ETL. Powerhouse superstructures are different from most building structures in that the powerhouse superstructure is usually very long, with a large length-to-width aspect ratio. The powerhouse roof system generally has transverse expansion/ contraction joints at the ends of each bay to accommodate the volume changes associated with temperature and shrinkage. This precludes the roof system from performing as a diaphragm. Each bay must therefore rely on the moment capacity of the longitudinal walls and the capacity of roof-to-wall connections to survive inertial force demands and displacement demands result-ing from earthquake ground motions. (2) Evaluation procedures. Each powerhouse superstructure located in a “moderate” or “high” region of seismicity, as defined in Table B-1, should be given a seismic hazard evaluation based on the criteria specified herein. (3) Performance-based analysis. (a) Performance-based analysis, often refered to as displacement-based analysis, recognizes that displacements are the best indicator of performance. Bending moment demands obtained from a linear elastic analysis, however, can be used indirectly to assess displacement ductility demands. This is illustrated in Figure B-1 and described below.
B-2

ETL 1110-2-568 31 Oct 06
Table B-1. Low, moderate, and high regions of seismicity
Region of Seismicity Classification SS* (2% in 50 year event) Low < 0.167 g Moderate < 0.500 g
≤ 0.167 g High ≤ 0.500 g * SS in Table B-1 represents the short-period spectral acceleration (0.2-s acceleration) for the 2% in 50-year event (2475-year event) obtained from USGS (2002) earthquake hazard maps.
EQ Force - FE
Base Moment – ME
Top Displacement - ΔE
Displacement - ΔE
Earthquake Force - FE or Earthquake Moment - ME
ΔY
ΔE
ΔE × C1 × C2
Plastic Hinge Region
FE = Seismic force on powerhouse wall based on linear elastic analysis lEFF = Distance to center of seismic force (FE) ME = Seismic moment at base of powerhouse wall based on linear elastic analysis = FE × lEFF MN = Nominal moment capacity of wall ME × C1 × C2 = Elastic moment producing displacement representing inelastic behavior ΔY = Displacement of wall at its nominal moment capacity (reinforcement at yield) ΔE = Displacement of wall based on linear elastic analysis ΔE × C1 × C2 = Displacement representing inelastic behavior
Center of Seismic Force
Powerhouse Wall
Powerhouse Substructure
lEFF
Behavior assuming the wall remains elastic
Actual inelastic behavior
ME
MN
ME × C1 × C2
Figure B-1. Linear analysis procedure for deformation-controlled action.
B-3
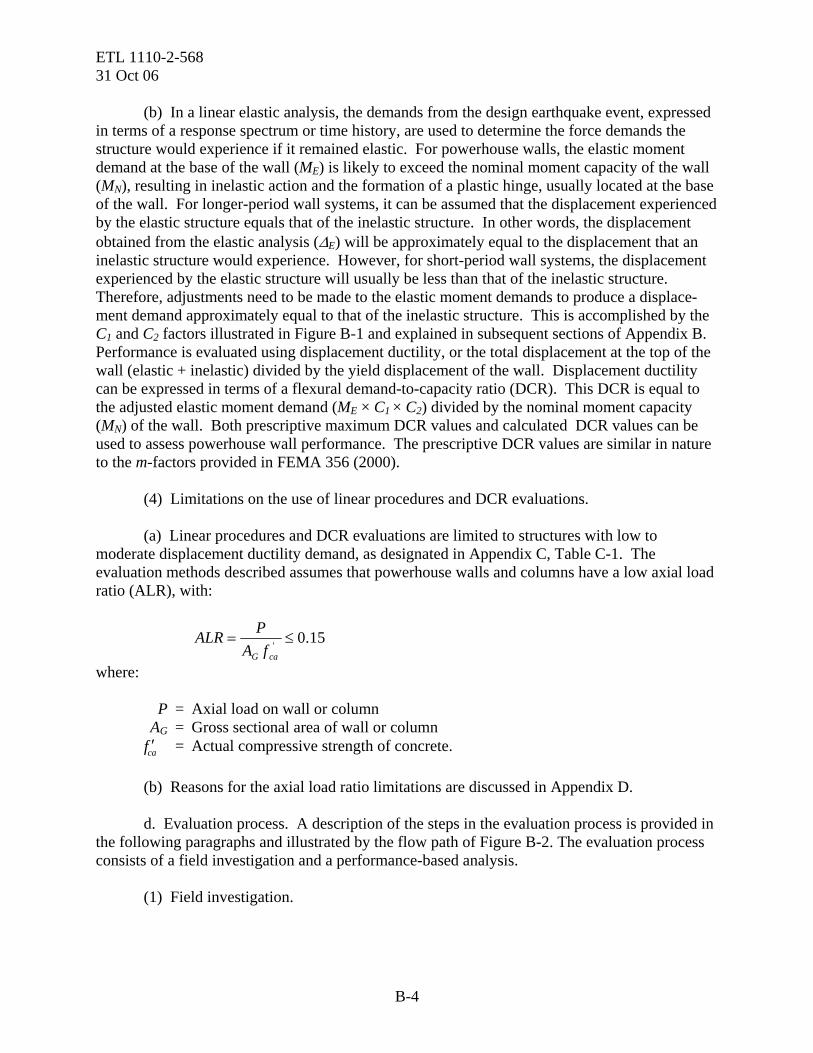
ETL 1110-2-568 31 Oct 06 (b) In a linear elastic analysis, the demands from the design earthquake event, expressed in terms of a response spectrum or time history, are used to determine the force demands the structure would experience if it remained elastic. For powerhouse walls, the elastic moment demand at the base of the wall (ME) is likely to exceed the nominal moment capacity of the wall (MN), resulting in inelastic action and the formation of a plastic hinge, usually located at the base of the wall. For longer-period wall systems, it can be assumed that the displacement experienced by the elastic structure equals that of the inelastic structure. In other words, the displacement obtained from the elastic analysis (ΔE) will be approximately equal to the displacement that an inelastic structure would experience. However, for short-period wall systems, the displacement experienced by the elastic structure will usually be less than that of the inelastic structure. Therefore, adjustments need to be made to the elastic moment demands to produce a displace-ment demand approximately equal to that of the inelastic structure. This is accomplished by the C1 and C2 factors illustrated in Figure B-1 and explained in subsequent sections of Appendix B. Performance is evaluated using displacement ductility, or the total displacement at the top of the wall (elastic + inelastic) divided by the yield displacement of the wall. Displacement ductility can be expressed in terms of a flexural demand-to-capacity ratio (DCR). This DCR is equal to the adjusted elastic moment demand (ME × C1 × C2) divided by the nominal moment capacity (MN) of the wall. Both prescriptive maximum DCR values and calculated DCR values can be used to assess powerhouse wall performance. The prescriptive DCR values are similar in nature to the m-factors provided in FEMA 356 (2000). (4) Limitations on the use of linear procedures and DCR evaluations. (a) Linear procedures and DCR evaluations are limited to structures with low to moderate displacement ductility demand, as designated in Appendix C, Table C-1. The evaluation methods described assumes that powerhouse walls and columns have a low axial load ratio (ALR), with:
15.0' ≤=caG fA
PALR
where: P = Axial load on wall or column AG = Gross sectional area of wall or column caf ′ = Actual compressive strength of concrete. (b) Reasons for the axial load ratio limitations are discussed in Appendix D. d. Evaluation process. A description of the steps in the evaluation process is provided in the following paragraphs and illustrated by the flow path of Figure B-2. The evaluation process consists of a field investigation and a performance-based analysis. (1) Field investigation.
B-4
ETL 1110-2-568 31 Oct 06
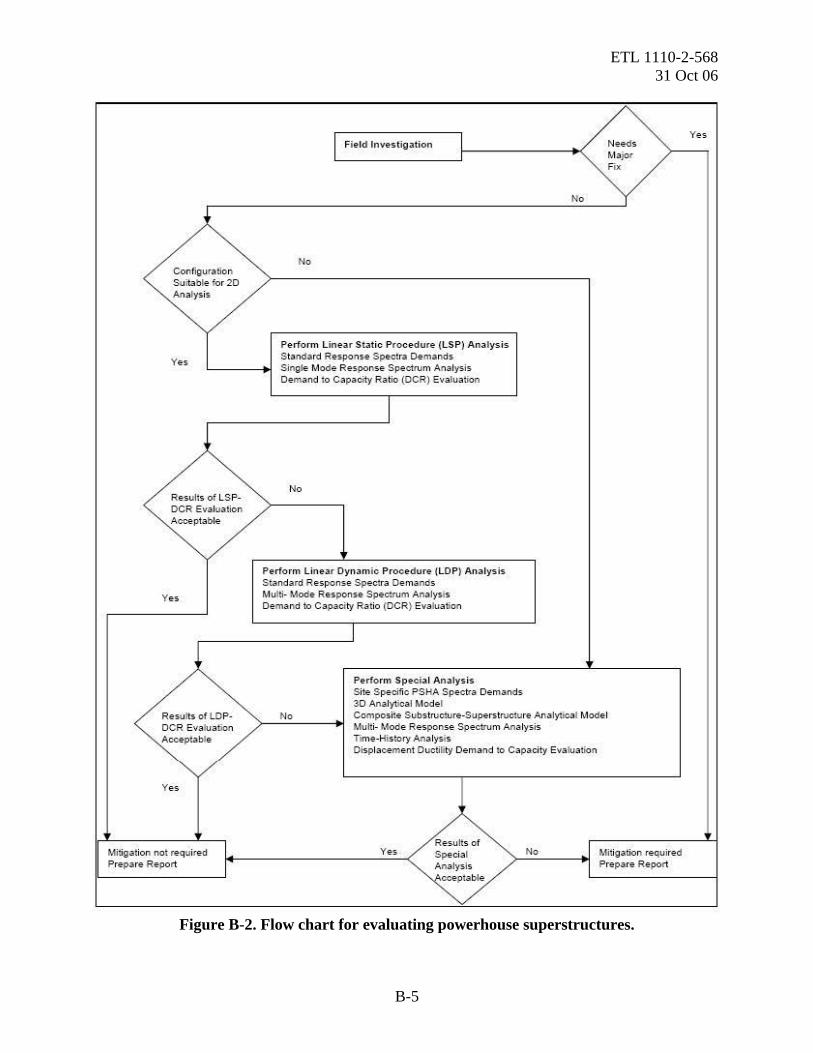
Figure B-2. Flow chart for evaluating powerhouse superstructures.
B-5
~ Yes I Field Investigation
ov X
No
No Configuration Suitable for 20 Analysis
Perform linear Static Procedure (LSP) Analysis
Ye s Stand ard Response Spectra Demands Single rv1ode Response Specttum Analysis Demand to Capacity Ratio (OCR) Evaluation
I
No Results of LSP-OCR Evaluation Acceptable
Perfo rm linear Dynamic Procedure {LOP• Analysis Standard Response Spec~ra Demands
Yes Multi- Mode Response Spectrum Analysis Demand to Capacity Ratio (OCR} Evaluation
I
Perform Special Analysis Sit e Specific PSHA Spec tra Demands 30 An alytical Model
Resu fts of LOP- No Composi! e SubstruC::ure-Superstructure Analytical Model OCR Eva luation Multi- Mode Response Spectrum Analysis Acceptable Time-History Analysis
Displacement Oucti\ay Demand <o Capaci ty Evalua1ion
Yes
I Results of Mitigation no1 required Yes Special No Mi:igation required Prep3re Report I
~ Prepare Report
t.able
ETL 1110-2-568 31 Oct 06 (a) The field investigation is generally used to obtain copies of all available pertinent drawings, to visibly inspect all components of the lateral force resisting system, and to collect all information essential to conducting a performance-based analysis. (b) If possible, evaluators should obtain all pertinent drawings before conducting the on-site inspection. This is usually not practical, and it often becomes necessary to obtain them at the project during the site visit. To help evaluators with the on-site inspection, a field data collection checklist and a true/false checklist are provided. Evaluators should use the on-site inspection to determine if a complete lateral force resisting system exists and whether there are any potential deficiencies in its structural elements and connections. (2) Performance-based analyses. Two performance-based analyses are covered. They are the linear static procedure (LSP) analysis and the linear dynamic procedure (LDP) analysis. (a) LSP analysis. Unless otherwise indicated, the LSP terminology used in the following paragraphs can refer to either the simple linear static procedure or the more comprehensive linear static procedure. The LSP is a performance-based analysis that uses an equivalent lateral force (ELF) procedure to determine earthquake demands on the structure and its critical components. In this analysis, standard response spectra are used to determine earthquake demands. (b) LDP analysis. The LDP analysis uses multi-mode response spectrum analysis procedures to determine earthquake demands on the superstructure and its critical components. Standard response spectra are most often used to determine earthquake demands. (c) Special analysis. The special analysis process consists of a host of procedures that can be used to better define earthquake demands on critical powerhouse superstructure com-ponents and a procedure that can be used to better define the displacement ductility capacity of components critical to performance. The special analysis process allows the evaluator to use a displacement ductility demand to displacement ductility capacity evaluation rather than a pre-scriptive DCR evaluation to assess the performance of the powerhouse superstructure. A site-specific probabilistic hazard analysis (PSHA) may be used to better define earthquake ground motion demands. A comprehensive finite element model of the entire substructure-superstructure system may be used to accurately account for substructure amplification effects on powerhouse superstructure components. Under certain circumstances, a linear elastic time-history analysis may be useful in assessing amplification effects. In other cases, a 3D analytical model may be useful to more accurately capture earthquake demands on superstructure components. All the above refinements in the analytical process fall under the category of “special analysis.” e. Analysis decision making process. (1) General. The following describes the various elements of the decision making process that takes place during a powerhouse superstructure seismic evaluation. The overall process is illustrated by Figure B-2. (2) Actions based on the results of the field investigation.
B-6

ETL 1110-2-568 31 Oct 06
(a) In general, an LSP analysis and/or an LDP analysis, and possibly a special analysis, will follow the field investigation. These analyses are needed to determine if the powerhouse lateral force resisting system is capable of meeting required performance objectives. (b) However, evaluators may decide, because of visible structural deterioration or because the on-site inspection indicates the powerhouse superstructure has little if any lateral load-carrying capacity, that the powerhouse superstructure is in need of a major fix. In this case, there would be no need to continue with the LSP, LDP, or special analysis. The results of the rapid evaluation would then be presented in a report indicating that mitigation is required. Evaluators, however, may elect to perform additional LSP, LDP and special analyses to assure all seismic deficiencies have been identified. (c) In other cases, evaluators during the field data collection trip may spot a condition where a minor fix is needed to provide a suitable lateral force load path or to provide necessary lateral resistance. In this circumstance, the required fix should be noted, and the required LSP, LDP, and/or special analysis performed, considering and evaluating the benefits provided by the recommended minor fix. (d) Most likely the minor fix will be associated with the connections between lateral force resisting elements. These connections may be either absent or deficient in capacity. Connection fixes can often be made at little expense, and the evaluator can proceed, assuming these fixes will be made, and perform the LSP and LDP analyses based on this assumption. (3) Selection of analysis method.
(a) In many cases, reasonable estimates of earthquake demands on critical structural components can be obtained using a superstructure-only analytical model that considers only the mass and stiffness properties of the superstructure. This simplification can be used because the substructure is rigid (i.e., unable to amplify the effects that the earthquake ground motions have on the superstructure) or because the effects of amplification can be applied separately based on a known superstructure and substructure vibrational characteristics (Refer to Appendix C). (b) In an LSP analysis, the superstructure walls are treated as a cantilever beam ele-ments. The LSP analysis can be accomplished without the use of the comprehensive structural analysis software that is often required to determine mode shapes and frequencies for the com-plex structural systems. The LSP has a simple form (Simple-LSP) and a more comprehensive form. In the Simple-LSP analysis, the inertial forces are assumed to be those associated with a constant acceleration response (i.e., peak acceleration response). Demands, therefore, are those associated with the short-period spectral acceleration (Ss) response often identified as the 0.2-second response. Mass contributing to the inertial response of the wall under consideration (upstream or downstream wall) is lumped at roof corbel and crane corbel locations. Periods of vibration for the Simple-LSP analysis are determined by simple formulation. (c) In the more comprehensive LSP analysis, a fundamental mode shape is assumed. Inertial force is based on the spectral acceleration associated with the first mode period. Period of
B-7

ETL 1110-2-568 31 Oct 06 vibration and inertial force distribution are calculated based on the assumed mode shape (linear) and mass distribution. (d) The LDP analysis is a multi-mode response spectrum analysis requiring the use of structural analysis software to determine the mode shapes and periods of vibration of all modes contributing to the response of the superstructure to earthquake ground motions. The LDP is described in Section B-4. Nearly all structural analysis software has the capacity to determine structure vibrational characteristics and perform dynamic analyses. (4) Special analysis. (a) A special analysis evaluation is used when it becomes necessary to use:
• Displacement-based evaluation procedures to determine if the powerhouse walls are sufficiently ductile to withstand earthquake demands in cases where prescriptive demand-to-capacity (DCR) acceptance criteria cannot be met.
• Composite substructure-superstructure analyses to better quantify amplification
effects. • Linear elastic time-history analyses to better quantify amplification effects. • Site-specific ground motions to more accurately define ground motion demands. • 3D analytical models to better capture superstructure dynamic response.
(b) One or more of the above actions constitutes a “special” analysis. (c) The displacement-based evaluation for powerhouses compares the displacement ductility capacity of the powerhouse walls or columns to the displacement ductility demand. Information on displacement ductility capacity is provided in Section B-5. (d) Composite substructure-superstructure analytical models can help in assessing amplification effects. This is also true for time history analyses. Amplification effects are described in Appendix C. (e) Site-specific probabilistic site hazard assessments (PSHA) can be used to more accurately define ground motion demands for those instances where performance is marginal and a reduction in ground motion demand can lead to acceptance without mitigation. Site-specific ground probabilistic site hazard assessments (PSHA) studies should be conducted in accordance with the requirements of EM 1110-2-6050. (f) In a 3D analysis, 3D models considered by the evaluator to best capture the dynamic behavior of the powerhouse superstructure system are used to determine earthquake demands on critical structural elements. The model may consists of beam elements, shell elements, and/or
B-8
ETL 1110-2-568 31 Oct 06
brick elements. Additional information on the 3D modeling of powerhouse structures is pro-vided in Section B-4 and FEMA 356 (2000). (5) Progressive analysis per Figure B-2 flowchart. Evaluators are encouraged to start with a Simple-LSP analysis and progress to the more complex and comprehensive analyses. This is the approach indicated by the flowchart of Figure B-2. Evaluators accustomed to performing dynamic analyses using structural analysis software may elect to skip the Simple-LSP and LSP analysis and go directly to the LDP analysis. It is highly recommended, however, that all steps indicated by the flowchart be performed in the sequence suggested to assure that evaluators have a clear understanding of how the powerhouse superstructure will respond to earthquake ground motions. When the results of a given performance-based analysis indicate conclusively that mitigation is unnecessary, the evaluator may forgo any additional analyses and prepare a report of findings. f. Reporting the findings. A report is required to document the decision made with respect to the need for mitigation. Report requirements are described in subsequent paragraphs. g. Qualifications of investigators. All structural evaluators will be engineers experienced in the seismic design of civil works structures. Evaluators must be familiar with structural dynamics and response spectrum analysis methods. Evaluators must understand the performance-based evaluation process as presented in EM 1110-2-6063 and FEMA 356 (2000). B-2. Design Criteria. a. Earthquake hazard levels. (1) General. The Basic Safety Earthquake 2 (BSE-2) hazard level is used to assess Collapse Prevention (CP) performance. The Basic Safety Earthquake 1A (BSE-1A) hazard level is used to assess Immediate Occupancy (IO) performance. BSE-2 and BSE-1A are to be combined with other loads that are expected during routine operation of the powerhouse. (2) BSE-2. BSE-2 is an earthquake hazard level that has a 2 percent chance of being exceeded in a 50-year period (2475-year return period). It is felt that this level of earthquake intensity will capture recurrence of all the largest-magnitude earthquakes that have occurred in the United States in historic times. (3) BSE-1A. BSE-1A is an earthquake that has a 5 percent chance of being exceeded in a 50-year period (975-year return period). b. Performance levels. (1) General. Two performance levels are considered when evaluating the response of powerhouses to earthquake ground motions. These are IO performance and CP performance. Acceptance criteria for each performance level are described in Section A-6. As stated pre-viously, life safety (LS) performance need not be considered in the evaluation since IO
B-9
ETL 1110-2-568 31 Oct 06 performance will govern. However, the LS performance level is described below along with IO and CP. (2) LS performance level. LS performance requires that some margin of safety against partial or total collapse remain after the structure has been subjected to a design earthquake event. Some structural elements and components may suffer significant damage, but this should be of a limited nature such that loss of life will not occur. Elements of the structure may perform beyond their elastic limits (non-linear behavior) provided non-linear displacement demands are generally moderate and load resistance is not diminished significantly. Damage may be signifi-cant, but it is generally concentrated in discrete locations where yielding occurs. This level of protection need not be evaluated since IO performance will govern. (3) IO performance level. IO performance requires that structural damage be limited such that repairs can be expeditiously made and the facility returned to operation. The lateral force resisting system is expected to retain nearly all of its strength and stiffness. The risk of life-threatening injury as a result of structural damage is considered to be low. This performance level is required for all powerhouses because the electrical power generated is critical to on-site or off-site emergency response. This level of protection will be evaluated for a BSE-1A event. (4) CP performance level. CP performance requires that collapse of the structure be prevented regardless of the level of damage. Damage may be unrepairable. Ductility demands will be greater than those associated with LS or IO performance. Resistance can decrease with increasing displacements, provided the structure will not collapse when subjected to extreme earthquake events. This level of protection will be evaluated for a BSE-2 event. c. Performance requirements. (1) General. The guidance requires that powerhouse structures meet the objective asso-ciated with IO and CP performance. This is accomplished by selecting an appropriate design-basis earthquake event (BSE-2 or BSE-1A) to be used in combination with specific performance-based evaluation procedures that assure that the structure will meet the appropriate performance level. The performance of powerhouse structures as presented here is based on a demand-to-capacity ratio (DCR) evaluation. Earthquake demands are determined using equivalent lateral force, linear elastic response spectrum analysis, or linear elastic time-history analysis. Member capacity is based on strength design (SD) procedures. (2) Loading combinations. (a) The following loading combination establishes the ultimate strength and service-ability requirements for the evaluation of reinforced-concrete powerhouse structures. The loading combination represents the total demand (dead load + live load + earthquake) for which the superstructure must be evaluated. (b) The following strength design loading combination shall be used to determine the total earthquake demand on powerhouse structures for BSE-2 and BSE-1A conditions:
B-10

ETL 1110-2-568 31 Oct 06
QE = QD + QL ± QDE (B-1) where: QE = combined action due to design earthquake loads, dead load, and live load for use
in evaluating IO, LS, and CP performance QD = dead load effect QL = live load effect QDE = earthquake load effects from the design earthquake, i.e., BSE-2 or BSE-1A. (c) Live loads to be considered are those that are likely to be present during the design earthquake event. d. Performance evaluation. (1) DCR evaluations are used to evaluate the seismic performance of powerhouse struc-tures. Depending on whether the response is a force-controlled action (shear) or a deformation-controlled action (flexure), demands and capacities will be expressed in terms of forces, dis-placement ductilities, or displacements. Capacities are determined in accordance with procedures described in Section B-5. Methods used to assess performance are covered in Section B-6. (2) For flexural response, the performance goals are met when the calculated DCR is less than or equal to a prescriptive DCR limit. The DCR limit can be greater than one for deformation-controlled actions (flexure) to account for expected displacement ductility. Deformation-controlled actions can also be evaluated using a special analysis approach where displacement ductility capacities are determined based on strain limits specified for concrete and reinforcement. These strain limits and information as to the region where yielding takes place (plastic hinge length) are used to determining values for curvature capacity, rotational capacity, displacement capacity, and displacement ductility capacity. (3) For a shear response, the shear demand must be less than the shear capacity. In other words, the shear DCR limit is equal to one. B-3. Estimating Earthquake Ground Motion Demands. a. Specification of earthquake ground motions. (1) General. The earthquake ground motions that are used for evaluating civil works powerhouses are most often characterized in terms of response spectra. Information on response spectra can be found in EM 1110-2-6050. (2) Using response spectra to estimate earthquake demand. Acceleration response spectra represent the peak acceleration response of single-degree-of-freedom (SDOF) systems to a time history of recorded ground motions. Earthquake response spectra can be site specific or standard (non-site specific). Standard response spectra are developed using spectral shapes based on an accumulation of data at sites of similar subsurface characteristics. These standard
B-11
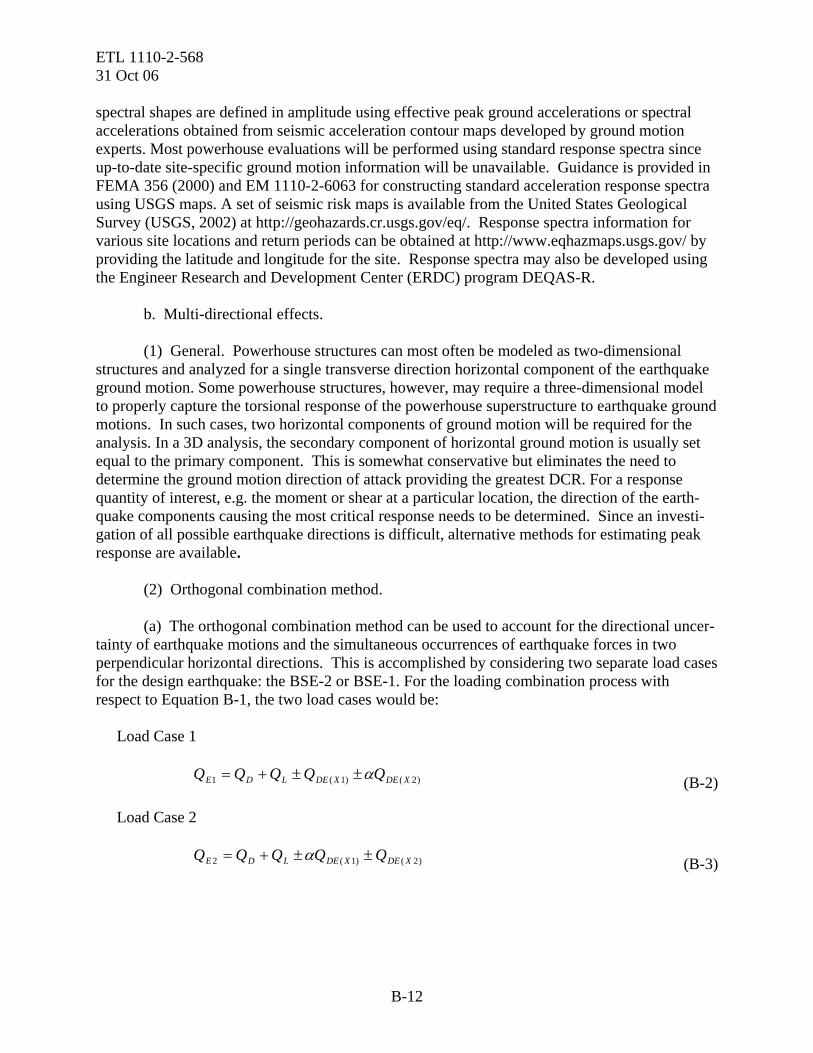
ETL 1110-2-568 31 Oct 06 spectral shapes are defined in amplitude using effective peak ground accelerations or spectral accelerations obtained from seismic acceleration contour maps developed by ground motion experts. Most powerhouse evaluations will be performed using standard response spectra since up-to-date site-specific ground motion information will be unavailable. Guidance is provided in FEMA 356 (2000) and EM 1110-2-6063 for constructing standard acceleration response spectra using USGS maps. A set of seismic risk maps is available from the United States Geological Survey (USGS, 2002) at http://geohazards.cr.usgs.gov/eq/. Response spectra information for various site locations and return periods can be obtained at http://www.eqhazmaps.usgs.gov/ by providing the latitude and longitude for the site. Response spectra may also be developed using the Engineer Research and Development Center (ERDC) program DEQAS-R. b. Multi-directional effects. (1) General. Powerhouse structures can most often be modeled as two-dimensional structures and analyzed for a single transverse direction horizontal component of the earthquake ground motion. Some powerhouse structures, however, may require a three-dimensional model to properly capture the torsional response of the powerhouse superstructure to earthquake ground motions. In such cases, two horizontal components of ground motion will be required for the analysis. In a 3D analysis, the secondary component of horizontal ground motion is usually set equal to the primary component. This is somewhat conservative but eliminates the need to determine the ground motion direction of attack providing the greatest DCR. For a response quantity of interest, e.g. the moment or shear at a particular location, the direction of the earth-quake components causing the most critical response needs to be determined. Since an investi-gation of all possible earthquake directions is difficult, alternative methods for estimating peak response are available. (2) Orthogonal combination method. (a) The orthogonal combination method can be used to account for the directional uncer-tainty of earthquake motions and the simultaneous occurrences of earthquake forces in two perpendicular horizontal directions. This is accomplished by considering two separate load cases for the design earthquake: the BSE-2 or BSE-1. For the loading combination process with respect to Equation B-1, the two load cases would be:
Load Case 1
)2()1(1 XDEXDELDE QQQQQ α±±+= (B-2)
Load Case 2
)2()1(2 XDEXDELDE QQQQQ ±±+= α (B-3)
B-12

ETL 1110-2-568 31 Oct 06
where: QE1 = peak value of any response quantity (forces, shears, moments) due to the effects
of dead load, live load, and the maximum design earthquake QDE(X1) = effects resulting from the X1 component of the design earthquake ground motion
occurring in the direction of the first principal structure axis QDE(X2) = effects resulting from the X2 component of the design earthquake ground motion
occurring in the direction of the second principal structure axis. (b) Generally α can be assumed equal to 0.30 for powerhouse structures. (3) SRSS and CQC methods. The square root of the sum of the squares (SRSS) and the complete quadratic combination (CQC) methods can also used for evaluating the multi-directional earthquake effects on powerhouse structures where two or three directions of motion must be considered. These methods are described in EC 1110-2-6063. The CQC method is recommended where torsional effects are expected to influence the response of the superstructure to earthquake ground motion. c. Earthquake demands on inelastic systems. The effects of earthquake ground motion demands on powerhouse structures are determined using linear-elastic response spectrum analysis procedures or linear-elastic time-history procedures. The displacement response of an elastic system to earthquake ground motions can be equal to or less than that of a system that exhibits a nonlinear response. The relationship between linear elastic response and nonlinear response is discussed in EC 1110-2-6063 and illustrated in Figure B-1. When demands for displacement controlled actions (flexure) are obtained from Linear Static Procedure (LSP) or Linear Dynamic Procedure (LDP) analyses, they must be modified to produce displacements that are equivalent to maximum expected inelastic displacements. This is accomplished through the use of displacement modification factors. The displacement modification factors C1 and C2 are in accordance with FEMA 440 (2005) and are described in Section B-6. d. Interaction between bays in response to longitudinal direction demands. Generator bay and erection bay superstructures usually have low displacement demands in the longitudinal direction of attack. Therefore, pounding between adjacent bays usually needs not be considered in a seismic evaluation. The exception might be when adjacent bays are of differing heights or when the lateral force resisting system consists of columns rather than structural walls. In such cases, the displacement demands should be evaluated for longitudinal-direction earthquake demands to determine if there is a chance for superstructures of adjacent bays to collide. Such collisions can result in structural damage due to pounding. B-4. Methods of Seismic Analysis and Structural Modeling. a. Introduction. (1) General. The structural evaluation procedure contained in this manual applies only to the powerhouse superstructure as defined by Figure B-3. The substructure part of the power-house cannot be evaluated by the simplified procedures described here. It is assumed that
B-13
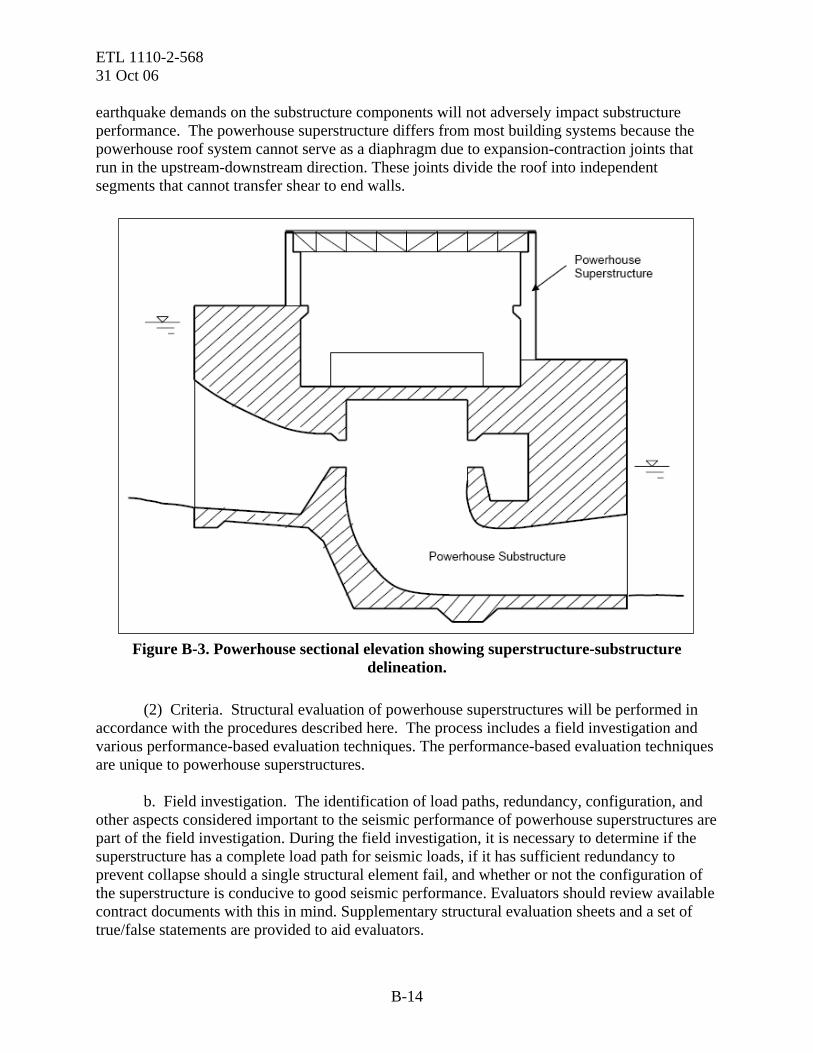
ETL 1110-2-568 31 Oct 06 earthquake demands on the substructure components will not adversely impact substructure performance. The powerhouse superstructure differs from most building systems because the powerhouse roof system cannot serve as a diaphragm due to expansion-contraction joints that run in the upstream-downstream direction. These joints divide the roof into independent segments that cannot transfer shear to end walls.
Figure B-3. Powerhouse sectional elevation showing superstructure-substructure delineation.
(2) Criteria. Structural evaluation of powerhouse superstructures will be performed in accordance with the procedures described here. The process includes a field investigation and various performance-based evaluation techniques. The performance-based evaluation techniques are unique to powerhouse superstructures. b. Field investigation. The identification of load paths, redundancy, configuration, and other aspects considered important to the seismic performance of powerhouse superstructures are part of the field investigation. During the field investigation, it is necessary to determine if the superstructure has a complete load path for seismic loads, if it has sufficient redundancy to prevent collapse should a single structural element fail, and whether or not the configuration of the superstructure is conducive to good seismic performance. Evaluators should review available contract documents with this in mind. Supplementary structural evaluation sheets and a set of true/false statements are provided to aid evaluators.
B-14
ETL 1110-2-568 31 Oct 06
c. Analytical models and amplification effects. (1) General. (a) Three performance-based analysis procedures are available to evaluate the response of powerhouse superstructures to earthquake ground motions. These procedures range in com-plexity from a Linear Static Procedure (LSP) analysis, where only a simple cantilever beam element model is necessary to evaluate earthquake demands on individual powerhouse walls, to a special analysis that can require a complex finite element analysis of the entire substructure-superstructure system. As the evaluations become more complex, so do the analytical models. The reliability of each analytical model in predicting earthquake demands will depend on the validity of the assumptions used in constructing the model. The LSP and LDP analyses use a superstructure-only model to estimate earthquake force and displacement demands. A super-structure-only model can be used in all the analyses provided the evaluator is satisfied that:
• The substructure is rigid and will not participate in a manner that will amplify the response of the superstructure to earthquake ground motions.
• Amplification effects can be estimated using the procedures described in Appendix C. • Amplification effects can be estimated using the top-of-substructure response spectra
obtained from Ebeling, Perez-Marcial, and Yule (2006). (b) The superstructure-only model is simplified even more for the Simple LSP and LSP analyses. (c) In the Simple-LSP analysis, the inertial forces are assumed to be those associated with a constant acceleration response (i.e., peak acceleration response). Demands therefore are those associated with the short-period spectral acceleration (Ss) response (i.e., 0.2-second response). The mass contributing to the inertial response of the wall under consideration (upstream or downstream wall) is lumped at two specified locations (i.e., the roof corbel and crane corbel). In the Simple-LSP, the wall lateral stiffness is based on the section properties of the lowermost wall section. Periods of vibration for the Simple-LSP analysis are determined by simple formulation. Displacement demands assume a 1-percent drift, or the displacement at the roof corbel is equal to 0.010 times the height of the wall from substructure to corbel. (d) The LSP analysis uses a simple equivalent lateral force (ELF) procedure to determine earthquake demands on the structure and its critical components. As with the Simple-LSP, the LSP estimates the wall lateral stiffness based on the section properties of the lowermost wall section. The LSP procedure uses basic modal analysis techniques, assumes that the first mode shape is linear, and assumes that the total earthquake demands are approximately equal to those of the fundamental mode of vibration. Mass is assigned to the same locations specified for the Simple-LSP analysis. (e) The LDP analysis uses multi-mode response spectrum analysis procedures to determine earthquake demands on the superstructure and its critical components. In an LDP
B-15
ETL 1110-2-568 31 Oct 06 analysis, it is possible to use the actual stiffness for differing wall sections, use many lumped-mass locations to capture actual mass distributions, consider more than just the fundamental mode, and capture “free to translate” at “fixed against translation” roof bearings conditions. (f) The validity of superstructure-only models and tributary mass assumptions used in a Simple-LSP, LSP, or LDP lumped-mass analyses are discussed in the following paragraphs. (2) Superstructure-only models. (a) The modes of vibration that can be significant to superstructure response are illustrated in Figure B-4. (b) Under roof support conditions that allow each wall to vibrate independently, there is a first mode response for both the tall and short walls that should be considered in the performance-based evaluation (Figure B-4a). There is also a second mode response for the tall wall (Figure B-4b) that can contribute to demands on the upper wall section between the crane corbel and roof corbel. When roof support conditions prevent each wall from vibrating independently, the first mode as indicated in Figure B-4c is used for the performance-based evaluation. (c) Performance of the superstructure is based on DCR evaluations for both force-controlled actions and deformation-controlled actions. The DCR method for deformation-controlled actions assumes that the superstructure responds in either the constant acceleration range or the constant velocity range (see Figure C-1). In these ranges, the displacement demand can be estimated using equal energy or equal displacement principles. This limits the super-structure analysis to one that considers only those flexural demands associated with the basic modes of vibration depicted in Figure B-4. Higher modes of vibration occur in the equal acceleration range of the response spectrum, where equal energy of equal displacement princi-ples no longer applies. Higher modes increase displacement demands very little. Therefore, limiting the analysis to the basic modes described above is considered to be reasonable when assessing deformation-controlled actions. Higher mode effects can increase shear demands, and it may be worthwhile to investigate shear demands by multi-mode LDP analysis. Shear demand, however, is limited by the flexural capacity of the member and need not exceed 1.5 times the shear associated with a flexural demand that is equal to the nominal moment capacity of the member. (d) Under rigid substructure conditions, the superstructure could be assumed to act as a flexible appendage attached to a rigid base. When subject to earthquake ground motions, the substructure (since it is rigid) moves in unison with the ground, and the accelerations at the top of the substructure are equal to the accelerations at the substructure-foundation interface. The superstructure, therefore, could be assumed to respond as if it were resting directly on the ground, and as such the top-of-rock response spectra could be used in the analysis.
B-16

ETL 1110-2-568 31 Oct 06
a. Superstructure walls vibrating independently. First mode.
b. Superstructure walls vibrating independently. Second mode for tall wall.
Figure B-4. Powerhouse superstructure modes of vibration.
B-17

ETL 1110-2-568 31 Oct 06
c. Superstructure walls vibrating together. First mode.
Figure B-4 (continued)
(e) In general, substructures are somewhat flexible, and amplification (i.e., magnifica-tion) effects on superstructure walls can be significant, especially when the fundamental period of the superstructure wall is near that of the substructure. Amplification refers to the ratio of acceleration demand on a superstructure that is founded atop the substructure to the acceleration demand on the superstructure if founded on top of rock. Amplification is the product of two components: height-wise amplification (ax) and resonance amplification (ap). Height-wise amplification occurs because the top of the substructure is higher than the center of seismic force. Resonance amplification (ap) increases as the period of the superstructure approaches the period of the substructure. The magnitude of the resonance amplification (ap) depends on the ratio of the superstructure period (T) to the substructure (T1). Height-wise amplification and resonance amplification effects are described in Appendix C. In general, resonance amplifica-tion effects must be considered when the superstructure-to-substructure period ratio (T/T1) is less than two. Height-wise amplification effects must be considered when T/T1 is less than three. Amplification effects (ax × ap) can be assumed to be negligible when T/T1 values are greater than three. Methods for estimating the period of the substructure are provided in Appendix C. Methods for estimating the period of the superstructure are provided in the following paragraphs. (3) Tributary mass assumptions. (a) Each powerhouse superstructure wall can be evaluated independently in cases where the walls have similar lateral stiffness. Walls of unequal lateral stiffness can also be evaluated independently using approximate procedures described below. In such cases, mass can be assigned to each wall by:
B-18

ETL 1110-2-568 31 Oct 06
• Lumping tributary mass at the roof corbel and crane corbel locations (Simple-LSP
and LSP analyses)
• Lumping mass at multiple locations based on tributary mass distribution (LDP analysis). (b) A typical powerhouse superstructure system is shown in Figure B-5.
Figure B-5. Powerhouse superstructure sectional elevation,
showing a typical framing system.
(c) Roof bearings permit free rotation at each end of the roof system, but free translation is usually limited to one end only. Keepers or slotted plates limit movement for bearings that are free to translate. The assumptions made with respect to the boundary conditions at each end of the roof span are critical to the analysis for walls of unequal stiffness. It is assumed for the LSP analysis that each wall of the powerhouse superstructure can be evaluated independently through proper assignment of wall and roof mass to each of two specified lumped-mass locations.
B-19

ETL 1110-2-568 31 Oct 06 Figure B-6 illustrates the response of walls of equal and unequal stiffness to earthquake ground motions when walls vibrate independently (translation fixed at one end and free at the other end) or vibrate together (translation fixed at both ends).
a. Upstream and downstream walls of equal stiffness.
b. Upstream and downstream walls of unequal stiffness.
The roof slide bearing allows walls to vibrate independently.
c. Upstream and downstream walls of unequal stiffness.
The roof slide bearing prevents walls from vibrating independently.
Figure B-6. Response of superstructure walls to lateral earthquake loads.
B-20
ETL 1110-2-568 31 Oct 06
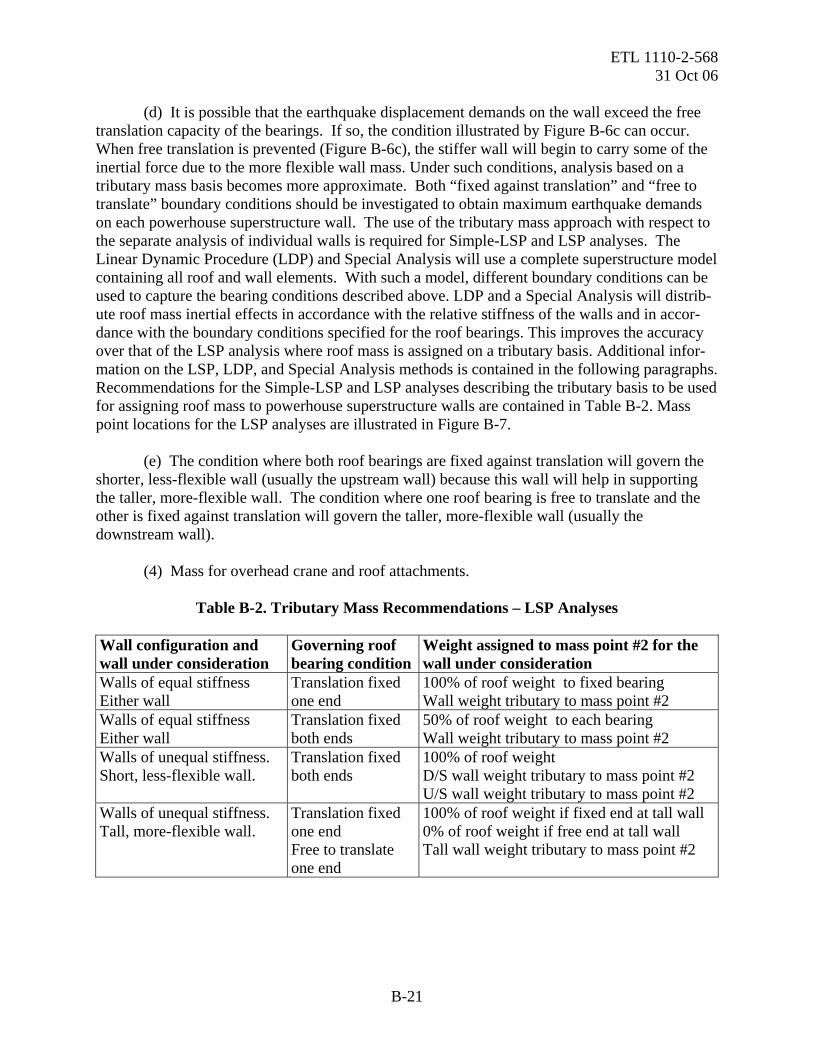
(d) It is possible that the earthquake displacement demands on the wall exceed the free translation capacity of the bearings. If so, the condition illustrated by Figure B-6c can occur. When free translation is prevented (Figure B-6c), the stiffer wall will begin to carry some of the inertial force due to the more flexible wall mass. Under such conditions, analysis based on a tributary mass basis becomes more approximate. Both “fixed against translation” and “free to translate” boundary conditions should be investigated to obtain maximum earthquake demands on each powerhouse superstructure wall. The use of the tributary mass approach with respect to the separate analysis of individual walls is required for Simple-LSP and LSP analyses. The Linear Dynamic Procedure (LDP) and Special Analysis will use a complete superstructure model containing all roof and wall elements. With such a model, different boundary conditions can be used to capture the bearing conditions described above. LDP and a Special Analysis will distrib-ute roof mass inertial effects in accordance with the relative stiffness of the walls and in accor-dance with the boundary conditions specified for the roof bearings. This improves the accuracy over that of the LSP analysis where roof mass is assigned on a tributary basis. Additional infor-mation on the LSP, LDP, and Special Analysis methods is contained in the following paragraphs. Recommendations for the Simple-LSP and LSP analyses describing the tributary basis to be used for assigning roof mass to powerhouse superstructure walls are contained in Table B-2. Mass point locations for the LSP analyses are illustrated in Figure B-7. (e) The condition where both roof bearings are fixed against translation will govern the shorter, less-flexible wall (usually the upstream wall) because this wall will help in supporting the taller, more-flexible wall. The condition where one roof bearing is free to translate and the other is fixed against translation will govern the taller, more-flexible wall (usually the downstream wall). (4) Mass for overhead crane and roof attachments.
Table B-2. Tributary Mass Recommendations – LSP Analyses
Wall configuration and wall under consideration
Governing roof bearing condition
Weight assigned to mass point #2 for the wall under consideration
Walls of equal stiffness Either wall
Translation fixed one end
100% of roof weight to fixed bearing Wall weight tributary to mass point #2
Walls of equal stiffness Either wall
Translation fixed both ends
50% of roof weight to each bearing Wall weight tributary to mass point #2
Walls of unequal stiffness. Short, less-flexible wall.
Translation fixed both ends
100% of roof weight D/S wall weight tributary to mass point #2 U/S wall weight tributary to mass point #2
Walls of unequal stiffness. Tall, more-flexible wall.
Translation fixed one end Free to translate one end
100% of roof weight if fixed end at tall wall 0% of roof weight if free end at tall wall Tall wall weight tributary to mass point #2
B-21
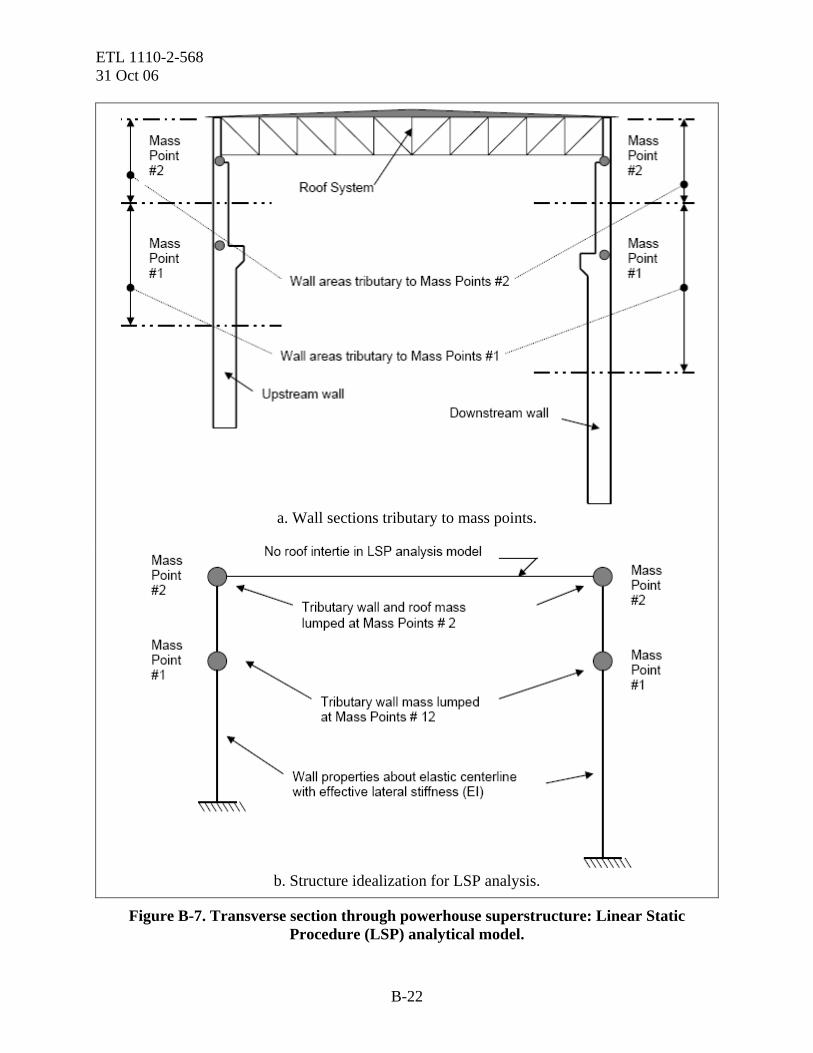
ETL 1110-2-568 31 Oct 06
a. Wall sections tributary to mass points.
b. Structure idealization for LSP analysis.
Figure B-7. Transverse section through powerhouse superstructure: Linear Static Procedure (LSP) analytical model.
B-22
ETL 1110-2-568 31 Oct 06
(a) For powerhouses located in high seismic regions, it may be advantageous to park the gantry crane near the end wall so that this structural element can carry any inertial forces generated by the crane mass during a major earthquake. This aspect can be assessed during the performance-based analysis. If parking the crane near an end wall could eliminate the need for costly remediation, then this action should be recommended in the final report. The interaction of the crane and powerhouse superstructure in response to earthquake ground motions is nonlinear and unpredictable. Therefore, simply assuming that the crane mass is distributed equally to each wall is acceptable. (b) In rare cases, switchgear or other massive nonstructural elements can be located on top of the powerhouse roof. With respect to demands on the superstructure, it is only necessary to add any significant nonstructural mass to appropriate nearby roof or roof corbel mass point locations. d. Effective stiffness. (1) The effective moment of inertia, Ie, of reinforced concrete structures at near-yield conditions can be significantly less than that represented by the gross section moment of inertia, IG. For powerhouse superstructure walls, the effective moment of inertia should be calculated and used in the LSP, LDP, and Special analyses to assure that the response of the powerhouse superstructure to earthquake ground motions is reasonable. The effective moment of inertia is an average value for the entire member and considers the distribution of cracking along the member length. The effective moment of inertia of reinforced concrete structures can be estimated based on the relationship between the cracking moment (i.e., the moment required to initiate cracking while ignoring the reinforcing steel) and the nominal moment capacity of the reinforced concrete wall section. The nominal moments and cracking moments used to estimate the effective moment of inertia are for those regions where moments are at their maximums. For powerhouse walls, this can be at the base of cantilever wall members or in upper wall sections where an abrupt change in wall thickness occurs. Once the cracking moment (MCR) and the nominal moment capacity (MN) have been determined, the ratio of Ie to IG can be estimated as follows:
0 8 0 9 1e
G C
I MI M
. .⎡ ⎤
= − −⎢⎣ ⎦
N
R⎥ . (B-4)
(2) The ratio of Ie to IG shall not be greater than 0.8 nor less than 0.25 for Grade 60 steel or less than 0.35 for 40 Grade steel. The nominal moment strength can be determined in accordance with standard ACI 318 procedures. The cracking moment (MCR) can be determined by the following expression.
M f
PA
SCR r b= +⎛⎝⎜
⎞⎠⎟ (B-5)
B-23
ETL 1110-2-568 31 Oct 06 where: = modulus of rupture = rf 7 5 cf
'. (psi units) P = axial load A = area Sb = IG / c = section modulus c = depth to neutral axis. (3) Equation B-5 is a simplification of the Bronson Equation that has been proposed for the seismic evaluation of Corps structures. Supporting documentation can be found in Appendix G of Strom and Ebeling (2005). e. Damping. Effective damping at 5 percent of critical will provide a reasonable estimate of the response of reinforced concrete structures at or near yield. It should be realized that damping is much lower than 5 percent for unyielding structures (about 2 percent) and much higher than 5 percent after significant damage has occurred. f. Linear Static Procedure (LSP) analysis. (1) Introduction. (a) The Simple-LSP and LSP provide hand computational methods for estimating the earthquake demands on powerhouse superstructure walls. These methods allow each super-structure wall to be evaluated separately based on a tributary mass approach. Each powerhouse superstructure wall is treated as a cantilever beam element with masses lumped at roof corbel (mass point #2) and crane corbel (mass point #1) locations. The lumped mass–beam element analytical model used for the Simple-LSP and LSP analysis is illustrated in Figure B-7. (b) Weights of the various wall sections and the roof are determined and assigned to each of the lumped mass locations based on a tributary area basis. In those cases where the two walls are of equal stiffness and fixed against translation at one end only, the roof mass is to be applied to the wall with the bearing fixed against translation. The roof mass is assigned to the fixed bearing roof corbel (mass point #2) location. In those cases where the two walls are of equal stiffness and fixed against translation at both ends, the roof mass is to be applied equally to each roof corbel (mass point #2) location. (c) For walls of unequal stiffness, evaluation of the taller, more-flexible wall will occur under the governing condition where the roof system is assumed fixed at one wall and free to slide at the other wall. The entire roof mass is to be assigned to the taller wall roof corbel location when it contains the bearing fixed against translation; otherwise no roof mass is to be assigned. For walls of unequal stiffness, evaluation of the shorter, less-flexible wall will occur under the governing condition where the roof system is assumed fixed against translation at both ends. The entire roof mass is to be assigned to the shorter wall roof corbel location. In addition, the mass tributary to mass point # 2 of the taller wall is to be assigned to the shorter wall roof corbel location.
B-24

ETL 1110-2-568 31 Oct 06
(d) The details of the Simple-LSP and LSP analyses are described below. The process is one of:
• Modeling the superstructure using the lumped-mass systems described above and considering only the fundamental mode of vibration.
• Estimating the structure fundamental period of vibration using simple formulations or
techniques. • Estimating earthquake demands based on the standard spectra approach described
FEMA 356 (2000) or EC 1110-2-6063. • Using simple procedures to determine the force and displacement demands on
superstructure walls. • Calculating moments and shear capacities for critical wall sections. • Determining demand-to-capacity ratios (DCR) for critical wall sections and verifying
that these meet prescriptive DCR acceptance criteria. • Verifying that splice lengths and anchorage lengths are adequate (see Appendix D). • Verifying that roof bearing connector demands are less than connector capacities (Per
ACI 318, Appendix D). • Comparing displacement demands to displacement capacities as a means of
evaluating the potential for a loss of support at roof bearing and crane corbel locations. • Checking potential brittle failure mechanisms (i.e., shear and sliding shear).
(2) Simple-LSP analysis. (a) In a Simple-LSP analysis, the seismic base shear (V) is determined in accordance with:
(B-6) WSV S2.1=
where: Ss = short-period (0.2-second) spectral acceleration for the design earthquake W = total tributary weight assigned to the powerhouse wall under evaluation. (b) The forces at each idealized lumped mass location shall be calculated by:
B-25

ETL 1110-2-568 31 Oct 06
(B-7) xSx WSF 2.1=
where: Wx = portion of wall tributary weight (W) assigned to the lumped mass at level (x). (c) The forces calculated by Equation B-7 may need to be increased to account for substructure height-wise amplification and resonance amplification. To determine if resonance amplification is possible, the evaluator must estimate the fundamental period of the wall (T) and the fundamental period of the substructure (T1). The fundamental period of the substructure can be estimated in accordance with methods provided in Appendix C. The fundamental period of the wall for the Simple-LSP method can be assumed to be equal to:
2( )WT
k g= π (B-8)
where: W = Total tributary weight assigned to the powerhouse wall under evaluation, and
33 e
e
EIkh
= (B-9)
where: E = modulus of elasticity of the concrete Ie = effective moment of inertia for the lowermost wall section he = effective height of wall = [w2 (h2) + w1 (h1)] ÷ w2 + w1 w2 = weight assigned to mass point #2 w1 = weight assigned to mass point #1 h2 = wall height to mass point #2 h1 = wall height to mass point #1. (d) Displacements for the Simple-LSP method are based on 1.0 percent drift. (e) The Simple-LSP method is demonstrated in Figure B-8. (3) LSP Analysis. The LSP analysis uses an approximate single-mode response spectrum analysis to determine the force and displacement demands on each of the powerhouse superstructure walls. A step-by-step description for LSP analysis is presented below.
B-26

ETL 1110-2-568 31 Oct 06
Figure B-8a. Linear Static Procedure (LSP) example.
Nominal moment and shear capacities determined in accordance with Section B-5
Location
Nominal Shear Capacity – VN
Nominal Moment Capacity - MN
1.5 Ft. U/S Wall Elev. 24.0 12.63 kips 32.8 ft-kips 1.5 Ft. D/S Wall Elev. 24.0 12.63 kips 32.8 ft-kips 3.5 Ft. U/S Wall Elev. 12.0 29.94 kips 161.6 ft-kips 3.5 Ft. D/S Wall Elev. 0.0 29.94 kips 161.6 ft-kips
Figure B-8b. Shear and moment capacities.
B-27

ETL 1110-2-568 31 Oct 06
Figure B-8c. Simple LSP, two lumped mass system; downstream wall (1-ft length of wall). The condition where the roof bearing
for the downstream wall is free to translate governs. Therefore, the downstream wall weight assigned to Mass Point #2 is that tributary to the wall itself. If upstream wall roof bearing were fixed against translation, it would be necessary to also assign
the weight of the roof system to Mass Point #2.
B-28

ETL 1110-2-568 31 Oct 06
Figure B-8d. Simple LSP, two-lumped mass system; upstream wall
(1-ft length of wall). The condition where both roof bearing are fixed against translation governs. Therefore, the upstream wall
weight assigned to Mass Point #2 includes: • The weight of the roof system = 50 (0.80) ÷ 8 = 5.0 kips • The weight of the wall tributary to the upstream Mass
Point #2 = 2.5 kips • The weight of the wall tributary to the downstream Mass
Point #2 = 2.5 kips.
The upstream wall weight assigned to Mass Point #2 = [7.5 (1.5) + 6.0 (3.5)] 0.150 = 4.8 kips.
B-29
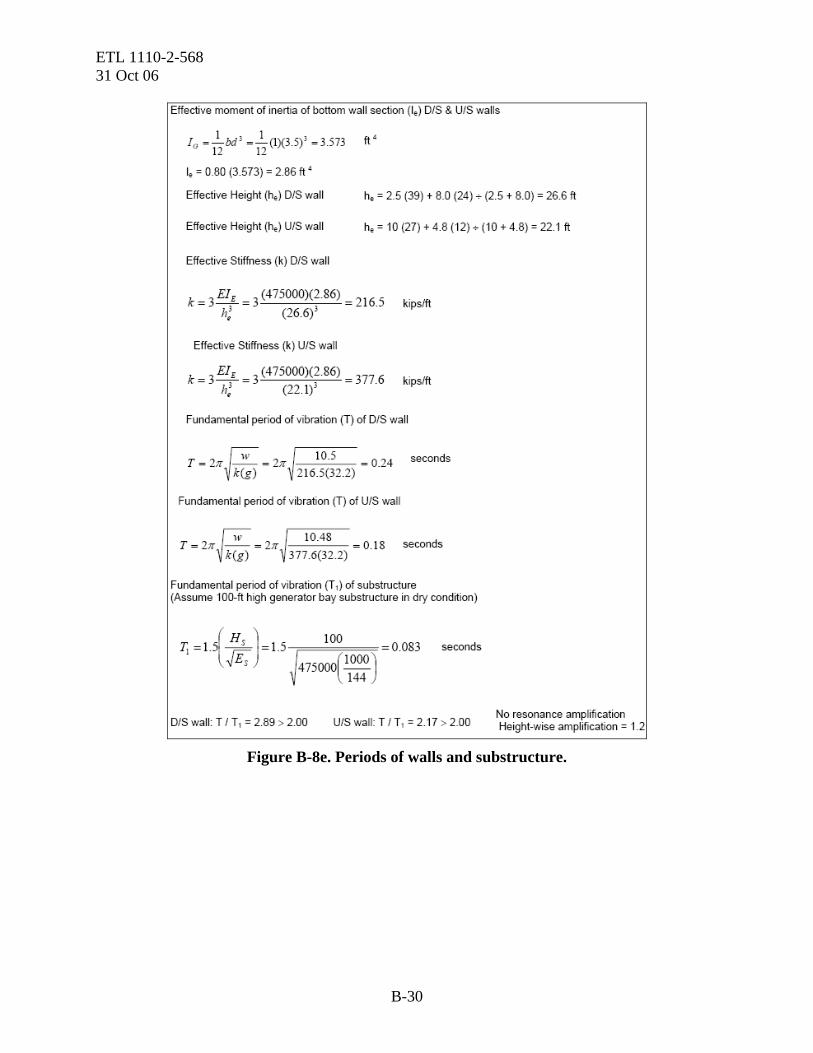
ETL 1110-2-568 31 Oct 06
Figure B-8e. Periods of walls and substructure.
B-30
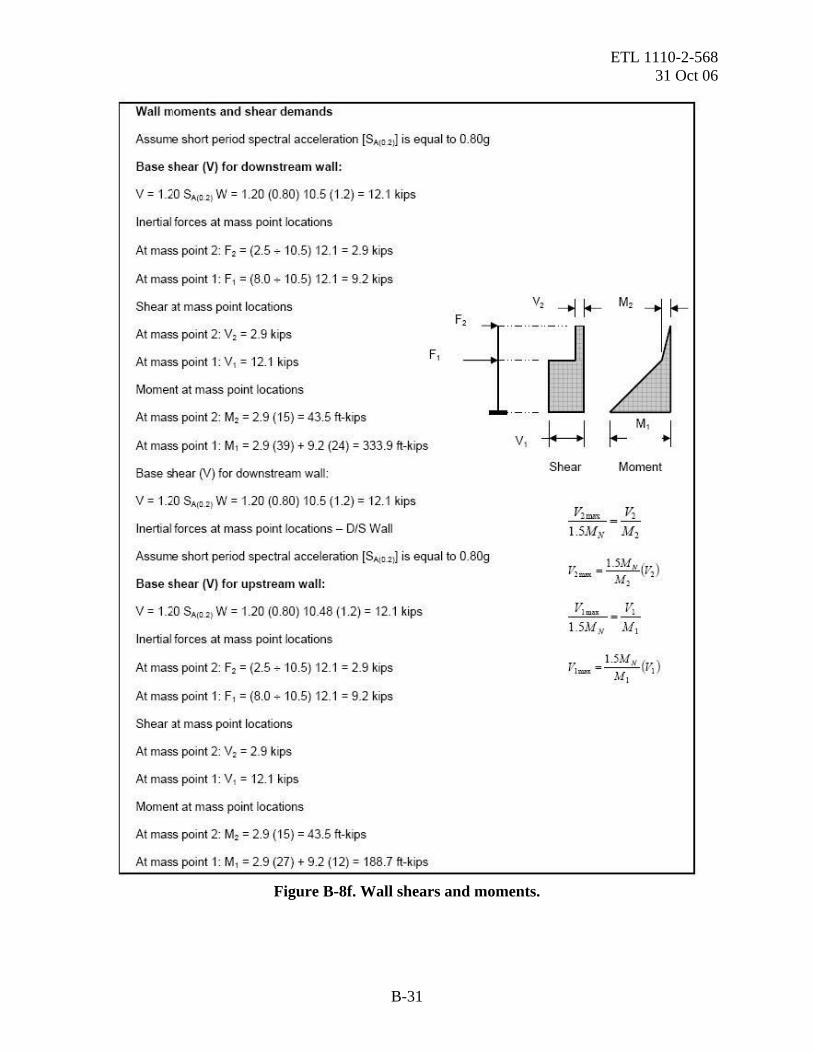
ETL 1110-2-568 31 Oct 06
Figure B-8f. Wall shears and moments.
B-31
Wall moments and shear demands
Assume short period spectral acceleration [S,10_,l) is equal to 0.80g
Base shear (V) for downstream wall:
V = 1.20 S,(O.' ! W = 1.20 (0.80) 10.5 (1.2) = 12.1 kips
Inertial forces at mass point locations
At mass point 2: F2 = (2.5.,. 10.5) 12.1 = 2.9 kips
At mass point 1: F, = (8.0.,. 10.5) 12.1 = 9.2 kips
Shear at mass point locations
At mass point 2: v, = 2.9 kips
At mass point 1: V, = 12.1 kips
Moment at mass point locations
At mass point 2: M2 = 2.9 (15) = 43.5 ft-kips
F,
v,
···-··--At mass point 1: M, = 2.9 (39) + 9.2 (24) = 333.9 It-kips
Base shear (V) for downstream wall:
V = 1.20 S,(0•21 W = 1.20 (0.80) 10.5 (1.2) = 12.1 kips
Inertial forces at mass point locations - D/S Wall
Assume short period spectral acceleration [S,10_21) is equal to 0.80g
Base shear (V) for upstream wall:
V = 1.20 S,(0•21 W = 1.20 (0.80) 10.48 (1.2) = 12.1 kips
Inertial forces at mass point locations
At mass point 2: F2 = (2.5.,. 10.5) 12.1 = 2.9 kips
At mass point 1: F, = (8.0.,. 10.5) 12.1 = 9.2 kips
Shear at mass point locations
At mass point 2: V2 = 2.9 kips
At mass point 1: V, = 12.1 kips
Moment at mass point locations
At mass point 2: M2 = 2.9 (15) = 43.5 ft-kips
At mass point 1: M, = 2.9 (27) + 9.2 (12) = 188.7 It-kips
v, H ~ M, ~ Shear Moment
V2 m..~ = _.!1.._ 1.5,\1,v ,\12
V = 1.5M.v (1!.) l:.»x lvfl 1
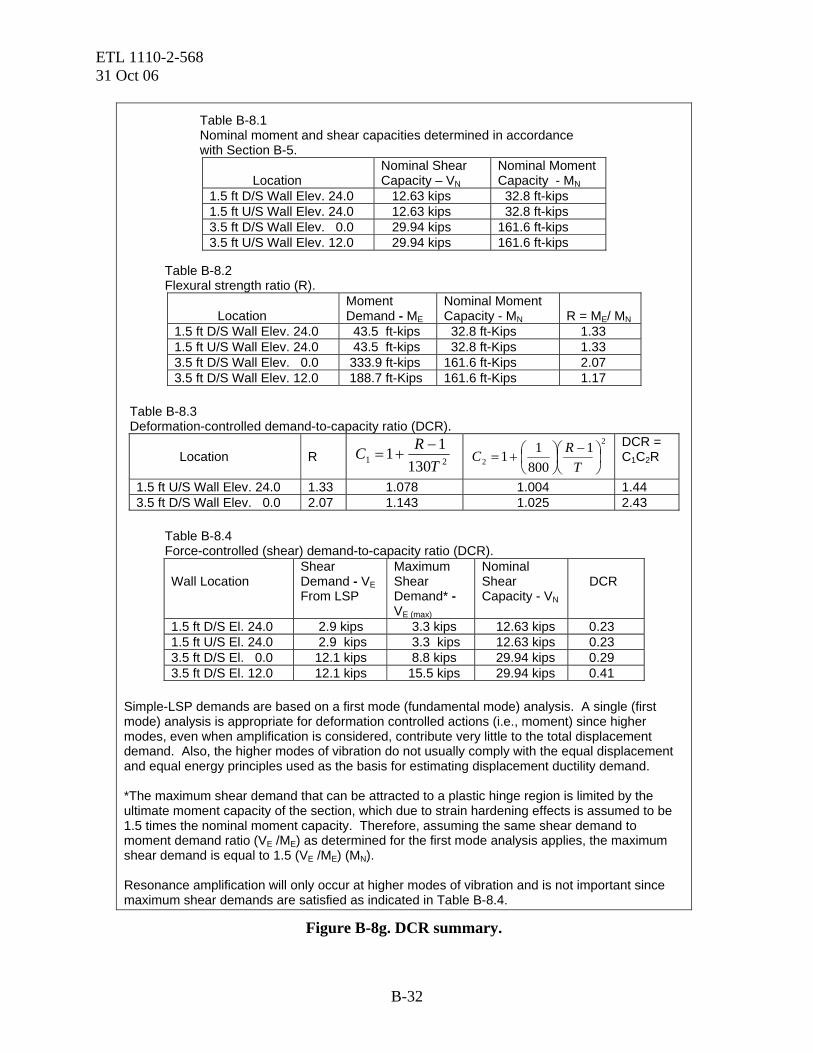
ETL 1110-2-568 31 Oct 06
Table B-8.1 Nominal moment and shear capacities determined in accordance with Section B-5.
Location
Nominal Shear Capacity – VN
Nominal Moment Capacity - MN
1.5 ft D/S Wall Elev. 24.0 12.63 kips 32.8 ft-kips 1.5 ft U/S Wall Elev. 24.0 12.63 kips 32.8 ft-kips 3.5 ft D/S Wall Elev. 0.0 29.94 kips 161.6 ft-kips 3.5 ft U/S Wall Elev. 12.0 29.94 kips 161.6 ft-kips
Table B-8.2 Flexural strength ratio (R).
Location
Moment Demand - ME
Nominal Moment Capacity - MN
R = ME/ MN
1.5 ft D/S Wall Elev. 24.0 43.5 ft-kips 32.8 ft-Kips 1.33 1.5 ft U/S Wall Elev. 24.0 43.5 ft-kips 32.8 ft-Kips 1.33 3.5 ft D/S Wall Elev. 0.0 333.9 ft-kips 161.6 ft-Kips 2.07 3.5 ft D/S Wall Elev. 12.0 188.7 ft-Kips 161.6 ft-Kips 1.17
Table B-8.3 Deformation-controlled demand-to-capacity ratio (DCR). Location
R 21 130
11T
RC −+=
2
21
80011 ⎟
⎠⎞
⎜⎝⎛ −⎟⎠⎞
⎜⎝⎛+=
TRC
DCR = C1C2R
1.5 ft U/S Wall Elev. 24.0 1.33 1.078 1.004 1.44 3.5 ft D/S Wall Elev. 0.0 2.07 1.143 1.025 2.43
Table B-8.4 Force-controlled (shear) demand-to-capacity ratio (DCR). Wall Location
Shear Demand - VE From LSP
Maximum Shear Demand* - VE (max)
Nominal Shear Capacity - VN
DCR
1.5 ft D/S El. 24.0 2.9 kips 3.3 kips 12.63 kips 0.23 1.5 ft U/S El. 24.0 2.9 kips 3.3 kips 12.63 kips 0.23 3.5 ft D/S El. 0.0 12.1 kips 8.8 kips 29.94 kips 0.29 3.5 ft D/S El. 12.0 12.1 kips 15.5 kips 29.94 kips 0.41
Simple-LSP demands are based on a first mode (fundamental mode) analysis. A single (first mode) analysis is appropriate for deformation controlled actions (i.e., moment) since higher modes, even when amplification is considered, contribute very little to the total displacement demand. Also, the higher modes of vibration do not usually comply with the equal displacement and equal energy principles used as the basis for estimating displacement ductility demand. *The maximum shear demand that can be attracted to a plastic hinge region is limited by the ultimate moment capacity of the section, which due to strain hardening effects is assumed to be 1.5 times the nominal moment capacity. Therefore, assuming the same shear demand to moment demand ratio (VE /ME) as determined for the first mode analysis applies, the maximum shear demand is equal to 1.5 (VE /ME) (MN). Resonance amplification will only occur at higher modes of vibration and is not important since maximum shear demands are satisfied as indicated in Table B-8.4.
Figure B-8g. DCR summary.
B-32
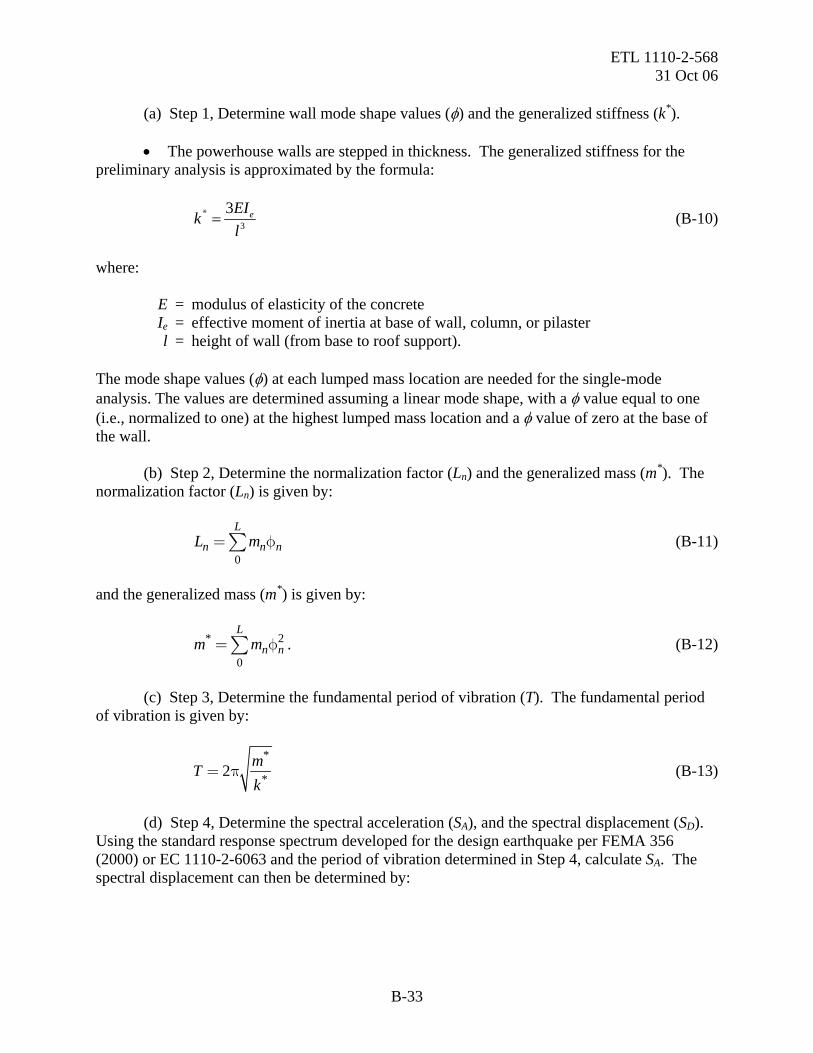
ETL 1110-2-568 31 Oct 06
(a) Step 1, Determine wall mode shape values (φ) and the generalized stiffness (k*).
• The powerhouse walls are stepped in thickness. The generalized stiffness for the preliminary analysis is approximated by the formula:
3
3 eEIkl
=* (B-10)
where: E = modulus of elasticity of the concrete Ie = effective moment of inertia at base of wall, column, or pilaster l = height of wall (from base to roof support). The mode shape values (φ) at each lumped mass location are needed for the single-mode analysis. The values are determined assuming a linear mode shape, with a φ value equal to one (i.e., normalized to one) at the highest lumped mass location and a φ value of zero at the base of the wall. (b) Step 2, Determine the normalization factor (Ln) and the generalized mass (m*). The normalization factor (Ln) is given by:
(B-11) 0
L
nL m= φ∑ n n
2
and the generalized mass (m*) is given by:
. (B-12) *
0
L
n nm m= φ∑ (c) Step 3, Determine the fundamental period of vibration (T). The fundamental period of vibration is given by:
*
*2 mTk
= π (B-13)
(d) Step 4, Determine the spectral acceleration (SA), and the spectral displacement (SD). Using the standard response spectrum developed for the design earthquake per FEMA 356 (2000) or EC 1110-2-6063 and the period of vibration determined in Step 4, calculate SA. The spectral displacement can then be determined by:
B-33
ETL 1110-2-568 31 Oct 06
2
2DTS
⎛ ⎞⎟⎜= ⎟⎜ ⎟⎜⎝ ⎠π AS (B-14)
(e) Step 5, Determine the lateral displacements ( )δn , inertial forces (Fn), and the seismic moments and shears on the wall.
• The lateral displacement of any mass is given by:
*n
nL Sm
⎛ ⎞⎟⎜δ = φ⎟⎜ ⎟⎜⎝ ⎠ D n . (B-15)
• The inertial force acting on any mass is computed by:
*n
n nLF m Sm
⎛ ⎞⎟⎜= φ⎟⎜ ⎟⎜⎝ ⎠ A n . (B-16)
• Once the inertial forces for each mass location have been determined, they must be
amplified for height-wise effects and resonance effects as described in Appendix C. These inertial forces are then applied to the wall, and the wall shears and moments are determined in the same manner as for any set of static loads.
• The disadvantages of the LSP analyses are that:
− They use approximate methods to determine the fundamental period of vibration.
− They are limited to a single mode of vibration.
− Mass is lumped at two specified locations, the roof bearing corbel and the crane corbel.
g. Linear Dynamic Procedure (LDP) analysis. (1) For certain powerhouse roof / wall configurations, it will be difficult to get reason-able results using the LSP analysis. In such cases, an LDP or Special Analysis should be performed. In the LDP, a response spectrum analysis is performed using a structural analysis computer program with dynamic analysis capability. (2) The LDP analysis will improve the accuracy of the analysis since:
• All contributing modes of vibration can be considered.
• The mass distribution of the structure can be more accurately represented.
B-34
ETL 1110-2-568 31 Oct 06
• The interaction between walls of differing lateral stiffness can be captured more
accurately. (3) Several general-purpose computer programs are available to perform multi-mode analyses of powerhouse superstructures. The structural idealization for a multi-mode analysis of a powerhouse superstructure is depicted in Figure B-9. Additional information on LDP analysis can be found in FEMA 356 (2000). Demand-to-capacity evaluations for the LDP analysis are similar to those described above for the LSP analysis. h. Special Analysis. A Special Analysis should be considered when it cannot be established conclusively by an LSP or LDP analysis that the powerhouse superstructure will (or will not) meet performance objectives. The Special Analysis can consist of one or more of the following:
• A displacement ductility evaluation to better estimate the displacement ductility capacity of critical powerhouse superstructure members.
• A finite element analysis and/or time-history analysis of the composite substructure-superstructure system to better estimate the influence substructure response has in amplifying the superstructure response. The substructure can be a simple finite element model, per Ebeling, Perez-Marcial, and Yule (2006), that reasonably captures the overall mass and stiffness properties of the substructure.
• A site-specific ground motion study to more accurately establish ground motion demands.
• A 3D analysis of superstructure to capture torsional response in non-symmetrical superstructure systems. (1) Displacement ductility evaluation. The displacement ductility evaluation is con-sidered to be the most important part of the Special Analysis. In many cases will be the only step performed as part of the Special Analysis. The displacement ductility evaluation may indicate displacement ductility capacities considerably greater than indicated by the prescriptive DCR acceptance criteria of Table B-3. Evaluators should be aware that an upper limit of four is placed on displacement ductility capacity (limit of moderated ductility demand) to assure that signifi-cant bond strength deterioration will not occur at splice and anchorage locations. This means acceptable DCR values as high as four can be used if a displacement capacity evaluation is performed and the results indicate that displacement ductility capacity is four or more. Other-wise, DCR values used for acceptance are limited to the actual displacement ductility capacity, or to a maximum of 2.0 for those cases where a displacement ductility capacity evaluation has not been performed. (2) Finite element analysis of the composite substructure-superstructure system. Height-wise amplification and resonance amplification effects can be captured in a superstructure-only model using the procedure described in Appendix C or by using top-of-substructure response
B-35

ETL 1110-2-568 31 Oct 06
a. Wall–roof configuration.
b. Structural idealization.
Figure B-9. Structural idealization for Linear Dynamic Procedure (LDP) analysis.
B-36

ETL 1110-2-568 31 Oct 06
Table B-3. Prescriptive DCR factors for superstructure seismic evaluation for displacement controlled actions (flexure), with members controlled by flexure.
IO CP 1.5 2.0
spectra from Ebeling, Perez-Marcial, and Yule (2006). A finite element analysis and time-history analysis of the composite substructure-superstructure system should be considered for those superstructures that are significantly influenced by amplification and are marginal with respect to satisfying acceptance requirements. (3) Site-specific ground motion study. A site-specific ground motion study to determine BSE-2 and BSE-1A ground motion demands may be advantageous when it cannot be determined conclusively that the existing powerhouse superstructure (without mitigation) will meet perfor-mance objectives. In such cases, a site-specific probabilistic hazard assessment (PSHA) conducted in accordance with EM 1110-2-6050 should be considered. (4) 3D analysis of superstructure. (a) Restrictions as to the acceptability of 2D models are provided in FEMA 356 (2000). (b) The need for a three-dimensional analytical model occurs in circumstances illustrated in Figures B-10 and B-11. (c) Certain generator bays and erection bays may have structural (shear) walls that buttress the upstream longitudinal wall or structural walls that enclose the end of the bay. These walls may not meet current code requirements with respect to ductility. Their capacity to resist earthquake demands, however, can be based on information presented in FEMA 356 (2000) for non-conforming wall systems provided the walls are constructed integrally with the longitudinal wall. The shear walls are generally positioned between transformers, and in many cases the center of mass of the system is not coincident with the center of rigidity. Under such conditions, a torsional response will occur due to earthquake ground motions occurring in the transverse direction. It would be difficult to estimate the response with a 2D model, so a 3D model should be used. A 3D analysis is important for obtaining the correct distribution of seismic forces and for capturing the combined influence of the transverse and torsional responses to EQ ground motions. The combined influence may be additive in a complete quadratic combination (see ER 1110-2-6063), since the periods of the transverse and torsional responses may be similar. Multi-direction effects are also important in evaluating square or rectangular columns, since they are weakest in the diagonal direction of attack. Therefore, it is important to investigate multi-directional effects with respect to the biaxial bending demands placed on these types of columns.
B-37
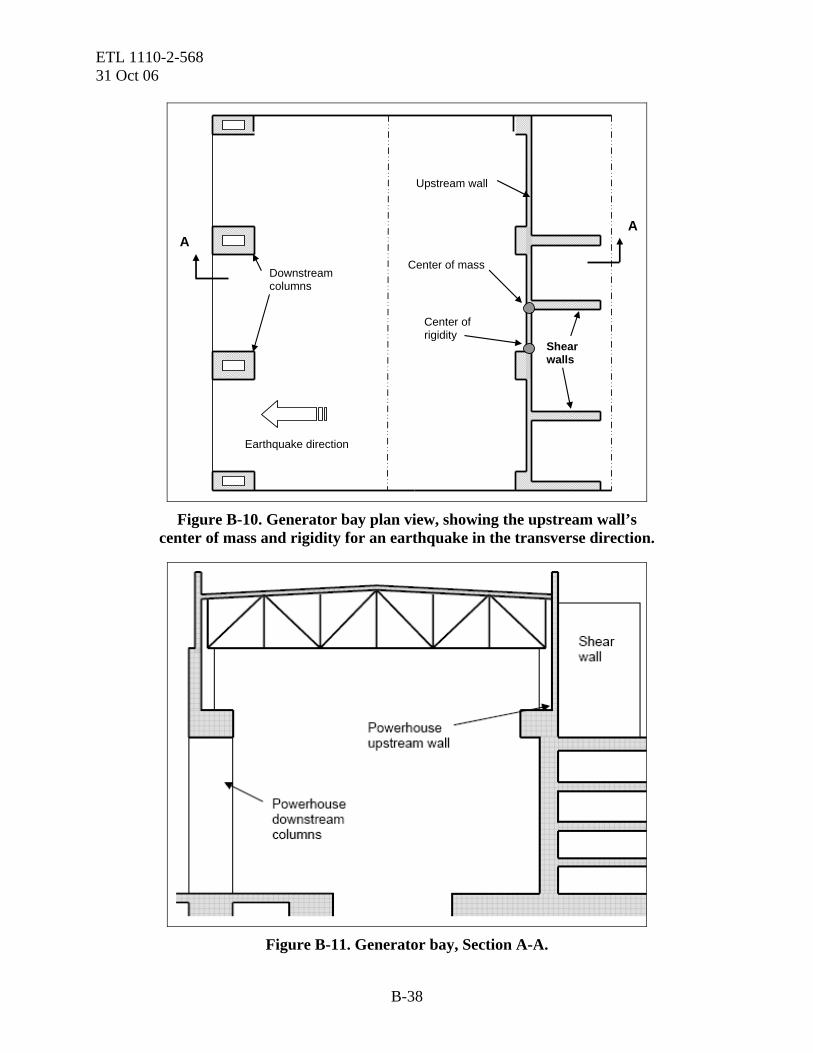
ETL 1110-2-568 31 Oct 06
Downstream columns
Center of mass
Center of rigidity
Shear walls
Upstream wall
A A
Earthquake direction
Figure B-10. Generator bay plan view, showing the upstream wall’s
center of mass and rigidity for an earthquake in the transverse direction.
Figure B-11. Generator bay, Section A-A.
B-38

ETL 1110-2-568 31 Oct 06
i. Demand-to-capacity ratio evaluations. (1) Demand-to-capacity ratio (DCR) evaluations are used to assess the performance of powerhouse superstructure components. Flexural response is considered a deformation-controlled action, and the moment demands must be modified to produce displacements in the linear elastic analytical model that are representative of an inelastic response. This is accomplished by multiplying the moment demands by the displacement modification factors C1 and C2, as illustrated in Figure B-1 and described in Section B-6. (2) Shear is considered a force-controlled action. The shear demands are those obtained directly from one of the specified performance-based analyses. The shear demand, however, need not exceed 150 percent of the shear corresponding to the nominal moment capacity (MN), or need not exceed:
1 5 NE
E
M VM. ( ) . (B-17)
(3) This assumes the member first yields in flexure and as such cannot attract additional shear force once the plastic moment capacity of the member is reached. The plastic moment capacity of the member is considered to be 150 percent of the nominal moment capacity due to strain hardening that occurs in the flexural reinforcing steel. (4) The seismic displacement demands are used to assess the performance of the free bearing support. The displacement capacity (δC) of the bearing support is based on the bearing details and how much lateral movement can take place before all support for the roof system (beams, trusses, etc.) is lost. The displacement demand (δE) is based on the displacements determined using the prescribed analytical model and the simplified analysis procedures described here for determining elastic displacement demand. The displacement demand used in the bearing support investigation shall be the sum of the displacements at the bearing level for both walls, assuming that the walls are moving outward. The displacement capacity of the free bearing support is satisfactory if: . (B-18) 1 2C E C C( )( )δ δ≥∑ (5) Displacement demands will be underestimated for Simple-LSP and LSP analyses where wall section properties are based on that of the lowermost wall section. Therefore, it is recommended for these types of analysis that as a minimum the displacement of each wall should be based on a drift equal to 0.010 times the height from the top of the substructure to the roof corbel. B-5. Force and Displacement Capacities. a. Introduction.
B-39
ETL 1110-2-568 31 Oct 06 (1) In conventional powerhouse wall systems, the compressive strains in the concrete are generally low, and earthquake demands are usually not sufficient to cause a shear failure. Bond deterioration under cyclic loading can only occur when the maximum compressive strain at the location of reinforcing bar splices exceeds 0.2 percent (0.002), the level of strain that initiates longitudinal micro cracking in the concrete adjacent to the splice. When compressive strains are below 0.2 percent (0.002, the chance for micro cracking and bond deterioration in regions adjacent to reinforcing steel splices is low [see Appendix G, Strom and Ebeling (2005)]. The 0.2-percent compressive strain limit is therefore used when evaluating displacement ductility capacity for IO performance. (2) When tensile strains in the longitudinal reinforcement are kept below 1 percent (0.010), it can be assumed that there will be minimal damage to the powerhouse superstructure (Hines, Dazio, and Seible 2006). The 1-percent tensile strain limit is therefore used when evaluating displacement ductility capacity for IO performance. (3) When compressive strains are below 0.4 percent, the chance for concrete spalling is low [see Appendix G, Strom and Ebeling (2005)]. Keeping concrete compressive strains below 0.4 percent will prevent the disastrous consequences of spalling, such as the loss of concrete cover, the loss of confinement reinforcement, and the buckling of reinforcing steel. Therefore, the 0.4-percent compressive strain limit is used when evaluating displacement ductility capacity for CP performance. (4) Fracturing of reinforcing steel is unique to lightly reinforced concrete members and can occur in powerhouse walls when strains in the reinforcing steel exceed 5 percent (0.050). The 5-percent tensile strain limit is therefore used when evaluating displacement ductility capacity for CP performance. This mode of failure is considered to be a brittle mode of failure. Therefore, it should be investigated for all lightly reinforced members (members where the nominal moment capacity is less than 1.2 times the cracking moment capacity) using a displacement ductility analysis where the displacement ductility capacity is compared to the displacement ductility demand on the member. (5) To meet performance requirements, all brittle modes of failure should be suppressed. Brittle modes of failure include shear (diagonal tension), sliding shear (shear-friction), and fracture of flexural reinforcing steel. Inelastic flexural response will limit shear demands. Therefore, it is only necessary to provide shear strength equal to the shear demand corresponding to that associated with the maximum feasible flexural strength. (6) It is desirable for the reinforcing steel used to resist flexural demands to have splice and anchorage lengths sufficient to develop the maximum bar strength including strain hardening effects. However, older powerhouse walls will not likely have development and splice lengths that comply with current code (ACI 318) requirements. In addition, powerhouses constructed before 1947 are unlikely to have the “high-bond” deformation patterns typical of modern reinforced concrete structures. Methods for evaluating wall systems with inadequate splice and development lengths are provided in Appendix D.
B-40
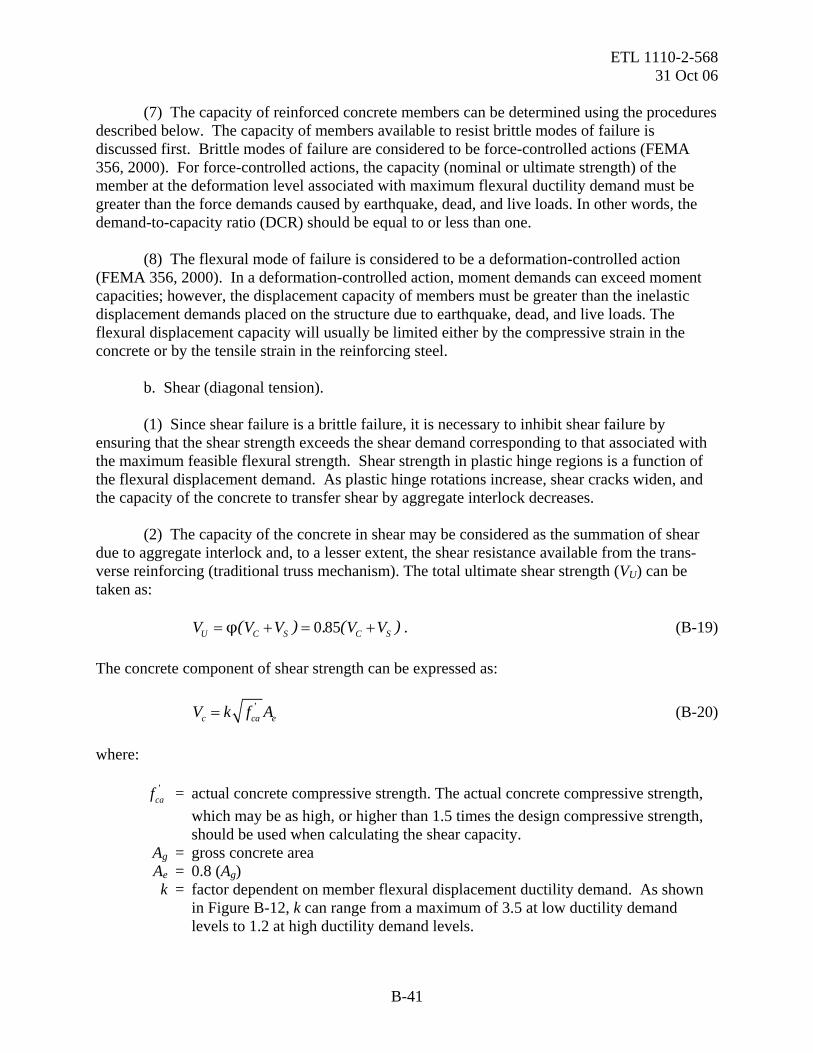
ETL 1110-2-568 31 Oct 06
S )
(7) The capacity of reinforced concrete members can be determined using the procedures described below. The capacity of members available to resist brittle modes of failure is discussed first. Brittle modes of failure are considered to be force-controlled actions (FEMA 356, 2000). For force-controlled actions, the capacity (nominal or ultimate strength) of the member at the deformation level associated with maximum flexural ductility demand must be greater than the force demands caused by earthquake, dead, and live loads. In other words, the demand-to-capacity ratio (DCR) should be equal to or less than one. (8) The flexural mode of failure is considered to be a deformation-controlled action (FEMA 356, 2000). In a deformation-controlled action, moment demands can exceed moment capacities; however, the displacement capacity of members must be greater than the inelastic displacement demands placed on the structure due to earthquake, dead, and live loads. The flexural displacement capacity will usually be limited either by the compressive strain in the concrete or by the tensile strain in the reinforcing steel. b. Shear (diagonal tension). (1) Since shear failure is a brittle failure, it is necessary to inhibit shear failure by ensuring that the shear strength exceeds the shear demand corresponding to that associated with the maximum feasible flexural strength. Shear strength in plastic hinge regions is a function of the flexural displacement demand. As plastic hinge rotations increase, shear cracks widen, and the capacity of the concrete to transfer shear by aggregate interlock decreases. (2) The capacity of the concrete in shear may be considered as the summation of shear due to aggregate interlock and, to a lesser extent, the shear resistance available from the trans-verse reinforcing (traditional truss mechanism). The total ultimate shear strength (VU) can be taken as: . (B-19) 0 85U C S CV V V V V( ) . (φ= + = + The concrete component of shear strength can be expressed as: c caV k f A'= e (B-20) where: caf ' = actual concrete compressive strength. The actual concrete compressive strength,
which may be as high, or higher than 1.5 times the design compressive strength, should be used when calculating the shear capacity.
Ag = gross concrete area Ae = 0.8 (Ag) k = factor dependent on member flexural displacement ductility demand. As shown
in Figure B-12, k can range from a maximum of 3.5 at low ductility demand levels to 1.2 at high ductility demand levels.
B-41
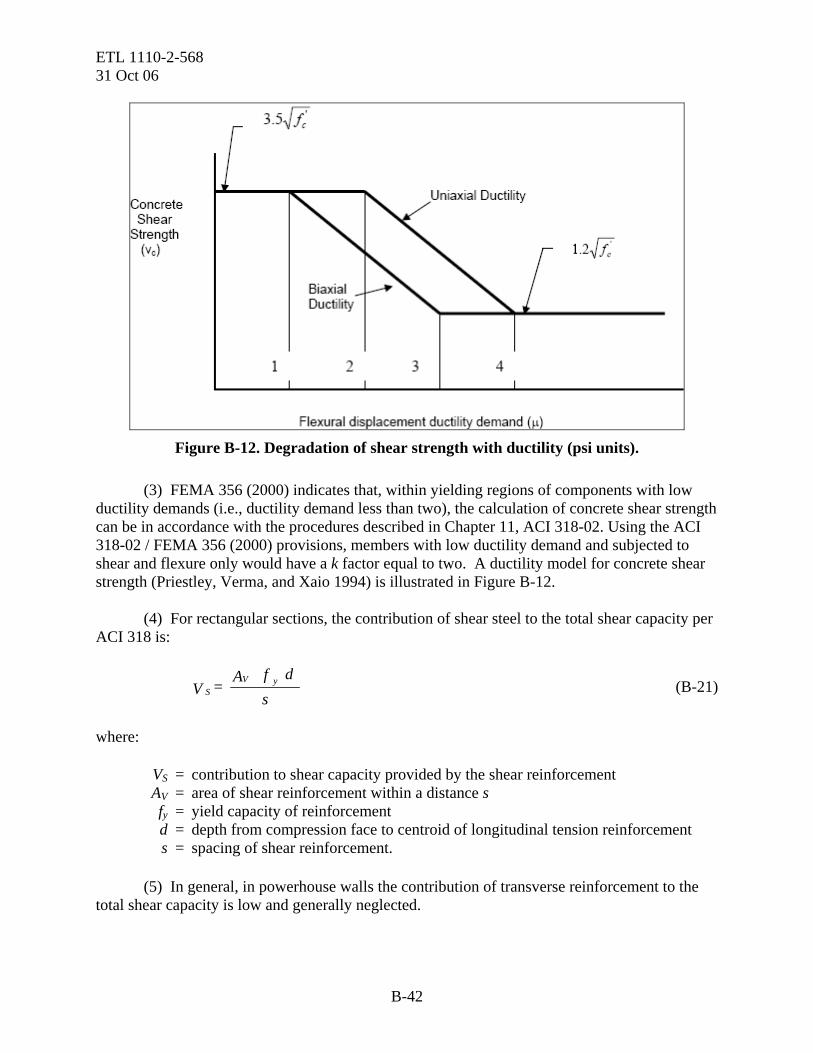
ETL 1110-2-568 31 Oct 06
Figure B-12. Degradation of shear strength with ductility (psi units).
(3) FEMA 356 (2000) indicates that, within yielding regions of components with low ductility demands (i.e., ductility demand less than two), the calculation of concrete shear strength can be in accordance with the procedures described in Chapter 11, ACI 318-02. Using the ACI 318-02 / FEMA 356 (2000) provisions, members with low ductility demand and subjected to shear and flexure only would have a k factor equal to two. A ductility model for concrete shear strength (Priestley, Verma, and Xaio 1994) is illustrated in Figure B-12. (4) For rectangular sections, the contribution of shear steel to the total shear capacity per ACI 318 is:
V yS
d fA = V s (B-21)
where: VS = contribution to shear capacity provided by the shear reinforcement AV = area of shear reinforcement within a distance s fy = yield capacity of reinforcement d = depth from compression face to centroid of longitudinal tension reinforcement s = spacing of shear reinforcement. (5) In general, in powerhouse walls the contribution of transverse reinforcement to the total shear capacity is low and generally neglected.
B-42
ETL 1110-2-568 31 Oct 06
(6) To meet damage control performance requirements for BSE-2 and BSE-1A loadings, the capacity of the reinforced concrete structures in shear shall be equal to or greater than the lesser of:
• The full elastic demand placed on the member by the design earthquake, or
• The shear corresponding to 1.5 times the shear associated with the nominal flexural strength.
c. Sliding shear. (1) In plastic hinge regions due to cyclic loading, the diagonal tension cracks can intersect, and a sliding shear failure rather than a diagonal tension failure results. Sliding shear is often a cause of strength degradation and therefore should be investigated as part of a seismic analysis. The sliding shear capacity, or shear friction shear capacity (VSF), can be determined by the following expression: VSF = μSF (P + 0.25 As fy) (B-22) where: μSF = sliding shear coefficient of friction, per ACI 318 P = axial load on section As = area of the longitudinal reinforcing steel across the potential failure plane fy = yield strength of the reinforcing steel. (2) This capacity is less than that commonly used in a shear-friction analysis because a safety factor of four has been applied to the steel contribution. The value expressed by Equation B-22 is based on cyclic load testing performed by Wood (1989). d. Reinforcing steel anchorage. The strength of deformed, straight, discontinuous bars embedded in concrete is defined in Appendix D. e. Reinforcing steel splices and hooked bars. (1) Development of reinforcing steel splices and hooked bars should be calculated using methods described in Appendix D. (2) For existing structures, the actual compressive strength rather than the design com-pressive strength should be used when evaluating splice lengths and anchorages. Deterioration of bond and splice strengths of reinforcing bars is one of the greatest problems in the design of earthquake-resistant reinforced concrete structures. Large concrete covers and transverse reinforcement provide the best protection against splice strength degradation. The ACI 318 development length equations allow these factors to be considered. Reinforcing steel in older powerhouse structures can cause some special problems with respect to development and
B-43
ETL 1110-2-568 31 Oct 06 splicing. Methods for evaluating the performance of reinforcement in older powerhouse structures are also presented in Appendix D. f. Fracture of reinforcing steel. Fracture of reinforcing steel can be prevented if enough flexural reinforcing steel is provided to produce a nominal moment strength equal to, or greater than, 1.2 times the cracking moment capacity of the section. Existing powerhouse wall systems will not always meet these requirements. Existing structures can be considered to meet earth-quake performance requirements if it can be demonstrated that displacement ductility demands are low enough to keep reinforcing steel strains below specified performance limits (See Section B-6). This requires a displacement ductility evaluation. The displacement ductility evaluation process is described below. g. Flexural strength. The flexural strength is that expected at the deformation level under consideration. Generally this is the nominal moment capacity, which is based on the yield strength of the steel. However, under conditions were development lengths or splice lengths are incapable of developing the yield strength of the steel, a lower stress level in the steel must be used to assess nominal moment capacity (see Appendix D). The nominal moment strength of reinforced concrete members can be determined in accordance with ACI 318. The nominal strength is the capacity to be used in determining demand-to-capacity ratios (DCR) for the Simple LSP, LSP, LDP, and Special Analysis methods. When the DCR exceeds acceptance requirements (see Table B-3), a displacement ductility analysis should be performed. The dis-placement ductility analysis is part of the Special Analysis. Methods for determining displace-ment ductility capacity for powerhouse cantilever wall, column, and pilaster sections are described below. h. Displacement ductility capacity. Displacement ductility analyses are required to determine if member flexural displacement ductility capacities are greater than flexural displace-ment ductility demands. Flexural displacement ductility capacity is related to curvature capacity, plastic hinge length (length of zone where yielding occurs), and member length. (1) Curvature capacity. (a) The curvature capacity will depend on the maximum amount of strain that can be placed on the concrete and reinforcing steel. To prevent fracturing of the reinforcing steel, the steel strain should be limited to 5 percent. This is the strain limit for Collapse Prevention (CP). Lower strain limits recommended for the IO performance are provided in Section B-6 and described below. (b) For CP performance, the plastic hinge length assumed for the calculation of rotation, displacement, and displacement ductility is based ultimate strain conditions (i.e., 0.004 for con-crete and 0.050 for reinforcement). Since little is known about the spread of plasticity at lower strain levels, rotation, displacement, and displacement ductility will be calculated for maximum strain conditions representing IO performance using the minimum plastic hinge length specified by Equation B-23 and the strain limit conditions in Table B-4.
B-44
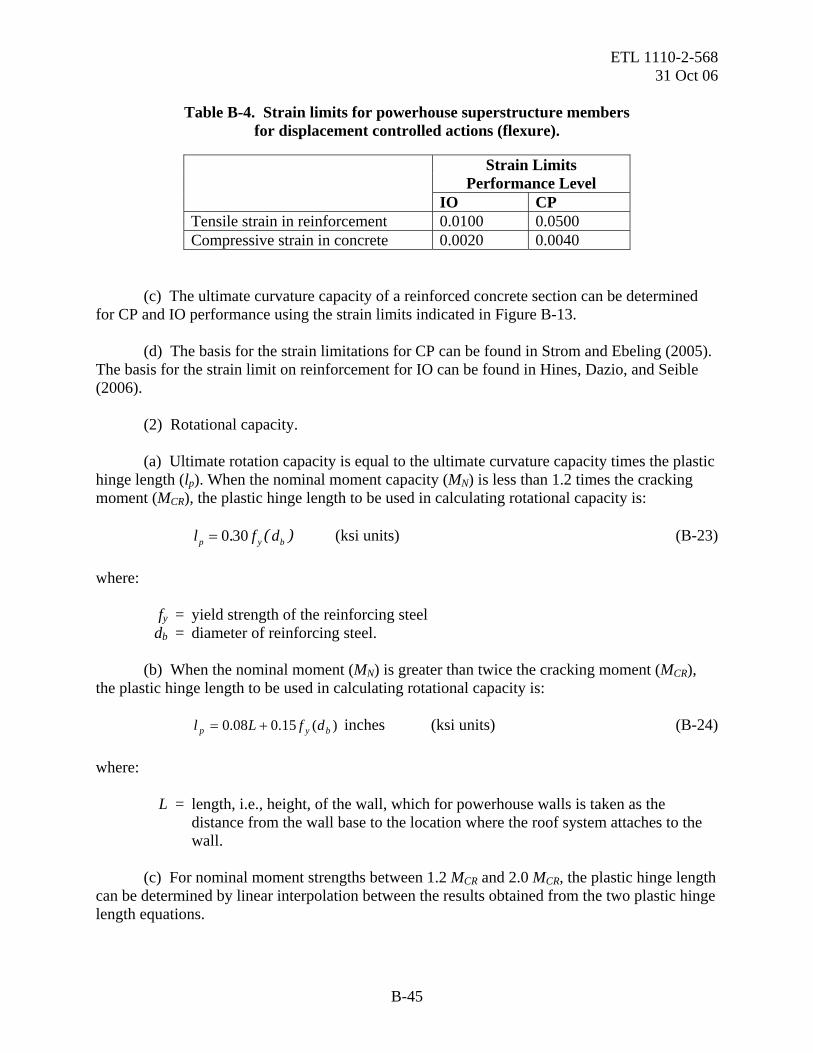
ETL 1110-2-568 31 Oct 06
Table B-4. Strain limits for powerhouse superstructure members
for displacement controlled actions (flexure).
Strain Limits Performance Level
IO CP Tensile strain in reinforcement 0.0100 0.0500 Compressive strain in concrete 0.0020 0.0040
(c) The ultimate curvature capacity of a reinforced concrete section can be determined for CP and IO performance using the strain limits indicated in Figure B-13. (d) The basis for the strain limitations for CP can be found in Strom and Ebeling (2005). The basis for the strain limit on reinforcement for IO can be found in Hines, Dazio, and Seible (2006). (2) Rotational capacity. (a) Ultimate rotation capacity is equal to the ultimate curvature capacity times the plastic hinge length (lp). When the nominal moment capacity (MN) is less than 1.2 times the cracking moment (MCR), the plastic hinge length to be used in calculating rotational capacity is: (ksi units) (B-23) 0 30p yl f. (= bd ) where: fy = yield strength of the reinforcing steel db = diameter of reinforcing steel. (b) When the nominal moment (MN) is greater than twice the cracking moment (MCR), the plastic hinge length to be used in calculating rotational capacity is: inches (ksi units) (B-24) )(15.008.0 byp dfLl +=
where: L = length, i.e., height, of the wall, which for powerhouse walls is taken as the
distance from the wall base to the location where the roof system attaches to the wall.
(c) For nominal moment strengths between 1.2 MCR and 2.0 MCR, the plastic hinge length can be determined by linear interpolation between the results obtained from the two plastic hinge length equations.
B-45
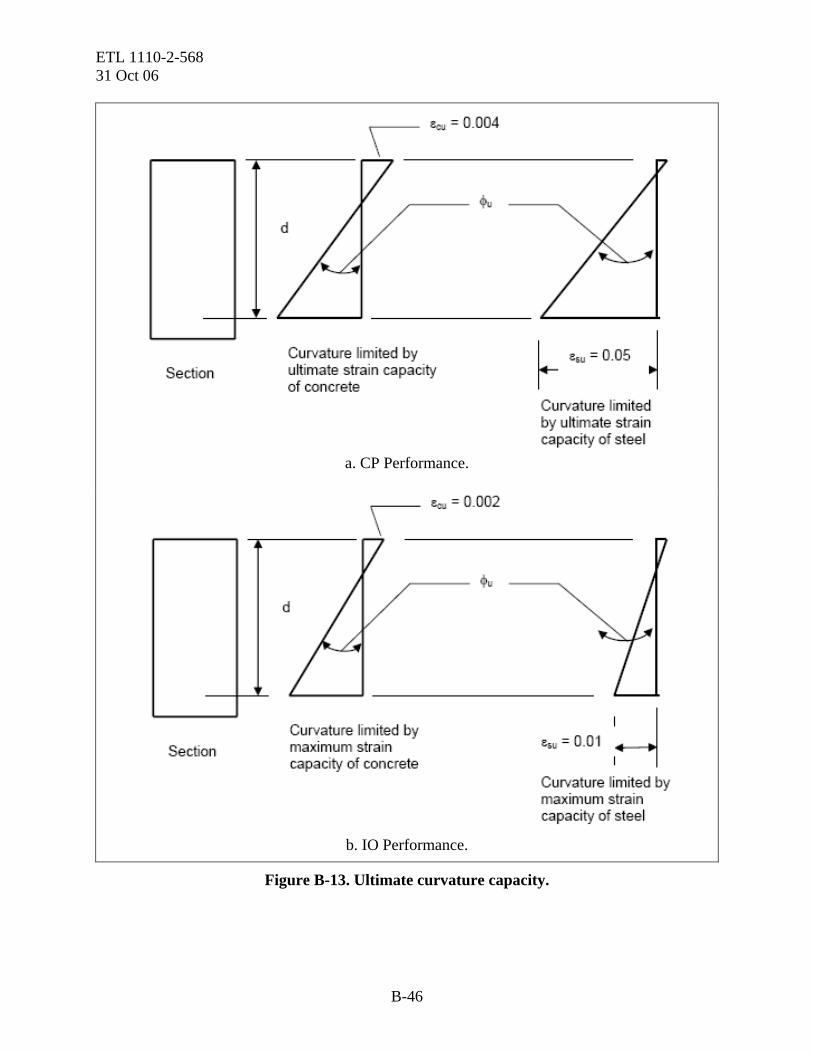
ETL 1110-2-568 31 Oct 06
a. CP Performance.
b. IO Performance.
Figure B-13. Ultimate curvature capacity.
B-46
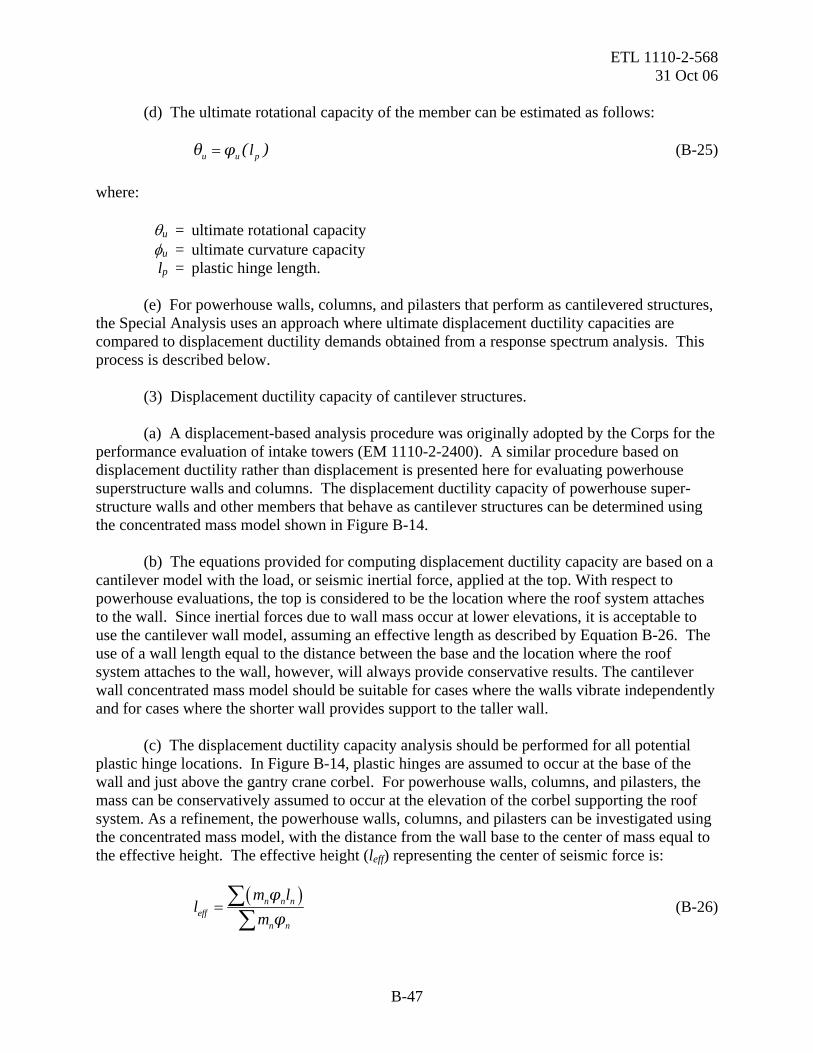
ETL 1110-2-568 31 Oct 06
(d) The ultimate rotational capacity of the member can be estimated as follows: (B-25) u u plθ φ ( )= where: θu = ultimate rotational capacity φu = ultimate curvature capacity lp = plastic hinge length. (e) For powerhouse walls, columns, and pilasters that perform as cantilevered structures, the Special Analysis uses an approach where ultimate displacement ductility capacities are compared to displacement ductility demands obtained from a response spectrum analysis. This process is described below. (3) Displacement ductility capacity of cantilever structures. (a) A displacement-based analysis procedure was originally adopted by the Corps for the performance evaluation of intake towers (EM 1110-2-2400). A similar procedure based on displacement ductility rather than displacement is presented here for evaluating powerhouse superstructure walls and columns. The displacement ductility capacity of powerhouse super-structure walls and other members that behave as cantilever structures can be determined using the concentrated mass model shown in Figure B-14. (b) The equations provided for computing displacement ductility capacity are based on a cantilever model with the load, or seismic inertial force, applied at the top. With respect to powerhouse evaluations, the top is considered to be the location where the roof system attaches to the wall. Since inertial forces due to wall mass occur at lower elevations, it is acceptable to use the cantilever wall model, assuming an effective length as described by Equation B-26. The use of a wall length equal to the distance between the base and the location where the roof system attaches to the wall, however, will always provide conservative results. The cantilever wall concentrated mass model should be suitable for cases where the walls vibrate independently and for cases where the shorter wall provides support to the taller wall. (c) The displacement ductility capacity analysis should be performed for all potential plastic hinge locations. In Figure B-14, plastic hinges are assumed to occur at the base of the wall and just above the gantry crane corbel. For powerhouse walls, columns, and pilasters, the mass can be conservatively assumed to occur at the elevation of the corbel supporting the roof system. As a refinement, the powerhouse walls, columns, and pilasters can be investigated using the concentrated mass model, with the distance from the wall base to the center of mass equal to the effective height. The effective height (leff) representing the center of seismic force is:
( )n n n
effn n
m ll
mφ
φ= ∑∑
(B-26)
B-47

ETL 1110-2-568 31 Oct 06
Figure B-14. Plastic hinge locations, effective length, and displacement
ductility.
where: mn = mass at level (n) of a multiple lumped mass system. ln = height from base to mass at level (n). φ = modal value at mass level (n). (d) The displacement ductility capacity (μδ) is equal to the ultimate displacement capacity (δu) divided by the yield displacement (δY). For the concentrated mass model (Figure B-14), the ultimate displacement capacity (δu) is equal to:
2
3 2y
U U y p
l ll l
φδ (φ φ )
⎛ ⎞= + − −⎜
⎝ ⎠
p⎟ . (B-27)
B-48

ETL 1110-2-568 31 Oct 06
(e) The yield displacement (δY) is equal to:
2
3y
Y
lφδ = . (B-28)
(f) Dividing the ultimate displacement capacity (δu) by the yield displacement (δY) and substituting the effective length (leff) for the length (l) results in the following equation for ultimate displacement ductility capacity (μδ):
1 3 1 1 0 5pu
y eff eff
l ll l
φμ .
φδ
⎛ ⎞ ⎛= + − −⎜ ⎟ ⎜⎜ ⎟ ⎜
⎝ ⎠ ⎝
p ⎞⎟⎟⎠
(B-29)
where: φy = curvature at first yield of the reinforcing steel leff = effective length, i.e., height, of the wall, which for powerhouse walls can be
conservatively taken as the distance from the wall base to the location where the roof system attaches to the wall, or can be more exactly determined using Equation B-26.
(4) Estimating displacement ductility. In practice, a moment curvature analysis should be performed to determine curvature capacity. This can be accomplished using the Corps CASE program M-Phi (X2002). Strain limits for the steel and concrete corresponding to collapse prevention (CP) performance or immediate occupancy (IO) performance are established for the M-Phi analysis. The program considers the effects axial load has on moment curvature capacity and uses the steel and concrete strain limitations input by the user. After the curvature capacity has been established by M-Phi analysis, rotational capacity, displacement capacity, and displacement ductility capacity can be determined using Equations A-23 through A-29. Because powerhouse wall, column, and pilaster systems are generally non-conforming systems (see FEMA 356, 2000), a limit of four is placed on displacement ductility capacity. Non-conforming systems are those systems where lateral confinement reinforcement is not in compliance with current code requirements. The displacement ductility capacity evaluation assumes that the member is controlled by flexure. i. Loss of support for roof system and overhead crane. (1) The powerhouse walls may undergo large seismic displacements during a design earthquake event. The seismic evaluation of powerhouse superstructures must assure that failures due to unseating will not occur in the roof system and overhead crane. The upstream and downstream walls may move out of phase. With both walls moving outwards, displacement demands at roof bearing locations and overhead crane corbels may be larger than seat widths. The displacement demand for the unseating evaluation should be based on the sum of the absolute displacements occurring at each bearing location.
B-49
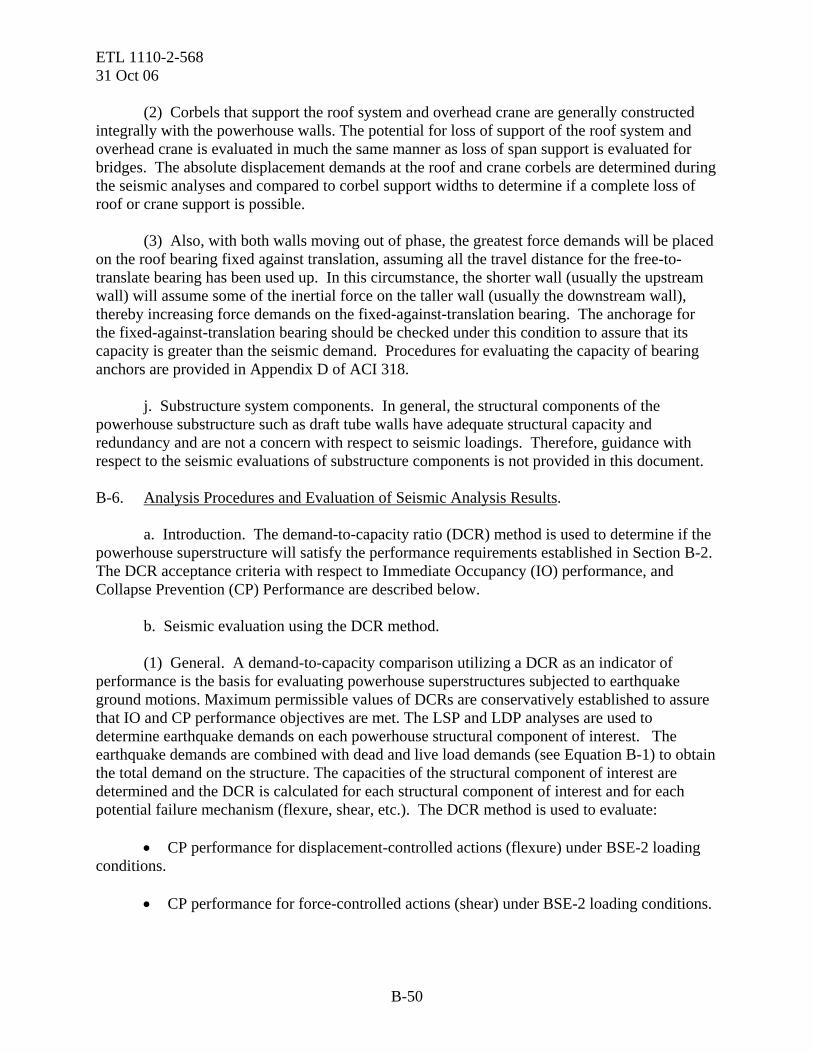
ETL 1110-2-568 31 Oct 06 (2) Corbels that support the roof system and overhead crane are generally constructed integrally with the powerhouse walls. The potential for loss of support of the roof system and overhead crane is evaluated in much the same manner as loss of span support is evaluated for bridges. The absolute displacement demands at the roof and crane corbels are determined during the seismic analyses and compared to corbel support widths to determine if a complete loss of roof or crane support is possible. (3) Also, with both walls moving out of phase, the greatest force demands will be placed on the roof bearing fixed against translation, assuming all the travel distance for the free-to-translate bearing has been used up. In this circumstance, the shorter wall (usually the upstream wall) will assume some of the inertial force on the taller wall (usually the downstream wall), thereby increasing force demands on the fixed-against-translation bearing. The anchorage for the fixed-against-translation bearing should be checked under this condition to assure that its capacity is greater than the seismic demand. Procedures for evaluating the capacity of bearing anchors are provided in Appendix D of ACI 318. j. Substructure system components. In general, the structural components of the powerhouse substructure such as draft tube walls have adequate structural capacity and redundancy and are not a concern with respect to seismic loadings. Therefore, guidance with respect to the seismic evaluations of substructure components is not provided in this document. B-6. Analysis Procedures and Evaluation of Seismic Analysis Results. a. Introduction. The demand-to-capacity ratio (DCR) method is used to determine if the powerhouse superstructure will satisfy the performance requirements established in Section B-2. The DCR acceptance criteria with respect to Immediate Occupancy (IO) performance, and Collapse Prevention (CP) Performance are described below. b. Seismic evaluation using the DCR method. (1) General. A demand-to-capacity comparison utilizing a DCR as an indicator of performance is the basis for evaluating powerhouse superstructures subjected to earthquake ground motions. Maximum permissible values of DCRs are conservatively established to assure that IO and CP performance objectives are met. The LSP and LDP analyses are used to determine earthquake demands on each powerhouse structural component of interest. The earthquake demands are combined with dead and live load demands (see Equation B-1) to obtain the total demand on the structure. The capacities of the structural component of interest are determined and the DCR is calculated for each structural component of interest and for each potential failure mechanism (flexure, shear, etc.). The DCR method is used to evaluate:
• CP performance for displacement-controlled actions (flexure) under BSE-2 loading conditions.
• CP performance for force-controlled actions (shear) under BSE-2 loading conditions.
B-50
ETL 1110-2-568 31 Oct 06
• IO performance for deformation-controlled actions (flexure) under BSE-1A loading
conditions.
• IO performance for force-controlled actions (shear) under BSE-1A loading conditions. (2) Flexural performance. (a) In the LSP and LDP analyses, an analytical model of the structure is evaluated using response spectrum analysis techniques. Using the first mode for LSP analyses and the modes described in Figure B-4 for LDP analyses, the maximum moment demands on various power-house superstructure members are obtained. These are the moment demands the structure would experience assuming it remained elastic during the design earthquake event. Often the moment demands will exceed the flexural strength (nominal moment capacity). The moment DCR is designated the flexural strength ratio (R), which equals the moment demand divided by the nominal moment capacity, or ME / MN. The flexural strength ratio is used to estimate the dis-placement ductility demand and determine a flexural displacement DCR. Unless a displacement ductility evaluation is performed, acceptable limits for the flexural DCR ratio is designated by prescriptive DCR acceptance criteria contained in Table B-3. Acceptance criteria for deformation controlled actions are expressed by Equation B-30. C1 × C2 × ME / MN ≤ DCR acceptance criteria. (B-30) (b) With respect to deformation-controlled actions, the linear elastic moments obtained from the LSP or LDP analyses may not be sufficient to displace the structure to the levels expected in response to the design earthquake ground motions. Therefore, as indicated in Equation B-30, when the earthquake moment demands exceed the nominal moment capacity, the moment demands from a first mode LSP or LDP analysis must be multiplied by C1 and C2 factors, where: C1 = FEMA 440 (2005) modification factor to relate expected maximum inelastic
displacements to displacements calculated for the linear elastic response. C2 = FEMA 440 (2005) modification factor to relate increases in inelastic
displacements due to cyclic degradation. (c) The DCR factors of Table B-3 set maximum limits for DCR to assure that the performance requirements are satisfied. (d) These prescriptive DCR values are similar in nature to the m factors in FEMA 356 (2000) that are used to define expected ductility limits (refer to Chapter 6 of FEMA 356, 2000). (e) Use of Table B-3. The DCR for the flexural response in a reinforced concrete powerhouse wall in order to meet immediate occupancy (IO) requirements under BSE-1A loading conditions must be less than or equal to 1.5. This means that the flexural strength ratio (ME / MN) when multiplied by C1 × C2 must be equal to or less than 1.5, or:
B-51

ETL 1110-2-568 31 Oct 06 C1 × C2 × ME / MN ≤ 1.5 (B-31) where: ME / MN = flexural strength ratio (R) ME = moment demand at the critical location assuming structure remains elastic
(demand from first mode LSP or LDP analysis) MN = nominal moment capacity of the wall at the critical location C1 = modification factor to relate maximum inelastic displacements to displacements
calculated for linear elastic response
C1 = 2
11130R
T−
+
C2 = modification factor to relate increases in inelastic displacements due to cyclic degradation.
C2 = 21 11
800R
T−⎛ ⎞⎛+ ⎜ ⎟⎜
⎝ ⎠⎝⎞⎟⎠
T = first mode period (seconds). (3) Shear performance. Shear failures are to be suppressed because they are brittle failures that involve rapid strength deterioration. Therefore, under BSE-1 and BSE-2 loadings, the shear demand should not exceed the shear capacity of the structure, or, in other words, the DCR should be less than or equal to one. The acceptance criteria for force-controlled actions (shear) is as indicated by Equation B-32: DCR = VE / VN ≤ 1.0 (B-32) where: VE = shear demand due to earthquake loading ≤ 1.5 that corresponding to the nominal
moment capacity of the member VN = nominal shear capacity of member. c. Displacement ductility evaluation. (1) In a displacement ductility evaluation, the displacement ductility capacity of a powerhouse superstructure column, pilaster, or wall is determined as described previously. The displacement ductility capacity is a function of the curvature ductility, which is equal to the ultimate curvature capacity divided by the yield curvature, φu / φy. The yield curvature, φy, is the curvature that causes first tensile yielding in the flexural reinforcement or that causes a strain in the flexural reinforcing steel equal to fy / Es, where fy is the yield strength of the reinforcing steel and Es is the modulus of elasticity of the reinforcing steel. (2) The ultimate curvature capacity, φu, is the curvature that places either the flexural reinforcing steel at its tensile strain limit or the concrete at its compressive strain limit. The strain limits on the steel and concrete desired for Immediate Occupancy (IO) or Collapse
B-52

ETL 1110-2-568 31 Oct 06
Prevention (CP) are described in Table B-4. A compressive strain capacity for the concrete was established at 0.0020 for IO performance. The 0.0020 compressive strain limit was established for IO performance to assure that bond deterioration would not develop at rebar splice locations. A tensile strain capacity for the steel was established at 0.050 for CP performance to assure that the rebar would not fracture when subject to cyclic loads. (3) However, as stated earlier, little is known about the spread of plasticity at lower strain levels (i.e., at the IO performance level). Therefore, rotation, displacement, and displacement ductility capacity will be calculated for strain conditions of Table B-4, but for IO performance, the minimum plastic hinge length of Equation B-23 will be used to determine rotation, displacement, and displacement ductility capacity. (4) Displacement ductility demands are estimated based on an LSP, LDP, or Special Analysis. Since all inelastic action will be due to the flexural response, the elastic demand moments (ME) and the nominal moment capacity of the section (MN) are used to determine the displacement ductility demand (μE) on the structure. The displacement ductility demand can be estimated as equal to the displacement demand divided by the displacement at yield, as expressed by Equation B-28. (5) Since it is a linear analysis where displacements are proportional to forces (see Figure B-1):
μE = C1 × C2 × ME / MN. (B-33) (6) The displacement ductility demand to meet performance requirements must be less than or equal to the displacement ductility capacity as determined using the procedures described above. The displacement ductility capacity, however, should not exceed four for CP perfor-mance or two for IO performance. B-7. Reporting Findings from Field Inspection and Performance-Base Analyses. a. General. A final report is needed to indicate the results of the field inspection and performance-based analyses. It is also needed to indicate if mitigation is required to satisfy the performance objectives. Specific information with respect to reporting findings is provided below. b. Field inspection reporting. This section provides guidelines for collecting and reporting field data that are important to the seismic evaluation of powerhouse superstructures. A field data collection checklist (Figure B-15) and a true / false checklist (Figure B-16) are to be completed in the field for use in the evaluation process. (1) Field data collection trip. The field data collection trip will be used to collect all the data necessary to successfully complete the seismic evaluation as described in this document. As a minimum, sufficient structural system load path data will be collected to completely determine elements and connections, or lack thereof, of the lateral force resisting systems.
B-53
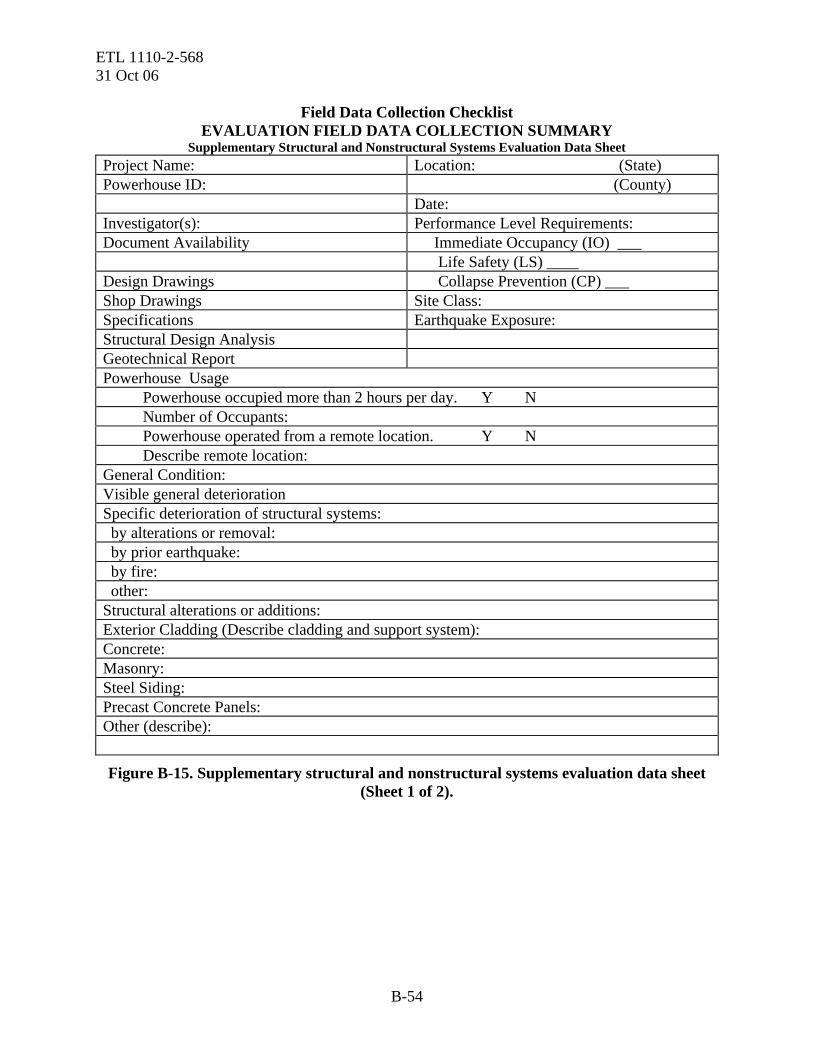
ETL 1110-2-568 31 Oct 06
Field Data Collection Checklist EVALUATION FIELD DATA COLLECTION SUMMARY
Supplementary Structural and Nonstructural Systems Evaluation Data Sheet Project Name: Location: (State) Powerhouse ID: (County) Date: Investigator(s): Performance Level Requirements: Document Availability Immediate Occupancy (IO) ___ Life Safety (LS) ____ Design Drawings Collapse Prevention (CP) ___ Shop Drawings Site Class: Specifications Earthquake Exposure: Structural Design Analysis Geotechnical Report Powerhouse Usage Powerhouse occupied more than 2 hours per day. Y N Number of Occupants: Powerhouse operated from a remote location. Y N Describe remote location: General Condition: Visible general deterioration Specific deterioration of structural systems: by alterations or removal: by prior earthquake: by fire: other: Structural alterations or additions: Exterior Cladding (Describe cladding and support system): Concrete: Masonry: Steel Siding: Precast Concrete Panels: Other (describe):
Figure B-15. Supplementary structural and nonstructural systems evaluation data sheet (Sheet 1 of 2).
B-54

ETL 1110-2-568 31 Oct 06
EVALUATION FIELD DATA COLLECTION SUMMARY
Supplementary Structural and Nonstructural Systems Evaluation Data Sheet Project Name: Location: (State) Powerhouse ID: (County) Performance Level: IO __ LS ___ CP __ Investigator(s): Date: Adequacy of Roof to Wall Connections: Adequacy of Bridge Crane Support System: Deformation Incompatibility: Nonstructural Hazards (describe): Structural Load Path (Describe): Consequences of Failure: Redundancy of Usage: Loss of Equipment Critical to Power Generation Loss of Equipment Critical to On-site Emergency Response: Potential High Loss of Life (explain):
Figure B-15. Supplementary structural and nonstructural systems evaluation data sheet (Sheet 2 of 2).
B-55

ETL 1110-2-568 31 Oct 06
EVALUATION STATEMENTS FOR POWERHOUSE SUPERSTRUCTURES LATERAL FORCE RESISTING SYSTEM
T F LOAD PATH: The structure contains a complete load path for seismic force
effects from any horizontal direction that serves to transfer the inertial forces from the mass to the foundation (NOTE: Write a brief description of this linkage for each principal direction.)
T F REDUNDANCY: The structure will remain laterally stable after the failure of
any single element. T F GEOMETRY: There are no significant geometrical irregularities; there are no
setbacks (i.e., no changes in horizontal dimension of the lateral-force resisting system of more than 30 percent from one powerhouse bay relative to the adjacent powerhouse bays.
T F MASS: There are no significant mass irregularities; there is no change of
effective mass of more than 50 percent from one powerhouse bay relative to the adjacent powerhouse bays.
T F VERTICAL IRREGULARITIES: Walls that comprise the lateral force resisting
system of the powerhouse superstructure are continuous from the roof to the substructure.
T F DETERIORATION OF CONCRETE: There is no visible deterioration of
concrete or reinforcing steel in the walls that comprise the lateral force resisting system of the powerhouse superstructure.
T F CRACKED SECTION MOMENT CAPACITY: The cracked section moment
capacity is greater than 1.2 times the cracking moment. (This is generally true if the percentage of reinforcement exceeds 0.5 percent)
Figure B-16. Evaluation statements for powerhouse lateral force resisting systems.
(2) Field data collection checklist. (a) Purpose. The purpose of the field data collection checklist is to help in recording basic information with respect to the superstructure lateral load resisting system. In addition to the data listed on the checklist, the evaluator should append any supplementary sketches and photographs that may be useful in the performance-based evaluation. (b) Performance level. Two performance levels are considered when evaluating the response of powerhouses to earthquake ground motions. These are immediate occupancy (IO) performance and collapse prevention (CP) performance. Descriptions and acceptance criteria for each performance level are provided in Section B-2.
B-56

ETL 1110-2-568 31 Oct 06
(c) Identification data and location. The state and county in which the powerhouse is located must be given as a minimum, with latitude and longitude, or other positioning, as available. (d) Document availability. The availability of the listed documents should be noted by a check mark. All information needed for the preliminary evaluation and special analyses that is not available from the drawings must be collected on the field data collection trip. Often it is advisable to obtain copies of the latest powerhouse superstructure drawings (those that are needed for the evaluation) from the project office during the field inspection trip. (e) Site and soil parameters. The site class type and site coefficients can be determined using information provided in FEMA 356 (2000). If possible, site class type should be deter-mined based on borehole information and the project geotechnical report. (f) Earthquake exposure. The most severe ground motion that the building has been subjected to, if available, should be recorded here. The year and the Modified Mercalli Intensity (MMI) or Richter magnitude and distance should be noted, e.g. MMI VI (1984), or M5 @ 25 miles (1981). If this information is not available, it should be so indicated on the data sheet. (g) Powerhouse usage. Information on powerhouse usage is helpful. The evaluator should indicate whether or not the powerhouse is occupied more than 2 hours per day, the approximate number of occupants in the powerhouse at any one time, and whether or not the powerhouse is operated from a remote location. Information on the amount of power produced and the impact a “loss of power generation” would have on on-site emergency response systems and on nearby communities should be stated. If the powerhouse is operated remotely, the type of remote operation should be described and the remote location indicated. (h) General condition. This section of the data sheet requires brief statements as to the general condition of the powerhouse superstructure. The investigator should inspect all the walls of the powerhouse superstructure, noting any evidence of cracking or spalling that could impair strength. The bridge crane corbel and walls above the bridge crane should be inspected, and, if access is available, the condition of the roof beam supports should be inspected. Knowledgeable project personnel should be queried as to known damage or deterioration. All damage should be noted on the data sheet. (i) Structural alterations or additions. All additions and alterations to the powerhouse superstructure should be noted. The evaluator should indicate whether or not the additions and alterations have changed the original lateral force resisting systems and whether or not the lateral load-carrying capacity has been compromised due to the removal or damage of structural elements. (j) Adequacy of roof-to-wall connections. The powerhouse roof systems are most likely to be supported by wall corbels and may be free to move relative to their supporting walls during an earthquake. Conditions of this type should be noted and the consequences of relative move-ment between structural components described. Special attention should be paid to the roof connection details. Roof connection details are considered satisfactory if the roof system is
B-57

ETL 1110-2-568 31 Oct 06 adequately anchored to the powerhouse walls, the anchors have sufficient capacity to resist seismic forces and displacements, and there is sufficient support width for free ends to prevent hammering between the roof system and wall and to prevent a loss of support that could lead to collapse of the roof system during an earthquake. (k) Adequacy of bridge crane support system. The capability of the bridge crane to sustain the seismic displacements that will occur in the powerhouse walls, and the bridge crane supporting corbel, are of major concern. Information on the bridge crane wall support corbel, the bridge crane wheel and rail configuration, the support width provided with respect to how far the crane wheels can displace laterally before support is lost, and information on how far the crane wheels can displace laterally before the bridge crane collides with the powerhouse wall should be indicated. Sketches and photographs showing the bridge crane and corbel are recommended as attachments to the field data collection sheet. (l) Structural load path. This item requires a brief description of the structural load path and the type of connections between the horizontal and vertical resisting elements. Any apparent lack or deficiency in connectivity should be identified. Detailed data regarding connection of structural components will be require for the LSP, LSP, and Special Analyses. (m) Consequences of failure. The information for this portion of the data sheet must be obtained from knowledgeable personnel. A positive statement regarding “Redundancy of Usage” indicates that in the event of severe damage or loss of a wall support system, the func-tions for generation of power and for response to on-site emergency conditions could be per-formed in another building or facility without significant impact. If power needed for on-site emergency response is obtainable from sources outside the powerhouse, or if power supplies to nearby communities are available from other sources, the details on the outside power sources should be indicated. (n) Sketches and photographs. Sketches needed to better describe important aspects of the powerhouse superstructure lateral force system and connections should be made during the field inspection trip and attached to the field data collection sheet. Photographs showing important features of the powerhouse superstructure, the lateral force resisting elements, and connections should be taken on the field inspection trip and copies attached to the field data collection sheet. (3) True/false evaluation statements. The true/false evaluation statements (Figure B-16) are to be completed in the field for use in the evaluation process. The evaluator should append any sketches, photographs, and calculations that may necessary to support the true/false checklist information. c. Final report. (1) The final report should, as a minimum, include the following:
• The field data checklist and true/false evaluation statement with relevant sketches, photographs, and calculations.
B-58

ETL 1110-2-568 31 Oct 06
• Response spectra information for the earthquakes used to evaluate IO and CP
performance.
• Relevant plans and sections describing the lateral force resisting system along with numbers designating individual members, joints, and connections. Number designations shall comply with those used for the analytical models.
• A description of the analytical models used in the performance-based analysis and their load cases.
• Boundary conditions used for each analysis, including connections to the substructure and connections between the roof system and supporting walls.
• Effective stiffness properties for members of the lateral force resisting system.
• A summary of earthquake demands on critical elements for IO and CP performance. This should include the Simple-LSP, LSP, and LDP analyses. Maximum force-controlled demands (shear, sliding shear) and maximum deformation-controlled demands (bending moments) should be provided.
• A summary of demand-to-capacity ratios (DCRs) for force-controlled and deformation-controlled actions along with a comparison to DCR acceptance criteria.
• A description of any special analyses that were performed (i.e., displacement ductility evaluations, composite structure analyses, 3D-analyses, time-history analyses, PSHA analyses, etc.), the reason for such analyses, and a results summary including the elements listed above.
• A statement covering any observed or computationally determined deficiencies, along with recommendations concerning possible mitigation or remediation. (2) Sufficient documentation for those calculations and computer analyses that support the report findings shall be provided. Documentation is needed to facilitate independent reviews and to establish a benchmark for future seismic investigations as deemed appropriate.
B-59
ETL 1110-2-568 31 Oct 06
APPENDIX C
Amplification Discussion
C-1. General. a. Features such as powerhouse walls, parapets, and other appendages that project away from larger supporting substructures are subject to amplification. A powerhouse substructure is a high-frequency responder that acts as a filter attenuating low-frequency motions but amplifying the seismic motion near the substructure’s own natural frequency. With respect to powerhouse superstructure walls, amplification effects will be automatically picked up when composite substructure-superstructure analytical models are used for the seismic evaluation. However, when the superstructure is decoupled from the substructure (superstructure-only models), any influence amplification has on total earthquake demand will be missed. The maximum ampli-fication occurs when the period of the substructure (T1) or ( ) nears the period of one of the principal modes of vibration for the superstructure (T). Principal modes of vibration that are of interest are illustrated in Figure B-4. Resonance can also occur at the superstructure’s higher modes of vibration. Although these higher-frequency modes can magnify force demands, they have little effect on displacement demands. The amplified force demands associated with these higher modes of vibration can cause shear demands to increase significantly. However, it must be recognized that shear demand is limited and need not exceed a demand corresponding to 1.5 times that of the member’s nominal moment capacity.
11T
b. It has long been recognized that displacements are the best indicator of structure performance and damage. Therefore, since higher-mode displacement demands are low and shear demand is limited, it is only necessary when assessing displacement ductility demand to consider those amplification effects associated with the low-frequency modes of the super-structure. Evaluators wishing to investigate the impact that higher-frequency modes of vibration may have on displacement demand are referred to Qi and Moehle (1991). c. Powerhouse superstructures are generally short-period systems with a fundamental period less than the characteristic ground motion period (i.e., intersection of the constant acceleration response and constant velocity response regions). Response is usually in the constant acceleration range of the response spectrum (Figure C-1a) d. This means that the earthquake demand on the substructure will be at a maximum and the spectral acceleration will be equal to 2.5 times the peak ground acceleration (PGA). Amplification will increase the demand on superstructure walls (assuming linear elastic behavior) by about six, meaning that the demands on the superstructure could reach 6 × 2.5, or about 15 times the PGA. This amplification applies to those generator bay composite models and erection/service bay block models as described in Ebeling, Perez-Marcial, and Yule (2006). The erection bay/service bay block-frame model described in Ebeling, Perez-Marcial, and Yule (2006) is a hybrid system considered to be best evaluated using composite modeling techniques. This particular system will therefore not be addressed with respect to a superstructure-only analysis.
C-1

ETL 1110-2-568 31 Oct 06
a. Standard acceleration response spectrum.
b. Standard displacement response spectrum.
Figure C-1. Top-of-rock response spectra.
C-2
ETL 1110-2-568 31 Oct 06
e. Amplification occurs due to height-wise acceleration occurring in the substructure and to resonance amplification occurring when the period of the superstructure nears that of the substructure. The intent of Appendix C is to:
• Describe height-wise amplification effects with respect to powerhouse substructures.
• Use data from Ebeling, Perez-Marcial, and Yule (2006) to develop simple methods that can be used to estimate the period of the substructure.
• Use data from Ebeling, Perez-Marcial, and Yule (2006) and NCEER-93-0003 to develop a simple method for estimating resonance amplification effects in superstructure-only models.
• Use data from Ebeling, Perez-Marcial, and Yule (2006) to provide guidance for determining when a superstructure will experience negligible amplification.
• Discuss the amplification provisions contained in FEMA 356 (2000) with respect to parapets and appendages.
• Suggest an alternative time-history approach for estimating amplification effects. C-2. Discussion of Ebeling, Perez-Marcial, and Yule (2006). a. A typical relationship between amplification and frequency per the Ebeling, Perez-Marcial, and Yule (2006) report is illustrated in Figure C-2. b. The powerhouse substructure is a high-frequency (short-period) responder. It acts as a filter amplifying the high-frequency motion near the substructure’s own natural frequency and somewhat attenuates (reduces) lower-frequency motions. The peak amplification response will occur when the substructure and superstructure have identical periods of vibration. c. Relationships between amplification and frequency obtained from the Ebeling, Perez-Marcial, and Yule (2006) report will be used to:
• Develop simple formulas that can be used to estimate the substructure’s fundamental period for generator bay block models and erection/service bay block models under both “dry” and “wet” conditions. The substructure’s fundamental period for the “dry” condition is designated as T1 and for the “wet” condition as . 1
1T • Determine the peak resonance amplification (ap) as a function of the substructure’s
fundamental period of vibration (T1). Total amplification (AF) divided by the height-wise amplification (ax) equals the peak resonance amplification (ap).
• Determine the superstructure-to-substructure period ratio (T/T1) or (T/ ) where
amplification is negligible (need not be considered).
11T
C-3

ETL 1110-2-568 31 Oct 06
Figure C-2. Typical amplification plot from Ebeling, Perez-Marcial, and Yule (2006). AF is the amplification factor, which is the acceleration of SDOF on top of substructure divided
by the acceleration of SDOF on top of rock, or the height-wise amplification (ax) multiplied by the resonance amplification (ap).
d. The figures contained in Section 5.2, “Recommended Amplification Factor Relationships for Generator Bay Composite Models,” and Section 5.3, “Recommended Amplification Factor Relationships for Erection / Service Bay Block Models,” of Ebeling, Perez-Marcial, and Yule (2006) are use to accomplish the above objectives. Information from the Ebeling, Perez-Marcial and Yule (2006) Section 5.2 and 5.3 figures important to this effort is presented in Tables C-1 through C-8.
C-4
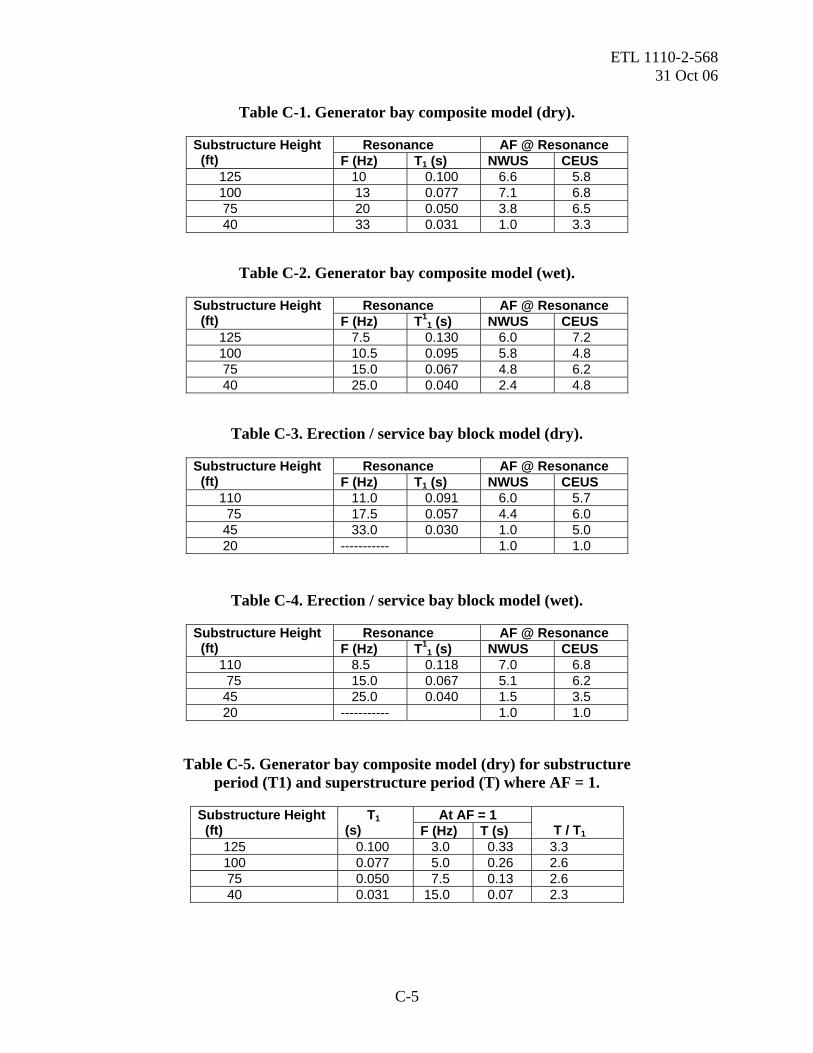
ETL 1110-2-568 31 Oct 06
Table C-1. Generator bay composite model (dry).
Resonance AF @ Resonance Substructure Height
(ft) F (Hz) T1 (s) NWUS CEUS 125 10 0.100 6.6 5.8 100 13 0.077 7.1 6.8 75 20 0.050 3.8 6.5 40 33 0.031 1.0 3.3
Table C-2. Generator bay composite model (wet).
Resonance AF @ Resonance Substructure Height (ft) F (Hz) T1
1 (s) NWUS CEUS 125 7.5 0.130 6.0 7.2 100 10.5 0.095 5.8 4.8 75 15.0 0.067 4.8 6.2 40 25.0 0.040 2.4 4.8
Table C-3. Erection / service bay block model (dry).
Resonance AF @ Resonance Substructure Height (ft) F (Hz) T1 (s) NWUS CEUS 110 11.0 0.091 6.0 5.7 75 17.5 0.057 4.4 6.0 45 33.0 0.030 1.0 5.0 20 ----------- 1.0 1.0
Table C-4. Erection / service bay block model (wet).
Resonance AF @ Resonance Substructure Height (ft) F (Hz) T1
1 (s) NWUS CEUS 110 8.5 0.118 7.0 6.8 75 15.0 0.067 5.1 6.2 45 25.0 0.040 1.5 3.5 20 ----------- 1.0 1.0
Table C-5. Generator bay composite model (dry) for substructure period (T1) and superstructure period (T) where AF = 1.
At AF = 1 Substructure Height
(ft) T1(s) F (Hz) T (s) T / T1
125 0.100 3.0 0.33 3.3 100 0.077 5.0 0.26 2.6 75 0.050 7.5 0.13 2.6 40 0.031 15.0 0.07 2.3
C-5

ETL 1110-2-568 31 Oct 06
Table C-6. Generator bay composite model (wet) for substructure period (T1) and superstructure period (T) where AF = 1.
At AF = 1 Substructure Height
(ft) T1(s) F (Hz) T (s) T / T1
125 0.130 2.0 0.500 3.8 100 0.095 4.0 0.250 2.6 75 0.067 6.0 0.170 2.5 40 0.040 10.0 0.100 2.5
Table C-7. Erection / service bay block model (dry) for substructure period (T1) and superstructure period (T) where AF = 1.
At AF = 1 Substructure Height
(ft) T1(s) F (Hz) T (s) T / T1
110 0.091 3.0 0.330 3.6 75 0.057 5.0 0.200 3.5 45 0.030 18.0 0.060 2.0 20 ---------
Table C-8. Erection / service bay block model (wet) for substructure period (T1) and superstructure period (T) where AF = 1.
At AF = 1 Substructure Height
(ft) T1(s) F (Hz) T (s) T / T1
110 0.118 3.0 0.330 2.8 75 0.067 5.0 0.200 3.0 45 0.040 18.0 0.060 1.5 20 ------------
e. Simple formulas that can be used to estimate the substructure’s fundamental period for generator bay block models and erection/service bay block models under both “dry” and “wet” conditions are developed based on the data contained in Tables C-1 through C-4. Plots of these data along with a plot of a linear equation that best fits the data are provided in Figures C-3 through C-6. f. Peak resonance amplification (ap) in the superstructure occurs at the substructure’s fundamental period of vibration (T1 or ). The total amplification (AF) divided by the height-wise amplification (a
11T
x) equals the peak resonance amplification (ap). The height-wise amplification (ax) is assumed to be 1.2 based on information presented in Section C-3. g. It is generally accepted that if the period of an appendage (in this case the powerhouse superstructure) is less than 0.06 seconds, then no dynamic amplification is expected. Therefore, only those AF values corresponding to substructures with periods of 0.06 seconds or greater will be used to estimate a reasonable AF for use in the assessment of superstructure-only models. The information in Tables C-1 through C-4 for substructures with periods greater than 0.06 seconds shows that a total amplification equal to 6.0 is reasonable.
C-6

ETL 1110-2-568 31 Oct 06
0.25 0.10 0.00 0.05 0.15 0.20
Dry Substructure Period (T1) - Seconds
25
50
75
100
125
150
Substructure Height (H) Feet
S
S
EH
T 50.11 =
Figure C-3. Generator bay block model (dry).
C-7
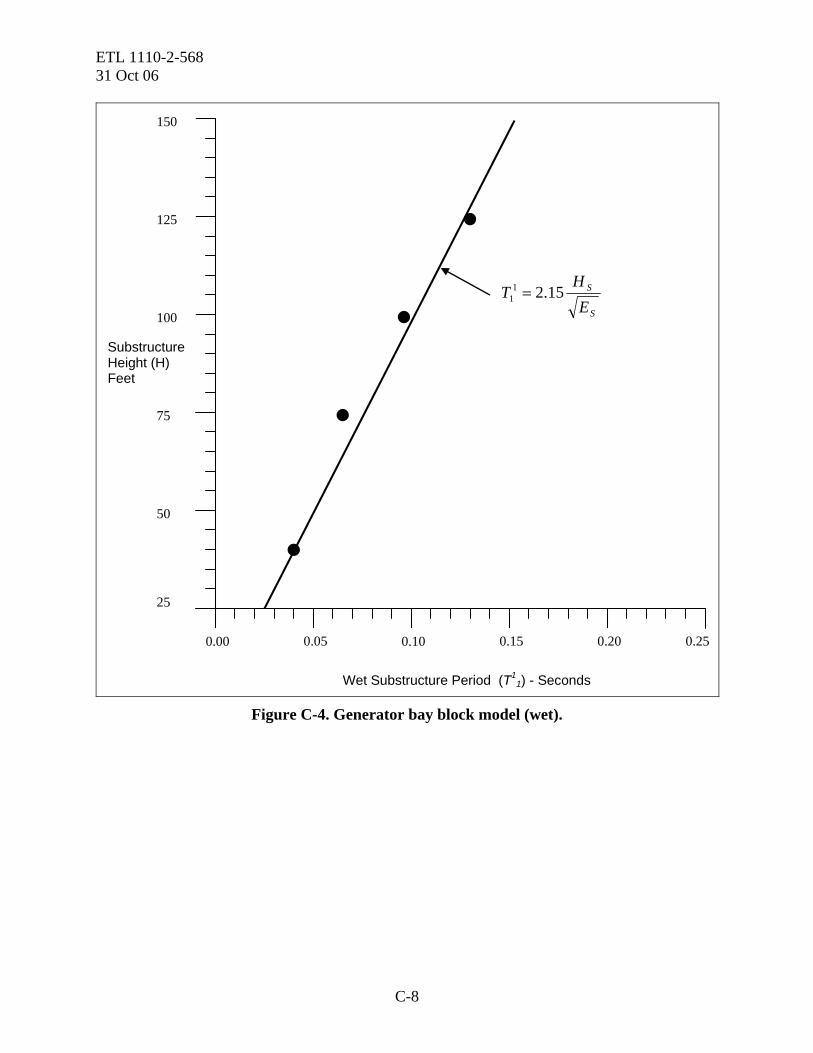
ETL 1110-2-568 31 Oct 06
0.25 0.10 0.00 0.05 0.15 0.20
Wet Substructure Period (T11) - Seconds
25
50
75
100
125
150
Substructure Height (H) Feet
S
S
EH
T 15.211 =
Figure C-4. Generator bay block model (wet).
C-8
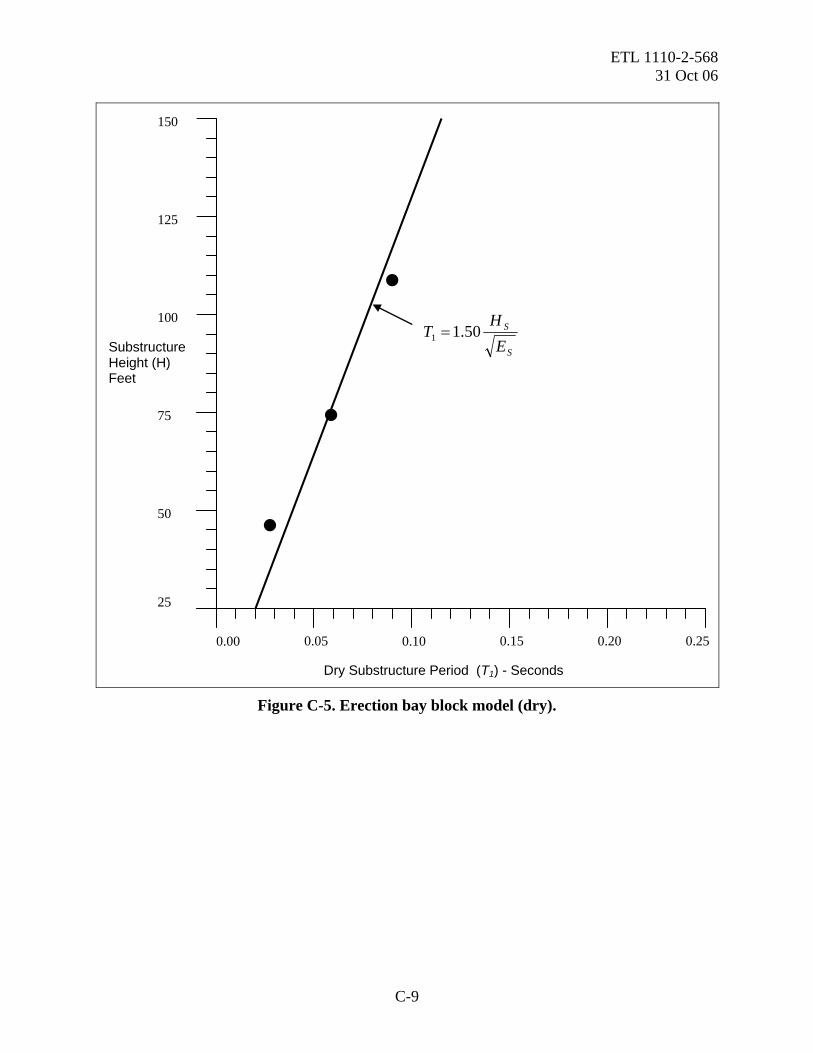
ETL 1110-2-568 31 Oct 06
0.10 0.00 0.05 0.15 0.20 0.25
Dry Substructure Period (T1) - Seconds
25
50
75
100
125
150
Substructure Height (H) Feet
S
S
EH
T 50.11 =
Figure C-5. Erection bay block model (dry).
C-9

ETL 1110-2-568 31 Oct 06
0.10 0.00 0.05 0.15 0.20 0.25
Wet Substructure Period (T11) - Seconds
25
50
75
100
125
150
Substructure Height (H) Feet
S
S
EH
T 00.211 =
Figure C-6. Erection bay block model (wet).
h. Tables C-5 through C-8 are used to determine the superstructure-period-to-substructure-period ratio (T/T1) or (T/ ) where amplification of the superstructure is negligible and need not be considered. This occurs because low-frequency attenuation effects cancel out height-wise amplification effects. Again, using only those total AF values corresponding to substructures with periods of 0.06 seconds or greater, it can be seen that a superstructure-period-to-substructure-period ratio of 3.0 would be a reasonable point to assume the effects of amplification will be negligible. This can be confirmed by reviewing the amplification plots contained in Section 5 of Ebeling, Perez-Marcial, and Yule (2006).
11T
C-10
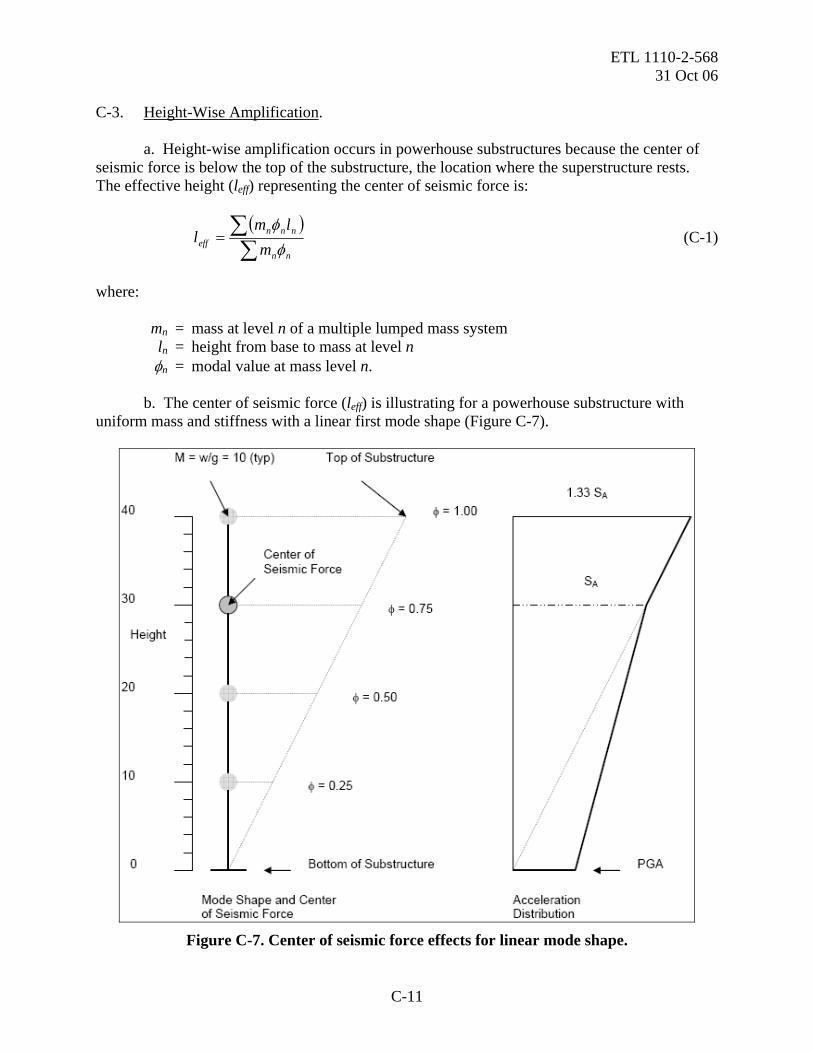
ETL 1110-2-568 31 Oct 06
C-3. Height-Wise Amplification. a. Height-wise amplification occurs in powerhouse substructures because the center of seismic force is below the top of the substructure, the location where the superstructure rests. The effective height (leff) representing the center of seismic force is:
( )∑∑=
nn
nnneff m
lml
φφ
(C-1)
where: mn = mass at level n of a multiple lumped mass system ln = height from base to mass at level n φn = modal value at mass level n. b. The center of seismic force (leff) is illustrating for a powerhouse substructure with uniform mass and stiffness with a linear first mode shape (Figure C-7).
Figure C-7. Center of seismic force effects for linear mode shape.
C-11
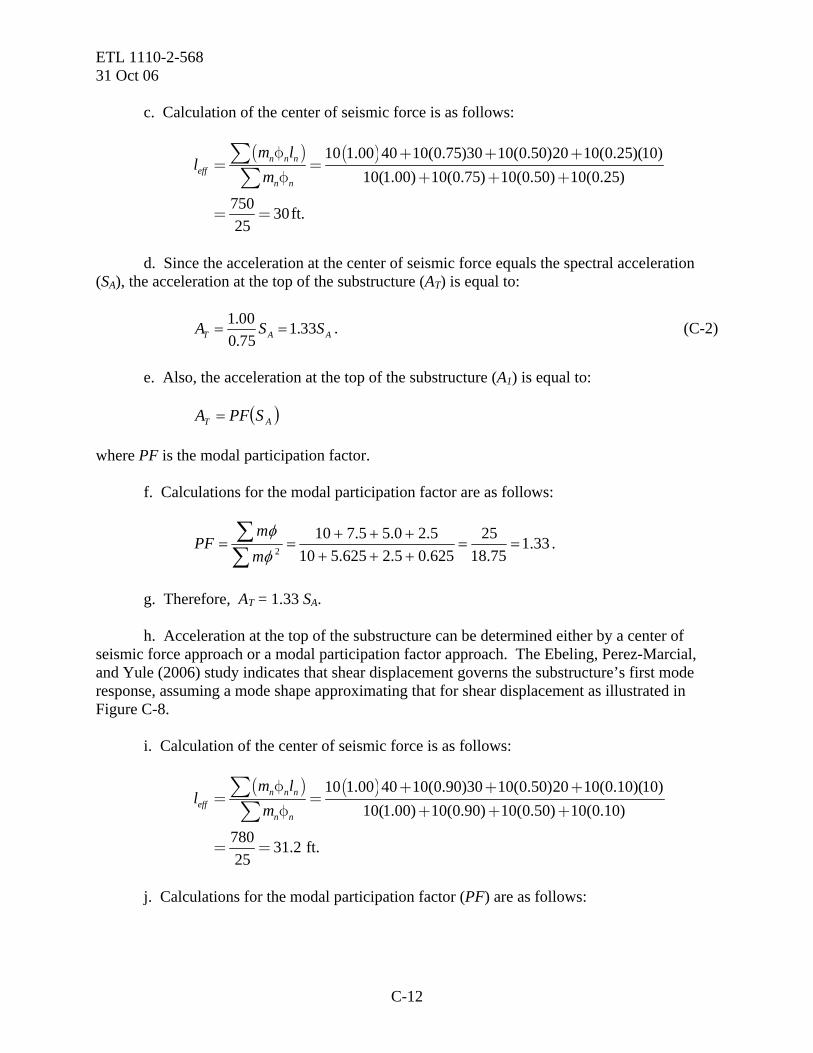
ETL 1110-2-568 31 Oct 06 c. Calculation of the center of seismic force is as follows:
( ) ( )10 1.00 40 10(0.75)30 10(0.50)20 10(0.25)(10)10(1.00) 10(0.75) 10(0.50) 10(0.25)
750 30ft.25
n n neff
n n
m ll
mφ + + +
= =φ + + +
= =
∑∑
d. Since the acceleration at the center of seismic force equals the spectral acceleration (SA), the acceleration at the top of the substructure (AT) is equal to:
1 00 1 330 75T A AA S.
..
= = S . (C-2)
e. Also, the acceleration at the top of the substructure (A1) is equal to: ( )AT SPFA = where PF is the modal participation factor. f. Calculations for the modal participation factor are as follows:
33.175.18
25625.05.2625.5105.20.55.710
2 ==++++++
==∑∑
φφ
mm
PF .
g. Therefore, AT = 1.33 SA. h. Acceleration at the top of the substructure can be determined either by a center of seismic force approach or a modal participation factor approach. The Ebeling, Perez-Marcial, and Yule (2006) study indicates that shear displacement governs the substructure’s first mode response, assuming a mode shape approximating that for shear displacement as illustrated in Figure C-8. i. Calculation of the center of seismic force is as follows:
( ) ( )10 1.00 40 10(0.90)30 10(0.50)20 10(0.10)(10)10(1.00) 10(0.90) 10(0.50) 10(0.10)
780 31.2 ft.25
n n neff
n n
m ll
mφ + + +
= =φ + + +
= =
∑∑
j. Calculations for the modal participation factor (PF) are as follows:
C-12

ETL 1110-2-568 31 Oct 06
Figure C-8. Center of seismic force for shear displacement response.
2.17.20
251.05.21.8100.10.50.910
2 ==++++++
==∑∑
φ
φ
mm
PF .
k. The acceleration at the top of the substructure (A1) is equal to: . ( ) AAT SSPFA 2.1== l. Height-wise amplification occurring in powerhouse superstructures can be based on the following assumptions:
• The substructure and superstructure will respond in the acceleration-sensitive range of the response spectra.
• Only first mode effects need be considered.
• The first mode participation factor (PF) is equal to 1.2.
C-13

ETL 1110-2-568 31 Oct 06 m. Height-wise amplification (ax) of acceleration if both the substructure and super-structure appendages are responding in the constant acceleration range is equal to 1.2. In other words, the acceleration the superstructure appendage will experience is 1.2 times that it would experience if it were founded on top of rock. With the spectral acceleration in the constant acceleration range equal to 2.5 times the peak ground acceleration (PGA), the force the super-structure appendage will experience due to height-wise acceleration is equal to 1.2 × 2.5, or 3.0 times the PGA. C-4. Resonance-Related Amplification. Resonance-related amplification takes place as the period of the superstructure approaches that of the substructure. The total amplification for substructures of various heights is presented above in Section C-2. With respect to generator bay substructures and erection/service bay block substructures responding in the constant-acceleration range, the maximum total amplification is approximately equal to six. Assuming that the height-wise amplification effect is equal to 1.2, the peak amplification attributable to resonance is equal to 6.0 ÷ 1.2, or 5.0. The range of the peak resonance response should be broadened from that indicated in the Ebeling, Perez-Marcial, and Yule (2006) report to account for inaccuracies in the determination of the substructure period (T1) or ( ) and the superstructure period (T). In this respect, the recommendations presented in National Center for Earthquake Engineering Research Technical Report NCEER-93-003 will be followed. The substructure-period-to-superstructure-period ratio (T/T
11T
1) is used to define the region where peak resonance occurs. Following NCEER-93-003 recommendations, the range of peak response is broadened from 0.7 (T/T1) to 1.4 (T/T1). Also, according to the NCEER study, resonance amplification effects outside the range of 0.5 (T/T1) to 2.0 (T/T1) are considered to be negligible. Based on the above discussion, the application of resonance response amplification for superstructure-only models can be in accordance with Figure C-9. C-5. Amplification Provisions Contained in FEMA 356 (2000). a. The provisions in FEMA 356 (2000) relating to parapets and appendages are examined to understand how they might compare with the provisions in Sections C-3 and C-4 above proposed for height-wise and resonance amplification of powerhouse superstructures. FEMA 356 (2000) contains general equation for amplification and an equation that establishes a default limit on amplification. The amplification suggested by Figure C-9 is higher than that which would occur using the general equation and much higher that than using the default limit. b. From the FEMA 356 (2000) general equation:
⎥⎦⎤
⎢⎣⎡ +=
hx
RWISa
FP
PpSPP 21
4.0 (C-3a)
C-14
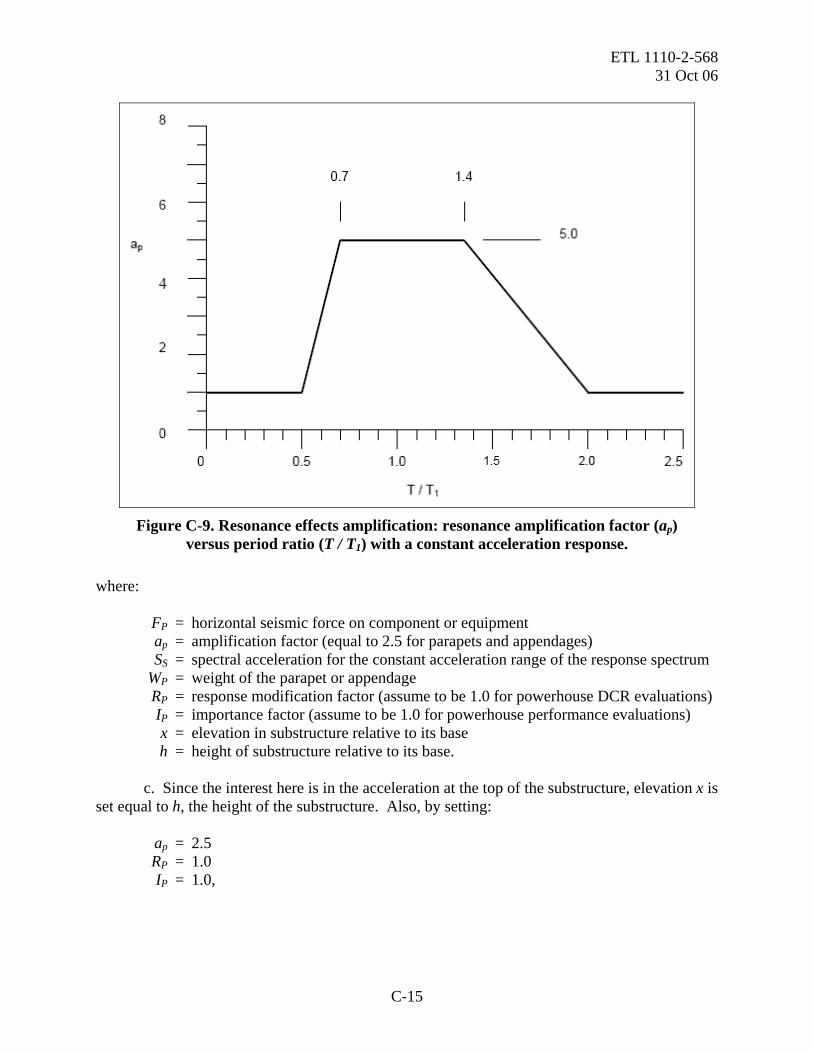
ETL 1110-2-568 31 Oct 06
Figure C-9. Resonance effects amplification: resonance amplification factor (ap)
versus period ratio (T / T1) with a constant acceleration response.
where: FP = horizontal seismic force on component or equipment ap = amplification factor (equal to 2.5 for parapets and appendages) SS = spectral acceleration for the constant acceleration range of the response spectrum WP = weight of the parapet or appendage RP = response modification factor (assume to be 1.0 for powerhouse DCR evaluations) IP = importance factor (assume to be 1.0 for powerhouse performance evaluations) x = elevation in substructure relative to its base h = height of substructure relative to its base. c. Since the interest here is in the acceleration at the top of the substructure, elevation x is set equal to h, the height of the substructure. Also, by setting: ap = 2.5 RP = 1.0 IP = 1.0,
C-15
ETL 1110-2-568 31 Oct 06 Equation C-3a becomes: , (C-3b) PSP WSF 0.3= indicating that the acceleration at the top of the substructure is equal to 3 times the top-of-rock spectral acceleration and, since performance is the constant-acceleration range, equal to 7.5 times the peak ground acceleration (i.e., 7.5 PGA). d. This is half the product of the height-wise amplification and resonance amplification (1.2 × 5.0 × 2.5 = 15 PGA) proposed for powerhouse superstructures as described in Sections B-2 and B-3 above. e. The FEMA 356 (2000) provisions limit the maximum force on components to: . (C-4) PPSP WISF 6.1= f. Recognizing that 0.4 (SDX) equals the peak ground acceleration for the design earthquake and taking IP equal to one, the above formulation can be rewritten to: . (C-5) ( ) PP WPGAF 0.4= g. This is about one-quarter the product of the height-wise amplification and resonance amplification proposed for powerhouse superstructures as described in Sections C-3 and C-4 above. The Equation C-5 default value is based on information observed with respect to components (parapet and appendages) and equipment located on top of buildings and subjected to major earthquake ground motions (NCEER, 1993). In general, buildings will perform inelastically during major earthquakes, thereby reducing resonance amplification effects. It is not anticipated that powerhouse substructures will perform inelastically, so the default seismic force expressed by Equations C-5 is not likely to be appropriate for powerhouse superstructures and equipment. However, it should be recognized that amplification effects predicted using the information described in Sections C-3 and C-4 would be upper-bound values. Before any remediation is undertaken based on the proposed upper-bound values, a time-history analysis, as described below, should be performed. C-6. Estimating the Period of the Substructure and Superstructure. a. To apply the amplification effects as proposed in Sections C-3 and C-4 in a super-structure-only evaluation, the evaluator must be able to estimate the period of the superstructure and substructure with reasonable accuracy. Methods for estimating the period of the super-structure for the simple linear static procedure (LSP) and the regular LSP analyses are contained in Appendix B. When linear dynamic procedures (LDP) analysis is used, periods of vibration for the superstructure will be part of the response spectrum analysis output. Procedures for estimating the period of vibration of the substructure were developed using information contained in Ebeling, Perez-Marcial, and Yule (2006) and presented in Section C-2.
C-16

ETL 1110-2-568 31 Oct 06
b. Based on information obtained from Ebeling, Perez-Marcial, and Yule (2006) and the period formulation approach used for dams by Fenves and Chopra (1985), the fundamental period of vibration for generator bay and erection/service bay block substructure models in the dry condition is approximately equal to:
S
S
EH
T 5.11 = (C-6)
where: T1 = fundamental period of substructure (seconds) HS = height of substructure (ft) ES = modulus of elasticity of substructure (psi). c. For the wet condition, the forebay and tailrace pool conditions are those assumed in Ebeling, Perez-Marcial, and Yule (2006). The forebay pool is assumed to be 20 ft above the top of the idealized substructure, and the tailrace pool 34.4 ft below the top of the idealized substructure. The height of the idealized substructure (HS) and the idealized pool conditions are illustrated in Figure C-10 for the generator bay analytical model. d. The fundamental period of vibration for the erection/service bay substructure in the wet condition is approximately equal to:
S
S
EH
T 0.21 = . (C-7)
e. The fundamental period of vibration for the generator bay substructure in the wet condition is approximately equal to:
S
S
EH
T 15.211 = . (C-8)
where T1 is the fundamental period of the wet substructure (seconds). f. The period formulations presented above (Equations C-6 through C-8) are a best fit to fundamental period data extracted from Ebeling, Perez-Marcial, and Yule (2006). Plots of the extracted data with the appropriate best-fit formulations are presented in Figures C-3 through C-6.
C-17

ETL 1110-2-568 31 Oct 06
Figure C-10. Generator bay sectional elevation, with the forebay and tailrace levels
representing “wet.”
g. For an erection/service bay substructure that is 100 ft high (HS = 100 ft) and that has a modulus of elasticity equal to 3.7 × 10⁶ psi (ES = 3.7 × 10⁶ psi), the fundamental period (T1) for the dry condition is:
078.03700000
1005.15.11 ===S
S
EH
T seconds.
h. For the wet condition with water 20 ft higher than the top of the substructure, the fundamental period ( ) for the wet condition is: 1
1T
1002 0 2 0 0 1043700000
1 S1
S
HTE
. .= = = . seconds.
C-18

ETL 1110-2-568 31 Oct 06
C-7. Estimating Superstructure Amplification Effects. a. The ratio of the periods of the superstructure to substructure (T/T1) can be determine using the formulations presented above for determining the period of the substructure and using methods described in Appendix B for determining the period of the superstructure. Knowing T/T1 and using the information provided in Figure C-4, the resonance amplification (ap) can be determined. The resonance amplification per Figure C-9 is presented in Table C-9.
Table C-9. Period ratio (T/T1) vs. resonance amplification (ap).
Period ratio (T/T1) Resonance amplification (ap) T/T1 ≤ 0.5 1.0 0.5 ≤ T/T1 ≤ 0.7 20.00 (T/T1) – 9.00 0.7 ≤ T/T1 ≤ 1.4 5.0 1.4 ≤ T/T1 ≤ 2.0 14.34 – 6.67 (T/T1) T/T1 ≥ 2.0 1.0
b. The resonance amplification values determined from Table C-9 must be multiplied by 1.2 to account for height-wise amplification (ax) effects. Resonance amplification effects can be neglected when the period of the superstructure is more than twice that of the substructure (T/T1 > 2.0). Height-wise amplification effects can be neglected when the period of the superstructure is more than three times that of the substructure (T/T1 > 3.0). Resonance amplification effects can also be neglected when the period of the superstructure is less than half that of the substructure (T/T1 < 0.5), although it is extremely unlikely that the period of the superstructure will be less than that of the substructure. c. The demands on superstructure-only models obtained from linear static procedure (LSP) or a linear dynamic procedure (LDP) analyses should be amplified when required and as suggested in the above discussion. Amplification effects are automatically included in the LDP analysis results when composite models are used. The demands from composite models, however, should be compared with amplified demands from the superstructure-only model. This comparison is necessary to make sure that peak response broadening as illustrated in Figure C-9 will not produce superstructure-only demands that are higher than those of the composite model. If this happens, the demands of the superstructure-only model should be used as the basis for demand-to-capacity ratio (DCR) evaluations. d. The above comparison should also be made between superstructure-only analyses performed with standard top-of-rock spectra and performed with top-of-substructure spectra obtained from Ebeling, Perez-Marcial, and Yule (2006). e. It is important that evaluators, when using composite analyses or top-of-substructure response spectrum analyses, consider only the low-frequency modes (fundamental mode for LSP analyses, Figure B-4 modes for LDP analyses) of the superstructure when performing demand-to-capacity ratio (DCR) evaluations for displacement-controlled actions (i.e., flexure). This is
C-19

ETL 1110-2-568 31 Oct 06 because a displacement ductility demand value calculated based on moment demand (rather than displacement demand) per the FEMA 356 (2000) methodology will produce an unreasonably high displacement ductility demand and DCR. C-8. Amplification by Time-History Analysis. Amplification effects obtained by amplified superstructure-only model LSP or LDP analysis or by composite model LDP analysis are considered to represent upper-bound demand conditions. If these upper-bound demands result in performance that is unacceptable, a linear elastic time-history analysis using demands from representative natural time-history records should be considered. With the time-history analysis, the peak demands can be examined with respect to the number and extent of the peak excursions critical to performance. Using the FEMA 356 (2000) performance-based evaluation techniques, it is assumed for reinforced concrete that strength and deformation capacities are for earthquake loadings involving three fully reversed deformation cycles to design deformation levels. Short-period structures (i.e., powerhouse superstructures) can be expected to sustain additional cycles to design deformation levels. Therefore, it is considered acceptable for evaluators to base the peak (amplified) time-history response on the average of the three cycles exhibiting the greatest demand.
C-20
ETL 1110-2-568 31 Oct 06
APPENDIX D
Evaluating Older Powerhouses
D-1. General. a. Many Corps powerhouses date back to the early 1900s. Therefore, it is important that engineers evaluating the seismic vulnerability of these older powerhouses understand aspects related to:
• Concrete and reinforcing steel material properties used in their design, and
• Codes and guidance governing their design. b. The year in which a Corps powerhouse was constructed will have significant influence on how it will perform when subjected to earthquake ground motions. Historical information on material properties valuable in assessing seismic performance is provided in FEMA 356 (2000). Default strength and yield properties from FEMA 356 (2000) are useful in the preliminary seismic assessment of older Corps powerhouses. Additional information may be available on the contract drawings or in the contract specifications. In some instances, sampling and testing will be required to confirm that strengths are the same as those originally assumed for preliminary seismic evaluations. c. Older powerhouse walls will likely not have development and splice lengths that comply with current code (ACI 318-02) requirements. In addition, powerhouses constructed before 1947 are unlikely to have the “high-bond” deformation patterns typical of modern reinforced concrete structures. Information on the yield and tensile strength properties of older reinforcing steel is provided in FEMA 356 (2000). This appendix provides guidance on one approach that can be used to assess the strength of older powerhouse walls that do not have adequate splice and development lengths. This deficiency can be the result of either past code design practice or the “low-bond” deformation pattern of older reinforcement. The information contained here on low-bond reinforcement is based on FEMA 356 (2000) and CRSI (2001). d. In most instances with older powerhouses, it will be difficult to determine the concrete compressive strengths and reinforcing steel strengths. The default lower-bound values provided in FEMA 356 (2000) and repeated in this appendix are intended for use in performing the LSP, LDP, and Special Analyses of existing powerhouse superstructures. In cases where demand-to-capacity ratios (DCR) are marginal with respect to meeting acceptance criteria, it may be advisable to conduct destructive and non-destructive testing to determine in-place concrete strengths and the yield strength and ultimate tensile strain capacity of the reinforcing steel. With older low-bond reinforcement, pull-out testing may be useful for determining the adequacy of the splice and development lengths used in the construction of critical components. e. Component strength will be a function of displacement ductility demand, with concrete shear strength declining rapidly as displacement ductility demand increases. Older powerhouse superstructure components do not contain the confinement steel required by modern
D-1
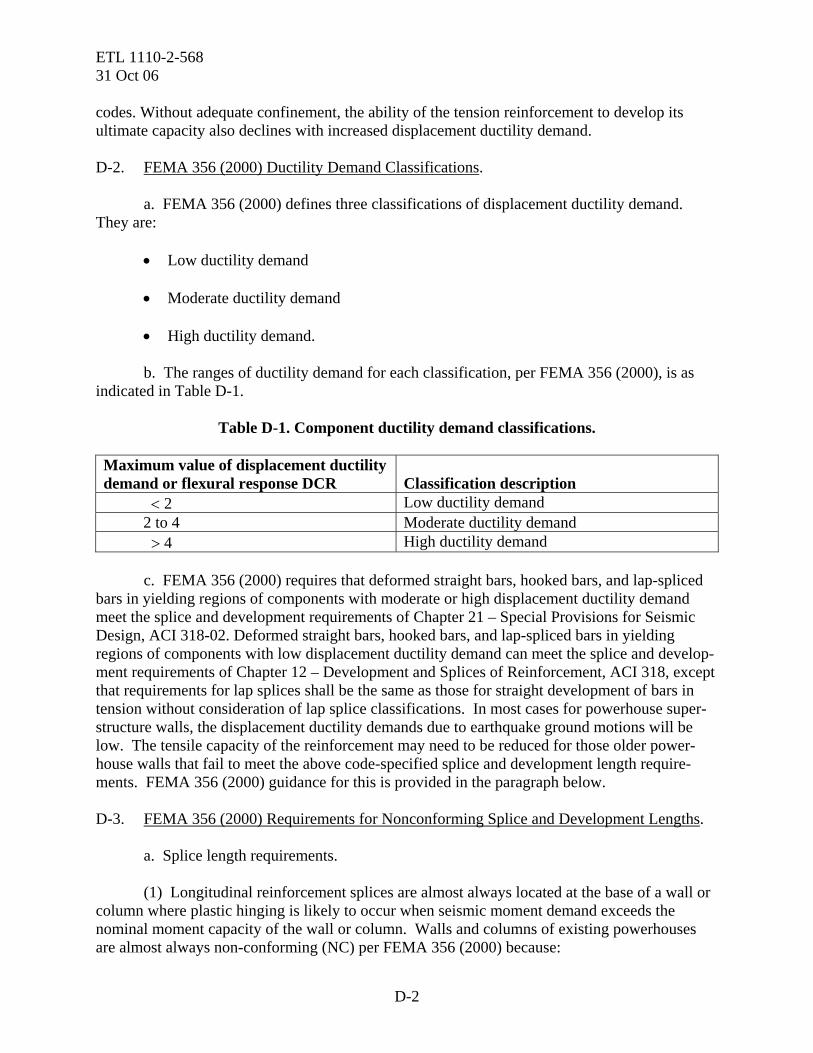
ETL 1110-2-568 31 Oct 06 codes. Without adequate confinement, the ability of the tension reinforcement to develop its ultimate capacity also declines with increased displacement ductility demand. D-2. FEMA 356 (2000) Ductility Demand Classifications. a. FEMA 356 (2000) defines three classifications of displacement ductility demand. They are:
• Low ductility demand
• Moderate ductility demand
• High ductility demand. b. The ranges of ductility demand for each classification, per FEMA 356 (2000), is as indicated in Table D-1.
Table D-1. Component ductility demand classifications.
Maximum value of displacement ductility demand or flexural response DCR
Classification description
< 2 Low ductility demand 2 to 4 Moderate ductility demand > 4 High ductility demand
c. FEMA 356 (2000) requires that deformed straight bars, hooked bars, and lap-spliced bars in yielding regions of components with moderate or high displacement ductility demand meet the splice and development requirements of Chapter 21 – Special Provisions for Seismic Design, ACI 318-02. Deformed straight bars, hooked bars, and lap-spliced bars in yielding regions of components with low displacement ductility demand can meet the splice and develop-ment requirements of Chapter 12 – Development and Splices of Reinforcement, ACI 318, except that requirements for lap splices shall be the same as those for straight development of bars in tension without consideration of lap splice classifications. In most cases for powerhouse super-structure walls, the displacement ductility demands due to earthquake ground motions will be low. The tensile capacity of the reinforcement may need to be reduced for those older power-house walls that fail to meet the above code-specified splice and development length require-ments. FEMA 356 (2000) guidance for this is provided in the paragraph below. D-3. FEMA 356 (2000) Requirements for Nonconforming Splice and Development Lengths. a. Splice length requirements. (1) Longitudinal reinforcement splices are almost always located at the base of a wall or column where plastic hinging is likely to occur when seismic moment demand exceeds the nominal moment capacity of the wall or column. Walls and columns of existing powerhouses are almost always non-conforming (NC) per FEMA 356 (2000) because:
D-2

ETL 1110-2-568 31 Oct 06
• Transverse confining reinforcement, if present, usually has spacings that are greater
than one-third the depth of the member.
• The strength provided by the transverse reinforcement is less than three-fourths the shear capacity of the member. (2) Where existing deformed straight bars, hooked bars, and lap-spliced bars do not meet the development requirements in the code provisions specified above, the capacity of the existing reinforcement shall be calculated using the following equation:
yd
bS f
ll
f = (D-1)
where: fS = maximum stress that can be developed in the bar for the straight development,
hook, or lap splice length (lb) lb = splice length provided ld = length required by ACI 318 Chapter 12, or 21 as appropriate for straight
development, hook development, or lap splice length, except required splice lengths may be taken as straight bar development lengths in tension.
(3) Where transverse reinforcement is distributed along the development length with spacing not exceeding one-third of the effective depth of the component, it shall be permitted to assume that the reinforcement retains the calculated maximum stress to high ductility demands. (4) FEMA 356 (2000) also indicates: “For larger spacings of transverse reinforcement, the development stress shall be assumed to degrade from fS to 0.2 fS at a ductility demand equal to two.” (5) This degradation need not be considered for powerhouse superstructure components if they have axial load ratios (ALR) less than 0.15, which is commonly the case:
15.0' ≤=caG fA
PALR (D-2)
where: P = axial load on wall or column AG = gross sectional area of wall or column fca
’ = actual compressive strength of concrete. (6) In research performed on concrete columns (Watson, Zahn, and Park 1994), it was determined that: “At low axial load ratios (<0.15) extremely large curvature-ductility factors are available with only very small quantities of confining reinforcement steel. In such cases, the
D-3

ETL 1110-2-568 31 Oct 06 amount of transverse reinforcement required is not governed by the requirements of concrete confinement.” (7) In addition, it has been observed that when compressive strains are below 0.2 percent (0.002), the chance for micro cracking and bond deterioration that could lead to reinforcing steel splice failure is low [see Appendix G, Strom and Ebeling (2005)]. b. Embedment length requirements. (1) The strength of deformed, straight, discontinuous bars embedded in concrete sections or beam-column joints, with clear cover over the embedded bar not less than three bar diameters (3db) shall be calculated as follows:
yeb
s fld
f ≤=2500 (D-3)
where: fs = maximum stress (psi) that can be developed in an embedded bar having an
embedment length le (in.). db = diameter of embedded bar (in.). (2) FEMA 356 (2000) also indicates: “When fs is less than fY, and the calculated stress in the bar due to design loads equals or exceeds fs, the maximum developed stress shall be assumed to degrade from fs to 0.2 fs at a ductility demand equal to two.” (3) For reasons stated above, this degradation need not be considered for powerhouse superstructure components that have axial load ratios less than 0.15. D-4. Splice and Development Length Requirements for “Low-Bond” Deformation Bars. a. In the early 1900s, the reinforcing steel could consist of:
• Plain round bars
• Twisted square bars
• Round and square bars with “low bond” deformations. b. Many of these early bars were patented or part of patented reinforcing systems. The term “low bond” is used to distinguish these bars from the “high bond” deformation type of reinforcing steel that became commonplace in 1947 and is basically unchanged to the present day (CRSI, 2001). Information useful to the evaluation of older reinforced concrete structures can be found in CRSI (2001).
D-4
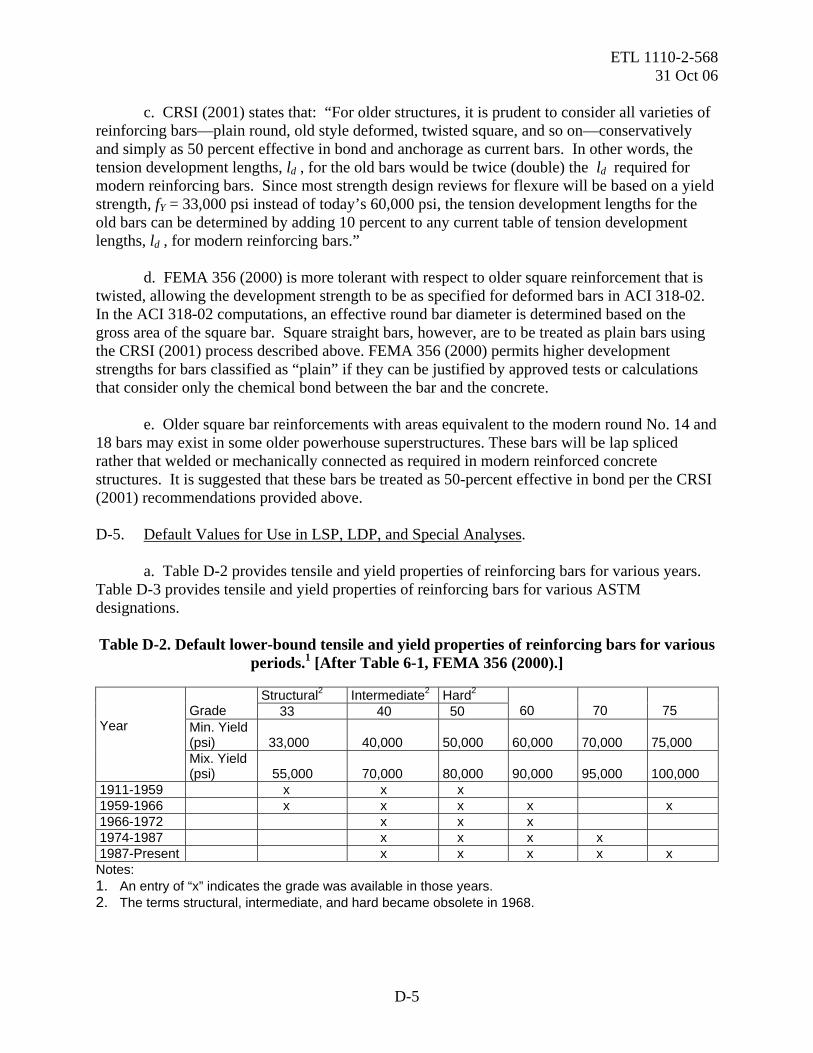
ETL 1110-2-568 31 Oct 06
c. CRSI (2001) states that: “For older structures, it is prudent to consider all varieties of reinforcing bars—plain round, old style deformed, twisted square, and so on—conservatively and simply as 50 percent effective in bond and anchorage as current bars. In other words, the tension development lengths, ld , for the old bars would be twice (double) the ld required for modern reinforcing bars. Since most strength design reviews for flexure will be based on a yield strength, fY = 33,000 psi instead of today’s 60,000 psi, the tension development lengths for the old bars can be determined by adding 10 percent to any current table of tension development lengths, ld , for modern reinforcing bars.” d. FEMA 356 (2000) is more tolerant with respect to older square reinforcement that is twisted, allowing the development strength to be as specified for deformed bars in ACI 318-02. In the ACI 318-02 computations, an effective round bar diameter is determined based on the gross area of the square bar. Square straight bars, however, are to be treated as plain bars using the CRSI (2001) process described above. FEMA 356 (2000) permits higher development strengths for bars classified as “plain” if they can be justified by approved tests or calculations that consider only the chemical bond between the bar and the concrete. e. Older square bar reinforcements with areas equivalent to the modern round No. 14 and 18 bars may exist in some older powerhouse superstructures. These bars will be lap spliced rather that welded or mechanically connected as required in modern reinforced concrete structures. It is suggested that these bars be treated as 50-percent effective in bond per the CRSI (2001) recommendations provided above. D-5. Default Values for Use in LSP, LDP, and Special Analyses. a. Table D-2 provides tensile and yield properties of reinforcing bars for various years. Table D-3 provides tensile and yield properties of reinforcing bars for various ASTM designations. Table D-2. Default lower-bound tensile and yield properties of reinforcing bars for various
periods.1 [After Table 6-1, FEMA 356 (2000).]
Structural2 Intermediate2 Hard2 Grade 33 40 50
60
70
75
Min. Yield (psi)
33,000
40,000
50,000
60,000
70,000
75,000
Year
Mix. Yield (psi)
55,000
70,000
80,000
90,000
95,000
100,000
1911-1959 x x x 1959-1966 x x x x x 1966-1972 x x x 1974-1987 x x x x 1987-Present x x x x x
Notes: 1. An entry of “x” indicates the grade was available in those years. 2. The terms structural, intermediate, and hard became obsolete in 1968.
D-5

ETL 1110-2-568 31 Oct 06 Table D-3. Default lower-bound tensile and yield properties of reinforcing bars for ASTM
specifications and periods.1 [After Table 6-2, FEMA 356 (2000).]
Struct.2 Inter.2 Hard2
ASTM Grade
33
40
50
60
70
75
Min. Yield (psi)
33,000
40,000
50,000
ASTM Desig.5
Steel Type
Year Range
Min. Tensile (psi)
55,000
70,000
80,000
90,000
95,000
100,000
A15 Billet 1911-1966
x x x
A16 Rail3 1913-1966
x
A61 Rail3 1963-1966
x
A160 Axle 1936-1964
x x x
A160 Axle 1965-1966
x x x x
A408 Billet 1957-1966
x x x
A431 Billet 1959-1966
x
A432 Billet 1959-1966
x
A615 Billet 1968-1972
x x x
A615 Billet 1974-1986
x x
A615 Billet 1987-1997
x x x
A6164 Rail3 1968-1997
x x
A617 Axle 1968-1997
x x
A706 Low-Alloy
1974-1997
x
A955 Stain-less
1996-1997
x x x
Notes: 1. An entry of “x” indicates the grade was available in those years. 2. The terms structural, intermediate and hard became obsolete in 1968. 3. Rail bars are marked with the letter “R.” 4. Bars marked “s” (ASTM 616) have supplementary requirements for bend tests. 5. ASTM steel is marked with the letter “W.”
D-6
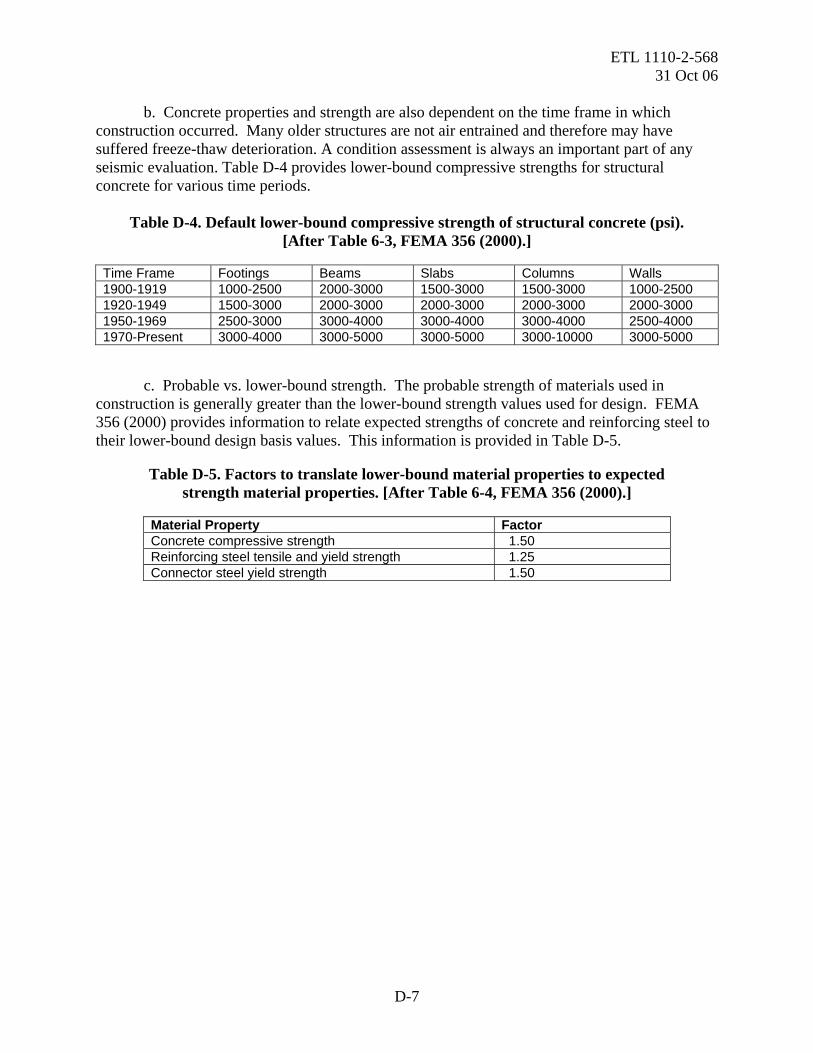
ETL 1110-2-568 31 Oct 06
b. Concrete properties and strength are also dependent on the time frame in which construction occurred. Many older structures are not air entrained and therefore may have suffered freeze-thaw deterioration. A condition assessment is always an important part of any seismic evaluation. Table D-4 provides lower-bound compressive strengths for structural concrete for various time periods.
Table D-4. Default lower-bound compressive strength of structural concrete (psi). [After Table 6-3, FEMA 356 (2000).]
Time Frame Footings Beams Slabs Columns Walls 1900-1919 1000-2500 2000-3000 1500-3000 1500-3000 1000-2500 1920-1949 1500-3000 2000-3000 2000-3000 2000-3000 2000-3000 1950-1969 2500-3000 3000-4000 3000-4000 3000-4000 2500-4000 1970-Present 3000-4000 3000-5000 3000-5000 3000-10000 3000-5000
c. Probable vs. lower-bound strength. The probable strength of materials used in construction is generally greater than the lower-bound strength values used for design. FEMA 356 (2000) provides information to relate expected strengths of concrete and reinforcing steel to their lower-bound design basis values. This information is provided in Table D-5.
Table D-5. Factors to translate lower-bound material properties to expected strength material properties. [After Table 6-4, FEMA 356 (2000).]
Material Property Factor Concrete compressive strength 1.50 Reinforcing steel tensile and yield strength 1.25 Connector steel yield strength 1.50
D-7
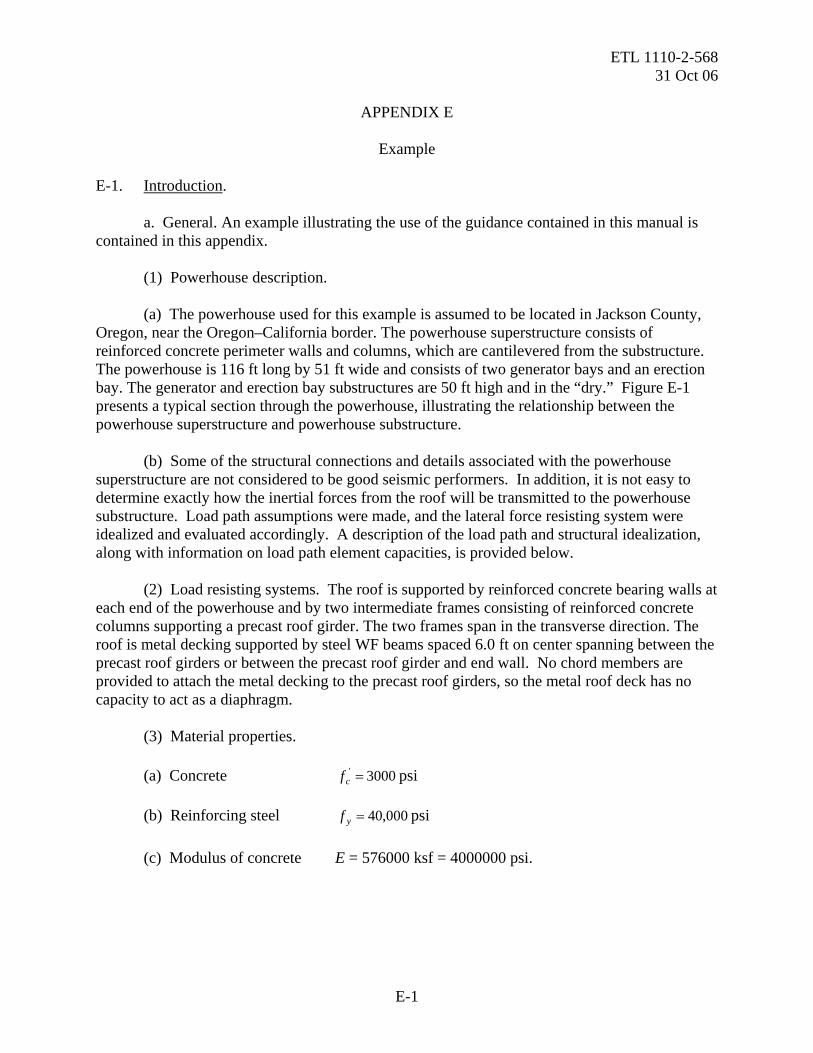
ETL 1110-2-568 31 Oct 06
APPENDIX E
Example
E-1. Introduction. a. General. An example illustrating the use of the guidance contained in this manual is contained in this appendix. (1) Powerhouse description. (a) The powerhouse used for this example is assumed to be located in Jackson County, Oregon, near the Oregon–California border. The powerhouse superstructure consists of reinforced concrete perimeter walls and columns, which are cantilevered from the substructure. The powerhouse is 116 ft long by 51 ft wide and consists of two generator bays and an erection bay. The generator and erection bay substructures are 50 ft high and in the “dry.” Figure E-1 presents a typical section through the powerhouse, illustrating the relationship between the powerhouse superstructure and powerhouse substructure. (b) Some of the structural connections and details associated with the powerhouse superstructure are not considered to be good seismic performers. In addition, it is not easy to determine exactly how the inertial forces from the roof will be transmitted to the powerhouse substructure. Load path assumptions were made, and the lateral force resisting system were idealized and evaluated accordingly. A description of the load path and structural idealization, along with information on load path element capacities, is provided below. (2) Load resisting systems. The roof is supported by reinforced concrete bearing walls at each end of the powerhouse and by two intermediate frames consisting of reinforced concrete columns supporting a precast roof girder. The two frames span in the transverse direction. The roof is metal decking supported by steel WF beams spaced 6.0 ft on center spanning between the precast roof girders or between the precast roof girder and end wall. No chord members are provided to attach the metal decking to the precast roof girders, so the metal roof deck has no capacity to act as a diaphragm. (3) Material properties. (a) Concrete psi 3000' =cf (b) Reinforcing steel 000,40=yf psi (c) Modulus of concrete E = 576000 ksf = 4000000 psi.
E-1
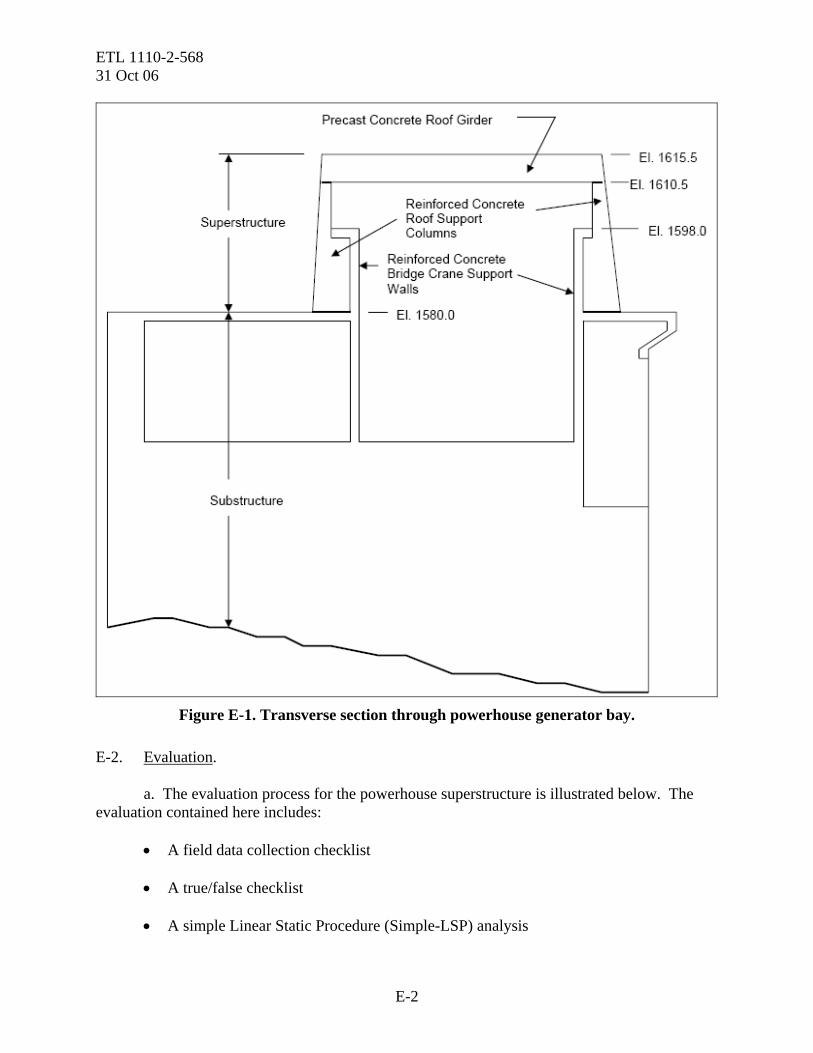
ETL 1110-2-568 31 Oct 06
Figure E-1. Transverse section through powerhouse generator bay.
E-2. Evaluation. a. The evaluation process for the powerhouse superstructure is illustrated below. The evaluation contained here includes:
• A field data collection checklist
• A true/false checklist
• A simple Linear Static Procedure (Simple-LSP) analysis
E-2
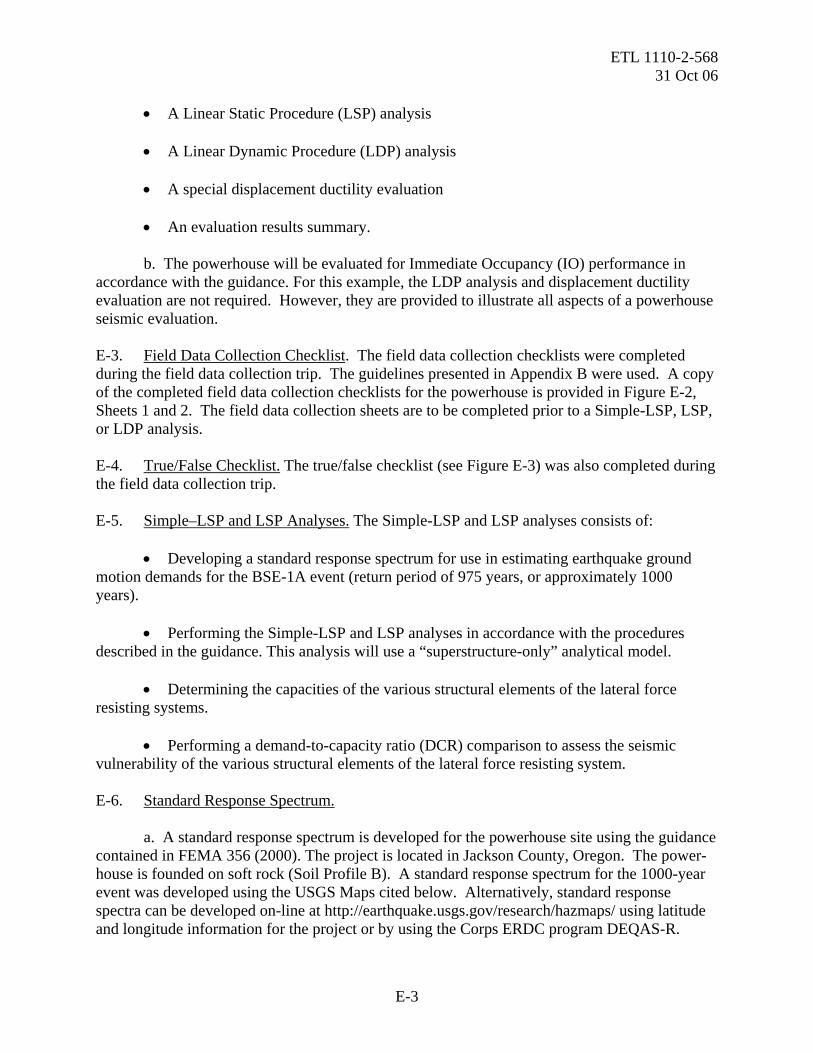
ETL 1110-2-568 31 Oct 06
• A Linear Static Procedure (LSP) analysis
• A Linear Dynamic Procedure (LDP) analysis
• A special displacement ductility evaluation
• An evaluation results summary.
b. The powerhouse will be evaluated for Immediate Occupancy (IO) performance in accordance with the guidance. For this example, the LDP analysis and displacement ductility evaluation are not required. However, they are provided to illustrate all aspects of a powerhouse seismic evaluation. E-3. Field Data Collection Checklist. The field data collection checklists were completed during the field data collection trip. The guidelines presented in Appendix B were used. A copy of the completed field data collection checklists for the powerhouse is provided in Figure E-2, Sheets 1 and 2. The field data collection sheets are to be completed prior to a Simple-LSP, LSP, or LDP analysis. E-4. True/False Checklist. The true/false checklist (see Figure E-3) was also completed during the field data collection trip. E-5. Simple–LSP and LSP Analyses. The Simple-LSP and LSP analyses consists of:
• Developing a standard response spectrum for use in estimating earthquake ground motion demands for the BSE-1A event (return period of 975 years, or approximately 1000 years).
• Performing the Simple-LSP and LSP analyses in accordance with the procedures
described in the guidance. This analysis will use a “superstructure-only” analytical model. • Determining the capacities of the various structural elements of the lateral force
resisting systems. • Performing a demand-to-capacity ratio (DCR) comparison to assess the seismic
vulnerability of the various structural elements of the lateral force resisting system. E-6. Standard Response Spectrum. a. A standard response spectrum is developed for the powerhouse site using the guidance contained in FEMA 356 (2000). The project is located in Jackson County, Oregon. The power-house is founded on soft rock (Soil Profile B). A standard response spectrum for the 1000-year event was developed using the USGS Maps cited below. Alternatively, standard response spectra can be developed on-line at http://earthquake.usgs.gov/research/hazmaps/ using latitude and longitude information for the project or by using the Corps ERDC program DEQAS-R.
E-3

ETL 1110-2-568 31 Oct 06
Project Name: Unnamed Location Oregon (State) Powerhouse ID: None Jackson (County) Performance Level: IO Investigator(s): RWS Date: 3/6/97 Document Availability Seismicity and Site Class Design Drawings: Yes Site Class: Soft Rock - B Shop Drawings: No Earthquake Exposure: No Info Specifications: Yes Structural Design Analysis: No Geotechnical Report: Yes Powerhouse Superstructure Usage Powerhouse occupied more than 2 hours per day. Y√ N Number of Occupants: 1 (powerhouse operator) Powerhouse operated from a remote location. Y N√ Describe remote location. General Condition: Excellent Visible general deterioration: None Specific deterioration of structural systems: by alterations or removal: No by prior earthquake: No by fire: No other: No Structural alterations or additions: None
Figure E-2. Field data evaluation checklist.
E-4
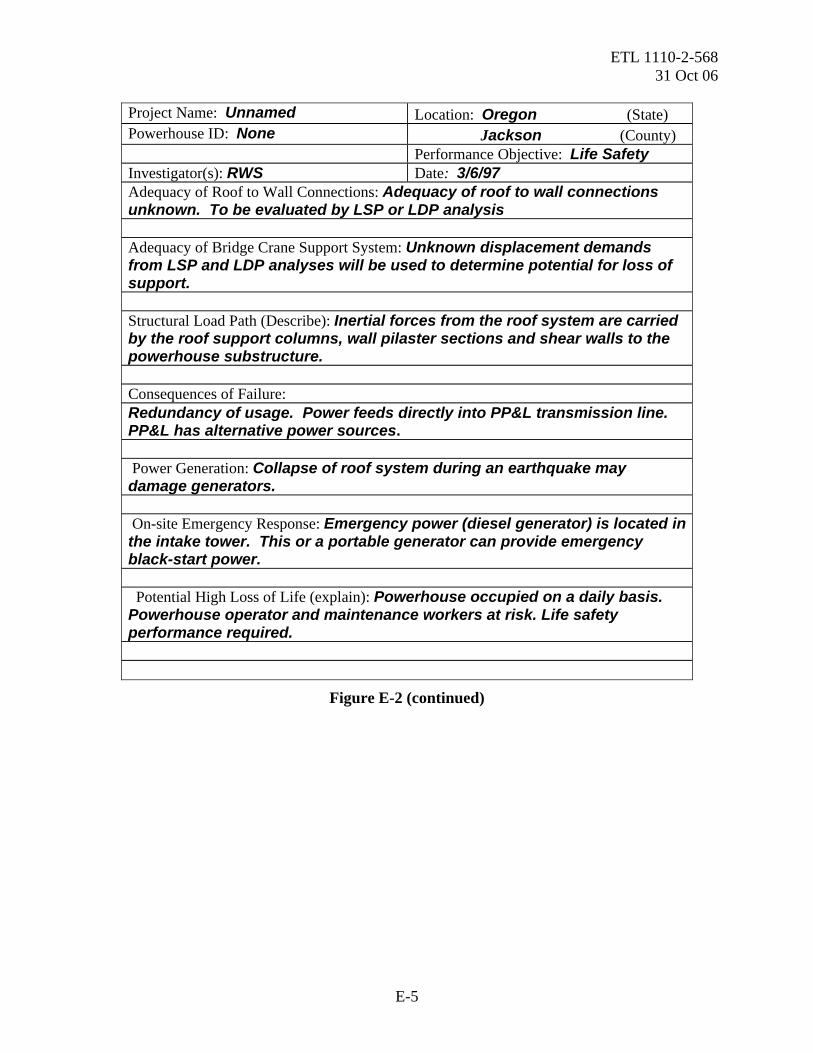
ETL 1110-2-568 31 Oct 06
Project Name: Unnamed Location: Oregon (State) Powerhouse ID: None Jackson (County) Performance Objective: Life Safety Investigator(s): RWS Date: 3/6/97 Adequacy of Roof to Wall Connections: Adequacy of roof to wall connections unknown. To be evaluated by LSP or LDP analysis Adequacy of Bridge Crane Support System: Unknown displacement demands from LSP and LDP analyses will be used to determine potential for loss of support. Structural Load Path (Describe): Inertial forces from the roof system are carried by the roof support columns, wall pilaster sections and shear walls to the powerhouse substructure. Consequences of Failure: Redundancy of usage. Power feeds directly into PP&L transmission line. PP&L has alternative power sources. Power Generation: Collapse of roof system during an earthquake may damage generators. On-site Emergency Response: Emergency power (diesel generator) is located in the intake tower. This or a portable generator can provide emergency black-start power. Potential High Loss of Life (explain): Powerhouse occupied on a daily basis. Powerhouse operator and maintenance workers at risk. Life safety performance required.
Figure E-2 (continued)
E-5
ETL 1110-2-568 31 Oct 06
LATERAL FORCE RESISTING SYSTEM T √ F LOAD PATH: The structure contains a complete load path for seismic force effects
from any horizontal direction that serves to transfer the inertial forces from the mass to the foundation. (NOTE: Write a brief description of this linkage for each principal direction.) Interior roof support columns and shear walls carry inertial forces in the transverse direction. Roof support columns (above El. 1598) carry inertial forces in the longitudinal direction.
T F √ REDUNDANCY: The structure will remain laterally stable after the failure of any
single element. Failure of roof support columns will lead to collapse of the roof system.
T √ F GEOMETRY: There are no significant geometrical irregularities; there are no
setbacks (i.e., no changes in horizontal dimension of the lateral-force resisting system of more than 30 percent from one powerhouse bay relative to the adjacent powerhouse bays.
T √ F MASS: There are no significant mass irregularities; there is no change of effective
mass of more than 50 percent from one powerhouse bay relative to the adjacent powerhouse bays.
T √ F VERTICAL IRREGULARITIES: Walls that comprise the lateral force resisting
system of the powerhouse superstructure are continuous from the roof to the substructure.
T √ F DETERIORATION OF CONCRETE: There is no visible deterioration of concrete
or reinforcing steel in the walls that comprise the lateral force resisting system of the powerhouse superstructure.
T √ F CRACKED SECTION MOMENT CAPACITY: The cracked section moment
capacity is greater than 2 times the cracking moment. (This is generally true if the percentage of reinforcement exceeds 0.5 percent). 0.8% longitudinal steel in the roof support columns > 0.5%.
Figure E-3. True/false checklist.
(1) Project data. (a) Project Name: Unnamed. (b) Project Location: Jackson County Oregon (See NEHRP Maps, Figures E-4 through E-7).
E-6
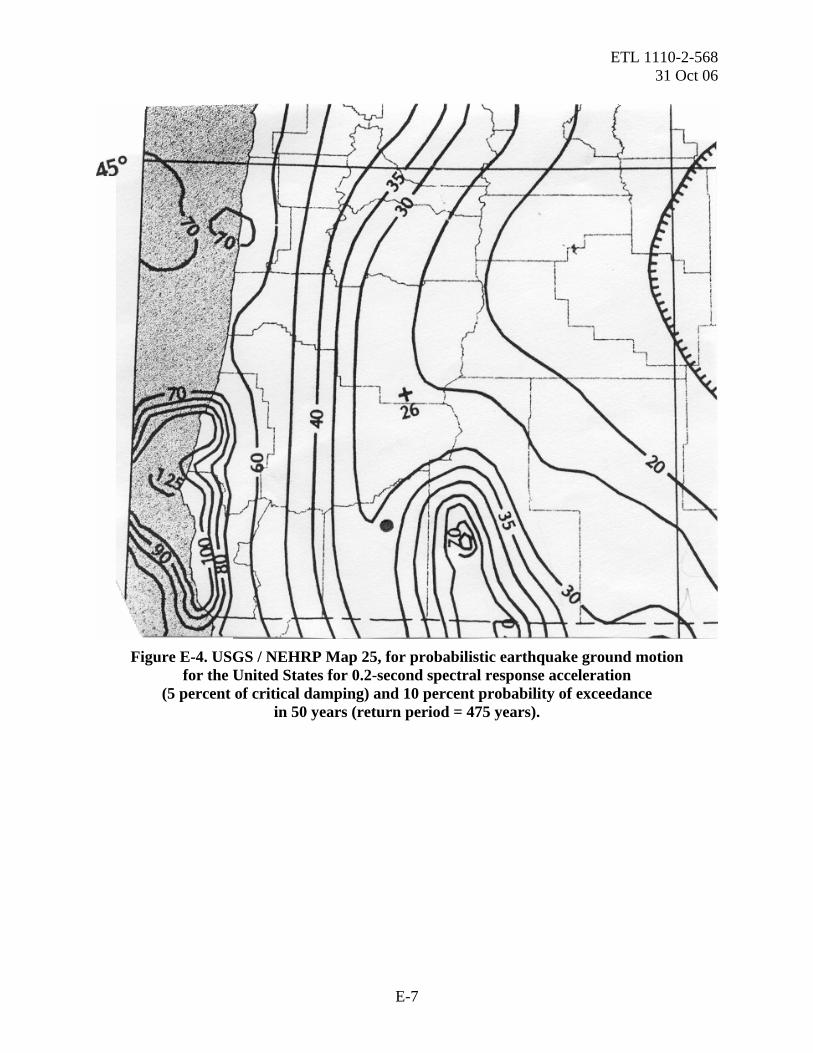
ETL 1110-2-568 31 Oct 06
Figure E-4. USGS / NEHRP Map 25, for probabilistic earthquake ground motion
for the United States for 0.2-second spectral response acceleration (5 percent of critical damping) and 10 percent probability of exceedance
in 50 years (return period = 475 years).
E-7

ETL 1110-2-568 31 Oct 06
Figure E-5. USGS / NEHRP Map 26, for probabilistic earthquake ground motion
for the United States for a 1.0-second spectral response acceleration (5 percent of critical damping) and 10 percent probability of exceedance in 50 years
(return period = 475 years).
E-8
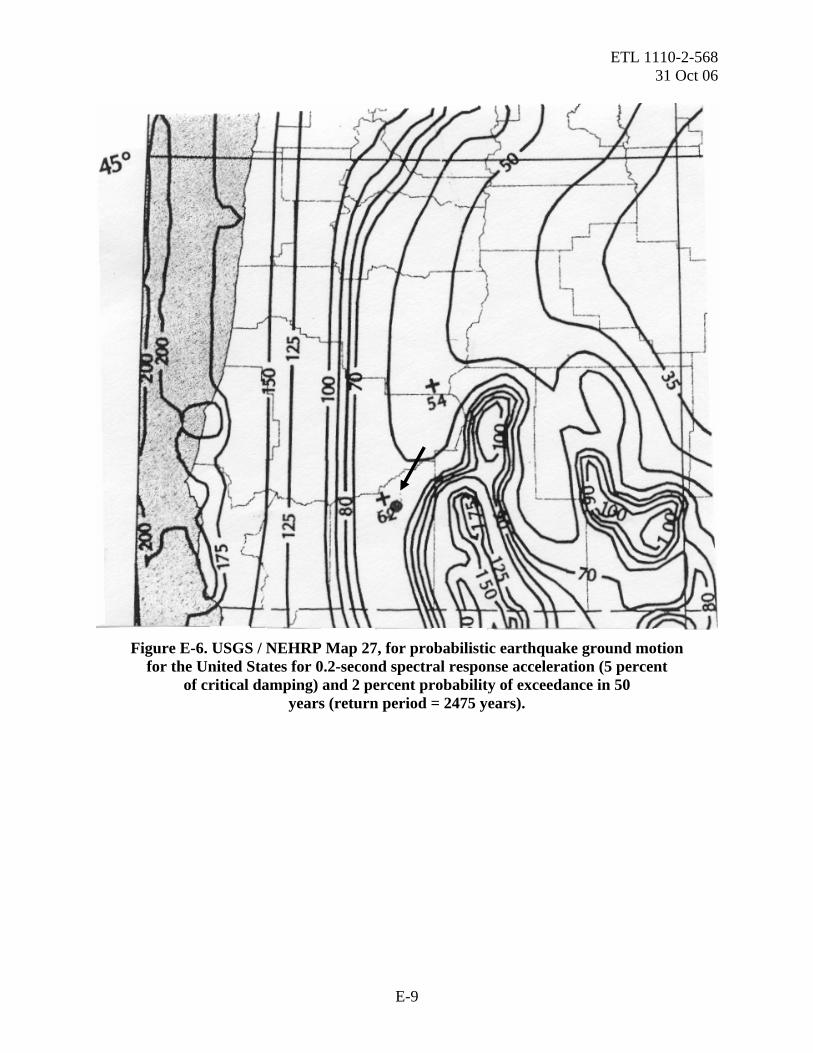
ETL 1110-2-568 31 Oct 06
Figure E-6. USGS / NEHRP Map 27, for probabilistic earthquake ground motion
for the United States for 0.2-second spectral response acceleration (5 percent of critical damping) and 2 percent probability of exceedance in 50
years (return period = 2475 years).
E-9
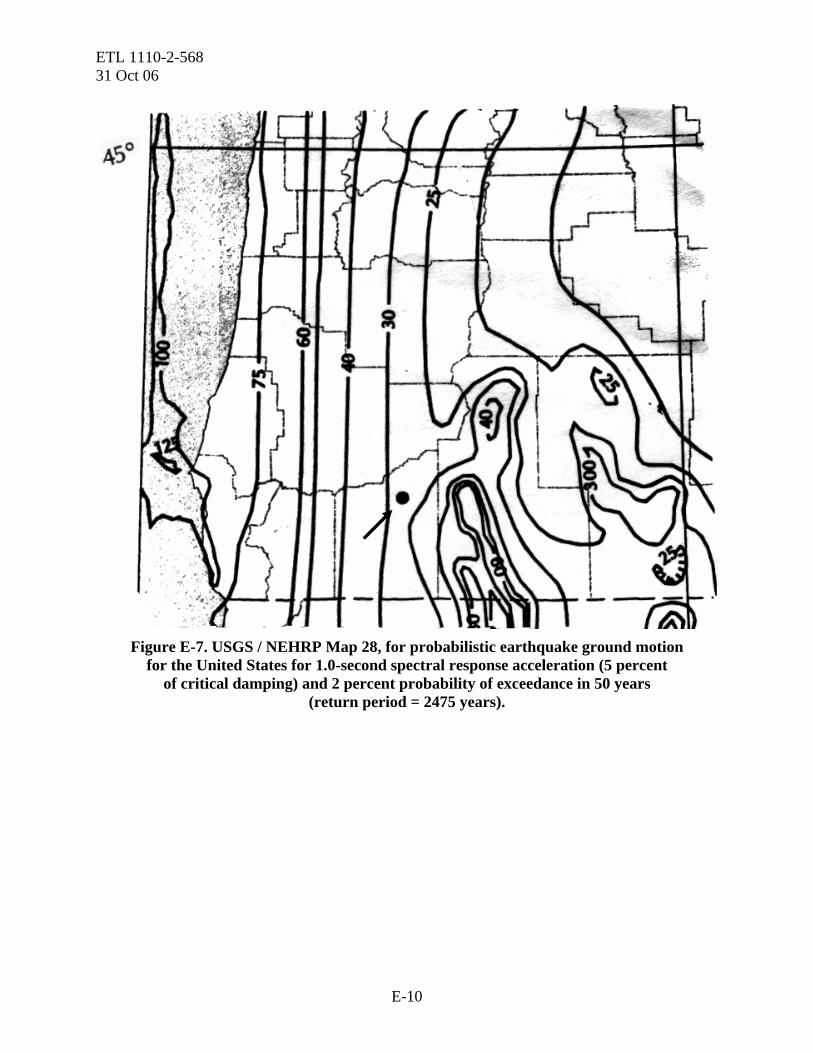
ETL 1110-2-568 31 Oct 06
Figure E-7. USGS / NEHRP Map 28, for probabilistic earthquake ground motion
for the United States for 1.0-second spectral response acceleration (5 percent of critical damping) and 2 percent probability of exceedance in 50 years
(return period = 2475 years).
E-10

ETL 1110-2-568 31 Oct 06
(c) Site Conditions: Soft Rock Foundation, Soil Profile B. (2) Development of standard spectrum for the 1000-year event. (a) Step 1. Obtain spectral acceleration for project from USGS / NEHRP Maps:
• Using USGS Maps 25, 26, 27, and 28 from the NEHRP Recommended Provisions Seismic Regulations for New Buildings (see Figures E-4 through E-7), determine the spectral response accelerations at periods of 0.20 seconds (SS) and 1.00 seconds (S1).
• For a return period (Tr) of 475 years
From NEHRP Map 25, = 0.33g SSFrom NEHRP Map 26, = 0.14g. 1S
• For a return period (Tr) of 2475 years
From NEHRP Map 27, = 0.65g SSFrom NEHRP Map 28, = 0.30g. 1S
(b) Step 2.
• Use FEMA 356 (2000) equations to establish the relationship between return period and spectral acceleration, where LPR as used in the following calculations represents the natural logarithm of the spectral acceleration parameter for either the 0.2-second or 1.0-second period for the earthquake return period under consideration (for this example, a 1000-year event).
E-11
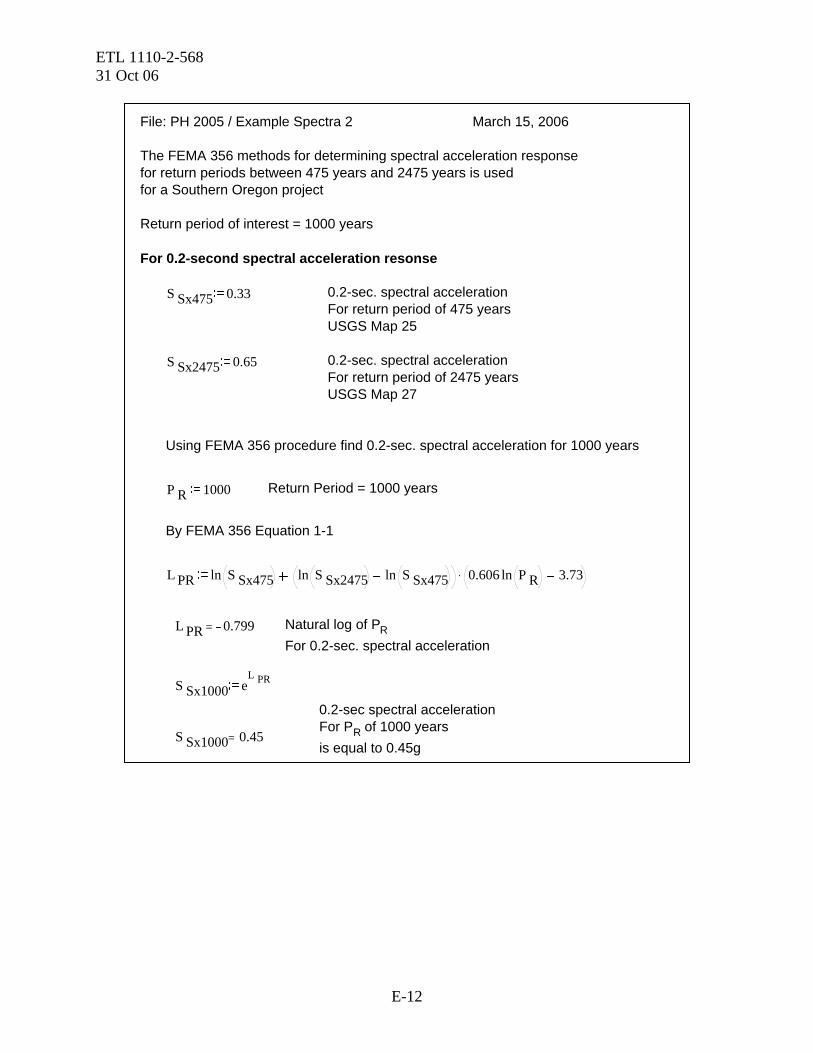
ETL 1110-2-568 31 Oct 06
File: PH 2005 / Example Spectra 2 March 15, 2006
The FEMA 356 methods for determining spectral acceleration responsefor return periods between 475 years and 2475 years is usedfor a Southern Oregon project
Return period of interest = 1000 years
For 0.2-second spectral acceleration resonse
S Sx475 0.33 0.2-sec. spectral acceleration For return period of 475 yearsUSGS Map 25
S Sx2475 0.65 0.2-sec. spectral acceleration For return period of 2475 yearsUSGS Map 27
Using FEMA 356 procedure find 0.2-sec. spectral acceleration for 1000 years
P R 1000 Return Period = 1000 years
By FEMA 356 Equation 1-1
L PR ln S Sx475 ln S Sx2475 ln S Sx475 0.606 ln P R. 3.73.
L PR 0.799= Natural log of PR For 0.2-sec. spectral acceleration
S Sx1000 eL PR
0.2-sec spectral acceleration For PR of 1000 yearsis equal to 0.45g
S Sx1000 0.45=
E-12
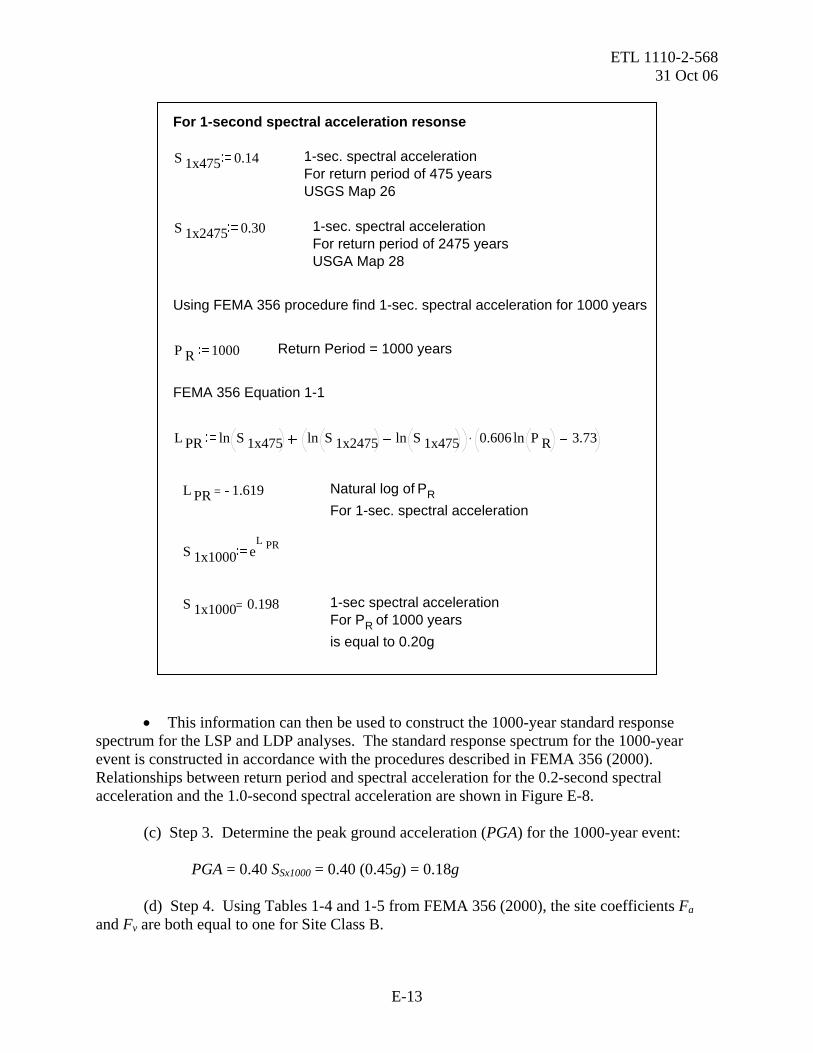
ETL 1110-2-568 31 Oct 06
For 1-second spectral acceleration resonse
S 1x475 0.14 1-sec. spectral acceleration For return period of 475 yearsUSGS Map 26
S 1x2475 0.30 1-sec. spectral acceleration For return period of 2475 yearsUSGA Map 28
Using FEMA 356 procedure find 1-sec. spectral acceleration for 1000 years
P R 1000 Return Period = 1000 years
FEMA 356 Equation 1-1
L PR ln S 1x475 ln S 1x2475 ln S 1x475 0.606 ln P R. 3.73.
L PR 1.619= Natural log of PR For 1-sec. spectral acceleration
S 1x1000 eL PR
S 1x1000 0.198= 1-sec spectral accelerationFor PR of 1000 yearsis equal to 0.20g
• This information can then be used to construct the 1000-year standard response
spectrum for the LSP and LDP analyses. The standard response spectrum for the 1000-year event is constructed in accordance with the procedures described in FEMA 356 (2000). Relationships between return period and spectral acceleration for the 0.2-second spectral acceleration and the 1.0-second spectral acceleration are shown in Figure E-8. (c) Step 3. Determine the peak ground acceleration (PGA) for the 1000-year event: PGA = 0.40 SSx1000 = 0.40 (0.45g) = 0.18g (d) Step 4. Using Tables 1-4 and 1-5 from FEMA 356 (2000), the site coefficients Fa and Fv are both equal to one for Site Class B.
E-13
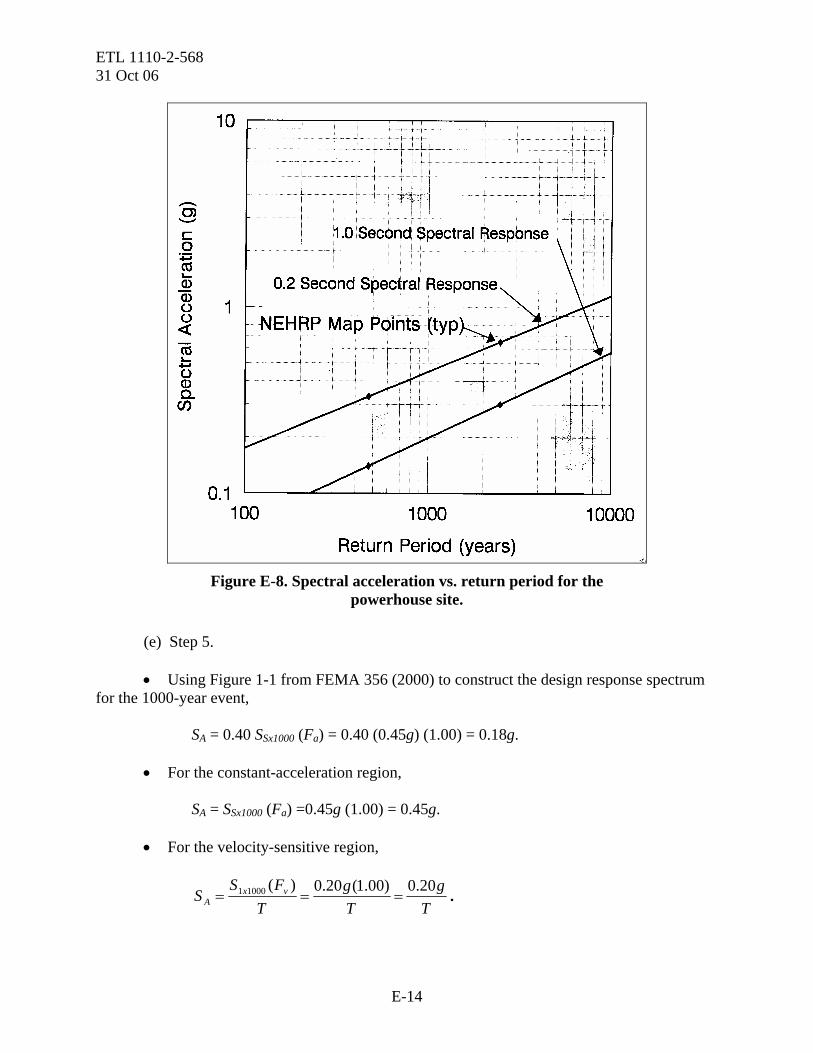
ETL 1110-2-568 31 Oct 06
Figure E-8. Spectral acceleration vs. return period for the
powerhouse site.
(e) Step 5.
• Using Figure 1-1 from FEMA 356 (2000) to construct the design response spectrum for the 1000-year event, SA = 0.40 SSx1000 (Fa) = 0.40 (0.45g) (1.00) = 0.18g.
• For the constant-acceleration region, SA = SSx1000 (Fa) =0.45g (1.00) = 0.45g.
• For the velocity-sensitive region,
T
gTg
TFS
S vxA
20.0)00.1(20.0)(10001 === .
E-14
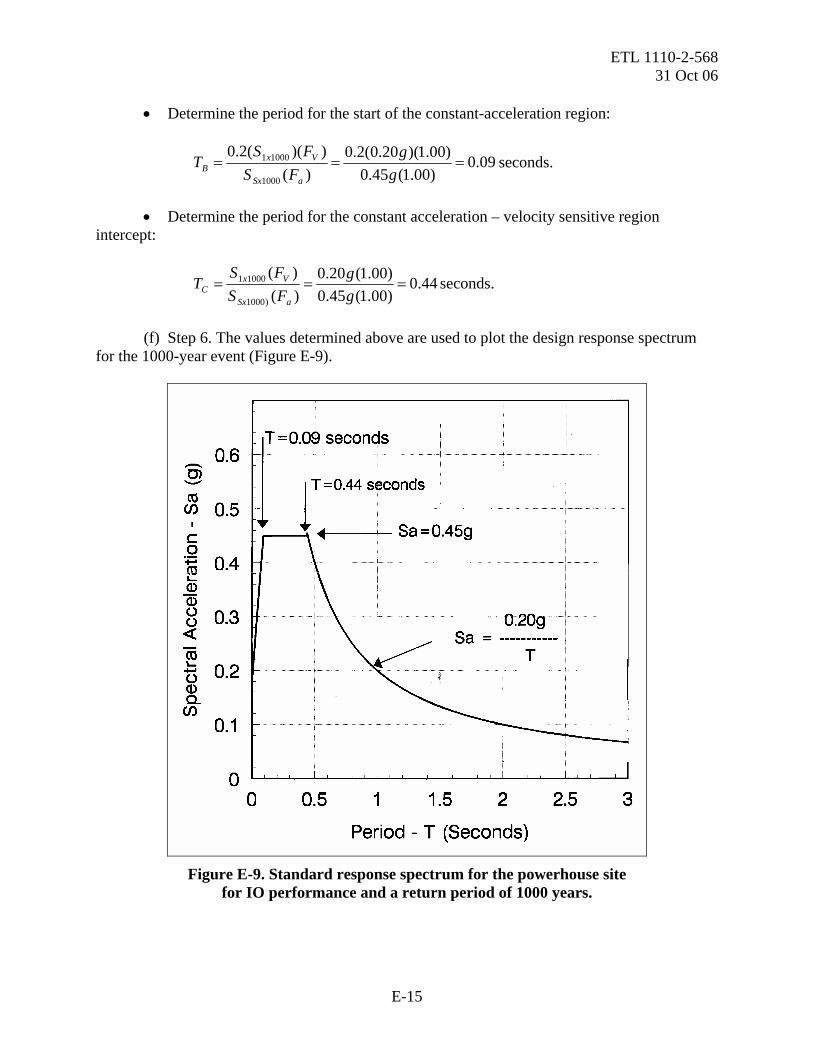
ETL 1110-2-568 31 Oct 06
• Determine the period for the start of the constant-acceleration region:
09.0)00.1(45.0
)00.1)(20.0(2.0)(
))((2.0
1000
10001 ===g
gFS
FST
aSx
VxB seconds.
• Determine the period for the constant acceleration – velocity sensitive region
intercept:
44.0)00.1(45.0)00.1(20.0
)()(
)1000
10001 ===gg
FSFS
TaSx
VxC seconds.
(f) Step 6. The values determined above are used to plot the design response spectrum for the 1000-year event (Figure E-9).
Figure E-9. Standard response spectrum for the powerhouse site
for IO performance and a return period of 1000 years.
E-15
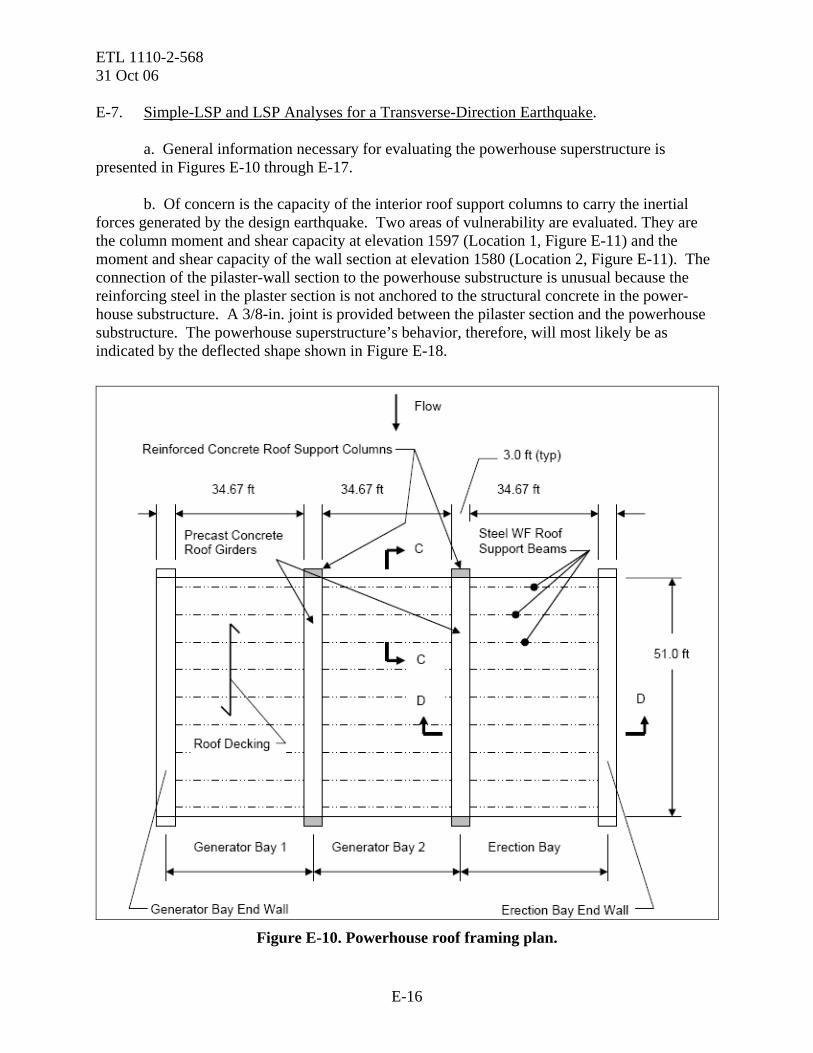
ETL 1110-2-568 31 Oct 06 E-7. Simple-LSP and LSP Analyses for a Transverse-Direction Earthquake. a. General information necessary for evaluating the powerhouse superstructure is presented in Figures E-10 through E-17. b. Of concern is the capacity of the interior roof support columns to carry the inertial forces generated by the design earthquake. Two areas of vulnerability are evaluated. They are the column moment and shear capacity at elevation 1597 (Location 1, Figure E-11) and the moment and shear capacity of the wall section at elevation 1580 (Location 2, Figure E-11). The connection of the pilaster-wall section to the powerhouse substructure is unusual because the reinforcing steel in the plaster section is not anchored to the structural concrete in the power-house substructure. A 3/8-in. joint is provided between the pilaster section and the powerhouse substructure. The powerhouse superstructure’s behavior, therefore, will most likely be as indicated by the deflected shape shown in Figure E-18.
Figure E-10. Powerhouse roof framing plan.
E-16

ETL 1110-2-568 31 Oct 06
Figure E-11. Powerhouse section C-C.
E-17
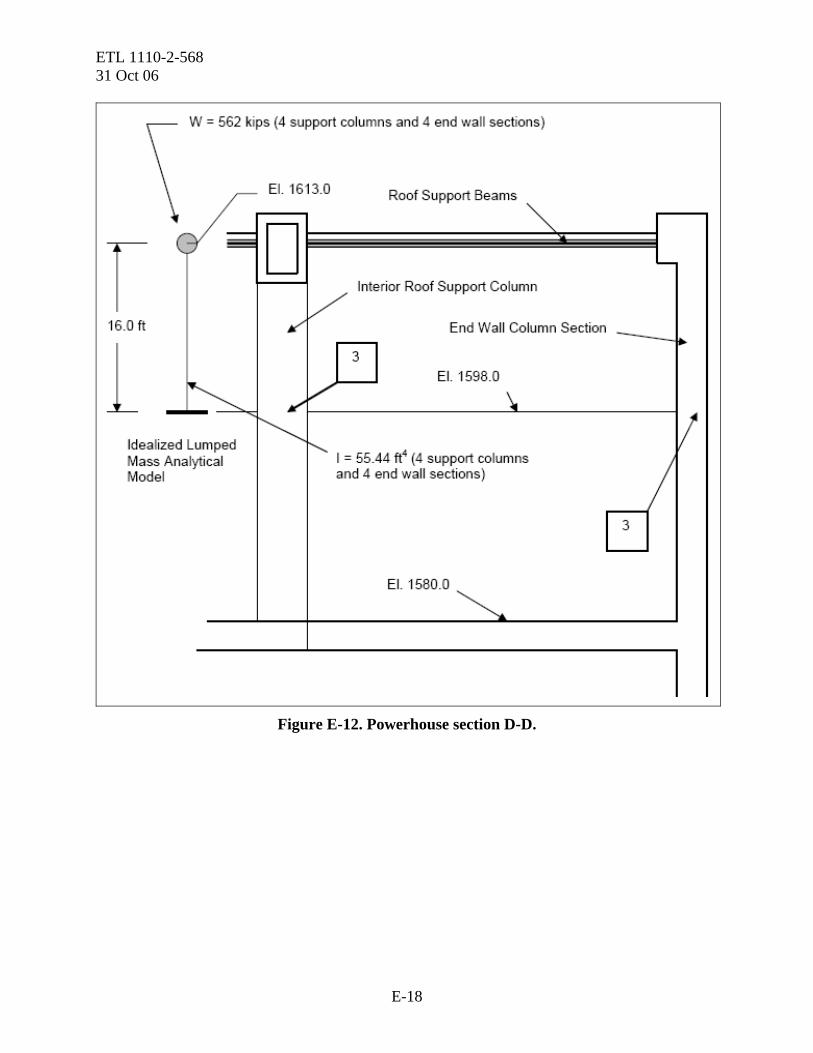
ETL 1110-2-568 31 Oct 06
Figure E-12. Powerhouse section D-D.
E-18

ETL 1110-2-568 31 Oct 06
Figure E-13. Powerhouse column section properties above elevation 1597.0.
E-19

ETL 1110-2-568 31 Oct 06
Figure E-14. Powerhouse pilaster section properties below elevation 1597.0.
E-20
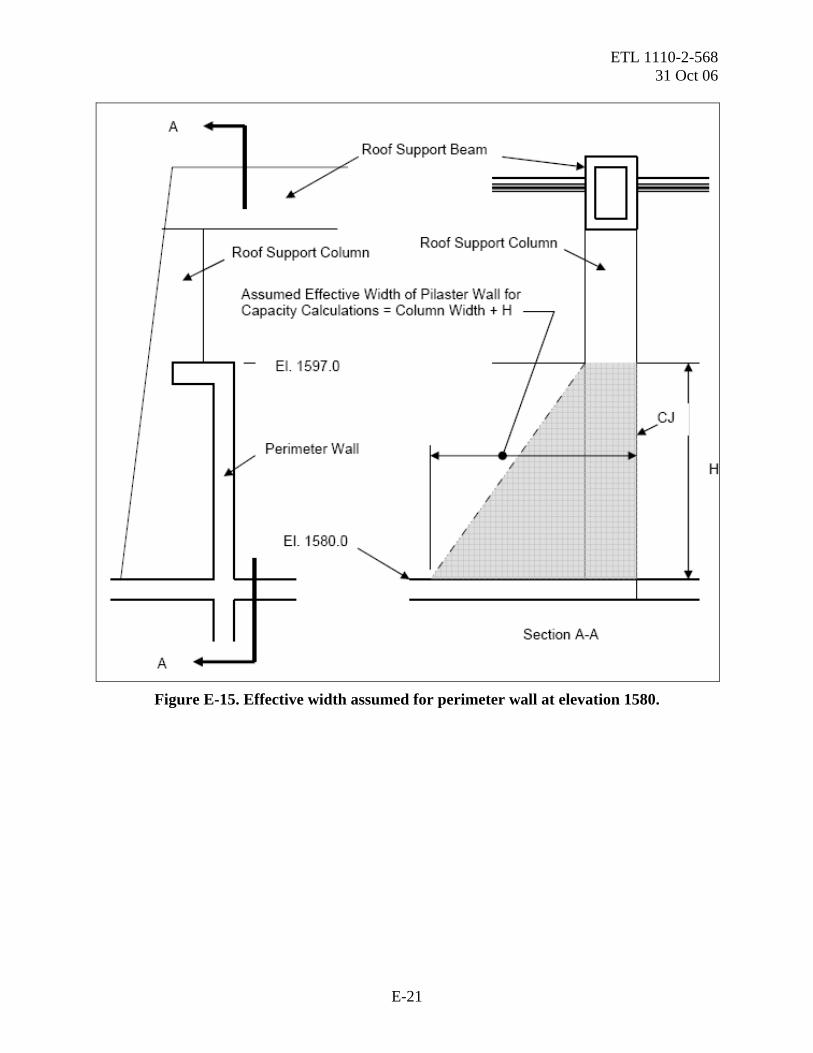
ETL 1110-2-568 31 Oct 06
Figure E-15. Effective width assumed for perimeter wall at elevation 1580.
E-21
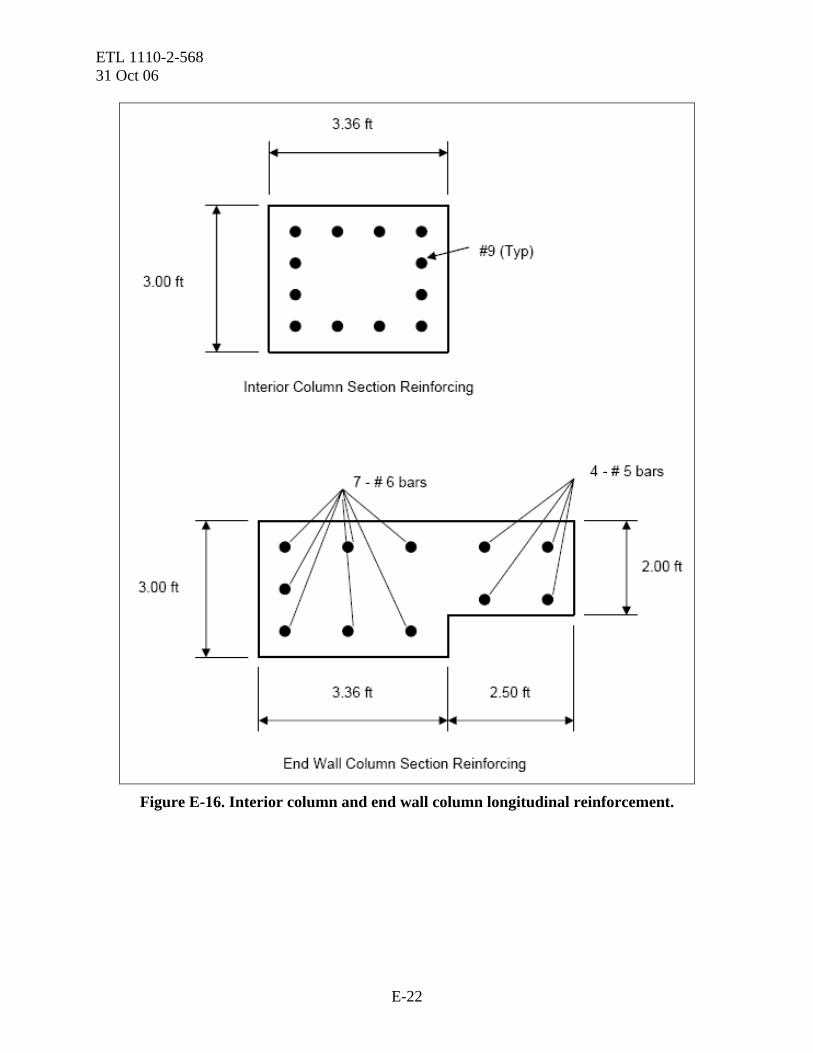
ETL 1110-2-568 31 Oct 06
Figure E-16. Interior column and end wall column longitudinal reinforcement.
E-22
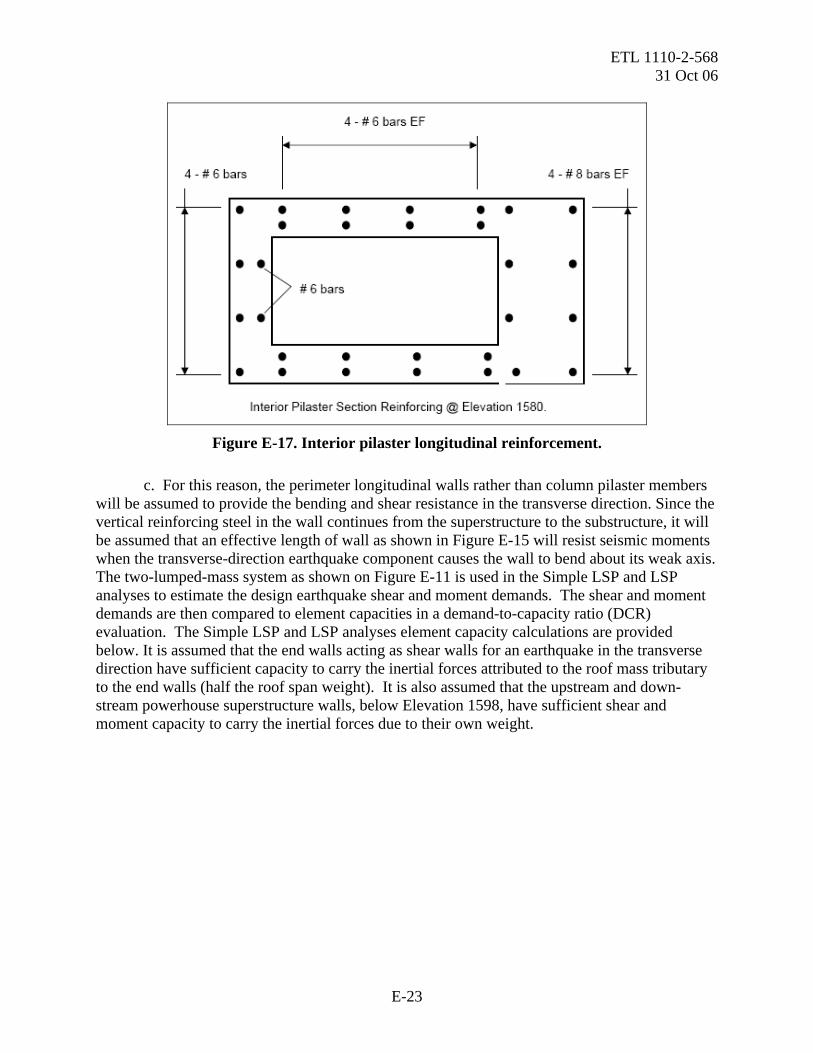
ETL 1110-2-568 31 Oct 06
Figure E-17. Interior pilaster longitudinal reinforcement.
c. For this reason, the perimeter longitudinal walls rather than column pilaster members will be assumed to provide the bending and shear resistance in the transverse direction. Since the vertical reinforcing steel in the wall continues from the superstructure to the substructure, it will be assumed that an effective length of wall as shown in Figure E-15 will resist seismic moments when the transverse-direction earthquake component causes the wall to bend about its weak axis. The two-lumped-mass system as shown on Figure E-11 is used in the Simple LSP and LSP analyses to estimate the design earthquake shear and moment demands. The shear and moment demands are then compared to element capacities in a demand-to-capacity ratio (DCR) evaluation. The Simple LSP and LSP analyses element capacity calculations are provided below. It is assumed that the end walls acting as shear walls for an earthquake in the transverse direction have sufficient capacity to carry the inertial forces attributed to the roof mass tributary to the end walls (half the roof span weight). It is also assumed that the upstream and down-stream powerhouse superstructure walls, below Elevation 1598, have sufficient shear and moment capacity to carry the inertial forces due to their own weight.
E-23
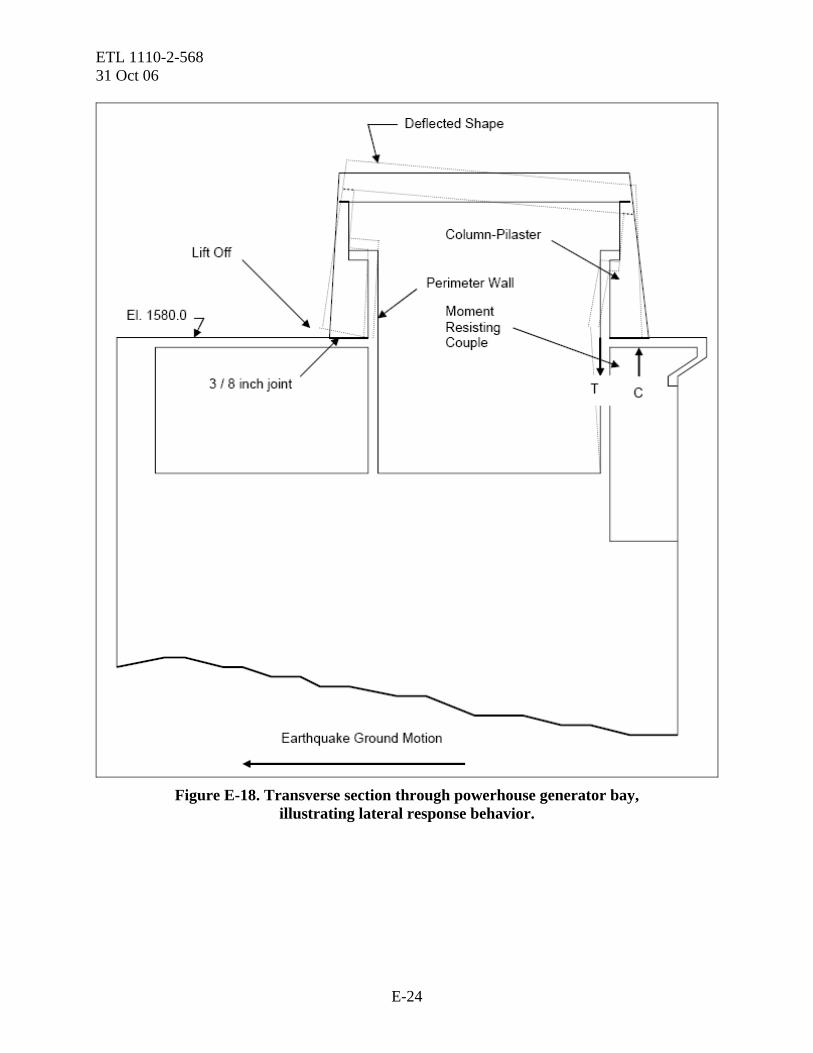
ETL 1110-2-568 31 Oct 06
Figure E-18. Transverse section through powerhouse generator bay,
illustrating lateral response behavior.
E-24
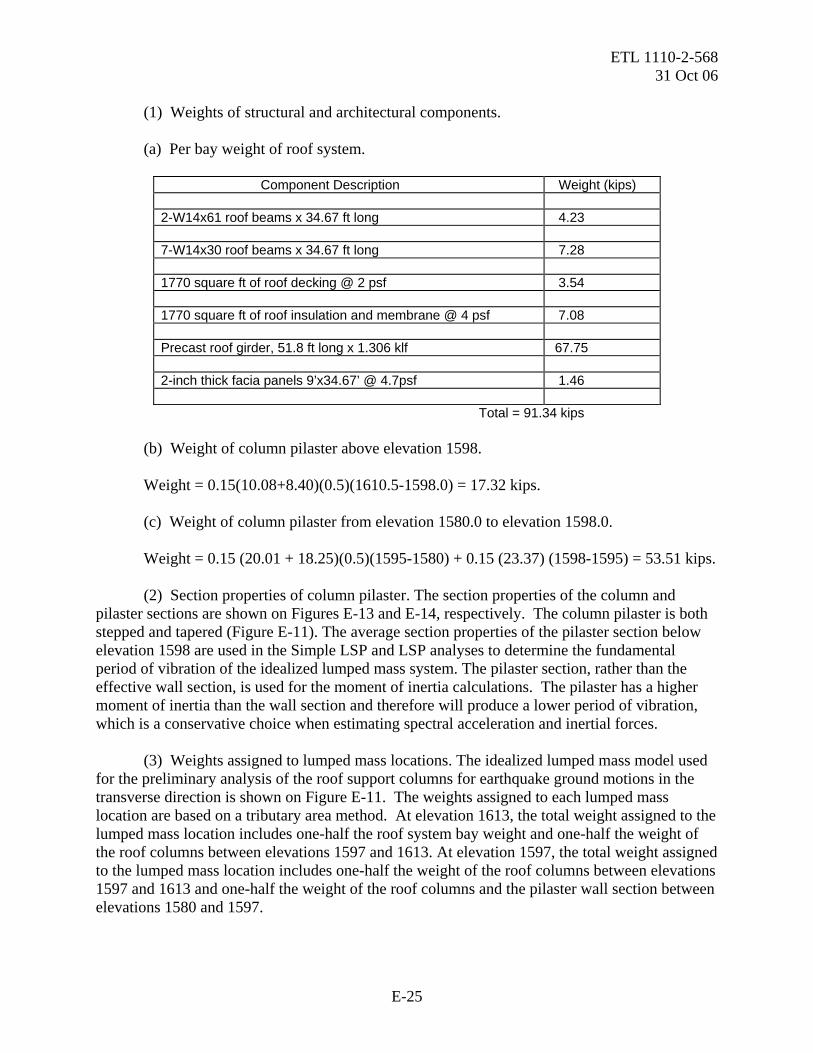
ETL 1110-2-568 31 Oct 06
(1) Weights of structural and architectural components. (a) Per bay weight of roof system.
Component Description Weight (kips) 2-W14x61 roof beams x 34.67 ft long 4.23 7-W14x30 roof beams x 34.67 ft long 7.28 1770 square ft of roof decking @ 2 psf 3.54 1770 square ft of roof insulation and membrane @ 4 psf 7.08 Precast roof girder, 51.8 ft long x 1.306 klf 67.75 2-inch thick facia panels 9’x34.67’ @ 4.7psf 1.46
Total = 91.34 kips (b) Weight of column pilaster above elevation 1598. Weight = 0.15(10.08+8.40)(0.5)(1610.5-1598.0) = 17.32 kips. (c) Weight of column pilaster from elevation 1580.0 to elevation 1598.0. Weight = 0.15 (20.01 + 18.25)(0.5)(1595-1580) + 0.15 (23.37) (1598-1595) = 53.51 kips. (2) Section properties of column pilaster. The section properties of the column and pilaster sections are shown on Figures E-13 and E-14, respectively. The column pilaster is both stepped and tapered (Figure E-11). The average section properties of the pilaster section below elevation 1598 are used in the Simple LSP and LSP analyses to determine the fundamental period of vibration of the idealized lumped mass system. The pilaster section, rather than the effective wall section, is used for the moment of inertia calculations. The pilaster has a higher moment of inertia than the wall section and therefore will produce a lower period of vibration, which is a conservative choice when estimating spectral acceleration and inertial forces. (3) Weights assigned to lumped mass locations. The idealized lumped mass model used for the preliminary analysis of the roof support columns for earthquake ground motions in the transverse direction is shown on Figure E-11. The weights assigned to each lumped mass location are based on a tributary area method. At elevation 1613, the total weight assigned to the lumped mass location includes one-half the roof system bay weight and one-half the weight of the roof columns between elevations 1597 and 1613. At elevation 1597, the total weight assigned to the lumped mass location includes one-half the weight of the roof columns between elevations 1597 and 1613 and one-half the weight of the roof columns and the pilaster wall section between elevations 1580 and 1597.
E-25

ETL 1110-2-568 31 Oct 06 (4) Vibrational characteristics for column pilaster. The average effective moment of inertia for the pilaster below elevation 1598 is used to determine the stiffness (k) of the idealized lumped mass system. The effective moment of inertia used in stiffness calculations is determined as described in Appendix B. The nominal moment capacity and cracking moment are obtained from moment-curvature analysis, which are presented in subsequent sections of the example problem. For the Simple-LSP and LSP analyses, the effective I is equal to 35% of the gross I. (a) Period of vibration of substructure. The substructure is 50 ft high and in a “dry” condition. Therefore, the period of vibration for the substructure (T1) is estimated (based on information contained in Appendix B) to be:
038.04000000
5050.11 ==T seconds.
(b) Period of vibration for superstructure by Simple-LSP analysis.
• Mathcad calculations are provided below to illustrate the method described in Appendix B to estimate the fundamental period of vibration (T) of the superstructure for a Simple-LSP analysis.
E-26

ETL 1110-2-568 31 Oct 06
he = Effective height to center of sesmic forceEc = Modulus of concreteT = Period of superstructureI = Moment of inertia of lower wall sectionIe = Effective moment of inertia of lower wall sectionk = Stiffness of lower wall sectionw = Weight tributary to wallw1 = Weight tributary to mass point #1w2 = Weight tributary to mass point #2g = Accleration of gravity
Simple-LSP Analysis for Transverse Direction EQ
E c 4000000 lbf
in2. E c 5.76 108. lbf
ft2=
w 1 35420lbf. w 2 54330lbf.
w w 1 w 2 w 8.975 104. lbf=
h 1 17.0 ft. h 2 33 ft.
h ew 1 h 1. w 2 h 2.
wh e 26.686 ft=
I 82.5 ft4. I e 0.35 I. I e 28.875 ft4=
k3 E c. I e.
h e3
k 2.626 106. lbfft
=
T 2 π. wk g.
. T 0.205 s=
• The superstructure-to-substructure period ratio (T/T1) is 0.205 ÷ 0.038 = 5.4 > 3.0, so
amplification effects will be negligible. (c) Period of vibration for superstructure by LSP analysis.
• Calculations are provided below to illustrate the method described in Appendix B to estimate the fundamental period of vibration (T) of the superstructure for an LSP analysis.
E-27
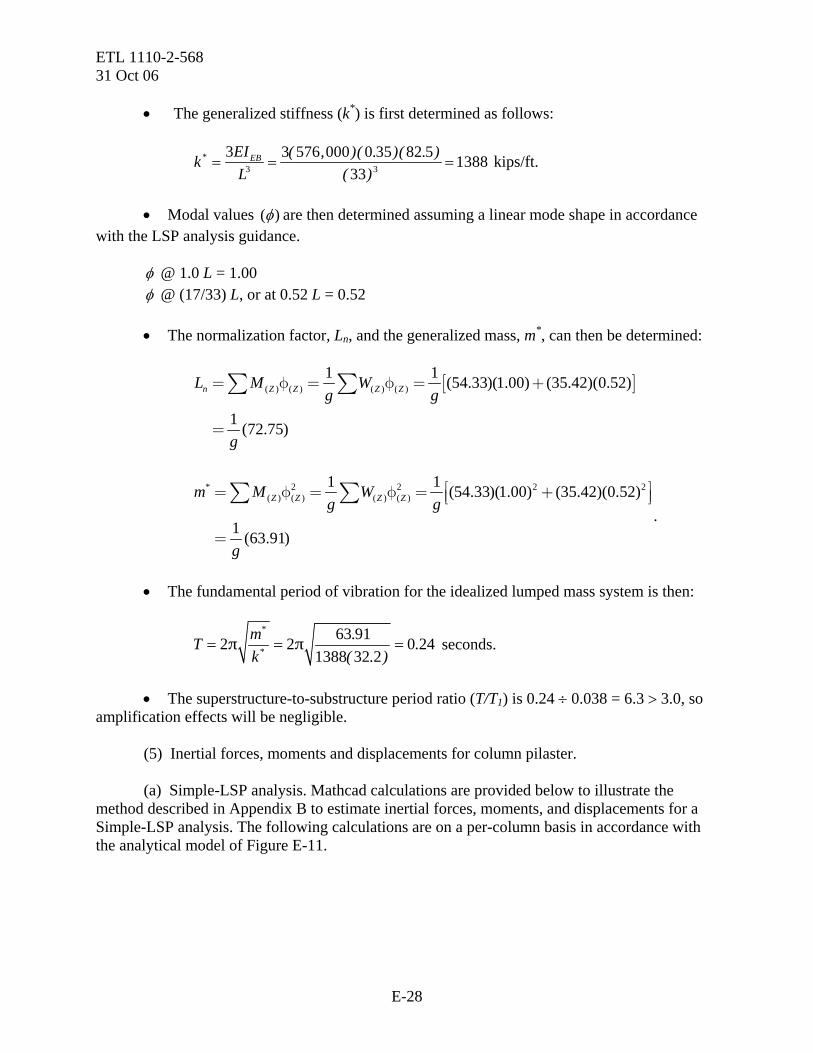
ETL 1110-2-568 31 Oct 06
• The generalized stiffness (k*) is first determined as follows:
3 3
3 3 576 000 0 35 82 5 138833
EBEIkL
* ( , )( . )( . )( )
= = = kips/ft.
• Modal values ( )φ are then determined assuming a linear mode shape in accordance
with the LSP analysis guidance. φ @ 1.0 L = 1.00 φ @ (17/33) L, or at 0.52 L = 0.52
• The normalization factor, Ln, and the generalized mass, m*, can then be determined:
[ ]( ) ( ) ( ) ( )
1 1 (54.33)(1.00) (35.42)(0.52)
1 (72.75)
n Z Z Z ZL M Wg g
g
= φ = φ = +
=
∑ ∑
* 2 2 2( ) ( ) ( ) ( )
1 1 (54.33)(1.00) (35.42)(0.52)
1 (63.91)
Z Z Z Zm M Wg g
g
2⎡ ⎤= φ = φ = +⎢ ⎥⎣ ⎦
=
∑ ∑.
• The fundamental period of vibration for the idealized lumped mass system is then:
63 912 2 01388 32 2
mTk
*
*
..
( . )π π= = = 24 seconds.
• The superstructure-to-substructure period ratio (T/T1) is 0.24 ÷ 0.038 = 6.3 > 3.0, so
amplification effects will be negligible. (5) Inertial forces, moments and displacements for column pilaster. (a) Simple-LSP analysis. Mathcad calculations are provided below to illustrate the method described in Appendix B to estimate inertial forces, moments, and displacements for a Simple-LSP analysis. The following calculations are on a per-column basis in accordance with the analytical model of Figure E-11.
E-28
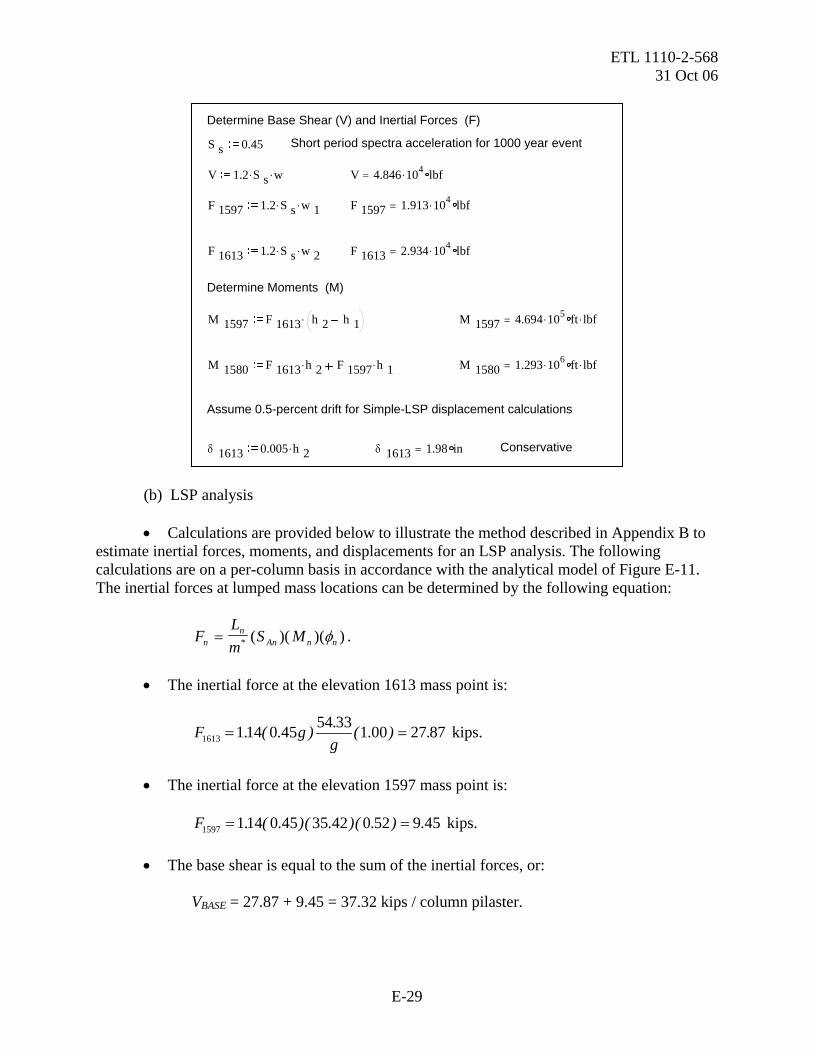
ETL 1110-2-568 31 Oct 06
Determine Base Shear (V) and Inertial Forces (F)
S s 0.45 Short period spectra acceleration for 1000 year event
V 1.2 S s. w. V 4.846 104. lbf=
F 1597 1.2 S s. w 1. F 1597 1.913 104. lbf=
F 1613 1.2 S s. w 2. F 1613 2.934 104. lbf=
Determine Moments (M)
M 1597 F 1613 h 2 h 1. M 1597 4.694 105. ft lbf.=
M 1580 F 1613 h 2. F 1597 h 1. M 1580 1.293 106. ft lbf.=
Assume 0.5-percent drift for Simple-LSP displacement calculations
δ 1613 0.005 h 2. δ 1613 1.98 in= Conservative
(b) LSP analysis
• Calculations are provided below to illustrate the method described in Appendix B to estimate inertial forces, moments, and displacements for an LSP analysis. The following calculations are on a per-column basis in accordance with the analytical model of Figure E-11. The inertial forces at lumped mass locations can be determined by the following equation:
FLm
S Mnn
An n n= * ( )( )(φ ) .
• The inertial force at the elevation 1613 mass point is:
161354 33114 0 45 1 00 27 87F g
g.
. ( . ) ( . ) .= = kips.
• The inertial force at the elevation 1597 mass point is:
kips. 1597 114 0 45 35 42 0 52 9 45F . ( . )( . )( . ) .= =
• The base shear is equal to the sum of the inertial forces, or: VBASE = 27.87 + 9.45 = 37.32 kips / column pilaster.
E-29

ETL 1110-2-568 31 Oct 06
• The moment at elevation 1597 (Location 1, Figure E-12) is: M1597 = 27.87 (16) = 445.9 ft-kips/column.
• The moment at elevation 1580 (Location 2, Figure E-12) is: M1580 = 27.87 (33) + 9.45 (17) = 1080 ft-kips/column.
• The displacements at the mass points can be determined by the following equations:
δ φ=⎛⎝⎜
⎞⎠⎟
Lm
SnD n* , 14.1
91.6375.72
* ==mLn .
• SA for T = 0.28 seconds is 0.45g. See the response spectrum for a 1000-year event
(Figure E-9).
• The spectral displacement, SD, is:
2 20 24 0 45 32 2 0 0212 ft 0 25 in..
2 2D ATS S .
. ( . ) . .π π
⎛ ⎞ ⎛ ⎞= = = =⎜ ⎟ ⎜ ⎟⎝ ⎠ ⎝ ⎠
• The displacement at elevation 1613 assuming an elastic response is:
in. 1613 114 0 25 1 00 0 29. ( . )( . ) .δ = =
• The displacement at elevation 1597 assuming an elastic response is: in. 1597 114 0 25 0 52 015. ( . )( . ) .δ = =
• The displacement of the pilaster column assuming that plastic hinging occurs can be estimated by multiplying the above displacements by C1 × C2. E-8. Simple-LSP and LSP Analyses for a Longitudinal-Direction Earthquake. As with a transverse-direction earthquake, the major concern is the capacity of the roof support columns to carry the inertial forces generated by the design earthquake. The location where the columns are most vulnerable is at elevation 1598 (Location 3, Figure E-12), where the columns frame in to the longitudinal direction superstructure shear walls. An effective section was used to represent the column sections at end wall locations (Figure E-16). A single lumped mass system (single-degree-of-freedom system) is used in a response spectrum analysis to determine design earth-quake elastic shear and moment demands. The single-degree-of-freedom system used is shown on Figure E-12. The shear and moment demands are then compared to element capacities in a demand-to-capacity evaluation. The response spectrum and element capacity calculations are provided in the following paragraphs for the longitudinal-direction earthquake. It is assumed that the superstructure upstream and downstream walls acting as shear walls below elevation 1598,
E-30

ETL 1110-2-568 31 Oct 06
for an earthquake in the longitudinal direction, have sufficient capacity to carry the inertial forces attributed to the roof mass tributary to the end walls. a. Weights of structural and architectural components. (1) Weight of roof system for entire building.
Component Description Weight (kips) 6-W14×61 roof beams × 34.67 ft long 12.69 21-W14×30 roof beams × 34.67 ft long 21.84 5310 square ft of roof decking @ 2 psf 10.62 5310 square ft of roof insulation and membrane @ 4 psf 21.24 2-Precast roof girder, 51.8 ft long × 1.306 klf 135.50 2-inch thick facia panels 9 ft × 104 ft @ 5psf 4.68
Total = 206.57 kips (2) Weight of roof girder support columns between elevation 1598 and elevation 1610.5.
Component Description Weight (kips) 4 - Columns with an average cross sectional area of 9.24 square ft
69.30
Total = 69.30 kips
(3) Weight of generator bay end wall, elevation 1598 to elevation 1615. (The erection bay end wall has the same weight.)
Component Description Weight (kips) 2.0-ft-thick wall × 12.0 ft high × 47.0 ft long 169.20 Roof beam section 3 ft wide × 5 ft high × 52 ft long 117.00 2-Pilasters, 9.24 square ft × 12.5 ft high 34.65
Total = 320.85 kips b. Section properties of roof girder support columns. The section properties of the roof girder support columns relative to earthquake motions in the longitudinal direction are shown on Figure E-13. The column section varies in cross section. The column section is idealized as a uniform section for the Simplified Analysis using average section properties for the sections above elevation 1597. The average section properties are also provided on Figure E-13. The end
E-31
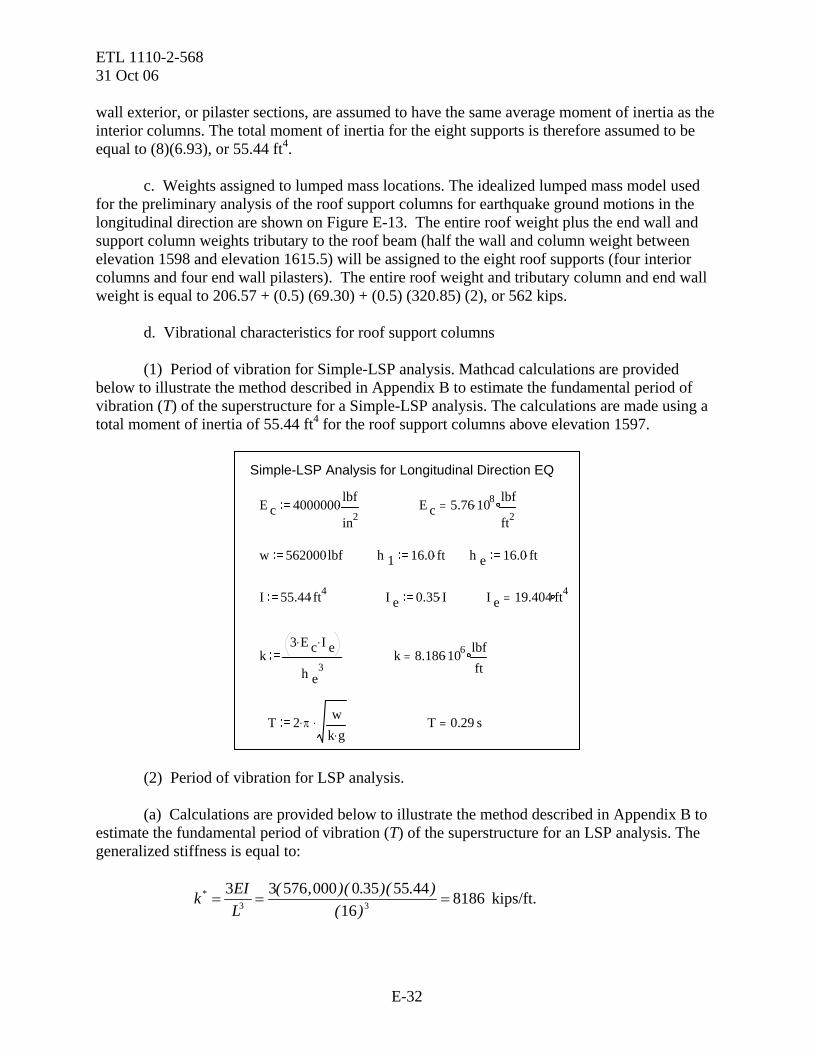
ETL 1110-2-568 31 Oct 06 wall exterior, or pilaster sections, are assumed to have the same average moment of inertia as the interior columns. The total moment of inertia for the eight supports is therefore assumed to be equal to (8)(6.93), or 55.44 ft4. c. Weights assigned to lumped mass locations. The idealized lumped mass model used for the preliminary analysis of the roof support columns for earthquake ground motions in the longitudinal direction are shown on Figure E-13. The entire roof weight plus the end wall and support column weights tributary to the roof beam (half the wall and column weight between elevation 1598 and elevation 1615.5) will be assigned to the eight roof supports (four interior columns and four end wall pilasters). The entire roof weight and tributary column and end wall weight is equal to 206.57 + (0.5) (69.30) + (0.5) (320.85) (2), or 562 kips. d. Vibrational characteristics for roof support columns (1) Period of vibration for Simple-LSP analysis. Mathcad calculations are provided below to illustrate the method described in Appendix B to estimate the fundamental period of vibration (T) of the superstructure for a Simple-LSP analysis. The calculations are made using a total moment of inertia of 55.44 ft4 for the roof support columns above elevation 1597.
Simple-LSP Analysis for Longitudinal Direction EQ
E c 4000000 lbf
in2. E c 5.76 108. lbf
ft2=
w 562000lbf. h 1 16.0 ft. h e 16.0 ft.
I 55.44 ft4. I e 0.35 I. I e 19.404 ft4=
k3 E c. I e.
h e3
k 8.186 106. lbfft
=
T 2 π.w
k g.. T 0.29 s=
(2) Period of vibration for LSP analysis. (a) Calculations are provided below to illustrate the method described in Appendix B to estimate the fundamental period of vibration (T) of the superstructure for an LSP analysis. The generalized stiffness is equal to:
3 3
3 3 576 000 0 35 55 44 818616
EIkL
* ( , )( . )( . )( )
= = = kips/ft.
E-32

ETL 1110-2-568 31 Oct 06
(b) The period of vibration (T) is:
5622 2 032 2 8186
m 29k
*
*.
( . )( )π π= = =T seconds.
e. Inertial forces, moments and displacements for column pilaster. (1) Simple-LSP analysis. Mathcad calculations are provided below to illustrate the method described in Appendix B to estimate inertial forces, moments, and displacements for a Simple-LSP analysis. The following calculations are based on an entire superstructure basis, which includes four interior columns and four end wall column sections.
Determine Base Shear (V) and Inertial Forces (F)
S s 0.45 Short period spectra acceleration for 1000 year event
Note: For single lumped mass case the partcipation factor can be set to one
V 1.0 S s. w. V 2.529 105. lbf=
F 1613 1.0 S s. w. F 1613 2.529 105. lbf=
Determine Moments (M)
M 1597 F 1613 h 1. M 1597 4.046 106. ft lbf.=
Assume 0.5-percent drift for Simple-LSP displacement calculations
δ 1613 0.005 h 1. δ 1613 0.96 in= Conservative
(2) LSP analysis. (a) Calculations are provided below to illustrate the method described in Appendix B to estimate inertial forces, moments, and displacements for an LSP analysis. The following calculations are based on an entire superstructure basis, which includes four interior columns and four end wall column sections. Since the roof support columns are represented as a single-degree-of-freedom system, the inertial force at the lumped mass location (F) is equal to the mass times the spectral acceleration, or F = (562/32.2)(0.45)(32.2) = 252.9 kips. (b) The shear between elevation 1613 and elevation 1597 is also equal to 252.9 kips. (c) The moment at elevation 1597 is equal to 252.9 (1613 − 1597), or 4046 ft-kips.
E-33

ETL 1110-2-568 31 Oct 06 (d) Since the roof support columns are represented as a single-degree-of-freedom system, the displacement (δ) at the mass point is equal to the spectral displacement. With the period equal to 0.29 seconds, the spectral acceleration (see response spectrum) is equal to 0.45 g. The mass point displacement assuming an elastic response is then:
2 20 29 0 45 32 2 0 0309 ft 0 37 in.
2 2D ATS S .
( ) ( . )( . ) . .δπ π
⎛ ⎞ ⎛ ⎞= = = = =⎜ ⎟ ⎜ ⎟⎝ ⎠ ⎝ ⎠
E-9. Element Capacities. a. The moment and shear capacities of the interior and exterior roof support columns and the effective wall sections are based on ultimate strength procedures following the guidance presented in this document. The Corps moment curvature program M-PHI was used to compute member ultimate moment capacities at axial force levels associated with the structure’s dead load. M-PHI analyses were performed for all members indicated in Table E-1a and E-1b. Moment curvature analyses input and output results are shown for the column pilaster member of Figure E-11 for a transverse-direction earthquake (Figure E-19). b. Reinforcing details for the roof support columns are shown in Figure E-16. The effective wall section below elevation 1597 used to resist transverse-direction roof column induced moments and shears is shown on Figure E-15. The effective wall section is reinforced with #8 bars every 9 in. on each face. The ultimate shear capacity is determined based on the shear strength equation in Appendix B. For the calculations, it will be assumed that the flexural displacement ductility demand will be in excess of two, so “k” is equal to 0.5 (conservative). Neglecting the contribution from axial load, the shear capacity of the concrete is therefore equal to:
( ) GGcacn AAfkVV 81.228.0)(85.0 ' ===φφ pounds. c. A summary of the element capacities for a transverse-direction earthquake is provided in Table E-1a. Element capacities for a longitudinal-direction earthquake are provided in Table E-1b.
E-34

ETL 1110-2-568 31 Oct 06
PH INT WALL TRANS EQ 1 40.0 29000.0 0.01 0.05 40.01 4.5 4070.0 0.004 50 4 4 2 1 24.0 12.0 1 2 1.05 2.00 1.05 22.00 5.7 12.00
Figure E-19a. M-PHI input.
PH INT WALL TRANS EQ INPUT PARMETERS LOAD PARAMETERS (KIPS) (IN) AXIAL LOAD .5700E+01 POSITION ON BEAM 12.00 CONCRETE PARAMETERS (KSI) F`C OF CONCRETE ..... 4.50 CONCRETE MODULUS ....4070.00 CONCRETE ULTIMATE STRAIN..... .0040 STEEL PARAMETERS (KSI) STEEL MODULUS ...... 29000.00 STEEL YIELD STRESS .....40.0 HARDENING STRAIN .1000E-01 STEEL ULTIMATE STRESS .... 40.01 ULTIMATE STEEL STRAIN .5000E-01 RECTANGULAR BEAM/COLUMN (IN) HEIGHT OF BEAM ..... 24.00 WIDTH OF BEAM ...... 12.00
Figure E-19b. M-PHI input echo.
E-35
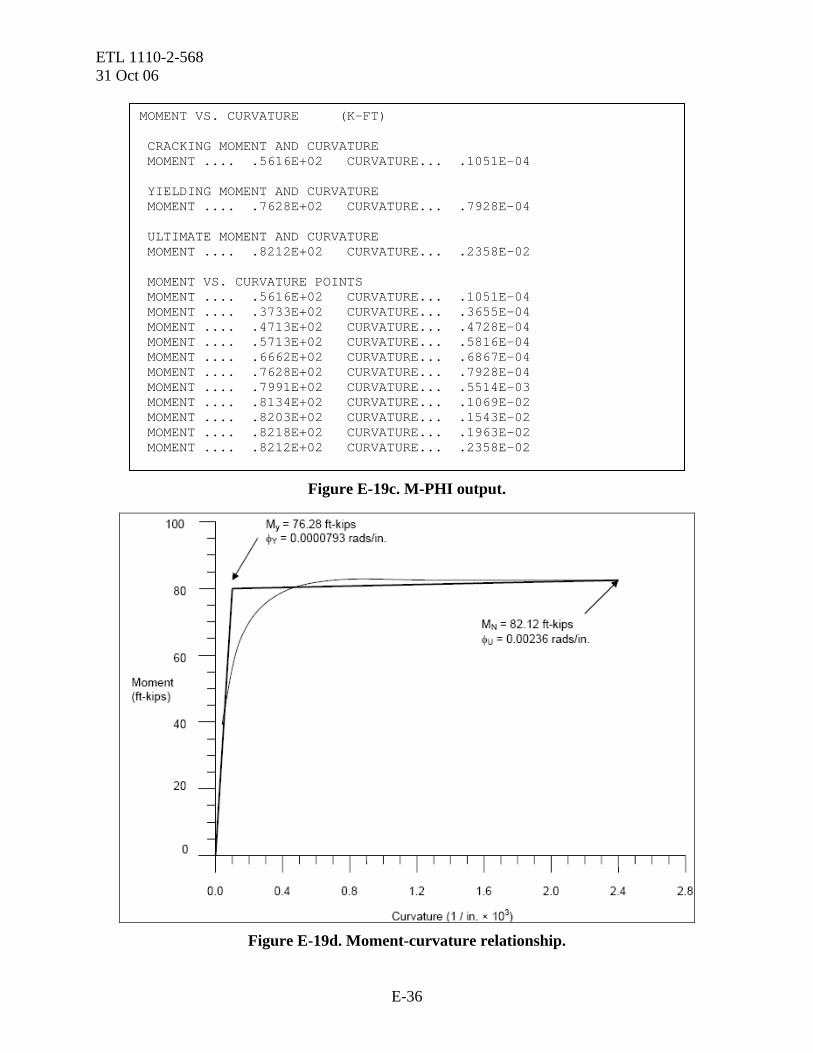
ETL 1110-2-568 31 Oct 06
MOMENT VS. CURVATURE (K-FT) CRACKING MOMENT AND CURVATURE MOMENT .... .5616E+02 CURVATURE... .1051E-04 YIELDING MOMENT AND CURVATURE MOMENT .... .7628E+02 CURVATURE... .7928E-04 ULTIMATE MOMENT AND CURVATURE MOMENT .... .8212E+02 CURVATURE... .2358E-02 MOMENT VS. CURVATURE POINTS MOMENT .... .5616E+02 CURVATURE... .1051E-04 MOMENT .... .3733E+02 CURVATURE... .3655E-04 MOMENT .... .4713E+02 CURVATURE... .4728E-04 MOMENT .... .5713E+02 CURVATURE... .5816E-04 MOMENT .... .6662E+02 CURVATURE... .6867E-04 MOMENT .... .7628E+02 CURVATURE... .7928E-04 MOMENT .... .7991E+02 CURVATURE... .5514E-03 MOMENT .... .8134E+02 CURVATURE... .1069E-02 MOMENT .... .8203E+02 CURVATURE... .1543E-02 MOMENT .... .8218E+02 CURVATURE... .1963E-02 MOMENT .... .8212E+02 CURVATURE... .2358E-02
Figure E-19c. M-PHI output.
Figure E-19d. Moment-curvature relationship.
E-36

ETL 1110-2-568 31 Oct 06
Table E-1a. Element capacities for a transverse-direction earthquake.
Location Number
Element Description
Axial Load PDL
Moment Capacity MC(ft-kips)
Shear Capacity VC(kips)
1 Interior column at elevation 1598 63 kips 735.3 33.11 2 Effective wall section at elevation 1580 5.7
kips/ft 82.1 (20) = 1642.0
131.40
Table E-1b. Element capacities for a longitudinal-direction earthquake.
Location Number Element Description
Axial Load PDL
Moment Capacity MC(ft-kips)
Shear Capacity VC(kips)
1 Interior column at elevation 1598 63 kips 837.7 33.11 2 Exterior column at elevation 1598 40 334.9 49.50
d. The total moment capacity of the columns and end wall sections for the entire roof system (four columns and four end wall sections) is equal to 4 (838) + 4 (335) = 46928 ft-kips. The total shear capacity is 330 kips. E-10. Comparison of Earthquake Demands to Element Capacity. a. Force demands (moments and shears) for the powerhouse interior and exterior wall elements were determined by Simple-LSP and LSP analyses. Acceptance criteria for Life Safety (LS) performance requires that:
• For flexure strength ratio (R), i.e., the ratio of elastic moment demand to nominal moment capacity (ME / MN), when multiplied by the product C1 × C2 must be less than or equal to a demand-to-capacity ratio (DCR) of 1.5, or:
C1 × C2 × R ≤ 1.5.
• For shear, the DCR must be less than or equal to one. b. The DCR evaluation for bending and shear using the demands from the LSP analysis is presented in Tables E-2a and E-2b, respectively.
E-37
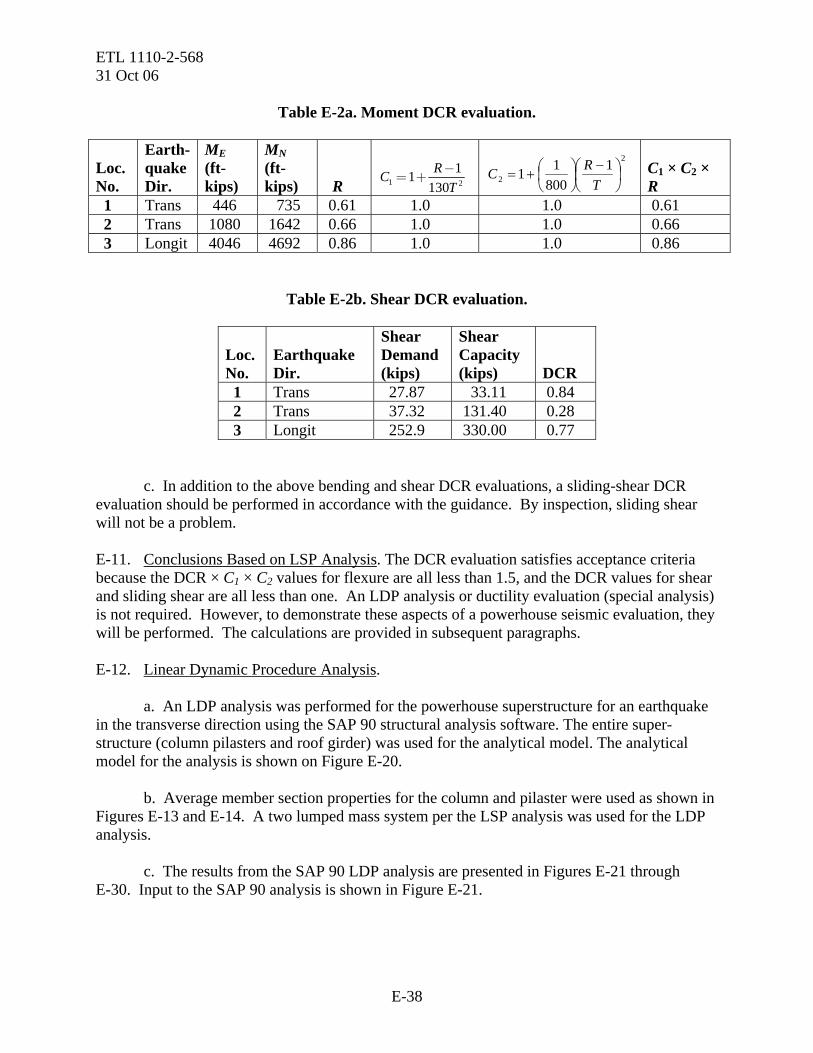
ETL 1110-2-568 31 Oct 06
Table E-2a. Moment DCR evaluation.
Loc. No.
Earth-quake Dir.
ME (ft-kips)
MN (ft-kips) R 1 2
11130RC
T−= +
2
21
80011 ⎟
⎠⎞
⎜⎝⎛ −⎟⎠⎞
⎜⎝⎛+=
TRC C1 × C2 ×
R 1 Trans 446 735 0.61 1.0 1.0 0.61 2 Trans 1080 1642 0.66 1.0 1.0 0.66 3 Longit 4046 4692 0.86 1.0 1.0 0.86
Table E-2b. Shear DCR evaluation.
Loc. No.
Earthquake Dir.
Shear Demand (kips)
Shear Capacity (kips)
DCR
1 Trans 27.87 33.11 0.84 2 Trans 37.32 131.40 0.28 3 Longit 252.9 330.00 0.77
c. In addition to the above bending and shear DCR evaluations, a sliding-shear DCR evaluation should be performed in accordance with the guidance. By inspection, sliding shear will not be a problem. E-11. Conclusions Based on LSP Analysis. The DCR evaluation satisfies acceptance criteria because the DCR × C1 × C2 values for flexure are all less than 1.5, and the DCR values for shear and sliding shear are all less than one. An LDP analysis or ductility evaluation (special analysis) is not required. However, to demonstrate these aspects of a powerhouse seismic evaluation, they will be performed. The calculations are provided in subsequent paragraphs. E-12. Linear Dynamic Procedure Analysis. a. An LDP analysis was performed for the powerhouse superstructure for an earthquake in the transverse direction using the SAP 90 structural analysis software. The entire super-structure (column pilasters and roof girder) was used for the analytical model. The analytical model for the analysis is shown on Figure E-20. b. Average member section properties for the column and pilaster were used as shown in Figures E-13 and E-14. A two lumped mass system per the LSP analysis was used for the LDP analysis. c. The results from the SAP 90 LDP analysis are presented in Figures E-21 through E-30. Input to the SAP 90 analysis is shown in Figure E-21.
E-38

ETL 1110-2-568 31 Oct 06
Figure E-20. Analytical model for the Linear Dynamic Procedure (LDP) analysis.
E-39

ETL 1110-2-568 31 Oct 06
Figure E-21. Input data for the SAP 90 LDP analysis.
POWERHOUSE LDP EXAMPLE C: FILE: LCP1 C: GENERATOR BAY TRANSVERSE SECTION C: EARTHQUAKE DEMANDS MDE = 1000-YEAR EVENT C: MAY 20, 2001 SYSTEM V=4 RESTRAINTS 1 6 R=0,1,0,1,0,1 1 R=1,1,1,1,1,1 6 R=1,1,1,1,1,1 JOINTS 1 X=0 Y=0 Z=0 2 X=0 Y=0 Z=17 3 X=0 Y=0 Z=33 4 X=51 Y=0 Z=33 5 X=51 Y=0 Z=17 6 X=51 Y=0 Z=0 FRAME NM=3 1 A=19.1 I=82.50,82.50 E=0.35*576000 2 A=9.25 I=7.50,7.50 E=0.35*576000 3 A=7.00 I=20.50,20.50 E=576000 1,1,2 M=1 2,2,3 M=2 3,3,4 M=3 LR=0,0,0,1,1,0 4,4,5 M=2 5,5,6 M=1 MASSES 2 M=35.42/32.2 3 M=54.33/32.2 4 M=54.33/32.2 5 M=35.42/32.2 SPEC A=0.0 S=32.2 D=0.05 0.000 0.180 0.090 0.450 0.440 0.450 0.500 0.400 0.600 0.333 0.700 0.286 0.800 0.250 0.900 0.222 1.000 0.200 1.500 0.133 2.000 0.100 3.000 0.067
E-40

ETL 1110-2-568 31 Oct 06
d. The eigenvalue solution information, including periods of vibration and participating mass information, is presented in Figure E-22. The fundamental period of vibration is 0.32 seconds, compared to 0.24 seconds calculated in the LSP analysis. The period of vibration from the LSP analysis is always shorter because of the moment of inertia properties of the lowermost member section. This conservatism is intentionally introduced into the LSP analysis. For this example, both the 0.24-second period and the 0.32-second period fall in the constant-acceleration range (peak range) of the response spectrum, so the spectral accelerations are the same for both the LSP and LDP analyses. The participating mass is 100 percent because four lumped masses were used in the idealized analytical model and four modes of vibration were requested in the SAP 90 analysis (V = 4). e. Spectral information for each mode of vibration from the SAP 90 output is shown in Figure E-23.
Figure E-22. Modal periods and participating mass for the SAP 90 LDP analysis.
Figure E-23. Spectral acceleration, velocity, and displacement for each mode
of vibration for the SAP 90 LDP analysis.
POWERHOUSE LDP EXAMPLE E I G E N V A L U E S A N D F R E Q U E N C I E S MODE EIGENVALUE CIRCULAR FREQ FREQUENCY PERIOD NUMBER (RAD/SEC)**2 (RAD/SEC) (CYCLES/SEC) (SEC) 1 0.378553E+03 0.194564E+02 3.096588 0.322936 2 0.146510E+05 0.121041E+03 19.264324 0.051909 3 0.149264E+05 0.122174E+03 19.444537 0.051428 4 0.943662E+05 0.307191E+03 48.890946 0.020454 P A R T I C I P A T I N G M A S S - (percent) MODE X-DIR Y-DIR Z-DIR X-SUM Y-SUM Z-SUM 1 72.480 0.000 0.000 72.480 0.000 0.000 2 0.000 0.000 0.000 72.480 0.000 0.000 3 27.520 0.000 0.000 100.000 0.000 0.000 4 0.000 0.000 0.000 100.000 0.000 0.000
POWERHOUSE LDP EXAMPLE MODE F R E Q U E N C Y S P E C T R A L NUMBER RAD./SEC CYCLES/SEC PERIOD-SEC ACCEL VEL DISPL 1 19.46 3.10 0.322936 14.490 0.745 0.038 2 121.04 19.26 0.051909 10.810 0.089 0.001 3 122.17 19.44 0.051428 10.764 0.088 0.001 4 307.19 48.89 0.020454 7.772 0.025 0.000
E-41
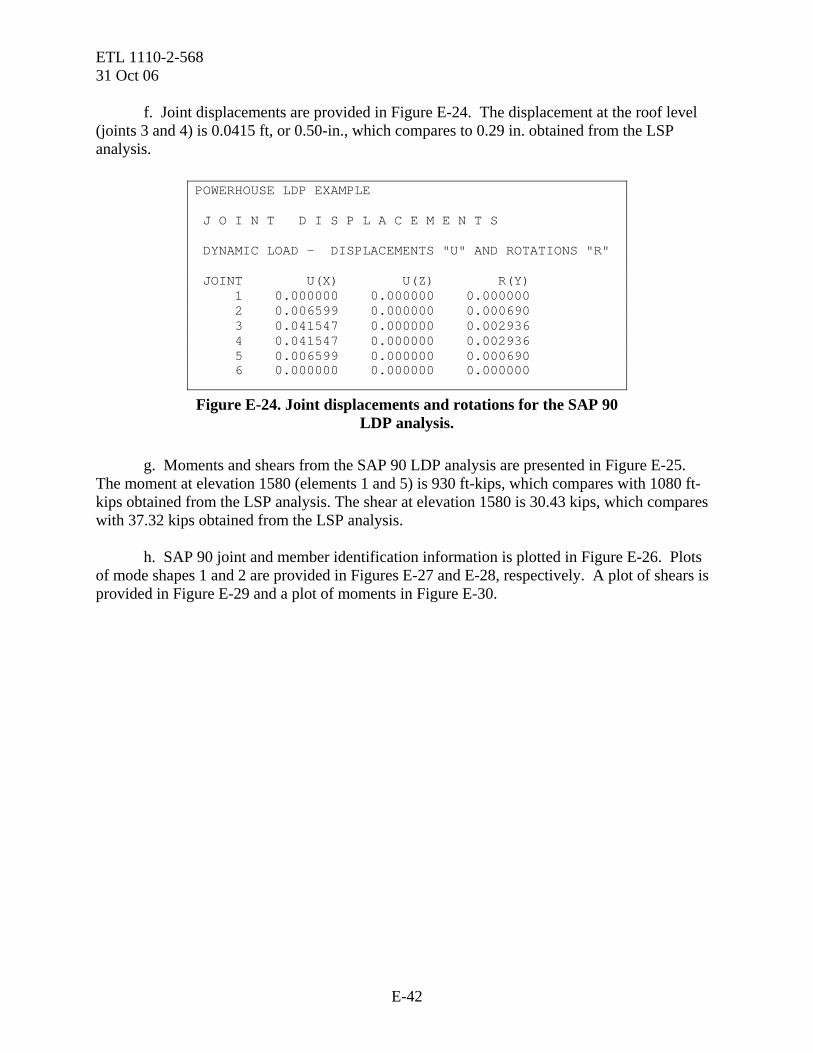
ETL 1110-2-568 31 Oct 06 f. Joint displacements are provided in Figure E-24. The displacement at the roof level (joints 3 and 4) is 0.0415 ft, or 0.50-in., which compares to 0.29 in. obtained from the LSP analysis.
Figure E-24. Joint displacements and rotations for the SAP 90 LDP analysis.
POWERHOUSE LDP EXAMPLE J O I N T D I S P L A C E M E N T S DYNAMIC LOAD - DISPLACEMENTS "U" AND ROTATIONS "R" JOINT U(X) U(Z) R(Y) 1 0.000000 0.000000 0.000000 2 0.006599 0.000000 0.000690 3 0.041547 0.000000 0.002936 4 0.041547 0.000000 0.002936 5 0.006599 0.000000 0.000690 6 0.000000 0.000000 0.000000
g. Moments and shears from the SAP 90 LDP analysis are presented in Figure E-25. The moment at elevation 1580 (elements 1 and 5) is 930 ft-kips, which compares with 1080 ft-kips obtained from the LSP analysis. The shear at elevation 1580 is 30.43 kips, which compares with 37.32 kips obtained from the LSP analysis. h. SAP 90 joint and member identification information is plotted in Figure E-26. Plots of mode shapes 1 and 2 are provided in Figures E-27 and E-28, respectively. A plot of shears is provided in Figure E-29 and a plot of moments in Figure E-30.
E-42

ETL 1110-2-568 31 Oct 06
Figure E-25. Element forces for the SAP 90 LDP analysis.
POWERHOUSE LDP EXAMPLE F R A M E E L E M E N T F O R C E S ELT LOAD DIST 1-2 PLANE AXIAL 1-3 PLANE AXIAL ID COND ENDI SHEAR MOMENT FORCE SHEAR MOMENT TORQ 1 -------------------------------------------- DYN 0.000 0.000 0.000 30.427 929.615 17.000 30.427 425.273 17.000 0.000 2 -------------------------------------------- DYN 0.000 0.000 0.000 26.580 425.273 16.000 26.580 0.000 16.000 0.000 3 -------------------------------------------- DYN 0.000 0.000 0.000 0.000 0.000 0.000 0.000 51.000 0.000 0.000 0.000 0.000 51.000 0.000 4 -------------------------------------------- DYN 0.000 0.000 0.000 26.580 0.000 16.000 26.580 425.273 16.000 0.000 5 -------------------------------------------- DYN 0.000 0.000 0.000 30.427 425.273 17.000 30.427 929.615
E-43
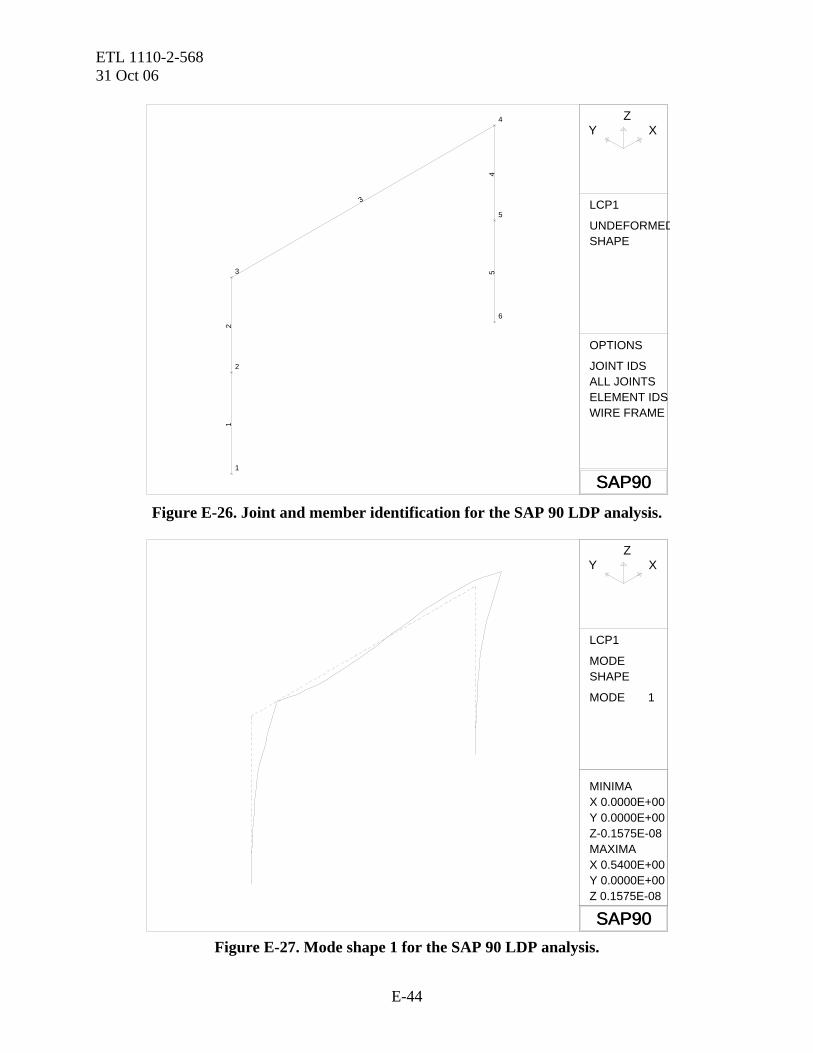
ETL 1110-2-568 31 Oct 06
SAP90 SAP90
XYZ
LCP1
UNDEFORMEDSHAPE
OPTIONS
JOINT IDS ALL JOINTS ELEMENT IDS WIRE FRAME
12
3
45
1
2
3
4
5
6
Figure E-26. Joint and member identification for the SAP 90 LDP analysis.
SAP90 SAP90
XYZ
LCP1
MODE SHAPE
MODE 1
MINIMA X 0.0000E+00Y 0.0000E+00Z-0.1575E-08MAXIMA X 0.5400E+00Y 0.0000E+00Z 0.1575E-08
Figure E-27. Mode shape 1 for the SAP 90 LDP analysis.
E-44

ETL 1110-2-568 31 Oct 06
SAP90
Y XZ
LCP1
MODE SHAPE
MODE 2
MINIMA X-0.6740E+00Y 0.0000E+00Z-0.5212E-09MAXIMA X 0.6740E+00Y 0.0000E+00Z 0.5212E-09
SAP90 Figure E-28. Mode shape 2 for the SAP 90 LDP analysis.
SAP90 SAP90
XYZ
LCP1
FRAME OUTPUT V22
LOAD 1
MIN < 3> 0.0000E+00AT 0.00MAX < 1> 0.3043E+02AT 0.00
Figure E-29. Member shears plot for the SAP 90 LDP analysis.
E-45
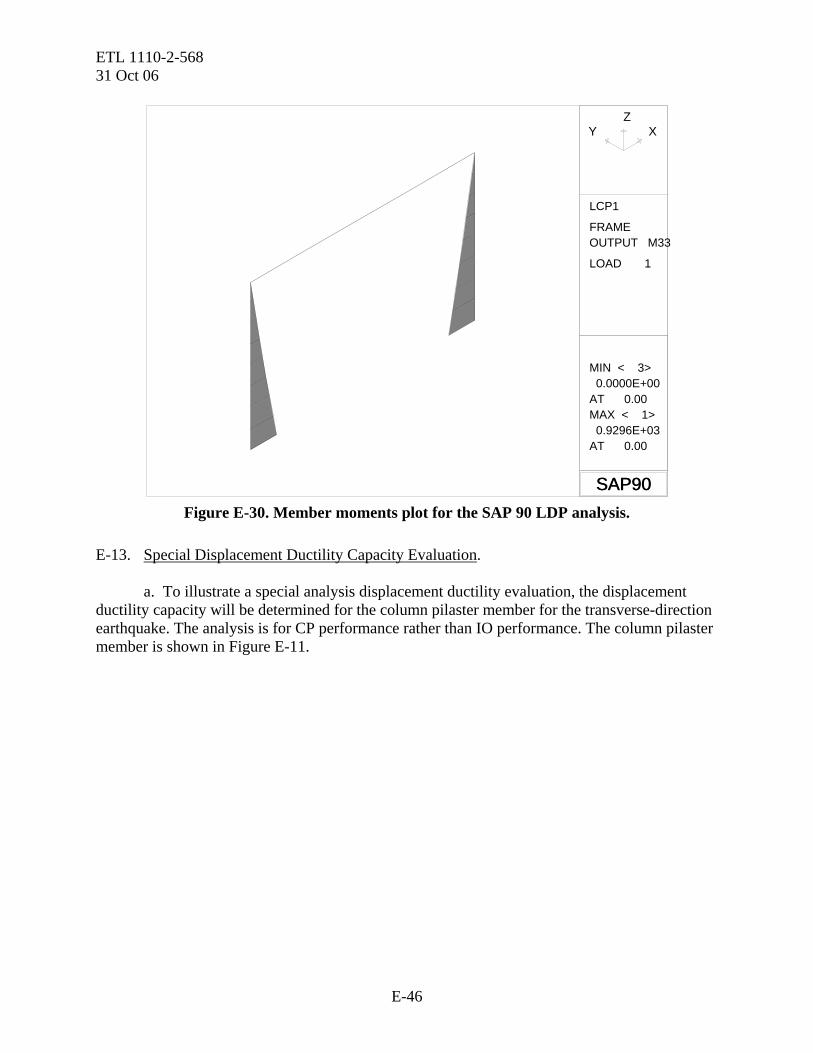
ETL 1110-2-568 31 Oct 06
SAP90 SAP90
XYZ
LCP1
FRAME OUTPUT M33
LOAD 1
MIN < 3> 0.0000E+00AT 0.00MAX < 1> 0.9296E+03AT 0.00
Figure E-30. Member moments plot for the SAP 90 LDP analysis.
E-13. Special Displacement Ductility Capacity Evaluation. a. To illustrate a special analysis displacement ductility evaluation, the displacement ductility capacity will be determined for the column pilaster member for the transverse-direction earthquake. The analysis is for CP performance rather than IO performance. The column pilaster member is shown in Figure E-11.
E-46

ETL 1110-2-568 31 Oct 06
Displacement Ductility Capacity
φ y 0.00007928 rads / inch
From M- φ Analysis φ u 0.002358 rads / inch
F y 40.0 KSI
M N 82.12 Ft-kips per foot of wallFrom M- φ Analysis
M CR 56.16 Ft-kips per foot of wall
M NM CR
1.462=
Plastic hinge length when M N / M CR is less than 1.2
d b 1.00 inches
L p 0.3 F y. d b.
L p 12= inches Use Lp equal to 12-inches to be conservative
L eff54.33 33( ). 1.00( ). 35.42 17( ). 0.52( ).( )
54.33 1.00( ). 35.42 0.52( ).12.
L eff 347.39= inches
μ 1 3φ uφ y
1.L pL eff
. 1 0.5L pL eff
..
μ 3.927= Ductility capacity for collapse prevention (CP) b. The ductility capacity evaluation assumes that plastic hinging will occur in the 2-ft-thick perimeter wall at elevation 1580. The displacement ductility capacity evaluation indicates that a displacement ductility of 3.927 is available for the ultimate strain conditions associated with collapse prevention (CP). This is more than the 2.00 value assumed when establishing DCR acceptance criteria for those cases where a displacement ductility capacity evaluation is not performed. This analysis assumes that splice and embedment lengths are adequate and that the axial load ratio is less than 0.15. A displacement ductility capacity evaluation could be performed in the same manner for IO performance, but using the maximum strain limits provided for IO performance in Appendix B. The plastic hinge length, however, should be that associated with just the strain penetration occurring on each side of the initial plastic hinge crack (i.e., LP = 0.30 fy db), which turned out to be that assumed for CP performance.
E-47

ETL 1110-2-568 31 Oct 06 E-14. Seismic Evaluation of Connections. a. Reinforcement anchorage and splice length. (1) According to drawing notes, the critical vertical reinforcing steel for the roof support columns meets ACI 318 Class A splice length requirements, which for the 1971 ACI Building Code is equal to1.0 ld, where:
lA f
fAd
b y
cb= =
0 0429 22
..
'.
(2) For the roof column #9 bars, 1.0 ld = 29.22 in., or 26 bar diameters. Assuming 2 in. of cover and an actual concrete compressive strength of 4500 psi, the required lap splice length according to ACI 318-02 is equal to 28.30 as calculated below. The lap splice length provided is greater than required.
E-48
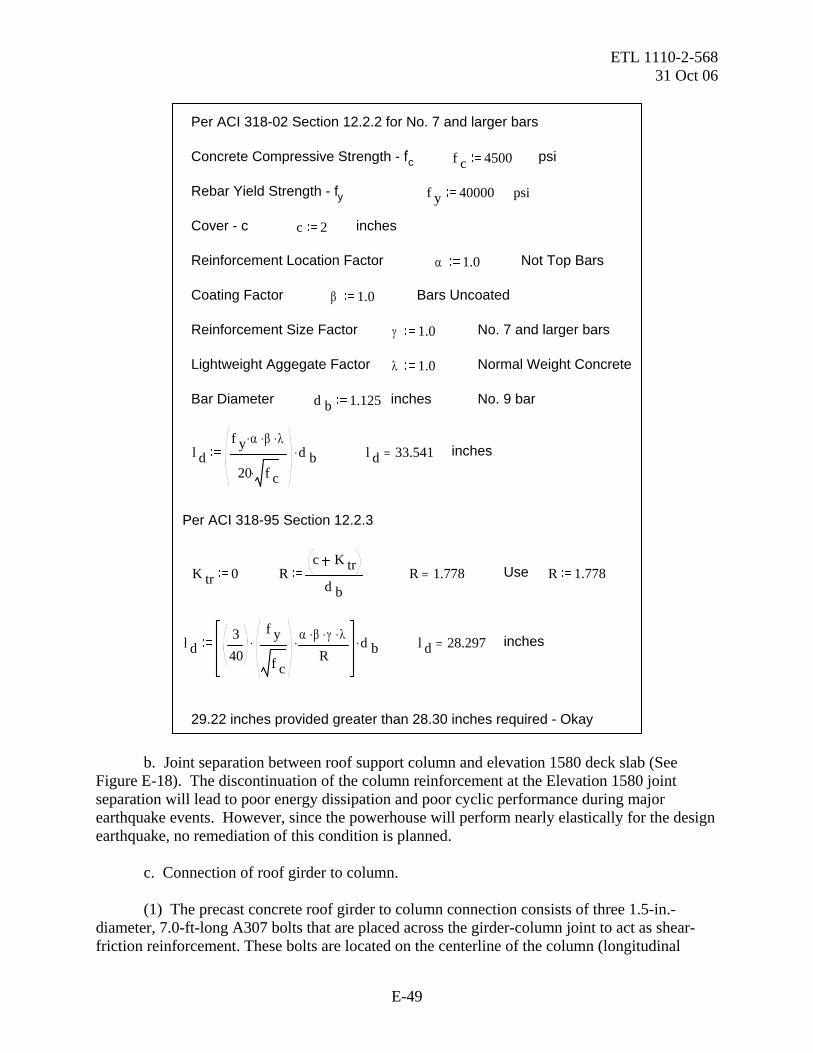
ETL 1110-2-568 31 Oct 06
Per ACI 318-02 Section 12.2.2 for No. 7 and larger bars
Concrete Compressive Strength - f'c f c 4500 psi
Rebar Yield Strength - fy f y 40000 psi
Cover - c c 2 inches
Reinforcement Location Factor α 1.0 Not Top Bars
Coating Factor β 1.0 Bars Uncoated
Reinforcement Size Factor γ 1.0 No. 7 and larger bars
Lightweight Aggegate Factor λ 1.0 Normal Weight Concrete
Bar Diameter d b 1.125 inches No. 9 bar
l df y α. β. λ.
20 f c.d b. l d 33.541= inches
Per ACI 318-95 Section 12.2.3
K tr 0 Rc K tr
d bR 1.778= Use R 1.778
l d340
f y
f c
. α β. γ. λ.
R. d b. l d 28.297= inches
29.22 inches provided greater than 28.30 inches required - Okay
b. Joint separation between roof support column and elevation 1580 deck slab (See Figure E-18). The discontinuation of the column reinforcement at the Elevation 1580 joint separation will lead to poor energy dissipation and poor cyclic performance during major earthquake events. However, since the powerhouse will perform nearly elastically for the design earthquake, no remediation of this condition is planned. c. Connection of roof girder to column. (1) The precast concrete roof girder to column connection consists of three 1.5-in.-diameter, 7.0-ft-long A307 bolts that are placed across the girder-column joint to act as shear-friction reinforcement. These bolts are located on the centerline of the column (longitudinal
E-49

ETL 1110-2-568 31 Oct 06 direction) and embedded equally in the column and precast roof girder. The shear friction capacity of the joint is: VSF = AS FY μ = 5.30(36)(0.55) = 105.0 kips. (2) The earthquake demand on the joint based on the LSP analysis is equal to 27.87 kips, which is much less than 105.0 kips. The connection between the roof girder and column is acceptable. For this powerhouse, both ends of the roof beams are fixed against translation, so the usual checks for adequate bearing seat widths are not required. E-15. Conclusions. The powerhouse superstructure is a short-period structure with high force demands and low displacement demands. Since the displacement demands are small, a loss of support for the bridge crane is considered to be minimal. The roof support columns are critical if the powerhouse is to survive a major earthquake without loss of life. Although the reinforcing details are poor (discontinuation of pilaster reinforcing steel and non-conforming transverse reinforcement), the displacement demands are low and the capacity provided meets guidance requirements. A final report of findings following the guidance provided in Appendix B would be prepared indicating that mitigation is not required.
E-50

ETL 1110-2-568 31 Oct 06
APPENDIX F
Notation
A Area ALR Axial load ratio Ab Area of reinforcing bars AG Gross area of concrete member Ae Effective area of concrete member in shear 0.8 Ag As Area of tension steel AV Area of shear steel ax Height-wise acceleration amplification ar Resonance acceleration amplification BSE-1A Basic safety earthquake for IO performance evaluations BSE-2 Basic safety earthquake for CP performance evaluations b Width of wall section c Reinforcing bar cover, or depth to neutral axis CQC Complete quadratic combination d Depth to reinforcing steel db Reinforcing bar diameter DCR Demand-to-capacity ratio C1 FEMA 440 modification factor to relate expected maximum inelastic
displacements to displacements calculated for linear elastic response C2 FEMA 440 modification factor to relate increases in inelastic displacements due
to cyclic degradation CP Collapse performance
F-1

ETL 1110-2-568 31 Oct 06 E Modulus of elasticity Es Modulus of elasticity of steel ELF Equivalent lateral force Fn Inertial force at lumped mass location
cf ′ Specified concrete compressive strength
caf ′ Actual concrete compressive strength fy Reinforcing steel yield strength fr Modulus of rupture fs Maximum stress that can be developed by reinforcement g Acceleration of gravity H Distance or height he Height of effective wall section for Simple-LSP analysis h1 Height from base to mass point 1 h2 Height from base to mass point 2 Ie Effective moment of inertia IEB Effective moment of inertia at bottom of wall IG Gross moment of inertia IO Immediate occupancy k Shear capacity factor or stiffness k* Generalized stiffness la Reinforcing bar anchorage length l Length of wall, i.e. height of wall leff Effective length of wall
F-2

ETL 1110-2-568 31 Oct 06
Ib Lap or splice length provided Id Lap or splice length required by ACI le Length of embedment Ln Normalization factor lp Plastic hinge length LDP Linear dynamic procedure LSP Linear static procedure or Simple linear static procedure LS Life safety m* Generalized mass M Moment MCR Cracking moment ME Total elastic moment demand for design earthquake loading condition MN Nominal moment capacity mn Lumped mass value P Axial load PSHA Probabilistic site hazard assessment QE Combined action due to design earthquake loads, dead load, and live load QD Dead load effect QL Live load effect QDE Earthquake load effects for the design earthquake, i.e., MDE or MCE QE1 QE load case 1 for orthogonal effects determination QE2 QE load case 2 for orthogonal effects determination
F-3

ETL 1110-2-568 31 Oct 06 QDE(X1) Effects resulting from the X1 component of the design earthquake ground motion
occurring in the direction of the 1st principal structure axis QDE(X2) Effects resulting from the X2 component of the design earthquake ground motion
occurring in the direction of the 2nd principal structure axis QDE(Z) Effects resulting from the vertical component of the design earthquake ground
motion occurring in the z-direction s Spacing of reinforcing steel SA Spectral acceleration SS Short-period spectral acceleration (0.2-second acceleration) Sb Section modulus SD Spectral displacement SD Strength design SDOF Single degree of freedom SRSS Square root of the sum of the squares T Fundamental period of vibration of powerhouse superstructure T1 Fundamental period of vibration of powerhouse substructure (dry)
11T Fundamental period of vibration of powerhouse substructure (wet)
TO Characteristic ground motion period V Shear or base shear VC Shear capacity contribution of concrete VS Shear capacity contribution of steel VSF Shear-friction capacity VE Elastic shear demand for design earthquake W Weight
F-4
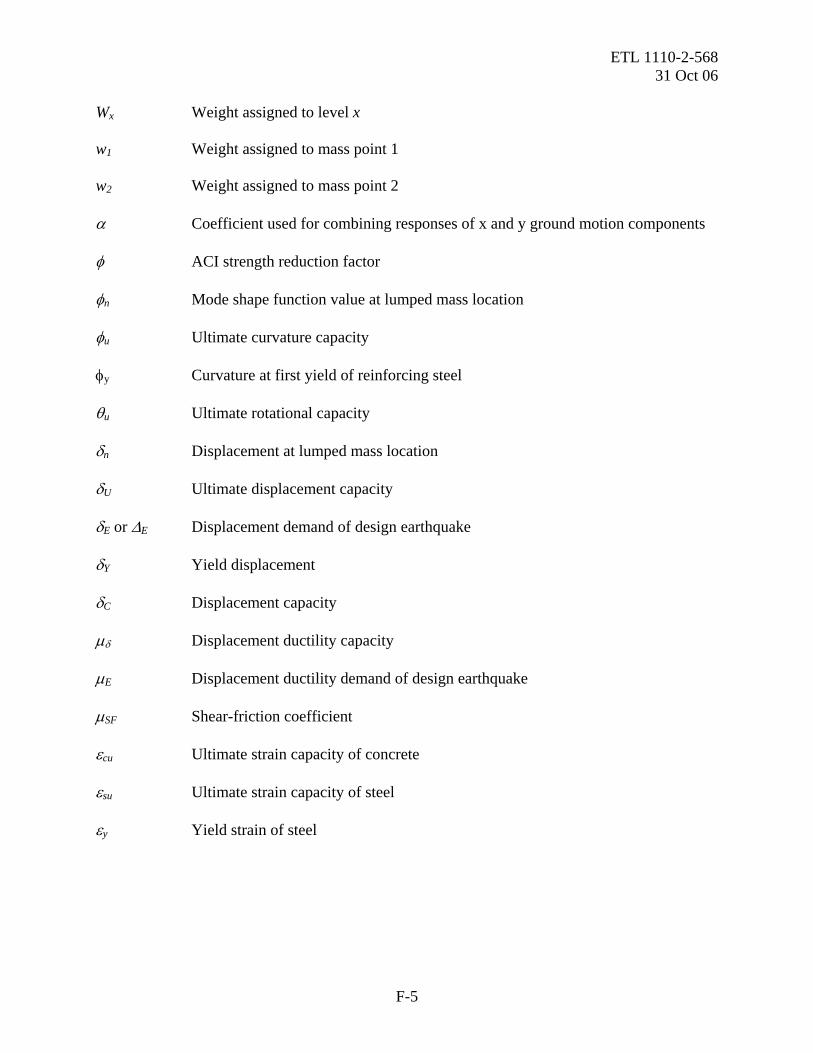
ETL 1110-2-568 31 Oct 06
Wx Weight assigned to level x w1 Weight assigned to mass point 1 w2 Weight assigned to mass point 2 α Coefficient used for combining responses of x and y ground motion components φ ACI strength reduction factor φn Mode shape function value at lumped mass location φu Ultimate curvature capacity φy Curvature at first yield of reinforcing steel θu Ultimate rotational capacity δn Displacement at lumped mass location δU Ultimate displacement capacity δE or ΔE Displacement demand of design earthquake δY Yield displacement δC Displacement capacity μδ Displacement ductility capacity μE Displacement ductility demand of design earthquake μSF Shear-friction coefficient εcu Ultimate strain capacity of concrete εsu Ultimate strain capacity of steel εy Yield strain of steel
F-5