*-1cmnatural hazards and internal migration: the role of ... · ooding but observed a strong...
TRANSCRIPT
Natural hazards and internal migration: The role of transient versuspermanent shocks?
Tanvir Pavela, Syed Hasanb, Nafisa Halimc, Pallab Mozumderd,∗
aDepartment of Economics, Florida International University, Miami, USAbSchool of Economics and Finance, Massey University, New Zealand
cDepartment of Global Health, Boston University, Boston, USAdDepartment of Earth and Environment and Department of Economics,
Florida International University, Miami, USA
Abstract
We analyse internal migration triggered by natural disasters in Bangladesh. We conducted a survey in nine
coastal districts and two major cities in Bangladesh to investigate whether floods and cyclones, which can
be considered as transient shocks, affect interregional migration differently compared to riverbank erosion
that causes loss of lands and thus generates shocks that are permanent in nature. Our findings suggest that
transient shocks induce households to move to nearby cities while permanent shocks push people to big cities
with more opportunities. Comparing income and expenditure of migrants and non-migrant households, we
find that the former group is better-off relative to their counterpart, indicating that welfare can be improved
by facilitating migration. Rising exposure to climate change induced natural disasters around the world imply
that our findings will be increasingly relevant for designing policies to address vulnerability, particularly for
disaster prone countries with weak social safety nets.
Keywords: Climate change, Natural disaster, Coastal area, Permanent shock, Transient shocks, Internal
migration.
JEL Classification: I38, Q54, Q56, R23.
?We acknowledge support from the National Science Foundation (Award #1204762, #1832693). We are grateful to ShyamalChowdhury for his valuable inputs in survey design and at various stages in pursuing this research. We also thank the respon-dents who spent their valuable time to participate in the ‘Coastal Vulnerability and Livelihood Security (CVLS)’ survey and thestaff members at the Evaluation & Consulting Services (ECONS) who implemented the survey with utmost diligence. We thankTobias Pfutze, Mihaela Pintea, Mahadev Bhat, Abu Shonchoy, Shahe Imran and seminar participants at the Florida Interna-tional University, Boston University, Southern Economic Association (SEA), Canadian Economic Association (CEA), WesternEconomic Association International (WEAI), and Eastern Economic Association (EEA) conferences for helpful comments.
∗Corresponding author. Office: AHC5 370, Department of Earth and Environment and Department of Economics, FloridaInternational University. Phone: 305-348-7146.
Email addresses: [email protected] (Tanvir Pavel), [email protected] (Syed Hasan), [email protected] (NafisaHalim), [email protected] (Pallab Mozumder)
Preprint submitted to Elsevier September 23, 2018

1. Introduction
The predictions about the dangers of climate change are increasingly being realised today as, among
others consequences, frequency and intensity of natural hazards are on the rise all over the world (O’neill and
Oppenheimer, 2002; Skoufias, 2003; Stern, 2008; IPCC, 2007; Desmet et al., 2018).1 Disasters triggered by
extreme weather events and climatic shocks in the form of cyclones, floods, storm surges, riverbank erosion,
tornadoes and earthquakes—among others—significantly affect the well-being, economic and otherwise, of
households and communities (Cattaneo and Peri, 2016). FAO (2018) estimated that, between 2003 and
2013, natural hazards caused a global damage of US$1.5 trillion and affected 2 billion people. It is projected
that by 2050, nearly 200 million people will be displaced due to environmental disruptions (Myers, 2002).
Studies focusing on GDP and welfare indicated that permanent flooding may reduce global real GDP and
welfare by an average of 0.19% and 0.24%, respectively, as people will be forced to live places with less
attractive amenities (Desmet et al., 2018). What is more daunting is that the economic damage caused by
disasters can be long-lasting (Lynham et al., 2017; Caruso, 2017).
The intensity and impacts of climate change and natural hazards vary over locations and groups (Agrawal
and Perrin, 2008; Agrawal et al., 2012; Cattaneo and Peri, 2016). For instance, Barrios et al. (2006) found
that climatic change, proxied by rainfall, changes the pace of urbanization in sub-Saharan Africa but not
in the other developing countries. Dasgupta (2018) find that, by the end of the 21st century, climate
change may increase under-four child mortality by 20 percent in some areas. However, natural hazards may
severely affect the people of the developing countries due to their dependence of natural resources and the
lack of adaptation and safety net instruments to fight against negative environmental shocks (O’neill and
Oppenheimer, 2002; Agrawal and Perrin, 2008).2 This is evidenced by the fact that the economic damage
between 2003 and 2013 due to environmental hazards in developing countries is estimated to be US$550
billion (FAO, 2018). Mejia et al. (2018) find that global temperatures have uneven macroeconomic effects,
with adverse consequences concentrated in most low-income countries as they have hot climates.3 Coronese
et al. (2018) has further indicated that available studies on the estimates of damage caused by natural
1Climate change reduces agricultural output, suppresses productivity of workers exposed to heat, slows investment, anddeteriorate health which lowers per capita output, in both the short and medium term. It may also have far reaching effects.For example, Para-PenaS and Reilly (2018) find that the concurrent year of the winter waves in Colombia caused by El-Ninoreduced theft rates during 2007-2012.
2Negative effect of climate change on natural resource dependent communities also apply in the developed country setting;see Fischer (2018) for an example on the US.
3Disasters may affect life in other ways, like reducing life satisfaction, lower schooling and deteriorate mental health of thevictims (Kellenberg and Mobarak, 2011; Mottaleb et al., 2015; Takasaki, 2017).
2

disaster, by employing mean regression techniques on yearly summed data, usually focus on trend and thus
systematically underestimate the real losses in low-income countries.
Bangladesh ranked 6th among countries that heavily suffers from natural disasters (Kreft et al., 2016).
More than 60 million people living in coastal areas of the country are highly vulnerable to climate change
and other environmental hazards. This is particularly because the unique physical geography of coastal
Bangladesh make it even more vulnerable to the potential impacts of a rising sea-level (Brammer, 2014).
The most common type of natural disasters in the coastal areas of Bangladesh are cyclones, floods
and riverbank erosions Poncelet et al. (2010). Tropical cyclones are very frequent in the coastal areas of
Bangladesh. For instance, in recent years, the southern coast of Bangladesh was hit by three consecutive
cyclones: Sidr in 2007, Nargis in 2008, and Aila in 2009 (Kabir et al., 2016; Mallick, 2014). Cyclones alone
claimed more than 100,000 lives and caused property damages of around US $3.5 billion in the country in
last 25 years (Dasgupta et al., 2010).
Located at the delta of the Ganges, Brahmaputra and Meghna river basin and a few feet above the
sea level, Bangladesh regularly experiences flash, rainfall-induced and storm surge floods. Each year, the
inundation of floods affects about 21% (or 31,000 square kilometres) of the country (Mirza, 2003). Using
a measure of self-reported flood, in combination with historical data, Karim (2018) indicated that frequent
flooding in the country has reduced agricultural income and negatively affected other welfare outcomes in
Bangladesh.
The erosion of the coastline and riverbank and the subsequent loss of arable land is another significant
concern for Bangladesh. It is one of the principal contributors to the process of destitution and marginaliza-
tion of rural families in the country (Poncelet et al., 2010; Planning Commission, 2015, 2017). It has been
estimated that about 60,000 individuals are displaced due to riverbank erosion and about 14,000 hectares
of arable land are eroded annually (Mutton and Haque, 2004; Mirza et al., 2003). These recurrent natural
disasters mostly affect the poorest group of coastal community residents (Ishtiaque and Nazem, 2017).
Households affected by shocks, either natural or man-made, follow a number of strategies to maintain
their consumption (Khandker, 2012). For example, after the Kobe Earthquake in 1995, households that
either held a large amount of collateralizable assets or faced no (binding) borrowing constraints were able
to maintain their consumption (Mozumder et al., 2009; Sawada and Shimizutani, 2008, 2011). In the face
of shocks, people also intensify the use the commons, either for their own or for their kins, to generate
additional income (Takasaki, 2011; Islam and Nguyen, 2018).
3

A risk averse individual would prefer to migrate to a place where there is a lower risk of natural disaster
(Brown et al., 2018). Thus, internal migration as an effective coping mechanism to natural hazards is
generally accepted. Unfortunately, the issue is less widely discussed in the literature, with early studies
largely ignoring the role of environmental factors for migration (Mallick and Etzold, 2015). Only a few
recent studies have discussed migration as an alternative strategy to cope with the adverse effects of natural
disasters (e.g., Blaikie et al., 2004; Black et al., 2011b; Naik, 2009; Poncelet et al., 2010). However, there is
insufficient empirical evidence to identify the nature and extent of internal migration as a coping strategy
against environmental shocks (Gemenne, 2011).
Among the few exceptions, Chen and Mueller (2018) empirically assessed whether members of households
in coastal Bangladesh have migrated due to flooding and salinity, either domestically or internationally. They
found no effect of flooding but observed a strong positive effect of salinity on domestic migration while the
effect was negative on international migration. Chen et al. (2017) found that the probability of migrating
for at least one member in a household declines during flooding. Paul (2005) observed no migration in the
aftermath of the 2004 tornado in Bangladesh. He argued that the availability and the management of aid
mitigate the effect of the disaster which allowed the victims to stay in their original location. The nature of
environmental shocks can be transient or permanent and no studies specifically focused how the nature of
shocks affect migration and the choice of destination. Again, while standard economic theories suggest that
migrating households improve their well-being, only a few studies empirically confirmed this hypothesis.
Against this background, this study analyses internal migration as a coping mechanism against natural
disasters in the south west coastal regions of Bangladesh. We explore whether riverbank erosion that leads
to loss of lands and thus impose a permanent negative shock on households’ economic status have higher
influence on domestic migration decisions, compared to the transient shocks as represented by floods and
cyclones. We also address whether such shocks differently influence households to migrate to the nearest
city or to distant but bigger city. We further examine the impact of migration on household income and
consumption. Our findings have significant implications for understanding whether migration can be used
as an effective coping mechanism for people affected by natural disasters.
The remainder of this article is organized as follows. Section 2 discusses about the determinants of
domestic migration in coastal Bangladesh with a particular focus on the nature of shocks and their effect on
migration decision. Section 3 briefly describes the survey and the data. Section 4 presents the methodology,
the empirical strategy and the identifying assumptions. Results from our analysis are presented in Section 5.
Section 6 concludes.
4
2. Natural disasters and internal migration in coastal Bangladesh
Migration can be internal or international, slow or rapid, forced or motivated and temporary or permanent
(Mallick and Vogt, 2012; Portes, 2010). Altogether, migration has a very complex set of determinants that
can be economic, social, political, demographic or environmental while the last factor has the capacity to
affect all the others (Black et al., 2011a,b; Bunea, 2012). Rural-urban (and in general internal) migration
in Bangladesh is usually explained by the push and pull factors in which the former factor mostly refers
to the desire for survival while the other refers to the attraction of better living and economic conditions
(Poncelet et al., 2010; Barrios et al., 2006). Though it is commonly believed that economic pull factors have
dominance over social or demographic factors of internal migration, with the recent global climate change,
environmental push factors are becoming increasingly important to exert direct and indirect influences on
internal migration decisions (Black et al., 2011a,b).
The shocks faced by households in developing countries, can be characterised into two general categories—
covariate and idiosyncratic (Patnaik et al., 2016). Idiosyncratic shocks are related to the effect at the
household or the individual level while covariate shocks affect a group of households, community, region or
even the entire country. Thus, a household that experiences an idiosyncratic shock is more likely to rely on
its neighbours for support, while households experiencing covariate shocks are less likely to do so as their
neighbours are also exposed to the same shock. Based on these distinctions, environmental shocks are mostly
covariate shocks in nature. It can also be inferred that the managing covariate shocks are more challenging
than idiosyncratic shocks as they affect a large proportion of households in the same community (Patnaik
et al., 2016).
The coastal zone of Bangladesh, which makes up approximately 30% of the total area of the country,
is particularly vulnerable to natural disasters. Its topographic and geo-physical location makes it prone to
periodic cyclones, floods and riverbank erosion. Depending on the nature and consequences of these natural
disasters, we classify the covariate environmental shocks into two categories—transient and permanent.
2.1. Transient shocks
Transient environmental shocks can be defined as a temporary exposure to a particular natural hazard.
Depending on the frequency, duration and intensity, floods and cyclones can be considered as common
transient shocks in the coastal areas of Bangladesh.
Bangladesh is one of the most flood-prone countries in the world due to its unique geographical location,
topography and exposure to monsoon rainfall. In the last 30 years, Bangladesh has experienced severe floods
5
during 1987-1988, 1998-1999, 2004-2005, 2007, 2010 and 2017. With 50% of the land less than 8 meters
above sea level, and a coastline of 600 km, coastal flooding is an alarming problem for Bangladesh. This not
only creates significant hardship for the people of coastal communities but also results in short-term and
long-term population displacements (Poncelet et al., 2010).
Cyclones that are usually accompanied by high winds and storm-surges, hit Bangladesh every three
years on average (Dasgupta et al., 2010; Mallick and Etzold, 2015). The coastal area of Bangladesh has
witnessed several cyclones in the last 50 years. Among them, Bhola in 1970, Gorky in 1991, Sidr in 2007,
Aila in 2009, and Komen in 2015 are the deadliest cyclones on record. Cyclones that destroy the homesteads
and livelihoods of millions of people in the coastal areas of Bangladesh trigger internal migration. Studies
have found that the victims of cyclones move away because of resource scarcity, infrastructure damages and
absent social protection, as well as the unavailability of income-generating alternatives (Poncelet et al., 2010;
Mallick et al., 2017).
2.2. Permanent shock
While events such as cyclones and floods may cause the affected households to leave their homes temporar-
ily, hazards like riverbank erosion that causes landloss forces households to move permanently. Households
living close to riverbanks often experience the loss of homestead and agricultural land which reduces their
production and employment opportunities, and subsequently threaten their livelihood security (Alam et al.,
2017, 2018). People living in the south west coastal belt are particularly exposed to permanent natural
hazards like riverbank erosion and find migration a viable coping strategy (Poncelet et al., 2010; Brammer,
2014; Kabir et al., 2018; Mollah and Ferdaush, 2015). Among all the climate-induced migrants in Dhaka
city, a significant proportion are from the coastal districts of Bangladesh such as Barguna, Patuakhali,
Maheshkhali, Noakhali, Bhola, Satkhira and Jessore, which are highly vulnerable to the natural hazards
including riverbank erosion (Adri and Simon, 2018).
In the past, three major rivers in Bangladesh—Padma, Meghna, and Jamuna —have eroded several
thousands hectares of floodplain and damaged extensive road and rail network, and displaced millions of
people (Das et al., 2014). This process has a long-term impact on the livelihood of people, society and
economy. However, due to the slow process and scattered incidences, this does not draw the attention of
media and policy makers in the same way victims of flood and cyclones do. For instance, the victims of
riverbank erosion receive less support from both the local and central government in the form of credit,
relief or any other type of financial support to fight against this silent catastrophe. As a result, the victims
6

of riverbank erosion leave their area on their own initiative and search for a place to survive socially and
economically (Zaber et al., 2018).
3. Survey design and sampling procedure
The area of Bangladesh is divided into eight administrative divisions of which, Khulna, Barisal and
Chittagong belong to the coastal zone. Each division is composed of several districts to make a total
of 64 districts in the country and the coastal area of Bangladesh covers 19 districts, most of which are
frequently affected by environmental shocks like cyclones, floods and riverbank erosions (Dasgupta et al.,
2014; Brammer, 2014). In 2015, we conducted a survey—Coastal Vulnerability and Livelihood Security
(CVLS) survey—to identify the link of transient and permanent environmental shocks with households’
migration decision and the choice of destination (nearest small city vs. distant big city).4 The survey design
targeted the areas affected by different type of natural disasters in recent years. The CVLS survey organised
face to face household interviews to collect data from nine south west districts in Khulna and Barisal
divisions. To better understand the dynamics of internal migration scenario in Bangladesh, the CVLS
survey tracked households of coastal area who were included in the Household Income and Expenditure
Survey (HIES) 2000 but now migrated to the nearby metropolitan city Khulna (of Khulna district) or
the distant capital city Dhaka (of Dhaka District) in Bangladesh. The origin and destination of migrant
households are shown in Figure 1.
[Figure 1]
Based on the survey design of nationally representative HIES, the CVLS collected information of 2,096
households. The distribution of respondents among source and destination districts is shown in Table 1.
The table shows that about 59 per cent of households in the survey migrated from one location to another.5
Among them, around 39 per cent of households moved to the nearest Khulna city, 31 per cent migrated to
the capital city Dhaka and 30 per cent settled down in 35 other districts in Bangladesh. On the other hand,
the origin of most of the migrants were Bagerhat and Khulna (20 per cent each), followed by Satkhira (18
per cent), Bhola (12 per cent) and Borguna (6 per cent). The rest 25 per cent of the migrants came from 32
4The Evaluation and Consulting Services (ECONS) Limited implemented the CVLS survey on behalf of the research teamled by Florida International University. The survey data was collected between August-December 2015. Additional informationon the survey can be available from the authors upon request.
5This seems a bit high but consistent with some recent studies like Marshall and Rahman (2013) who find that the populationgrowth rate between 2000-2010 in coastal areas is nearly half than the national average. Unfortunately, we could not find anyreliable source providing the rate of outmigration in our surveyed districts. Thus we used unweighted analysis throughout ourstudy.
7

other districts, some of which are outside our surveyed area. These internal migrants are mostly permanent
or long-term migrants who did not indicate any intention of returning to their location of origin.
[Table 1]
Information in our survey include data on the occurrence of internal migration as well as their desti-
nation. We also asked households whether they have suffered from any environmental shocks like floods,
cyclones or riverbank erosions in recent years. Other important information collected in the survey include,
households’ socio-demographic condition, educational status of the household members, ownership of hous-
ing, land ownership and landholding, value of households’ assets, whether received credit or relief support
and other economic activities. We also collected information on household income by asking them about
the components of earnings coming from different sources. We further computed household consumption
by asking about their consumption of food items like rice, food crops, wheat, lentils, edible oil, vegetables,
poultry items, dairy items, salt, sugar, dry food, beverages, among others that they have consumed as well
as the non-food consumption like expenditure on fuel, house rent, transportation, educational, toiletries,
clothing, utensils and medical items.
A number of sampled households have missing information on household size, gender and age of household
head as well as land ownership, asset, income and consumption. We dropped such 287 households from our
analysis.6,7 Thus our final analysis sample consists of 1,809 households.
Table 2 presents the summary statistics of explanatory variables considered in our analysis. Regarding
the exposure to natural disasters, about 28 per cent of the households experienced riverbank erosion, a
permanent environmental shock, compared to transient environmental shocks like cyclones (12 per cent)
and floods (8 per cent). In our sample, the majority of the households in Bhola district are affected by
riverbank erosion while respondents from Barguna and Khulna districts experienced significant threats from
cyclones Sidr and Aila, respectively.8 Note that household income and consumption in Table 2 are reported
in current prices which, when adjusted for inflation between 2000 and 2015, appear to be close between the
two periods.9
[Table 2]
6We dropped households who reported zero income which, we believe, are implausible and represent missing income.7We did not observe any systematic difference in the excluded sample and the analysis sample regarding their observed
characteristics. As a result, we do not expect any selection bias in our sample.8Data not reported.9The inflation rate between 2000 and 2015 was around 300 per cent as calculated using CPI (with changing base) reported
in Bangladesh Bureau of Statistics (2011, 2018).
8
4. Empirical framework
We examine the impact of different type of natural disasters on internal migration by using the following
model
Pr(Mi = 1|X) = α+ βEi + γHi + θWi + ψZi + λd + εi (1)
where, for each i, M takes the value of 1 if household head migrates and 0 otherwise, E, H, W and Z
are vectors of explanatory variables and ε is the error term. The vector of explanatory variable E includes
separate controls for exposure to disasters like floods, cyclones and riverbank erosions.10 In some separate
models E represents transient shocks (floods or cyclones) and permanent shock (riverbank erosions) that
households experience. H is the vector of household characteristics that include household size, and sex,
age, age squared, marital status and religion of household head. H also includes indicators for literacy of
household head, whether household head has a personal phone and whether there is electricity connection in
their residence. The income and wealth components are represented by the vector W that includes amount
of land owned by the household, a dummy indicating house ownership, household income and asset value.
The vector Z includes separate dummies for receiving credit or relief by the household that can be considered
as coping instruments against natural hazards. Finally, we control for the district fixed effects λd in our
model to net out the effect of time-invariant variables (such as the communication and job opportunity in
a district) that are correlated with the explanatory variables, leading to the problem of endogeneity.
We use probit regression to estimate equation (1). This is due to the fact that the binary response
model ensures the estimated probabilities to lie within zero and one and allow independent variables to have
non-constant partial effects. Since alternative estimation techniques like logit and linear probability model
(LPM) provide similar results, we only rely on the probit models for our conclusions and report them in our
analysis.
We also examine the determinants of destination choices. In particular, we examine how factors like
transient and permanent shock affect migration to different types of destinations. This is motivated by the
fact that personal preference of the migrant and the availability of amenities can influence households to
move to a specific location (Von Reichert and Rudzitis, 1992; Mollah and Ferdaush, 2015; Mishra, 2016). In
10Our data includes information on exposure to salinity, drought and some other type of natural disasters. Since a very smallgroup of households suffer from these disasters, we excluded separate controls for them. Our conclusions remain unchanged incase they are included in the model.
9
determining the choice of alternative locations, we use the the model given below11
Pr(Mi = 1, 2, 3|X) = α+ βEi + γHi + θWi + ψZi + λd + εi (2)
where, in addition to the notations described earlier, for each i, M takes a value of zero for no migration,
1 for migration to Dhaka city, 2 for migration to Khulna city and 3 for migration to other cities. In that
model we use a set of independent variables that are similar to our previous model including the district
fixed effects. Because of the advantage of binary choice models over the linear probability model mentioned
earlier, we use the multinomial probit model to estimate equation (2).
Next, we empirically analyse the impact of migration on household income and consumption. The
availability of data in 2000 and 2015 for both group of households—who migrate and who do not—allow us
to employ a difference-in-differences (DD) model as follows
Yi = α+ β1Mi + β2Posti + β3Mi × Post+ γHi + θWi + λd + εi (3)
where, for each i, Y represents income (or consumption in other models). M is a dummy for migration
(reference group is no migration) and Post is a dummy for 2015 values (reference year is 2000). The vectors
H, W , Z and λd represents the same set of variables we defined earlier and they are included in the model
to control for any difference between the two groups with regard to those characteristics. One obvious
exception is the exclusion of household income when it is the dependent variable in the model. We employed
the same model for investigating the impact on household consumption in which, we included household
income as an explanatory variable.12
The identifying assumption in our DD estimation is the parallel trend of income (and consumption)
between migrants and non-migrants. In other words, without migration, the difference in income (and
consumption) between the two groups would have remained the same. We cannot test our identifying
assumption directly but we are not aware of any reason that indicates different trends of consumption and
income for these two groups.
11The multinomial probit model for migration choices is motivated by the framework of the random utility model discussedin Davies et al. (2001).
12Income is the most important determinant of consumption and thus studies routinely employ household income in explainingconsumption (see, e.g., Hasan, 2016b).
10

5. Estimation results and discussion
5.1. Types of shocks and migration
We start with identifying the links between different types of of environmental shocks and internal
migration employing equation (1) and probit regressions. The marginal effects, that are estimated at the
mean values of all other covariates, are reported in Table 3.13 Column 1 presents results that are estimated
using separate controls for natural disasters—flood, cyclone and riverbank erosion—but excludes other
control variables as well as the district fixed effects. It indicates a significant effect of all type of natural
disasters that is lowest for cyclone (a transient shock) and highest for riverbank erosion (the permanent
shock).14
[Table 3]
When we add additional control variables to the model, estimated marginal effects change (Column 2).
Specifically, the effect of cyclone become insignificant while the effect of flood and riverbank erosion shrinks.
Among the significant variables, age of household head negatively affects migration while migration is higher
for married household heads. Such results are reasonable as older households are more attached to their
location of origin and thus may have a tendency to migrate less. Also, in a finite work life, mature age
workers are not as motivated as young workers since they have less time to accumulate income (Kennan and
Walker, 2011). Married households, on the other hand, can be more desperate to improve their livelihood
and therefore migrate more, as we find in our study.
Literacy can affect migration in both ways. In one hand, education may provide more opportunity
to improve livelihood by migrating to a new place (Sandefur and Scott, 1981; De Jong, 2000). On the
other hand, literate households may migrate less as they may have a better understanding of coping and
mitigation mechanisms, allowing them to stay at their place of origin (Marshall and Rahman, 2013). Our
study supports the latter hypothesis. Mobile phones may facilitate migration by allowing people to network
with others living in potential migration destinations. Transferring property can be time-consuming in
Bangladesh which can be relevant for house owners. Such households may also have enhanced capacity to
cope up. Thus it is reasonable for people living in their own house to be less likely to migrate, as we see
in our results. Lower migration of the people who receive credit can also be expected as they can spend
13Since the individual regression coefficients of probit models are difficult to interpret, we reported marginal effects. Fullregression results are available from the authors upon request.
14All tests are conducted at the 5 per cent significance level.
11

the money on mitigating the negative effect of natural hazards as well as on coping up activities to allow
them to stay at their place of origin. Assets discourage households to migrate, probably in the same way
house ownership does. Interestingly, high income households are more likely to migrate. One potential
explanation can be that higher income people can afford the cost of migration. It may also be the case that
such households are more motivated to migrate to protect their income.
Column 3 of Table 3 presents the estimated results of the model that also controls for the fixed effects
at the district level. The previous results largely remain unchanged in this model where, cyclone is not
statistically significant while flooding increases the probability of migration by 24 per cent. The estimated
effect of flood is similar to some previous findings. For example, Gray and Mueller (2012) observed flooding
to have modest effect on internal mobility in Bangladesh, especially for the women and the poor. In this
model, riverbank erosion, which washes away assets and homesteads of rural households, increases domestic
migration by 43 per cent. The results reveal that riverbank erosion is the key driver of internal mobility
since the victims of this hazard become destitute who eventually migrate. This pattern is also observed by
Das et al. (2014). The only variable which is not significant in the previous model but significant in the
model with district fixed effect is household size. Household size may have an ambiguous effect on internal
migration decision. In one way, larger households might be able to diversify their income by sending one
of their members to a different location (Li et al., 2014). In contrast, the larger the family size, the more
difficult it would be to migrate due to the associated cost (and management) of migration. Better coping
by such households through job and income diversification and then not migrating can also be a possibility.
The significantly negative effect of household size in our study indicates that the latter hypothesis can be
more relevant for Bangladesh.
Next, we compare the effect of transient and permanent shocks. Column 4-6 repeats the previous analysis
conducted in columns 1-3 but now include group shocks in the model while drop separate controls for cyclone,
flood and riverbank erosion. Again, the results are largely similar. In the final model with all controls and
district fixed effects, presented at column 6, people affected by transient shocks are 11 percent more likely
to migrate. On the other hand, permanent shocks induce people to migrate more by 41 per cent compared
to the people who do not suffer from any natural hazard. In summary, Table 3 demonstrates that transient
and permanent shocks affect domestic migration differently with higher effects for permanent shock and
lower effect for transient shock.
Our results are robust to a number of modifications in the model. For example, we get a similar results
when we use a linear probability model (see appendix Table A.1). We also arrive at a similar conclusion
12

when we use logistic regression model for our analysis. In all cases, our model fit appears reasonable, as
given by the Pseudo R2 (or Adjusted R2 in case of LPM).
One important point of consideration here is to figure out the best approach to model environmental
shocks. Columns 1-3 of Table 3 include all types of environmental shocks as separate independent variables
whereas columns 4-6 group flood and cyclone together to represent them as a transient shock, leaving
riverbank erosion as the permanent shock. While model results are largely similar, the model in column 6
can be considered superior as indicated by the lower values of the BIC (Bayesian information criterion)
compared to the values of the corresponding model.15 As a result, we continue to use grouped shocks in the
latter part of our study.
5.2. Choice of migration destination
At this stage, we start looking at how different type of shocks affect the choice of migration destination.
We employ equation (2) and estimate it using multivariate probit regression. Table 4 presents the marginal
effects estimated from the multivariate probit model, again calculated at the mean values of all other
covariates. The determinants of migrating to Dhaka, presented at column 1, indicate that transient shocks
do not induce people migrating to the big city. However, permanent shock is very important in explaining
their migration to Dhaka city. On the other hand, both transient and permanent shocks significantly affect
households to migrate to Khulna city but the latter has a much higher impact than the former (column 2).
When we consider migration to other cities, we find a significant impact of permanent shock but no effect
of temporary shock on their move (column 3).
[Table 4]
The effect of other variables, presented in Table 4, are largely similar to those in Table 3. However,
there are some interesting differences in the effect of the explanatory factors on migrating to a particular
type of destination. For instance, literacy of household head negatively affects migration to either Dhaka or
Khulna (cities) but has no effect on migrating to other cities. This is consistent with the two hypotheses we
discussed earlier—literacy can allow to people cope up and stay at the location of origin but also can offer
better opportunity through migration. In particular, the former argument can be important for migrating
Dhaka and Khulna while both (or none) can be relevant for migrating to other cities and thus producing a
null result. As expected, mobile phone can affect migration to Dhaka by allowing to network with people in
15We prefer BIC over AIC as the former favours parsimonious models (Chakrabarti and Ghosh, 2011).
13

Dhaka while it may not be relevant for migrating nearby cities as networking with people from those cities
is possible without phones. Living in own house, while has a significantly negative effect on migrating to
cities in Dhaka and Khulna, the effect is significant for other cities only at the 10 per cent level of significant.
The most interesting case is receiving credit which is considered as a coping instrument to natural disaster.
Receiving credit negatively affects migrating to Dhaka city but positively affects migrating to Khulna and
other cities. Receiving credit can be tied with the condition of not migrating to a distant place but may
encourage migration to a nearby place as credit may allow them to expand income generating activities.
Relief has no impact on migration to Dhaka and Khulna but impacts positively in migrating to other cities.
This can be due to the fact that affected households, who receive relief, may have friends and relative to
other cities where they can migrate easily. Non-land asset holding has a negative effect on migration but
the impact is not statistically significant for migrating to khulna. One potential reason can be the inclusion
of income, asset and land ownership in the model which, altogether over-controls household entitlement in
our specification.
Our overall results in Table 4 indicate that permanent shocks have significant and positive impact on
the choice of all the migration destinations. However, transient shock only affects migration to the nearby
city Khulna and not migration to any other cities. We also arrive at similar conclusions when we employ
independent probit regressions (see appendix Table A.2) or the multinomial logit regression to explain the
choice of migration destinations. Such results are expected as people may like to stick at their location of
origin or temporarily shift to nearby destinations when the shock is temporary. On the contrary, when any
shock does a permanent damage to people’s economic condition and livelihood so that they do not have any
intention to come back, they tend to migrate to a place with more opportunities like the megacity Dhaka.
5.3. Impact on income and consumption
Our last hunch is to look at the impact of migration on household income and consumption. Estimated
results of the difference-in-difference model in equation (3) are presented at Table 5. Column 1 in the
table estimates the model without any control variable and shows that, in 2000, there was no significant
difference between the people who migrated (treatment group) and who did not (control group). Over time,
income of both groups increased significantly. The DD estimate indicates that, the increase was nearly
44 percent higher for the people who migrated compared to those who did not. This is equivalent to an
annual growth of 2.5 per cent for fifteen years. It is important to recognise that the effect can be due to
the various macroeconomic and local factors occurred between 2010-2015 that are not controlled for in our
model. However, our results may indicate that migration has been important for such income growth.
14
[Table 5]
Table 5, column 2 adds some additional controls into the model. It produces similar results like those in
column 1. Significant explanatory variables in the model indicate that all of large, male headed, married,
house owners and wealthy households benefit significantly from migration while households with electricity
connection experience the opposite effect. Larger households may have more working members while male
headed households may benefit more as females from conservative households are less likely to be in wage
work or salaried jobs (Ahmed and Sen, 2018) and even if they work, women earn less due to the discrimination
against women in Bangladesh (Ahmed and Maitra, 2010, 2015). On the other had, married households can
be more desperate to improve their economic condition. Home ownership and asset holding can have a
positive effect on income. The negative effect of electricity connection appears counter-intuitive but can be
due to the intermittent electricity supply in Bangladesh (Hasan and Mozumder, 2017).
Model estimates largely remain unchanged when we add district fixed effects (Table 5, column 3). The
two exceptions are significant and negative impact of the age of household head and the positive impact of
receiving relief support. Older head may represent households with more elderly members who can be less
productive (Kennan and Walker, 2011). On the other hand, receiving relief may enable households to avoid
the negative shocks of natural disaster. For example, Hasan (2016a) finds that a negative income shock
results in a significant reduction in food consumption that can eventually affect the health and thus future
income.
We observe a similar picture when we conduct our analysis with household consumption (Table 5, columns
4-6). However, migrants (treatment group) start with a lower consumption in 2000—the reference period in
our setting. In the model with district fixed effects (column 6), Muslim households have higher consumption
which can be due to the religion-culture interaction (Cleveland et al., 2013). Households with mobile phones
and electricity connections have higher consumption; land ownership and income also affect consumption
positively. Since all these variables can be considered as proxies to wealth, such effects may reflect the
positive effect of wealth on consumption. In summary, Table 5 indicates that households disproportionately
benefit from migration compared to those who are left behind. Such findings are consistent with some
previous studies (e.g., Beegle et al., 2011; De Brauw et al., 2017) who find large consumption growth after
migration. This is expected as people optimally choose to migrate to maximise their future utility and both
income and consumption can be considered as good proxies for household welfare.
15
All the models of income and consumption in Table 5 have reasonable goodness of fit and the results
are robust to changes in model specification. For example, allowing differential impact for those suffered
transient shock and those suffered permanent shock provides a similar conclusion (see appendix, Table A.3).
To examine whether migration locations have separate effects on household income and consumption,
next we estimate a DD model with three treatment groups—migrating to Dhaka city, migrating to Khulna
city and migrating to other cities—against the same reference group (no migration). Results in Table 6
indicate a similar impact we observed earlier. However, the table indicates that, the groups migrated to
Dhaka or Khulna city benefited while those who migrated to other cities did not. Our conclusions remain
unchanged if we allow for differential impact for transient and permanent shocks as well as for the migration
destinations (see appendix, Table A.4).
[Table 6]
To sum up, Table 6 indicates that migration location was important for household welfare. Compared
to people who did not migrate, households disproportionately benefited by migrating to Dhaka or Khulna
city whereas those who migrated to other cities did not. Since the opportunity of working and earning is
much higher in larger cities, people migrated there are expected to have higher income and consumption.
Our analysis primarily suggest that the government should assist in the migration process to improve
the welfare of the victims of natural disasters. This is in line with the results of Bryan et al. (2014), who
randomly assigned an $8.50 incentive to households in rural Bangladesh to temporarily migrate to cities
during the lean season. They found that the incentive induces 22 per cent of households to send a seasonal
migrant and their consumption at the origin increases significantly. Adaptation by internal migration is
effective as the incremental cost of adapting to climate change is small compared with a counterfactual
outcome with no adaptation measures (Dasgupta et al., 2010). The importance of facilitating migration
is further emphasized by the fact that migration is beneficial to both who move out and who stay behind
(Shayegh and Casey, 2017).
It is worth noting that strengthening the adaptive capacity, which may include facilitating internal
migration, also requires developing rural institutions (Agrawal et al., 2012). Involvement of local community,
specifically including women in the decision process, can also be effective in enhancing the adaptability
of affected households (Takasaki, 2014; Grillos, 2018). Complementary policy support such as financial
incentive for facilitating migration, providing low-income housing and creating employment opportunities
need to be set up to help settle the rising influx of migrants into the cities that are struggling to provide
16
basic services to its’ residences (Dustmann and Okatenko, 2014; Kirchberger, 2017; Depetris-Chauvin and
Santos, 2018).
6. Conclusion
We explored the nexus of environmental disasters and internal migration in the south west parts of
Bangladesh. In particular, we investigated the impact of transient and permanent environmental shocks
on migration decision and the choice of destinations. We also investigated how household income and
consumption changed after migration. Controlling for a diverse set of socio-economic and demographic
factors, we found that both transient and permanent environmental shocks force households to migrate.
However, the influence of permanent shocks (riverbank erosions) on migration are much stronger than that
of the transient shocks (cyclones or floods). We also find that households prefer to move into the nearest
metropolitan city when the environmental shock is transient, whereas they tend to relocate to a distant city
when it is permanent in nature. Our analysis on income and consumption indicates that migration can be an
effective coping mechanism against environmental shocks as households’ income and consumption increase
following migration, compared to those who do not migrate.
Our analysis suggests that strengthening the adaptive capacity may include internal migration and thus
the government should assist the migration process to cope with rising vulnerabilities of natural disasters.
Migration, as a strategy of adaptation, is important as it benefits both who migrates as well as those who stay
put by reducing the pressure at the origin. However, in formulating public policies to promote migration,
it is important to be aware that a pro-poor adoption policy should consider the complementarity among
markets, governments, and communities (Sawada and Takasaki, 2017).
17

Tables and Figures
Table 1: Distribution of survey respondents acrossorigin and destination district
Migrated to
Source district Dhaka Khulna Other No migration Total
Bagerhat 26 90 127 330 573Khulna 4 125 119 182 430Satkhira 22 106 93 111 332Bhola 127 13 19 97 256Barguna 52 14 8 58 132Other 149 140 13 71 373Total 380 488 379 849 2,096
Note: 1. A total of 125 people who reported to migrate from Khulna toKhulna moved from rural areas of the district to the city.
Table 2: Summary statistics of independent variables
Variable definition Mean SD
Experienced cyclone in last 10yrs 0.12 0.32Experienced flood in last 10yrs 0.08 0.27Experienced river erosion in last 10yrs 0.28 0.45Transinet shock 0.18 0.39Permanent shock 0.28 0.45Number of household members 4.91 2.18Household head is male 0.94 0.23Age of the household head in years 45.35 13.62Household head is married 0.86 0.35Household head is muslim 0.83 0.37Literacy of household head 0.51 0.50Household head has a personal phone 0.90 0.29Electricity in home 0.55 0.50Owned land in decimals 6.60 10.42Lives in owned house 0.61 0.49Received credit after disaster 0.49 0.50Received relief after disaster 0.41 0.49Non-land asset value (BDT) 4,204 13,930Monthly household income before migration (BDT) 3,754 3,122Monthly household income after migration (BDT) 12,348 7,755Monthly consumption before migration (BDT) 4,126 5,852Monthly consumption after migration (BDT) 15,873 18,792N 1,809
Note: 1. At 31 March 2015 (in the beginning of the survey period), theexchange rate was $US 1 = BDT 78.40 (domestic currency) (BangladeshBank, 2018).2. The inflation rate between 2000 and 2015 (i.e., before and after migrationdata collection time periods) was 300 per cent as calculated using CPI (withchanging base) reported in Bangladesh Bureau of Statistics (2011, 2018).
18

Table 3: Effect on Internal migration: Marginal effects from probit models
All shocks Grouped shocks
(1) (2) (3) (4) (5) (6)
Experienced cyclone in last 10yrs0.096∗∗ -0.036 -0.023(0.043) (0.043) (0.044)
Experienced flood in last 10yrs0.362∗∗∗ 0.262∗∗∗ 0.215∗∗∗
(0.064) (0.070) (0.071)
Experienced river erosion in last 10yrs0.493∗∗∗ 0.357∗∗∗ 0.359∗∗∗
(0.030) (0.045) (0.048)
Transinet shock0.249∗∗∗ 0.115∗∗∗ 0.105∗∗∗
(0.035) (0.040) (0.040)
Permanent shock0.488∗∗∗ 0.340∗∗∗ 0.341∗∗∗
(0.031) (0.045) (0.047)
Number of household members-0.013∗ -0.020∗∗∗ -0.013∗ -0.021∗∗∗
(0.007) (0.007) (0.007) (0.007)
Household head is male0.039 0.013 0.028 0.003
(0.069) (0.068) (0.069) (0.068)
Age of the household head in years-0.003∗∗∗ -0.004∗∗∗ -0.003∗∗∗ -0.003∗∗∗
(0.001) (0.001) (0.001) (0.001)
Household head is married0.267∗∗∗ 0.296∗∗∗ 0.270∗∗∗ 0.300∗∗∗
(0.045) (0.046) (0.046) (0.046)
Household head is muslim0.061∗ 0.047 0.060∗ 0.045(0.031) (0.032) (0.031) (0.032)
Literacy of household head-0.063∗∗ -0.065∗∗ -0.067∗∗ -0.068∗∗
(0.027) (0.027) (0.027) (0.027)
Household head has a personal phone0.139∗∗∗ 0.140∗∗∗ 0.149∗∗∗ 0.147∗∗∗
(0.042) (0.043) (0.043) (0.043)
Electricity in home-0.039 0.026 -0.036 0.030(0.030) (0.031) (0.030) (0.031)
Owned land in decimals-0.002∗ -0.001 -0.003∗∗ -0.002(0.001) (0.001) (0.001) (0.001)
Lives in owned house-0.252∗∗∗ -0.249∗∗∗ -0.245∗∗∗ -0.240∗∗∗
(0.042) (0.044) (0.043) (0.044)
Received credit after disaster0.070∗∗∗ 0.053∗∗ 0.075∗∗∗ 0.058∗∗
(0.025) (0.025) (0.025) (0.025)
Received relief after disaster-0.013 0.017 -0.023 0.009(0.029) (0.029) (0.029) (0.029)
Ln(non-land asset value)-0.062∗∗∗ -0.057∗∗∗ -0.061∗∗∗ -0.056∗∗∗
(0.014) (0.015) (0.014) (0.015)
Ln(monthly income before migration)0.093∗∗∗ 0.101∗∗∗ 0.084∗∗∗ 0.095∗∗∗
(0.017) (0.018) (0.017) (0.018)
Constant0.698∗∗∗ 0.718∗∗∗ 0.732∗∗∗ 0.695∗∗∗ 0.714∗∗∗ 0.730∗∗∗
(0.013) (0.017) (0.017) (0.013) (0.017) (0.017)District fixed effects No No Yes No No YesPsedu R2 0.16 0.29 0.34 0.16 0.28 0.33AIC 1969.13 1707.88 1605.58 1969.64 1719.23 1610.44BIC 1991.13 1812.39 1743.09 1986.14 1818.24 1742.45N 1,809 1,809 1,809 1,809 1,809 1,809
Note: 1. Robust standard errors are reported in the parentheses.∗ p <0.10, ∗∗ p <0.05, ∗∗∗ p <0.01.
19

Table 4: Choice of location for internal migrants:Marginal effects from multinomial probit model
Migrated to
Dhaka Khulna Other cities(1) (2) (3)
Transinet shock0.078 0.670∗∗∗ 0.150
(0.211) (0.168) (0.185)
Permanent shock1.340∗∗∗ 1.308∗∗∗ 0.994∗∗∗
(0.208) (0.195) (0.222)
Number of household members-0.079∗ -0.087∗∗ -0.058∗
(0.043) (0.035) (0.031)
Household head is male0.116 -0.311 0.398
(0.338) (0.319) (0.396)
Age of the household head in years0.023 -0.043 -0.017
(0.033) (0.031) (0.026)
Household head is married1.167∗∗∗ 1.435∗∗∗ 0.862∗∗∗
(0.267) (0.226) (0.207)
Household head is muslim0.399 0.428∗∗ 0.053
(0.240) (0.165) (0.139)
Literacy of household head-0.314∗∗ -0.290∗∗ -0.155(0.150) (0.127) (0.125)
Household head has a personal phone1.276∗∗∗ 0.383∗ 0.289(0.340) (0.210) (0.197)
Electricity in home0.294 0.440∗∗∗ -0.272∗
(0.191) (0.147) (0.140)
Owned land in decimals0.009 -0.018∗∗ -0.006
(0.007) (0.008) (0.006)
Lives in owned house-0.926∗∗∗ -1.081∗∗∗ -0.349∗
(0.213) (0.185) (0.201)
Received credit after disaster-0.299∗∗ 0.328∗∗∗ 0.404∗∗∗
(0.139) (0.121) (0.120)
Received relief after disaster-0.319∗ -0.006 0.341∗∗
(0.182) (0.143) (0.132)
Ln(non-land asset value)-0.471∗∗∗ -0.114 -0.180∗∗
(0.083) (0.071) (0.072)
Ln(monthly income before migration)0.335∗∗∗ 0.147∗∗ 0.830∗∗∗
(0.089) (0.072) (0.139)
Constant-0.074 0.289 -6.659∗∗∗
(1.143) (1.026) (1.384)District fixed effects Yes Yes YesN 1,809
Note: 1. Robust standard errors are reported in the parentheses.2. Reference category is households who do not migrate.∗ p <0.10, ∗∗ p <0.05, ∗∗∗ p <0.01.
20
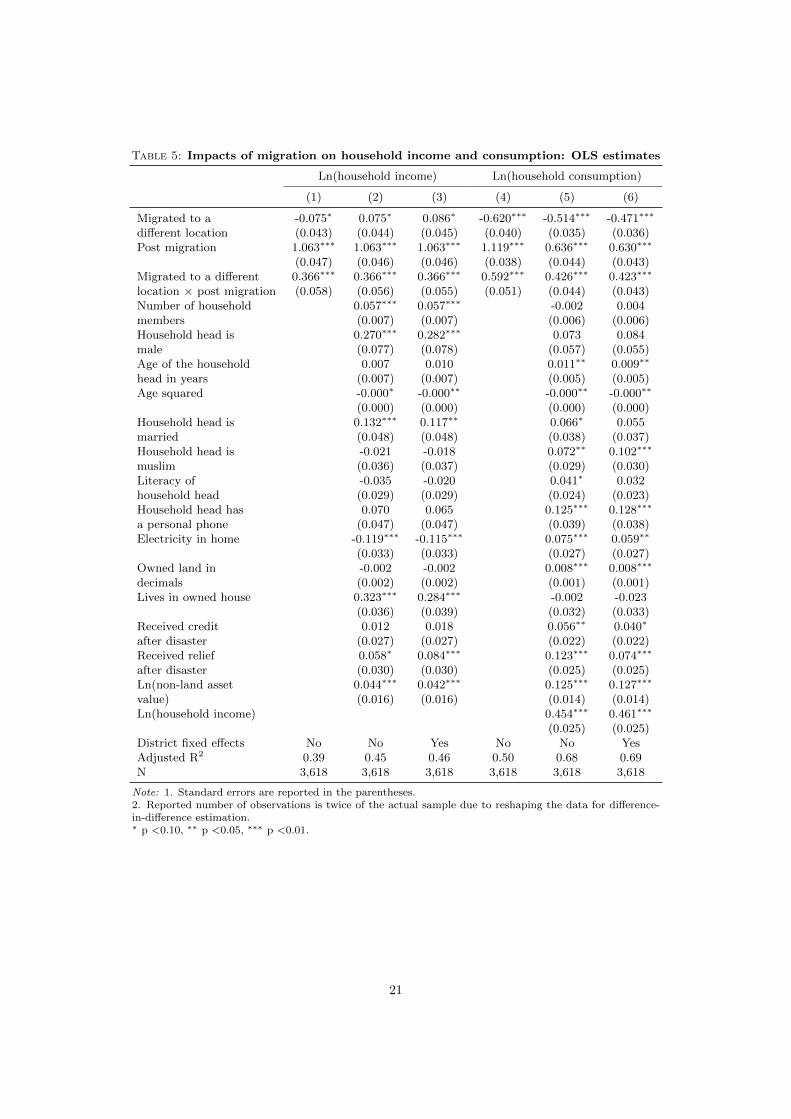
Table 5: Impacts of migration on household income and consumption: OLS estimates
Ln(household income) Ln(household consumption)
(1) (2) (3) (4) (5) (6)
Migrated to a -0.075∗ 0.075∗ 0.086∗ -0.620∗∗∗ -0.514∗∗∗ -0.471∗∗∗
different location (0.043) (0.044) (0.045) (0.040) (0.035) (0.036)Post migration 1.063∗∗∗ 1.063∗∗∗ 1.063∗∗∗ 1.119∗∗∗ 0.636∗∗∗ 0.630∗∗∗
(0.047) (0.046) (0.046) (0.038) (0.044) (0.043)Migrated to a different 0.366∗∗∗ 0.366∗∗∗ 0.366∗∗∗ 0.592∗∗∗ 0.426∗∗∗ 0.423∗∗∗
location × post migration (0.058) (0.056) (0.055) (0.051) (0.044) (0.043)Number of household 0.057∗∗∗ 0.057∗∗∗ -0.002 0.004members (0.007) (0.007) (0.006) (0.006)Household head is 0.270∗∗∗ 0.282∗∗∗ 0.073 0.084male (0.077) (0.078) (0.057) (0.055)Age of the household 0.007 0.010 0.011∗∗ 0.009∗∗
head in years (0.007) (0.007) (0.005) (0.005)Age squared -0.000∗ -0.000∗∗ -0.000∗∗ -0.000∗∗
(0.000) (0.000) (0.000) (0.000)Household head is 0.132∗∗∗ 0.117∗∗ 0.066∗ 0.055married (0.048) (0.048) (0.038) (0.037)Household head is -0.021 -0.018 0.072∗∗ 0.102∗∗∗
muslim (0.036) (0.037) (0.029) (0.030)Literacy of -0.035 -0.020 0.041∗ 0.032household head (0.029) (0.029) (0.024) (0.023)Household head has 0.070 0.065 0.125∗∗∗ 0.128∗∗∗
a personal phone (0.047) (0.047) (0.039) (0.038)Electricity in home -0.119∗∗∗ -0.115∗∗∗ 0.075∗∗∗ 0.059∗∗
(0.033) (0.033) (0.027) (0.027)Owned land in -0.002 -0.002 0.008∗∗∗ 0.008∗∗∗
decimals (0.002) (0.002) (0.001) (0.001)Lives in owned house 0.323∗∗∗ 0.284∗∗∗ -0.002 -0.023
(0.036) (0.039) (0.032) (0.033)Received credit 0.012 0.018 0.056∗∗ 0.040∗
after disaster (0.027) (0.027) (0.022) (0.022)Received relief 0.058∗ 0.084∗∗∗ 0.123∗∗∗ 0.074∗∗∗
after disaster (0.030) (0.030) (0.025) (0.025)Ln(non-land asset 0.044∗∗∗ 0.042∗∗∗ 0.125∗∗∗ 0.127∗∗∗
value) (0.016) (0.016) (0.014) (0.014)Ln(household income) 0.454∗∗∗ 0.461∗∗∗
(0.025) (0.025)District fixed effects No No Yes No No YesAdjusted R2 0.39 0.45 0.46 0.50 0.68 0.69N 3,618 3,618 3,618 3,618 3,618 3,618
Note: 1. Standard errors are reported in the parentheses.2. Reported number of observations is twice of the actual sample due to reshaping the data for difference-in-difference estimation.∗ p <0.10, ∗∗ p <0.05, ∗∗∗ p <0.01.
21

Table 6: Impacts of migration location on household income and consumption:OLS estimates
Ln(household income) Ln(household consumption)
(1) (2) (3) (4) (5) (6)
Migrated to Dhaka -0.397∗∗∗ -0.158∗∗∗ -0.184∗∗∗ -0.886∗∗∗ -0.595∗∗∗ -0.474∗∗∗
(0.057) (0.061) (0.064) (0.056) (0.050) (0.054)Migrated to Khulna -0.269∗∗∗ -0.118∗∗ -0.101∗ -0.824∗∗∗ -0.659∗∗∗ -0.615∗∗∗
(0.059) (0.058) (0.060) (0.059) (0.044) (0.045)Migrated to other 0.503∗∗∗ 0.453∗∗∗ 0.456∗∗∗ -0.086∗ -0.296∗∗∗ -0.288∗∗∗
city (0.045) (0.047) (0.047) (0.047) (0.044) (0.044)Post migration 1.063∗∗∗ 1.063∗∗∗ 1.063∗∗∗ 1.119∗∗∗ 0.657∗∗∗ 0.648∗∗∗
(0.047) (0.046) (0.045) (0.038) (0.043) (0.043)Migrated to Dhaka 0.737∗∗∗ 0.737∗∗∗ 0.737∗∗∗ 0.776∗∗∗ 0.455∗∗∗ 0.449∗∗∗
× post migration (0.072) (0.069) (0.069) (0.067) (0.057) (0.056)Migrated to Khulna 0.451∗∗∗ 0.451∗∗∗ 0.451∗∗∗ 0.877∗∗∗ 0.681∗∗∗ 0.677∗∗∗
× post migration (0.075) (0.072) (0.071) (0.070) (0.055) (0.054)Migrated to other -0.121∗ -0.121∗ -0.121∗ 0.040 0.093 0.094location × post migration (0.066) (0.065) (0.064) (0.063) (0.059) (0.058)Number of household 0.056∗∗∗ 0.056∗∗∗ -0.001 0.005members (0.007) (0.007) (0.006) (0.006)Household head is 0.253∗∗∗ 0.262∗∗∗ 0.076 0.086male (0.076) (0.077) (0.056) (0.054)Age of the household 0.007 0.009 0.011∗∗ 0.010∗∗
head in years (0.007) (0.006) (0.005) (0.005)Age squared -0.000∗ -0.000∗∗ -0.000∗∗ -0.000∗∗
(0.000) (0.000) (0.000) (0.000)Household head is 0.143∗∗∗ 0.136∗∗∗ 0.074∗ 0.060married (0.047) (0.047) (0.038) (0.037)Household head is 0.001 -0.001 0.080∗∗∗ 0.104∗∗∗
muslim (0.036) (0.036) (0.029) (0.030)Literacy of -0.037 -0.025 0.037 0.032household head (0.028) (0.028) (0.023) (0.023)Household head has 0.072 0.073 0.136∗∗∗ 0.128∗∗∗
a personal phone (0.047) (0.047) (0.039) (0.038)Electricity in home -0.094∗∗∗ -0.085∗∗∗ 0.085∗∗∗ 0.061∗∗
(0.032) (0.032) (0.027) (0.027)Owned land in -0.002 -0.002 0.008∗∗∗ 0.008∗∗∗
decimals (0.002) (0.002) (0.001) (0.001)Lives in owned house 0.264∗∗∗ 0.229∗∗∗ -0.022 -0.024
(0.037) (0.039) (0.033) (0.033)Received credit 0.013 0.015 0.047∗∗ 0.042∗
after disaster (0.027) (0.027) (0.022) (0.022)Received relief 0.045 0.069∗∗ 0.115∗∗∗ 0.074∗∗∗
after disaster (0.030) (0.031) (0.025) (0.025)Ln(non-land asset 0.045∗∗∗ 0.041∗∗∗ 0.122∗∗∗ 0.129∗∗∗
value) (0.016) (0.015) (0.013) (0.013)Ln(household income) 0.435∗∗∗ 0.443∗∗∗
(0.025) (0.025)District fixed effects No No Yes No No YesAdjusted R2 0.44 0.48 0.48 0.54 0.68 0.69N 3,618 3,618 3,618 3,618 3,618 3,618
Note: See footnotes in Table 5.
22

Note: 1. Polygon indicates current location of migrants while its’ colour represents their district of origin.
Figure 1: Origin and destination of migrant households
23

References
Adri, N. and Simon, D. (2018). A tale of two groups: focusing on the differential vulnerability of “climate-induced” and
“non-climate-induced” migrants in Dhaka City. Climate and Development, 10(4):321–336.
Agrawal, A. and Perrin, N. (2008). Climate adaptation, local institutions and rural livelihoods. IFRI Working Paper W08I-6,
School of Natural Resources and Environment, University of Michigan, MI, USA.
Agrawal, A., Perrin, N., Chhatre, A., Benson, C. S., and Kononen, M. (2012). Climate policy processes, local institutions, and
adaptation actions: Mechanisms of translation and influence. Wiley Interdisciplinary Reviews: Climate Change, 3(6):565–
579.
Ahmed, S. and Maitra, P. (2010). Gender wage discrimination in rural and urban labour markets of Bangladesh. Oxford
Development Studies, 38(1):83–112.
Ahmed, S. and Maitra, P. (2015). A distributional analysis of the gender wage gap in Bangladesh. The Journal of Development
Studies, 51(11):1444–1458.
Ahmed, T. and Sen, B. (2018). Conservative outlook, gender norms and female wellbeing: Evidence from rural Bangladesh.
World Development, 111:41–58.
Alam, G. M., Alam, K., and Mushtaq, S. (2017). Climate change perceptions and local adaptation strategies of hazard-prone
rural households in Bangladesh. Climate Risk Management, 17:52–63.
Alam, G. M., Alam, K., Mushtaq, S., and Leal Filho, W. (2018). How do climate change and associated hazards impact on
the resilience of riparian rural communities in Bangladesh? Policy implications for livelihood development. Environmental
Science & Policy, 84:7–18.
Bangladesh Bank (2018). Monthly Economic Trends. Monthly report, Bangladesh Bank, Dhaka, Bangladesh.
Bangladesh Bureau of Statistics (2011). Statistical Year Book Bangladesh 2010. Report, BBS, Ministry of Planning, Government
of the People’s Republic of Bangladesh, Dhaka, Bangladesh.
Bangladesh Bureau of Statistics (2018). Statistical Year Book Bangladesh 2017. Report, BBS, Ministry of Planning, Government
of the People’s Republic of Bangladesh, Dhaka, Bangladesh.
Barrios, S., Bertinelli, L., and Strobl, E. (2006). Climatic change and rural–urban migration: The case of sub-Saharan Africa.
Journal of Urban Economics, 60(3):357–371.
Beegle, K., De Weerdt, J., and Dercon, S. (2011). Migration and economic mobility in Tanzania: Evidence from a tracking
survey. Review of Economics and Statistics, 93(3):1010–1033.
Black, R., Adger, W. N., Arnell, N. W., Dercon, S., Geddes, A., and Thomas, D. (2011a). The effect of environmental change
on human migration. Global Environmental Change, 21:S3–S11.
Black, R., Kniveton, D., and Schmidt-Verkerk, K. (2011b). Migration and climate change: Towards an integrated assessment
of sensitivity. Environment and Planning A, 43(2):431–450.
Blaikie, P., Cannon, T., Davis, I., and Wisner, B. (2004). At risk: Natural hazards, people’s vulnerability and disasters.
Routledge, NY, USA.
Brammer, H. (2014). Bangladesh’s dynamic coastal regions and sea-level rise. Climate Risk Management, 1:51–62.
Brown, P., Daigneault, A. J., Tjernstrøm, E., and Zou, W. (2018). Natural disasters, social protection, and risk perceptions.
World Development, 104:310–325.
Bryan, G., Chowdhury, S., and Mobarak, A. M. (2014). Underinvestment in a profitable technology: The case of seasonal
migration in Bangladesh. Econometrica, 82(5):1671–1748.
24

Bunea, D. (2012). Modern gravity models of internal migration: The case of Romania. Theoretical and Applied Economics,
4(4):127.
Caruso, G. D. (2017). The legacy of natural disasters: The intergenerational impact of 100 years of disasters in Latin America.
Journal of Development Economics, 127:209–233.
Cattaneo, t. and Peri, G. (2016). The migration response to increasing temperatures. Journal of Development Economics,
122:127–146.
Chakrabarti, A. and Ghosh, J. K. (2011). AIC, BIC, and recent advances in model selection. In Bandyopadhyay, P. S.
and Forster, M. R., editors, Philosophy of Statistics, volume 7 of Handbook of the Philosophy of Science, pages 583–605.
North-Holland, Amsterdam, the Netherlands.
Chen, J. J. and Mueller, V. (2018). Salt of the earth: Migration, adaptation, and soil salinity in coastal Bangladesh. Conference
Paper, Presented at the ASSA 2018 Annual Meeting in Philadelphia, PA, USA. Available from: https://goo.gl/YDWZBy
[Accessed: 15 March 2018].
Chen, J. J., Mueller, V., Jia, Y., and Tseng, S. K.-H. (2017). Validating migration responses to flooding using satellite and
vital registration data. American Economic Review, 107(5):441–45.
Cleveland, M., Laroche, M., and Hallab, R. (2013). Globalization, culture, religion, and values: Comparing consumption
patterns of lebanese muslims and christians. Journal of Business Research, 66(8):958–967.
Coronese, M., Lamperti, F., Chiaromonte, F., Roventini, A., et al. (2018). Natural disaster risk and the distributional dynamics
of damages. Working Paper 2018/22, Laboratory of Economics and Management (LEM), SantAnna School of Advanced
Studies, Pisa, Italy. Available from: https://goo.gl/te3iKL [Accessed: 23 August 2018].
Das, T. K., Haldar, S. K., Gupta, I. D., and Sen, S. (2014). River bank erosion induced human displacement and its conse-
quences. Living Review of Landscape Research, 8(3):1–35.
Dasgupta, S. (2018). Burden of climate change on malaria mortality. International Journal of Hygiene and Environmental
Health, 221(5):782–791.
Dasgupta, S., Akhter Kamal, F., Huque Khan, Z., Choudhury, S., and Nishat, A. (2014). River salinity and climate change:
Evidence from coastal Bangladesh. Policy Research Working Paper 6817, World Bank, Washington DC, USA.
Dasgupta, S., Huq, M., Khan, Z. H., Ahmed, M. M. Z., Mukherjee, N., Khan, M., and Pandey, K. D. (2010). Vulnerability
of Bangladesh to cyclones in a changing climate: Potential damages and adaptation cost. Policy Research Working Paper
5280, World Bank, Washington DC, USA.
Davies, P. S., Greenwood, M. J., and Li, H. (2001). A conditional logit approach to US state-to-state migration. Journal of
Regional Science, 41(2):337–360.
De Brauw, A., Mueller, V., and Woldehanna, T. (2017). Does internal migration improve overall well-being in Ethiopia?
Journal of African Economies, 27(3):347–365.
De Jong, G. F. (2000). Expectations, gender, and norms in migration decision-making. Population Studies, 54(3):307–319.
Depetris-Chauvin, E. and Santos, R. J. (2018). Unexpected guests: The impact of internal displacement inflows on rental
prices in Colombian host cities. Journal of Development Economics, 134:289–309.
Desmet, K., Kopp, R. E., Kulp, S. A., Nagy, D. K., Oppenheimer, M., Rossi-Hansberg, E., and Strauss, B. H. (2018). Evaluating
the Economic Cost of Coastal Flooding. Working Paper 24918, National Bureau of Economic Research, Cambridge, MA,
USA.
25

Dustmann, C. and Okatenko, A. (2014). Out-migration, wealth constraints, and the quality of local amenities. Journal of
Development Economics, 110:52–63.
FAO (2018). The impact of disasters on agriculture and food security. Technical Paper, Food and Agriculture Organisation
(FAO), Rome, Italy. Available from: https://goo.gl/b9TEvf [Accessed: 5 March 2018].
Felbermayr, G., Groschl, J. K., Sanders, M., Schippers, V., and Steinwachs, T. (2018). Shedding light on the spatial diffusion
of disasters. CESifo Working Paper No. 7146, Munich Society for the Promotion of Economic Research - CESifo, Munich,
Germany. Available from: https://goo.gl/wVqf4Q [Accessed: 30 August 2018].
Fischer, A. P. (2018). Pathways of adaptation to external stressors in coastal natural-resource-dependent communities: Impli-
cations for climate change. World Development, 108:235–248.
Gemenne, F. (2011). Why the numbers don’t add up: A review of estimates and predictions of people displaced by environmental
changes. Global Environmental Change, 21:S41–S49.
Gray, C. L. and Mueller, V. (2012). Natural disasters and population mobility in Bangladesh. Proceedings, National Academy
of Sciences, Washington DC, USA.
Grillos, T. (2018). Women’s participation in environmental decision-making: Quasi-experimental evidence from northern
Kenya. World Development, 108:115–130.
Hasan, S. A. (2016a). Engel curves and equivalence scales for Bangladesh. Journal of the Asia Pacific Economy, 21(2):301–315.
Hasan, S. A. (2016b). The impact of the 2005-10 rice price increase on consumption in rural Bangladesh. Agricultural
Economics, 47(4):423–433.
Hasan, S. A. and Mozumder, P. (2017). Income and energy use in Bangladesh A household level analysis. Energy Economics,
65:115–126.
IPCC (2007). Impacts, Adaptation and Vulnerability. Contribution of working group II to the fourth assessment report of the
intergovernmental report on climate change, Intergovernmental Panel on Climate Change (IPCC), Cambridge University
Press, NY, USA. Available from: https://goo.gl/xmT7uQ [Accessed: 3 August 2018].
Ishtiaque, A. and Nazem, N. I. (2017). Household-level disaster-induced losses and rural–urban migration: Experience from
world’s one of the most disaster-affected countries. Natural Hazards, 86(1):315–326.
Islam, A. and Nguyen, C. (2018). Do networks matter after a natural disaster? A study of resource sharing within an informal
network after Cyclone Aila. Journal of Environmental Economics and Management, 90:249–268.
Kabir, M. E., Serrao-Neumann, S., Davey, P., Hossain, M., and Alam, M. T. (2018). Drivers and temporality of internal
migration in the context of slow-onset natural hazards: Insights from north-west rural Bangladesh. International Journal
of Disaster Risk Reduction, 31:617–626.
Kabir, R., Khan, H. T., Ball, E., and Caldwell, K. (2016). Climate Change Impact: The experience of the coastal areas of
Bangladesh affected by Cyclones Sidr and Aila. Journal of Environmental and Public Health, 2016:1–9.
Karanja Ng’ang’a, S., Bulte, E. H., Giller, K. E., McIntire, J. M., and Rufino, M. C. (2016). Migration and self-protection
against climate change: A case study of Samburu County, Kenya. World Development, 84:55–68.
Karim, A. (2018). The household response to persistent natural disasters: Evidence from Bangladesh. World Development,
103:40–59.
Kellenberg, D. and Mobarak, A. M. (2011). The economics of natural disasters. Annual Review of Resource Economics,
3:297–312.
26

Kennan, J. and Walker, J. R. (2011). The effect of expected income on individual migration decisions. Econometrica, 79(1):211–
251.
Khandker, S. R. (2012). Seasonality of income and poverty in Bangladesh. Journal of Development Economics, 97(2):244–256.
Kirchberger, M. (2017). Natural disasters and labor markets. Journal of Development Economics, 125:40–58.
Kreft, S., Eckstein, D., Dorsch, L., and Fischer, L. (2016). Global climate risk index 2016: Who suffers most from extreme
weather events? Weather-related loss events in 2014 and 1995 to 2014. Briefing Paper, Germanwatch, Berlin, Germany.
Available from: https://goo.gl/UKo9Ri [Accessed: 3 August 2018].
Li, Y., Lopez-Carr, D., and Chen, W. (2014). Factors affecting migration intentions in ecological restoration areas and their
implications for the sustainability of ecological migration policy in arid Northwest China. Sustainability, 6(12):8639–8660.
Lynham, J., Noy, I., and Page, J. (2017). The 1960 Tsunami in Hawaii: Long-Term Consequences of a Coastal Disaster. World
Development, 94:106–118.
Mallick, B. (2014). Cyclone-induced migration in southwest coastal Bangladesh. ASIEN, 130:60–81.
Mallick, B., Ahmed, B., and Vogt, J. (2017). Living with the risks of cyclone disasters in the south-western coastal region of
Bangladesh. Environments, 4(1):13.
Mallick, B. and Etzold, B. (2015). Environment, Migration, and Adaptation: Evidence and of Climate Change in Bangladesh.
AH Development Publishing House, Dhaka, Bangladesh.
Mallick, B. and Vogt, J. (2012). Cyclone, coastal society and migration: Empirical evidence from Bangladesh. International
Development Planning Review, 34(3):217–240.
Marshall, R. and Rahman, S. (2013). Internal migration in Bangladesh: Character, drivers and policy issues. Technical Paper,
United Nations Development Programme (UNDP), NY, USA. Available from: https://goo.gl/kKjLhB [Accessed: 3 August
2018].
Mejia, S. A., Mrkaic, M., Novta, N., Pugacheva, E., and Topalova, P. (2018). The effects of weather shocks on economic
activity: What are the channels of impact? IMF Working Papers 18/144, International Monetary Fund, Washington DC,
USA. Available from: https://goo.gl/NT5NiX [Accessed: 30 August 2018].
Mirza, M. M. Q. (2003). Climate change and extreme weather events: Can developing countries adapt? Climate Policy,
3(3):233–248.
Mirza, M. M. Q., Warrick, R., and Ericksen, N. (2003). The implications of climate change on floods of the Ganges, Brahmaputra
and Meghna rivers in Bangladesh. Climatic Change, 57(3):287–318.
Mishra, D. K. (2016). Internal Migration in Contemporary India. SAGE Publications, India.
Mollah, T. H. and Ferdaush, J. (2015). Riverbank Erosion, Population Migration and Rural Vulnerability in Bangladesh (A
Case Study on Kazipur Upazila at Sirajgonj District). Environment and Ecology Research, 3(5):125–131.
Mottaleb, K. A., Mohanty, S., and Mishra, A. K. (2015). Intra-household resource allocation under negative income shock: A
natural experiment. World Development, 66:557–571.
Mozumder, P., Bohara, A. K., Berrens, R. P., and Halim, N. (2009). Private transfers to cope with a natural disaster: Evidence
from Bangladesh. Environment and Development Economics, 14(2):187–210.
Mutton, D. and Haque, C. E. (2004). Human vulnerability, dislocation and resettlement: Adaptation processes of river-bank
erosion-induced displacees in Bangladesh. Disasters, 28(1):41–62.
Myers, N. (2002). Environmental refugees: A growing phenomenon of the 21st century. Philosophical Transactions of the
Royal Society of London B: Biological Sciences, 357(1420):609–613.
27

Naik, A. (2009). Migration and natural disasters. In Laczko, F. and Aghazarm, C., editors, Migration, Environment and Climate
Change: Assessing the Evidence, pages 247–317. International Organization for Migration (IOM), Geneva, Switzerland.
Available from: https://goo.gl/JMrNUS [Accessed: 3 August 2018].
O’neill, B. C. and Oppenheimer, M. (2002). Dangerous climate impacts and the Kyoto Protocol. Science, 296(5575):1971–1972.
Para-PenaS, R. I. and Reilly, B. (2018). Climate variability and theft in Colombia. Document 481, Directorate of Eco-
nomic Studies, National Planning Department (DNP), Government of Colombia, Bogota, Colombia. Available from:
https://goo.gl/ohGYhB [Accessed: 30 August 2018].
Patnaik, U., Das, P. K., and Bahinipati, C. S. (2016). Coping with climatic shocks: Empirical evidence from rural coastal
Odisha, India. Global Business Review, 17(1):161–175.
Paul, B. K. (2005). Evidence against disaster-induced migration: The 2004 tornado in north-central Bangladesh. Disasters,
29(4):370–385.
Planning Commission (2015). Seventh Five Year Plan (FY2016 - FY2020): Accelerating Growth, Empowering Citizens. Final
version, Planning Commission, Bangladesh Government. Available from: https://goo.gl/iWmHUN [Accessed: 23 August
2018].
Planning Commission (2017). Bangladesh Delta Plan 2100. Draft, Planning Commission, Bangladesh Government. Available
from: https://goo.gl/5StZsk [Accessed: 23 August 2018].
Poncelet, A., Gemenne, F., Martiniello, M., and Bousetta, H. (2010). A country made for disasters: Environmental vulnerability
and forced migration in Bangladesh. In Afifi, Tamer, J. J., editor, Environment, forced migration and social vulnerability,
pages 211–222. Springer, NY, USA.
Portes, A. (2010). Migration and social change: Some conceptual reflections. Journal of Ethnic and Migration Studies,
36(10):1537–1563.
Sandefur, G. D. and Scott, W. J. (1981). A dynamic analysis of migration: An assessment of the effects of age, family and
career variables. Demography, 18(3):355–368.
Sawada, Y. and Shimizutani, S. (2008). How do people cope with natural disasters? Evidence from the great Hanshin-Awaji
(Kobe) earthquake in 1995. Journal of Money, Credit and Banking, 40(2-3):463–488.
Sawada, Y. and Shimizutani, S. (2011). Changes in durable stocks, portfolio allocation, and consumption expenditure in the
aftermath of the Kobe earthquake. Review of Economics of the Household, 9(4):429.
Sawada, Y. and Takasaki, Y. (2017). Natural disaster, poverty, and development: An introduction. World Development,
94:2–15.
Shayegh, S. and Casey, G. (2017). To go or not to go: Migration alleviates climate damages even for those who stay behind.
Technical report.
Skoufias, E. (2003). Economic crises and natural disasters: Coping strategies and policy implications. World Development,
31(7):1087–1102.
Stern, N. (2008). The economics of climate change. American Economic Review, 98(2):1–37.
Takasaki, Y. (2011). Do the commons help augment mutual insurance among the poor? World Development, 39(3):429–438.
Takasaki, Y. (2014). How is disaster aid allocated within poor communities? Risk sharing and social hierarchy. Journal of
International Development, 26(8):1097–1114.
Takasaki, Y. (2017). Do natural disasters decrease the gender gap in schooling? World Development, 94:75–89.
28

Tian, Q. and Lemos, M. C. (2018). Household livelihood differentiation and vulnerability to climate hazards in rural China.
World Development, 108:321–331.
Von Reichert, C. and Rudzitis, G. (1992). Multinomial logistic models explaining income changes of migrants to high-amenity
counties. The Review of Regional Studies, 22(1):25.
Zaber, M., Nardi, B., and Chen, J. (2018). Responding to Riverbank Erosion in Bangladesh. In Proceedings
of the 1st ACM SIGCAS Conference on Computing and Sustainable Societies, page 27. ACM. Available from:
https://doi.org/10.1145/3209811.3209823 [Accessed: 4 September 2018].
29

Appendix A: Tables
Table A.1: Effect on internal migration: Marginal effects from OLS estimates
All shocks Grouped shocks
(1) (2) (3) (4) (5) (6)
Experienced cyclone in last 10yrs0.106∗∗∗ 0.007 0.007(0.033) (0.030) (0.030)
Experienced flood in last 10yrs0.280∗∗∗ 0.198∗∗∗ 0.173∗∗∗
(0.031) (0.033) (0.033)
Experienced river erosion in last 10yrs0.393∗∗∗ 0.233∗∗∗ 0.232∗∗∗
(0.018) (0.027) (0.027)
Transinet shock0.230∗∗∗ 0.115∗∗∗ 0.106∗∗∗
(0.025) (0.026) (0.026)
Permanent shock0.391∗∗∗ 0.225∗∗∗ 0.223∗∗∗
(0.018) (0.027) (0.027)
Number of household members-0.012∗∗ -0.018∗∗∗ -0.012∗∗ -0.018∗∗∗
(0.005) (0.005) (0.005) (0.005)
Household head is male0.005 -0.018 0.003 -0.021
(0.055) (0.054) (0.054) (0.053)
Age of the household head in years-0.002∗∗∗ -0.003∗∗∗ -0.002∗∗∗ -0.003∗∗∗
(0.001) (0.001) (0.001) (0.001)
Household head is married0.236∗∗∗ 0.253∗∗∗ 0.238∗∗∗ 0.255∗∗∗
(0.036) (0.036) (0.036) (0.035)
Household head is muslim0.066∗∗ 0.061∗∗ 0.064∗∗ 0.057∗
(0.030) (0.029) (0.030) (0.029)
Literacy of household head-0.050∗∗ -0.050∗∗ -0.051∗∗ -0.051∗∗
(0.021) (0.020) (0.021) (0.020)
Household head has a personal phone0.126∗∗∗ 0.128∗∗∗ 0.132∗∗∗ 0.133∗∗∗
(0.039) (0.038) (0.040) (0.038)
Electricity in home-0.061∗∗ -0.006 -0.058∗∗ -0.005(0.028) (0.028) (0.028) (0.028)
Owned land in decimals-0.003∗∗ -0.002 -0.003∗∗ -0.002(0.001) (0.001) (0.001) (0.001)
Lives in owned house-0.217∗∗∗ -0.215∗∗∗ -0.209∗∗∗ -0.204∗∗∗
(0.033) (0.034) (0.034) (0.034)
Received credit after disaster0.064∗∗∗ 0.051∗∗∗ 0.068∗∗∗ 0.055∗∗∗
(0.020) (0.019) (0.020) (0.019)
Received relief after disaster-0.003 0.026 -0.013 0.017(0.026) (0.026) (0.026) (0.025)
Ln(non-land asset value)-0.043∗∗∗ -0.039∗∗∗ -0.043∗∗∗ -0.039∗∗∗
(0.011) (0.012) (0.011) (0.012)
Ln(monthly income before migration)0.074∗∗∗ 0.075∗∗∗ 0.067∗∗∗ 0.069∗∗∗
(0.013) (0.013) (0.012) (0.012)
Constant0.651∗∗∗ 0.654∗∗∗ 0.651∗∗∗ 0.651∗∗∗ 0.654∗∗∗ 0.651∗∗∗
(0.010) (0.013) (0.013) (0.010) (0.013) (0.013)District fixed effects No No Yes No No YesR2 0.18 0.31 0.36 0.18 0.31 0.36AIC 2108.38 1810.25 1696.49 2101.30 1818.37 1701.41BIC 2124.89 1909.26 1823.00 2112.30 1911.87 1822.42N 1,809 1,809 1,809 1,809 1,809 1,809
Note: 1. Robust standard errors are reported in the parentheses.∗ p <0.10, ∗∗ p <0.05, ∗∗∗ p <0.01.
30
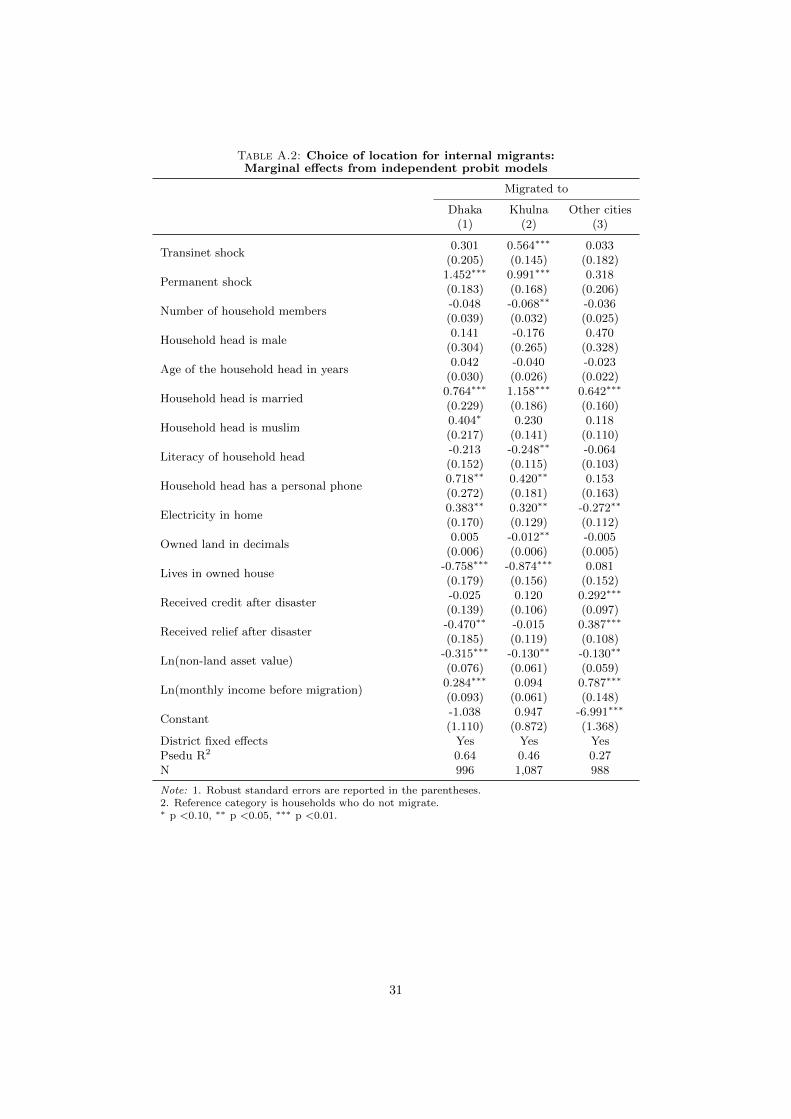
Table A.2: Choice of location for internal migrants:Marginal effects from independent probit models
Migrated to
Dhaka Khulna Other cities(1) (2) (3)
Transinet shock0.301 0.564∗∗∗ 0.033
(0.205) (0.145) (0.182)
Permanent shock1.452∗∗∗ 0.991∗∗∗ 0.318(0.183) (0.168) (0.206)
Number of household members-0.048 -0.068∗∗ -0.036(0.039) (0.032) (0.025)
Household head is male0.141 -0.176 0.470
(0.304) (0.265) (0.328)
Age of the household head in years0.042 -0.040 -0.023
(0.030) (0.026) (0.022)
Household head is married0.764∗∗∗ 1.158∗∗∗ 0.642∗∗∗
(0.229) (0.186) (0.160)
Household head is muslim0.404∗ 0.230 0.118(0.217) (0.141) (0.110)
Literacy of household head-0.213 -0.248∗∗ -0.064(0.152) (0.115) (0.103)
Household head has a personal phone0.718∗∗ 0.420∗∗ 0.153(0.272) (0.181) (0.163)
Electricity in home0.383∗∗ 0.320∗∗ -0.272∗∗
(0.170) (0.129) (0.112)
Owned land in decimals0.005 -0.012∗∗ -0.005
(0.006) (0.006) (0.005)
Lives in owned house-0.758∗∗∗ -0.874∗∗∗ 0.081(0.179) (0.156) (0.152)
Received credit after disaster-0.025 0.120 0.292∗∗∗
(0.139) (0.106) (0.097)
Received relief after disaster-0.470∗∗ -0.015 0.387∗∗∗
(0.185) (0.119) (0.108)
Ln(non-land asset value)-0.315∗∗∗ -0.130∗∗ -0.130∗∗
(0.076) (0.061) (0.059)
Ln(monthly income before migration)0.284∗∗∗ 0.094 0.787∗∗∗
(0.093) (0.061) (0.148)
Constant-1.038 0.947 -6.991∗∗∗
(1.110) (0.872) (1.368)District fixed effects Yes Yes YesPsedu R2 0.64 0.46 0.27N 996 1,087 988
Note: 1. Robust standard errors are reported in the parentheses.2. Reference category is households who do not migrate.∗ p <0.10, ∗∗ p <0.05, ∗∗∗ p <0.01.
31

Table A.3: Impacts of migration on household income and consumptionby types of shocks experienced: OLS estimates
Ln(household income) Ln(household consumption)
(1) (2) (3) (4) (5) (6)
Post transient shock 0.645∗∗∗ 0.837∗∗∗ 0.827∗∗∗ 0.544∗∗∗ 0.251∗ 0.181induced migration (0.186) (0.232) (0.227) (0.106) (0.143) (0.146)Post permanent shock 0.371∗∗ 0.552∗∗∗ 0.560∗∗∗ 0.603∗∗∗ 0.393∗∗∗ 0.314∗∗∗
induced migration (0.167) (0.196) (0.194) (0.104) (0.118) (0.116)Migrated to a -0.147∗∗∗ 0.083∗∗ 0.091∗∗ -0.670∗∗∗ -0.453∗∗∗ -0.418∗∗∗
different location (0.039) (0.041) (0.042) (0.038) (0.032) (0.033)Post transient shock induced migration 0.313 0.549∗∗ 0.584∗∗ 0.821∗∗∗ 0.662∗∗∗ 0.690∗∗∗
× migrated to a different location (0.193) (0.236) (0.231) (0.116) (0.148) (0.151)Post permanent shock induced migration 0.604∗∗∗ 0.936∗∗∗ 0.945∗∗∗ 0.669∗∗∗ 0.476∗∗∗ 0.589∗∗∗
× migrated to a different location (0.171) (0.200) (0.199) (0.111) (0.124) (0.123)Number of household 0.067∗∗∗ 0.068∗∗∗ -0.005 0.001members (0.008) (0.008) (0.006) (0.006)Household head is 0.277∗∗∗ 0.294∗∗∗ 0.039 0.051male (0.089) (0.090) (0.064) (0.062)Age of the household 0.007 0.009 0.009∗ 0.008head in years (0.008) (0.008) (0.005) (0.005)Age squared -0.000 -0.000∗ -0.000∗ -0.000
(0.000) (0.000) (0.000) (0.000)Household head is 0.098∗ 0.086 0.026 0.019married (0.057) (0.057) (0.043) (0.042)Household head is -0.071 -0.051 0.045 0.085∗∗
muslim (0.045) (0.045) (0.033) (0.033)Literacy of -0.017 -0.000 0.056∗∗ 0.048∗
household head (0.033) (0.033) (0.025) (0.025)Household head has 0.006 0.006 0.078∗ 0.083∗∗
a personal phone (0.058) (0.058) (0.042) (0.042)Electricity in home -0.200∗∗∗ -0.181∗∗∗ 0.041 0.032
(0.038) (0.038) (0.031) (0.031)Owned land in -0.002 -0.002 0.009∗∗∗ 0.008∗∗∗
decimals (0.002) (0.002) (0.002) (0.002)Lives in owned house 0.737∗∗∗ 0.663∗∗∗ 0.193∗∗∗ 0.155∗∗∗
(0.048) (0.049) (0.038) (0.039)Received credit 0.030 0.027 0.064∗∗∗ 0.042∗
after disaster (0.032) (0.032) (0.024) (0.023)Received relief 0.085∗∗ 0.113∗∗∗ 0.129∗∗∗ 0.080∗∗∗
after disaster (0.036) (0.036) (0.028) (0.028)Ln(non-land asset 0.044∗∗ 0.042∗∗ 0.118∗∗∗ 0.122∗∗∗
value) (0.018) (0.018) (0.015) (0.014)Ln(household income) 0.611∗∗∗ 0.613∗∗∗
(0.020) (0.020)District fixed effects No No Yes No No YesAdjusted R2 0.12 0.28 0.29 0.21 0.63 0.64N 3,618 3,618 3,618 3,618 3,618 3,618
Note: See footnotes in Table 5.
32
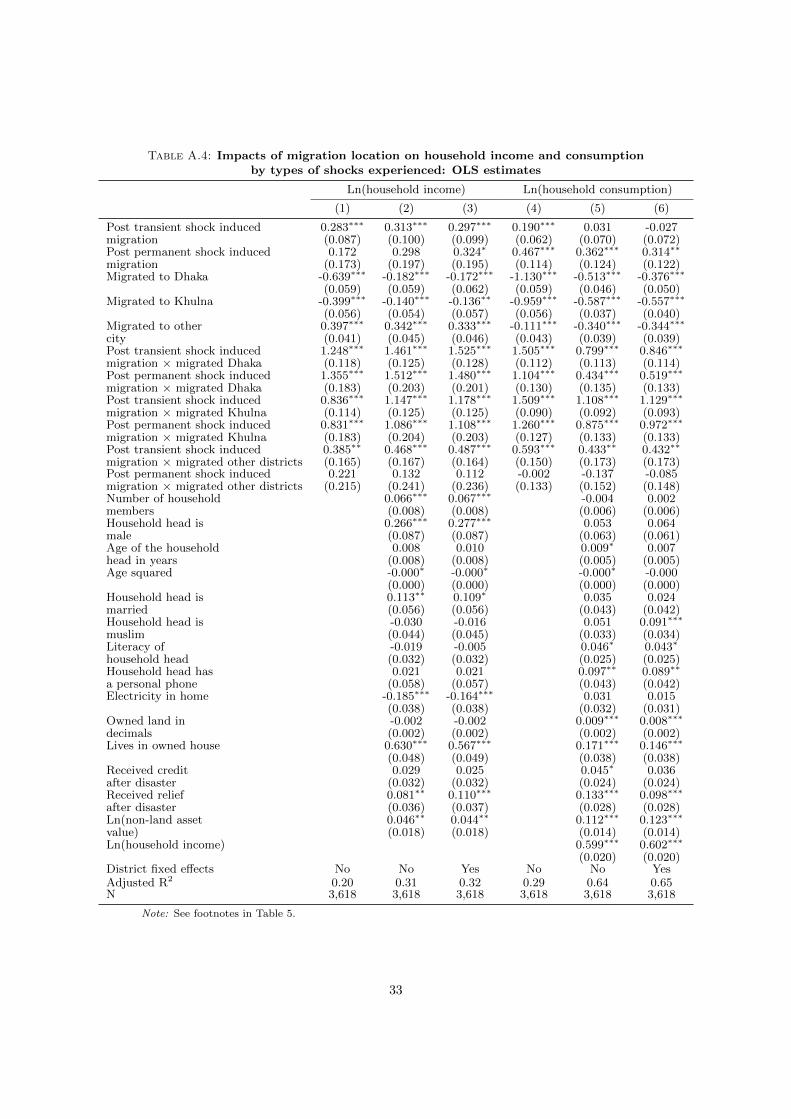
Table A.4: Impacts of migration location on household income and consumptionby types of shocks experienced: OLS estimates
Ln(household income) Ln(household consumption)
(1) (2) (3) (4) (5) (6)
Post transient shock induced 0.283∗∗∗ 0.313∗∗∗ 0.297∗∗∗ 0.190∗∗∗ 0.031 -0.027migration (0.087) (0.100) (0.099) (0.062) (0.070) (0.072)Post permanent shock induced 0.172 0.298 0.324∗ 0.467∗∗∗ 0.362∗∗∗ 0.314∗∗
migration (0.173) (0.197) (0.195) (0.114) (0.124) (0.122)Migrated to Dhaka -0.639∗∗∗ -0.182∗∗∗ -0.172∗∗∗ -1.130∗∗∗ -0.513∗∗∗ -0.376∗∗∗
(0.059) (0.059) (0.062) (0.059) (0.046) (0.050)Migrated to Khulna -0.399∗∗∗ -0.140∗∗∗ -0.136∗∗ -0.959∗∗∗ -0.587∗∗∗ -0.557∗∗∗
(0.056) (0.054) (0.057) (0.056) (0.037) (0.040)Migrated to other 0.397∗∗∗ 0.342∗∗∗ 0.333∗∗∗ -0.111∗∗∗ -0.340∗∗∗ -0.344∗∗∗
city (0.041) (0.045) (0.046) (0.043) (0.039) (0.039)Post transient shock induced 1.248∗∗∗ 1.461∗∗∗ 1.525∗∗∗ 1.505∗∗∗ 0.799∗∗∗ 0.846∗∗∗
migration × migrated Dhaka (0.118) (0.125) (0.128) (0.112) (0.113) (0.114)Post permanent shock induced 1.355∗∗∗ 1.512∗∗∗ 1.480∗∗∗ 1.104∗∗∗ 0.434∗∗∗ 0.519∗∗∗
migration × migrated Dhaka (0.183) (0.203) (0.201) (0.130) (0.135) (0.133)Post transient shock induced 0.836∗∗∗ 1.147∗∗∗ 1.178∗∗∗ 1.509∗∗∗ 1.108∗∗∗ 1.129∗∗∗
migration × migrated Khulna (0.114) (0.125) (0.125) (0.090) (0.092) (0.093)Post permanent shock induced 0.831∗∗∗ 1.086∗∗∗ 1.108∗∗∗ 1.260∗∗∗ 0.875∗∗∗ 0.972∗∗∗
migration × migrated Khulna (0.183) (0.204) (0.203) (0.127) (0.133) (0.133)Post transient shock induced 0.385∗∗ 0.468∗∗∗ 0.487∗∗∗ 0.593∗∗∗ 0.433∗∗ 0.432∗∗
migration × migrated other districts (0.165) (0.167) (0.164) (0.150) (0.173) (0.173)Post permanent shock induced 0.221 0.132 0.112 -0.002 -0.137 -0.085migration × migrated other districts (0.215) (0.241) (0.236) (0.133) (0.152) (0.148)Number of household 0.066∗∗∗ 0.067∗∗∗ -0.004 0.002members (0.008) (0.008) (0.006) (0.006)Household head is 0.266∗∗∗ 0.277∗∗∗ 0.053 0.064male (0.087) (0.087) (0.063) (0.061)Age of the household 0.008 0.010 0.009∗ 0.007head in years (0.008) (0.008) (0.005) (0.005)Age squared -0.000∗ -0.000∗ -0.000∗ -0.000
(0.000) (0.000) (0.000) (0.000)Household head is 0.113∗∗ 0.109∗ 0.035 0.024married (0.056) (0.056) (0.043) (0.042)Household head is -0.030 -0.016 0.051 0.091∗∗∗
muslim (0.044) (0.045) (0.033) (0.034)Literacy of -0.019 -0.005 0.046∗ 0.043∗
household head (0.032) (0.032) (0.025) (0.025)Household head has 0.021 0.021 0.097∗∗ 0.089∗∗
a personal phone (0.058) (0.057) (0.043) (0.042)Electricity in home -0.185∗∗∗ -0.164∗∗∗ 0.031 0.015
(0.038) (0.038) (0.032) (0.031)Owned land in -0.002 -0.002 0.009∗∗∗ 0.008∗∗∗
decimals (0.002) (0.002) (0.002) (0.002)Lives in owned house 0.630∗∗∗ 0.567∗∗∗ 0.171∗∗∗ 0.146∗∗∗
(0.048) (0.049) (0.038) (0.038)Received credit 0.029 0.025 0.045∗ 0.036after disaster (0.032) (0.032) (0.024) (0.024)Received relief 0.081∗∗ 0.110∗∗∗ 0.133∗∗∗ 0.098∗∗∗
after disaster (0.036) (0.037) (0.028) (0.028)Ln(non-land asset 0.046∗∗ 0.044∗∗ 0.112∗∗∗ 0.123∗∗∗
value) (0.018) (0.018) (0.014) (0.014)Ln(household income) 0.599∗∗∗ 0.602∗∗∗
(0.020) (0.020)District fixed effects No No Yes No No YesAdjusted R2 0.20 0.31 0.32 0.29 0.64 0.65N 3,618 3,618 3,618 3,618 3,618 3,618
Note: See footnotes in Table 5.
33