© 2007 mcgraw-hill higher education. all rights reserved. chapter 9: circulatory adaptations to...
Post on 20-Dec-2015
213 views
TRANSCRIPT

© 2007 McGraw-Hill Higher Education. All rights reserved.
Chapter 9:Circulatory Adaptations
to Exercise
EXERCISE PHYSIOLOGY
Theory and Application to Fitness and Performance, 6th edition
Scott K. Powers & Edward T. Howley

© 2007 McGraw-Hill Higher Education. All rights reserved.
Introduction
• One major challenges to homeostasis posed by exercise is the increased muscular demand for oxygen
• During heavy exercise, oxygen demands may by 15 to 25 times
• Two major adjustments of blood flow are; cardiac output– Redistribution of blood flow
• A thorough understanding of the cardiovascular system is essential to exercise physiology
© 2007 McGraw-Hill Higher Education. All rights reserved.
Objectives
• Give an overview of the design and function of the circulatory system
• Describe cardiac cycle & associated electrical activity recorded via electrocardiogram
• Discuss the pattern of redistribution of blood flow during exercise
• Outline the circulatory responses to various types of exercise

© 2007 McGraw-Hill Higher Education. All rights reserved.
Objectives
• Identify the factors that regulate local blood flow during exercise
• List & discuss those factors responsible for regulation of stroke volume during exercise
• Discuss the regulation of cardiac output during exercise

© 2007 McGraw-Hill Higher Education. All rights reserved.
The Cardiovascular System
Purposes
1. Transport O2 to tissues and removal of waste
2. Transport of nutrients to tissues
3. Regulation of body temperature

© 2007 McGraw-Hill Higher Education. All rights reserved.
The Circulatory System
• Heart– Pumps blood
• Arteries and arterioles– Carry blood away from the heart
• Capillaries– Exchange of nutrients with tissues
• Veins and venules– Carry blood toward the heart

© 2007 McGraw-Hill Higher Education. All rights reserved.
Structure of the Heart
Fig 9.1

© 2007 McGraw-Hill Higher Education. All rights reserved.
Pulmonary and Systemic Circuits
Systemic circuit• Left side of the heart• Pumps oxygenated
blood to the whole body via arteries
• Returns deoxygenated blood to the right heart via veins
Pulmonary circuit• Right side of the heart• Pumps deoxygenated
blood to the lungs via pulmonary arteries
• Returns oxygenated blood to the left heart via pulmonary veins

© 2007 McGraw-Hill Higher Education. All rights reserved.
The Myocardium
Fig 9.2

© 2007 McGraw-Hill Higher Education. All rights reserved.
The Cardiac Cycle
Systole• Contraction phase
Diastole• Relaxation phase
Fig 9.3

© 2007 McGraw-Hill Higher Education. All rights reserved.
Pressure Changes
During the Cardiac Cycle
Fig 9.4

© 2007 McGraw-Hill Higher Education. All rights reserved.
Arterial Blood Pressure
• Expressed as systolic/diastolic– Normal is 120/80 mmHg– High is 140/90 mmHg
• Systolic pressure (top number)– Pressure generated during ventricular
contraction (systole) • Diastolic pressure
– Pressure in the arteries during cardiac relaxation (diastole)

© 2007 McGraw-Hill Higher Education. All rights reserved.
Blood Pressure
• Pulse pressure– Difference between systolic and diastolic
• Mean arterial pressure (MAP)– Average pressure in the arteries
Pulse Pressure = Systolic - Diastolic
MAP = Diastolic + 1/3(pulse pressure)

© 2007 McGraw-Hill Higher Education. All rights reserved.
Mean Arterial Pressure
Blood pressure of 120/80 mm Hg
MAP = 80 mm Hg + .33(120-80)
= 80 mm Hg + 13
= 93 mm Hg

© 2007 McGraw-Hill Higher Education. All rights reserved.
Measurement of Blood Pressure
Fig 9.5

© 2007 McGraw-Hill Higher Education. All rights reserved.
Factors That Influence Arterial Blood Pressure
Fig 9.6
© 2007 McGraw-Hill Higher Education. All rights reserved.
Electrical Activity of the Heart
• Contraction of the heart depends on electrical stimulation of the myocardium
• Impulse is initiated in the right atrium and spreads throughout entire heart
• May be recorded on an electrocardiogram (ECG)

© 2007 McGraw-Hill Higher Education. All rights reserved.
Conduction System of the Heart
Fig 9.7

© 2007 McGraw-Hill Higher Education. All rights reserved.
Electrocardiogram
• Records the electrical activity of the heart• P-wave
– Atrial depolarization• QRS complex
– Ventricular depolarization• T-wave
– Ventricular repolarization

© 2007 McGraw-Hill Higher Education. All rights reserved.
Electrocardiogram
Fig 9.9

© 2007 McGraw-Hill Higher Education. All rights reserved.
CardiacCycle
&ECG
Fig 9.10

© 2007 McGraw-Hill Higher Education. All rights reserved.
Diagnostic Use of the ECG
• ECG abnormalities may indicate coronary heart disease
– ST-segment depression can indicate myocardial ischemia

© 2007 McGraw-Hill Higher Education. All rights reserved.
Abnormal ECG
Fig 9.8
© 2007 McGraw-Hill Higher Education. All rights reserved.
Cardiac Output
The amount of blood pumped by the heart each minute
• Product of heart rate and stroke volume
– Heart rate = number of beats per minute– Stroke volume = amount of blood ejected
in each beat
Q = HR x SV

© 2007 McGraw-Hill Higher Education. All rights reserved.
Regulation of Heart Rate
• Decrease in HR– Parasympathetic nervous system
• Via vagus nerve – Slows HR by inhibiting SA node
• Increase in HR– Sympathetic nervous system
• Via cardiac accelerator nerves– Increases HR by stimulating SA node

© 2007 McGraw-Hill Higher Education. All rights reserved.
Nervous System Regulation of Heart Rate
Fig 9.11
© 2007 McGraw-Hill Higher Education. All rights reserved.
Regulation of Stroke Volume
• End-diastolic volume (EDV)– Volume of blood in the ventricles at the end
of diastole (“preload”)• Average aortic blood pressure
– Pressure the heart must pump against to eject blood (“afterload”)
• Strength of the ventricular contraction– “Contractility”

© 2007 McGraw-Hill Higher Education. All rights reserved.
End-Diastolic Volume
• Frank-Starling mechanism– Greater preload results in stretch of
ventricles and in a more forceful contraction
• Affected by:– Venoconstriction– Skeletal muscle pump– Respiratory pump

© 2007 McGraw-Hill Higher Education. All rights reserved.
The Skeletal Muscle Pump
• Rhythmic skeletal muscle contractions force blood in the extremities toward the heart
• One-way valves in veins prevent backflow of blood
Fig 9.12

© 2007 McGraw-Hill Higher Education. All rights reserved.
Average Aortic Pressure
• Aortic pressure is inversely related to stroke volume
• High afterload results in a decreased stroke volume– Requires greater force generation by the
myocardium to eject blood into the aorta• Reducing aortic pressure results in higher
stroke volume

© 2007 McGraw-Hill Higher Education. All rights reserved.
Ventricular Contractility
• Increased contractility results in higher stroke volume– Circulating epinephrine and norepinephrine– Direct sympathetic stimulation of heart

© 2007 McGraw-Hill Higher Education. All rights reserved.
Factors that Regulate Cardiac Output
Cardiac = Cardiac Rate x Stroke VolumeOutput
Mean arterialpressure
EDVContraction
strength
Frank-Starling
Stretch
Sympatheticnerves
Parasympatheticnerves
Fig 9.13
© 2007 McGraw-Hill Higher Education. All rights reserved.
HemodynamicsThe study of the physical principles of blood flow

© 2007 McGraw-Hill Higher Education. All rights reserved.
Physical Characteristics of Blood
• Plasma– Liquid portion of blood– Contains ions, proteins, hormones
• Cells– Red blood cells
• Contain hemoglobin to carry oxygen– White blood cells– Platelets
• Important in blood clotting
© 2007 McGraw-Hill Higher Education. All rights reserved.
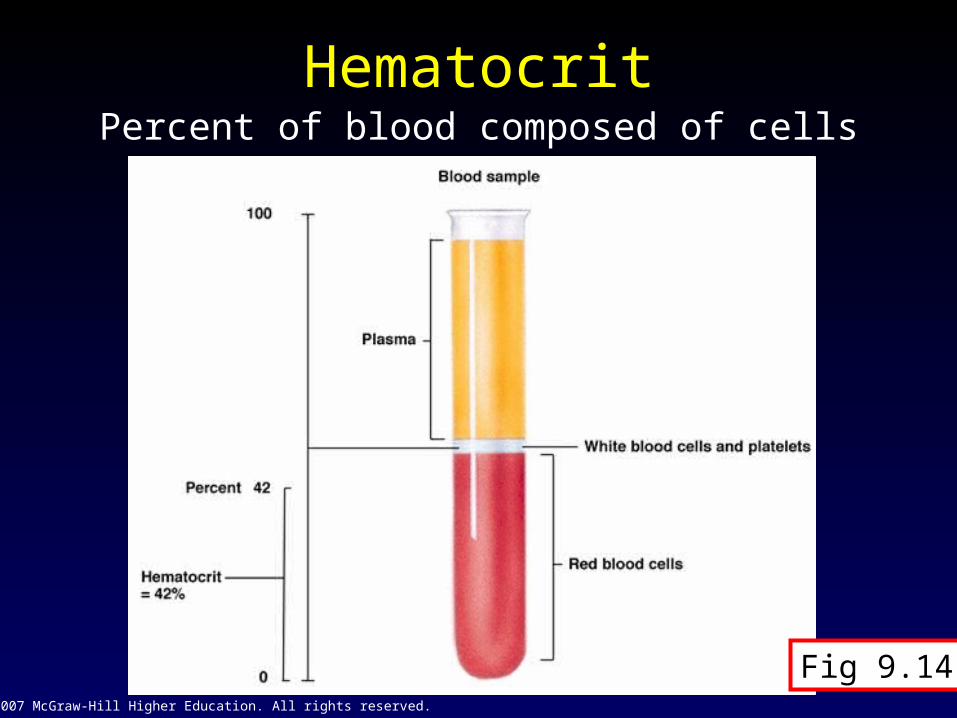
Hematocrit
Fig 9.14
Percent of blood composed of cells

© 2007 McGraw-Hill Higher Education. All rights reserved.
Hemodynamics
Based on interrelationships between:
–Pressure
–Resistance
–Flow

© 2007 McGraw-Hill Higher Education. All rights reserved.
Hemodynamics: Pressure
• Blood flows from high low pressure
– Proportional to the difference between MAP and right atrial pressure (P)

© 2007 McGraw-Hill Higher Education. All rights reserved.
Blood Flow Through the Systemic Circuit
Fig 9.15

© 2007 McGraw-Hill Higher Education. All rights reserved.
Hemodynamics: Resistance
• Resistance depends upon:– Length of the vessel– Viscosity of the blood– Radius of the vessel
• A small change in vessel diameter can have a dramatic impact on resistance!
Resistance = Length x viscosity
Radius4

© 2007 McGraw-Hill Higher Education. All rights reserved.
Hemodynamics: Blood Flow
• Directly proportional to the pressure difference between the two ends of the system
• Inversely proportional to resistance
Flow = Pressure
Resistance

© 2007 McGraw-Hill Higher Education. All rights reserved.
Sources of Vascular Resistance
• MAP decreases throughout the systemic circulation
• Largest drop occurs across the arterioles
– Arterioles are called “resistance vessels”

© 2007 McGraw-Hill Higher Education. All rights reserved.
Pressure Changes Across the Systemic Circulation
Fig 9.16

© 2007 McGraw-Hill Higher Education. All rights reserved.
Oxygen Delivery During Exercise
• Oxygen demand by muscles during exercise is many times greater than at rest
• Increased O2 delivery accomplished by:
– Increased cardiac output– Redistribution of blood flow to skeletal
muscle

© 2007 McGraw-Hill Higher Education. All rights reserved.
Changes in Cardiac Output
• Cardiac output increases due to:– Increased HR
• Linear increase to max
– Increased SV
• Plateau at ~40% VO2max
• Oxygen uptake by the muscle also increases– Higher arteriovenous difference
Max HR = 220 - Age (years)

© 2007 McGraw-Hill Higher Education. All rights reserved.
Changes in Cardiovascular
Variables During Exercise
Fig 9.17
© 2007 McGraw-Hill Higher Education. All rights reserved.
Redistribution of Blood Flow
• Muscle blood flow to working skeletal muscle
• Splanchnic blood flow to less active organs
– Liver, kidneys, GI tract

© 2007 McGraw-Hill Higher Education. All rights reserved.
Changes in Muscle and Splanchnic Blood Flow
During Exercise
Fig 9.18
© 2007 McGraw-Hill Higher Education. All rights reserved.
Increased Blood Flow to Skeletal Muscle During Exercise
• Withdrawal of sympathetic vasoconstriction• Autoregulation
– Blood flow increased to meet metabolic demands of tissue
– O2 tension, CO2 tension, pH, potassium, adenosine, nitric oxide

© 2007 McGraw-Hill Higher Education. All rights reserved.
Redistribution of Blood Flow During Exercise
Fig 9.19
© 2007 McGraw-Hill Higher Education. All rights reserved.
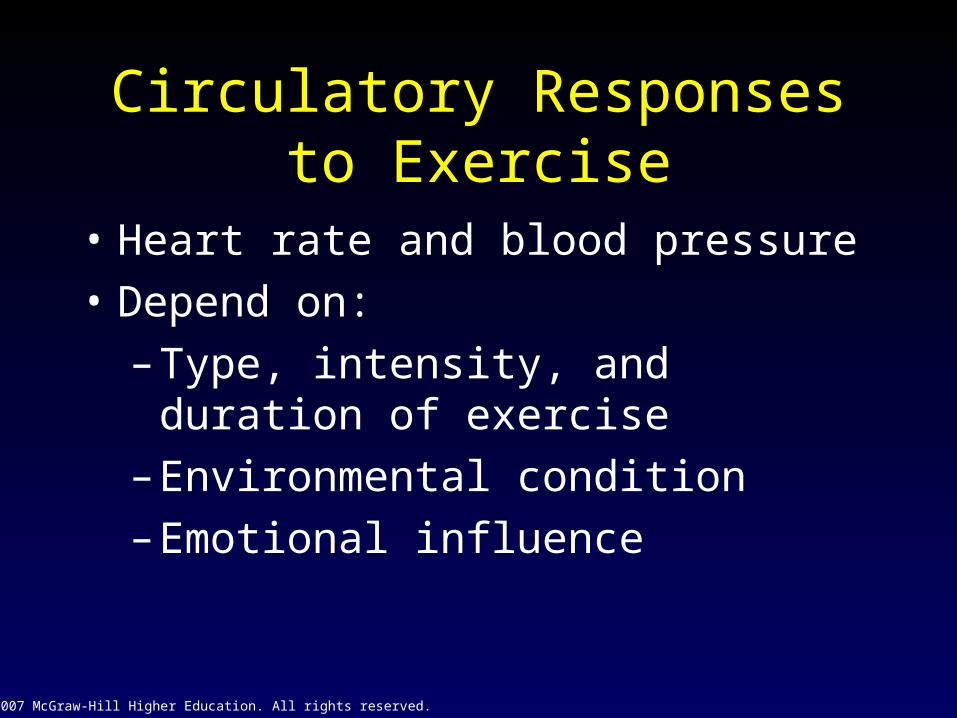
Circulatory Responses to Exercise
• Heart rate and blood pressure
• Depend on:
– Type, intensity, and duration of exercise
– Environmental condition
– Emotional influence

© 2007 McGraw-Hill Higher Education. All rights reserved.
Transition From Rest Exercise and Exercise Recovery
• Rapid increase in HR, SV, cardiac output
• Plateau in submaximal (below lactate threshold) exercise
• Recovery depends on:
– Duration and intensity of exercise
– Training state of subject

© 2007 McGraw-Hill Higher Education. All rights reserved.
Transition From Rest Exercise Recovery
Fig 9.20

© 2007 McGraw-Hill Higher Education. All rights reserved.
Incremental Exercise
• Heart rate and cardiac output– Increases linearly with increasing work rate– Reaches plateau at 100% VO2max
• Systolic blood pressure– Increases with increasing work rate
• Double product– Increases linearly with exercise intensity– Indicates the work of the heart
Double product = heart rate x systolic BP

© 2007 McGraw-Hill Higher Education. All rights reserved.
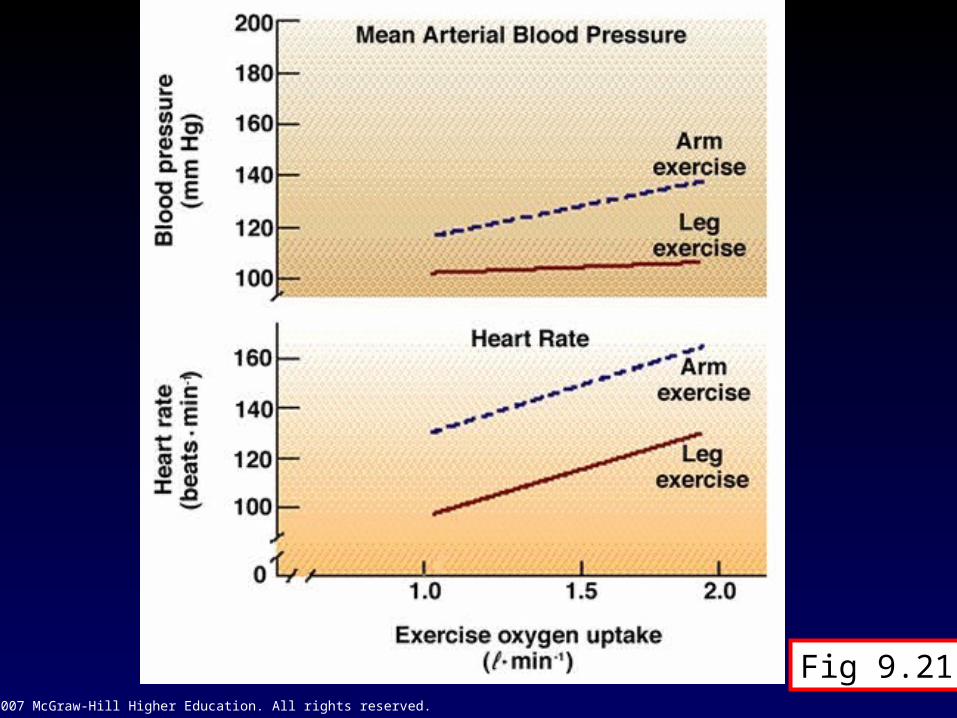
Arm vs. Leg Exercise
• At the same oxygen uptake arm work results in higher:– Heart rate
• Due to higher sympathetic stimulation – Blood pressure
• Due to vasoconstriction of large inactive muscle mass
.
© 2007 McGraw-Hill Higher Education. All rights reserved.
Heart Rate and Blood Pressure
During Arm and Leg Exercise
Fig 9.21

© 2007 McGraw-Hill Higher Education. All rights reserved.
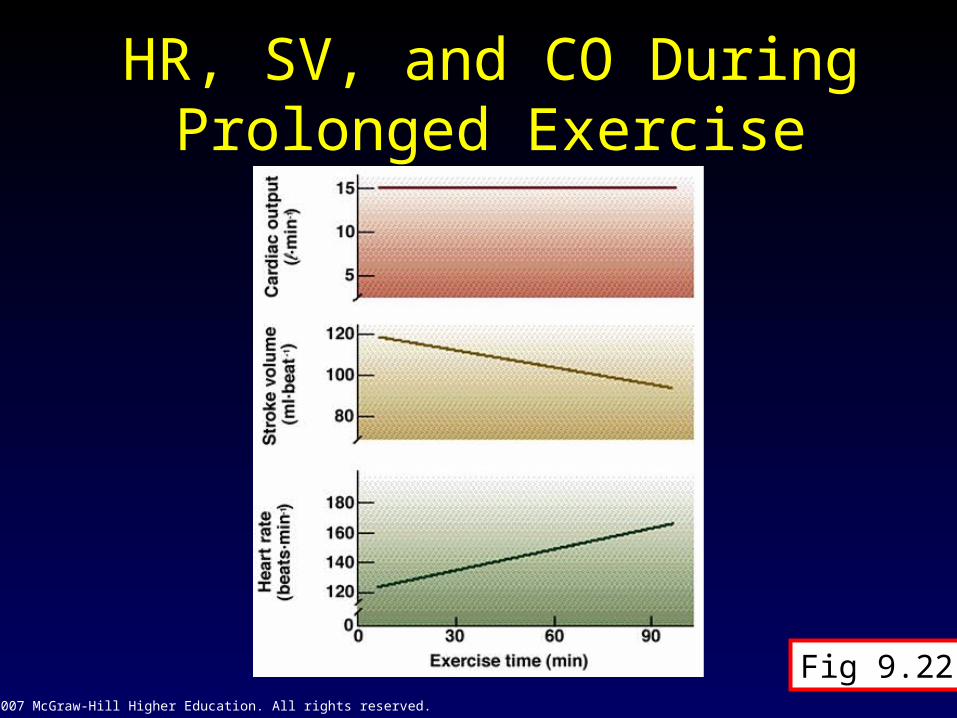
Prolonged Exercise
• Cardiac output is maintained
– Gradual decrease in stroke volume
– Gradual increase in heart rate
• Cardiovascular drift
– Due to dehydration and increased skin blood flow (rising body temperature)
.
© 2007 McGraw-Hill Higher Education. All rights reserved.
HR, SV, and CO During Prolonged Exercise
Fig 9.22

© 2007 McGraw-Hill Higher Education. All rights reserved.
Cardiovascular Adjustments to Exercise
Fig 9.23

© 2007 McGraw-Hill Higher Education. All rights reserved.
Summary of Cardiovascular Control During Exercise
• Initial signal to “drive” cardiovascular system comes from higher brain centers
• Fine-tuned by feedback from:– Chemoreceptors– Mechanoreceptors– Baroreceptors

© 2007 McGraw-Hill Higher Education. All rights reserved.
A Summary of
Cardiovascular Control
During Exercise
Fig 9.24
© 2007 McGraw-Hill Higher Education. All rights reserved.
Chapter 9:Circulatory Adaptations
to Exercise