© 2008 by nelson, a division of thomson canada limited transparency 4.1 finance for non-financial...
TRANSCRIPT

© 2008 by Nelson, a division of Thomson Canada Limited Transparency 4.1
Finance for Non-Financial ManagersFifth Edition
Slides prepared by
Pierre G. BergeronUniversity of Ottawa
© 2008 by Nelson, a division of Thomson Canada Limited Transparency 4.2
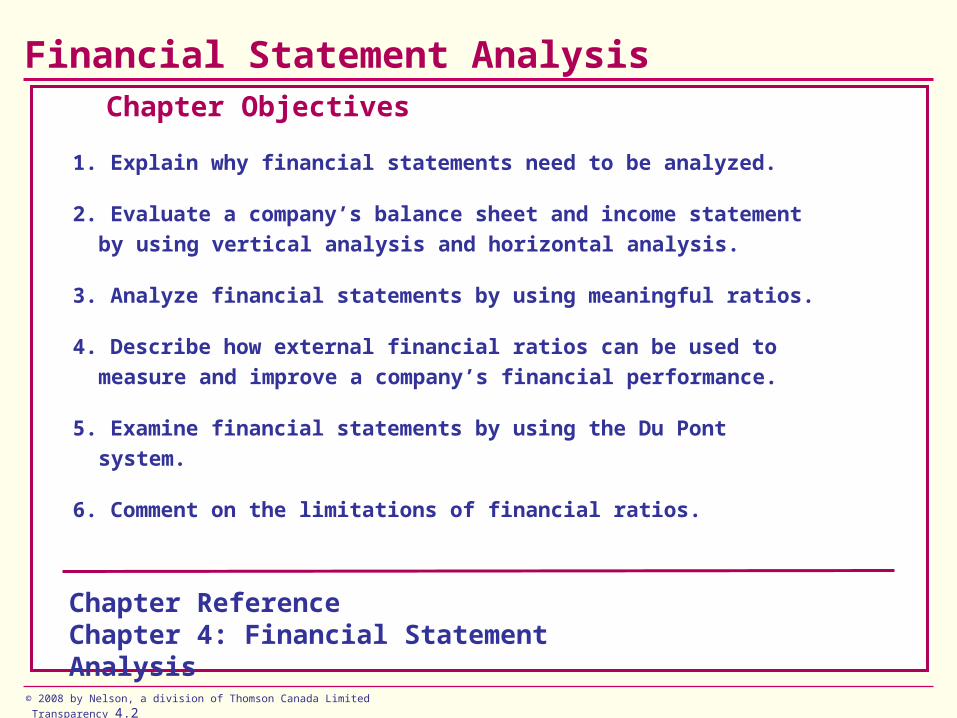
Financial Statement Analysis
Chapter Objectives
1. Explain why financial statements need to be analyzed.
2. Evaluate a company’s balance sheet and income statement by
using vertical analysis and horizontal analysis.
3. Analyze financial statements by using meaningful ratios.
4. Describe how external financial ratios can be used to measure
and improve a company’s financial performance.
5. Examine financial statements by using the Du Pont system.
6. Comment on the limitations of financial ratios.
Chapter ReferenceChapter 4: Financial Statement Analysis
© 2008 by Nelson, a division of Thomson Canada Limited Transparency 4.3
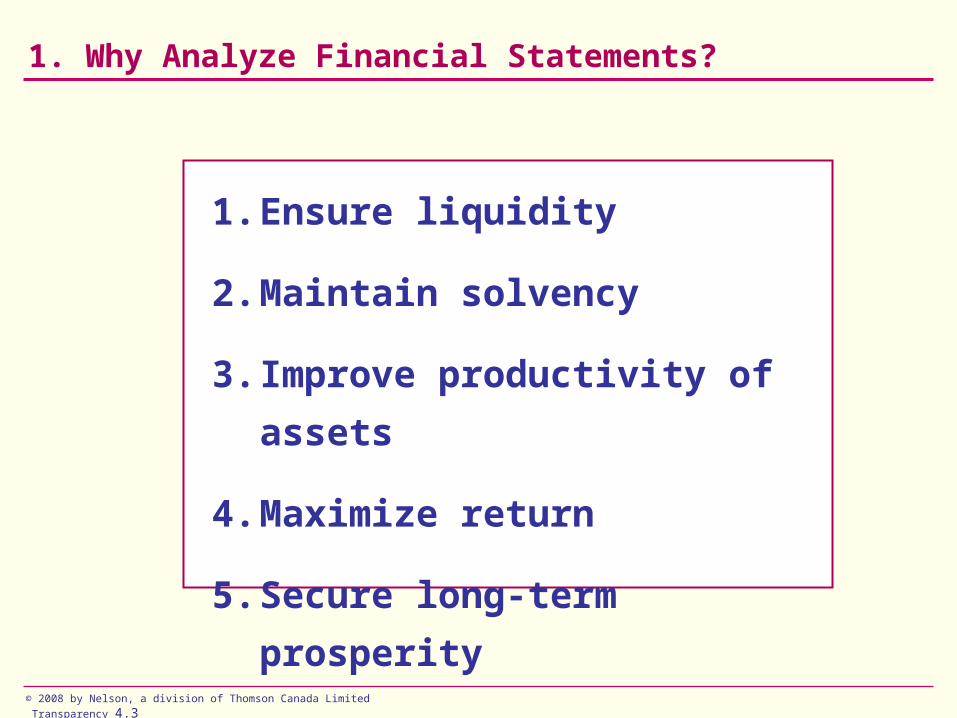
1. Why Analyze Financial Statements?
1. Ensure liquidity
2. Maintain solvency
3. Improve productivity of assets
4. Maximize return
5. Secure long-term prosperity

© 2008 by Nelson, a division of Thomson Canada Limited Transparency 4.4
2. Modern Industries Ltd. – Vertical Analysis
Sales revenue
Cost of sales
Gross profit
Operating expenses
Salaries
Lease payments
Amortization
Other expenses
Total operating expenses
Income before taxes
Income taxes
Net income
$2,500,000
1,400,000
1,100,000
820,000
20,000
50,000
50,000
940,000
160,000
80,000
$ 80,000
2006 $ % of sales
100.0
56.0
44.0
32.8
0.8
2.0
2.0
37.6
6.4
3.2
3.2
100.0
58.0
42.0
33.2
0.8
1.3
2.1
37.4
4.6
2.3
2.3
2005 $ % of sales
$2,300,000
1,334,000
966,000
763,600
18,000
30,000
48,000
859,600
106,400
53,200
$ 53,200

© 2008 by Nelson, a division of Thomson Canada Limited Transparency 4.5
Modern Industries Ltd. – Horizontal Analysis
Sales revenue
Cost of sales
Gross profit
Operating expenses
Salaries
Lease payments
Amortization
Other expenses
Total operating expenses
Income before taxes
Income taxes
Net income
$2,500,000
1,400,000
1,100,000
820,000
20,000
50,000
50,000
940,000
160,000
80,000
$ 80,000
$2,300,000
1,334,000
966,000
763,600
18,000
30,000
48,000
859,600
106,400
53,200
$ 53,200
2006 2005
$ 200,000
66,000
134,000
56,400
2,000
20,000
2,000
80,400
53,600
26,800
$ 26,800
Amount of change
8.69
4.95
13.87
7.38
11.10
66.67
4.17
9.35
50.37
50.37
50.37
% of change
© 2008 by Nelson, a division of Thomson Canada Limited Transparency 4.6
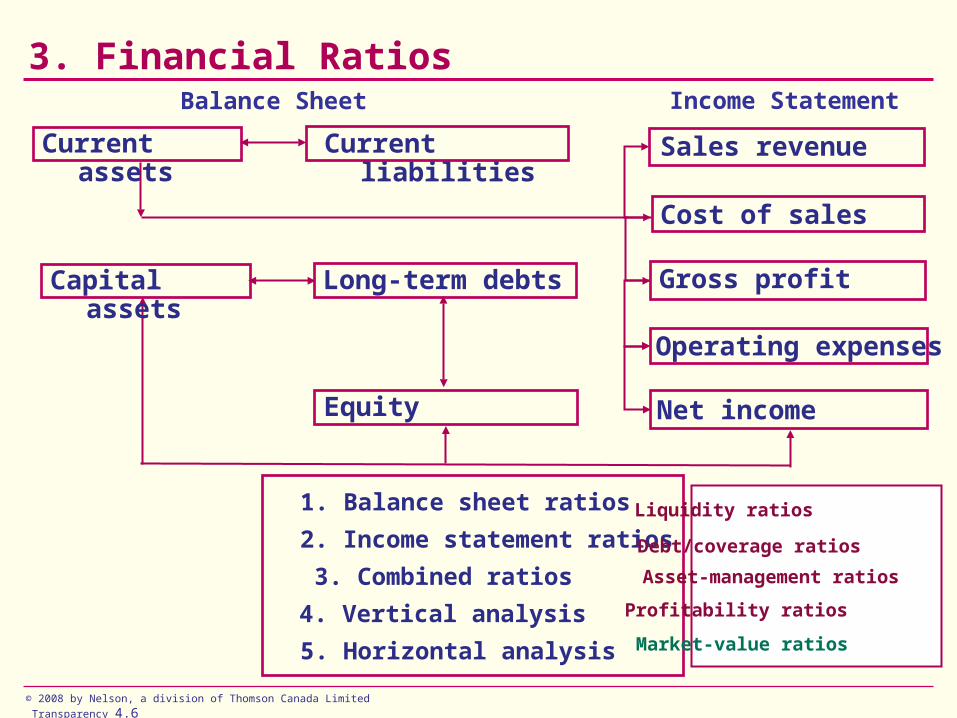
3. Financial Ratios
4. Vertical analysis
Sales revenue
Operating expenses
Cost of sales
Gross profit
Net income
Income Statement
2. Income statement ratios
3. Combined ratios
Current assets Current liabilities
Capital assets Long-term debts
Equity
Balance Sheet
1. Balance sheet ratios
5. Horizontal analysis
Liquidity ratios
Debt/coverage ratios
Asset-management ratios
Profitability ratios
Market-value ratios
© 2008 by Nelson, a division of Thomson Canada Limited Transparency 4.7
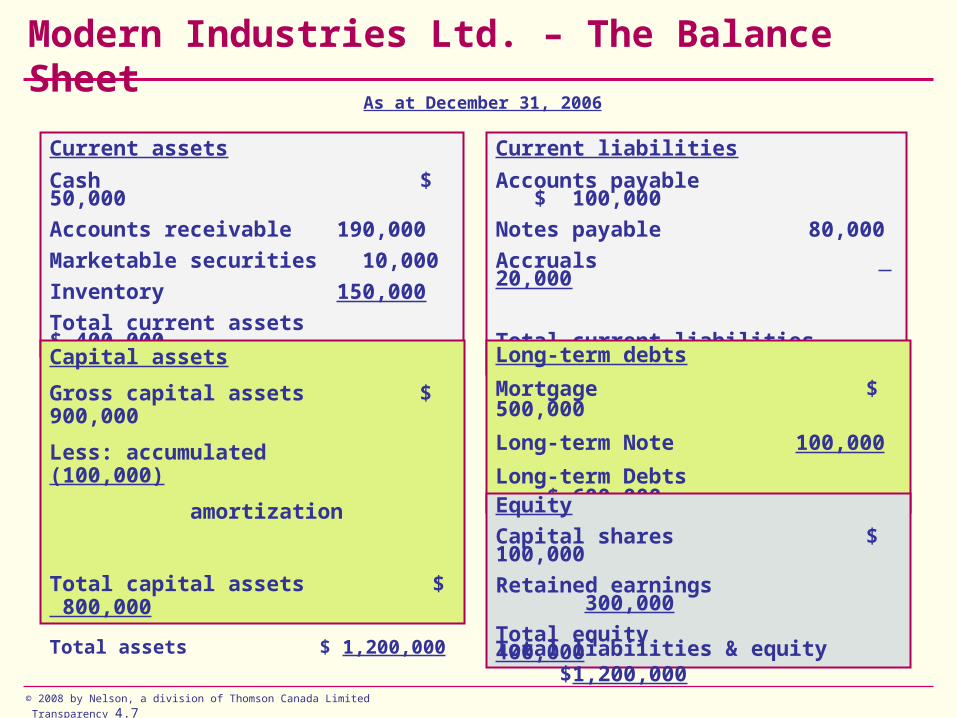
Modern Industries Ltd. – The Balance Sheet
Current assets
Cash $ 50,000
Accounts receivable 190,000
Marketable securities 10,000
Inventory 150,000
Total current assets $ 400,000
Current liabilities
Accounts payable $ 100,000
Notes payable 80,000
Accruals 20,000
Total current liabilities $ 200,000
Capital assets
Gross capital assets $ 900,000
Less: accumulated (100,000)
amortization
Total capital assets $ 800,000
Long-term debts
Mortgage $ 500,000
Long-term Note 100,000
Long-term Debts $ 600,000
Equity
Capital shares $ 100,000
Retained earnings 300,000
Total equity 400,000
Total assets $ 1,200,000 Total liabilities & equity $1,200,000
As at December 31, 2006
© 2008 by Nelson, a division of Thomson Canada Limited Transparency 4.8
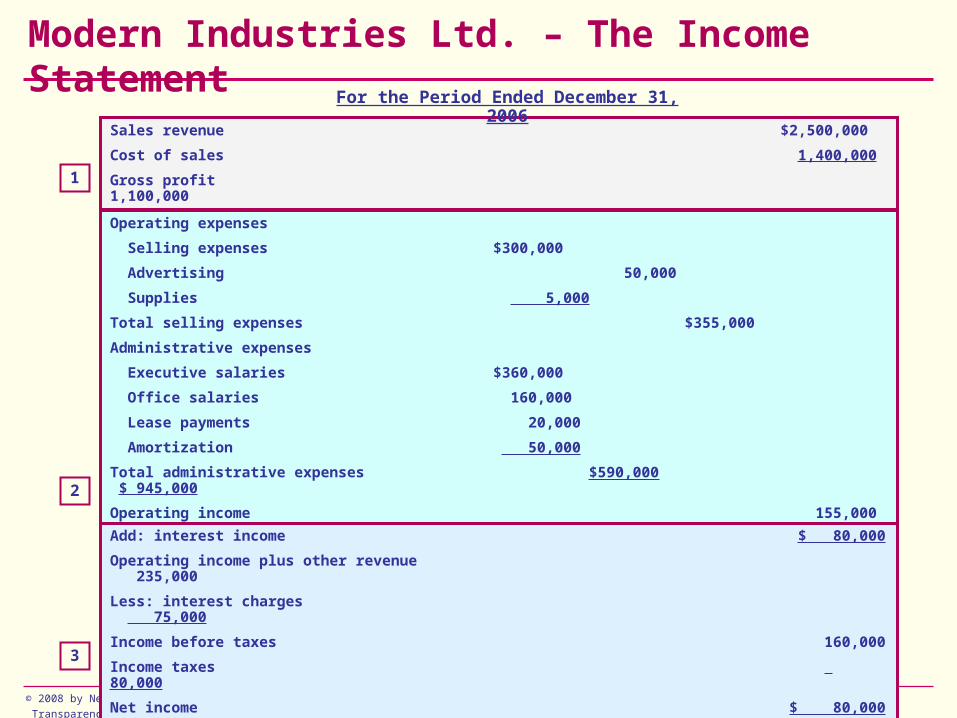
Modern Industries Ltd. – The Income Statement
Sales revenue $2,500,000
Cost of sales 1,400,000
Gross profit 1,100,0001
For the Period Ended December 31, 2006
2
Operating expenses
Selling expenses $300,000
Advertising 50,000
Supplies 5,000
Total selling expenses $355,000
Administrative expenses
Executive salaries $360,000
Office salaries 160,000
Lease payments 20,000
Amortization 50,000
Total administrative expenses $590,000 $ 945,000
Operating income 155,000
3
Add: interest income $ 80,000
Operating income plus other revenue 235,000
Less: interest charges 75,000
Income before taxes 160,000
Income taxes 80,000
Net income $ 80,000

© 2008 by Nelson, a division of Thomson Canada Limited Transparency 4.9
Categories of Financial Ratios
ratios Indicate a company’s ability to meet its short-term obligations.
Liquidity
ratios Measure the extent to which a business can be financed by debt.
Debt/coverage
ratios Show how effectively management utilizes the assets of a business.
Asset-management
ratios Indicate the management’s overall effectiveness as measured by return on sales, on assets, on equity.
Profitability
• short-term lenders
• everybody
• employees
• Investors (shareholders & long-term lenders)
• managers
• suppliers

© 2008 by Nelson, a division of Thomson Canada Limited Transparency 4.10
Commonly Used Financial Ratios
LIQUIDITY RATIOS
DEBT/COVERAGE RATIOS
ASSET/MANAGEMENT RATIOS
PROFITABILITY RATIOS
1. Current ratio (times)
2. Quick or acid test ratio (times)
3. Debt-to-total assets (percent)
4. Times-interest-earned (times)
5. Fixed-charges coverage (times)
6. Average collection period (days)
7. Inventory turnover (times)
8. Capital assets turnover (times)
9. Total assets turnover (times)
10. Profit margin on sales (percent)
11. Return on total assets (percent)
12. Return on equity (percent)

© 2008 by Nelson, a division of Thomson Canada Limited Transparency 4.11
Ratio 1: Current Ratio
Purpose To give a general indication of the ability of a business (borrower) to meet its current obligations.
Current assets Current liabilities
Cash $ 50,000 Accounts payable $100,000
Accounts receivable 190,000 Notes payable 80,000
Marketable securities 10,000 Accruals 20,000
Inventory 150,000
Total current assets $400,000 Total current liabilities $200,000
Current assets
Current liabilities$400,000
$200,000= = 2.0 times
• collateral • growth • cushion
© 2008 by Nelson, a division of Thomson Canada Limited Transparency 4.12
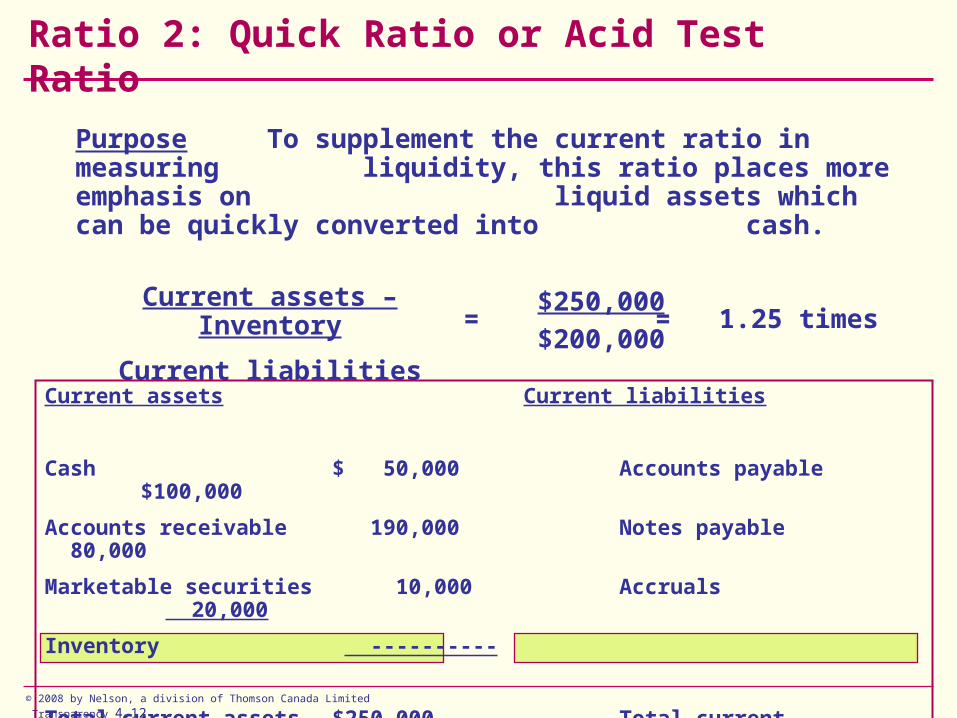
Ratio 2: Quick Ratio or Acid Test Ratio
Purpose To supplement the current ratio in measuring liquidity, this ratio places more emphasis on liquid assets which can be quickly converted into cash.
Current assets Current liabilities
Cash $ 50,000 Accounts payable $100,000
Accounts receivable 190,000 Notes payable 80,000
Marketable securities 10,000 Accruals 20,000
Inventory ----------
Total current assets $250,000 Total current liabilities $200,000
Current assets – Inventory
Current liabilities
$250,000
$200,000= = 1.25 times

© 2008 by Nelson, a division of Thomson Canada Limited Transparency 4.13
Ratio 3: Debt-to-Total Assets
Purpose Measures the proportion of “all” debts provided by lenders to finance “all” assets.
It is also called debt ratio.
Total current assets $ 400,000 Total current liabilities $ 200,000
Total capital assets 800,000 Total long-term debts 600,000
Total debts 800,000
Equity 400,000
Total assets $ 1,200,000 Total liabilities & equity $ 1,200,000
Total debts
Total assets
$800,000
$1,200,000= = 67 percent

© 2008 by Nelson, a division of Thomson Canada Limited Transparency 4.14
Applying for a Mortgage
A person in the 40% tax bracket applies for a mortgage
Payment Salary
$ 1,500$ 5,000
= = .30=$ 2,000$ 5,000 = .40
Payment Salary
Mortgage $ 1,500Income taxes $ 2,000Mortgage $ 2,000
Other $ 1,500
Total $ 5,000Other $ 1,000
Total $ 5,000
Income taxes $ 2,000

© 2008 by Nelson, a division of Thomson Canada Limited Transparency 4.15
Ratio 4: Times-Interest-Earned
Purpose Shows the debt-paying ability of a business or its capacity to service the interest charges.
Sales revenue $ 2,500,000
Cost of sales 1,400,000
Gross profit 1,100,000
Operating expenses
Total selling expenses $ 355,000
Total admin. expenses 590,000 945,000
Operating income 155,000
Add: interest income 80,000
Less: interest charges 75,000 5,000
Income before taxes 160,000
Income taxes 80,000
Net income $ 80,000
Income before taxes + Interest charges
Interest charges$235,000
$75,000= = 3.1 times
•••••
Interest
Principal
Taxes
Dividends
Retained earnings

© 2008 by Nelson, a division of Thomson Canada Limited Transparency 4.16
Ratio 5: Fixed-Charges-Coverage RatioPurpose Similar to the times-interest-earned ratio except
this ratio includes “all” fixed charges, or the capacity to service the interest charges and other fixed obligations.
Sales revenue $2,500,000Cost of sales 1,400,000Gross profit 1,100,000Operating expensesTotal selling expenses $355,000Total administrative expenses 590,000* 945,000Operating income 155,000Add: interest income 80,000Less: interest charges 75,000 5,000Income before taxes 160,000Income taxes 80,000Net income $ 80,000*Includes $20,000 lease payments
I.B.T. + Interest charges + Lease payments
Interest charges + Lease payments
$255,000
$95,000= = 2.7 times

© 2008 by Nelson, a division of Thomson Canada Limited Transparency 4.17
Ratio 6: Average Collection Period
Purpose Measures the number of days it takes a business to collect payments after credit sales have been made.
Balance Sheet
Current assets
Accounts receivable $ 190,000
Total current assets $ 400,000
Sales revenue
365
$2,500,000
365= = = $6,849Step 1 Average sales per day
Step 2 Average collection periodAccounts receivable
Average sales per day
$190,000
$6,849= = = 27.7 days
Income Statement
Sales revenue $2,500,000
Cost of sales 1,400,000
Gross profit $ 1,100,000

© 2008 by Nelson, a division of Thomson Canada Limited Transparency 4.18
Ratio 7: Inventory Turnover
Purpose Shows how long it takes for inventory to turn around or how fast it moves.
Balance Sheet
Current assets
Inventory $ 150,000
Total current assets $ 400,000
Income Statement
Sales revenue $2,500,000
Cost of sales 1,400,000
Gross profit $1,100,000
Cost of sales
Average inventory
$1,400,000
$150,000 = = 9.3 times

© 2008 by Nelson, a division of Thomson Canada Limited Transparency 4.19
Ratio 8: Capital Assets TurnoverPurpose Measures how intensively a firm’s assets such as
land, buildings, and equipment are working.
Current assets $ 400,000
Net capital assets 800,000
Total assets $ 1,200,000
Sales revenue $ 2,500,000
Cost of sales 1,400,000
Gross profit 1,100,000
Total op. expenses 945,000
Operating income 155,000
Other income 5,000
Income before taxes 160,000
Income taxes 80,000
Net income $ 80,000
Sales revenue
Net capital assets
$2,500,000
$800,000= = 3.1 times
Income Statement Balance Sheet
© 2008 by Nelson, a division of Thomson Canada Limited Transparency 4.20
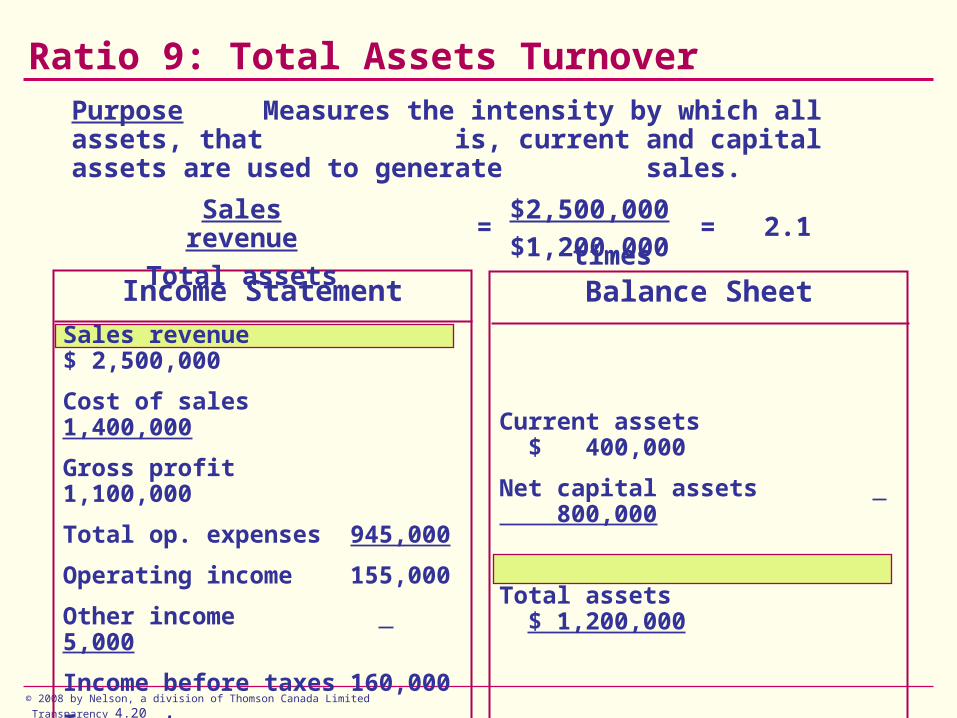
Ratio 9: Total Assets TurnoverPurpose Measures the intensity by which all assets, that
is, current and capital assets are used to generate sales.
Balance Sheet
Current assets $ 400,000
Net capital assets 800,000
Total assets $ 1,200,000
Income Statement
Sales revenue $ 2,500,000
Cost of sales 1,400,000
Gross profit 1,100,000
Total op. expenses 945,000
Operating income 155,000
Other income 5,000
Income before taxes 160,000
Income taxes 80,000
Net income $ 80,000
Sales revenue
Total assets
$2,500,000
$1,200,000 = = 2.1 times

© 2008 by Nelson, a division of Thomson Canada Limited Transparency 4.21
Ratio 10: Profit Margin on Sales
Purpose Shows the efficiency of the business.
Sales revenue $ 2,500,000
Cost of sales 1,400,000
Gross profit 1,100,000
Operating expenses
Total selling expenses $355,000
Total admin. expenses 590,000 945,000
Operating income 155,000
Add: interest income 80,000
Less: interest charges 75,000 5,000
Income before taxes 160,000
Income taxes 80,000
Net income $ 80,000
Operating income
Sales revenue
$155,000
$2,500,000 = = 6.2 percent
Vertical analysis
100.0
44.0
6.2
3.2

© 2008 by Nelson, a division of Thomson Canada Limited Transparency 4.22
Ratio 11: Return on Total Assets
Purpose Measures the return on funds invested in the business by both the owners and the lenders.
Balance Sheet
Current assets $ 400,000
Net capital assets 800,000
Total assets $ 1,200,000
Income Statement
Sales revenue $2,500,000
Cost of sales 1,400,000
Gross profit 1,100,000
Total op. expenses 945,000
Operating income 155,000
Other income 5,000
Income before taxes 160,000
Income taxes 80,000
Net income $ 80,000
Net income
Total assets
$ 80,000
$ 1,200,000 = = 6.7 percent

© 2008 by Nelson, a division of Thomson Canada Limited Transparency 4.23
Ratio 12: Return on Equity
Purpose Shows how profitable a business is to its owners.
Balance Sheet
Current liabilities $ 200,000
Total long-term debts 600,000
Total debts 800,000
Equity 400,000
Total liabilities & equity $1,200,000
Income Statement
Sales revenue $2,500,000
Cost of sales 1,400,000
Gross profit 1,100,000
Total op. expenses 945,000
Operating income 155,000
Other income 5,000
Income before taxes 160,000
Income taxes 80,000
Net income $80,000
Net income
Owners’ equity
$80,000
$400,000 = = 20.0 percent

© 2008 by Nelson, a division of Thomson Canada Limited Transparency 4.24
Supplementary Financial and Market Ratios
LIQUIDITY RATIOS
DEBT/COVERAGE RATIOS
ASSET/MANAGEMENT RATIOS
PROFITABILITY RATIOS
1. Cash ratio (times)
2. Working capital ratio (times)
3. Debt-to-equity (times)
4. Accounts receivable turnover (times)
5. Day’s sales to inventory (days)
6. Income after taxes to sales (percent)
7. Gross margin on sales (percent)
8. Return on invested capital (percent)
MARKET RATIOS
9. Earnings per share (dollars)
10. Cash flow per share (dollars)
11. Return per share (percent)
12. Price/earnings ratio (times)

© 2008 by Nelson, a division of Thomson Canada Limited Transparency 4.25
4. External Financial Ratios
LIQUIDITY RATIOS
DEBT/ COVERAGE
RATIOS
ASSET/ MANAGEMENT
RATIOS
PROFITABILITY RATIOS
1. Current ratio (times)
2. Quick or acid test ratio (times)
3. Debt to total assets (percent)
4. Times-interest-earned (times)
5. Fixed-charges coverage (times)
6. Average Collection period (days)
7. Inventory turnover (times)
8. Capital Assets turnover (times)
9. Total Assets turnover (times)
10. Profit Margin on sales (percent)
11. Return on total assets (percent)
12. Return on equity (percent)
2.00
1.25
.67
3.10
2.70
27.70
9.30
3.10
2.10
6.20
6.70
20.00
Modern Industries Ltd.
1.50
1.00
.55
5.00
5.00
35.00
8.00
4.50
3.50
5.50
5.50
15.00
External ratios

© 2008 by Nelson, a division of Thomson Canada Limited Transparency 4.26
5. Du Pont Financial System
Cash+
Accountsreceivable
+Prepaid
expenses +
Inventory
Cost of sales
+Amortization
+ Selling
expenses+
Administrativeexpenses
Currentassets
+Capitalassets
Sales-
Total cost of operation
Total assetsturnover
X
Return on total
assets
Sales÷
Total assets
÷
Sales
Operating margin
Operatingmargin

© 2008 by Nelson, a division of Thomson Canada Limited Transparency 4.27
6. Limitations of Financial Ratios
To make ratios meaningful, you should …
1. Look at trends
2. Compare your financial performance with other businesses or industry
The caveats of financial ratios
• They only give signals – they do not answer questions relating
to why, what, or how.
• When comparing ratios with other businesses, make sure that
the closing dates of the financial statements are the same.
• Make sure that the numbers used are similar.
• The size of the business may make a difference.
• The nature of the operations may also be different (new plant versus
worn-out plant).