© 2009 yahia m. tokal-ahmed all rights reserved
TRANSCRIPT

© 2009
Yahia M. Tokal-Ahmed
ALL RIGHTS RESERVED
RESPONSE OF BRIDGE STRUCTURES SUBJECTED TO BLAST LOADS AND
PROTECTION TECHNIQUES TO MITIGATE THE EFFECT OF BLAST
HAZARDS ON BRIDGES
by
YAHIA M. TOKAL-AHMED
A Dissertation submitted to the
Graduate School – New Brunswick
Rutgers, The State University of New Jersey
In partial fulfillment of the requirements
for the degree of
Doctor of Philosophy
Graduate Program in Civil and Environmental Engineering
Written under the direction of
Dr. Husam S. Najm
and approved by
_______________________________
_______________________________
_______________________________
_______________________________
_______________________________
New Brunswick, New Jersey
January, 2009

ii
ABSTRACT OF THE DISSERTATION
Response of bridge structures subjected to blast loads and protection techniques to
mitigate the effect of blast hazards on bridges
by YAHIA M. TOKAL-AHMED
Dissertation Director:
Dr. Husam S. Najm
Bridges are critical to the transportation system especially at the time of crises. They are
essential for rescue missions, evacuations, and rapid distribution of aid and medical
supplies. Bridges are highly visible and accessible structures which make them valued
potential targets for terrorist attacks as their destruction could have significant impact on
the nation. An efficient security system can minimize the potential of terrorism, yet it will
not completely eliminate the threat. Consequently, critical bridges should be protected
and designed to mitigate probable blast hazards.
The primary objective of this investigation is to analyze the effect of blast loads on
critical bridge components and bridge global response, and propose protection measures
for mitigating blast hazards. This investigation presents an overview of the characteristics
of blast loads, pressure distributions, wave propagation and reflection, energy dissipation,
and the factors affecting the behavior of structural elements subjected to blast loading.

iii
To simplify the analysis of structural elements subjected to blast loads, blast load
response spectra were developed. These spectra are used to transform the dynamic blast
loads into equivalent static loads. Blast response spectra can be used to analyze and
design individual structural components subjected to blast loads, estimate the required
ductility, and estimate the minimum standoff distance for the probable blast hazards.
The global behavior of a typical highway bridge was evaluated using computer
simulation. The bridge model was subjected to various blast scenarios applied above or
below the bridge deck. The results from these computer simulations were used to identify
the vulnerable components in the bridge during a blast hazard as well as estimating the
magnitudes and locations of maximum shear forces and bending moments. The results
from the computer simulations were compared to those from the response spectral
analysis. Thus, protection measures were proposed and evaluated. Protection measures
include preventive measures such as standoff distance and added security. They also
include improved redundancy through utilizing multiple column bents with double and
triple edge columns, using highly ductile materials, longer seat widths, doubly reinforced
decks, hold-down devices, and the use of cable auxiliary systems.

iv
DEDICATION
To my parents, for all their love, care, and support.

v
ACKNOWLEDGEMENTS
First and foremost, I would like to thank God Almighty for guiding me through every
step of my life. I wish to express my deepest gratitude to my advisor Dr. Husam Najm,
for his guidance, care, support, and encouragement. Working with Dr. Najm was an
enriching experience on both the personal and the professional levels. This work was
only possible through his guidance and assistance.
I am very grateful to my committee members; Dr. Perumalsamy Balaguru, Dr. Hani
Nassif, Dr. Yook-Kong Yong, and Dr. David Coit. I am honored to have them in my
committee. I deeply thank them for all their help. I would like to thank Dr. Perumalsamy
Balaguru and Dr. Nenad Gucunski for always being so welcoming to my questions and
for their guidance and advice. Special thanks to Dr. Edward Nawy for his invaluable
advice and assistance. I extend my appreciation to the staff of Civil Engineering
Department at Rutgers University for their help and support; Connie Dellamura, Linda
Szary, Pat Szary, Azam Kalantari, and Gina Cullari. Also, I am very grateful to my
instructors; Dr. Trefor Williams, Dr. Andy Foden, and Suhail Albhaisi.
Thanks to my colleagues at the Civil and Environmental Engineering Department.
Special thanks to Dr. Joseph Davis, Kagan Aktas, Amrutha Donaiah, and Ufuk Ates. I
would like to express my appreciation and gratitude to Dr. Mohamed Nazir, Dr.
Mohamed Arafa, Radwa Omar, Salaheldin Hamed, and Ahmed Shaker.

vi
Finally, I thank my brother and sister for their warm encouragement and love. Most of
all, I thank my beloved parents for their kindness, warmth, love, and prayers. Words can
not express my appreciation and love to them.

vii
TABLE OF CONTENTS
ABSTRACT OF THE DISSERTATION ........................................................................... ii
DEDICATION................................................................................................................... iv
ACKNOWLEDGEMENTS................................................................................................ v
TABLE OF CONTENTS.................................................................................................. vii
LIST OF TABLES............................................................................................................. xi
LIST OF FIGURES .......................................................................................................... xii
CHAPTER 1: INTRODUCTION...................................................................................... 1
1.1 Statement of Problem.......................................................................................... 1
1.2 Research Objectives............................................................................................ 2
CHAPTER 2: BACKGROUND........................................................................................ 5
2.1 Blast Hazards and Attacks against Infrastructure Targets .................................. 5
2.2 Designing Bridges for Blast Hazards................................................................ 11
2.3 Characteristics of the Blast Wave..................................................................... 16
2.3.1 Types of explosives................................................................................... 17
2.3.2 Types of blast scenarios ............................................................................ 19
2.3.3 Positive and negative phases..................................................................... 20
2.3.4 Incident and reflected pressures................................................................ 21
2.3.5 Cubic root scaling and blast wave parameters .......................................... 23
2.3.6 Confined versus unconfined blasts ........................................................... 27
2.3.7 Vapor cloud explosions............................................................................. 27

viii
2.4 Factors affecting the Behavior of Bridges during Blast loading....................... 28
2.5 Comparison of Blast Hazards and Earthquakes Hazards.................................. 30
2.6 Dynamic Properties of Materials ...................................................................... 31
2.7 Strength Increase Factor ................................................................................... 32
2.8 Impulsive Load Design ..................................................................................... 33
2.9 Equivalent SDOF Analysis ............................................................................... 34
2.10 Plastic Design of Structural Members Loaded with Impulsive Loads ............. 35
2.11 Pressure-Impulse (P-I) Diagrams...................................................................... 38
2.12 Synopsis ............................................................................................................ 44
CHAPTER 3: RESPONSE SPECTRA FOR BLAST LOADS....................................... 47
3.1 Variation of Blast Pressure along the Length of Loaded Members.................. 48
3.2 Elastic Blast Pressure Response Spectra........................................................... 52
3.2.1 Designing a member for a specific charge weight and standoff distance. 60
3.2.2 Calculating the minimum required standoff distance for a member......... 61
3.3 Inelastic Blast Pressure Response Spectra ........................................................ 62
CHAPTER 4: ANALYTICAL INVESTIGATION......................................................... 66
4.1 Analysis Methods.............................................................................................. 66
4.2 ELS Software .................................................................................................... 68
4.2.1 Applied element method ........................................................................... 68
4.2.2 Connectivity between elements ................................................................ 69
4.2.3 Collapse analysis....................................................................................... 71

ix
4.2.4 Blast wave model...................................................................................... 71
4.3 Response of Concrete Columns Subjected to Blast Loads ............................... 73
4.3.1 ELS analysis.............................................................................................. 74
4.3.2 Response spectral analysis – Approximate Analysis................................ 89
4.3.3 Comparisons and discussions ................................................................... 94
CHAPTER 5: BRIDGE GLOBAL RESPONSE TO BLAST LOADS........................... 98
5.1 Below Deck Blast Scenario ............................................................................ 103
5.1.1 Blast scenario close to the bridge midspan ............................................. 103
5.1.2 Blast scenario between the midspan and the bridge pier ........................ 112
5.1.3 Blast scenario underneath the bridge bent .............................................. 114
5.1.4 Hand charge attached to one or more of the columns............................. 118
5.2 Above Deck Blast Scenario ............................................................................ 119
5.2.1 Blast scenario close to the bridge midspan ............................................. 120
5.2.2 Blast scenario close to the bridge bent.................................................... 123
5.3 Results and Discussion ................................................................................... 125
CHAPTER 6: PROTECTION TECHNIQUES TO MITIGATE BLAST HAZARDS. 127
6.1 Minimum Standoff Distance and Maximum Charge Weight ......................... 128
6.2 Highly Ductile Concrete Materials ................................................................. 129
6.2.1 SIFCON .................................................................................................. 132
6.2.2 SIMCON................................................................................................. 134
6.2.3 ECC......................................................................................................... 135

x
6.3 Redundancy and Continuity............................................................................ 139
6.4 Collapse Prevention using Auxiliary Cable Systems...................................... 147
6.4.1 Equilibrium of the deflected system (Popov, 1990) ............................... 150
6.4.2 Castigliano’s first theorem (Oden, 1967)................................................ 154
6.4.3 Prestressed cable system......................................................................... 157
6.4.4 Anchorage details of cable system.......................................................... 158
CHAPTER 7: CONCLUSIONS AND RECOMMENDATIONS................................. 161
7.1 Summary......................................................................................................... 161
7.2 Conclusions and Recommendations ............................................................... 162
7.3 Future Research .............................................................................................. 165
APPENDIX A................................................................................................................. 166
A.1 Using the Blast Response Spectra to Design a Structural Element Subjected to a
Specific Blast Scenario ............................................................................................... 167
A.2 Calculating the Minimum Required Standoff Distance for a Specific Structural
Element ....................................................................................................................... 174
APPENDIX B ................................................................................................................. 179
Design of Catenary Cable System to Prevent Progressive Collapse .......................... 180
APPENDIX C ................................................................................................................. 184
Cost Analysis of Bridge Protection Measures against Extreme Events ..................... 185
REFERENCES ............................................................................................................... 194
CURRICULUM VITA ................................................................................................... 197

xi
LIST OF TABLES
Table 2.1. Minimum barrier standoffs from bridge piers (FHWA, 2003)........................ 16
Table 2.2. Desired barrier standoffs from bridge piers (FHWA, 2003) ........................... 16
Table 2.3. TNT equivalents for different types of explosive (TM5-1300, 1990)............. 18
Table 2.4. Comparing seismic hazards and blast hazards................................................. 31
Table 2.5. Dynamic Increase Factor for design of reinforced Concrete (TM5-1300, 1990)
................................................................................................................................... 32
Table 2.6. Strength Increase Facor (TM5-1300, 1990) .................................................... 33
Table 2.7. Performance criteria for typical structural components (TM5-1300, 1990).... 43
Table 4.1. Comparison between the maximum shear values of ELS versus SDOF......... 95
Table 4.2. Comparison between the total shear values of ELS versus SDOF.................. 95

xii
LIST OF FIGURES
Fig. 2.1. Murrah Federal Building before explosion (courtesy Associated Press) ............. 6
Fig. 2.2. Murrah Federal Building after explosion (courtesy Associated Press) ................ 6
Fig. 2.3. Severe damage in the Murrah Federal Building (courtesy Associated Press)...... 7
Fig. 2.4. Khubar Towers after the terrorist attack (courtesy Associated Press).................. 7
Fig. 2.5. WTC towers completely collapsed after the attacks (courtesy Associated Press) 8
Fig. 2.6. Damage done to the Pentagon building (courtesy Associated Press)................... 8
Fig. 2.7. Collapse of I-880 ramps near Oakland, CA (courtesy Associated Press) ............ 9
Fig. 2.8. Barge crashing into the river piers of I-40 Bridge in Oklahoma (NTSB, 2002) 10
Fig. 2.9. Collapse of I-40 Bridge in Oklahoma due to vessel impact (NTSB, 2002) ....... 10
Fig. 2.10. Collapse of bridge due to blast (courtesy AFP / Getty Images) ....................... 11
Fig. 2.11. Collapse of bridge span due to blast load (GlobalSecurity.org, 1999)............. 12
Fig. 2.12. Collapse of truss bridge due to blast (CNN, 2005)........................................... 12
Fig. 2.13. Hemispherical blast waves for ground-level explosion (courtesy Reuters) ..... 19
Fig. 2.14. Pressure-time history for free field blast (TM5-1300, 1990) ........................... 21
Fig. 2.15. Angle of incidence (TM5-1300, 1990)............................................................. 22
Fig. 2.16. Effect of angle of incidence on the coefficient of reflection (TM5-1300, 1990)
................................................................................................................................... 23
Fig. 2.17. Blast wave parameters for hemispherical TNT explosion (TM5-1300, 1990). 25
Fig. 2.18. Proposed equation for coefficient of reflected pressure ................................... 26
Fig. 2.19. Effect of standoff distance on pressure amplitude (A.T.-BLAST)................... 29
Fig. 2.20. Dynamic Load Factor for triangular load (TM5-1300, 1990) .......................... 35
Fig. 2.21. Typical resistance curve of elastic-perfectly plastic system............................. 36

xiii
Fig. 2.22. Typical normalized P-I diagram for a SDOF system (Mays and Smith, 1995) 38
Fig. 2.23. Quasi-static loading .......................................................................................... 40
Fig. 2.24. Impulsive loading ............................................................................................. 40
Fig. 2.25. P-I diagram expressed in specific units (ASCE, 1997) .................................... 42
Fig. 3.1. Variation of range and angle of incidence along the length of the loaded member
................................................................................................................................... 48
Fig. 3.2. Distribution of blast pressure along the length of the loaded member for
different values of standoff distances ....................................................................... 50
Fig. 3.3. Distribution of blast pressure along the length of the loaded member for
different charge weights (R = 5 ft)............................................................................ 51
Fig. 3.4. Response Spectra for W = 500 lbs (zero damping) ............................................ 55
Fig. 3.5. Response Spectra for W = 1000 lbs (zero damping) .......................................... 56
Fig. 3.6. Response Spectra for R = 3 ft (zero damping) ................................................... 57
Fig. 3.7. Response Spectra for R = 8 ft (zero damping) ................................................... 58
Fig. 3.8. Response Spectra for R = 20 ft (zero damping) ................................................. 59
Fig. 3.9. Effect of Damping on the equivalent static pressure (W = 1000 lbs)................. 63
Fig. 3.10. Plastic pressure values for various ductility limits (W = 500 lbs).................... 64
Fig. 3.11. Plastic pressure values for various ductility limits (W = 1000 lbs).................. 65
Fig. 4.1. Comparison between AEM, FEM, and DEM (ELS Technical Manual, 2006).. 69
Fig. 4.2. Connectivity springs between adjacent elements (ELS Technical Manual, 2006)
................................................................................................................................... 70
Fig. 4.3. Partial connectivity in AEM (ELS Technical Manual, 2006) ............................ 71
Fig. 4.4. Effect of the standoff distance on the time of maximum response .................... 75

xiv
Fig. 4.5. Typical time-history response of a concrete column subjected to distant blast
load............................................................................................................................ 78
Fig. 4.6. Schematics of cracks developed in a concrete column due to variable standoff
distances.................................................................................................................... 79
Fig. 4.7. Schematics of SFD developed in a concrete column due to variable standoff
distances.................................................................................................................... 80
Fig. 4.8. Schematics of BMD developed in a concrete column due to variable standoff
distances.................................................................................................................... 81
Fig. 4.9. Schematics of shear envelope developed in a concrete column due to variable
standoff distances...................................................................................................... 82
Fig. 4.10. Schematics of bending moment envelope developed in a concrete column due
to variable standoff distances.................................................................................... 83
Fig. 4.11. Effect of the standoff distance on the magnitude of the reversed response ..... 84
Fig. 4.12. Response of concrete column to various blast scenarios.................................. 87
Fig. 4.13. Effect of the charge weight on the maximum shear developed in the column. 88
Fig. 4.14. Resistance curve for concrete columns with fixed supports............................. 90
Fig. 4.15. Pressure distribution along the length of the column ....................................... 93
Fig. 4.16. Maximum shear calculated using ELS analysis versus SDOF analysis........... 96
Fig. 4.17. Summation of total shear calculated using ELS analysis versus SDOF analysis
................................................................................................................................... 96
Fig. 5.1. Cross section of bridge (Wassef et al, 2003) .................................................... 100
Fig. 5.2. Reinforcement details of the bridge model (ELS)............................................ 100
Fig. 5.3. Prestressed girders supported on elastomeric bearing pads.............................. 101

xv
Fig. 5.4. View of the bridge model prior to being subjected to blast scenarios.............. 102
Fig. 5.5. Response of deck slab to a blast scenario from below (scale 1:15) ................. 104
Fig. 5.6. Schematics of the SFD of a bridge girder subjected to below-deck blast scenario
................................................................................................................................. 105
Fig. 5.7. Schematics of the BMD of a bridge girder subjected to below-deck blast ...... 106
Fig. 5.8. Separation between the girders and the abutment ............................................ 108
Fig. 5.9. Fixed bearing connection.................................................................................. 109
Fig. 5.10. Separation between the bottom flange and the web of the prestressed girders
................................................................................................................................. 109
Fig. 5.11. Lateral movement of abutment due to blast waves ........................................ 110
Fig. 5.12. Schematics of the SFD and BMD of a bridge column subjected to below-deck
blast scenario........................................................................................................... 111
Fig. 5.13. Lateral displacement of bridge girders (scale 1:20) ....................................... 112
Fig. 5.14. Response of the bridge model to a below-deck detonation between the midspan
and the pier.............................................................................................................. 113
Fig. 5.15. Intermediate bent subjected to lateral bending (scale 1:50) ........................... 114
Fig. 5.16. Rising of bridge superstructure if the girders are not restrained against upward
movement................................................................................................................ 115
Fig. 5.17. Deformed shape of the intermediate bent (scale 1:25) ................................... 116
Fig. 5.18. Failure in concrete columns for integral piers ................................................ 117
Fig. 5.19. Cracking at the pier cap and separation between the cap beam and columns 117
Fig. 5.20. Failure in concrete column as a result of a hand emplaced charge ................ 118
Fig. 5.21. Bridge collapse due to the failure in the intermediate pier............................. 119

xvi
Fig. 5.22. Crushing of concrete at the top of the deck slab............................................. 121
Fig. 5.23. Initiation of flexural cracks in the cap beam .................................................. 122
Fig. 5.24. Severe flexural cracking of pier cap and buckling of concrete columns........ 122
Fig. 5.25. Hazards of falling debris................................................................................. 123
Fig. 5.26. Response of the bridge model to an above-deck detonation at the bent......... 124
Fig. 6.1. Moment-curvature curve of HPFRC versus RC............................................... 130
Fig. 6.2. Effect of the fiber volume fraction on the flexural behavior of SIFCON ........ 133
Fig. 6.3. Load-deflection curve for reinforced concrete versus reinforced SIFCON (Fritz
et al, 1992) .............................................................................................................. 134
Fig. 6.4. Tensile stress strain behavior of concrete, FRC, and ECC (Li, 2003) ............. 138
Fig. 6.5. Bendable ECC (Li, 2003) ................................................................................. 138
Fig. 6.6. Multiple column straddle bent (Route 130 East Brunswick, NJ) ..................... 140
Fig. 6.7. Close view of the multi column bent................................................................ 141
Fig. 6.8. Increased pier redundancy using double and triple edge columns ................... 142
Fig. 6.9. HPFRC wall piers............................................................................................. 142
Fig. 6.10. Combinations of HPFRC walls and columns................................................. 143
Fig. 6.11. Encased composite HPFRC columns ............................................................. 145
Fig. 6.12. Effect of pipe thickness on the moment curvature curve ............................... 146
Fig. 6.13. Effect of concrete ultimate strain on the moment curvature curve................. 147
Fig. 6.14. Typical detail of cable system in concrete girders ......................................... 149
Fig. 6.15. Typical detail of cable system in steel girders................................................ 150
Fig. 6.16. Equilibrium of deflected system of cables for a two-span bridge .................. 151
Fig. 6.17. Equilibrium of deflected system of cables for a multiple-span bridge........... 153

xvii
Fig. 6.18. Long single cable system versus multiple short cable systems ...................... 155
Fig. 6.19. Effect of the angle of rotation on the requires area of the cables ................... 156
Fig. 6.20. Prestressed cable system a) initial prestressing b) final equilibrium.............. 157
Fig. 6.21. Anchored cables at the abutment backwall .................................................... 160
Fig. 6.22. Anchored cables behind columns ................................................................... 160
Fig. A.1. Response spectra for W = 1000 lbs (zero damping)........................................ 169
Fig. A.2. Pressure distribution along the length of the member ..................................... 171
Fig. B.1. Schematic of the catenary forces in the cable system...................................... 181
Fig. C.1. Pier section prior to any protection measures .................................................. 192
Fig. C.2. Pier section designed for minor blast hazards.................................................. 193
Fig. C.3. Pier section designed for major blast hazards.................................................. 193

1
CHAPTER 1
INTRODUCTION
1.1 Statement of Problem
One of the challenges associated with blast design is that most of the information related
to this phenomenon are scattered in different sources. In addition to the scatter, some of
the information is classified and not accessible. It is essential to review the available
literature regarding bridge security, types of explosives, characteristics of the blast wave,
and the different factors that affect the behavior of bridges during blast scenarios.
According to the Federal Highway Administration (NBI, 2006) there are more than
600,000 bridges in the United States. Bridges are essential and critical components of the
transportation system especially at the time of crises. They are essential for rescue
missions, evacuation, and transporting supplies. Damage in one or more critical bridges
can result in hundreds of causalities. In addition, the cost of reconstructing the bridge is
significantly high. This reconstruction cost can range from several million dollars for
ordinary bridges up to billions of dollars for major bridges. Blast hazards on bridges can
be classified as either accidental hazards or intentional blast attacks. The accessibility of

2
bridges as well as their national importance makes them attractive targets to terrorism.
Bridges and other transportation assets are considered to be potential targets to terrorist
attacks (Blue Ribbon Panel Report, 2003). Information obtained from terrorists training
manuals and the testimonies of captured terrorists revealed that there were planned
terrorist attacks against U.S. bridges. In 2001, California received several threats to some
of its major bridges (CNN, 2001). Pictures of the Golden Gate Bridge and the Brooklyn
Bridge were found with one of the captured terrorists. In 2002, a terrorist plot to destroy
the Brooklyn Bridge by using blowtorches to cut through its cables was exposed.
Between 1980 and 2006, more than 50 attacks against highway bridges were recorded
worldwide (TRB, 2008).
An effective security system will minimize the potential threat of an attack, but it will not
entirely eliminate the occurrence of attacks. Critical bridges should be designed to
mitigate potential blast scenarios. The current engineering standards used for the design
of bridges do not account for designing bridges against blast loading. Hence, it is
essential to investigate the effect of blast scenarios on critical bridges and establish
guidelines regarding the security of bridges.
1.2 Research Objectives
The primary objective of this investigation is to analyze the effect of blast loads on
critical bridge components and bridge global response, and propose protection measures
for mitigating blast hazards. The proposed research program will take into account both
local and global behavior of bridges. Based on the observations obtained from the

3
analysis and the response of bridge components, protection measures will be proposed
and evaluated. These protections measures aim to minimize the damage and prevent the
collapse of bridges subjected to blast hazards. The objectives of this study are the
following:
• Understand the fundamentals of blast hazards both qualitatively and
quantitatively. The effect of wave propagation, reflected pressure, momentum,
and impulse will be studied to evaluate their effect on structural elements. The
interaction between the blast waves and the structural material will be examined.
• Develop blast load response spectra to transform the dynamic blast loads into
equivalent static loads. Blast response spectra can be used to analyze and design
individual structural components subjected to blast loads, estimate the required
ductility, and estimate the minimum standoff distance for the different probable
blast scenarios.
• Perform computer simulation to evaluate the behavior of individual superstructure
and substructure bridge components subjected to blast loads, and the global
behavior of bridges subjected to various blast loads applied above or below the
bridge deck. The results from these computer simulations will be used to identify
the vulnerable components in the bridge during a blast hazard. These results will
be compared with a simplified SDOF analysis using the blast load response
spectra.

4
• Evaluate various protection measures and investigate in depth those measures that
are efficient, easy to apply, and cost effective. These protection measures include:
cable systems to prevent collapse, redundant substructure components,
substructure components made using High Performance Fiber Reinforced
Concrete (HPFRC), superstructure continuity, and maintaining minimum standoff
distance.

5
CHAPTER 2
BACKGROUND
2.1 Blast Hazards and Attacks against Infrastructure Targets
Recently, the threat of terrorist attacks has become an increasing concern for
governments. America was subjected to several terrorist attacks during the past 25 years.
In April 1983, the United States embassy in Beirut, Lebanon was subjected to a car
bombing attack which killed 63 people. The interest in protecting infrastructure against
terrorist attacks and blast hazards was strongly generated after the bombing of the Murrah
Federal Building in Oklahoma City in April 1995 (Figs 2.1 through 2.3). This terrorist
attack killed 168 people and injured over 600 more. A second wave of interest was
generated after the bombing of the Khubar Towers in Saudi Arabia in June 1996 (Fig.
2.4). The buildings were used as housing facilities for foreign military personnel. The
explosion killed 19 U.S. servicemen and injured more than 500 people from several
countries. However, the collapse of World Trade Center (WTC) Towers in New York
City, resulting from the terrorist attack in September 2001, was the key event that raised a
high interest level of protecting critical infrastructural targets against blast scenarios (Fig

6
2.5). Almost 3,000 people were killed in the WTC Towers collapse (CNN, 2002). The
Pentagon was also attacked by a hijacked plane (Fig. 2.6).
Fig. 2.1. Murrah Federal Building before explosion (courtesy Associated Press)
Fig. 2.2. Murrah Federal Building after explosion (courtesy Associated Press)

7
Fig. 2.3. Severe damage in the Murrah Federal Building (courtesy Associated Press)
Fig. 2.4. Khubar Towers after the terrorist attack (courtesy Associated Press)

8
Fig. 2.5. WTC towers completely collapsed after the attacks (courtesy Associated Press)
Fig. 2.6. Damage done to the Pentagon building (courtesy Associated Press)

9
Other hazards on bridges could result from incidents such as fiery crashes of gasoline
tankers such as those on I-95 in Connecticut in 2003, and I-880 near San Francisco in
2007 (Fig. 2.7). Both these incidents resulted in the partial collapse of bridges and caused
significant damage and disruption to traffic. Vessel impact and truck impacts are also
hazardous events to bridges and can result in partial or total collapse of the bridge. An
example of such, was the vessel impacts to the river piers of the I-40 Bridge in Oklahoma
in 2002 (Figs. 2.8 and 2.9) that resulted in the total collapse of two spans of the bridge.
Similarly, a truck impact resulted in the partial collapse of two girders in Pennsylvania in
2007.
Fig. 2.7. Collapse of I-880 ramps near Oakland, CA (courtesy Associated Press)

10
Fig. 2.8. Barge crashing into the river piers of I-40 Bridge in Oklahoma (NTSB, 2002)
Fig. 2.9. Collapse of I-40 Bridge in Oklahoma due to vessel impact (NTSB, 2002)
11
2.2 Designing Bridges for Blast Hazards
Adopting an efficient security system is the most effective way to minimize the potential
of terrorist attacks. The security system should be visible so that it can scare terrorists
away. Many of these security measures are cost-effective such as security surveillance,
cameras, preventing parking under the bridge, and proper lighting of the site (Williamson
and Winget, 2005). Yet, it is almost impossible to totally eliminate terrorism and other
blast hazards. Critical bridges and essential infrastructure elements need to be protected
against extreme loads resulting from low probability / high consequence events such as
terrorist attacks, blast hazards, and other high impact loads. These bridges have to be
designed to mitigate the effect of blast loading due to probable attacks and hazards.
Structural engineers should begin considering blast as a type of loading on critical
structures. In addition, designing bridges to mitigate blast scenarios will enhance their
performance against other extreme events. The devastating effect of blast loads on
bridges is shown in Figs. 2.10 through 2.12.
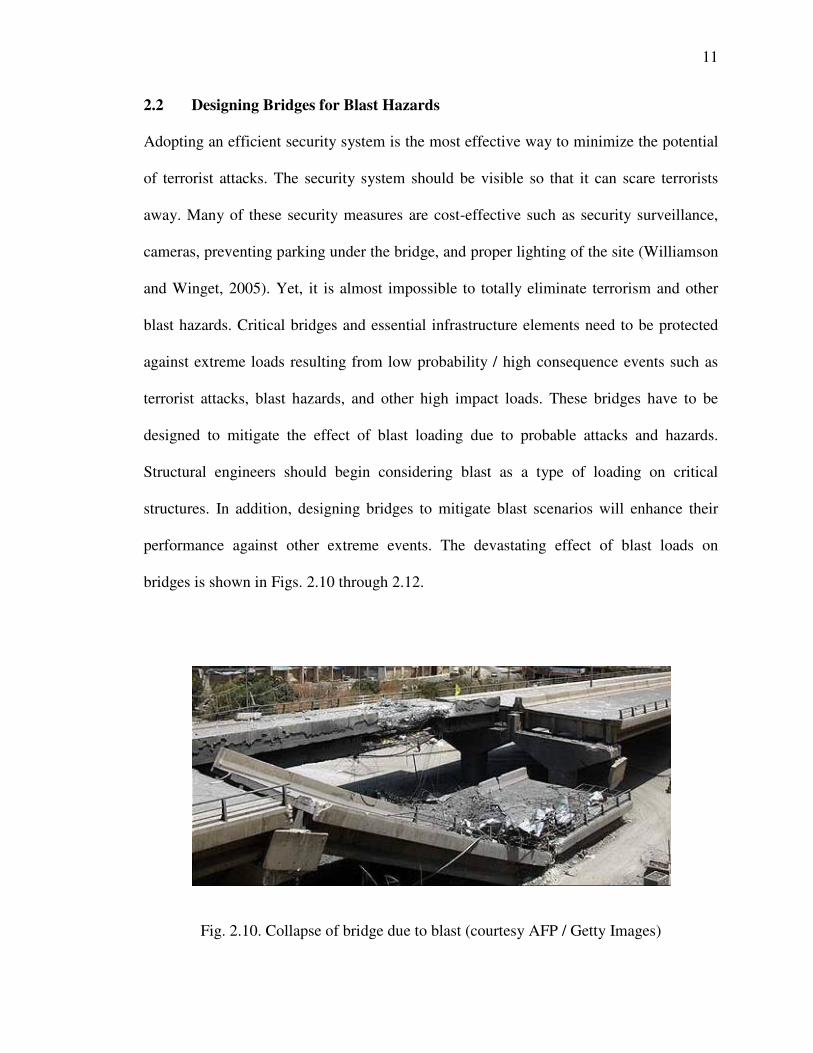
Fig. 2.10. Collapse of bridge due to blast (courtesy AFP / Getty Images)

12
Fig. 2.11. Collapse of bridge span due to blast load (GlobalSecurity.org, 1999)
Fig. 2.12. Collapse of truss bridge due to blast (CNN, 2005)

13
Terrorist attacks are highly unpredictable events, and therefore it is impossible to predict
the exact scenario that might take place. More than 50% of the terrorist attacks
worldwide are in the form of explosives (FHWA, 2006). Designing bridges to resist all
possible combinations of blast scenarios is unpractical and uneconomical. Military
structures are usually designed to resist probable blast scenarios and to remain functional
after the event. However, it is uneconomical to design bridges and other essential
infrastructure components to remain intact after blast attacks.
The philosophy of designing structures against blast loading aims to minimize the
damage as much as possible. First, it is important to categorize bridges in terms of their
importance (Blue Ribbon Panel Report, 2003). Due to the limited financial resources,
prioritization of bridges will ensure that more concern will be directed towards critical
bridges. There are several factors that affect the prioritization process. These factors
include the national significance of the bridge, availability of alternative routes, average
daily traffic, bridge dimensions, criticality to emergency evacuation, and border crossing.
Secondly, a risk assessment should be made to identify the credible threats that can occur
and to predict the accepted risk levels and design for the unacceptable levels of damage.
A security risk assessment, however, is difficult to quantify. Security risk is a function of
the nature of the threat or the attack, the probability of an attack, the probability the attack
is successful, the effectiveness of the bridge security system against the attack, and the
consequences associated with the bridge damage or collapse due to the attack.

14
Blast hazards and performance criteria for bridges can be based on a two-level design
approach; Level I blast design is an operating level blast in which the bridge remains
operational after light blast with minimal to moderate damage, and Level II blast design
in which the bridge suffers significant damage but does not collapse under heavy blast
loads. The choice of design levels for blast loads depends on many complex factors
including detailed analytical investigation, experimental studies, bridge type, and the risk
assessment and the consequences of an attack. Categorizing the blast scenario into light
blast or heavy blast is a multifaceted challenging task. This categorization depends on the
charge weight, the standoff distance, and the properties of the structural element
subjected to the blast load. Consequently, the same blast scenario can be categorized
differently depending on the geometry, strength, and material of the loaded element. If an
8 ft diameter column is subjected to a charge weight of 1000 lbs at a standoff distance of
15 ft, this scenario can be categorized as a light blast event. On the contrary, if a 3 ft
diameter column is subjected to the same scenario, it might be treated as a heavy blast
event.
Despite the small weight of hand emplaced explosive devices, they are considered as
heavy blast events due to their devastating effect as a result of their almost zero standoff
distances. Furthermore, blast scenarios involving heavy trucks are categorized as heavy
blast events as trucks can carry up to 30,000 lbs of explosives. Further studies are
required to quantify the blast design level for different structural elements.

15
However, in order to maintain a uniform level of bridge performance against blast
hazards, a design level blast load needs to be established for each performance level. For
a standardized design procedure, this design level blast load should be independent of the
structural properties. The design level blast load should be a function of the charge
weight and the standoff distance.
The Blue Ribbon Panel for Bridge Security Assessments (FHWA, 2003) provided
estimated values for the minimum standoff distances and the desired standoff distances
for typical highway bridges in the United States. These values are presented in tables 2.1
and 2.2, respectively. Yet, these values can only be considered for preliminary analysis as
they do not seem to be based on scientific or experimental investigations. Further studies
are required to verify these values and establish uniform performance levels and structure
specific assessment. In addition, these values are dependant on the thickness of the bridge
pier, and therefore need to be standardized to be independent of the geometry of the
bridge.

16
Table 2.1. Minimum barrier standoffs from bridge piers (FHWA, 2003)
Table 2.2. Desired barrier standoffs from bridge piers (FHWA, 2003)
2.3 Characteristics of the Blast Wave
To understand the behavior of bridges during a blast event, it is important to study the
characteristics of the blast waves and pressures, and to account for the different factors
that affect the behavior of bridge components subjected to blast loads.

17
2.3.1 Types of explosives
An explosion is a phenomenon in which energy is released in a very fast and violent
manner and is accompanied by the release of gases and generation of high temperatures.
There are different types of explosions; nuclear, physical, and chemical. Explosive
volcanic eruptions are classified as natural explosions. Chemical explosives are the most
common type of artificial explosives that can occur accidentally or can be caused by
terrorist attacks. Chemical explosives are generally in the form of condensed solids or
liquids. In a chemical explosion, a rapid oxidation reaction takes place producing
pressure waves, also called blast waves (Mays and Smith, 1995).
Explosions are categorized as low explosives or high explosives. Low explosives tend to
deflagrate, while high explosives tend to detonate. Deflagration is a subsonic (having a
speed less than the speed of sound) combustion process in which the material burns
rapidly, while detonation is a supersonic (having a speed more than the speed of sound)
decomposition process in which the condensed material burns at a higher rate than that of
the low explosives producing what is known as shock waves. Shock waves are transient
waves that expand outward from the detonation source into the surrounding air. The
duration of blast waves lasts only for few milliseconds.
The process of deflagration is easier to control than detonation. Gun powder is the most
common type of low explosives. Fireworks are controlled low explosives. High
explosives usually have less energy than many common materials, however, it is their
rapid release of the energy that creates the blast pressure which causes the damaging

18
effect (Kiger and Woodson, 2006). Detonation velocities for high explosives range from
18,000 fps to 25,000 fps. Dynamite was the first high explosive used by engineers.
Trinitrotoluene (TNT) is the most common type of high explosives. TNT is commonly
used as the reference explosive, other explosives types are usually transformed to an
equivalent weight of TNT. These transformation factors are presented in Table 2.3. When
a high explosive is detonated, instantly created pressure waves travel away from the
detonation source in the form of spherical waves. For a ground-level explosion, those
pressure waves are hemispherical as shown in Fig. 2.13.
Table 2.3. TNT equivalents for different types of explosive (TM5-1300, 1990)
Explosive
Types
Equivalent mass for
pressure
Equivalent mass for
impulse
Valid for pressure
range (psi)
ANFO 0.82 0.82 1-100
C-4 1.37 1.19 10-100
HBX-1 1.17 1.16 5-20
HBX-3 1.14 0.97 5-25
H-6 1.38 1.15 5-100
Pentolite 1.42 1.00 5-100
TNT 1.00 1.00 All

19
Fig. 2.13. Hemispherical blast waves for ground-level explosion (courtesy Reuters)
2.3.2 Types of blast scenarios
The behavior of structures subjected to blast loads depends to a great extent on the size of
the blast and its proximity to the structure. For large scale blast waves like those
produced due to nuclear explosions, the blast wave is significantly huge compared to the
size of the structure, and hence the whole structure tends to deform, and the global
stiffness of the structure governs the behavior of the structure. A different scenario can
take place in cases of explosions resulting from accidents or terrorist attacks. In these
explosions, the blast wave is relatively small, and the local behavior of structure
components dominates the behavior of the structure. Consequently, it is important to
study the individual behavior of the structural components subjected to the blast wave.
These components are loaded sequentially as the blast wave travels from the detonation
source towards the structure.

20
2.3.3 Positive and negative phases
When a high explosive is detonated in open free air (free field), the induced pressure is
divided into two main phases; the positive phase and the negative phase. The positive
phase starting point is the time taken by the blast wave to travel from the detonation
source to the element, which is known as the time of arrival (TOA). At this point, the
pressure rises up instantaneously to the peak incident pressure (Pso), and then it starts to
decay as the compressed air at the shock front cools down and the pressure falls slightly
below the atmospheric pressure. This creates the negative phase (Mays and Smith, 1995).
Finally, the pressure stabilizes to match the ambient pressure at the end of the negative
phase.
During the positive phase, the elements exposed to the blast wave are subjected to
compressive pressure, while during the negative phase they are subjected to suction. The
amplitude of the negative phase is much lower than that of the positive phase, and usually
the negative phase is neglected in design. Only for light structures, does the negative
phase have a significant effect. A typical pressure-time history curve in free field is
shown in Fig. 2.14. The positive phase is usually idealized to an equivalent triangular
blast load having the same peak pressure and an idealized duration (td).

21
Fig. 2.14. Pressure-time history for free field blast (TM5-1300, 1990)
2.3.4 Incident and reflected pressures
When the incident pressure (Pso) waves created by the detonation encounter a solid
surface, the pressure undergoes reflection. This reflection is mainly attributed to the
compression of air molecules of the pressure wave when they decelerate suddenly and are
brought to rest. At this incident, the structure is loaded by the reflected pressure (Mays
and Smith, 1995). This reflected pressure (Pr) is of significant higher amplitude than the
incident pressure. The value of the reflected pressure depends on the angle of incidence
(α) between the detonation source and the point under consideration. It also depends on
the value of the incident pressure. The incidence angle can be calculated using the
diagram presented in Fig. 2.15. The value of the reflected pressure decreases with the
increase in the value of the incidence angle, i.e. the reflected pressure reaches its
Positive phase duration
Negative phase duration
Ambient Pressure
Peak Pressure
P
Pressure, P (t)
Time, t Time of arrival
Positive phase
Negative phase
td
Idealized impulse

22
maximum value at a zero incidence angle. The effect of the angle of incidence on the
magnitude of the reflected pressure is presented in Fig. 2.16. The coefficient of reflection
(Cr) is defined as the ratio of the reflected pressure to the incident pressure. For distant
explosions, the value of Cr is in the order of 2, while for close blast scenarios, Cr can be
as high as 13.
Fig. 2.15. Angle of incidence (TM5-1300, 1990)
Where:
R = perpendicular distance from the center of the explosive device to the loaded element
X = distance between the projection of the charge and the point of concern
α = angle of incidence at the point of concern
α
R
X
Explosive device
Structural Element

23
Fig. 2.16. Effect of angle of incidence on the coefficient of reflection (TM5-1300, 1990)
2.3.5 Cubic root scaling and blast wave parameters
Blast wave parameters include: the incident pressure (Pso), reflected pressure (Pr),
incident impulse (io), reflected impulse (ir), time of arrival (TOA), positive phase
duration, negative phase duration, idealized duration (td), and blast wave speed. The
impulse is defined as the area under the pressure-time curve. The main two factors in
determining the blast wave parameters are the distance from the blast source (range, R)
and the charge weight (W). It was verified that the cubic root scaling model proposed by
Hopkinson (1915) is representative of the blast wave parameters for different
combinations of range and charge weight. Hopkinson stated that the same pressure, either
incident or reflected, can be produced from different charge weights as long as the ratios
of their ranges are proportional to the cubic root of their charge weights (Eq. 2.1).

24
3/1
2
1
2
1
=
W
W
R
R (2.1)
The scaled distance (Z) is defined as the dimensionless ratio of the distance from the
center of explosive (R) in feet divided by the cubic root of the charge weight (W) in lbs.
This relation is presented in Eq. 2.2. Hopkinson’s cubic-root scaling model was
confirmed by Kennedy (1946). The intensity of the blast increases with the increase in
the cubic root of the charge weight and the decrease in the standoff distance. However,
the standoff distance is the dominant parameter in determining the intensity of the
pressure. A slight increase in the standoff distance can significantly reduce the induced
pressure.
3/1W
RZ = (2.2)
To illustrate Hopkinson’s scaling numerically, assume a charge weight of 1000 lbs at
distance 100 ft from a specific target. The pressure produced by this scenario is the same
as that produced by a charge weight of 125 lbs at distance 50 ft, and is the same as that
produced by a charge weight of 1 lb at distance 10 ft. However, for each of the above
scenarios, the duration of the positive phase is different, and hence the impulse is
different. The magnitude of the impulse increases with the increase in the charge weight.
The United States Department of Defense provided charts relating the blast wave
parameters to the scaled distance (TM5-1300, 1990). The blast wave parameters for a
ground-level hemispherical wave is presented in Fig. 2.17. These parameters are
numerically represented in A.T.-BLAST software developed by the Applied Research
Associates (ARA), Inc.

25
1
10
100
1000
10000
100000
1000000
0.1 1 10
Scaled Distance, Z
Pso
, P
r, (
i so/W
1/3
),
(ir/W
1/3
)
Pso
Pr
(iso/W1/3)
(ir/W1/3)
Fig. 2.17. Blast wave parameters for hemispherical TNT explosion (TM5-1300, 1990)
Pso = peak positive incident pressure, psi. Pr = peak positive reflected pressure, psi is / W
1/3 = scaled unit positive incident impulse, psi-ms/lb1/3 ir / W
1/3 = scaled unit positive reflected impulse, psi-ms/lb1/3
26
0
2
4
6
8
10
12
14
0 10 20 30 40 50 60 70 80 90 100
scaled distance, Z
Co
eff.
of
Ref
lect
ed P
ress
ure
(C
r)
TM5-1300
Proposed Eqn
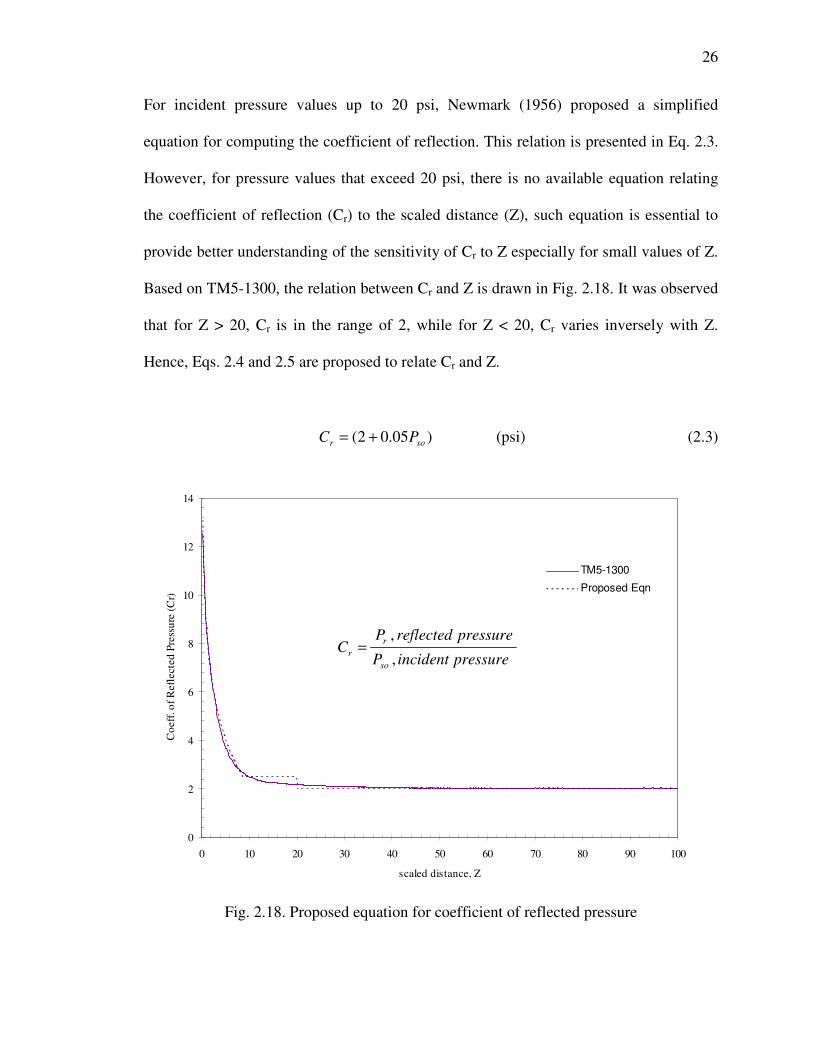
For incident pressure values up to 20 psi, Newmark (1956) proposed a simplified
equation for computing the coefficient of reflection. This relation is presented in Eq. 2.3.
However, for pressure values that exceed 20 psi, there is no available equation relating
the coefficient of reflection (Cr) to the scaled distance (Z), such equation is essential to
provide better understanding of the sensitivity of Cr to Z especially for small values of Z.
Based on TM5-1300, the relation between Cr and Z is drawn in Fig. 2.18. It was observed
that for Z > 20, Cr is in the range of 2, while for Z < 20, Cr varies inversely with Z.
Hence, Eqs. 2.4 and 2.5 are proposed to relate Cr and Z.
)05.02( sor PC += (psi) (2.3)
pressureincidentP
pressurereflectedPC
so
r
r,
,=
Fig. 2.18. Proposed equation for coefficient of reflected pressure

27
For Z > 20, Cr = 2 (2.4)
For Z < 20, Cr = (-2.82 ln Z +8.56) not less than 2.5 (2.5)
2.3.6 Confined versus unconfined blasts
In the case of internal blast scenarios, where the blast occurs inside a confined or partially
confined structure, the pressure wave encounter several re-reflections based on the
geometry of the enclosing space. These re-reflections can significantly aggravate the
situation. In addition, the confinement effect significantly increases the duration of the
pressure creating a quasi-static effect. For bridges, this scenario is very unlikely to
happen due to the open space around the bridge which allows the ventilation of the
pressure. For this reason, the duration of blast loading acting on the components of a
bridge is very short, and it is convenient to design these components for impulsive
loading. For blast loads inside box girder bridges, where multiple reflections are
expected, re-reflection of blast wave needs to be considered.
2.3.7 Vapor cloud explosions
Vapor Cloud Explosion (VCE) is an accidental type of explosions that takes place due to
the release of a flammable material such as liquefied gases under high pressure. If the
released flammable vapor is subjected to ignition, explosion takes place producing
overpressure shock waves similar to those produced by high explosives. This scenario
can take place due to the crash of gasoline tankers into bridge components. The severity
of the VCE depends on the properties of the flammable material, rate of release, quantity
of the material, temperature, and pressure (Sundararajan, 2007). The VCE can be
transformed into an equivalent TNT weight using Eq. 2.6

28
YHHWW TNTCCTNT )/(= (2.6)
Where:
WTNT = equivalent TNT weight
WC = weight of chemical
HC = heat of combustion of chemical
HTNT = heat of detonation of TNT = 1155 kcal/kg
Y = fraction of the mass of chemical that contributes to the explosion (The
Environmental Protection Agency [EPA] recommends Y of 0.1)
2.4 Factors affecting the Behavior of Bridges during Blast loading
The factors affecting the behavior of a structure during blast scenarios can be categorized
as external factors and internal factors. The external factors are those that depend on the
blast scenario. They include the explosive material, standoff distance, charge weight, and
the angle of incidence, while internal factors are those factors dependant on the properties
of the structural element subjected to the blast load such as stiffness, mass, ductility,
redundancy and continuity of the whole structure. As for the external factors, there is
limited control over the charge weight that might be used in the scenario. It depends on
the type of car or truck used. A small car can carry about 500 lbs of TNT, while a mid
size truck can carry up to 10,000 lbs of explosives. It is crucial to direct more security
measures towards vans and trucks as the amount of charge carried by them can be
devastating. The standoff distance is the most critical parameter in blast scenarios. Just by
increasing the standoff distance by a few feet, the pressure drops significantly. Therefore,
it is essential to provide minimum standoff distance for critical bridges that are potential
targets for terrorist attacks or are exposed for accidental chemical explosions. A charge

29
weight of 1000 lbs TNT can produce a reflected pressure of 85,000 psi at 2 ft standoff
distance; this pressure drops to 2,000 psi at 20 ft, which is almost 2% of the pressure
induced at 2 ft. The variation of the reflected pressure with the standoff distance is shown
in Fig. 2.19.
Fig. 2.19. Effect of standoff distance on pressure amplitude (A.T.-BLAST)
The behavior of structural elements depends to a great extent on their properties. The
most important factors are the period of vibration and ductility of the element. Massive
structures respond better than lightweight structures. Structural elements with high
ductility will provide better resistance to blast loads. Also, the continuity and redundancy
of the whole structure have great impact on the behavior of the structure. The structure
should be designed for element removal scenarios that might occur during blast.
Redundant and continuous structures exhibit localized damage rather than global
collapse.
0
10,000
20,000
30,000
40,000
50,000
60,000
70,000
80,000
90,000
100,000
0 5 10 15 20
Range, ft
Ref
lect
ed P
ress
ure
, psi
Ref
lect
ed P
ress
ure
, P
r (p
si)
Standoff distance or Range, ft

30
Blast loads are non-simultaneous and non-uniform. They vary along the length of the
loaded member due to the variation in the range and the incident angle. For distant blast
loads, the blast pressure can be approximated as uniform load. However, for small
ranges, this approximation will significantly overestimate the applied blast loads.
2.5 Comparison of Blast Hazards and Earthquakes Hazards
One of the recommendations of the FHWA report “Multiyear Plan for Bridge and Tunnel
Security Research, Development, and Deployment”, which was published in 2006, was to
investigate the transferability of seismic design approach to blast resistant structures.
Hence, it is important to understand the similarities and differences between blast loads
and seismic loads. Both earthquakes and blast hazards are low risk, unpredictable, and
devastating events. Earthquakes can not be predicted, prevented, or even controlled.
However, blast can be controlled by adopting effective security system such as inspecting
trucks and enforcing minimum standoff distances.
The major difference between earthquakes and blast loads is the loading duration.
Earthquakes usually last for several seconds to a few minutes, while the duration of blast
loading is significantly small. Blast loads last for only a few milliseconds depending on
the charge weight and standoff distance. In addition, for blast loading, damping can be
neglected due to the short loading time. The performance of a structure during an
earthquake depends mainly on its global behavior, especially its overall period of the
vibration. However, for blast loading, localized behavior of individual elements is
expected. Regarding the method of analysis, elements subjected to blast loading can be

31
idealized as an equivalent single degree of freedom (SDOF) system. However, different
mode shapes should be considered for seismic design. Finally, heavier structures are
subjected to higher base shear during earthquakes, while massive structures have better
response than lightweight structures during blast loading. This is mainly attributed to the
fact that massive structures are less rigid than light weight structure. Consequently, the
period of vibration of a massive structure is relatively high, and hence, it is subjected to a
lower dynamic load factor as illustrated in section 2.9 and in Fig. 2.20. A comparison
between seismic hazards versus blast hazards is presented in Table 2.4.
Table 2.4. Comparing seismic hazards and blast hazards
Criterion Seismic hazards Blast hazards
Low risk Yes Yes
Prediction Unpredictable Unpredictable
Severe damage Yes Yes
Can be controlled No Partially
Loading duration Several seconds Few milliseconds
Damping Considered Neglected
Structural behavior Global Localized
Mass effect Negative Positive
2.6 Dynamic Properties of Materials
During blast scenarios, materials are rapidly loaded by higher strain rates. Thus, plastic
deformations are much less than those in the case of static loading at normal strain rates.
It was found that the mechanical properties of materials during blast loading are
increased. The ratio between the material property under rapid dynamic load and the

32
same property under static loading is defined as the dynamic increase factor (DIF). The
DIF for concrete and reinforcing steel bars are presented in Table 2.5.
Table 2.5. Dynamic Increase Factor for design of reinforced Concrete (TM5-1300, 1990)
Far Design Range Close-in Design Range
Reinforcing Bars Concrete Reinforcing Bars Concrete Type of stress
fdy / fy fdu / fu f’dc / f’c fdy / fy fdu / fu f’dc / f’c Bending 1.17 1.05 1.19 1.23 1.05 1.25
Diagonal Tension 1.00 NA 1.00 1.10 1.00 1.00
Direct Shear 1.10 1.00 1.10 1.10 1.00 1.10
Bond 1.17 1.05 1.00 1.23 1.05 1.00
Compression 1.10 NA 1.12 1.13 NA 1.16
Where:
fy = static yield strength of steel fdy = dynamic yield strength of steel
fu = static ultimate strength of steel fdu = dynamic ultimate strength of steel
f’c = static ultimate strength of concrete f’
dc = dynamic ultimate strength of concrete
2.7 Strength Increase Factor
Unlike the Dynamic Increase Factor (DIF), the Strength Increase Factor (SIF) depends
mainly on the static properties of material and is independent on the rate of loading. The
mechanical properties of materials specified in codes and specifications are usually the
minimum values that are obtained from the standard tests. However, the average values
for the material properties are higher than those values provided by the specifications.
The average yield strength of steel is approximately 25% higher than the specified
minimum values (ASCE, 1997). Blast hazards are considered low probability events, and
hence, it is recommended to include this SIF in the design or analysis of the structural
members that are subjected to this extreme load. Some of the SIF recommended by TM5-

33
1300 are provided in Table 2.6. The modified dynamic yield strength of steel after
accounting for both the SIF and the DIF is presented in Eq. 2.7.
ydy fDIFSIFf ))((* = (2.7)
The SIF used for concrete 1.0. This is a conservative approach due to the brittle nature of
concrete. However, for the analysis of existing structures, the in-situ strength of concrete
can be used in lieu of the minimum compressive strength of concrete which is measured
at 28 days and does not account for the age of concrete.
Table 2.6. Strength Increase Facor (TM5-1300, 1990)
Material SIF
Structural Steel (fy <50 ksi) 1.1
Reinforcing Steel (fy <60 ksi) 1.1
Cold-Formed Steel 1.21
Concrete 1.0
2.8 Impulsive Load Design
The design of structural elements subjected to blast loads depends mainly on the duration
of blast. For confined or partially confined blast scenarios, the blast duration is long and
the design is based on the quasi-static load, while for free-field unconfined blast
scenarios, the blast duration is mush shorter than the period of the structural element
subjected to the blast load. Hence, the blast pressure will finish acting on the element
before the element responds with its full deformation and most of the deformation will
occur after the pressure is cleared. Consequently, the maximum response of the system
occurs during its free vibration phase. In this investigation, it is assumed that the designed

34
bridge is located in an unconfined field, and hence the bridge design for blast will be
based on the impulsive load.
2.9 Equivalent SDOF Analysis
A bridge component subjected to blast load can be idealized as an equivalent single
degree of freedom system (SDOF). The equivalent mass of the SDOF system is equal to
the actual mass multiplied by a load-mass coefficient (KLM). This coefficient is used to
equate the work done by the actual system and that of the equivalent SDOF system.
Values of KLM for different support conditions and loading types are tabulated in TM5-
1300 (1990). The dynamic blast load acting on the structure can be idealized as an
equivalent static load equal to the dynamic load amplitude multiplied by a dynamic load
factor (DLF). The dynamic load factor is based on the ratio of the blast load duration (td)
to the period of vibration of the structural element (T). Since this ratio is relatively small
for the unconfined blast scenarios on bridges, DLF is a reduction factor for typical
designs of bridge structures. However, for internal blasts inside buildings, the multiple
reflections of the blast waves create a quasi-static loading effect. Thus, the DLF can be
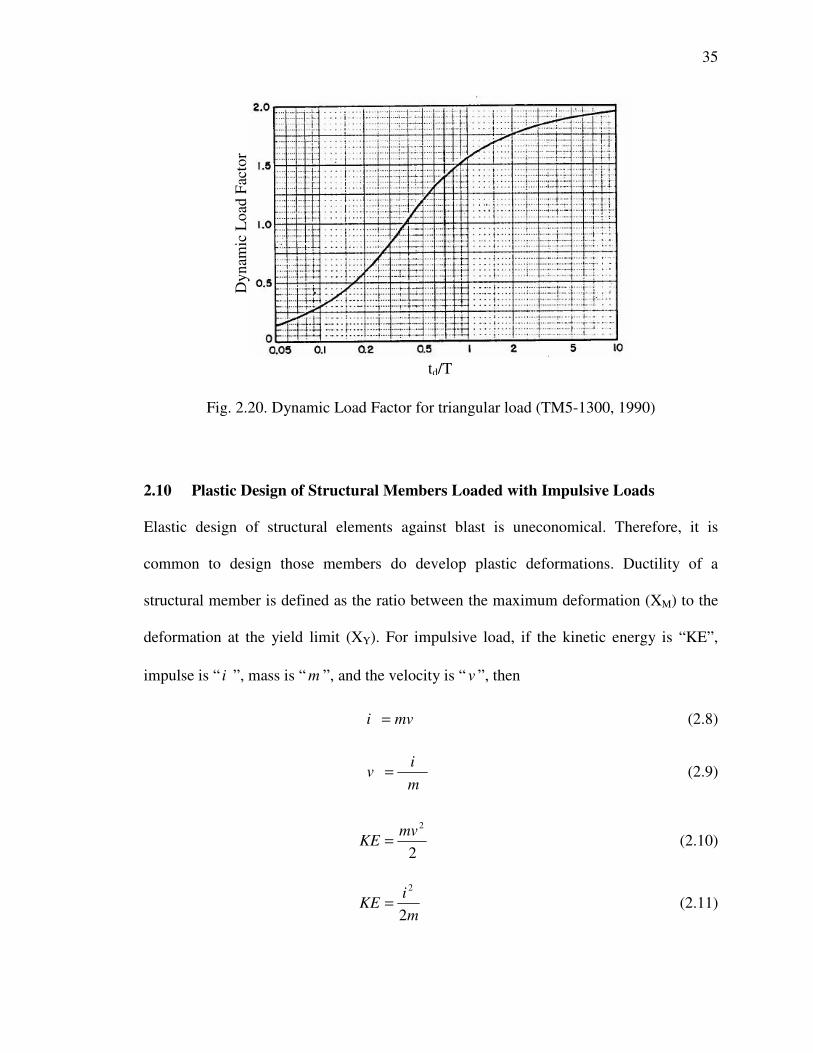
relatively higher than that used for bridges. The variation of DLF with td/T is shown in
Fig. 2.20.
35
Fig. 2.20. Dynamic Load Factor for triangular load (TM5-1300, 1990)
2.10 Plastic Design of Structural Members Loaded with Impulsive Loads
Elastic design of structural elements against blast is uneconomical. Therefore, it is
common to design those members do develop plastic deformations. Ductility of a
structural member is defined as the ratio between the maximum deformation (XM) to the
deformation at the yield limit (XY). For impulsive load, if the kinetic energy is “KE”,
impulse is “ i ”, mass is “ m ”, and the velocity is “ v ”, then
mvi = (2.8)
m
iv = (2.9)
2
2mv
KE = (2.10)
m
iKE
2
2
= (2.11)
td/T
Dy
nam
ic L
oad
Fac
tor

36
Res
ista
nce
Deformation
Ru
XY XM
k
The strain energy absorbed by the structure is shown in Fig. 2.21 and is expressed by:
)5.0( YMue XXRW −= (2.12)
Fig. 2.21. Typical resistance curve of elastic-perfectly plastic system
Y
M
X
X=µ (2.13)
)5.0( −= µYue XRW (2.14)
We = strain energy, uR = ultimate resistance of the element, MX = maximum deformation,
YX = yield deformation, and µ = ductility.
The stiffness (k) and natural circular frequency of the structure (ω ) are describes as:
Y
u
X
Rk = (2.15)
m
k=ω (2.16)
Equating the kinetic energy and the strain energy, we obtain:
)2
1(
2 2
22
−= µωm
R
m
i u (2.17)

37
)12(2
22 −= µ
ωuR
i (2.18)
12 −=
µ
ωiRu (2.19)
The previous equations are based on the analysis provided by Mays and Smith (1995) and
Kiger and Woodson (2006). To relate the structural resistance to the pressure and the
dynamic load factor (DLF), the following equations are proposed.
( )
=
TtPi dr
πω
25.0 ( )
= dr t
TP
π (2.20)
Equation (19) can be expressed as follows:
( )
−= d
ru t
T
PR
π
µ 12 (2.21)
In the above equation,
dt
T
πis an approximation to the DLF. For values of
T
td less
than 0.5, this approximation provides reasonable values close to the exact response
(Chopra, 1995). However, for more accurate results, the exact DLF should be calculated
from the dynamic analysis by using the dynamic load factor (Eq. 2.22):
( ))(
12DLF
PR r
u−
=µ
(2.22)
It is clear from equation (2.22) that the required resistance of the structural element to
resist impulsive load decreases with the increase in the ductility, and hence it is more
economical to increase the member ductility. The recommended ductility values for

38
concrete structures subjected to blast loads ranges from 10 to 15, which correspond to
rotation angles 2o (0.035 rad) and 4o (0.07 rad), respectively (TM5-1300, 1990).
2.11 Pressure-Impulse (P-I) Diagrams
Pressure-Impulse diagrams, also known as damage assessment diagrams, are often used
to evaluate the behavior of a specific SDOF structural element when subjected to blast
loads. This graphical solution was first introduced by Baker (1973). P-I diagrams can be
used to predict the damage level in a specific structural member due to the pressure and
impulse values produced by a certain blast scenario. In P-I diagrams, the behavior of the
structural member is classified into 3 main regions, Quasi-Static (Q-S) loading, Impulse
loading, and Dynamic loading, which are designated as region I, region II, and region III,
respectively as shown in Fig. 2.22.
Fig. 2.22. Typical normalized P-I diagram for a SDOF system (Mays and Smith, 1995)

39
If the ratio between the blast duration to the period of vibration of the structure is
relatively high (td/T >>1), the structure will reach its maximum deformation while the
blast load is still in action, and the behavior of the structural element will be dominated
by the pressure created by the blast and the effect of the impulse is insignificant (Mays
and Smith, 1995). This phase is similar to the behavior of structures under constant load
and is defined as the quasi-static loading phase. The dynamic displacement of the quasi-
static phase is a function of the peak blast load and the stiffness of the structure and its
maximum value is equal to twice the value of the static displacement.
On the other hand, if the ratio between the blast duration to the period of vibration of the
structure is relatively small (td/T <<1), the structure will reach its maximum deformation
in the free vibration phase after the blast load has cleared. Hence, the behavior of the
structural element will be dominated by the Impulse created by the blast and the effect of
the pressure is insignificant. Using the principle of conservation of energy, the maximum
dynamic displacement can be approximated as Ttd /)(π . The quasi-static load and the
impulsive load are illustrated in Figs 2.23 and 2.24, respectively.
The transition region between region I and region II is known as the dynamic loading
(region III). In this case, the ratio between the blast duration to the period of vibration of
the structure is close to one (td ~ T). The analysis of the structural response under
dynamic loading is cumbersome as it requires solving the dynamic equation of motion of
the structure. The boundaries of these three regions are expressed in Eqs. 2.23 through
2.25 (Mays and Smith, 1995).

40
force
resi
stan
ce
t max. response
td
time
blast load
force
time
blast lo
ad
td
max. response
resist
ance
t
π
20>
T
td Quasi-static Loading (Region I) (2.23)
π5
1<
T
td Impulsive Loading (Region II) (2.24)
ππ
20
5
1<>
T
td Dynamic Loading (Region III) (2.25)
Fig. 2.23. Quasi-static loading
Fig. 2.24. Impulsive loading

41
The P-I diagram shown in Fig. 2.22 is expressed in terms of the normalized (non
dimensional) pressure and impulse values. For quasi-static loading, the ratio between the
maximum dynamic displacement (Xmax) and the static displacement (Xst) can be
expressed as:
2/maxmax ==KF
X
X
X
st
(2.26)
Hence, the normalized pressure can be expressed as:
12
max
=XK
F (2.27)
Where, (F) is the peak blast load, and (K) is the stiffness of the structure.
Similarly, for impulsive loading, the ratio between the maximum dynamic displacement
(Xmax) and the static displacement (Xst) can be expressed as:
2/max dd t
T
t
KF
X ωπ== (2.28)
The natural frequency of vibration (ω) can be expressed as:
M
K=ω (2.29)
The Impulse (I) can be expressed as:
2dtF
I = (2.30)
Hence, the normalized Impulse can be expressed as:
1max
=KMX
I (2.31)

42
P-I diagrams are generated for specific structural elements, material properties, and
failure mechanism. The element type can be beams, one way slabs, two way slabs,
columns, or walls. Material type can be reinforced concrete, steel, masonry, or others. For
each P-I diagram, a specific failure mechanism is assumed such as flexural failure,
diagonal tension, or shear. For a specific blast scenario, if the combination of pressure
and impulse falls below or to the left of the curve, the structure will exhibit no damage,
whereas, if it falls above or to the right of the curve, the structure will be damaged (Fig.
2.22). P-I diagrams can also be expressed in terms of the pressure and impulse values in
specific dimensions as shown in Fig. 2.25
Fig. 2.25. P-I diagram expressed in specific units (ASCE, 1997)
Facility and Component Explosive Damage Assessment Program (FACEDAP) is a
computer program developed by Oswald and Skerhut (1993) to perform P-I damage
assessment for individual structural components as well as entire conventional buildings
subjected to external blast attacks. Four damage levels 0%, 30%, 60%, and 100% are

43
incorporated in the diagrams. These damage levels correspond to high levels of
protection, medium level of protection, low level of protection, and collapse,
respectively. These damage levels were recommended by the U.S. Corps of Engineers
and they correspond to specific ductility limit and support rotation induced in the
structure. Some of these values are presented in Table 2.7. The percentage of damage in
the entire structure can be determined based on weighted calculation of the damage level
induced in each member.
Table 2.7. Performance criteria for typical structural components (TM5-1300, 1990)
Light damage Moderate damage Severe damage Component Type µ∗ θ∗∗ µ θ µ θ
RC Beam 1 1 5 2 20 4
Steel Beam 3 2 10 6 20 12
One-Way Masonry Wall 0.25 0.5 0.5 0.75 1.0 1
∗ µ = ductility limit ∗∗ θ = support rotation in degrees
FACEDAP P-I diagrams are generated for a range of scaled standoff distance (Z) ranging
between 3 and 100, and thus they can not be used for blast hazards at close proximity.
Furthermore, they are developed for a specific failure mechanism and do not take into
account the combination of various failure mechanisms. Since these P-I diagrams are
generated based on various assumptions and approximations, they have limited accuracy
and reliability and should not be used when high accuracy is required (Oswald and
Skerhut, 1993). For more accurate results, theoretical P-I diagrams can validated based
on experimental data obtained from blast testing of structural members.

44
In brief, P-I diagrams can be used as a preliminary tool to determine the damage level in
structural components. However, they should not be used if high accuracy level is
required. Some of the shortcomings of P-I diagrams include the uncertainties in the
assumed level of damage, and the effect of combined failure mechanisms. Furthermore,
P-I diagrams are generated in terms of the pressure and the impulse values generated by
the blast and they can not be used to determine the minimum standoff distance that
should be provided to the structural components in order to resist a specific charge
weight. It will be more convenient to develop blast response spectra in terms of the
charge weights and the standoff distance rather than the pressure and impulse values.
2.12 Synopsis
• The pressure induced due to the detonation of an explosive device is divided into two
main phases; positive phase and negative phase. During the positive phase, the
structure is subjected to compressive pressure, whereas it is subjected to suction
during the negative phase. The amplitude of the negative phase is insignificant when
compared to that of the positive phase, and hence, only the positive phase is
considered in the design.
• The free field pressure waves produced by a detonation are defined as the incident
pressure waves. When these incident pressure waves encounter a solid surface, they
undergo reflection and the structure is loaded by the reflected pressure. The
amplitude of the reflected pressure is significantly higher than that of the incident
pressure waves, and therefore it is important to account for the effect of the reflected
pressure waves on the design of structural members subjected to blast hazards.

45
• The factors affecting the behavior of a structure during blast scenarios can be
categorized as external factors and internal factors. External factors depend on the
blast scenario. This includes the explosive material, standoff distance, charge weight,
and the angle of incidence, while internal factors are dependant on the properties of
the structural element subjected to the blast load such as its stiffness, mass, ductility,
redundancy and continuity of the whole structure.
• The blast wave parameters such as the amplitude of the incident and reflected
pressure, impulse, and blast duration depend mainly on the weight of the explosive
charge and the standoff distance between the explosive device and the structural
element. The intensity of the pressure is directly proportional to the cubic root of the
charge weight, whereas it is inversely proportional to the standoff distance.
However, the standoff distance is the dominant parameter in determining the
intensity of the pressure. The same pressure can be produced from different blast
scenarios as long as the ratio between their standoff distances is proportional to the
cubic root of their charge weights.
• The effect of blast waves on bridges is classified as a free-field unconfined blast
scenario. The open space around the bridge allows for the ventilation of the pressure
waves and hence, the duration of the blast load acting on the bridge components is
relatively short when compared with the period of the structure. Consequently, the
maximum structural response occurs during the free vibration phase and the bridge
components can be designed for impulsive loading.
• Blast loads are non-simultaneous and non-uniform. They vary along the length of the
loaded member due to the variation in the range and the standoff distance. For distant

46
blast loads, the blast pressure can be approximated as uniform load. However, for
small ranges, this approximation significantly overestimates the applied blast loads.
The blast pressure distribution along the length of the loaded member can be
approximated as a triangular pressure with its maximum value occurring at the point
of the shortest perpendicular distance from the detonation source. This peak pressure
decreases linearly by a slope of 1:2, and thus the pressure drops to zero with a
horizontal distance that is equal to twice the value of the standoff distance.
• Pressure-Impulse (P-I) diagrams can be used as a primary tool to determine the
damage level induced in a specific structural member due to the pressure and
impulse values produced by the blast scenario. P-I diagrams lack accuracy due to the
uncertainties in the assumed failure mechanism and level of damage. It will be more
convenient to develop blast response spectra in terms of the charge weights and the
standoff distance rather than the pressure and impulse values.

47
CHAPTER 3
RESPONSE SPECTRA FOR BLAST LOADS
The behavior of bridges subjected to blast loads depends mainly on the standoff distance
and the charge weight used in the blast scenario. It is hard to predict the charge weight
that might be used in an attack. The charge weight can vary from few pounds to
thousands of pounds depending on the size of used vehicles. It is important to prevent
blast scenarios involving large trucks. More security measures should be directed to these
types of trucks. A typical small car can carry about 500 lbs. This can increase to 1000 lbs
for vans. Hence, this analysis will be based on the previous two values of charge
weights. There are also uncertainties associated with the explosive material used in the
attack. The explosive materials used by terrorists are usually not sophisticated and are not
expected to have TNT equivalence more than one. Therefore, TNT will be used as the
default explosive material.

48
3.1 Variation of Blast Pressure along the Length of Loaded Members
The distribution of blast pressure along the length of the loaded member has significant
effect on the behavior of that member. For large values of standoff distance, the pressure
can be assumed to be uniform along the length of the member, while for small values of
standoff distance, this approximation can significantly overestimate the pressure. When a
structural member is subjected to a blast, the peak pressure occurs at the point having the
shortest perpendicular distance from the blast source. This point has the minimum range.
Furthermore, the value of the angle of incidence at this point is zero, and hence, the
reflected pressure is maximized. However, the peak pressure decreases as we move away
from this point of maximum pressure. This decrease in the pressure is due to the increase
in the range (R) as well as the increase in the angle of incidence as shown (α) in Fig. 3.1.
For very small values of standoff distances, this decrease is very steep. If the length of the
member is relatively bigger than the standoff distance, the angle of incidence at the tips
of the member becomes significantly large, and the pressure approaches the incident
pressure.
Fig. 3.1. Variation of range and angle of incidence along the length of the loaded member
Detonation
source
RCenter REdge
α

49
It is important to develop a simplified procedure to represent the pressure distribution for
different blast scenarios. The variation of blast pressure along the length of the loaded
member was plotted for different values of standoff distance as shown in Fig. 3.2. This
figure was developed using the AT-Blast software which is a numerical representation of
the blast wave parameter charts of the United States Department of Defense (TM5-1300,
1990).
To compare, the distribution of pressure for different standoff distances, the pressure is
presented in percentile values. The peak pressure in each case is considered to be the 100
percentile. It was observed that for a 50 ft standoff distance, the pressure drops to 83% of
the peak value along a distance of 15 ft. The drop in pressure increases with the decrease
in the standoff distance. For a 5 ft standoff distance, the pressure drops to less than 50%
of the peak pressure along a distance of 5 ft, while for a standoff distance equal to 2 ft,
the pressure drops to 50% with only a 2 ft distance along the length of the member. Based
on the presented curve, the pressure distribution can be approximated by a triangular
pressure that decreases linearly by a slope of 1:2 (see Appendix A, Fig A2). In other
words, the pressure drops to zero with a horizontal distance equal to twice the value of
the standoff distance. This approximation is valid for different values of standoff
distance. It was clarified that the distribution of the pressure depends mainly on the
standoff distance, while it is independent on the charge weight as demonstrated in Fig.
3.3.

50
0
10
20
30
40
50
60
70
80
90
100
-15 -12 -9 -6 -3 0 3 6 9 12 15
Distance along length of loaded member, ft
Per
cen
tag
e o
f M
axim
um
Ref
lect
ed P
ress
ure
R = 50 ft
R = 20 ft
R = 10 ft
R = 5 ft
R = 2 ft
15 15
R
bomb
Fig. 3.2. Distribution of blast pressure along the length of the loaded member for different values of standoff distances

51
0
10
20
30
40
50
60
70
80
90
100
-15 -10 -5 0 5 10 15
Distance along length of loaded member, ft
Per
cen
tage
of
Max
imu
m R
efle
cted
Pre
ssure
W = 100 lbs
W = 500 lbs
W = 1000 lbs
W = 10,000 lbs
15 15
R
bomb
Fig. 3.3. Distribution of blast pressure along the length of the loaded member for different charge weights (R = 5 ft)

52
Unless the detonation charge is located exactly at the midspan of the member, the blast
load distribution will be unsymmetrical. For most members, the blast pressure will have a
trapezoidal / triangular shape. To simplify the design, the trapezoidal blast pressure can
be converted to an equivalent uniform pressure. The value of this uniform pressure is
equal to the peak value of the triangular pressure multiplied by a correction factor “C”,
such that the area under both pressure distributions is the same (Eq. 3.1). This
approximation can yield reasonable results. However, more accurate results can be
obtained by analyzing the structural member under the effect of the trapezoidal blast load.
lengthloaded
ondistributipressuretriangulartheunderareaC = (3.1)
3.2 Elastic Blast Pressure Response Spectra
Estimating the blast loads on a member due to specific blast scenario is a cumbersome
procedure. There are different combinations of charge weights and standoff distances.
Each case has its particular values of pressure and duration. In addition, the equivalent
static pressure that acts on the member depends on the dynamic load factor (DLF), and
hence, the period of the structural element. To facilitate the design, it is essential to have
response spectra similar to those used in seismic design. For the seismic response spectra,
the global period of the structure is used to estimate the spectral acceleration which is
then multiplied by the total mass of the structure to give the base shear. However, in blast
loading, the equivalent static pressure can be computed directly based on the charge
weight, the standoff distance, and the local period of the structural element. These
response spectra can be generated in two different ways. Firstly, they can be generated

53
for constant charge weights and variable standoff distances (Figs 3.4 and 3.5). Secondly,
they can be generated for variable charge weights and constant standoff distances (Figs
3.6 through 3.8). In addition, they can be generated for specific damping values.
Nevertheless, the effect of damping can be neglected due to the short loading duration.
In this study, all the response spectra were generated based on numerical solutions of the
triangular impulse of the blast scenario. Newmark’s constant average method was used
for the numerical analysis (Chopra, 1995). The analysis is based on Eq. 2.22 which was
derived in the previous chapter. The response spectrum for a constant charge weight of
500 lbs and variable standoff distances is presented in Fig. 3.4. This spectrum is based on
zero damping constant. A similar spectrum for a charge weight of 1000 lbs is presented in
Fig. 3.5. The standoff distances used in these curves ranged from 2 ft to 50 ft. Response
spectra for constant values of standoff distances and variable charge weights are
presented in Figs. 3.6, 3.7, and 3.8 for standoff distances of 3 ft, 8 ft, and 20 ft,
respectively.
It can be observed from these curves that pressure values decrease with the increase in
the period of the structure. This is attributed to the fact that the DLF decreases with the
increase in the period. Flexible members are subjected to less pressure values compared
to stiff members. It is also observed that the pressure values dropped with the increase in
the standoff distance. The equivalent static pressure for a standoff distance of 2 ft
dropped to less than 50% with only one additional foot of standoff distance. On the other
hand, the drop in pressure is much less significant for standoff distance larger than 6 ft. In

54
all these spectra, it is assumed that the structural member has a ductility value of one
(elastic response spectra). The equivalent elastic static pressure obtained from these
curves will be modified based on the ductility of the member. The plastic static pressure
is obtained by dividing the elastic static pressure by a ductility factor (Rf). The equation
for this factor is:
12 −= µfR (3.2)

55
0
1
2
3
4
5
6
7
8
9
10
11
12
13
14
15
0 0.01 0.02 0.03 0.04 0.05 0.06 0.07 0.08 0.09 0.1
Period, seconds
Eq
uiv
alen
t E
last
ic S
tati
c P
ress
ure
, P
ST
(ksi
)R = 2 ft
R = 3 ft
R = 4 ft
R = 6 ft
R = 8 ft
R = 10 ft
R = 15 ft
R = 20 ft
R = 30 ft
R = 40 ft
R = 50 ft
µ = 1 (elastic)
Fig. 3.4. Response Spectra for W = 500 lbs (zero damping) 5
5

56
0
1
2
3
4
5
6
7
8
9
10
11
12
13
14
15
0 0.01 0.02 0.03 0.04 0.05 0.06 0.07 0.08 0.09 0.1
Period, seconds
Eq
uiv
alen
t E
last
ic S
tati
c P
ress
ure
, P
ST (k
si)
R = 2 ft
R = 3 ft
R = 4 ft
R = 6 ft
R = 8 ft
R = 10 ft
R = 15 ft
R = 20 ft
R = 30 ft
R = 40 ft
R = 50 ft
µ = 1 (elastic)
Fig. 3.5. Response Spectra for W = 1000 lbs (zero damping) 5
6

57
0
1
2
3
4
5
6
7
8
9
10
11
12
13
14
15
0 0.01 0.02 0.03 0.04 0.05 0.06 0.07 0.08 0.09 0.1
Period, seconds
Eq
uiv
alen
t E
last
ic S
tati
c P
ress
ure
, k
si
W = 2,500 lbs
W = 2,000 lbs
W = 1,500 lbs
W = 1,250 lbs
W = 1,000 lbs
W = 750 lbs
W = 500 lbs
W = 250 lbs
W = 100 lbs
Fig. 3.6. Response Spectra for R = 3 ft (zero damping) 5
7
58
0
1
2
3
4
5
6
7
8
9
10
11
12
13
14
15
0 0.01 0.02 0.03 0.04 0.05 0.06 0.07 0.08 0.09 0.1
Period, seconds
Eq
uiv
alen
t E
last
ic S
tati
c P
ress
ure
, k
si
W = 10,000 lbs
W = 5,000 lbs
W = 2,500 lbs
W = 2,000 lbs
W = 1,500 lbs
W = 1,250 lbs
W = 1,000 lbs
W = 750 lbs
W = 500 lbs
W = 250 lbs
W = 100 lbs
Fig. 3.7. Response Spectra for R = 8 ft (zero damping) 5
8

59
0
1
2
3
4
5
6
7
8
9
10
11
12
13
14
15
0 0.01 0.02 0.03 0.04 0.05 0.06 0.07 0.08 0.09 0.1
Period, seconds
Eq
uiv
alen
t E
last
ic S
tati
c P
ress
ure
, k
si
W = 10,000 lbs
W = 5,000 lbs
W = 2,500 lbs
W = 2,000 lbs
W = 1,500 lbs
W = 1,250 lbs
W = 1,000 lbs
W = 750 lbs
W = 500 lbs
W = 250 lbs
W = 100 lbs
Fig. 3.8. Response Spectra for R = 20 ft (zero damping)
59

60
These response spectra can be used for the design as well as the analysis of structural
members subjected to blast loads. In addition, they can be used to determine the
minimum standoff distance that should be provided to a member to resist specific blast
scenario. Using the response spectra for design is summarized as follows:
3.2.1 Designing a member for a specific charge weight and standoff distance
Step1: The period of the structural member is calculated based on its mass and stiffness.
These values are computed based on the design for other types of loads acting on
the member.
Step2: For a specific probable blast scenario, use the response spectra for the anticipated
charge weight and standoff distance.
Step3: Read the equivalent elastic static pressure from the vertical axis based on the
period, charge weight, and standoff distance.
Step 4: The equivalent elastic static pressure is multiplied by the correction factor “C”
derived in Eq. 3.1.
Step 5: Divide the result by the ductility factor (Rf) derived in Eq. 3.2, based on the
provided ductility, to get the equivalent plastic static pressure.
Step 6: Multiple this plastic static pressure by the tributary width of the member to obtain
the equivalent uniform load.
Step 7: Use this uniform load to calculate the maximum shear and bending moment
acting on the member.
Step 8: Check the adequacy of the member to resist the applied staining actions. If the
member is not adequate, revise the design and repeat steps 1 through 7.

61
3.2.2 Calculating the minimum required standoff distance for a member
Step1: The period of the structural member is calculated based on its mass and stiffness.
These values are computed based on the design for other types of loads acting on
the member.
Step2: Based on the properties of the structural element calculate the maximum uniform
plastic pressure that the member can withstand.
Step3: Multiply this plastic static pressure by the ductility factor (Rf) derived in Eq. 3.2
to obtain the maximum elastic static pressure.
Step4: For a specific charge weight, the minimum standoff distance can be computed
based on the equivalent elastic static pressure and the period of the structure.
Step 5: Based on the computed standoff distance, the equivalent elastic static pressure is
divided by the correction factor “C” derived in Eq. 3.1 to give a revised elastic
static pressure.
Step 6: Enter the response spectrum using the revised elastic static pressure to compute
the revised standoff distance.
Step 7: Repeat steps 5 and 6 until the standoff distance converges to a constant value.
The above design steps are illustrated in detailed examples that are provided in the
Appendix (A.1 and A.2).
To study the effect of damping, the response spectra were generated based on damping
values of 0%, 3%, 5%, and 10%. The results are shown in Fig. 3.9. It was observed that
the pressure dropped with the increase in the damping constant. For a specifics damping
62
value, this drop was constant for all blast scenarios. Hence, the drop in pressure due to
damping is independent on the charge weight and the standoff distance. The percentile
drop in pressure for damping values of 3%, 5%, and 10% was about 4.5%, 7.3%, 13.7%,
respectively. It is observed that the relationship is linear. For every 1% of damping, the
pressure drops 1.4% of the undamped pressure value. For most structural members, the
damping values are less than 5%, and hence, the damping does not have a significant
effect on the pressure values and can be ignored. Damping values can be increased
through utilizing higher mechanical damping devices. However, mechanical dampers are
likely to be damaged during the blast. Furthermore, due to the significantly small
duration of the blast, mechanical dampers will not have enough time to be engaged to
reduce the blast pressure acting on the structure.
3.3 Inelastic Blast Pressure Response Spectra
The blast pressure response spectra can be generated for specific ductility values. In this
case, the equivalent plastic static pressure values are obtained directly from the response
spectra without using the ductility factor (Rf). The inelastic plastic pressure response
spectra for a charge weight of 500 lbs and various ductility limits is shown in Fig. 3.10. A
similar spectrum for a charge weight of 1000 lbs is shown in Fig. 3.11. Figures 3.10 and
3.11 are generated for two values of standoff distances; 2 ft and 10 ft.

63
0
1
2
3
4
5
6
7
8
9
10
11
12
13
14
15
0 0.01 0.02 0.03 0.04 0.05 0.06 0.07 0.08 0.09 0.1
Period, seconds
Eq
uiv
alen
t E
last
ic S
tati
c P
ress
ure
, P
ST
(ksi
)
R = 2 ft, D = 0% R = 4 ft, D = 0% R = 10 ft, D = 0%
R = 2 ft, D =3% R = 4 ft, D = 3% R = 10 ft, D = 3%
R = 2 ft, D =5% R = 4 ft, D = 5% R = 10 ft, D = 5%
R = 2 ft, D =10% R = 4 ft, D = 10% R = 10 ft, D = 10%
Fig. 3.9. Effect of Damping on the equivalent static pressure (W = 1000 lbs)
63

64
Fig. 3.10. Plastic pressure values for various ductility limits (W = 500 lbs) 64
0
1
2
3
4
5
6
7
8
9
10
11
12
13
14
15
0 0.01 0.02 0.03 0.04 0.05 0.06 0.07 0.08 0.09 0.1
Period, seconds
Eq
uiv
alen
t P
last
ic S
tati
c P
ress
ure
, P
ST (k
si)
R = 2 ft, m = 1 R = 10 ft, m = 1
R = 2 ft, m = 5 R = 10 ft, m = 5
R = 2 ft, m = 10 R = 10 ft, m = 10
R = 2 ft, m =15 R = 10 ft, m = 15
µ
µ
µ
µ
µ
µ
µ
µ

65
Fig. 3.11. Plastic pressure values for various ductility limits (W = 1000 lbs)
65
0
1
2
3
4
5
6
7
8
9
10
11
12
13
14
15
0 0.01 0.02 0.03 0.04 0.05 0.06 0.07 0.08 0.09 0.1
Period, seconds
Eq
uiv
alen
t P
last
ic S
tati
c P
ress
ure
, P
ST
(ksi
)
R = 2 ft, m = 1 R = 10 ft, m = 1
R = 2 ft, m = 5 R = 10 ft, m = 5
R = 2 ft, m = 10 R = 10 ft, m = 10
R = 2 ft, m =15 R = 10 ft, m = 15
µ
µ
µ
µ
µ
µ
µ
µ

66
CHAPTER 4
ANALYTICAL INVESTIGATION
4.1 Analysis Methods
Researchers have used several analysis methods to simulate the behavior of structures
subjected to blast loads. The simplest analysis is based on idealizing an individual
structural element as a single degree of freedom model (SDOF). The impulsive blast load
is converted to an equivalent concentrated static force acting on the SDOF element. If the
material properties were considered linearly elastic, the analysis is referred to as linear
elastic static analysis. More accurate results can be obtained by taking into account the
nonlinear behavior of the materials, and hence the analysis becomes nonlinear static
analysis. The main advantage of static analysis method is that it is simple and fast. On the
other hand, it does not account for dynamic behavior of the structure. Furthermore, it
does not account for the interaction between the response of structure and the blast load.
In reality, the blast loads are spherical or hemispherical waves that apply pressure on the
loaded elements, and hence converting the blast load to a single concentrated force is not
an accurate representation of the actual blast scenario.

67
More accurate results can be obtained by using non-linear dynamic analysis methods.
Unlike elastic static analysis, non-linear dynamic analysis accounts for the plastic
behavior of structural elements by taking into consideration the nonlinear properties of
materials. Non-linear dynamic analysis method is more realistic as it accounts for the
ductility, yielding, cracking, and damping. In general, SDOF analysis can be used to
provide preliminary analysis to individual structural elements subjected to distant blasts.
However, this method lacks accuracy if applied for close range blasts. Another major
disadvantage is that SDOF analysis does not simulate nor predict the failure mechanism
of the structure when subjected to an extreme blast scenario (Williamson and Winget,
2005).
A more rigorous analysis can be performed by using the finite element method. The main
advantage of the finite element analysis (FEA) is that it takes into account the interaction
between the blast loads and the structural response. There are several commercial FEA
softwares available in the market. Most of these softwares simulate blast loading as
pressure-time histories. Third party softwares, such as A.T.-Blast, are used to convert the
blast scenario into an equivalent pressure which is then applied to the structure. The
magnitude of this pressure varies according to the charge weight and the standoff
distance. Although FEA softwares are more accurate than other SDOF analyses, they are
not representative to the actual scenario. Blast loads are non-simultaneous and non-
uniform. They vary along the length of the loaded member due to the variation in the
range and the incident angle. For distant blast scenarios, the blast pressure can be
approximated as uniform pressure load. However, for small ranges, this approximation
will significantly over estimate the blast loads. Furthermore, FEA is limited to the

68
nonlinear dynamic behavior. It does not track how the collapse of the structure is
triggered and it does not account for elements separation and collision that takes place
during the stages of collapse.
4.2 ELS Software
4.2.1 Applied element method
The main focus of this part of the study is to evaluate the local and global behavior of
bridges subjected to blast loads, and to simulate and predict their failure mechanisms
during blast scenarios. In order to obtain accurate results, it is important to represent the
blast loads realistically as much as possible. This will require a software that can
represent the behavior of the structure during the various stages starting from the
application of loads until the complete collapse. Recently, Applied Science International
(ASI) released a 3D analysis program named “Extreme Loading for Structures” (ELS).
This software is based on the applied element method (AEM) which was developed by
Kimiro Meguro and Hatem Tagel-din during the late 90’s (Tagel-Din, 1998). AEM is
characterized by its unique ability to track the structural collapse behavior during the
several stages throughout the lifetime of the structure. This includes the application of
loads, elastic stage, crack initiation and propagation, reinforcement yielding, nonlinear
behavior, large displacements, element separation, elements collision, and energy
dissipation during collision (ELS Technical Manual, 2006).
When a structure is subjected to conventional loads, the rules of continuum mechanics
apply and the behavior can be represented by the FEM. However, when the structure is

69
subjected to extreme loading cases such as earthquakes, blasts, and impacts, the behavior
of structure is controlled by the separation and collision of its elements, and hence the
rules of continuum mechanic will no longer apply. In this case, the behavior of the
separated elements can be simulated by using the discrete element method (DEM).
Although DEM is well representative of the separation and collision, it can not represent
the continuum elements. A major advantage of AEM lies in its wide range of applications
as it can represent both the continuum as well as the discrete behavior of structures.
Therefore, it can realistically simulate the behavior of the structures before and during
collapse. Hence, AEM is preferred over FEA and DEM. A comparison between the three
methods of analysis is presented in Fig. 4.1.
Fig. 4.1. Comparison between AEM, FEM, and DEM (ELS Technical Manual, 2006)
4.2.2 Connectivity between elements
FEA is usually based on modeling structural elements either as frame elements or shell
elements. Adjacent elements are connected together through their common nodes, and

70
consequently partial connectivity is not allowed, and the failure and separation of
elements can not be simulated. Conversely, in AEM, elements are modeled as 3D shapes
which are connected together by springs along their surfaces (Fig. 4.2). Therefore,
adjacent elements are not restricted to share common nodes, and therefore, this leads to
simplified meshing in comparison to FEA. In AEM, partial connectivity can be achieved
between adjacent elements if they share a portion of the surface (Fig. 4.3). During
analysis, partial connectivity may occur if some of the springs fail, while other springs
remain intact.
AEM allows for the separation between the adjacent elements if the applied forces
exceed the separation strain between these elements. After separation, these 3D elements
are free to collide with one another according to the loading scenario. ELS implements
the auto-element contact detection system to simulate the behavior of colliding elements.
This includes several types of contacts such as, corner to face, edge to edge, and corner to
edge (ELS Technical Manual, 2006).
Fig. 4.2. Connectivity springs between adjacent elements (ELS Technical Manual, 2006)
Normal Springs Shear Springs x-z Shear Springs y-z

71
Fig. 4.3. Partial connectivity in AEM (ELS Technical Manual, 2006)
4.2.3 Collapse analysis
ELS can predict whether or not the collapse of the structure will occur under certain
loading conditions. If collapse occurs, ELS can simulate how this collapse is initiated and
whether it will be partial or total collapse. These simulations can be used to identify the
structural vulnerabilities and to investigate how to enhance the behavior of the structures
in order to prevent disproportionate collapses. ELS software was used to simulate the
blast scenario that hit the Murrah Federal Building in Oklahoma City in 1995 (ASI,
2004). The simulation was very similar to the actual collapse of the building. This
indicates that ELS software can be used to predict the behavior of structures subjected to
blast loads and to track their failure throughout the various stages of collapse.
4.2.4 Blast wave model
The choice of ELS software was mainly based on its ability to create and simulate
realistic blast conditions without using any other third party software. ELS software uses
a free-field blast wave model. The magnitude of the pressure is generated based on the
charge weight and the standoff distance from the detonation source. In analysis, the

72
detonation of the blast can be set to a specific time. After detonation, pressure waves
travel from the detonation source towards the surrounding elements. When the wave front
encounters a solid surface, the pressure is assumed to act perpendicular to the loaded
surface. The pressure value is obtained based on Friedlander’s equation (Baker, 1973)
[Eq. 4.1].
sT
bt
s
so eT
tPtP
−
−= 1)( max (4.1)
Where:
soP = incident pressure value
t = time measured since wave arrival
maxP = peak static overpressure at the wave front
sT = duration of the positive phase
b = wave decay parameter
This blast wave model does not take into consideration the effect of the incident angle on
the amplification of the blast pressure, and hence, all structural elements are assumed to
be loaded by the incident pressure. This assumption underestimates the magnitude of the
actual pressure acting on the structure. In fact, when the incident pressure (Pso) waves
created by the detonation encounter a solid surface, the pressure undergoes reflection.
This reflection is mainly attributed to the compression of air molecules of the pressure
wave when they decelerate suddenly and are brought to rest. At this incident, the
structure is loaded by the reflected pressure (Mays and Smith, 1995). This reflected
pressure (Pr) is of significantly higher amplitude than the incident pressure. The value of

73
the reflected pressure depends on the angle of incidence between the detonation source
and the point under consideration. It also depends on the value of the incident pressure.
The coefficient of reflection (Cr) is defined as the ratio of the reflected pressure to the
incident pressure (Eq. 4.2). For distant explosions, the value of Cr is in the order of 2,
while for close blast scenarios, Cr can get as high as 13.
sorr PCP = (4.2)
For our study, the results of the blast analysis obtained using ELS software will be then
multiplied by the coefficient of reflection (Cr), which was developed earlier in equations
(2.4) and (2.5). This will ensure more realistic representation of the blast event. Since Cr
changes with the change in the value of the incident pressure Pso, therefore, the relation
between the reflected and the incident pressure is a non-linear relationship.
4.3 Response of Concrete Columns Subjected to Blast Loads
In this section, ELS software will be used to perform blast analysis for concrete columns
subjected to blast loads. The results will be compared with the values obtained from the
SDOF analysis using the blast loading response spectra that were developed earlier in this
investigation.
The cross sectional properties, dimensions, and reinforcements of the column were based
on that of a typical concrete bridge. The cross section was assumed to be circular with 3.5
ft diameter and the column height was assumed to be 18 ft. The column was assumed to

74
be fixed at both the top and bottom. This assumption is deemed reasonable since the
column is monolithically connected to the footing at the bottom and to the cap beam at
the top. The reinforcement consisted of 16 # 8 bars longitudinal reinforcement and # 3
stirrups @ 12 inches with 3 inches cover. The compressive strength of concrete and yield
strength of steel used in the analysis were 3 ksi and 60 ksi, respectively.
The blast scenario is assumed to be the result of an explosive device located below the
bridge deck. The blast load has a charge weight of 1000 lbs of TNT explosives. This
weight represents that of an average size van. The main parameter considered in the
analysis is the effect of the standoff distance on the behavior of the concrete columns. In
this analysis, the standoff distance varied from 5 ft up to 100 ft. The charge is assumed to
be located at 3 ft above the ground surface. This distance represents the center of gravity
of a typical car trunk.
4.3.1 ELS analysis
The analysis was recorded over a period of 0.1 second with a time step increment of
0.0001 second. It was observed that the time step increment is a crucial parameter in the
analysis of structural elements subjected to blast loads. This time step should be a very
small value to monitor the rapid changes that take place in the behavior of the structure.
If the time step is not small enough, the obtained results can be inaccurate and
misleading. As expected, the time at which the maximum response is recorded increased
in a curvilinear manner with the increase in the standoff distance (Fig. 4.4).

75
The results obtained from ELS included the maximum shear and its location, maximum
moments and its location, shear envelope, bending moment envelope, crack pattern, and
deformed shape. These results are obtained for each blast scenario and then plotted
together for comparison. The results are presented in Figs. 4.6 through 4.10. A typical
time-history response of a concrete column subjected to a distant blast load is shown in
Fig. 4.5.
Fig. 4.4. Effect of the standoff distance on the time of maximum response
0
0.01
0.02
0.03
0.04
0.05
0.06
0 20 40 60 80 100 120
Standoff distance, ft
Tim
e at
wh
ich
max
imu
m r
espo
nse
is
reco
rded
, se
c

76
From these results, several observations were made. For distant blasts, the bending
moment diagram (BMD) and the shear force diagram (SFD) were similar to that of a
fixed beam subjected to uniform distributed load (Figs. 4.7 and 4.8). The maximum
negative moment was generated at the location of the fixed supports, and the maximum
positive moment was generated at the mid span of the column. The moment and shear
envelopes indicated that the column undergoes reversible response (Figs. 4.9 and 4.10).
However, the magnitude of the reversed shear and moment is usually smaller than the
initial magnitude. For standoff distance exceeding 20 ft, the magnitude of the reversed
response was about 50% of the initial. The cracks induced in the columns subjected to the
distant blast were mainly minor flexural cracks initiated at the supports and the midspan,
which are the location of the maximum negative and positive moments, respectively. A
schematic of the deformed shape and cracking of the column is shown in Fig. 4.6. For
clarity, the deformed shapes were multiplied by a scaling factor of 10.
However, with the decrease in the standoff distance, more localized behavior was
observed. The SFD became nonlinear with its peak value at bottom support which is
closer to the detonation source (Fig. 4.7). The maximum positive moment shifted from
the midspan to the level of the detonation source (Fig. 4.8). Furthermore, the magnitude
of the reversed response started to decrease with the decrease in the standoff distance.
The effect of the standoff distance on the magnitude of the reversed response is shown in
Fig. 4.11. This decrease can be attributed to the plastic behavior of the columns due to the
higher degree of damage and the intensive cracking. It was also observed that more
cracks were induced with the decrease in the standoff distance (Fig. 4.6). These cracks
were spread all along the column height, but they were very intense at the level of the

77
detonation source. Additionally, these cracks propagated throughout the whole cross
section of the column. This can be attributed to the formation of shear cracks in addition
to the flexural cracks. For blast scenarios in close proximity, concrete breaching occurred
at the level of the detonation source. The intensive cracking and the breaching of concrete
led to the failure of the column and its final collapse.

78
-60
-40
-20
0
20
40
60
80
100
-0.01 0.01 0.03 0.05 0.07 0.09 0.11 0.13 0.15
Time, sec
Per
cen
tag
e o
f m
axim
um
sh
ear
resp
on
seR = 50 ft
Fig. 4.5. Typical time-history response of a concrete column subjected to distant blast load
78

79
bomb
R = 100 ft R = 50 ft R = 20 ft R = 10 ft R = 5 ft failure
Fig. 4.6. Schematics of cracks developed in a concrete column due to variable standoff distances 7
9

80
R = 100 ft R = 50 ft R = 20 ft R = 10 ft R = 5 ft
Fig. 4.7. Schematics of SFD developed in a concrete column due to variable standoff distances 8
0

81
R = 100 ft R = 50 ft R = 20 ft R = 10 ft R = 5 ft
Fig. 4.8. Schematics of BMD developed in a concrete column due to variable standoff distances 81
82
R = 100 ft R = 50 ft R = 20 ft R = 10 ft R = 5 ft
Fig. 4.9. Schematics of shear envelope developed in a concrete column due to variable standoff distances 82

83
R = 100 ft R = 50 ft R = 20 ft R = 10 ft R = 5 ft
Fig. 4.10. Schematics of bending moment envelope developed in a concrete column due to variable standoff distances
83

84
-60
-40
-20
0
20
40
60
80
100
0 0.005 0.01 0.015 0.02 0.025
Time, sec
Per
cen
tag
e o
f m
axim
um
sh
ear
resp
on
se
R = 5 ft
R = 10 ft
R = 20 ft
Fig. 4.11. Effect of the standoff distance on the magnitude of the reversed response
84

85
From the above results, it can be concluded that distant blasts can be approximated as a
uniformly distributed load. On the other hand, as the standoff distance decreases, this
approximation lacks accuracy as the structural element undergoes localized behavior at
the level of the detonation source. Furthermore, the nonlinearity in the shape of the shear
diagram for close proximity should be taken into consideration during the design.
In the earlier analysis, the charge weight was assumed to be a constant value. However,
in reality, the charge weight can vary from a few lbs up to thousands of lbs depending on
the size of the vehicle used in the blast scenario. To examine the effect of the variation in
the charge weight on the behavior of columns, ELS was used to run several simulations.
Two parameters were considered in the analysis; the standoff distance and the charge
weight. The used standoff distance varied from 2 ft up to 100 ft. The charge weight was
assumed to vary as 50, 100, 200, 500, and 1000 lbs (Fig. 4.12). The small values of the
charge weight such as 50 and 100 lbs represents the typical blast scenario due to a hand
charge or a small brief case. Hence, these values are usually expected to be located near
the columns at small standoff distance values. On the other side, the heavier charge
weights represent the vehicle bombings of an average size car or van, and hence, they are
more likely to occur at larger standoff distances.
To observe the relationship between the charge weight and the column response, the
maximum shear developed in the column was plot versus the charge weight for variable
standoff distances (Fig. 4.13). From this figure, it can be seen that the maximum shear
induced in the column increased with the increase in the charge weight. Yet, the effect of
the charge weight is far less significant than the effect of the standoff distance on the

86
response of the column. These results are in good agreement to the conclusion drawn
earlier from the blast loading response spectra. For standoff distance more than 10 ft, the
relationship between the charge weight and the column response can be approximated as
a linearly increasing relation. The slope of this linear relation increases with the decrease
in the standoff distance, while for standoff distances less than 10 ft, the relationship tends
to be a curvilinear relation as shown in Fig. 4.13.

87
0
1000
2000
3000
4000
5000
6000
0 10 20 30 40 50 60 70 80 90 100
Stand off distance, ft
Max
imu
m s
hea
r in
th
e co
lum
n, k
ips
50 lbs
100 lbs
200 lbs
500 lbs
1000 lbs
Fig. 4.12. Response of concrete column to various blast scenarios 8
7

88
0
5000
10000
15000
20000
25000
30000
35000
0 100 200 300 400 500 600 700 800 900 1000
Charge wieght, lbs
Max
imu
m s
hea
r in
the
colu
mn
, k
ips
R = 2 ft
R = 4 ft
R = 10 ft
R = 20 ft
R = 50 ft
R = 100 ft
Fig. 4.13. Effect of the charge weight on the maximum shear developed in the column
88

89
4.3.2 Response spectral analysis – Approximate Analysis
The response spectral analysis is an approximate method in which each column is
idealized as an equivalent single degree of freedom system (SDOF). The equivalent
period of vibration of the SDOF system is calculated using Eq. 4.3. The actual mass of
the column was multiplied by a load-mass coefficient (KLM). This coefficient is used to
equate the work done by the actual system and that of the equivalent SDOF system.
Values of KLM for different support conditions and loading types are tabulated in TM5-
1300 (1990). For a column with fixed supports subjected to distributed load KLM is equal
to 0.77, 0.78, and 0.66 for the elastic, elasto-plastic, and plastic analysis, respectively.
E
LM
K
KMT π2= (4.3)
Where:
T = period of vibration M = actual mass
LMK = load-mass coefficient EK = equivalent stiffness
An elastic design of structural elements against blast is uneconomical. Therefore, it is
more cost-effective to design those members to develop plastic deformations. The
behavior of a concrete column fixed at both its ends and subjected to uniform blast
pressure is shown in Fig. 4.14. The column behaves linearly elastic until the formation of
plastic hinges at the fixed supports. Plastic hinges at the support are formed due to the
yielding of the negative-moment steel. At this point, the column enters the elasto-plastic
phase and the stiffness value changes to matche that of a simply supported column.
Finally, when the deformation of the column reaches its plastic limit (XP), this will result
in the yielding of the positive moment steel and thus the plastic behavior until the final
collapse.

90
To simplify the analysis procedure, TM5-1300 adopts a simplified bilinear curve with an
equivalent stiffness value of KE such that the area and the actual curve and the simplified
bilinear curve are the same. It was reported that the difference between both approaches
is negligible, and hence the equivalent stiffness can be used with good accuracy (TM5-
1300, 1990). The elastic stiffness (Ke), elasto-plastic stiffness (Kep), and the equivalent
stiffness (KE) of a concrete column subjected to uniform load are presented in Eqs. 4.4,
4.5, and 4.6, respectively. The values of KE for different loading configurations and
support conditions are tabulated in TM5-1300.
3
384
L
EIKe = (4.4)
35
384
L
EIKep = (4.5)
3
307
L
EIKE = (4.6)
Fig. 4.14. Resistance curve for concrete columns with fixed supports
Ela
stic
phas
e
Elasto-plastic phase
Plastic phase
Res
ista
nce
Deflection
Formation of plastic hinges at
the supports
XE XP
Equivalent bilinear resistance function (KE)
Collapse
L

91
Blast loads are non-simultaneous and non-uniform. They vary along the length of the
loaded member due to the variation in the range and the incident angle. Earlier in this
investigation, it was proved that the blast pressure distribution can be represented by a
triangular pressure that decreases linearly with a slope of 1:2. In other words, the pressure
drops to zero with a horizontal distance equal to twice the value of the standoff distance
(Fig. 4.15). To transform the triangular blast pressure to an equivalent uniform pressure,
the load correction factor (C) which was developed in Eq. 3.1 should be applied.
The calculation of the equivalent static load on a typical column subjected to a blast
scenario is presented herein. The column is assumed to be subjected to a TNT detonation
of 1000 lbs placed at standoff distance that varies from 5 ft up to 100 ft from the column.
The specific weight of concrete is assumed to be 150 pcf. The inertia of the cracked
section is assumed to be 0.7 of the inertia of the uncracked section. Since the column has
a circular cross section, only 80% of the column diameter is considered as its tributary
width that is subjected to the perpendicular blast pressure. Damping was ignored in the
analysis. The provided calculation is based on a standoff distance of 50 ft. Similarly, the
calculation can be repeated for other values of the standoff distance.
1000 lbs at 50 ft
Elastic modulus of concrete, '57000 ccon fE =
= 300057000 = 3,122,018 lb/in2 = 450,000 k/ft2
Area of concrete, 2rA π= = )75.1( 2π = 9.62 ft2
Gross moment of inertia, 4
4
1rI g π= )75.1(
4
1 4π= = 7.37 ft4

92
Cracked moment of inertia, gcr II 7.0= = 5.16 ft4
Density of concrete, 15.0=conγ kips/ft3
Self weight of column = HAconγ = (0.15)(9.62)(18) = 26 kips
g = 32.2 ft/sec2 M = (26/32.2) = 0.807 kip-sec2/ft
LMK = 0.66 for the plastic behavior
3
307
L
EIK cr
E =318
)16.5)(000,450)(307(= = 122,231 kip/ft
For typical bridge piers, the column height is significantly longer than the column depth.
Therefore, the effect of the shear stiffness on the period of vibration of the structure is
usually minimal and can be neglected.
E
LM
K
KMT π2=
)231,122(
)66.0()807.0(2π= = 0.0131sec
From the blast pressure response spectrum (Fig. 3.5), equivalent elastic static pressure =
0.164 kip/in2
Tributary area = (0.8x3.5) (18) = 50.4 ft2 = 7,258 in2
Calculating the load correction factor (C):
lengthloaded
ondistributipressuretriangulartheunderareaC =
18
)3)(5.0)(97.01()15)(5.0)(85.01( +++= = 0.935 (Fig. 4.15)
Support shear = (0.164 kip/in2) (7,258 in2) (0.935) (0.5) = 557 kips
Fixed end moment 12
2Lω
=12
)18()9.61( 2
= = 1,671 kip-ft

93
Fig. 4.15. Pressure distribution along the length of the column
15
3
Standoff distance50 ft
100 ft
100 ft
height of column
2
1
2
1
0.97
1.0
0.85

94
4.3.3 Comparisons and discussions
The results obtained from ELS analysis were compared with those obtained from the
SDOF equivalent static analysis using the blast loading response spectra. It was observed
that for large values of the standoff distance, the two methods are in good agreement.
However, as the value of the standoff distance decreases, the difference between the two
methods starts to increase. For small values of standoff distances, the approximate SDOF
analysis using the blast pressure response spectra yields more variability. Based on the
results obtained from the current investigation, it is recommended to use more rigorous
analysis methods for standoff distance values less than 20 ft.
The maximum shear responses calculated using ELS analysis versus the SDOF static
analysis are compared in Fig. 4.16 and Table 4.1. The SDOF static analysis using an
equivalent uniformly distributed load tends to underestimate the shear value for small
values of the standoff distance. This can be attributed to the nonlinearity in the shape of
the shear diagram which was not taken into consideration when using the SDOF analysis.
For large values of the standoff distances, the shear diagram is linearly symmetrical with
the top and bottom supports carrying the same share of the shearing force. However, for
small values of the standoff distance, the shear diagram becomes nonlinear and the share
of the bottom support – which is closer to the detonation source – tends to increase at the
expense of the top support. When the standoff distance is smaller than 10 ft, the shear
force at the top support was almost insignificant when compared with that of the bottom
support (Fig. 4.6). For clarity, the summation of shear forces at both supports was
calculated, and then compared using ELS analysis and SDOF analysis (Fig. 4.17 and
95
Table 4.2). It was observed that the total shear at both supports obtained using SDOF
analysis and ELS were in good agreement for all the values of the standoff distance. This
illustrates the effect of the nonlinearity in the shape of the shear force diagram on the
behavior of structural elements subjected to close proximity of blast loads.
Therefore, for small values of the standoff distance in the SDOF analysis, it could more
realistic to represent the blast pressure by equivalent concentrated load acting at the level
of the detonation source. This will result in higher shear value at the support closer to the
detonation source. More conservative results can be obtained if the total value of shear is
assumed to act at the support which is closer to the detonation source. Furthermore, in the
SDOF analysis, it was roughly assumed that 80% of the column diameter is subjected to
the blast pressure. Further investigations are required to determine a practical value for
the portion of the cylindrical face subjected to blast loading.
Table 4.1. Comparison between the maximum shear values of ELS versus SDOF R Z Cr ELS values modified ELS values* SDOF % difference
5 0.5 10.5 2620 27510 12406 -55
10 1 8.5 1150 9775 4382 -55
20 2 6.6 580 3828 1952 -49
50 5 3.6 220 792 557 -30
100 10 2 64 128 133 4
Table 4.2. Comparison between the total shear values of ELS versus SDOF R Z Cr ELS values modified ELS values* SDOF % difference
5 0.5 10.5 2620 27510 24812 -10
10 1 8.5 1150 9775 8764 -10
20 2 6.6 810 5346 3904 -27
50 5 3.6 420 1512 1114 -26
100 10 2 128 256 266 4
* modified ELS values = (ELS values) x (Cr)
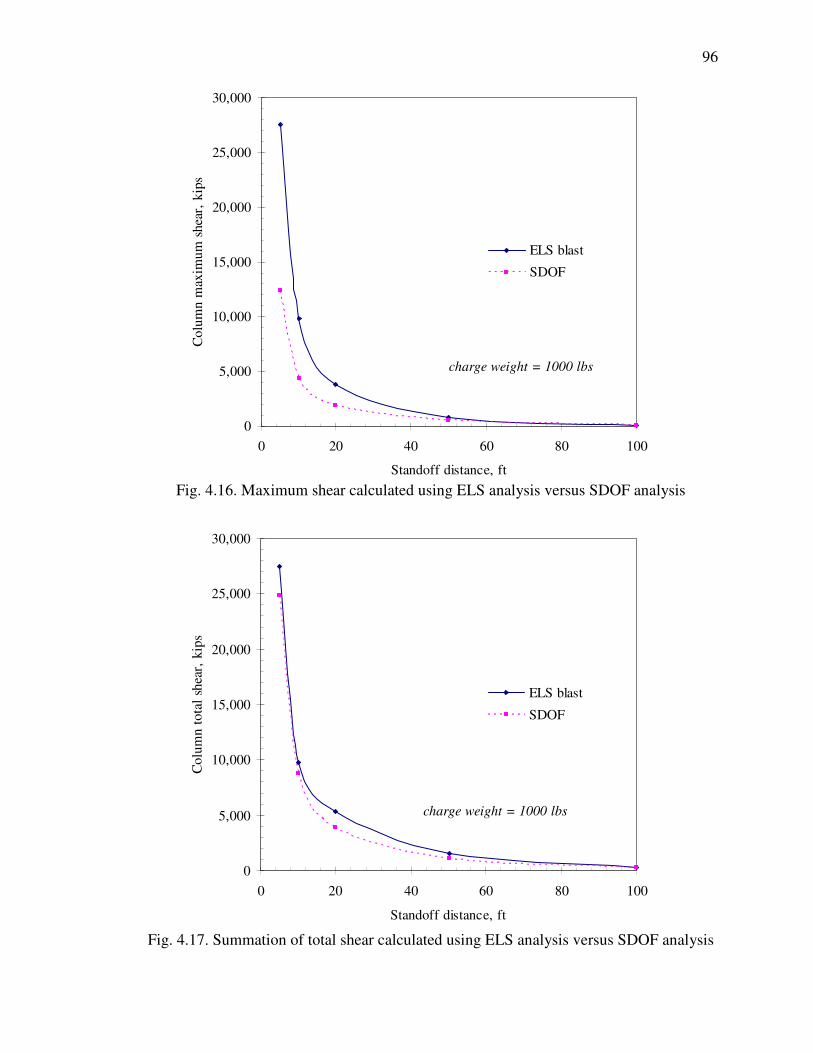
96
0
5,000
10,000
15,000
20,000
25,000
30,000
0 20 40 60 80 100
Standoff distance, ft
Co
lum
n m
axim
um
shea
r, k
ips
ELS blast
SDOF
charge weight = 1000 lbs
0
5,000
10,000
15,000
20,000
25,000
30,000
0 20 40 60 80 100
Standoff distance, ft
Co
lum
n t
ota
l sh
ear,
kip
s
ELS blast
SDOF
charge weight = 1000 lbs
Fig. 4.16. Maximum shear calculated using ELS analysis versus SDOF analysis
Fig. 4.17. Summation of total shear calculated using ELS analysis versus SDOF analysis

97
From the analytical investigation performed on the response of concrete columns
subjected to blast hazards, the following observations were made:
• For distant blasts, it was observed that the blast pressure acting on the column was
similar to that of a uniformly distributed load. Flexural cracks were developed at the
location of maximum bending moments. However, with the decrease in the standoff
distance, more localized behavior was observed. The shear force diagram became
nonlinear and the maximum moment was recorded at the level of the detonation
source. In addition to the flexural cracks, shear cracks were formed. These cracks
were induced throughout the length of the column and propagated through its entire
cross section. For close proximity blast scenarios, failure of the column took place
due to the intensive cracking and the breaching of concrete.
• The results obtained from ELS analysis were compared with those obtained from the
single degree of freedom (SDOF) static analysis using the blast loading response
spectra. It was observed that for large values of the standoff distance, the two
methods are in good agreement. However, as the value of the standoff distance
decreases, the difference between the two methods starts to increase. The SDOF
static analysis using an equivalent uniformly distributed load tends to underestimate
the shear value for small values of the standoff distance. This can be attributed to the
nonlinearity in the shape of the shear diagram which was not taken into consideration
when using the SDOF analysis.

98
CHAPTER 5
BRIDGE GLOBAL RESPONSE TO BLAST LOADS
To understand the global behavior of bridges subjected to blast loads, a typical
prestressed concrete girder superstructure bridge will be analyzed using the ELS
software. The bridge geometry, materials, dimensions, and details are based on the
FHWA design example (Wassef et al, 2003). In this example, the design of the bridge
was based on the second edition of the AASHTO-LRFD Bridge Design Specification. To
simplify the analyzed model, minor modifications were applied to the original bridge
details (Figs 5.1 and 5.2). The bridge consisted of two simple spans; each 110 ft long. For
live loads, continuity between the two spans was achieved using a common concrete deck
supported on the prestressed girders. The thickness of the deck slab was 8”. The top and
bottom reinforcement for the deck slab were assumed to be the same. This reinforcement
consisted of #5 @ 7” in the transverse direction perpendicular to the prestressed girders
and #5 @ 12” in the longitudinal direction. The concrete compressive strength and steel
yield strength used in the analysis of the deck slab were 4 ksi and 60 ksi, respectively.

99
The prestressed girders were AASHTO Type VI. The girders were spaced at 9’-8”. For
prestressing, grade 270 steel strands were used. The total prestressing force was 1600
kips with a constant eccentricity of 31”. The stirrups used for the prestressed girders were
extended upward in the deck slab to provide composite action. The prestressed girders
were supported on 3.5” thick elastomeric bearing pads (Fig. 5.3). To support the girders
laterally, 12” thick concrete diaphragms were provided between the girders at the ends
and at third-points along the length of each span. A common 36” thick intermediate
concrete diaphragm was provided between both spans.
The substructure consisted of multi-column intermediate bent having 4 circular columns
spaced at 14’-1”. The column diameter and height are 3.5’ and 18’, respectively. The
column reinforcement consisted of 16 # 8 bars longitudinal reinforcement and # 3 stirrups
@ 12 inches with 3 inches cover. The column reinforcement was extended upward in the
4’ x 4’ cap beam and downward in the concrete footing. Reinforcement for the cap beam
consisted of 14 # 9 at the top, 9 # 8 at the bottom, and 4 # 7 on each side. The footings
were 12’ x 12’ with a depth of 3’. The compressive strength of concrete and yield strength
of steel used in the analysis of the substructure were 3 ksi and 60 ksi, respectively. A
cross section of the bridge from the design example (Wassef et al, 2003), and the
reinforcement details of the bridge model which is analyzed using ELS are presented in
Figs. 5.1and 5.2, respectively.
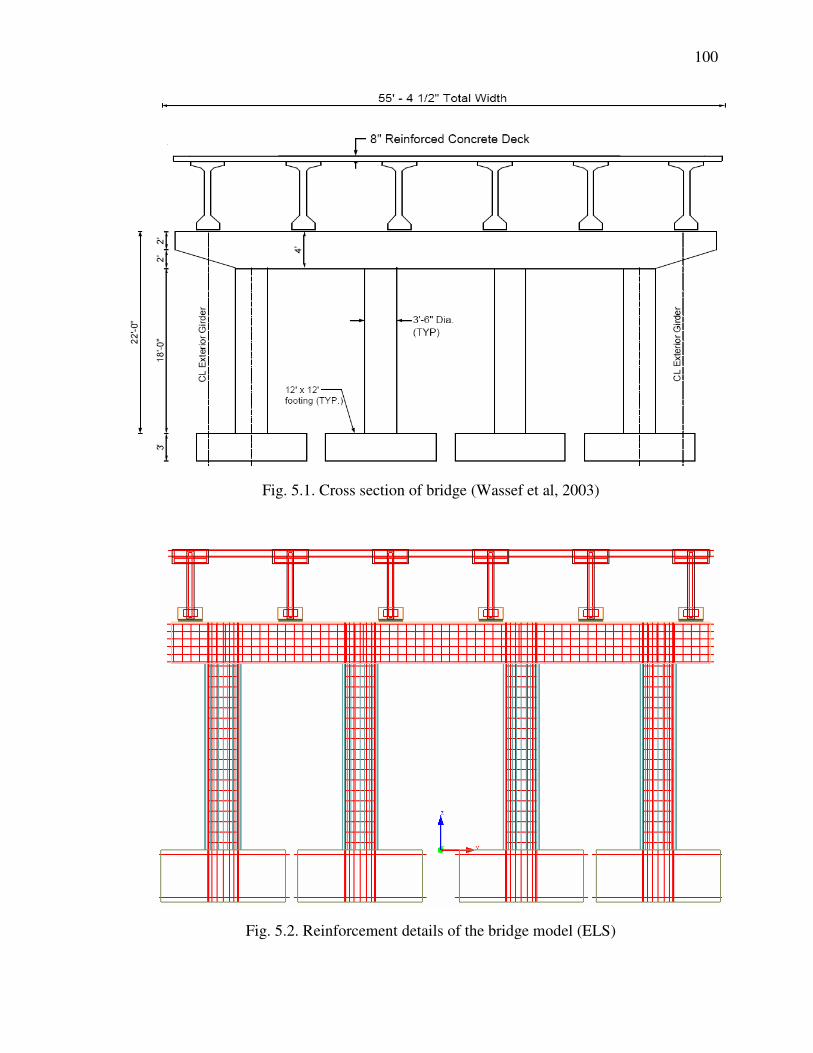
100
Fig. 5.1. Cross section of bridge (Wassef et al, 2003)
Fig. 5.2. Reinforcement details of the bridge model (ELS)

101
Fig. 5.3. Prestressed girders supported on elastomeric bearing pads The bridge model will be analyzed for several blast scenarios. These scenarios can be
classified into two main categories; above deck and below deck. For each one of these
two categories, the detonation charge is assumed to be located either closer to the middle
of one of the bridge spans or closer to the intermediate bent. In the blast analysis, the
bridge is assumed to be free from any traffic. Hence, only the self weight of the bridge is
taken into consideration. A perspective view of the bridge model prior to being subjected
to the blast scenario is presented in Fig. 5.4.
Elastomeric bearing pad
Continuous deck slab
Prestressed girders (AASHTO Type VI)
Intermediate Diaphragm
Diaphragm limits

102
Fig. 5.4. View of the bridge model prior to being subjected to blast scenarios
(End diaphragms are not shown for clarity)
102
110 ft
110 ft
103
5.1 Below Deck Blast Scenario
The below deck blast scenario can be a result of a vehicle explosion, a hand charge, or a
small brief case. For the vehicle explosion, the location of the vehicle can be at midspan
or somewhere in-between the midspan and one of the bents. If the vehicle is located
closer to midspan, the standoff distance between the columns and the detonation source is
usually large, and hence, the threat to the columns is minimal. In this scenario, the deck
slab and concrete girders will be subjected to uplift pressure from the blast. This uplift
pressure can be devastating because the slab and girders were not designed to withstand
this uplift force. Another extreme scenario can occur if the vehicle is located closer to the
bent or if hand charges are attached to one or more columns. In this case, the columns are
subjected to severe damage due to the insufficient standoff distance. In this case, the blast
waves may result in loss of one or more columns, and may lead to the potential collapse
of the bridge. The results of these extreme cases are presented herein.
5.1.1 Blast scenario close to the bridge midspan
When the bridge is subjected to a below deck detonation at midspan, the hemispherical
blast waves travel towards the bridge structure. For typical bridges, the height of the
bridge deck above the ground level is less than midspan length, and hence, the girders
and deck are the first structural elements affected by the blast. For conventional design,
the steel reinforcement of the deck slab is designed to carry the stresses produced by the
dead and live loads applied to the bridge. At the middle of the deck slab between adjacent
girders, the bottom fiber of the slab is subjected to tensile stresses, and hence, primary
steel reinforcements are located at the bottom of the slab. This arrangement is reversed
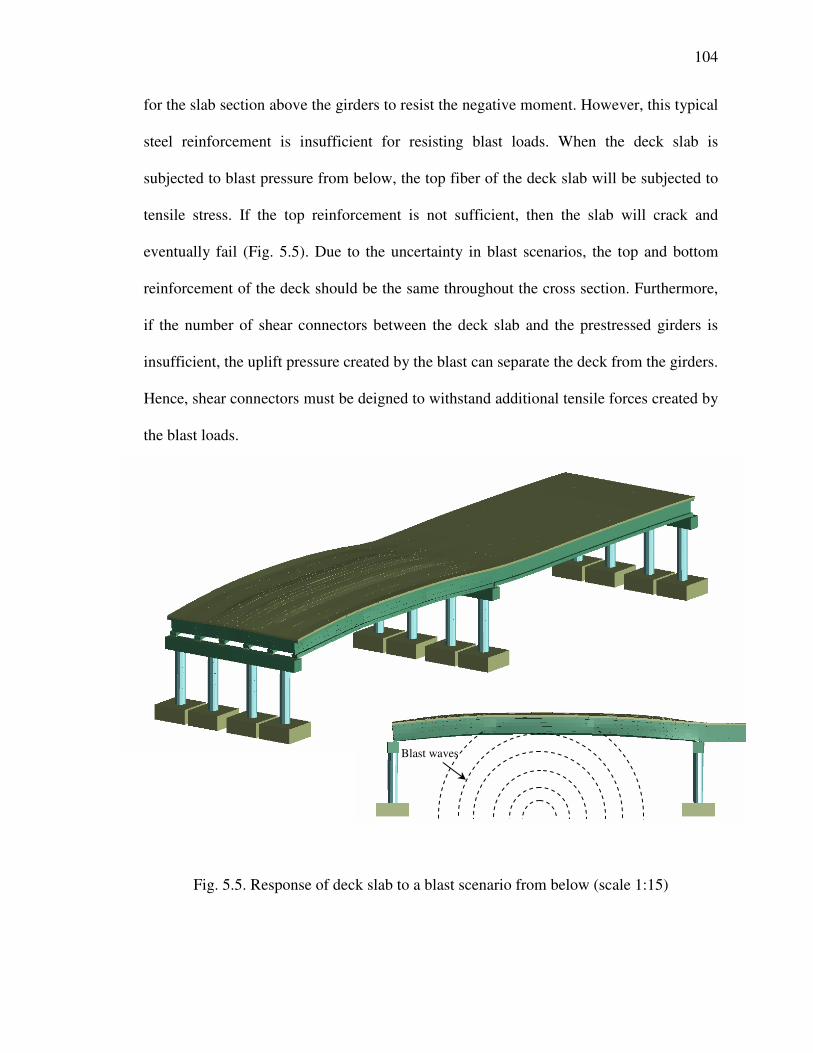
104
for the slab section above the girders to resist the negative moment. However, this typical
steel reinforcement is insufficient for resisting blast loads. When the deck slab is
subjected to blast pressure from below, the top fiber of the deck slab will be subjected to
tensile stress. If the top reinforcement is not sufficient, then the slab will crack and
eventually fail (Fig. 5.5). Due to the uncertainty in blast scenarios, the top and bottom
reinforcement of the deck should be the same throughout the cross section. Furthermore,
if the number of shear connectors between the deck slab and the prestressed girders is
insufficient, the uplift pressure created by the blast can separate the deck from the girders.
Hence, shear connectors must be deigned to withstand additional tensile forces created by
the blast loads.
Fig. 5.5. Response of deck slab to a blast scenario from below (scale 1:15)
Blast waves
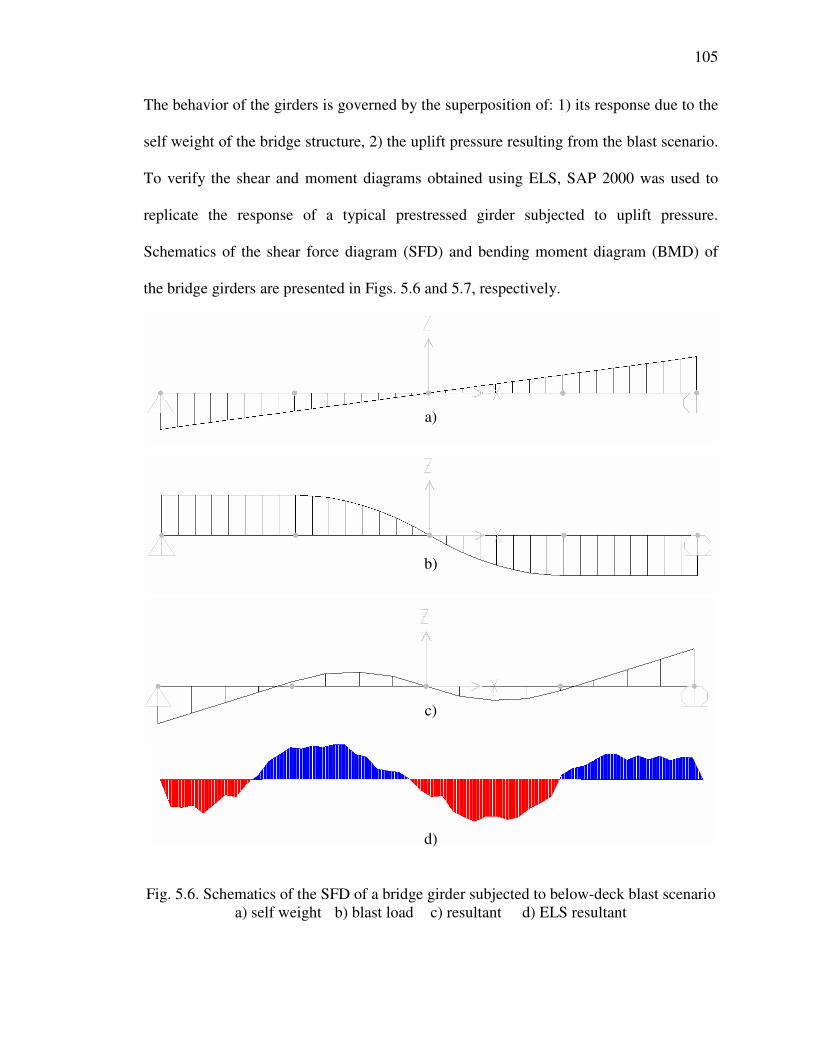
105
The behavior of the girders is governed by the superposition of: 1) its response due to the
self weight of the bridge structure, 2) the uplift pressure resulting from the blast scenario.
To verify the shear and moment diagrams obtained using ELS, SAP 2000 was used to
replicate the response of a typical prestressed girder subjected to uplift pressure.
Schematics of the shear force diagram (SFD) and bending moment diagram (BMD) of
the bridge girders are presented in Figs. 5.6 and 5.7, respectively.
a)
b)
c)
d) Fig. 5.6. Schematics of the SFD of a bridge girder subjected to below-deck blast scenario
a) self weight b) blast load c) resultant d) ELS resultant

106
a)
b)
c)
d)
e)
Fig. 5.7. Schematics of the BMD of a bridge girder subjected to below-deck blast a) self weight b) prestressing c) blast load d) resultant e) ELS resultant

107
From the simulation performed on the bridge model using ELS, it was observed that the
behavior of the bridge model due to a blast scenario located at midspan below the deck
depends on the type of bearing between the girders and the substructure. If the girders are
only resting on the elastomeric bearing (free bearing), then they are not restrained against
upward movement. In this case, if the uplift forces acting on the girders exceed the
gravity loads, then the girders will move vertically upward departing from the
substructure. If the blast scenario takes place at an exterior span of the bridge, it is more
likely to have this separation between the girders and the substructure over the abutment
rather than over the intermediate pier (Fig. 5.8). This is mainly because the gravity loads
at the abutment are of lesser value than those at the intermediate pier. Furthermore, the
deck slab provides some continuity at the intermediate pier. Hence, it is important to
implement more mitigation measures at the abutments where it is more likely to
encounter separation between the girders and the substructure.
A possible mitigation technique against this vertical movement is to restrain the girders
against uplift. A typical fixed bearing connection consists of shear studs embedded in the
bottom flange of the concrete girders and welded to a steel plate at the bottom of the
girders. This plate is connected to another sole plate which is then connected to the
abutment by anchor bolts (Fig. 5.9). This detail can be sufficient to prevent the upward
movement for small values of uplift pressure. However, if the uplift pressure created by
the blast scenario exceeds the capacity of the anchor bolts, then the girders will be
released and they can move vertically similar to the case of the free bearing. If the anchor
bolts are strong enough to withstand the tensile forces, another mode of failure can take

108
place due to the separation between the bottom flange and the web of the concrete girders
(Fig. 5.10).
After the girders are uplifted, they will rebound back on the substructure. If the provided
seat width is not enough, the girders will fall to the ground and this can result in the
collapse of one or more spans of the bridge. Furthermore, the blast waves can result in the
lateral movement of the abutment and this can aggravate the situation (Fig. 5.11). Hence,
it is important to ensure that the seat width is long enough to hold the rebounding girders.
Fig. 5.8. Separation between the girders and the abutment
Detonation source

109
Fig. 5.9. Fixed bearing connection
Fig. 5.10. Separation between the bottom flange and the web of the prestressed girders
Anchor bolt Abutment/Pier cap
Elastomeric bearing
Welded stud
Concrete girder
Sole plate with slot holes

110
Fig. 5.11. Lateral movement of abutment due to blast waves
The behavior of concrete columns subjected to blast scenarios was discussed earlier in
this study. Schematics of the SFD and BMD of a bridge column subjected to below-deck
blast scenario close to the midspan are presented in Fig. 5.12. It was observed that the
maximum shear was recorded at the bottom of the column at the intersection with the
footings, while the shear at the top of the column was smaller in magnitude. In addition,
the maximum negative moment was recorded at the bottom support, while the top support
was mainly subjected to positive moment. This behavior can be attributed to the
elastomeric bearing pads which allow for relative rotation between the cap beam and the
prestressed girders. Therefore, the upper support of the column is less rigid than its lower
support.

111
a) SFD b) BMD
Fig. 5.12. Schematics of the SFD and BMD of a bridge column subjected to below-deck blast scenario
It was also observed that the blast waves resulted in the transverse movement of the
girders (Fig. 5.13). This can apply significant torsional forces on the girders. Therefore, it
is essential to provide lateral stiffness by providing sufficient number of concrete
diaphragms. Concrete diaphragms are preferable over steel cross frames because they
exhibit more stiffness, and enhance the continuity of the bridge in the transverse
direction. As a result, all girders act together as a single unit instead of having individual
behavior for each girder
prestressed girders
cap beam
bridge column
blast wave
front

112
Fig. 5.13. Lateral displacement of bridge girders (scale 1:20)
5.1.2 Blast scenario between the midspan and the bridge pier
To examine the effect of blast scenarios located somewhere between the midspan and the
bridge pier, the bridge was subjected to a blast detonation located 10 ft away from the
intermediate pier below the deck slab. It was observed that the failure of the bridge is
initiated by the cracking at the top fiber of the deck slab followed by the flexural failure
of the prestressed girder (Fig 5.14). As a result of the blast wave pressure, the
intermediate bent was subjected to lateral bending (Fig. 5.15). The magnitude of this
bending depends to a great extent on the standoff distance between the pier and the
detonation source. The best mitigation measure is to provide minimum standoff distance
so as to prevent blast scenarios at close proximity to the pier. To mitigate the lateral
bending of the bent, the columns should be designed to exhibit significant plastic
behavior and energy absorption capacity. This can be achieved by using ductile fiber
reinforced concrete (FRC) and closely spaced stirrups.
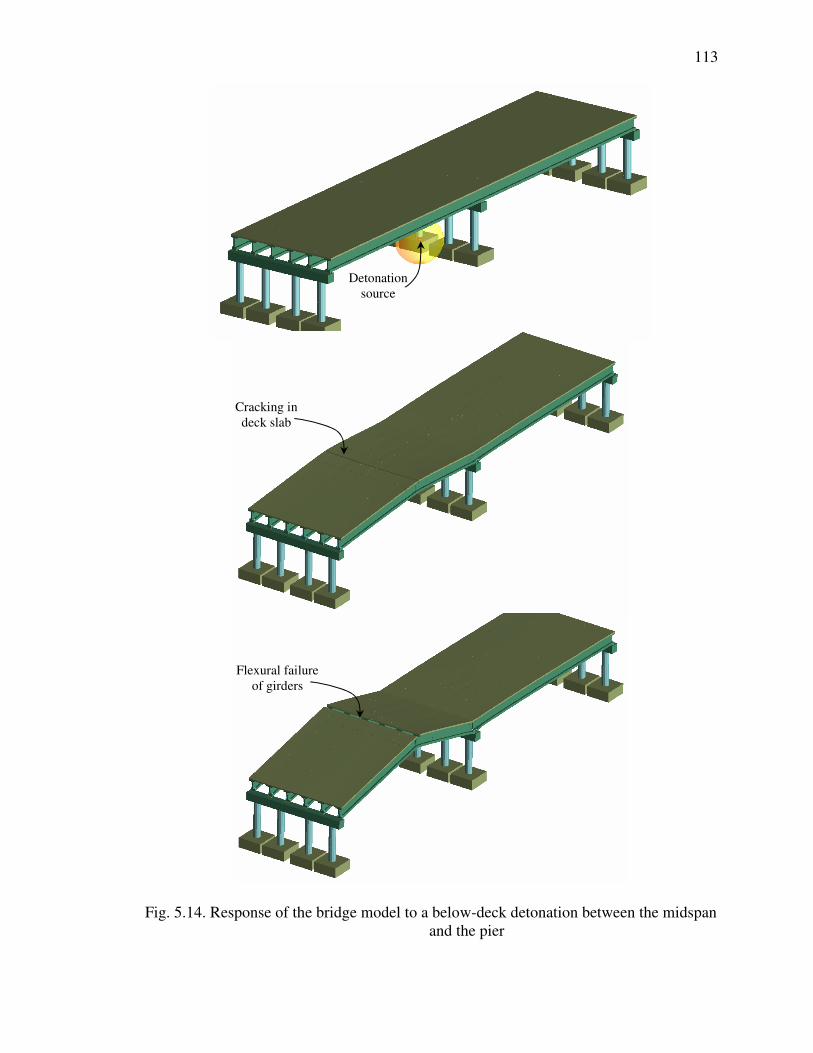
113
Fig. 5.14. Response of the bridge model to a below-deck detonation between the midspan
and the pier
Cracking in deck slab
Flexural failure of girders
Detonation source

114
Fig. 5.15. Intermediate bent subjected to lateral bending (scale 1:50)
5.1.3 Blast scenario underneath the bridge bent
To examine the effect of blast scenarios at close proximity to the pier, the bridge model
was analyzed for a detonation charge located exactly at the location of the pier at the
center of the bent columns. The nature of this blast scenario depends to a great extent on
the type of pier and the spacing between its columns. If the columns are closely spaced,
then it is more likely for the blast to be a result of a small charge weight either hand
emplaced or embedded in a brief case. However, if the spacing between the columns is
large enough to allow the passage of a vehicle loaded with explosives, then this blast
scenario can become devastating. As explained earlier, if the bearing does not restrain the
bridge girders against uplift, then the blast waves can result in lifting the bridge over the
Detonation source

115
Cracking in deck slab
Cracking in deck slab
Detonation source
Vertical displacement
pier. This behavior depends on the charge weight used in the attack. Small charge
weights are expected to trigger localized damaged, whereas heavier charges can result in
lifting the bridge. Furthermore, the blast pressure can trigger flexural cracks at the top
fiber of the deck slab as well as the bridge girders (Fig. 5.16). Hence, it is recommended
to restrain the upward movement of the superstructure. The deformed shape of the pier
cap is presented in Fig. 5.17.
Fig. 5.16. Rising of bridge superstructure if the girders are not restrained against upward
movement

116
Wave front
Fig. 5.17. Deformed shape of the intermediate bent (scale 1:25)
The behavior of the bridge superstructure at the intermediate pier is dependant on the
bearing type. For expansion bearings, relative movement between the adjacent spans of
the bridge is expected. However, for fixed bearings where the girders of adjacent spans
are connected by a common concrete diaphragm, the two adjacent spans behave
integrally.
The bridge model was analyzed for the case of integral piers where the girders are rigidly
connected to the pier cap. It was observed that the failure is initiated at the columns either
by tensile failure of columns due to uplift or by separation between the columns and the
pier cap (Fig. 5.18). For the integral piers at the far ends of the span, the failure was

117
Cracking of the cap beam
initiated by cracking of the cap beam followed by separation between the cap beam and
the columns (Fig. 5.19). This behavior is mainly attributed to the upward movement of
the superstructure as a result of the blast waves.
Fig. 5.18. Failure in concrete columns for integral piers
Fig. 5.19. Cracking at the pier cap and separation between the cap beam and columns
Separation between column and pier cap
Tensile failure of column
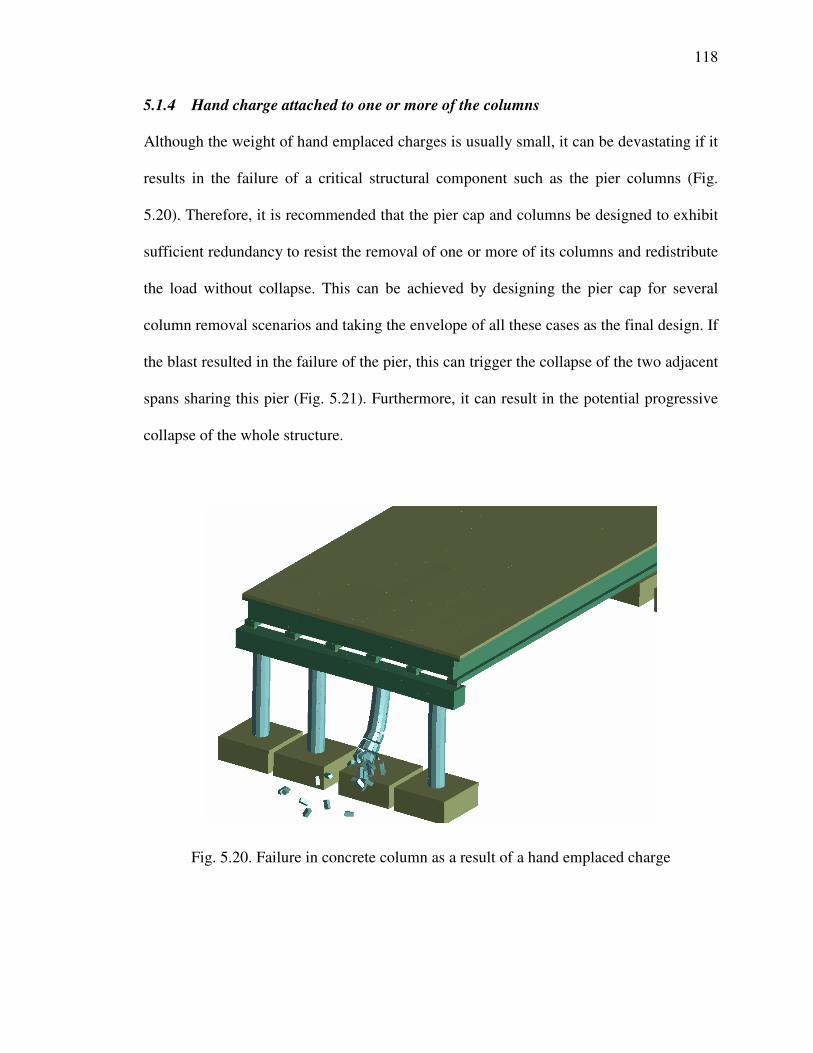
118
5.1.4 Hand charge attached to one or more of the columns
Although the weight of hand emplaced charges is usually small, it can be devastating if it
results in the failure of a critical structural component such as the pier columns (Fig.
5.20). Therefore, it is recommended that the pier cap and columns be designed to exhibit
sufficient redundancy to resist the removal of one or more of its columns and redistribute
the load without collapse. This can be achieved by designing the pier cap for several
column removal scenarios and taking the envelope of all these cases as the final design. If
the blast resulted in the failure of the pier, this can trigger the collapse of the two adjacent
spans sharing this pier (Fig. 5.21). Furthermore, it can result in the potential progressive
collapse of the whole structure.
Fig. 5.20. Failure in concrete column as a result of a hand emplaced charge

119
Fig. 5.21. Bridge collapse due to the failure in the intermediate pier
5.2 Above Deck Blast Scenario
The behavior of bridges due to blast scenarios above the deck depends mainly on the size
of the vehicle used in the attack. Small vehicles can carry about 500 lbs, whereas big
trucks can carry as much as 20,000 lbs of explosives. The standoff distance is measured
from the top of the deck slab to the centroid of the detonation charge, and hence, it
usually ranges from 3 to 5 ft depending on the height of the vehicle. For this analysis, the
standoff distance is taken as 3 ft.
Although the average standoff distance for blast scenarios above the deck is much
smaller than that below the bridge deck, it was observed that below-deck blast scenarios
can be more devastating than above-deck blast scenarios. This is mainly attributed to the
uplift pressure created by detonations located below the deck slab, while for above-deck

120
blast scenarios; the bridge is loaded in the same direction of the gravity loads. Therefore,
for the same amount of explosives, it is expected to encounter more damage if the blast
scenario takes place below the bridge deck. Two cases were considered in the analysis: 1)
the explosive vehicle is located close to the midspan 2) the explosive vehicle is located
close to bent. The results of these two extreme cases are presented herein.
5.2.1 Blast scenario close to the bridge midspan
For comparison, the weight of explosives used in this scenario was the same as that used
for the below-deck blast scenario at midspan. It was observed that blast resulted in minor
crushing at the top of the deck slab at mid span. However, the bridge remained intact. To
examine how the failure can take place, the charge weight was increased to 3 times the
original value. In this case, severe crushing was observed at the deck slab around the
midspan (Fig. 5.22). This was followed by the flexural cracking of the pier cap and the
buckling of the concrete columns (Figs 5.23 and 5.24). This is mainly attributed to
compressive forces resulting from the blast pressure. One of the hazards associated with
the blast scenarios above the bridge deck is due to the falling debris which can result in
severe injuries to individuals below the bridge (Fig. 5.25).

121
Fig. 5.22. Crushing of concrete at the top of the deck slab
Detonation source

122
Fig. 5.23. Initiation of flexural cracks in the cap beam
Fig. 5.24. Severe flexural cracking of pier cap and buckling of concrete columns

123
Fig. 5.25. Hazards of falling debris
5.2.2 Blast scenario close to the bridge bent
From the analysis of the blast scenario when the explosive vehicle is located close to the
bridge bent, it was observed that the behavior of the bridge was very similar to the case
when the vehicle is at the midspan (Fig. 5.26). The failure is initiated by the crushing of
concrete at the top of the deck slab followed by the intensive flexural cracking of the pier
cap and the buckling of the columns.
Based on the results obtained from these computer simulations, mitigation measures for
protecting bridges against blast attacks were evaluated. The use of high-performance
fiber reinforced composite columns, multiple columns; confinement, cable systems, and
other details in conjunction with protective measures are presented in the next chapter.

124
Fig. 5.26. Response of the bridge model to an above-deck detonation at the bent

125
5.3 Results and Discussion
The global behavior of a typical highway bridge subjected to blast hazards was evaluated
using ELS software. The bridge model was subjected to several blast scenarios from
above and below the bridge deck. For each scenario, the bridge model was analyzed for
variable blast locations and charge weights. Based on the analyses results, the following
observations were made:
• For the same charge weight, it was observed that below-deck blast scenarios are
more devastating than above-deck blast scenarios. This is mainly due to the uplift
forces created by the below-deck blast scenarios. When the bridge model was
subjected to a below-deck detonation at midspan, the primal threat was on the bridge
superstructure. For conventional design, the bridge superstructure is designed for
gravity load, and hence the uplift forces created by the below-deck explosion can be
devastating. If the uplift forces acting on the bridge superstructure exceeded the
effect of the gravity loads, the girders will move vertically upward departing from
the substructure. After the girders are uplifted, they will rebound back on the
substructure provided that adequate seat width is provided.
• When the bridge model was subjected to a blast detonation located close to the
intermediate pier, it was observed that the failure is initiated by the cracking at the
top fiber of the deck slab followed by the flexural failure of the girders. The
intermediate pier was subjected to a combined effect of lateral bending and uplift
forces. These uplift forces can result in the tensile failure of the column or the
separation between the column and the pier cap.

126
• The bridge model was analyzed under the effect of hand emplaced charges attached
to one of the substructure columns. Even though the weight of the hand charge is
relatively small when compared to that of a vehicle bomb, it can be devastating due
to its close proximity and can result in the failure of the structural member to which
it is attached to.
• When the bridge model was subjected to a blast scenario located above the deck, it
was observed that the failure can take place due to the crushing of the deck slab
followed by the flexural cracking of the pier cap and the buckling of the substructure
columns. This is mainly attributed to the compressive forces produced by the blast.

127
CHAPTER 6
PROTECTION TECHNIQUES TO MITIGATE BLAST
HAZARDS
This chapter deals with evaluation of protection measures that can be implemented to
reduce the vulnerability of bridges to blast hazards and other extreme events. The use of
these protection measures will increase the cost of the bridge and in certain cases this
increase is significant and can be prohibitive. The selected protection measures and the
associated additional cost should be addressed early on in the design process so that the
bridge owner and the public are aware of the impact of including extreme-event-design
on bridge geometry, functionality, clearance, aesthetics, and cost. An example of the cost
impact of some of the protection measures is provided in appendix C.
Protection measures can be classified into two main categories: 1) protection measures
related to blast scenario, and 2) protection measures related to the structural elements.
The impulsive load created by the blast scenario depends on the standoff distance and the
charge weight, and hence, by controlling these two parameters, the magnitude of the blast
load can change significantly. Additionally, the behavior of the structure subjected to

128
blast load is sensitive to its geometry, continuity, properties of the materials, and the
availability of alternate load paths to prevent its progressive collapse. Various protection
techniques and protective measures for bridges were investigated and the results are
presented herein.
6.1 Minimum Standoff Distance and Maximum Charge Weight
Through the literature review, it was clear that the standoff distance is the key factor in
determining the damage produced by a blast scenario. Therefore, the most effective
protection measure is to provide a minimum standoff distance to protect the critical
components in the bridge. Standoff distance can be provided by using barriers or
obstacles to prevent vehicles from coming too close to the protected element.
Nevertheless, in many cases it is practically difficult to utilize barriers as they will
interrupt traffic to a certain extent. In addition to the standoff distance, the blast pressure
depends on the charge weight used in the attack. Therefore, more security measures
should be directed to heavy trucks as they can carry up to 20,000 lbs of explosives. The
type and material of barrier, wall or obstacle used to enforce the minimum standoff
distance should be very ductile and capable of high energy absorption. The use of High
Performance Fiber Reinforced Composites (HPFRC) in these elements can provide the
required ductility and high energy absorption capacities needed to maintain the design
standoff after a blast event.

129
6.2 Highly Ductile Concrete Materials
It is uneconomical and unpractical to design structures to be blast-proof. The design
philosophy is mainly based on allowing the structure to be damaged but preventing the
total collapse of the structure. Therefore, the structural elements should be designed to
exhibit large plastic deformations. The required resistance of the structural element to
resist impulsive blast loads decreases with the increase in the ductility of the element.
The recommended ductility values for concrete structures ranges from 10 to 15, which
corresponds to rotation angles 2o and 4o, respectively (TM5-1300, 1990).
The ductility of concrete is enhanced with proper confinement. Yet, it is impossible to
achieve those high ductility levels using conventional reinforced concrete. Hence, it is
essential to utilize innovative materials that are capable of exhibiting higher levels of
ductility and energy dissipation such as High Performance Fiber Reinforced Concrete
(HPFRC). A comparison between the moment-curvature curve of HPFRC using SIFCON
matrix and conventional confined reinforced concrete (RC) is presented in Fig. 6.1. This
curve was generated using USC_RC program. The confined ultimate strain of concrete
for RC and HPFRC is taken as 0.02 and 0.06, respectively. From the curve, it is observed
that the ductility of HPFRC is significantly higher than that of conventional reinforced
concrete.

130
0
20,000
40,000
60,000
80,000
100,000
120,000
140,000
160,000
0 0.0005 0.001 0.0015 0.002 0.0025 0.003
Curvature
Mom
ent,
Kip
-in
Encased SIFCON Column, f'c = 15 ksi
Confined RC Column, f'c = 4 ksi2000014.0
0027.0, ===
Y
USIFCONforφ
φµ
1100014.0
0015.0, ===
Y
URCforφ
φµ
Fig. 6.1. Moment-curvature curve of HPFRC versus RC
Fiber-reinforced concrete (FRC) consists of discontinuous discrete fibers embedded in
cement based matrix. Based on the desired properties, fine aggregate or a combination of
fine and coarse aggregate may be added to the mix. FRC is characterized by its improved
tensile and flexural strength in comparison to the regular concrete. Furthermore, based on
the volume fraction of the fibers, FRC structures can exhibit high levels of ductility. The
mechanical properties of FRC depend on the properties of the matrix, type of fiber, fiber
length, volume fraction of the fibers, fiber orientation, and bond between the fibers and
the surrounding concrete (Zia P. et al, 1991).

131
Several types of fibers are being used in FRC. These fibers can be classified as metallic,
mineral, or polymeric fibers. Metallic fibers are usually made of steel or stainless steel,
while mineral fibers are usually glass fibers. The most common types of polymeric fibers
are aramid, polyester, and carbon fibers (Balaguru and Shah, 1992).
The load deflection relationship of FRC is linearly elastic until cracking. When the matrix
cracks, the tensile stresses are transferred to the fibers below the neutral axis. Depending
on the volume and strength of the fiber, the maximum load may drop or increase after the
first cracking. With sustained loading, nonlinear plastic deflection occurs due to the
separation between the fibers and the matrix. The post peak behavior indicates the high
energy absorption (toughness) of FRC. Toughness is a measure of the energy absorption
capacity of the material and hence its ductility. Ductility of a structural member is
described as its ability to sustain inelastic deformation without significant loss in its load
carrying capacity prior to failure. Therefore, toughness is of great importance for the
safety of structures, especially for structures subjected to seismic or blast loading. When
a ductile structural member is loaded close to its maximum carrying capacity, the
inelastic deformation produced will allow significant warning time to ensure the safety of
lives and allow enough time to start the rehabilitation process. Ductile structures allow
effective redistribution of loads and moments and hence they exhibit large deformations
while still sustaining the applied loads. The toughness index increases with the increase
in the fiber volume fraction, and the increase in the fiber aspect ratio (Balaguru and Shah,
1992). Slurry Infiltrated Fiber Concrete (SIFCON), Slurry Infiltrated Mat Concrete
(SIMCON), and Engineered Cementitious Composites (ECC) are the most common types
132
of highly ductile concrete materials. The properties of these different types were studied
and the results are presented herein.
6.2.1 SIFCON
Slurry infiltrated fiber concrete (SIFCON) is a cementitious composite with high volume
fraction of steel fibers. The volume fraction of fibers in ordinary FRC does not exceed
2%. For volume fractions more than 2%, it becomes very difficult to mix the composite.
To overcome this obstacle, a new technique was introduced for SIFCON. This technique
involves infiltrating a pre-placed stack of steel fibers with cementitious slurry (Lankard,
1984). The cement based slurry contains only fine aggregate as using large aggregates
may lead to improper infiltration. External vibration may be used to facilitate the
infiltration of the slurry. This process results in utilizing high volume fractions of steel
fibers. The volume fraction of steel fibers can be as high as 20% (Balaguru et al., 1992).
Load deflection curve of SIFCON is characterized by the relatively long post-peak plastic
plateau. This indicates the ability of the material to develop large plastic deformation
without significant drop in its load carrying capacity. SIFCON is characterized by its
superior ductile behavior and energy absorption capacity which makes it a practical
material for structures subjected to dynamic loads such as seismic or blast loads. The
toughness of SIFCON is much higher than that of the conventional FRC. Furthermore,
the high volume fraction of steel fibers significantly increases the load carrying capacity
of the material. The load carrying capacity of SIFCON depends to a great extent on the
volumetric ratio of the used fibers (Fig. 6.2).

133
Fig. 6.2. Effect of the fiber volume fraction on the flexural behavior of SIFCON (Josifek and Lankard, 1987)
Like other types of FRC, the flexural failure is initiated by the cracking of the matrix
followed by a plastic deformation plateau due to the pull-out of fibers. Normally, FRC
fibers are randomly distributed, while steel fibers are pre-placed in SIFCON which
ensures a more uniform distribution. This uniform distribution improves the flexural
capacity as well as the toughness of the composite. The flexural load-deflection curve for
SIFCON is close to the behavior of an elastic perfectly plastic material (Parameswaran et
al., 1994). Recently, steel bars were used to reinforce SIFCON. This application proved
to provide high strength and high ductility especially under extreme cyclic loading. A
comparison between the load deflection response of reinforced concrete and reinforced
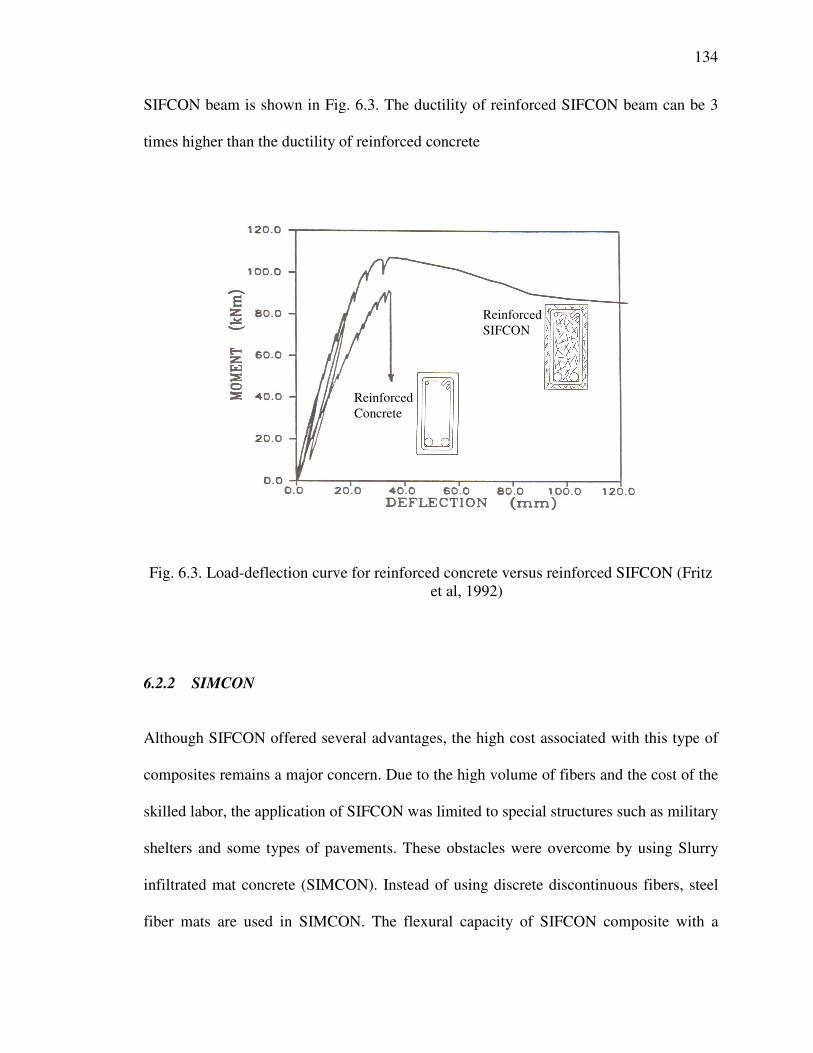
134
SIFCON beam is shown in Fig. 6.3. The ductility of reinforced SIFCON beam can be 3
times higher than the ductility of reinforced concrete
Fig. 6.3. Load-deflection curve for reinforced concrete versus reinforced SIFCON (Fritz et al, 1992)
6.2.2 SIMCON
Although SIFCON offered several advantages, the high cost associated with this type of
composites remains a major concern. Due to the high volume of fibers and the cost of the
skilled labor, the application of SIFCON was limited to special structures such as military
shelters and some types of pavements. These obstacles were overcome by using Slurry
infiltrated mat concrete (SIMCON). Instead of using discrete discontinuous fibers, steel
fiber mats are used in SIMCON. The flexural capacity of SIFCON composite with a
Reinforced Concrete
Reinforced SIFCON

135
certain volumetric ratio of fibers can be achieved by SIMCON using almost half the
amount of fibers that was used in SIFCON (Hackman et al., 1992). The main advantage
of SIMCON lies in the pre-formed fiber mat which can utilize fibers with aspect ratios
exceeding 500. This is almost 5 times the aspect ratio of the discrete fibers used in
SIFCON. Since fibers are arranged in a mat, the handling problems are minimized. These
higher values of the aspect ratio permit a better bonding between the fibers and the
surrounding matrix, and hence improve the flexural behavior.
Hackman et al. (1992) compared the flexural behavior of SIMCON versus SIFCON
specimens. It was observed that using SIMCON with fiber volumetric ratio of about 3.5%
can yield almost 75% of the flexural strength of SIFCON specimens having a fiber
volumetric ratio of 14%. When the fibrous volume in SIMCON was increased to 5.7%,
the flexural strength was about 85% of that of the SIFCON specimens. This proves that
the flexural capacity of SIFCON composites can be achieved by SIMCON using only a
small fraction of the fiber ratio. The extremely high flexural strength of SIMCON with
fewer amounts of fibers gives it an advantage over SIFCON. Furthermore, the energy
absorption capacity of SIMCON is much higher than that of SIFCON. Hackman et al.
(1992) reported that SIMCON specimens with only 25% of the volume of fibers used in
SIFCON specimens exhibited 15% higher energy absorption capacity.
6.2.3 ECC
During the last decade, Engineered Cementitious Composite (ECC) emerged as a
promising material that can possess the advantages of both steel and concrete. ECC is a
special type of ultra ductile FRC. The unique characteristics of ECC are based on the

136
microstructure tailoring of the composite to achieve enhanced mechanical properties. The
main philosophy is to utilize the fibers to bridge across the matrix cracks. Hence, the
fiber type, matrix properties, and the bond between the fibers and the matrix are the main
factors that control the behavior of ECC (Li, 2003). The tensile strain of ECC can reach
as high as 5% with fiber volume fraction less than 3%.
Conventional concrete or FRC specimens are characterized by the strain softening
following the initiation of the first crack. Conversely, ECC exhibits strain hardening due
to the development of multiple cracks (Fig. 6.4). The crack pattern of ECC is
characterized by the small crack spacing (0.5 to 5 mm) and small individual crack widths
(less than 200 micrometer). The small crack width is attributed to the bridging fibers
which prevent the opening of the cracks. To obtain this multiple cracking behavior, the
cracking strength of the matrix should be less than the maximum bridging stress of the
fibers. Furthermore, the strain hardening behavior is very sensitive to the fiber/matrix
interface. A too weak interface can result in the pull-out of fibers, while a too strong
interface can prevent the stretching of the fibers across the bridged crack (Li, 2003). To
achieve the desired ductile behavior, the fiber volumetric fraction and the bond between
the fibers and the matrix should be micromechanically engineered. Polyvinyl alcohol
(PVA) fibers are most commonly used in ECC. These polymeric fibers are tailored by
controlling their surface coating to achieve the desired bond with the matrix.
ECC is characterized by its high ductile behavior. It is commonly referred to as
“bendable concrete” (Fig. 6.5). Unlike conventional concrete, the shear behavior of ECC

137
is considerably ductile, and hence it responds very well under extreme cyclic loading.
Furthermore, its energy absorption capacity is much higher than that of any other type of
FRC. ECC can exhibit very large deformation while sustaining the applied loads. Steel
reinforcements can be used in ECC to form an elasto-plasic material (R/ECC) that can
sustain large strain values (Li, 2003).
The structural applications of ECC are numerous. ECC can be prepared using different
techniques. It can be cast, extruded, or sprayed. Furthermore, ECC can be produced as
self compacting material. Its high energy absorption capacity makes it suitable for
extreme loading cases that require high ductility. It was observed that R/ECC performs
excellently under seismic loads (Fisher and Li, 2002). Moreover, ECC can be used in the
plastic hinge regions of precast concrete members. ECC can be used in the repair and
retrofitting of existing structures. It has high fatigue endurance and good resistance for
freeze and thaw. The initial cost of ECC is relatively high. However, this cost can be
justified by observing the life cycle cost of the structure. ECC structures require
minimum repair even under extreme loading cases. When ECC is subjected to an extreme
loading case, its behavior is characterized by the development of multiple cracks of small
width. These cracks can be sealed with the use of adhesives, and hence ECC provides
potential for constructing self-healing structures (Li et al., 1998).
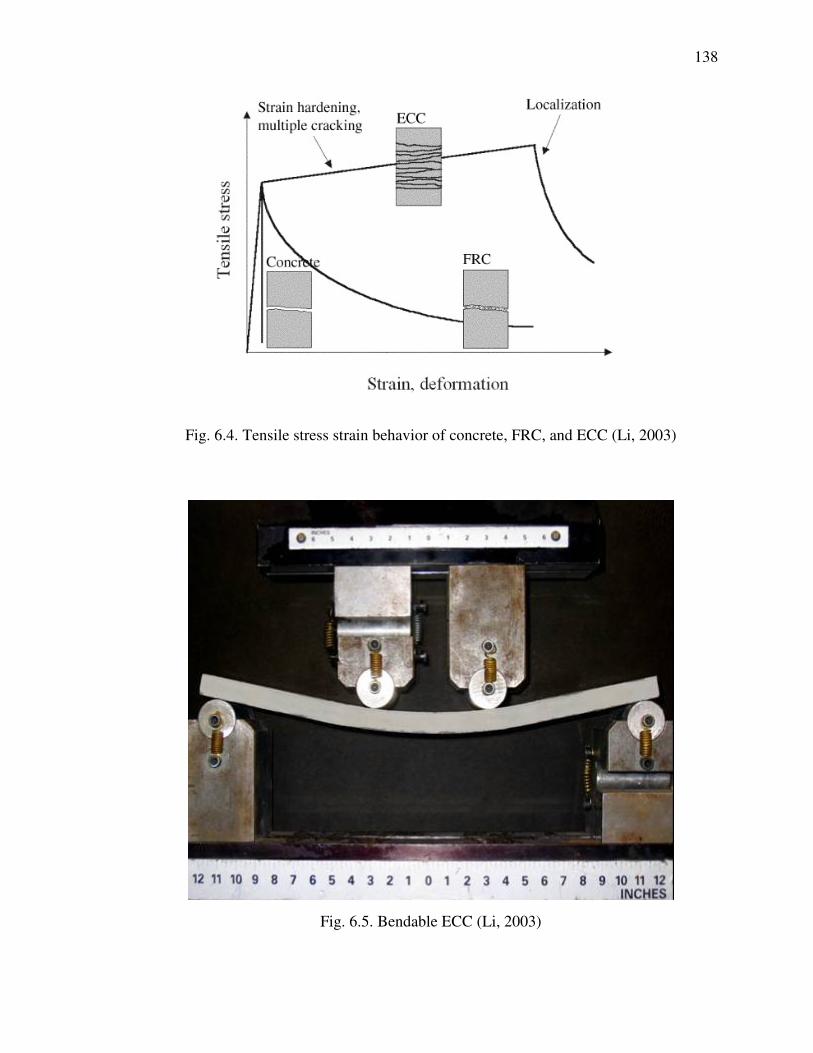
138
Fig. 6.4. Tensile stress strain behavior of concrete, FRC, and ECC (Li, 2003)
Fig. 6.5. Bendable ECC (Li, 2003)

139
Concisely, Engineered Cementitious Composite (ECC) gained potential as a highly
ductile concrete with superior energy absorption capacity. The superior ductile behavior
of ECC was demonstrated through several experimental investigations. Using
micromechanical tailoring approach, small fraction of fibers is used to achieve superior
mechanical properties. Its energy absorption capacity is much higher than that of any
other type of FRC. Its high energy absorption capacity makes it suitable for extreme
loading cases that require high ductility. Furthermore, ECC can be used for the repair and
rehabilitation of existing structures to improve their performance. However, further
research is required to investigate the properties of ECC and to develop its design
guidelines.
6.3 Redundancy and Continuity
The integrity of the overall bridge is vital to prevent the horizontal spread of the damage
to adjacent areas. Progressive collapse occurs when local failure of a primary structural
element leads to a chain reaction of structural failures, and results in the collapse of all or
disproportionately large part of the structure. Proper design and detailing can
significantly reduce the possibility of progressive collapse. This can be achieved by
providing sufficient continuity, redundancy, and energy-dissipating capacity in the
structural members to transfer the loads from the locally damaged region to adjacent
regions capable of sustaining these additional loads without collapse.
For multiple span bridges, intermediate piers should be designed to withstand the
removal of one or more of its supporting columns. Hence, if a hand charge is attached to

140
one of the column, this shall not lead to the collapse of the entire structure. Some of the
provisions for impact design of bridges can be implemented to improve its redundancy
during blast hazards. The New Jersey Turnpike Authority recommends a minimum area
of 30 ft2 for single column bents. A more effective techniques is to provide multiple
column bents to reduce the vulnerability of the bridge to progressive collapse (Figs. 6.6
and 6.7)
Fig. 6.6. Multiple column straddle bent (Route 130 East Brunswick, NJ)

141
Fig. 6.7. Close view of the multi column bent In order to provide adequate redundancy, the cap beam should be designed for column-
removal scenarios. The loss of the edge columns can be very devastating due to the
cantilever behavior of the cap beam, and hence, redundancy can be provided by using
double and triple edge columns as shown in Fig. 6.8. This will ensure that the bridge will
remain intact even if one of the edge columns is lost due to any extreme event such as
earthquake, blast, or vehicle impact. Redundancy can also be provided using wall piers
constructed using HPFRC or a combination of HPFRC walls and columns as shown in
Figs 6.9 and 6.10, respectively.

142
Fig. 6.8. Increased pier redundancy using double and triple edge columns
Fig. 6.9. HPFRC wall piers

143
Fig. 6.10. Combinations of HPFRC walls and columns
Furthermore, using steel encased HPFRC columns can increase the energy absorption
capacity and provide more redundancy. The steel casing can be tightly attached to the
external skin of the concrete section as shown in Fig. 6.11 (a) or it can be offset from the
concrete section by a hollow distance such as 6 to 12 inches as shown in Fig. 6.11 (b).
This hollow distance enhances the standoff distance of the structural member without
additional material cost.
Filler materials such as foam or sand can be used to fill the hollow space, and hence,
improve the energy dissipation capacity of the member. Anchorage of these columns to
the foundation is very critical and the connection of the pier to the footing should be
through mechanical anchorage capable of developing the full ductility of the structural

144
element. This will require minimum embedment of the steel casing into the footing with
mechanical anchorage which is likely to result in a massive foundation.

145
Steel casing
High ductile matrix
Mechanical anchorage in footing
a) tightly encased a) hollow encased
Fig. 6.11. Encased composite HPFRC columns
145
outer shell (Steel casing)
inner shell (interior column)
Empty space or filler material
Mechanical anchorage in footing

146
0
20,000
40,000
60,000
80,000
100,000
120,000
140,000
160,000
180,000
200,000
0 0.0005 0.001 0.0015 0.002 0.0025 0.003
Curvature
Mom
ent,
Kip
-in
1 in thick pipe
0.75 in thick pipe
0.5 in thick pipe
non-encased RC
Steel encased HPFRC columns can deliver ductility values of 10 to 20. As shown in Fig.
6.1, a 4 ft diameter steel encased HPFRC column has almost twice the ductility of the
conventional reinforced concrete column of the same diameter. Figures 6.12 and 6.13
show the ductility values obtained from encased HPFRC columns for various pipe
thicknesses, and confinement ratios, respectively. These figures demonstrate that the
ductility values recommended for blast design can be achieved using these types of
columns. It is observed that the ductility of the encased columns increases with the
increase in the pipe thickness as well as the increase in the ultimate strain of concrete.
Fig. 6.12. Effect of pipe thickness on the moment curvature curve

147
0
20,000
40,000
60,000
80,000
100,000
120,000
140,000
160,000
180,000
200,000
0 0.001 0.002 0.003 0.004 0.005 0.006 0.007
Curvature
Mom
ent,
Kip
-in
concrete ultimate strain = 0.08
concrete ultimate strain = 0.06
concrete ultimate strain = 0.04
Co
ncr
ete
ult
imat
e st
rain
= 0
.04
curv
ature
= 0
.0038
Concr
ete
ult
imat
e st
rain
= 0
.06
curv
ature
= 0
.005
0
Concr
ete
ult
imat
e st
rain
= 0
.08
curv
ature
= 0
.00
61
µµ µµ =
21
µµ µµ =
28
µµ µµ =
34
Fig. 6.13. Effect of concrete ultimate strain on the moment curvature curve 6.4 Collapse Prevention using Auxiliary Cable Systems
Recently, the catenary action of cable systems has been experimentally evaluated to
prevent the progressive collapse of buildings (Astaneh et al., 2001). This innovative
technique is based on providing number of cables to bridge the gap created by the
collapsed member and hence, prevent the progressive collapse of the structure as shown
in Figure 6.17. If this technique is utilized in bridges, it can localize the damage induced
in one of the bridge spans, and prevent this damage from extending to the adjacent spans.
Furthermore, the cables can support the damaged span and prevent its collapse on the
roadway/waterway below. This can save the lives of those above and below the bridge. It
can also insure that the roadway below the bridge remains serviceable for emergency

148
vehicles. The applicability of using systems of cables in bridges were studied and the
various parameters associated with the design of these cables such as their length, area,
material, deviation saddle location, and anchorage were evaluated.
If an intermediate pier is destroyed, the equilibrium condition of the deformed structure
depends on the catenary action developed in the cables system as well as the catenary
action developed in the superstructure of the bridge. The catenary action developed in the
superstructure depends on the superstructure material, superstructure dimensions, and
connection type between the adjacent spans. Concrete superstructures have relatively
poor tensile capacity in comparison to steel superstructure. For catenary action to develop
in the superstructure, it is important to have continuity between the adjacent spans. If the
failed pier is located underneath an expansion joint, then there will be no catenary action
in the superstructure. Quantifying the catenary action that can develop in the
superstructure is complicated and further experimental research is required to examine
this phenomenon. For this investigation, it is assumed that the entire load is being resisted
by the cables system, i.e. the contribution of the catenary action developed in the
superstructure is ignored. This assumption yields more conservative results as any
contribution from the superstructure will be considered as reserved capacity.
The cable system technique consists of passing a number of cables through holes
provided in the diaphragms connecting the superstructure of concrete girders or through
the vertical stiffeners in steel girders (Figs. 6.14 and 6.15). Under regular loading
conditions, the cable system is inactive and is not carrying any load. However, when one

149
C Intermediate Diaphragm
Deviation Pipe
L
A
A
CableCable
of the intermediate piers is destroyed due to an extreme event such as vessel collision,
accidental impact of trucks, fire, or blast attacks, the bridge superstructure starts to deflect
at the location of the damaged pier inducing elongation in the cables. This deflection will
stop when a state of non-linear geometrical equilibrium is reached between the vertical
force resulting from the dead and live loads on the superstructure, and the tensile forces
induced in the cable system. The end diaphragms/stiffeners and their corresponding
anchorages should be designed to withstand the total tensile force induced in the cables at
the state of equilibrium.
Fig. 6.14. Typical detail of cable system in concrete girders
Section A-A

150
Vertical Stiffeners
B
B
Deviation Pipe
Cable Cable
Fig. 6.15. Typical detail of cable system in steel girders
The equilibrium condition depends on the area of the cables, their material properties,
and the geometry of the deformed system. It is important to eliminate any sag in the
cables. The induced forces in the cables can be computed using the structural equilibrium
of the deformed system (Popov, 1990) or Castigliano’s first theorem (Oden, 1967).
6.4.1 Equilibrium of the deflected system (Popov, 1990)
The deflected shape for a two-span bridge is shown in Fig. 6.16.
Section B-B

151
Fig. 6.16. Equilibrium of deflected system of cables for a two-span bridge
The equilibrium equations can be expressed as follows:
i
iL
∆=θtan and ))(tan( iiL θ=∆
*cos
i
ii
L
L=θ and
i
ii
LL
θcos
* =
Elongation in each cable segment = )( **
iiii LL
AE
LT−=
)1()(**
*
i
i
i
iii
L
LAE
L
LLAET −=
−=
)cos1( ii AET θ−= (6.1)
2211 sinsin θθ TTP += (6.2)
Where:
P = applied load including the dynamic effect (dynamic factor of 2 is recommended)
Ti = Tensile force induced in ith cable segment
∆ = deflection at the location of the damaged pier
Li = initial length of ith cable segment
Li*= deformed length of ith cable segment
θi = rotation angle of the deformed ith cable
P
∆
L1 L2
L1* L2*
θ1 θ2 Τ1 Τ2
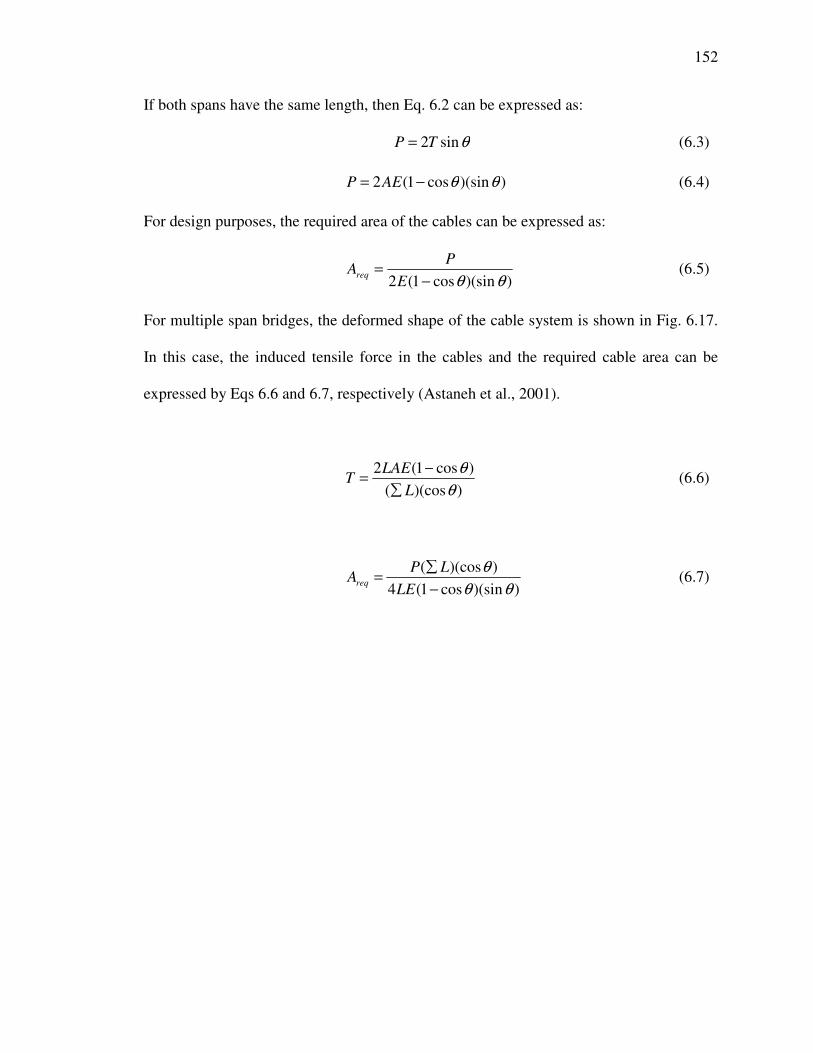
152
If both spans have the same length, then Eq. 6.2 can be expressed as:
θsin2TP = (6.3)
))(sincos1(2 θθ−= AEP (6.4)
For design purposes, the required area of the cables can be expressed as:
))(sincos1(2 θθ−=
E
PAreq (6.5)
For multiple span bridges, the deformed shape of the cable system is shown in Fig. 6.17.
In this case, the induced tensile force in the cables and the required cable area can be
expressed by Eqs 6.6 and 6.7, respectively (Astaneh et al., 2001).
))(cos(
)cos1(2
θ
θ
L
LAET
∑
−= (6.6)
))(sincos1(4
))(cos(
θθ
θ
−
∑=
LE
LPAreq (6.7)

153
ΣL
L*
LLP
θ T ∆ T
concr
ete an
chora
ge
block
burri
ed in
to
soil
concrete anchorage
block burried into
soil
Fig. 6.17. Equilibrium of deflected system of cables for a multiple-span bridge
153

154
6.4.2 Castigliano’s first theorem (Oden, 1967)
The tensile forces induced in the cables can also be expressed using Castigliano’s first
theorem (Oden, 1967). The required area of the cable is presented in Eq. 6.8. The results
obtained using Eq (6.8) are in very good agreement with those obtained using Eq. (6.7)
(Astaneh et al., 2001).
3
2
2
))((
∆
∑=
E
LLPAreq (6.8)
The analysis of the catenary action induced in the cables depends on the equilibrium of
the deformed system, and hence, the required area of the cables is not solely dependant
on the applied loads. However, it depends on several other factors. From Eqs 6.7 and 6.8,
it can be observed that in order to minimize the area of cable required to resist the vertical
loads, one or more of the following conditions should be provided:
• Reduce the applied loads (P)
• Reduce the total length of the cable (ΣL)
• Reduce the square of the deflected segment length (L)
• Increase in the elastic modulus of cable material (E)
• Increase the deflection at the damaged pier (∆)
The external applied loads depend on the summation of the dead weight of the
superstructure and the live load acting on the bridge at the time of failure, and hence, we
have no control over these applied loads. Since the required area of cables is inversely
proportional to ∆3, then it is most economic to increase the value of ∆ in order to
minimize the area of cables. For most bridges, ∆ will be limited by the required clearance
for emergency vehicles to operate during the high consequence event. In addition, the

155
Cable system 1
Cable system 2
Cable system 3
One long cable system
Column 1 Column 2 Column 3
required area of cables can be minimized by using innovative material that has higher
values of elastic modulus such as 12K high modulus carbon fiber tows which have an
elastic modulus of 92,000 ksi. However, the anchorage of carbon fiber cables should be
designed carefully to eliminate the possibility of rupture. Additionally, the required area
of the cables increases with the increase in the total length of the used cable. Therefore, it
can be more economical to use multiple short cable systems instead of one long cable
system throughout the entire length of the bridge. Each one of these multiple cable
systems will extend along two adjacent spans. A schematic of this technique is shown in
Fig. 6.18. Cable 1 will be anchored behind the left abutment and behind column 2; cable
2 will be anchored behind columns 1 and 3; and cable 3 will be anchored behind the right
abutment and behind column 2. However, the main disadvantage associated with using
multiple cable systems is that in involves using more anchorages that that used for a
single cable system.
a) Alternative (I)
b) Alternative (II)
Fig. 6.18. Long single cable system versus multiple short cable systems

156
For small values of deflection (∆) and angle of rotation (θ) it can be observed that the
required area of the cables is not governed by the applied loads, and hence, the induced
stress in the cables is very low which indicates that the cables are not used efficiently.
Whereas for higher values of ∆ and θ, the stress level in the cables increases and the
cables are utilized more efficiently. The effect of the angle of rotation on the required
area of cables and the corresponding stress induced in the cables is shown in Fig. 6.19.
This curve is generated for a typical two-span bridge; each span is 110 ft long. The
modulus of elasticity of the cables is taken as 29,000 ksi. All values in Fig. 6.19 are based
on a unit applied force (P), and hence, the required area obtained from this curve should
be multiplied by the value of the total vertical applied load.
Fig. 6.19. Effect of the angle of rotation on the requires area of the cables
0.0
0.1
0.2
0.3
0.4
0.5
0.6
0.7
0.8
0.9
1.0
0 1 2 3 4 5 6 7 8 9
Rotation angle, θ (degrees)
Req
uir
ed a
rea
of
cab
le p
er u
nit
fo
rce
(in
2/
kip
)
0
50
100
150
200
250
300
Ind
uce
d S
trss
in
th
e ca
ble
(k
si)
Required Area of Cable
Induced Stress in Cable
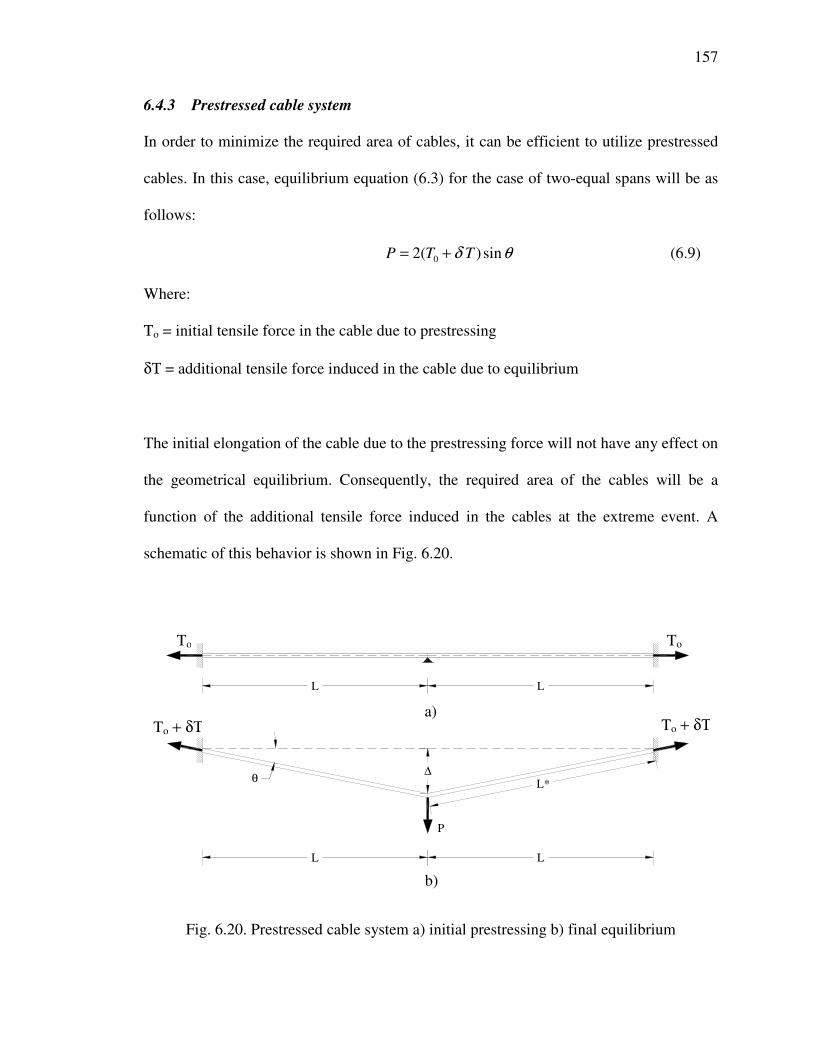
157
θ
L
L*∆
L
L L
P
To To
To + δΤ To + δΤ a)
b)
6.4.3 Prestressed cable system
In order to minimize the required area of cables, it can be efficient to utilize prestressed
cables. In this case, equilibrium equation (6.3) for the case of two-equal spans will be as
follows:
θδ sin)(2 0 TTP += (6.9)
Where:
To = initial tensile force in the cable due to prestressing
δΤ = additional tensile force induced in the cable due to equilibrium
The initial elongation of the cable due to the prestressing force will not have any effect on
the geometrical equilibrium. Consequently, the required area of the cables will be a
function of the additional tensile force induced in the cables at the extreme event. A
schematic of this behavior is shown in Fig. 6.20.
Fig. 6.20. Prestressed cable system a) initial prestressing b) final equilibrium

158
δΤ can be expressed as: )cos1( θδ −= AET (6.10)
The required area is: ))(sincos1(2
sin2
θθ
θ
−
−=
E
TPA o
req (6.11)
If prestressed cables are used, then the effect of this prestressing force on the
superstructure should be considered in the design. It is recommended to keep the center
of gravity of the cable system close to the center of gravity of the girders. This will
minimize the effect of bending moment resulting from the eccentricity of the cables.
Furthermore, it is essential to design the anchorage properly to ensure that the
prestressing force will not be released at the time of failure.
6.4.4 Anchorage details of cable system
The anchorage design of the cable system is provided by extending the cables over a
saddle in the abutment backwall. Cables are anchored in the soil behind the abutment
wall or in a concrete block buried behind the abutment wall as shown in Fig. 6.21. For
multiple-span long bridges in which only specific piers are to be protected, the cables can
be anchored at the ground within the span behind the columns as shown in Fig. 6.22.
However, this should be discussed with the traffic engineers to ensure that the roadway
underneath the bridge is wide enough for the traffic. In case of prestressed cables, it will
be difficult to prestress the cables if they are anchored in concrete blocks behind the
abutments or behind the columns. Providing live end anchorage near the intermediate
diaphragms can simplify the constructability of the cables. In this case, the cables will

159
have dead anchorage in the concrete blocks behind the abutments and/or behind the
columns and live anchorage within the spans near the diaphragm.
In conclusion, the catenary action developed in the cables system is a promising
technique that can be utilized to localize the damaged that can occur in a certain span of
the bridge, isolate the destroyed pier, prevent the progressive collapse from extending to
adjacent spans of bridge, and reduce the number of causalities. Further research is
required to provide a detailed method of analysis and detailing procedure for the use of
cable systems. The design of catenary forces in cable systems is illustrated in a detailed
example provided in appendix B.

160
concr
ete
anch
orage
blo
ck
burrie
d into
soil
girderdamaged pier
diaphragmscatenary cable
concrete
anchorage block
burried intosoil
Saddle detail
concrete anchorageblock burried into
soil
concrete anchorageblock burried into
soil
concrete reinforcedto resist curved cable
cable
couplers
rigid bent steel pipe
to anchorage
Fig. 6.21. Anchored cables at the abutment backwall
Fig. 6.22. Anchored cables behind columns
160
Saddle Detail

161
CHAPTER 7
CONCLUSIONS AND RECOMMENDATIONS
7.1 Summary
The increased threat of terrorist attacks against infrastructural and transportation targets is
an alarming phenomenon and a matter of national security. Bridges are very important
elements in the transportation system. The importance of bridges, their national
significance, and the casualties associated with a damaged bridge make them attractive
targets to terrorists. Consequently, critical bridges should be protected against blast
hazards. There are no codes or design guidelines available for protecting bridges against
blast, and hence, it is essential to analyze the effect of blast loads on critical bridge
components and to evaluate the global response of bridges subjected to various blast
scenarios. This research examined the fundamentals of blast loads including blast wave
parameters, wave propagation, reflected blast pressure, impulse, and the factors affecting
the behavior of structural members subjected to blast loads. Blast load response spectra
were developed to transform the dynamic blast load into an equivalent static load. These
spectra can be used to perform a simplified SDOF analysis of structural elements
subjected to blast loads. To evaluate the global response of a typical highway bridge

162
model subjected to blast hazards, a computer simulation was performed using ELS
software. The bridge model was subjected to various blast scenarios. For each scenario,
the vulnerable elements were identified. Based on the results obtained from the computer
simulations, protection measures were proposed. This includes using materials with high
energy absorption capacities such as high-performance fiber reinforced composites,
redundant superstructure components, superstructure continuity, and cable systems to
prevent progressive collapse and minimize the damage.
7.2 Conclusions and Recommendations
• Efficient security systems are the most effective way to minimize the potential of
terrorist attacks. This includes security surveillance, cameras, preventing parking
under the bridge, proper lighting of the site, and truck and van inspections. It is
crucial to direct more security measures to vans and trucks as the amount of charge
carried by them can be devastating.
• The standoff distance is the most critical parameter in blast scenarios. It is essential
to enforce minimum standoff distance for critical bridges that are potential targets for
terrorist attacks or are exposed to accidental chemical explosions.
• Dynamic analysis of structures subjected to blast hazards is cumbersome and time
consuming. In order to simplify the analysis, blast pressure response spectra were
proposed. These spectra are based on transforming the dynamic blast load generated
by the explosive devise into an equivalent static load using numerical solution of the
impulsive blast load. Blast pressure response spectra can be used to analyze the
effect of blast loads on a structural component, design this structural member to

163
withstand the blast pressure, and to estimate the minimum required standoff distance
that should be provided for the structural member to prevent its collapse under a
specific blast hazard.
• The global response of critical bridges subjected to blast hazards should be
investigated to identify the vulnerable structural elements and to predict the failure
mechanism of the bridge. Analysis softwares such as Extreme Loading for Structures
(ELS), Dytran, and others are effective tools for simulating the behavior of bridges
under blast loads and for tracking their failure throughout the various stages of
collapse.
• For critical bridges that might be subjected to below-deck blast scenarios, it is
recommended to provide the same top and bottom reinforcement to the deck slab
throughout the cross section. It is also important to provide sufficient number of
shear connectors between the deck slab and girders for full composite action to
prevent the separation of the deck from the superstructure girders. To resist the uplift
forces and to prevent the separation between the girders and the substructure, it is
recommended to use a fixed bearing connection to resist the tensile forces created by
blast.
• In case the girders are uplifted from the substructure during the blast scenario, it is
important to ensure that the seat width is long enough to hold the rebounding girders
and prevent the progressive collapse of the bridge. Hold down devices may also be
required in some cases to minimize impact and rebound.
• Blast waves can result in transverse movements of the girders and can apply
significant torsional forces on them. Therefore, it is essential to provide lateral

164
stiffness by utilizing a sufficient number of diaphragms. For concrete girders,
concrete diaphragms are preferable over steel cross frames because they exhibit more
stiffness to enhance the continuity of the bridge in the transverse direction. As a
result, all girders act together as a single unit rather than having individual behavior
for each one.
• Structural elements should be designed to exhibit large plastic deformations and high
ductility limits. It is essential to utilize High Performance Fiber Reinforced Concrete
(HPFRC) materials such as SIFCON, SIMCON, and ECC, due to their high energy
absorption capacities.
• The use of highly ductile concrete materials such as SIFCON and ECC encased in
steel columns produces ductility levels ranging from 10 to 20 which are two to three
times higher than the ductility of conventional concrete and are expected to meet the
ductility requirements for blast design.
• Redundancy and continuity of the bridge structure are essential to prevent its
progressive collapse and minimize the induced damage during blast hazards.
Redundancy can be enhanced by providing double and triple edge columns for the
substructure bents, using HPFRC wall piers, and combinations of HPFRC walls and
columns.
• A cable system can be designed to provide an alternate load path to support the
structure following an extreme event. Catenary action developed in the cable system
can be utilized to localize the damage that may occur in certain spans of the bridge,
isolate the destroyed pier, prevent the progressive collapse from extending to
adjacent spans of bridge, and reduce the number of causalities. Cable layout, number

165
and locations of diaphragms, and anchorage systems are key factors in designing an
efficient, functional, constructable, and cost effective cable system.
7.3 Future Research
• There is a need for experimental testing of structural members subjected to blast
loads. Those members should be monitored throughout the experimental tests by
special sensors. The stress, strains, and deflections should be recorded and compared
with the corresponding theoretical values.
• Further research is required to provide analysis and design guidelines, detailing, and
layout schemes for the use of cable systems as an alternate load path to support
bridge girders following a major blast event.
• Further research is required to investigate the use of ECC in bridge piers, walls, and
other structural elements, and to develop its design guidelines.
• Available software programs for simulating bridge response to blast loads are still
undergoing further development and evaluation. Care should be taken when using
these software programs for evaluating bridge response especially when evaluating
parameters such as angles of incidence and reflected pressures.
• Analysis and design guidelines should be developed to provide a detailed analysis
and design procedures for critical bridges subjected to blast hazards. These
guidelines should take into account both the local and global behavior of critical
bridges.

166
APPENDIX A

167
A.1 Using the Blast Response Spectra to Design a Structural Element Subjected
to a Specific Blast Scenario
This example illustrates the use of the blast response spectra to design a flexural member
subjected to a blast event of 1000 lbs located at a standoff distance of 20 ft. The span of
the designed member is 20 ft. The compressive strength of concrete and the yield strength
of steel are: 4000' =cf psi, and 000,60=yf psi
Step 1: The period of the structural member is calculated based on its mass and stiffness.
These values are computed based on the design for other types of loads acting on
the member.
Assume the member has square cross section 3ft x 3ft with the same top and bottom
reinforcement of 8 # 8 bars.
b = 36 in
d = 36 – 2.5 in cover – 1.0 in bar/2 = 33 in
Elastic modulus of concrete, '57000 ccon fE = = 400057000
= 3,605,000 lb/in2 = 519,120 kip/ft2
Density of concrete, 15.0=conγ kips/ft3
Area of concrete, A = 3 x 3 = 9.0 ft2
Area of steel, As = 8 x 0.79 = 6.32 in2
Modular ratio, n = 3605
29000==
c
s
E
E=8.04
n As = (8.04)(6.32) = 50.84 in2
b
bdnAnAnAc
sss )2( ++−=
36
))33)(36)(2(84.50(84.5084.50 ++−= = 8.34 in

168
Gross moment of inertia, 3
12
1hbI g = )3(
12
1 4= = 6.75 ft4
Cracked moment of inertia, 23
)(3
cdnAbc
I scr −+= 23
)34.833(84.503
)34.8)(36(−+= =
1.83 ft4
Use an average moment of inertia, =+
=+
=2
83.175.6
2
crg
a
III 4.29 ft4
Self weight of member = HAconγ = (0.15)(9.0)(20) = 27 kips
Assume the member is subjected to a static weight of 73 kips
Total weight on the member = 100 kips
g = 32.2 ft/sec2
M = (100/32.2) = 3.1 kip-sec2/ft
LMK = 0.66 for the plastic behavior
3
307
L
EIK a
E =320
)29.4)(120,519)(307(= = 85,462 kip/ft
E
LM
K
KMT π2=
)462,85(
)66.0()1.3(2π= = 0.031 sec
Step 2: For the design blast scenario, use the response spectra for the specific charge
weight and standoff distance.
Use the response spectra for 1000 lbs. A close in view of this spectrum is presented in
Fig. A.1.

169
0.0
0.1
0.2
0.3
0.4
0.5
0.6
0.7
0.8
0.9
1.0
0 0.01 0.02 0.03 0.04 0.05 0.06 0.07 0.08 0.09 0.1
Period, seconds
Eq
uiv
alen
t E
last
ic S
tati
c P
ress
ure
, k
si
R = 6 ft
R = 8 ft
R = 10 ft
R = 15 ft
R = 20 ft
R = 30 ft
R = 40 ft
R = 50 ft
Fig. A.1. Response spectra for W = 1000 lbs (zero damping)
169

170
Step 3: Read the equivalent elastic static pressure from the vertical axis based on the
period, charge weight, and standoff distance.
From the response spectrum at a standoff distance of 20 ft, the equivalent elastic static
pressure = 0.277 kip/in2
Step 4: The equivalent elastic static pressure is multiplied by the correction factor “C”
derived in Eq. 3.1.
Assume the detonation source is located at the midspan of the member. The pressure
distribution can be approximated to a triangular pressure that decreases linearly by a
slope of 1:2 as shown in Fig. A.2. In other words, the pressure drops to zero with a
horizontal distance equal to twice the value of the standoff distance.
lengthloaded
ondistributipressuretriangulartheunderareaC =
20
)10)(5.0)(75.01()10)(5.0)(75.01( +++= = 0.875
Equivalent elastic static pressure = (0.277 kip/in2) (0.875) = 0.242 kip/in2

171
Fig. A.2. Pressure distribution along the length of the member
20 ft
40 ft
Standoff distance20 ft
40 ft
height of column
2
1
2
1
0.75
1.0
0.75

172
Step 5: Divide the result by the ductility factor (Rf), based on the provided ductility, to
give the equivalent plastic static pressure.
Assume 5=µ , 12 −= µfR = 3
Equivalent plastic static pressure = (0.242 kip/in2)/ 3 = 0.080 kip/in2
Step 6: Multiply this plastic static pressure by the tributary width of the member to obtain
the equivalent uniform load.
Tributary width = 3.0 ft = 36 in
Uniform load = (0.080 kip/in2)(36 in) = 2.90 kip/in = 34.85 kip/ft
Step 7: Use this uniform load to calculate the maximum shear and bending moment
acting on the member.
Support shear = (34.85 kip/ft) (20 ft) (0.5) = 348 kips
Fixed end moment 12
2Lω
=12
)20()85.34( 2
= = 1162 kip-ft
Note: if the member is subjected to bending and shear due to conventional loads, the
bending and shear values should be added to those from the blast load case.
Step 8: Check the adequacy of the member to resist the applied staining actions. If the
member is not adequate, revise the design and repeat steps 1 through 7.
For dynamic bending, the design strength is calculated as the product of the material
strength, the Strength Increase Factor (SIF), and the Dynamic Increase Factor (DIF).
dyf = (SIF)(DIF) yf = (1.1)(1.17)(60) = 77.2 ksi

173
'
dcf = (SIF)(DIF) '
cf = (1.0)(1.19)(4) = 4.76 ksi
Values for DIF and SIF are obtained from Table 2.5 and Table 2.6, respectively.
bf
fAa
dc
dys
'85.0= =
)36)(76.4)(85.0(
)2.77)(32.6(=3.35 in
]2
[a
dfAM dysP −= ]2
35.333)[2.77)(32.6( −= = 15283 kip-in = 1273 kip-ft > 1162 kip-ft
Hence, bending capacity is adequate
For dynamic shear,
'
dcf = (SIF)(DIF) '
cf = (1.0)(1.1)(4) = 4.4 ksi
The shear capacity of plain concrete is
bdfV dcc
'2= )33)(36(44002= = 157 kips
The shear capacity of the stirrups is
s
dfAV
dyv
s =
Assume No. 4 two-legged stirrups @ 5.0 in spacing, i.e. area per leg = 0.2 in2
5
)33)(2.77)(4.0(=sV =204 kips
Total shear capacity = 157 + 204 = 361 kips > 348 Kips
Hence, shear capacity is adequate.
Note: if the design is inadequate, the member strength can be increase either by
increasing its dimensions, increasing the reinforcement ratio, enhancing the material
properties, or increasing the ductility limit.

174
A.2 Calculating the Minimum Required Standoff Distance for a Specific
Structural Element
This example illustrates the use of the blast response spectra to determine the minimum
standoff distance that should be provided to a specific member in order to resist a specific
charge weight. The charge weight is assumed to be 1000 lbs. The span of the designed
member is 20 ft. The compressive strength of concrete and the yield strength of steel are:
4000' =cf psi, and 000,60=yf psi
Step 1: The period of the structural member is calculated based on its mass and stiffness.
These values are computed based on the design for other types of loads acting on
the member.
Assume the member has square cross section 3ft x 3ft with the same top and bottom
reinforcement of 8 # 8 bars.
b = 36 in
d = 36 – 2.5 in cover – 1.0 in bar/2 = 33 in
'57000 ccon fE = = 400057000 = 3,605,000 lb/in2 = 519,120 kip/ft2
15.0=conγ kips/ft3
33 xA = = 9.0 ft2
As = 8 x 0.79 = 6.32 in2
n = 3605
29000==
c
s
E
E=8.04
n As = (8.04)(6.32) = 50.84 in2
b
bdnAnAnAc
sss )2( ++−=
36
))33)(36)(2(84.50(84.5084.50 ++−= = 8.34 in

175
3
12
1hbI g = )3(
12
1 4= = 6.75 ft4
23
)(3
cdnAbc
I scr −+= 23
)34.833(84.503
)34.8)(36(−+= = 1.83 ft4
Use an average moment of inertia, =+
=+
=2
83.175.6
2
crg
a
III 4.29 ft4
Self weight of member = HAconγ = (0.15)(9.0)(20) = 27 kips
Assume the member is subjected to a static weight of 73 kips
Total weight on the member = 100 kips
g = 32.2 ft/sec2
M = (100/32.2) = 3.1 kip-sec2/ft
LMK = 0.66 for the plastic behavior
3
307
L
EIK a
E =320
)29.4)(120,519)(307(= = 85,462 kip/ft
E
LM
K
KMT π2=
)462,85(
)66.0()1.3(2π= = 0.031 sec
Step 2: Based on the properties of the structural element calculate the maximum uniform
plastic pressure that the member can withstand.
For dynamic bending, the design strength is calculated as the product of the material
strength, the Strength Increase Factor (SIF), and the Dynamic Increase Factor (DIF).
dyf = (SIF)(DIF) yf = (1.1)(1.17)(60) = 77.2 ksi
'
dcf = (SIF)(DIF) '
cf = (1.0)(1.19)(4) = 4.76 ksi
Values for DIF and SIF are obtained from Table 2.5 and Table 2.6, respectively.

176
bf
fAa
dc
dys
'85.0= =
)36)(76.4)(85.0(
)2.77)(32.6(=3.35 in
]2
[a
dfAM dysP −= ]2
35.333)[2.77)(32.6( −= = 15283 kip-in = 1273 kip-ft
Uniform plastic pressure from bending 2
12
bL
M p
b == ω)240)(36(
)15282()12(2
= = 0.088 kip/in2
For dynamic shear,
'
dcf = (SIF)(DIF) '
cf = (1.0)(1.1)(4) = 4.4 ksi
The shear capacity of plain concrete is
bdfV dcc
'2= )33)(36(44002= = 157 kips
The shear capacity of the stirrups is
s
dfAV
dyv
s =
Assume No. 4 two-legged stirrups @ 5.0 in spacing, i.e. area per leg = 0.2 in2
5
)33)(2.77)(4.0(=sV =204 kips
Total shear capacity = 157 + 204 = 361 kips
Uniform plastic pressure from shear =Lb
Vn
s
2=ω =
)36)(240(
)361)(2(= 0.084 kip/in2
Maximum uniform plastic pressure is the lesser of bω and sω , hence maxω = 0.084 kip/in2
Step 3: Multiply this plastic static pressure by the ductility factor (Rf) to obtain the
maximum elastic static pressure.
Assume 5=µ , 12 −= µfR = 3

177
Maximum uniform elastic static pressure = (0.084) (3) = 0.252 kip/in2
Step 4: For a specific charge weight, the minimum standoff distance can be computed
based on the equivalent elastic static pressure and the period of the structure.
Use the blast response spectrum for a charge weight of 1000 lbs. Using the period of the
structure (0.031 sec) and the uniform pressure of 0.252 kip/in2, the standoff distance
obtained from the chart is 21 ft
Step 5: Based on the computed standoff distance, the equivalent elastic static pressure is
divided by the correction factor “C” derived in Eq. 3.1 to give a revised elastic
static pressure.
Assume the detonation source is located at the midspan of the member. The pressure
distribution can be approximated to a triangular pressure that decreases linearly by a
slope of 1:2. In other words, the pressure drops to zero with a horizontal distance equal to
twice the value of the standoff distance.
lengthloaded
ondistributipressuretriangulartheunderareaC =
20
)10)(5.0)(75.01()10)(5.0)(75.01( +++= = 0.875
Revised elastic static pressure = 0.252/0.875 = 0.288 kip/in2
Step 6: Enter the response spectrum using the revised elastic static pressure to compute
the revised standoff distance.
Revised standoff distance = 19.5 ft

178
Step 7: Repeat steps 5 and 6 until the standoff distance converges to a constant value Since the change in the standoff distances obtained in steps 4 and 6 is insignificant, there
is no need to carry any further iteration.

179
APPENDIX B

180
Design of Catenary Cable System to Prevent Progressive Collapse
This example illustrates the design of a two span bridge to mitigate the removal of the
intermediate pier. The design is based on utilizing steel cables to provide catenary action
to resist the external applied loads, and hence prevent the collapse of the bridge. The
design will be based on a two-span bridge; each span is 110 ft long. The superstructure
consists of AASHTO Type VI prestressed girders spaced at 10 feet center-to-center. The
deck slab thickness is 8 inches with 2 in. haunch at the location of the girders. The future
wearing surface is assumed to be 2 inches. The self weight of concrete is taken as 150
lb/ft3. The weight per unit foot on each girder is calculated as follows:
Agirder = 1128 in2
girder weight = (1128)(0.15)/(144) = 1.18 k/ft
deck slab weight = (8)(10/12)(0.15) = 0.98 k/ft
wearing surface = (2)(10/12)(0.15) = 0.24 k/ft
haunch weight = 0.09 k/ft
Parapet and guardrail = 0.5 k/ft
Total dead load = 1.18 + 0.98 + 0.24 + 0.09 + 0.5 = 3.0 k/ft
Due to loss of pier, the total dead weight carried by the cables (P) will be:
P = (3.0) (110+110)/2 = 330 kips
For the steel cables, assume puf = 270 ksi
Due to the dynamic effect of the extreme event, this force (P) should be multiplied by a
magnification factor. However, in this example this factor is assumed to be equal to 1.

181
Fig. B.1. Schematic of the catenary forces in the cable system For steel Cables, the modulus of elasticity (E) = 29000 ksi
θsin2TP =
))(sincos1(2 θθ−= AEP
Since the required area of cables is inversely proportional to ∆3, then it is most economic
to increase the value of ∆ in order to minimize the area of cables. For most bridges, ∆ will
be limited by the required clearance for emergency vehicles to operate during the high
consequence event. For this example, it is assumed that ∆ = 7 ft
)22.0( ksi 8.581.44
2594
in 1.44)0636.0)(65.3cos1)(29000(2
330
))(sincos1(2
K 2594)0636.0(2
330
sin2
65.3
0636.0110
7tan
2
pu
req
ffstressCable
E
PA
PT
L
==
=−
=−
=
===
=
===∆
θθ
θ
θ
θ
o
θ
L =110
L* ∆
L =110
L =110
P
L =110

182
Number of 0.6 in Φ diameter strands required = 44.1/0.217 = 203 or about 7 x 31- 0.6 in
Φ tendons per girder. (This is a large number of tendons per girder and will not be
practical to accommodate in terms of anchorages, deviation diaphragms, and space)
In order to reduce the number of cables, we can utilize the following alternatives:
1. Provide prestressing forces in the cables to reduce their number.
2. Use high modulus cables such as high-modulus carbon fiber tendons.
1. Prestressing
It is recommended to maintain the centroid of the prestressed cables at center of gravity
of composite section of the superstructure to avoid introducing bending stresses in deck
and girder that could further complicate the design. The amount of prestressing will be
controlled by the allowable compression in the composite girder.
puf for the prestressing steel cables is assumed to be 270 ksi
θsin)(2 0 TTP +∆= Where ∆T0 is the prestress in the two cables
kip 2594)(3)(2
kip 2594)0636.0(2
330
sin2)(
0
0
=∆⇒∆=
===∆+
TTT
Assume
PTT
θ
kip 865=∆T and T0 = 1730 kip
))(sincos1(2
sin2
θθ
θ
−
−=
E
TPA o
req = 2in 7.14)0636.0)(998.01)(29000)(2(
)0636.0)(1730)(2(330=
−
−
)65.0( 5.1767.14
)865(3 pufksifstresscablefinal ==
)(0.43f ksi 7.1177.14
1730 pu==fstresscableinitial

183
2. High-Modulus Carbon Cables
The modulus of carbon fiber cables can range from 43,500 ksi (300 GPa) up to 92,000 ksi
(640 GPa) for ultra-high modulus cables compared the 29,000ksi (200 GPa) modulus of
steel. The tensile strength of these cables also ranges from 220 ksi 390 ksi. The required
area of the cables is inversely proportional to their modulus of elasticity. For example,
using the ultra-modulus carbon cables with E = 87,000 ksi (600 GPa) and fu = 300 ksi,
the required area in the previous example will drop from 44.1 in2 to 14.7 in2 without
introducing any prestress in the cables. If we introduce pre-tensioning in the ultra-
strength carbon cables equal to 0.3fu = 90 ksi, then the required area will drop from 14.7
in2 to 9.73 in2.
However, for carbon cables, more attention should be paid for anchorages, deviation
diaphragms and sleeves, protection against vandalism, and transverse shear behavior.
Also availability, cost, and experience in using these tendons are other factors that need
to be addressed when such cables are considered.

184
APPENDIX C

185
Cost Analysis of Bridge Protection Measures against Extreme Events
The security design of a specific bridge should be addressed with respect to the statewide
network of bridges rather than independent project-level security design (TRB, 2007). To
provide the most effective security system, all bridges within the network should be
examined and their risk assessments should be identified. Consequently, for the critical
bridges, extreme event protection measures are proposed. Due to the high cost of the
protection measures and the limited government budget, prioritization of these protection
measures is required to achieve the most cost effective design (TRB, 2007). The high cost
of bridge security design can only be justified with respect to the severe consequences
and causalities that are associated with a destroyed bridge. Damage to one or more
critical bridges can result in hundreds of causalities. In addition, the cost of
reconstructing a bridge is significantly high. This reconstruction cost can range from few
millions up to several billions of dollars.
This section illustrates the impact of some protection measures on the cost of a typical
highway bridge. As illustrated earlier in this investigation, it is uneconomical and
unpractical to design structures to be blast-proof. The design philosophy is mainly based
on allowing the structure to be damaged but preventing the total collapse of the structure.
Generally, preventive security measures such as security surveillance, cameras,
preventing parking over and under the bridge, and proper lighting of the site are the most
cost effective and should be considered as the first step in security design. If further
protection is required, protection measures are selected based on the risk assessment,
bridge performance criteria, and the design level blast. The cost analysis of these

186
protection measures is multifaceted as it depends on the bridge type, material, geometry,
location, nature of the attack, and the protection measure adopted. This protection cost
can vary significantly from one bridge to another and should depend on specific case
studies.
The design bridge geometry, materials, dimensions, and details are based on the FHWA
design example (Wassef et al, 2003) that was used earlier in chapter 5 (Fig. C.1). The
cost analysis will be divided into two main categories; 1) Protection measures for minor
blast hazards 2) Protection measures for major blast hazards. In addition, these protection
measures will improve the behavior of the bridge during other extreme events such as
vessel impacts, truck impacts, and earthquakes. The substructure of the bridge is the most
vulnerable to blast attacks and can trigger disproportionate collapse. Hence, this cost
analysis will focus mainly on the protection measures of the substructure. Costs of
excavation, coring, field testing, and other items are ignored in this study as they are
assumed not to vary significantly between the design alternatives.
Preliminary cost of the substructure prior to any protection measures:
Columns:
Diameter of each column = 3.5 ft
Column height = 18 ft
Area of each column = 4
)5.3)(( 2π = 9.62 ft2
Volume of concrete per column = (18) (9.62) = 173.2 ft3
For the four column in the pier, volume of concrete = (4) (173.2) = 692.6 ft3 = 25.6 CY

187
Bent cap beam:
Area of cap beam = (4 ft) (4 ft) = 16 ft2
Length of cap beam = 55.38 ft
Volume of concrete in the cap beam = (16) (55.38) = 886 ft3 = 32.8 CY
For the columns and cap beam, assume steel reinforcement weight is 200 lbs/CY
Footings:
Volume of each footing = (12 ft) (12 ft) (3 ft) = 432 ft3
For all four footing, volume of concrete = (4) (432) = 1728 ft3 = 64 CY
Assume steel reinforcement weight is 125 lbs/CY
Entire substructure:
Total volume of concrete above Footings = 25.6 CY + 32.8 CY = 58.4 CY
Assume the cost of concrete above footings is $800 per cubic yard
Cost of concrete above footings = ($800/CY) (58.4 CY) = $47,000
Assume unit cost of steel reinforcements = $1.4 per lb
Cost of steel reinforcement above footings = (200 lb/CY) (58.4 CY) ($1.4/lb) = $16,500
Total volume of concrete in footings = 64 CY
Assume the cost of concrete in footings is $400 per cubic yard
Cost of concrete in footings = ($400/CY) (64 CY) = $26,000
Assume unit cost of steel reinforcements = $1.4 per lb
Cost of steel reinforcement in footings = (125 lb/CY) (64 CY) ($1.4/lb) = $11,000
Total substructure cost = $100,500 per pier

188
Cost of the substructure including protection measures for minor blast hazards:
The protection measures utilized against minor blast hazards will consist of using high
performance fiber reinforced concrete (HPFRC) in all the columns and the bent cap. The
number and geometry of the columns and the bent cap will not be changed. The
connection between the columns and the foundation is assumed to be through mechanical
anchorage to ensure adequate ductility. The pier section designed for minor blast hazards
is shown in Fig. C.2. The cost of the HPFRC varies according to the type of fibers used
as well as the fiber supplier. Since HPFRC is only provided by limited suppliers, its price
is job specific. In this example, it is assumed that the cost of HPFRC including testing
and labor is twice that of conventional concrete that was used earlier prior to the
protection measures. The unit cost of mechanical anchorage can also vary according to its
type and characteristics. In this example, the cost of each mechanical anchorage is
assumed to be $7,500.
Columns:
For the four column in the pier, volume of concrete = 692.6 ft3 = 25.6 CY
Bent cap beam:
Volume of concrete in the cap beam = 886 ft3 = 32.8 CY
For the columns and cap beam, assume steel reinforcement weight is 200 lbs/CY
Footings:
For all four footing, volume of concrete = 1728 ft3 = 64 CY
Assume steel reinforcement weight is 125 lbs/CY

189
Entire substructure:
Total volume of concrete above Footings = 25.6 CY + 32.8 CY = 58.4 CY
Assume the unit cost of HPFRC above footings is $1,600 per cubic yard
Cost of concrete above footings = ($1,600/CY) (58.4 CY) = $93,500
Cost of steel reinforcement above footings = (200 lb/CY) (58.4 CY) ($1.4/lb) = $16,500
Total volume of concrete in footings = 64 CY
Assume the cost of concrete in footings is $400 per cubic yard
Cost of concrete in footings = ($400/CY) (64 CY) = $26,000
Cost of steel reinforcement in footings = (125 lb/CY) (64 CY) ($1.4/lb) = $11,000
Cost of mechanical anchorages = (4) ($7,500) = $30,000
Total substructure cost = $177,000 per pier
Cost of the substructure including protection measures for major blast hazards:
The protection measures utilized against major blast hazards will consist of using high
performance fiber reinforced concrete (HPFRC) in all the columns and the bent cap.
Double edge columns will be used at each side of the pier to provide increased
redundancy. For high energy absorption capacities, all columns will be encased in 3/4
inches thick steel pipe. The connection between the columns and the foundation is
assumed to be through mechanical anchorage to ensure adequate ductility. The pier
section designed for major blast hazards is shown in Fig. C.3.

190
Columns:
Total number of columns = 4 initial columns + 2 additional edge columns = 6 columns
For the six column in the pier, volume of concrete = (6) (173.2) = 1039.2 ft3 = 38.5 CY
Area of steel casing = )12/75.0)(5.3)(( ftπ = 0.69 ft2
Assume the steel casing extends a distance of 1 ft in both the bent cap and the footing.
Total length of steel casing = 20 ft
Volume of six casings = (6) (0.69) (20) = 82.5 ft3
Weight of steel casings = (490 lbs/ft3) (82.5 ft3) = 40,409 lbs
Bent cap beam:
Area of cap beam = (4 ft) (4 ft) = 16 ft2
Length of cap beam = 55.38 ft
Volume of concrete in the cap beam = (16) (55.38) = 886 ft3 = 32.8 CY
Footings:
Total number of footings = 6
For all six footing, volume of concrete = (6) (432) = 2592 ft3 = 96 CY
Entire substructure:
Weight of steel casings = (490 lbs/ft3) (82.5 ft3) = 40,409 lbs
Assume the unit cost of structural steel is $1.75 per lb
Cost of structural steel = (40,409 lbs) ($1.75 /lb) = $71,000
Total volume of concrete above Footings = 38.5 CY + 32.8 CY = 71.3 CY
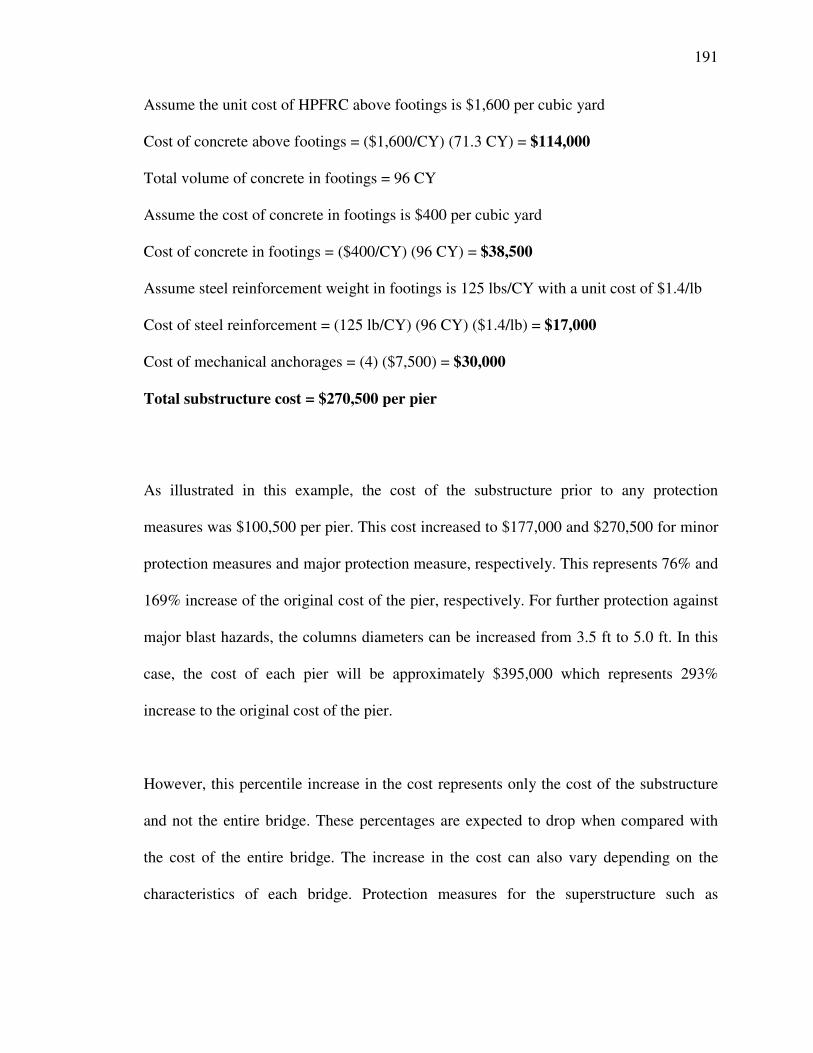
191
Assume the unit cost of HPFRC above footings is $1,600 per cubic yard
Cost of concrete above footings = ($1,600/CY) (71.3 CY) = $114,000
Total volume of concrete in footings = 96 CY
Assume the cost of concrete in footings is $400 per cubic yard
Cost of concrete in footings = ($400/CY) (96 CY) = $38,500
Assume steel reinforcement weight in footings is 125 lbs/CY with a unit cost of $1.4/lb
Cost of steel reinforcement = (125 lb/CY) (96 CY) ($1.4/lb) = $17,000
Cost of mechanical anchorages = (4) ($7,500) = $30,000
Total substructure cost = $270,500 per pier
As illustrated in this example, the cost of the substructure prior to any protection
measures was $100,500 per pier. This cost increased to $177,000 and $270,500 for minor
protection measures and major protection measure, respectively. This represents 76% and
169% increase of the original cost of the pier, respectively. For further protection against
major blast hazards, the columns diameters can be increased from 3.5 ft to 5.0 ft. In this
case, the cost of each pier will be approximately $395,000 which represents 293%
increase to the original cost of the pier.
However, this percentile increase in the cost represents only the cost of the substructure
and not the entire bridge. These percentages are expected to drop when compared with
the cost of the entire bridge. The increase in the cost can also vary depending on the
characteristics of each bridge. Protection measures for the superstructure such as

192
increased seat width, additional deck reinforcements, and hold down devices are less
expensive in comparison with the protection measures utilized in the substructure.
Based on this limited study of the cost analysis of protection measures for piers, it is
expected that the increase in the cost of a typical bridge designed for a major blast hazard
is approximately 10% to 15% of the total cost of the bridge.
Fig. C.1. Pier section prior to any protection measures
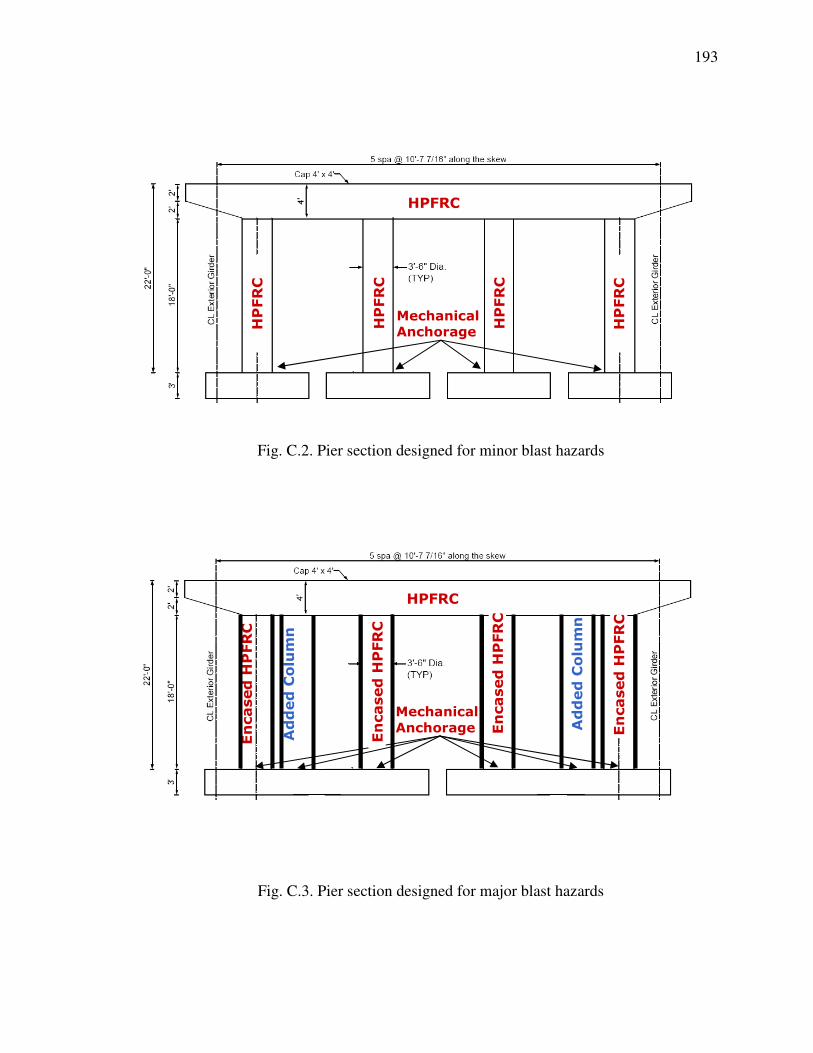
193
Fig. C.2. Pier section designed for minor blast hazards
Fig. C.3. Pier section designed for major blast hazards
HPFRC
HPFRC
HPFRC
HPFRC
HPFRC
Mechanical Anchorage
HPFRC
Encased HPFRC
Mechanical
Anchorage
Encased HPFRC
Encased HPFRC
Encased HPFRC
Added Column
Added Column

194
REFERENCES
American Association of State Highway and Officials (AASHTO), “Load and Resistant Factor Design, Bridge Design Specifications,” 2003. Applied Science International (ASI), “Computer Simulation of the Alfred P. Murrah Federal Building Bombing Event, 1995,” ASI, 3221 Wellington Court, Raleigh, NC 27615, September, 2004. www.AppliedScienceInt.com. ASCE, “Design of Blast Resistant Buildings in Petrochemical Facilities,” American Society of Civil Engineers (ASCE), 1997. Astaneh-Asl, A., Jones, B., Zhao, Y, and Hwa, R., “Progressive Collapse Resistance of Steel Building Floors”, Report Number UCB/CEE-Steel-2001/03, Department of Civil and Environmental Engineering., Univ. of California, Berkeley, 2001. AT-Blast (Anti-terrorism) Version 2.0 Software, Developed by Applied Research Associates (ARA), Inc. Balaguru, P. N., and Shah, S. P., “Fiber Reinforced Cement Composites,” McGraw-Hill, New York, 1992, xii, 530 pp. Baker, W.E. “Explosions in air”, University of Texas Press, 1973. Cable News Network (CNN) “Davis defends public warning about California bridges”11/02/2001.http://archives.cnn.com/2001/US/11/02/inv.bridge.threat/index.html Chopra, A. K., “Dynamics of structures-theory and applications to earthquake engineering”, Prentice Hall, 1995.
ELS Technical Manual (Extreme Loading for Structures), Developed by Applied Science International (ASI), LLC, 3221 Wellington Court, Raleigh, NC 27615, January 2006.
Federal Highway Administration (FHWA), “Recommendations for Bridge and Tunnel Security, Blue Ribbon Panel Report” Report No. FHWA-IF-03-036, AASHTO, Washington, D.C., September 2003, p. 55. Federal Highway Administration (FHWA), “Multiyear Plan for Bridge and Tunnel Security Research, Development, and Deployment,” Publication No. FHWA-HRT-06-072, AASHTO, Washington, D.C., March 2006, p. 59. Federal Highway Administration (FHWA), “National Bridge Inventory (NBI) Report,” The National Bridge Inventory Study Foundation, 2006.

195
Fischer, G. and Li, V. C. “Effect of matrix ductility on deformation behavior of steel reinforced ECC flexural members under reversed cyclic loading conditions,” ACI Structures Journal, Vol. 99, Issue 6, 2002, pp.781-790 Fritz, C., Naaman, A., and Reinhardt, H., “SIFCON Matrix in RC Beams,” Proc., High Performance Fiber Reinforced Cement Composites, ACI, 1992.
Hackman, L. E., Farrell, M. B., and Dunham, O. O., “Slurry Infiltrated Mat Concrete (SIMCON),” Concrete International, 1992, pp 53-56. Hopkinson, B., “British Ordnance Board Minutes” 13565, 1915 Josifek, C., and Lankard, D., “SIFCON: Slurry Infiltrated Fiber Concrete,” Proc., Fiber Reinforced Concrete Int. Symposium, 1987.
Kennedy, W.D., “Explosions and Explosives in Air” NDRC, Washington DC, 1946. Kiger, S.A. and Stanley C. Woodson, “Explosion Effects and Structural Design for Blast, A Two-Day Training course” Center for Explosion Resistant Design, University of Missouri, October 2006. Lankard, R. D., “Properties, applications: Slurry infiltrated Fiber Concrete (SIFCON),” Concrete International, 1984, pp 44-47. Li, V. C., Lim, Y. M., and Chan, Y. W., “Feasibility Study of a Passive Smart Self-healing Cementitious Composites,” Composites Part B, Vol. 29B, 1998, pp. 819-827. Li, V. C., “On Engineered Cementitious Composites (ECC): A Review of the Material and Its Applications,” Journal of Advanced Concrete Technology, Japan Concrete Institute, Vol. 1, No. 3, November 2003, pp. 215-230. Mays G.C. and Smith P.D., “Blast Effects on Buildings,” Thomas Telford Publications, Thomas Telford Services Ltd, Heron Quay, London, UK, 1995. Newmark N. M., “An Engineering Approach to Blast Resistant Design,” ASCE Transactions, Vol. 121, Paper 2786, American Society of Civil Engineers, New York, NY, 1956, pp. 45-64. NSTB, “U.S. Towboat Robert Y. Love Allision With Interstate 40 Highway Bridge Near Webbers Falls, Oklahoma May 26, 2002” Highway accident report, National Transportation Safety Board, Washington D.C., 2002. Oden, J.T., “Mechanics of Elastic Structures”, McGraw Hill, New York, 1967. Oswald, C. J. and Skerhut, D. “FACEDAP User’s Manual,” Southwest Research Institute and U.S. Army Corps of Engineers, Omaha (NE) District, April 1993.

196
Parameswaran, V., Balasubramanian, K., Ramakrishnan, V., and Krishnamoorthy, T., “Toughness of Slurry Infiltrated Fibrous Concrete (SIFCON),” ACI Special Publications, SP 142-3, 1994.
Popov, E. P., “Engineering Mechanics of Solids”, Prentice Hall, New Jersey, 1990. Sundararajan, “Structural Design of Buildings and Industrial Facilities for Blast
Loads and Accidental Explosions”, American Society of Civil Engineers, New York, NY, 2007.
Tagel-Din, H., “A new Efficient Method for Nonlinear, Large Deformation and Collapse Analysis of Structures,” PhD Thesis, Civil Eng. Dept., University of Tokyo, September 1998. TM 5-1300, “Design of Structures to Resist the Effects of Accidental Explosions,” US Department of Defense, Washington DC, December 1990. TRB, “Bridge Network Security Evaluation Method” Transportation Research Board, Committee: AHD35, Washington DC, 2007.
TRB, “Workshop # 156: Bridge and Tunnel Security” Transportation Research Board (TRB) 87th Annual Meeting, Washington DC, 2008.
USC_RC program, Asad Esmaeily, University of Southern California. Wassef, W. G., Smith, C., Clancy, C. M., and Smith, M. J., “Comprehensive Design Example for Prestressed concrete (PSC) Girder Superstructure Bridge with Commentary” submitted to FHWA NHI - 04-043, 2003, pp. 381. Williamson, E.B., and Winget, D.G., “Risk Management and Design of Critical Bridges for Terrorist Attacks,” Journal of Bridge Engineering, Vol. 10, No. 1, January 2005, pp. 96-106. Zia P., Leming M.L., and Ahmad S.H., “High Performance Concretes: A State-of-the-art Report (1989-1994),” FHWA-RD-97-030, 1991

197
CURRICULUM VITA
Yahia M. Tokal-Ahmed
EDUCATION: 2009 Ph.D. Civil and Environmental Engineering, Rutgers University, New Jersey
2005 M.S. Structural Engineering, Lawrence Technological University, Michigan
2002 B.S. Civil and Environmental Engineering, Cairo University, Egypt
PUBLICATIONS: Yahia Tokal and Husam Najm, “Bridge Protection Measures for Blast Loading,” submitted to ASCE Journal of Bridge Engineering for review, 2008
Yahia Tokal and Husam Najm, “Response of Bridge Structures Subjected to Blast Hazards,” submitted to ASCE Journal of Structural Engineering for review, 2008
Grace, N., Enomoto, T., Tokal, Y., Abdelmohti, A., “Flexural Behavior of Precast Concrete Box Beams Post-tensioned with Unbonded Carbon Fiber Composite Cables,” PCI Journal, July-August 2008
Y. Tokal and H. Najm, “Protecting Bridges against Blast Loads,” Bridge Engineering association, New York City Bridge Conference, August, 2007
Grace, N., Abdelmohti, Tokal, Y., A., “Use of CFRP-DCI/CFCC/Steel in Prestressed Box Beam Bridges,” submitted to ACI Journal for review, 2006
Yahia Tokal, “Flexural Response of Box Beam Bridges Prestressed using Carbon Fiber Composite Cables (CFCC),” Masters Thesis, Lawrence Technological University, Southfield, MI, December 2005
Grace, N., Singh, S., Tokal, Y., “Development of CFCC Reinforced and Prestressed Box Beam Highway Bridges,” Final Report, Submitted to Tokyo Rope. Co. Ltd, Japan, 2005