© 2013 by ashwin vasant jadhav - illinois: ideals home
TRANSCRIPT

© 2013 by Ashwin Vasant Jadhav

MODELING OF GROUND OPERATIONS USING END-AROUND (PERIMETER)
TAXIWAYS FOR THE MODERNIZED CHICAGO O‟HARE INTERNATIONAL AIRPORT
BY
ASHWIN VASANT JADHAV
THESIS
Submitted in partial fulfillment of the requirements
for the degree of Master of Science in Aerospace Engineering
in the Graduate College of the
University of Illinois at Urbana-Champaign, 2013
Urbana, Illinois
Adviser:
Associate Professor Cedric Langbort

ii
Abstract
By 2031, U.S. air carriers are projected to transport 1.3 billion passengers within the U.S.
National Airspace System, with system capacity projected to increase an average of 3.6 percent
per year (FAA Aerospace Forecasts 2011-2031). Through the Next Generation Air Transport
System project, a comprehensive overhaul of the airspace infrastructure is envisaged which
includes major hub airports like Chicago‟s O‟Hare International Airport (ORD). Constantly
affected by delays, incursions and capacity constraints, the risks of the airport layout
modifications at ORD after completion of the O‟Hare Modernization Program (OMP) have been
identified in this thesis. Further, the use of perimeter or end-around taxiways (EAT) have been
tested in ARENA© using a full-scale post-OMP airport layout of ORD. Impacts on safety,
runway occupancy times and overall airport efficiency in future high traffic scenarios have been
analyzed. Results show that the implementation of EATs will drastically reduce the potential for
incursions with a 15-25 percent increase in global-level airport taxi-times. While the significant
rise in taxi-times can be considered as a drawback of EATs, it can be argued that the
improvement in safety levels compensate for it.

iii
Acknowledgements
I would like to thank Prof. Cedric Langbort for his consistent support in the progress and
completion of this thesis. His patient, constructive and prompt correspondence via email has
played a pivotal role in molding this document. Apart from the thesis, he has steadily guided me
through academic minefields and helped me recover from tumultuous situations in my post-
graduate program.
I would also like to convey my sincere thanks to Prof. Philippe Geubelle for his leadership
and coordination throughout my academic and thesis phases. Without a second chance from him,
I wouldn‟t have had an opportunity to improve my academic career.
Many thanks to Prof. Natasha Neogi, who offered me this thesis problem, giving me a portal
into air traffic management. On a similar note, I would like to thank Prof. Terry Von Thaden,
who provided me with a perfect platform of aviation studies and accident investigation. Without
the guidance of Prof. Neogi and Prof. Von Thaden, my transition from academia to the aviation
industry would not have been possible.
I would like to thank my family back home in India and my friends in Champaign for
standing by me through tough times - my wife, Pragni, in particular, who was my girlfriend when
I started writing this thesis.
To conclude, I thank my employees at the International Air Transport Association for their
support, the staff at the Federal Aviation Administration for their help with database access and
working papers and finally the ground operations personnel at O‟Hare International Airport for
their advice and input.
iv
Table of Contents
LIST OF FIGURES, TABLES AND ALGORITHMS ...................................................................... VII
ACRONYMS ........................................................................................................................................ IX
CHAPTER 1 ........................................................................................................................................... 1
INTRODUCTION .................................................................................................................................. 1
1.1. The National Airspace System .................................................................................................... 1
1.2. The Next Generation Air Transportation System ........................................................................ 3
1.3. Large Hub Airports ..................................................................................................................... 6 1.3.1. Delays .................................................................................................................................... 7 1.3.2. Capacity ................................................................................................................................. 9 1.3.3. Safety ................................................................................................................................... 11
1.4. O’Hare International Airport .................................................................................................... 12 1.4.1. O’Hare Modernization Program ............................................................................................ 16 1.4.2. Thesis Objective and Organization ........................................................................................ 18
CHAPTER 2 ......................................................................................................................................... 20
BACKGROUND AND METHODOLOGY ......................................................................................... 20
2.1. Background .............................................................................................................................. 20
2.2. Runway Incursions ................................................................................................................... 22
2.3. Hot-Spots ................................................................................................................................. 24
2.4. End-Around Taxiways (EATs) .................................................................................................... 26 2.4.1. Best Practices ....................................................................................................................... 27 2.4.2. Limitations ........................................................................................................................... 29
CHAPTER 3 ......................................................................................................................................... 30
THEORETICAL AND EXPERIMENTAL SETUP ............................................................................ 30
3.1. Taxi-Time ................................................................................................................................. 30
3.2. Path Selection .......................................................................................................................... 31

v
3.3. Aircraft Categories ................................................................................................................... 31
3.4. Aircraft Movement Speeds ....................................................................................................... 32
3.5. Separation Standards ............................................................................................................... 32
3.6. Conflict Scenarios ..................................................................................................................... 34
3.7. O’Hare Setup ............................................................................................................................ 35 3.7.1. Air Traffic Flow ..................................................................................................................... 35 3.7.2. Ground Traffic Flow with EATs .............................................................................................. 36
CHAPTER 4 ......................................................................................................................................... 39
SIMULATION ...................................................................................................................................... 39
4.1. Software................................................................................................................................... 39
4.2. Modules ................................................................................................................................... 40 4.2.1. Flowchart Modules ............................................................................................................... 40 4.2.2. Data modules ....................................................................................................................... 42 4.2.3. Distribution .......................................................................................................................... 43
4.3. Model Architecture .................................................................................................................. 44 4.3.1. Create/Assign Logic .............................................................................................................. 44 4.3.2. Approach/Arrival Logic ......................................................................................................... 46 4.3.3. Taxi Logic (Arrival) ................................................................................................................ 47 4.3.4. Gate Logic ............................................................................................................................ 48 4.3.5. Taxi Logic (Departure) .......................................................................................................... 49 4.3.6. Departure/Ascent Logic ........................................................................................................ 49
4.4. Model Validation...................................................................................................................... 50 4.4.1. Input Parameters ................................................................................................................. 50 4.4.2. Validation Results ................................................................................................................. 50
4.5. Main Simulation ....................................................................................................................... 51 4.5.1. Input Parameters ................................................................................................................. 52 4.5.2. Entity Transit ........................................................................................................................ 52 4.5.3. Summary of Computation..................................................................................................... 58
CHAPTER 5 ......................................................................................................................................... 60
RESULTS AND DISCUSSION ............................................................................................................ 60
5.1. Local-Level Taxi-Time Comparison............................................................................................ 60 5.1.1. Concept................................................................................................................................ 60 5.1.2. Method ................................................................................................................................ 60 5.1.3. Results ................................................................................................................................. 61 5.1.4. Conclusion ........................................................................................................................... 61
5.2. Global-Level Taxi-Time Comparison ......................................................................................... 62
vi
5.2.1. Concept................................................................................................................................ 62 5.2.2. Method ................................................................................................................................ 62 5.2.3. Results ................................................................................................................................. 63 5.2.4. Conclusion ........................................................................................................................... 64
5.3. Runway Occupancy Time.......................................................................................................... 64 5.3.1. Concept................................................................................................................................ 64 5.3.2. Method ................................................................................................................................ 64 5.3.3. Results ................................................................................................................................. 65 5.3.4. Conclusion ........................................................................................................................... 66
5.4. Conflict Analysis ....................................................................................................................... 66 5.4.1. Concept................................................................................................................................ 66 5.4.2. Method ................................................................................................................................ 67 5.4.3. Results ................................................................................................................................. 67 5.4.4. Conclusion ........................................................................................................................... 69
CHAPTER 6 ......................................................................................................................................... 70
SUMMARY AND FUTURE WORK ................................................................................................... 70
6.1. Summary of Results.................................................................................................................. 70 6.1.1. Advantages: ......................................................................................................................... 70 6.1.2. Disadvantages ...................................................................................................................... 71 6.1.3. Conclusion ........................................................................................................................... 71
6.2. Future Research ....................................................................................................................... 72
BIBLIOGRAPHY................................................................................................................................. 73

vii
List of Figures, Tables and Algorithms
Figure 1.1: The United States’ National Airspace System ....................................................................................... 1
Figure 1.2: Historical and forecasted passenger enplanements in the U.S. NAS..................................................... 2
Figure 1.3: Capacity constrained airports and regions in 2015 ............................................................................... 4
Figure 1.4: Large Hubs in the National Airspace System ....................................................................................... 7
Figure 1.5: Breakdown of all commercial aviation delays in the U.S. for the calendar year 2011 .......................... 8
Figure 1.6: Projected number of new aircraft in North America by 2030 .............................................................. 9
Figure 1.7: Number of long-haul routes worldwide .............................................................................................. 10
Figure 1.8: Airport improvements planned until 2018 .......................................................................................... 11
Figure 1.9: Total number of Runway Incursions per Fiscal Year ......................................................................... 12
Figure 1.10: Operations and Delay Statistics at O’Hare as of August 2011 .......................................................... 13
Figure 1.11: The present airport layout at Chicago O’Hare – October 2010 ........................................................ 14
Figure 1.12: Forecasted enplanements per year at Chicago O’Hare airport till 2025. ......................................... 15
Figure 1.13: Number of delays at ORD as a percentage of NAS delays ................................................................ 16
Figure 1.14: The new Airfield Layout at Chicago O’Hare .................................................................................... 17
Figure 2.1: Incursions at major airports 2004-2008 .............................................................................................. 23
Figure 2.2: (a) NACO airport diagram of ORD emphasizing the incursion hot spots .......................................... 25
Figure 2.2: (b) Magnified view of the highlighted (red) sub-section from Fig. 2.3 (a) ........................................... 25
Figure 2.3: End-Around Taxiway screenshot at ORD acquired from a NASA simulation ................................... 26
Figure 2.4: (a) Runway Incursion Statistics for DFW between December 2007 and March 2009 ........................ 28
Figure 2.4: (b) The EAT at DFW with tail height specifications ........................................................................... 28
Table 3.1: Separation standards for arriving aircraft during the simulation ....................................................... 33
Table 3.2: Separation standards for departing aircraft during the simulation ..................................................... 33
Figure 3.1: The different types of possible conflicts due to loss of separation between aircraft on the ground .... 34
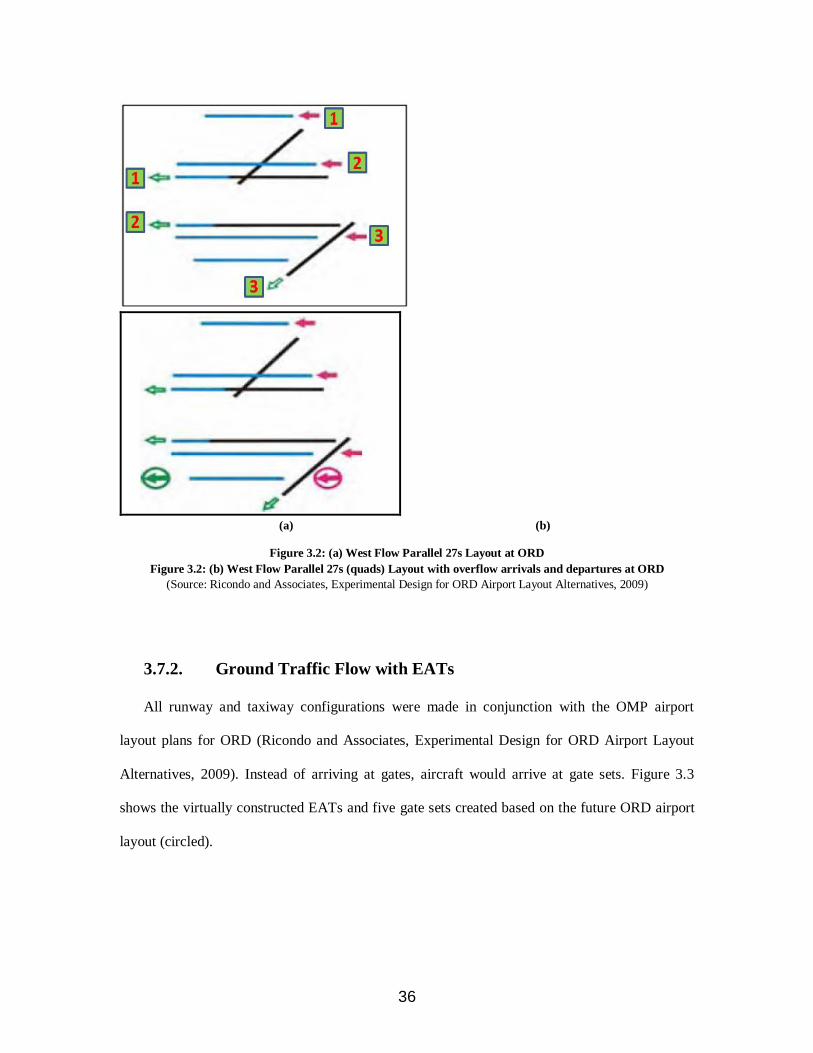
Figure 3.2: (a) West Flow Parallel 27s Layout at ORD ......................................................................................... 36
Figure 3.2: (b) West Flow Parallel 27s (quads) Layout with overflow arrivals and departures at ORD .............. 36
Figure 3.3: The post-OMP airport layout of ORD highlighting the locations of the EATs and the gate-sets ....... 37
Figure 4.1: The probability mass function for a Poisson distribution ................................................................... 44
Figure 4.2: The process flowchart for create/assign logic...................................................................................... 45
Figure 4.3: The process flowchart for approach/arrival logic ............................................................................... 46

viii
Figure 4.4: The process flowchart for a part of the taxi logic ............................................................................... 47
Figure 4.5: The process flowchart for gate logic ................................................................................................... 49
Table 4.1: Comparison of various taxi-time elements used for the model validation............................................ 51
Algorithm 1: The Process Algorithm Comprising of all phases and logical operations in the ORD simulation
with the modified EAT layout using ARENA© ..................................................................................................... 56
Figure 5.1: Origin and end points used to conduct the local-level taxi-time comparisons (from figure 3.3) ......... 61
Figure 5.2: Results of the local-level benchmarking depicting average taxi-times ................................................ 61
Figure 5.3: Results of the global-level arrival taxi-times during the simulation ................................................... 63
Figure 5.4: Results of the global-level departure taxi-times during the simulation .............................................. 63
Figure 5.5: The runway occupancy percentages for all arrival and departure runways ...................................... 65
Figure 5.6: Breakdown of all conflicts that occurred during the simulation by type ............................................ 68
Figure 5.7 (a): Breakdown of total intersection conflicts by airfield location ....................................................... 68
Figure 5.7 (b): Breakdown of total queue conflicts by airfield location ................................................................ 69
ix
Acronyms
AOSC Airport Obstruction Standards Committee
ASDE-X Airport Surface Detection Equipment – Model X
ASIAS Aviation Safety Information Analysis and Sharing
ATC Air Traffic Control
ATL Hartsfield-Jackson International Airport
BTS Bureau of Transportation Statistics
CAASD Center for Advanced Aviation System Development
CPS Constrained Position Shifting
CVQ Collaborative Virtual Queue
DEPARTS Departure Enhanced Planning and Runway/Taxiway Assignment System
DFW Dallas Fort-Worth Airport
DOT Department of Transportation
EAT End-Around Taxiway
FAA Federal Aviation Administration
FAROS Final Approach Runway Occupancy Signal
FCFS First-Come-First-Served
FY Fiscal Year
GAO Government Accountability Office
GPS Global Positioning System
JPDO Joint Planning and Development Office
HS Hot-Spot
IAH George Bush International Airport
IATA International Air Transport Association

x
ICAO International Civil Aviation Organization
LAX Los Angeles International Airport
MIA Miami International Airport
MILP Mixed Integer Linear Programming
MIT Massachusetts Institute of Technology
NACO National Aeronautical Charting Office
NAS National Airspace System
NASA National Aeronautics and Space Administration
Next Gen Next Generation Air Transport System
NM Nautical Mile
OAG Official Airline Guide
OMP O‟Hare Modernization Program
ORD O‟Hare International Airport
ROT Runway Occupancy Time
SRMD Safety Risk Management Document
SWIM System-Wide Information Management
U.S. United States
1
Chapter 1
Introduction
1.1. The National Airspace System
The United States‟ National Airspace System (NAS) is the network of United States (U.S.)
airspace: air navigation facilities, equipment, services, airports or landing areas, aeronautical
charts, information, regulations, procedures, material and manpower (FAA, Handbook 8083-15A
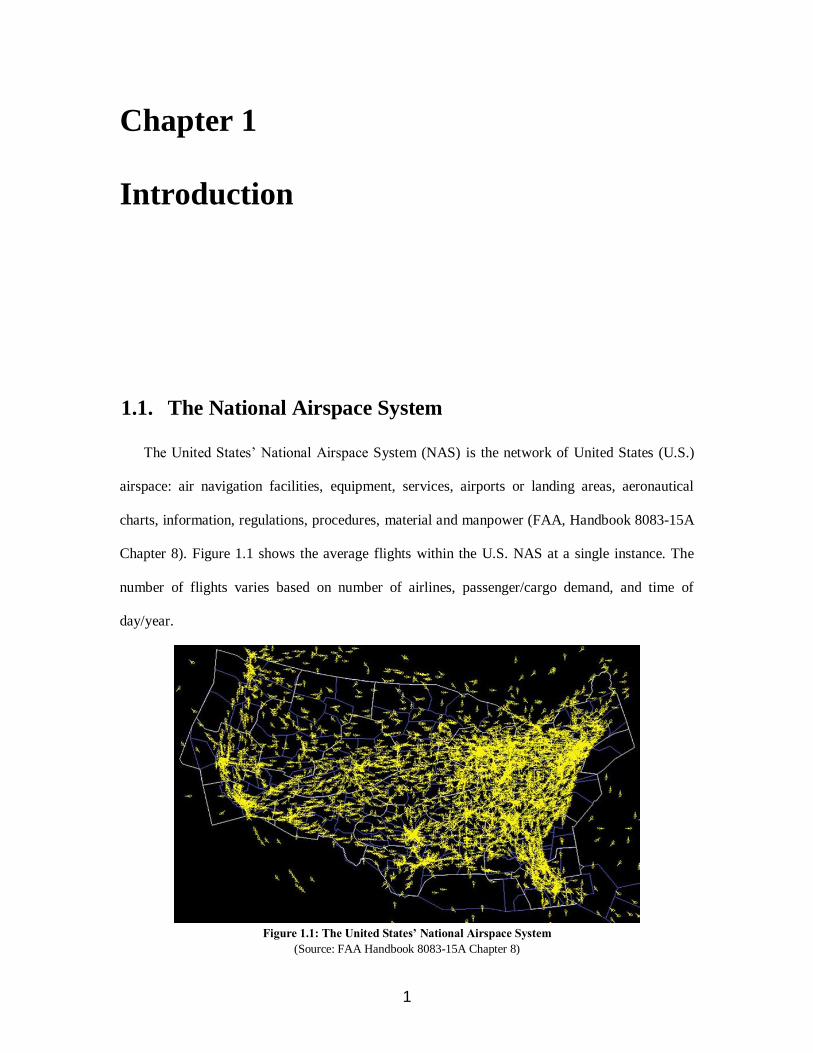
Chapter 8). Figure 1.1 shows the average flights within the U.S. NAS at a single instance. The
number of flights varies based on number of airlines, passenger/cargo demand, and time of
day/year.
Figure 1.1: The United States’ National Airspace System
(Source: FAA Handbook 8083-15A Chapter 8)
2
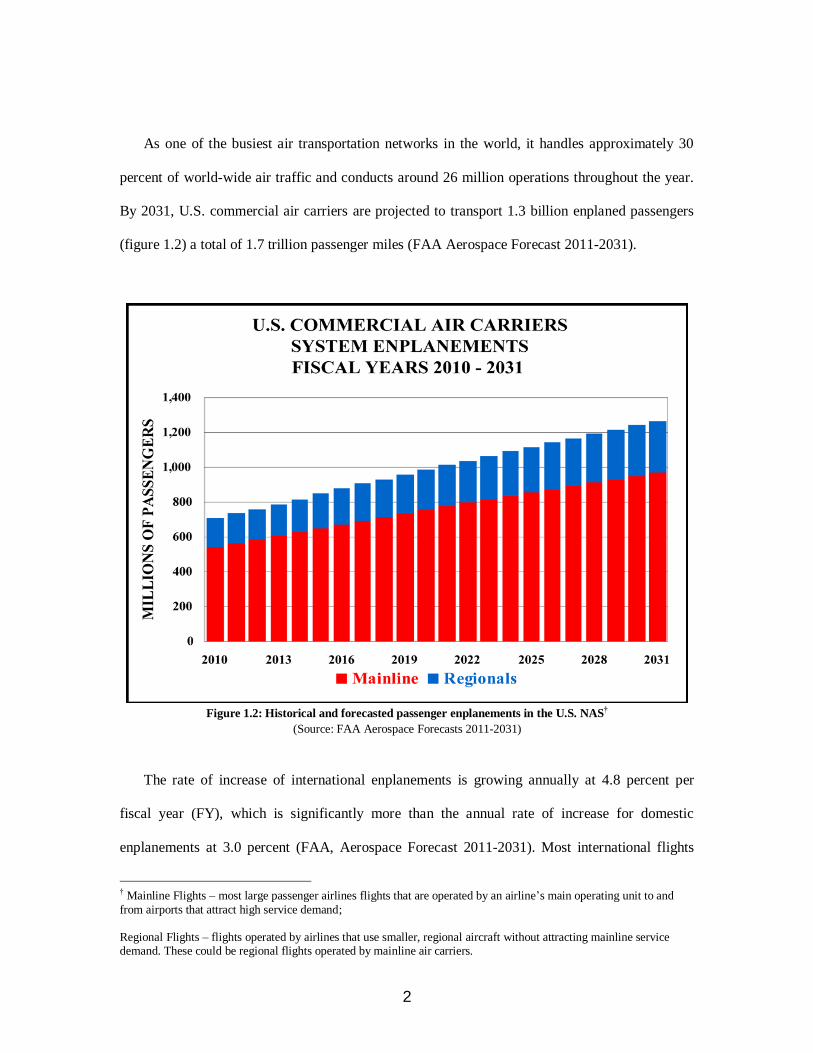
As one of the busiest air transportation networks in the world, it handles approximately 30
percent of world-wide air traffic and conducts around 26 million operations throughout the year.
By 2031, U.S. commercial air carriers are projected to transport 1.3 billion enplaned passengers
(figure 1.2) a total of 1.7 trillion passenger miles (FAA Aerospace Forecast 2011-2031).
Figure 1.2: Historical and forecasted passenger enplanements in the U.S. NAS
†
(Source: FAA Aerospace Forecasts 2011-2031)
The rate of increase of international enplanements is growing annually at 4.8 percent per
fiscal year (FY), which is significantly more than the annual rate of increase for domestic
enplanements at 3.0 percent (FAA, Aerospace Forecast 2011-2031). Most international flights
† Mainline Flights – most large passenger airlines flights that are operated by an airline‟s main operating unit to and
from airports that attract high service demand; Regional Flights – flights operated by airlines that use smaller, regional aircraft without attracting mainline service demand. These could be regional flights operated by mainline air carriers.
3
utilize large hub airports within the NAS. These airports face the biggest challenge to meet the
increasing traffic and passenger demands.
To address these demands, the United States‟ Congress established the Joint Planning and
Development Office (JPDO), which is comprised of members from different departments
including the Department of Transportation (DOT), the Federal Aviation Administration (FAA)
and the National Aeronautics and Space Administration (NASA). The objective of this taskforce
is to prepare the NAS for the high volume of traffic whilst improving safety, security and
reliability. The product of these efforts will be a new era of air traffic control (ATC) systems and
infrastructure within the NAS known as The Next Generation Air Transportation System (Next
Gen).
1.2. The Next Generation Air Transportation System
Next Gen is an umbrella term for the ongoing, comprehensive transformation of the NAS. At
its most basic level, Next Gen represents an evolution from a ground-based system of ATC to a
satellite-based system of air traffic management. The progress of Next Gen relies upon the
development of aviation-specific applications for existing, widely-used technologies, such as the
Global Positioning System (GPS) and technological innovation in areas such as weather
forecasting, data networking and digital communications. Hand in hand with state-of-the-art
technology will be new airport infrastructure and new procedures, including the shift of certain
decision-making responsibility from the ground to the cockpit. The implementation of Next Gen
will result in fewer delays, reduced taxi-times and holding in the air, with more flexibility to get
around weather problems at capacity constrained airports.

4
Measuring the 2007 capacity against the forecast for the 2015 (figure 1.3) mid-term planning
period revealed that 18 airports and seven metropolitan areas are projected to require additional
capacity if the existing airfield configurations remained constant without any capacity
enhancements (MITRE, Capacity Needs in the National Airspace System 2007-2025). If the
existing airfield configurations remain constant without any capacity improvements by 2025, 27
airports and 15 metropolitan areas are forecasted to require additional capacity (MITRE, Capacity
Needs in the National Airspace System 2007-2025).
Figure 1.3: Capacity constrained airports and regions in 2015 (MITRE, Capacity Needs in the National Airspace System 2007-2025)
5
From an airport development perspective, the targets of Next Gen have been identified as
(FAA, Next Gen Implementation Plan, 2010):
Information Sharing: Improving data-management by getting the right information to
the right person at the right time using system-wide information management (SWIM‡).
This will be a key component during ground operations;
Environmental Impact: Reducing aviation‟s impact on the environment through quieter,
cleaner and more fuel-efficient flights;
Increased Safety: Enhancing safety through proactive methods and preventing accidents
with advanced safety management to better predict, identify and resolve hazards;
Infrastructure: Adding design flexibility and making better use of ground infrastructure
through airport development (runways, taxiways, etc.) and advanced navigational ground
aids (such as the Airport Surface Detection Equipment – Model X (ASDE-X§), Final
Approach Runway Occupancy Signal (FAROS**
), etc.)
Although, Next Gen involves the overhaul of the ATC system, airport-centric improvements
will maximize its near-term and long-term benefits. Next Gen begins and ends at the airport
(FAA, Next Gen Implementation Plan, 2010), which has made airport development a key factor
in its success, especially at large hubs.
‡ SWIM is the network structure that will carry Next Gen digital information. SWIM will enable cost-effective, real-
time data exchange and sharing among users of the NAS [FAA].
§ ASDE-X is a surveillance system using radar and satellite technology that allows air traffic controllers to track
surface movement of aircraft and vehicles to help avoid incursions [FAA]
** FAROS is a technology designed to prevent accidents and incursions on airport runways by activating a flashing
light visible to the pilot of an approaching aircraft to warn that the runway being approached is occupied and hazardous [FAA]

6
1.3. Large Hub Airports
The airports in the U.S. are classified into (FAA Airport Planning and Capacity website,
2011):
1) Commercial Airports - publicly owned airports that have at least 2,500 passengers
boarding each calendar year and receive scheduled passenger service. They are further
classified into:
Primary Airports – having more than 10,000 passengers boarding each year;
Non-Primary Airports – having 2,500 to 10,000 passengers boarding each year;
2) Cargo Service Airports – that, in addition to any other air transportation services that may
be available, are served by aircraft providing air transportation of only cargo with a total
annual landed weight of more than 100 million pounds;
3) Reliever Airports - designated by the FAA to relieve congestion at Commercial Service
Airports and to provide improved general aviation access to the overall community.
The remaining airports, while not specifically defined by the FAA, are commonly described as
General Aviation Airports.
Primary commercial airports are further categorized into the following by the percentage of
passenger enplanements annually within the U.S. (FAA Airport Planning and Capacity website,
2011):
Non-hub airports – Less than 0.05 percent passengers;
Small Hub Airports – At least 0.05 percent but less than 0.25 percent;
Medium Hub Airports – At least 0.25 percent but less than 1 percent;
Large Hub Airports – More than 1 percent.
7
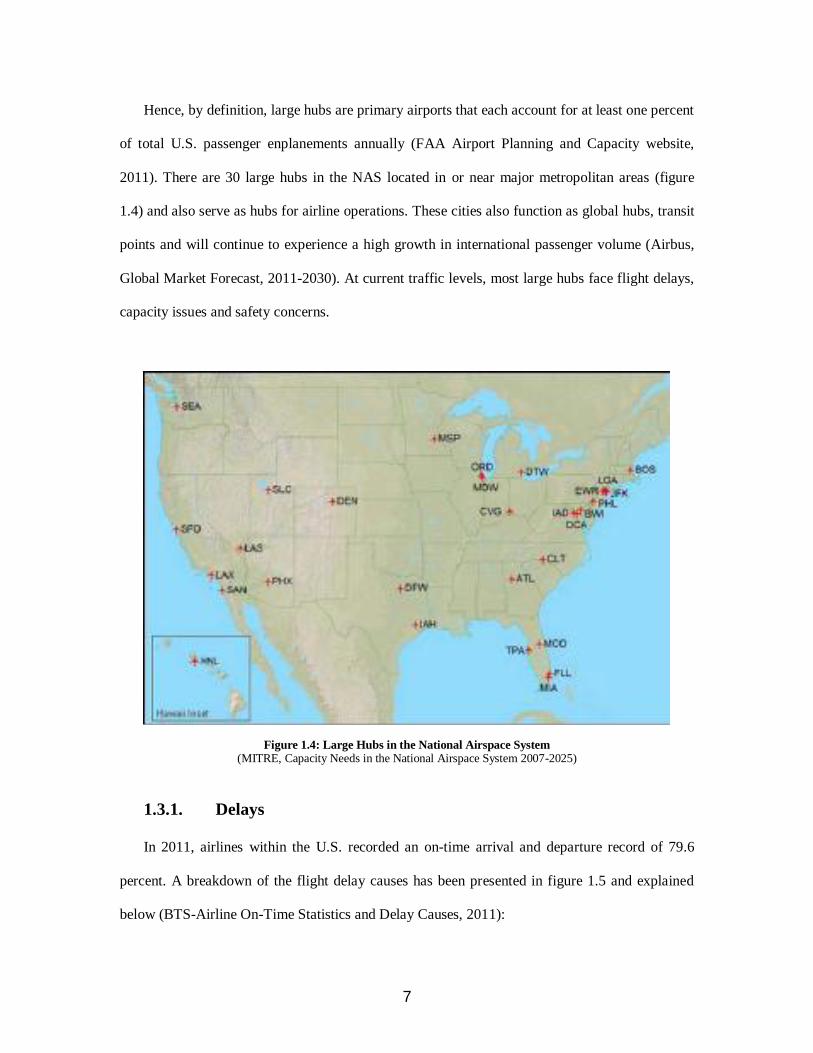
Hence, by definition, large hubs are primary airports that each account for at least one percent
of total U.S. passenger enplanements annually (FAA Airport Planning and Capacity website,
2011). There are 30 large hubs in the NAS located in or near major metropolitan areas (figure
1.4) and also serve as hubs for airline operations. These cities also function as global hubs, transit
points and will continue to experience a high growth in international passenger volume (Airbus,
Global Market Forecast, 2011-2030). At current traffic levels, most large hubs face flight delays,
capacity issues and safety concerns.
Figure 1.4: Large Hubs in the National Airspace System (MITRE, Capacity Needs in the National Airspace System 2007-2025)
1.3.1. Delays
In 2011, airlines within the U.S. recorded an on-time arrival and departure record of 79.6
percent. A breakdown of the flight delay causes has been presented in figure 1.5 and explained
below (BTS-Airline On-Time Statistics and Delay Causes, 2011):

8
Approximately 32 percent flights were delayed because the aircraft arrived late, i.e.
the previous flight with same aircraft arrived late causing the present flight to depart
late. Since, delays due to this phenomenon tend to ripple through the NAS, it is
commonly known as the „Ripple Delay Effect‟.
Almost 30 percent flights were delayed due to aviation system delays (such as non-
extreme weather conditions, runway closures, heavy traffic volume, and air traffic
control).
Exactly 26 percent flights were delayed due to air carrier delay (circumstances within
the airline's control such as maintenance or crew problems, aircraft cleaning, baggage
loading, fueling),
Around 10 percent of the delays were attributed to cancelled or diverted flights while
the remaining 3 percent were due to weather and security.
Figure 1.5: Breakdown of all commercial aviation delays in the U.S. for the calendar year 2011
(Source: BTS- Airline On-Time Statistics and Delay Causes, 2011)
The „Ripple Delay Effect‟ and the NAS delays account for more than 60 percent of all
commercial aviation delays (figure 1.5). Hub-to-hub analyses of flights from Chicago O‟Hare
9
international airport (ORD) to Hartsfield-Jackson Atlanta International Airport (ATL) have
revealed how local and system level factors combine to affect components of delay (Laskey et al.,
2008). These components contribute to the final arrival delay at the destination airport, thereby
delaying the aircraft for its next leg of flight. Therefore, improvements at the most congested hub
airports will have a positive impact on other hub airports as well.
From strictly an airport perspective, several factors have an impact on delays: runway
configurations, taxiway design, traffic density, etc. Their impact is not only limited to ground
delays but also increase the probability of a missed approach, representing airport coupling
effects which need to be accounted for in the future design of metropolitan airports and high-
density operations (Gariel et al., 2011).
1.3.2. Capacity
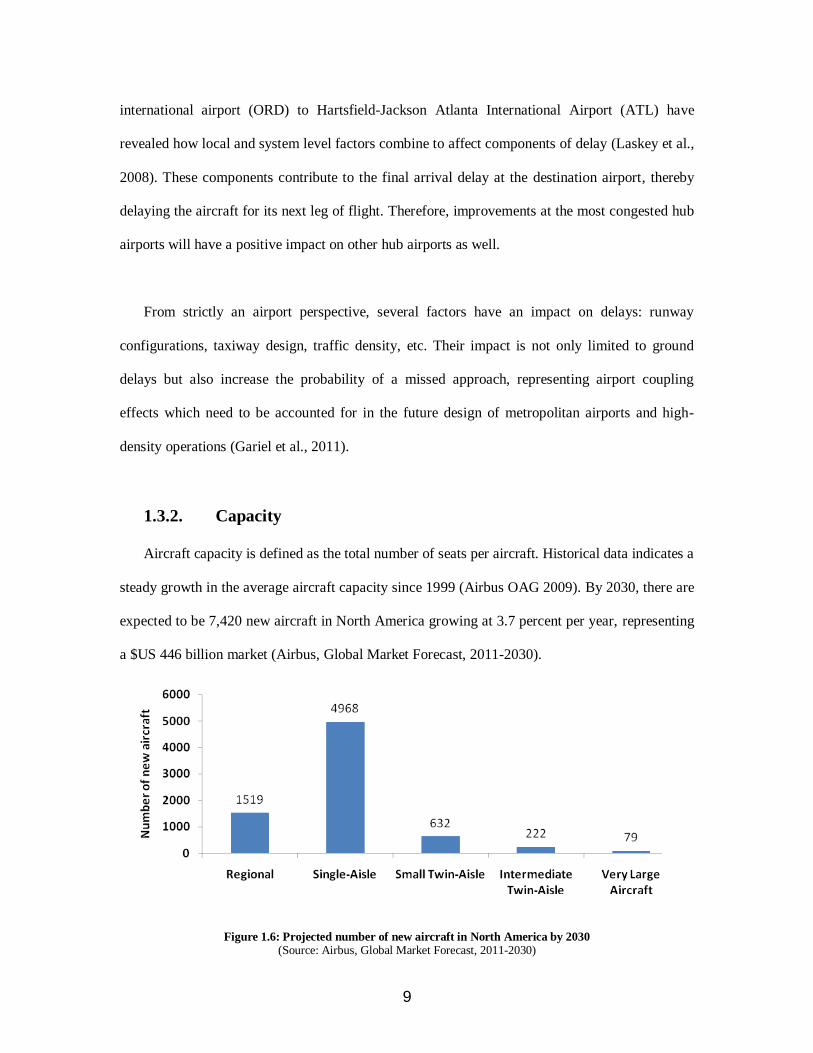
Aircraft capacity is defined as the total number of seats per aircraft. Historical data indicates a
steady growth in the average aircraft capacity since 1999 (Airbus OAG 2009). By 2030, there are
expected to be 7,420 new aircraft in North America growing at 3.7 percent per year, representing
a $US 446 billion market (Airbus, Global Market Forecast, 2011-2030).
Figure 1.6: Projected number of new aircraft in North America by 2030 (Source: Airbus, Global Market Forecast, 2011-2030)
10
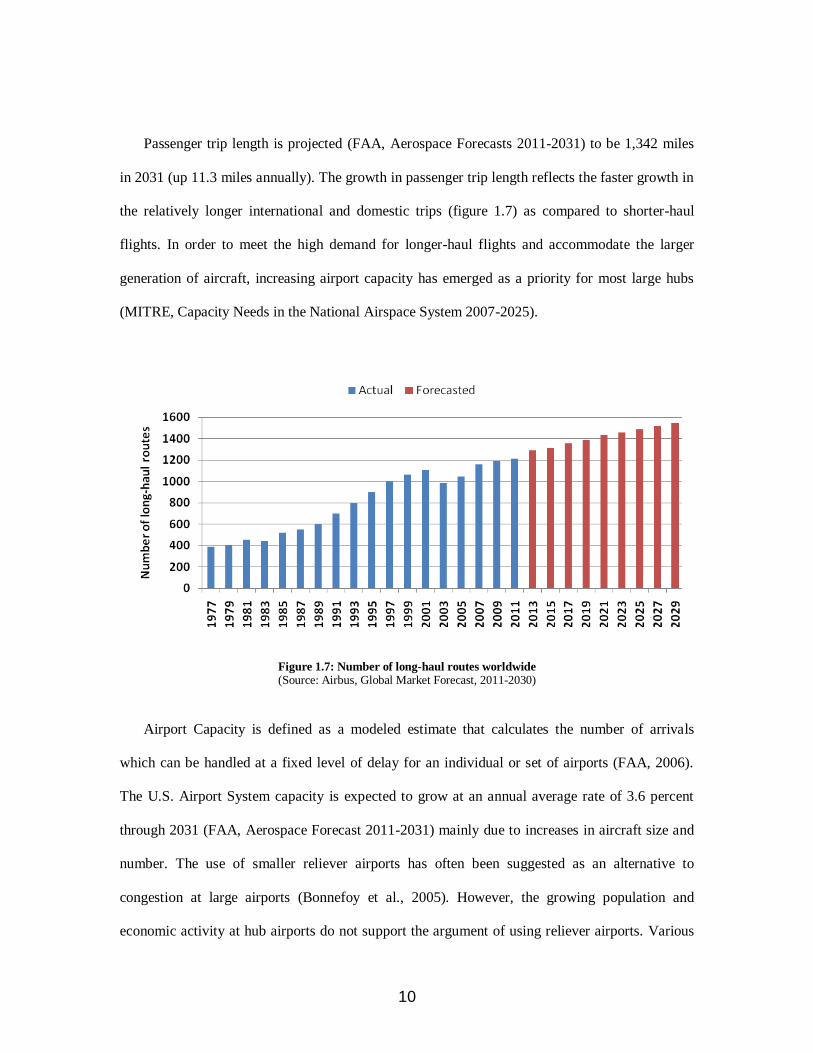
Passenger trip length is projected (FAA, Aerospace Forecasts 2011-2031) to be 1,342 miles
in 2031 (up 11.3 miles annually). The growth in passenger trip length reflects the faster growth in
the relatively longer international and domestic trips (figure 1.7) as compared to shorter-haul
flights. In order to meet the high demand for longer-haul flights and accommodate the larger
generation of aircraft, increasing airport capacity has emerged as a priority for most large hubs
(MITRE, Capacity Needs in the National Airspace System 2007-2025).
Figure 1.7: Number of long-haul routes worldwide (Source: Airbus, Global Market Forecast, 2011-2030)
Airport Capacity is defined as a modeled estimate that calculates the number of arrivals
which can be handled at a fixed level of delay for an individual or set of airports (FAA, 2006).
The U.S. Airport System capacity is expected to grow at an annual average rate of 3.6 percent
through 2031 (FAA, Aerospace Forecast 2011-2031) mainly due to increases in aircraft size and
number. The use of smaller reliever airports has often been suggested as an alternative to
congestion at large airports (Bonnefoy et al., 2005). However, the growing population and
economic activity at hub airports do not support the argument of using reliever airports. Various

11
airfield modifications have been planned until 2018 to accommodate the forecasted capacity
increase (figure 1.8).
Figure 1.8: Airport improvements planned until 2018 (FAA, Next Gen Implementation Plan, March 2010)
Most of the projects envision a modernization plan that includes the use of parallel runways.
One of the best examples that illustrate the impact of parallel runways is the fifth runway at
Hartsfield-Jackson airport, Atlanta (ATL), which opened in May 2006. Often referred to as the
most important runway in USA, it averages more than 100,000 landings and take-offs per year
(ATL website, Fifth Runway Construction Project, 2011). The runway has decreased delays at
ATL by 50 percent and the increased operational capacity is estimated to save the airline industry
$260 million a year in delay costs (ATL website, Fifth Runway Construction Project, 2011).
1.3.3. Safety
Runway incursions have been the most concerning factor in aviation safety since 2005. This
is mainly due to the steady increase in the total number of incursions between 2005 and 2008
(figure 1.9). The total number runway incursions in the NAS have not decreased significantly
since peaking in 2008.
The FAA has stated that the most probable causes for runway incursions are poor airfield
geometry, the presence of incursion Hot-Spots, lack of information exchange and lack of pilot

12
and ATC situational awareness. A detailed methodology has been presented in Chapter 2 to
understand these concepts better.
Figure 1.9: Total number of Runway Incursions per Fiscal Year
(Source: FAA Runway Incursion Statistics, 2011)
The large hub examined in this thesis is ORD, a fitting example of a large hub in the NAS
plagued with delays, capacity and safety issues. It is ranked in the top five airports in the U.S. for
number of runway incursions and worst on-time performance (FAA, ASPM database, 2011).
Facing a high annual rate of growth of passengers in the next decade (BTS, T-100 market, 2010),
it will be crucial for ORD to increase capacity while focusing on reducing the incursion rate.
1.4. O’Hare International Airport
Located in one of the largest metropolitan cities in the U.S., ORD caters to over 30 million
passengers every year (FAA, ASPM database, 2011). It has been ranked consistently in the top
five large hubs in the U.S. in the past decade (BTS, T-100 market, 2010). Traffic statistics at
ORD between 2009 and 2011 indicate that over 128,000 flight operations††
were conducted every
††
A single flight operation is defined as “the airborne movement of aircraft in controlled or noncontrolled airport
terminal areas, and counts at en route fixes or other points where counts can be made”. (FAA, 14 CFR 170.3)

13
year with average delays (arrival and departure) of 20 percent (FAA, ASPM database, 2011).
Figure 1.10 shows the arrival and departure delays with respect to the number of operations
conducted at ORD from 2002 to 2011. The data for the calendar year 2011 is projected. The
airport has had the lowest percentage of on-time arrivals in the NAS since 2006, with almost 70
percent of these delays due to volume, equipment and airport inadequacies (City of Chicago
website, O‟Hare Modernization Program, 2011).
Figure 1.10: Operations and Delay Statistics at O’Hare as of August 2011 (Source: FAA ASPM database, 2011)
O‟Hare airport not only has a reputation of repeatedly recording one of the worst on-time
performances in the NAS, but also the highest number of runway incursions over the past decade
(FAA, Aviation Safety Information Analysis and Sharing (ASIAS) system, 2011). Its complex
taxiway layout, number of runway intersections, hot-spots and round-the-clock traffic congestion

14
all contribute to low safety levels (City of Chicago website, O‟Hare Modernization Program,
2011).
Figure 1.11: The present airport layout at Chicago O’Hare – October 2010 (Source: City of Chicago, OMP website, 2011)

15
Figure 1.12: Forecasted enplanements per year at Chicago O’Hare airport till 2025.
(Source: Ricondo and Associates, Experimental Design for ORD Airport Layout Alternatives, 2009)
Forecasts suggest that the number of enplanements at ORD will reach almost 50 million per
year by 2025 (figure 1.12) (Ricondo and Associates, 2009). The high demand of domestic and
international passengers is due to the following:
The geographical location of ORD within the U.S. – It is one of the largest airports in
the central part of the country and acts as a transit point for cross-country and
international flights;
The proximity to one of the largest population densities within the U.S. – the Chicago
area, which the largest city in the Midwest and also the commercial capital of the
central part of the country;
The hub for United-Continental Airlines – one of the biggest airlines in the world in
terms of number of passengers transported per year and number of aircraft in its fleet
(International Air Transport Association (IATA), 2011). The airline is expected to
expand its fleet, increase frequency of flights through the country and increase code-
sharing with international airlines (IATA, 2011).

16
In order to ensure that the increased traffic levels of the future are not subjected to the low
level of safety, immediate action is required. Hence, the FAA has undertaken the expansion and
redevelopment of the airport called the O‟Hare Modernization Program (OMP).
1.4.1. O’Hare Modernization Program
ORD delays cause a ripple effect throughout the entire air traffic system. The number of
delays at ORD as a function of the total NAS delays peaked in 2004. Following improvements at
some major airports, the delays remained close to an average of 6 percent. But since 2009, the
trend of increases in delays is similar to the early 2000s, when traffic began to exponentially
increase (figure 1.13).
Figure 1.13: Number of delays at ORD as a percentage of NAS delays (Source: BTS-Flight Delays at a Glance, 2011)
The OMP, an integral part of the Next Gen plan, is the city of Chicago‟s proposal to realign
three existing runways, extend two existing runways, and construct one new runway at O‟Hare.
This will result in an eight-runway configuration consisting of six parallel east/west runways and

17
two crosswind runways (figure 1.14). Overall delays will be reduced by 66 percent, and the
annual operational capacity will be increased from 974,000 to 1,194,000 aircraft operations (City
of Chicago website, O‟Hare Modernization Program, 2011).
Figure 1.14: The new Airfield Layout at Chicago O’Hare (Source: City of Chicago OMP website, 2011)
There have been certain negative observations about this project. The Del Balzo Report
(Hinson D, Howe J, 2011) suggests that the addition of runways will add to the delays and
increase bottle-necks. ORD is currently ranked first amongst all U.S. airports based on total
number of runway incursions (FAA, ASIAS system, 2011). It is claimed that the OMP will result
in fewer active runway crossings in the middle third of the runway than the current airfield (City
18
of Chicago OMP website, 2011). However, comparisons between the old and new airport
configurations reveal that multiple incursion Hot-Spots will prevail (discussed in section 2.3).
1.4.2. Thesis Objective and Organization
From a safety perspective, the use of perimeter taxiways or End-Around taxiways (EATs) at
ORD has been suggested and modeled in this thesis. In order to determine the effectiveness of
this strategy for ORD, and to benchmark this proposed taxiway configuration, a full-scale
simulation of modernized O‟Hare has been conducted. The thesis will aim to answer the
following questions:
Will the new OMP layout increase or decrease the number of incursion Hot-Spots,
thereby affecting the safety levels?
Would implementation of EATs be a feasible option to avert potential incursion
scenarios?
What will be the impact of EATs at ORD in future high traffic load scenarios on
o Local-level taxi-times
o Global-level taxi-times
o Runway Occupancy Times
o Incursions or conflicts
This thesis has been organized as follows: In Chapter 1, we have been introduced to the NAS,
large hub airports and taken a closer look at the OMP as an integral part of the Next Gen
program. Chapter 2 provides a background of research conducted in ground operations modeling
at airports. Further, the concepts of runway incursions, hot spots and EATs have been reviewed.
Chapter 3 discusses ground movement theory, explaining the premise of each parameter used in
the simulation. Chapter 4 explains the simulation, with an introduction to the software used to
19
model the ground operations at ORD. The simulation setup is discussed in detail using flowchart
modules and a sample algorithm is provided. Chapter 5 presents the results of the simulation,
including taxi-time comparisons, runway occupancy analysis and conflict assessment. Chapter 6
concludes the thesis, summarizing the simulation and the results. Future research directions have
also been outlined.

20
Chapter 2
Background and Methodology
2.1. Background
Since 1985, when capacity and delays were projected due to traffic increase, many
theoretical and simulation-based models have been created to examine airport efficiency. Most of
these models, however, have focused on individual aspects of operations dynamics. Arrival
planning has been one such unit where considerable research has been conducted towards
analysis of separation and throughput (Ignaccolo, 2003) (Ren, 2008). The Constrained Position
Shifting (CPS) system or sequencing of like-category aircraft together during approach
(Balakrishnan, 2006) (Harikiopoulo, 2010) is considered to be the preferred solution to optimal
arrivals on a single runway (Subramanian, 2002) (Kohler, 2004). Research has been conducted on
factors such as taxiway queuing dynamics (Carr et al., 2002) and airport slot optimization
(Andersson, 2000) that contribute to overall airport efficiency. The above publications, however,
have approached their problems from a purely optimization perspective.
Departure planning has been another research problem tackled ever since runways were
identified as constraints. Researchers at the Massachusetts Institute of Technology (MIT) are
considered to be the pioneers in departure planning architecture (Anagnostakis et al., 2001) with

21
most of their analysis conducted using the test-bed models of Boston Logan Airport (Shumsky,
1997) (Husni, 1998) (Anagnostakis et al., 2000). Many other laboratory prototypes have been
developed (Barrer et al., 1989) (Cooper et al., 2001) (Burgain, 2008) with the objective of
optimizing departure sequencing. Although these researches have used simulation models instead
of optimization techniques, they have focused on singular aspects of airport efficiency only.
In order to examine and model airport operations in its entirety, full-scale models of the
airports are required. Such simulations are required to analyze all operations contributing to
airport efficiency, especially at large hub airports. Unlike past full-scale models (Chin, 1997)
(Andersson, 2000) that have been developed using transportation engineering platforms, the
model presented in this thesis have been created using a business simulation software. Most
publications focusing on taxi-times (Pesic, 2001) (Smeltink, 2004) have highlighted its complex
nature due to dependencies with path selection, aircraft category, movement speeds and conflicts.
One of the simpler full-scale modeling tools with theoretically-driven parameters used to simulate
ground operations has been MATLAB © (Voulgarellis et al., 2005), which inspired the approach
used in this thesis with a different process modeling software.
The simulation inputs used in this thesis are obtained from theoretically-derived
parameters along with real-world data from the OMP. The model used in this thesis attempts to
combine these various aspects does not use any optimization techniques for departure / arrival
processes. Rather, it addresses the entirety of airport operations, by concentrating on runway
efficiency (departures and arrivals), safety (conflicts) and taxi-times. The model facilitates the
benchmarking of real-world results with simulation results obtained with the modified EAT
layout at ORD.
22
The concept of EATs has been well-documented after its success at various large hub airports
throughout the NAS (Satyamurti, 2007) (Chandler, 2009) (Engelland, 2010). Their impacts on
runway operations, taxi-times and runway incursion mitigation have aided in recognizing the
coupling relationship between airport surface traffic and airport efficiency (Kistler, 2009).
Further, these factors have led to a better understanding of the propagation of delays throughout
the NAS (Chin, 1997), giving more insight on the way delays ripple through the air transportation
network of the U.S. (Laskey, 2007). Hence, airport efficiency has gained vital importance,
emerging as one of the most important targets for Next Gen.
2.2. Runway Incursions
Beginning FY 2010 the International Civil Aviation Organization (ICAO) defines a
runway incursion as: “Any occurrence at an aerodrome involving the incorrect presence of an
aircraft, vehicle, or person on the protected area of a surface designated for the landing and
take-off of aircraft.” (ICAO, Manual on the Prevention of Runway Incursions, First Edition,
2007). Runway incursions are classified into four categories, tracked by the ICAO and FAA:
Category A: Separation decreases to the point that participants take extreme action to
narrowly avoid a collision.
Category B: Separation decreases, and there is a significant potential for a collision.
Category C: Separation decreases, but there is ample time and distance to avoid a
collision.
Category D: There is little or no chance of collision, but the definition of a runway
incursion is met.
23
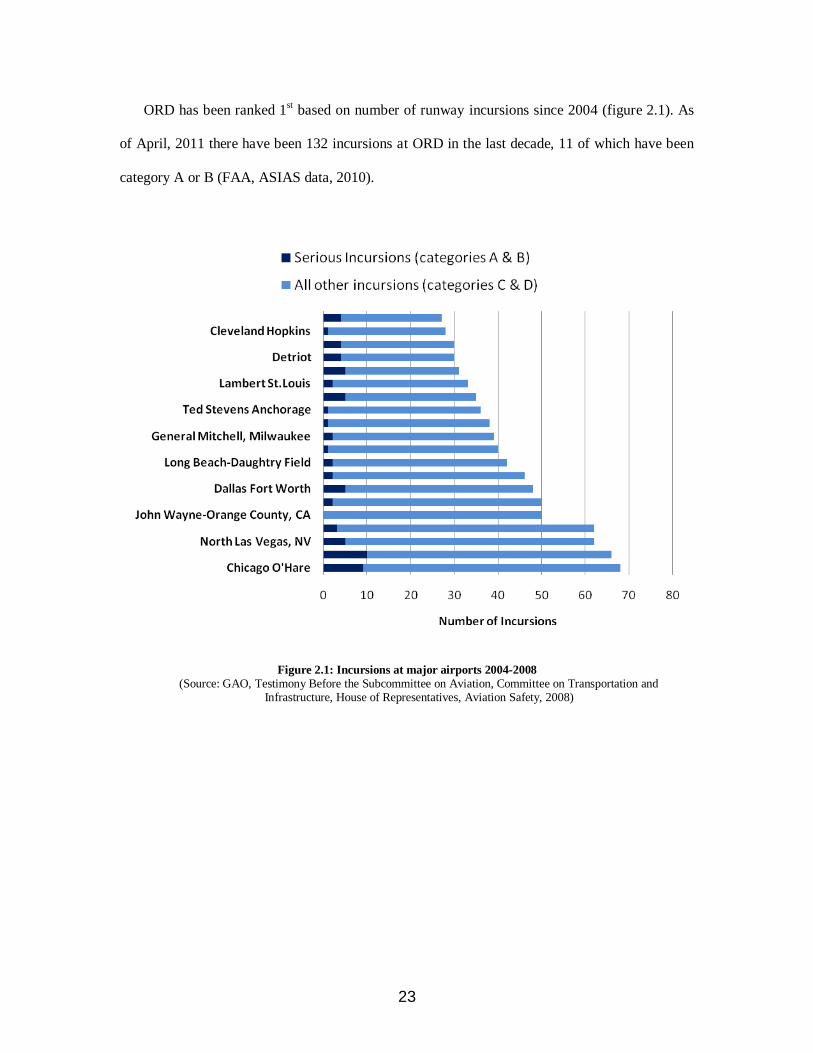
ORD has been ranked 1st based on number of runway incursions since 2004 (figure 2.1). As
of April, 2011 there have been 132 incursions at ORD in the last decade, 11 of which have been
category A or B (FAA, ASIAS data, 2010).
Figure 2.1: Incursions at major airports 2004-2008
(Source: GAO, Testimony Before the Subcommittee on Aviation, Committee on Transportation and Infrastructure, House of Representatives, Aviation Safety, 2008)
24
2.3. Hot-Spots
The ICAO defines an Incursion Hot-Spot (HS) as “a location on an aerodrome movement
area with a history or potential risk of collision or runway incursion and where heightened
attention by pilots/drivers is necessary” (ICAO, Manual on the Prevention of Runway Incursions,
First Edition, 2007). There are currently approximately 50 airports with Hot-Spot brochures
developed prior to the adoption of the ICAO definition. The FAA has added Hot-Spots to
National Aeronautical Charting Office (NACO) diagrams to bring attention to movement areas
that have previously contributed to the occurrence of runway incursions. The Airports Diagram
Order JO7910.4D makes identification of hot spots standard and mandatory. The FAA has
identified 23 airports as potential candidates to receive official hot spot markings on their
respective NACO diagrams (FAA, Annual Runway Safety Report, 2009).
As of September, 2011, 11 hot-spots have been identified at ORD (figure 2.2). The changes
that will be brought about to the airport layout after the OMP will eliminate only some of the hot-
spots shown in the diagrams above. Some prominent intersections like HS 2 and HS 8 will remain
the same with no changes projected with the runway-runway intersection and the apron design
respectively. Although the post-OMP hot spots have not been officially identified by the FAA
and NACO, the construction of new runways, especially 9C-27C and 10C-28C, clearly indicate
potential hot-spots. These intersections will involving a higher density of traffic converging at
high speeds, thereby increasing the risk of an incursion. Hence, it can be concluded that the
number of incursion hot-spots at ORD will not decrease after the completion of the OMP.

25
Figure 2.2: (a) NACO airport diagram of ORD emphasizing the incursion hot spots
(Source: FAA Airport Charts website)
Figure 2.2: (b) Magnified view of the highlighted (red) sub-section from Fig. 2.3 (a)
(Source: FAA Airport Charts website)

26
A unique way to reduce intersections and improve efficiency at a busy airport like ORD is to
construct a taxiway around the end of a runway as an alternative to having aircraft cross an active
runway. Continued focus on other measures, termed Alternative Capacity Enhancement
Measures, can help reduce delay without substantial investment (FAA, Engineering Briefing No.
75, 2007).
2.4. End-Around Taxiways (EATs)
By definition, EATs are taxiways that are constructed around a runway. They allow an
aircraft unrestricted taxiing to the terminal rather than having aircraft hold and cross an active
runway. The time taken to the runway is a variable depending upon the number of aircraft in
arrival/departure queue, the distance between them and the category of the aircraft (in order to
adhere to ground separation standards). Figure 2.3 shows an EAT that was used by NASA to
analyze its effects and simulate traffic patterns.
Figure 2.3: End-Around Taxiway screenshot at ORD acquired from a NASA simulation (Source: NASA SimLabs, 2009)

27
Aircraft using perimeter taxiways generally taxi farther and experience longer unimpeded
taxi-times than aircraft on conventional taxiways. Perimeter taxiway advocates argue that these
negatives are offset by reduced potential for runway incursions due to fewer required clearances
(i.e. reduced frequency congestion), increased runway throughput, potential fuel and emissions
savings due to non-stop taxi flows.
In accordance with the Safety Risk Management Document (SRMD) for departure-end
EATs, application of these standards is limited to airports with “greater than 150,000 departure
operations and greater than 10,000 minutes of delay annually” (or approximately the 30 largest
airports), which qualifies ORD (FAA, Engineering Briefing No. 75, 2007). A national standard
for EATs for the arrival end of the runway (under approaching aircraft) is under development but
not yet available. Through the runway safety management strategy, the implementation of
perimeter taxiways as a form of improved infrastructure has been highlighted in the FAA Annual
Runway Safety Report for FY 2009 to improve the physical safety infrastructure at airports.
2.4.1. Best Practices
Hartsfield-Jackson Atlanta International Airport (ATL) is the busiest airport in the world in
terms of aircraft operations. In June 2006, the airport opened a new runway. In April 2007, it
became the first airport in the U.S. to install an EAT, eliminating about 612 runway crossings per
day (ATL website http://www.atlanta-airport.com/).
Dallas/Ft. Worth International Airport (DFW) is the third busiest airport in terms of aircraft
operations. The airport has approximately 1,700 runway crossings a day with some aircraft
required to cross two runways to get to the terminal environment. Significantly reducing the
number of daily runway crossings has the potential to reduce the chance of aircraft getting too

28
close to each other. A perimeter taxiway went operational at DFW in December 2008. Between
December 2008 and March 2009 there were 2 runway incursions at DFW (figure 2.4 (a)). This
represents a decrease of 50 percent when compared to the same time period in the previous year.
Also partly responsible for this statistic was the FAROS system working in conjunction with
ASDE-X to monitor the entire runway surface as opposed to monitoring specific zones on the
airfield.
(a) (b)
Figure 2.4: (a) Runway Incursion Statistics for DFW between December 2007 and March 2009
(Source: FAA Annual Runway Safety Report 2009)
Figure 2.4: (b) The EAT at DFW with tail height specifications (Engelland S. et al, 2010)
The movement area taxi-time analysis was performed at DFW to determine how use of the
perimeter taxiway affected overall taxi-times. Local-level (comparison of pre-EAT and post-EAT
times for that particular taxiway) results show taxi-times via the perimeter taxiway to be about
forty-five seconds longer on average, but with significantly less variability. Global-level (change
in overall airport taxi-times) results show average perimeter taxiway times to be a little more than
one minute longer with variability that is comparable to that for other taxi paths (Engelland S. et
al, 2010).
29
2.4.2. Limitations
The use of the perimeter taxiway is constrained by flow direction and aircraft tail height. The
maximum tail height of 65 feet would not permit the use of the EAT by an Airbus A380 (figure
2.4 (b)). Also, current FAA policy established by the Airport Obstructions Standards Committee
(AOSC) (FAA, AOSC 2004, 2005, 2006) permits only departing aircraft to overfly an operational
perimeter taxiway. These constraining factors have been accounted for in the simulation setup
which is discussed in detail in the following chapter.
30
Chapter 3
Theoretical and Experimental Setup
3.1. Taxi-Time
Based on ground movement theory, taxi-time can be defined as the sum of unimpeded taxi-
time and variable waiting time (Smeltink, 2004). Unimpeded taxi-time is defined as the
uninterrupted taxi-time from the gate to the runway threshold or vice-versa. This component is a
function of:
The path chosen
The path distance
Speed of the aircraft
Variable waiting time is the sum of the waiting time due to traffic flow management constraints,
excess demand, imprecise planning and uncertainty. It is a function of:
The number of conflicts
The type of conflict
Separation standards
31
3.2. Path Selection
It is important to ensure that aircraft follow a permitted route. If the route for each aircraft is
pre-determined, the ground movement problem is reduced to finding the best possible schedule
(Smeltink, 2004). The other extreme occurs when no restrictions are set for the routing of each
aircraft. The last possibility is for the restrictions to lie somewhere in between these extremes,
where there is a predefined set of routes for each aircraft and the algorithm can choose amongst
them (Pesic, 2001).
The paths for each aircraft were selected in conformance with the airport layout plan for ORD
after the completion of the OMP. Each path or taxiway had a fixed distance; hence the unimpeded
taxi-time for an aircraft on a particular taxiway is a constant. The path, once chosen, would not be
altered. Therefore, the component of an „unpredicted response to an existing plan‟ was
minimized. The path selection is also dependent upon the runway and gate assignment. The
runway and gate assignment here was based on availability. Hence, the component of „additional
waiting time caused by imprecise planning‟ was minimized too. In other words, neither
potentially available runway/gate slots were wasted nor aircraft were assigned
unavailable/occupied runways or gates.
3.3. Aircraft Categories
Aircraft were divided into three weight categories:
Large aircraft: gross take-off weight of more than 255,000 lbs. Examples: long range
transport and cargo aircraft like the MD-11, B757, B747, A330, A340, etc. Note: The
A380 was not used during the simulation since it does not conform to tail height
requirements for EAT use.

32
Medium aircraft: gross take-off weight between 41,000 - 255,000 lbs. Examples: large
turboprop commuters, short and medium range transport aircraft like MD-80, B737,
A320, etc.
Small aircraft: gross take-off weight of more than 41,000 lbs. Examples: all single
engine aircraft, light and very light business jets, light twin engine aircraft, etc.
3.4. Aircraft Movement Speeds
Different aircraft require different lengths of time for taxiing. Recent research has taken this
into account, modeling the speed depending either upon the type or size of an aircraft
(Balakrishnan, 2007) or the kind of taxiway that is being followed. The time for making a turn
must also be taken into account (Pesic, 2001). In this simulation, a maximum speed of 20 knots,
15 knots and 10 knots was used for large, medium and small aircraft respectively. An aircraft
would be able to accelerate to the maximum speed only if separation standards were met. During
turns, regardless of turn angle, a 5 knot speed was applied to aircraft of all categories. The only
exception to this rule was high-speed exit taxiways used by aircraft to exit the runway in an
expedited manner. The speed on these taxiways for all aircraft categories was the speed that it
decelerated to before turning onto the taxiway. It was approximately calculated to be an average
of 9 knots for all arriving aircraft.
3.5. Separation Standards
It is crucial that aircraft do not conflict with each other and have a separation based on their
size and jet blast. This is ensured during take-off and landing by applying separation constraints.
33
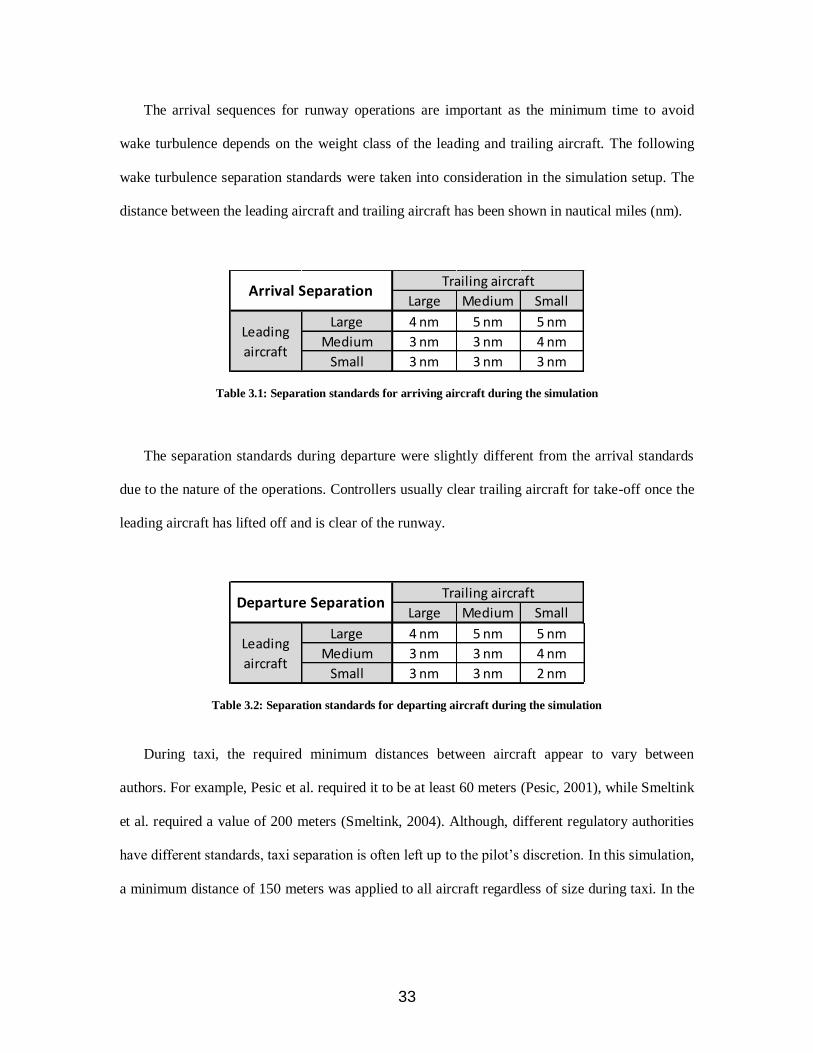
The arrival sequences for runway operations are important as the minimum time to avoid
wake turbulence depends on the weight class of the leading and trailing aircraft. The following
wake turbulence separation standards were taken into consideration in the simulation setup. The
distance between the leading aircraft and trailing aircraft has been shown in nautical miles (nm).
Large Medium Small
Large 4 nm 5 nm 5 nm
Medium 3 nm 3 nm 4 nm
Small 3 nm 3 nm 3 nm
Leading
aircraft
Trailing aircraftArrival Separation
Table 3.1: Separation standards for arriving aircraft during the simulation
The separation standards during departure were slightly different from the arrival standards
due to the nature of the operations. Controllers usually clear trailing aircraft for take-off once the
leading aircraft has lifted off and is clear of the runway.
Large Medium Small
Large 4 nm 5 nm 5 nm
Medium 3 nm 3 nm 4 nm
Small 3 nm 3 nm 2 nm
Trailing aircraft
Leading
aircraft
Departure Separation
Table 3.2: Separation standards for departing aircraft during the simulation
During taxi, the required minimum distances between aircraft appear to vary between
authors. For example, Pesic et al. required it to be at least 60 meters (Pesic, 2001), while Smeltink
et al. required a value of 200 meters (Smeltink, 2004). Although, different regulatory authorities
have different standards, taxi separation is often left up to the pilot‟s discretion. In this simulation,
a minimum distance of 150 meters was applied to all aircraft regardless of size during taxi. In the
34
event that the minimum distance was met, a conflict would occur. The taxiways were broken into
smaller sub-modules to ensure that aircraft wouldn‟t overtake each other.
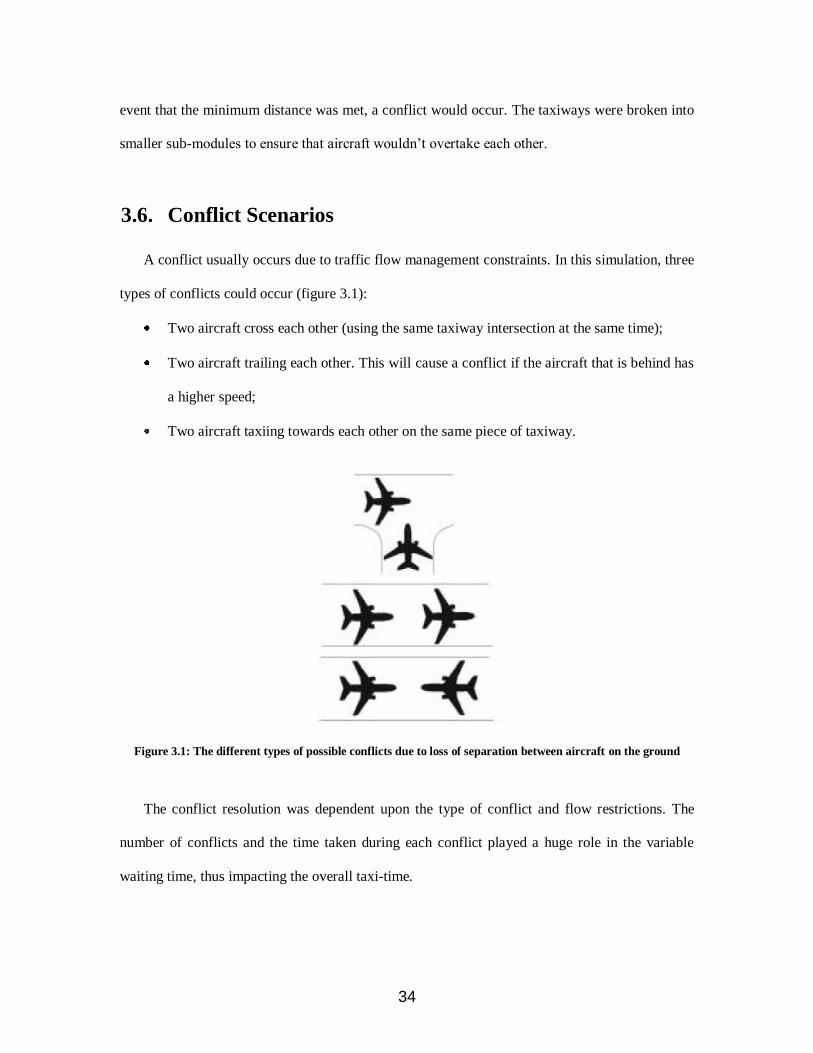
3.6. Conflict Scenarios
A conflict usually occurs due to traffic flow management constraints. In this simulation, three
types of conflicts could occur (figure 3.1):
Two aircraft cross each other (using the same taxiway intersection at the same time);
Two aircraft trailing each other. This will cause a conflict if the aircraft that is behind has
a higher speed;
Two aircraft taxiing towards each other on the same piece of taxiway.
Figure 3.1: The different types of possible conflicts due to loss of separation between aircraft on the ground
The conflict resolution was dependent upon the type of conflict and flow restrictions. The
number of conflicts and the time taken during each conflict played a huge role in the variable
waiting time, thus impacting the overall taxi-time.

35
3.7. O’Hare Setup
3.7.1. Air Traffic Flow
Since, the OMP will enable O‟Hare to have eight runways; this creates multiple combinations
for arrival and departure. OMP researchers have considered the combination of traffic flow
possibilities using runways for departures, arrivals and overflow traffic. The most commonly used
runway configuration will be the Alternative C - West Flow – Parallel 27s layout (Ricondo and
Associates, Experimental Design for ORD Airport Layout Alternatives, 2009). By 2013, the
demand level for this configuration will result in 3,169 daily operations and by 2018 it will have
risen to 3,374 operations, resulting in 72 percent of average daily usage till 2018 (Ricondo and
Associates, Experimental Design for ORD Airport Layout Alternatives, 2009). The arrival and
departure runways were numbers in order from north to south (figure 3.2 a). Overflow arrivals
and departures were assigned to the standby runway (figure 3.2 b) while an additional crosswind
runway was kept unused. All aircraft navigated on a FCFS basis, i.e. no constrained position
shifting was applied.
36
(a) (b)
Figure 3.2: (a) West Flow Parallel 27s Layout at ORD
Figure 3.2: (b) West Flow Parallel 27s (quads) Layout with overflow arrivals and departures at ORD
(Source: Ricondo and Associates, Experimental Design for ORD Airport Layout Alternatives, 2009)
3.7.2. Ground Traffic Flow with EATs
All runway and taxiway configurations were made in conjunction with the OMP airport
layout plans for ORD (Ricondo and Associates, Experimental Design for ORD Airport Layout
Alternatives, 2009). Instead of arriving at gates, aircraft would arrive at gate sets. Figure 3.3
shows the virtually constructed EATs and five gate sets created based on the future ORD airport
layout (circled).

37
Figure 3.3: The post-OMP airport layout of ORD highlighting the locations of the EATs and the gate-sets
A total of four EATs were virtually constructed and modeled in the simulation. With runways
9L-27R, 9C-27C and 10C-28C handling arrivals, the EATs were used by arriving aircraft on
these runways. Runway 4L-22R was used only as a taxiway in this setup. Since none of the
departing aircraft used the EATs, they were strictly unidirectional. Arrival runway 1 used EAT 1
and 2; arrival runway 2 used EAT 2 only; arrival runway 3 used EAT 3 only. Overflow arrivals
on 10R-28L (whenever used) utilized a combination of EAT 4 and 3. This meant that the standard
of using EATs only on the departure end of the runway was adhered to (section 2.4.2). Details
about EAT dimensions are highlighted in section 4.5.1.

38
The assignment and input of the various variables discussed in this chapter play a crucial role
in each replication of the simulation. It is important to note that these inputs do not encompass all
real-world aspects of air traffic dynamics. The following factors are examples of variables not
considered in this simulation model.
Weather - Chicago has a reputation for having some of the most erratic weather
patterns in the U.S. These patterns dictate the flow of traffic on many occasions at
ORD. The addition of this input variable could have resulted in changes to traffic
flow patterns multiple times, which would be difficult to incorporate in the
simulation.
Variable Traffic Load - The traffic load for the simulation was considered to be at
high levels for the entire 24-hour day, whereas in reality the load changes based on
rush hour.
Flow Pattern Changes - Due to changes in traffic load and weather, the ATC and
airport personnel decide to utilize the runways and taxiways differently. This is done
circumstantially to either accommodate traffic or as a reaction to other random
variables (like emergencies, high-alert levels, etc). The flow pattern was kept
constant throughout all replications in the simulation.

39
Chapter 4
Simulation
4.1. Software
The main advantage of a simulation in the case of traffic capacity analysis is its realistic
approach to modeling. Such a problem can also be solved analytically, but the results might not
be applicable to real world scenarios. In this thesis, a software program called ARENA© has
been used, which was initially developed as business simulation software by Rockwell
Automation. Its user-friendly environment and range of functions has expanded its use in other
fields. ARENA© enables demonstration of variability and dynamics of a particular system
(Kelton et al., 1998) using different flowchart and data modules. ARENA© has been used to
simulate a ground traffic flow meter (Nagarajan et al., 2007) and also used to model arrival flight
traffic (Kim, 2008) at George Bush International Airport (IAH). Some of the main features of
ARENA© are:
Modeling of processes to define, document, and communicate.
Simulation of the future system performance to understand complex relationships and
identify opportunities for improvement.
Visualization of operations with dynamic animation graphics.
40
Analysis of how the system will perform in its “as-is” configuration and under a myriad
of possible “to-be” alternatives so that results can be benchmarked and compared.
4.2. Modules
This section describes the various modules available in Arena©. The flowchart modules are
used as building blocks in the simulation environment with each of them having contrasting
functions. The Data Modules are mainly statistical in nature assist with input of variables and
make grouped data outputs (like queue time, pre-defined schedule of flights) accessible. The
purpose of each module and its specific usage in this simulation has been described below.
4.2.1. Flowchart Modules
Create: This module is intended as the starting point for entities in a simulation model. Entities
are created using a schedule or based on a time between arrivals. Entities then leave the module to
begin processing through the system. The entity type is specified in this module. Number of
entities per creation, maximum number of entities and the frequency of creation must be
specified. A variety of distributions can be used to specify the frequency like a Poisson
Distribution, Exponential Distribution, Triangular Distribution, etc. In the validation phase of the
simulation, a normal distribution was used while a Poisson distribution was used for the main
simulation as it was over a 24-hour time period (section 4.2.3).
Dispose: This module is intended as the ending point for entities in a simulation model. Entity
statistics are recorded before the entity is disposed. Only one Dispose module was utilized in the
very end of the simulation.

41
Decide: This module allows for decision-making processes in the system. It includes options to
make decisions based on one or more conditions (e.g., aircraft category, assigned gate, etc.) or
based on one or more probabilities (e.g., 75 percent true; 25 percent false). Conditions can be
based on attribute values (e.g., Emergency landing), variable values, the entity type, or an
expression. There are two exit points out of the Decide module when its specified type is either 2-
way Condition (an “OR” function). There is one exit point for “true” entities and one for “false”
entities. The Decide Module was placed at various junctures in the simulation setup to enable
path selection. The path selection was based on input variables (assigned gate or runway) given at
the beginning of the model after entity creation.
Assign: This module is used for assigning new values to variables, entity attributes, entity types,
entity pictures, or other system variables. Multiple assignments can be made with a single Assign
module. For example: Destination, Entity type (arriving or departing aircraft), Aircraft Category,
etc.
Record: This module is used to collect statistics in the simulation model. Various types of
observational statistics are available, including time between exits through the module, entity
statistics (time, aircraft type etc.), general observations, and interval statistics (from some time
stamp to the current simulation time). A count type of statistic is available as well. Tally and
Counter sets can also be specified. It is a very useful tool to calculate number of aircrafts passing
through a taxiway or busy intersection.
Assign-Record: A combination of both these functions determines the taxi-times. For example:
When assigned “Taxi-time TNOW”, the stopwatch begins for each entity and when assigned
“record taxi-time STOP”, the taxi-time from TNOW to STOP is calculated.

42
Process: This module is intended as the main processing method in the simulation. Options for
seizing and releasing resource constraints are available. Additionally, there is the option to use a
“sub-model” and specify hierarchical user-defined logic. The process time is allocated to the
entity and may be considered to be value added, non-value added, transfer, wait, or other. This
function was used exclusively for all six runways. The command “Seize Delay Release” in the
Process block would enable queuing of aircraft before the runway process. Only one entity can
use a process at a given time. The Process Module combines well with various Data Modules to
quantify sets, delays, waiting time, conflicts and other variables (if needed).
Station: The Station module defines a station (or a set of stations) corresponding to a physical or
logical location where processing occurs. If the Station module defines a station set, it is
effectively defining multiple processing locations. The station (or each station within the defined
set) has a matching activity area that is used to report all times and costs accrued by the entities in
this station. This function was used for all intersections and gate-sets. At certain Stations, a
constraint could be applied restricting the usage of that Station by a single entity only. This
characteristic was very useful in the case of tarmac intersections and gates.
4.2.2. Data modules
Entity module: This data module defines the various entity types and their initial values in a
simulation. A live list of created, currently existing, disposed entities was available using this
function.
Queue module: This data module may be utilized to change the ranking rule for a specified
queue. The default ranking rule for all queues is First-Come-First-Served unless otherwise
43
specified in this module. There is an additional field that allows the queue to be defined as shared.
This module was quite useful in identifying conflicts and could provide real-time data about
existing queues, the entities involved in them and the elapsed queue time.
Variable module: This data module is used to define a variable‟s dimension and initial value(s).
Variables can be referenced in other modules (e.g., the Decide module), can be reassigned a new
value with the Assign module, and can be used in any expression. A list of variables and a tabular
list of statistics was accessible throughout the simulation.
Schedule module: This data module may be used in conjunction with the Create module to
define an arrival schedule. Additionally, a schedule may be used and referenced to factor time
delays based on the simulation time. The schedule function was not used in this simulation, but it
can be used to replicate any known transit timetable.
Set module: This data module defines various types of sets, including resource, counter, tally,
entity type, and entity picture. Resource sets can be used in the Process modules. Counter and
Tally sets can be used in the Record module. This function is useful to group entities with similar
properties, for example, aircraft with more than 10 minutes of queue delay.
4.2.3. Distribution
ARENA© contains a set of built-in functions for generating random numbers from the
commonly used probability distributions. Each of the distributions in ARENA© has one or more
parameter values associated with it. These parameter values must be specified to define the
distribution fully. The number, meaning, and order of the parameter values depend on the
distribution.
44
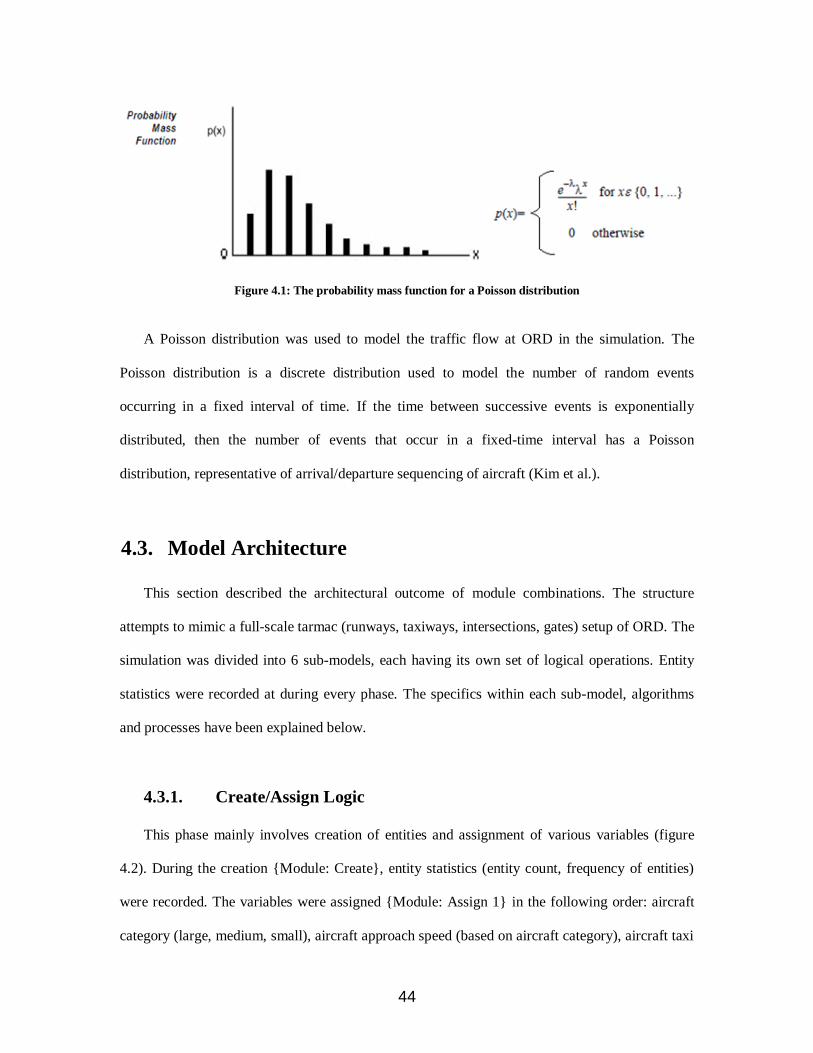
Figure 4.1: The probability mass function for a Poisson distribution
A Poisson distribution was used to model the traffic flow at ORD in the simulation. The
Poisson distribution is a discrete distribution used to model the number of random events
occurring in a fixed interval of time. If the time between successive events is exponentially
distributed, then the number of events that occur in a fixed-time interval has a Poisson
distribution, representative of arrival/departure sequencing of aircraft (Kim et al.).
4.3. Model Architecture
This section described the architectural outcome of module combinations. The structure
attempts to mimic a full-scale tarmac (runways, taxiways, intersections, gates) setup of ORD. The
simulation was divided into 6 sub-models, each having its own set of logical operations. Entity
statistics were recorded at during every phase. The specifics within each sub-model, algorithms
and processes have been explained below.
4.3.1. Create/Assign Logic
This phase mainly involves creation of entities and assignment of various variables (figure
4.2). During the creation {Module: Create}, entity statistics (entity count, frequency of entities)
were recorded. The variables were assigned {Module: Assign 1} in the following order: aircraft
category (large, medium, small), aircraft approach speed (based on aircraft category), aircraft taxi
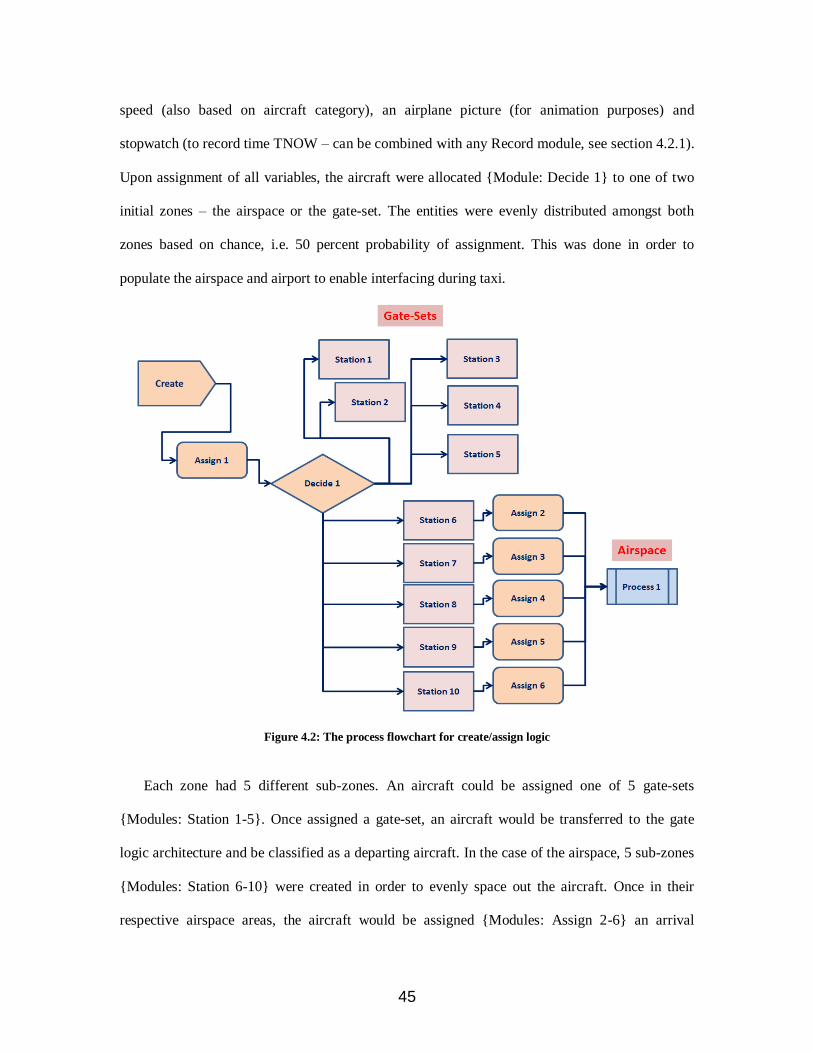
45
speed (also based on aircraft category), an airplane picture (for animation purposes) and
stopwatch (to record time TNOW – can be combined with any Record module, see section 4.2.1).
Upon assignment of all variables, the aircraft were allocated {Module: Decide 1} to one of two
initial zones – the airspace or the gate-set. The entities were evenly distributed amongst both
zones based on chance, i.e. 50 percent probability of assignment. This was done in order to
populate the airspace and airport to enable interfacing during taxi.
Figure 4.2: The process flowchart for create/assign logic
Each zone had 5 different sub-zones. An aircraft could be assigned one of 5 gate-sets
{Modules: Station 1-5}. Once assigned a gate-set, an aircraft would be transferred to the gate
logic architecture and be classified as a departing aircraft. In the case of the airspace, 5 sub-zones
{Modules: Station 6-10} were created in order to evenly space out the aircraft. Once in their
respective airspace areas, the aircraft would be assigned {Modules: Assign 2-6} an arrival

46
runway and an arrival gate. All the aircraft would then progress to the airspace {Module: Process
1}.
4.3.2. Approach/Arrival Logic
This phase comprises of the entire approach process and ends when the aircraft completes the
landing process, i.e. turns onto a taxiway (figure 4.3). As seen in section 4.3.1, the aircraft were
assigned arrival runways and arrival gates. Each aircraft would enter the approach corridor
{Modules: Process 2-4} from the airspace depending on the assigned runway {Module: Decide
2}. Following a successful approach, the aircraft would land on the designated runway {Modules:
Process 5-7} and reduce speed in order to turn onto a taxiway. In the event that an aircraft would
execute a „missed approach‟ or a „go around‟ {Modules: Decide 3-5}, it would be redirected to
the airspace {Modules: Process 8-10}. The time taken for the approach process was dependent
upon the aircraft category and wake vortex separation standards (section 3.5). At the end of
approach logic, every entity would directly enter the taxi logic (without exceptions).
Figure 4.3: The process flowchart for approach/arrival logic

47
4.3.3. Taxi Logic (Arrival)
Considering the motive of this thesis, this is the most crucial phase in the entire architecture.
It comprises of numerous taxiways – high-speed exit taxiways, EATs and regular taxiways
(figure 4.4). The aircraft land on their designated runways and begin taxiing to their assigned
gates. All the aircraft use designated taxiways based on their assigned gates.
Upon completion of the landing process on the runway, two variables are assigned:
TNOW for calculating the taxi-time by placing a „Module: Record‟ at the end of the taxi
logic at the gate.
The taxi path that an aircraft must take in order to get to its designated gate. The path is
based on real-time feedback, i.e. if one of the taxiways that the aircraft is supposed to
take has a queue or bottleneck, the aircraft is given an alternate taxiway path. The path,
however, once assigned cannot be changed. The use of EATs was made mandatory for all
arriving aircraft that needed to cross a runway.
Figure 4.4: The process flowchart for a part of the taxi logic

48
Upon landing, the aircraft then takes the first possible taxiway. In this case we will assume it
is taxiway 9 {Module: Process 11}. At any given intersection {Module: Decide 6}, the aircraft is
directed towards the path that will lead it towards its final destination. Unlike the Module: Decide
1 shown in section 4.3.1, the logic of this module is based on condition. In this case the condition
that it follows is the destination gate of the aircraft. Hence, if the aircraft was going towards gate-
set 2, it would take a particular path (taxiway 10) {Module: Process 12}, if it was going towards
gate-set 3, it would be directed to taxiway 11{Module: Process 13} or finally, if it was going to
gate-set 4 via taxiway 6 or taxiway 12, it would take the third possible option {Module: Process
14}. Taking this option could lead to another intersection {Module: Decide 7}, which would lead
to either taxiway 6 {Module: Process 15} or taxiway 12 {Module: Process 16}. The entire taxi
logic architecture consisted of numerous complex combinations of taxiways (process modules)
and intersections (decide modules). Please note that the architecture presented in figure 4.5 is just
one of many logical combinations that were used in the simulation. The taxi logic ends when the
aircraft completes the process on the final taxiway/apron leading to its gate.
4.3.4. Gate Logic
In this phase (figure 4.5), the aircraft reach their gates, are assigned new variables for
departure (departure runway and taxi path) and begin pushback. When an aircraft arrives at the
gate via the final taxiway/apron {Module: Process 17}, the taxi-time is immediately recorded
{Module: Record 1} in combination with the TNOW function used in section 4.3.3. Following
arrival at the gate, a wait time was applied to each aircraft for unloading, loading, maintenance,
etc. This time varied between 15 minutes and 90 minutes depending on the aircraft category and
included a random delay time {Module: Process 18}. The aircraft then begins the pushback
process upon which the TNOW variable {Module: Assign 7} is assigned once again in order to
begin calculation of the taxi-time. In addition, the aircraft is assigned its departure runway and

49
taxi path. Following the assignment of variables, the entities proceed to the taxi logic once again
via pushback {Module: Process 19}.
Figure 4.5: The process flowchart for gate logic
4.3.5. Taxi Logic (Departure)
The basic principles in the taxi logic during departure are the same as arrival. Since the
taxiways were unidirectional, different sets of taxiways were used in the departure and arrival
phases, but their intersections created conflicts (section 3.6). The phase begins once pushback is
completed and ends when the aircraft makes the final turn onto the designated departing runway.
This results in the „Module: Record‟ being used again to calculate the departure taxi-time.
4.3.6. Departure/Ascent Logic
This is the last phase before an entity is terminated. The aircraft would take-off on their
designated runways. The take-off (process) time would depend upon the aircraft category and
departure separation standards applied. Once clear of the runway, the entity would be randomly
directed to a post-departure airspace before being disposed.

50
4.4. Model Validation
In order to assess whether the results of the full-scale simulation are tangible, a model
validation simulation was conducted. Low traffic levels were used in order to ensure that the
unimpeded taxi-times were comparable. The validation used the current (pre-OMP) configuration
at ORD.
4.4.1. Input Parameters
Based on the annual average taxi-times for arriving and departing aircraft at ORD in 2009, a
one-hour slot was considered as a benchmarking unit. The FAA ASPM and OPSNET databases
were accessed to retrieve data pertaining to traffic patterns and taxi-times at ORD. The date and
time slot most representative of low traffic load for that year was the 11pm – 12am slot on the
15th of May, 2009. During the hour, there were 32 landings and 43 take-offs (FAA ASPM
Database). The following parameters of the current ORD layout were used as input in the
ARENA© software:
Dimensions of the taxiways, gates, runways and aprons for pre-OMP configuration
(ORD master-plan created by Ricondo & Associates, OMP Website 2011)
A Normal distribution was used for the validation with approximately one entity
created per minute representing a low-key hour at ORD (FAA OPSNET database).
Note that all entities once created do not congregate in the airspace, as a substantial
portion spawn as departure aircraft at gates (section 4.5.2).
4.4.2. Validation Results
A total of 81 entities were created, 35 landings and 44 take-offs occurred during the
simulation hour. The throughput of arriving and departing entities in the simulation was relatively
accurate to the real-world data. For each entity, simulation entry time, simulation exit time,

51
arrival taxi-time, departure taxi-time and waiting time were recorded. The arrival time calculated
was the taxi-time from touchdown on the runway until the aircraft docks with the gate. The
departure time calculated was the taxi-time from gate pushback until takeoff. Results (table 4.1)
show that the model exhibits a positive error in the range of one to two percent. Compared to
real-world data, the model exhibited +1.4% for arriving aircraft and +1.7% for departing aircraft.
Since the difference between the real values and the simulation taxi-times were quite marginal,
the validation was considered successful to proceed to the main simulation.
Taxi-Time Validation Elements Arrivals Departures
2009 Annual Average (m:sec) 9:56 17:23
Real ORD Low Load
11pm-12am 15th May 2009 (m:sec)7:57 10:50
Model Validation for Low Load (m:sec) 8:04 11:01
% Error - Real vs Model + 1.4 + 1.7
Table 4.1: Comparison of various taxi-time elements used for the model validation
4.5. Main Simulation
The full-scale simulation was conducted using the post-OMP configuration of ORD. In
addition, four virtually constructed EATs were added to the simulation. Since the validation
phase yielded results with low error, the main simulation was conducted thereafter. Unlike the
model validation, this phase involved the transition of entities through the virtual airport system
over the period of 24 hours.

52
4.5.1. Input Parameters
The following input data was used:
All airport layout parameters including taxiways, gates, runways and aprons were
post-OMP configuration (Ricondo & Associates, OMP Website 2011)
Dimensions of virtually constructed EATs were established based on FAA and ICAO
regulations (AOSC data, NASA SimLabs), in accordance to which the centerline of
the EAT was kept at 1,500 feet when perpendicular to the runway and 500 feet each
side when parallel to the runway.
The traffic input data was obtained from high load projections given by various OMP
publications (Ricondo & Associates, 2010) (OMP Website 2011). Being most
representative of the traffic projection pattern, a Poisson distribution was used for
arriving and departing aircraft. Note that all entities once created do not congregate in
the airspace, as a substantial portion spawn as departure aircraft at gates.
4.5.2. Entity Transit
The journey of an entity is described below along with the transit algorithm. In order to
encompass the entire arrival and departure processes, an entity that was initially assigned to the
airspace was chosen. The general transit algorithm is presented on the left while the individual
entity characteristics corresponding to that particular module are shown on the right. The process
algorithm was recorded from ARENA© on the 50th
replication during the simulation of the ORD
airport under high load traffic with a modified layout using EATs.
Create/Assign Logic
1. Create – Entity (Aircraft).
Expression – Poisson (30) seconds
2. Record – Count – Number In Entity value: 387

53
3. Assign – Picture – Airplane Entity value: Picture
Assign – Aircraft Category Entity value: Medium
Assign – TNOW Entity value: T = 0
4. Decide – N ways by chance (10) – 10%
If N = 1...5
Then Route to Gate 1,2,3,4 or 5
Else Proceed to Airspace Entity value: Airspace
5. Assign – Arrival Runway = 1,2 or 3 Entity value: 3
Assign – Destination = Gate Set 1,2,3,4 or 5 Entity value: Gate Set 2
6. Record – STOP Entity value : T = 34 sec
7. Decide – Approach
N ways by condition (Arrival Runway)
If N = Arrival Runway 1
Then Approach 1
If N = Arrival Runway 2
Then Approach 2
If N = Arrival Runway 3
Then Approach 3 Entity value: N = 3
Approach/Arrival Logic
8. Process – Approach 3 Process time: 13 min 22 sec
9. Process – Arrival Runway 3 Process time: 2 min 8 sec
Taxi Logic (Arrival)
10. Assign – TNOW Entity value: T = 0
Assign – Taxi Path
11. Process – Taxiway 19 Process time: 6 min 18 sec

54
12. Decide – Taxiway
N ways by Condition (Gate Set)
If N = Gate Set 1
Then Taxiway 20
If N = Gate Set 2, 3, 4 or 5
Then Taxiway 21 Entity value: N = Gate Set 2
13. Process – Taxiway 21
Delay – Conflict (queue) Process time: 8 min 1 sec
14. Decide – Taxiway
N ways by condition (Gate Set)
If N = Gate Set 1, 2, 3
Then Taxiway 27 Entity value: N = Gate Set 2
If N = Gate Set 4, 5
Then Taxiway 39
15. Process – Taxiway 27
Delay – Conflict (intersect) Process time: 3 min 56 sec
16. Decide – Taxiway
N ways by condition (Gate Set)
If N = Gate Set 1
Then Taxiway 13
If N = Gate Set 2
Then Taxiway 6 Entity value: N = Gate Set 2
If N = Gate Set 3
Then Taxiway 12
If N = Gate Set 4 or 5

55
Then Taxiway 47
17. Process – Taxiway 6 Process time: 1 min 39 sec
18. Record – STOP Entity value: T = 19 min 54 sec
Gate Logic
19. Process – Gate
Delay – Random Process time: 49 min 22 sec
20. Assign – Departure Runway = 1, 2 or 3 Entity value: 2
Assign – Taxi Path
Assign – TNOW Entity value: T = 0
Taxi Logic (Departure)
21. Process – Taxiway 6 Process time: 2 min 3 sec
22. Decide – Taxiway
N ways by condition (Departure Runway)
If N = Departure Runway 1
Then Taxiway 3
If N = Departure Runway 2 or 3
Then Taxiway 46 Entity value: N = 2
23. Process – Taxiway 46 Process time: 2 min 9 sec
24. Decide – Taxiway
N ways by condition (Departure Runway)
If N = Departure Runway 1
Then Taxiway 13
If N = Departure Runway 2 or 3
Then Taxiway 47 Entity value: N = 2
25. Process – Taxiway 47
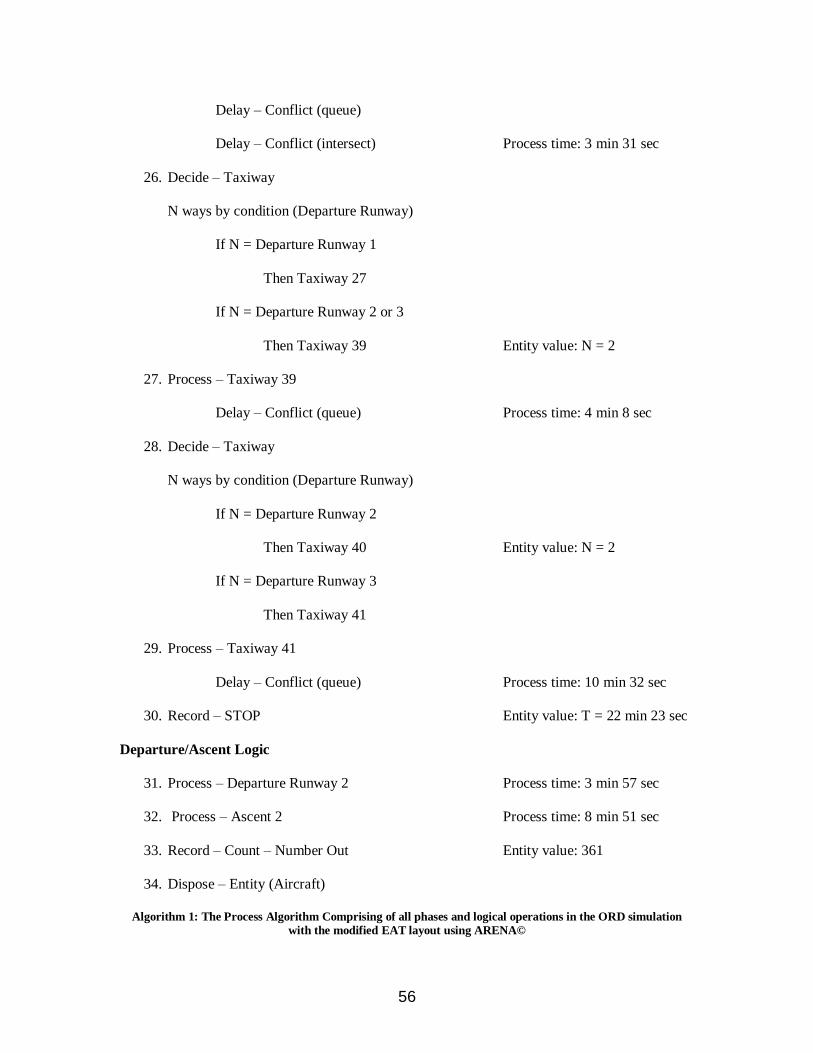
56
Delay – Conflict (queue)
Delay – Conflict (intersect) Process time: 3 min 31 sec
26. Decide – Taxiway
N ways by condition (Departure Runway)
If N = Departure Runway 1
Then Taxiway 27
If N = Departure Runway 2 or 3
Then Taxiway 39 Entity value: N = 2
27. Process – Taxiway 39
Delay – Conflict (queue) Process time: 4 min 8 sec
28. Decide – Taxiway
N ways by condition (Departure Runway)
If N = Departure Runway 2
Then Taxiway 40 Entity value: N = 2
If N = Departure Runway 3
Then Taxiway 41
29. Process – Taxiway 41
Delay – Conflict (queue) Process time: 10 min 32 sec
30. Record – STOP Entity value: T = 22 min 23 sec
Departure/Ascent Logic
31. Process – Departure Runway 2 Process time: 3 min 57 sec
32. Process – Ascent 2 Process time: 8 min 51 sec
33. Record – Count – Number Out Entity value: 361
34. Dispose – Entity (Aircraft)
Algorithm 1: The Process Algorithm Comprising of all phases and logical operations in the ORD simulation
with the modified EAT layout using ARENA©

57
The algorithm shown above depicts the transit of a random entity from creation to disposal.
The creation of the entity (or aircraft) follows a Poisson expression (Step 1), this being the 387th
entity to enter the simulation (Step 2). They are assigned several values (Step 3), including
aircraft category. The aircraft are assigned an origin value (Step 4), either one of the five gate
sets (50 percent probability) or towards the airspace (50 percent probability), ensuring that the
system is populated. In this case, the aircraft is directed to the airspace and then assigned Arrival
Runway 3 and Gate Set 2 (Step 5), determining the approach it will take (Step 7). The entire
create/assign process is timed (Step 6) to ensure that it remains at a negligible percentage of the
simulation time. The entire approach/arrival process (Steps 8 and 9) was timed at a little more
than 15 minutes.
Upon landing onto the runway, the taxi path is assigned and the taxi-time calculation begins
(Step 10). The aircraft taxis onto the EAT/ taxiway 19 (Step 11), followed by taxiway 21 (Step
13), taxiway 27 (Step 15) with a delay and finally taxiway 6 (Step 17) leading to Gate Set 2.
Before taking each taxiway, the entity decides (Steps 12, 14 and 16) its next course based on the
pre-assigned taxi path when it arrived (Step 10). Each conflict is defined (queue, intersect or
head-on) and accounted for in the total taxiway process time.
Once at the gate, the taxi-time is calculated (Step 18), which is slightly under 20 minutes in
this case and the aircraft begins the turn-around process at the gate with a random delay (Step 19).
During the turn-around period, which is a little under 50 minutes for this entity, the new values
(departure runway, taxi path) are assigned (Step 20). The calculation of the taxi-time begins once
again through the various taxiway combinations (Steps 21, 23, 25, 27 and 29) that the aircraft
takes to taxi to Departure Runway 2. In this departure sequence, the aircraft faced various forms
of delays and conflicts at multiple intersections (Steps 22, 24, 26 and 28) through its pre-assigned

58
path. The final conflict was in excess of 10 minutes queuing for the departure runway. The delay
occurred on the ramp which is shared by departure runways 2 and 3, transforming it into a
bottleneck during high traffic scenarios. The entity records a taxi-time of 22 minutes and 23
seconds (Step 30) before moving on to the departure process (Step 31) and ascent process (Step
32). After being counted as the 361st entity (Step 33) exiting the simulation, it is disposed (Step
34).
4.5.3. Summary of Computation
During the simulation, there were two primary statistical computations occurring: counting of
entities and calculation of process times.
Entity Count: To ensure that an accurate number of entities entering or exiting a system or sub-
system was known at any given time, counters were placed at their entry and exit points.. In this
case, the system is the entire simulation environment while a sub-system can be the airspace, any
of the runways or any of the gate-sets. For most critical modules (Process, Create, Dispose,
Station, Decide), in-built counters existed. The Record module was used to keep live count for
other modules.
Process-Time: The computation of process times was conducted using a combination of the
Assign and Record modules. Using the Assign module, a command “TNOW” was given to
entities. The basic function of this command was to initiate recording of time until the Record
module is reached and the “STOP” command is given. Hence, the process time is defined as the
time from when the “TNOW” is applied until the “STOP” command is used. This pair of
commands was utilized throughout the simulation to calculate taxi-times, runway occupancy
times, gate turnaround times and delays (due to conflicts).

59
Resultant Output: The run time of the simulation was for 24 hours or 1440 minutes for ORD. A
speed of 100X was applied to each run producing a simulation time of 14 minutes and 40 seconds
per replication. 100 replications were conducted in total, all of which were successful. A total of
1,893 entities were created using the Poisson distribution. During the 24-hour period, 708
landings and 1,035 take-offs occurred. During the simulation, the above mentioned computations
were conducted to record entity count and process-times. At the end of the simulation, the
following statistics were made available using the Data Modules (section 4.2.2).
Overall Simulation count of entities entering and exiting the system.
Modules used: Create, Dispose
Count of entities for each process, station and decide module.
Modules used: Record, Process, Station, Decide, Queue
Tabular data of process-times for all entities in all processes, stations and delays.
Modules used: Process, Assign-Record, Queue
Tabular data of process-times for all entities from arrival runways to gate-sets.
Modules used: Assign-Record
Tabular data of process-times for all entities from gate-sets to departure runways.
Modules used: Assign-Record
This data was then cross-referenced and synthesized to be presented in conformity with the
thesis objectives (section 1.4.2). The following chapter describes the results of the simulation and
the data synthesis.

60
Chapter 5
Results and Discussion
5.1. Local-Level Taxi-Time Comparison
5.1.1. Concept
The local-level comparison compares taxi-times with and without the use of EATs between
two points across a runway. It quantifies the difference in time required to taxi via the EAT
versus the time required to taxi across the active runway.
5.1.2. Method
In order to examine the local-level taxi-times, benchmarking was conducted using start and
end points on either sides of the runway crossings. As shown in figure 5.1, point A would be the
origin and point B would be the end point for an aircraft taxiing across runways 9C-27C and 9R-
27R, while a combination of using EATs 1 and 2 would be the benchmarking alternative.
Similarly, point C would be the origin and point D would be the end point for aircraft crossing
runways 10C-28C and 10L-28R, with a combination of EAT 4 and 3 acting as the benchmarking
alternative. Average taxi-times were calculated for the entire 24-hour simulation.
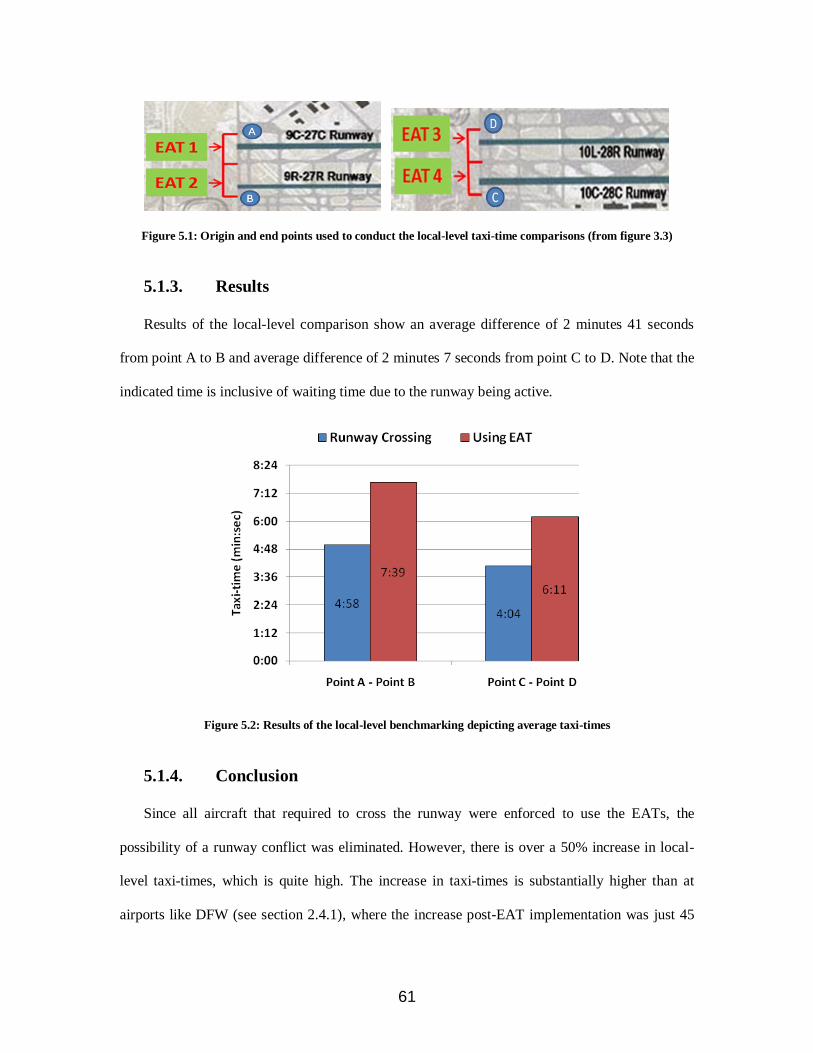
61
Figure 5.1: Origin and end points used to conduct the local-level taxi-time comparisons (from figure 3.3)
5.1.3. Results
Results of the local-level comparison show an average difference of 2 minutes 41 seconds
from point A to B and average difference of 2 minutes 7 seconds from point C to D. Note that the
indicated time is inclusive of waiting time due to the runway being active.
Figure 5.2: Results of the local-level benchmarking depicting average taxi-times
5.1.4. Conclusion
Since all aircraft that required to cross the runway were enforced to use the EATs, the
possibility of a runway conflict was eliminated. However, there is over a 50% increase in local-
level taxi-times, which is quite high. The increase in taxi-times is substantially higher than at
airports like DFW (see section 2.4.1), where the increase post-EAT implementation was just 45

62
seconds (~10%). Hence, it can be concluded that the local-level results in high traffic load
scenarios do not support the implementation of EATs.
5.2. Global-Level Taxi-Time Comparison
5.2.1. Concept
The global-level comparison compares the effects of airport modifications on overall taxi-
times. It is the quantitative difference between the average taxi-times using a modified EAT
layout versus the current ORD configuration. For an accurate comparison, both periods analyzed
must have similar traffic loads.
5.2.2. Method
As a benchmarking unit, the 27th of December, 2008 was selected as it represented high
traffic levels during the holiday period. The overall taxi-times for the 24-hour period were
substantially greater than the average ORD taxi-times in 2008. The average arrival taxi-time
during this day was 17 minutes 29 seconds and average departure time was 23 minutes 59
seconds (FAA ASPM database, 2011).
A similar high load traffic input was used in the full-scale ORD layout with EAT
modifications. Input data was obtained from the FAA ASPM database, it included approximate
frequencies of aircraft per runway, average turnaround times and taxi-times. After recording the
taxi-times for all entities in the full-scale simulation, the average taxi-times were calculated from
each gate-set to each runway and vice-versa.
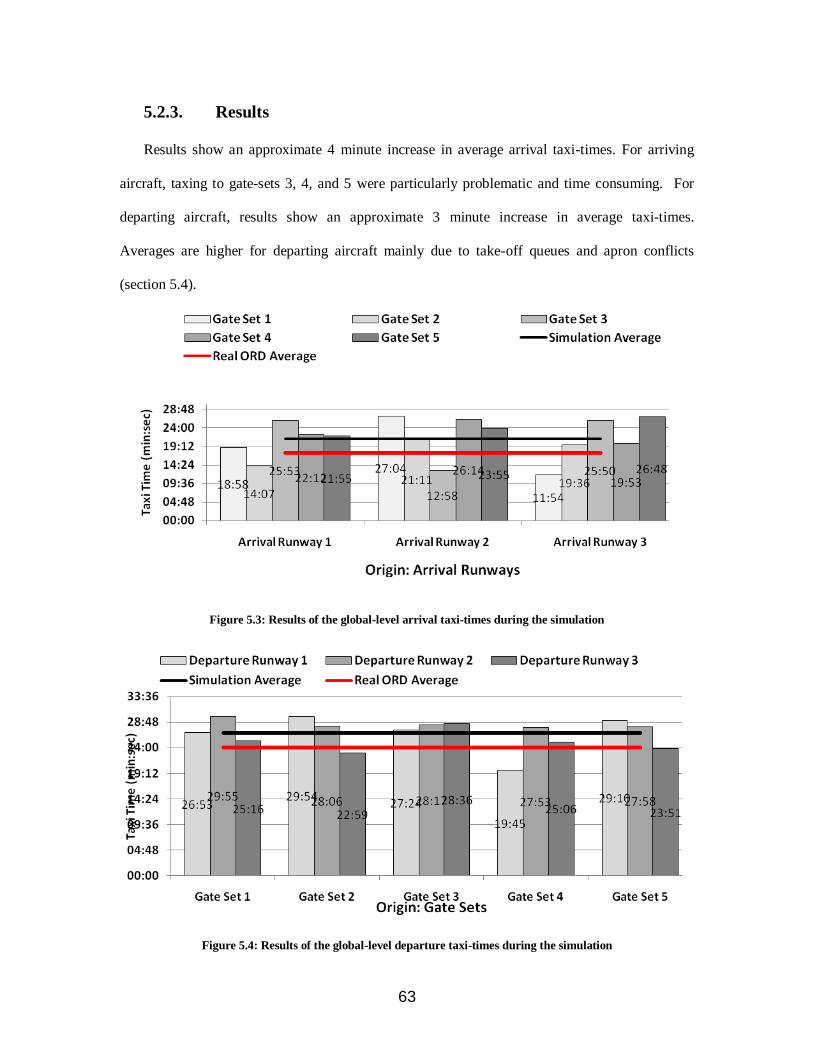
63
5.2.3. Results
Results show an approximate 4 minute increase in average arrival taxi-times. For arriving
aircraft, taxing to gate-sets 3, 4, and 5 were particularly problematic and time consuming. For
departing aircraft, results show an approximate 3 minute increase in average taxi-times.
Averages are higher for departing aircraft mainly due to take-off queues and apron conflicts
(section 5.4).
Figure 5.3: Results of the global-level arrival taxi-times during the simulation
Figure 5.4: Results of the global-level departure taxi-times during the simulation

64
5.2.4. Conclusion
Due to the larger distances for aircraft to travel after the OMP, the high average taxi-times
aren‟t unexpected under high traffic loads. When compared to DFW (see section 2.4.1) which
exhibited an average one minute increase post-EAT implementation, the increase in global-level
taxi-times is quite high. However, the percentage increase from benchmarking is around 15% for
arriving and departing aircraft. Although the taxi-times are high, the global-level results are a
positive sign due to their low percentage increase (compared to local-level results) under high
traffic loads.
5.3. Runway Occupancy Time
5.3.1. Concept
The runway occupancy time (ROT) is defined as the amount of time an aircraft spends on the
runway, thereby making it unusable by any other aircraft. The ROT is highly dependent on the
aircraft category/type (see section 3.3). The ROT is considered to be the perfect tool to examine
airport efficiency (Anagnostakis et al, 2001).
5.3.2. Method
During the simulation, the amount of time that each aircraft spent on the runway was
recorded. Upon comparing it with the total modeling time, the runway occupancy percentages
were calculated for each runway, where 100% runway occupancy would indicate maximum
utilization of the runway. It is important to note that for arriving aircraft the ROT includes final
approach time, i.e. when an aircraft was on final approach, no other aircraft could use the runway.

65
Similarly, for departing aircraft the runway was considered to be in use until a safe wake vortex
distance was achieved post-takeoff from the runway threshold.
5.3.3. Results
Figure 5.5: The runway occupancy percentages for all arrival and departure runways
The results of the ROT modeling clearly indicate that the departure runways were much more
efficiently utilized compared to the arrival runways. One of the major reasons for the arrival
runways being under-utilized is aircraft separation due to different size categories. In the
simulation, the aircraft were directed to the arrival runways based on a First-Come-First-Served
(FCFS) basis. The FCFS system corresponds to the real-world sequencing of arriving aircraft at
ORD (NASA SimLabs, 2009). This creates a mix of aircraft belonging to different size categories
landing on the same runway.
The sharing of the same apron between runways 10L-28R and 4R-22L created bottlenecks.
Since both these runways were used for departing aircraft (section 3.7.1), long queues were

66
formed on various occasions leading to both runways. In this case, runway 10L-28R had more
aircraft queued onto taxiways and the apron leading to it, maximizing its ROT.
5.3.4. Conclusion
Although FCFS sequencing is used in real-world queuing dynamics, applying sequence
optimization techniques (Balakrishnan, 2006) could maximize arrival efficiency in this case.
These techniques have not been implemented at airports yet but can impact overall airport
efficiency.
For departures, the presence of separate independent taxiways or aprons leading to different
departure runways is quite crucial to runway efficiency. The taxiway and apron layout was the
primary reason for under-utilization of departure runways, which is a critical part of high-load
airport operations. In addition to placement of EATs within airport safety minimums and
regulations, the presence of EATs should facilitate traffic flow in accordance with taxiways,
aprons and runways (FAA, 2007). Although the EATs did not have a direct impact on the ROT,
the results show improper tarmac infrastructure would not complement the implementation of
EATs.
5.4. Conflict Analysis
5.4.1. Concept
Recapping section 3.6, a conflict usually occurs due to traffic flow management constraints.
In this simulation, three types of conflicts could occur:
Intersection: Two aircraft cross each other (using the same taxiway intersection at the
same time);
67
Queue: Two aircraft trailing each other. This will cause a conflict if the aircraft that is
behind has a higher speed;
Head-on: Two aircraft taxiing towards each other on the same piece of taxiway.
5.4.2. Method
Process or Station Modules were used to virtually portray taxiways, gates, aprons and
intersections. A constraint was applied making the module available only to one entity at a time.
A conflict was identified when a delay process occurred around a module with this constraint. By
comparing the directions of the entity using the module and the entity approaching it (and
stopping), the conflict could be classified as a head-on, intersection or queue.
For the sectional analysis based on taxi location, the airfield was broken down into runway
area, gate area and en-route taxiways. The runway area encompassed the runways, high-speed
exit taxiways and EATs while the gate area encompassed the apron connecting the gate to the
main taxiways. The rest of the taxiways between the gate and runway areas were classified as en-
route taxiways.
5.4.3. Results
During the simulation, a total of 1,040 conflicts occurred, most of which were of the queuing
type (figure 5.6). There were no head-on conflicts due to the unidirectional nature of all taxiways
and runways. The majority of the conflicts were queues (81%) while intersection conflicts
occurred 19% of the time. A further analysis on queue and intersection conflicts has been
conducted to determine their location on the airfield.

68
Figure 5.6: Breakdown of all conflicts that occurred during the simulation by type
Analysis of the intersection conflicts (figure 5.7 (a)) reveals that most of them occurred on
en-route taxiways (83%) and the remaining near the gate area (17%). The most encouraging
aspect was the absence of intersection conflicts in the runway area. This strongly points towards a
reduction in the number of runway incursions, if EATs are used.
Figure 5.7 (a): Breakdown of total intersection conflicts by airfield location

69
Figure 5.7 (b): Breakdown of total queue conflicts by airfield location
A breakdown of the queue conflicts (figure 5.7 (b)) by location validates the concern raised in
previous sub-sections. With 60% of the queues near the runway area, the common apron shared
by the runways 10L-28R and 4R-22L can be classified as the most problematic bottleneck in the
ORD layout.
5.4.4. Conclusion
The majority of conflicts being of the queuing nature points towards the need for a much
improved departure queuing mechanism. From strictly a safety perspective, the analysis shows
promising results due to no intersecting conflicts occurring near the runway. This statistic
indicates that runway incursions (section 2.2) are nullified with EATs.

70
Chapter 6
Summary and Future Work
6.1. Summary of Results
In this thesis, an experimental analysis for ground operations at ORD has been modeled. The
simulation setup was based on forecasted high traffic levels using a modified EAT layout. With
similar parameter selection for any other modernizing airport, efficiency results for EATs at
contrasting large hubs can be achieved. A summary of results is provided below.
6.1.1. Advantages:
Increased Runway Safety: The presence of the EATs completely eliminated runway crossings
(section 5.4), establishing a higher level of safety due to the reduced risk of runway incursions. A
total of 1,040 conflicts were noted during the simulation, none of which were on the runway.
Acceptable Increase in Global-Level Taxi-Times: Global-level results showed a 15% increase
in overall taxi-times (section 5.2). Based on the validation phase, we can assume this increase
could be 1-3% more than real-world results (section 4.4). Although there are no established
yardsticks to measure tolerable increases in taxi-times, a 15% rise at high traffic load can be

71
considered as a pro. This deduction is supported by the expected 10-15% increase in taxi-times
due to EAT implementation (FAA, 2007) (Engelland S., 2010) at large hub airports.
6.1.2. Disadvantages
High Increase in Local-Level Taxi-Times: The simulation showed an increase in local-level
taxi-times due to the presence of EATs. Local-level taxi-time analysis showed an average
increase of approximately 2 minutes 30 seconds per aircraft, which is approximately 50% more
than direct runway crossings (section 5.1).
Inefficient Runway Occupancy: The ROT analysis clearly showed that the ground movement
infrastructure at ORD does not support the implementation of EATs (FAA, 2007). This resulted
in poor runway usage for both arriving and departing aircraft (section 5.3).
6.1.3. Conclusion
With Next Gen progressing towards reducing separation using technology (FAA, 2010), the
potential of implementing EATs at large hub airports in the NAS is still unclear. It is important to
note that all the results and discussion presented in this thesis is based on forecasted high load
scenarios only. The implementation of EATs is not envisioned at large hub airports catering to
only medium and low load traffic throughout the day. Hence, at airports with mainly high traffic
volumes, the application of EATs is subject to priorities given to individual factors like safety
levels, capacity, airport efficiency and delays. At such airports, based on the results presented in
this thesis, it is recommended that EATs be implemented where increase in safety levels have
higher priority. For an airport like ORD with a non-singular problem (section 1.3), i.e. delays,
capacity and safety, implementation of EATs would not be the optimal solution.

72
6.2. Future Research
The future of airport design has immense potential. As the population in major cities
increases, their airports will need to expand to accommodate more aircraft in size and numbers.
All large aircraft will rely on large hub airports within the NAS, while other aircraft will be more
dependent on smaller and medium sized airports.
The ground expansion of hub airports is expected to be very limited due to geographical
limitations. Similar to road and railroad infrastructure, these geographical limitations could
encourage airport development to follow the trend of vertical expansion. Further enhancements
will be made in the ARENA© model for ORD using the concepts of taxiways passing underneath
the runway. Theoretically, this would eliminate runway-taxiway intersections and nullify the taxi-
time on an EAT. However, a comprehensive simulation and structural analysis of infrastructure
will need to be conducted to test the effects of high traffic loads. Financial and cost-benefit
analyses of the construction and use of such underground taxiways will also need to be examined.
Another enhancement planned in the ORD simulation presented in this thesis will follow the
progress of the SWIM technology (section 1.2). Future aircraft will strongly rely on various
inputs of information from surface detection equipment and virtual queuing mechanisms. The
impact of this technology on pilot/ATC decision-making can be tested. For example, when an
aircraft arrives at a decision point just before crossing an active runway, using SWIM or a derived
algorithm, an optimal decision can be made. The algorithm would calculate the time to cross the
active runway and cross-check it with the information provided by the approaching aircraft,
directing the pilot to cross the runway if deemed safe. As a result, an aircraft would not proceed
to the EAT if a runway crossing was safely executable given the information provided.
73
Bibliography
1. Airbus, Global Market Forecast 2011-2030, 2011.
2. Anagnostakis I., Clarke J.P., Bohme D., Volckers U., 2001, Runway Operations Planning and
Control: Sequencing and Scheduling, Journal of Aircraft Vol. 38, No. 6, Nov–Dec 2001
3. Anagnostakis I., Idris H.R., Clarke J.P., Feron E., Hansman R.J., Odoni A.R., Hall W.D., A Conceptual
Design of a Departure Planner Decision Aid, presented at the 3rd USA/Europe Air Traffic
Management R&D Seminar, Naples, Italy, 13-16 June 2000.
4. MITRE, Capacity Needs in the National Airspace System 2007-2025 – An Analysis of Airports and
Metropolitan Area Demand and Operational Capacity in the Future, 2007.
5. Andersson K., Carr F., Feron E., Hall W., Analysis and Modeling of Ground Operations at Hub
Airports, 3rd USA/Europe Air Traffic Management R&D Seminar Napoli, 13-16 June 2000
6. Atkin J., Burke E., Ravizza S., The Airport Ground Movement Problem: Past and Current Research
and Future Directions, 4th International Conference on Research in Air Transportation, Budapest,
June 01-04, 2010.
7. ATL website Construction Projects, Fifth Runway, http://www.atlanta-
airport.com/Airport/Construction/Construction_Fithrunway.aspx, retrieved on 1st October, 2011.
8. Balakrishnan H., Jung Y., A framework for coordinated surface operations planning at Dallas-Fort
Worth International Airport, Proceedings of the AIAA Guidance, Navigation, and Control Conference,
Hilton Head, USA, 2007.
9. Balakrishnan H., Chandran B., Scheduling Aircraft Landings under Constrained Position Shifting,
AIAA Guidance, Navigation, and Control Conference and Exhibit, Keystone, Colorado, August 2006.
10. Barrer J.N., Swetnam G.F., Weiss W.E., The Feasibility Study of Using Computer Optimization for
Airport Surface Traffic Management, MTR89W00010, The MITRE Corporation, McLean, VA, March
1989.
11. Bonnefoy P., Hansman R., Emergence of Secondary Airports and Dynamics of Secondary Airport
Systems in the U.S., 2005.
12. BTS, Airline On-Time Statistics and Delay Causes,
http://www.transtats.bts.gov/OT_Delay/OT_DelayCause1.asp, retrieved on 10th January, 2012
13. BTS, T-100 market, http://www.transtats.bts.gov/Fields.asp?Table_ID=292, retrieved on 10th January,
2012

74
14. Burgain P., Feron E., Clarke J.P., Collaborative Virtual Queue: Fair Management of Congested
Departure Operations and Benefit Analysis, July 3, 2008.
15. Carr F., Evans A., Clarke J.P., Feron E, Modeling and Control of Airport Queuing Dynamics under
Severe Flow Restrictions, Proceedings of the American Controls Conference, Anchorage, AK, 2002.
16. Chandler, J., The Perimeter Push, Air Transport World, Vol. 6, No. 9, p. 69, September 2009.
17. Chin D., Goldberg J., Tang T., Airport Surface Delays and Causes: A Preliminary Analysis, NASA,
1997
18. City of Chicago, O’Hare Modernization Program website http://www.cityofchicago.org/omp,
retrieved on 1st October, 2011.
19. Cooper W., Chemiavsky E., DeArmon J., Foster G., Mills M., Mohleji S., Zhu F., Determination of
Minimum Push-Back Time Predictability Needed for Near-Term Departure Scheduling using
DEPARTS, The MITRE Corporation CAASD, 2001.
20. Engelland S., Ruszkowski L., Analysis of DFW Perimeter Taxiway Operations, 10th AIAA Aviation
Technology, Integration, and Operations (ATIO) Conference, Fort Worth, Texas, 13 - 15 September
2010.
21. FAA, Airport Obstructions Standards Committee (AOSC) Decision Document #03 Atlanta Runway
8R/26L End-Around Taxiway, 12 July 2004.
22. FAA, Airport Obstructions Standards Committee (AOSC) Decision Document #06 Dallas/Fort Worth
(DFW) End-Around Taxiway System, 8 June 2005.
23. FAA, Airport Obstructions Standards Committee (AOSC) Decision Document #07 National Departure
Case Standard for End-Around Taxiways, 21 September 2006.
24. FAA report, Engineering Briefing No. 75, Incorporation of Runway Incursion Prevention into Taxiway
and Apron Design, 2007.
25. FAA, Air Traffic Organization, Annual Runway Safety Report, 2009
26. FAA, Report to Congress 2009-2013, National Plan of Integrated Airports, 2009.
27. FAA, Next Gen Implementation Plan, March 2010.
28. FAA, Handbook 8083-15A Chapter 8, Revised Edition, 2010.
29. FAA, Aerospace Forecast 2011-2031, 2011
30. FAA website, Airport Planning and Capacity, Airport Categories
http://www.faa.gov/airports/planning_capacity/passenger_allcargo_stats/categories, retrieved on 1st
October, 2011
75
31. FAA Airport Charts website http://www.faa.gov/airports/runway_safety/diagrams/, retrieved on 1st
October, 2011
32. FAA, Aviation System Performance Metrics (ASPM) database, data retrieved on 15th May, 2011
33. FAA, Aviation Safety Information Analysis and Sharing (ASIAS) system, data retrieved on 15th May,
2011
34. Gariel M., Spieser K., Frazzoli E., On the Statistics and Predictability of Go-Arounds., 2011.
35. Hinson D., Howe J., The Del Balzo Report
www.areco.org/Joint%20Statementof%20Hinson%20and%20Howe.pdf, retrieved on 1st October, 2011
36. Husni R., Delcaire B., Anagnostakis I., Hall W.D., Pujet N.,Feron E., Hansman R.J., Clarke J.P.,
Odoni A.R., Identification of Flow Constraints and Control Points in Departure Operations at Airport
System, AIAA 98-4291, Proceedings AIAA Guidance, Navigation and Control Conference, Boston,
MA, August 1998.
37. GAO, Testimony Before the Subcommittee on Aviation, Committee on Transportation and
Infrastructure, House of Representatives, Aviation Safety, 2008
38. Harikiopoulo D., Neogi N., Polynomial Time Feasibility Condition for Multi-Class Aircraft
Sequencing on a Single Runway Airport, IEEE Journal on Intelligent Transportation Systems 2010.
39. ICAO, Manual on the Prevention of Runway Incursions, First Edition, 2007
40. Ignaccolo M., A Simulation Model for Airport Capacity and Delay Analysis, Transportation Planning
and Technology, Vol. 26, No. 2, pp. 135–170, April 2003
41. Kelton D., Sadowski R., Sadowski D., Simulation with Arena, WCB/McGraw-Hill, 1998.
42. Kim C., Akinbodunse D., Nwakamma C., Modelling Arrival Flight Traffic using Arena, Howard
University, Washington, 2008.
43. Kistler M., Gupta G., Relationship between Airport Efficiency and Surface Traffic, AIAA Aviation
Technology, Integration, and Operations Conference (ATIO), Hilton Head, South Carolina, September
2009.
44. Kohler A., Potential Airport Capacity Gains from the Optimal Assignment of Aircraft Types to
Runways, M.S. Thesis, MIT, June 2004.
45. Laskey K., Xu N., Chen C., Propagation of Delays in the National Airspace System, Center for Air
Transportation Research and SEOR Department, George Mason University, 2007
46. Nagarajan K., Vial P., Awyzio G., Simulation of SNMPv3 Traffic Flow Meter MIB Using Arena
Simulation Modelling Software, University of Wollongong, Wollongong, NSW, Australia, 2007.
76
47. NASA SimLabs, Chicago OMP Ultimate-phase Real-time Simulation and Workload Evaluation
(COURSE) http://www.simlabs.arc.nasa.gov/ffc/course.html, 2009.
48. Pesic B., Durand N., Alliot J., Aircraft ground traffic optimization using a genetic algorithm,
Proceedings of the Genetic and Evolutionary Computation Conference, San Francisco, USA, 2001.
49. Ren L., Clarke J.P., Flight-Test Evaluation of the Tool for Analysis of Separation and Throughput,
Journal of Aircraft, Vol. 45, No. 1, January–February 2008
50. Satyamurti S., Runway Incursion Mitigation, Capacity Enhancement and Safety Improvements with
Perimeter Taxiway Operations at Dallas Fort Worth International Airport, PhD Thesis, May 2007
51. Shumsky, Robert A., Real Time Forecasts of Aircraft Departure Queues, Air Traffic Control
Quarterly, Vol. 5(4), 1997.
52. Smeltink J., Soomer M., de Waal P., van der Mei R., Optimisation of Airport Taxi Planning, National
Aerospace Laboratory NLR, 2003
53. Smeltink J., Soomer M, de Waal P, van der Mei R., An optimization model for airport taxi scheduling,
Proceedings of the INFORMS Annual Meeting, Denver, USA, 2004.
54. Subramanian P., A Simulation Study to Investigate Runway Capacity Using TAAM, MBA Aviation
Thesis, Embry Riddle Aeronautical University, 2002.
55. Voulgarellis P.G., Christodoulou M.A.,Boutalis Y.S., A MATLAB Based Simulation Language for
Aircraft Ground Handling Operations at Hub Airports (SLAGOM), Proceedings of the 13th
Mediterranean Conference on Control and Automation, Limassol, Cyprus, 2005.