© 2013 pam wilde interim presentation: developing the b2b offering 1 1. introduction & agenda...
TRANSCRIPT

© 2013 Pam Wilde Interim Presentation: Developing the B2B Offering1
1. Introduction & Agenda
• Situational analysis Competitor analysis Products Pricing and revenue analysis Distribution including customer acquisition and international Process Market sector analysis Customer needs analysis
Headline recommendations Areas to explore

© 2013 Pam Wilde Interim Presentation: Developing the B2B Offering2
2. Definition
• What is “B2B”?“Generating revenue and building reputation from activities in areas other than the
direct education of students”
• Collateral benefits Supports strategic priorities – research engaged, business focussed Greater industry & business relevance of University offering and research Enhanced student / faculty opportunities and experience Community and stakeholder benefits Enhanced reputation with students, academics and businesses/organisations
© 2013 Pam Wilde Interim Presentation: Developing the B2B Offering3
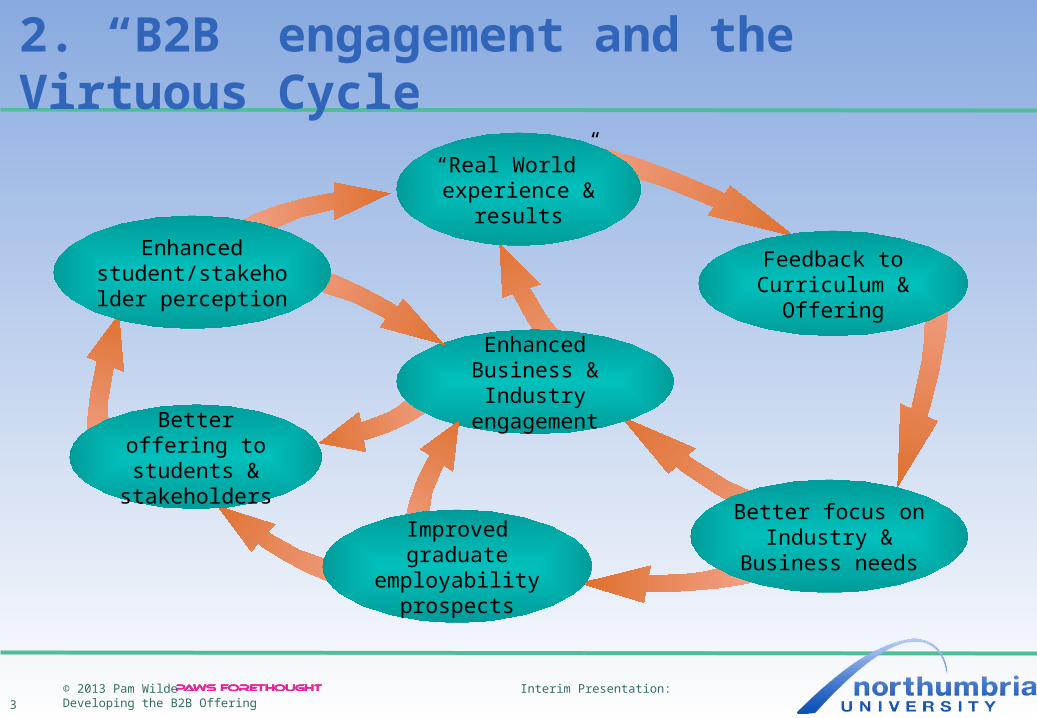
2. “B2B” engagement and the Virtuous Cycle
Enhanced Business & Industry engagement
Feedback to Curriculum & Offering
Better focus on Industry & Business
needsImproved graduate
employability prospects
Enhanced student/stakeholder
perception
Better offering to students &
stakeholders
“Real World” experience &
results

© 2013 Pam Wilde Interim Presentation: Developing the B2B Offering4
3. Situational Analysis: Competitive Set
Blue-chipcredibility
SMEcredibilty
Public & 3rd SectorCredibility
InternationalCredibility
Effective InterfaceAccess & Navigation
Awareness / Saliency
Value
Track-record& Reputation
Partnership /CollaborationCapacity
Proactive
Nimble
PracticalImplementation
Objectivethinking
Innovative/Bleeding edge
Multi-Disciplinary
People experience & expertise
High-endConsultancy
In-houseR&D
Industry SpecialistGroups
NorthumbriaUniversity
• Perceptions of Strengths & Weaknesses

© 2013 Pam Wilde Interim Presentation: Developing the B2B Offering5
3. Situational Analysis: Competitive Set• Perceptions of Strengths & Weaknesses
Blue-chipcredibility
SMEcredibilty
Public & 3rd SectorCredibility
InternationalCredibility
Effective InterfaceAccess & Navigation
Awareness / Saliency
Value
Track-record& Reputation
Partnership /CollaborationCapacity
Proactive
Nimble
PracticalImplementation
Objectivethinking
Innovative/Bleeding edge
Multi-Disciplinary
People experience & expertise
High-endConsultancy
NorthumbriaUniversity

© 2013 Pam Wilde Interim Presentation: Developing the B2B Offering6
3. Situational Analysis: Competitive Set• Perceptions of Strengths & Weaknesses
Blue-chipcredibility
SMEcredibilty
Public & 3rd SectorCredibility
InternationalCredibility
Effective InterfaceAccess &
Navigation
Awareness / Saliency
Value
Track-record& Reputation
Partnership /Collaboration
Capacity
Proactive
Nimble
PracticalImplementation
Objectivethinking
Innovative/Bleeding edge
Multi-Disciplinary
People experience & expertise
In-houseR&D
NorthumbriaUniversity

© 2013 Pam Wilde Interim Presentation: Developing the B2B Offering7
3. Situational Analysis: Competitive Set• Perceptions of Strengths & Weaknesses
CambridgeOxford
Imperial College London
LSE
Durham
University College LondonWarwick
Bath
BristolYork
Southampton
Exeter
King's College LondonNotti ngham
SOASLoughborough
Glasgow
Birmingham
Leicester
Newcastle
Aston
East Anglia
Surrey
Manchester
Liverpool Queen's, Belfast
Royal Holloway
Kent
Reading
Queen MaryCardiff
Essex
Heriot-WattStrathclyde
City
Dundee
KeeleStirling
Aberdeen
Oxford Brookes
Hertfordshire
Aberystwyth
Brunel
Robert Gordon
Ulster
Plymouth
Swansea
Chichester
Goldsmiths College
Huddersfield
University of the Arts, London
West of England, Bristol
Bournemouth
Hull
Sheffield Hallam
Central Lancashire
Birmingham City
Lincoln
Brighton
Winchester Middlesex
Coventry
Bradford
Roehampton
Gloucestershire
Glasgow Caledonian
Westminster
Bangor
University for the Creative Arts
Chester
De Montfort
Portsmouth
Glamorgan
Edinburgh Napier
Bath Spa
Cumbria
Queen Margaret
Kingston
University of Wales, Newport
Teesside
Sunderland
Trinity Saint David
Manchester Metropolitan
West London
Abertay Dundee
Leeds Metropolitan
Salford
Edge Hill
Staffordshire
Canterbury Christ Church
Liverpool John Moores
York St John
Bedfordshire
GlyndwrNorthampton
Worcester
Buckinghamshire New
Derby
Greenwich
Anglia Ruskin
Southampton Solent
West of Scotland
East London
Bolton
London Metropolitan
London South Bank
1.00
1.20
1.40
1.60
1.80
2.00
2.20
2.40
2.60
2.80
3.00
40 45 50 55 60 65 70 75 80 85 90
Rese
arch
Ass
essm
ent
(CU
G 2
013)
Graduate Prospects (CUG 2013)

© 2013 Pam Wilde Interim Presentation: Developing the B2B Offering8
History, History of Art
Art & Design
Comm & Media Studies
Dance, Drama, Cinematics
English
“Modern Languages”
Linguistics
Politics
Social Policy
Sociology
Accounting & Finance
Business Studies
Economics
Hospitality, Tourism etc
Law
Planning, Land, Property etc
Architecture
Building
Computer Science
Engineering Subjects
Geography & Environment
Information Management
Mathematics
Social Policy
Biological & Food Sciences
Chemistry
Education
Nursing & Allied Medical
Psychology
Social Work
Sports Science
1Q
2Q
3Q
4Q
CUG Overall, Research and Graduate Prospects Rank 2013Art, Design & Social
SciencesBusiness & Law Engineering &
EnvironmentHeath &
Life Sciences
3. Situational Analysis: Competitive Set

© 2013 Pam Wilde Interim Presentation: Developing the B2B Offering9
3. Situational Analysis: Products• Product set broadly in-line with HE offerings
Selected opportunities for product development• Strengths & track-record in selected disciplines
Reliance on these few specialisations = future risk• Historically faculty driven
Need integrated & multidisciplinary product approach • Core competencies restricted to specific disciplines
e.g. Student Law Clinic model – expand into other areas Not used capabilities to expand/build reputation in new sectors/disciplines
• CPD and employee training highly rated, research strength variable• Variable customer experience – dependent on individuals• Course delivery options could be more flexible• No obvious prioritisation – capacity and focus issues
© 2013 Pam Wilde Interim Presentation: Developing the B2B Offering10
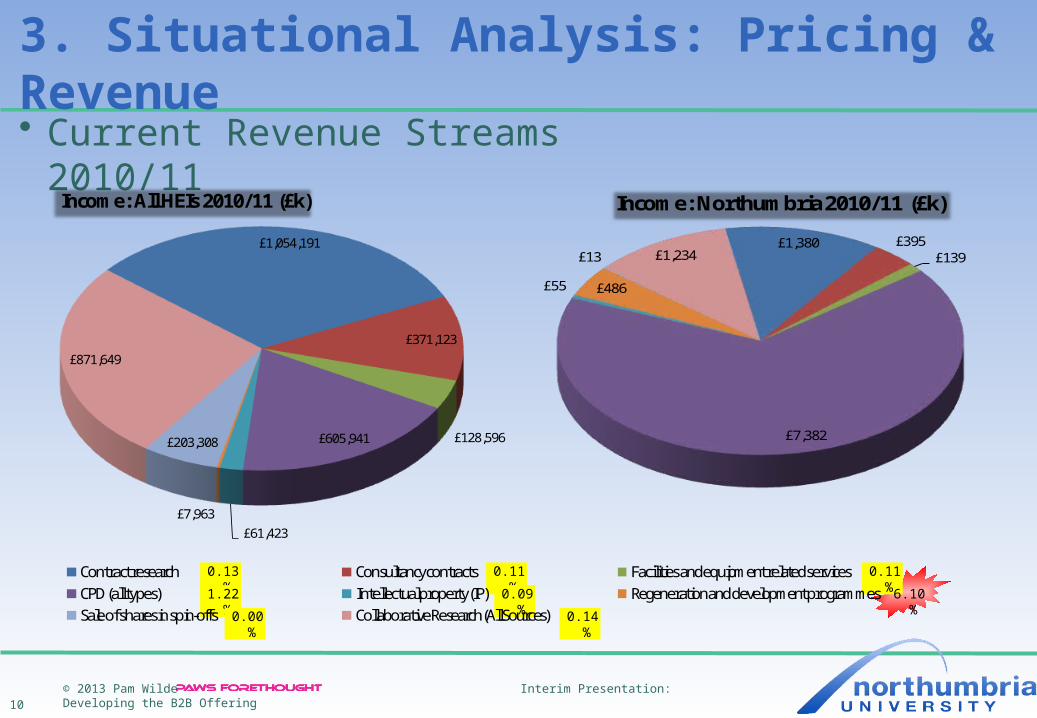
£1,380 £395 £139
£7,382
£55 £486
£13 £1,234
Income: Northumbria 2010/11 (£k)
3. Situational Analysis: Pricing & Revenue• Current Revenue Streams 2010/11
£1,054,191
£371,123
£128,596 £605,941
£61,423 £7,963
£203,308
£871,649
Income: All HEIs 2010/11 (£k)
Contract research Consultancy contracts Facilities and equipment related servicesCPD (all types) Intellectual property (IP) Regeneration and development programmesSale of shares in spin-offs Collaborative Research (All Sources)
0.13% 0.11% 0.11%
1.22% 0.09% 6.10%
0.00% 0.14%
© 2013 Pam Wilde Interim Presentation: Developing the B2B Offering11
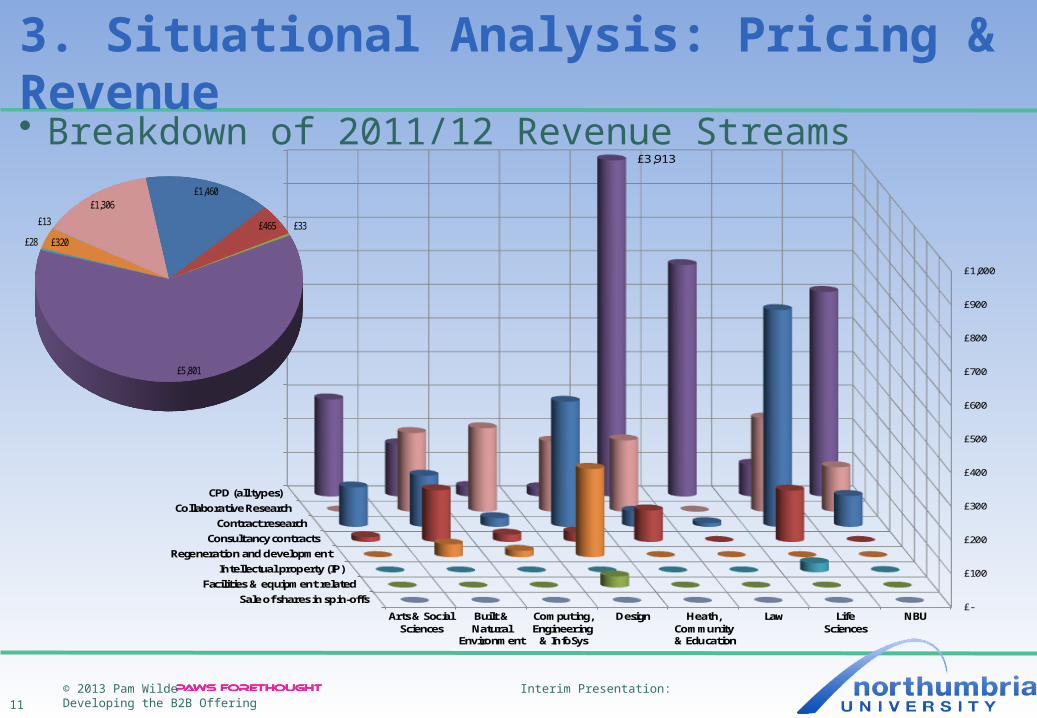
3. Situational Analysis: Pricing & Revenue• Breakdown of 2011/12 Revenue Streams
Sale of shares in spin-offsFacilities & equipment related
Intellectual property (IP)Regeneration and development
Consultancy contractsContract research
Collaborative ResearchCPD (all types)
£-
£100
£200
£300
£400
£500
£600
£700
£800
£900
£1,000
Arts & SocialSciences
Built &Natural
Environment
Computing,Engineering & InfoSys
Design Heath,Community
& Education
Law LifeSciences
NBU
£3,913
£1,460
£465 £33
£5,801
£28 £320
£13
£1,306

© 2013 Pam Wilde Interim Presentation: Developing the B2B Offering12
3. Situational Analysis: Pricing & Revenues• Pricing internally focussed and faculty based
cost plus, lack of transparency/consistency Lack of clarity around margins – overall and by discipline/market
• Strengths & track-record in selected disciplines But ... insensitive to market trends and opportunities
• Limited understanding around different revenue stream profitability e.g. research margin % and value versus consultancy
• Disproportionate income from CPD Not a bad thing per se, but a source of risk
• Benchmarking data not readily/easily available Barrier to understanding and creating external/competitor focus
• Use to inform where resources best deployed

© 2013 Pam Wilde Interim Presentation: Developing the B2B Offering13
3. Situational Analysis: Revenues• Surprisingly low contribution from SMEs• Consultancy largest revenue generator for SMEs (£56m). Contract research contributes
£40m, as does equipment/facilities. • SME income increasing – indicates increasing appetite and engagement to innovate SME
products and services.Figure 1 Total income by partner 2003-04 to 2010-11 (real terms)

© 2013 Pam Wilde Interim Presentation: Developing the B2B Offering14
3. Situational Analysis: Revenues• Contract research represents largest opportunity, with largest demand from public and
third sector• Consultancy services offer similar market opportunity to CPD• As pressure mounts on public sector spending, large business spending next attractive
opportunityFigure 2 Selected HE-BCI income streams 2003-04 to 2010-11 (real terms) Figure 3 Income by activity and partner 2010-11

© 2013 Pam Wilde Interim Presentation: Developing the B2B Offering15
3. Situational Analysis: Revenues• Consultancy & Contract Research income
Collaborative research presents potential opportunity due to nebulous nature – plays to partnership strengths and project specific expertise.
But ... often multi-disciplinary Non-commercial and SMEs increasing spending on contract research
Figure 6 Contract research income 2003-04 to 2010-11 (real terms)Figure 7 Consultancy income 2003-04 to 2010-11 (real terms)
© 2013 Pam Wilde Interim Presentation: Developing the B2B Offering16
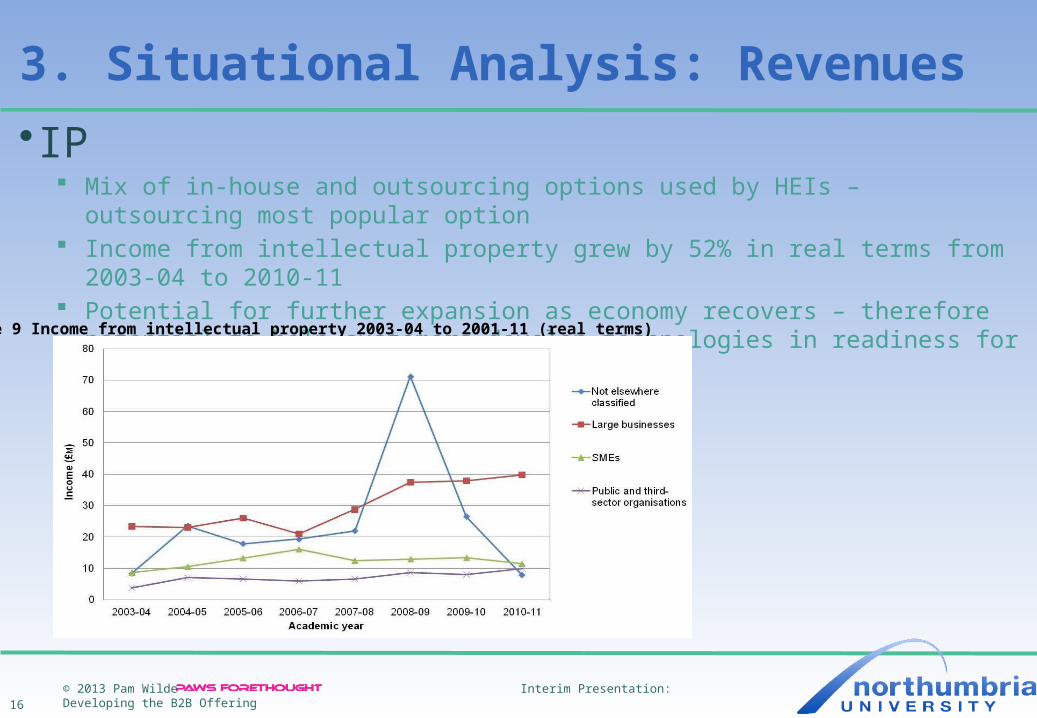
3. Situational Analysis: Revenues• IP
Mix of in-house and outsourcing options used by HEIs – outsourcing most popular option Income from intellectual property grew by 52% in real terms from 2003-04 to 2010-11 Potential for further expansion as economy recovers – therefore potential to help customers
develop technologies in readiness for upturn
Figure 9 Income from intellectual property 2003-04 to 2001-11 (real terms)

© 2013 Pam Wilde Interim Presentation: Developing the B2B Offering17
3. Situational Analysis: Revenues• CPD
Figure 14 CPD and continuing education 2010-11 High proportion of CPD from
public sector plays to Northumbria University's strengths
But...potential risk through over-reliance
Opportunity to take CPD/training/personal skills training competencies into new disciplines and areas
Need to articulate clearly the generic capabilities and target audience benefits

© 2013 Pam Wilde Interim Presentation: Developing the B2B Offering18
3. Situational Analysis: Revenues• Facilities & EquipmentFigure 8 Facilities and equipment 2003-04 to 2010-11 (real terms)
• Northumbria University's facilities stand up well against other HE offerings
• Large businesses increased their spending • Opportunity to leverage to build business
relationships as well as generate income – focussing on combination of facilities with leading edge expertise – not each in isolation
• Need to understand if any facilities are unique in what they offer
• Opportunity to invite businesses to experience and also offer virtual tours to potential students
• Market focus more on technology e.g. digital media suites, wind tunnels
• Vocational facilities e.g. sports centres could be used to support wider offering e.g. sports psychology
© 2013 Pam Wilde Interim Presentation: Developing the B2B Offering19
3. Situational Analysis: Revenues
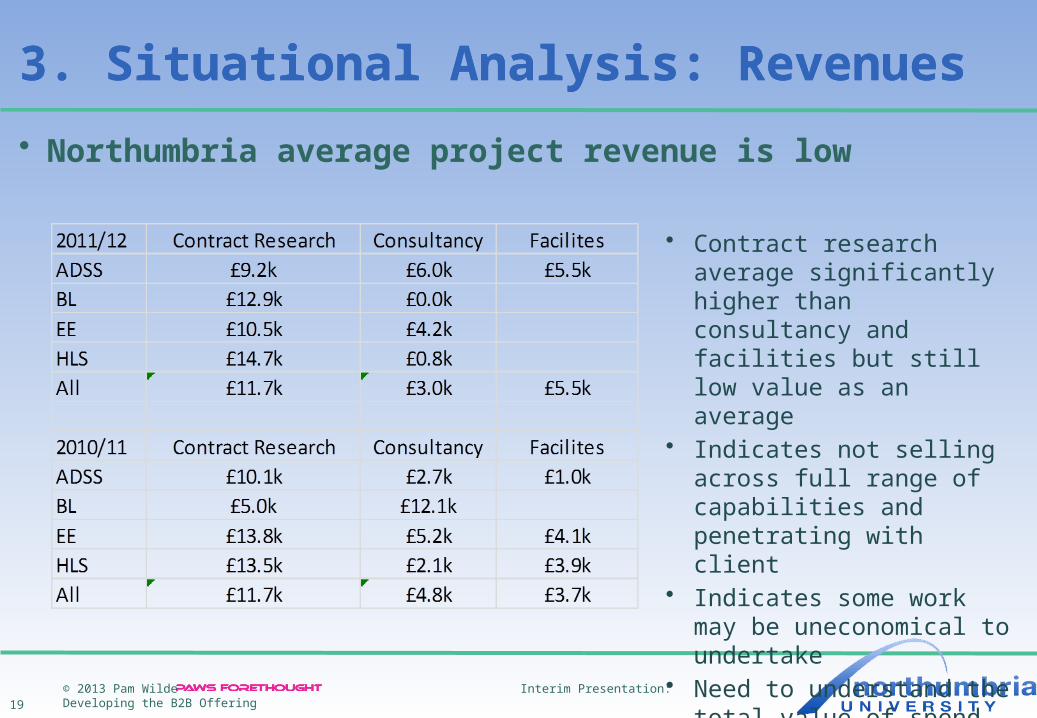
• Northumbria average project revenue is low
3. Situational Analysis: Revenues
• Contract research average significantly higher than consultancy and facilities but still low value as an average
• Indicates not selling across full range of capabilities and penetrating with client
• Indicates some work may be uneconomical to undertake
• Need to understand the total value of spend over a period to see if small pieces of work are successfully converted into larger projects

© 2013 Pam Wilde Interim Presentation: Developing the B2B Offering20
3. Situational Analysis: Process• Customer Acquisition
Unclear Process – does not support full capabilities Competing priorities and issues with capacity to deliver Not easy to navigate around the University and find the right person Industry feedback indicates identifying and engaging with academics is
a major barrier for external clients (in particular SMEs) Demonstrated ability to focus on the process of design & methodology Not maximised this capability or communicated competency CRM system & process being introduced – crucial to successful
acquisition strategy – behavioural change required Must provide information to support proactive BDM lead generation
• e.g. finding target companies/companies similar to university successes,• e.g. holding information on existing customers including contact details & routes to access• e.g. won/lost reporting and analysis of opportunities• Performance metrics support behaviours and focus
© 2013 Pam Wilde Interim Presentation: Developing the B2B Offering21
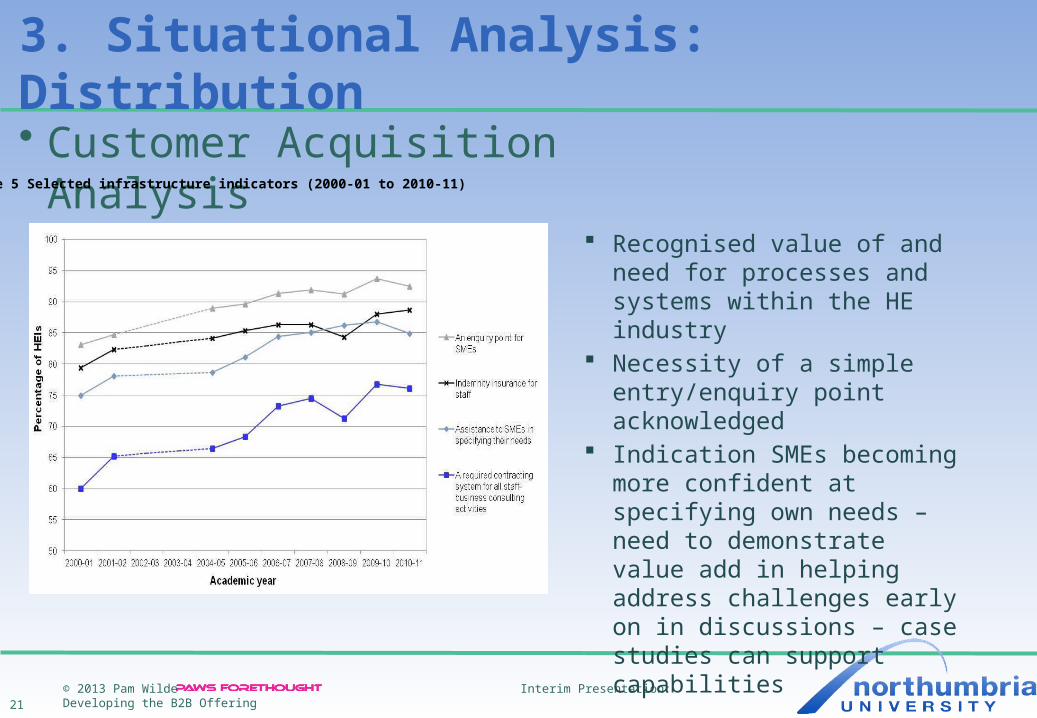
3. Situational Analysis: Distribution• Customer Acquisition Analysis
Figure 5 Selected infrastructure indicators (2000-01 to 2010-11)
Recognised value of and need for processes and systems within the HE industry
Necessity of a simple entry/enquiry point acknowledged
Indication SMEs becoming more confident at specifying own needs – need to demonstrate value add in helping address challenges early on in discussions – case studies can support capabilities

© 2013 Pam Wilde Interim Presentation: Developing the B2B Offering22
3. Situational Analysis: Distribution• Customer Acquisition Analysis
Figure 4 Incentives for staff to engage with business and the community 2000-01 to 2010-11
In response to the question ‘How would you rate the level of incentives for staff at your HEI to engage with Business and the Community?’
HE staff recognise the importance of engaging with businesses – the challenge is to provide the processes and develop the capability to optimise the opportunity

© 2013 Pam Wilde Interim Presentation: Developing the B2B Offering23
3. Situational Analysis: Distribution
• International development - 1 Handled through international office independently of BDMs International office focus is on student recruitment Most of business is from Middle East – have the money to invest
• Risk of over-reliance on this Region• Monitor and seek out opportunities globally
International sales model: individual reps covering specific countries talk to sponsors to communicate Uni benefits
• need resources and capabilities to offer full range and demonstrate wide range of experience• Indications not promoting/focussing on all opportunities/disciplines e.g. not strong in oil and
gas – growing market opportunity and synergies with Middle East
Success measures not clearly defined or co-ordinated with BDMs
© 2013 Pam Wilde Interim Presentation: Developing the B2B Offering24
3. Situational Analysis: Distribution• International – 2
Businesses think in terms of product and capability Reputation important for overseas – based on what delivered and
longevity/heritage Basic Marketing support not supplied: for example
• brand messages e.g. quality, environment• specific sector/discipline competency examples• digital and soft copy communications• translated versions

© 2013 Pam Wilde Interim Presentation: Developing the B2B Offering25
3. Situational Analysis: Best Practice
• NDC – Design Centre Good reputation. Innovative. Good at problem identification and issue
definition. Cross-disciplinary – bring together and lead cross-functional teams.
Focuses on the process of design and methodology rather than individual products
Demonstrated ability to work successfully with large companies e.g. Unilever, Mars; as well as SMEs
Designers good at e.g. blogs – use to promote university and engage with wider business community
Opportunity to use core competencies of NDC and also share best practices
© 2013 Pam Wilde Interim Presentation: Developing the B2B Offering26
3. Situational Analysis: Best Practice Examples
• Coventry University Business engagement focus
• Newcastle University• MIT – ILP (Industry Liaison Programme)
membership model
• Cranfield communication of industry/student benefits
• Lancaster multi-disciplinary branded “Imagination”
© 2013 Pam Wilde Interim Presentation: Developing the B2B Offering27
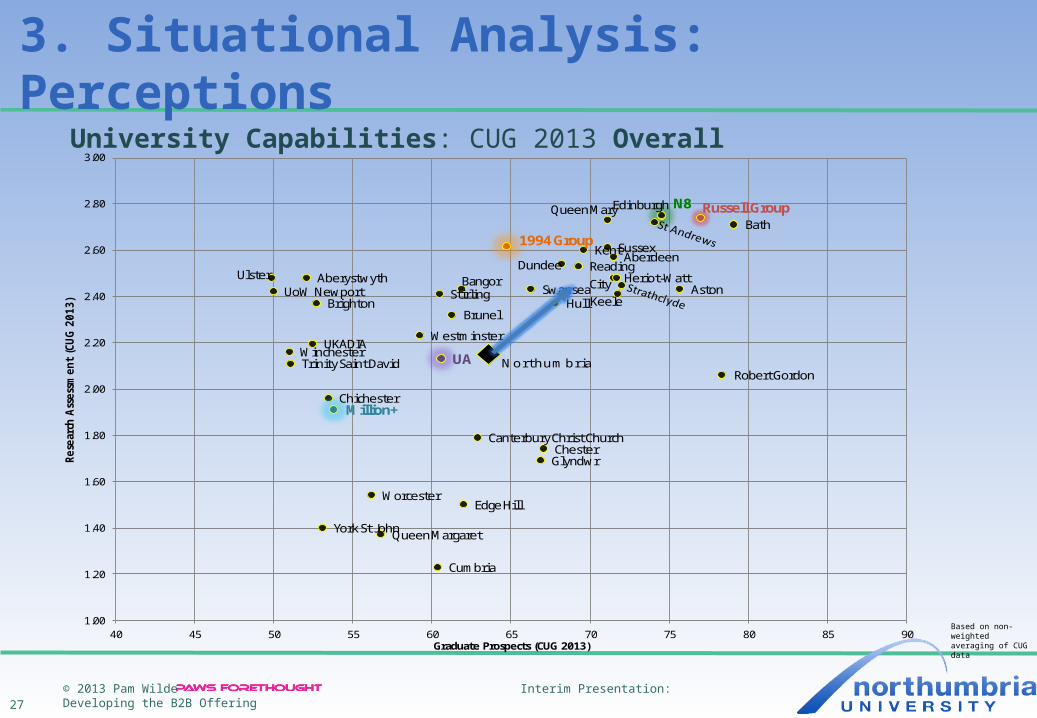
3. Situational Analysis: Perceptions
Edinburgh N8 Russell GroupQueen MaryBath
1994 Group SussexKent AberdeenDundee Reading
Ulster Aberystwyth Heriot-WattCityBangorSwansea AstonUoW Newport Stirling
KeeleBrighton HullBrunel
WestminsterUKADIA
WinchesterNorthumbriaUATrinity Saint David
Robert Gordon
ChichesterMillion+
Canterbury Christ ChurchChesterGlyndwr
WorcesterEdge Hill
York St JohnQueen Margaret
Cumbria
1.00
1.20
1.40
1.60
1.80
2.00
2.20
2.40
2.60
2.80
3.00
40 45 50 55 60 65 70 75 80 85 90
Rese
arch
Ass
essm
en
t (C
UG
201
3)
Graduate Prospects (CUG 2013)
University Capabilities: CUG 2013 Overall
Based on non-weighted averaging of CUG data

© 2013 Pam Wilde Interim Presentation: Developing the B2B Offering28
3. Situational Analysis: Perceptions
CambridgeOxford
Imperial College London
LSE
Durham
University College LondonWarwick
Bath
BristolYork
Southampton
Exeter
King's College LondonNotti ngham
SOASLoughborough
Glasgow
Birmingham
Leicester
Newcastle
Aston
East Anglia
Surrey
Manchester
Liverpool Queen's, Belfast
Royal Holloway
Kent
Reading
Queen MaryCardiff
Essex
Heriot-WattStrathclyde
City
Dundee
KeeleStirling
Aberdeen
Oxford Brookes
Hertfordshire
Aberystwyth
Brunel
Robert Gordon
Ulster
Plymouth
Swansea
Chichester
Goldsmiths College
Huddersfield
University of the Arts, London
West of England, Bristol
Bournemouth
Hull
Sheffield Hallam
Central Lancashire
Birmingham City
Lincoln
Brighton
Winchester Middlesex
Coventry
Bradford
Roehampton
Gloucestershire
Glasgow Caledonian
Westminster
Bangor
University for the Creative Arts
Chester
De Montfort
Portsmouth
Glamorgan
Edinburgh Napier
Bath Spa
Cumbria
Queen Margaret
Kingston
University of Wales, Newport
Teesside
Sunderland
Trinity Saint David
Manchester Metropolitan
West London
Abertay Dundee
Leeds Metropolitan
Salford
Edge Hill
Staffordshire
Canterbury Christ Church
Liverpool John Moores
York St John
Bedfordshire
GlyndwrNorthampton
Worcester
Buckinghamshire New
Derby
Greenwich
Anglia Ruskin
Southampton Solent
West of Scotland
East London
Bolton
London Metropolitan
London South Bank
1.00
1.20
1.40
1.60
1.80
2.00
2.20
2.40
2.60
2.80
3.00
40 45 50 55 60 65 70 75 80 85 90
Re
sear
ch A
sse
ssm
en
t (
CU
G 2
01
3)
Graduate Prospects (CUG 2013)
University Capabilities: CUG 2013 Overall
Based on non-weighted averaging of CUG data

© 2013 Pam Wilde Interim Presentation: Developing the B2B Offering29
3. Situational Analysis: PerceptionsUniversity Capabilities – Art, Design & Social Sciences Subjects: CUG 2012
Based on non-weighted averaging of CUG data
Aberdeen
Aberystwyth
Arts University College at Bournemouth
Aston
Bangor
BathBrighton
Brunel
Canterbury Christ Church
CS of Speech and Drama
Chester
Chichester
City
Courtauld Institute
Cumbria
Dundee
Edge Hill
Edinburgh
Falmouth
Glyndwr
Heriot-Watt
Hull
Kent
Leeds TrinityMillion+
N8
Newman
Norwich UCotA
Queen Margaret
Queen Mary
Reading
Robert Gordon
Russell Group
St Andrews
St Mary's
Strathclyde
Sussex
Swansea
Trinity Saint David
UA UKADIA
Ulster UoW NewportWestminster
Winchester
WorcesterYork St John
Northumbria
Average of Averages
1.00
1.50
2.00
2.50
3.00
3.50
30 35 40 45 50 55 60 65 70 75 80
Rese
arch
Ass
essm
ent
(CU
G 2
012)
Graduate Prospects (2012)ADSS

© 2013 Pam Wilde Interim Presentation: Developing the B2B Offering30
3. Situational Analysis: Perceptions
1994 Group
Aberdeen
Aberystwyth
Aston
Bangor
Bath
Brighton
Brunel
Canterbury Christ Church
ChesterChichester
City
Dundee Heriot-Watt
Hull
Keele
Million+
N8
Queen Margaret
Queen Mary
Reading
Robert Gordon
St Andrews
St Mary's
Stirling
Sussex
Swansea
UA
Ulster
Westminster
Northumbria
Average of Averages
1.00
1.50
2.00
2.50
3.00
3.50
30 40 50 60 70 80
Re
sear
ch A
sse
ssm
en
t (C
UG
20
12
)
Graduate Prospects (CUG 2012)B&L
University Capabilities – Business & Law Subjects: CUG 2012
Based on non-weighted averaging of CUG data
© 2013 Pam Wilde Interim Presentation: Developing the B2B Offering31
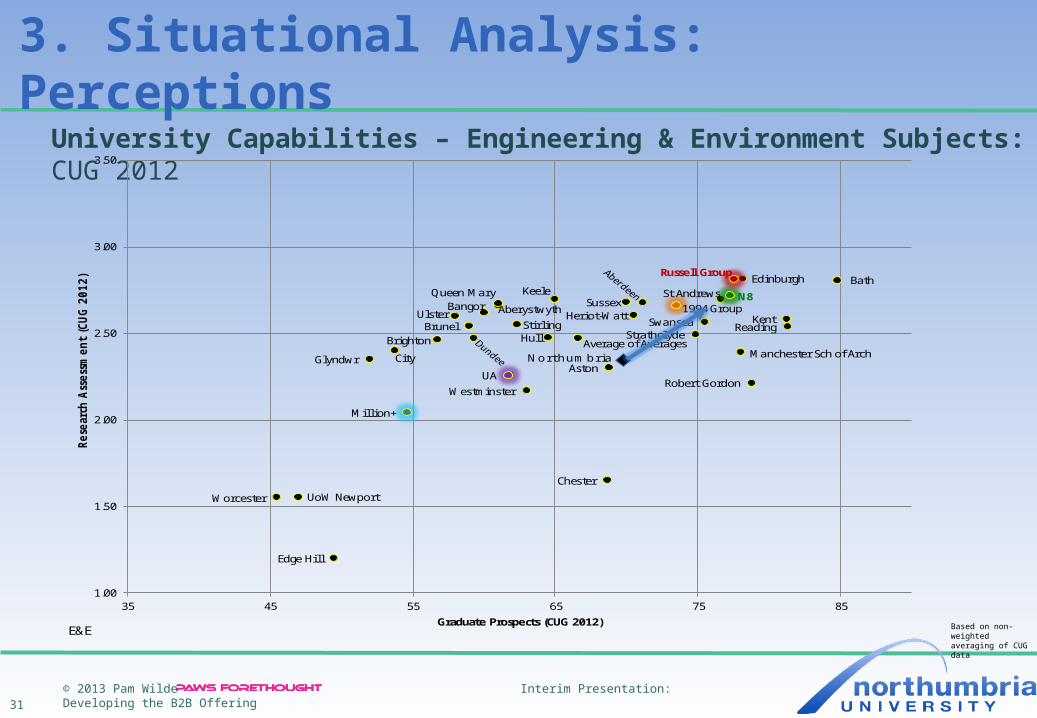
3. Situational Analysis: Perceptions
1994 GroupAberystwyth
Aston
Bangor
Bath
BrightonBrunel
Chester
City
Edge Hill
Edinburgh
Glyndwr
Heriot-Watt
Hull
Keele
Kent
Manchester Sch of Arch
Million+
N8Queen Mary
Reading
Robert Gordon
Russell Group
St Andrews
StirlingStrathclyde
Sussex
Swansea
UA
Ulster
UoW Newport
Westminster
Worcester
NorthumbriaAverage of Averages
1.00
1.50
2.00
2.50
3.00
3.50
35 45 55 65 75 85
Re
sear
ch A
sse
ssm
en
t (C
UG
20
12
)
Graduate Prospects (CUG 2012)E&E
University Capabilities – Engineering & Environment Subjects: CUG 2012
Based on non-weighted averaging of CUG data

© 2013 Pam Wilde Interim Presentation: Developing the B2B Offering
32
3. Situational Analysis: PerceptionsUniversity Capabilities – Health & Life Sciences Subjects: CUG 2012
Aberdeen
Aberystwyth
Aston
Bangor
Bath
Brighton
Brunel
Canterbury Christ ChurchChester
Chichester
CityDundee
Edge Hil l
Edinburgh
Glyndwr
Harper AdamsHeriot-Watt
Hull
KeeleKent
Kingston/St George's, UoL
Leeds Trinity
Million+
N8
Newman
Queen Margaret
Queen MaryReading
Robert Gordon
Russell Group
St Andrews
St Mary's
Stirling
Strathclyde
Sussex
Swansea
UA
Ulster
UoW Newport
Westminster
Winchester
Worcester
York St John
NorthumbriaAverage of Averages
1.00
1.50
2.00
2.50
3.00
3.50
55 60 65 70 75 80 85 90 95 100
Graduate ProspectsH&LS

© 2013 Pam Wilde Interim Presentation: Developing the B2B Offering33
3. Situational Analysis: PerceptionsUniversity Capabilities - Art, Design & Social Science Subjects (all HEIs): CUG 2012
Based on non-weighted averaging of CUG data
Aberdeen
AberystwythAnglia Ruskin
Arts University College at Bournemouth
Aston
Bangor
Bath
Bath Spa
Bedfordshire
Birmingham
Birmingham City
Bolton
Bournemouth
Bradford
BrightonBristol
Brunel
Cambridge
Canterbury Christ Church
Cardiff
Cardiff Metropolitan
Central Lancashire
Central School of Speech and Drama
Chester
Chichester
City
Courtauld Institute
Coventry
Cumbria
De Montfort
Derby
Dundee
Durham
East Anglia
East London
Edge Hill
Edinburgh
Edinburgh Napier
Essex
Exeter
Falmouth
Glamorgan
Glasgow
Glasgow Caledonian
Gloucestershire
Glyndwr
Goldsmiths College
Greenwich
Heriot-Watt
Hertfordshire
Huddersfield
Hull
KeeleKent
King's College London
Kingston
Lancaster
Leeds
Leeds Metropolitan
Leeds Trinity
Leicester
Lincoln
Liverpool
Liverpool John Moores
London Metropolitan
London School of Economics
London South Bank
Loughborough
Manchester
Manchester Metropolitan
Middlesex
Newcastle
NewmanNorthampton
Northumbria
Norwich UCA
Nottingham
Nottingham Trent
Oxford
Oxford Brookes
Plymouth
Plymouth St Mark and St John
Portsmouth
Queen Margaret
Queen Mary
Queen's, BelfastReading
Robert Gordon
Roehampton
Royal Holloway
Salford
Sheffield
Sheffield Hallam
SOAS
Southampton
Southampton Solent
St Andrews
St Mary'sStaffordshire
Stirling
StrathclydeSunderland
Surrey
Sussex
Swansea
Teesside
Trinity Saint David
Ulster
University College London
University for the Creative Arts
University of the Arts, London
UoW, Newport
Warwick
West London
West of England, Bristol
West of Scotland
Westminster
Winchester
York
York St John
1.00
1.50
2.00
2.50
3.00
3.50
30 35 40 45 50 55 60 65 70 75 80 85
Re
sear
ch A
sse
ssm
en
t
Graduate ProspectsAD&SS

© 2013 Pam Wilde Interim Presentation: Developing the B2B Offering34
3. Situational Analysis: PerceptionsUniversity Capabilities – Business & Law Subjects (all HEIs): CUG 2012
Based on non-weighted averaging of CUG data
Aberdeen
Abertay Dundee
Aberystwyth
Aston
Bangor
Bath
Bedfordshire
Birmingham
Bolton
Bournemouth
Bradford
Brighton
Bristol
Brunel
Canterbury Christ Church
Cardiff
Cardiff Metropolitan
Chester
Chichester
City
Coventry
De Montfort
Dundee
Durham
East Anglia
East London
Edinburgh
Edinburgh Napier
Essex
Exeter
Glamorgan
Glasgow
Glasgow Caledonian
Gloucestershire
Goldsmiths College
Greenwich
Heriot-Watt
Hertfordshire
Huddersfield
Hull
Keele
KentKing's College London
Kingston
LancasterLeeds
Leeds Metropolitan
Leicester
Lincoln
Liverpool
Liverpool John MooresLondon Metropolitan
London South Bank
Loughborough
Manchester
Middlesex
Newcastle
Northampton
Northumbria
Nottingham
Nottingham Trent
Oxford Brookes Plymouth
Portsmouth
Queen Margaret
Queen Mary
Queen's, Belfast
Reading
Robert Gordon
Roehampton
Royal Holloway
Salford
Sheffield
Sheffield Hallam
SOAS
Southampton
St Andrews
St Mary's
Staffordshire
Stirling
Strathclyde
Sunderland
Surrey Sussex
Swansea
Teesside
Ulster
University College London
Warwick
West of England, Bristol
West of Scotland
Westminster
York
Grand Total
1.00
1.50
2.00
2.50
3.00
3.50
30 35 40 45 50 55 60 65 70 75 80 85
Re
sear
ch A
sse
ssm
en
t
Graduate ProspectsB&L

© 2013 Pam Wilde Interim Presentation: Developing the B2B Offering35
3. Situational Analysis: PerceptionsUniversity Capabilities – Engineering & Environment (all HEIs): CUG 2012
Based on non-weighted averaging of CUG data
AberdeenAberystwyth
Aston
Bangor
Bath
Bath Spa
Bedfordshire
Birmingham
Birmingham City
Bolton
Bournemouth
Bradford
Brighton
Bristol
Brunel
Cambridge
Cardiff
Chester
City
Coventry
De Montfort
Dundee
Durham
East Anglia
East London
Edge Hill
Edinburgh
Glamorgan
Glasgow Caledonian
Gloucestershire
Glyndwr
Goldsmiths College
Greenwich
Heriot-Watt
Hertfordshire
Huddersfield
Hull
Imperial College London
Keele
Kent
Kingston
Leeds Metropolitan
Leicester
Lincoln
Liverpool
Liverpool John Moores
London Metropolitan
London School of Economics
London South Bank
Manchester Metropolitan
Manchester School of Architecture
Middlesex
Newcastle
Northumbria
Nottingham
Nottingham Trent
Oxford
Oxford Brookes
Plymouth
Portsmouth
Queen Mary
Queen's, Belfast Reading
Robert Gordon
Royal Holloway
Salford
Sheffield
Sheffield Hallam
Southampton
Southampton Solent
Staffordshire
Stirling
Strathclyde
Sunderland
Surrey
Sussex
Teesside
Ulster
University College London
University of Wales, Newport
Warwick
West London
West of England, Bristol
West of Scotland
Worcester
Average of Averages
1.00
1.50
2.00
2.50
3.00
3.50
35 40 45 50 55 60 65 70 75 80 85 90
Re
sea
rch
Ass
ess
me
nt
Graduate ProspectsE&E
© 2013 Pam Wilde Interim Presentation: Developing the B2B Offering36
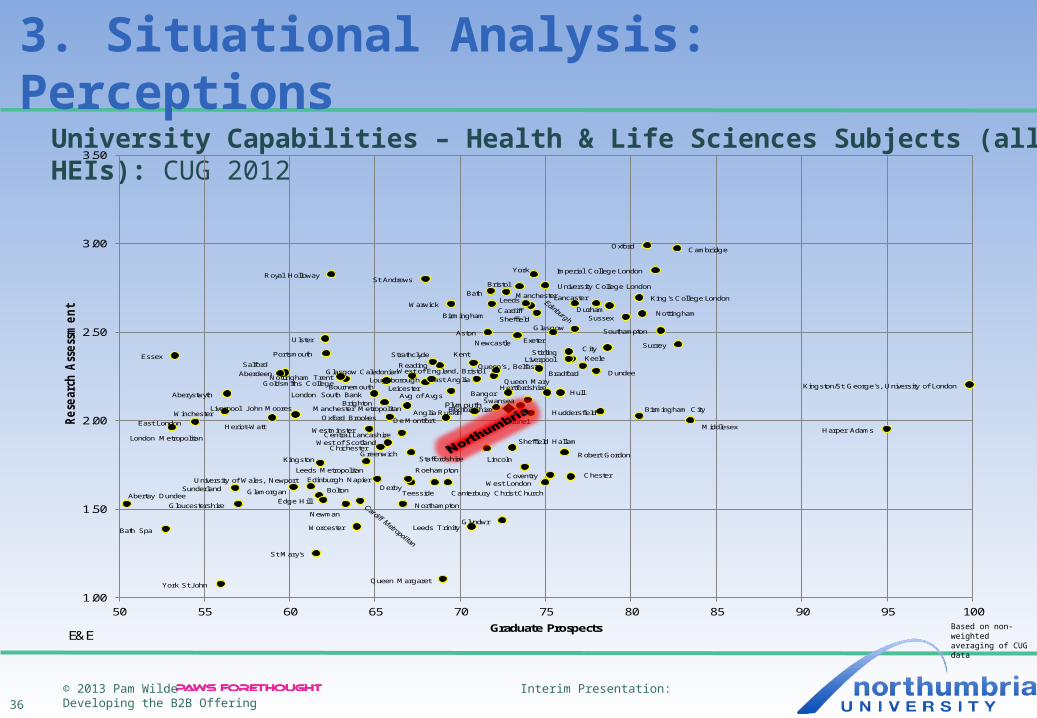
3. Situational Analysis: PerceptionsUniversity Capabilities – Health & Life Sciences Subjects (all HEIs): CUG 2012
Based on non-weighted averaging of CUG data
Aberdeen
Abertay Dundee
Aberystwyth
Anglia Ruskin
Aston
Bangor
Bath
Bath Spa
Bedfordshire
Birmingham
Birmingham City
Bolton
Bournemouth
Bradford
Brighton
Bristol
Brunel
Cambridge
Canterbury Christ Church
Cardiff
Central Lancashire
Chester
Chichester
City
Coventry
De Montfort
Derby
Dundee
Durham
East Anglia
East London
Edge Hill
Edinburgh Napier
Essex
Exeter
Glamorgan
Glasgow
Glasgow Caledonian
Gloucestershire
Glyndwr
Goldsmiths College
Greenwich
Harper AdamsHeriot-Watt
Hertfordshire
Huddersfield
Hull
Imperial College London
KeeleKent
King's College London
Kingston
Kingston/St George's, University of London
LancasterLeeds
Leeds Metropolitan
Leeds Trinity
Leicester
Lincoln
Liverpool
Liverpool John Moores
London Metropolitan
London South Bank
Loughborough
Manchester
Manchester Metropolitan
Middlesex
Newcastle
NewmanNorthampton
Nottingham
Nottingham Trent
Oxford
Oxford Brookes
Plymouth
Portsmouth
Queen Margaret
Queen Mary
Queen's, BelfastReading
Robert Gordon
Roehampton
Royal Holloway
Salford
Sheffield
Sheffield Hallam
Southampton
St Andrews
St Mary's
Staffordshire
StirlingStrathclyde
Sunderland
Surrey
Sussex
Swansea
Teesside
Ulster
University College London
University of Wales, Newport
Warwick
West London
West of England, Bristol
West of Scotland
Westminster
Winchester
Worcester
York
York St John
Avg of Avgs
1.00
1.50
2.00
2.50
3.00
3.50
50 55 60 65 70 75 80 85 90 95 100
Re
sear
ch A
sse
ssm
en
t
Graduate ProspectsE&E
© 2013 Pam Wilde Interim Presentation: Developing the B2B Offering37
4. Market Analysis
• Sectors & Trends Economic recession and challenges – impact on spending, investment, innovation and
skills development Identify and develop plans to maximise opportunities in emerging markets and
growing sectors Reduction in Public Sector spending increases need to diversify Winding down of Regional Development Agencies means new relationships may need
to be established Impact arising from e.g. changes in e.g. HE Innovation Funding need to be assessed
and quantified Possible opportunities arising out of legislative and political changes e.g. freeing up
legal market, CRE disbanding

© 2013 Pam Wilde Interim Presentation: Developing the B2B Offering38
5. Customer Needs Analysis
• Businesses think in terms of product and (multi-disciplinary) capability• Business Needs from Graduates
Graduate leadership, management & communication skills Graduate ‘real-world’ &/or workplace experience Basic & fundamental skills Common sense, commercial perspective Independent thought and & problem solving capabilities Self motivation, passionate, positive attitude
• Articulate these outcomes in collateral – in business language• Demonstrate how they are integrated into courses and adopted by
graduates• Student needs driven by business needs re employability
© 2013 Pam Wilde Interim Presentation: Developing the B2B Offering39
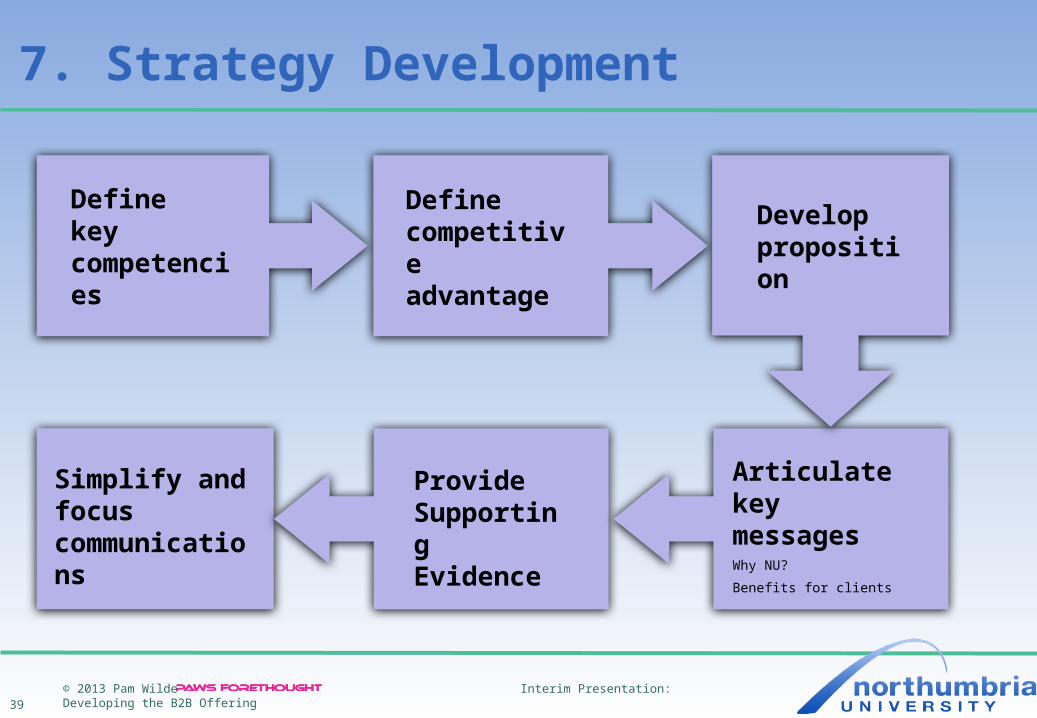
7. Strategy Development
Define keycompetencies
Define competitive advantage
Provide Supporting Evidence
Simplify and focus communications
Articulate key messagesWhy NU?
Benefits for clients
Develop proposition

© 2013 Pam Wilde Interim Presentation: Developing the B2B Offering40
8. Headline findings – early indications• Recommended areas to explore
Develop a clear proposition for engaging business community
Internally focussed – need to focus on external market & customer needs
Prioritise resources and activities based on market needs
Develop brand positioning based on market needs and competitive advantages
Develop multi-disciplinary capability and positioning
Communications – key messages, simply articulated and presented
Process improvements: e.g. easier access and interface with University
Develop sales strategy that supports delivery of University objectives
Embed business thinking and terminology in the University

© 2013 Pam Wilde Interim Presentation: Developing the B2B Offering41
8. Headline findings – early indications• (Marketing) organisational recommendations
Remits more externally focussed: international, market, customer, competitor
Increased market intelligence and competitor monitoring focus Dedicated B2B resource –
• “go to” person in Marketing who “lives” B2B Specific communications, brand and digital B2B responsibilities
incorporated into Marketing roles Specific Brand and Communications Strategy Manager role
covering B2B as part of remit B2B Product Manager
• focus on developing multi-disciplinary portfolio

© 2013 Pam Wilde Interim Presentation: Developing the B2B Offering42
8. Headline findings – early indications• Cultural recommendations
Investigate option of Commercial Manager – with B2B accountabilities – responsibilities to include pricing and analysis of BDM activity/wins/losses• Supports move to university being more commercially focussed
Emphasis on centralisation in the short to medium term until disciplines embedded• Enables control, consistency• Dedicated resource to focus on agreed priorities and demonstrate importance• Supports focus on market-led multi-disciplinary rather than individual faculty focus• Facilitates cultural change and sharing of learning/best practice• Need to ensure supports move to being more proactive and nimble
Hold e.g. market insight and best practice sessions