© 2013 src developing practical and meaningful cyber security metrics for the enterprise matthew...
TRANSCRIPT

© 2013 SRC
Developing Practical and Meaningful Cyber Security Metrics for the Enterprise
Matthew Sweeney - SRC, Inc.
Benjamin Pokines – SRC, Inc.
1

PR 13-2701 2
State of enterprise cyber security metrics• Current practices• Gaps
Proposed metrics• Description• Formulation• Experiments/results
Analysis and future directions of metrics• “Ideal” metrics• Applications• Future work
Goal of the Talk
PR 13-2701 3
Cyber security metrics often focus on compliance and exposure to risk• Number of attack vectors• Duration of exposure• etc.
Gaps exist in measuring security operations intelligence• And in turn, business risk & cost• Improved metrics and metrics reporting would improve cyber
security intelligence
Major issue is outcome, not just compliance• E.g., down machines, increased threat exposure
Problem Description
PR 13-2701 4
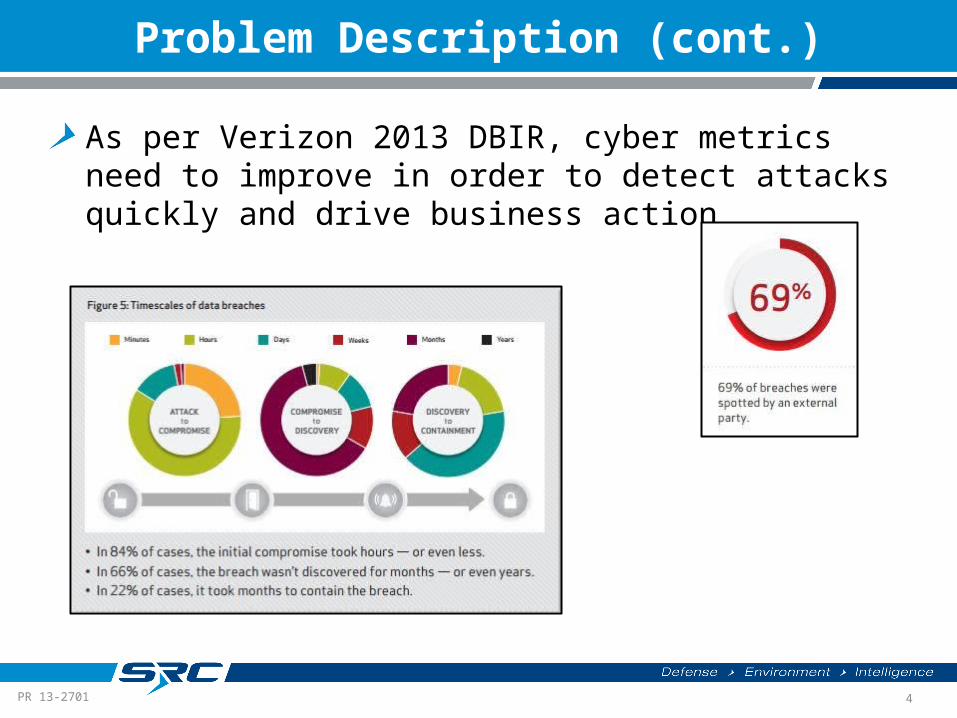
As per Verizon 2013 DBIR, cyber metrics need to improve in order to detect attacks quickly and drive business action
Problem Description (cont.)

PR 13-2701
Current Cyber Security Practice
5
Sensors Audit Logs
Collect & SIEM React
Network Threats
Host Threats
Vulnerabilities
Log Aggregation & Reporting
PR 13-2701 6
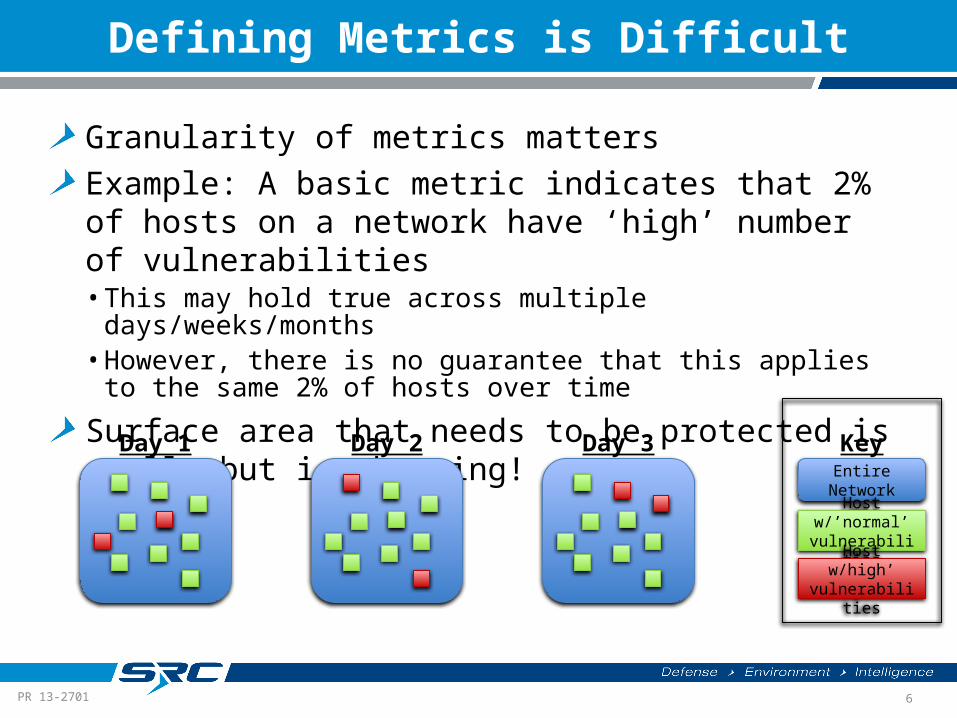
Granularity of metrics matters
Example: A basic metric indicates that 2% of hosts on a network have ‘high’ number of vulnerabilities• This may hold true across multiple days/weeks/months• However, there is no guarantee that this applies to the same 2% of
hosts over time
Surface area that needs to be protected is small, but is changing!
Defining Metrics is Difficult
Day 1 Day 2 Day 3
Entire Network
Host w/’normal’ vulnerabilities
Host w/high’ vulnerabilities
Key

PR 13-2701 7
Goals and Objectives
Approach
Aspects of comprehensive cyber security metrics
Component breakdown
Results & Findings• Characterization• Trends
Limitations
Recommendations
SRC Cyber Security Metrics

PR 13-2701
High level metrics that normalize across sensors to paint a picture of overall health of information systems• Near real time
Think credit score• Amount of debt : Number of threats detected• Active lines of credit : Number of assets on the network• Credit score : Hackability Index score
Facilitate discovery and cyber intelligence as opposed to strictly monitoring• Idea is for metrics to develop information and show how things are
changing over time
Designed as an in-house experiment with the commercial market in mind• Specifically, management and executive level personnel
Metrics Goals and Objectives
8
PR 13-2701
Hackability Index Goals
9
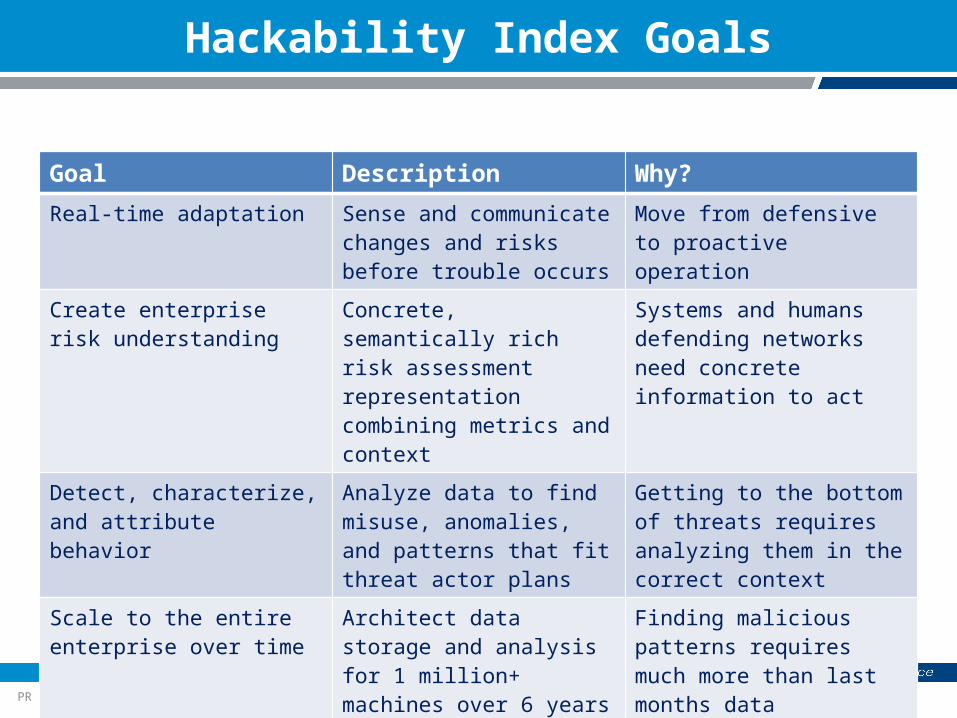
Goal Description Why?
Real-time adaptation Sense and communicate changes and risks before trouble occurs
Move from defensive to proactive operation
Create enterprise risk understanding
Concrete, semantically rich risk assessment representation combining metrics and context
Systems and humans defending networks need concrete information to act
Detect, characterize, and attribute behavior
Analyze data to find misuse, anomalies, and patterns that fit threat actor plans
Getting to the bottom of threats requires analyzing them in the correct context
Scale to the entire enterprise over time
Architect data storage and analysis for 1 million+ machines over 6 years of data
Finding malicious patterns requires much more than last months data

PR 13-2701 10
Interviews with team at DHS ICE SOC, SRC IT• Initial effort – develop ‘crib sheet’ of relevant events given triggers
from metrics
Met with internal IT team on multiple occasions• Glean what information is important to them and what is already
available
Met with SRC executive team• Determine what, at that level, is useful and actionable
Developed a list of over 60 metrics
Reduced ~20-25 metrics into 6 categories
Approach

PR 13-2701 11
Baseline and delta of observed cyber security metrics• e.g., attack surface; threats, reinfections,
persistent infections; outbound traffic trends
Behavior models and patterns• Internal Vulnerabilities, Infections, and Persistent
Threats
• External Communications and 3rd Party Associations
• Internal and External Exposures and Likelihood to Enable Threats(Employee Behavior)
Open-source information• New vulnerabilities with available exploits
• External Threat Environment and Attack Intel
What is Hackability?

PR 13-2701 12
Hackability Index I Operational Concept
Business Hackability

PR 13-2701 13
Continuously updated
Contextually rich• Internal cyber defense activity• External attack activity and user behavior profile• Connection to business operations and outcome
Deal in atoms of data over time
Can be consistently applied to different time periods of data (one hour vs. one day vs. one month)
Bonus – metrics that can be fully automated from security sensor logs• Log types that are supported under this work are:− Netscreen (firewall)
− Tipping point (IPS)
− Secunia (assets/vulnerabilities)
− Symantec (scheduled & manual A/V)
− Cisco Ironport (web proxy)
Aspects of Comprehensive Metrics

PR 13-2701 14
Sans Top 20• Critical Control 5: Malware Defenses• Critical Control 14: Maintenance, Monitoring, and Analysis of Security Audit
Logs
NIST 800-53
Support of Critical Controls
Family Class ControlSecurity Assessment and Authorization
Management CA-7 CONTINUOUS MONITORING
Incident Response Operational IR-5 INCIDENT MONITORINGIR-6 INCIDENT REPORTINGIR-7 INCIDENT RESPONSE ASSISTANCE
Risk Assessment Management RA-3 RISK ASSESSMENT
System and Information Integrity
Operational SI-4 INFORMATION SYSTEM MONITORINGSI-5 SECURITY ALERTS, ADVISORIES, AND DIRECTIVES

PR 13-2701 15
The Hackability Index is currently patent pending
Hackability Index
Hackability Index
Defense Effectiveness
Index
Technical Debt Index
Opportunity Risk Index
New Detections
Index
Surface Area Index
Length Of Score History
Index
Proportion of machines on the network
that have been compromised
to some degree
Proportion of total detection activity relative to number of assets (as
compared with recent past)
Severity of current
detections compared to max possible severity that
could be seen
Number of current threats that are ‘new’ (haven’t been
spotted on network in
past N days)
Number of network
assets that currently have
threat detections
Proportion of time that each
sensor has been online
and reporting

PR 13-2701 16
Hackability Index I Scoring Components
Index Component
Description Meaning
Defense Effectiveness
Level of reinfections on your network, weighted by severity
A low score could suggest that your tools for mitigating infections need improvement.
Length of History
History of data available for index computations for each sensor
A low score indicates the immaturity of sensor use and ability to log its history
New Threats Threats detected by your network sensors not seen (recently).
A low score could suggest new or upcoming infection trends.
Opportunity Risk Overall severity of threats on your network A low score indicates that there are many high
severity threats, and these should be addressed.
Surface Area Percentage of assets producing detections by your sensors
A low score indicates there are many hosts with activity for your sensors.
Technical Debt Overall threat activity to key assets on your network
A low score indicates there has been an increase in threat activity relative to historical values

PR 13-2701 17
Opportunity Risk Index
Opportunity risk is designed to show how the severity of current threat detections compares to the maximum possible severity that could be seen
Calculation for each sensor, i;
And finally, combining all of the sensors together:

PR 13-2701 18
Opportunity Risk Index Example
Firewall (weight = 1.0)24 Threat Detections
Severity = 1 (9)Severity = 3 (1)Severity = 4 (14)
Max Severity is 5
A/V (weight = 2.0)11 Threat Detections
Severity = 1 (1)Severity = 3 (10)
Max Severity is 3
Firewall (weight = 1.0)19 Threat Detections
Severity = 1 (8)Severity = 2 (10)Severity = 5 (1)
Max Severity is 5
Opportunity Risk Index Score (weight = 10)
= 3.0
PR 13-2701 19
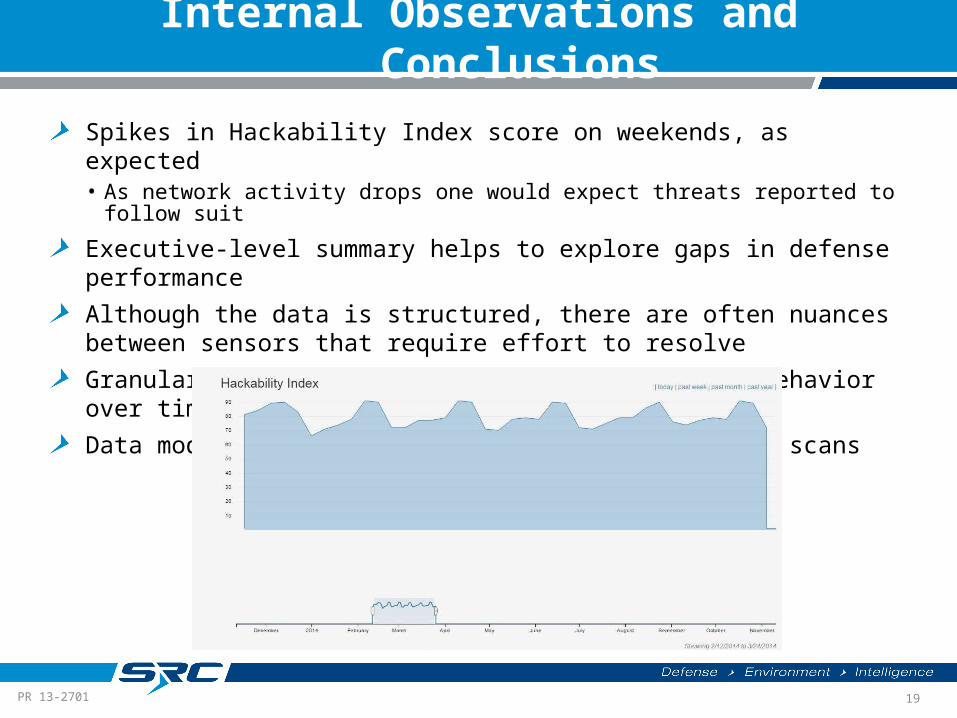
Spikes in Hackability Index score on weekends, as expected• As network activity drops one would expect threats reported to follow suit
Executive-level summary helps to explore gaps in defense performance
Although the data is structured, there are often nuances between sensors that require effort to resolve
Granularity matters – there is a story in user behavior over time
Data models expected patterns of threat and vuln scans
Internal Observations and Conclusions

PR 13-2701 20
Applications
Industry could use as a standard form of measurement
Executives could use as a tool to determine network health vs. IT expenditures
Applications in insurance industry, mergers & acquisitions, takeovers, etc.
Limitations
Near real time
Works only with what sensors report
Vulnerability sensor data
Unknown unknowns
Deploying Hackibility

PR 13-2701 21
Real-time behavior analysis
Incorporating risk from external indicators• Example could be malware in the wild
Patch and vulnerability sensor data
Predictive analytics• Using known attack vectors as models to predict when an attack is
imminent or in-process• Using external indicators combined with observed events to predict
a coming attack
Future Directions
PR 13-2701 22
Matthew Sweeneymsweeney at srcinc dot com
Benjamin Pokinesbpokines at srcinc dot com
Questions?