© 2014 sabrina nilufar
TRANSCRIPT

© 2014 SABRINA NILUFAR

EXPERIMENTAL INVESTIGATION OF STRUCTURE, COMPOSITION AND PROPERTIES OF NOVEL METAL-CARBON COVETIC MATERIALS
BY
SABRINA NILUFAR
DISSERTATION
Submitted in partial fulfillment of the requirements for the degree of Doctor of Philosophy in Mechanical Engineering
in the Graduate College of the University of Illinois at Urbana-Champaign, 2014
Urbana, Illinois
Doctoral Committee:
Professor Iwona Jasiuk, Chair Professor Karin A Dahmen Professor Lourdes Salamanca-Riba Professor Martin Ostoja-Starzewski Associate Professor Amy Wagoner Johnson

II
ABSTRACT
Covetics are novel metal-carbon materials invented by Third Millennium Materials
(TM2), LLC (Waverly, Ohio). In these materials metals such as copper, aluminum, zinc, silver,
gold or other base metals or their alloys are combined with high weight percent of carbon
powder (up to 9 wt %) in a new way.
In this dissertation an experimental investigation was carried out to study mechanical
properties, structure and composition (carbon content) of copper and aluminum alloy-based
covetics. Covetic materials of 7075 Al, 6061 Al and 10200 Cu alloys obtained from TM2 were
tested. 7075 Al materials were warm rolled while the other two materials were as-cast and no
heat treatment was done on any of the samples. The 7075 Al covetic materials had carbon
contents of 0, 3 and 5 wt%, 10200 Cu covetic materials had carbon contents of 0, 3, 5 and 9 wt%
and 6061 Al covetic materials had carbon contents of 0 and 2.3 wt% as reported by TM2. The
mechanical properties of covetics were measured by tensile test (Young’s modulus, 0.2% yield
strength, ultimate tensile strength, and elongation), Charpy impact test (energy absorption),
nanoindentation (elastic modulus and hardness) and Vickers and Rockwell methods (hardness).
Scanning Electron Microscopy (SEM) and X-ray Diffraction (XRD) were used to analyze the
structure of these materials. Carbon content of covetic materials was examined by Energy
Dispersive Spectroscopy (EDS) and X-ray Photoelectron Spectroscopy (XPS). The experimental
results indicate significant changes in the mechanical properties and structure of covetics with
increasing carbon content. For Al covetics, mechanical testing showed the following
enhancements in properties over the corresponding base materials: higher 0.2% yield strength
and ultimate tensile strength, higher hardness (Rockwell, Vickers and nanoindentation), higher

III
energy absorption (impact energy) and lower density, as carbon content increased. XRD showed
an increase in the lattice constant and a decrease in the average crystallite size with carbon
increase. However, for the Cu covetics there was an optimum wt% of carbon beyond which the
properties did not improve. In summary, the covetics studied in this dissertation exhibited
improved mechanical properties with an increase in the carbon content which make them
promising candidates for many engineering applications.

IV
To my beloved husband, Farhan
V
ACKNOWLEDGEMENTS
I would like to express my sincere appreciation and gratitude to my Ph.D. advisor, Dr.
Iwona M. Jasiuk, for her continuous guidance, inspiration, encouragement and support
throughout this whole project.
I would also like to thank Jason Shugart, Lou Luedtke and Harry Couch from Third
Millennium Materials, LLC (TM2) for supplying covetic materials for this study and for helpful
discussions. I would also like to thank Dr. Lourdes Salamanca-Riba for providing me lots of
great ideas and insightful discussion throughout the project. I want to extend my gratitude to Dr.
Karin A. Dahmen, Dr. Amy J. Wagoner Johnson and Dr. Martin Ostoja-Starzewski for serving
on my dissertation committee and for providing me feedbacks.
I wish to deeply acknowledge the friendship and support I have received from Jessica C.
Mullen, Jennifer Mott Peuker and the many others in my department and at the university over
the years. I also want to thank the fine gentlemen in the MechSE machine shop and I appreciate
the support of many of the MechSE staff, specifically Kathy Smith and Laura Baylor.
Special thanks to Dr. Jim Mabon, Dr. Mauro Sardela, Scott Robinson, Dr. Danielle Gray
for their training and valuable assistance with different equipment used in this study. I wish to
thank my group members for providing motivation and constructive discussions.
I wish to thank my parents, siblings, my husband and my 5 year old daughter Zoya for
their never-ending love and support.
Finally, I would like to acknowledge financial support from the NSF grant (CMMI:
#1234130). Note that any opinions, findings, and conclusions or recommendations expressed in

VI
this material are those of the author and do not necessarily reflect the views of the National
Science Foundation.

VII
TABLE OF CONTENTS
LIST OF TABLES ........................................................................................................................ XI
LIST OF FIGURES ..................................................................................................................... XII
CHAPTER 1: INTRODUCTION ....................................................................................................1
1.1 Background ......................................................................................................................1
1.2 Dissertation statement ......................................................................................................3
1.3 Dissertation outline ..........................................................................................................3
1.4 References ........................................................................................................................5
CHAPTER 2: LITERATURE REVIEW .........................................................................................8
2.1 Metallic materials.............................................................................................................8
2.2 Metal matrix composites ..................................................................................................9
2.3 Metal carbon composites ...............................................................................................11
2.3.1 Aluminum carbon metal matrix composites ..........................................................11
2.3.1.1 Cold spraying ...............................................................................................14
2.3.1.2 Plasma spraying ...........................................................................................15
2.3.2 Copper carbon metal matrix composites................................................................19
2.3.2.1. Spark Plasma Sintering (SPS) ......................................................................20
2.3.2.2. Ball milling ..................................................................................................21
2.4 Interfacial bonding .........................................................................................................24
2.5 Covetics..........................................................................................................................26
2.6 References ......................................................................................................................30
CHAPTER 3: CHARACTERIZATION OF ROLLED 7075 AL COVETICS .............................37
3.1 Introduction ....................................................................................................................37
3.2 Materials and Methods ...................................................................................................39
3.2.1 Materials ................................................................................................................39

VIII
3.2.2 Calculation of 7075 Al-C phase diagrams ...........................................................39
3.2.3 Density measurement ...........................................................................................39
3.2.4 Indentation testing ................................................................................................40
3.2.5 Tensile testing ......................................................................................................41
3.2.6 X-ray Diffraction (XRD) analysis .......................................................................42
3.2.7 Scanning Electron Microscopy (SEM) imaging ..................................................42
3.2.8 X-ray Photoelectron Spectroscopy (XPS) analysis..............................................43
3.3 Results ............................................................................................................................44
3.3.1 Calculation of 7075 Al-C phase diagrams ...........................................................44
3.3.2 Density measurement ...........................................................................................45
3.3.3 Indentation testing ................................................................................................46
3.3.4 Tensile testing ......................................................................................................48
3.3.5 X-ray Diffraction (XRD) analysis .......................................................................51
3.3.6 Scanning Electron Microscopy (SEM) imaging ..................................................53
3.3.7 X-ray Photoelectron Spectroscopy (XPS) analysis..............................................56
3.4 Discussion ......................................................................................................................56
3.4.1 Calculation of 7075 Al-C phase diagrams ...........................................................56
3.4.2 Density measurement ...........................................................................................56
3.4.3 Indentation testing ................................................................................................57
3.4.4 Tensile testing ......................................................................................................58
3.4.5 X-ray Diffraction (XRD) analysis .......................................................................59
3.4.6 Scanning Electron Microscopy (SEM) imaging ..................................................61
3.4.7 X-ray Photoelectron Spectroscopy (XPS) analysis..............................................64
3.5 Conclusions ....................................................................................................................65
3.6 References ......................................................................................................................66

IX
CHAPTER 4: CHARACTERIZATION OF AS CAST 10200 CU COVETICS ..........................72
4.1 Introduction ....................................................................................................................72
4.2 Materials and Methods ...................................................................................................73
4.2.1 Materials ..............................................................................................................73
4.2.2 Density measurement ...........................................................................................74
4.2.3 Hardness testing ...................................................................................................74
4.2.4 Charpy impact testing ..........................................................................................75
4.2.5 Tensile testing ......................................................................................................76
4.2.6 X-ray Diffraction (XRD) analysis .......................................................................78
4.2.7 Scanning Electron Microscopy (SEM) imaging ..................................................78
4.3 Results ............................................................................................................................79
4.3.1 Density measurement ...........................................................................................79
4.3.2 Hardness testing ...................................................................................................80
4.3.3 Charpy impact testing ..........................................................................................81
4.3.4 Tensile testing ......................................................................................................82
4.3.5 X-ray Diffraction (XRD) analysis .......................................................................85
4.3.6 Scanning Electron Microscopy (SEM) imaging ..................................................88
4.4 Discussion ......................................................................................................................91
4.4.1 Density measurement ...........................................................................................91
4.4.2 Hardness testing ...................................................................................................91
4.4.3 Charpy impact testing ..........................................................................................92
4.4.4 Tensile testing ......................................................................................................93
4.4.5 X-ray Diffraction (XRD) analysis .......................................................................95
4.4.6 Scanning Electron Microscopy (SEM) imaging ..................................................97
4.5 Conclusions ..................................................................................................................101

X
4.6 References ....................................................................................................................102
CHAPTER 5: CHARACTERIZATION OF AS CAST 6061 AL COVETICS ..........................106
5.1 Introduction ..................................................................................................................106
5.2 Materials and Methods .................................................................................................107
5.2.1 Materials ............................................................................................................107
5.2.2 Density measurement .........................................................................................108
5.2.3 Hardness testing .................................................................................................108
5.2.4 Charpy impact testing ........................................................................................109
5.2.5 Scanning Electron Microscopy (SEM) imaging ................................................110
5.2.6 X-ray Diffraction (XRD) analysis .....................................................................110
5.3 Results ..........................................................................................................................111
5.3.1 Density measurement .........................................................................................111
5.3.2 Hardness testing .................................................................................................112
5.3.3 Charpy impact testing ........................................................................................112
5.3.4 Scanning Electron Microscopy (SEM) imaging ................................................114
5.3.5 X-ray Diffraction (XRD) analysis .....................................................................116
5.4 Discussion ....................................................................................................................118
5.4.1 Density measurement .........................................................................................118
5.4.2 Hardness testing .................................................................................................119
5.4.3 Charpy impact testing ........................................................................................119
5.4.4 Scanning Electron Microscopy (SEM) imaging ................................................120
5.4.5 X-ray Diffraction (XRD) analysis .....................................................................122
5.5 Conclusions ..................................................................................................................123
5.6 References ....................................................................................................................124
CHAPTER 6: CONCLUSIONS, LIMITATIONS AND RECOMMENDATIONS ...................128

XI
LIST OF TABLES
Table 2.1. Calculated contact and true wear values for cold sprayed Al-CNT coatings [20] .......14
Table 2.2. Nanomechanical properties of cold-sprayed Al-CNT properties [20] ..........................15
Table 2.3. Mechanical properties and microstructural features of plasma sprayed Al-CNT MMC [23] .................................................................................................................................................16
Table 2.4. Macro-wear rate of plasma-sprayed coatings [23] .......................................................17
Table 2.5. Friction and nano wear resistance improvement data from nano-scratch test [23] ......18
Table 2.6. Reaction for metals and the reinforcements at <800°C processing [44] ......................25
Table 3.1. Measured and theoretically obtained densities of 7075 Al covetics .............................46
Table 3.2. Carbon content of the materials by EDS and XPS .......................................................54
Table 3.3. Comparison of elastic modulus and hardness of 7075 Al from literature ...................57
Table 4.1. Measured and theoretically obtained densities of 10200 Cu covetics .........................80
Table 4.2. Rockwell and Vickers Hardness of 10200 Cu covetics ...............................................80
Table 4.3. Charpy impact testing results of 10200 Cu covetics ....................................................81
Table 4.4. SEM-EDS analysis of 10200 Cu covetics ...................................................................90
Table 4.5. Mechanical properties of 10200 Cu alloy (MatWeb Materials Property Data) ...........92
Table 5.1. Measured and theoretically obtained densities of 6061 Al covetics .........................111
Table 5.2. Rockwell and Vickers Hardness of 6061 Al covetics ...............................................112
Table 5.3. Charpy impact testing results of 6061 Al covetics ....................................................113
Table 5.4. Carbon content of 6061 Al covetics by EDS .............................................................116

XII
LIST OF FIGURES
Figure 2.1. Global outlooks of metal-matrix composites by different industries from 2004 to 2013 [10] ........................................................................................................................................10
Figure 2.2. Schematic diagram of cold spray process [14] ............................................................12
Figure 2.3. Schematic diagram of plasma spraying [15] ...............................................................13
Figure 2.4. Temporal wear-profiles of plasma-sprayed coatings showing volume loss [23] ........17
Figure 2.5. Cu-C phase diagram [33].............................................................................................20
Figure 2.6. (e) Cu matrix with 10 wt% (f) Cu matrix with 15 wt% [34] .......................................21
Figure 2.7. Hardness vs wt. % CNT addition (f) in Cu-CNT MMC [35] ......................................21
Figure 2.8. Hardness vs. wt. % of MWCNT in Cu-CNT MMC [36] ............................................22
Figure 2.9. Hardness vs wt. % of SWCNT in Cu-CNT MMC [36] ..............................................23
Figure 2.10. He-ion fractured image of as-extruded aluminum 6061 covetic 3 wt% carbon [53] ....
........................................................................................................................................................26
Figure 2.11. SEM image of as-extruded aluminum 6061 cv 3wt% showing carbon network [53] ...
........................................................................................................................................................27
Figure 2.12. HRTEM image of a Cu cv 5wt% sample showing modulation [53] .........................28
Figure 2.13. Stress vs. strain behavior comparison of covetic and non-covetic as-extruded Al-6061 [52] ........................................................................................................................................29
Figure 2.14. Stress vs. strain curves for centrifugally cast covetic and non-covetic copper [52] ..29
Figure 3.1. Preparation of tensile samples in different directions .................................................42
Figure 3.2. Predicted phase diagram of 7075 A1-C system [S-PHASE (Al2CuMg), T-PHASE (Zn-Mg-Al-rich phase)] .................................................................................................................45
Figure 3.3. Vickers and Rockwell B hardness (Kgf/mm2) versus carbon content ........................47
Figure 3.4. Elastic Modulus (Es) versus carbon content measured by nanoindentation .............47
Figure 3.5. Hardness (H) versus carbon content measured by nanoindentation ..........................48

XIII
Figure 3.6. UTS with different carbon content and orientation .....................................................49
Figure 3.7. 0.2% YS with different carbon content and orientation ...............................................49
Figure 3.8. E with different carbon content and orientation ..........................................................50
Figure 3.9. % EL with different Carbon content and orientation...................................................50
Figure 3.10. A typical example of the XRD pattern is shown for 7075 aluminum with increasing wt% of C ........................................................................................................................................51
Figure 3.11. Effect of wt% of C on the average crystallite size of 7075 aluminum ......................52
Figure 3.12. Changes in lattice parameter due to different wt% of C in 7075 aluminum .............52
Figure 3.13. Changes in lattice strain due to different wt% of C in 7075 aluminum ....................53
Figure 3.14. SEM images (250 x) of fractured surfaces of 7075 covetic with 0 (left) and 5 wt% C (right) .............................................................................................................................................54
Figure 3.15. SEM images (800 x) of fractured surfaces of 7075 covetic with 0 (left) and 5 wt% C (right) .............................................................................................................................................55
Figure 3.16. High magnification SEM images of fractured surfaces of 7075 covetic with 0 (left)
and 5 wt% C (right)........................................................................................................................55
Figure 3.17. Images before and after tensile testing ......................................................................59
Figure 3.18. The Hall–Petch effect for 7075 Al covetics compared to the experimental values for the yield strength ............................................................................................................................60
Figure 3.19. SEM-EDS analysis of 7075 Al covetic with 0 wt% C (point 1 showed some Fe, Cu rich Al while points 2, 3 and 4 are Al rich matrix .........................................................................62
Figure 3.20. SEM-EDS analysis of 7075 Al covetic with 3 wt% C (point 1 showed amorphus carbon; point 2 was Sodium Carbonate (Na2CO3); point 3 was Aluminum Carbide (Al4C3); points 4 and were Al rich matrix; point 6 was Oxygen rich area ..................................................63
Figure 3.21. SEM-EDS analysis of 7075 Al covetic with 5 wt% C (points 1 and 5 were Aluminum Carbide (Al4C3); points 2 and 4 were Amorphus carbon; points 3 and 8 were Al rich matrix; point 6 was T-PHASE (Zn-Mg-Al-rich phase) and point 7 was S-PHASE (Al2CuMg) ..64
Figure 4.1. Longitudinal and transverse samples for hardness testing .........................................75
Figure 4.2. Geometry of Charpy V-notch impact testing sample .................................................76

XIV
Figure 4.3. Goemetry of tensile testing samples ...........................................................................77
Figure 4.4. Photographs of Charpy impact fracture surfaces of 10200 Cu covetics ...................82
Figure 4.5. UTS with different wt % of carbon ...........................................................................83
Figure 4.6. 0.2% YS with different wt % of carbon ....................................................................83
Figure 4.7. E with different wt % of carbon ................................................................................84
Figure 4.8. Ultimate tensile strain with different wt % of carbon ...............................................84
Figure 4.9. X-ray diffraction patterns of 10200 Cu covetics for different carbon content ..........85
Figure 4.10. Effect of Carbon content on the average crystallite size of 10200 Cu covetics ......86
Figure 4.11. Effect of Carbon content on the lattice parameter of 10200 Cu covetics ................87
Figure 4.12. Effect of Carbon content on the lattice strain of 10200 Cu covetics .......................87
Figure 4.13. SEM images of the Charpy impact fracture surfaces at 200x of 10200 Cu covetics (a) 0 wt% C, (b) 3 wt% C, (c) 5 wt% C and (d) 9 wt% C..............................................................88
Figure 4.14. SEM images of the Charpy impact fracture surfaces at 1200x of 10200 Cu covetics (a) 0 wt% C, (b) 3 wt% C, (c) 5 wt% C and (d) 9 wt% C..............................................................89
Figure 4.15. Example for area and point analysis on 10200 Cu covetics with 0 wt% C .............90
Figure 4.16. Representative stress-strain curves for 10200 Cu covetics with 0 and 3 wt% C ....94
Figure: 4.17. Photographs of failed samples before and after tensile testing of 10200 Cu covetics with 0 and 3 wt% C..........................................................................................................95
Figure 4.18. SEM-EDS analysis of 10200 Cu covetic with 0 wt% C (points 1, 2 and 4 were Cu rich regions; while point 3 showed copper oxide (Cu2O) ..............................................................97
Figure 4.19. SEM-EDS analysis of 10200 Cu covetic with 3 wt% C (points 1 and 6 were copper oxide (Cu2O); points 2,3 and 5 indicated Cu rich area; point 4 showed copper matrix with more carbon .............................................................................................................................................98
Figure 4.20. SEM-EDS analysis of 10200 Cu covetic with 5 wt% C (points 1 and 3 were Cu rich regions; point 2 showed copper oxide (Cu2O); points 4 and 5 were oxygen rich Cu area .....99
Figure 4.21. SEM-EDS analysis of 10200 Cu covetic with 9 wt% C (points 1, 3 and 7 indicated Cu rich regions; points 4, 5 and 8 were oxygen rich Cu matrix; points 2 and 6 showed copper oxide (Cu2O) and point 9 showed 7.19 wt% C in Cu matrix .......................................................100

XV
Figure 5.1. Charpy impact fracture surfaces of 6061 Al covetics ..............................................113
Figure 5.2. SEM micrographs of Charpy impact fracture surfaces of 6061 Al covetics A) 0 wt% C at 100x, B) 2.3 wt% C at 100x, C) 0 wt% C at 800x, and D) 2.3 wt% C at 800x ...................114
Figure 5.3. Example for area and point analysis on 6061 Al covetics.......................................115
Figure 5.4. Effect of carbon addition on the average crystallite size of 6061 Al covetic ..........117
Figure 5.5. Effect of carbon addition on the Lattice Parameter of 6061 Al covetic ..................117
Figure 5.6. Effect of carbon addition on Lattice Strain of 6061 Al covetic ..............................118
Figure 5.7. SEM-EDS analysis of 6061 Al covetic with 0 wt% C ............................................121
Figure 5.8. SEM-EDS analysis of 6061 Al covetic with 2.3 wt% C ..........................................122

1
CHAPTER 1: INTRODUCTION
1.1 BACKGROUND
The ongoing efforts of creating novel materials focus on improving the performance of
materials such as plastics, metals and ceramics by manipulating their structures to obtain new
properties for a wide range of applications. This has led to the development of composite
materials which are made from two or more constituent materials with significantly different
physical or chemical properties, that, when combined, produce a material with characteristics
different from either of the individual components [1]. These new materials are designed in such
a way that they have improved properties compared to traditional materials. One of the typical
engineered composite materials is a metal matrix composite combining different forms of carbon
such as graphene, carbon nanotubes (CNTs), carbon nanofibers (CNFs), and other forms of
carbon. Processing of these materials poses challenges and it may lead to an inhomogeneous
distribution of carbon reinforcement and inadequate bonding between the carbon and metal.
Covetics are a new class of materials which were recently invented by Third Millennium
Materials (TM2), LLC (Waverly, Ohio) [2]. A new method of carbon catalyzation was developed
to create covetics which uses molten metal and metal alloys as an ionizing medium. It was
reported that nanocarbon structures form in situ while bonding to the metal ionizing medium [2,
3]. Covetics are metal-carbon materials, which consist of a metal (made of copper, aluminum,
zinc, silver, gold or other base element) and carbon combined by using a proprietary process,
with higher carbon contents than those predicted by phase diagrams. TM2 introduced the term
“covetic” following the hypothesis of Dr. David Cookson from the Argonne National

2
Laboratory. He hypothesized that the carbon infused into the metal molecular structure and
formed a covalent bond with the metal. Initial testing has revealed that covetics respond to
physical loads with deformation behavior more like that typical of polymers than that of metals
[4-7]. In addition, covetic properties can be controlled by the chemical reaction and the carbon
composition allowing them to be tailored for specific applications. Covetics promise to deliver
superior properties for advanced engineering applications. However, they need to be further
explored and better understood before they can be widely accepted and used commercially.
In recent years, carbon in different forms: graphene [8, 9], carbon nanotubes [10-16],
carbon nanofibers [17, 18], aggregated diamond nanorods [19], and nanodiamonds [20], has been
combined with metals to manufacture composites. However, for ease of fabrication or recycling,
the composites have a problem that they cannot survive remelting. Covetics are the bonded
carbon-metal materials that can survive repeated melting cycles [2, 3]. To date, these materials
have demonstrated the ability to withstand more than 1500 degrees Celsius under an oxygen
plasma lance without separation of carbon and metals [2]. As covetics are carbon compounds
bonded with different metals, potential users will need to have an understanding of the carbon
form and its effect on the properties and behavior of these materials. Since their invention,
covetics have been created by combining carbon with 15 different metals and their alloys, and
because of their reported unusual properties, the potential uses and advantages associated with
covetics are numerous.

3
1.2 DISSERTATION STATEMENT
This doctoral dissertation research focused on the structural and mechanical
characterization and the evaluation of carbon content of aluminum alloy and copper alloy based
covetics. The mechanical properties of interest included hardnesses at different scales, tensile
properties, and energy absorption. Structural properties were evaluated using Energy Dispersive
Spectroscopy (EDS), Scanning Electron Microscopy (SEM), and X-Ray Diffraction (XRD).
Carbon content of the metals and their covetics were measured using SEM with Energy
Dispersive Spectroscopy (EDS) microanalysis and X-ray Photoelectron Spectroscopy (XPS).
1.3 DISSERTATION OUTLINE
This dissertation addresses an experimental characterization of covetics made using three
different metal alloys as base metals: 7075 Al, 6061 Al, and 10200 Cu.
In Chapter 2, a literature review is provided that summarizes the different techniques
proposed in literature to strengthen metals and its alloys thereby improving their mechanical
properties. Different manufacturing processes are reviewed for metals and alloys in order to
understand the advantages and drawbacks of each method. At the end of the chapter, various
experimental data reported in literature on mechanical properties and the structures of metals are
reviewed.
In Chapter 3, the characterization of the structure, composition, and mechanical
properties of aluminum carbon covetic materials is addressed. More specifically, we focused on
warm-rolled aluminum alloy 7075 Al with 0, 3, and 5 wt% of carbon infused during processing.

4
These materials were made using the covetic process including the material with 0 wt% C, which
was created for reference. Characterization included estimates of carbon contents using SEM
with EDS and XPS, SEM imaging of tensile fractured and polished surfaces, XRD testing of the
structure, and density measurements. Mechanical testing included tensile testing which provided
Young’s modulus (E), 0.2% yield strength (YS), ultimate tensile strength (UTS), and tensile
elongation at failure, Rockwell and Vickers tests which gave hardnesses, and nanoindentation
testing which provided Young’s modulus and local hardness. The obtained experimental results
were compared with data available in literature for 7075 Al alloy.
Chapter 4 focuses on the characterization of the structure, chemical composition, and
mechanical properties of 10200 Cu-C materials manufactured by the covetic process. More
precisely, four different sets of materials in terms of carbon content: 0, 3, 5 and 9 wt% C were
studied. These materials were made by TM2. Hardness, impact and tensile testing were
conducted to evaluate mechanical properties of these materials. SEM and XRD studies were
carried out to analyze microstructures of these materials, and SEM-EDS was used to assess
chemical compositions.
Chapter 5 addresses the effect of addition of carbon on the mechanical and structural
properties of 6061 Al alloy made by the covetic process. For comparison purposes control
samples of 6061 Al alloy covetics (0 wt% C) were also prepared and examined. Impact testing
and hardness measurements at the micro and mesoscale were carried out in order to obtain
mechanical properties of these covetics. SEM and SEM-EDS studies were conducted in order to
investigate the structure, composition, and failure modes of these materials. XRD was carried out
to obtain information on the average crystallite size of these materials. The experimentally
obtained data was compared with that found in literature for a 6061 Al alloy.

5
The final chapter, Chapter 6, includes the summary, limitations of the experimental
results, and recommended extensions to be considered in future studies.
1.4 REFERENCES
1. Mallick, P.K., Fiber-Reinforced Composites: Materials, Manufacturing and Designs, 2nd ed.,
CRC Press, 1993.
2. Luedtke, L., Covetics-rare new hybrid fuses nanocarbon and metal in bond stronger than sp2,
October 2013. Available: http://www.nanowerk.com/spotlight/spotid=32673.php
3. Shugart, J., New Class of Metallic Nanocomposites, paper presented at Materials Science &
Technology (MS&T 2009), Pittsburgh, PA, 25-29 October 2009.
4. Salamanca-Riba, L., R. Isaacs, A.N. Mansour, A. Hall, D.R. Forrest, M.C. LeMieux, and J.
Shugart, A new type of carbon nanostructure formed within a metal-matrix, in Technical
Proceedings of the 2012 NSTI Nanotechnology Conference and Expo, NSTI-Nanotech 2012, p.
278-281.
5. Brown, L., P. Joyce, D.R. Forrest, and J. Wolk, Physical and Mechanical Characterization of
a Nano Carbon Infused Aluminum-Matrix Composite, Proceedings of the SAMPE Fall Technical
Conference, Ft. Worth, TX, 17-20 October 2011.
6. Forrest, D.R., I. Jasiuk, L. Brown, P. Joyce, A. Mansour, and L. Salamanca-Riba, Novel metal-
matrix composites with integrally-bound nanoscale carbon, Proceedings of Nanotech
Conference & Expo, Santa Clara, CA, 18-21 June 2012.

6
7. Jasiuk, I., S. Nilufar, L. Salamanca-Riba, R. Isaacs, and S. Siddiqi, Novel aluminum-carbon
materials, in Technical Proceedings of the 2013 NSTI Nanotechnology Conference and Expo,
NSTI-Nanotech 2013, vol. 1, p. 27-30.
8. Wang, W.X., S.H. Liang, T. Yu, D.H. Li, Y.B. Li, and X.F. Han, The study of interaction
between graphene and metals by Raman spectroscopy, Journal of Applied Physics, 2011, 109
(7): p. 501-507.
9. Zangwill, A., and D.D. Vedensky, Novel Growth Mechanism of Epitaxial Graphene on
Metals, Nano Letters, 2011, 11 (5): p. 2092–2095.
10. Agarwal, A., S. Bakshi, and D. Lahiri, Carbon nanotubes: reinforced metal matrix
composites: CRC press, 2011.
11. Chen, Y., S. Bakshi, and A. Agarwal, Correlation between nanoindentation and nanoscratch
properties of carbon nanotube reinforced aluminum composite coatings, Surface & Coatings
Technology, 2010, 204: p. 2709-2715.
12. Turkevich, V., O. Kulik, A. Garan, I. Petrusha, A. Lutsenko, and A. Vashchenko, Phase
diagram of the Al-C system at a pressure of 8 GPa, Sverkhtverdye Materialy, 2004, 4: p. 29-34.
13. Yang, M., J. Novak, R. Fink, J. Brookover, and N. Jiang, Properties of a newly developed
carbon-aluminum nanocomposite, in Technical Proceedings of the 2009 NSTI Nanotechnology
Conference and Expo, NSTI-Nanotech 2009, p. 550-553.
14. Balani, K., S. Harimkar, A. Keshri, Y. Chen, N. Dahortre, and A. Agarwal, Multiscale wear
of plasma-sprayed carbon-nanotube-reinfored aluminum oxide naocomposite coating, Acta
Materialia, 2008, 56: p. 5984-5994.

7
15. Bakshi, S., A. Keshri, and A. Agarwal, A comparison of mechanical and wear properties of
plasma sprayed carbon nanotube reinforced aluminum composites at nano and macro scale,
Materials Science and Engineering A, 2011, 528: p. 3375-3384.
16. Lim, D., D. You, H. Choi, S. Lim, and H. Jang, Effect of CNT distribution on tribological
behavior of alumina-CNT composites, Wear, 2005, 259: p. 539-544.
17. Chakravarthi, D., V. Khabashesku, R. Vaidyanathan, J. Blaine, S. Yarlagadda, D. Roseman,
Q. Zeng, and E. Barrera, Carbon Fiber–Bismaleimide Composites Filled with Nickel-Coated
Single-Walled Carbon Nanotubes for Lightning-Strike Protection, Advanced Functional
Materials, 2011, 21: p. 2527-2533.
18. Jiang, Q., R. Yang, G. Fu, D. Xie, B. Huang, Z. He, and Y. Zhao, Preparation of the carbon
nanotube/ carbon fiber composite and application as the electrode material of the
electrochemical super capacitor, Materials Science Forum, 2011, 687, p. 158-162.
19. Dubrovinskaia, N., L. Dubrovinsky, W. Crichton, F. Langenhorst, and A. Richter,
Aggregated diamond nanorods, the densest and least compressible form of carbon, Applied
Physics Letters, 2005, 87 (08): p. 3106-3110.
20. Galli, G., Structure, Stability and Electronic Properties of Nanodiamonds, Chapter 2, L.
Colombo and A. Fasolino (Eds.), Computer-Based Modeling of Novel Carbon Systems and Their
Properties, Carbon Materials: Springer Science+Business Media B.V., 2010.

8
CHAPTER 2: LITERATURE REVIEW
2.1 METALLIC MATERIALS
Metals account for about two thirds of all the elements and about 24% of the mass of the
planet. Metals have highly desired engineering properties including high stiffness, strength,
ductility, melting point, thermal and electrical conductivity, and toughness. From the periodic
table, it can be seen that a large number of the elements are classified as being a metal. Among
the common metallic materials, iron-carbon (steel) alloys are used for high strength applications,
aluminum and its alloys are used because they are easy to form, readily available, inexpensive,
and recyclable, copper and copper alloys have a number of properties that make them useful,
including high electrical and thermal conductivities, high ductility, and good corrosion
resistance, titanium alloys are used for high strength in higher temperature (~1000° F)
application, when component weight is a concern, or when good corrosion resistance is required,
nickel alloys are used for yet higher temperature (~1500-2000° F) applications or when good
corrosion resistance is required, while refractory materials are used for highest temperature (>
2000° F) applications. The key feature that distinguishes metals from non-metals is their metallic
bonding. In metals valence electrons are free to move easily throughout the metal. The existence
of these free electrons has a number of profound consequences on the properties of metals. For
example, metals tend to be good electrical conductors because the free electrons can move easily
within the material. Over the past decades, advancements in aviation and automotive industries
have found that traditional metals and metal alloys are insufficient to meet design requirements
and the need to produce metal matrix composites has been acknowledged.

9
2.2 METAL MATRIX COMPOSITES
Since the early 1960s, there has been an ever-increasing demand for newer, stronger,
stiffer, and yet lighter-weight materials in the fields such as aerospace, transportation, and
construction. High demands of materials for better overall performance has led to extensive
research and development efforts in the composite materials fields. The oldest manmade
composite materials which are over 6000 years old are called wattle and daub. This primitive
composite was used for making walls using a combination of straw, wet soil, animal solid waste,
sand, and clay [1]. Composite materials have low specific gravity that makes their properties
superior in strength and modulus [2, 3] to many traditional engineering materials such as metals.
As a result, these materials are now being rapidly utilized in industries that traditionally used
metals, and these have become the forefront of research and development activity in many
related areas. Composite materials that exist today can be categorized into five major classes,
which include ceramic matrix composites (CMCs), metal matrix composites (MMCs),
intermetallic matrix composites (IMCs), carbon-carbon composites (CCCs) and polymer matrix
composites (PMCs) [3].
Metal matrix composites (MMCs) are composite materials that are being formed by two
or more materials or constituents [4]. The first application of MMCs can be dated back to a
copper reinforced steel wire in the late 1960s [5]. The MMCs constituents, i.e. a matrix and
reinforcement, complement each other in terms of their mechanical properties, e.g. strength and
hardness [6]. In this literature review, the metals are the continuous matrix phase and the
reinforcements (e.g., carbon reinforcement) are the discontinuous continuum phase.

10
The application of MMC ranges from sporting goods, e.g. golf clubs and tennis rackets,
to concrete and metal bridges to aerospace industry, e.g. airplane bodies and satellites, and
automotive industry, including radiator, engines, and frames. Although majority of these MMCs
has been extensively used in the automotive and aerospace applications, the MMC do have their
limits. For example, metals and their alloys have high strength and toughness but their elastic
modulus is generally lower than that of a ceramic and their density is high. On the other hand,
ceramics have high elastic modulus but low ductility and toughness [7]. With the introduction of
airplanes for airline, aerospace, and defense industries, the need for light weight and high
strength material has been recognized. The need to make the material lighter and stronger can
increase fuel efficiency by reducing the overall payload weight for the flight [8]. The MMC
usage has increased in years and is predicted to further increase. Figure 2.1 shows a 65%
increase for the ground transportation industry from 2004 to 2013 [9].
Figure 2.1. Global outlooks of metal-matrix composites by different industries from
2004 to 2013 [9].
For example, the aluminum MMCs usage from 1999 to 2014 for each automobile
produced in the United States will increase from using 251 lb. to an estimated 280 lb [10]. These

11
aluminum MMCs usages include cars’ chassis, suspension, steering components, cylinder heads,
cylinder blocks, pumps, radiators, and engine covers. Therefore, new MMCs research has been
continued for novel MMC with high elastic modulus, toughness, and high strength.
2.3 METAL CARBON COMPOSITES
Metal-carbon composites consist of a metal matrix and the carbon as reinforcing material.
The zone between these two phases, the interphase, is an essential part of MMCs. Bonding
develops from physical or chemical interactions, interfacial frictional stress and residual stresses
due to a mismatch between coefficients of thermal expansion of reinforcement and matrix. The
understanding and control of the underlying interfacial phenomena governing the transmission of
thermal, electrical, and mechanical properties across the whole composite is of high importance
when designing MMC for a particular application.
2.3.1 Aluminum carbon metal matrix composites
Aluminum carbon metal matrix composite (Al-C MMC) has been a main focus of study
in recent years due to its superior properties such as the low density, high strength, and stiffness
and its broad applications [11]. Al-C MMC manufacturing processes include powder
metallurgy, hot extrusion, thermal sprayings, ball milling, and ultrasonic mixing [12]. In most
current studies, Al-C MMCs have been mainly manufactured by two thermal spraying processes,
i.e. cold spraying (Figure 2.2) [13] and plasma spraying (Figure 2.3) [14], respectively.
Therefore, these two processes are reviewed next.

12
Figure 2.2. Schematic diagram of cold spray process [13].
Both cold spraying and plasma spraying processes belong to the family of thermal
sprayings. The major difference between the two methods is the temperature being used. Cold
spraying is performed at an ambient temperature with supersonic speed of 600 to 1500 m/s with
pressurized gas, e.g. Helium, of up to 3.5 MPa [15]. On the other hand, the plasma spraying is
performed by either a direct current or radio frequency discharge which melts the materials at
atmospheric pressure with a thermal spraying heat source of 8000K. Under this condition, the
divided metal, e.g. Al, and the non-metal, e.g. carbon, are deposited into a molten or semi-molten
state on a prepared substrate [16].

13
Figure 2.3. Schematic diagram of plasma spraying [14].
The cold spraying process has several advantages over the plasma spraying. The
advantages include no bulk particle melting due to the low temperature process, no high
temperature equipment required (e.g. extreme electrical heating equipment or fuel gases), no
solidification stresses caused by temperature change, and producing of highly dense coatings
with minimal effects by oxidation and phase changes. On the other hand, the disadvantages of
cold spraying include using ductile binders for hard brittle materials and high cost due to inert
gas being used unless being recycled [13]. However, the plasma spraying process has its own
advantages as well. The advantages include stronger, denser, and cleaner coatings although the
process itself is also relatively high cost and complex due to the equipment being used [14].
The following discussion will compare mechanical properties, i.e. wear resistance,
modulus of elasticity, and hardness of the cold sprayed and plasma sprayed Al-C MMC versus
their aluminum counterparts (without carbon). In addition, nanoindentation and nanoscratch

14
tests results are also discussed to compare the above mechanical properties. Finally, macro wear
testing is reviewed as well on the plasma sprayed Al-C MMC.
2.3.1.1 Cold spraying
Chen et al. carried out the cold spraying process to mix CNT with Al and used
nanoindentation and nanoscratch tests to evaluate mechanical properties (elastic modulus,
hardnesses, and coefficient of friction) of the Al-CNT MMC. They considered this method over
plasma spraying because it did not involve high temperature and thus would not form a needle-
like Al4C3 phase, which is a brittle and hydroscopic material [17]. According to the research
done by Sasaki et al [18] and Deng et al., Al4C3 phase degrades mechanical properties of the
MMC at temperatures above 656.3°C. Temperature lower than that was used in the plasma
spraying process [19]. The above experiment was carried out by using Hysitron Triboindenter
with a diamond Berkovic indenter tip with a radius of 100 nm. The data from the experiment
proved that the indentation depths decreased as CNT % increased from 0% to 1% as shown in
Table 2.1 [17].
Table 2.1. Calculated contact and true wear values for cold sprayed Al-CNT coatings
[17]

15
Furthermore, the experiment also showed that both elastic modulus and hardness of the
cold sprayed Al-CNT MMC increased as CNT % increased from 0% to 1.0% in wt. as presented
in Table 2.2 [17].
Table 2.2. Nanomechanical properties of cold-sprayed Al-CNT properties [17]
In conclusion, the cold-sprayed Al-CNT MMC had higher elastic strength and hardness
as seen in Table 2.2 compared to the cold-sprayed Al. On the other hand, the coefficient of
friction of the cold-sprayed Al-CNT MMC was not affected by addition of up to 1 wt. % of CNT
[18].
2.3.1.2 Plasma spraying
Balani et al. [20] conducted an experiment to compare the wear volume loss,
microstructure, and friction with different CNT length scale in four different Al-CNT-MMCs.
The four different microstructures for the Al-CNT-MMCs studied in their experiments were as
follows:
1. A-SD coatings (0 wt. % CNT)
2. A4C-B (Al2O3 – 4 wt. % CNTs agglomerated in matrix)

16
3. A4C-SD (Al2O3 – 4 wt. % CNT dispersed in matrix)
4. A8C-SD (Al2O3 – 8 wt. % CNT dispersed in matrix)
The nanoscratch testing was also done by using a Hysitron Triboindenter, same as in the
cold spraying experiment performed by Chen et al. In addition, macro-scale wear testing was
also performed by comparing time-volume-loss profile of coatings during the 150 min testing
with the 15-min specimen’s weight loss recording interval. The experimental results are shown
in Table 2.3, Table 2.4, and Figure 2.4. The plasma sprayed Al-CNT MMC experiment had also
demonstrated that both elastic modulus and hardness increased as CNT % increased from 0% to
8%, same as cold sprayed Al-CNT in wt. with the decreasing of porosity as well. The decrease
in porosity resulted in better mechanical properties of the Al-CNT MMC as CNT % wt.
increased.
Table 2.3. Mechanical properties and microstructural features of plasma sprayed Al-CNT
MMC [20]

17
Figure 2.4. Temporal wear-profiles of plasma-sprayed coatings showing volume loss
[20].
Table 2.4. Macro-wear rate of plasma-sprayed coatings [20]
The macro wear testing results are presented in Figure 2.4 which shows that high CNT
content results in less volume loss. The wear rates decreased dramatically to over 49.4 times
with the composite as the wt% of CNT went from 0 to 8%. In addition, although both A4C-B
and A4C-SD had 4 wt. % CNT but since A4C-SD underwent an additional processing where the

18
CNTs were dispersed inside the matrix, the A4C-SD coatings had a little bit of advantage over
that of A4C-B which used only a one- step process. The reason for the advantage was that the
dispersed CNTs, which were more homogenously distributed than in A4C-B due to spray-dried
powder feedstock, enhanced the plasticity and micro-deformation of A4C-SD. Therefore, the
above results also show that processing techniques could help the distribution of CNTs leading to
different properties. On the other hand, the coefficient of friction did not improve as seen in
Table 2.5. with the addition of CNT but the nano wear resistance was improved dramatically
from 1.8x, 3.1x, and 17.8x respectively similarly as the macro wear resistance when the %wt.
CNT increased [20].
Table 2.5. Friction and nano wear resistance improvement data from nano-scratch test
[20]
Furthermore, few other experiments using different types of carbon reinforcements with
aluminum and/or different processing methods, including Al-C-MMC by molecular level mixing
(MLM) process [21], Aluminum Silicon CNT by plasma spray [22], Al-C with tape casting [23],

19
Hydroxyapatite with Al-CNT [24], and Al-CNT in sea water environment [25], were done and
the increasing wear resistance and hardness were found.
2.3.2 Copper carbon metal matrix composites
Copper carbon metal matrix composite (Cu-C MMC) had been a main focus in thermal
management applications, e.g. heat sink applications, due to its superior conductivity of
approximately 3000 W/mK (CNT), which is almost 8 times that of Cu, 400 W/mK [26]. There
were few models proposed to determine the thermal conductivity for Cu-C MMC. For example,
in 2004, Nan et al. proposed a model to determine the thermal conductivity of Cu-C MMC using
Maxwell-Garnett effective medium theory [27]. In addition, in 2011, Gao et al. had used
molecular dynamics to predict the thermal resistivity of Cu-C MMC with the assumption of
coherent transport without the interaction between electrons and photons [28]. Additional studies
were also done on hardness, coefficient of friction and wear tests similar to the experiments on
Al-C MMC with different types of manufacturing processes.
Cu-C MMC manufacturing processes included molecular level mixing (MLM), electro-
less and electro-deposition of Cu on C, and powder metallurgy, etc. Moreover, ball milling was
also extensively used to disperse carbon reinforcements in Cu powder for manufacturing MMC.
For Nickel and Inconel [29] based composites, to promote better bonding and wettability
between the metal and carbon the ball milling method was used. One advantage of Cu was that
there was no carbides formation between Cu and C like the Al4C3 in aluminum carbon metal
matrix composite but wettability was still an issue between Cu and carbon reinforcements [26].

20
Figure 2.5. Cu-C phase diagram [30].
Therefore, the Cu-C MMCs that were manufactured by ball milling, MLM and spark plasma
sintering (SPS) technique were reviewed. Furthermore, a Cu-C phase diagram (Figure 2.5) was
included for reference [30].
2.3.2.1 Spark Plasma Sintering (SPS)
Chua et al. [31] used SPS to manufacture Cu-CNT MMC and the result showed that
CNTs started to cluster in Cu matrix with 15 wt% CNTs while 0 to 10 wt% CNTs showed
remarkably evenly distributed pattern as seen in Figure 2.6.

21
Figure 2.6. (e) Cu matrix with 10 wt% CNT (f) Cu matrix with 15 wt% CNT [31].
2.3.2.2 Ball milling
Dong et al. [32] carried out similar experiment with testing of hardness, coefficient of
friction, and wear of Cu-CNT MMC obtained using ball milling process with Ni-coated CNT
Figure 2.7. Hardness vs wt. % CNT addition (f) in Cu-CNT MMC [32].

22
and compared his results to Cu-CF MMC. Vicker’s hardness tester was used to test the hardness
of the Cu-CNT MMC and the coefficient of friction testing was done with 100 N and velocity of
0.42 m/s. The hardness test results showed improvement for up to 12 wt% of CNT addition.
The hardness of Cu-CNT MMC decreased after that and when CNT addition was at 25 wt%, the
hardness was even lower than the pure Cu MMC (Figure 2.7).
In a later study Patil et al. [33] found that 4 wt% is the optimum wt% for both SWCNT
and MWCNT addition in a Cu matrix. Their experiment showed that density decreased starting
at 4 wt% CNT and thus the increased porosity softened the material even though SEM showed a
uniform distribution of the CNTs in Cu-CNT MMC. This microhardness test result was much
lower than what Doug et al. and Chu et al. reported. The discrepancy could be due to the fact
that the Cu-CNT MMC that Patil et al. manufactured had higher porosity than those made by
Doug et al. and Chu et al.
Figure 2.8. Hardness vs. wt. % of MWCNT in Cu-CNT MMC [33].

23
Figure 2.9. Hardness vs wt. % of SWCNT in Cu-CNT MMC [33].
Furthermore, other experiments related to Cu-C MMCs with different forms of carbon
reinforcements and different processing methods including pulse-reverse electrodeposition for
electronic plating [34] and metal-nonmetal transition in Cu-CNT films for pressure sensors [35]
were reviewed. Additional studies on enhanced electro migration (EM) resistance done by Chai
et al. showed that Cu/CNT could be used where good EM resistance and high current density
was required [36]. In addition, other similar studies like Li et al. [37] showed an increase in
Young’s modulus when using cold rolling and annealing for Cu-CNT MMC.

24
2.4 INTERFACIAL BONDING
Interfacial bonding has significant effect on the mechanical properties of MMCs. The
interfacial bonding can strengthen or degrade the MMC properties dependent upon the type and
amount of the phases, e.g. carbides, being formed in the matrix. The bonding for MMCs can be
developed by chemical reaction, residual stress, and physical interlocking, among others. For the
chemical reaction, when the metal is melted using liquid phase processing, e.g. hot plasma
sintering method, interface carbide will form by oxidation of the base material with the reduction
process of the reinforcement. The interfacial region consists of the compound that is made of the
metal and reinforcement. The compound, i.e. carbide, in most cases degrades the mechanical
properties of the MMCs as studied by Sasaki et al.[18] and Deng et al.[38]. On the other hand,
small amount and volume of these carbides formed in the interface region can improve
mechanical properties [39]. As for the residual stress at the interfacial region, it is induced by
the mismatch of thermal expansion between the reinforcement, e.g. CNT, and the base metal. In
addition, the physical bonding is also affected by the surface roughness of reinforcement and the
wetting material that may be used to enhance the mechanical interlocking mechanism between
the base material and reinforcement. [40].
There are a few ways to improve interfacial bonding between metal and the
reinforcement. They include heat treatment, alloying, and usage of wetting material. For
example, using SiC in Al CNT matrix will deter the formation of Al4C3. On the other hand, for
the unreactive metal like magnesium, aluminum can be used to facilitate formation of small
amount and sizes of carbide which would improve bonding between Mg and C. Table 2.6 below
provides a few examples of the interfacial reactions between different metals and different
nanocarbon reinforcements [40].

25
Table 2.6. Reaction for metals and the reinforcements at <800°C processing [40]
Although compressive strengths do not seem to be affected much by the interfacial
bonding as seen in study by Bakshi, [39], the poor interfacial bonding will act as a pre-existing
crack for materials that require tensile strength as seen in the experiment done by Hwang et al.
[41]. On the other hand, the interfacial bonding consisting of small amounts Al4C3 had been
credited for a 129% increase in compressive strength for Aluminum CNT MMC by Bakshi.
Although the interfacial bonding can help load transfer from matrix to reinforcement and thus
increase the mechanical properties of MMCs, the ductility of the matrix will decrease due to the
hardness of the interface region. In addition, wetting will help to improve the properties and
phases for the interfacial region [39]. Poor wetting affinity shown by carbon for aluminum [41]
and copper [42] contributes to weakening of the interfacial bonding between carbon and the
metal [26]. Several techniques [43-45] have been proposed to facilitate uniform distribution of
carbon reinforcement in the metal but many of them have associated disadvantages [26].
Al Mg+Al Mg Cu Ti
C Al4C3
Al4C3 (>2% Al)Al2MgC2 (<2%
Al) No reaction No reaction No reaction
Si AlSi Mg2Si Mg2Si No data Ti5Si3
SiC Al4C3 + Si Al4C3 + Si No data No reaction TiC + Si
TiCAl4C3 + Ti
Al4C3 + Al3Ti No data No data No data No data

26
2.5 COVETICS
Though metal carbon composites showed improved mechanical performance, their large
scale production with uniform distribution of carbon reinforcements and good interfacial
bonding remains a problem. In contrast to the method of mixing separately produced carbon
reinforcements with the metal, covetics are produced by a novel technique that leads to the
formation of carbon structures in-situ [46]. This alleviates the problem of poor wetting between
carbon and metal when carbon reinforcements are introduced into the metal.
Figure 2.10. He-ion fractured image of as-extruded aluminum 6061 covetic 3 wt% carbon [47].
27
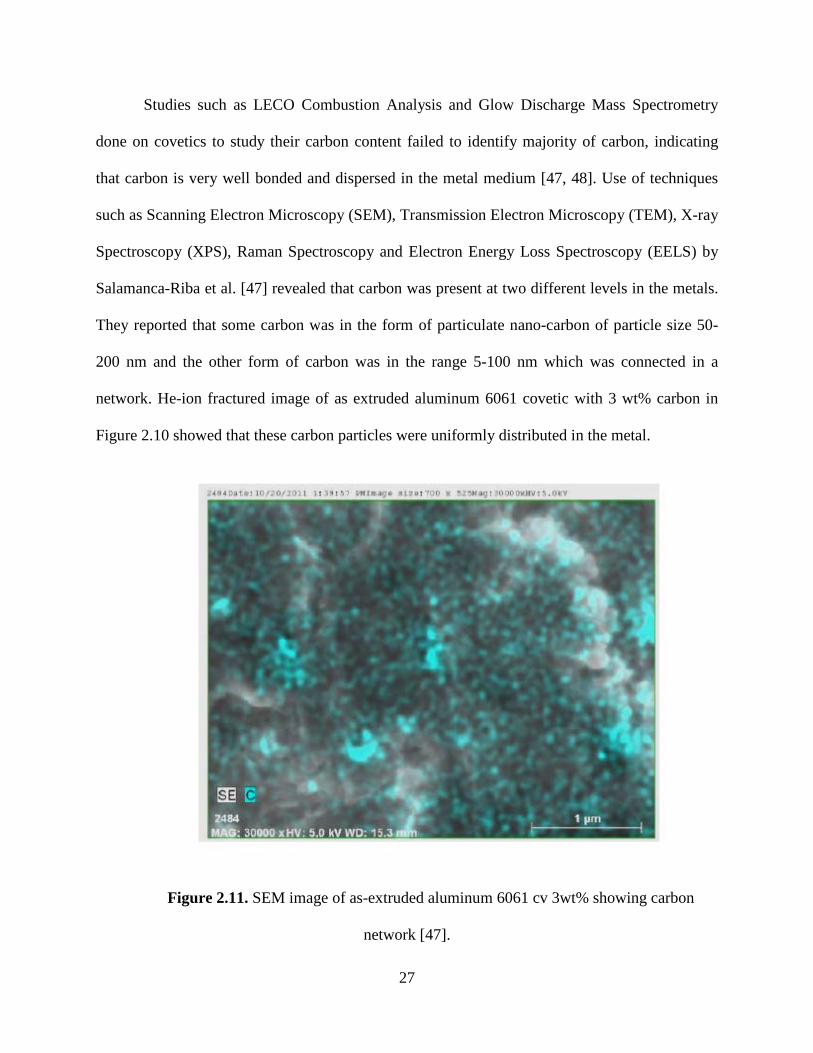
Studies such as LECO Combustion Analysis and Glow Discharge Mass Spectrometry
done on covetics to study their carbon content failed to identify majority of carbon, indicating
that carbon is very well bonded and dispersed in the metal medium [47, 48]. Use of techniques
such as Scanning Electron Microscopy (SEM), Transmission Electron Microscopy (TEM), X-ray
Spectroscopy (XPS), Raman Spectroscopy and Electron Energy Loss Spectroscopy (EELS) by
Salamanca-Riba et al. [47] revealed that carbon was present at two different levels in the metals.
They reported that some carbon was in the form of particulate nano-carbon of particle size 50-
200 nm and the other form of carbon was in the range 5-100 nm which was connected in a
network. He-ion fractured image of as extruded aluminum 6061 covetic with 3 wt% carbon in
Figure 2.10 showed that these carbon particles were uniformly distributed in the metal.
Figure 2.11. SEM image of as-extruded aluminum 6061 cv 3wt% showing carbon
network [47].

28
The same group tested copper and aluminum covetics and revealed that lattice-
incorporated carbon was present in different forms in different metals. In aluminum, lattice-
carbon was shown to form strips oriented mostly along the preferred crystallographic directions
(Figure 2.11), while in copper, carbon formed modulation along various crystallographic
directions (Figure 2.12). Electron Energy Loss Spectroscopy and Raman Spectroscopy were also
performed in that study on Al and Cu covetics to understand the form of carbon present inside
the metal lattice, which suggested graphite like sheets and sp2 bonding which indicated CNTs
[47].
Figure 2.12. HRTEM image of a Cu cv 5wt% sample showing modulation [47].

29
Figure 2.13. Stress vs. strain behavior comparison of covetic and non-covetic as-
extruded Al-6061 [48].
Figure 2.14. Stress vs. strain curves for centrifugally cast covetic and non-covetic copper
[48].

30
Mechanical testing conducted by Forrest et. al. [48] confirmed improvement in yield
strength and tensile strength with increasing carbon content in 7075 Al covetics. As-extruded
aluminum 6061 covetic (3 wt% carbon) showed 30% improvement in yield strength (Figure
2.13) as compared to the material with no carbon. Similar testing on centrifugally cast covetic
and non-covetic copper revealed higher strength for the covetic. However, the covetic failed
sooner which was believed to be caused by porosity (Figure 2.14).
These preliminary results on covetics described above illustrate very interesting
characteristics of covetics. However, there is still no comprehensive analysis of these materials.
This dissertation addresses this challenging and widely open subject.
2.6 REFERENCES
1. http://en.wikipedia.org/wiki/Wattle_and_daub
2. Khoun, L., C. Timotei, and P. Hubert, Characterization Methodology of Thermoset Resins for
the Processing of Composite Materials — Case Study: CYCOM 890RTM Epoxy Resin, Journal of
Composite Materials, 2010, 44(11): p. 1397-1415.
3. Mallick, P.K., Fiber-Reinforced Composites: Materials, Manufacturing and Designs, 2nd ed.
CRC Press, 1993.
4. Mortensen, A., and J. Llora, Metal Matrix Composites, Annual Review of Materials Research
Online, 2010, 40: p. 243-270.
5. Rawal, S. Manufacture of Al nanocomposite - a critical review, Journal of Materials, 2001, 53:
p. 14-17.

31
6. http://en.wikipedia.org/wiki/Composite_material
7. Agarwal, A., S. Bakshi, and D. Lahiri, Carbon nanotubes: reinforced metal matrix
composites, CRC press, 2010.
8. Bakshi, S., D. Lahiri, and A. Agarwal, Carbon nanotube reinforced metal matrix composites –
a review, International Materials Reviews, 2010, 55(1): p. 41-64.
9. Borgonovo, C. and D. Apelian, Manufacture of Aluminum nanocomposites: A critical review,
Materials science forum, 2011, 678: p. 1-22.
10.http://www.thefreelibrary.com/Increased+aluminum+in+automobiles+saving+weight+and+fu
el+consumption.-a0159786251
11. Peng, B., M. Locascio, P. Zapol, S. Y. Li, S. I. Mielke, G. C. Schatz, and H. D. Espinosa,
Measurements of near-ultimate strength for multiwalled carbon nanotubes and irradiation-
induced crosslinking improvements, Nature Nanotechnology, 2008, 3(10): p. 626-631.
12. Bakshi, S.R., A.K. Keshri, and A Agarwal, A Comparison of Mechanical and Wear
Properties of Plasma Sprayed Carbon Nanotube Reinforced Aluminum Composites at Nano and
MacroScale, Materials Science and Engineering A, 2011, 528: p. 3375-3384.
13. http://www.gordonengland.co.uk/coldspray.htm
14. http://www.gordonengland.co.uk/ps.htm
15. http://patents.com/us-6759085.html
16.http://www.engr.sjsu.edu/sgleixner/PRIME/Nanomaterials/References/Fauchais_plasma
spraying.pdf
32
17. Chen, Y., S. Bakshi, and A. Agarwal, Correlation between nanoindentation and nanoscratch
properties of carbon nanotube reinforced aluminum composite coatings, Surface & Coatings
Technology, 2010, 204: p. 2709-2715.
18. Sasaki, G., Y. Hara, Z. Xu, K. Sugio, H. Fukushima, Y. choi, and K. Matsugi, Fabrication of
carbon nano-fiber/aluminum composites by low-pressure infiltration method, Materials science
forum, 2010, 654-656: p. 2692-2695, 2010.
19. Deng, C., D. Wang, X. Zhang, and A. Li, Processing and properties of carbon nanotubes
reinforced aluminum composites, Materials Science and Engineering A, 2007, 444(1): p. 138-
145.
20. Balani, K., S. Harimkar, A. Keshri, Y. Chen, N. Dahortre, and A. Agarwal, Multiscale wear
of plasma-sprayed carbon-nanotube-reinfored aluminum oxide naocomposite coating, Acta
Materialia, 2008, 56: p. 5984-5994.
21. Cha, S., K. Kim, K. Lee, C. Mo, and S. Hong, Strengthening and toughening of carbon
nanotube reinforced alumina nanocomposite fabricated by molecular level mixing process,
Scripta Materialia, 2005, 53: p. 793-797.
22. Bakshi, S., A. Keshri, and A. Agarwal, A comparison of mechanical and wear properties of
plasma sprayed carbon nanotube reinforced aluminum composites at nano and macro scale,
Materials science and engineering A, 2011, 528: p. 3375-3384.
23. Lim, D., D. You, H. Choi, S. Lim, and H. Jang, Effect of CNT distribution on tribological
behavior of alumina-CNT composites, Wear, 2005, 259: p. 539-544.

33
24. Balani, K., D. Lahiri, A. Keshri, R. Bakshi, J. Tercero, and A. Agarwal, The nano-scratch
behavior of biocompatible hydroxyapatite reinforced with aluminum oxide and carbon nanotube,
Journal of the Minerals, Metals & Materials Society, 2009, 61(9): p. 63-66.
25. Keshri, A., and A. Agrawal, Wear behavior of plasma-sprayed carbon nanotube-reinforced
aluminum oxide coating in marine and high-temperature environments, Journal of Thermal
Spray Technology, 2011, 20: p. 1217-1230.
26. Lahiri, D., S. Ghosh, and A. Agarwal, Carbon nanotube reinforced hydroxyapatite composite
for orthopedic application: A review, Materials Science and Engineering C, 2012, 32(7): p.
1727–1758.
27. Nan, C., Z. Shi, and Y. Lin, A simple model for thermal conductivity of carbon nanotube-
based composites, Applied Physics Letter, 2003, 85: p. 666-669.
28. Gao, F., J. Qu, and M. Yao, Interfacial thermal resistance between metallic carbon nanotube
and Cu substrate, Journal of Applied Physics, 2011, 110(12): p.124314-1-124314-6.
29. Atthipalli, G., Y. Tang, A. Star, and J.L. Gray, Electrochemical characterization of carbon
nanotube forests grown on coper foil using transition metal catalysts, Thin Solid Films, 2011,
520: p. 1651-1655.
30. Lopez, G. A., and E. J. Mittemeijer, The solubility of C in solid Cu, Scripta Materialia, 2004,
51(1): p. 1-5.
31. Chua, K., Q. Wua, C. Jiaa, X. Lianga, J. Niea, W. Tianb, G. Gaic, and H. Guod, Fabrication
and effective thermal conductivity of multi-walled carbon nanotubes reinforced Cu matrix

34
composites for heat sink applications, Composites Science and Technology, 2010, 70(2): p. 298–
304.
32. Dong, S., J. Tu, and X. Zhang, An investigation of the sliding wear behavior of Cu-matrix
composite reinforced by carbon nanotubes, Materials Science and Engineering A, 2001, 313: p.
83-87.
33. Patil, R., V. Chatpalli, and K. Kannan, Study on Young’s modulus and microhardness of
carbon nanotubes reinforced copper nanocomposite, Materials Science and Technology, 2010,
26: p. 478-481.
34. Arai, S., Y. Suwa, and M. Endo, Cu/Multiwalled Carbon Nanotube Composite Films
Fabricated by Pulse-Reverse Electrodeposition, Journal of the Electrochemical Society, 2011,
158: p. 49-53.
35. Ghodselahi, T., M. Vesaghi, A. Shafiekhani, M. Ahmadi, M. Panahandeh, and M. Saani,
Metal–nonmetal transition in the copper–carbon nanocomposite films, Physcia B, 2010, 405: p.
3949-3951.
36. Chai, Y., P. Chan, and Y. Fu, Copper/Carbon nanotube composite interconnect for enhanced
electromigration resistance, presented at the Electronic Components and Technology
Conference 2008.
37. Li, Y., W. Housten, Y. Zhao, and Y. Zhu, Cu/single-walled carbon nanotube laminate
composites fabricated by cold rolling and annealing, Nanotechnology, 2007, 18: 205607.
38. Deng, C., D. Wang, X. Zhang, and A. Li, Processing and properties of carbon nanotubes
reinforced aluminum composites, Materials Science and Engineering A, 2007, 444: p. 138-145.

35
39. Bakshi, S., Plasma And Cold Sprayed Aluminum Carbon Nanotube Composites:
Quantification of Nanotube Distribution And Multiscale Mechanical Properties, PhD
dissertation, Florida International University, 2009.
40. Vaucher, S., and O. Beffort, Bonding and interface formation in metal matrix composites,
MMC- Assess Thematic Network, Vol. 9.
41. Hwang, S., D. Bang, K. Yoon, Y. Park, D. Lee, and S. Jeong, Fabrication and
Characterization of Aluminum-Carbon Nanotube Powder and Polycarbonate/Aluminum-Carbon
Nanotube Composites, Journal of Composite Materials, 2010, 44: p. 2711–2722.
42. Mortimer, D.A., and M. Nicholas, The wetting of carbon by copper and copper alloys,
Journal of Materials Science, 1970, 5(2): p. 149-155.
43. Esawi, A.M.K., and M.A. El Borady, Carbon nanotube-reinforced aluminium strips,
Composites Science and Technology, 2008, 68(2): p. 486-492.
44. Cha, S.I., K.T. Kim, S.N. Arshad, C.B. Mo, and S.H. Hong, Extraordinary strengthening
effect of carbon nanotubes in metal-matrix nanocomposites processed by molecular-level mixing,
Advanced Materials, 2005, 17(11): p. 1377-1381.
45. He, C., N. Zhao, C. Shi, X. Du, J. Li, H. Li, and Q. Cui, An approach to obtaining
homogeneously dispersed carbon nanotubes in al powders for preparing reinforced al-matrix
composites, Advanced Materials, 2007, 19(8): p. 1128-1132.
46. Luedtke, L., Covetics-rare new hybrid fuses nanocarbon and metal in bond stronger than sp2,
October 2013. Available: http://www.nanowerk.com/spotlight/spotid=32673.php

36
47. Salamanca-Riba, L., R. Isaacs, A.N. Mansour, A. Hall, D.R. Forrest, M.C. LeMieux, and J.
Shugart, A new type of carbon nanostructure formed within a metal-matrix, in Technical
Proceedings of the 2012 NSTI Nanotechnology Conference and Expo, NSTI-Nanotech 2012, p.
278-281.
48. Forrest, D.R., I. Jasiuk, L. Brown, P. Joyce, A. Mansour, and L. Salamanca-Riba, Novel
metal-matrix composites with integrally-bound nanoscale carbon, Proceedings of Nanotech
Conference & Expo, Santa Clara, CA, 18-21 June 2012.

37
CHAPTER 3: CHARACTERIZATION OF ROLLED 7075 AL COVETICS
3.1 INTRODUCTION
There is a continual need for new materials which are lighter and stronger. Among
industrial metals, aluminum and aluminum alloys are widely used because of their low relative
density, high strength, excellent corrosion resistance, and good machinability [1]. Continued
demand for this high performance metal has led to the development of aluminum-based Metal
Matrix Composites (MMCs) where reinforcement is added to the metal and the constituents
complement each other in terms of their mechanical properties, e.g. strength and hardness [2], to
give rise to a unique class of materials. The improvements in physical and mechanical properties
of aluminum-based MMCs have made them attractive candidates for industrial applications in
fields such as aerospace, automotive, renewable energy, electronics, construction and other
industries [3]. Among other choices, carbon-based fillers have been used to improve properties
of different materials: polymers [4-7], ceramics [8-10], and metals [11, 12].
Studies reported that an Al 2024 system infused with carbon nanotubes (CNTs) showed
superior mechanical properties such as improved hardness and tensile strength [13, 14] over a
conventional alloy. Multiwalled nanotube (MWNT)-aluminum composites showed greater
improvements in strength and hardness while graphene-aluminum composites showed decrease
in mechanical properties [15] when compared with systems containing no carbon. Some recent
studies reported improvements in mechanical, thermal, and wear properties utilizing a plasma
spray method to disperse nanoparticles into an Al system [16-18]. There are few reports in
literature addressing the solubility of carbon in aluminum but there are no such materials

38
available commercially [19, 20]. Several studies have been carried out on mixing aluminum and
carbon for high temperature applications [21, 22]. Researchers also used a sputtering technique
to fabricate aluminum-carbon thin films, verified carbon content by SEM and TEM imaging,
presented insights on forms of carbon, and showed improved properties [23].
Recently, Third Millennium Materials, LLC (TM2) (Waverly, Ohio) developed a new
manufacturing process using which carbon can be infused into several different metals or alloys,
including aluminum [24-27]. In these novel materials, called “covetics,” the carbon-metal bond
is very strong, resisting many standard methods of detecting carbon, and the carbon does not
separate out during remelting, laser ablation, or magnetron sputtering.
In this chapter, the characterization of the structure, composition, and mechanical
properties of the aluminum carbon covetic materials is addressed. More specifically, we focus on
warm-rolled aluminum alloy 7075 Al with 0, 3 and 5 wt% of carbon infused during processing.
All these three materials were made using the covetic process. Characterization included
estimates of actual carbon contents using scanning electron microscopy (SEM) with energy
dispersive spectroscopy (EDS) and x-ray photoelectron spectroscopy (XPS), SEM imaging of
tensile fracture surfaces and polished surfaces, x-ray diffraction (XRD) testing of structure, and
density measurements. Mechanical testing included tensile testing which provided Young’s
modulus (E), 0.2% yield strength (YS), ultimate tensile strength (UTS), and tensile elongation at
failure, Rockwell and Vickers tests which gave hardness, and nanoindentation testing which
provided local Young’s modulus and hardness. The obtained experimental results were
compared with data available in literature for 7075 Al alloys.
39
3.2 MATERIALS AND METHODS
3.2.1 Materials
The 7075 aluminum covetics, manufactured by TM2, with 0, 3 and 5 weight percent of
carbon (target compositions as reported by TM2), were characterized. In the notation used in
figures these three types of materials were denoted as 0 wt% C, 3 wt% C, and 5 wt% C,
respectively. The weight percentages of carbon were the processing compositions. These
materials were all produced using the covetics manufacturing process. They were in the T0
condition and rolled 5 times at 20% reductions per pass to a thickness of 1.0 mm (0.04 in) from
the as-cast 1.0 cm (0.40 in) thick samples. All three billets were cast in the same furnace and
rolled in the MSC Rolling Mill (Manufacturing Sciences Corporation, Oak Ridge, TN) in the
same batch after side-by-side homogenization at 450 ºC.
3.2.2 Calculation of 7075 Al-C phase diagrams
The CALPHAD (CALculation of PHAse Diagrams) method was used to predict phase
diagrams computationally. This method is based on the fact that a phase diagram is the
representation of the thermodynamic properties of a system. If the thermodynamic properties are
known, then it is possible to calculate the multi-component phase diagrams. Thermodynamic
descriptions of lower order systems (e.g., the Gibbs energy of each phase) are combined to
extrapolate higher order systems.
3.2.3 Density measurement
Densities were obtained by measuring the weights and volumes of at least five samples of
50 × 25 × 1 mm3 sizes for each carbon content level. The samples were ground down to have

40
smooth and parallel edges prior to measurements. Sample dimensions were measured at three
different locations, and the values were averaged. Theoretical densities for the samples were also
predicted by applying a rule of mixtures as shown in equation 3.1.
ρ = ρc fc + ρa fa (3.1)
where ρ and f represent density and volume fraction, respectively, and subscripts c and a denote
carbon and aluminum, respectively.
3.2.4 Indentation testing
Hardness testing was carried out at three different length scales (nanoscale, microscale,
and mesoscale) to determine local and global hardnesses of the Al 7075 alloy covetics.
Specimens were polished by using a series of abrasive papers and polishing cloths. The samples
were polished using an ECOMET 3000 grinder with sandpaper having grit sizes of 320, 600,
1200, and 2400. Then, the samples were polished using the same grinder-polisher with polishing
powder (3.0, 1.0, 0.3 and 0.02 micron de-agglomerated alpha alumina) in four stages with the
help of polishing cloths.
At the nanoscale, TI 950 TriboIndenter® (Hysitron, Minneapolis, MN) was used to
perform nanoindentation tests on the plane parallel to the rolling direction. Indentations were
made with a diamond Berkovich tip. Indentation sites were selected using TriboIndenter’s
optical system. For all test areas, 8000 μN load-controlled indents were made using a five-second
load, two-second hold, and five-second unload function. Sixteen indentations were conducted on
each specimen. Hardness, H, and reduced elastic modulus, Er, were obtained from the software
and elastic modulus, Es, was calculated using equation 3.2 [28].

41
(3.2)
where the subscript i corresponds to the indenter material, the subscript s refers to the indented
material, and ν is Poisson’s ratio. For a diamond indenter probe, Ei is 1140 GPa and νi is 0.07,
and νs is 0.33 for 7075 Al.
At the microscale, Vickers microhardness (VHN) was measured on the surface parallel to
the rolling direction by applying a load of 3 kg for 15 sec (Shimadzu microhardness tester HMV-
M3, Newage Testing Instruments, Inc., Feasterville, PA). The surface of the specimen was
prepared the same way as for the nanoindentation test. The hardness value was the average of
five measurements made on the surface of each specimen. At the mesoscale, Rockwell hardness
(HRB) was also measured on the same plane (Wilson/ Rockwell Hardness Tester by Instron,
Grove City, PA).
3.2.5 Tensile testing
Tensile specimens were prepared from the same rolled sheets as those used for the
indentation tests in accordance with the ASTM Standard E-8/E8M-09 [29] sub-size
specifications with a 25 mm (1.0 in) gauge length. The tensile test was performed using an MTS
servo hydraulic materials testing machine (MTS 22 kips load cell) operated at a constant
crosshead speed of 0.0254 mm/s (0.001 in/s). Four samples of each kind were machined to the
same length and shape in three different orientations (0°, 45°, and 90°) with respect to the rolling
direction as shown in Figure 3.1. An extensometer with 25.4 mm (1.0 in) gauge length was used
to obtain a displacement. Load-displacement data were recorded and used to generate stress-
2 21 (1 ) (1 )s i
r s iE E Eν ν− −
= +

42
strain curves and calculate Young’s modulus (E), ultimate tensile strength (UTS), percent
elongation (% EL) and yield strength (YS).
Figure 3.1. Preparation of tensile samples in different directions.
3.2.6 X-ray Diffraction (XRD) analysis
The powder XRD data were collected on a Bruker D8 Venture equipped with a four-
circle kappa diffractometer and Photon 100 detector. An Iμs microfocus Cu source supplied the
multi-mirror monochromated incident beam. The sample was dispersed in a minimum amount of
paratone oil, loaded onto a 0.3 mm loop, and exposed for 180 seconds for each of several frames.
The frames were merged and integrated from 5 to 100 degrees 2θ. In the final spectrum, data
were normalized to facilitate pattern matching, and the baseline was corrected using a Chebyshev
polynomial.
3.2.7 Scanning Electron Microscopy (SEM) imaging
Scanning electron microscopy was used to visualize fractured and polished surfaces and
to quantify carbon content.
0°
45°
90°
direction of rolling

43
First, SEM images were taken using a Field-Emission Environmental Scanning Electron
Microscope (ESEM-FEG) with Energy-Dispersive Spectroscopy (EDS) (Philips XL30 ESEM-
FEG, FEI, Hillsboro, OR). Tensile fracture surfaces of 7075 Al alloy covetic specimens from
zero degree orientation (tested along rolling direction) were imaged. Samples were imaged with
no coating or other sample preparation.
Then, SEM with Energy Dispersive X-ray Microanalysis was conducted by using a JEOL
7000F Analytical SEM to visualize the microstructure and quantify the chemical composition.
The samples were polished using an ECOMET 3000 grinder with sandpaper having grit sizes of
320, 600, 1200 and 2400. Later those were polished using the same grinder-polisher with
polishing powder (3.0, 1.0, 0.3 and 0.02 micron de-agglomerated alpha alumina) in four stages
with the help of polishing cloths. Final polishing was done in a Vibratory polisher with buffer
solution for 3-4 hours. Samples were cleaned with warm water in an ultrasonic bath and final
cleaning was done using Ethanol.
3.2.8 X-ray Photoelectron Spectroscopy (XPS) analysis
The XPS spectra were measured using a Physical Electronics model 5400 X-ray
photoelectron spectrometer by Azzam Mansoor at the Naval Surface Warfare Center, Bethesda,
MD. The data were collected at room temperature using a nonmonochromatic Al Kα (1486.6 eV)
X-ray source operating at 400 W (15 kV and 27 mA). Data collection proceeded when the
pressure in the analysis chamber reached ≈2 x 10⁻⁸ Torr. Multiplex spectra for the Al 2p, Al 2s, C
1s and O 1s photoemission regions were collected at an electron takeoff angle of 45 degrees,
analyzer pass energy of 35.75 eV (analyzer resolution of 0.54 eV), 0.2 eV/step, and integration
interval of 50 ms/step and averaged 10, 10, 50, and 100 scans per region, respectively. The
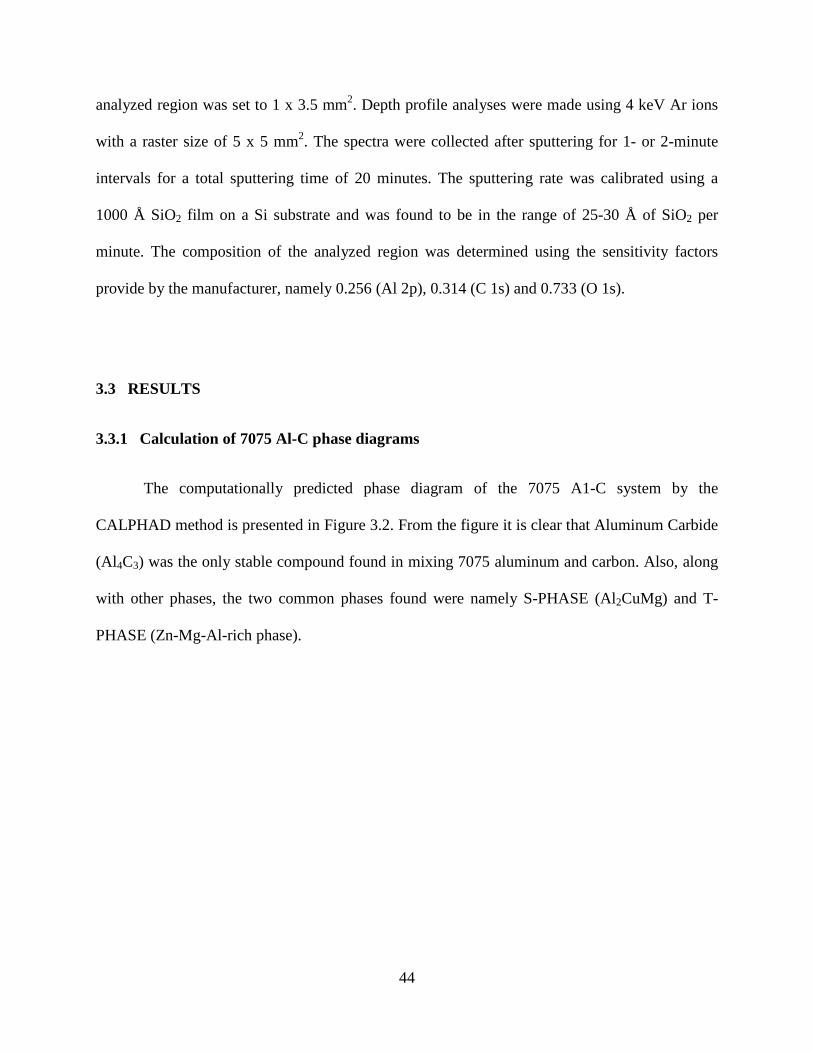
44
analyzed region was set to 1 x 3.5 mm2. Depth profile analyses were made using 4 keV Ar ions
with a raster size of 5 x 5 mm2. The spectra were collected after sputtering for 1- or 2-minute
intervals for a total sputtering time of 20 minutes. The sputtering rate was calibrated using a
1000 Å SiO2 film on a Si substrate and was found to be in the range of 25-30 Å of SiO2 per
minute. The composition of the analyzed region was determined using the sensitivity factors
provide by the manufacturer, namely 0.256 (Al 2p), 0.314 (C 1s) and 0.733 (O 1s).
3.3 RESULTS
3.3.1 Calculation of 7075 Al-C phase diagrams
The computationally predicted phase diagram of the 7075 A1-C system by the
CALPHAD method is presented in Figure 3.2. From the figure it is clear that Aluminum Carbide
(Al4C3) was the only stable compound found in mixing 7075 aluminum and carbon. Also, along
with other phases, the two common phases found were namely S-PHASE (Al2CuMg) and T-
PHASE (Zn-Mg-Al-rich phase).
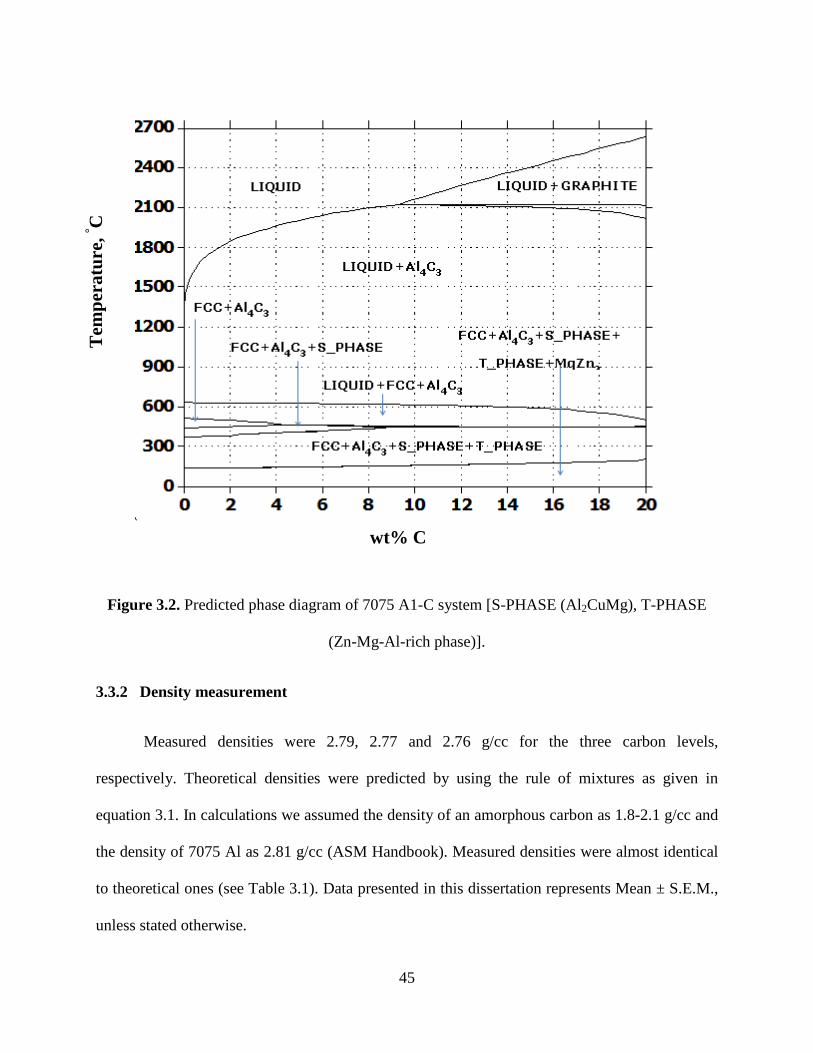
45
Figure 3.2. Predicted phase diagram of 7075 A1-C system [S-PHASE (Al2CuMg), T-PHASE
(Zn-Mg-Al-rich phase)].
3.3.2 Density measurement
Measured densities were 2.79, 2.77 and 2.76 g/cc for the three carbon levels,
respectively. Theoretical densities were predicted by using the rule of mixtures as given in
equation 3.1. In calculations we assumed the density of an amorphous carbon as 1.8-2.1 g/cc and
the density of 7075 Al as 2.81 g/cc (ASM Handbook). Measured densities were almost identical
to theoretical ones (see Table 3.1). Data presented in this dissertation represents Mean ± S.E.M.,
unless stated otherwise.
wt% C
Tem
pera
ture
, ° C

46
Table 3.1. Measured and theoretically obtained densities of 7075 Al covetics
Material Measured Density
(g/cc) Theoretical Density
(g/cc)
0 wt% C 2.79 ± 0.22 2.81
3 wt% C 2.77 ± 0.19 2.78 - 2.79
5 wt% C 2.76 ± 0.20 2.76 - 2.77
3.3.3 Indentation testing
Vickers and Rockwell hardness tests showed improved properties for covetics with
carbon addition as shown in Figure 3.3. More specifically, for the 5 wt% C material, the Vickers
hardness increased by 33% and the Rockwell hardness increased by 32%. Nanoindentation tests
were performed on the same rolled sheets as were used in the hardness tests and were in the
plane parallel to the rolling direction. Measured quantities were the reduced elastic modulus, Er,
and hardness, H. From Er, and using equation 3.2, the elastic modulus (Es) was calculated. Both
Es and H increased for covetics (see Figures 3.4 and 3.5). The elastic modulus and hardness
increased for covetics (5 wt% C) by 8% and 43%, respectively, as compared to the 0 wt% C
samples.

47
Figure 3.3. Vickers (Kgf/mm2) and Rockwell B hardness versus carbon content.
Figure 3.4. Elastic Modulus (Es) versus carbon content measured by nanoindentation.

48
Figure 3.5. Hardness (H) versus carbon content measured by nanoindentation.
3.3.4 Tensile testing
Tensile testing results of these samples in three different orientations were presented in
Figures 3.6 – 3.9. Both the UTS and the 0.2% YS, measured using tensile testing, increased as the
carbon content increased. The UTS increased by 40% (from 0 to 5 wt% C) for a 0 degree
orientation, from about 400 MPa to nearly 600 MPa, respectively. Similarly, the 0.2% YS
increased by 41% with increasing carbon content at 0° orientation.
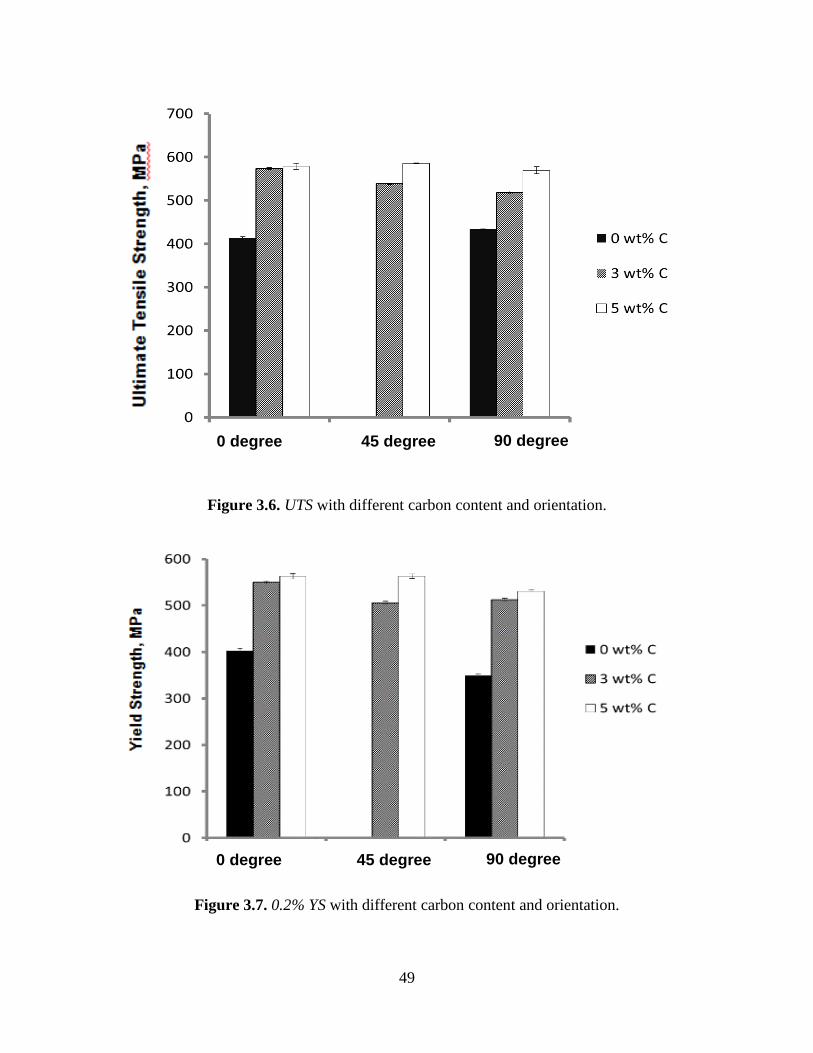
49
Figure 3.6. UTS with different carbon content and orientation.
Figure 3.7. 0.2% YS with different carbon content and orientation.
45 degree 0 degree 90 degree
45 degree 0 degree 90 degree

50
Figure 3.8. E with different carbon content and orientation.
Figure 3.9. % EL with different Carbon content and orientation.
45 degree 0 degree 90 degree
45 degree 0 degree 90 degree

51
3.3.5 X-ray Diffraction (XRD) analysis
The results from the XRD analysis of the 7075 Al and its covetic samples are
summarized in Figures 3.10-3.13. The XRD patterns of 7075 Al with 0 wt% C, 3 wt% C, and 5
wt% C are shown in Figure 3.10 using only one representative example. The XRD patterns were
further analyzed to determine the crystallite size of the materials as shown in Figure 3.11. Lattice
parameter and lattice strain from the XRD measurements are also shown in
Figure 3.10. A typical example of the XRD pattern is shown for 7075 Al covetics with
increasing wt% of C.

52
Figure 3.11. Effect of wt% of C on the average crystallite size of 7075 Al covetics.
Figure 3.12. Changes in lattice parameter due to different wt% of C in 7075 Al covetics.

53
Figures 3.12 and 3.13. Both the lattice parameter and lattice strain increased with increasing
carbon content in 7075 Al covetics.
3.3.6 Scanning Electron Microscopy (SEM) imaging
The SEM micrographs of fractured tensile samples of the covetics and 7075 Al alloy are
shown in Figures 3.14-3.16. Energy Dispersive X-ray Microanalysis System (EDS) was also
used to quantify chemical composition and the results are tabulated in Table 3.2. Further SEM-
EDS microanalysis of 7075 Al covetics was conducted and will be discussed later.
Figure 3.13. Changes in lattice strain due to different wt% of C in 7075 Al covetics.

54
Figure 3.14. SEM images (250x) of fractured surfaces of 7075 covetic with 0 wt% C (left) and 5 wt% C (right).
Table 3.2. Carbon content of the materials by EDS and XPS
Material Carbon weight %
(EDS) Carbon weight %
(EDS)* Carbon weight %
(XPS) **
0 wt% C 1.20 ± 0.205 0.025 ± 0.018 1.15
3 wt% C 1.63 ± 0.184 0.520 ± 0.220 1.71
5 wt% C 2.30 ± 0.244 0.594 ± 0.160 1.89
*Caroline Scheck, Naval Surface Warfare Center, Bethesda, MD
**Azzam Mansoor, Naval Surface Warfare Center, Bethesda, MD

55
Figure 3.15. SEM images (800x) of fractured surfaces of 7075 covetic with 0 wt% C (left) and 5 wt% C (right).
Figure 3.16. High magnification SEM images of fractured surfaces of 7075 covetic with 0 wt% C (left) and 5 wt% C (right).

56
3.3.7 X-ray Photoelectron Spectroscopy (XPS) analysis
The average carbon concentrations, as determined by XPS after sputtering for the 0, 3,
and 5 wt% C (control, 6.5, and 10.6 atomic % C, respectively) samples, were determined to be
1.15, 1.71, and 1.89 wt % C (2.5, 3.7, and 4.1 at%), respectively. The results from XPS analysis
are tabulated in the fourth column of Table 3.2 to compare with those obtained by SEM-EDS
microanalysis.
3.4 DISCUSSION
3.4.1 Calculation of 7075 Al-C phase diagrams
The solubility of carbon in aluminum was primarily investigated in melt environments at
high temperatures [30, 31]. Work by Simensen [31] quantified carbon solubility in aluminum
and showed that the solubility decreased sharply for temperatures below 750 °C. He also
predicted an equilibrium carbon solubility of 0.013 ppm at aluminum freezing temperature and
showed the Al4C3 solubility also decreases at regular working temperature. In the 7075 Al-C
binary system, aluminum carbide, Al4C3, was one of the intermediate compounds, along with the
S-PHASE and T-PHASE, found in our predicted phase diagram. Polished 7075 Al samples were
examined by SEM-EDS analysis and they confirmed the presence of these phases along with
other compounds.
3.4.2 Density measurement
Densities remained nearly constant at different carbon contents. Such small variation in
density could be attributed to a low volume percentage of the infused carbon and the fact that

57
carbon has density which is fairly similar to that of the elemental aluminum. Theoretically
predicted densities were in good agreement with the measured densities of the covetics.
3.4.3 Indentation testing
The hardnesses measured by Vickers and Rockwell hardness testers were in a similar
range compared to 7075-T6 material from Aluminum Association’s Engineering Data for
Aluminum Structures. Rockwell and Vickers hardnesses for 7075-T6 Al were reported as 87
HRB and 175 kgf/mm2. Our 5 wt% C covetic showed the same Rockwell hardness, i.e., 87 HRB,
and 178 kgf/mm2 as the Vickers hardness.
Nanoindentation results are tabulated in Table 3.3 and compared with those found in
literature. The experimentally obtained elastic modulus and hardness of 7075 Al covetics with 5
wt% C were compared with 7075 Al with Si-bearing inclusions (Mg2Si), 7075 Al with Fe-
bearing inclusions (Al7Cu2Fe), 7075 Al with Fe-bearing inclusions (Al23Fe4Cu), over-aged 7075
Al and peak-aged 7075 Al as nanoindentation results for pure 7075 Al was not available.
Table 3.3. Comparison of elastic modulus and hardness of 7075 Al from literature
Modulus (GPa) Hardness (GPa)
7075 Al with Si-bearing inclusions (Mg2Si)
94.8 ± 7.5 [35] 5.2 ± 0.5 [35] 82.3–99.4 [33] 4.1–5.9 [33]
44.9–55.3 [34] 1.56–3.44 [34]
7075 Al with Fe-bearing inclusions (Al7Cu2Fe)
160.2 ± 10.9 [35] 8.8 ± 0.9 [35] 153.34–168.46 [32] 132–167 [33] 8.5–12.4 [33] 115.2–154.8 [34] 5.2–8 [34]
7075 Al with Fe-bearing inclusions (Al23Fe4Cu)
139.5 ± 3.7 [35] 7.5 ± 0.8 [35]

58
From Table 3.3, it was clear that our data is comparable to that of the over- and peak-
aged (heat treated) 7075 Al alloy, but the 7075 Al alloys with inclusions showed higher values
than the studied covetic materials.
3.4.4 Tensile testing
Our tensile test results showed a 40% increase in UTS (from 0 to 5 wt% C) for a 0 degree
orientation, and a 41% increase in 0.2% YS for the same materials with increasing carbon at 0°
orientation. Other orientations also displayed improved strength in covetics with carbon. Note
that strength increased significantly higher than the strain hardening created by the rolling
process alone. From Al data from the Aluminum Association’s Engineering Data for Aluminum
Structures, standard, as cast Al 7075-0 has a UTS = 275 MPa and Al 7075-T6 has a UTS = 572
MPa. Our data showed that the UTS reached about 580 MPa with the highest level of carbon.
The material was not heat treated—only warm rolled; however, it had a UTS as good as that of a
heat-treated aluminum alloy. Percent elongation had no clear trend for any orientation group.
Most of the samples fractured at the extensometer knife edge which might have led to this
Table 3.3 (cont.)
7075 Al (Over Aged) 83.5 ± 1.2 [35] 2.06 ± 0.06 [35]
7075 Al (Peak Aged) 84.3 ± 1.7 [35] 2.41 ± 0.08 [35]
7075 Al covetics 5 wt% C 83.0 ± 2.1 [This study] 2.88 ± 0.09 [This study]

59
inconsistency (Figure 3.17). No localized necking was observed in the samples after tensile
testing in Figure 3.17. Samples at 0° and 90° orientations broke on the plane normal to the
direction of loading: 45° samples broke at 45°. However, the elastic modulus remained
unchanged (about 70 GPa) for all cases.
Figure 3.17. Images before and after tensile testing.
3.4.5 X-ray Diffraction (XRD) analysis
The broadening of the XRD peaks of the C-doped Al samples (Figure 3.10) indicated a
decrease in crystallite size as described already by other authors using high energy milling for
aluminum-based nanocomposites [36-38]. It is interesting to note that the 0 wt% C had
90°
45°
0°

60
significant extra peaks between 40 and 45 degrees that were not as significant for the 3 wt% C
and 5 wt% C samples.
As shown in Figure 3.11, the average crystallite size for both the 3 wt% C and 5 wt% C
samples decreased compared to the no carbon added covetic. The size was decreased to about 25
nm for 3 wt% C sample and remained almost constant in the 5 wt% C sample. The crystallite
sizes measured here were slightly smaller than those reported by Bradbury et al. [39] and Choi et
al. [40] for 1xxx aluminum. This could be possible as the aluminum alloy and manufacturing
process for our materials were different.
Figure 3.18. The Hall–Petch effect for 7075 Al covetics compared to the experimental values for
the yield strength.
300
400
500
600
700
1 2 3
Hall Petch
Experimental
Yie
ld S
treng
th, M
Pa
0 wt% C 3 wt% C 5 wt% C
61
Metals show an increase in strength with decreasing crystallite size due to the pile up of
dislocations at the crystal boundaries (referred as the Hall–Petch effect). The relation between
yield stress and grain size is described mathematically by the Hall–Petch equation as follows:
𝜎𝑦= 𝜎𝑜+ 𝑘𝑦√𝑑
(3.3)
where σy is the yield stress, σo is a materials constant for the starting stress for dislocation, ky is
the strengthening coefficient (a constant unique to each material, ky = 0.068 MPa/m3/2 for Al),
and d is the average grain diameter [39]. Using the values in equation 3.3, the Hall-Petch yield
strength was predicted and shown in Figure 3.18, and, for comparison, the yield strength found
experimentally by tensile testing is also included. From this figure it could be concluded that
using the values of average crystallite sizes found from XRD results, the predicted Hall-Petch
yield strength was higher than our experimental results although the increasing trend was similar.
3.4.6 Scanning Electron Microscopy (SEM) imaging
The results in Table 3.2 show that the amount of carbon in each sample was lower than
the manufacturer’s target wt% carbon. Note that 0 wt% 7075 Al showed 1.20% C in the sample.
Small amount of carbon in the 0 wt% 7075 Al material is expected as one can create covetics in
the plasma field between the electrodes of the reactor, from the carbon electrodes, carbon mixer
and even the carbon crucible during materials processing. Column 3 shows the results obtained
by Caroline Scheck of the Naval Surface Warfare Center, Bethesda, MD, who tested the same
materials but different samples. A difference in the result is observed: column 3 showed lower
values than column 2 for the same material. This difference could be due to the spatial
heterogeneity of material due to a possible nonuniform carbon distribution.

62
No significant differences were observed in the SEM micrographs of the tensile fracture
surfaces at lower magnifications (Figures 3.14 and 3.15) for the materials with these three carbon
contents, but higher magnifications (20,000x) revealed less ductile local failure behavior with an
increase of the carbon content (Figure 3.16).
Figure 3.19. SEM-EDS analysis of 7075 Al covetic with 0 wt% C (point 1 showed some Fe, Cu rich Al while points 2, 3 and 4 were Al-rich matrix).
During manufacturing no carbon was added in the 0 wt% sample, and, as a result, no
compound containing carbon was found in that particular sample (Figure 3.19). It was discussed
earlier that in the 7075 Al-C phase diagram, Al4C3 is the only stable compound found in mixing
aluminum and carbon along with S-PHASE (Al2CuMg), T-PHASE (Zn-Mg-Al-rich phase).
These compounds were seen in the 3 wt% C (Figure 3.20) and 5 wt% C (Figure 3.21) covetics.

63
Figure 3.20. SEM-EDS analysis of 7075 Al covetic with 3 wt% C (point 1 showed amorphous carbon, point 2 was sodium carbonate (Na2CO3), point 3 was aluminum carbide (Al4C3), points 4
and 5 were Al-rich matrix, and point 6 was an oxygen-rich area).
In Figure 3.20, point 1 refers to amorphous carbon; point 2 is sodium carbonate
(Na2CO3); point 3 is aluminum carbide (Al4C3); points 4 and 5 are Al-rich matrix; and point 6 is
an oxygen-rich area. The samples were polished using a buffer solution and the sodium
carbonate, which was an unexpected compound, could be present from the buffer solution which
contains sodium. Similarly, Figure 3.21 shows aluminum carbide (Al4C3) in points 1 and 5,
amorphous carbon in points 2 and 4, Al-rich matrix in points 3 and 8, T-PHASE (Zn-Mg-Al-rich
phase) in point 6, and S-PHASE (Al2CuMg) in point 7. Table 2 indicates that almost 50% of the
target amount of C was present in the covetic matrix, and the rest of it was believed to form

64
different compounds in the covetic materials. Also since powdered carbon was added into the hot
melt, there could be losses when adding the carbon during processing.
Figure 3.21. SEM-EDS analysis of 7075 Al covetic with 5 wt% C (points 1 and 5 were aluminum carbide (Al4C3), points 2 and 4 were amorphous carbon, points 3 and 8 were Al-rich matrix, point 6 was T-PHASE (Zn-Mg-Al-rich phase), and point 7 was S-PHASE (Al2CuMg)).
3.4.7 X-ray Photoelectron Spectroscopy (XPS) analysis
The goal of this investigation was to use XPS combined with Ar-ion depth profiling to
determine the carbon content at the bulk level and compare it to that obtained by SEM-EDS. As
was the case for most materials, hydrocarbon and various oxygen functionalities were always

65
present as contaminants on the surface, and Ar-ion sputtering was used to remove these
contaminants. Additionally, other elements that were present in small quantities in this type of
alloy (such Zn, Cu, Si, Mg, etc) were ignored.
The presence of high carbon and oxygen contents as contaminants on the surface (before
sputtering) was prominent. Once sputtering of the surface with Ar-ions began, the carbon and
oxygen concentrations decreased significantly while that of aluminum increased significantly.
The average carbon concentrations as determined by XPS after sputtering for the 0, 3, and 5 wt%
C (control, 6.5, and 10.6 atomic % C, respectively) samples were determined to be 1.15, 1.71,
and 1.89 wt% C (2.5, 3.7, and 4.1 at% C), respectively. Again, the data showed some carbon in
the control sample. As discussed earlier, small amounts of carbon are infused by applying a
covetic process. Additionally, there could be a carbon contamination from the oil pump in the
system. Table 3.2 confirms that our results are comparable to the XPS data examined by Azzam.
3.5 CONCLUSIONS
In this chapter the 7075 aluminum covetics were studied. Microstructure characteristics,
mechanical properties, and amounts of carbon in the materials were investigated. Results of
microstructure observation and tests of mechanical properties are summarized as follows:
(1) Tensite test results showed that the ultimate tensile strength increased (by 40%) and
0.2% offset yield strength increased (by 41%) for covetics, but Young’s modulus (E)
remained unchanged. No clear trend was observed in % EL data.

66
(2) Rockwell, Vickers, and nanoindentation hardness each increased with increasing
carbon content. Elastic modulus measured by the nanoindentation also increased with
added carbon.
(3) No localized necking was observed in the failed tensile test specimens. SEM
micrographs illustrated ductile failure characteristics.
(4) Both SEM-EDS and XPS analysis confirmed a lower amount of carbon in the
materials than the target value except for the control sample (target value of 0 wt% C)
which had a measureable carbon presence.
(5) XRD analysis showed lower crystalline size with added carbon which may explain
the improvement in mechanical properties.
3.6 REFERENCES
1. Immarigeon, J.P., R.T. Holt, A.K. Koul, L. Zhao, W. Wallace, and J.C. Beddoes, Lightweight
materials for aircraft applications, Material Characterization, 1995, 35: p. 41–67.
2. Mortensen, A., and J. Llora, Metal Matrix Composites, Annual Review of Materials Research
Online, 2010, 40: p. 243-270.
3. Rawal, S., Manufacture of Al nanocomposite - a critical review, Journal of Materials, 2001,
53: p. 14-17.

67
4. Miyagawa, H., M. Misra, and A.K. Mohanty, Mechanical Properties of Carbon Nanotubes
and Their Polymer Nanocomposites, Journal of Nanoscience and Nanotechnology, 2005, 5(10):
p. 1593–1615.
5. Salvetat J.P., and B.R. Pipes, Progress on Mechanics of Carbon Nanotubes and Derived
Materials, Journal of Nanoscience and Nanotechnology, 2006, 6(7): p. 1857–1882.
6. Takashi, I., Overview of trends in advanced composite research and applications in Japan,
Advanced Composite Materials, 2006, 15(1): p. 3–37.
7. Xie, X.L., Y.W. Mai, and X.P. Zhou, Dispersion and alignment of carbon nanotubes in
polymer matrix: A review, Materials Science and Engineering R, 2005, 49(4): p. 89–112.
8. Piegney, A., C. Laurent, E. Flahaut, and A. Rousset, Carbon nanotubes in novel ceramic
matrix nanocomposites, Ceramics International, 2000, 26: p. 677-683.
9. Curtin, W.A., and B.W. Sheldon, CNT-reinforced ceramics and metals, Materials Today,
2004, 7(11): p. 44–49.
10. White, A.A., S.M. Best, and I.A. Kinloch, Hydroxyapatite-Carbon Nanotube Composites for
Biomedical Applications: A Review, International Journal of Applied Ceramic Technology, 2007,
4(1), p. 1-13.
11. Bakshi, S., D. Lahiri, and A. Agarwal, Carbon nanotube reinforced metal matrix composites
– a review, International Materials Reviews, 2010, 55(1): p. 41-64.
12. Borgonovo, C., and D. Apelian, Manufacture of Aluminum nanocomposites: A critical
review, Materials Science Forum, 2011, 678: p. 1-22.

68
13. Choi, H.J., B.H. Min, J.H. Shin, and D.H. Bae, Strengthening in nanostructured 2024
aluminum alloy and its composites containing carbon nanotubes, Composites: Part A, 2011, 42:
p. 1438–1444.
14. Deng, C., X. Zhang, D. Wang, Q. Lin, and A. Li, Preparation and characterization of carbon
nanotubes/aluminum matrix composites, Materials Letters, 2007, 61: p. 1725–1728.
15. Bartoluccia, S.F., J. Parasa, M.A. Rafieeb, J. Rafieec, S. Lee, D. Kapoor, and N. Koratkar,
Graphene–aluminum nanocomposites. Materials Science and Engineering A, 2011, 528: p.
7933– 7937.
16. Bakshi, S.R., V. Singh, S. Seal, and A. Agarwal, Aluminum composite reinforced with
multiwalled carbon nanotubes from plasma spraying of spray dried powders, Surface &
Coatings Technology, 2009, 203: p. 1544–1554.
17. Bakshi, S.R., R.R. Patel, and A. Agarwal, Thermal conductivity of carbon nanotube
reinforced aluminum composites: A multi-scale study using object oriented finite element
method, Computational Materials Science, 2010, 50: p. 419–428.
18. Bakshi, S.R., A.K. Keshri, and A. Agarwal, A comparison of mechanical and wear
properties of plasma sprayed carbon nanotube reinforced aluminum composites at nano and
macro scale, Materials Science and Engineering A, 2011, 528: p. 3375–3384.
19. Simensen, C.J., Comments on the solubility of carbon in molten aluminum, Metallurgical
Transactions A, 1989, 20(1): p. 191-196.
20. Rodseth, J., B. Rasch, O. Lund, and J. Thonstad, Solubility of Carbon in Aluminum upon
Casting Process, in Light Metals: Proceedings of Sessions, TMS Annual Meeting, 2002.

69
21. Lovshenco, F.G., and G. Jangg, Production of dispersion- hardened Aluminum- Carbon
alloys, Part I, Poroshkovaya Metallurgiya, 1978, 9(189): p. 39-44.
22. Lovshenco, F.G., and G. Jangg, Production of dispersion- hardened Aluminum- Carbon
alloys, Part II, Poroshkovaya Metallurgiya, 1978, 10(190): p. 54-58.
23. Carson, R.T., Microstructure and Mechanical Properties of Al1-xCx Alloys, PhD
dissertation, University of Illinois-UC, 1992.
24. Shugart, J., New Class of Metallic Nanocomposites, paper presented at Materials Science &
Technology (MS&T 2009), Pittsburgh, PA, 25-29 October 2009.
25. Brown, L., P. Joyce, D.R. Forrest, and J. Wolk, Physical and Mechanical Characterization of
a Nano Carbon Infused Aluminum-Matrix Composite, Proceedings of the SAMPE Fall Technical
Conference, Ft. Worth, TX, 17-20 October 2011.
26. Forrest, D.R. I. Jasiuk, L. Brown, P. Joyce, A. Mansour, and L. Salamanca-Riba, Novel
metal-matrix composites with integrally-bound nanoscale carbon, Proceedings of Nanotech
Conference & Expo, Santa Clara, CA, 18-21 June 2012.
27. Salamanca-Riba, L., R. Isaacs, A.N. Mansour, A. Hall, D.R. Forrest, M.C. LeMieux, and J.
Shugart, A new type of carbon nanostructure formed within a metal-matrix, in Technical
Proceedings of the 2012 NSTI Nanotechnology Conference and Expo, NSTI-Nanotech 2012, p.
278-281.
28. Oliver, W.C., and G.M. Pharr, An improved technique for determining hardness and elastic
modulus using load and displacement sensing indentation experiments, Journal of Materials
Research, 1992, 7: p. 1564–1583.

70
29. ASTM E8/E8M– 09, Standard Test Methods for Tension Testing of Metallic Materials.
30. Olden, L.L., and R.A. McCune, Phase equilibria in the Al-Si-C system, Metallurgical
Transactions A, 1987, 18(12): p. 2005-2014.
31. Qiu, C., and R. Metselaar, Solubility of carbon in liquid A1 and stability of A14C3, Journal of
Alloys and Compounds, 1994, 216: p. 55-60.
32. Bozek, J.E., J.D. Hochhalter, M.G. Veilleux, M. Liu, G. Heber, S.D. Sintay, A.D. Rollett,
D.J. Littlewood, A.M. Maniatty, H. Weiland, R.J. Christ Jr., J. Payne, G. Welsh, D.G. Harlow,
P.A. Wawrzynek, and A.R. Ingraffea, A Geometric Approach to Modeling Microstructurally
Small Fatigue Crack Formation: III. Correlation of simulated slip and stress fields with
observations of nucleation, Modelling and Simulation in Materials Science and Engineering,
2008, 16: p. 1–27.
33. Patton, G., C. Rinaldi, Y. Brechet, G. Lormand, and R. Fougeres, Study of fatigue damage in
7010 aluminum alloy, Materials Science and Engineering A, 1998, 254(1-2): p. 207–218.
34. Oswald, L.E., Effects of microstructure on high-cycle fatigue of an Al–Zn–Mg– Cu Alloy (Al-
7055), Master’s Thesis, School of Engineering, University of Pittsburgh, Pittsburgh, PA, 2003.
35. Singha, S.S., C. Schwartzsteina, J.J. Williamsa, X. Xiaob, F. De Carlob, and N. Chawlaa, 3D
microstructural characterization and mechanical properties of constituent particles in Al 7075
alloys using X-ray synchrotron tomography and nanoindentation, Journal of Alloys and
Compounds, 2014, 602: p. 163–174.

71
36. Bakshi, S.R., R.R. Patel, and A. Agarwal, Thermal conductivity of carbon nanotube
reinforced aluminum composites: A multi-scale study using object oriented finite element
method, Computational Materials Science, 2010, 50: p. 419–428.
37. Khan, A.S., B. Farrokh, and L. Takacs, Effect of grain refinement on mechanical properties
of ball-milled bulk aluminum, Materials science and engineering A, 2008, 489: p. 77–84.
38. Choi, H.J., S.W. Lee, J.S. Park, and D.H. Bae, Tensile behavior of bulk nanocrystalline
aluminum synthesized by hot extrusion of ball-milled powders, Scripta Materialia, 2008, 59(10):
p. 1123–1126.
39. Bradbury, C.R., J. Gomon, L. Kollo, H. Kwon, and M. Leparoux, Hardness of Multi Wall
Carbon Nanotubes reinforced aluminium matrix composites, Journal of Alloys and Compounds,
2014, 585: p. 362–367.
40. Choi, H.J., J.H. Shin, and D.H. Bae, Grain size effect on the strengthening behavior of
aluminum-based composites containing multi-walled carbon nanotubes, Composites science and
technology, 2011, 71(15): p. 1699–1705.

72
CHAPTER 4: CHARACTERIZATION OF AS CAST 10200 CU COVETICS
4.1 INTRODUCTION
It had been well recognized that the solubility of C in solid Cu is very small [1]. The
solubility of C in liquid Cu was extensively studied [2, 3] and the available data on the Cu–C
equilibrium phase diagram were discussed [4-7] where no carbide phases were reported. Based
on the success of the Mechanical Alloying technique (solid-state powder processing technique)
in creating supersaturated solutions of immiscible solids [8, 9] researchers used this method to
infuse carbon into copper with considerable success [10-12]. These studies reported on the effect
of carbon assimilation into the metal lattice structure either as a solid solution of carbon and
metal [12] or as a formation of small carbon clusters [10]. Inclusion of carbon has been attributed
to cause an increase in lattice parameter and lattice strain [7]. However, these studies did not
investigate bulk mechanical properties of these materials. Recently, Third Millennium Materials
(TM2) invented a covetic manufacturing process which achieves higher carbon solubility in
copper and copper alloys. It is also believed that the properties of covetics are dominated by the
properties of the carbon structures created during the chemical reaction. These new materials
have not yet been studied in detail. Therefore, a systematic experimental work is needed to
obtain comprehensive information on the structural and mechanical properties of these new
copper-based covetic materials.
In this chapter we presented our experimental results on the characterization of the
structure, chemical composition and mechanical properties of 10200 Cu-C materials
manufactured by the covetic process. We studied covetic materials with four different carbon
contents - 0, 3, 5 and 9 wt% C received from Third Millennium Materials (TM2). More precisely,
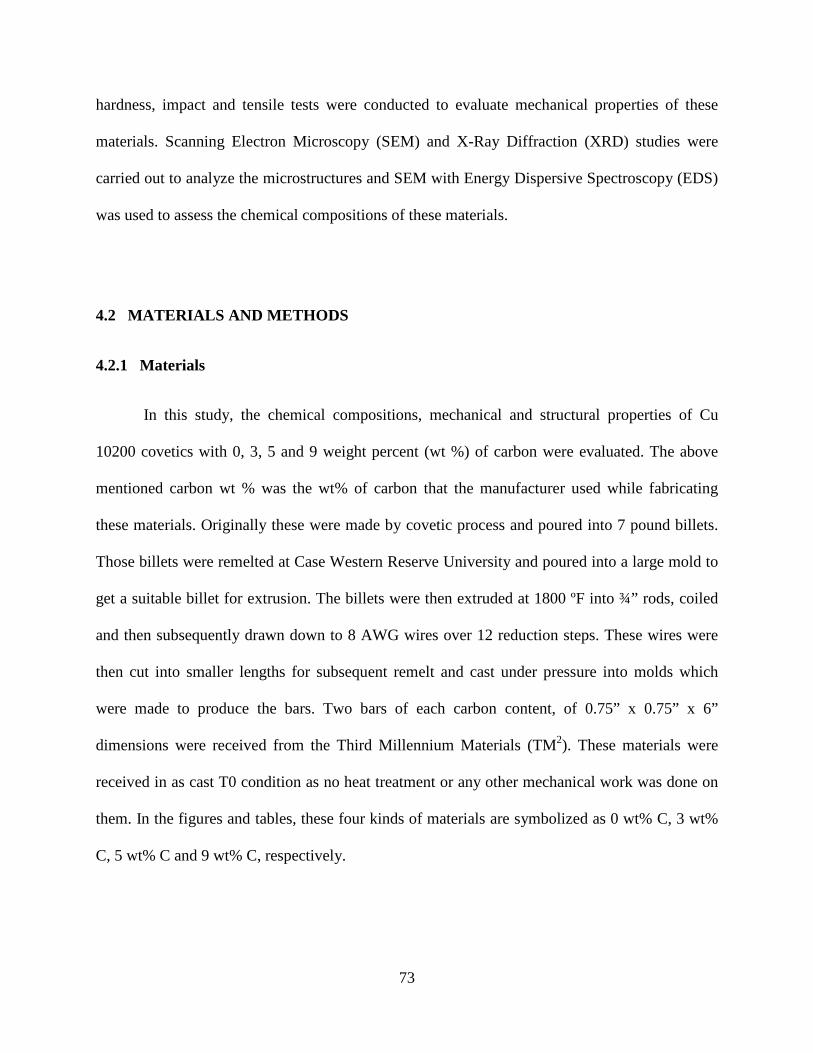
73
hardness, impact and tensile tests were conducted to evaluate mechanical properties of these
materials. Scanning Electron Microscopy (SEM) and X-Ray Diffraction (XRD) studies were
carried out to analyze the microstructures and SEM with Energy Dispersive Spectroscopy (EDS)
was used to assess the chemical compositions of these materials.
4.2 MATERIALS AND METHODS
4.2.1 Materials
In this study, the chemical compositions, mechanical and structural properties of Cu
10200 covetics with 0, 3, 5 and 9 weight percent (wt %) of carbon were evaluated. The above
mentioned carbon wt % was the wt% of carbon that the manufacturer used while fabricating
these materials. Originally these were made by covetic process and poured into 7 pound billets.
Those billets were remelted at Case Western Reserve University and poured into a large mold to
get a suitable billet for extrusion. The billets were then extruded at 1800 ºF into ¾” rods, coiled
and then subsequently drawn down to 8 AWG wires over 12 reduction steps. These wires were
then cut into smaller lengths for subsequent remelt and cast under pressure into molds which
were made to produce the bars. Two bars of each carbon content, of 0.75” x 0.75” x 6”
dimensions were received from the Third Millennium Materials (TM2). These materials were
received in as cast T0 condition as no heat treatment or any other mechanical work was done on
them. In the figures and tables, these four kinds of materials are symbolized as 0 wt% C, 3 wt%
C, 5 wt% C and 9 wt% C, respectively.

74
4.2.2 Density measurement
In order to measure densities of the 10200 Cu covetics, weight and volume were
determined. The weight was measured with a scale while the volume was measured directly
(from the geometry of the object) and also by the displacement of a fluid, i.e. Archimedes’
method. The average of the two methods of calculating volume was used to predict the density
of the material. Seven samples of 10 × 10 × 3 mm3 sizes for each carbon content were examined
to measure the density of these materials. The samples were grounded to have smooth and
parallel edges prior to measurements. Sample dimensions were measured at three different
locations and the values were averaged. Theoretical densities for the samples were also predicted
by applying a rule of mixtures as shown in equation 4.1.
Theoretical density ρ = ρc fc + ρcu fcu (4.1)
where ρ and f represents density and volume fraction, respectively and superscripts c and cu
denote carbon and copper, respectively.
4.2.3 Hardness testing
Vickers and Rockwell hardness testers were used to measure the hardness of covetic
materials. Samples were cut and sectioned into small pieces. The machining work was performed
in the machine shop of Mechanical Science and Engineering department at the University of
Illinois at Urbana-Champaign. Both longitudinal and transverse samples were prepared for
hardness testing (Figure 4.1). Specimens were then polished using MetaServ R 250 grinder-
polisher from Buehler with sand papers having grit sizes 600, 1200, 2400 and 4000. Then, the
samples were polished using the same grinder-polisher with polishing powder (3.0, 1.0, 0.3 and

75
Figure 4.1. Longitudinal and transverse samples for hardness testing.
0.02 micron de-agglomerated alpha alumina) in four stages with the help of polishing cloths at
Fredrick Seitz Material Research Laboratory at the University of Illinois at Urbana-Champaign.
Vickers micro hardness (VHN) was measured in both the longitudinal and transverse
directions of the materials by applying 3000 grams of load for 15 seconds. A Shimadzu
microhardness tester HMV-M3, Newage Testing Instruments, Inc., Feasterville, PA, USA was
used for this investigation. The hardness value was the average of the total of ten measurements
made on two orthogonal surfaces each specimen. Rockwell hardness (HRF) was also measured
on the same directions of the samples in a Wilson/ Rockwell Hardness Tester by Instron, Grove
City, PA, USA.
4.2.4 Charpy impact testing
Samples for the Charpy impact test were machined in accordance with the ASTM E23 02
standard [13]. The specimens (Figure 4.2) had a square cross-section of approximate dimensions:
W=D= 10mm. The notch was about 1.5 mm deep (d0), had an included angle of 450, and had a
notch root radius of approximately 0.15 mm. The total length of the specimen was 55 mm while
the spacing between specimen supports was 40 mm. Dynatup Impact Test Machine (Model
8250)

76
Figure 4.2. Geometry of Charpy V-notch impact testing sample.
was configured to perform the Charpy V-notch impact test to determine the energy absorbed
during impact events. A weighted crosshead was released and was slid on guide bars. A steel flag
on the carriage passed through the velocity detector block. The tup (instrumented load cell)
attached to the crosshead contacted the specimen. The velocity and load data were recorded and
used to calculate the impact energy.
4.2.5 Tensile testing
Tensile specimens were prepared from the same as cast materials as used for density and
other mechanical tests. According to the ASTM Standard E-8/E8M [14] sub-size specification
(Figure 4.3- dimensions were in mm) specimens were machined. All specimens were tested
using a servo hydraulic materials testing machine (MTS 22 kips load cell) operated at a constant
crosshead speed of 0.0254 mm/s (0.001in/s). An extensometer with 25.4 mm (1.0 in) gauge
length was used to obtain displacement during the tensile testing. Testing procedure was done as
follows:
1. Measured the width and thickness of the samples at several points along their reduced-
area section.

77
2. Placed the sample between the testing jaws, ensuring the sample is in the equally
adjusted position in the middle of the jaws with a dial caliper.
3. Set the crosshead speed of 0.0254 mm/s (0.001in/s). Balanced the load and set the gage
length.
4. Started the crosshead and continued until break was detected.
Figure 4.3. Geometry of tensile testing samples.
Load vs. displacement curves were recorded for each sample. The tensile stress at each required
data point was determined using equation 4.2 and the ultimate tensile strength and Young’s
modulus were calculated using equations 4.3 and 4.4, respectively.
σi = Pi / A ( 4.2 )
UTS = Pmax / A ( 4.3 )
E = Δσ / Δε ( 4.4 )
where Pi and σi are the load and stress at data point I, Pmax and UTS are the maximum load
before failure and the ultimate tensile strength, A is the average cross-sectional area and E is the

78
tensile modulus of elasticity, Δσ and Δε are the differences in applied tensile stress and strain
between the two strain points.
The stress-strain curves were generated from the load-displacement data recorded during
tensile testing and used for calculating Young’s modulus E, ultimate tensile strength UTS,
ultimate tensile strain and yield strength 0.2% YS.
4.2.6 X-ray Diffraction (XRD) analysis
A Bruker D8 Venture equipped with a four-circle kappa diffractometer and Photon 100
detector was used to collect the powder XRD data. An Iμs microfocus Cu source supplied the
multi-mirror monochromated incident beam. Very little paratone oil was used to disperse the
sample and loaded onto a 0.3mm loop and exposed for 180 seconds for each of several frames.
The frames were merged and integrated from 5 to 100 degrees 2θ. The data was normalized in
the final spectrum to facilitate pattern matching, and the baseline was corrected using a
Chebyshev polynomial.
4.2.7 Scanning Electron Microscopy (SEM) imaging
Scanning electron microscopy images of the samples after impact tests were taken by
using a Field-Emission Environmental Scanning Electron Microscope (ESEM-FEG) with
Energy-Dispersive Spectroscopy (EDS) (Philips XL30 ESEM-FEG, FEI, Hillsboro, Oregon,
USA). To image the failed specimens no sputter coater or any other sample preparations were
done.
Energy Dispersive X-ray Microanalysis System was done using JEOL 7000F Analytical
SEM to quantify the chemical composition. Samples were machined and polished using

79
MetaServ R 250 grinder- polisher from Buehler with sand papers having grit sizes 600, 1200,
2400 and 4000. Then, the samples were polished using the same grinder-polisher with polishing
powder (3.0, 1.0, 0.3 and 0.02 micron de-agglomerated alpha alumina) in four stages with the
help of polishing cloths. At the final stage, the samples were placed in the Syntron vibro-
polisher for 3- 4 hours using 50-70 nm diameter alumina colloidal gel. Samples were mounted on
aluminum stubs of 2.5 cm diameter using superglue before placing in the vibro-polisher. After
polishing the samples were cleaned by hot water in the ultrasonic bath and dried with air. Then,
they were cleaned by IPA (isopropyl alcohol). The polishing was completed in Fredrick Seitz
Material Research Laboratory (FSMRL) at the University of Illinois at Urbana-Champaign.
4.3 RESULTS
4.3.1 Density measurement
For the prediction of theoretical density, we assumed the density of an amorphous carbon
as 1.8-2.1 g/cc and that of 10200 Cu as 8.90 g/cc [ASM handbook]. Theoretical densities were
estimated by using the rule of mixtures as described in equation 4.1. The values for both
experimental and theoretical densities were summarized in Table 4.1.

80
Table 4.1. Measured and theoretically obtained densities of 10200 Cu covetics.
Material Weight % C
Measured Density (g/cc)
Theoretical Density (g/cc)
0 8.89 ± 0.23 8.90
3 8.66 ± 0.31 8.69 – 8.70
5 8.52 ± 0.21 8.55 – 8.56
9 8.19 ± 0.53 8.26 – 8.29
4.3.2 Hardness testing
Vickers and Rockwell hardness values for 10200 Cu covetics were tabulated in Table 4.2.
It was evident from the table that hardness improved for 10200 Cu covetics as carbon was added
Table 4.2. Rockwell and Vickers Hardness of 10200 Cu covetics
Material Weight % C
Rockwell Hardness (HRB)
Vickers Hardness (kgf/mm2)
0 24 ± 1.8 41 ± 2.7
3 46 ± 2.1 70 ± 3.1
5 38 ± 2.4 53 ± 2.8
9 28 ± 1.3 44 ± 1.9

81
to the material. This improvement was observed for both scales for covetics containing 3 wt% C.
More specifically, for the 3 wt% C covetic the Vickers hardness increased by 71% and the
Rockwell hardness increased by 92%. After that as more carbon was added to 10200 Cu,
hardness decreased compared to that of 3 wt% C samples. However, those values were still
higher than the ones obtained for covetic with no carbon i.e. 0 wt% C.
4.3.3 Charpy impact testing
The results from Charpy impact testing on 10200 Cu covetics were tabulated in Table
4.3. It is clear from this table that the maximum load for 10200 Cu covetics was almost constant
as a function of carbon wt% but the maximum energy increased compared to the samples which
Table 4.3. Charpy impact testing results of 10200 Cu covetics
Material Weight % C
Maximum Load (kN)
Maximum Energy (J)
0 6.03 ± 0.80 15.53 ± 1.7
3 7.30 ± 0.12 42.36 ± 2.1
5 6.03 ± 0.42 27.26 ± 1.8
9 6.08 ± 0.31 19.97 ± 0.9
had no carbon. More precisely, the maximum energy increased almost three times for the
samples which had 3 wt% C as compared with the material with 0 wt% C. It also showed
improvement in the energy absorption for the covetic samples with 5 and 9 wt% C. Images
of fracture surfaces of 10200 Cu covetics with 0, 3, 5 and 9 wt% C after Charpy impact testing
are shown in Figure 4.4

82
Figure 4.4. Photographs of Charpy impact fracture surfaces of 10200 Cu covetics.
4.3.4 Tensile testing
The final results of tensile testing of 10200 Cu covetics are presented in Figures 4.5 – 4.8.
Both the UTS and 0.2% YS from tensile testing increased for the covetics with 3 wt% C
compared to those with no carbon. However, both properties had decreasing trends as the carbon
content further increased. The UTS increased by 31% (from 0 to 3 wt% C) from about 170 MPa
to nearly 223 MPa. Similarly, 0.2% YS increased by 33% for the same material. Elastic modulus,
E remained unchanged and the value was about in between 115-117 GPa for all the
0 % C
3 % C
5 % C
9 % C
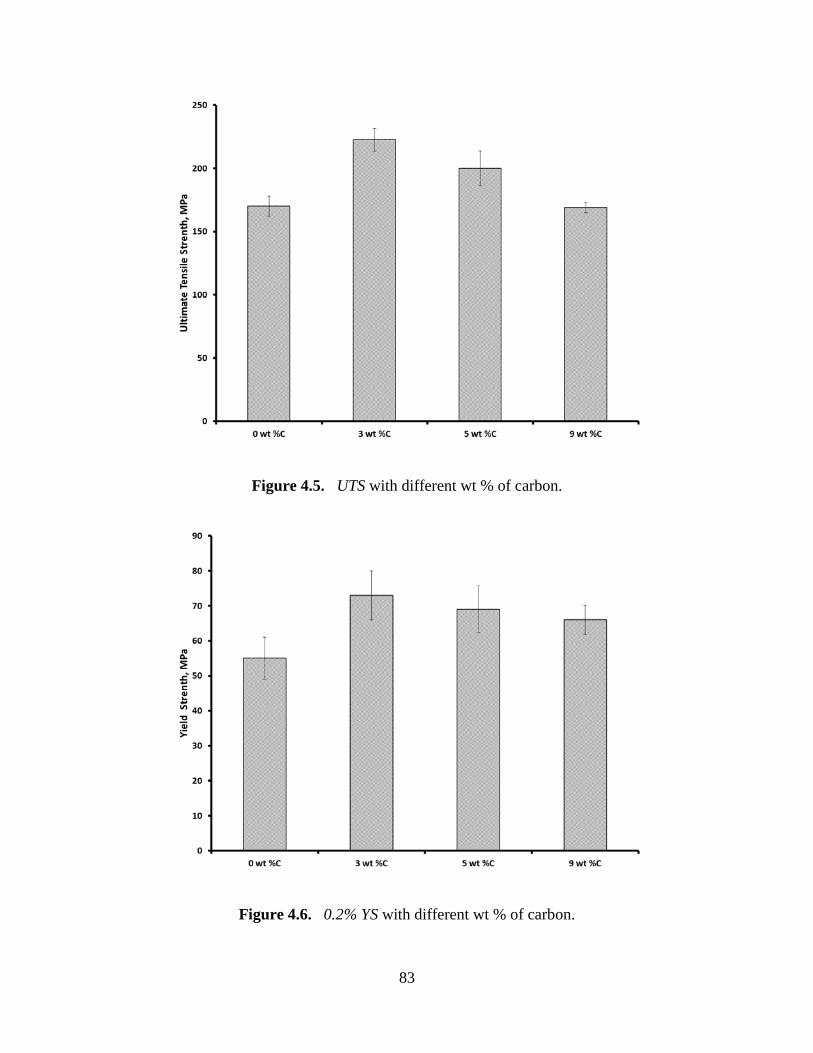
83
Figure 4.5. UTS with different wt % of carbon.
Figure 4.6. 0.2% YS with different wt % of carbon.

84
Figure 4.7. E with different wt % of carbon.
Figure 4.8. Ultimate tensile strain with different wt % of carbon.
covetics. Ultimate tensile strain also increased for 3 wt% C covetics and after that it decreased
with increasing carbon content.

85
4.3.5 X-ray Diffraction (XRD) analysis
Figure 4.9 shows the XRD patterns of 10200 Cu covetics with 0, 3, 5 and 9 wt% C. We
did not observe any carbon peak which if present should be reflected in between 20-30 (2Ɵ) for
carbon (002). Possibly a slight reflection of copper oxide (Cu2O) peak around 36.6 (2Ɵ) was
observed for the covetic samples with carbon which was absent for the one with no carbon.
The average crystallite sizes for covetics were plotted against carbon content in Figure
4.10. From Figure 4.10 it was seen that the crystallite size of copper covetics decreased for 3
Figure 4.9. X-ray diffraction patterns of 10200 Cu covetics for different carbon content.
0 wt% C
3 wt% C
5 wt% C
9 wt% C Cu2O
[111]
[200] [220]

86
wt% C covetics and again the value increased with addition of more carbon. More specifically, it
decreased from 32.05 nm to 28.84 nm for 0 wt% C to 3 wt% C. Figure 4.11 showed the
dependence of the lattice parameter on the carbon content. It is seen in the figure that the 0 and 3
wt% C covetics had the same lattice parameter, about 0.36156 nm. As the carbon content
increased the lattice parameter first decreased (for 5 wt% C) and then increased (for 9 wt% C).
Lattice strain increased (Figure 4.12) for 3 wt% C covetic (from 0.137 % to 0.173 %) and then
decreased with addition of more carbon.
Figure 4.10. Effect of Carbon content on the average crystallite size of 10200 Cu covetics.

87
Figure 4.11. Effect of Carbon content on the lattice parameter of 10200 Cu covetics.
Figure 4.12. Effect of Carbon content on the lattice strain of 10200 Cu covetics.
0 wt% C 3 wt% C 5 wt% C 9 wt% C
0 wt% C 3 wt% C 5 wt% C 9 wt% C

88
4.3.6 Scanning Electron Microscopy (SEM) imaging
Figures 4.13 (a), (b), (c) and (d) show the fracture surfaces after Charpy impact tests of
the 10200 Cu covetics with 0, 3 5 and 9 wt% C, respectively at lower magnification (200x).
From these figures no significant difference in the fracture surfaces as a function of carbon
content was observed. More images of the same samples were taken at higher magnification
(1200x) to further investigate the mode of fracture. The representative fracture surfaces of 10200
Cu covetics with 0, 3 5 and 9 wt% C are shown in Figure 4.14 (a), (b), (c) and (d), respectively.
Figure 4.13. SEM images of the Charpy impact fracture surfaces at 200x of 10200 Cu covetics
(a) 0 wt% C, (b) 0 wt% C, (c) 5 wt% C and (d) 9 wt% C.
(a) 0 wt% C (b) 3 wt% C
(c) 5 wt% C (d) 9 wt% C
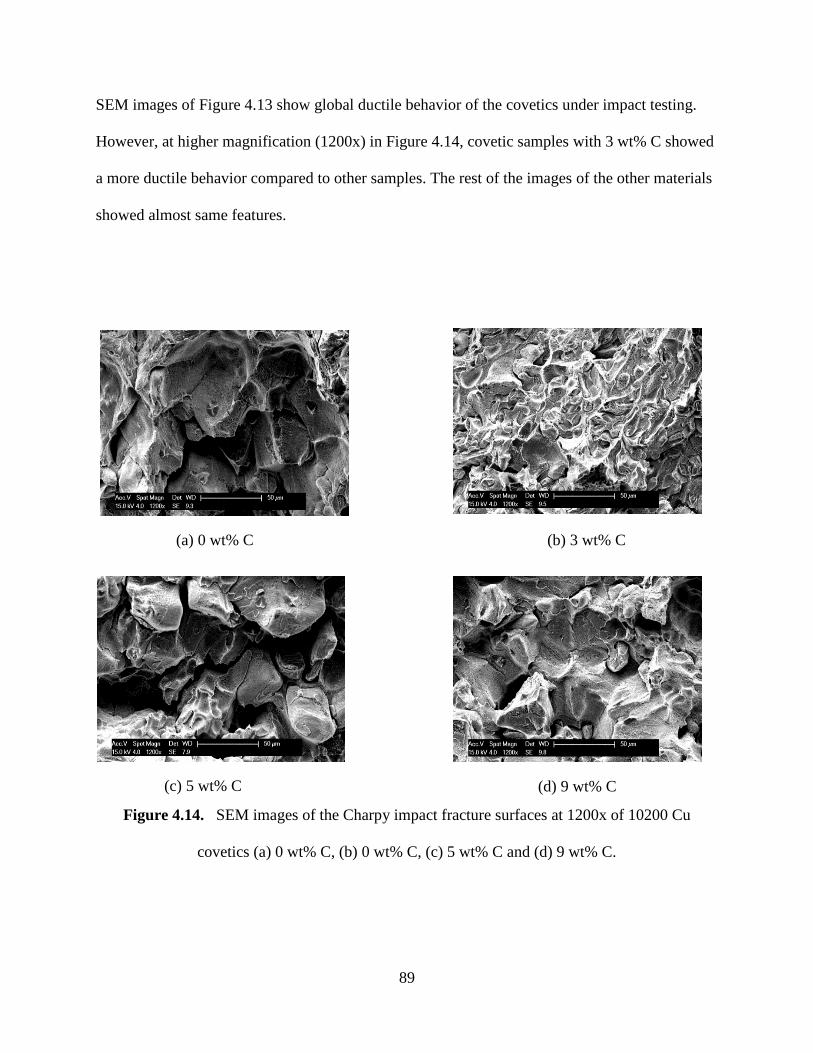
89
SEM images of Figure 4.13 show global ductile behavior of the covetics under impact testing.
However, at higher magnification (1200x) in Figure 4.14, covetic samples with 3 wt% C showed
a more ductile behavior compared to other samples. The rest of the images of the other materials
showed almost same features.
Figure 4.14. SEM images of the Charpy impact fracture surfaces at 1200x of 10200 Cu
covetics (a) 0 wt% C, (b) 0 wt% C, (c) 5 wt% C and (d) 9 wt% C.
(a) 0 wt% C
(b) 3 wt% C
(c) 5 wt% C
(d) 9 wt% C

90
Table 4.4. SEM-EDS analysis of 10200 Cu covetics
Material
Carbon content, wt%
[Area Analysis]
Carbon content, wt%
[Point Analysis]
0 wt% C 0.82 ± 0.245 0.67 ± 0.170
3 wt% C 1.63 ± 0.284 1.36 ± 0.210
5 wt% C 3.30 ± 0.223 3.26 ± 0.182
9 wt% C 6.20 ± 0.215 6.47 ± 0.928
Figure 4.15. Example for area and point analysis on 10200 Cu covetics with 0 wt% C.
Chemical compositions of 10200 Cu covetics were quantified by using Energy Dispersive X-
ray Microanalysis System (EDS). Both area and point analyses were considered to measure the
carbon composition of the covetic materials as shown in Figure 4.15. Box 1 in the figure refers to
1
2

91
the area and 2 to the point analysis. Two different polished samples for each carbon content were
analyzed and the averages of fifteen different areas and points from SEM–EDS analysis were
tabulated in Table 4.4.
4.4 DISCUSSION
4.4.1 Density Measurement
From the data taken from the ASM handbook for measuring theoretical densities, it was
clear that 10200 Cu was almost four times denser than carbon. As a result, the value of density
decreased as the amount of carbon increased as seen in Table 4.1. But the experimental density
decreased more than the theoretical data. It was believed that as the carbon content increased,
porosity in the cast product also increased which attributed to the lower values for the
experimentally measured densities.
4.4.2 Hardness Testing
The covetic materials that we received from TM2 were at as cast T0 condition. For
comparing hardnesses measured by Vickers and Rockwell methods, it was challenging to find
data from literature for the same condition. We received data from MatWeb Materials Property
Data and tabulated the values in Table 4.5 where mechanical properties of various 10200 Cu
alloys at different conditions are listed.

92
Table 4.5. Mechanical properties of 10200 Cu alloy (MatWeb Materials Property Data) [15]
10200 Cu Tensile Strength (MPa)
Elongation (%)
Vickers Hardness (HV)
Annealed 210 40 55 max
Half Hard 245 10 75 – 90
Hard 310 7 90 – 115
Third column of Table 4.5 shows Vickers hardness numbers for heat treated and
hardened 10200 Cu alloys. These values are comparable to the experimentally obtained data of
10200 Cu covetics (Table 4.2).
4.4.3 Charpy impact testing
Our Charpy impact results from Table 4.3 clearly show that the energy absorption
improved for covetics with carbon compared to those materials that had no carbon. We
compared the values acquired after testing with those reported in the MatWeb Materials Property
Data. The Izod impact energy absorption was reported to vary from 34 -61 J depending on the
heat treatment and mechanical work done on the Cu materials. Our materials has absorbed
energy between 15-43 J. Again, we would like to mention that our samples were not heat treated
and no mechanical work was done on those before any test. The improvement was solely
because of the carbon addition using the new covetics processing technique.

93
The values for energy absorption increased for the samples with 3 wt% C and then it
decreased for the 5 wt% C samples and further decreased for the 9 wt% C covetics. The trend of
increasing and then decreasing energy absorption clearly followed that of hardness. Generally,
brittle materials absorb less energy than ductile materials. But in the case of covetics, we
observed the opposite trend.
Figure 4.4 showed the fracture surface of the 10200 Cu covetics with 0, 3, 5 and 9 wt%
C. No notable differences were found by observing the fracture surfaces as all four types of
materials as all of them looked very similar to each other. To further investigate this issue, tensile
testing was conducted and is discussed next.
4.4.4 Tensile Testing
The results obtained from tensile testing (Figures 4.9-4.12) of 10200 Cu covetics were
compared with those tabulated in Table 4.5. Our data indicated that UTS reached the value of
223 MPa for 3 wt% C covetics, which was in between the strengths for annealed and half hard
copper (Table 4.4). Also, percent elongation for the same sample almost matched the annealed
data. The trend of the yield strength data followed the same trend as the hardness and energy
absorption measured by Charpy impact test. For a given material, the impact energy is expected
to decrease if the yield strength increases, i.e. if the material undergoes some process that makes
it more brittle it is less able to undergo plastic deformation such as cold working or precipitation
hardening. However, our results showed the opposite trend i.e. with increase in yield strength the
energy absorption also increased.
Figure 4.16 shows the typical stress-strain curve for 10200 Cu covetics with 0 and 3 wt%
C. It is clear from the figure that both stress and strain are higher for 3 wt% C covetics as

94
compared to the material with no carbon. It is also seen in the photograph of the failed samples
(Figure 4.17) that the covetic with 3 wt% C elongated more than the covetic with 0 wt% C
Figure 4.16. Representative stress-strain curves for 10200 Cu covetics with 0 and 3 wt% C.
without necking. From Figure 4.16, toughness (area under stress-strain curve) was calculated for
each material and the values were 29.25 J/m3 and 68.92 J/m3 for 0 wt % C and 3 wt% C covetics
Strain (mm/mm)
0 wt% C
3 wt% C

95
respectively. Similarly we considered other two materials and the toughness values were 50.37
J/m3 and 31.74 J/m3 for 5 wt % C and 9 wt% C covetics respectively. This proved that the
hardest (3 wt% C) of all 10200 Cu covetic materials received from TM2 was also the toughest.
The results we obtained from Charpy impact testing in Table 4.3 can thus be justified by the
toughness data calculated from tensile testing of covetic materials.
Figure: 4.17. Photographs of failed samples before and after tensile testing of 10200 Cu
covetics with 0 and 3 wt% C.
4.4.5 X-ray Diffraction (XRD) analysis
It was already discussed in the literature [4-7], no carbide phase existed in the Cu-C
phase diagram because of the low solubility of carbon in copper. This was also proved by the
XRD pattern shown in Figure 4.9. If the carbon were present in the form of graphite, a deflection
Before
After (0 wt % C)
After (3 wt % C)

96
between 20-30 (2Ɵ) would be expected. However, the most common phase of Cu-C system, i.e.
copper oxide was seen in the XRD pattern.
The average crystallite sizes of 10200 Cu covetics measured in this study were varied in
between 28.84 to 32.05 nm. The values were in agreement with Liu et.al. [12] and slightly
smaller than those observed by Sazi et al. [16] and Yaman e et al. [17, 18]. Manufacturing
process could be the reason behind the difference in crystallite size. The lattice parameter
indicated for pure copper by Chu et.al. [19] was 0.3611–0.3612 nm. Our experimental results
showed that it reached a maximum value of 0.36156 nm for covetics which was higher than that
of pure copper. This result was in agreement with that previously reported by Yamane at al. [18]
who used ball milling to manufacture the metal samples. On the other hand, Saji et al. [16]
reported for the same system (Cu-C), produced by an attritor type ball mill with speed of 175
rpm, a lattice parameter value of about 0.36153 nm which is in good agreement with our data.
We observed decrease in lattice parameter with addition of more carbon. It could be possible that
the solubility of carbon in copper reached the limit. In addition, the lattice expansion was related
not only to the solution of carbon in copper but also to the strain induced by very small carbon
cluster [10]. Lattice strain increased for 3 wt% C copper covetics. The value was very high
possibly due to the strong plastic deformation exerted and dissolution of carbon in the copper
lattice.
The yield strength of metal could be increased with decrease in crystallite size (known as
Hall–Petch effect). It could be possible due to the pile up of dislocation at the crystal boundaries.
The Hall–Petch effect contributed significantly to the mechanical properties of metals when the
average crystallite size was below 100 nm [20-22]. Our experimental results agreed with the
above statement. Figure 4.6 clearly showed that the yield strength of 10200 Cu covetics

97
increased with addition of carbon and it was highest for 3 wt% C covetics, which had the lowest
crystallite size (28.84 nm) as seen in Figure 4.10.
4.4.6 Scanning Electron Microscopy (SEM) Imaging
The SEM-EDS results obtained by both area and point analysis show the amount of
carbon in each covetic material. It is seen in Table 4.4 that each sample displayed lower amount
of carbon for both analysis than the target wt% carbon by manufacturers. For 0 and 3 wt% C
covetics the area analysis showed slightly higher values than the point analysis data.
Figure 4.18. SEM-EDS analysis of 10200 Cu covetic with 0 wt% C (points 1, 2 and 4 were Cu
rich regions; while point 3 showed copper oxide (Cu2O).
1
2
3
4

98
However, for 5 and 9 wt% C we observed almost same value for both methods. We also noticed
0.6-0.8 wt% C in 0 wt% C covetic sample where no carbon was added in the manufacturing
process. During manufacturing covetics, in the plasma field between the carbon electrodes of the
reactor, carbon mixer and even from the carbon crucible some amount of carbon migrates into
the mix and gets converted. This is the reason for getting some amount of carbon in the 0 wt% C
sample.
Figure 4.19. SEM-EDS analysis of 10200 Cu covetic with 3 wt% C (points 1 and 6 were
copper oxide (Cu2O); points 2,3 and 5 indicated Cu rich area; point 4 showed copper matrix
with more carbon.
1
2
3
4
5
6

99
For further analysis of chemical compositions, detailed SEM-EDS analysis was
conducted on each sample with different carbon content. We already commented that no carbide
form was found in Cu-C phase diagram [4-7]. Our SEM -EDS microanalysis also confirmed that
no carbide phase was present in the 10200 Cu covetics manufactured and supplied by TM2. The
amount of copper in 10200 Cu indicated almost 99.95% [15]. As a result, no other element was
expected to be found in the material. However, the presence of copper oxide (Cu2O) was found
at some points.
Figure 4.20. SEM-EDS analysis of 10200 Cu covetic with 5 wt% C (points 1 and 3 were Cu
rich regions; point 2 showed copper oxide (Cu2O); points 4 and 5 were oxygen rich Cu area.
3
1
2
4 5

100
Figure 4.18 shows SEM micrograph of 10200 Cu covetic with 0 wt% C where points 1,
2 and 4 are Cu rich regions, while point 3 show copper oxide (Cu2O). SEM image of 10200 Cu
covetic with 3 wt% C is shown in Figure 4.19. Points 1 and 6 in the figure are copper oxide
(Cu2O), points 2, 3 and 5 indicate Cu rich area, while point 4 shows copper matrix with more
carbon than the other points. Similarly, Figures 4.20 and 4.21 show SEM micrographs of 10200
Cu covetic with 5 wt% C and 9 wt% C, respectively. Points 1 and 3 of Figure 4.20 are Cu rich
regions, point 2 shows copper oxide (Cu2O), points 4 and 5 indicates oxygen rich Cu matrix.
Figure 4.21. SEM-EDS analysis of 10200 Cu covetic with 9 wt% C (points 1, 3 and 7 indicated
Cu rich regions; points 4, 5 and 8 were oxygen rich Cu matrix; points 2 and 6 showed copper
oxide (Cu2O) and point 9 showed 7.19 wt% C in Cu matrix.
3
1
2
4
5
6
9
8 7

101
Likewise, points 1, 3 and 7 of Figure 4.21 indicate Cu rich regions, points 4, 5 and 8 are oxygen
rich Cu matrix, points 2 and 6 show copper oxide (Cu2O) and in point 9, 7.19 wt% C was found
in Cu matrix. It is seen in Table 4.4 that the amount of carbon detected in SEM–EDS analysis is
less than the target amount of C used during the manufacturing process. Also, no amorphus
carbon or carbon in carbide form were found in the investigation. Since the manufacturer has
been adding powdered carbon into the hot melt, some carbon losses in the hot zone above the
melt is observed, if the powdered carbon feed tube is not positioned way down into the deep
vortex of the mixer. Some of the difference between our analyzed carbon content and target
carbon content can be explained, however they have tried several times to weigh the losses in a
hepa filter above the reactor, and the measured losses were no more than ½%. The other
differences we believe may just be in techniques for finding and estimating the carbon in the
final covetic. It should be mentioned that carbon is difficult to quantify and the methods used
may not give very precise data. However, qualitatively, we do see an increase in the carbon
content as the reported carbon content increases.
4.5 CONCLUSIONS
In this chapter, the structure, chemical composition and mechanical properties of 10200
Cu-C covetic materials were investigated. The results from the mechanical tests indicated that
addition of carbon improved mechanical properties of 10200 Cu covetics. 3 wt% C covetic was
found to be the hardest, strongest as well as toughest of all the Cu covetics tested. After that for 5
and 9 wt% C the mechanical properties declined. Rockwell and Vickers Hardness increased by

102
71% and 92 % for 3 wt% C covetics. Maximum load indicated no change but energy absorption
increased almost three times for the 3wt% C sample. Ultimate tensile strength, UTS (by 31%)
and 0.2% offset yield strength, 0.2% YS increased (by 33%) for 3 wt% C covetics, but Young’s
modulus E remained unchanged for all the materials with different carbon content. SEM-EDS
quantified the amount of carbon and chemical composition of the materials. The information on
the average crystallite sizes, lattice parameters and lattice strains was acquired from XRD
analysis, which explained a possible reason for improvement in mechanical properties.
4.6 REFERENCES
1. Hansen, M., and K. Anderko, Constitution of binary alloys, 2nd ed., McGraw-Hill, 1958.
2. Anderson, J.R., Solubility of Carbon in molten Copper-Manganese and Copper-Nickel Alloys,
Master’s Thesis, Dept. of Metallurgy, Massachusetts Institute of Technology, Cambridge, MA,
1946.
3. Oden, L.L., and N.A. Gokcen, Cu-C and Al-Cu-C phase diagrams and thermodynamic
properties of c in the alloys from 1550 °C to 2300 °C, Metallurgical Transactions B, 1992, 23
(4): p. 453-458.
4. Subramanian, P.R., D.E. Laughlin, In: Subramanian, P.R., D.J. Chakrabarti, and D.E.
Laughlin, editors. Phase diagrams of binary copper alloys. Monograph series on alloy phase
diagrams, vol. 10. Materials Park, OH: ASM International, 1994, p. 109.

103
5. McLellan, R.B., The solubility of carbon in solid gold, copper, and silver, Scripta
Metallurgica, 1969, 3(6): p. 389-391.
6. Mathieu, G., S. Guiot, and J. Cabane, Solubilite du carbone dans l'argent, le cuivre et l'or,
Scripta Metallurgica, 1973, 7(4): p. 421-425.
7. Lopez, G.A., and E.J. Mittemeijer, The solubility of C in solid Cu, Scripta Materialia, 2004,
51(1): p. 1-5.
8. Gerasimov, K.B., S.V. Mytnichenko, and S.V. Pavlov, Microstructure of the products of
mechanical alloying in the cu-cr system, Doklady Physical Chemistry, 1996, 351(1-3): p. 310-
312.
9. Eckert, J., J.C. Holzer, C.E. Krill, and W.L. Johnson, Mechanically driven alloying and grain
size changes in nanocrystalline fe-cu powders, Journal of Applied Physics, 1993, 73(6): p. 2794-
2802.
10. Marques, M.T., J.B. Correia, and O. Conde, Carbon solubility in nanostructured copper,
Scripta Materialia, 2004, 50(7): p. 963-967.
11. Wang, D.B., Y.C. Wu, W.F. Wang, and Y. Zong, Nanocrystalline copper-carbon composite
powders prepared by mechanical alloying, Wuhan Ligong Daxue Xuebao/Journal of Wuhan
University of Technology, 2007, 29(10): p.131-133.
12. Liu, X., Y. Liu, Z. Cao, X. Ran, and X. Guo, Fabrication of cu (c) supersaturated solid
solution by mechanical alloying, Cailiao Rechuli Xuebao/Transactions of Materials and Heat
Treatment, 2006, 27(2): p. 31-33.

104
13. ASTM E23-02, Standard Test Methods for Notched Bar Impact Testing of Metallic
Materials.
14. ASTM E8/E8M – 09, Standard Test Methods for Tension Testing of Metallic Materials.
15.http://www.matweb.com/search/datasheet.aspx?matguid=a629b7c5643b44bfb25b9bba7f8140
ab&ckck=1
16. Saji, S., T. Kadokura, H. Anada, K. Notoya, and N. Takano, Solid solubility of carbon in
copper during mechanical alloying, Materials Transactions, 1998, 39(7): p. 778–781.
17. Yamane, T., H. Okubo, K. Hisayuki, N. Oki, M. Konishi, M. Komatsu, M. Kiritani, Y.
Minamino, Y. Koizumi, and S.J. Kim, Solid solubility of carbon in a mechanically alloyed Cu-
29.7 At. Pct Zn alloy, Metallurgical and Materials Transactions A, 2001, 32(7): p. 1861-1862.
18. Yamane, T., H. Okubo, K. Hisayuki, N. Oki, M. Konishi, M. Komatsu, , M. Kiritani, Y.
Minamino, Y. Koizumi, and S.J. Kim, Solid solubility of carbon in copper mechanically alloyed,
Journal of Materials Science Letters, 2001, 20(3): p. 259-260.
19. Chu, J.P., C.H. Chung, P.Y. Lee, J.M. Rigsbee, and J.Y. Wang. Microstructure and
properties of Cu-C pseudoalloy films prepared by sputter deposition, Metallurgical and Materials
Transactions A, 1998, 29(2): p. 647-658.
20. Bakshi, S.R., A.K. Keshri, and A. Agarwal, A comparison of mechanical and wear
properties of plasma sprayed carbon nanotube reinforced aluminum composites at nano and
macro scale, Materials Science and Engineering A, 2011, 528(9): p. 3375–3384.
21. Khan, A.S., B. Farrokh, and L. Takacs, Effect of grain refinement on mechanical properties
of ball-milled bulk aluminum, Materials Science and Engineering A, 2008, 489(1-2): p. 77–84.

105
22. Choi, H.J., S.W. Lee, J.S. Park, and D.H. Bae, Tensile behavior of bulk nanocrystalline
aluminum synthesized by hot extrusion of ball-milled powders, Scripta Materialia, 2008, 59(10):
p. 1123–1126.

106
CHAPTER 5: CHARACTERIZATION OF AS CAST 6061 AL COVETICS
5.1 INTRODUCTION
Aluminum alloys are widely used for high-strength and light weight structures in
aerospace and automotive applications. Aluminum-magnesium-silicon (Al-Mg-Si) denoted as
6xxx series alloys are medium strength heat treatable alloys that have good formability [1, 2]. An
important characteristic of one example of such materials, the 6061 Al, is its good weldability.
Because of these favorable properties, the 6061 alloy is used in the transport [3-5], public works
(framework, pylon, handling equipment, etc.) and also for complex structures assembled by
welding [6–8]. The study presented in this chapter addresses this widely used 6061 Al alloy. It is
an age hardenable alloy, with its mechanical properties being mainly controlled by the hardening
precipitates contained in the material. When this alloy is subjected to a solution heat treatment
followed by quenching and tempering, its mechanical properties reach their highest level and
become very good compared to other aluminum alloys. Different ceramic particles such as
carbides, nitrides, oxides, etc. [9-11], carbon nanotubes (CNTs) [12-21] and carbon nanofibers
(CNFs) [22-26] have been used as reinforcements for these materials. Carbon fillers in the form
of graphite, graphene, CNTs and CNFs are widely used because of their high elastic moduli, high
mechanical strengths, and outstanding electrical conductivities, which can improve mechanical
and physical properties. However, graphite dispersion in aluminum alloys has not been
investigated broadly even though graphite acts as an excellent lubricating agent under conditions
of friction. Lately, Third Millennium Materials (TM2) invented a covetic manufacturing process
where activated carbon powders are added to the molten metal or metal alloys. Materials

107
manufactured by covetic process show improved properties compared to the base metal or metal
alloy. Therefore, systematic studies on the structural characteristics and properties of these
materials manufactured by this newly invented covetic process are needed before these materials
can be used for engineering applications.
In this chapter, effect of addition of carbon to 6061 Al alloy by covetic process on the
mechanical and structural properties was investigated. Control samples of 6061 Al alloy covetics
(0 wt% C) were also examined for comparison purposes. Impact testing and hardnesses at micro
and mesoscale were carried out to obtain mechanical properties of these covetic materials.
Scanning electron microscopy (SEM) studies were conducted along with energy dispersive
spectroscopy (EDS) to comprehend the structure, composition and failure modes. X-ray
Diffraction (XRD) was done to obtain information on the average crystalline size of these
materials. The experimentally obtained data was compared to those found in literature for a 6061
Al alloy.
5.2 MATERIALS AND METHODS
5.2.1 Materials
We received 6061 Al covetics with 0 and 2.3 weight percent (wt %) of carbon from Third
Millennium Materials (TM2). The materials were originally made by covetic process in the Ajax
furnace in Warren, and cast into 3” diameter cylinders. These were machined to fit an extruder
at AFRL (2.95” diameter with a tapered nose). The covetics were extruded into ½” rods at 450
ºC billet temperature, under pressure on a Lombard extruder operated by UES for AFRL.
Sections of the extruded rod of 1/2” x 1” pieces were cut, and with the help of an injection caster

108
the covetics were remelted, and cast into the 0.75” x 0.75” bars. No heat treatment was done on
these materials. Hence, these materials were received in as cast T0 condition. Material with no
carbon (0 wt % C) made by covetic process was used as control for comparison purposes. One
bar of 0.75” x 0.75” x 6” dimensions was received for each carbon content.
5.2.2 Density measurement
Experimental densities were predicted by measuring weight and volume of 6061 Al
covetic samples with the two carbon contents. Volume was the average of results obtained using
two methods. One was measured directly (from the geometry of the object) and the other by the
displacement of fluid, i.e. Archimedes’ method. The weight was measured with a scale. Seven
samples of 10 × 10 × 3 mm3 sizes for each carbon content were used to measure the density of
these materials. The samples were grounded to have smooth and parallel edges prior to
measurements. Sample dimensions were measured at three different locations and the values
were averaged. Theoretical densities for the samples were also predicted by applying a rule of
mixtures as shown in equation 5.1.
ρ = ρc fc + ρal fal (5.1)
where ρ and f represents density and volume fraction, respectively, and superscripts c and al
denote carbon and 6061 Al alloy, respectively.
5.2.3 Hardness testing
We measured hardness of the 6061 Al covetics by using Vickers and Rockwell hardness
tests. Samples were cut and sectioned into small pieces in the machine shop at the Mechanical
Science and Engineering Department at the University of Illinois at Urbana-Champaign. Both
109
longitudinal and transverse samples were prepared for hardness testing as shown in Figure 4.1.
Specimens were then polished using MetaServ R 250 grinder - polisher from Buehler with sand
papers having grit sizes 600, 1200, 2400 and 4000. For smoother surface, the samples were
further polished using the same grinder-polisher with polishing powder (3.0, 1.0, 0.3 and 0.02
micron de-agglomerated alpha alumina) in four stages with the help of polishing cloths at the
Fredrick Seitz Material Research Laboratory at the University of Illinois at Urbana-Champaign.
Rockwell hardness (HRB) was measured on both the longitudinal and transverse surfaces
of the specimens in a Wilson/ Rockwell Hardness Tester by Instron, Grove City, PA, USA.
Vickers micro hardness (VHN) was also measured on both surfaces of the same specimens by
applying a load of 3000 grams for 15 seconds. A Shimadzu microhardness tester HMV-M3,
Newage Testing Instruments, Inc., Feasterville, PA, USA was used for this investigation. The
reported hardness value was the average of the total of ten measurements made on the two
orthogonal surfaces (longitudinal and transverse) of each specimen.
5.2.4 Charpy impact testing
The Charpy test measures the energy absorbed by a standard notched specimen while
breaking under an impact load. All specimens subjected to Charpy impact test were conducted
on a 8250 Dynatup Impact Test Machine. For each carbon content at least four specimens were
tested. Specimens were machined according to the ASTM E23 02 standard [27] as shown in
Figure 4.2. Then, the average value of the test results was taken as the material property. A
weighted crosshead was released and was slid on guide bars. A steel flag on the carriage passed
through the velocity detector block. The tup (instrumented load cell) attached to the crosshead

110
contacted the specimen. The velocity and load data were recorded and used to calculate the
impact energy.
5.2.5 Scanning Electron Microscopy (SEM) Imaging
Scanning electron microscopy images of the samples after impact tests were taken by
using a Field-Emission Environmental Scanning Electron Microscope (ESEM-FEG) with
Energy-Dispersive Spectroscopy (EDS) (Philips XL30 ESEM-FEG, FEI, Hillsboro, Oregon,
USA). No coating or any other sample preparations were done to image failed specimens.
Energy Dispersive X-ray Microanalysis System was employed by using the JEOL 7000F
Analytical SEM to quantify the chemical composition of covetic samples. The samples were
machined and polished using MetaServ R 250 grinder - polisher from Buehler with sand papers
having grit sizes 600, 1200, 2400 and 4000. Then, the samples were polished using the same
grinder-polisher with polishing powder (3.0, 1.0, 0.3 and 0.02 micron de-agglomerated alpha
alumina) in four stages with the help of polishing cloths. At the final stage, the samples were
placed in the Syntron vibro-polisher for 3- 4 hours using 50-70 nm diameter alumina colloidal
gel. Samples were mounted on aluminum stubs of 2.5 cm diameter using superglue before
placing them in a vibro-polisher. After polishing, the samples were cleaned by hot water in the
ultrasonic bath and dried with air. At last, the samples were cleaned by IPA (isopropyl alcohol).
These polishing steps were completed in the Fredrick Seitz Material Research Laboratory at the
University of Illinois at Urbana-Champaign.
5.2.6 XRD Analysis
The powder XRD data were collected on a Bruker D8 Venture equipped with a four-
circle kappa diffractometer and Photon 100 detector. An Iμs microfocus Cu source supplied the

111
multi-mirror monochromated incident beam. The sample was dispersed in a minimum amount
of paratone oil and loaded onto a 0.3mm loop and exposed for 180 seconds for each of several
frames. The frames were merged and integrated from 5 to 100 degrees 2θ. The final spectrum
data was normalized to facilitate pattern matching and a Chebyshev polynomial was used to
correct the baseline.
5.3 RESULTS
5.3.1 Density measurement
Theoretical densities were predicted by using the rule of mixtures as summarized in
equation 5.1. To calculate density, we assumed the density of an amorphous carbon as 1.8-2.1
g/cc and the density of 6061 Al as 2.70 g/cc (ASM Handbook). As shown in Table 5.1, the
measured densities were same for both the materials and the value was 2.75 g/cc.
Table 5.1. Measured and theoretically obtained densities of 6061 Al covetics
Material Measured Density (g/cc)
Theoretical Density (g/cc)
0 wt% C 2.75 ± 0.27 2.70
2.3 wt% C 2.75 ± 0.18 2.68 - 2.69

112
5.3.2 Hardness testing
Both Rockwell and Vickers hardness values for 6061 Al covetics are tabulated in Table
5.2. It is seen from the table that the hardness increased with the addition of carbon in the
6061 Al alloy. Rockwell and Vickers hardness increased by 10% and 51%, respectively, over
control sample for the 2.3 wt% C in 6061 Al covetics.
5.3.3 Charpy impact testing
The experimental results of Charpy impact test on 6061 Al covetics (0 and 2.3 wt% C)
are summarized in Table 5.3. It is seen from Table 5.3 that the maximum load for the 6061 Al
covetics did not change but the maximum energy increased almost four times when compared to
the control sample which had no carbon.
Table 5.2. Rockwell and Vickers Hardness of 6061 Al covetics
Material Rockwell Hardness (HRB)
Vickers Hardness (kgf/mm2)
0 wt% C 38 ± 2.1 43 ± 3.2
2.3 wt% C 42 ± 1.8 65 ± 5.1
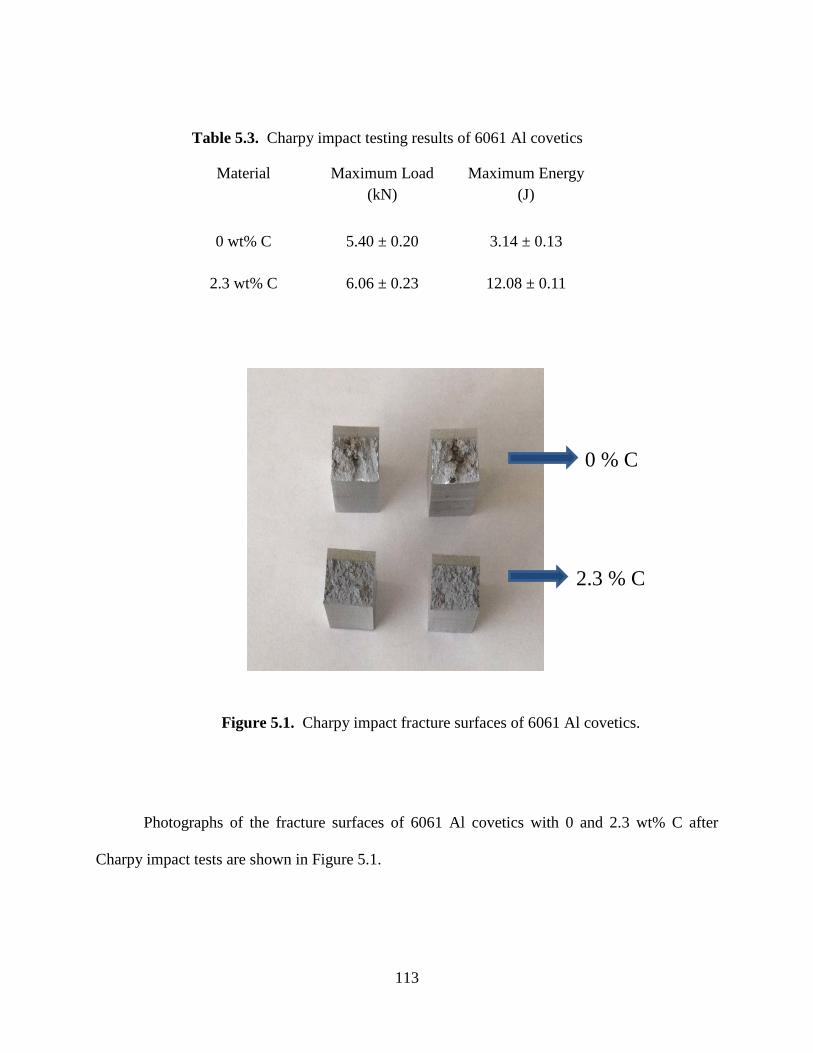
113
Figure 5.1. Charpy impact fracture surfaces of 6061 Al covetics.
Photographs of the fracture surfaces of 6061 Al covetics with 0 and 2.3 wt% C after
Charpy impact tests are shown in Figure 5.1.
Table 5.3. Charpy impact testing results of 6061 Al covetics
Material Maximum Load (kN)
Maximum Energy (J)
0 wt% C 5.40 ± 0.20 3.14 ± 0.13
2.3 wt% C 6.06 ± 0.23 12.08 ± 0.11
0 % C
2.3 % C

114
5.3.4 Scanning Electron Microscopy (SEM) Imaging
The Charpy impact fracture surfaces of 6061 Al covetics were imaged by the SEM and
are shown in Figure 5.2. Figures 5.2 A, C show fracture surfaces of 6061 Al covetics with 0 wt%
A
B
C
D
Figure 5.2. SEM micrographs of Charpy impact fracture surfaces of 6061 Al covetics A) 0
wt% C at 100x, B) 2.3 wt% C at 100x, C) 0 wt% C at 800x, and D) 2.3 wt% C at 800x.

115
C at 100x and 800x, respectively. Similarly, Figures 5.2 B and D show the fracture surfaces of
6061 Al covetics with 2.3 wt% C at 100x and 800x, respectively.Energy Dispersive X-ray
Microanalysis System (EDS) was used to quantify the chemical composition of 6061 Al
covetics. We performed both area and point analyses to obtain the carbon content of the covetic
materials as shown in Figure 5.3.
Figure 5.3. Example of area and point analysis on 6061 Al covetics.
Box 1 in the figure indicates the area and 2 is the point. We used two different polished
samples for each carbon content and acquired information on fifteen different areas and points
and the average of the obtained data from the SEM-EDS analysis is summarized in Table 5.4.

116
Table 5.4 Carbon content of 6061 Al covetics by EDS
Material Carbon content, wt%
[Area Analysis]
Carbon content, wt%
[Point Analysis]
0 wt% C 0.60 ± 0.203 0.40 ± 0.120
2.3 wt% C 1.9 ± 0.520 1.3 ± 0.578
5.3.5 X-ray Diffraction (XRD) analysis
Results on the 6061 Al covetics crystalline size, lattice parameter and lattice strain of the
materials with two differetn carbon contents, obtained from XRD measurements, are shown in
Figures 5.4-5.6. The covetic crystalline size decreased with the addition of carbon and changed
from 33 nm to 29.5 nm in the 2.3 wt% C covetic (Figure 5.4). The changes in the lattice
parameter values calculated from the shifts in peak position in the XRD patterns are illustrated in
Figure 5.5. The lattice parameter found for the control sample was 0.40474 nm. It increased with
the addition of carbon and reached 0.405081 nm. Figure 5.6 shows the variation of lattice strain
with the carbon content. Lattice strain increased with the increasing carbon content.

117
Figure 5.4. Effect of carbon addition on the average crystallite size of 6061 Al covetics.
Figure 5.5. Effect of carbon addition on the lattice parameter of 6061 Al covetics.
0 wt% C 2.3 wt% C

118
Figure 5.6. Effect of carbon addition on the lattice strain of 6061 Al covetics.
5.4 DISCUSSION
5.4.1 Density measurement
Experimentally obtained density for the 6061 Al covetic was slightly larger than the
density found in literature for a 6061 Al alloy. The data was taken from the ASM handbook to
predict the theoretical density. Also, the experimentally obtained density was the same for the
covetics with two different carbon contents. This was due to the fact that the covetics were
manufactured with a small amount of carbon (2.3 wt% C) and the density of carbon is fairly
similar to that of the 6061 Al. This could be the reason behind no change in measured densities.
Theoretically predicted densities changed marginally due to the low amount of carbon which is
slightly lighter than the elemental aluminum.
0 wt% C 2.3 wt% C

119
5.4.2 Hardness testing
Hardness values measured by both Rockwell and Vickers testers showed improvement
with the carbon addition to the alloy. The experimentally acquired data was compared to that
found in literature. In the Aluminum Association’s Engineering Data for Aluminum Structures
Rockwell and Vickers hardness for 6061-T6 Al were reported as 60 HRB and 107 kgf/mm2.
Vickers hardness for 6061-T4 Al was reported as 75 kgf/mm2 but Rockwell data for the same
material was not found. The above mentioned values are higher than what we measured
experimentally for the 6061 Al covetics. It is to be noted that these materials were heat treated
and our covetics were not. We could not find hardness data for the 6061 Al with no heat
treatment, i.e. T0 condition. In Chapter 3, it was shown that hardness increased with the
increasing carbon content. For the 6061 covetic, we only received the material with 2.3 wt% C.
Materials with higher carbon content might show further improvements in hardness values for
covetics even with no heat treatment.
5.4.3 Charpy impact testing
Typically, tough materials absorb a lot of energy, while brittle materials tend to absorb
very little energy prior to fracture. Our Charpy impact test results contradicted the above
statement as we observed higher hardness values for 2.3 wt% C covetics in both scales -
Rockwell and Vickers - shown in Table 5.2. Figure 5.1 showed a ductile fracture surface of the
control covetic which had no carbon and the one with 2.3 wt% C showed a shiny brittle fracture
surface which validated our hardness results. This was discussed in Chapter 4 where we showed
that toughness (area under stress-strain curve obtained from tensile testing) increased as the
hardness of the 10200 Cu covetics increased with the addition of carbon. However, because of

120
shortage of materials we were not able to conduct tensile tests on the 6061 Al covetics to
measure tensile strength and toughness. Therefore, we could not further investigate the relations
between hardness, strength and toughness for the 6061 Al covetics as we did in Chapter 4 for the
10200 Cu covetics.
We compared our Charpy impact test results with the data for commercially available
6061 –T4 Al alloy. This data was collected in the Materials Testing Instructional Laboratory
(MTIL) of University of Illinois at Urbana- Champaign. Under the same testing conditions and
specimen dimensions, 6061–T4 Al showed better properties than our covetics (9.46 kN
maximum load and 26.63 J maximum energy). Again, we would like to conclude that our data is
based on only one material that we received from TM2 (with 2.3 wt% C). 6061 Al covetics with
higher wt% C might show same or even better energy absorption characteristics than the heat
treated sample.
5.4.4 Scanning Electron Microscopy (SEM) Imaging
We observed rough ductile surface in the photographs of fracture surfaces in Figure 5.1.
The same trend was seen earlier in the SEM micrographs of the covetic samples. Figures 5.2 A,
C showed fracture surfaces of 0 wt% C and while in B, D 2.3 wt% C samples were illustrated at
100x and 800x, respectively. Figures 5.2 A and C looked more rough while B and D revealed
comparatively the more brittle failure surface appearance.
Table 5.4 showed that the amount of carbon in each sample was lower than the target
wt% carbon reported by manufacturers. It was also seen that the area analysis showed more
carbon than the point analysis which was expected as the area might contain some phases of
carbon along with the amount of carbon integrated in the matrix. Note that the control sample

121
(manufactured with no added carbon) also showed some amount of carbon. The amount of
carbon in the 0 wt% covetic is the result of contamination due to the carbon electrodes of the
reactor, carbon mixer and the carbon crucible during manufacturing process.
Figure 5.7. SEM-EDS analysis of 6061 Al covetic with 0 wt% C.
Figures 5.7 and 5.8 showed detailed SEM-EDS microanalysis of 6061 Al covetics.
Quantitative element measurements were done on covetic samples to acquire information on the
phases present in covetics. Two random points were examined on 6061 Al covetic with 0 wt% C

122
(Figure 5.7). Small amount of carbon was found in the aluminum matrix. Figure 5.8 showed
Aluminum Carbide (Al4C3) at point 1, Al rich matrix at points 2, 3 and 4 and Fe3SiAl2 particles
at point 5 and Mg2Si particles at point 2. According to the ASM Handbook, these phases are
expected to be present in 6061 Al alloy along with carbon.
Figure 5.8. SEM-EDS analysis of 6061 Al covetic with 2.3 wt% C.
5.4.5 X-ray Diffraction (XRD) analysis
Grain-boundary strengthening is one of the methods of strengthening materials by
changing their average crystallite (grain) size. It is based on the observation that grain boundaries

123
impede a dislocation movement and that the number of dislocations within a grain has an effect
on how easily dislocations can traverse grain boundaries and travel from grain to grain.
Therefore, by changing the grain size dislocation movement the yield strength can be influenced.
According to the Hall–Petch effect, metals show an increase in strength with decreasing grain
size due to the pile up of dislocations at the crystal boundaries (discussed in Chapters 3 and 4). It
was observed from the results obtained by XRD analysis that average crystalline size decreased
and both the lattice parameter and the lattice strain increased with the addition of carbon. This
could be the explanation for observing higher hardness values for covetics with higher carbon
content. The addition of carbon decreased the average crystallite size which could have
contributed to the higher hardness for the 2.3 wt% C covetic material.
5.5 CONCLUSIONS
In this study, we conducted a systematic study on the 6061 Al covetics to address the
carbon addition related changes in all three aspects: the structure, composition and mechanical
properties. The results from the experiments of the 6061 Al covetics demonstrated that the
mechanical properties, structure and composition changed with the addition of carbon in the
6061 Al manufactured by covetic process. Energy absorption increased almost four times in the
materials with incorporated carbon. Rockwell and Vickers hardness increased by 10% and 51%
respectively with the increase in the carbon content. Photographs of the failed specimens and
SEM micrographs illustrated a ductile to brittle-like change on failure surface due to the added
carbon. SEM-EDS quantified the amount of carbon and the phases present in the studied

124
materials. The reasons for the improved mechanical properties could be explained by the XRD
analysis.
5.6 REFERENCES
1. Murtha, S.J., New 6xxx aluminum alloy for automotive body sheet applications [J], SAE
International Journal of Materials Manufacturing, 1995, 104: p. 657 − 666.
2. Mansourinejad, M., and B. Mirzakhani, Influence of sequence of cold working and aging
treatment on mechanical behaviour of 6061 aluminum alloy, Transactions of Nonferrous Metals
Society of China, 2012, 22: p. 2072 – 2079.
3. Zhang, Z.H., X.Q. Yang, J.L. Zhang, G. Zhou, X.D. Xu, and B.L. Zou, Effect of welding
parameters on microstructure and mechanical properties of friction stir spot welded 5052
aluminum alloy. Materials and Design, 2011, 32(8–9): p. 4461–4470.
4. Uematsu, Y., K. Tokaji, Y. Tozaki, T. Kurita, and S. Murata, Effect of re-filling probe hole on
tensile failure and fatigue behavior of friction stir spot welded joints in Al–Mg–Si alloy,
International Journal of Fracture, 2008, 30: p. 1956–1966.
5. Uematsu, Y. and K. Tokaji, Comparison of fatigue behaviour between resistance spot and
friction stir spot welded aluminium alloy sheets, Science and Technology of Welding and
Joining, 2009, 14: p. 62–71.
6. International Aluminium Institute, Primary Aluminium Production, http://www.world-
aluminium.org, 22/09/08, 2008.

125
7. Voisin, P., Métallurgie extractive de l’aluminium. Techniques de l’ingénieur. Matériaux
métalliques, 1992, M 2340.
8. http://aluminium.matter.org.uk, 2010.
9. Suryanarayana, C., Bibliography on Mechanical Alloying and Milling, Cambridge
International Science Publishing, Cambridge, UK, 1995.
10. Gibson, P.R., A.J. Clegg, and A.A. Das, Wear of Cast Al-Si Alloys Containing Squeeze Cast
Graphitic Al-Si Alloys, Materials Science Technology, 1985, 1: p. 559–567.
11. Pai, B.C., P.K. Rohatgi, and S. Venkatesh, Scanning electron microscopy studies of wear in
LM13 and LM13-graphite particulate composite, Wear, 1982, 76: p. 211–220.
12. Iijima, S., Helical microtubules of graphitic carbon, Nature, 1991, 354: p. 56–58.
13. Xie, S.S., W.Z. Li, Z.W. Pan, B.H. Chang, and L.F. Sun, Mechanical and physical properties
on carbon nanotube, Journal of Physics and Chemistry of Solids, 2000, 61: p. 1153–1158.
14. Yao, Z., C.C. Zhu, M. Cheng, and J. Liu, Mechanical Properties of Carbon Nanotube by
Molecular Dynamics Simulation, Computational Materials Science, 2001, 22(3): p. 180-184.
15. Wu, Y., X. Zhang, A.Y.T. Leung, and W. Zhong, A structural mechanics approach for the
analysis of carbon nanotubes, International Journal of Solids and Structures, 2003, 40(10): p.
2487–2499.
16. Lau, A.K., and D. Hui, The revolutionary creation of new advanced materials-carbon
nanotubes composites, Composites Part B, 2002, 33(4): p. 263–277.

126
17. Ru, C.Q., Effective bending stiffness of carbon nanotubes, Physical Review B, 2000, 62(15):
p. 9973–9976.
18. Treacy, M.M.J., T.W. Ebbesen, and J.M. Gibson, Exceptionally high Young's modulus
observed for individual carbon nanotubes, Nature, 1996, 381: p. 678–680.
19. Yao, N., and V. Lordi, Young’s modulus of single-walled carbon nanotubes, Journal of
Applied Physics, 1998, 84(3): p. 1939–1943.
20. Wong, E.W., P.E. Sheehan, and C.M. Lieber, Nanobeam Mechanics: Elasticity, Strength and
Toughness of Nanorods and Nanotubes, Science, 1997, 277: p. 1971–1975.
21. Yu, M.F., O. Lourie, M.J. Dyer, K. Moloni, T.F. Kelly, and R. S. Ruoff, Strength and
Breaking Mechanism of Multiwalled Carbon Nanotubes Under Tensile Load, Science, 2000,
287: p. 637–640.
22. Garcia, E.J., A.J. Hart, B.L. Wardle, and A.H. Slocum, Fabrication and nanocompression
testing of aligned CNT/polymer nanocomposites, Advanced Materials, 2007, 19: p. 2151–2156.
23. Coleman, J.N., U. Khan, W.J. Blau, and Y. K. Gun’ko, Small but strong: A review of the
mechanical properties of carbon nanotube–polymer composites, Carbon, 2006, 44(9): p. 1624–
1652.
24. Silvain, J.F., C. Vincent, J.M. Heintz, and N. Chandra, Novel processing and
characterization of Cu/CNF nanocomposite for high thermal conductivity applications,
Composite Science and Technology, 2009, 69(14) p. 2474–2484.
25. Ullbrand, J.M., J.M. Cordoba, J. Tamayo-Ariztondo, M.R. Elizalde, M. Nygren, J.M.
Molina-Aldareguia, and M. Oden, Thermomechanical properties of copper–carbon nanofibre

127
composites prepared by spark plasma sintering and hot pressing, Composite Science and
Technology, 2010, 70(16): p. 2263–2268.
26. Kwon, H., H. Kurita, M. Leparoux, and A. Kawasaki, Carbon Nanofiber Reinforced
Aluminum Matrix Composite Fabricated by Combined Process of Spark Plasma Sintering and
Hot Extrusion, Journal of Nanoscience Nanotechnology, 2011, 11(4): p. 4119–4126.
27. ASTM E23-02, Standard Test Methods for Notched Bar Impact Testing of Metallic
Materials.

128
CHAPTER 6: CONCLUSIONS, LIMITATIONS AND RECOMMENDATIONS
This dissertation focused on the characterization of the three types of covetic materials:
rolled 7075 Al with 0, 3, and 5 wt% C, as cast 10200 Cu with 0, 3, 5, and 9 wt% C, and 6061 Al
with 0 and 2.3 wt% C, all made using a covetic process. In order to characterize the structure,
chemical composition and properties of these materials several experimental techniques (XRD,
SEM, XPS, and mechanical tests) were employed. Our experimental results demonstrated how
the changes in the carbon content influenced the structure and mechanical properties of covetic
materials. The following points summarize the obtained results:
1. XRD results indicated that the lattice constant increased while the average crystallite
size decreased with the addition of carbon in Al and Cu alloys made by covetic
process.
2. Quantification of the amount of carbon present in these materials was carried out by
SEM-EDS and XPS studies. Measured carbon content values were smaller by
approximately a factor of two than the amounts used during a covetics manufacturing
process.
3. Mechanical tests showed an increase in mechanical properties (0.2% yield strength
and ultimate tensile strength) of aluminum-based covetics with the addition of carbon
in these materials. Elastic modulus showed no change.
4. 10200 Cu covetics showed an increase in the mechanical properties with the addition
of carbon. Best results were obtained for 3 wt% C while higher carbon contents
resulted in decreasing mechanical properties.

129
These conclusions are based on a limited number of samples (supplied by TM2)
manufactured using the covetic process and specific post-processing methods. They apply to the
covetic materials studied in this dissertation, but not necessarily the whole class of covetic
materials. This study is just an initial investigation of these very interesting and complex
materials.
As for the future recommendations, in addition to the techniques used, many additional
characterization techniques could be employed to further analyze these materials. In particular, a
more comprehensive study is needed to understand the effects of processing on the structure and
properties of these materials. Additional recommendations are as follows:
1. Several techniques used here could be further explored. For instance, image processing
software could be used to process SEM images to obtain quantitative information such
as the porosity and carbon content.
2. Mechanical tests could be conducted at different strain rates and temperatures.
3. Comprehensive study could be done on how various processing and post processing
variables influence properties of covetics.
4. Additional techniques such as TEM could be used to study dislocation-based
deformation mechanisms in covetics.
5. Electron backscatter diffraction (EBSD) and SEM of etched polished samples could
help to increase knowledge of the grain size, crystal orientations, and texture.
6. Aluminum-based covetics with higher carbon contents could be studied to determine
the optimum carbon content for the enhancement of mechanical properties.
7. Results reported in this study apply to covetics with no heat treatment. Other post
processing methods involving heat treatments could produce new results.

130
8. Further investigation is needed to determine the exact nature of the form of carbon and
the interaction of carbon with metals resulting from the covetic manufacturing process.
9. Electrical and thermal conductivities of covetics could be measured.
10. Corrosion resistance could also be investigated.
11. Studies on formability and welding could be done.
12. Finally, computational and analytical methods could be used to simulate the behavior
of these materials and obtain predictive models.
In summary, these reported results are only the beginning and we hope that they will
stimulate further investigations of these very interesting materials.