© 2015 ihs presentation ihs.com ihs crude oil markets: outlook to 2020 oil market services aaron...
TRANSCRIPT
© 2015 IHS
Presentation
ihs.com
IHS
Crude oil markets: outlook to 2020
Oil Market Services
Aaron Brady, Senior Director, [email protected]
James Fallon, Senior Director, [email protected]
21 April 2015
ENERGY

© 2015 IHS 2
Base case outlook: Two oil price phases to 2020
Two price phases to 2020
© 2015 IHS: 50104-3Source: IHS
PHASE ONE: 2015–2016 PHASE TWO: 2017–2020
Supply surplus—Oil prices under pressure
Weaker supply gains—Demand growth pushes prices up
© 2015 IHS 3
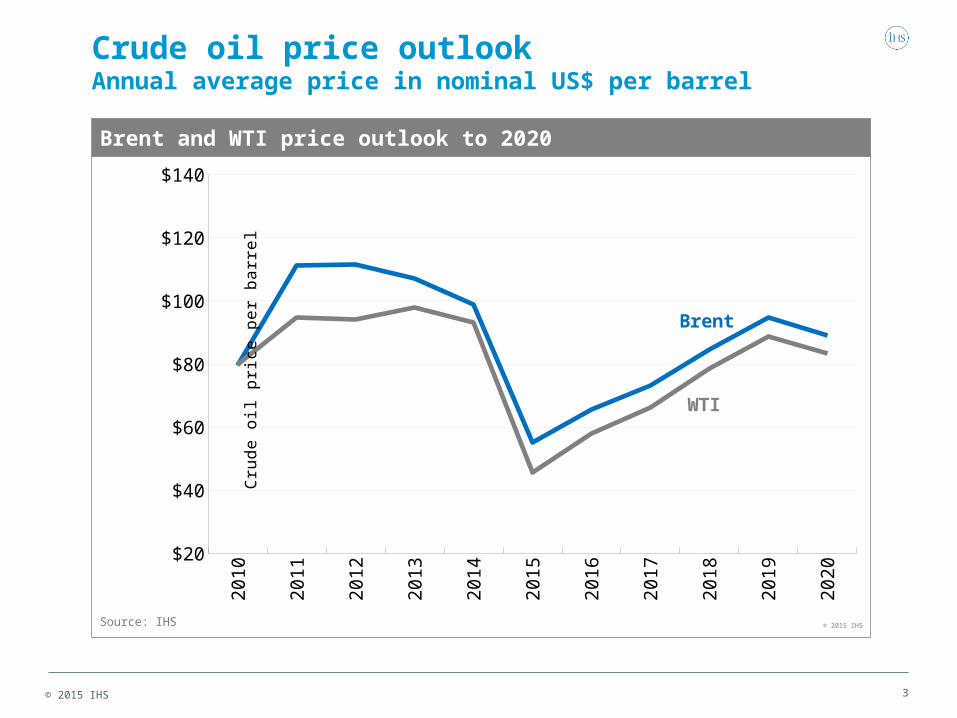
Crude oil price outlookAnnual average price in nominal US$ per barrel
20
10
20
11
20
12
20
13
20
14
20
15
20
16
20
17
20
18
20
19
20
20$20
$40
$60
$80
$100
$120
$140
Brent and WTI price outlook to 2020
Source: IHS © 2015 IHS
Cru
de
oil
pri
ce p
er
ba
rre
l
Brent
WTI

© 2015 IHS
Geopolitical factors kept ~3 MMb/d oil off the market which held off price declines – until mid 2015
4
• Through mid-2015, oil off the market countered-balanced the rise in supply from North America.
• Libyan factions reached agreements which returned 500,000 b/d to the market quickly, causing the first downdraft in oil prices.
• Baghdad and Erbil reached agreement in early December 2015 which will allow 400,000 b/d to flow from KRG in 2015.
• Markets “suddenly” realized the structural market imbalance.
Jan-
12
Apr-1
2
Jul-1
2
Oct-1
2
Jan-
13
Apr-1
3
Jul-1
3
Oct-1
3
Jan-
14
Apr-1
4
Jul-1
4
Oct-1
4-1,600
-1,400
-1,200
-1,000
-800
-600
-400
-200
0
Iraq Nigeria Libya Iran Non-OPEC Saudi Arabia Kuwait
Th
ou
san
d b
arre
ls p
er d
ay
Global crude production outages
Source: IHS, EIA
Libya
IraqNigeria
Iran
Non-OPEC
© 2015 IHS

© 2015 IHS
1st Tipping Point: return of Libyan production brought fundamentals back into focus
5
Jan-
13
Feb-1
3
Mar
-13
Apr-1
3
May
-13
Jun-
13
Jul-1
3
Aug-1
3
Sep-1
3
Oct
-13
Nov-1
3
Dec-1
3
Jan-
14
Feb-1
4
Mar
-14
Apr-1
4
May
-14
Jun-
14
Jul-1
4
Aug-1
4
Sep-1
4
Oct
-14
Nov-1
4
Dec-1
4-2.5
-2.0
-1.5
-1.0
-0.5
0.0
0.5
1.0
1.5
2.0
2.5
-2.50
-2.00
-1.50
-1.00
-0.50
0.00
0.50
1.00
1.50
2.00
2.50
$/b mmb/dFirst Tip-
ping point mid 2015
Global oil supply growth and the Brent forward curve (3rd month – 1st month)
Source: IHS Energy Crude Oil Markets © 2015 IHS
Brent forward curve(3rd to 1st month)
US + Libya cumulative production change
Contango (upward sloping forward curve) indicates loose market
Backwardation (downward sloping forward curve) indicates tight market

© 2015 IHS 6
2nd Tipping Point: Saudi Arabia stepped back from being the market balancer to guard market share
Q1
2012
Q2
2012
Q3
2012
Q4
2012
Q1
2013
Q2
2013
Q3
2013
Q4
2013
Q1
2014
Q2
2014
Q3
2014
Q4
2014
28.0
28.5
29.0
29.5
30.0
30.5
31.0
31.5
32.0
32.5
33.0
$0
$20
$40
$60
$80
$100
$120
$140
$/b
bl
OPEC dynamics: OPEC crude production vs call on OPEC
Source: IHS Energy Crude Oil Markets service
MM
b/d
Brent $/bbl
OPEC output
Call on OPEC
© 2015 IHS
OPEC’s roll-over of production reflects a willingness to incur short-term pain to let market find the weak producers.
© 2015 IHS 7
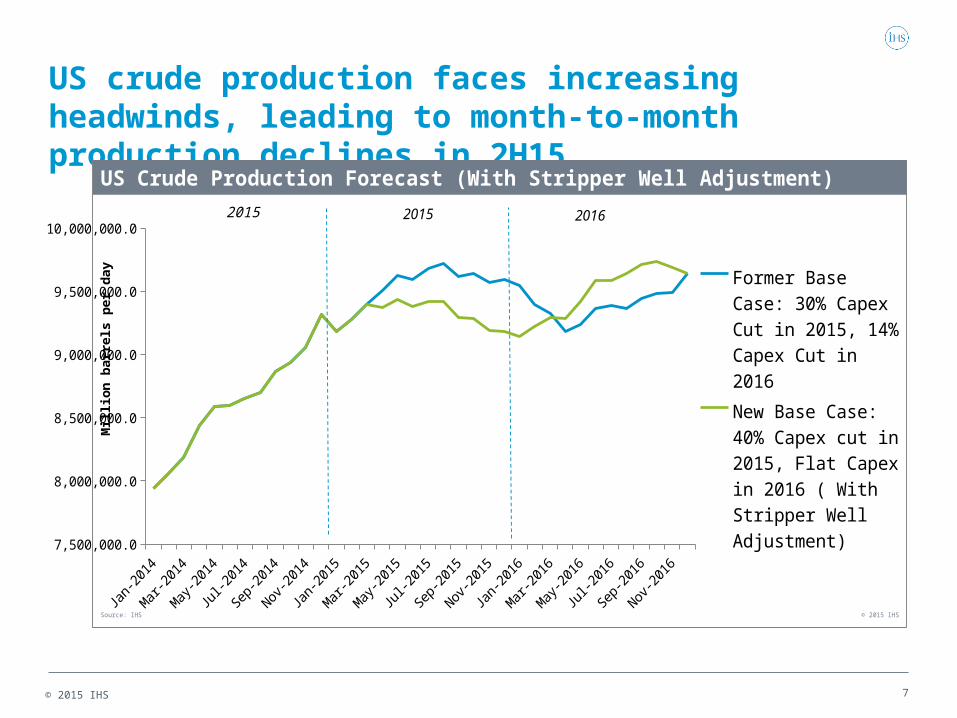
US crude production faces increasing headwinds, leading to month-to-month production declines in 2H15
7,500,000.0
8,000,000.0
8,500,000.0
9,000,000.0
9,500,000.0
10,000,000.0
Former Base Case: 30% Capex Cut in 2015, 14% Capex Cut in 2016
New Base Case: 40% Capex cut in 2015, Flat Capex in 2016 ( With Stripper Well Adjustment)
Mil
lio
n b
arre
ls p
er d
ay
US Crude Production Forecast (With Stripper Well Adjustment)
Source: IHS © 2015 IHS
2015 2015 2016

© 2015 IHS 8
There is a wide range of production economics among and within onshore US plays
Jan-13
Feb-13
Mar-13
Apr-13
May-13
Jun-13
Jul-13
Aug-13
Sep-13
Oct-13
Nov-13
Dec-13
Jan-14
Feb-14
Mar-14
Apr-14
May-14
0.0
500,000.0
1,000,000.0
1,500,000.0
2,000,000.0
2,500,000.0
3,000,000.0
3,500,000.0
120+
110-120
100-110
90-100
80-90
70-80
60-70
50-60
40-50
30-40
Under 30
2013 On-shore Main-tenance Mtn
MM
b/d
US onshore crude brought online in 2013 by WTI $/bbl breakeven categories
Breakeven $/bbl WTI
Source: IHS Energy © 2015 IHS
$50-$60/bbl
Volume needed to replace 2013 onshore base decline
$30-$40/bbl
$40-$50/bbl
$60-$70/bbl
In 2013, the US needed 1.45 MMb/d of new production to cover base decline, all of which could have come from wells breaking even at $60-$70/bbl

© 2015 IHS 9
World economic and oil demand growth
2010 2011 2012 2013 2014 2015 2016 2017 2018 2019 20200.0%
0.5%
1.0%
1.5%
2.0%
2.5%
3.0%
3.5%
4.0%
4.5%
World economic and oil demand growth
Source: IHS, IEA © 2015 IHS
Pe
rce
nt c
ha
ng
e fr
om
pre
vio
us
yea
rWorld economic growth
World oil demand growth

© 2015 IHS
Liquids demand growth approaches 1.3-1.4 MMb/d, mostly due to improving economic conditions
10
2014 2015 2016 2017 2018 2019 2020-200
0
200
400
600
800
1,000
0
300
600
900
1,200
1,500
1,800
Africa Asia_Pacific CIS Europe Latin America Middle East
North America World
Change from preceding year (regions left-scale, world right-scale)
© 2015 IHS
Th
ou
san
d b
bl/d
Source: IHS
World demand (right-scale)

© 2015 IHS 11
OPEC crude oil production
2010 2011 2012 2013 2014 2015 2016 2017 2018 2019 20200
5
10
15
20
25
30
35
OPEC crude oil production to 2020
Source: IHS © 2015 IHS
Mill
ion
ba
rre
ls p
er
da
y
Saudi Arabia
Iraq
Iran
Kuwait
Nigeria
UAELibya
Other OPEC members

© 2015 IHS 12
Saudi Arabia is a baseload producer, not a “swing” producer
Tight oil
2010 2011 2012 2013 2014 2015 2016 2017 2018 2019 20200
2
4
6
8
10
12
14
Saudi Arabian crude oil production and spare capacity
Source: IHS © 2015 IHS
Mill
ion
ba
rre
ls p
er
da
y
Spare production capacity
Crude oil production

© 2015 IHS 13
United States crude oil production outlookAnnual average production volume
Tight oil
2010 2011 2012 2013 2014 2015 2016 2017 2018 2019 20205
6
7
8
9
10
11
12
USA crude oil production to 2020
Source: IHS, EIA. Note: Data include segregated condensate. © 2015 IHS
Mill
ion
ba
rre
ls p
er
da
yMonth-to-month growth halts, temporarily

© 2015 IHS 14
Full cycle Brent $60/barrel breakeven would put a number of key producers at risk of cancelling projects
Venez
uela
Gabon
Iraq
Norway UK
Denm
ark
Niger
ia
Canad
a-SAGD
Azerb
aija
n
Sudan &
South
Sudan
Chad
Vietn
am
Indones
ia
China
Ghana
Egypt
Brunei
Yemen
Qatar
Oman
UAE
Saudi A
rabia
$0
$10
$20
$30
$40
$50
$60
$70
$80
$90
$100
$110
$120
$130
$140
2015 Brent breakeven price analysis: Ranked according country, highest to lowest and showing high and low price range
Source: IHS Energy Cost Services © 2015 IHS
Bre
nt
$/b
bl
2015 Average Brent breakeven price full cycle 10% discount rate by country: Ranked highest to lowest breakeven with high and low price range
High range
Average breakeven
$60/bbl breakeven
Low range

© 2015 IHS 15
Non-OPEC crude oil production outlook, excluding USA
Tight oil
2010 2011 2012 2013 2014 2015 2016 2017 2018 2019 20200
5
10
15
20
25
30
35
40
Non-OPEC crude oil production, excluding United States
Source: IHS, IEA, EIA © 2015 IHS
Mill
ion
bar
rels
per
day
Canada
Latin America (incl. Mexico)
Asia Pacific
Europe
AfricaMiddle East
CISCommonwealth of
Independent States

© 2015 IHS 16
Trends in upstream oil field development costsIndex illustrates change in cost of developing a global portfolio of upstream assets
Tight oil
20
10
20
11
20
12
20
13
20
14
20
15
20
16
20
17
20
18
20
19
20
20140
160
180
200
220
240
260
Indicative upstream capital cost trends
Note: History is the IHS Upstream Capital Cost Index. Projection is indicative trend for future costs. Source: IHS © 2015 IHS
Ind
ica
tive
ca
pita
l co
st in
de
x (2
00
0 =
10
0)
In 2020 costs are still 7% below 2014 level

© 2015 IHS 17
Annual change in world oil demand and supply
2010 2011 2012 2013 2014 2015 2016 2017 2018 2019 20200.0
0.5
1.0
1.5
2.0
2.5
3.0
3.5
$0
$20
$40
$60
$80
$100
$120
Do
llars
pe
r b
arr
el
Change from previous year in world oil supply and demand
Notes: Annual changes are changes from the previous year. Liquids demand includes LPG and biofuels. Liquids supply includes natural gas liquids and biofuels.Source: IHS, IEA, EIA © 2015 IHS
Mill
ion
ba
rre
ls p
er
da
y
Brent price (right scale)
Demand Supply

© 2015 IHS 18
Long term real Brent prices expected to revert to ~$110, required to support marginal supply development
2005
2006
2007
2008
2009
2010
2011
2012
2013
2014
2015
2016
2017
2018
2019
2020
2021
2022
2023
2024
2025
2026
2027
2028
2029
2030
2031
2032
2033
2034
2035
2036
2037
2038
2039
2040
0
20
40
60
80
100
120
140
Dated Brent, real
Dated Brent long-term outlook
© 2015 IHS
Co
ns
tan
t 2
01
4 d
olla
rs p
er
ba
rre
l
Source: IHS

© 2015 IHS
Wedge of ~50 million bbl/d new oil production by 2040 needed to offset declines and meet demand growth
19
0
10,000
20,000
30,000
40,000
50,000
60,000
70,000
80,000
90,000
100,000
2005 2010 2015 2020 2025 2030 2035 2040
Segregated Condensate FIP FUD FUA YTF Tight Oil
World Crude and Condensate Production Outlook
Source: IHS © 2015 IHS
Th
ou
san
d b
arre
ls p
er d
ay

© 2015 IHS 20
Long term Brent-WTI spread reflects export parity economics (US crude trade liberalization)
1990
1991
1992
1993
1994
1995
1996
1997
1998
1999
2000
2001
2002
2003
2004
2005
2006
2007
2008
2009
2010
2011
2012
2013
2014
2015
2016
2017
2018
2019
2020
2021
2022
2023
2024
2025
2026
2027
2028
2029
2030
2031
2032
2033
2034
2035
2036
2037
2038
2039
2040
-20
0
20
40
60
80
100
120
140
Brent - WTI Dated Brent, Spot FOB WTI, Spot Cushing
Brent vs WTI Crude Prices
© 2015 IHS
Rea
l 201
4 D
olla
rs p
er B
arre
l
Source: IHS

© 2015 IHS 21
The case for a wider WTI-Brent spread: refining constraints for light tight oil processing
Tier 1 – Displace light sweet crude imports
($2 – 4/Barrel)
($1 – 2/Barrel)
($0.5 – 1.0/Barrel)
($8 – 18+/Barrel)

© 2015 IHS 22
North America crude price relationships

IHS Customer Care:• Americas: +1 800 IHS CARE (+1 800 447 2273); [email protected] • Europe, Middle East, and Africa: +44 (0) 1344 328 300; [email protected] • Asia and the Pacific Rim: +604 291 3600; [email protected]
© 2015 IHS. No portion of this report may be reproduced, reused, or otherwise distributed in any form without prior written consent, with the exception of any internal client distribution as may be permitted in the license agreement between client and IHS. Content reproduced or redistributed with IHS permission must display IHS legal notices and attributions of authorship. The information contained herein is from sources considered reliable but its accuracy and completeness are not warranted, nor are the opinions and analyses which are based upon it, and to the extent permitted by law, IHS shall not be liable for any errors or omissions or any loss, damage or expense incurred by reliance on information or any statement contained herein. For more information, please contact IHS at [email protected], +1 800 IHS CARE (from North American locations), or +44 (0) 1344 328 300 (from outside North America). All products, company names or other marks appearing in this publication are the trademarks and property of IHS or their respective owners.