© 2018 ijrar january 2019, volume 06, issue 1
TRANSCRIPT

© 2018 IJRAR January 2019, Volume 06, Issue 1 www.ijrar.org (E-ISSN 2348-1269, P- ISSN 2349-5138)
IJRAR190M008 International Journal of Research and Analytical Reviews (IJRAR) www.ijrar.org 47
Flood Frequency Analysis of High Magnitude
Riverine Flood of Upper Godavari Basin
1M S Jadhav 1Assisstant Professor
1PG Department of Geography, 1BPHE Society’s Ahmednagar College, Ahmednagar, MH, India
ABSTRACT:
Flood is weather related hydrological globally widespread disaster and most frequently occurrence phenomena. It is overflow
situation of river during heavy rainfall inundating area along channel. Recently published report of two decade (1995-2015)
assessment of worldwide flood concluded that, 2.3 billion and 1.57 lakhs populations affected and killed respectively
subsequently many more study and report exposed that India to be gradually flood prone country placed in top ten in context to
lives and GDP losses with recurrence of high magnitude flood towards end of 21st century. Genuine research published in nature
of rainfall of period 66 years (1950-2017) exhibiting significant observation that, over central India, ‘the mean monsoon rainfall is
a decline but the frequency of extreme rainfall events (daily rainfall ≥ 150 mm) it has increased by about 75% during the period
(Roxy, et al., 207). Literature available on Upper Godavari basin also has been in same line of fact. Flood frequency is statistical
measure of high magnitude flood occurrence probability. Hence, in this attempt flood frequency curve or plot has adopted to
comprehend high magnitude discharge or flood events at five gaging stations of sub-basins of Upper Godavari basin,
Maharashtra. In conclusion we found flood frequency of high magnitude flood recurrence interval in year given in bracket with
gaging stations, Nandur Mamdmeshwar (55), Jayakwadi dam (40) Gangapure dam (47), Kopargaon (110 to 130), Bhandardara
dam (115), Mula dam (150). It very cogent in flood risk assessment, forecasting and management practices.
Key Words: Flood, Frequency curve, Upper Godavari basin, Recurrence interval
I. INTRODUCTION
Flood is most frequently occurring, big killer of people, terrible harmful hydrological hazard cum disaster experienced by almost
every country and communities of the world. It has extensive spatiotemporal scope. Flood is trigger to various phenomena as type
of floods viz. flash flood, costal flood, urban flood and riverine flood instigate by heavy rainfall and lack of drainage. Flood
severity is byproduct of combination of intensity cum spatiotemporal distribution of rainfall, topography cum surface nature, river
pattern cum basin size-shape and anthropogenic encroachments cum interference.
Dichotomy has been observed while thoroughly reading, studying and reviewing literature which is available right from local to
international level that is fluvial floods are natural or man induced. This dichotomy is not only in the literature but also among the
layman, environmental-social activist, administrators, NGOs, politician, planers and policy makers, and judiciary also.
Commonsense make enable to say confidently that most of time flood is man induced rather than natural looking at recent year
events in the climate change ear. The Earth’s environment was stable in the past ten thousand year as period of Holocene when
human civilization arise, developed and flourish but in recent period stability of nature may under threatened particularly since
Industrial Revolution new era called Anthropocene in which human actions, activities and so-called development have becomes
main driver force for global environmental changes without sustainability (Rockström, et al., 2009). Under the effect of climate
change, severe meteorological and hydrological phenomena including flood with the potential to cause, loss of human life, social
disruption and economical loss. The frequency, magnitude and consciences of flood have been increased and become top killer
among the natural and manmade hazards. The specific magnitude flood recurrence interval in large and medium river basins of the
world has been increased.
Among all natural disasters, occurrence percentage of flood hydrological disaster is 43% with top rank having observed 3062
flood events since 1995 to 2012 within 20 years in the world (Wahlstrom & Guha-Sapir, 2015). UNISDR report entitled The
Human Cost of Weather Related Disaster (WRD)-2019-2015 rightly pointed out that people frequently and highly affected by
flood and in two decades (1995-2015) number of affected people was 2.3 billion (56%) hence it is top one among the all-weather
related disaster. Flood killed 157000 which are 26% of WRD people in two decades. Economic damage is more than 25% (662
billion US$). Future losses to be increased in built environment by five disaster in whish river flooding is one with earthquake,
tsunamis, tropical cyclone and wind & storm surge. (UNISDR, 2018)
Natural and Man induced are two broad category of disasters. Hydrological hazard defined by (EM-DAT, 2009) as a hazard
caused by the occurrence, movement, and distribution of surface and subsurface freshwater and saltwater. Among the natural
hazard, hydrological hazard Flood is most frequently recurrent one which has been classified as. Coastal, Riverine, Flash and Ice
Jam Flood (EM-DAT, 2009) (Wahlstrom & Guha-Sapir, 2015). Flood is maximum flow which results high water level that
overflows the river banks (natural or artificial levees) along the stream due to heavy rainfall, storm, cyclone and snow melting
II. FLOOD LOSSES IN INDIA & MAHARASHTRA:
Most of the internationally published research based report cogent reports have been strongly and tactfully underlined that India
is high flood prone country. (Simpkins, 2017), concluded that thirty million people affected by extensive flooding in India
because of extreme rainfall which result in flash flood (Goswami, Venugopal, Sengupta, Madhusoodanan, & Xavier, 2006) as
well as same events are increasingly common in recent decades, threefold increase in widespread extreme rain events over
central India during 1950–2015 and India alone amounted to losses of about $3billion per year, which is 10% of the global
economic losses (Roxy, et al., 2017). National Flood Commission 1980, reported 40m.ha flood prone is in India with

© 2018 IJRAR January 2019, Volume 06, Issue 1 www.ijrar.org (E-ISSN 2348-1269, P- ISSN 2349-5138)
IJRAR190M008 International Journal of Research and Analytical Reviews (IJRAR) www.ijrar.org 48
33.516m.ha, unprotected and rest of it is protected, subsequently according to X & XI plan area was reported 45.64 m.ha.
(Paithankar, 2013)
India witnessed worst natural disaster where flood is most recurrent and most devastative are Bihar flood (1987), Maharashtra
Flood, 2005, Assam Floods, 2012, Uttarakhand Floods 2013, Kashmir Floods, 2014 (DB, 2018), are five most devastating floods
of India, with some more events viz. Keral Flood-2018, 2017-Mumbai, Gujrath, West Benal, Bihar, North East India,2016-
Brahmaputra, 2015- Chennai, Gujrat, Assam, 2014-Kashmir, 2013-North India(UK), 2013 Brahmaputra, 2008-Bihar.2007-
Bihar,2005 Mumbai. The 268 flooding events in India between1950–2015 witnessed impact like 825 million people, leaving 17
million homeless and killing 69,000 people (Roxy, et al., 2017)
Fig.1: Type of Damage Due to Floods or Heavy Rains in India: (1953 to 2016)
Fig 2: Type of Damage Due to Floods or Heavy Rains in Maharashtra: (1953 to 2016), Source: (FFD, 2018)
III. STUDY AREA: LOCATION AND DETAIL REVIEW OF FLOOD IN UPPER GODAVARI BASIN
Godavari River is flow in central India as second largest after Ganga River which source of water to drinking, irrigation,
industry, power generation and it scared one among Hindu culture. Its absolute extension is 73°24’ to 83°4’ E and 16°19’ to
22°34’ N having source at Trimbakeshwar, Nashik, Maharashtra and flow with 1,465 km length up to mouth at Bay of Bengal
sea. The total area is 3, 12,812 Sq.km which is nearly 9.5% of the total geographical area of the country, it is distributed among
six states and one union territory. Upper Godavari sub basin (Map-1) from source to Jaykwadi dam has been considered as study
area, which actual area is 21443.23 Sq.km. Within sub basin, six gauging stations have been selected for flood frequency
analysis.
Upper Godavari basin is having good number of major (12), Medium (10) Minor (82) and local sector dams (871) with few
ongoing projects as an water management aspect but in heavy rainfall during monsoon period this network get over flow and
flood has been observed along the main channel in the basin where lives, property, agricultural field and crop, infrastructure etc.
get effect of adjacent settlements. (GoM-WRD, 2013) IITM Pune (MWR-GOI, 2008) has been studied entire country and three
basins Ganga, Godavari Krishna with focus on spatial change in summer monsoon rainfall variability and water availability and
genuinely predicted increase in extreme rainfall and rainfall intensity with rainy days in the basin toward 21st century, Godavari
basin projected to have higher rainfall than Ganga and Krishna basins and flow would be change from 98 km2 (1961:1990) to
116km2 (2071:2100) (MWR-GOI, 2008), so flood management related policy implications have been suggested. The mean
monsoon rainfall is a decline but the frequency of extreme rainfall events (daily rainfall ≥ 150 mm) it has increased by about
75% during the period (Roxy, et al., 2017).
0.00
5.00
10.00
15.00
20.00
25.00
19
53
19
55
19
57
19
59
19
61
19
63
19
65
19
67
19
69
19
71
19
73
19
75
19
77
19
79
19
81
19
83
19
85
19
87
19
89
19
91
19
93
19
95
19
97
19
99
20
01
20
03
20
05
20
07
20
09
20
11
20
13
20
15
Area affected in % Population affected in%
Damage to Crops m. ha. (%) Damage to Crops Rs.Crore(%)
Damage to Houses Nos. in % Damage to Houses in Rs.Crore %
Cattle Lost Nos. % Human live LostNos. %
Damage to Public Utilities in
Rs.Crore %
Total damages
Crops, Houses & Public utilities in Rs.Crore %
0
5
10
15
20
25
30
35
19
53
19
55
19
57
19
59
19
61
19
63
19
65
19
67
19
69
19
71
19
73
19
75
19
77
19
79
19
81
19
83
19
85
19
87
19
89
19
91
19
93
19
95
19
97
19
99
20
01
20
03
20
05
20
07
20
09
20
11
20
13
20
15
Area Affected in m.ha.(%)Population Affected in%Damage to Crop Area in m.ha (%)Damage to Crop Value in Rs.Crore (%)Damage to Houses Nos (%)Damage to Houses Value Rs.CroreCattle Lost Nos.Human Lives Lost Nos.Damage to Public UtilitiesTotal damages crops, houses & public utilities (Rs.Crore)
Type of Damage Due to Floods or Heavy Rains in India: (1953 to 2016)
Type of Damage Due to Floods or
Heavy Rains in Maharashtra
(1953 to 2016)
© 2018 IJRAR January 2019, Volume 06, Issue 1 www.ijrar.org (E-ISSN 2348-1269, P- ISSN 2349-5138)
IJRAR190M008 International Journal of Research and Analytical Reviews (IJRAR) www.ijrar.org 49
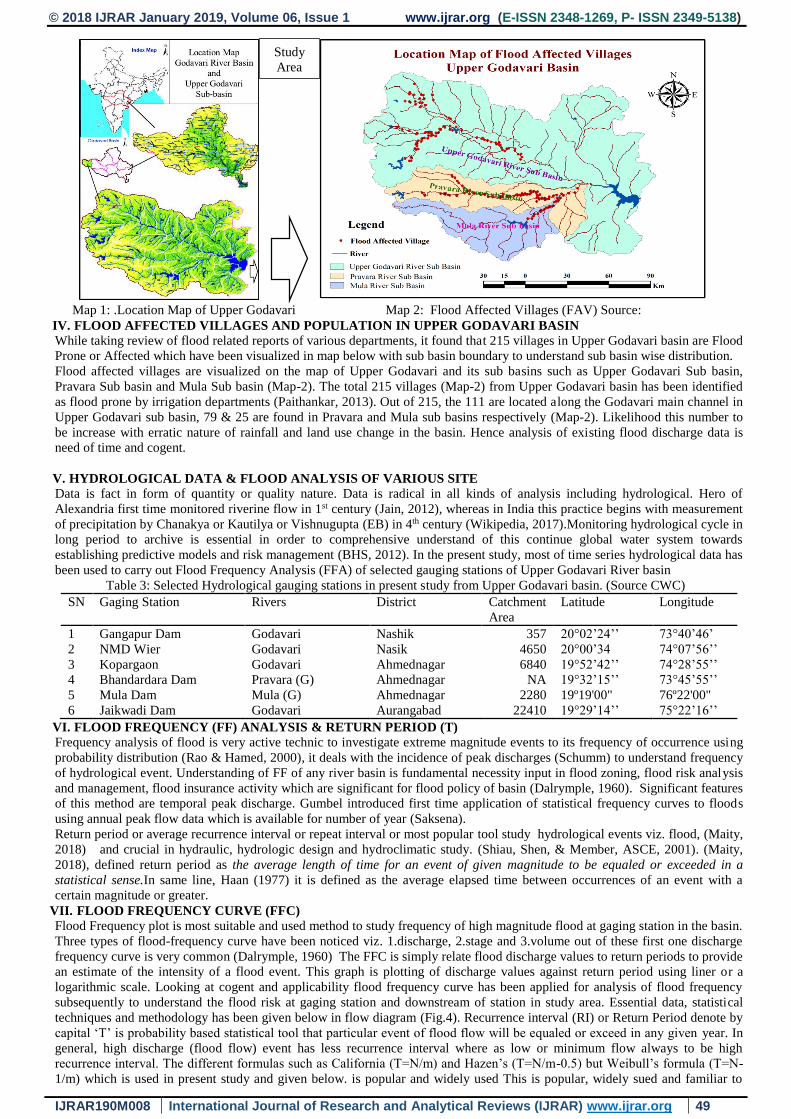
Map 1: .Location Map of Upper Godavari Map 2: Flood Affected Villages (FAV) Source:
IV. FLOOD AFFECTED VILLAGES AND POPULATION IN UPPER GODAVARI BASIN
While taking review of flood related reports of various departments, it found that 215 villages in Upper Godavari basin are Flood
Prone or Affected which have been visualized in map below with sub basin boundary to understand sub basin wise distribution.
Flood affected villages are visualized on the map of Upper Godavari and its sub basins such as Upper Godavari Sub basin,
Pravara Sub basin and Mula Sub basin (Map-2). The total 215 villages (Map-2) from Upper Godavari basin has been identified
as flood prone by irrigation departments (Paithankar, 2013). Out of 215, the 111 are located along the Godavari main channel in
Upper Godavari sub basin, 79 & 25 are found in Pravara and Mula sub basins respectively (Map-2). Likelihood this number to
be increase with erratic nature of rainfall and land use change in the basin. Hence analysis of existing flood discharge data is
need of time and cogent.
V. HYDROLOGICAL DATA & FLOOD ANALYSIS OF VARIOUS SITE
Data is fact in form of quantity or quality nature. Data is radical in all kinds of analysis including hydrological. Hero of
Alexandria first time monitored riverine flow in 1st century (Jain, 2012), whereas in India this practice begins with measurement
of precipitation by Chanakya or Kautilya or Vishnugupta (EB) in 4th century (Wikipedia, 2017).Monitoring hydrological cycle in
long period to archive is essential in order to comprehensive understand of this continue global water system towards
establishing predictive models and risk management (BHS, 2012). In the present study, most of time series hydrological data has
been used to carry out Flood Frequency Analysis (FFA) of selected gauging stations of Upper Godavari River basin
Table 3: Selected Hydrological gauging stations in present study from Upper Godavari basin. (Source CWC)
SN Gaging Station Rivers District Catchment
Area
Latitude Longitude
1 Gangapur Dam Godavari Nashik 357 20°02’24’’ 73°40’46’
2 NMD Wier Godavari Nasik 4650 20°00’34 74°07’56’’
3 Kopargaon Godavari Ahmednagar 6840 19°52’42’’ 74°28’55’’
4 Bhandardara Dam Pravara (G) Ahmednagar NA 19°32’15’’ 73°45’55’’
5 Mula Dam Mula (G) Ahmednagar 2280 19º19'00" 76º22'00"
6 Jaikwadi Dam Godavari Aurangabad 22410 19°29’14’’ 75°22’16’’
VI. FLOOD FREQUENCY (FF) ANALYSIS & RETURN PERIOD (T)
Frequency analysis of flood is very active technic to investigate extreme magnitude events to its frequency of occurrence using
probability distribution (Rao & Hamed, 2000), it deals with the incidence of peak discharges (Schumm) to understand frequency
of hydrological event. Understanding of FF of any river basin is fundamental necessity input in flood zoning, flood risk analysis
and management, flood insurance activity which are significant for flood policy of basin (Dalrymple, 1960). Significant features
of this method are temporal peak discharge. Gumbel introduced first time application of statistical frequency curves to floods
using annual peak flow data which is available for number of year (Saksena).
Return period or average recurrence interval or repeat interval or most popular tool study hydrological events viz. flood, (Maity,
2018) and crucial in hydraulic, hydrologic design and hydroclimatic study. (Shiau, Shen, & Member, ASCE, 2001). (Maity,
2018), defined return period as the average length of time for an event of given magnitude to be equaled or exceeded in a
statistical sense.In same line, Haan (1977) it is defined as the average elapsed time between occurrences of an event with a
certain magnitude or greater.
VII. FLOOD FREQUENCY CURVE (FFC)
Flood Frequency plot is most suitable and used method to study frequency of high magnitude flood at gaging station in the basin.
Three types of flood-frequency curve have been noticed viz. 1.discharge, 2.stage and 3.volume out of these first one discharge
frequency curve is very common (Dalrymple, 1960) The FFC is simply relate flood discharge values to return periods to provide
an estimate of the intensity of a flood event. This graph is plotting of discharge values against return period using liner or a
logarithmic scale. Looking at cogent and applicability flood frequency curve has been applied for analysis of flood frequency
subsequently to understand the flood risk at gaging station and downstream of station in study area. Essential data, statistical
techniques and methodology has been given below in flow diagram (Fig.4). Recurrence interval (RI) or Return Period denote by
capital ‘T’ is probability based statistical tool that particular event of flood flow will be equaled or exceed in any given year. In
general, high discharge (flood flow) event has less recurrence interval where as low or minimum flow always to be high
recurrence interval. The different formulas such as California (T=N/m) and Hazen’s (T=N/m-0.5) but Weibull’s formula (T=N-
1/m) which is used in present study and given below. is popular and widely used This is popular, widely sued and familiar to
Study
Area

© 2018 IJRAR January 2019, Volume 06, Issue 1 www.ijrar.org (E-ISSN 2348-1269, P- ISSN 2349-5138)
IJRAR190M008 International Journal of Research and Analytical Reviews (IJRAR) www.ijrar.org 50
calculate Return Period or Recurrence Interval (RI) in years or any time unite as per nature of data. (Christopherson & Hobbs,
2000)
VIII. DATA SOURCES METHODOLOGY AND EQUATIONS:
Hydrological data, particularly discharge of few sites was taken from various sources such as http://www.india-wris.nrsc.gov.in/,
whereas data of Mula and Bhandardara dam has been collected from irrigation department Ahmednagar. The data has organized
and analyzed in Excel-10 software. To carryout entire analysis for present study we have been flowed following equations and
methodology presented in flow chart. Return period of all discharge observation at all six sites has been produced by Eq.1
subsequently probability and probability in percentage has been calculated using Eq.2 and Eq.3 respectively. Probability (P) is
reverse of return period (T).
𝑅𝑒𝑐𝑢𝑟𝑟𝑒𝑛𝑐𝑒 𝐼𝑛𝑡𝑒𝑟𝑣𝑎𝑙 𝑜𝑟 𝑅𝑒𝑡𝑢𝑟𝑛 𝑃𝑒𝑟𝑖𝑜𝑑: 𝑇 = 𝑁+1
𝑀 ……………………………. Eq.1
𝑃𝑟𝑜𝑏𝑎𝑏𝑖𝑙𝑖𝑡𝑦: 𝑃 =1
𝑇 …………………………………………………………...............Eq.2
𝑃𝑟𝑜𝑏𝑎𝑏𝑖𝑙𝑖𝑡𝑦 𝑖𝑛 %: 𝑃 =1
𝑇∗ 100 ………………………………………………………Eq.3
Where…N: total record of discharge in years; M: Rank of particular discharge in total observations,
Fig 4: Methodology Flow Chart of Recurrence Interval and Flood Frequency Curve
Fig.5: Hydrograph of Nandur-Madmeshwar Gauging Station in Upper Godavari basin (1962 -2016), Source: CWC
Fig 6: FFC at Gangapur Dam gauging station (G) Fig 7: FCC at Nandur-Madmeshwar weir gauging station (G)
Flood Frequency Curve:
Plotting of Discharge (Y axis)
Recurrence Interval (X axis)
Hydro Data
Source CWC
Compile discharge data of
available year
N
Rank data by
magnitude
M
Processing & Calculation: 𝑻: 𝑵+𝟏
𝑴
Interpretation of RI; Ex. 100, 50, 25 year floods
based on probability P=1/T

© 2018 IJRAR January 2019, Volume 06, Issue 1 www.ijrar.org (E-ISSN 2348-1269, P- ISSN 2349-5138)
IJRAR190M008 International Journal of Research and Analytical Reviews (IJRAR) www.ijrar.org 51
Fig 8: FFC at Kopargaon gauging station (G) Fig 9: FCC at Bhandardara dam gauging station (P)
Fig 10: FFC at Mula dam gauging station (M) Fig 11: FCC at Jayakwadi dam gauging station (G)
IX. ANALYSIS AND RESULT DISCUSSIONS
All six sites (Table-3) data has been analyzed in order to produce flood frequency curve. It this entire process initially dada has
been organized in descending order and then allotted ranks to each value. The arranging, ranking data and calculations of ‘T’ and
‘P’ based on ‘Q’ of all station has been done but not given her in details, only result in form of Flood Frequency Curves of all
selected six is given since Fig. 6 to Fig. 11. Flood frequency curve is showing situation of recurrence interval of particular
discharge. The at all station flood fact is different as Mula dam having (3) events, Kopargaon (2), Bhandardara dam (1) whose
return period is more than 200years and remaining Gangapur (1), Nandur-Madmeshwar (1), Jayakwadi dam (1) whose return
period (T) is 20 to 60 years. High magnitude discharge flood has been found with its recurrence interval (Table-4) at all six
selected sites.
Table 4: Recurrence Interval and Probability of selective high magnitude flood discharge of six gauging station
Station Year Q T (P = 1 / T ) (P (%) = 1 / T*100 )
Gangapur Dam 2006 142871 59 1/59=0.0169 1.7
NMD Weir 1976 352333 56.00 1/56=0.018 1.8
Kopargaon 1990 4.58 439 1/439=0.0023 0.23
Bhandardara Dam 1995 12306 246 1/246=0.004 0.40
Mula Dam 2006 105.24 606 1/606=0.0017 0.17
Jayakwadi Dam 2006 7889.13 39 1/39=0.026 2.56
X. CONCLUSION:
Return period is determination of the possibility of an even such as flood in hydrological study in order to understand the risk of
same magnitude flood after expected interval of time. Flood risk assessment is very fundamental activity while study river
hydrology toward planning of ricer restoration, hydro project development and flood hazard management. In present study return
period at three stations viz. Mula dam, Kopargaon and Bhandardara of high magnitude is found more that is more than 200 year.
Other three sites viz. Gangapur dam, Nandur-Madmeshwar dam and Jayakwadi where return period of high magnitude is between
20 to 60 years. It can be say that at all sites or downstream having probability of high magnitude flood. At Gangapur which is
located upstream of Nashik city where recurrence interval of high magnitude flood of 2006 (Q142871) is 59, it means respected
amount of flood probably likelihood in practice once in 59 years which probability is 0.0169 or 1.7 percent. It could be dangerous
to the Nashik city.
Study has been found three high magnitude flood years e.g. (2006, 2016, 2004) at Gangapur, (1976, 1969, 2006) at
Nanduarmadmeshwar, (1990, 2013 ,2001) at Kopargaon, (1995, 1976, 2005) at Bhandardara, (2006, 2008, 2005) at Mula project
and (2006, 1976, 1990) at Jayakwadi Paithan dam. The range of return period (T) of all above mentioned years discharge
magnitude is from 13 (Jayakwadi dam-1990) to 439 (Kopargaon-1990) years.

© 2018 IJRAR January 2019, Volume 06, Issue 1 www.ijrar.org (E-ISSN 2348-1269, P- ISSN 2349-5138)
IJRAR190M008 International Journal of Research and Analytical Reviews (IJRAR) www.ijrar.org 52
Recent study produced & published in reputed journals noticed that this basin would be have erratic nature of rainfall and rain
may decline but extreme events of rains and subsequently flood likely to be increased in days to come. On this back ground this
study is significant, plus it helps to hydrologist while hydro project development planning is in practice. In short flood frequency
analysis using flood frequency curve based on the return period of recurrence interval has been cogent towards flood risk
assessment (future scope of study) in the upper Godavari river sub basin with special focus on Pravara, Mula and Upper Godavari
sub basins as part of Godavari Upper basin.
REFERENCES:
Barichivich, J., Gloo, E., Peylin, P., Brienen, R. J., Schöngart, J., Espinoza, J. C., et al. (2018). Recent intensification of Amazon flooding extremes driven by strengthened Walker circulation. Science Advances, 4(9), 1-7.
BHS. (2012). Hydrological Data-The Importance of Hydrological Data. Retrieved from British Hydrological Society :
http://www.hydrology.org.uk/Hydrological_data.php CWC. (2012). Handbook for Flood Protection, Anti Erosion and River Training Workshop. New Delhi: Flood Managment Organisation.
Dalrymple, T. (1960). Flood-Frequency Analysis, Manual of Hydrology:Part-3 Flood Flow Tecniques Geological Survey,USA. Washington DC: United State
Department of the Interior. EB. (n.d.). Kautily. Retrieved from Encyclopedia Britannica: https://www.britannica.com/biography/Kautilya
EM-DAT. (2009). General Classification. Retrieved from The International Disaster Database: https://www.emdat.be/classification
FFD, F. F. (2018, May 10). Atate wise flood damage statistics. Retrieved from Centreal Water Commission: http://cwc.gov.in/main/downloads/statewise_flood_data_damage_statistics.pdf
GoM-WRD. (2013). Master Plan for Integrated Development and Managment of Water Resources of Suba basins of Upper Godavari. Aurangabad: Government
of Maharashtra-Water Resource Department. Goswami, B. N., Venugopal, V., Sengupta, D., Madhusoodanan, M. S., & Xavier, P. K. (2006, December 1). Increasing Trend of Extreme Rain Events Over India
in a Warming Environment. SCIENCE, 314, 1442-1445.
Jain, S. K. (2012). NPTEL-Civil Engineering-Hudrological Mesurment and Analysis of Data. Retrieved from NPTEL:
https://nptel.ac.in/courses/105107129/module2/lecture1/lecture1.pdf
Luo, T., Maddocks, A., Iceland, C., Ward , P., & Winsemius, H. (2015). World’s 15 Countries with the Most People Exposed to River Floods. Retrieved from World Resource Institute: http://www.wri.org/blog/2015/03/world%E2%80%99s-15-countries-most-people-exposed-river-floods
Maity, R. (2018). Statistical Methods in Hydrology and Hydroclimatology. Singapore: Springer Nature Singapore Pte Ltd.
MWR-GOI. (2008). Preliminary Consolidated Report on Effect of Climate Change on Water Resources. New Delhi: Government of India Ministry of Water Resources.
Paithankar, Y. (2013, August 21). CWC National Flood Forecasting Network. Retrieved from India-WRIS Wiki: http://www.india-
wris.nrsc.gov.in/wrpinfo/index.php?title=Flood_Management Rao, A. R., & Hamed, K. H. (2000). Flood Frequency Analysis. Boca Raton: CRC Press.
Roxy, M. K., Ghosh, S., Pathak, A., Athulya, R., Mujumdar, M., Murtugudde, R., et al. (2017, October 03). A threefold rise in widespread extreme rain events
over central India. Nature Communications, 8(708), 1-11. Saksena, S. (n.d.). Introduction to Flood Frequency Analysis. Retrieved from Data and Model Driven Hydrology Education:
https://serc.carleton.edu/hydromodules/steps/168500.html
Schumm, S. A. (n.d.). River. Retrieved from Encyclopedia Britannica: https://www.britannica.com/science/river/Streamflow-and-sediment-yield#ref399602 Shiau, J. T., Shen, H. W., & Member, ASCE. (2001). Recurrence Analysis Of Hydrologic Droughts Of Differing Severity. J. Water Resour. Planning and
Management, 127, 30-40.
Simpkins, G. (2017, 11 02). Extreme rain in India. Nature Climate Change, 7, 760. UNISDR. (2018). Annual Report 2017-106-17 Biennium Work Programme Final Report . Geneva, Switzerland: United Nations Office for Disaster Risk
Reduction (UNISDR).
Wahlstrom, M., & Guha-Sapir, D. (2015). The Human Cost of Waeather Related Disastes-1995-2015. Geneva: UNISDR-United Nations Office for Disaster Risk Reduction.
Wikipedia. (2017). Chanakya. Retrieved from Wikipedia: https://en.wikipedia.org/wiki/Chanakya