© 2019 jetir december 2019, volume 6, issue 12 ... · the sedimentary basin. ironstone deposits...
TRANSCRIPT
© 2019 JETIR December 2019, Volume 6, Issue 12 www.jetir.org (ISSN-2349-5162)
JETIR1912016 Journal of Emerging Technologies and Innovative Research (JETIR) www.jetir.org 112
Mineralogical and geochemical studies of ironstones
around Koton karfi, part of southern Bida Basin,
north central Nigeria JOHN UZOMA MEGWARA1,*, SOLOMON IOKOSO ABA’A 2 , IDRIS ISA FUNTUA 3
1Applied and Engineering Geology Department, Nigerian Geological Survey Agency, Kaduna, Nigeria
2 Geology Department, Federal University of Technology, Lafia, Nigeria
3 Umar Musa Yar’adua University, Katsina, Nigeria.
ABSTRACT
The combination of mineralogical and geochemical data of sedimentary rocks can reveal the nature of rocks and the tectonic settings of
the sedimentary basin. Ironstone deposits cap plateaux around Koton Karfi requiring detailed studies. The survey area is bounded by
longitudes 6°48ʹ00ʺ E to 6°52ʹ48ʺ E and latitudes 8°05ʹ00ʺ N to 8°10ʹ46ʺ N covering an area of about 96.8 km2. The stratigraphic successions
in the study area consist of the basal Lokoja Formation, overlain by the Patti Formation and capped by the Agbaja Formation. The basal
Lokoja Formation is a sequence of matrix supported conglomerates and sandstones overlying the Pre–Cambrian Basement. Twenty one
rock samples were collected from the study area. Geochemical analysis of the samples was carried out using x-ray fluorescence.
Mineralogical analysis determined the mineral compositions and modal percentages of minerals in the samples. Twenty elements and
nineteen oxides were revealed and they include Al2O3, SiO2, Fe2O3, P2O5, CaO, K2O, V2O5, Cr2O3, Eu2O3, NiO2, ZnO, La2O3, BaO,
SrO, CuO, Nd2O3, Re2O7 and PbO. The mineralogical study shows the presence of two petrographic varieties namely the ooidal pack-
ironstone and detrital mud-ironstone. The core of the ooids is made up of pseudomorphs of goethite after siderite and hematite after
Itabirite.
KEY WORDS Framboid, Goethite, Hematite, Itabirite, Magnetite.
1.0 INTRODUCTION
Ironstone is a sedimentary rock, either deposited directly as a ferruginous sediment or formed by
chemical replacement that contains a substantial proportion of an iron (Fe) compound from which
iron can be smelted commercially. The iron minerals comprising ironstones can consist either of
oxides: limonite, hematite and magnetite; carbonates: siderite; silicates: chamosite; or some
combination of these minerals. Iron exists naturally in ironstone (sometimes called iron ore). Iron
ores are rocks and minerals from which metallic iron can be economically extracted (Chard, 1995).
The significance attached to the growth of the steel sector has led to interest in the ironstone
deposits of Nigeria. Two broad types of iron deposits occur prominently in Nigeria. They are: (i)
Banded Iron Formation (BIF): The Formation occurs in folded bands and lenses associated with
the Pre-Cambrian metasedimentary schist belts outcropping in the western half of the country. The
iron formation bands which vary in thickness from about 3 cm to 5 m are found commonly in
groups intercalated within surrounding country rocks or as isolated thin units. The bands have
variable strike extent with some stretching though discontinuously for several kilometers.
© 2019 JETIR December 2019, Volume 6, Issue 12 www.jetir.org
(ISSN-2349-5162)
JETIR1912016 Journal of Emerging Technologies and Innovative Research (JETIR) www.jetir.org 113
Prominent locations include Tajimi, Itapke, Ajabanoko, Ochokochoko Toto, Farin Ruwa, Birnin
Gwari, Maru, Jamare, Kaura Namoda, Kakun, Isanlu, Roni and Ogbomosho areas (MSMD, 2010).
(ii) The Cretaceous sedimentary (oolitic) iron deposits: Although they are described as
sedimentary, they are partly lateritic in character and occur prominently around Agbaja, Koton
Karfi and Nsudde areas in the north central and south eastern zones of the country respectively
(MSMD, 2010). According to Obaje (2009), Koton Karfi hosts prominent ironstone bodies
requiring detailed investigation. The ironstone deposits cap hills and table lands around Koton
Karfi.
Tattam (1943), suggested that the sediments outcropping at the south‒eastern end of the Bida Basin
(Figure 1), are laterally continuous with beds in the Anambra Basin occurring at the stratigraphical
level of the Enugu Shale and Adeleye (1973) regarded the Patti Formation and Lokoja Sandstone
as the lateral equivalents of the Mamu Formation and Enugu Shales respectively. Adeleye (1973)
correlated the Batati/Agbaja ironstones with the Dukamaje Formation in the Sokoto Basin,
concluding that the Bida Basin was affected by a Maastrichtian transgression advancing from the
northwest.
Adeleye (1973) and Oresajo (1979) suggested a synsedimentary origin for the ironstones because
their depositional characteristics and relationship with other sediments of the Bida Basin show that
the ooids were formed within a high energy domain. The lateritic model was first postulated due
to the absence of fossils in the ironstone beds (Du Preez, 1956), and to the presence of iron oxide
and hydroxide in the ooids (Jones, 1955, 1958; Kogbe, 1978).

© 2019 JETIR December 2019, Volume 6, Issue 12 www.jetir.org (ISSN-2349-5162)
JETIR1912016 Journal of Emerging Technologies and Innovative Research (JETIR) www.jetir.org 114
Ladipo et al. (1988, 1993); Mucke (1993) and Mucke et al. (1994) suggested a post‒diagenetic iron enrichment
for the ironstone deposits. This survey thus focuses on the mineralization of ironstone in the study area due to
recent specialized industrial demands for the ore. Various analyses will reveal the mineralization pattern of the
ore. This is achieved by carrying out intensive geochemical and petrographic studies of the ironstone samples.
1.1 Location and Accessibility
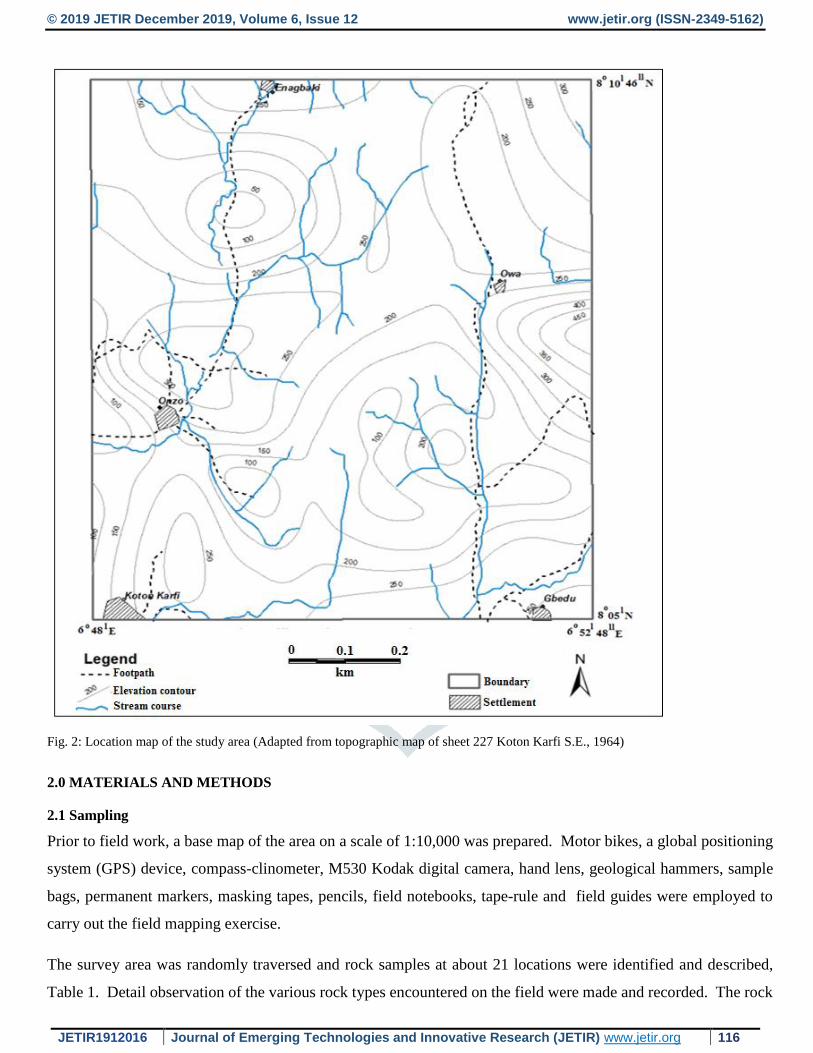
The study area is located along the Abuja-Lokoja road, around Koton Karfi, southern Bida Basin; with longitude
6°48ʹ00ʺ E to 6°52ʹ48ʺ E and latitude 8°05ʹ00ʺ N to 8°10ʹ46ʺ N, covering an area of 96.8 km2 and accessible through
footpaths as shown in Figure 2.
Two distinct climatic conditions mark the survey area; which are the annual wet and dry season periods. The wet
season influenced by the tropical maritime winds, is experienced during the months of March to October, with
mean annual rainfall of 1560 mm. The dry season is influenced by the northeasterly Harmattan winds which
prevail between the months of November to February. Humidity during this period ranges from about 30% to
35% and the area is usually characterized by dusty haze (Oguntoyinbo, 1978). After the departure of the
Harmattan and in the absence of rain, the hot sunny season with temperatures exceeding 27°C sets in. The mean
annual temperature of the area is 20°C (Balogun, 2000). The study area falls within the woodland savannah
vegetation belt (Abimbola, 1994). Typified by high grass, shrubs and low trees. Within the study area, vegetation
changes with season, in the wet season it flourishes while in the dry season much of it withers and dies. Along
the stream courses where the soil is wet, thicker vegetation called fringing forest is found (Oguntoyinbo, 1978).

© 2019 JETIR December 2019, Volume 6, Issue 12 www.jetir.org (ISSN-2349-5162)
JETIR1912016 Journal of Emerging Technologies and Innovative Research (JETIR) www.jetir.org 115
Fig.1 Geological map of Nigeria showing the Bida Basin (Adapted: Akpan et al., 2016)
The survey area is characterized by irregular ridges, steep hills and table lands. Elevation ranges from about 200
m to 300 m. The table lands are capped by laterites which support little vegetation. Edges of the hills form sharp
escarpment with occasional break in slope, indicative of the influence of erosion and presence of resistant
indurated sandstone beds. The area is drained by the flood plain of river Niger marked by elongated ponds and
streams (Oguntoyinbo, 1978). Flow pattern is in the habit of branching tree roots, such that tributaries branch out
from streams in different directions; mostly at acute angles, (Figure 2).
© 2019 JETIR December 2019, Volume 6, Issue 12 www.jetir.org (ISSN-2349-5162)
JETIR1912016 Journal of Emerging Technologies and Innovative Research (JETIR) www.jetir.org 116
Fig. 2: Location map of the study area (Adapted from topographic map of sheet 227 Koton Karfi S.E., 1964)
2.0 MATERIALS AND METHODS
2.1 Sampling
Prior to field work, a base map of the area on a scale of 1:10,000 was prepared. Motor bikes, a global positioning
system (GPS) device, compass-clinometer, M530 Kodak digital camera, hand lens, geological hammers, sample
bags, permanent markers, masking tapes, pencils, field notebooks, tape-rule and field guides were employed to
carry out the field mapping exercise.
The survey area was randomly traversed and rock samples at about 21 locations were identified and described,
Table 1. Detail observation of the various rock types encountered on the field were made and recorded. The rock
© 2019 JETIR December 2019, Volume 6, Issue 12 www.jetir.org (ISSN-2349-5162)
JETIR1912016 Journal of Emerging Technologies and Innovative Research (JETIR) www.jetir.org 117
types and locations were indicated on the base map with the aid of pencil and protractor. Various structural features
that characterized the rock types were measured using the compass and the values recorded in the field notebook.
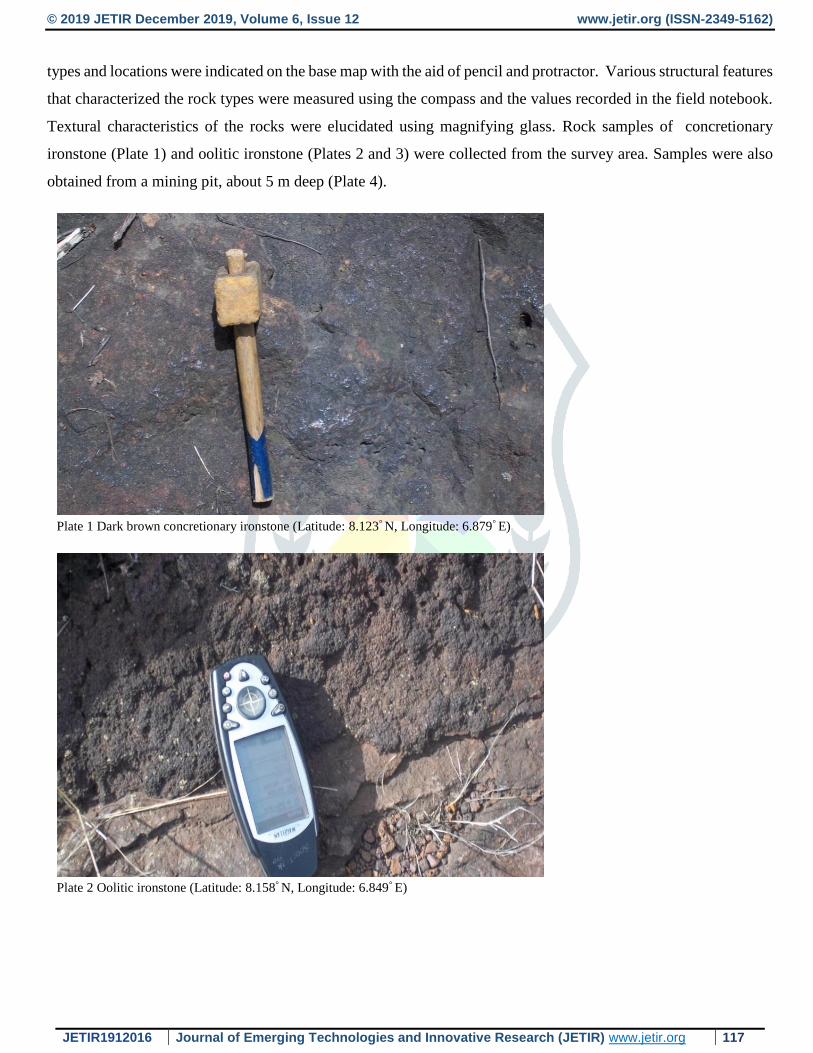
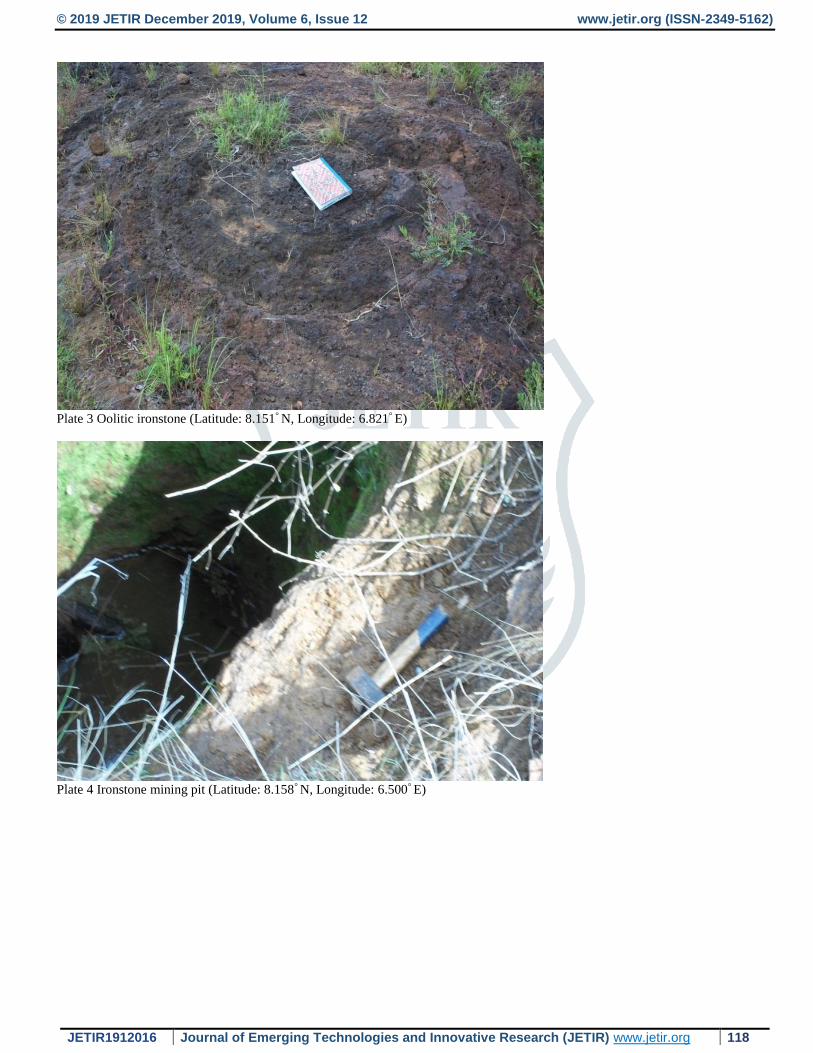
Textural characteristics of the rocks were elucidated using magnifying glass. Rock samples of concretionary
ironstone (Plate 1) and oolitic ironstone (Plates 2 and 3) were collected from the survey area. Samples were also
obtained from a mining pit, about 5 m deep (Plate 4).
Plate 1 Dark brown concretionary ironstone (Latitude: 8.123° N, Longitude: 6.879° E)
Plate 2 Oolitic ironstone (Latitude: 8.158° N, Longitude: 6.849° E)
© 2019 JETIR December 2019, Volume 6, Issue 12 www.jetir.org (ISSN-2349-5162)
JETIR1912016 Journal of Emerging Technologies and Innovative Research (JETIR) www.jetir.org 118
Plate 3 Oolitic ironstone (Latitude: 8.151° N, Longitude: 6.821° E)
Plate 4 Ironstone mining pit (Latitude: 8.158° N, Longitude: 6.500° E)

© 2019 JETIR December 2019, Volume 6, Issue 12 www.jetir.org (ISSN-2349-5162)
JETIR1912016 Journal of Emerging Technologies and Innovative Research (JETIR) www.jetir.org 119
Table 1 Sample locations and their respective longitude and latitude coordinates
S/N Sample
Identification
Longitude
{Decimal
Degree}
Latitude
{Decimal
Degree}
Remark
1 Location 1 6.825 8.158 Brownish concretionary ironstone (obtained from mining pit)
2 Location 2 6.849 8.157 Brownish concretionary ironstone
3 Location 3 6.850 8.156 Weathered and loose brownish ironstone
4 Location 4 6.850 8.149 Small pebbles of brownish ironstones
5 Location 5 6.855 8.151 Fresh pebbles of ironstones, depleted and weathered
6 Location 6 6.855 8.159 Weathered, flat ironstone terrain, reddish brown in colour
7 Location 7 6.857 8.158 Brownish concretionary ironstone
8 Location 8 6.860 8.157 Brownish concretionary ironstone
9 Location 9 6.860 8.156 Slightly weathered ironstones with grassy vegetation
10 Location 10 6.849 8.158 Brownish concretionary ironstone
11 Location 11 6.838 8.158 Brownish concretionary ironstone
12 Location 12 6.842 8.152 Brownish concretionary ironstone
13 Location 13 6.846 8.138 Brownish concretionary ironstone
14 Location 14 6.821 8.151 Massive ironstone, relatively fresh exposed surface
15 Location 15 6.814 8.121 Brownish concretionary ironstone
16 Location 16 6.805 8.144 Brownish concretionary ironstone
17 Location 17 6.847 8.099 Brownish concretionary ironstone
18 Location 18 6.867 8.105 Dark brownish Oolitic ironstone, sample collected along water channel
19 Location 19 6.873 8.106 Dark brownish Oolitic ironstone
20 Location 20 6.849 8.158 Dark brownish Oolitic ironstone
21 Location 21 6.879 8.123 Brownish concretionary ironstone
2.2 Methodology of Samples Analysis
2.2.1 X-Ray Fluorescence Spectrometric Analysis
This exercise was carried out at the National Geoscience Research Labouratory Centre, Kaduna, Nigeria.
Ironstone samples were crushed and grind to pass 150 mesh sieves (British standard). The powdered sample was
loaded in a sample cup of the MiniPal4 x-ray fluorescence spectrometer model. Sample cups were identified with
position numbers. The sample cup containing the powdered content was placed in a sample holder of the machine
at a specific position, with position numbers ranging from 1‒12. On selection of the specified position number;
the spectrometer will rotate and bring the cup under x‒ray focus. The x‒ray bombards the sample and gives the
result. The principle of measurement used is the Bragg’s Law given by Bragg (1913):
nλ = 2d sin θ (1)
where,
n = whole number
λ = wavelength of the element
d = spacing between successive planes of atoms
θ = compliment of the optical angle of incidence and reflection, that is 900 minus the angle of incidence.
© 2019 JETIR December 2019, Volume 6, Issue 12 www.jetir.org (ISSN-
2349-5162)
JETIR1912016 Journal of Emerging Technologies and Innovative Research (JETIR) www.jetir.org 120
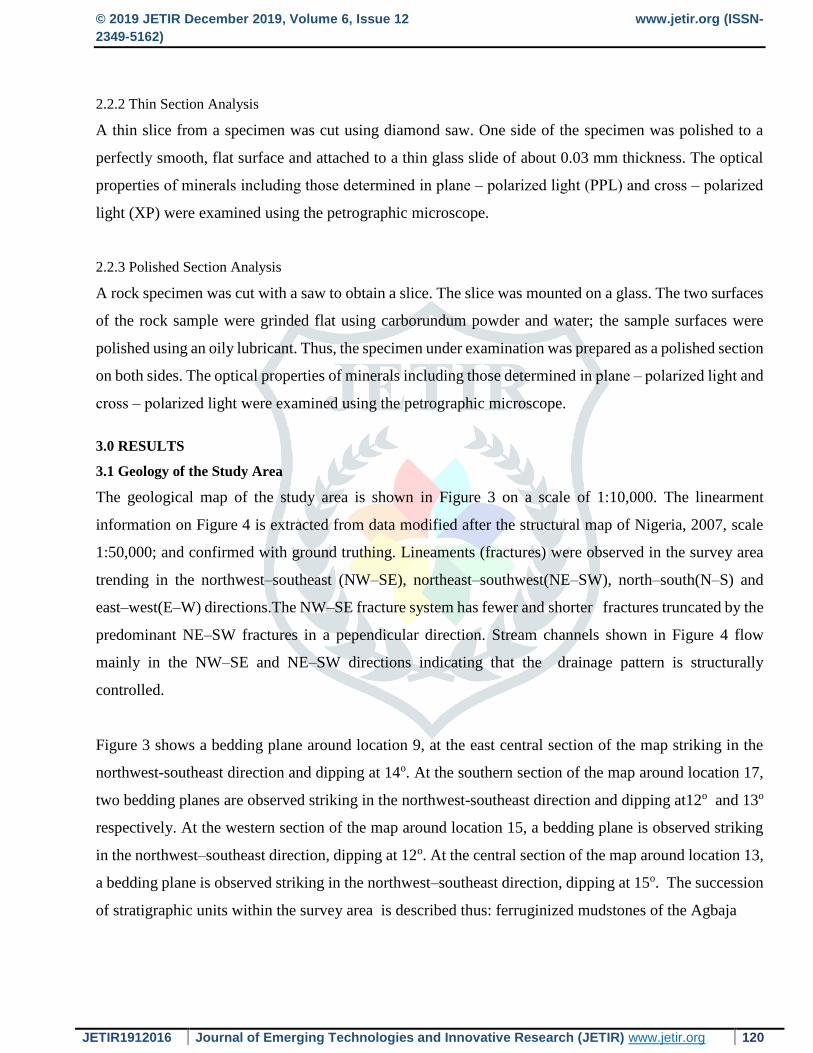
2.2.2 Thin Section Analysis
A thin slice from a specimen was cut using diamond saw. One side of the specimen was polished to a
perfectly smooth, flat surface and attached to a thin glass slide of about 0.03 mm thickness. The optical
properties of minerals including those determined in plane ‒ polarized light (PPL) and cross ‒ polarized
light (XP) were examined using the petrographic microscope.
2.2.3 Polished Section Analysis
A rock specimen was cut with a saw to obtain a slice. The slice was mounted on a glass. The two surfaces
of the rock sample were grinded flat using carborundum powder and water; the sample surfaces were
polished using an oily lubricant. Thus, the specimen under examination was prepared as a polished section
on both sides. The optical properties of minerals including those determined in plane ‒ polarized light and
cross ‒ polarized light were examined using the petrographic microscope.
3.0 RESULTS
3.1 Geology of the Study Area
The geological map of the study area is shown in Figure 3 on a scale of 1:10,000. The linearment
information on Figure 4 is extracted from data modified after the structural map of Nigeria, 2007, scale
1:50,000; and confirmed with ground truthing. Lineaments (fractures) were observed in the survey area
trending in the northwest–southeast (NW–SE), northeast–southwest(NE–SW), north–south(N–S) and
east–west(E–W) directions.The NW–SE fracture system has fewer and shorter fractures truncated by the
predominant NE–SW fractures in a pependicular direction. Stream channels shown in Figure 4 flow
mainly in the NW–SE and NE–SW directions indicating that the drainage pattern is structurally
controlled.
Figure 3 shows a bedding plane around location 9, at the east central section of the map striking in the
northwest-southeast direction and dipping at 14o. At the southern section of the map around location 17,
two bedding planes are observed striking in the northwest-southeast direction and dipping at12o and 13o
respectively. At the western section of the map around location 15, a bedding plane is observed striking
in the northwest–southeast direction, dipping at 12o. At the central section of the map around location 13,
a bedding plane is observed striking in the northwest–southeast direction, dipping at 15o. The succession
of stratigraphic units within the survey area is described thus: ferruginized mudstones of the Agbaja

© 2019 JETIR December 2019, Volume 6, Issue 12 www.jetir.org (ISSN-2349-5162)
JETIR1912016 Journal of Emerging Technologies and Innovative Research (JETIR) www.jetir.org 121
Fig. 3 Geological map of the study area

© 2019 JETIR December 2019, Volume 6, Issue 12 www.jetir.org (ISSN-2349-5162)
JETIR1912016 Journal of Emerging Technologies and Innovative Research (JETIR) www.jetir.org 122
Fig. 4: Structural geology and ironstone mineralization map of the study area
Formation (NPss) overlying the sandstones, claystones and shales of the Patti Formation (Lass)
which overlies the feldspathic sandstones and siltstones of the Lokoja Formation (Nsh). The
Agbaja and Patti Formations are Maastrichtian in age; the Lokoja Formation is Campanian in age,
Olabode, 2016. This stratigraphic succession is inferred from lithologic units observed from dried
up stream channels and road cuttings within the study area. Figure 4 shows a northeast-southwest
trending fabric of ironstone mineralised sections in the study area, suggesting a structurally
controlled ironstone mineralization.

© 2019 JETIR December 2019, Volume 6, Issue 12 www.jetir.org
(ISSN-2349-5162)
JETIR1912016 Journal of Emerging Technologies and Innovative Research (JETIR) www.jetir.org 123
3.2 Geochemical Analysis
The concentration of Al2O3 ranges from 0.38% to 17.00%, with an average value of 8.49%. SiO2
concentration ranges from 1.06% to 8.80%, with an average value of 4.32%. Fe2O3 content ranges
from 74.00% to 94.04%, with an average value of 83.52%. Concentration of P2O5 ranges from
1.00% to 3.50% with an average value of about 2.32%. MnO content ranges from 0.08% to 8.44%
with an average value of about 0.764% (Table 2). K2O, Cr2O3, NiO2, ZnO, La2O3, SrO, CuO,
Nd2O3, Re2O7 and PbO generally have concentration less than 0.10%. Table 3 shows the
composition of the later mentioned set of oxides expressed in parts per million (ppm).
3.3 Rhodonite and Wollastonite formation associated with ferruginization
Fe2O3—Al2O3—SiO2 ternary map is shown in Figure 5 suggesting that unferruginization tends
towards formation of alumina in the B—horizon, Zamanian et al., 2015. The brown corner is made
up of silica. Various mineralization associated with the Fe2O3—Al2O3—SiO2 ternary model is
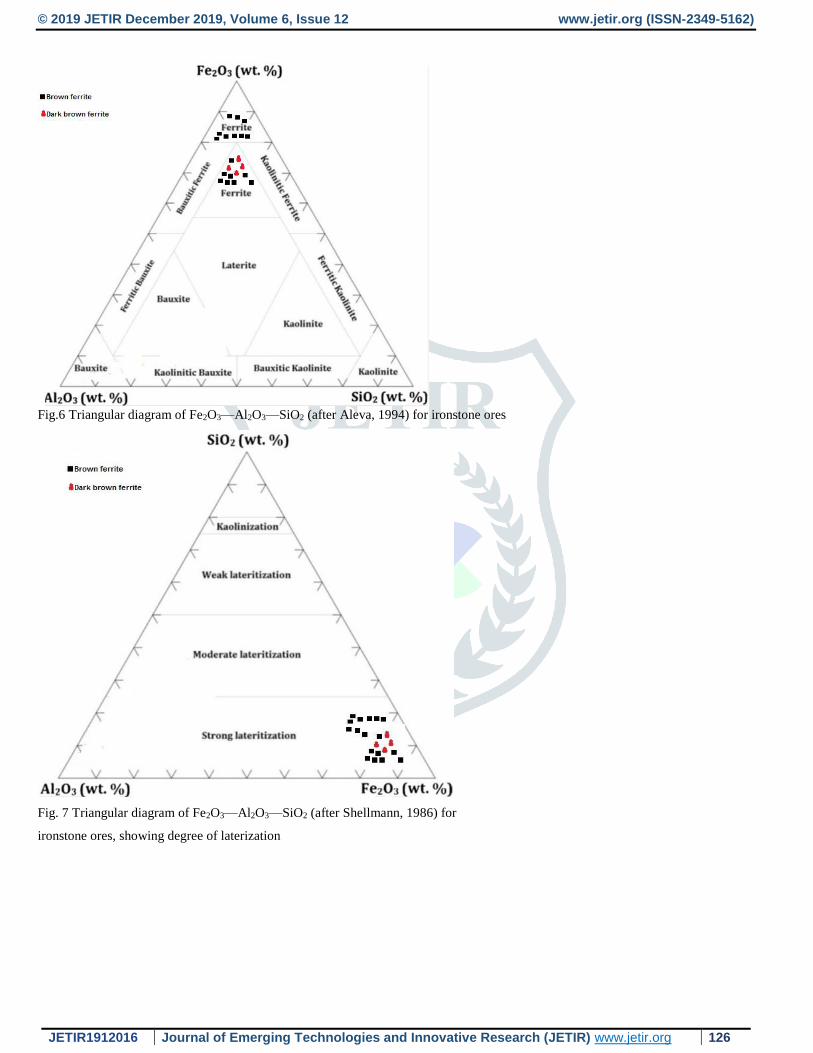
shown in Figure 6. Levels of laterization are illustrated in Figure 7. In the B—horizon, if Fe is
being substituted by Mn, the mineral rhodonite (MnSiO3), would be formed, Figure 8 ;( Johnson
et al., 2005, Wilkinson and Humphreys, 2005). MnO is often nonstoichiometric, (Zamanian et al.,
2015).
MnO + SiO2 → MnSiO3
Fe2O3—CaO—SiO2 ternary map is shown in Figure 9. CaO (calcia) minerals are very susceptible
to weathering and leaching thereby leaving behind iron and alumina which are more resistive to
weathering and leaching to form iron-related minerals such as hematite and goethite. Hence,
increase in ferruginization and calsilicate content tends towards formation of wollastonite
(CaSiO3) in the B—horizon (Wilkinson and Humphreys, 2005).

© 2019 JETIR December 2019, Volume 6, Issue 12 www.jetir.org (ISSN-2349-5162)
JETIR1912016 Journal of Emerging Technologies and Innovative Research (JETIR) www.jetir.org 124
Table 2 Composition of oxide constituents of ironstones displayed in weight percentage (wt %)
CaO + SiO2 → CaSiO3
3.4 Differential accumulation of iron and manganese in relation to SiO2/Al2O3 ratio
According to Furukawa et al. 1976, the differential concentration of either iron or manganese in ironstones as
expressed by a ratio (termed iron-manganese ratio), Fe2O3/ (Fe2O3+MnO) is positively correlated with the ratio
SiO2/Al2O3, all contents expressed in percentages shown in

© 2019 JETIR December 2019, Volume 6, Issue 12 www.jetir.org (ISSN-2349-5162)
JETIR1912016 Journal of Emerging Technologies and Innovative Research (JETIR) www.jetir.org 125
Table 3 Composition of oxide constituents of the ironstones displayed in parts per million (ppm)
Fig. 5 Ternary map of wt. % (Fe2O3, Al2O3 and SiO2) composition
© 2019 JETIR December 2019, Volume 6, Issue 12 www.jetir.org (ISSN-2349-5162)
JETIR1912016 Journal of Emerging Technologies and Innovative Research (JETIR) www.jetir.org 126
Fig.6 Triangular diagram of Fe2O3—Al2O3—SiO2 (after Aleva, 1994) for ironstone ores
Fig. 7 Triangular diagram of Fe2O3—Al2O3—SiO2 (after Shellmann, 1986) for
ironstone ores, showing degree of laterization

© 2019 JETIR December 2019, Volume 6, Issue 12 www.jetir.org (ISSN-2349-5162)
JETIR1912016 Journal of Emerging Technologies and Innovative Research (JETIR) www.jetir.org 127
Fig. 8 Ternary map of wt. % (Fe2O3, MnO and SiO2) composition
Fig. 9 Ternary map of wt. % (Fe2O3, CaO and SiO2) composition

© 2019 JETIR December 2019, Volume 6, Issue 12 www.jetir.org (ISSN-2349-5162)
JETIR1912016 Journal of Emerging Technologies and Innovative Research (JETIR) www.jetir.org 128
Table 4. The ratios are plotted on log−log coordinates shown in Figure 10. The positive correlation infers increase
in iron relative to decrease in manganese content as the silica decreases
Table 4 Accumulation of Fe2O3 in relation to MnO, SiO2 and Al2O3, after Furukawa et al. 1976
Sample
ID
SiO2/Al2O3
(A)
Fe2O3/
(Fe2O3+MnO)
(B)
CaO+K2O
(C)
A/C B/C Log(A/C) Log(B/C)
Loc 1 0.21 0.989 0.27 0.763 3.662 -0.118 0.564
Loc 2 0.60 0.997 0.30 2.000 3.325 0.301 0.522
Loc 3 0.24 0.987 0.42 0.567 2.349 -0.246 0.371
Loc 4 1.12 0.998 0.24 4.667 4.160 0.669 0.619
Loc 5 0.15 0.995 0.38 0.388 2.619 -0.411 0.418
Loc 6 0.53 0.996 0.33 1.616 3.019 0.208 0.480
Loc 7 0.21 0.999 0.20 1.060 4.993 0.025 0.698
Loc 8 1.04 0.994 0.38 2.730 2.615 0.436 0.417
Loc 9 0.97 0.998 0.21 4.626 4.753 0.665 0.677
Loc 10 0.30 0.998 0.30 0.993 3.327 -0.003 0.522
Loc 11 3.68 0.999 0.38 9.695 2.628 0.987 0.420
Loc 12 0.86 0.998 0.33 2.597 3.025 0.415 0.481
Loc 13 0.55 0.998 0.31 1.770 3.220 0.248 0.508
Loc 14 0.56 0.998 0.44 1.263 2.269 0.101 0.356
Loc 15 0.63 0.997 0.27 2.346 3.694 0.370 0.568
Loc 16 0.19 0.998 0.20 0.953 4.988 -0.021 0.698
Loc 17 0.39 0.998 0.18 2.141 5.545 0.331 0.744
Loc 18 0.00 0.998 0.23 0.000 4.339 0.000 0.637
Loc 19 0.88 0.971 0.25 3.520 3.885 0.547 0.589
Loc 20 0.32 0.999 0.73 0.444 1.369 -0.353 0.136
Loc 21 0.26 0.901 0.80 0.319 1.127 -0.496 0.052
Fig. 10: Accumulation of Fe2O3 in relation to MnO, SiO2 and Al2O3 (after Furukawa et al., 1976)
relative to alumina. This result accords with the fact that iron oxides are relatively immobile compared to
manganese oxides (Furukawa et al., 1976).
3.5 Deleterious constituents of ironstones
The deleterious constituents of ironstones include P2O5, K2O, Al2O3, SiO2, S, ZnO and MnO. Figure 11 shows
the deleterious constituents and their concentration at sampling points. Sulfur content is below detection limit in
all the samples, probably due to iron enrichment in highly

© 2019 JETIR December 2019, Volume 6, Issue 12 www.jetir.org (ISSN-2349-5162)
JETIR1912016 Journal of Emerging Technologies and Innovative Research (JETIR) www.jetir.org 129
Fig. 11 Al2O3, SiO2, P2O5 CaO, MnO and Fe2O3 concentration in ironstones at the sampling points
non‒reducing environments. The diagram shows an increase in Fe2O3 content; and decrease in the concentration
of Al2O3 from locations 1 to 3. At location 7, the concentration of Fe2O3 decreases to 77% while Al2O3 increases
to 15.2 %. This trend continues up to location 21, indicating iron enrichment may be accompanied by depletion
in alumina content probably due to weathering of rocks and replacement of elements during the ferruginization
process. The sample at location 18 exhibited 92% Fe2O3 concentration and zero P2O5 content implying that iron
enrichment may tend toward de-phosphorization.
Generally, every rise in Fe2O3 content is accompanied by a corresponding decrease in SiO2 concentration and
vice versa. This may imply that iron enrichment is accompanied by desilication probably due to weathering of
rocks and replacement of elements during the ferruginization process. Desilication (or desilicification) is the
removal of silicon from a soil horizon, relative to some less mobile component or components. Characteristic of
pedogenesis in the tropics where silicon tends to be more mobile than iron and aluminum in well drained soils.
The process is active in the formation of ferrallitic soils, laterites and bauxites, Zamanian et al., 2015.
3.6 Thin Section Petrographic Analysis
Petrographic studies were carried out on thin sections of specimens from locations (2, 5, 6, 7, 11, 17, 18 and 19).
IM denotes iron oxide minerals and Q signifies quartz. Figure 12 (2, 5, 6, 7, 17, and 19) shows the ooidal pack-
ironstone petrographic variety having radial structure with concentric laminations. The ooidal pack-ironstone is
characterized by spherical, oblong and fragmented ooids. The ooids have nuclei with dark brown colour seen
under plane polarized light or grey colour observed under cross polarized light. Peloids are also observed
cemented by grains of ferruginous quartzite (Q) of the Itabirite type. Concentric laminae of goethite ooids may
form several discrete zones of goethite suggesting iron enrichment zones, Figure 12{5}. Well sorted ooids and
loosely parked ooids are shown in Figure 12{17 and 19}.

© 2019 JETIR December 2019, Volume 6, Issue 12 www.jetir.org
(ISSN-2349-5162)
JETIR1912016 Journal of Emerging Technologies and Innovative Research (JETIR) www.jetir.org 130
Figure 13{11 and 18} indicates detrital mud-ironstone petrographic variety, with brownish
framboids of goethite after siderite, Figure 13{11} or fragmented brownish pseudomorphs of
hematite after Itabirite, Figure 13{18}. Major mineral constituents include hematite and goethite.
Quartz (Q) is also observed. The regular or irregular desiccation cracks are not mineralized.
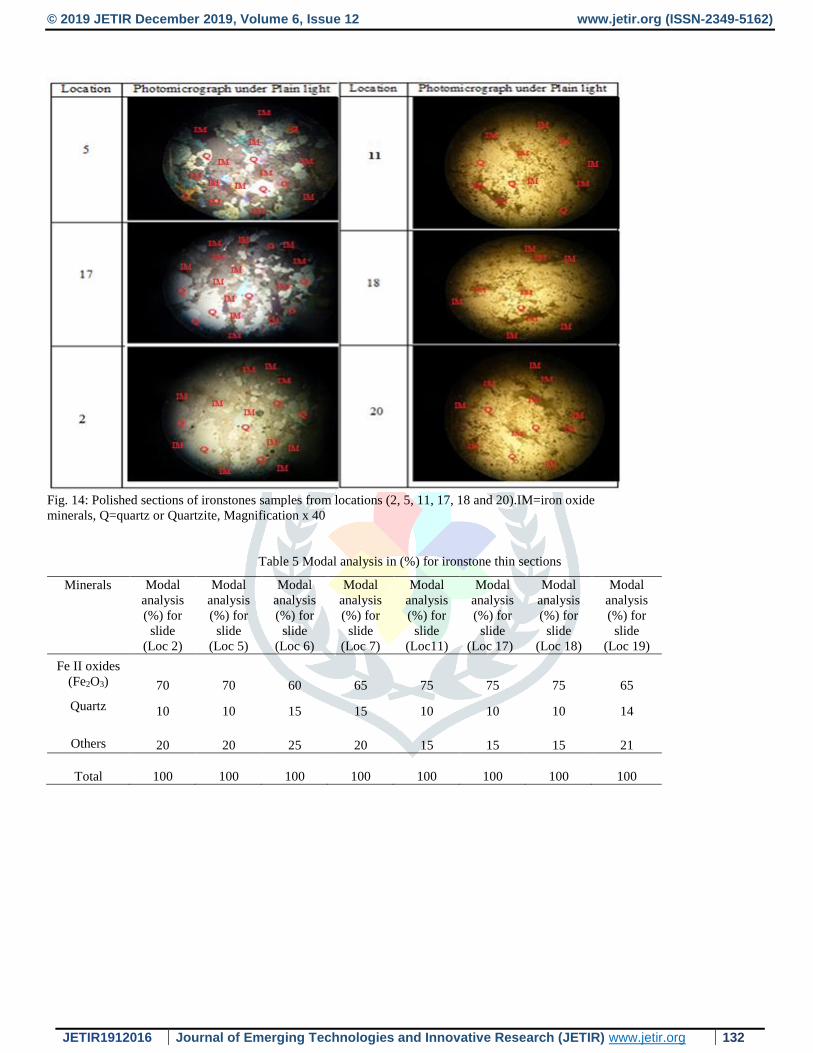
3.7 Petrographic Analysis of Polished Sections
Polished slabs of detrital mud-ironstones are shown in Figure 14 (11, 18 and 20). Microscopic
analyses of the ironstones reveal a botryoidal texture with brownish poorly sorted zones of
hematite (IM) in Figure 14 (18 and 20). Ferruginous quartzite (Q) of the Itabirite type is also
observed. The crystal system is trigonal. Bireflectance is weak with distinct anisotropy. Polishing
hardness is less than pyrite.
Polished slabs of ooidal park-ironstones are shown in Figure 14 (2, 5 and 17). Petrographic
analyses of the specimens reveal a botryoidal texture with angular grains of quartz (Q) and clusters
of pseudomorphs of goethite after siderite (IM). Colour of the slab is bluish-grey while the crystal
system is orthorhombic with a weak bireflectance. Polishing hardness is less than pyrite.
3.8 Modal Analysis of Ironstone Samples
Modal analysis of the thin sections, (Table 5) shows the ironstones having quartz mineral
population less than 20%. The grains of quartz are angular in samples: Figure 12 (2, 5, 6, 7, 17 and
19) and Figure 13 (11 and 18); implying that they have not travelled far while the iron minerals
acted as the cementing materials binding the grains together. The grains of quartz are rounded in
Figure 12 {7}; signifying that they have travelled far while the iron minerals acted as the cementing
materials binding the grains together.
Modal analysis of polished sections, (Table 6) shows the ironstones having quartz mineral
population less than 20%. The grains of the quartz are angular and un-zoned in Figure 14 (2, 5, 11,
18 and 20); indicating that they have not travelled far while the iron minerals acted as the
cementing materials binding the grains together.

© 2019 JETIR December 2019, Volume 6, Issue 12 www.jetir.org (ISSN-2349-5162)
JETIR1912016 Journal of Emerging Technologies and Innovative Research (JETIR) www.jetir.org 131
Fig. 12 Thin sections of ironstone samples from locations (2, 5, 6, 7, 17 and 19). IM = iron oxide minerals,
Q=quartz, Magnification x 40
Fig. 13 Thin sections of ironstones samples from locations (11 and 18). IM = iron oxide
minerals, Q=quartz, Magnification x 40
4.0 DISCUSSION AND CONCLUSION
4.1 Discussion
Drainage system of the study area is of the dendritic pattern and structurally controlled. The northwest-southeast
fracture trend constitutes the conjugate trend to the northeast-southwest direction. The former trend is observed to
be younger, being perpendicular, fewer and often truncate the northeast-southwest fracture system.
© 2019 JETIR December 2019, Volume 6, Issue 12 www.jetir.org (ISSN-2349-5162)
JETIR1912016 Journal of Emerging Technologies and Innovative Research (JETIR) www.jetir.org 132
Fig. 14: Polished sections of ironstones samples from locations (2, 5, 11, 17, 18 and 20).IM=iron oxide
minerals, Q=quartz or Quartzite, Magnification x 40
Table 5 Modal analysis in (%) for ironstone thin sections
Minerals
Modal
analysis
(%) for
slide
(Loc 2)
Modal
analysis
(%) for
slide
(Loc 5)
Modal
analysis
(%) for
slide
(Loc 6)
Modal
analysis
(%) for
slide
(Loc 7)
Modal
analysis
(%) for
slide
(Loc11)
Modal
analysis
(%) for
slide
(Loc 17)
Modal
analysis
(%) for
slide
(Loc 18)
Modal
analysis
(%) for
slide
(Loc 19)
Fe II oxides
(Fe2O3) 70 70 60 65 75 75 75 65
Quartz 10 10 15 15 10 10 10 14
Others 20 20 25 20 15 15 15 21
Total 100 100 100 100 100 100 100
100

© 2019 JETIR December 2019, Volume 6, Issue 12 www.jetir.org (ISSN-2349-5162)
JETIR1912016 Journal of Emerging Technologies and Innovative Research (JETIR) www.jetir.org 133
Table 6 Modal analysis in (%) for ironstone polished sections
Minerals
Modal
analysis
(%) for
slide
(Loc 5)
Modal
analysis
(%) for
slide
(Loc 17)
Modal
analysis
(%) for
slide
(Loc 11)
Modal
analysis
(%) for
slide
(Loc 2)
Modal
analysis
(%) for
slide
(Loc18)
Modal
analysis
(%) for
slide
(Loc 19)
Fe II oxides
(Fe2O3) 65 55 60 70 80 70
Quartz 10 20 20 15 10 15
Others 25 25 20 15 10 15
Total 100 100 100 100 100 100
The study area comprises fine to coarse grained well sorted ferruginous sandstones, mud-stones,
quartz, feldspar, and siltstones of the Patti Formation intercalated with sandstone facies. The
ironstone Formation comprises two units namely pack-ironstone and mud-ironstone. Two
petrographic varieties were identified viz: the ooidal pack-ironstone and detrital mud-ironstone.
Spherical, oblong and fragmented ooids of pack-ironstone have complex mineralogy described by
their cortex and nuclei. Minerals of the ooids are goethite, hematite and ferruginous quartzite of
the Itabirite type. The core of the ooids is also made up of pseudomorphs of goethite after siderite
or pseudomorphs of hematite after siderite.
Enrichment of the ooids resulted in the formation of minerals such as hematite and goethite. Adv
ancing replacement and infilling of open space are common iron enrichment mechanisms in the
ironstones. Irregular cavities within the ironstone matrix exhibit botryoidal texture while those
created in the ooids are sometimes filled with milky white phosphorus mineral bolivarite and quartz
which occur as disseminations within the goethitic matrix and veins of pack-ironstone and detrital
mud-ironstones.
4.2 Conclusion
Iron enrichment is accompanied by a corresponding depletion of Al2O3 and SiO2, moderate to extreme
reduction of CaO, K2O, V2O5, Cr2O3, Eu2O3, NiO2, MnO, ZnO, La2O3, SrO, BaO, CuO, Nd2O3, Re2O7,
PbO and a significant gain in P2O5, probably due to weathering. The significant depletion of these oxides
with increasing ferruginization can be inferred to be a supergene nature of the replacement process. The
replacement process can be described as desilication and depletion of alumina plus iron enrichment.
The high Fe2O3 concentration, zero sulfur content and generally low MnO and K2O concentration suggest
the ironstones as having minimal deleterious constituents.

© 2019 JETIR December 2019, Volume 6, Issue 12 www.jetir.org (ISSN-2349-5162)
JETIR1912016 Journal of Emerging Technologies and Innovative Research (JETIR) www.jetir.org 134
ACKNOWLEDGEMENT
All the glory belong to God. The authors are grateful for the invaluable support provided by the staff of Geology
and Mining Department, Nasarawa State University, Keffi, Nigeria. The geochemical analysis by the staff of
National Geoscience Research Labouratory Centre, Kaduna, Nigeria is highly appreciated.
REFERENCES
Abimbola, A. F. 1994. Mineralogical and geochemical studies of Agbaja ironstone Formation Nupe Basin Central
Nigeria, Ph.D. Thesis, University of Ibadan.
Adeleye, D. R. 1973. Origin of ironstones, an example from Middle Niger Valley, Nigeria, Jour. of Sed
. Petrol., 43, 709 – 727.
Aleva, G.J.J.1994. Laterites: Concepts, Geology, Morphology and Chemistry. International Soil Reference and
Information Centre (ISRIC), Waganingen, The Netherlands, 169.
Balogun, O. Y. 2000. Senior Secondary Atlas. 2nd Edn, Nigeria: Longman.
Bragg, W.L.1913. The diffraction of short electromagnetic waves by a crystal. Proceedings of the Cambridge
Philosophical Society, 17, 43–57.
Chard, J. 1995. Making Iron and Steel: The Historic Processes, 1700-1900 Ringwood, NJ: North Jersey Highlands
Historical Society.
Du Preez, J. W. 1956. Origin, classification and distribution of laterites. Proc African Confr. Ibadan
(3rd), 223 – 234.
Furukawa, H., Handawella, J., Kyuma, K., & Kawaguchi, K. 1976. Chemical, mineralogical and micro
morphological properties of glaebules in some tropical lowland soils. Southeast Asian Studies, 13 (3), 1–
24.
Johnson, D.L., Domier, E.J. and Johnson, D.N. 2005. Reflections on the nature of soil and its biomantle. Annals,
Association of American Geographers, 95 (1), 11–31.
Jones, H. A. 1955. The occurrence of oolitic ironstones in Nigeria: Their origin, geological history and
petrology. Ph.D. Thesis, Oxford University, 232.
Jones, H. A. 1958. The oolitic ironstones of Agbaja Plateau, Kabba Province. Records of the Geol. Sur.
Nigeria, 20 – 43.
Kogbe, C. A. 1978. Origin and composition of the ferruginous oolites and laterites of NW Nigeria. Geol. Rundsch
Band 67, Hert 2, 662 – 674.
Ladipo, K. O., Akande, S. O. and Mucke, A. 1988. Depositional environments, ore microscopy and origin
of the Agbaja oolitic ironstone: Abstr. Vol. NMGS, 15.
© 2019 JETIR December 2019, Volume 6, Issue 12 www.jetir.org (ISSN-2349-5162)
JETIR1912016 Journal of Emerging Technologies and Innovative Research (JETIR) www.jetir.org 135
Ladipo, K. O., Akande, S. O. and Mucke, A. 1993. Genesis of oolitic ironstone from the Middle Niger
sedimentary Basin: evidence from sediment logical ore microscopic and geochemical studies, Jour. Min.
Geol.
Ministry of Mines and Steel Development. 2010. Iron ore exploration opportunities in Nigeria.
Mucke, A. 1993. Post – diagenetic ferruginization of sedimentary rocks (sandstones, oolitic ironstones,
kaolins and bauxites) including a comparative study of the reddening of red Beds. In: Development of sed.,
Diagenesis, 4.
Mucke, A., Ogunbajo, M. I. and Shekwolo, P. D. 1994. The Phanerozoic ironstones of the Bida Basin, Nigeria:
Their mineralogy and genesis, Abstr. Vol., NMGS.
Obaje, N. G. 2009. Geology andMineral resources of Nigeria London: Springer,
1-100.
Obaje, N. G., Musa, M. K., Odoma, A. N. and Hamza, H. 2011. The Bida Basin in north-central Nigeria:
sedimentology and petroleum geology. Journal of Petroleum and Gas Exploration Research, 1(1), 001 –
013.
Oguntoyinbo, J. S. 1978. Reflection coefficient of natural vegetation crops and urban surfaces in Nigeria. Quart.
Jour. Royal Met. Soc. 96, 430 – 441.
Olabode, S. O. 2016. Soft sediment deformation structures in the Maastrichtian Patti Formation, southern Bida
Basin Nigeria: Implications for the assessment of endogenic triggers in the Maastrichtian sedimentary
record, Open Journal of Geology, 6, 410–438.
Oresajo, M. O. 1979. Petrology and Geochemistry of Bassan-Nge Ironstone, M.Phil. Thesis, University
of Ibadan, Nigeria.
Shellmann, W. 1986. A new definition of laterite. Mem. Geol. Surv. India. 120:1–7.
Tattam, C. M. 1943. A review of Nigerian stratigraphy. Rep. Geol. Surv., Nigeria
Wilkinson, M.T. and Humphreys, G.S. 2005. Exploring paedogenesis via nuclide-based soil production rates and
OSL-based bioturbation rates, Australian Journal of Soil Research, 43, 767–779.
Zamanian, H., Ahmadnejad, F. and Zarasvandi, A. 2015. Mineralogical and geochemical investigations of the
Mombi bauxite deposit, Zagros Mountain, Iran, Chemieder Erde Geochemistry, 1–25.