· stifel -50%-25% 0% 25% 50% 75% 100% 125% 150% 175% 500 incremental annualized return of s&p...
TRANSCRIPT

Barry B. Bannister, CFA [email protected] (443) 224-1317
Jesse Cantor [email protected] (443) 224-1344
Stifel Equity Trading Desk (800) 424-8870
Market Commentary/Strategy
To QEternal or QExit, that is the Question: the Case Builds for Tapering Soon
We see a slow 12-month QE taper that starts as early as Dec-2013, consensus sees a Mar-2014 taper thatwinds QE down in ~6 months. Catalysts are: a counter-productive shrinkage of Treasury collateral,diminishing effectiveness of adding a constant $85B/month to base money, a need to holster QE before usingit again, and the historical tendency of post-WW II Fed Chairmen not to leave unfinished business. Stockmarket volatility typically jumps after Fed transitions, but despite more volatility we see the S&P 500 ending2014 flat as QE taper lowers the P/E by a percentage that equals the 2014 EPS growth we see, ergo a flatS&P 500. We take our risk with sectors, and since Materials, Energy, Industrials & Technology can do well inthe year before the first rate hike we see a window of opportunity as global GDP returns.
As we stated Oct-3, 2013 on Page 5-6, we see a modest QE taper as early as Dec-2013 that lasts a year, versus
consensus of a Mar-2014 taper that winds QE down more quickly. We show that adding a constant $85B monthly to the
monetary base has diminishing returns (Exhibit 1) and if credit creation is the goal there is little utility in removing 80% of
net Treasury debt issuance (i.e., high quality collateral) on a run-rate basis by 1Q14E (Exhibit 2). Even if the $40B/mo.
Treasury purchases are tapered, we doubt the Fed trims the $45B/mo. MBS QE until 2H14 since net MBS issuance is still
negative and past QE rounds did not end until net MBS issuance turned positive (Exhibit 3).
Another reason we see for commencing taper forthwith is a desire to save QE for later use. While the Fed frames its
communications in terms of objectives (ex., "until X% unemployment”) and time (ex., for a “prolonged period”) we use a
"builder" analogy and believe the Fed has three principal tools: (1) the "Hammer" of QE, (2) the "Bulldozer" of rate policy,
and (3) the "Scaffolding" of Fed-held assets (Exhibit 4-5). We believe the optimal use of the QE hammer - once it is
placed back in the Fed’s tool belt (tapered) - is to surprise the market to achieve maximal effect. This contrasts with rate
policy and stock of assets held, which we believe require more communication to achieve objectives.
In the year before leaving office the eight departing Fed Chairmen since 1948 have uniformly presided over rising policy
interest rates and periods of modest stock market volatility. In contrast, the first year of new Chairmen features a wide
divergence in rates (perhaps due to the human urge of a new Chairman to “do something”?) with spiking stock market
volatility, especially the first ~90 days (Exhibit 6). Though the FFR is currently resting on the zero bound, a higher Fed
Funds Rate (FFR) has already de facto occurred because QE was effectively a “negative” interest rate according to Fed
research that has traveled from minus 5% in late 2009 to about 0% currently (Exhibit 7). Given that FFR history may be
repeating itself, we believe it is reasonable for investors to expect heightened stock market volatility in 1H14.
Despite the bump in volatility we see 2014 as “full of sound and fury, signifying nothing.” Our view of a slow Fed taper that
starts in Dec-2013 and lasts all year to Dec-2014 serves to lower the S&P 500 P/E ratio (Trailing 12-month, Operating) by
~(9)% from 17x to 15.5x in 2014, in our view, given the correlation between QE and P/E (no such correlation exists
between EPS and QE). The Fed is a manipulator of the price of money - interest discount rates - and the P/E is a discount
rate (earnings yield). Multiplying our below Consensus 2014 EPS view of +7% y/y (Street view is +10.7% y/y) results in a
flat S&P 500 (Exhibit 8). The Materials, Energy, Industrials & Technology sectors typically do well in the year before a
rate hike, so we prefer them for a window of opportunity trade 4Q13/1Q14 as global growth returns (Exhibit 9).
November 6, 2013
Market Strategy*******
Stifel does and seeks to do business with companies covered in its research reports. As a result, investors shouldbe aware that the firm may have a conflict of interest that could affect the objectivity of this report. Investorsshould consider this report as only a single factor in making their investment decision.
All relevant disclosures and certifications appear on pages 14 - 15 of this report.

STIFEL
Stifel Macro & Sector Views:
To QEternal or QExit, that is the Question:
the Case Builds for Tapering Soon
November 6, 2013
Barry B. Bannister, CFA
Managing Director, Equity Research – Chief Equity Strategist, Stifel [email protected] 443-224-1317
Stifel does and seeks to do business with companies covered in its research reports. As a result, investors should be aware that the firm may have a conflict of
interest that could affect the objectivity of this report. Investors should consider this report as only a single factor in making their investment decision.
All relevant disclosures and certifications appear on page 14 & 15 of this report.
STIFEL
CLICK HERE FOR VIDEO SUMMARY
Page 2
Market StrategyNovember 6, 2013
STIFEL
-50%
-25%
0%
25%
50%
75%
100%
125%
150%
175%
An
nu
ali
zed
Retu
rn o
f S
&P
500
Incremental annualized return of S&P 500 (price only) per $250B of marketable securities purchased by the Federal
Reserve, Nov-08 to present
-12,000
-10,000
-8,000
-6,000
-4,000
-2,000
0
2,000
4,000
An
nu
ali
ze
d G
row
th in
No
nfa
rm P
ayro
lls
(0
00
's)
Incremental nonfarm payroll growth (at annualized clip, thousands of jobs)* per
$250B of marketable securities purchased by the Federal Reserve, Nov-08 to present
* Interpolated to weekly figures
0.0%
0.5%
1.0%
1.5%
2.0%
2.5%
3.0%
3.5%
4.0%
-5%
0%
5%
10%
15%
20%
25%
30%
35%
40%
Ja
n-1
0
Ap
r-1
0
Ju
l-1
0
Oc
t-1
0
Ja
n-1
1
Ap
r-11
Ju
l-11
Oc
t-11
Ja
n-1
2
Ap
r-1
2
Ju
l-1
2
Oc
t-1
2
Ja
n-1
3
Ap
r-1
3
Ju
l-1
3
Oc
t-1
3
Ja
n-1
4
Total Federal Reserve Assets YoY Change (Left) vs. Core PCE-Deflator 3-Month
Annualized Change (Right)
Source: U.S. Federal Reserve & Bloomberg data. Stifel format.
Barry B. Bannister, CFA Stifel Equity Strategy [email protected]
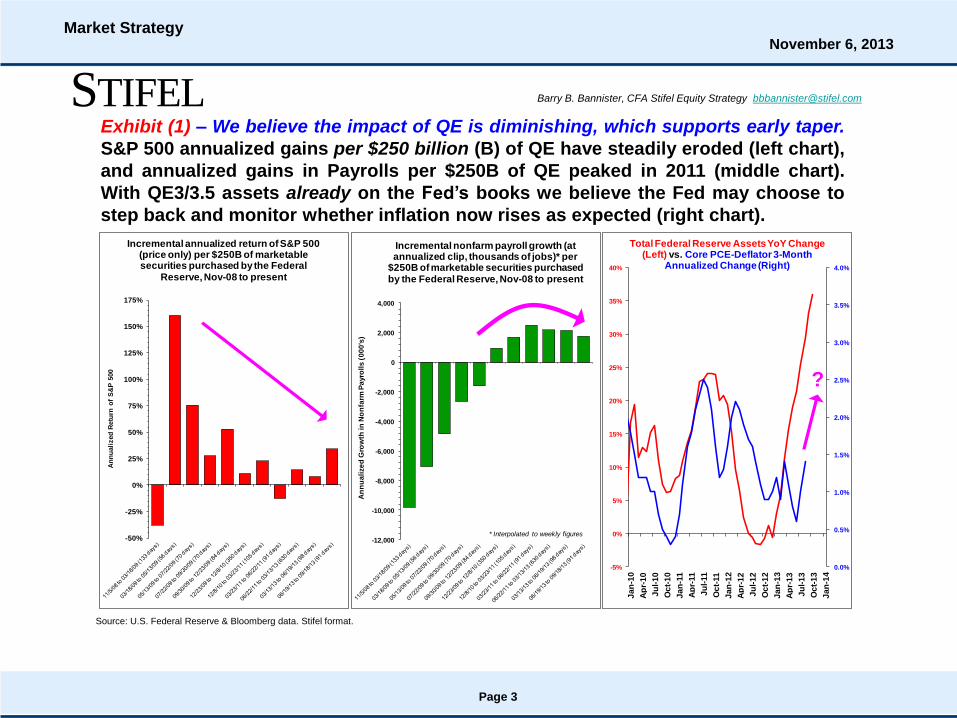
Exhibit (1) – We believe the impact of QE is diminishing, which supports early taper.
S&P 500 annualized gains per $250 billion (B) of QE have steadily eroded (left chart),
and annualized gains in Payrolls per $250B of QE peaked in 2011 (middle chart).
With QE3/3.5 assets already on the Fed’s books we believe the Fed may choose to
step back and monitor whether inflation now rises as expected (right chart).
?
Page 3
Market StrategyNovember 6, 2013

STIFEL
-40%
-30%
-20%
-10%
0%
10%
20%
30%
40%
50%
60%
70%
80%
90%
3Q
08
4Q
08
1Q
09
2Q
09
3Q
09
4Q
09
1Q
10
2Q
10
3Q
10
4Q
10
1Q
11
2Q
11
3Q
11
4Q
11
1Q
12
2Q
12
3Q
12
4Q
12
1Q
13
2Q
13
3Q
13
4Q
13
E
1Q
14
E
LTM % Net Treasury Issuance (New Supply of Treasuries) Purchased by the Federal Reserve
End of QE11Q2010
End of QE22Q2011
Estimates depict Fed purchases without taper
and Stifel est. of net treasury issuance
through 1Q14.
Barry B. Bannister, CFA Stifel Equity Strategy [email protected]
Source: SIFMA, Dept. of Treasury, Bloomberg data. Stifel estimates.
Exhibit (2) – One catalyst for commencing a taper of the Treasury portion of
QE before Chairman Bernanke’s term ends 1/31/14 is collateral withdrawal. The
Fed’s purchases are removing quality collateral from the system, absorbing
80% of net trailing 12-month (TTM) Treasury issuance by 1Q14E. We believe
this supports an early start for tapering the $40B/mo. of Treasury purchases.
Page 4
Market StrategyNovember 6, 2013

STIFEL
-$0.4 Tr.
-$0.2 Tr.
$0.0 Tr.
$0.2 Tr.
$0.4 Tr.
$0.6 Tr.
$0.8 Tr.
$1.0 Tr.
3Q
08
4Q
08
1Q
09
2Q
09
3Q
09
4Q
09
1Q
10
2Q
10
3Q
10
4Q
10
1Q
11
2Q
11
3Q
11
4Q
11
1Q
12
2Q
12
3Q
12
4Q
12
1Q
13
2Q
13
3Q
13
4Q
13E
1Q
14E
2Q
14E
3Q
14E
4Q
14E
LTM Net Mortgage-backed Security Issuance (New Supply of MBS) Purchased by the Federal Reserve
Net MBS Issued (i.e. negative = supply
shrinking)
Purchased by the FedEnd of QE1
1Q2010
End of QE22Q2011
Barry B. Bannister, CFA Stifel Equity Strategy [email protected]
Source: SIFMA, Dept. of Treasury, Bloomberg data. Stifel estimates.
Exhibit (3) – We would expect tapering of the MBS portion of QE to wait until 2nd
half 2014. MBS purchases are $45B/month but net MBS issuance (black line) is
still negative. Since QE1 and QE2 only ended when net MBS issuance turned
positive (circles), the Fed may wait until 2H14 to withdraw MBS QE, in our view.
Page 5
Market StrategyNovember 6, 2013
STIFEL
Source: Stifel commentary.
(1) ZIRP is Zero Interest Rate Policy, IOER is Interest on Excess Reserves, RRR is Reserve Requirement Ratio.
Barry B. Bannister, CFA Stifel Equity Strategy [email protected]
Communication by
TOOL available:
(1) LSAP (QE),
(2) ZIRP Rate Policy/IOER/RRR(1)
(3) Stock of Assets
Communication by
OBJECTIVE:
Inflation rate X%
Unemployment rate X%
Communication by
TIME:
Prolonged period…
Beyond reaching a target level…
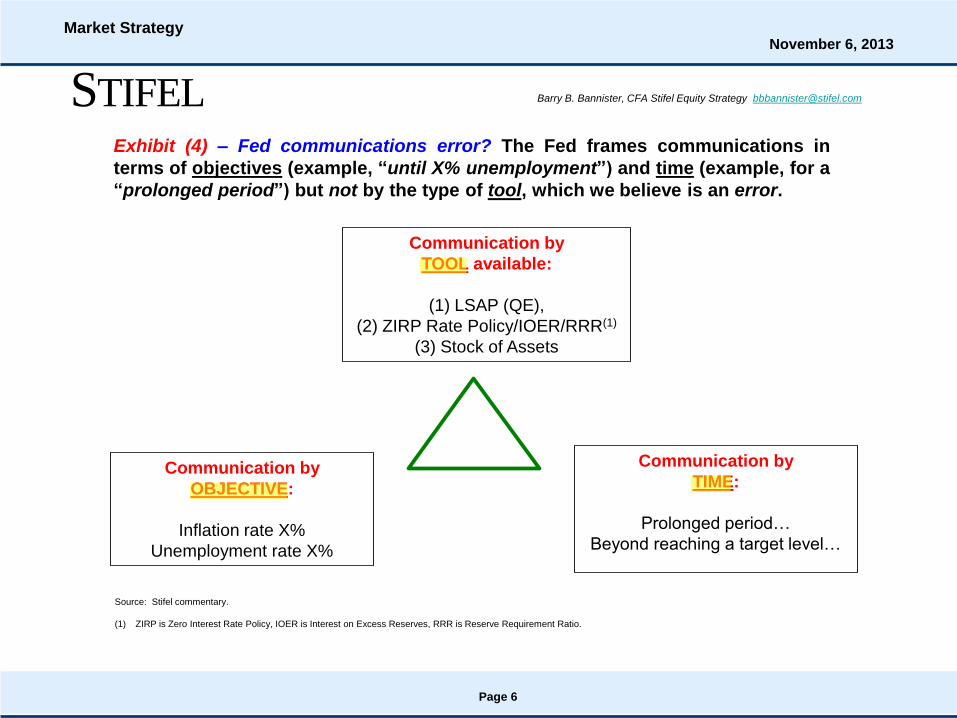
Exhibit (4) – Fed communications error? The Fed frames communications in
terms of objectives (example, “until X% unemployment”) and time (example, for a
“prolonged period”) but not by the type of tool, which we believe is an error.
Page 6
Market StrategyNovember 6, 2013

STIFEL
Source: Wikimedia commons, Stifel commentary.
(1) ZIRP is Zero Interest Rate Policy, IOER is Interest on Excess Reserves. We could include Reserve Requirements in rates as well.
(2) Base Money is currency + bank reserves at the Federal Reserve.
Barry B. Bannister, CFA Stifel Equity Strategy [email protected]
LSAP (QE) Asset purchases
(Hammer)
Target 0% rates & Interest on
Excess Reserves (IOER)
(Bulldozer)
Stock of assets held on Fed
balance sheet
(Scaffolding)
Optimal Communication Strategy:
Surprise
Objective of the Strategy:
To control rate volatility
Optimal Communication Strategy:
Moderate lead time
Objective of the Strategy:
To control rate levels
Optimal Communication Strategy:
Sustained with gradual change
Objective of the Strategy:
To flex base money(2)
Exhibit (5) - Our view is that QE is more effective without advance Fed
communication. The Fed has three “tools”, which are: (1) “Hammer” LSAP (QE),
(2) “Bulldozer” rate policy(1), and (3) “Scaffolding” Fed-held stock of assets. These
tools have different uses and optimal communications strategies, in our view. For
example, we have long contended that QE 3/3.5 was effective precisely because it
was open-ended and thus could not be discounted by the market.
Page 7
Market StrategyNovember 6, 2013

STIFEL
(A)(B)
(C)
(D)
(E)
(F)(G)
-400bps
-300bps
-200bps
-100bps
0bps
100bps
200bps
300bps
400bps
500bps
600bps
700bps
800bps
M-1
2M
-11
M-1
0M
-9M
-8M
-7M
-6M
-5M
-4M
-3M
-2M
-1M
+0
M+
1M
+2
M+
3M
+4
M+
5M
+6
M+
7M
+8
M+
9M
+10
M+
11
M+
12
Federal Funds Rate (FFR) Surrounding (12 Months Prior + 12 Months Following) Transitions of Federal Reserve
Chairmen, Indexed to Chairman Exit = 100, +/- in Bps
(A) Eccles (4/15/48)
(B) McCabe (3/31/51)
(C) Martin (1/31/70)
(D) Burns (1/31/78)
(E) Miller (8/6/79)
(F) Volcker (8/11/87)
(G) Greenspan (1/31/06)
Chairman (Departure)
Source: U.S. Federal Reserve, Dow Jones & Co. Stifel formats.
(1) NY Fed Discount Rate 1/48 to 6/54, Actual FFR 7/54 to 8/82, Target FFR 9/82 to 12/08, Actual FFR 1/09 to present. We acknowledge that the focus of past Federal Reserve
Boards was not always on rates (example: Fed research here). We use rates for simplicity as prima facie evidence of policy direction.
Barry B. Bannister, CFA Stifel Equity Strategy [email protected]
15
25
35
45
55
65
75
Trailing 30-Day Volatility of Dow Jones Industrial Average, Composite of Days (+/- 250 Trading Days) Surrounding Transition of Fed Chairmen since 1948
Exhibit (6) - The year before the exit of past Fed Chairmen has featured higher policy
rates and modest stock market volatility, but the year after has greater
variance/volatility. Fed Chairmen since W.W. II (Appendix A) have exited with rising
rates(1), but new Chairmen have been more disparate (left chart), raising stock
market volatility the first ~90 days after the new Chairman takes office (right chart).
Fed uniformly tightens
before a Chairman
departs…
…but new Fed
Chairmen have a
disparate 1st year.
Stock market volatility
is modest before a
Chairman departs…
…but increases the
first quarter after a
new Chairman
takes office.
1st quarter of
new Chairman
Page 8
Market StrategyNovember 6, 2013

STIFEL Barry B. Bannister, CFA Stifel Equity Strategy [email protected]
Exhibit (7) – In keeping with the history of past transitions, this Fed has already de
facto tightened rates. As the chart below from a Fed study(1) shows, once rates
reached 0% the LSAP (QE) and conditions created a “negative” FFR of -5% in 2009,
diminishing as economic & financial(2) variables have recovered, moving toward 0%.
Source: Cleveland Fed study.
(1) “Where Would the Federal Funds Rate Be, If It Could Be Negative?” Cleveland Fed, Oct-2012 here. Chart was updated by the Cleveland Fed upon request.
(2) The empirical model cited above used a Bayesian Vector Autoregressive (BVAR) model with 17 variables to determine an unrestricted forecast of the FFR. As
we would expect, financial variables contributed the most to the estimated FFR recovery from a -4% plateau post 4Q2010.
Pe
rce
nt
Page 9
Market StrategyNovember 6, 2013
STIFEL
13.0x
13.5x
14.0x
14.5x
15.0x
15.5x
16.0x
16.5x
17.0x
Ja
n-1
2
Ma
r-12
Ma
y-1
2
Ju
l-12
Se
p-1
2
No
v-1
2
Ja
n-1
3
Ma
r-13
Ma
y-1
3
Ju
l-13
Se
p-1
3
No
v-1
3
Ja
n-1
4
Ma
r-14
Ma
y-1
4
Ju
l-14
Se
p-1
4
No
v-1
4
Ja
n-1
5
S&P 500 Index P/E on Operating Earnings, Actual and Estimates through 4Q14,
Actual Projection$1,250
$1,300
$1,350
$1,400
$1,450
$1,500
$1,550
$1,600
$1,650
$1,700
$1,750
$1,800
De
c-11
Fe
b-1
2
Ap
r-12
Ju
n-1
2
Au
g-1
2
Oct-1
2
De
c-1
2
Fe
b-1
3
Ap
r-13
Ju
n-1
3
Au
g-1
3
Oct-1
3
De
c-1
3
Fe
b-1
4
Ap
r-14
Ju
n-1
4
Au
g-1
4
Oct-1
4
De
c-1
4
S&P 500 Index Weekly Average PriceProjection based on Stifel Taper Assumptions
(Left Chart, Top) & Stifel Earnings Ests.
Actual Projection
-10%
-8%
-6%
-4%
-2%
0%
2%
4%
6%
8%
10%
12%
Ja
n-1
2
Ma
r-12
Ma
y-1
2
Ju
l-12
Se
p-1
2
No
v-1
2
Ja
n-1
3
Ma
r-13
Ma
y-1
3
Ju
l-13
Se
p-1
3
No
v-1
3
Ja
n-1
4
Ma
r-14
Ma
y-1
4
Ju
l-14
Se
p-1
4
No
v-1
4
Ja
n-1
5
BCA "Money Impulse": 2nd Derivative of U.S. Monetary Base, Advanced Six Weeks vs. S&P 500 LTM P/E Ratio (3-Mo. % Change),Actual Jan-12 to Latest, Stifel Estimates through 4Q14. 3-Month Smoothed
Fed taper 2nd deriv. leads S&P P/E change by ~6 weeks, implies S&P
P/E slightly down mid-2014E.
Actual Projection
Source: Standard & Poor’s, Bloomberg. Stifel format.
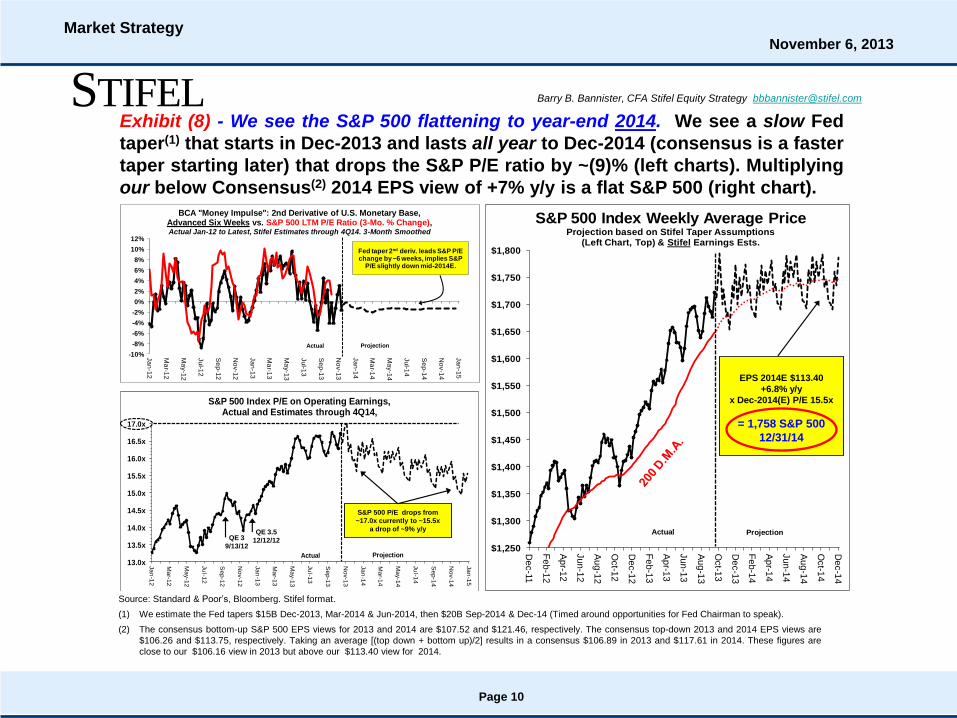
(1) We estimate the Fed tapers $15B Dec-2013, Mar-2014 & Jun-2014, then $20B Sep-2014 & Dec-14 (Timed around opportunities for Fed Chairman to speak).
(2) The consensus bottom-up S&P 500 EPS views for 2013 and 2014 are $107.52 and $121.46, respectively. The consensus top-down 2013 and 2014 EPS views are
$106.26 and $113.75, respectively. Taking an average [(top down + bottom up)/2] results in a consensus $106.89 in 2013 and $117.61 in 2014. These figures are
close to our $106.16 view in 2013 but above our $113.40 view for 2014.
EPS 2014E $113.40
+6.8% y/y
x Dec-2014(E) P/E 15.5x
= 1,758 S&P 500
12/31/14
S&P 500 P/E drops from
~17.0x currently to ~15.5x
a drop of ~9% y/y
QE 3
9/13/12
QE 3.5
12/12/12
Exhibit (8) - We see the S&P 500 flattening to year-end 2014. We see a slow Fed
taper(1) that starts in Dec-2013 and lasts all year to Dec-2014 (consensus is a faster
taper starting later) that drops the S&P P/E ratio by ~(9)% (left charts). Multiplying
our below Consensus(2) 2014 EPS view of +7% y/y is a flat S&P 500 (right chart).
Barry B. Bannister, CFA Stifel Equity Strategy [email protected]
Page 10
Market StrategyNovember 6, 2013
STIFEL
0.0%
0.1%
0.2%
0.3%
0.4%
0.5%
0.6%
0.7%
0.8%
0.9%
1.0%
Ja
n-1
1
Ap
r-11
Ju
l-11
Oc
t-11
Ja
n-1
2
Ap
r-12
Ju
l-12
Oc
t-12
Ja
n-1
3
Ap
r-13
Ju
l-13
Oc
t-13
Ja
n-1
4
Ap
r-14
Ju
l-14
Oc
t-14
Ja
n-1
5
Ap
r-15
Ju
l-15
Oc
t-15
Ja
n-1
6
Fed Funds Effective Rate FF Futures
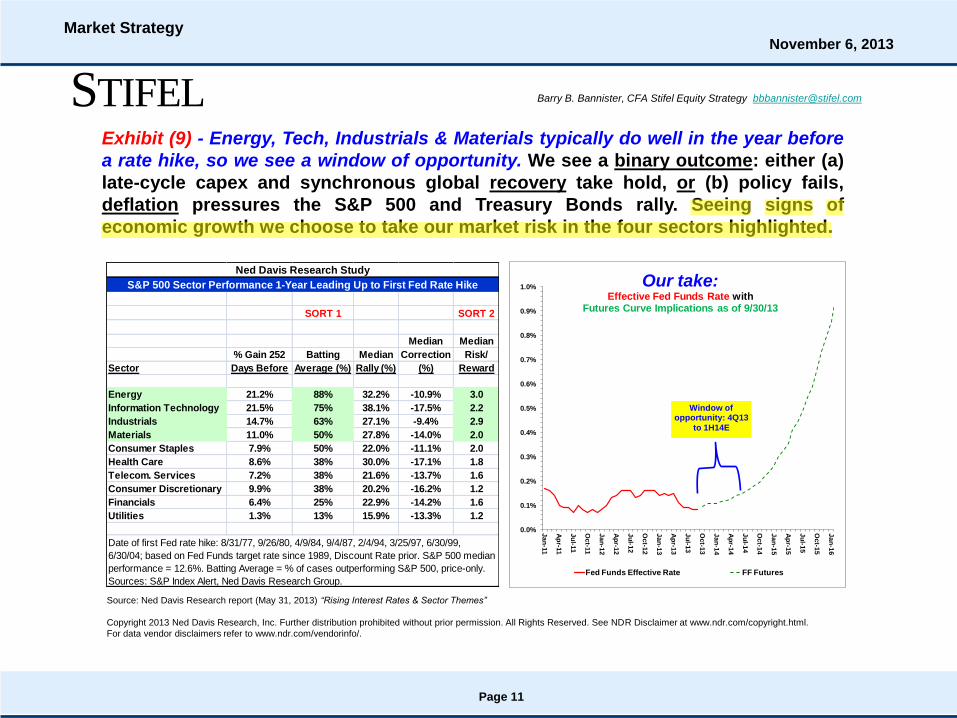
Our take: Effective Fed Funds Rate with
Futures Curve Implications as of 9/30/13
Window of opportunity: 4Q13
to 1H14E
Barry B. Bannister, CFA Stifel Equity Strategy [email protected]
Source: Ned Davis Research report (May 31, 2013) “Rising Interest Rates & Sector Themes”
Copyright 2013 Ned Davis Research, Inc. Further distribution prohibited without prior permission. All Rights Reserved. See NDR Disclaimer at www.ndr.com/copyright.html.
For data vendor disclaimers refer to www.ndr.com/vendorinfo/.
SORT 1 SORT 2
Median Median
% Gain 252 Batting Median Correction Risk/
Sector Days Before Average (%) Rally (%) (%) Reward
Energy 21.2% 88% 32.2% -10.9% 3.0
Information Technology 21.5% 75% 38.1% -17.5% 2.2
Industrials 14.7% 63% 27.1% -9.4% 2.9
Materials 11.0% 50% 27.8% -14.0% 2.0
Consumer Staples 7.9% 50% 22.0% -11.1% 2.0
Health Care 8.6% 38% 30.0% -17.1% 1.8
Telecom. Services 7.2% 38% 21.6% -13.7% 1.6
Consumer Discretionary 9.9% 38% 20.2% -16.2% 1.2
Financials 6.4% 25% 22.9% -14.2% 1.6
Utilities 1.3% 13% 15.9% -13.3% 1.2
Ned Davis Research Study
S&P 500 Sector Performance 1-Year Leading Up to First Fed Rate Hike
Date of first Fed rate hike: 8/31/77, 9/26/80, 4/9/84, 9/4/87, 2/4/94, 3/25/97, 6/30/99,
6/30/04; based on Fed Funds target rate since 1989, Discount Rate prior. S&P 500 median
performance = 12.6%. Batting Average = % of cases outperforming S&P 500, price-only.
Sources: S&P Index Alert, Ned Davis Research Group.
Exhibit (9) - Energy, Tech, Industrials & Materials typically do well in the year before
a rate hike, so we see a window of opportunity. We see a binary outcome: either (a)
late-cycle capex and synchronous global recovery take hold, or (b) policy fails,
deflation pressures the S&P 500 and Treasury Bonds rally. Seeing signs of
economic growth we choose to take our market risk in the four sectors highlighted.
Page 11
Market StrategyNovember 6, 2013

STIFEL
600
650
700
750
800
850
900
950
1000
4%
5%
6%
7%
8%
9%
10%
Ja
n-6
9
Fe
b-6
9
Ma
r-69
Ap
r-69
Ma
y-6
9
Ju
n-6
9
Ju
l-69
Au
g-6
9
Se
p-6
9
Oct-6
9
No
v-6
9
De
c-6
9
Ja
n-7
0
Fe
b-7
0
Ma
r-70
Ap
r-70
Ma
y-7
0
Ju
n-7
0
Ju
l-70
Au
g-7
0
Se
p-7
0
Oct-7
0
No
v-7
0
De
c-7
0
Ja
n-7
1
Do
w J
on
es I
nd
ustr
ials
Pri
ce
Fed
era
l F
un
ds R
ate
William McChesney Martin Jr.'s Exit (Jan-31, 1970)
700
750
800
850
900
950
1000
4%
5%
6%
7%
8%
9%
10%
11%
Ja
n-7
7
Fe
b-7
7
Ma
r-77
Ap
r-77
Ma
y-7
7
Ju
n-7
7
Ju
l-77
Au
g-7
7
Se
p-7
7
Oct-7
7
No
v-7
7
De
c-7
7
Ja
n-7
8
Fe
b-7
8
Ma
r-78
Ap
r-78
Ma
y-7
8
Ju
n-7
8
Ju
l-78
Au
g-7
8
Se
p-7
8
Oct-7
8
No
v-7
8
De
c-7
8
Ja
n-7
9
Do
w J
on
es I
nd
ustr
ials
Pri
ce
Fed
era
l F
un
ds R
ate
Arthur F. Burn's Exit (Jan-31, 1978)
190
200
210
220
230
240
250
260
270
280
1.45%
1.50%
1.55%
1.60%
1.65%
1.70%
1.75%
1.80%
Ma
r-50
Ap
r-50
Ma
y-5
0
Ju
n-5
0
Ju
l-50
Au
g-5
0
Se
p-5
0
Oct-5
0
No
v-5
0
De
c-5
0
Ja
n-5
1
Fe
b-5
1
Ma
r-51
Ap
r-51
Ma
y-5
1
Ju
n-5
1
Ju
l-51
Au
g-5
1
Se
p-5
1
Oct-5
1
No
v-5
1
De
c-5
1
Ja
n-5
2
Fe
b-5
2
Ma
r-52
Do
w J
on
es I
nd
ustr
ials
Pri
ce
NY
Fed
Dis
co
un
t R
ate
Thomas B. McCabe's Exit (Mar-31, 1951)
145
150
155
160
165
170
175
180
185
190
195
200
0.9%
1.0%
1.1%
1.2%
1.3%
1.4%
1.5%
1.6%
Ap
r-47
Ma
y-4
7
Ju
n-4
7
Ju
l-47
Au
g-4
7
Se
p-4
7
Oct-4
7
No
v-4
7
De
c-4
7
Ja
n-4
8
Fe
b-4
8
Ma
r-48
Ap
r-48
Ma
y-4
8
Ju
n-4
8
Ju
l-48
Au
g-4
8
Se
p-4
8
Oct-4
8
No
v-4
8
De
c-4
8
Ja
n-4
9
Fe
b-4
9
Ma
r-49
Ap
r-49
Do
w J
on
es I
nd
ustr
ials
Pri
ce
NY
Fed
Dis
co
un
t R
ate
Marriner S. Eccles' Exit (Apr-15, 1948)
Barry B. Bannister, CFA Stifel Equity Strategy [email protected]
Appendix (A) – Fed Discount/Fed Funds rates(1) and Dow Jones Industrials one year before and one year after
Fed Chairman transitions since W.W. II.
Source: U.S. Federal Reserve, Dow Jones & Co. Stifel formats.
(1) NY Fed Discount Rate through June 1954, Actual FFR July 1954 to Aug-1982, Target FFR Sep-1982 to Dec-2008, Actual FFR Jan-2009 to present.
Page 12
Market StrategyNovember 6, 2013
STIFEL
750
770
790
810
830
850
870
890
910
930
950
6%
8%
10%
12%
14%
16%
18%
20%
Au
g-7
8
Se
p-7
8
Oct-7
8
No
v-7
8
De
c-7
8
Ja
n-7
9
Fe
b-7
9
Ma
r-79
Ap
r-79
Ma
y-7
9
Ju
n-7
9
Ju
l-79
Au
g-7
9
Se
p-7
9
Oct-7
9
No
v-7
9
De
c-7
9
Ja
n-8
0
Fe
b-8
0
Ma
r-80
Ap
r-80
Ma
y-8
0
Ju
n-8
0
Ju
l-80
Au
g-8
0
Do
w J
on
es I
nd
ustr
ials
Pri
ce
Fed
era
l F
un
ds R
ate
G. William Miller's Exit (Aug-6, 1979)
9,800
10,300
10,800
11,300
11,800
12,300
12,800
2.0%
2.5%
3.0%
3.5%
4.0%
4.5%
5.0%
5.5%
Ja
n-0
5
Fe
b-0
5
Ma
r-05
Ap
r-05
Ma
y-0
5
Ju
n-0
5
Ju
l-05
Au
g-0
5
Se
p-0
5
Oct-0
5
No
v-0
5
De
c-0
5
Ja
n-0
6
Fe
b-0
6
Ma
r-06
Ap
r-06
Ma
y-0
6
Ju
n-0
6
Ju
l-06
Au
g-0
6
Se
p-0
6
Oct-0
6
No
v-0
6
De
c-0
6
Ja
n-0
7
Do
w J
on
es I
nd
ustr
ials
Pri
ce
Fed
era
l F
un
ds R
ate
Alan Greenspan's Exit (Jan-31, 2006)
1600
1800
2000
2200
2400
2600
2800
5.5%
6.0%
6.5%
7.0%
7.5%
8.0%
8.5%
Au
g-8
6
Se
p-8
6
Oct-8
6
No
v-8
6
De
c-8
6
Ja
n-8
7
Fe
b-8
7
Ma
r-87
Ap
r-87
Ma
y-8
7
Ju
n-8
7
Ju
l-87
Au
g-8
7
Se
p-8
7
Oct-8
7
No
v-8
7
De
c-8
7
Ja
n-8
8
Fe
b-8
8
Ma
r-88
Ap
r-88
Ma
y-8
8
Ju
n-8
8
Ju
l-88
Au
g-8
8
Do
w J
on
es I
nd
ustr
ials
Pri
ce
Fed
era
l F
un
ds R
ate
Paul A. Volcker's Exit (Aug-11, 1987)
Barry B. Bannister, CFA Stifel Equity Strategy [email protected]
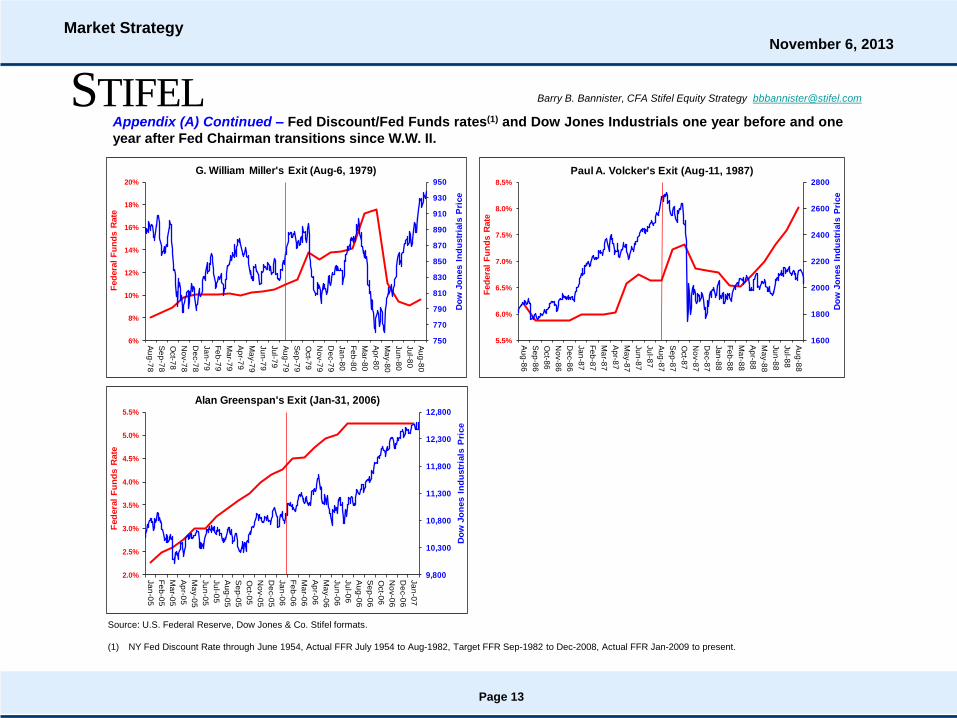
Appendix (A) Continued – Fed Discount/Fed Funds rates(1) and Dow Jones Industrials one year before and one
year after Fed Chairman transitions since W.W. II.
Source: U.S. Federal Reserve, Dow Jones & Co. Stifel formats.
(1) NY Fed Discount Rate through June 1954, Actual FFR July 1954 to Aug-1982, Target FFR Sep-1982 to Dec-2008, Actual FFR Jan-2009 to present.
Page 13
Market StrategyNovember 6, 2013

Important Disclosures and Certifications
I, Barry B. Bannister, certify that the views expressed in this research report accurately reflect my personal viewsabout the subject securities or issuers; and I, Barry B. Bannister, certify that no part of my compensation was, is, orwill be directly or indirectly related to the specific recommendations or views contained in this research report. Forour European Conflicts Management Policy go to the research page at www.stifel.com.
Stifel research analysts receive compensation that is based upon (among other factors) Stifel's overall investment bankingrevenues.
Our investment rating system is three tiered, defined as follows:
BUY -For U.S. securities we expect the stock to outperform the S&P 500 by more than 10% over the next 12 months. ForCanadian securities we expect the stock to outperform the S&P/TSX Composite Index by more than 10% over the next 12months. For other non-U.S. securities we expect the stock to outperform the MSCI World Index by more than 10% over thenext 12 months. For yield-sensitive securities, we expect a total return in excess of 12% over the next 12 months for U.S.securities as compared to the S&P 500, for Canadian securities as compared to the S&P/TSX Composite Index, and for othernon-U.S. securities as compared to the MSCI World Index.
HOLD -For U.S. securities we expect the stock to perform within 10% (plus or minus) of the S&P 500 over the next 12months. For Canadian securities we expect the stock to perform within 10% (plus or minus) of the S&P/TSX CompositeIndex. For other non-U.S. securities we expect the stock to perform within 10% (plus or minus) of the MSCI World Index. AHold rating is also used for yield-sensitive securities where we are comfortable with the safety of the dividend, but believe thatupside in the share price is limited.
SELL -For U.S. securities we expect the stock to underperform the S&P 500 by more than 10% over the next 12 months andbelieve the stock could decline in value. For Canadian securities we expect the stock to underperform the S&P/TSXComposite Index by more than 10% over the next 12 months and believe the stock could decline in value. For other non-U.S.securities we expect the stock to underperform the MSCI World Index by more than 10% over the next 12 months andbelieve the stock could decline in value.
Of the securities we rate, 47% are rated Buy, 50% are rated Hold, and 3% are rated Sell.
Within the last 12 months, Stifel or an affiliate has provided investment banking services for 16%, 7% and 3% of thecompanies whose shares are rated Buy, Hold and Sell, respectively.
Additional Disclosures
Please visit the Research Page at www.stifel.com for the current research disclosures and respective target pricemethodology applicable to the companies mentioned in this publication that are within Stifel's coverage universe. For adiscussion of risks to target price please see our stand-alone company reports and notes for all Buy-rated stocks.
The information contained herein has been prepared from sources believed to be reliable but is not guaranteed by us and isnot a complete summary or statement of all available data, nor is it considered an offer to buy or sell any securities referred toherein. Opinions expressed are subject to change without notice and do not take into account the particular investmentobjectives, financial situation or needs of individual investors. Employees of Stifel or its affiliates may, at times, release writtenor oral commentary, technical analysis or trading strategies that differ from the opinions expressed within. Past performanceshould not and cannot be viewed as an indicator of future performance.
Stifel is a multi-disciplined financial services firm that regularly seeks investment banking assignments and compensationfrom issuers for services including, but not limited to, acting as an underwriter in an offering or financial advisor in a merger oracquisition, or serving as a placement agent in private transactions. Moreover, Stifel and its affiliates and their respectiveshareholders, directors, officers and/or employees, may from time to time have long or short positions in such securities or inoptions or other derivative instruments based thereon.
These materials have been approved by Stifel Europe Limited, authorized and regulated by the Financial Conduct Authority(FCA) in the UK, in connection with its distribution to professional clients and eligible counterparties in the EuropeanEconomic Area. (Stifel Europe Limited home office: London +44 20 7557 6030.) No investments or services mentioned areavailable in the European Economic Area to retail clients or to anyone in Canada other than a Designated Institution. Thisinvestment research report is classified as objective for the purposes of the FCA rules. Please contact a Stifel entity in yourjurisdiction if you require additional information.
Additional Information Available Upon Request
Page 14
Market StrategyNovember 6, 2013

© 2013 Stifel, Nicolaus & Company, Incorporated, One South Street, Baltimore, MD 21202.© 2013 Stifel Nicolaus Canada Inc. 79 Wellington Street West, 21st Floor Toronto, ON M5K 1B7.All rights reserved.
Page 15
Market StrategyNovember 6, 2013