" Транзитно-ориентированное проектирование города:...
TRANSCRIPT

ecoParqMexico City’s Parking Meter System
Michael KodranskyOsh Urban ForumJune 2015


Where?
• Polanco • 4km2
• 440 pay and display parking meters• 6,000 on-street parking spaces

Implementation of Parking MetersThe equipment chosen by the City was the multispace or pay-and-display parking meter
Operator City’s Finance Dept.
Public Space Authority
30%


Communication Strategy
www.ecoparq.com.mx
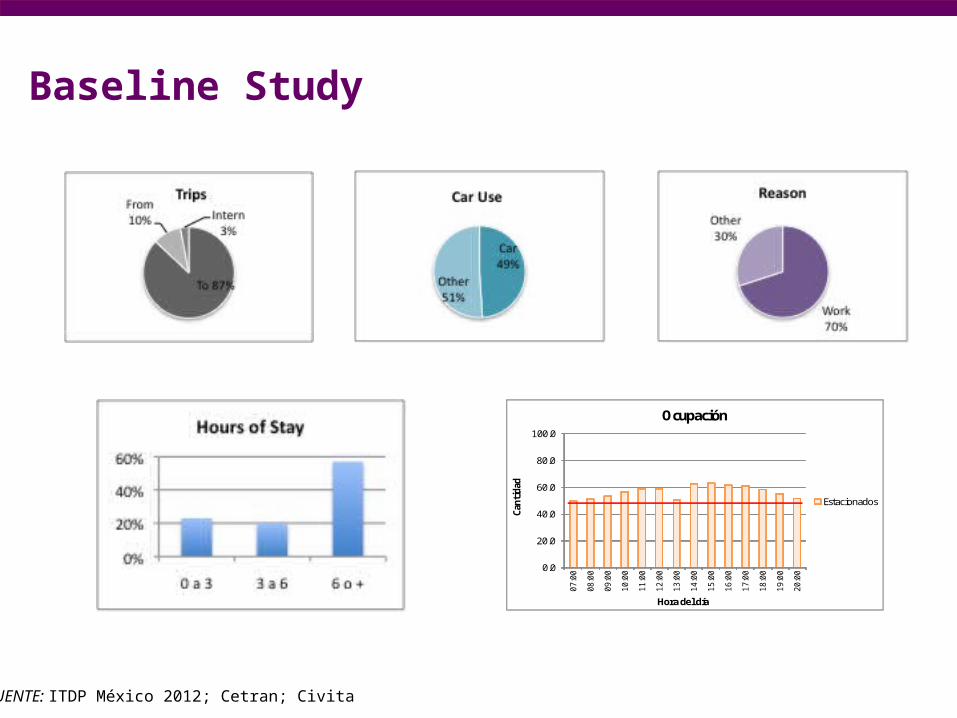
Baseline Study
FUENTE: ITDP México 2012; Cetran; Civita
POLANCO
Manzana:
Cajones
45 93.9% 0.2368981 3.5303 100.0% 0.2577778 3.03
49
07:00 08:00 09:00 10:00 11:00 12:00 13:00 14:00 15:00 16:00 17:00 18:00 19:00 20:00
Índice de ocupación 102% 105% 109% 116% 120% 121% 104% 129% 130% 127% 125% 120% 113% 106%
Estacionados 49.4 51.0 53.2 56.5 58.6 58.9 50.7 62.6 63.2 61.7 60.8 58.2 55.1 51.5
Status 0 a 1 1 a 2 2 a 3 3 a 4 4 a 5 5 a 6. 6 a 7 7 a 8 8 a 9 9 a 10 10 a 11 11 a 12 12 a 13 13 a 14
En cajón ocupado 24 48 65 54 34 33 44 35 37 38 47 39 30 80En cajón apartado 4 5 5 4 2 0 2 2 2 1 3 2 3 5Total 28 52 69 58 35 34 46 37 39 38 50 40 33 85
4.3% 8.1% 10.8% 9.0% 5.5% 5.2% 7.2% 5.7% 6.0% 5.9% 7.7% 6.2% 5.1% 13.2%
0 a 3 hrs. 23.18% 3 a 6 hrs. 19.70% 6 a 14 hrs. 57.1%
Fuente: Estudios de campo realizados por CETRAN, Noviembre 2010
0
10
20
30
40
50
60
70
80
90
0 a
1
1 a
2
2 a
3
3 a
4
4 a
5
5 a
6.
6 a
7
7 a
8
8 a
9
9 a
10
10 a
11
11 a
12
12 a
13
13 a
14
Canti
dad
de ca
jone
s
Horas
Demanda de cajones-hora
En cajón apartado
En cajón ocupado
23.18%
19.70%
57.1%
Horas de permanencia
0 a 3 hrs.3 a 6 hrs.6 a 14 hrs.
0.0
20.0
40.0
60.0
80.0
100.0
07:0
0
08:0
0
09:0
0
10:0
0
11:0
0
12:0
0
13:0
0
14:0
0
15:0
0
16:0
0
17:0
0
18:0
0
19:0
0
20:0
0
Canti
dad
Hora del día
Ocupación
Estacionados

FUENTE: ITDP México 2012; Cetran; Civita
Average 8.12% Average 6:04m
Baseline Study
% of traffic looking for on-street parking
How long an on-street parking space remains
unused

FUENTE: ITDP México 2012; Cetran; Civita
17:02 minutes cruising (includes walking)
1.41 passengers per vehicle
Baseline StudyCruising time + walking time
Passengers per vehicle
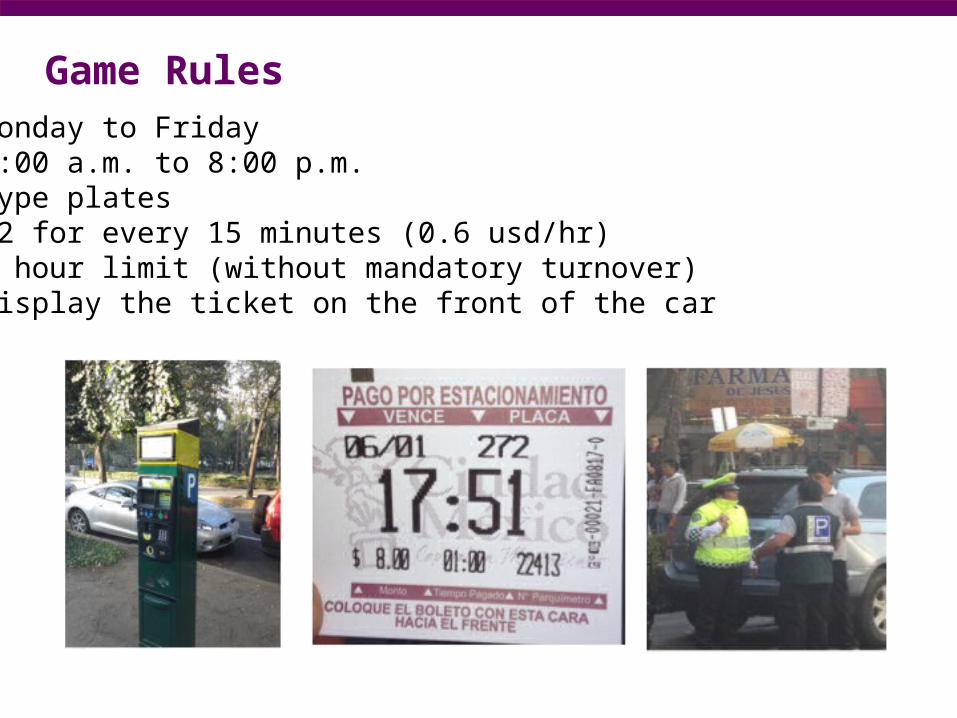
Game Rules• Monday to Friday• 8:00 a.m. to 8:00 p.m.• Type plates• $2 for every 15 minutes (0.6 usd/hr)• 3 hour limit (without mandatory turnover)• Display the ticket on the front of the car

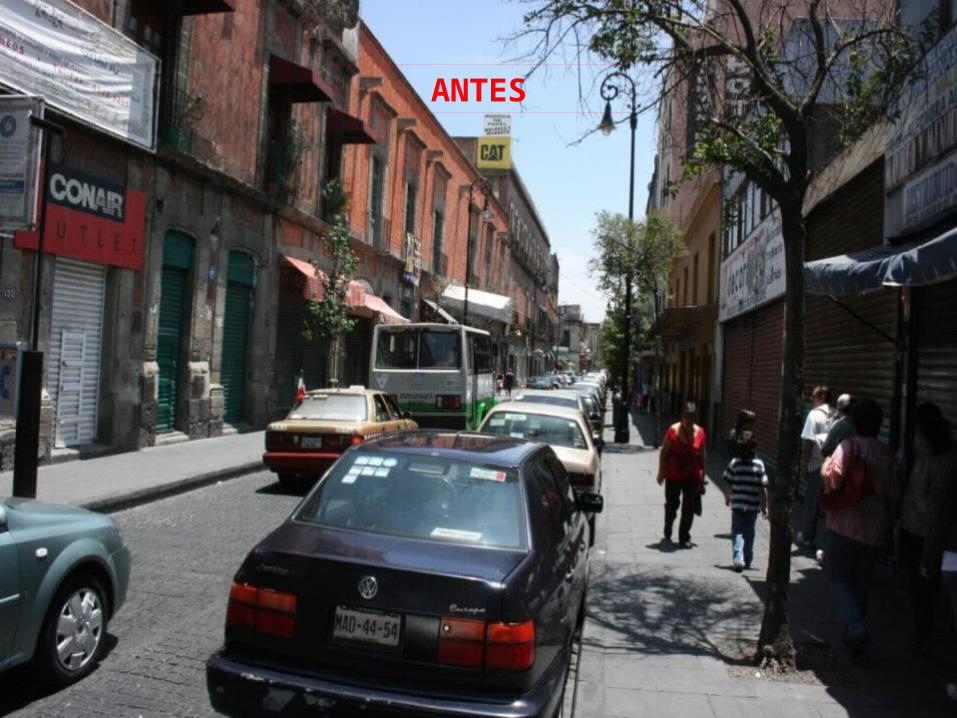
Polanco and Emerson streetcross
BEFORE AFTER
Impacts

• Turnover increase from 3.5 to 5.• Average availability of 45%-55%• 35% availability on peak demand.• 70-90 tickets and wheel clamps per day• ~ $6M to the public space recovery
FUENTE: SEDUVI/AEP/ecoParq
First Results

Operation: enforcement

Operation: enforcementFINES• $299 for illegal parking• $180 for unlocking the wheel clamp

ANTES

DESPUÉS
ANTES

DESPUÉS

ANTES

DESPUÉS