digital.library.unt.edu/67531/metadc717134/m2/1/high_res...digital.library.unt.edu
TRANSCRIPT

ESH-EMS-2000408
THE ENVIRONMENTAL PROTECTION DEPARTMENTENVIRONMENTAL MONITORING SECTION
The Savannah River Site’sGroundwater Monitoring Program
FOURTH QUARTER 2000 (U)(October through December 2000)
Westinghouse Savannah River CompanySavannah River SiteAiken, SC 29808
Prepared for the U.S. Department of Energy under Contract No. AB60294N

This document was prepared in conjunction with work accomplished under Contract No.DE-AC09-96SR18500 with the U.S. Department of Energy.
DISCLAIMER
This report was prepared as an account of work sponsored by an agency of the United States Government.Neither the United States Government nor any agency thereof, nor any of their employees, makes anywarranty, express or implied, or assumes any legal liability or responsibility for the accuracy,completeness, or usefulness of any information, apparatus, product or process disclosed, or represents thatits use would not infringe privately owned rights. Reference herein to any specific commercial product,process or service by trade name, trademark, manufacturer, or otherwise does not necessarily constitute orimply its endorsement, recommendation, or favoring by the United States Government or any agencythereof. The views and opinions of authors expressed herein do not necessarily state or reflect those of theUnited States Government or any agency thereof.
This report has been reproduced directly from the best available copy.
Available for sale to the public, in paper, from: U.S. Department of Commerce, National TechnicalInformation Service, 5285 Port Royal Road, Springfield, VA 22161, phone: (800)553-6847, fax: (703) 605-6900, email: [email protected] online ordering:http://www.ntis.gov/ordering.htm
Available electronically at http://www.doe.gov/bridge
Available for a processing fee to U.S. Department of Energy and its contractors, in paper, from: U.S.Department of Energy, Office of Scientific and Technical Information, P.O. Box 62, Oak Ridge, TN37831-0062, phone: (865 ) 576-8401, fax: (865) 576-5728, email: [email protected]

This Quarter at a Glance . . .Executive Summarytable of all analytes detected at or above Flag 2 criteriaFlagging Criteriastandards for flagging resultsSample Schedulingdescription of the sampling scheduleField Notescomments from the field-data booksAnalytical Data Reviewdiscrepancies in each laboratory's analytical data; laboratory-specific methods and
estimated quantitation limitsQuality Control Samplesdiscussion of the quality of the analytical data in terms of precision, accuracy,
representativeness, comparability, and completenessSite Indextable of the well series and their site locations; also discusses the history of the sitesAddendum—results from Microseeps’ third quarter 2000 ERA performance standardsAppendices:A. Water-Level Datatables listing field data obtained for hydrogeologic studiesB. Analytical Resultstables listing all verified and validated analytical results and field data for the quarterC. Sampling Blanks Resultstables listing all verified and validated analytical results for sampling blanks for
the quarter
• • •
The Savannah River Site (SRS) was constructed to produce basic materials used in nuclear weapons, primarilytritium and plutonium-239. Five reactors—along with support facilities—were built to produce and purify thesematerials.
SRS is divided into the following areas, based on production and other functions:
• reactor materials area (M)
• reactor areas (C, K, L, P, and R)
• heavy water reprocessing area (D)
• separations areas (F and H)
• waste management areas (E, F, H, S, and Z)
• administration area (A)
• other areas (B, N, TNX, and G)
Since the end of the Cold War, SRS has shut down several facilities because of declining defenserequirements. These included all five reactors and facilities in M Area, D Area, and TNX. However, E Area, SArea, and Z Area opened to support waste management activities.


ContentsContentsESH-EMS-2000408ESH-EMS-2000408 Page Page iiiiii Fourth Quarter 2000Fourth Quarter 2000
This page left blank intentionally.

ContentsContentsESH-EMS-2000408ESH-EMS-2000408 Page Page iviv Fourth Quarter 2000Fourth Quarter 2000
ContentsContentsPage
Executive Summary ............................................................................................................................................. 1
Introduction ..................................................................................................................................................................5
Organization of This Report....................................................................................................................................5
Flagging Criteria ..........................................................................................................................................................9
Sample Scheduling ...................................................................................................................................................19
Environmental Screening......................................................................................................................................19
GCMS VOA Analyses...........................................................................................................................................20
Sampling Requests...............................................................................................................................................20
Maintenance, Access, or Other Problems............................................................................................................22
Dy Wells ................................................................................................................................................................22
New Wells .............................................................................................................................................................22
Field Notes..................................................................................................................................................................23
Analytical Data Review .............................................................................................................................................35
GIMS Data Review Module ..................................................................................................................................35
Review of the Analytical Data ...............................................................................................................................35
Analytical Methods................................................................................................................................................37
Quality Control Samples...........................................................................................................................................53
Precision................................................................................................................................................................53
Accuracy................................................................................................................................................................57
Representativeness ..............................................................................................................................................61
Comparability ........................................................................................................................................................62
Completeness .......................................................................................................................................................62
Site Index ..................................................................................................................................................................133
Site History ..........................................................................................................................................................136
Glossary....................................................................................................................................................................147

ContentsContentsESH-EMS-2000408ESH-EMS-2000408 Page Page vv Fourth Quarter 2000Fourth Quarter 2000
References ...............................................................................................................................................................155
Addendum ...............................................................................................................................................................157
Appendix A. Water-Level Data .......................................................................................................................... A-1
Appendix B. Analytical Results......................................................................................................................... B-1
Appendix C. Sampling Blanks Results ............................................................................................................C-1

ContentsContentsESH-EMS-2000408ESH-EMS-2000408 Page Page vivi Fourth Quarter 2000Fourth Quarter 2000
LIST OF FIGURESLIST OF FIGURES
Page
Figure 1. Areas and Locations Monitored for Groundwater Quality ........................................................... 7
Figure 2. Separations and Waste Management Areas Monitored for Groundwater Quality ..................... 8
Figure 3. Three Types of Groundwater Monitoring Wellheads .................................................................. 23
Figure 4. Relative Difference vs. the Mean .................................................................................................. 54
Figure 5. Relationship between wi and Analyte Concentration ................................................................. 55
Figure 6. Effect of a Linear-Weight Function on the MRDadj..................................................................... 55

ContentsContentsESH-EMS-2000408ESH-EMS-2000408 Page Page viivii Fourth Quarter 2000Fourth Quarter 2000
LIST OF TABLESLIST OF TABLES
Page
Table 1. Analytes above Flag 2 Criteria ........................................................................................................ 1
Table 2. Flagging Criteria ............................................................................................................................. 10
Table 3. Comments from the Field Data ..................................................................................................... 24
Table 4. EX Samples with High Analytical Results as Compared to Historical Data ............................. 38
Table 5. GE Samples with High Analytical Results as Compared to Historical Data............................. 38
Table 6. GE Samples with Low Analytical Results as Compared to Historical Data.............................. 38
Table 7. WA Samples with High Analytical Results as Compared to Historical Data ............................ 39
Table 8. GP Samples with High Analytical Results as Compared to Historical Data............................. 39
Table 9. GP Samples with Low Analytical Results as Compared to Historical Data.............................. 39
Table 10. ML Samples with High Analytical Results as Compared to Historical Data............................. 39
Table 11. TM Samples with High Analytical Results as Compared to Historical Data............................. 39
Table 12. Methods and Estimated Quantitation Limits Used by EX .......................................................... 40
Table 13. Methods and Estimated Quantitation Limits Used by GE.......................................................... 43
Table 14. Methods and Estimated Quantitation Limits Used by WA ......................................................... 45
Table 15. Methods and Estimated Quantitation Limits Used by GP.......................................................... 49
Table 16. Methods and Estimated Quantitation Limits Used by ML.......................................................... 50
Table 17. Methods and Estimated Quantitation Limits Used by TM.......................................................... 51
Table 18. Wells Providing Blind Replicate Samples and Associated Blanks ........................................... 62
Table 19. Analytes Not Showing Measurable Concentrations above Estimated Quantitation Limitsin Any Replicated or Duplicated Samples for GE, WA, EX, and ML.................................... 63
Table 20. Analytes Not Showing Measurable Concentrations above Estimated Quantitation Limitsin Any Replicated or Duplicated Samples for GP and TM ................................................... 64
Table 21. Intralaboratory MRD Indices for EX .............................................................................................. 65
Table 22. Intralaboratory MRD Indices for GE ............................................................................................. 66
Table 23. Intralaboratory MRD Matrix Spike Indices for GE ....................................................................... 67
Table 24. Intralaboratory MRD Indices for WA............................................................................................. 67
Table 25. Intralaboratory MRD Indices for GP ............................................................................................. 70

ContentsContentsESH-EMS-2000408ESH-EMS-2000408 Page Page viiiviii Fourth Quarter 2000Fourth Quarter 2000
Table 26. Intralaboratory MRD Indices for ML ............................................................................................. 71
Table 27. Intralaboratory MRD Indices for TM ............................................................................................. 72
Table 28. Interlaboratory MRD and t-test Results for Analytes with atLeast One Pair of Results above the RDL for EM and WA................................................... 72
Table 29. Interlaboratory MRD and t-test Results for Analytes with atLeast One Pair of Results above the RDL for GE and WA................................................... 73
Table 30. Interlaboratory MRD and t-test Results for Analytes with atLeast One Pair of Results above the RDL for EX and ML.................................................... 74
Table 31. Interlaboratory MRD and t-test Results for Analytes with atLeast One Pair of Results above the RDL for GP and TM ................................................... 74
Table 32. GE Samples and Blind Replicates Yielding Results WhereOne Is More Than Twice Another ........................................................................................... 75
Table 33. WA Samples and Blind Replicates Yielding Results WhereOne Is More Than Twice Another ........................................................................................... 75
Table 34. WA Samples and Laboratory Duplicates Yielding Results WhereOne Is More Than Twice Another ........................................................................................... 75
Table 35. GP Samples and Blind Replicates Yielding Results WhereOne Is More Than Twice Another ........................................................................................... 75
Table 36. GP Samples and Laboratory Duplicates Yielding Results WhereOne Is More Than Twice Another ........................................................................................... 75
Table 37. TM Samples and Blind Replicates Yielding Results WhereOne Is More Than Twice Another ........................................................................................... 76
Table 38. TM Samples and Laboratory Duplicates Yielding Results WhereOne Is More Than Twice Another ........................................................................................... 76
Table 39. Analytes with One Laboratory’s Result Greater Than Twice the Resultfrom the Other Laboratory between GE and WA .................................................................. 76
Table 40. Analytes with One Laboratory’s Result Greater Than Twice the Resultfrom the Other Laboratory between GP and TM................................................................... 76
Table 41. Quality Control Standards for Selected Analyses for EX ........................................................... 77
Table 42. Quality Control Standards for Selected Analyses for GE........................................................... 79
Table 43. Quality Control Standards for Selected Analyses for WA .......................................................... 81
Table 44. Quality Control Standards for Selected Analyses for EM .......................................................... 84
Table 45. Quality Control Standards for Selected Analyses for ML .......................................................... 86
Table 46. ML Performance Evaluation, Water Pollution Study WP69........................................................ 89

ContentsContentsESH-EMS-2000408ESH-EMS-2000408 Page Page ixix Fourth Quarter 2000Fourth Quarter 2000
Table 47. Laboratory Control Sample Recoveries for GE ........................................................................... 92
Table 48. Laboratory Control Sample Recoveries for WA .......................................................................... 94
Table 49. Laboratory Control Sample Recoveries for GP ........................................................................... 96
Table 50. Laboratory Control Sample Recoveries for ML........................................................................... 97
Table 51. Laboratory Control Sample Recoveries for TM........................................................................... 97
Table 52. Surrogate Recoveries for EX......................................................................................................... 98
Table 53. Surrogate Recoveries for GE ........................................................................................................ 99
Table 54. Surrogate Recoveries for WA........................................................................................................ 99
Table 55. Surrogate Recoveries for ML ...................................................................................................... 100
Table 56. Matrix Spike Recoveries for EX .................................................................................................. 100
Table 57. Matrix Spike Recoveries for GE .................................................................................................. 101
Table 58. Matrix Spike Recoveries for WA.................................................................................................. 103
Table 59. Matrix Spike Recoveries for GP .................................................................................................. 105
Table 60. Matrix Spike Recoveries for ML .................................................................................................. 106
Table 61. Analytes Detected in Method Blanks for EX .............................................................................. 107
Table 62. Analytes Detected in Method Blanks for GE ............................................................................. 110
Table 63. Analytes Detected in Method Blanks for WA ............................................................................. 112
Table 64. Analytes Detected in Method Blanks for GP ............................................................................. 117
Table 65. Analytes Detected in Method Blanks for ML ............................................................................. 119
Table 66. Analytes Detected in Method Blanks for TM ............................................................................. 120
Table 67. Analytes Detected in Field Blanks for EX .................................................................................. 121
Table 68. Analytes Detected in Field Blanks for GE .................................................................................. 121
Table 69. Analytes Detected in Field Blanks for WA.................................................................................. 122
Table 70. Analytes Detected in Field Blanks for GP .................................................................................. 123
Table 71. Analytes Detected in Field Blanks for ML .................................................................................. 124
Table 72 Analytes Detected in Field Blanks for TM .................................................................................. 124
Table 73. Analytes Detected in Trip Blanks for EX .................................................................................... 125
Table 74. Analytes Detected in Trip Blanks for GE.................................................................................... 126

ContentsContentsESH-EMS-2000408ESH-EMS-2000408 Page Page xx Fourth Quarter 2000Fourth Quarter 2000
Table 75. Analytes Detected in Trip Blanks for WA ................................................................................... 127
Table 76. Analytes Detected in Trip Blanks for ML.................................................................................... 128
Table 77. Bailed Wells .................................................................................................................................. 129
Table 78. Sampled Wells with Metal Casings............................................................................................. 130
Table 79. Wells That Had Turbidity Greater Than 15 NTU......................................................................... 130
Table 80. Analyses Not Performed by EX ................................................................................................... 131
Table 81. Analyses Not Performed by GE................................................................................................... 132
Table 82. Analyses Not Performed by WA .................................................................................................. 132
Table 83. Sites and Locations by Well Series ............................................................................................ 133
Table 84. Quality Control Standards for Selected Analyses for MS ........................................................ 157

Executive SummaryExecutive SummaryESH-EMS-2000408ESH-EMS-2000408 Page Page 11 Fourth Quarter 2000Fourth Quarter 2000
Executive SummaryExecutive SummaryThe Environmental Protection Department/Environmental Monitoring Section (EPD/EMS) administers theSavannah River Site’s (SRS) Groundwater Monitoring Program. During fourth quarter 2000, EPD/EMS conductedextensive sampling of monitoring wells.
EPD/EMS has established two sets of flagging criteria to assist in managing sample results. The flagging criteriado not define contamination levels; instead, they aid personnel in sample scheduling, data interpretation, and trendidentification. Since 1991, the flagging criteria have been based on the U.S. Environmental Protection Agency(EPA) drinking water standards and on method detection limits. A detailed explanation of the flagging criteria ispresented in the Flagging Criteria section of this document. Analytical results from fourth quarter 2000 areincluded in this report, an electronic copy of which is made available to all site custodians.
One or more analytes exceeded Flag 2 criteria during fourth quarter 2000 in 50 monitoring well series. Analytesexceeded the current Flag 2 criteria for the first time since 1984 in 12 of those 50 monitoring well series.
Table 1, organized alphabetically by well series, lists those well series with analytical results above Flag 2 criteriaduring fourth quarter 2000. Results from all laboratory analyses that underwent the standard verification andvalidation process are used to generate this table. Specific conductance and pH data from field measurementsalso are included in this table.
Table 1.Table 1. Analytes above Flag 2 CriteriaAnalytes above Flag 2 Criteria
SiteWellSeries Analytes above Flag 2 Criteria
A-Area Metals Burning Pit ABP Aluminum, iron, pH, specific conductance, trichloroethylene
A-Area Coal Pile Runoff ContainmentBasin
ACB Aluminum, iron
Metallurgical Laboratory Seepage Basin AMB Boron, trichloroethylene
Motor Shop Oil Basin AOB Boron, iron, tetrachloroethylene, trichloroethylene
A-Area Burning/Rubble Pits ARP Aluminum, boron, iron, tetrachloroethylene, total organichalogens, trichloroethylene
Injection Wells of the C-Area Reactor AS 1,2-dichloroethylene, trichloroethylene
Burial Grounds Perimeter Wells BGO Aluminum, dissolved, aluminum, bis(2-ethylhexyl) phthalate,boron, carbon-14, chloroethene, 1,1-dichloroethane, cis-1,2-dichloroethylene, 1,1-dichloroethylene,dichloromethane, gross alpha, iodine-129, iron, dissolved,iron, lead, lithium, mercury, nickel-63, nonvolatile beta, pH,radium-226, radium-228, specific conductance, strontium-90, tetrachloroethylene, total alpha-emitting radium, totalorganic carbon, total organic halogens, trichloroethylene,trichlorofluoromethane, tritium
E–Area Vaults near the Burial Grounds BGX Boron, dichloromethane, lithium, manganese, pH, radium-226, specific conductance, total organic carbon, totalorganic halogens, trichloroethylene, tritium
Multiscreened Wells for the Burial GroundComplex Southeast Plume Area
BSE Lithium, nitrate-nitrite as nitrogen, total alpha-emittingradium, trichloroethylene, tritium

Executive SummaryExecutive SummaryESH-EMS-2000408ESH-EMS-2000408 Page Page 22 Fourth Quarter 2000Fourth Quarter 2000
SiteWellSeries Analytes above Flag 2 Criteria
Mixed Waste Management FacilitySouthwestern Plume Interim MeasuresMonitoring Wells
BSW Benzene, boron, chloroethene, chromium, 1,1-dichloroethane, 1,1-dichloroethylene, gross alpha,lithium, mercury, nonvolatile beta, radium-226, specificconductance, tetrachloroethylene, total alpha-emittingradium, total organic carbon, total organic halogens,trichloroethylene, tritium
C-Area Burning/Rubble Pit CRP Aluminum, boron, carbon tetrachloride, chloroethene, cis-1,2-dichloroethylene, 1,2-dichloroethylene, iron, manganese,manganese, nitrite as nitrogen, tetrachloroethylene, totalorganic carbon, total organic halogens, trichloroethylene
D-Area Oil Seepage Basin DOB Aluminum, boron, chloroethene, iron, tetrachloroethylene,total organic carbon, trichloroethylene
D-Area Oil Seepage Basin DOL Nitrate as nitrogen
Surrounding the 288-1F F-Area Ash Basin FAB Aluminum, boron, gross alpha, iron, manganese, total organichalogens
F-Area Burning/Rubble Pits FBP Aluminum, nitrate-nitrite as nitrogen, nonvolatile beta, totalorganic halogens, trichloroethylene
F-Area Canyon Building FCA Lithium, trichloroethylene
F-Area Coal Pile Runoff ContainmentBasin
FCB Aluminum, iron, lithium
F-Area Effluent Treatment Cooling WaterBasin
FET Aluminum
F-Area Seepage Basins GroundwaterRemediation, Hot Spot Extraction Wells
FEX Aluminum, americium-241, cadmium, curium-243/244, iodine-129, radium-226, radium-228, specific conductance,uranium-233/234, uranium-235, uranium-238
F-Area Seepage Basins GroundwaterRemediation, Hot Spot Injection Wells
FIN Aluminum, iodine-129, radium-226, specific conductance,strontium-89/90, uranium-233/234, uranium-238
F-Area Seepage Basins FSB Aluminum, beryllium, cadmium, cobalt, gross alpha, iron,lead, manganese, nitrate-nitrite as nitrogen, nonvolatilebeta, pH, specific conductance, tritium
F-Area Inactive Process Sewer Line Wellsfor Groundwater Assessment
FSL Aluminum, cadmium, gross alpha, lead, nitrate-nitrite asnitrogen, nonvolatile beta, specific conductance, tritium
F-Area Sludge Land Application Site FSS Dissolved aluminum, aluminum, total alpha-emitting radium,total organic carbon, tritium
H-Area Tank Farm Groundwater OperableUnit
HAA Aluminum, iron, total organic halogens
H-Area Seepage Basins GroundwaterRemediation, Hot Spot Extraction Wells
HEX Aluminum, iodine-129, mercury, nickel-63, strontium-89/90
H-Area Seepage Basins GroundwaterRemediation, Hot Spot Injection Wells
HIN Iodine-129, mercury, radium-226, specific conductance
Hazardous Waste/Mixed Waste DisposalFacility
HMD Boron, lithium, radium-228, total organic carbon, tritium

Executive SummaryExecutive SummaryESH-EMS-2000408ESH-EMS-2000408 Page Page 33 Fourth Quarter 2000Fourth Quarter 2000
SiteWellSeries Analytes above Flag 2 Criteria
H-Area Seepage Basins HSB Bis(2-ethylhexyl) phthalate, dichloromethane, gross alpha,lithium, mercury, nitrate-nitrite as nitrogen, nonvolatile beta,pH, specific conductance, total alpha-emitting radium, totalorganic carbon, total organic halogens, tritium
H-Area Inactive Process Sewer Line HSL Nonvolatile beta, tritium
Ford Building Seepage Basin HXB Aluminum, iron
K-Area Disassembly Basin KDB Aluminum, gross alpha, iron, manganese,tetrachloroethylene, total organic carbon, tritium
L-Area Acid/Caustic Basin LAC Aluminum, tetrachloroethylene, trichloroethylene
L-Area Research Wells LAW Tritium
L-Area Oil and Chemical Basin LCO Carbon-14, tetrachloroethylene, trichloroethylene, tritium
L-Area Disassembly Basin LDB Aluminum, iron, lead, manganese, tritium
Sanitary Landfill LFW Aluminum, benzene, chloroethene, 1,1-dichloroethane, grossalpha, iron, lead, mercury, thallium, total organic carbon,trichloroethylene, trichlorofluoromethane, tritium
Miscellaneous Chemical Basin MCB Carbon-14, iron, pH, specific conductance,tetrachloroethylene, total organic halogens,trichloroethylene
M-Area Hazardous Waste ManagementFacility (HWMF)
MSB Aluminum, boron, iron, lead, lithium, manganese, nitrate-nitrite as nitrogen, pH, specific conductance,tetrachloroethylene, total organic halogens,trichloroethylene
B-Area Microbiology Wells P Aluminum
R-Area Reactor Seepage Basins RPC Gross alpha, nonvolatile beta, strontium-90, tritium
Series D, R-Area Reactor Seepage Basinsand R-Area Disassembly Basin
RSD Gross alpha, nonvolatile beta, strontium-90
M-Area Recovery Wells RWM Dichloromethane, tetrachloroethylene, trichloroethylene
Silverton Road Waste Site SRW Aluminum, boron, iron, lead, lithium
T-Area Burying Ground TBG Aluminum, carbon tetrachloride, gross alpha, iron,manganese, nitrate-nitrite as nitrogen, radium-226, radon-222, tetrachloroethylene, total organic halogens,trichloroethylene
TNX Permeable Wall Demonstration WellInstallation
TCM Aluminum, gross alpha, trichloroethylene, uranium
USGS Intrinsic Remediation InvestigationPiezometers in T Area
TIR Aluminum, trichloroethylene
TNX-Area Assessment Wells TNX Aluminum, boron, gross alpha, iron, manganese, total organiccarbon, total organic halogens, trichloroethylene, uranium
TNX-Area Test Recovery Wells TRW Carbon tetrachloride, trichloroethylene

Executive SummaryExecutive SummaryESH-EMS-2000408ESH-EMS-2000408 Page Page 44 Fourth Quarter 2000Fourth Quarter 2000
SiteWellSeries Analytes above Flag 2 Criteria
Old TNX Seepage Basin XSB Aluminum, boron, gross alpha, iron, radium-226, total organiccarbon, total organic halogens, trichloroethylene, uranium
New TNX Seepage Basin YSB Boron, iron
Note: The groundwater samples are unfiltered. Therefore, the results for metals are for total recoverable metals. Analytesin bold were detected at levels above the current Flag 2 criteria for the first time since 1984.

IntroductionIntroductionESH-EMS-2000408ESH-EMS-2000408 Page Page 55 Fourth Quarter 2000Fourth Quarter 2000
IntroductionIntroductionThis report summarizes the Groundwater Monitoring Program conducted by SRS during fourth quarter 2000. Itincludes the analytical data, field data, data review, quality control, and other documentation for this program;provides a record of the program’s activities; and serves as an official record of the analytical results.
EPD/EMS is responsible for providing drilling, sampling, and analytical and data management support for the SRSGroundwater Monitoring Program at approximately 135 waste sites in 17 areas at SRS (see figures 1 and 2 at theend of this section). The majority of this monitoring is required by U.S. Department of Energy (DOE) orders and byfederal and state regulations administered by the USEPA and the South Carolina Department of Health andEnvironmental Control (SCDHEC). The Groundwater Monitoring Program includes the following activities:
• installation, maintenance, and abandonment of monitoring wells
• environmental soil borings
• development of sampling and analytical schedules
• collection and analysis of groundwater samples
• review of analytical and other data
• maintenance of the databases containing groundwater monitoring data
• quality assurance (QA) evaluations of laboratory performance
• reports of results to waste-site facility custodians and the Environmental Protection Department
The custodian of each waste site is responsible for informing EPD/EMS of sampling and analytical requirementsand special requests for the sampling schedule, assisting in review of the data, and making any decisionsregarding groundwater monitoring at the waste site.
Each custodian has access to an electronic copy of this report. Each custodian also receives site-specific data onrequest.
ORGANIZATION OF THIS REPORTORGANIZATION OF THIS REPORTThis report is divided into sections that focus on specific aspects of the SRS Groundwater Monitoring Program.The Executive Summary section presents a listing by waste site and well series of all analytes detected at orabove Flag 2 criteria during the quarter. Analytes detected at or above Flag 2 criteria for the first time since 1984are indicated in bold type.
The Flagging Criteria section lists flagging criteria for analytes and provides a short description of how the criteriawere derived. The Sample Scheduling section discusses the preparation of the sampling schedule and thecriteria for analyte selection.
During sample collection, samplers write comments in the field logbooks that may be pertinent to the analysis ofsamples. Many of the comments concern wells that went dry during sampling or water that appeared colored,turbid, or aerated. These comments are included in the Field Notes section.
Samples are analyzed by the EPD/EMS (EM Lab or EM) Radiological Laboratory at SRS and by one or more off-site laboratories. During fourth quarter 2000, EMAX Laboratories, Inc. (EX), of Torrance, CA; General EngineeringLaboratories (GE), of Charleston, SC; GE Mobile Laboratory (ML) at SRS; and Recra LabNet Philadelphia (WA),of Lionville, PA, were the primary off-site laboratories. Radionuclide analyses were conducted by EnvironmentalPhysics, Inc. (GP), for GE, and Thermo NUtech (TM), a subcontractor for WA. Microseeps, Inc. (MS), of

IntroductionIntroductionESH-EMS-2000408ESH-EMS-2000408 Page Page 66 Fourth Quarter 2000Fourth Quarter 2000
Pittsburgh, PA, performed several analyses for the C-Area Burning Rubble Pit, D-Area Oil Seepage Basin, andMiscellaneous Chemical Basin sampling projects; however, the MS results weren’t available for publication inthis report.
The Analytical Data Review section contains three subsections. The GIMS Data Review Module subsection dis-cusses automated data management activities at EPD/EMS. The Review of the Analytical Data subsection in-cludes a discussion of discrepancies in each laboratory’s analytical data, including results that were considerablyhigher or lower than previous results. This subsection also includes information about the analytical narratives thatwere used as reference materials throughout the data validation process. The Analytical Methods subsection liststhe methods the laboratories used for measuring concentrations of each analyte.
The Quality Control Samples section contains five subsections and discusses the analytical data in terms of thefollowing indicators of data quality: precision, accuracy, representativeness, comparability, and completeness. ThePrecision subsection explains the replicate analysis program, gives the statistical methods used for comparison,and lists the results of the comparisons between the replicate and duplicate analyses. The Accuracy subsectionexamines the relationship between an observed value and an accepted reference value and/or the measure of theover- or underestimation of reported concentrations. The Representativeness subsection describes how ground-water samples can be affected to produce results that may be biased positively or negatively. The Comparabilitysubsection discusses whether the laboratories use the same standardized procedures for sample preparation andanalysis, whether the reporting units are the same, and whether similar quantitation limits were obtained. TheCompleteness section evaluates the amount of useable data that resulted from the data collection.
The Site Index section lists and gives a description of the sites associated with each well series, as well ashistorical information for the sites. A list of terms, abbreviations, and acronyms used in this report can be found inthe Glossary section. References cited are included in the References section. The Addendum section includesresults of MS’s third quarter certified environmental quality control standards from Environmental ResearchAssociates. The Water-Level Data section (Appendix A) includes concurrent water elevations obtained in A/Mand other areas; these data are used by SRS personnel in hydrogeologic studies. The Analytical Results section(Appendix B) includes tables listing the verified and validated analytical results from all laboratories and field datafor all wells sampled during the quarter. The tables appear in alphabetical order by well name. The SamplingBlanks Results section (Appendix C) contains tables listing the analytical results of laboratory tests on samplingblanks.

IntroductionIntroductionESH-EMS-2000408ESH-EMS-2000408 Page Page 77 Fourth Quarter 2000Fourth Quarter 2000
Figure 1.Figure 1. Areas and Locations Monitored for Groundwater QualityAreas and Locations Monitored for Groundwater Quality

IntroductionIntroductionESH-EMS-2000408ESH-EMS-2000408 Page Page 88 Fourth Quarter 2000Fourth Quarter 2000
Figure 2.Figure 2. Separations and Waste Management Areas Monitored for Groundwater QualitySeparations and Waste Management Areas Monitored for Groundwater Quality

Flagging CriteriaFlagging CriteriaESH-EMS-2000408ESH-EMS-2000408 Page Page 99 Fourth Quarter 2000Fourth Quarter 2000
Flagging CriteriaFlagging CriteriaAnalytes in the data tables are assigned flagging levels (0, 1, or 2) depending on their concentrations in a ground-water sample. The flagging levels dictate the scheduling and frequency of groundwater sampling. Beginning firstquarter 1992, flagging criteria were established for all of the constituents currently being analyzed as part of theEPD/EMS Groundwater Monitoring Program, except for certain aesthetic constituents, indicator parameters, majorcations, and common laboratory contaminants and cleaners, which can be analyzed by special request. The flag-ging criteria in table 2 were determined as follows:
Flag 0: Analytical results below Flag 1 and constituents having no flagging criteria were classified as Flag 0.
Flag 1: The Flag 1 criterion for a constituent was set as one-half of the EPA final primary drinking water standard,the EPA proposed primary drinking water standard, or the EPA secondary drinking water standard for thatconstituent. If a constituent did not have an EPA drinking water standard, the Flag 1 criterion was set as five timesa recently published 90th percentile detection limit obtained by one of the primary laboratories.
Flag 2: The Flag 2 criterion for a constituent was set as the EPA final primary drinking water standard, the EPAproposed primary drinking water standard, or the EPA secondary drinking water standard for that constituent. If aconstituent did not have a drinking water standard, the Flag 2 criterion was set as 10 times a recently published90th percentile detection limit obtained by one of the primary laboratories.
The following acronyms are used as abbreviated sources in the flagging criteria table. Complete informationconcerning documents cited can be found in the References section of this report.
APHA American Public Health Association.
APHA Method A specific analytical method for testing constituent levels in a sample as established by theAPHA, American Water Works Association, and Water Pollution Control Federation. See American Public HealthAssociation et al. in References.
EPA U.S. Environmental Protection Agency.
EPA Method A specific analytical method for testing constituent levels. Descriptions of these methods can befound in the EPA publications Methods for Chemical Analysis of Water and Wastes (1983) and Test Methods forEvaluating Solid Waste (1986b) and in the 1991 Code of Federal Regulations, Title 40, Part 136. See Environ-mental Protection Agency in References.
EPD/EMS The Environmental Protection Department/Environmental Monitoring Section at the Savannah RiverSite.
PDWS Primary Drinking Water Standards.
SCDHEC South Carolina Department of Health and Environmental Control.
SDWS Secondary Drinking Water Standards.
Flagging CriteriaFlagging CriteriaESH-EMS-2000408ESH-EMS-2000408 Page Page 1010 Fourth Quarter 2000Fourth Quarter 2000
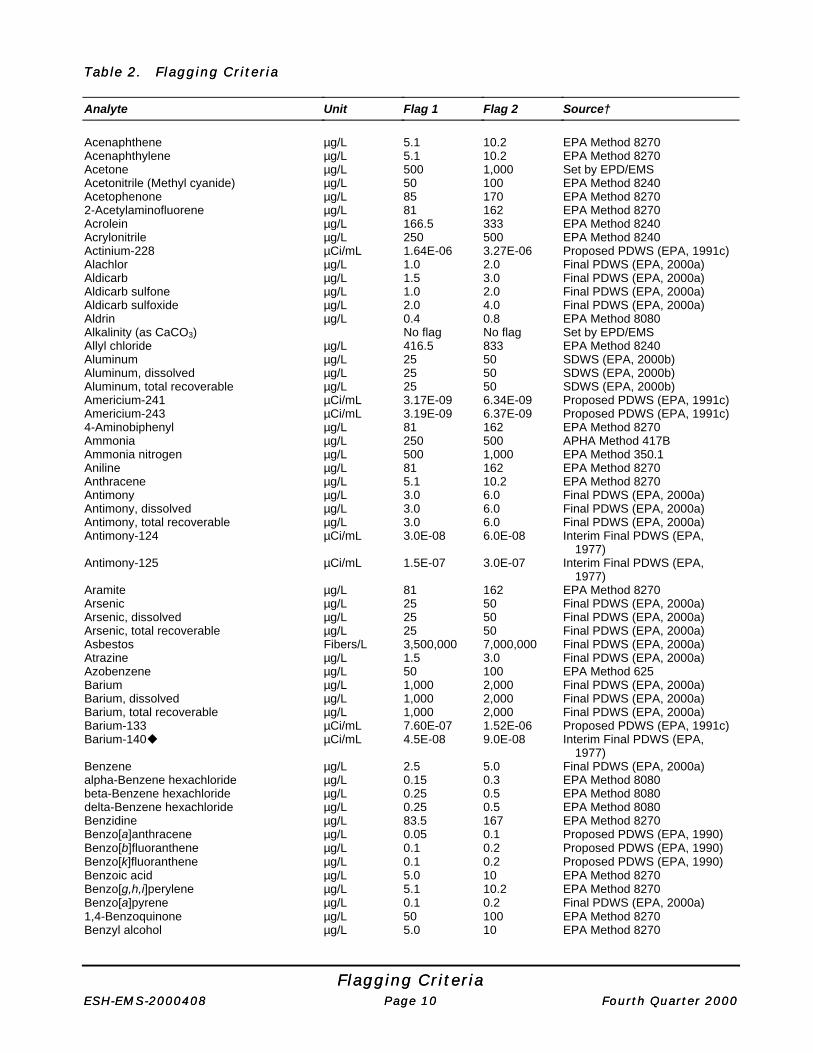
Table 2.Table 2. Flagging CriteriaFlagging Criteria
Analyte Unit Flag 1 Flag 2 Source†
Acenaphthene µg/L 5.1 10.2 EPA Method 8270Acenaphthylene µg/L 5.1 10.2 EPA Method 8270Acetone µg/L 500 1,000 Set by EPD/EMSAcetonitrile (Methyl cyanide) µg/L 50 100 EPA Method 8240Acetophenone µg/L 85 170 EPA Method 82702-Acetylaminofluorene µg/L 81 162 EPA Method 8270Acrolein µg/L 166.5 333 EPA Method 8240Acrylonitrile µg/L 250 500 EPA Method 8240Actinium-228 µCi/mL 1.64E-06 3.27E-06 Proposed PDWS (EPA, 1991c)Alachlor µg/L 1.0 2.0 Final PDWS (EPA, 2000a)Aldicarb µg/L 1.5 3.0 Final PDWS (EPA, 2000a)Aldicarb sulfone µg/L 1.0 2.0 Final PDWS (EPA, 2000a)Aldicarb sulfoxide µg/L 2.0 4.0 Final PDWS (EPA, 2000a)Aldrin µg/L 0.4 0.8 EPA Method 8080Alkalinity (as CaCO3) No flag No flag Set by EPD/EMSAllyl chloride µg/L 416.5 833 EPA Method 8240Aluminum µg/L 25 50 SDWS (EPA, 2000b)Aluminum, dissolved µg/L 25 50 SDWS (EPA, 2000b)Aluminum, total recoverable µg/L 25 50 SDWS (EPA, 2000b)Americium-241 µCi/mL 3.17E-09 6.34E-09 Proposed PDWS (EPA, 1991c)Americium-243 µCi/mL 3.19E-09 6.37E-09 Proposed PDWS (EPA, 1991c)4-Aminobiphenyl µg/L 81 162 EPA Method 8270Ammonia µg/L 250 500 APHA Method 417BAmmonia nitrogen µg/L 500 1,000 EPA Method 350.1Aniline µg/L 81 162 EPA Method 8270Anthracene µg/L 5.1 10.2 EPA Method 8270Antimony µg/L 3.0 6.0 Final PDWS (EPA, 2000a)Antimony, dissolved µg/L 3.0 6.0 Final PDWS (EPA, 2000a)Antimony, total recoverable µg/L 3.0 6.0 Final PDWS (EPA, 2000a)Antimony-124 µCi/mL 3.0E-08 6.0E-08 Interim Final PDWS (EPA,
1977)Antimony-125 µCi/mL 1.5E-07 3.0E-07 Interim Final PDWS (EPA,
1977)Aramite µg/L 81 162 EPA Method 8270Arsenic µg/L 25 50 Final PDWS (EPA, 2000a)Arsenic, dissolved µg/L 25 50 Final PDWS (EPA, 2000a)Arsenic, total recoverable µg/L 25 50 Final PDWS (EPA, 2000a)Asbestos Fibers/L 3,500,000 7,000,000 Final PDWS (EPA, 2000a)Atrazine µg/L 1.5 3.0 Final PDWS (EPA, 2000a)Azobenzene µg/L 50 100 EPA Method 625Barium µg/L 1,000 2,000 Final PDWS (EPA, 2000a)Barium, dissolved µg/L 1,000 2,000 Final PDWS (EPA, 2000a)Barium, total recoverable µg/L 1,000 2,000 Final PDWS (EPA, 2000a)Barium-133 µCi/mL 7.60E-07 1.52E-06 Proposed PDWS (EPA, 1991c)Barium-140u µCi/mL 4.5E-08 9.0E-08 Interim Final PDWS (EPA,
1977)Benzene µg/L 2.5 5.0 Final PDWS (EPA, 2000a)alpha-Benzene hexachloride µg/L 0.15 0.3 EPA Method 8080beta-Benzene hexachloride µg/L 0.25 0.5 EPA Method 8080delta-Benzene hexachloride µg/L 0.25 0.5 EPA Method 8080Benzidine µg/L 83.5 167 EPA Method 8270Benzo[a]anthracene µg/L 0.05 0.1 Proposed PDWS (EPA, 1990)Benzo[b]fluoranthene µg/L 0.1 0.2 Proposed PDWS (EPA, 1990)Benzo[k]fluoranthene µg/L 0.1 0.2 Proposed PDWS (EPA, 1990)Benzoic acid µg/L 5.0 10 EPA Method 8270Benzo[g,h,i]perylene µg/L 5.1 10.2 EPA Method 8270Benzo[a]pyrene µg/L 0.1 0.2 Final PDWS (EPA, 2000a)1,4-Benzoquinone µg/L 50 100 EPA Method 8270Benzyl alcohol µg/L 5.0 10 EPA Method 8270

Flagging CriteriaFlagging CriteriaESH-EMS-2000408ESH-EMS-2000408 Page Page 1111 Fourth Quarter 2000Fourth Quarter 2000
Analyte Unit Flag 1 Flag 2 Source†
Beryllium µg/L 2.0 4.0 Final PDWS (EPA, 2000a)Beryllium, dissolved µg/L 2.0 4.0 Final PDWS (EPA, 2000a)Beryllium, total recoverable µg/L 2.0 4.0 Final PDWS (EPA, 2000a)Beryllium-7 µCi/mL 3.0E-06 6.0E-06 Interim Final PDWS (EPA,
1977)5-day Biochemical oxygen demand No flag No flag Set by EPD/EMSBis(2-chloroethoxy) methane µg/L 5.1 10.2 EPA Method 8270Bis(2-chloroethyl) ether µg/L 5.1 10.2 EPA Method 8270Bis(chloromethyl) ether µg/L 50 100 EPA Method 8270Bis(2-ethylhexyl) phthalate µg/L 3.0 6.0 Final PDWS (EPA, 2000a)Bismuth-214 µCi/mL 9.4E-06 1.89E-05 Proposed PDWS (EPA, 1991c)Boron µg/L 2,500 5,000 EPA Method 6010Boron, dissolved µg/L 2,500 5,000 EPA Method 6010Boron, total recoverable µg/L 2,500 5,000 EPA Method 6010Bromide µg/L 5,000 10,000 EPA Method 300.0Bromobenzene µg/L 25 50 EPA Method 8260Bromochloromethane µg/L 5 10 EPA Method 8260Bromodichloromethane µg/L 50 100 Final PDWS (EPA, 2000a)Bromoform (Methyl bromide) µg/L 50 100 Final PDWS (EPA, 2000a)Bromomethane µg/L 10 20 EPA Method 82404-Bromophenyl phenyl ether µg/L 5.1 10.2 EPA Method 82702-sec-Butyl-4,6-dinitrophenol µg/L 3.5 7.0 Final PDWS (EPA, 2000a)n-Butylbenzene µg/L 5 10 EPA Method 8260sec-Butylbenzene µg/L 5 10 EPA Method 8260tert-Butylbenzene µg/L 5 10 EPA Method 8260Butylbenzyl phthalate No flag No flag Set by EPD/EMSCadmium µg/L 2.5 5.0 Final PDWS (EPA, 2000a)Cadmium, dissolved µg/L 2.5 5.0 Final PDWS (EPA, 2000a)Cadmium, total recoverable µg/L 2.5 5.0 Final PDWS (EPA, 2000a)Calcium No flag No flag Set by EPD/EMSCalcium, dissolved No flag No flag Set by EPD/EMSCalcium, total recoverable No flag No flag Set by EPD/EMSCarbofuran µg/L 20 40 Final PDWS (EPA, 2000a)Carbon disulfide µg/L 25 50 EPA Method 8240Carbon tetrachloride µg/L 2.5 5.0 Final PDWS (EPA, 2000a)Carbon-14 µCi/mL 1.0E-06 2.0E-06 Interim Final PDWS (EPA,
1977)Carbonate No flag No flag Set by EPD/EMSCerium-141u µCi/mL 1.5E-07 3.0E-07 Interim Final PDWS (EPA,
1977)Cerium-144 µCi/mL 1.31E-07 2.61E-07 Proposed PDWS (EPA, 1991c)Cesium-134v µCi/mL 4.07E-08 8.13E-08 Proposed PDWS (EPA, 1991c)Cesium-137 µCi/mL 1.0E-07 2.0E-07 Interim Final PDWS (EPA,
1977)Chemical oxygen demand No flag No flag Set by EPD/EMSChlordane µg/L 1.0 2.0 Final PDWS (EPA, 2000a)alpha-Chlordane µg/L 0.25 0.5 EPA Method 8080gamma-Chlordane µg/L 0.25 0.5 EPA Method 8080Chloride µg/L 125,000 250,000 SDWS (EPA, 2000b)4-Chloroaniline µg/L 5.0 10 EPA Method 8270Chlorobenzene µg/L 50 100 Final PDWS (EPA, 2000a)Chlorobenzilate µg/L 81 162 EPA Method 8270Chloroethane µg/L 10 20 EPA Method 8240Chloroethene (Vinyl chloride) µg/L 1.0 2.0 Final PDWS (EPA, 2000a)Chloroethyl vinyl ether µg/L 5.0 10 EPA Method 82402-Chloroethyl vinyl ether µg/L 50 100 EPA Method 8240Chloroform µg/L 50 100 Final PDWS (EPA, 2000a)4-Chloro-m-cresol µg/L 5.1 10.2 EPA Method 8270Chloromethane (Methyl chloride) µg/L 10 20 EPA Method 82402-Chloronaphthalene µg/L 5.1 10.2 EPA Method 82402-Chlorophenol µg/L 5.1 10.2 EPA Method 82704-Chlorophenyl phenyl ether µg/L 5.1 10.2 EPA Method 8270

Flagging CriteriaFlagging CriteriaESH-EMS-2000408ESH-EMS-2000408 Page Page 1212 Fourth Quarter 2000Fourth Quarter 2000
Analyte Unit Flag 1 Flag 2 Source†
Chloroprene µg/L 1,665 3,330 EPA Method 82402-Chlorotoluene µg/L 25 50 EPA Method 82604-Chlorotoluene µg/L 5 10 EPA Method 8260Chromium µg/L 50 100 Final PDWS (EPA, 2000a)Chromium, dissolved µg/L 50 100 Final PDWS (EPA, 2000a)Chromium, total recoverable µg/L 50 100 Final PDWS (EPA, 2000a)Chromium-51u µCi/mL 3.0E-06 6.0E-06 Interim Final PDWS (EPA,
1977)Chrysene µg/L 0.1 0.2 Proposed PDWS (EPA, 1990)Cobalt µg/L 50 100 EPA Method 6010Cobalt, dissolved µg/L 50 100 EPA Method 6010Cobalt, total recoverable µg/L 50 100 EPA Method 6010Cobalt-57 µCi/mL 5.0E-07 1.0E-06 Interim Final PDWS (EPA,
1977)Cobalt-58 µCi/mL 4.5E-06 9.0E-06 Interim Final PDWS (EPA,
1977)Cobalt-60 µCi/mL 5.0E-08 1.0E-07 Interim Final PDWS (EPA,
1977)Color No flag No flag Set by EPD/EMSCopper µg/L 500 1,000 Final PDWS (SCDHEC, 1981)Copper, dissolved µg/L 500 1,000 Final PDWS (SCDHEC, 1981)Copper, total recoverable µg/L 500 1,000 Final PDWS (SCDHEC, 1981)Corrosivity No flag No flag Set by EPD/EMSm-Cresol (3-Methylphenol) µg/L 50 100 EPA Method 8270o-Cresol (2-Methylphenol) µg/L 5.0 10 EPA Method 8270p-Cresol (4-Methylphenol) µg/L 60 120 EPA Method 8270Curium-242 µCi/mL 6.65E-08 1.33E-07 Proposed PDWS (EPA, 1991c)Curium-243 µCi/mL 4.15E-09 8.30E-09 Proposed PDWS (EPA, 1991c)Curium-243/244µ µCi/mL 4.15E-09 8.30E-09 Proposed PDWS (EPA, 1991c)Curium-244 µCi/mL 4.92E-09 9.84E-09 Proposed PDWS (EPA, 1991c)Curium-245/246µ µCi/mL 3.12E-09 6.23E-09 Proposed PDWS (EPA, 1991c)Curium-246 µCi/mL 3.14E-09 6.27E-09 Proposed PDWS (EPA, 1991c)Cyanide µg/L 100 200 Final PDWS (EPA, 2000a)Dalapon µg/L 100 200 Final PDWS (EPA, 2000a)p,p'-DDD µg/L 0.55 1.1 EPA Method 8080p,p'-DDE µg/L 0.25 0.5 EPA Method 8080p,p'-DDT µg/L 0.85 1.7 EPA Method 8080Diallate µg/L 81 162 EPA Method 8270Dibenz[a,h]anthracene µg/L 0.15 0.3 Proposed PDWS (EPA, 1990)Dibenzofuran µg/L 5.0 10 EPA Method 8270Dibromochloromethane µg/L 50 100 Final PDWS (EPA, 2000a)1,2-Dibromo-3-chloropropane µg/L 0.1 0.2 Final PDWS (EPA, 2000a)1,2-Dibromoethane µg/L 0.025 0.05 Final PDWS (EPA, 2000a)Dibromomethane (Methylene bromide) µg/L 10 20 EPA Method 8240Di-n-butyl phthalate No flag No flag Set by EPD/EMS1,2-Dichlorobenzene µg/L 300 600 Final PDWS (EPA, 2000a)1,3-Dichlorobenzene µg/L 81 162 EPA Method 82701,4-Dichlorobenzene µg/L 37.5 75 Final PDWS (EPA, 2000a)3,3'-Dichlorobenzidine µg/L 5.1 10.2 EPA Method 8270trans-1,4-Dichloro-2-butene µg/L 250 500 EPA Method 8240Dichlorodifluoromethane µg/L 10 20 EPA Method 82401,1-Dichloroethane µg/L 10 20 EPA Method 82401,2-Dichloroethane µg/L 2.5 5.0 Final PDWS (EPA, 2000a)cis-1,2-Dichloroethylene µg/L 35 70 Final PDWS (EPA, 2000a)1,1-Dichloroethylene µg/L 3.5 7.0 Final PDWS (EPA, 2000a)1,2-Dichloroethylene µg/L 25 50 EPA Method 8240trans-1,2-Dichloroethylene µg/L 50 100 Final PDWS (EPA, 2000a)Dichloromethane (Methylene chloride) µg/L 2.5 5.0 Final PDWS (EPA, 2000a)2,4-Dichlorophenol µg/L 5.1 10.2 EPA Method 82702,6-Dichlorophenol µg/L 83.5 167 EPA Method 82702,4-Dichlorophenoxyacetic acid µg/L 35 70 Final PDWS (EPA, 2000a)1,2-Dichloropropane µg/L 2.5 5.0 Final PDWS (EPA, 2000a)

Flagging CriteriaFlagging CriteriaESH-EMS-2000408ESH-EMS-2000408 Page Page 1313 Fourth Quarter 2000Fourth Quarter 2000
Analyte Unit Flag 1 Flag 2 Source†
2,2-Dichloropropane µg/L 5 10 EPA Method 8260cis-1,3-Dichloropropene µg/L 10 20 EPA Method 8240trans-1,3-Dichloropropene µg/L 10 20 EPA Method 8240Dieldrin µg/L 4.15 8.3 EPA Method 8080Di(2-ethylhexyl) adipate µg/L 200 400 Final PDWS (EPA, 2000a)Diethyl phthalate No flag No flag Set by EPD/EMSDimethoate µg/L 81 162 EPA Method 82702,4-Dimethyl phenol µg/L 5.1 10.2 EPA Method 8270Dimethyl phthalate No flag No flag Set by EPD/EMSp-Dimethylaminoazobenzene µg/L 81 162 EPA Method 8270p-(Dimethylamino)ethylbenzene µg/L 50 100 EPA Method 82707,12-Dimethylbenz[a]anthracene µg/L 81 162 EPA Method 82703,3'-Dimethylbenzidine µg/L 81 162 EPA Method 8270a,a-Dimethylphenethylamine µg/L 81 162 EPA Method 82701,3-Dinitrobenzene µg/L 81 162 EPA Method 82702,4-Dinitrophenol µg/L 51 102 EPA Method 82702,4-Dinitrotoluene µg/L 0.5 1.0 EPA Method 82702,6-Dinitrotoluene µg/L 0.5 1.0 EPA Method 8270Di-n-octyl phthalate No flag No flag Set by EPD/EMS1,4-Dioxane µg/L 500 1000 EPA Method 8270Diphenylamine µg/L 81 162 EPA Method 82701,2-Diphenylhydrazine µg/L 83.5 167 EPA Method 8270Diquat dibromide µg/L 10 20 Final PDWS (EPA, 2000a)Dissolved organic carbon µg/L 10,500,000 21,000,000 EPA Method 9060Disulfoton µg/L 81 162 EPA Method 8270Endosulfan I µg/L 0.25 0.5 EPA Method 8080Endosulfan II µg/L 0.55 1.1 EPA Method 8080Endosulfan sulfate µg/L 0.55 1.1 EPA Method 8080Endothall µg/L 50 100 Final PDWS (EPA, 2000a)Endrin µg/L 1.0 2.0 Final PDWS (EPA, 2000a)Endrin aldehyde µg/L 0.85 1.7 EPA Method 8080Endrin ketone No flag No flag Set by EPD/EMSEthyl ether µg/L 50 100 EPA Method 8260Ethyl methacrylate µg/L 2.5 5.0 EPA Method 8270Ethyl methanesulfonate µg/L 81 162 EPA Method 8270Ethylbenzene µg/L 350 700 Final PDWS (EPA, 2000a)Europium-152 µCi/mL 3.0E-08 6.0E-08 Interim Final PDWS (EPA,
1977)Europium-154 µCi/mL 1.0E-07 2.0E-07 Interim Final PDWS (EPA,
1977)Europium-155 µCi/mL 3.0E-07 6.0E-07 Interim Final PDWS (EPA,
1977)Famphur µg/L 81 162 EPA Method 8270Fluoranthene µg/L 5.1 10.2 EPA Method 8270Fluorene µg/L 5.1 10.2 EPA Method 8270Fluoride µg/L 2,000 4,000 Final PDWS (EPA, 2000a)Glyphosate µg/L 350 700 Final PDWS (EPA, 2000a)Gross alpha µCi/mL 7.5E-09 1.5E-08 Final PDWS (EPA, 2000a)Heptachlor µg/L 0.2 0.4 Final PDWS (EPA, 2000a)Heptachlor epoxide µg/L 0.1 0.2 Final PDWS (EPA, 2000a)Heptachlorodibenzo-p-dioxins µg/L 0.007 0.014 EPA Method 82801,2,3,4,6,7,8-HPCDD µg/L 0.007 0.014 EPA Method 8280Heptachlorodibenzo-p-furans µg/L 0.008 0.016 EPA Method 82801,2,3,4,6,7,8-HPCDF µg/L 0.008 0.016 EPA Method 8280Hexachlorobenzene µg/L 0.5 1.0 Final PDWS (EPA, 2000a)Hexachlorobutadiene µg/L 5.0 10 EPA Method 8270Hexachlorocyclopentadiene µg/L 25 50 Final PDWS (EPA, 2000a)Hexachlorodibenzo-p-dioxins µg/L 0.008 0.016 EPA Method 82801,2,3,4,7,8-HXCDD µg/L 0.0105 0.021 EPA Method 8280Hexachlorodibenzo-p-furans µg/L 0.006 0.012 EPA Method 82801,2,3,4,7,8-HXCDF µg/L 0.0085 0.017 EPA Method 8280Hexachloroethane µg/L 0.5 1.0 EPA Method 8270

Flagging CriteriaFlagging CriteriaESH-EMS-2000408ESH-EMS-2000408 Page Page 1414 Fourth Quarter 2000Fourth Quarter 2000
Analyte Unit Flag 1 Flag 2 Source†
Hexachlorophene µg/L 83.5 167 EPA Method 8270Hexachloropropene µg/L 81 162 EPA Method 82702-Hexanone µg/L 50 100 EPA Method 8240Indeno[1,2,3-c,d]pyrene µg/L 0.5 1.0 EPA Method 8270Iodine µg/L 250 500 APHA Method 415AIodine-129 µCi/mL 5.0E-10 1.0E-09 Interim Final PDWS (EPA,
1977)Iodine-131u µCi/mL 1.5E-09 3.0E-09 Interim Final PDWS (EPA,
1977)Iodomethane (Methyl iodide) µg/L 125 250 EPA Method 8240Iron µg/L 150 300 SDWS (EPA, 2000b)Iron, dissolved µg/L 150 300 SDWS (EPA, 2000b)Iron, total recoverable µg/L 150 300 SDWS (EPA, 2000b)Iron-55u µCi/mL 1.0E-06 2.0E-06 Interim Final PDWS (EPA,
1977)Iron-59u µCi/mL 1.0E-07 2.0E-07 Interim Final PDWS (EPA,
1977)Isobutyl alcohol µg/L 834.5 1,669 EPA Method 8240Isodrin µg/L 81 162 EPA Method 8270Isophorone µg/L 5.1 10.2 EPA Method 8270Isopropylbenzene µg/L 5 10 EPA Method 8260p-Isopropyltoluene µg/L 5 10 EPA Method 8260Isosafrole µg/L 81 162 EPA Method 8270Kepone µg/L 81 162 EPA Method 8270Lanthanum-140u µCi/mL 3.0E-08 6.0E-08 Interim Final PDWS (EPA,
1977)Lead µg/L 25 50 Final PDWS (SCDHEC, 1981)Lead, dissolved µg/L 25 50 Final PDWS (SCDHEC, 1981)Lead, total recoverable µg/L 25 50 Final PDWS (SCDHEC, 1981)Lead-212 µCi/mL 6.20E-08 1.23E-07 Proposed PDWS (EPA, 1991c)Lindane µg/L 0.1 0.2 Final PDWS (EPA, 2000a)Lithium µg/L 125 250 EPA Method 6010Lithium, dissolved µg/L 125 250 EPA Method 6010Lithium, total recoverable µg/L 125 250 EPA Method 6010Magnesium No flag No flag Set by EPD/EMSMagnesium, dissolved No flag No flag Set by EPD/EMSMagnesium, total recoverable No flag No flag Set by EPD/EMSManganese µg/L 25 50 SDWS (EPA, 2000b)Manganese, dissolved µg/L 25 50 SDWS (EPA, 2000b)Manganese, total recoverable µg/L 25 50 SDWS (EPA, 2000b)Manganese-54 µCi/mL 1.5E-07 3.0E-07 Interim Final PDWS (EPA,
1977)Mercury µg/L 1.0 2.0 Final PDWS (EPA, 2000a)Mercury, dissolved µg/L 1.0 2.0 Final PDWS (EPA, 2000a)Mercury, total recoverable µg/L 1.0 2.0 Final PDWS (EPA, 2000a)Methacrylonitrile µg/L 416.5 833 EPA Method 8240Methapyrilene µg/L 81 162 EPA Method 8270Methoxychlor µg/L 20 40 Final PDWS (EPA, 2000a)Methyl ethyl ketone No flag No flag Set by EPD/EMSMethyl isobutyl ketone No flag No flag Set by EPD/EMSMethyl methacrylate µg/L 50 100 EPA Method 8270Methyl methanesulfonate µg/L 81 162 EPA Method 8270Methyl tert-butyl ether µg/L 5.0 10 EPA Method 82603-Methylcholanthrene µg/L 81 162 EPA Method 82702-Methyl-4,6-dinitrophenol µg/L 51 102 EPA Method 82702-Methylnaphthalene µg/L 5.0 10 EPA Method 8270Molybdenum µg/L 250 500 EPA Method 6010Molybdenum, dissolved µg/L 250 500 EPA Method 6010Molybdenum, total recoverable µg/L 250 500 EPA Method 6010Naphthalene µg/L 83.5 167 EPA Method 82701,4-Naphthoquinone µg/L 81 162 EPA Method 82701-Naphthylamine µg/L 81 162 EPA Method 8270

Flagging CriteriaFlagging CriteriaESH-EMS-2000408ESH-EMS-2000408 Page Page 1515 Fourth Quarter 2000Fourth Quarter 2000
Analyte Unit Flag 1 Flag 2 Source†
2-Naphthylamine µg/L 81 162 EPA Method 8270Neptunium-237 µCi/mL 3.53E-09 7.06E-09 Proposed PDWS (EPA, 1991c)Neptunium-239 µCi/mL 8.40E-07 1.68E-06 Proposed PDWS (EPA, 1991c)Nickel µg/L 50 100 Final PDWS (EPA, 2000a)Nickel, dissolved µg/L 50 100 Final PDWS (EPA, 2000a)Nickel, total recoverable µg/L 50 100 Final PDWS (EPA, 2000a)Nickel-59 µCi/mL 1.5E-07 3.0E-07 Interim Final PDWS (EPA,
1977)Nickel-63 µCi/mL 2.5E-08 5.0E-08 Interim Final PDWS (EPA,
1977)Niobium-95u µCi/mL 1.5E-07 3.0E-07 Interim Final PDWS (EPA,
1977)Nitrate as nitrogen µg/L 5,000 10,000 Final PDWS (EPA, 2000a)Nitrate-nitrite as nitrogen µg/L 5,000 10,000 Final PDWS (EPA, 2000a)Nitrite as nitrogen µg/L 500 1,000 Final PDWS (EPA, 2000a)m-Nitroaniline µg/L 5.0 10 EPA Method 8270o-Nitroaniline µg/L 5.0 10 EPA Method 8270p-Nitroaniline µg/L 5.0 10 EPA Method 8270Nitrobenzene µg/L 5.1 10.2 EPA Method 8270Nitrogen by Kjeldahl method µg/L 500 1,000 EPA Method 351.22-Nitrophenol µg/L 5.1 10.2 EPA Method 82704-Nitrophenol µg/L 5.1 10.2 EPA Method 82704-Nitroquinoline-1-oxide µg/L 81 162 EPA Method 8270N-Nitrosodi-n-butylamine µg/L 81 162 EPA Method 8270N-Nitrosodiethylamine µg/L 81 162 EPA Method 8270N-Nitrosodimethylamine µg/L 83.5 167 EPA Method 8270N-Nitrosodiphenylamine µg/L 5.1 10.2 EPA Method 8270N-Nitrosodipropylamine µg/L 5.1 10.2 EPA Method 8270N-Nitrosomethylethylamine µg/L 81 162 EPA Method 8270N-Nitrosomorpholine µg/L 81 162 EPA Method 8270N-Nitrosopiperidine µg/L 81 162 EPA Method 8270N-Nitrosopyrrolidine µg/L 81 162 EPA Method 82705-Nitro-o-toluidine µg/L 81 162 EPA Method 8270Nonvolatile beta µCi/mL 2.5E-08 5.0E-08 Interim Final PDWS (EPA,
1977)Octachlorodibenzo-p-dioxin µg/L 0.0085 0.017 EPA Method 8280Octachlorodibenzo-p-furan µg/L 0.0065 0.013 EPA Method 8280Odor No flag No flag Set by EPD/EMSOil & grease µg/L 8,350 16,700 EPA Method 413.1Oxamyl µg/L 100 200 Final PDWS (EPA, 2000a)2,2-Oxybis(1-Chloropropane) µg/L 100 200 EPA Method 8270Parathion µg/L 0.4 0.8 EPA Method 8080Parathion methyl µg/L 0.4 0.8 EPA Method 8080PCB 1016 µg/L 0.25 0.5 Final PDWS (EPA, 2000a)PCB 1221 µg/L 0.25 0.5 Final PDWS (EPA, 2000a)PCB 1232 µg/L 0.25 0.5 Final PDWS (EPA, 2000a)PCB 1242 µg/L 0.25 0.5 Final PDWS (EPA, 2000a)PCB 1248 µg/L 0.25 0.5 Final PDWS (EPA, 2000a)PCB 1254 µg/L 0.25 0.5 Final PDWS (EPA, 2000a)PCB 1260 µg/L 0.25 0.5 Final PDWS (EPA, 2000a)PCB 1262 µg/L 0.25 0.5 Final PDWS (EPA, 2000a)Pentachlorobenzene µg/L 81 162 EPA Method 8270Pentachlorodibenzo-p-dioxins µg/L 0.008 0.016 EPA Method 82801,2,3,7,8-PCDD µg/L 0.0075 0.015 EPA Method 8280Pentachlorodibenzo-p-furans µg/L 0.0085 0.017 EPA Method 82801,2,3,7,8-PCDF µg/L 0.0085 0.017 EPA Method 8280Pentachloroethane µg/L 81 162 EPA Method 8270Pentachloronitrobenzene µg/L 81 162 EPA Method 8270Pentachlorophenol µg/L 0.5 1.0 Final PDWS (EPA, 2000a)pH pH 8.0 10 Set by EPD/EMSpH pH 4.0 3.0 Set by EPD/EMSPhenacetin µg/L 81 162 EPA Method 8270

Flagging CriteriaFlagging CriteriaESH-EMS-2000408ESH-EMS-2000408 Page Page 1616 Fourth Quarter 2000Fourth Quarter 2000
Analyte Unit Flag 1 Flag 2 Source†
Phenanthrene µg/L 5.1 10.2 EPA Method 8270Phenol µg/L 83.5 167 EPA Method 8270Phenols µg/L 50 100 EPA Method 420.1p-Phenylenediamine µg/L 81 162 EPA Method 8270Phorate µg/L 0.85 1.7 EPA Method 8080Picloram µg/L 250 500 Final PDWS (EPA, 2000a)2-Picoline µg/L 81 162 EPA Method 8270Plutonium-238 µCi/mL 3.51E-09 7.02E-09 Proposed PDWS (EPA, 1991c)Plutonium-239 µCi/mL 3.11E-08 6.21E-08 Proposed PDWS (EPA, 1991c)Plutonium-239/240µ µCi/mL 3.11E-08 6.21E-08 Proposed PDWS (EPA, 1991c)Plutonium-240 µCi/mL 3.11E-08 6.22E-08 Proposed PDWS (EPA, 1991c)Plutonium-241u µCi/mL 3.13E-08 6.26E-08 Proposed PDWS (EPA, 1991c)Plutonium-242u µCi/mL 3.27E-08 6.54E-08 Proposed PDWS (EPA, 1991c)Potassium No flag No flag Set by EPD/EMSPotassium, dissolved No flag No flag Set by EPD/EMSPotassium, total recoverable No flag No flag Set by EPD/EMSPotassium-40 µCi/mL 1.5E-07 3.0E-07 Proposed PDWS (EPA, 1986a)Promethium-144 µCi/mL 5.0E-08 1.0E-07 EPA Method 901.1Promethium-146 µCi/mL 5.0E-08 1.0E-07 EPA Method 901.1Promethium-147 µCi/mL 2.62E-06 5.24E-06 Proposed PDWS (EPA, 1991c)Pronamid µg/L 81 162 EPA Method 8270Propionitrile µg/L 1,665 3,330 EPA Method 8240n-Propylbenzene µg/L 5 10 EPA Method 8260Pyrene µg/L 5.1 10.2 EPA Method 8270Pyridine µg/L 81 162 EPA Method 8270Radium-226 µCi/mL 2.5E-09 5.0E-09 Interim Final PDWS (EPA,
1977)Radium-228 µCi/mL 2.5E-09 5.0E-09 Interim Final PDWS (EPA,
1977)Radon-222 µCi/mL 1.5E-07 3.0E-07 Proposed PDWS (EPA, 1991c)Ruthenium-103u µCi/mL 1.0E-07 2.0E-07 Interim Final PDWS (EPA,
1977)Ruthenium-106 µCi/mL 1.5E-08 3.0E-08 Interim Final PDWS (EPA,
1977)Safrole µg/L 81 162 EPA Method 8270Selenium µg/L 25 50 Final PDWS (EPA, 2000a)Selenium, dissolved µg/L 25 50 Final PDWS (EPA, 2000a)Selenium, total recoverable µg/L 25 50 Final PDWS (EPA, 2000a)Silica No flag No flag Set by EPD/EMSSilica, dissolved No flag No flag Set by EPD/EMSSilica, total recoverable No flag No flag Set by EPD/EMSSilver µg/L 50 100 SDWS (EPA, 2000b)Silver, dissolved µg/L 50 100 SDWS (EPA, 2000b)Silver, total recoverable µg/L 50 100 SDWS (EPA, 2000b)Simazine µg/L 2.0 4.0 Final PDWS (EPA, 2000a)Sodium No flag No flag Set by EPD/EMSSodium, dissolved No flag No flag Set by EPD/EMSSodium, total recoverable No flag No flag Set by EPD/EMSSodium-22 µCi/mL 2.33E-07 4.66E-07 Proposed PDWS (EPA, 1991c)Specific conductance µS/cm 250 500 Set by EPD/EMSStrontium-89 µCi/mL 1.0E-08 2.0E-08 Interim Final PDWS (EPA,
1977)Strontium-89/90µ µCi/mL 4.0E-09 8.0E-09 Final PDWS (EPA, 2000a)Strontium-90 µCi/mL 4.0E-09 8.0E-09 Final PDWS (EPA, 2000a)Styrene µg/L 50 100 Final PDWS (EPA, 2000a)Sulfate µg/L 200,000 400,000 Proposed PDWS (EPA, 1990)Sulfide µg/L 8,350 16,700 EPA Method 9030Sulfotepp µg/L 81 162 EPA Method 8270Surfactants No flag No flag Set by EPD/EMS2,4,5-T µg/L 0.25 0.5 EPA Method 81502,3,7,8-TCDD µg/L 0.007 0.014 Final PDWS (EPA, 2000a)2,3,7,8-TCDF µg/L 0.00425 0.0085 EPA Method 8280

Flagging CriteriaFlagging CriteriaESH-EMS-2000408ESH-EMS-2000408 Page Page 1717 Fourth Quarter 2000Fourth Quarter 2000
Analyte Unit Flag 1 Flag 2 Source†
Technetium-99 µCi/mL 4.5E-07 9.0E-07 Interim Final PDWS (EPA,1977)
1,2,4,5-Tetrachlorobenzene µg/L 81 162 EPA Method 8270Tetrachlorodibenzo-p-dioxins µg/L 0.007 0.014 EPA Method 8280Tetrachlorodibenzo-p-furans µg/L 0.0055 0.011 EPA Method 82801,1,1,2-Tetrachloroethane µg/L 10 20 EPA Method 82401,1,2,2-Tetrachloroethane µg/L 50 100 EPA Method 8240Tetrachloroethylene µg/L 2.5 5.0 Final PDWS (EPA, 2000a)2,3,4,6-Tetrachlorophenol µg/L 83.5 167 EPA Method 8270Thallium µg/L 1.0 2.0 Final PDWS (EPA, 2000a)Thallium, dissolved µg/L 1.0 2.0 Final PDWS (EPA, 2000a)Thallium, total recoverable µg/L 1.0 2.0 Final PDWS (EPA, 2000a)Thionazin µg/L 81 162 EPA Method 8270Thorium-228 µCi/mL 6.25E-08 1.25E-07 Proposed PDWS (EPA, 1991c)Thorium-230 µCi/mL 3.96E-08 7.92E-08 Proposed PDWS (EPA, 1991c)Thorium-232 µCi/mL 4.4E-08 8.8E-08 Proposed PDWS (EPA, 1991c)Thorium-234u µCi/mL 2.0E-07 4.01E-07 Proposed PDWS (EPA, 1991c)Tin µg/L 250 500 EPA Method 282.2Tin, dissolved µg/L 250 500 EPA Method 282.2Tin, total recoverable µg/L 250 500 EPA Method 282.2Tin-113 µCi/mL 1.5E-07 3.0E-07 Interim Final PDWS (EPA,
1977)Toluene µg/L 500 1,000 Final PDWS (EPA, 2000a)o-Toluidine µg/L 81 162 EPA Method 8270Total alpha-emitting radium µCi/mL 2.5E-09 5.0E-09 Interim Final PDWS (EPA,
1977)Total carbon µg/L 5,000 10,000 EPA Method 9060Total coliform N/A 0 0 Final PDWS (EPA, 2000a)Total dissolved solids No flag No flag Set by EPD/EMSTotal hydrocarbons µg/L 5,000 10,000 EPA Method 418.1Total inorganic carbon µg/L 8,350 16,700 EPA Method 9060Total organic carbon µg/L 500,000 1,000,000 EPA Method 9060Total organic halogens µg/L 50 100 EPA Method 9020Total organic nitrogen µg/L 500 1,000 APHA Method 420Total petroleum hydrocarbons µg/L 8,350 16,700 EPA Method 418.1Total phosphates (as P) No flag No flag Set by EPD/EMSTotal phosphorus No flag No flag Set by EPD/EMSToxaphene µg/L 1.5 3.0 Final PDWS (EPA, 2000a)2,4,5-TP (Silvex) µg/L 25 50 Final PDWS (EPA, 2000a)Tributyl phosphate µg/L 86 172 EPA Method 82701,2,3-Trichlorobenzene µg/L 5 10 EPA Method 82601,2,4-Trichlorobenzene µg/L 35 70 Final PDWS (EPA, 2000a)1,1,1-Trichloroethane µg/L 100 200 Final PDWS (EPA, 2000a)1,1,2-Trichloroethane µg/L 2.5 5.0 Final PDWS (EPA, 2000a)Trichloroethylene µg/L 2.5 5.0 Final PDWS (EPA, 2000a)Trichlorofluoromethane µg/L 10 20 EPA Method 82402,4,5-Trichlorophenol µg/L 5.0 10 EPA Method 82702,4,6-Trichlorophenol µg/L 0.5 1.0 EPA Method 82701,2,3-Trichloropropane µg/L 10 20 EPA Method 8240Trichlorotrifluoroethane µg/L 50 100 EPA Method 8260O,O,O-Triethyl phosphorothioate µg/L 81 162 EPA Method 82701,2,4-Trimethylbenzene µg/L 5 10 EPA Method 82601,3,5-Trimethylbenzene µg/L 5 10 EPA Method 82601,3,5-Trinitrobenzene µg/L 81 162 EPA Method 8270Tritium µCi/mL 1.0E-05 2.0E-05 Final PDWS (EPA, 2000a)TurbidityX No flag No flag Set by EPD/EMSUranium µg/L 10 20 Proposed PDWS (EPA, 1991c)Uranium alpha activity µCi/mL 1.5E-08 3.0E-08 Proposed PDWS (EPA, 1991c)Uranium, dissolved µg/L 10 20 Proposed PDWS (EPA, 1991c)Uranium, total recoverable µg/L 10 20 Proposed PDWS (EPA, 1991c)Uranium-233/234µ µCi/mL 6.9E-09 1.38E-08 Proposed PDWS (EPA, 1991c)Uranium-234 µCi/mL 6.95E-09 1.39E-08 Proposed PDWS (EPA, 1991c)

Flagging CriteriaFlagging CriteriaESH-EMS-2000408ESH-EMS-2000408 Page Page 1818 Fourth Quarter 2000Fourth Quarter 2000
Analyte Unit Flag 1 Flag 2 Source†
Uranium-235 µCi/mL 7.25E-09 1.45E-08 Proposed PDWS (EPA, 1991c)Uranium-238 µCi/mL 7.3E-09 1.46E-08 Proposed PDWS (EPA, 1991c)Vanadium µg/L 66.5 133 EPA Method 6010Vanadium, dissolved µg/L 66.5 133 EPA Method 6010Vanadium, total recoverable µg/L 66.5 133 EPA Method 6010Vinyl acetate µg/L 50 100 EPA Method 8240m/p-Xylene µg/L 81 162 EPA Method 8260o-Xylene µg/L 5 10 EPA Method 8260Xylenes µg/L 5,000 10,000 Final PDWS (EPA, 2000a)Yttrium-88 µCi/mL 5.0E-08 1.0E-07 EPA Method 901.1Zinc µg/L 2,500 5,000 SDWS (EPA, 2000b)Zinc, dissolved µg/L 2,500 5,000 SDWS (EPA, 2000b)Zinc, total recoverable µg/L 2,500 5,000 SDWS (EPA, 2000b)Zinc-65 µCi/mL 1.5E-07 3.0E-07 Interim Final PDWS (EPA,
1977)Zirconium-95 µCi/mL 1.0E-07 2.0E-07 Interim Final PDWS (EPA,
1977)Zirconium/Niobium-95u µCi/mL 1.0E-07 2.0E-07 Interim Final PDWS (EPA,
1977)
† Analytical methods are discussed in the Analytical Data Review section of this document; references for dated sourcesare in the References section.uEMS discontinued monitoring this radionuclide because it is inappropriate for the SRS Groundwater Monitoring Program.vEPD/EMS set this flagging criterion using the 1991 proposed PDWS because the final PDWS in 1977 may have been in
error.µWhen radionuclide analyses are combined, the lower DWS of the two isotopes is used for flagging.X The primary maximum contaminant level range for turbidity is 1−5 NTU, which is inappropriate for the SRS Groundwater
Monitoring Program.
Note: Beginning fourth quarter 1992, samples were no longer filtered at the wells. Therefore, the methods for analyzingmetals now include a digestion step. Beginning fourth quarter 1993, the laboratories were required to report allmetals as total recoverable metals. Flagging criteria remain unchanged.

Sample SchedulingSample SchedulingESH-EMS-2000408ESH-EMS-2000408 Page Page 1919 Fourth Quarter 2000Fourth Quarter 2000
Sample SchedulingSample SchedulingScheduling of sampling and analyses for the SRS Groundwater Monitoring Program conducted by EPD/EMSis based on several factors. Environmental screening is scheduled on a regular basis. Additional scheduling isbased on previous flagging levels, regulatory requirements, and special requests that fall within the scope of theGroundwater Monitoring Program. This information is used to generate The Savannah River Site’s Ground-water Monitoring Program 2000 Sampling Schedule.
A breakdown by laboratory of the total number of analyses performed during fourth quarter 2000 follows:
Laboratory Number of AnalysesEMAX Laboratories, Inc. 13,210Environmental Physics 5,572General Engineering Laboratories 7,178General Engineering Mobile Laboratory 3,036Recra LabNet Philadelphia 27,649Thermo NUtech 2,217
ENVIRONMENTAL SCREENINGENVIRONMENTAL SCREENINGNew wells designated as screening program wells are scheduled initially for four quarters of environmentalscreening. Environmental-screening constituents, which include indicator parameters, groundwater qualitycharacteristics, and some drinking water characteristics, are listed below. After the initial four quarters ofanalyses for new wells, environmental screening is scheduled once every three years for wells identified asenvironmental-screening program wells. The wells are sampled only for the environmental-screeningconstituents that have not been analyzed for other reasons within the past three years.
Beginning in 1996, EPD/EMS changed its policy concerning quarterly field measurements. Only wellsscheduled by request or wells identified for environmental screening receive field measurements.
Environmental-Screening Constituents
Aluminum Water temperature Total phosphates (as P)Arsenic Well condition TritiumBarium FluorideBoron Gross alphaCadmium IronChloride LeadChromium LithiumField measurements Major ions
Air temperature CalciumDate MagnesiumDepth to water PotassiumFlow rate SilicapH ManganesePhenolphthalein alkalinity MercuryProgram Nitrate-nitrite as nitrogenSampling method Nonvolatile betaSite code SeleniumSpecific conductance SilverStabilized (Yes or No) SodiumTime SulfateTotal alkalinity Total dissolved solidsTurbidity Total organic carbonVolume purged Total organic halogens

Sample SchedulingSample SchedulingESH-EMS-2000408ESH-EMS-2000408 Page Page 2020 Fourth Quarter 2000Fourth Quarter 2000
Scheduling Based on Flagging LevelsScheduling Based on Flagging Levels
Only the flagging criteria for environmental screening and GC VOA (see Glossary) are used to triggerscheduling. Wells are grouped for scheduling by monitoring site or by the investigation for which they aresampled. Specific criteria for Flag 1 and Flag 2 designations are found in the Flagging Criteria section of thisreport.
Beginning in 1996, only wells in the environmental-screening program were scheduled by flagging criteria oncea year. Constituents classified as Flag 0 in each well series are scheduled for analyses only by custodianrequest or as part of the triennial environmental-screening program. If an analytical result for an environmental-screening or GC VOA analysis in any well exceeds Flag 2 or Flag 1, the environmental-screening wells in thesame monitoring series are sampled and analyzed for that constituent once a year. If a constituent falls belowFlag 2 for three consecutive sampling events, the individual well’s flag is reduced from Flag 2 status to Flag 1 orFlag 0 status, depending on the results, and the well is scheduled according to the lower flag. If a constituentfalls below Flag 1 for three consecutive sampling events, the individual well’s flag is reduced from Flag 1 statusto Flag 0 status, and the flagging-based sampling ceases.
If an environmental-screening or GC VOA constituent has ever been flagged in a well series, it automaticallyis flagged for all new wells of that series that are designated as environmental-screening wells. The rulespreviously referred to also apply to removal of a flag from a new well.
When one or more of the five constituents in the GC VOA suite are flagged, the entire suite is scheduled foranalysis. The GC VOA suite includes the following constituents: carbon tetrachloride, chloroform,tetrachloroethylene, 1,1,1-trichloroethane, and trichloroethylene.
The following constituents are exceptions to the flagging rules but still receive analyses by custodian requestor during triennial environmental-screening analyses:
• Specific conductance and pH, two indicator constituents, have flagging criteria but do not trigger thescheduling mechanism.
• No flags are set for the following indicator parameters and major cations: alkalinity, 5-day biochemicaloxygen demand, calcium, carbonate, chemical oxygen demand, magnesium, potassium, silica, sodium,total dissolved solids, total phosphates (as P), and total phosphorus.
• Aesthetic analyses such as color, odor, corrosivity, Eh, turbidity, and surfactants are not assignedflagging criteria but may be analyzed by special request.
• Common laboratory contaminants and cleaners including phthalates, dichloromethane (methylenechloride), ketones, and toluene are not assigned flagging criteria unless they have primary drinkingwater standards. These constituents may be analyzed by special request.
GCMS VOA ANALYSESGCMS VOA ANALYSES
All wells are reviewed for total organic halogens (TOH) results twice a year. GCMS VOA (see Glossary) isscheduled once for individual wells that are designated as environmental-screening wells, have had two resultsfor TOH greater than 10 µg/L (excluding the first TOH analysis), and have never received GCMS VOA analysis.
SAMPLING REQUESTSSAMPLING REQUESTSMany analyses are scheduled at the request of various SRS groups. The person or group requesting ananalysis must submit a formal sampling request form to EPD/EMS. If the request is within the scope of theGroundwater Monitoring Program, and if provision for the analysis has been made in the current laboratorycontract, the analysis is added to the sampling schedule. Likewise, if a sampling request needs to be deleted,the originator of the request must submit a deletion form.

Sample SchedulingSample SchedulingESH-EMS-2000408ESH-EMS-2000408 Page Page 2121 Fourth Quarter 2000Fourth Quarter 2000
Regulatory RequirementsRegulatory RequirementsAll regulatory sampling requirements, such as those mandated by the Resource Conservation and RecoveryAct (RCRA), are scheduled by request.
Changes in SamplingChanges in SamplingFor changes in sampling for fourth quarter 2000, please refer to The Savannah River Site’s GroundwaterMonitoring Program 2000 Sampling Schedule.
The following RCRA Facility Investigation/Remedial Investigation (RFI/RI) and South Carolina Department ofHealth and Environmental Control (SCDHEC) projects were in process during fourth quarter 2000:
• A- and M-Area
• F- and H-Area Seepage Basins
• F- and H-Area Water Treatment Unit Injection Tanks
• F- and H-Area Water Treatment unit Extraction Tank
• Mixed Waste Management Facility
• Purge Water Management System
• Sanitary Landfill
CERCLA ProjectsCERCLA ProjectsThe following Comprehensive Environmental Response, Compensation, and Liability Act (CERCLA) projectswere scheduled for sampling during fourth quarter 2000:
• C-Area Burning/Rubble Pit
• D-Area Oil Seepage Basin
• K-Area Disassembly Basin
• L-Area Disassembly Basin
• Miscellaneous Chemical Basin
• R-Area Burning/Rubble Pits
• R-Area Reactor Seepage Basin
• Road A Chemical Basin
• Silverton Road Waste Site
• TNX Area

Sample SchedulingSample SchedulingESH-EMS-2000408ESH-EMS-2000408 Page Page 2222 Fourth Quarter 2000Fourth Quarter 2000
MAINTENANCE, ACCESS, OR OTHER PROBLEMSMAINTENANCE, ACCESS, OR OTHER PROBLEMSThe following wells were not sampled for environmental screening:
ASB 1A, 3AR, 6A; CMP 8, 10D, 11D; CSD 8D; CSO 1; CSR 2D, 5D, 6D; DCB 4A, 5A, 6, 8, 10 12, 13, 15, 16R;FCA 2D; HAP 2; HCA 1, 2, 3, 4, 4A, 4AA, 4B, 4C; HCB 1, 2, 3, 4; HET 1D, 2D, 3D, 4D; HHP 1D, 2D; HR314DU, 15DU; HR8 12, 13; HWP 2D; HWS 1A, 2; KAB 2, 4; KBP 1D, 2D; KRB 16D, 17D, 19D; KSM 1D; KSB5D; LAC 2, 3; LBP 1D, 2D, 3D; LRP 1, 2, 3, 4; NBG 1, 2, 3, 4, 5; P 29D; PBP 1D, 2D, 3D; PCB 1A, 2A, 3A, 4A;PDB 2, 3, 4, 5; PRP 1A, 3, 4; PSB 1A, 2A, 3A, 4A, 5A, 6A, 7A; RBP 1D, 2D, 3D; SBG 2, 3, 6; SCA 1, 2, 3, 3A,4, 4A, 5, 6; SLP 1, 2; and YSC 2D
Wells FBP 2A and FCB 2 were not sampled due to broken pumps.
Wells ABP 9B and SRW 19 were not sampled due to mechanical problems.
Well TNX 35D was not sampled due to high turbidity.
Well MSB 14C was not sampled because it needed redevelopment.
Wells BGO 53D; BSW 2C3, 3C2, 3C3, 3D1, 6D1, 7D1; and FAL 4D were not sampled, but no reason wasgiven.
DRY WELLSDRY WELLSThe following wells were not sampled because they were dry during fourth quarter 2000:
AMB 6; BGO 40D; BSE 1C2, 1C4, 1D1, 1D2, 1D3, 2C1, 2C2, 2C3, 2C4, 3C1, 3C2, 3C3, 3C4, 3D1, 3D2, 3D3;BSW 2D1, 3C1, 4D1, 6D2; CRP 3D (December event); FAL 2; FBP 6D; FSB106D; HSB113D; MCB 11D; MSB8A; RPC 4DU, 6DU, 8DU, 10DU; and RSE 7, 10.
NEW WELLSNEW WELLSThe following wells were scheduled to be sampled for the first time during fourth quarter 2000:
BSW 1C1, 1C2, 1C3, 1C4, 1D1, 1D2, 1D3, 2C1, 2C2, 2C3, 2D1, 2D2, 2D3, 3C1, 3C2, 3C3, 3C4, 3D1, 3D2,4C1, 4C2, 4C3, 4D1, 4D2, 4D3, 5C1, 5C2, 5C3, 5C4, 5D1, 5D2, 5D3, 6C1, 6C2, 6C3, 6C4, 6D1, 6D2, 6D3,7C1, 7C2, 7C3, 7C4, 7D1, 7D2, 7D3, 8C1, 8C2, 8C3, 8C4, 8D1, 8D2, 8D3; RPC 3DL, 4DL, 5DL, 6DL, 7DL,7DU, 9DL, 9DU, 11DM, 13DU, 14DU; and RRP 5D, 6D, 7D.

Field NotesField NotesESH-EMS-2000408ESH-EMS-2000408 Page Page 2323 Fourth Quarter 2000Fourth Quarter 2000
Field NotesField NotesA sampler may visit a well to collect field data, collect samples, and/or measure depth to water. A well may bevisited multiple times during a quarter for any combination of these reasons. Field measurements generallyinclude air temperature, depth to water prior to pumping, flow rate, pH, phenolphthalein alkalinity, specificconductance, total alkalinity, turbidity, volume of water purged prior to sampling, and water temperature.Dissolved oxygen and Eh (REDOX potential) can be obtained by special request.
EPD/EMS personnel and RCS Corporation of Aiken, SC, performed well visitations during fourth quarter 2000.Each sampler maintained a field notebook. These notebooks are in the fourth quarter 2000 section of theEPD/EMS Groundwater Monitoring Library. All well visitations were routine during fourth quarter 2000, except asindicated in table 3. The table includes samplers’ comments about conditions that may affect the samples or thedata-collection process.
The majority of wells sampled during fourth quarter 2000 were pumped. Bailed wells are listed in table 77 in theQuality Control Samples section.
If a well pumps or is bailed dry during purging and is revisited and sampled within 24 hours, this is consideredone sampling event yielding a single set of field and analytical data. For such wells, table 3 lists the volumepurged before the well went dry during the first visitation. The Analytical Results section gives the total amountof water purged from each well in one sampling event.
Comments about dry wells and continuously pumping wells are also in the Analytical Results section.
Figure 3. Three Types of Groundwater Monitoring WellheadsFigure 3. Three Types of Groundwater Monitoring Wellheads

Field NotesField NotesESH-EMS-2000408ESH-EMS-2000408 Page Page 2424 Fourth Quarter 2000Fourth Quarter 2000
Table 3.Table 3. Comments from the Field DaComments from the Field Datata
Well Date Comments
ABP Series
ABP 8C 12/12/00 Purged through sample portABP 9B 12/14/00 Under currentABP 10D 11/01/00 Purge through port 7 gal
ACB Series
ACB 2A 10/24/00 Equipment failureACB 3A 10/24/00 High turbidity; purged 11 gal through sample port; tubing
cracked
AMB Series
AMB 6 10/24/00 No water to surface; dry wellAMB 7 11/01/00 Purged through port
AOB Series
AOB 1 10/17/00 No water in standpipeAOB 3 10/17/00 Pumped dry
10/18/00 Sampled after recovery
BGO Series
BGO 1D 12/05/00 Dry after 13 gal; dirty/red water; flow slowed and notregistering on meter; purged through sample port
12/06/00 Purged through port; sampled after recoveryBGO 2D 12/08/00 Flowmeter not operatingBGO 3A 12/08/00 Purged through sample portBGO 3C 12/08/00 Purged through sample portBGO 3DR 11/08/00 Broken
11/09/00 Broken; variable box overload during sampling11/15/00 Overloaded variable box11/16/00 Pump inoperable
BGO 4D 12/16/00 No water in standpipe; purged through sample portBGO 5D 12/18/00 Pumped dry; sampled after recoveryBGO 6D 11/02/00 Purged through sample portBGO 8AR 12/18/00 Not enough water to reach surface
12/22/00 High turbidity; sandBGO 9AA 11/02/00 Pumped dry; high pH; purged through sample port;
sampled after recoveryBGO 10B 11/02/00 Dry after 92 gal; pump is surging, keeps slowing itself
down; aerated; sampled after recoveryBGO 10C 12/01/00 Dry after 32 gal; sampled after recoveryBGO 10DR 12/01/00 Dry after 3 gal; sampled after recoveryBGO 12CX 11/28/00 Purged through sample portBGO 12DR 12/15/00 Purged through port due to low volume for purgeBGO 13DR 12/15/00 Pumped dry; sampled after recoveryBGO 16D 11/01/00 Dry after 1 gal
11/02/00 Sampled after recoveryBGO 17DR 11/02/00 Dry after 14 gal; sampled after recoveryBGO 20A 11/10/00 Pumped dry
11/13/00 Variable box overload12/18/00 Variable box overloaded12/21/00 Flowmeter not working; purged 5 gal through port
BGO 21D 11/13/00 Dry after 7 gal; sampled after recovery;BGO 24D 11/13/00 Dry after 3 gal
11/14/00 Sampled after recoveryBGO 25A 11/08/00 Surging; well cap loose; do not have proper replacement,
therefore air in standpipe causing surges; purgedthrough port
BGO 26A 11/28/00 Dry after 33 gal; sampled after recovery

Field NotesField NotesESH-EMS-2000408ESH-EMS-2000408 Page Page 2525 Fourth Quarter 2000Fourth Quarter 2000
Well Date Comments
BGO 26D 11/06/00 Dry after 6 gal; sampled after recoveryBGO 27D 11/14/00 Dry after 8 gal
12/16/00 Pumped dry12/17/00 Dry after 1 gal; sampled after recovery
BGO 28D 11/08/00 Dry after 6 gal; purged after recoveryBGO 29A 11/13/00 Dry after 41 gal; sampled after recoveryBGO 29D 11/13/00 Dry after 5 gal; sampled after recoveryBGO 30C 11/06/00 Dry after 41 gal; sampled after recoveryBGO 31C 11/15/00 Flowmeter leaking at bottomBGO 31D 12/01/00 Pumped dry
12/16/00 Pumped dry12/17/00 Sampled after recovery
BGO 32D 12/17/00 Dry after 11 gal; dirty water12/18/00 Sample port broken; pipes frozen; sampled after recovery
BGO 33D 11/14/00 Dry after 8 gal12/16/00 Pumped dry12/17/00 Sampled after recovery
BGO 34D 12/16/00 Pumped dry12/18/00 Pumped dry12/19/00 Sampled after recovery
BGO 35D 12/16/00 Pumped dry12/19/00 Sampled after recovery
BGO 36D 11/13/00 Flowmeter not operatingBGO 37D 12/16/00 Pumped dry
12/18/00 Pumped dry12/19/00 Pumped dry12/20/00 Sampled after recovery
BGO 38D 11/10/00 Dirty water; flow slowed; purged through port in 5-galbucket
BGO 39A 11/13/00 Dry after 15 galBGO 39D 11/13/00 Dry after 5 gal
12/06/00 Dry after 6 gal12/07/00 Sampled after recovery
BGO 40D 11/13/00 Not enough water to sample; water level came up to 70.4ft.
BGO 41A 12/18/00 Dry after 19 gal; sampled after recovery12/21/00 Connection lost temporarily; re-established connection
BGO 42C 12/18/00 Well was not sampled due to physical problemBGO 43A 11/07/00 Dry after 15 gal; high conductivity, purged through port;
sampled after recoveryBGO 43CR 11/07/00 Dry after 21 gal; pump surging; purged 5 gal through port;
sampled after recoveryBGO 43D 11/07/00 pH jumpingBGO 44B 12/15/00 Dry after 35 gal; sampled after recoveryBGO 44C 11/08/00 Dry after 7 gal; surging; purged through port; sampled
after recovery12/15/00 Dry after 14 gal12/16/00 Sampled after recovery
BGO 44D 11/08/00 No water in standpipeBGO 45A 11/13/00 Flowmeter not operatingBGO 45B 12/15/00 Dry after 48 gal; sampled after recovery; surgingBGO 45C 12/15/00 Dry after 20 gal; sampled after recoveryBGO 45D 12/15/00 Flowmeter sticking at low speeds; purged 5 gal through
portBGO 47D 11/09/00 Well was not sampled; still set up for purge water
managementBGO 49A 11/10/00 Pumped dry after 51 gallons; 5-gal bucket, purged through
port; sampled after recoveryBGO 49D 11/10/00 Flowmeter quit working; purged through port; aeratedBGO 50A 11/09/00 Pumped dry
11/10/00 Sampled after recoveryBGO 51AA 12/16/00 Major overload flashing on box; pump or electrical failure

Field NotesField NotesESH-EMS-2000408ESH-EMS-2000408 Page Page 2626 Fourth Quarter 2000Fourth Quarter 2000
Well Date Comments
BGO 51D 12/16/00 Purged through port due to low purge volume12/19/00 Dry after 2 gal; sampled after recovery
BGO 52D 12/16/00 Dry after 2 gal; sampled after recovery; not all samplescollected
BGO 53B 12/16/00 Electrical voltage overloadBGO 53C 11/01/00 Purged through sample port; cracked pipeBGO 53D 12/21/00 Cloudy water; flowmeter stuck, probably frozen; purged
through port12/28/00 No water to surface; pump is operational
BGX Series
BGX 1A 11/01/00 Dry after 17 gal11/02/00 Sampled after recovery
BGX 1C 11/01/00 Purged through sample portBGX 1D 12/06/00 Dry after 1 gal
12/07/00 Sampled after recoveryBGX 2B 12/07/00 Dry after 78 gal; aerated; purged through port; sampled
after recoveryBGX 3D 10/18/00 Piping leaks
11/08/00 Leaking pipesBGX 4A 10/31/00 High turbidityBGX 4C 10/31/00 Flowmeter broken and sticking; purged into 5 gal bucketBGX 4D 10/31/00 Dirty waterBGX 6D 12/07/00 Flowmeter sticks; purged through portBGX 9D 12/17/00 Purged through sample portBGX 10D 12/18/00 Purged through sample portBGX 11D 12/16/00 Pumped dryBGX 12D 12/05/00 Dry after 3 gal
12/18/00 Purged through sample port
BRD Series
BRD 4 11/02/00 Flowmeter not working; estimated flow rate into 5-galbucket
BSE Series
BSE 1C2 12/31/00 No water level but tape was wet at 57 ft; no water tosurface; dry well
BSE 1C3 12/31/00 All of sample not takenBSE 1D1 12/31/00 Not enough water to sampleBSE 1D2 12/31/00 Not enough water to sampleBSE 1D3 12/31/00 Not enough water to sampleBSE 3D1 12/30/00 Not enough water to sampleBSE 3D2 12/30/00 Not enough water to sample
BSW Series
BSW 2D1 12/06/00 Dry wellBSW 2D2 12/06/00 High turbidityBSW 2D3 12/06/00 High turbidityBSW 3C1 12/27/00 Dry after 0.5 galBSW 3C4 12/30/00 High turbidityBSW 4C2 12/30/00 High turbidityBSW 4D1 12/27/00 Would not produce waterBSW 4D2 12/27/00 High turbidityBSW 4D3 12/27/00 High turbidityBSW 5C1 12/20/00 High turbidityBSW 5C3 12/21/00 High turbidityBSW 5C4 12/21/00 High turbidityBSW 5D1 12/20/00 High turbidityBSW 5D2 12/21/00 High turbidity

Field NotesField NotesESH-EMS-2000408ESH-EMS-2000408 Page Page 2727 Fourth Quarter 2000Fourth Quarter 2000
Well Date Comments
BSW 5D3 12/21/00 High turbidityBSW 6C1 12/08/00 High turbidityBSW 6C2 12/08/00 High turbidityBSW 6D2 12/14/00 Well is dryBSW 7C1 12/29/00 High turbidityBSW 7C2 12/29/00 High turbidityBSW 7C3 12/29/00 High turbidityBSW 7C4 12/30/00 High turbidityBSW 8C3 12/23/00 Water too muddy for alkalinity reading; turbidity greater
than 1,000 NTUBSW 8C4 12/23/00 Water too muddy for alkalinity reading; turbidity greater
than 1,000 NTU
CRP Series
CRP 3C 12/07/00 Purged through sample portCRP 3D 11/16/00 Dry after 1 gal
12/04/00 Dry after 1 gal; sampled after recoveryCRP 5D 12/04/00 Pumped dryCRP 11D 11/16/00 Purged through sample port due to high turbidityCRP 17DU 11/16/00 Dry after 1 gal
11/20/00 Dry after 13 gallons; high turbidity; sampled after recovery12/07/00 Dry after 1 gal; purged through sample port; sampled after
recovery
DOB Series
DOB 3 12/15/00 Flowmeter not operating
FAB Series
FAB 1 10/20/00 Pumped dry10/23/00 Pumped dry; sampled after recovery
FAL Series
FAL 1 10/31/00 3 gallons through sample portFAL 2 10/31/00 No water to surface; dry well
FBP Series
FBP 2A 10/23/00 Broken pumpFBP 5D 10/24/00 No water in standpipeFBP 6D 10/24/00 Not enough water to surface
FCA Series
FCA 19D 10/31/00 5 gallons through sample port
FCB Series
FCB 2 10/23/00 Broken pumpFCB 4 10/31/00 Purged through sample portFCB 5 10/23/00 Flowmeter not operating correctly
FEX Series
FEX 1TK 12/12/00 Well is continuously pumping
FIN Series
FIN 2TK 10/10/00 Well is continuously pumping11/14/00 Well is continuously pumping12/12/00 Well is continuously pumping
FSB Series
FSB 78C 10/06/00 Dry after 41 gal

Field NotesField NotesESH-EMS-2000408ESH-EMS-2000408 Page Page 2828 Fourth Quarter 2000Fourth Quarter 2000
Well Date Comments
10/09/00 Dry after 33 gal; sampled after recoveryFSB 90D 10/09/00 Dry after 6 gal; sampled after recovery; no water in
standpipeFSB 92C 10/05/00 Dry after 41 gal; sampled after recoveryFSB 93D 10/09/00 Dry after 4 gal; sampled after recoveryFSB 94C 10/09/00 Dry after 26 gal
10/10/00 Sampled after recoveryFSB 97C 10/05/00 Dry after 53 gal; sampled after recovery
10/04/00 Dry after 8 galFSB 97D 10/05/00 Sampled after recoveryFSB 98D 10/04/00 Dry after 10 galFSB106C 10/24/00 Both sides of valve leaking; riser elbow pipe leaks both
endsFSB106D 10/04/00 No water in standpipe; no water to surface; dry wellFSB107D 10/30/00 Metals were pulled at 65 NTU; well began with high
turbidityFSB108D 10/04/00 No power to pump
10/18/00 Flowmeter sticking; 10 gal. purge through port; pumpslow; surges and stops
FSB112D 10/24/00 5 leaks inside casing each sideFSB113A 10/04/00 Dry after 40 gal; sampled after recoveryFSB117D 10/24/00 Leaks both sides of teeFSB119D 10/04/00 Trips breakerFSB120A 10/09/00 Pumped dry
10/10/01 Sampled after recoveryFSB120D 10/09/00 Pumped dry
10/10/00 Sampled after recovery
FSL Series
FSL 1D 10/20/00 Dry after 5 gal; sampled after recoveryFSL 2D 10/09/00 Flowmeter not workingFSL 3D 10/09/00 Pumped dry; sampled after recoveryFSL 4D 10/09/00 Water rose to 34.10 ft. in the standpipe, but proceeded no
fartherFSL 7D 10/05/00 Dry after 1 gal
10/06/00 Sampled after recovery
FSS Series
FSS 1D 12/01/00 Dry after 4 gal; purged2 gal through port12/04/00 Flowmeter not working because of temperature; purged
through port; pumped dry12/05/00 Sampled after recovery
FSS 2D 12/01/00 Dirty water; dry after 17 gal; purge tube snapped in cold;purged through port
12/04/00 Dry after 13 gal; sampled after recoveryFSS 3D 12/01/00 Dry after 13 gal
12/04/00 Pump not pulling water; flowmeter not working12/05/00 Flowmeter not working
FSS 4D 12/01/00 Red and dirty water; leaking heavily at flowmeter; purged5 gal through port
HAA Series
HAA 3D 10/26/00 Pumped dry10/27/00 Pumped dry10/31/00 Very dirty water; purged through port; operator error
HEX Series
HEX500TK 12/12/00 Well is continuously pumping

Field NotesField NotesESH-EMS-2000408ESH-EMS-2000408 Page Page 2929 Fourth Quarter 2000Fourth Quarter 2000
Well Date Comments
HIN Series
HIN600TK 10/10/00 Well is continuously pumping11/14/00 Well is continuously pumping12/12/00 Well is continuously pumping
HMD Series
HMD 1D 11/30/00 Dry after 4 gal; sampled after recoveryHMD 4D 12/15/00 Dry after 3 gal
12/16/00 Sampled after recovery
HSB Series
HSB 66 10/11/00 Pump is inoperable10/17/00 Flowmeter not operating
HSB 68 10/16/00 Dry after 3 gal; sampled after recoveryHSB 68C 10/09/00 Pumped dry
10/10/00 Sampled after recoveryHSB 70C 10/18/00 Dry after 21 gal; sampled after recoveryHSB 84B 10/11/00 Pump surgingHSB 84C 10/11/00 Pumped dry; sampled after recoveryHSB 85A 12/04/00 Generator only taking one well at a timeHSB 85B 10/11/00 Pumped dry; sampled after recovery
12/04/00 Electrical short, no current12/13/00 Dry after 43 gal; slowed down, not registering in flowmeter12/14/00 Sampled after recovery
HSB 85C 12/04/00 Flowmeter broken; purged through port; sample portbroken off
HSB 86D 10/25/00 Elbow leaks at endHSB102D 10/11/00 Dry after 11 gal; sampled after recoveryHSB109C 10/12/00 Hinge brokenHSB111C 10/12/00 Well was not sampled because of a physical reasonHSB112E 10/12/00 High voltage on variable box
10/17/00 Variable speed box not working10/23/00 Pumped dry10/24/00 Purged through sample port; sampled after recovery
HSB113D 10/11/00 Well is dryHSB116D 10/11/00 Pumped dry; sampled after recoveryHSB117C 10/23/00 No power to pumpHSB123A 10/12/00 Dry after 29 gal; sampled after recoveryHSB125D 10/16/00 Generator not functioning with variable speedbox; unable
to collect samplesHSB126D 10/16/00 Dry after 14 gal; sampled after recoveryHSB133D 10/13/00 No samples taken due to high turbidity; purged through
sample port; 5 gal through portHSB135C 10/13/00 Dirty waterHSB138D 10/13/00 Some surging initially; flowmeter sticking at low volumeHSB139C 10/23/00 Dry after 32 gal; sampled after recoveryHSB142D 10/16/00 Flowmeter not operating; pumped dry
10/17/00 Sampled after recovery12/19/00 Dry after 14 gal; sampled after recovery; surging; purged
through portHSB144A 10/16/00 Sample cock brokeHSB147D 10/17/00 No water in standpipeHSB150D 10/16/00 Water was not coming out enough to go through
flowmeter, had to purge 25 gal through sample cockHSB151C 10/16/00 Not sampled due to generator failure / time constraints;
will revisit 10/17/00HSB151D 12/19/00 Purged through sample portHSB152D 10/17/00 Dry after 4 gal; sampled after recovery
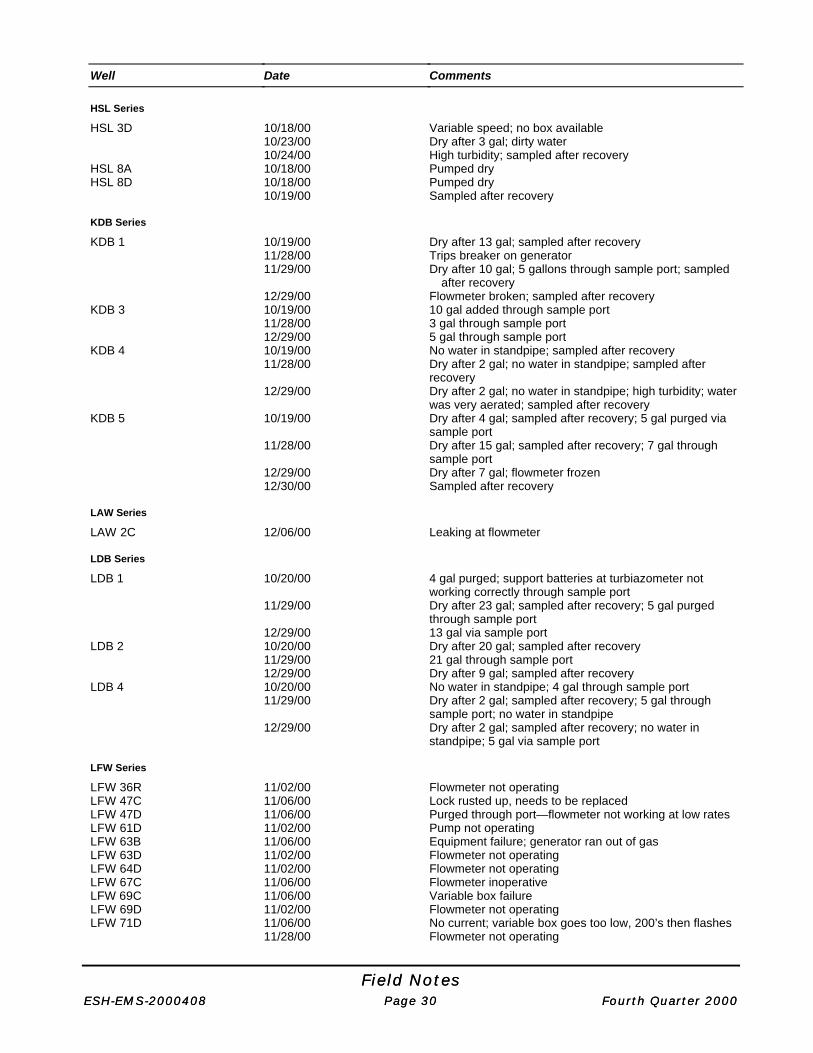
Field NotesField NotesESH-EMS-2000408ESH-EMS-2000408 Page Page 3030 Fourth Quarter 2000Fourth Quarter 2000
Well Date Comments
HSL Series
HSL 3D 10/18/00 Variable speed; no box available10/23/00 Dry after 3 gal; dirty water10/24/00 High turbidity; sampled after recovery
HSL 8A 10/18/00 Pumped dryHSL 8D 10/18/00 Pumped dry
10/19/00 Sampled after recovery
KDB Series
KDB 1 10/19/00 Dry after 13 gal; sampled after recovery11/28/00 Trips breaker on generator11/29/00 Dry after 10 gal; 5 gallons through sample port; sampled
after recovery12/29/00 Flowmeter broken; sampled after recovery
KDB 3 10/19/00 10 gal added through sample port11/28/00 3 gal through sample port12/29/00 5 gal through sample port
KDB 4 10/19/00 No water in standpipe; sampled after recovery11/28/00 Dry after 2 gal; no water in standpipe; sampled after
recovery12/29/00 Dry after 2 gal; no water in standpipe; high turbidity; water
was very aerated; sampled after recoveryKDB 5 10/19/00 Dry after 4 gal; sampled after recovery; 5 gal purged via
sample port11/28/00 Dry after 15 gal; sampled after recovery; 7 gal through
sample port12/29/00 Dry after 7 gal; flowmeter frozen12/30/00 Sampled after recovery
LAW Series
LAW 2C 12/06/00 Leaking at flowmeter
LDB Series
LDB 1 10/20/00 4 gal purged; support batteries at turbiazometer notworking correctly through sample port
11/29/00 Dry after 23 gal; sampled after recovery; 5 gal purgedthrough sample port
12/29/00 13 gal via sample portLDB 2 10/20/00 Dry after 20 gal; sampled after recovery
11/29/00 21 gal through sample port12/29/00 Dry after 9 gal; sampled after recovery
LDB 4 10/20/00 No water in standpipe; 4 gal through sample port11/29/00 Dry after 2 gal; sampled after recovery; 5 gal through
sample port; no water in standpipe12/29/00 Dry after 2 gal; sampled after recovery; no water in
standpipe; 5 gal via sample port
LFW Series
LFW 36R 11/02/00 Flowmeter not operatingLFW 47C 11/06/00 Lock rusted up, needs to be replacedLFW 47D 11/06/00 Purged through port—flowmeter not working at low ratesLFW 61D 11/02/00 Pump not operatingLFW 63B 11/06/00 Equipment failure; generator ran out of gasLFW 63D 11/02/00 Flowmeter not operatingLFW 64D 11/02/00 Flowmeter not operatingLFW 67C 11/06/00 Flowmeter inoperativeLFW 69C 11/06/00 Variable box failureLFW 69D 11/02/00 Flowmeter not operatingLFW 71D 11/06/00 No current; variable box goes too low, 200’s then flashes
11/28/00 Flowmeter not operating

Field NotesField NotesESH-EMS-2000408ESH-EMS-2000408 Page Page 3131 Fourth Quarter 2000Fourth Quarter 2000
Well Date Comments
LFW 76 10/02/00 Pumped dry; sampled after recovery; high turbidity
MCB Series
MCB 5C 12/12/00 Flowmeter not operatingMCB 6 11/01/00 Pumped dry; delayed start, overheated generator; purged
through portMCB 7C 12/14/00 Dry after 10 gal; sampled after recoveryMCB 11D 12/14/00 No water to surfaceMCB 13C 12/14/00 Flowmeter not operatingMCB 14B 12/14/00 Flowmeter not operating
MSB Series
MSB 5A 10/23/00 No water in standpipeMSB 7A 10/19/00 Dirty water; flowmeter not working; purged through sample
portMSB 8A 10/23/00 No water in standpipe; dry wellMSB 13D 10/23/00 Dry after 20 gal
10/24/00 Dry after 11 gal; sampled after recoveryMSB 14C 10/23/00 Mechanical failure; well will be redevelopedMSB 18C 12/14/00 Bad odor; slow, flow barely registering on meter; purged
through portMSB 29TA 10/19/00 Leaky pipeMSB 58D 10/23/00 Sampled after recoveryMSB 62D 10/24/00 Dry after 6 gal
10/25/00 Sampled after recoveryMSB 63D 10/24/00 Purged through sample port due to high turbidityMSB 73B 12/12/00 Flowmeter not operatingMSB 82A 10/30/00 Dry after 55 gal; sampled after recoveryMSB 84A 10/23/00 Pumped dry; flow too slight to activate through flowmeter;
purged through sample port10/24/00 Pumped dry; no measurable water depth; no water in
standpipe
RPC Series
RPC 3DL 10/25/00 Unable to sample due to mechanical problemRPC 3DU 10/25/00 Dry well
10/27/00 Dry wellRPC 4DL 10/25/00 Variable box overloadRPC 4DU 10/25/00 Dry well; pump needs maintenanceRPC 5DL 10/25/00 Electrical failure
10/27/00 Purged 2.5 gal through port; no flowmeterRPC 5DU 10/25/00 Dry after 1 gal
10/26/00 Sampled after recoveryRPC 6DL 10/25/00 Unable to sample due to electrical problem, no power plugRPC 6DU 10/25/00 No water to surface
10/27/00 Pump not working10/31/00 Not enough water to sample
RPC 7DL 10/30/00 Surging; purged 4 gal through sample portRPC 7DU 10/27/00 Pumped dry while trying to lower turbidity
10/30/00 Dry after 5 gal10/31/00 Sampled after recovery
RPC 8DU 10/30/00 Dry well; air only coming out of pumpRPC 9DU 10/30/00 Sampled after recovery; overheated generator; plug
disconnected from wiringRPC 10DL 10/31/00 Flowmeter not operatingRPC 10DU 10/31/00 Dry wellRPC 11DU 11/06/00 Dry after 6 gal
11/07/00 Dry after 5 gal; sampled after recoveryRPC 14DU 11/06/00 Dry after 7 gal
11/07/00 Sampled after recovery

Field NotesField NotesESH-EMS-2000408ESH-EMS-2000408 Page Page 3232 Fourth Quarter 2000Fourth Quarter 2000
Well Date Comments
12/11/00 Dry after 9 gal; dirty/clay red water; water turned toclay/red before sample could be pulled out
12/12/00 Dry after 3 gal; very dirty water; purged through port12/13/00 High turbidity; sampled after recovery
RSD Series
RSD 2C 11/30/00 Dry after 4 galRSD 3 11/06/00 Pumped dry
12/12/00 Dry after 13 gal; purged through port; sampled afterrecovery
RSE Series
RSE 7 10/30/00 No water in standpipe; dry wellRSE 10 11/30/00 Dry well
RSF Series
RSF 1 11/07/00 Hand pump; estimated volume in 5 gal bucketRSF 3 11/06/00 Dry after 45 gal
11/07/00 Sampled after recovery
RWM Series
RWM 1 11/07/00 Well is continuously pumping12/11/00 Well is continuously pumping
RWM 3 11/08/00 Well is continuously pumping12/11/00 Well is continuously pumping
RWM 4 11/08/00 Well is continuously pumping12/11/00 Well is continuously pumping
RWM 5 11/08/00 Well is continuously pumping12/11/00 Well is continuously pumping
RWM 6 11/07/00 Well is continuously pumping12/11/00 Well is continuously pumping
RWM 7 11/07/00 Well is continuously pumping12/11/00 Well is continuously pumping
RWM 8 11/07/00 Well is continuously pumping12/11/00 Well is continuously pumping
RWM 9 11/07/00 Well is continuously pumping12/11/00 Well is continuously pumping
RWM 10 11/07/00 Well is continuously pumping12/11/00 Well is continuously pumping
RWM 11 11/07/00 Well is continuously pumping12/11/00 Well is continuously pumping
RWM 12 10/05/00 Well is continuously pumping11/07/00 Well is continuously pumping12/11/00 Well is continuously pumping
RWM 13B 11/07/00 Well is continuously pumping12/11/00 Well is continuously pumping
RWM 13C 11/07/00 Well is continuously pumping12/11/00 Well is continuously pumping
RWM 14B 10/05/00 Well is continuously pumping11/07/00 Well is continuously pumping12/11/00 Well is continuously pumping
RWM 14C 10/05/00 Well is continuously pumping11/07/00 Well is continuously pumping12/11/00 Well is continuously pumping
RWM 15B 11/07/00 Well is continuously pumping12/11/00 Well is continuously pumping
RWM 17B 10/09/00 Well is continuously pumping11/07/00 Well is continuously pumping12/11/00 Well is continuously pumping
RWM 17D 10/09/00 Well is continuously pumping

Field NotesField NotesESH-EMS-2000408ESH-EMS-2000408 Page Page 3333 Fourth Quarter 2000Fourth Quarter 2000
Well Date Comments
11/07/00 Well is continuously pumping12/11/00 Well is continuously pumping
SRW Series
SRW 4 11/20/00 No water in standpipe; well is drySRW 7 11/20/00 Flowmeter broken; purged into 5-gal bucketSRW 19 11/20/00 Unable to sample due to physical problem
TBG Series
TBG 1 12/05/00 Purged through sample portTBG 3 12/05/00 Purged through sample portTBG 7 11/16/00 Flowmeter not operating
TCM Series
TCM 7 12/13/00 High turbidity
TNX Series
TNX 1D 11/22/00 Flowmeter not workingTNX 2D 11/16/00 Dry after 6 gal; sampled after recoveryTNX 3D 11/15/00 Flowmeter not operatingTNX 4D 11/16/00 Dry after 5 gal; sampled after recoveryTNX 5D 11/16/00 Dry after 2 gal; sampled after recoveryTNX 6D 11/16/00 Dry after 3 gal
11/17/00 Sampled after recoveryTNX 7D 11/16/00 Dry after 20 gal
11/17/00 Sampled after recoveryTNX 24D 11/22/00 Field parameters only; instruments not coming on due to
cold temperatureTNX 35D 11/29/00 High turbidity
12/13/00 High turbidity
TRW Series
TRW 1 11/14/00 Well is continuously pumpingTRW 2 11/14/00 Well is continuously pumpingTRW 3 11/14/00 Well is continuously pumpingTRW 4 11/14/00 Well is continuously pumping

Field NotesField NotesESH-EMS-2000408ESH-EMS-2000408 Page Page 3434 Fourth Quarter 2000Fourth Quarter 2000
NOTESNOTES

Analytical Data ReviewAnalytical Data ReviewESH-EMS-2000408ESH-EMS-2000408 Page Page 3535 Fourth Quarter 2000Fourth Quarter 2000
Analytical Data ReviewAnalytical Data ReviewThe SRS Groundwater Monitoring Program evaluates all data systematically to provide high-quality data forreporting on the environmental monitoring and cleanup efforts at SRS. Data verification and validation arecontinuous, interactive processes, usually completed within 60 days after the last data are received for aquarter.
EX, GE, ML, and WA, the primary contracting laboratories for sample analyses, performed all analyses with thefollowing exceptions:
• Microseeps, Inc. (MS), of Pittsburgh, PA, performed several screening level analyses for the C-AreaBurning Rubble Pit, D-Area Oil Seepage Basin, and Miscellaneous Chemical Basin sampling projects;however, the MS results weren’t available for publication in this report.
• GP conducted radionuclide analyses for GE, and TM conducted radionuclide analyses for WA. GP andTM conducted gross alpha, nonvolatile beta, tritium, and selected radionuclide analyses. ML conductedgross alpha, nonvolatile beta, and tritium analyses.
GIMS DATA REVIEW MODULEGIMS DATA REVIEW MODULEThe Geochemical Information Management System (GIMS) is a combination of hardware, software, data,and procedures that supports EPD/EMS’ data management activities. The GIMS Data Review Module providesautomated data loading, validation and verification functions, data editing, determination of data review status,report generation, and data review QA. The data editing program allows users to correct errors in loadedanalytical, field, and shipping data. When the review process is complete, data are loaded into the permanentproduction database tables in GIMS and are available sitewide.
REVIEW OF THE ANALYTICAL DATAREVIEW OF THE ANALYTICAL DATAEPD/EMS accepts subcontract laboratory data using a software program to compare the data againstestablished acceptance criteria and to produce an output report identifying those instances where theacceptance criteria are not met. After acceptance, EPD/EMS performs additional reviews of the analytical datafor errors and unusual results before releasing the data for use. The laboratories are asked to review andcomment on suspect data.
Typical errors identified during data loading into GIMS include incorrect sample dates, run dates, and sampleidentifications; incorrectly entered analytical units, methods, and corresponding detection limits; and incorrectdilution factor calculations.
Analytical results that appear different from historical data collected since 1991 are brought to the attention ofthe appropriate laboratory. Thus, the laboratory is able to identify problems with some of the analyses, includingincorrect dilution factor calculations and data entry errors. EPD/EMS corrects data files after receiving writtennotification from the laboratory. Specific details concerning the corrections are entered in the EMS GroundwaterMonitoring Program Changes to the Database Logbook.
Samples that exceeded holding times are indicated by an EPA STORET code Q in the analytical results tables(see Appendix B for further information). The EPA STORET code V is used to indicate sample resultsassociated with method laboratory blanks at the preparation step that are elevated above the instrumentdetection limit. Samples that were preserved incorrectly are marked with a Y EPA STORET code in theanalytical results tables (see Appendix B). Usually, the Y indicates that the sample coolers were not coldenough. An EMS code I indicates that a sample’s matrix spike recovery was not within control limits.
To determine if analytical results for a sampling site are similar to or relatively higher or lower than historicalresults, new results for each well are compared to that well’s historical results using the following procedure:

Analytical Data ReviewAnalytical Data ReviewESH-EMS-2000408ESH-EMS-2000408 Page Page 3636 Fourth Quarter 2000Fourth Quarter 2000
• GIMS calculates the mean of the historical results and the mean of the historical results abovedetection for all analytes in the wells being compared. The historical results that are below theirdetection limit value are considered at their detection limits for the purpose of the calculation. Theprocess eliminates any false high values due to diluted samples.
• GIMS factors in trends in the data calculated from the previous eight sampling events. If no previousdata are available for a particular well/analyte combination, the program includes previous results fromother wells in the same vicinity.
• Results greater than 10 times the calculated mean of the previous results are marked as “high.”Results (or their detection limits if the results are below detection) less than 10 percent of the calculatedmean of the previous results are marked as “low.”
GIMS flags the potentially anomalous results for review. The data reviewer examines the results and takes intoaccount individual historical values, variations of certain values, general trends in the data, and data in the prepbatch associated with the current result. The data reviewer eliminates results if anomalous historical resultshave skewed the calculated mean. Another data reviewer inspects and confirms that the results marked asanomalous are properly identified. Anomalous results are presented to the lab for review and comment. Resultssignificantly high or low compared with historical data are rerun by the lab.
Review of the Analytical NarrativesReview of the Analytical NarrativesEPD/EMS reviews the analytical narratives received from the laboratories, which are used as referencematerials throughout the data validation process. Any discrepancies between the narratives and the analyticalor chain-of-custody (COC) data must be resolved by the laboratories. The narratives include the following typesof problems: QA samples that do not meet the criteria specified by the analytical method, problems with matrixinterference, sample-specific adjustments to the method caused by high concentrations of some analytes,problems with sample preservation and holding time, instrument calibration problems, and contaminatedblanks. The narratives also include additional information about COC and analytical data.
Review of EX’s Analytical DataReview of EX’s Analytical DataA technical review of the quarter’s analytical data identified at least one reported result for each of the analysesin table 4 as high compared with historical data. A review of the laboratory records did not reveal any problemswith the analyses.
A technical review of the quarter’s analytical data identified no reported results as low compared with historicaldata.
Review of GE’s Analytical DataReview of GE’s Analytical DataA technical review of the quarter’s analytical data identified at least one reported result for each of the analysesin table 5 as high compared with historical data. A review of the laboratory records did not reveal any problemswith the analyses.
A technical review of the quarter’s analytical data identified at least one reported result for each of the analysesin table 6 as low compared with historical data. A review of the laboratory records did not reveal any problemswith the analyses.
Review of WA’s Analytical DataReview of WA’s Analytical DataA technical review of the quarter’s analytical data identified at least one reported result for each of the analysesin table 7 as high as compared with historical data. A review of the laboratory records did not reveal anyproblems with the analyses.
A technical review of the quarter’s analytical data identified no reported results as low compared with historicaldata.

Analytical Data ReviewAnalytical Data ReviewESH-EMS-2000408ESH-EMS-2000408 Page Page 3737 Fourth Quarter 2000Fourth Quarter 2000
Review of EM’s Analytical DataReview of EM’s Analytical DataA technical review of the quarter’s analytical data identified no reported results as high compared with historicaldata.
A technical review of the quarter’s analytical data identified no reported results as low compared with historicaldata.
Review of GP’s Analytical DataReview of GP’s Analytical DataA technical review of the quarter’s analytical data identified at least one reported result for each of the analysesin table 8 as high compared with historical data. A review of the laboratory records did not reveal any problemsother than those listed below.
A technical review of the quarter’s analytical data identified at least one reported result for each of the analysesin table 9 as low compared with historical data. A review of the laboratory records did not reveal any problemswith the analyses.
Results for several wells were rejected due to low abundance for actinium-228, bismuth-214, europium-154,lead-212, potassium-40, thorium-232, and zirconium-95. Results for at least one well were rejected for curium-245-246 due to americium-243 tracer taildown.
Review of ML’s Analytical DataReview of ML’s Analytical DataA technical review of the quarter’s analytical data identified at least one reported result for each of the analysesin table 10 as high as compared with historical data. A review of the laboratory records did not reveal anyproblems with the analyses.
A technical review of the quarter’s analytical data identified no reported results as low compared with historicaldata.
Review of TM’s Analytical DataReview of TM’s Analytical DataA technical review of the quarter’s analytical data identified at least one reported result for each of the analysesin table 11 as high as compared with historical data. A review of the laboratory records did not reveal anyproblems with the analyses.
A technical review of the quarter’s analytical data identified no reported results as low compared with historicaldata.
ANALYTICAL METHODSANALYTICAL METHODSSample analyses performed for EPD/EMS during fourth quarter 2000 were conducted using EPA and othermethods as noted in tables 12–17 at the end of this section. EX, GE, and WA performed most of the analysesconducted during the quarter. Their methods and estimated quantitation limits (EQLs) are listed in table 12 forEX, table 13 for GE, and table 14 for WA.
GP, ML, and TM performed the radionuclide analyses during fourth quarter 2000. Radionuclide methodsgenerally are modified by the laboratories performing the analyses. Their methods and EQLs are listed intable 15 for GP, table 16 for ML, and table 17 for TM.
The EM Lab conducted selected radionuclide analyses of samples required by the Groundwater MonitoringProgram. The total activity method used by the EM Lab is an in-house method based on applicable EPA, DOE,or other procedures. Methods used by EPD/EMS for testing other radioisotopes also are in-house analyticalmethods. The EM Lab radioactivity determinations are typically reported as the absolute concentrationscalculated from the analytical tests.
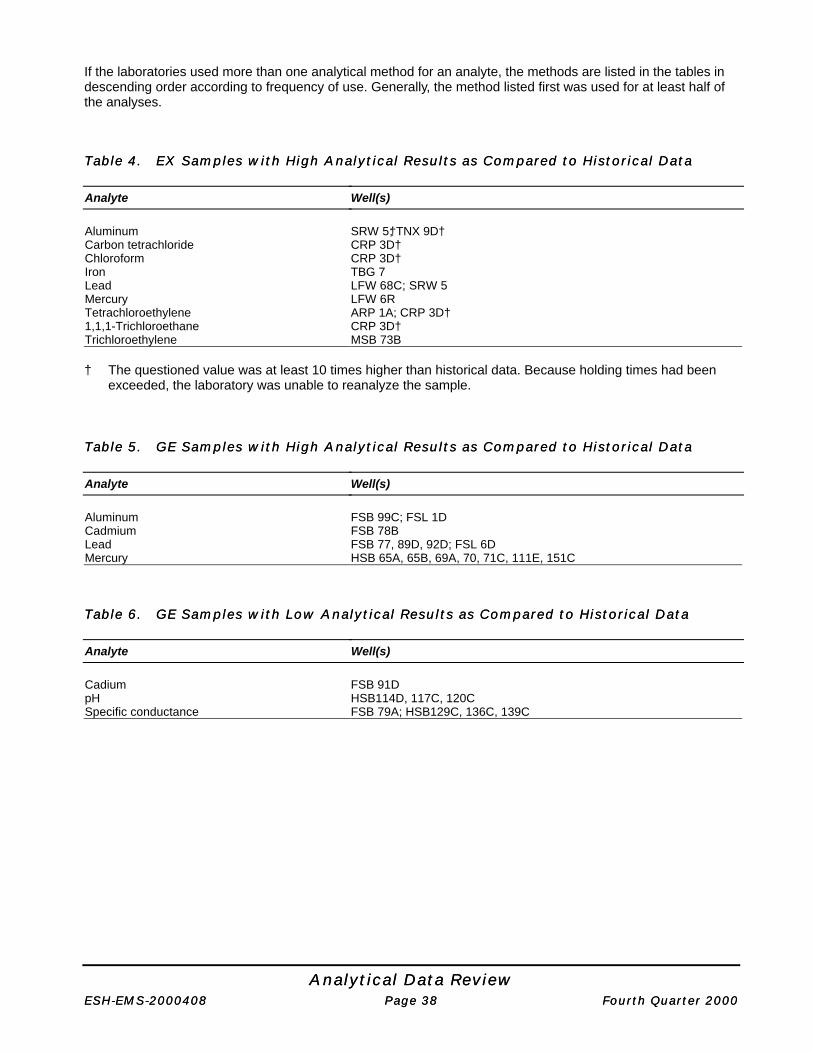
Analytical Data ReviewAnalytical Data ReviewESH-EMS-2000408ESH-EMS-2000408 Page Page 3838 Fourth Quarter 2000Fourth Quarter 2000
If the laboratories used more than one analytical method for an analyte, the methods are listed in the tables indescending order according to frequency of use. Generally, the method listed first was used for at least half ofthe analyses.
Table 4.Table 4. EX Samples with High Analytical Results as Compared to Historical DataEX Samples with High Analytical Results as Compared to Historical Data
Analyte Well(s)
Aluminum SRW 5†; TNX 9D†Carbon tetrachloride CRP 3D†Chloroform CRP 3D†Iron TBG 7Lead LFW 68C; SRW 5Mercury LFW 6RTetrachloroethylene ARP 1A; CRP 3D†1,1,1-Trichloroethane CRP 3D†Trichloroethylene MSB 73B
† The questioned value was at least 10 times higher than historical data. Because holding times had beenexceeded, the laboratory was unable to reanalyze the sample.
Table 5.Table 5. GE Samples with High Analytical Results as Compared to Historical DataGE Samples with High Analytical Results as Compared to Historical Data
Analyte Well(s)
Aluminum FSB 99C; FSL 1DCadmium FSB 78BLead FSB 77, 89D, 92D; FSL 6DMercury HSB 65A, 65B, 69A, 70, 71C, 111E, 151C
Table 6.Table 6. GE Samples with LoGE Samples with Low Analytical Results as Compared to Historical Dataw Analytical Results as Compared to Historical Data
Analyte Well(s)
Cadium FSB 91DpH HSB114D, 117C, 120CSpecific conductance FSB 79A; HSB129C, 136C, 139C

Analytical Data ReviewAnalytical Data ReviewESH-EMS-2000408ESH-EMS-2000408 Page Page 3939 Fourth Quarter 2000Fourth Quarter 2000
Table 7.Table 7. WA Samples with High Analytical Results as Compared to Historical DataWA Samples with High Analytical Results as Compared to Historical Data
Analyte Well(s)
Alkalinity (as CaCO3) BGO 6D, 43D; BGX 2D; HSB 85CBarium BGO 3A, 35CCopper BGO 52A; HSB 85C1,1-Dichloroethane BGO 31Dtrans-1,2-Dichloroethylene BGO 37CDichloromethane (Methylene chloride) BGO 11DR, 16AR, 33D, 37CIron, dissolved BGO 29CLead BGO 52ANitrate nitrite as nitrogen HSB122A, 139ASulfate BGO 35C; FSS 1DTotal dissolved solids BGO 3C, 8D, 10DR, 49C; BGX 6DTrichloroethylene BGO 31DTrichlorofluromethane BGO 2DZinc BGO 34D, 52A
Table 8.Table 8. GP Samples with High Analytical RGP Samples with High Analytical Results as Compared to Historical Dataesults as Compared to Historical Data
Analyte Well(s)
Carbon-14 BGO 10DRGross alpha FSB 76B; HSB 126D, 134C; RPC 8DL†Nonvolatile beta FSB 76B, 120C; HSB 71, 134C; RPC 8DL†Strontium-90 BGO 46D, 48C, 48DTritium FSB 87A, 88C, 107D; HSB 84D, 138D
† The questioned value was at least 10 times higher than historical data. Because holding times had not beenexceeded, the laboratory was asked to reanalyze the sample.
Table 9.Table 9. GP Samples with Low Analytical Results as Compared to Historical DataGP Samples with Low Analytical Results as Compared to Historical Data
Analyte Well(s)
Tritium HSB 71
Table 10.Table 10. ML Samples with High Analytical Results as Compared to Historical DataML Samples with High Analytical Results as Compared to Historical Data
Analyte Well(s)
Gross alpha LFW 67BTritium LFW 6R, 63B, 71C
Table 11.Table 11. TM Samples with High Analytical Results as Compared to Historica TM Samples with High Analytical Results as Compared to Historicall Data Data
Analyte Well(s)
Gross alpha BGO 20AA

Analytical Data ReviewAnalytical Data ReviewESH-EMS-2000408ESH-EMS-2000408 Page Page 4040 Fourth Quarter 2000Fourth Quarter 2000
Analyte Well(s)
Nonvolatile beta BGO 20AA, 45C, 53C; RSF 2Total alpha-emitting radium BGO 2D, 4D, 10AR, 10DR, 12AX, 12CX, 14DR, 19DR, 20AA, 27D, 33C,
37C, 37D, 49C, 51C, 52AA, 53B; FSS 3D, 4D; HMD 3DTritium BGO 31D, 32D, 43AA, 53AA, 53B; BGX 12D; HSB151C
Table 12.Table 12. Methods and Estimated Quantitation Limits Used by EXMethods and Estimated Quantitation Limits Used by EX
Analyte Unit Method Minimum/Maximum EQLs
Acenaphthene µg/L EPA8270C 10.0Acenaphthylene µg/L EPA8270C 10.0Acetone µg/L EPA8260B 20.0Acetonitrile µg/L EPA8260B 200Acrolein µg/L EPA8260B 50.0Acrylonitrile µg/L EPA8260B 10.0Aldrin µg/L EPA8081A 0.1Allyl chloride µg/L EPA8260B 5.0Aluminum µg/L EPA6010B 200Anthracene µg/L EPA8270C 10.0Antimony µg/L EPA6010B 100Arsenic µg/L EPA6010B 10.0Barium µg/L EPA6010B 10.0Benzene µg/L EPA8260B 5.0/2,500alpha-Benzene hexachloride µg/L EPA8081A 0.1beta-Benzene hexachloride µg/L EPA8081A 0.1delta-Benzene hexachloride µg/L EPA8081A 0.1Benzidine µg/L EPA8270C 10.0Benzo[a]anthracene µg/L EPA8270C 10.0Benzo[b]fluoranthene µg/L EPA8270C 10.0Benzo[k]fluoranthene µg/L EPA8270C 10.0Benzo[g,h,i]perylene µg/L EPA8270C 10.0Benzo[a]pyrene µg/L EPA8270C 10.0Beryllium µg/L EPA6010B 1.0Bis(2-chloroethoxy) methane µg/L EPA8270C 10.0Bis(2-chloroethyl) ether µg/L EPA8270C 10.0Bis(2-chloroisopropyl) ether µg/L EPA8270C 10.0Bis(2-ethylhexyl) phthalate µg/L EPA8270C 10.0Boron µg/L EPA6010B 100Bromochloromethane µg/L EPA8260B 5.0Bromodichloromethane µg/L EPA8260B 5.0/2,500Bromoform µg/L EPA8260B 5.0/2,500Bromomethane µg/L EPA8260B 5.0/2,5004-Bromophenyl phenyl ether µg/L EPA8270C 10.0Butylbenzyl phthalate µg/L EPA8270C 10.0Cadmium µg/L EPA6010B 10.0Carbon disulfide µg/L EPA8260B 5.0Carbon tetrachloride µg/L EPA8260B 5.0/2,500
µg/L EPA8021B 1.0/100alpha-Chlordane µg/L EPA8081A 0.1gamma-Chlordane µg/L EPA8081A 0.1Chlorobenzene µg/L EPA8260B 5.0/2,5004-Chloro-m-cresol µg/L EPA8270C 10.0Chloroethane µg/L EPA8260B 5.0/2,500Chloroethene µg/L EPA8260B 5.0/2,5002-Chloroethyl vinyl ether µg/L EPA8260B 5.0/2,500Chloroform µg/L EPA8260B 5.0/2,500
µg/L EPA8021B 1.0/100Chloromethane µg/L EPA8260B 5.0/2,5002-Chloronaphthalene µg/L EPA8270C 10.0

Analytical Data ReviewAnalytical Data ReviewESH-EMS-2000408ESH-EMS-2000408 Page Page 4141 Fourth Quarter 2000Fourth Quarter 2000
Analyte Unit Method Minimum/Maximum EQLs
2-Chlorophenol µg/L EPA8270C 10.04-Chlorophenyl phenyl ether µg/L EPA8270C 10.0Chloroprene µg/L EPA8260B 20.0Chromium µg/L EPA6010B 10.0Chrysene µg/L EPA8270C 10.0Copper µg/L EPA6010B 20.0Cyanide µg/L EPA9014 10.0p,p´-DDD µg/L EPA8081A 0.2p,p´-DDE µg/L EPA8081A 0.2p,p´-DDT µg/L EPA8081A 0.2Dibenz[a,h]anthracene µg/L EPA8270C 10.0Dibromochloromethane µg/L EPA8260B 5.0/2,5001,2-Dibromo-3-chloropropane µg/L EPA8260B 10.01,2-Dibromoethane µg/L EPA8260B 5.0Dibromomethane µg/L EPA8260B 5.0Di-n-butyl phthalate µg/L EPA8270C 10.01,2-Dichlorobenzene µg/L EPA8260B 5.01,3-Dichlorobenzene µg/L EPA8260B 5.01,4-Dichlorobenzene µg/L EPA8260B 5.03,3´-Dichlorobenzidine µg/L EPA8270C 10.0trans-1,4-Dichloro-2-butene µg/L EPA8260B 20.0Dichlorodifluoromethane µg/L EPA8260B 5.01,1-Dichloroethane µg/L EPA8260B 5.0/2,5001,2-Dichloroethane µg/L EPA8260B 5.0/2,5001,1-Dichloroethylene µg/L EPA8260B 5.0/2,5001,2-Dichloroethylene µg/L EPA8260B 5.0cis-1,2-Dichloroethylene µg/L EPA8260B 5.0/2,500trans-1,2-Dichloroethylene µg/L EPA8260B 5.0/2,500Dichloromethane µg/L EPA8260B 10.0/5,0002,4-Dichlorophenol µg/L EPA8270C 10.01,2-Dichloropropane µg/L EPA8260B 5.0/2,5001,3-Dichloropropane µg/L EPA8260B 5.02,2-Dichloropropane µg/L EPA8260B 5.01,1-Dichloropropene µg/L EPA8260B 5.0cis-1,3-Dichloropropene µg/L EPA8260B 5.0/2,500trans-1,3-Dichloropropene µg/L EPA8260B 5.0/2,500Dieldrin µg/L EPA8081A 0.2Diethyl phthalate µg/L EPA8270C 10.02,4-Dimethyl phenol µg/L EPA8270C 10.0Dimethyl phthalate µg/L EPA8270C 10.02,4-Dinitrophenol µg/L EPA8270C 25.02,4-Dinitrotoluene µg/L EPA8270C 10.02,6-Dinitrotoluene µg/L EPA8270C 10.0Di-n-octyl phthalate µg/L EPA8270C 10.01,4-Dioxane µg/L EPA8260B 5001,2-Diphenylhydrazine µg/L EPA8270C 10.0Endosulfan sulfate µg/L EPA8081A 0.2Endosulfan I µg/L EPA8081A 0.1Endosulfan II µg/L EPA8081A 0.2Endrin µg/L EPA8081A 0.2Endrin aldehyde µg/L EPA8081A 0.2Ethyl methacrylate µg/L EPA8260B 5.0Ethylbenzene µg/L EPA8260B 5.0/2,500Fluoranthene µg/L EPA8270C 10.0Fluorene µg/L EPA8270C 10.0Heptachlor µg/L EPA8081A 0.1Heptachlor epoxide µg/L EPA8081A 0.1Hexachlorobenzene µg/L EPA8270C 10.0Hexachlorobutadiene µg/L EPA8270C 10.0Hexachlorocyclopentadiene µg/L EPA8270C 10.0Hexachloroethane µg/L EPA8270C 10.02-Hexanone µg/L EPA8260B 20.0

Analytical Data ReviewAnalytical Data ReviewESH-EMS-2000408ESH-EMS-2000408 Page Page 4242 Fourth Quarter 2000Fourth Quarter 2000
Analyte Unit Method Minimum/Maximum EQLs
Indeno[1,2,3-c,d]pyrene µg/L EPA8270C 10.0Iodomethane µg/L EPA8260B 5.0Iron µg/L EPA6010B 200Isobutyl alcohol µg/L EPA8260B 500Isophorone µg/L EPA8270C 10.0Lead µg/L EPA6010B 10.0Lindane µg/L EPA8081A 0.1Lithium µg/L EPA7430 2.0/20.0Manganese µg/L EPA6010B 10.0Mercury µg/L EPA7470A 0.5Methacrylonitrile µg/L EPA8260B 2002-Methyl-4,6-dinitrophenol µg/L EPA8270C 25.0Methyl ethyl ketone µg/L EPA8260B 20.0Methyl isobutyl ketone µg/L EPA8260B 10.0Methyl methacrylate µg/L EPA8260B 20.0Naphthalene µg/L EPA8270C 10.0Nickel µg/L EPA6010B 50.0Nitrate-nitrite as nitrogen µg/L EPA300.0 100/1,000Nitrobenzene µg/L EPA8270C 10.02-Nitrophenol µg/L EPA8270C 10.04-Nitrophenol µg/L EPA8270C 25.0N-Nitrosodimethylamine µg/L EPA8270C 25.0N-Nitrosodiphenylamine µg/L EPA8270C 10.0N-Nitrosodipropylamine µg/L EPA8270C 10.0PCB 1016 µg/L EPA8082 1.0PCB 1221 µg/L EPA8082 1.0PCB 1232 µg/L EPA8082 1.0PCB 1242 µg/L EPA8082 2.0PCB 1248 µg/L EPA8082 1.0PCB 1254 µg/L EPA8082 1.0PCB 1260 µg/L EPA8082 1.0Pentachloroethane µg/L EPA8260B 200Pentachlorophenol µg/L EPA8270C 25.0Phenanthrene µg/L EPA8270C 10.0Phenol µg/L EPA8270C 10.0Propionitrile µg/L EPA8260B 200Pyrene µg/L EPA8270C 10.0Selenium µg/L EPA6010B 10.0Silver µg/L EPA6010B 20.0Styrene µg/L EPA8260B 5.01,1,1,2-Tetrachloroethane µg/L EPA8260B 5.01,1,2,2-Tetrachloroethane µg/L EPA8260B 5.0/2,500Tetrachloroethylene µg/L EPA8260B 5.0/2,500
µg/L EPA8021B 1.0/5,000Thallium µg/L EPA6010B 10.0Toluene µg/L EPA8260B 5.0/2,500Total organic carbon µg/L EPA9060 5,000Toxaphene µg/L EPA8081A 2.01,2,4-Trichlorobenzene µg/L EPA8270C 10.01,1,1-Trichloroethane µg/L EPA8260B 5.0/2,500
µg/L EPA8021B 1.0/1001,1,2-Trichloroethane µg/L EPA8260B 5.0/2,500Trichloroethylene µg/L EPA8260B 5.0/2,500
µg/L EPA8021B 1.0/5,000Trichlorofluoromethane µg/L EPA8260B 5.0/2,5002,4,6-Trichlorophenol µg/L EPA8270C 25.01,2,3-Trichloropropane µg/L EPA8260B 5.0Vinyl acetate µg/L EPA8260B 5.0Xylenes µg/L EPA8260B 10.0Zinc µg/L EPA6010B 20.0

Analytical Data ReviewAnalytical Data ReviewESH-EMS-2000408ESH-EMS-2000408 Page Page 4343 Fourth Quarter 2000Fourth Quarter 2000
Table 13.Table 13. Methods and Estimated Quantitation Limits Used by GEMethods and Estimated Quantitation Limits Used by GE
Analyte Unit Method Minimum/Maximum EQLs
Acetone µg/L EPA8260B 5.0Alkalinity (as CaCO3) meq/L EPA310.1 1,000/2,000Aluminum µg/L EPA6010B 50.0
µg/L EPA6020 15.0Antimony µg/L EPA6010B 10.0
µg/L EPA6020 2.0Arsenic µg/L EPA6010B 5.0
µg/L EPA6020 3.0Barium µg/L EPA6010B 5.0
µg/L EPA6020 2.0Benzene µg/L EPA8260B 1.0Beryllium µg/L EPA6020 0.2
µg/L EPA6010B 5.0Bis(2-ethylhexyl) phthalate µg/L EPA8270C 0.962/1.0Boron µg/L EPA6010B 50.0Bromodichloromethane µg/L EPA8260B 1.0Bromoform µg/L EPA8260B 1.0Bromomethane µg/L EPA8260B 1.0Cadmium µg/L EPA6020 1.0
µg/L EPA6010B 5.0Calcium µg/L EPA6010B 100Carbon disulfide µg/L EPA8260B 5.0Carbon tetrachloride µg/L EPA8260B 1.0Chloride µg/L EPA9056 100Chlorobenzene µg/L EPA8260B 1.0Chloroethane µg/L EPA8260B 1.0Chloroethene µg/L EPA8260B 1.02-Chloroethyl vinyl ether µg/L EPA8260B 5.0Chloroform µg/L EPA8260B 1.0Chloromethane µg/L EPA8260B 1.0Chromium µg/L EPA6010B 5.0
µg/L EPA6020 3.0Cobalt µg/L EPA6020 1.0
µg/L EPA6010B 5.0Copper µg/L EPA6010B 5.0
µg/L EPA6020 2.0Cyanide µg/L EPA9012A 5.0Dibromochloromethane µg/L EPA8260B 1.0Dibromomethane µg/L EPA8260B 1.01,1-Dichloroethane µg/L EPA8260B 1.01,2-Dichloroethane µg/L EPA8260B 1.01,1-Dichloroethylene µg/L EPA8260B 1.01,2-Dichloroethylene µg/L EPA8260B 2.0trans-1,2-Dichloroethylene µg/L EPA8260B 1.0Dichloromethane µg/L EPA8260B 5.01,2-Dichloropropane µg/L EPA8260B 1.0cis-1,3-Dichloropropene µg/L EPA8260B 1.0trans-1,3-Dichloropropene µg/L EPA8260B 1.0Ethylbenzene µg/L EPA8260B 1.0Fluoride µg/L EPA9056 50.02-Hexanone µg/L EPA8260B 5.0Iron µg/L EPA6010B 50.0
µg/L EPA6020 25.0Lead µg/L EPA6010B 5.0
µg/L EPA6020 2.0Lithium µg/L EPA6020 10.0Magnesium µg/L EPA6010B 20.0Manganese µg/L EPA6010B 10.0
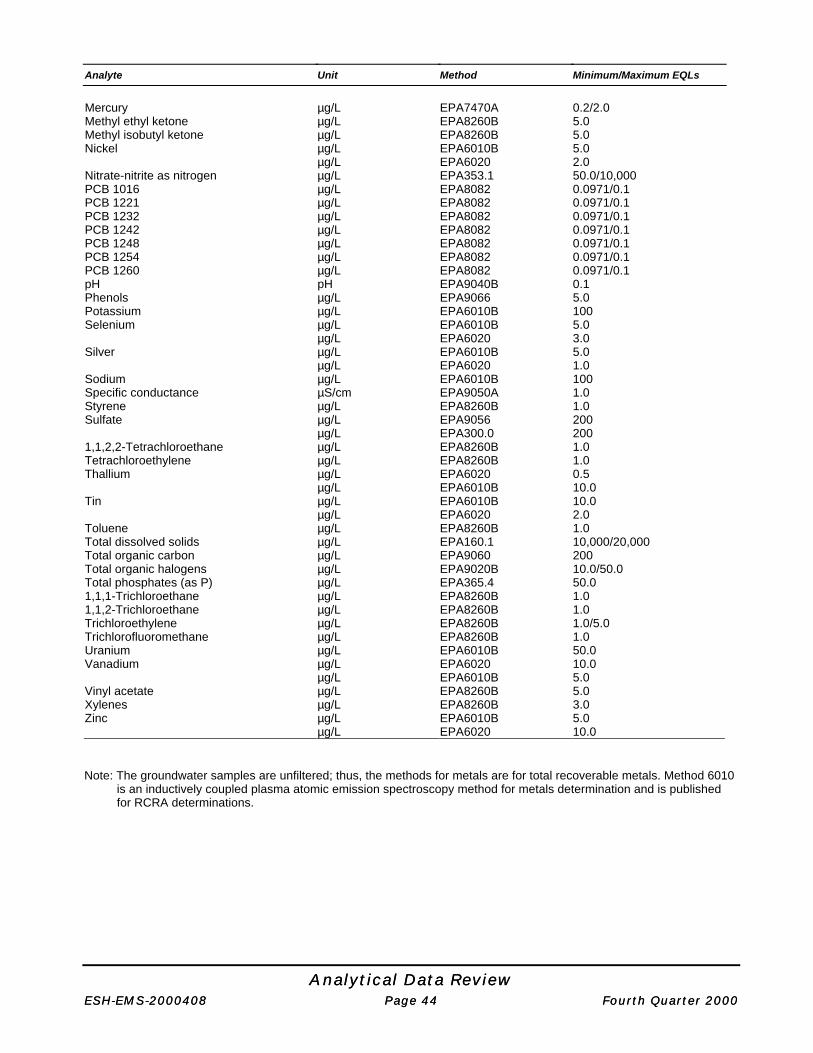
Analytical Data ReviewAnalytical Data ReviewESH-EMS-2000408ESH-EMS-2000408 Page Page 4444 Fourth Quarter 2000Fourth Quarter 2000
Analyte Unit Method Minimum/Maximum EQLs
Mercury µg/L EPA7470A 0.2/2.0Methyl ethyl ketone µg/L EPA8260B 5.0Methyl isobutyl ketone µg/L EPA8260B 5.0Nickel µg/L EPA6010B 5.0
µg/L EPA6020 2.0Nitrate-nitrite as nitrogen µg/L EPA353.1 50.0/10,000PCB 1016 µg/L EPA8082 0.0971/0.1PCB 1221 µg/L EPA8082 0.0971/0.1PCB 1232 µg/L EPA8082 0.0971/0.1PCB 1242 µg/L EPA8082 0.0971/0.1PCB 1248 µg/L EPA8082 0.0971/0.1PCB 1254 µg/L EPA8082 0.0971/0.1PCB 1260 µg/L EPA8082 0.0971/0.1pH pH EPA9040B 0.1Phenols µg/L EPA9066 5.0Potassium µg/L EPA6010B 100Selenium µg/L EPA6010B 5.0
µg/L EPA6020 3.0Silver µg/L EPA6010B 5.0
µg/L EPA6020 1.0Sodium µg/L EPA6010B 100Specific conductance µS/cm EPA9050A 1.0Styrene µg/L EPA8260B 1.0Sulfate µg/L EPA9056 200
µg/L EPA300.0 2001,1,2,2-Tetrachloroethane µg/L EPA8260B 1.0Tetrachloroethylene µg/L EPA8260B 1.0Thallium µg/L EPA6020 0.5
µg/L EPA6010B 10.0Tin µg/L EPA6010B 10.0
µg/L EPA6020 2.0Toluene µg/L EPA8260B 1.0Total dissolved solids µg/L EPA160.1 10,000/20,000Total organic carbon µg/L EPA9060 200Total organic halogens µg/L EPA9020B 10.0/50.0Total phosphates (as P) µg/L EPA365.4 50.01,1,1-Trichloroethane µg/L EPA8260B 1.01,1,2-Trichloroethane µg/L EPA8260B 1.0Trichloroethylene µg/L EPA8260B 1.0/5.0Trichlorofluoromethane µg/L EPA8260B 1.0Uranium µg/L EPA6010B 50.0Vanadium µg/L EPA6020 10.0
µg/L EPA6010B 5.0Vinyl acetate µg/L EPA8260B 5.0Xylenes µg/L EPA8260B 3.0Zinc µg/L EPA6010B 5.0
µg/L EPA6020 10.0
Note: The groundwater samples are unfiltered; thus, the methods for metals are for total recoverable metals. Method 6010is an inductively coupled plasma atomic emission spectroscopy method for metals determination and is publishedfor RCRA determinations.

Analytical Data ReviewAnalytical Data ReviewESH-EMS-2000408ESH-EMS-2000408 Page Page 4545 Fourth Quarter 2000Fourth Quarter 2000
Table 14.Table 14. Methods and Estimated QuantitatiMethods and Estimated Quantitation Limits Used by WAon Limits Used by WA
Analyte Unit Method Minimum/Maximum EQLs
Acenaphthene µg/L EPA8270C 10.0/114Acenaphthylene µg/L EPA8270C 10.0/114Acetone µg/L EPA8260B 10.0Acetonitrile µg/L EPA8260B 20.0Acetophenone µg/L EPA8270C 10.0/1142-Acetylaminofluorene µg/L EPA8270C 10.0/114Acrolein µg/L EPA8260B 20.0Acrylonitrile µg/L EPA8260B 5.0Aldrin µg/L EPA8081A 0.05/0.108Alkalinity (as CaCO3) meq/L EPA310.1 6,700/13,400Allyl chloride µg/L EPA8260B 10.0Aluminum, dissolved µg/L EPA6010B 146Aluminum µg/L EPA6010B 1464-Aminobiphenyl µg/L EPA8270C 10.0/114Aniline µg/L EPA8270C 10.0/114Anthracene µg/L EPA8270C 10.0/114Antimony µg/L EPA6010B 27.0Aramite µg/L EPA8270C 20.0/228Arsenic, dissolved µg/L EPA6010B 40.0Arsenic µg/L EPA6010B 40.0Barium, dissolved µg/L EPA6010B 1.8Barium µg/L EPA6010B 1.8Benzene µg/L EPA8260B 5.0/25.0alpha-Benzene hexachloride µg/L EPA8081A 0.05/0.108beta-Benzene hexachloride µg/L EPA8081A 0.05/0.108delta-Benzene hexachloride µg/L EPA8081A 0.05/0.108Benzo[a]anthracene µg/L EPA8270C 10.0/114Benzo[b]fluoranthene µg/L EPA8270C 10.0/114Benzo[k]fluoranthene µg/L EPA8270C 10.0/114Benzoic acid µg/L EPA8270C 25.0/285Benzo[g,h,i]perylene µg/L EPA8270C 10.0/114Benzo[a]pyrene µg/L EPA8270C 10.0/114Benzyl alcohol µg/L EPA8270C 10.0/114Beryllium µg/L EPA6010B 1.6Bis(2-chloroethoxy) methane µg/L EPA8270C 10.0/114Bis(2-chloroethyl) ether µg/L EPA8270C 10.0/114Bis(2-chloroisopropyl) ether µg/L EPA8270C 10.0/114Bis(2-ethylhexyl) phthalate µg/L EPA8270C 10.0/114Boron µg/L EPA6010B 266Bromodichloromethane µg/L EPA8260B 5.0/25.0Bromoform µg/L EPA8260B 5.0/25.0Bromomethane µg/L EPA8260B 10.0/50.04-Bromophenyl phenyl ether µg/L EPA8270C 10.0/114Butylbenzyl phthalate µg/L EPA8270C 10.0/1142-sec-Butyl-4,6-dinitrophenol µg/L EPA8270C 50.0/570Cadmium, dissolved µg/L EPA6010B 4.7Cadmium µg/L EPA6010B 4.7Carbon disulfide µg/L EPA8260B 5.0Carbon tetrachloride µg/L EPA8260B 5.0/25.0
µg/L EPA8021B 1.0alpha-Chlordane µg/L EPA8081A 0.05/0.108gamma-Chlordane µg/L EPA8081A 0.05/0.1084-Chloroaniline µg/L EPA8270C 10.0/114Chlorobenzene µg/L EPA8260B 5.0/25.0Chlorobenzilate µg/L EPA8270C 10.0/1144-Chloro-m-cresol µg/L EPA8270C 10.0/114Chloroethane µg/L EPA8260B 10.0/50.0Chloroethene µg/L EPA8260B 10.0/50.02-Chloroethyl vinyl ether µg/L EPA8260B 10.0/50.0
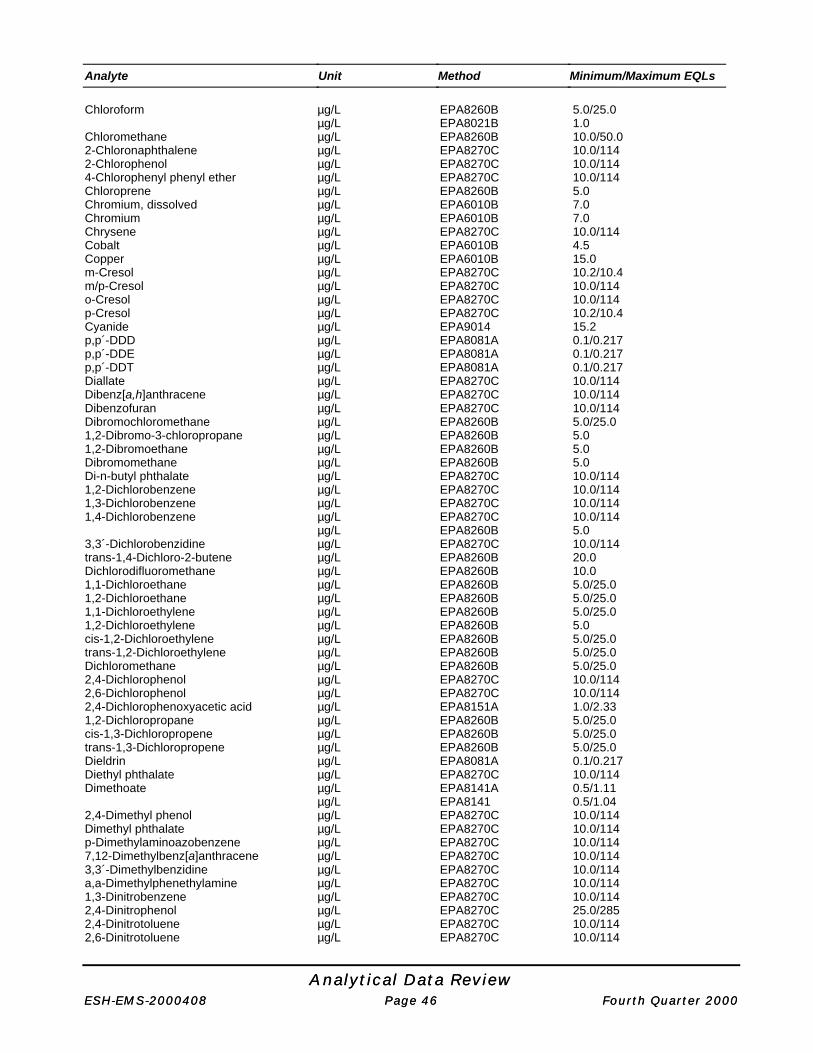
Analytical Data ReviewAnalytical Data ReviewESH-EMS-2000408ESH-EMS-2000408 Page Page 4646 Fourth Quarter 2000Fourth Quarter 2000
Analyte Unit Method Minimum/Maximum EQLs
Chloroform µg/L EPA8260B 5.0/25.0µg/L EPA8021B 1.0
Chloromethane µg/L EPA8260B 10.0/50.02-Chloronaphthalene µg/L EPA8270C 10.0/1142-Chlorophenol µg/L EPA8270C 10.0/1144-Chlorophenyl phenyl ether µg/L EPA8270C 10.0/114Chloroprene µg/L EPA8260B 5.0Chromium, dissolved µg/L EPA6010B 7.0Chromium µg/L EPA6010B 7.0Chrysene µg/L EPA8270C 10.0/114Cobalt µg/L EPA6010B 4.5Copper µg/L EPA6010B 15.0m-Cresol µg/L EPA8270C 10.2/10.4m/p-Cresol µg/L EPA8270C 10.0/114o-Cresol µg/L EPA8270C 10.0/114p-Cresol µg/L EPA8270C 10.2/10.4Cyanide µg/L EPA9014 15.2p,p´-DDD µg/L EPA8081A 0.1/0.217p,p´-DDE µg/L EPA8081A 0.1/0.217p,p´-DDT µg/L EPA8081A 0.1/0.217Diallate µg/L EPA8270C 10.0/114Dibenz[a,h]anthracene µg/L EPA8270C 10.0/114Dibenzofuran µg/L EPA8270C 10.0/114Dibromochloromethane µg/L EPA8260B 5.0/25.01,2-Dibromo-3-chloropropane µg/L EPA8260B 5.01,2-Dibromoethane µg/L EPA8260B 5.0Dibromomethane µg/L EPA8260B 5.0Di-n-butyl phthalate µg/L EPA8270C 10.0/1141,2-Dichlorobenzene µg/L EPA8270C 10.0/1141,3-Dichlorobenzene µg/L EPA8270C 10.0/1141,4-Dichlorobenzene µg/L EPA8270C 10.0/114
µg/L EPA8260B 5.03,3´-Dichlorobenzidine µg/L EPA8270C 10.0/114trans-1,4-Dichloro-2-butene µg/L EPA8260B 20.0Dichlorodifluoromethane µg/L EPA8260B 10.01,1-Dichloroethane µg/L EPA8260B 5.0/25.01,2-Dichloroethane µg/L EPA8260B 5.0/25.01,1-Dichloroethylene µg/L EPA8260B 5.0/25.01,2-Dichloroethylene µg/L EPA8260B 5.0cis-1,2-Dichloroethylene µg/L EPA8260B 5.0/25.0trans-1,2-Dichloroethylene µg/L EPA8260B 5.0/25.0Dichloromethane µg/L EPA8260B 5.0/25.02,4-Dichlorophenol µg/L EPA8270C 10.0/1142,6-Dichlorophenol µg/L EPA8270C 10.0/1142,4-Dichlorophenoxyacetic acid µg/L EPA8151A 1.0/2.331,2-Dichloropropane µg/L EPA8260B 5.0/25.0cis-1,3-Dichloropropene µg/L EPA8260B 5.0/25.0trans-1,3-Dichloropropene µg/L EPA8260B 5.0/25.0Dieldrin µg/L EPA8081A 0.1/0.217Diethyl phthalate µg/L EPA8270C 10.0/114Dimethoate µg/L EPA8141A 0.5/1.11
µg/L EPA8141 0.5/1.042,4-Dimethyl phenol µg/L EPA8270C 10.0/114Dimethyl phthalate µg/L EPA8270C 10.0/114p-Dimethylaminoazobenzene µg/L EPA8270C 10.0/1147,12-Dimethylbenz[a]anthracene µg/L EPA8270C 10.0/1143,3´-Dimethylbenzidine µg/L EPA8270C 10.0/114a,a-Dimethylphenethylamine µg/L EPA8270C 10.0/1141,3-Dinitrobenzene µg/L EPA8270C 10.0/1142,4-Dinitrophenol µg/L EPA8270C 25.0/2852,4-Dinitrotoluene µg/L EPA8270C 10.0/1142,6-Dinitrotoluene µg/L EPA8270C 10.0/114

Analytical Data ReviewAnalytical Data ReviewESH-EMS-2000408ESH-EMS-2000408 Page Page 4747 Fourth Quarter 2000Fourth Quarter 2000
Analyte Unit Method Minimum/Maximum EQLs
Di-n-octyl phthalate µg/L EPA8270C 10.0/1141,4-Dioxane µg/L EPA8270C 10.0/114Diphenylamine µg/L EPA8270C 10.0/114Disulfoton µg/L EPA8141A 0.5/1.11
µg/L EPA8141 0.5/1.04Endosulfan sulfate µg/L EPA8081A 0.1/0.217Endosulfan I µg/L EPA8081A 0.05/0.108Endosulfan II µg/L EPA8081A 0.1/0.217Endrin µg/L EPA8081A 0.1/0.217Endrin aldehyde µg/L EPA8081A 0.1/0.217Ethyl methacrylate µg/L EPA8270C 10.0/114Ethyl methanesulfonate µg/L EPA8270C 10.0/114Ethylbenzene µg/L EPA8260B 5.0/25.0Famphur µg/L EPA8141A 1.2/2.67
µg/L EPA8141 1.2/2.5Fluoranthene µg/L EPA8270C 10.0/114Fluorene µg/L EPA8270C 10.0/114Heptachlor µg/L EPA8081A 0.05/0.108Heptachlor epoxide µg/L EPA8081A 0.05/0.108Hexachlorobenzene µg/L EPA8270C 10.0/114Hexachlorobutadiene µg/L EPA8270C 10.0/114Hexachlorocyclopentadiene µg/L EPA8270C 10.0/114Hexachlorodibenzo-p-dioxins µg/L EPA8280A 1.5/1.7
µg/L EPA8280A 1.5/4.3Hexachlorodibenzo-p-furans µg/L EPA8280A 1.2/1.6
µg/L EPA8280A 1.6/3.0Hexachloroethane µg/L EPA8270C 10.0/114Hexachlorophene µg/L EPA8270C 250/2,850Hexachloropropene µg/L EPA8270C 10.0/1142-Hexanone µg/L EPA8260B 10.0Indeno[1,2,3-c,d]pyrene µg/L EPA8270C 10.0/114Iodomethane µg/L EPA8260B 5.0Iron, dissolved µg/L EPA6010B 74.0Iron µg/L EPA6010B 74.0Isobutyl alcohol µg/L EPA8260B 100Isodrin µg/L EPA8081A 0.1/0.217Isophorone µg/L EPA8270C 10.0/114Isosafrole µg/L EPA8270C 10.0/114Kepone µg/L EPA8081A 0.5/1.08Lead, dissolved µg/L EPA6010B 47.0Lead µg/L EPA6010B 47.0Lindane µg/L EPA8081A 0.05/0.108Lithium µg/L EPA6010B 2.7Manganese µg/L EPA6010B 7.8Mercury, dissolved µg/L EPA7470A 0.7Mercury µg/L EPA7470A 0.7Methacrylonitrile µg/L EPA8260B 10.0Methapyrilene µg/L EPA8270C 10.0/114Methoxychlor µg/L EPA8081A 0.5/1.082-Methyl-4,6-dinitrophenol µg/L EPA8270C 25.0/285Methyl ethyl ketone µg/L EPA8260B 10.0Methyl isobutyl ketone µg/L EPA8260B 10.0Methyl methacrylate µg/L EPA8270C 10.0/114Methyl methanesulfonate µg/L EPA8270C 10.0/1143-Methylcholanthrene µg/L EPA8270C 10.0/1142-Methylnaphthalene µg/L EPA8270C 10.0/114Naphthalene µg/L EPA8270C 10.0/1141,4-Naphthoquinone µg/L EPA8270C 10.0/1141-Naphthylamine µg/L EPA8270C 10.0/1142-Naphthylamine µg/L EPA8270C 10.0/114Nickel µg/L EPA6010B 26.0Nitrate-nitrite as nitrogen µg/L EPA353.2 20.0/4,000

Analytical Data ReviewAnalytical Data ReviewESH-EMS-2000408ESH-EMS-2000408 Page Page 4848 Fourth Quarter 2000Fourth Quarter 2000
Analyte Unit Method Minimum/Maximum EQLs
m-Nitroaniline µg/L EPA8270C 25.0/285o-Nitroaniline µg/L EPA8270C 25.0/285p-Nitroaniline µg/L EPA8270C 25.0/285Nitrobenzene µg/L EPA8270C 10.0/1142-Nitrophenol µg/L EPA8270C 10.0/1144-Nitrophenol µg/L EPA8270C 25.0/2854-Nitroquinoline-1-oxide µg/L EPA8270C 20.0/228N-Nitrosodi-n-butylamine µg/L EPA8270C 10.0/114N-Nitrosodiethylamine µg/L EPA8270C 10.0/114N-Nitrosodimethylamine µg/L EPA8270C 10.0/114N-Nitrosodiphenylamine µg/L EPA8270C 10.0/114N-Nitrosodipropylamine µg/L EPA8270C 10.0/114N-Nitrosomethylethylamine µg/L EPA8270C 10.0/114N-Nitrosomorpholine µg/L EPA8270C 10.0/114N-Nitrosopiperidine µg/L EPA8270C 50.0/570N-Nitrosopyrrolidine µg/L EPA8270C 10.0/1145-Nitro-o-toluidine µg/L EPA8270C 10.0/114Parathion µg/L EPA8141A 0.5/1.11
µg/L EPA8141 0.5/1.04Parathion methyl µg/L EPA8141A 0.5/1.11
µg/L EPA8141 0.5/1.04PCB 1016 µg/L EPA8082 1.0/2.15PCB 1221 µg/L EPA8082 2.0/4.3PCB 1232 µg/L EPA8082 1.0/2.15PCB 1242 µg/L EPA8082 1.0/2.15PCB 1248 µg/L EPA8082 1.0/2.15PCB 1254 µg/L EPA8082 1.0/2.15PCB 1260 µg/L EPA8082 1.0/2.15Pentachlorobenzene µg/L EPA8270C 10.0/114Pentachlorodibenzo-p-dioxins µg/L EPA8280A 0.93/2.2
µg/L EPA8280A 1.1/1.7µg/L EPA8280A 2.2/4.8µg/L EPA8280A 1.7/4.8
Pentachloroethane µg/L EPA8270C 10.0/114Pentachloronitrobenzene µg/L EPA8270C 50.0/570Pentachlorophenol µg/L EPA8270C 25.0/285pH pH EPA9040B 0.1Phenacetin µg/L EPA8270C 10.0/114Phenanthrene µg/L EPA8270C 10.0/114Phenol µg/L EPA8270C 10.0/114Phenols µg/L EPA9066 37.0p-Phenylenediamine µg/L EPA8270C 10.0/114Phorate µg/L EPA8141A 0.5/1.11
µg/L EPA8141 0.5/1.042-Picoline µg/L EPA8270C 10.0/114Pronamid µg/L EPA8270C 10.0/114Propionitrile µg/L EPA8260B 50.0Pyrene µg/L EPA8270C 10.0/114Pyridine µg/L EPA8270C 10.0/114Safrole µg/L EPA8270C 10.0/114Selenium, dissolved µg/L EPA6010B 66.0Selenium µg/L EPA6010B 66.0Silver, dissolved µg/L EPA6010B 5.0Silver µg/L EPA6010B 5.0Specific conductance µS/cm EPA9050A 8.9Styrene µg/L EPA8260B 5.0Sulfate µg/L EPA9056 340/6,800Sulfide µg/L EPA9034 10,000Sulfotepp µg/L EPA8141A 0.5/1.11
µg/L EPA8141 0.5/1.042,4,5-T µg/L EPA8151A 0.5/1.162,3,7,8-TCDD µg/L EPA8280A 0.82/1.2

Analytical Data ReviewAnalytical Data ReviewESH-EMS-2000408ESH-EMS-2000408 Page Page 4949 Fourth Quarter 2000Fourth Quarter 2000
Analyte Unit Method Minimum/Maximum EQLs
µg/L EPA8280A 1.2/4.31,2,4,5-Tetrachlorobenzene µg/L EPA8270C 10.0/114Tetrachlorodibenzo-p-dioxins µg/L EPA8280A 0.82/1.2
µg/L EPA8280A 1.2/4.3Tetrachlorodibenzo-p-furans µg/L EPA8280A 1.1/1.2
µg/L EPA8280A 1.1/4.71,1,1,2-Tetrachloroethane µg/L EPA8260B 5.01,1,2,2-Tetrachloroethane µg/L EPA8260B 5.0/25.0Tetrachloroethylene µg/L EPA8260B 5.0/25.0
µg/L EPA8021B 1.02,3,4,6-Tetrachlorophenol µg/L EPA8270C 10.0/114Thallium µg/L EPA6010B 55.0Thionazin µg/L EPA8141A 0.5/1.11
µg/L EPA8141 0.5/1.04Tin µg/L EPA6010B 70.0Toluene µg/L EPA8260B 5.0/25.0o-Toluidine µg/L EPA8270C 10.0/114Total dissolved solids µg/L EPA160.1 50,000Total organic carbon µg/L EPA9060 1,000Total organic halogens µg/L EPA9020B 120/12,000Toxaphene µg/L EPA8081A 5.0/10.82,4,5-TP (Silvex) µg/L EPA8151A 0.5/1.161,2,4-Trichlorobenzene µg/L EPA8270C 10.0/1141,1,1-Trichloroethane µg/L EPA8260B 5.0/25.0
µg/L EPA8021B 1.01,1,2-Trichloroethane µg/L EPA8260B 5.0/25.0Trichloroethylene µg/L EPA8260B 5.0/25.0
µg/L EPA8021B 1.0Trichlorofluoromethane µg/L EPA8260B 5.0/25.02,4,5-Trichlorophenol µg/L EPA8270C 25.0/2852,4,6-Trichlorophenol µg/L EPA8270C 10.0/1141,2,3-Trichloropropane µg/L EPA8260B 5.0O,O,O-Triethyl phosphorothioate µg/L EPA8141A 0.5/1.11
µg/L EPA8141 0.5/1.041,3,5-Trinitrobenzene µg/L EPA8270C 10.0/114Vanadium µg/L EPA6010B 6.9Vinyl acetate µg/L EPA8260B 10.0Xylenes µg/L EPA8260B 5.0/10.0Zinc µg/L EPA6010B 53.0
Note: The groundwater samples are unfiltered; thus, the methods for metals are for total recoverable metals. Method 200.7is an inductively coupled plasma atomic emission spectroscopy method for metals determination and is publishedfor Safe Drinking Water Act investigations.
Table 15.Table 15. Methods and Estimated Quantitation Limits Used by GPMethods and Estimated Quantitation Limits Used by GP
Analyte Unit Method Minimum/Maximum EQLs
Actinium-228 µCi/mL EPIA-013 5.94E-09/1.61E-08Americium-241 µCi/mL EPIA-011 1.7E-11/2.68E-09Antimony-125 µCi/mL EPIA-013 3.9E-09/1.07E-08Bismuth-212 µCi/mL EPIA-013 9.96E-09/3.23E-08Bismuth-214 µCi/mL EPIA-013 3.5E-09/1.94E-08Carbon-14 µCi/mL EPIA-003 7.36E-09/4.76E-08Cerium-144 µCi/mL EPIA-013 1.42E-08/2.57E-08Cesium-134 µCi/mL EPIA-013 1.32E-09/3.97E-09

Analytical Data ReviewAnalytical Data ReviewESH-EMS-2000408ESH-EMS-2000408 Page Page 5050 Fourth Quarter 2000Fourth Quarter 2000
Analyte Unit Method Minimum/Maximum EQLs
Cesium-137 µCi/mL EPIA-013 1.48E-09/3.93E-09Cobalt-57 µCi/mL EPIA-013 1.95E-09/3.12E-09Cobalt-60 µCi/mL EPIA-013 1.53E-09/4.45E-09Curium-242 µCi/mL EPIA-011 1.71E-11/2.12E-09Curium-243/244 µCi/mL EPIA-011 4.33E-11/2.78E-09Curium-245/246 µCi/mL EPIA-011 1.97E-11/1.67E-09Europium-152 µCi/mL EPIA-013 3.96E-09/1.2E-08Europium-154 µCi/mL EPIA-013 4.48E-09/1.12E-08Europium-155 µCi/mL EPIA-013 5.29E-09/1.6E-08Gross alpha µCi/mL EPIA-001 2.74E-10/1.73E-08
µCi/mL EPA900.0 3.08E-09/3.62E-09Iodine-129 µCi/mL EPIA-006 4.78E-10/5.81E-09Lead-212 µCi/mL EPIA-013 3.07E-09/7.6E-09Manganese-54 µCi/mL EPIA-013 2.17E-09/3.44E-09Neptunium-237 µCi/mL EPIA-032 9.2E-11/7.29E-10Nickel-63 µCi/mL EPIA-022 1.5E-08/1.83E-07Nonvolatile beta µCi/mL EPIA-001 7.31E-10/4.16E-08
µCi/mL EPA900.0 6.28E-09/6.9E-09Plutonium-238 µCi/mL EPIA-011 5.78E-11/2.84E-09Plutonium-239/240 µCi/mL EPIA-011 2.83E-11/1.43E-09Plutonium-244 µCi/mL EPIA-011 9.03E-11/1.98E-10Potassium-40 µCi/mL EPIA-013 1.51E-08/5.93E-08Promethium-144 µCi/mL EPIA-013 2.06E-09/3.27E-09Promethium-146 µCi/mL EPIA-013 1.87E-09/5.06E-09Radium, total alpha-emitting µCi/mL EPIA-010 1.15E-10/1.93E-09Radium-226 µCi/mL EPIA-008 8.02E-11/9.18E-10Radium-228 µCi/mL EPIA-009 5.87E-10/2.46E-09Radon-222 µCi/mL EPIA-007 3.94E-08/5.52E-08Ruthenium-106 µCi/mL EPIA-013 1.98E-08/2.97E-08Sodium-22 µCi/mL EPIA-013 2.26E-09/3.99E-09Strontium-89/90 µCi/mL EPIA-004 1.44E-09/8.19E-09Strontium-90 µCi/mL EPIA-004 2.03E-10/1.42E-09Technetium-99 µCi/mL EPIA-005 3.89E-09/3.98E-08Thallium-208 µCi/mL EPIA-013 1.75E-09/4.46E-09Thorium-228 µCi/mL EPIA-012 4.42E-11/3.05E-09Thorium-230 µCi/mL EPIA-012 2.2E-11/1.54E-09Thorium-232 µCi/mL EPIA-012 1.57E-11/1.38E-09Tritium µCi/mL EPIA-002 5.62E-07/1.02E-05Uranium-233/234 µCi/mL EPIA-011 5.69E-11/1.91E-09Uranium-235 µCi/mL EPIA-011 6.4E-11/1.56E-09Uranium-238 µCi/mL EPIA-011 5.47E-11/2.73E-09Yttrium-88 µCi/mL EPIA-013 2.64E-09/4.68E-09Zinc-65 µCi/mL EPIA-013 4.14E-09/9.08E-09
Table 16.Table 16. Methods and Estimated Quantitation Limits Used by MLMethods and Estimated Quantitation Limits Used by ML
Analyte Unit Method Minimum/Maximum EQLs
Acetone µg/L EPA8260B 10.0/2,000Benzene µg/L EPA8260B 1.0/200Bromodichloromethane µg/L EPA8260B 1.0/200Bromoform µg/L EPA8260B 1.0/200Bromomethane µg/L EPA8260B 1.0/200
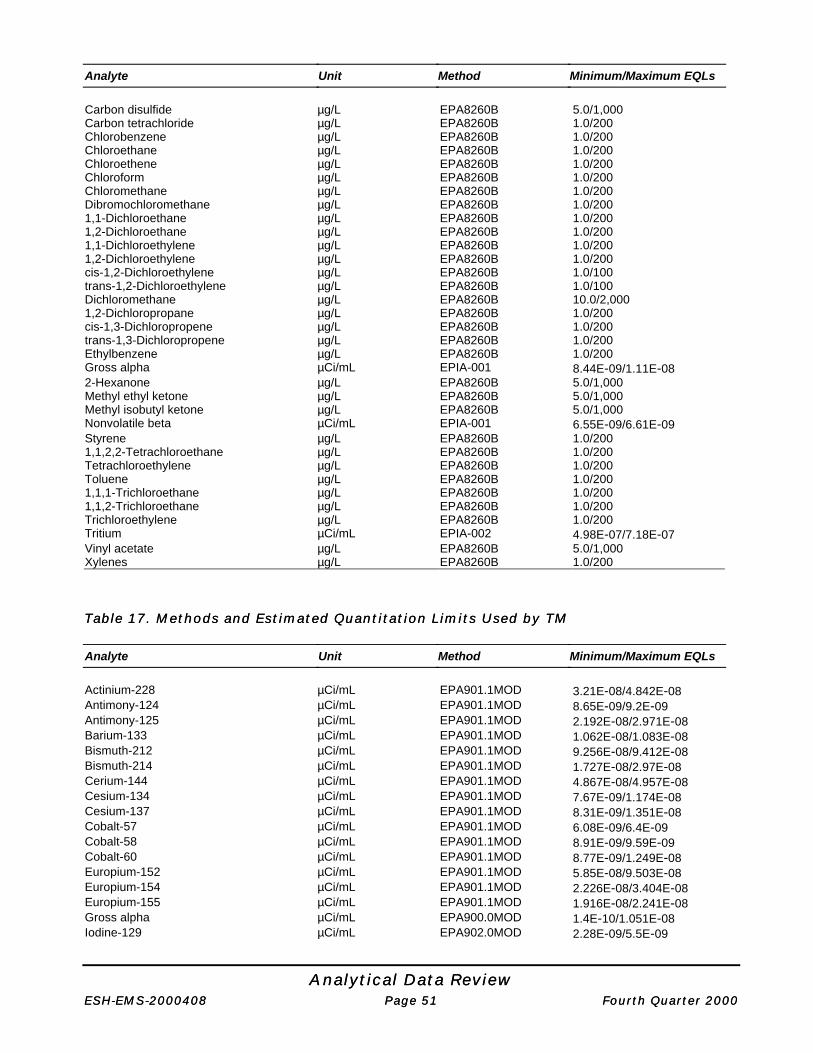
Analytical Data ReviewAnalytical Data ReviewESH-EMS-2000408ESH-EMS-2000408 Page Page 5151 Fourth Quarter 2000Fourth Quarter 2000
Analyte Unit Method Minimum/Maximum EQLs
Carbon disulfide µg/L EPA8260B 5.0/1,000Carbon tetrachloride µg/L EPA8260B 1.0/200Chlorobenzene µg/L EPA8260B 1.0/200Chloroethane µg/L EPA8260B 1.0/200Chloroethene µg/L EPA8260B 1.0/200Chloroform µg/L EPA8260B 1.0/200Chloromethane µg/L EPA8260B 1.0/200Dibromochloromethane µg/L EPA8260B 1.0/2001,1-Dichloroethane µg/L EPA8260B 1.0/2001,2-Dichloroethane µg/L EPA8260B 1.0/2001,1-Dichloroethylene µg/L EPA8260B 1.0/2001,2-Dichloroethylene µg/L EPA8260B 1.0/200cis-1,2-Dichloroethylene µg/L EPA8260B 1.0/100trans-1,2-Dichloroethylene µg/L EPA8260B 1.0/100Dichloromethane µg/L EPA8260B 10.0/2,0001,2-Dichloropropane µg/L EPA8260B 1.0/200cis-1,3-Dichloropropene µg/L EPA8260B 1.0/200trans-1,3-Dichloropropene µg/L EPA8260B 1.0/200Ethylbenzene µg/L EPA8260B 1.0/200Gross alpha µCi/mL EPIA-001 8.44E-09/1.11E-082-Hexanone µg/L EPA8260B 5.0/1,000Methyl ethyl ketone µg/L EPA8260B 5.0/1,000Methyl isobutyl ketone µg/L EPA8260B 5.0/1,000Nonvolatile beta µCi/mL EPIA-001 6.55E-09/6.61E-09Styrene µg/L EPA8260B 1.0/2001,1,2,2-Tetrachloroethane µg/L EPA8260B 1.0/200Tetrachloroethylene µg/L EPA8260B 1.0/200Toluene µg/L EPA8260B 1.0/2001,1,1-Trichloroethane µg/L EPA8260B 1.0/2001,1,2-Trichloroethane µg/L EPA8260B 1.0/200Trichloroethylene µg/L EPA8260B 1.0/200Tritium µCi/mL EPIA-002 4.98E-07/7.18E-07Vinyl acetate µg/L EPA8260B 5.0/1,000Xylenes µg/L EPA8260B 1.0/200
Table 17.Table 17. Methods and Estimated Quantitation Limits Used by TMMethods and Estimated Quantitation Limits Used by TM
Analyte Unit Method Minimum/Maximum EQLs
Actinium-228 µCi/mL EPA901.1MOD 3.21E-08/4.842E-08Antimony-124 µCi/mL EPA901.1MOD 8.65E-09/9.2E-09Antimony-125 µCi/mL EPA901.1MOD 2.192E-08/2.971E-08Barium-133 µCi/mL EPA901.1MOD 1.062E-08/1.083E-08Bismuth-212 µCi/mL EPA901.1MOD 9.256E-08/9.412E-08Bismuth-214 µCi/mL EPA901.1MOD 1.727E-08/2.97E-08Cerium-144 µCi/mL EPA901.1MOD 4.867E-08/4.957E-08Cesium-134 µCi/mL EPA901.1MOD 7.67E-09/1.174E-08Cesium-137 µCi/mL EPA901.1MOD 8.31E-09/1.351E-08Cobalt-57 µCi/mL EPA901.1MOD 6.08E-09/6.4E-09Cobalt-58 µCi/mL EPA901.1MOD 8.91E-09/9.59E-09Cobalt-60 µCi/mL EPA901.1MOD 8.77E-09/1.249E-08Europium-152 µCi/mL EPA901.1MOD 5.85E-08/9.503E-08Europium-154 µCi/mL EPA901.1MOD 2.226E-08/3.404E-08Europium-155 µCi/mL EPA901.1MOD 1.916E-08/2.241E-08Gross alpha µCi/mL EPA900.0MOD 1.4E-10/1.051E-08Iodine-129 µCi/mL EPA902.0MOD 2.28E-09/5.5E-09

Analytical Data ReviewAnalytical Data ReviewESH-EMS-2000408ESH-EMS-2000408 Page Page 5252 Fourth Quarter 2000Fourth Quarter 2000
Analyte Unit Method Minimum/Maximum EQLs
Lead-212 µCi/mL EPA901.1MOD 1.263E-08/2.141E-08Manganese-54 µCi/mL EPA901.1MOD 7.5E-09/8.48E-09Nonvolatile beta µCi/mL EPA900.0MOD 9.0E-11/1.135E-08Potassium-40 µCi/mL EPA901.1MOD 1.164E-07/1.591E-07Promethium-144 µCi/mL EPA901.1MOD 8.26E-09/8.53E-09Promethium-146 µCi/mL EPA901.1MOD 1.541E-08/2.159E-08Radium, total alpha-emitting µCi/mL EPA903.0MOD 9.0E-11/4.45E-09Radium-228 µCi/mL EPA904.0MOD 7.6E-10/3.18E-09Radon-222 µCi/mL EPA901.1MOD 1.727E-08Ruthenium-106 µCi/mL EPA901.1MOD 7.815E-08/7.824E-08Sodium-22 µCi/mL EPA901.1MOD 7.9E-09/9.36E-09Strontium-90 µCi/mL EMLSR02MOD 4.9E-10/4.02E-09Technetium-99 µCi/mL EICHROMTC1MOD 1.876E-08/2.018E-08Thallium-208 µCi/mL EPA901.1MOD 3.698E-08/3.945E-08Tin-113 µCi/mL EPA901.1MOD 9.86E-09/1.012E-08Tritium µCi/mL EPA906.0MOD 7.1E-07/4.74892E-03Yttrium-88 µCi/mL EPA901.1MOD 8.08E-09/1.027E-08Zinc-65 µCi/mL EPA901.1MOD 1.839E-08/1.971E-08Zirconium-95 µCi/mL EPA901.1MOD 1.536E-08/1.552E-08

Quality Control SamplesQuality Control SamplesESH-EMS-2000408ESH-EMS-2000408 Page Page 5353 Fourth Quarter 2000Fourth Quarter 2000
Quality Control SamplesQuality Control SamplesThis section discusses the analytical data in terms of the following indicators of data quality: precision,accuracy, representativeness, comparability, and completeness. Precision is determined from the field andlaboratory duplicate or replicate analyses and indicates the consistency of field and laboratory techniques.Accuracy is determined from the quality control standards, laboratory data records reviews, laboratory controlsamples or blank spikes, surrogates, matrix spikes, and the results of method, field, and trip blanks andindicates the ability of the laboratory to generate correct results. (Equipment blanks are used to evaluate theeffectiveness of the cleaning procedures used in the field.) Representativeness is the determination of how wellthe sample reflects the site’s characteristics. Comparability expresses the confidence with which data fromdifferent laboratories are considered to be equivalent. Completeness measures the amount of useable dataresulting from the data collection activity.
PRECISIONPRECISIONPrecision is a measure of the repeatability of a measurement and is evaluated from the results of duplicatesamples and splits. Blind replicates, or field replicates, measure the repeatability of the sampling and analyticaltechniques, and laboratory duplicates measure the ability of the laboratory to reproduce a result. Split samplesmeasure whether two laboratories using comparable procedures obtain equivalent results. Low precision canbe caused by poor instrument performance, poor operator technique, inconsistent application of methodprotocols, laboratory environment, time between analyses, or by a difficult, heterogeneous sample matrix.
Replicate and Duplicate AnalysesReplicate and Duplicate Analyses of of Samples SamplesBlind replicate and duplicate samples are analyzed to establish the precision of scheduled analyses. Thereplicate and duplicate analytical results are used to generate Mean Relative Difference (MRD) indices, whichare used to evaluate the laboratories’ performances.
The primary laboratories, EM, EX, GE, and WA, performed all analyses with the following exceptions: GP andTM performed radionuclide analyses for GE and WA. ML conducted gross alpha, nonvolatile beta, and tritiumanalyses. MS performed several screening level analyses for the C-Area Rubble Pit, D-Area Oil Basin, andMiscellaneous Chemical Basin sampling projects.
For intralaboratory comparisons, generally 10% of the samples are analyzed in duplicate. In addition, EPD/EMSsends blind replicates of approximately 5% of the total samples to the laboratories for analysis. The results ofthe blind replicate analyses are used for both intralaboratory and interlaboratory comparisons.
All fourth quarter 2000 analytical results that have undergone the standard WSRC verification and validationprocess are included in the Analytical Results section (Appendix B) of this report). Results from duplicatesamples are included in the main table for a given well and sample date. Results from analyses of replicatesamples and duplicate analyses of the replicates are reported in a second table for the same well and sampledate.
Table 18 lists the well names, sample dates, and associated blanks for wells used as blind replicates for EX,GE, WA, and ML.
Certain analytes were not present in concentrations above estimated quantitation limits in any well sampleshaving replicates or duplicates. These analytes are not considered in further evaluation of replicate andduplicate analyses and are listed in tables 19 and 20. See tables 12–17 for the estimated quantitation limits thatare applicable this quarter.
Intralaboratory ComparisonsIntralaboratory Comparisons
Intralaboratory comparisons are of two types: in-house duplicates and blind replicates. The MRD was devel-oped by R.C. Tuckfield of the Applied Statistics Group at the Savannah River Technology Center, in conjunctionwith M.M. Khalil of EPD/EMS, to assess the reproducibility of identical chemical analyses. For both intralabora-

Quality Control SamplesQuality Control SamplesESH-EMS-2000408ESH-EMS-2000408 Page Page 5454 Fourth Quarter 2000Fourth Quarter 2000
tory comparisons, the MRD is defined as the average absolute difference between an original sample and itsduplicate or blind replicate, expressed as a percentage of the mean of those two values. It is calculated as
( ( )[ ])MRD = x
x y x y
n
i i i ii
n
− +
=∑ / /
,
2
1001
For the in-house duplicate comparisons, the quantities xi and yi represent the results for the original sampleand the in-house duplicate, respectively. For the blind replicate comparisons, xi and yi represent the results forthe known sample and the EPD blind replicate, respectively. Generally, the closer the original results and theirreplicate or duplicate results are to each other, the lower the MRD.
An Adjusted Mean Relative DifferenceAn Adjusted Mean Relative Difference
A drawback to the MRD statistic occurs when xi and yi are close to zero. This drawback can be illustrated bydetermining the relative difference (RD) for the i th well or sample as follows:
Figure 4. Relative Difference vs. the MeanFigure 4. Relative Difference vs. the Mean
The RDi is an individual term in the MRD calculation for the i th replicated sample. For example, if xi = 99 and yi
= 101, then RDi = 2%. However, if xi = 3 and yi = 1, then RDi = 100%. Both situations have the same absolutedifference, but the latter situation has a much larger relative difference. The effect can be shown by graphing
where
x
i
y
n
ith
i
= an analyte' s mean concentration
in a water sample for the well,
= the analyte' s mean concentrationin the replicate or duplicate, and
= the number of pairs of observation s..
RDii i
i
x y
z=
−
where zx y
ii i=
+
.2

Quality Control SamplesQuality Control SamplesESH-EMS-2000408ESH-EMS-2000408 Page Page 5555 Fourth Quarter 2000Fourth Quarter 2000
the relative difference vs. the mean (zi ) and marking contours for constant levels of absolute difference(figure 4). The first contour, in the lower left corner of the figure, represents the smallest absolute difference.The last contour, in the upper right corner of the figure, represents the largest absolute difference.
The inordinate inflation of the MRD when xi and yi are near zero is of particular concern when the results arebelow the limit of quantitation (LOQ). Briefly, the LOQ is defined by L.H. Keith (1991) as 10 times the instrumentsignal standard deviation (σ) for blank samples. For perspective, the limit of detection is defined as 3σ.
The reproducibility of analytical results less than the LOQ is considered by environmental chemists to bequestionable. In this situation, the RDi may reflect variation more in the measuring device itself than in themeasuring process. However, the MRD can be a useful statistic if adjusted so that results below the LOQhave less influence than more reproducible results above the LOQ.
The simplest adjustment to the MRD to reduce the influence of analyte concentrations near zero is to weighteach RDi in the calculation by an amount, wi, that reflects its proximity to the LOQ value. Figure 5 shows therelationship between wi and analyte concentration. This relationship is a linear-weight function.
Figure 5. Relationship between Figure 5. Relationship between wwii and Analyte and AnalyteConcentrationConcentration
Figure 6 shows the computer simulation results for the effect of a linear-weight function on the now-adjustedMRD (MRDadj), developed by Tuckfield and Khalil, again by determining constant contours of absolute differ-ence. Below the LOQ, all samples with the same absolute difference are given the same adjusted RD value.Above the LOQ, the unadjusted RD is preserved because the weight function is unity when zi is greaterthan the LOQ.
Figure 6. Effect of a Linear-Weight Function on theFigure 6. Effect of a Linear-Weight Function on theMRDadjMRDadj

Quality Control SamplesQuality Control SamplesESH-EMS-2000408ESH-EMS-2000408 Page Page 5656 Fourth Quarter 2000Fourth Quarter 2000
The MRDadj, then, has the following form:
This adjustment has several advantages. For example, the weight function reflects the chemist’s view of thereliability of the measurement. If analyses are conducted on different equipment (i.e., with different LOQs),the precision of the equipment is included automatically in the MRD. Data from more precise equipment aregiven more influence. Also, no data are removed from the computation completely, so the sample size (n) isnot affected.
Normalizing Data to the Reference DetectionNormalizing Data to the Reference Detection Limit Limit
Because some detection limits may be anomalously high (because of dilution or other effects, for example), itis necessary to use a reference detection limit (RDL) in the MRD calculations. This is set as the 90th percentilevalue of the detection limits of the not-detected samples. All the results less than the RDL are adjusted up tothat value. Results that are detection limit values above the RDL are eliminated from the MRD index calcula-tions. By definition, fewer than 10% of the detection limit values are above the RDL. The intralaboratory MRDindices are listed in tables 21–27. Table 23 provides the intralaboratory MRD matrix spike indices for GE.
InterlaboratoryInterlaboratory Comparisons Comparisons
For interlaboratory comparisons, the MRD is calculated as the average absolute difference between the labo-ratories for the i th well expressed as a percentage of the mean of both laboratories. For these comparisons,xi and yi represent the mean analyte concentrations for the i th well; xi represents the mean from onelaboratory, and yi represents the mean from the other. The means are calculated from the known sampleresults and the EPD blind replicate results.
Choosing an RDLChoosing an RDL
For interlaboratory comparisons, a new RDL must be established for calculation of the MRD. The interlabora-tory RDL is chosen as the 90th percentile value from the combined array of non-detected sample results fromboth laboratories.
Normalizing Data to the RDLNormalizing Data to the RDL
All results less than the RDL are adjusted to the new RDL value. Detection limit values above the RDL areeliminated from the MRD index comparison and from the t-tests. By definition, fewer than 10% of the detectionlimit values are above the RDL. In addition to the interlaboratory MRD calculations, paired t-tests are performedto see if the difference between the mean concentrations of an analyte from the same well reported by eachlaboratory is significant. The t-test tests the null hypothesis that there is no significant difference in the concen-trations reported by the two laboratories. The MRD and the t-test results for analytes with at least one pair ofresults above the interlaboratory RDL are listed in tables 28–31.
Analytes with significance-of-probability values less than .050 (tables 28–31) indicate a probability of less than5% that the results for that analyte are the same from both laboratories.
MRDadj =
w RD=
i ii
n
n1
∑,
where wLOQ
; if LOQ
otherwise.
i
i iz z=
<
1 ;

Quality Control SamplesQuality Control SamplesESH-EMS-2000408ESH-EMS-2000408 Page Page 5757 Fourth Quarter 2000Fourth Quarter 2000
Presentation of the Replicate and Duplicate AnalysesPresentation of the Replicate and Duplicate AnalysesIn tables 28–31, high MRDs (greater than or equal to 20) appear in bold type. Low MRDs (less than or equal to.050) appear in bold italic type.
Table 32 lists analytes and wells for which samples and blind replicates analyzed by GE yielded results whereone was more than twice another.
Table 33 lists analytes and wells for which samples and blind replicates analyzed by WA yielded results whereone was more than twice another.
Table 34 lists analytes and wells for which samples and laboratory duplicates analyzed by WA yielded resultswhere one was more than twice another.
Table 35 lists analytes and wells for which samples and blind replicates analyzed by GP yielded results whereone was more than twice another.
Table 36 lists analytes and wells for which samples and laboratory duplicates analyzed by GP yielded resultswhere one was more than twice another.
Table 37 lists analytes and wells for which samples and blind replicates analyzed by TM yielded results whereone was more than twice another.
Table 38 lists analytes and wells for which samples and laboratory duplicates analyzed by TM yielded resultswhere one was more than twice another.
Tables 39 and 40 list analytes and wells where a result from one laboratory was more than twice the corre-sponding result from the other laboratory.
See the Analytical Methods subsection of the Analytical Data Review section of this report for more information.
ACCURACYACCURACYAccuracy is defined as the closeness of agreement between an observed value and an accepted referencevalue or as a measure of the over- or underestimation of reported concentrations. Accuracy is especiallyimportant when the concentration of concern approaches the detection limit and/or the action limit. When theconcentration is underestimated near the detection limit, the analyte may be present but reported as notdetected; near the action limit, the analyte may be at a concentration that would require remediation, but theremediation would not be performed. When the concentration is overestimated near the detection limit, theanalyte may not be present but reported as detected; near the action limit, the analyte may not be at aconcentration that would require remediation, but the remediation would be performed. Quality controlstandards, laboratory data records reviews, performance evaluation studies, laboratory control samples,surrogate and matrix spikes, and method blanks are used to evaluate accuracy.
Quality Control StandardsQuality Control StandardsDuring fourth quarter 2000, EPD/EMS conducted quality assessments of EM, EX, GE, WA, and MLlaboratories. Each laboratory received a set of certified environmental quality control standards fromEnvironmental Resource Associates (ERA) of Arvada, CO (lot numbers 443, 595, 596, 3236, 3444, 8925,99103, 99104, and 99105). Each laboratory’s results were compared with the ERA-certified values andperformance acceptance limits (PALs). The PALs are listed as guidelines for acceptable analytical results giventhe limitations of the EPA methods used to determine these parameters. The PALs closely approximate the95% confidence interval. EX, GE, WA, ML, and EM all returned results for fourth quarter 2000 quality controlassessments. The laboratories’ results and the certified values and limits are listed in tables 41–45.
EX, GE, and WA analyzed total petroleum hydrocarbons by the infrared method and grease and oil by thegravimetric method. The laboratories were requested to report m-cresol and p-cresol as m/p-cresol and m-

Quality Control SamplesQuality Control SamplesESH-EMS-2000408ESH-EMS-2000408 Page Page 5858 Fourth Quarter 2000Fourth Quarter 2000
xylene and p-xylene as m/p-xylene because current analytical methods do not allow them to separate theseanalytes reliably.
EX did not report results for fluoranthene. GE did not report results for fluoranthene, 2-sec-butyl-4,6-dinotrophenol, and toxaphene. WA did not report fluoranthene and tetrachloroethylene results. EM did notreport volatiles because the volatiles instrument was down.
MS third quarter results are attached in an addendum to this report. The fourth quarter results from MS will beincluded in the first quarter 2001 report.
GE does not perform the analysis for total petroleum hydrocarbons. Consequently, the laboratory was notrequested to report the results for this analysis. ML does not perform the following analyses: boron, cations,grease and oil, herbicides, inorganics, molybdenum, nutrients, strontium, total petroleum hydrocarbons,toxaphene, and turbidity. Consequently, the laboratory was not requested to report the results for theseanalyses. ML does do cyanide analysis but was not requested to do so during fourth quarter 2000.
Ninety-nine analyses were requested of EX, GE, and WA. Sixty-six analyses were requested of ML. Forty-fouranalyses of volatiles and metals were requested of EM. Of the 98 analyses reported by EX, 94, or 95.9%, werewithin the PALs. Of the 95 analyses reported by GE, 95, or 100%, were within the PALs. Of the 97 analysesreported by WA, 91, or 93.8%, were within the PALs. Of the 65 analyses reported by ML, 63, or 96.9%, werewithin the PALs. Of the 22 analyses reported by EM, 21, or 95.5% were within the PALs.
Performance EvaluationPerformance EvaluationOver the past few months, ML participated in an EPA’ s Laboratory Performance Evaluation Water Pollution(WP) study. EPA conducts the studies biannually to certify laboratories for specific analyses.
Table 46 contains results for WP69. In WP69, which was reported in December 2000, the ML results forbenzo[b]flouranthene and dimethyl phthalate were outside of acceptance limits. In addition, ML was asked tocheck for error for the results of calcium and PCB 1260.
Laboratory Data RecordsLaboratory Data Records Review ReviewLaboratory Data Records Reviews (LDRRs) are conducted periodically at laboratories which performenvironmental analyses for WSRC. The purpose of the reviews is to investigate technical validation issuesdiscussed in Superfund’s Data Quality Objectives which are not adequately addressed by computer checkingthe AN98 electronic data deliverables, or by reviewing the analytical narratives or the COC forms. Thesetechnical issues include instrument calibration, analyte identification, and analyte quantitation. The issues areaddressed by examining all initial calibration records for the period reviewed, continuing calibration records forrandomly selected dates within the period reviewed, and selected sample records from those dates.
The LDRR emphasizes programmatic laboratory behavior; a judgment is formed on whether the laboratory is oris not in compliance with WSRC requirements. However, if any QA/QC issues identified during the review arejudged to be significant enough to affect data usability (R- and U-qualifier issues), then the affected data will beappropriately qualified. QA/QC issues that do not affect data usability (J-qualifier issues) are noted in the report,but do not result in requalification of data.
The LDRRs for fourth quarter 2000 were conducted at EX, GE and GP, WA, and ML during February andMarch 2001. The LDRR results are summarized below.
Fourth Quarter 2000 Records Review ofFourth Quarter 2000 Records Review of EX EX
On March 21–22, 2001, laboratory data records were reviewed for organic and inorganic analyses conducted byEX during fourth quarter 2000. No technical issues of concern were identified during the review.

Quality Control SamplesQuality Control SamplesESH-EMS-2000408ESH-EMS-2000408 Page Page 5959 Fourth Quarter 2000Fourth Quarter 2000
Fourth Quarter 2000 Records Review ofFourth Quarter 2000 Records Review of GE and GP GE and GP
On February 27–28 and March 1, 2001, laboratory records were reviewed for organic, inorganic, andradiochemical analyses associated with soil and groundwater samples conducted by GE and GP during fourthquarter 2000. No technical issues of concern were identified during the review.
Fourth Quarter 2000 Records Review ofFourth Quarter 2000 Records Review of WA WA
On March 12–14, 2001, laboratory data records were reviewed for inorganic and organic analyses associatedwith soil and groundwater samples conducted by WA during fourth quarter 2000. No technical issues of concernwere identified during the review.
Fourth Quarter 2000 Records Review ofFourth Quarter 2000 Records Review of ML ML
On March 7–9 2001, laboratory records were reviewed for organic and inorganic analyses associated with soiland groundwater samples conducted by ML during fourth quarter 2000. No technical issues of concern wereidentified during the review.
Laboratory Control SamplesLaboratory Control SamplesLaboratory control samples are used to monitor the performance of all steps in the analysis process, includingsample preparation, and are used to identify problems with the analytical procedure. Laboratory control samplesare deionized water spiked with selected target analytes, prepared, and analyzed with the regular samples forinorganic and radiological parameters. Blank spikes are organic-free water spiked with selected target analytes,prepared, and analyzed with the regular samples for organic parameters. The spiking solutions for laboratorycontrol samples are obtained from the EPA or a third-party supplier, or they are prepared in the laboratory withchemicals from a different source than the calibration standards. All laboratory control standards are validatedto EPA standards, as detailed in the EGG Operating Handbook, section 1.800, Analytical Data Qualification.
The percent recovery (% R) for laboratory control samples or blank spikes is calculated as
% . R =Observed concentration
Known concentration× 100
Tables 47–51 list the statistical information for the percent recovery for laboratory control samples by analyte forGE, WA, GP, ML, and TM. The Qualified Out of Range column provides the number of laboratory controlsamples or blank spikes that had percent recoveries outside the acceptance limits compared to the totalnumber analyzed; the other columns provide the mean recovery, standard deviation, and the minimum andmaximum recoveries.
SurrogatesSurrogates
Surrogates are analytes not normally found in environmental samples that are used to spike all samples, QCsamples, and calibration standards for organic analyses. Surrogates are added prior to analysis for VOAs(volatile organic analyses) and prior to extraction for semivolatiles, pesticides, and herbicides. Low surrogaterecovery is a measure of the effect of the sample matrix, high analyte concentration, or laboratory error. Highsurrogate recovery usually indicates instrument or sample preparation errors. All surrogates are validated toEPA standards, as detailed in the WSRC EGG Operating Handbook, section 1.800, Analytical DataQualification.
Tables 52–55 list the statistical information for the percent recovery for the surrogates by analyte for EX, GE,WA, and ML. The Qualified Out of Range column gives the number of surrogates that had percent recoveriesoutside the acceptance limits compared to the total number analyzed; the other columns provide the meanrecovery, standard deviation, and the minimum and maximum recoveries.

Quality Control SamplesQuality Control SamplesESH-EMS-2000408ESH-EMS-2000408 Page Page 6060 Fourth Quarter 2000Fourth Quarter 2000
Matrix SpikesMatrix Spikes
Matrix spikes are used to evaluate the effect of the sample matrix on the analytical procedure. Matrix spikes areprepared by adding a known quantity of the target analyte to at least 5% of the samples prior to samplepreparation. For the inorganic analyses, all target analytes are spiked. For the organic analyses, selected targetanalytes are used in the spiking solution. Results from the matrix spike are used to evaluate the extent of matrixinterference and to determine the bias of the procedure for the sample matrix. Matrix spikes have the samerecovery limits as laboratory control samples.
The percent recovery for matrix spikes is calculated as
% R =SSR - SR
SA× 100 ,
where
% R = percent recovery
SSR = spiked sample result
SR = sample result, and
SA = spike added.
Percent bias in tables 56–60 is the difference between 100% and the mean recovery; a negative value indicatesthat the mean recovery was below 100%. If the bias is consistently positive, the laboratory may beoverestimating the concentration of the analyte, and if the bias is consistently negative, the laboratory may beunderestimating the concentration of the analyte. Results close to the quantitation and action limits should beclosely examined, and their use in decision-making should be carefully considered.
Matrix spikes are rejected if the concentration of the analyte in the sample is more than four times the amountof the spike. Results for matrix spikes are provided in tables 56–60 for EX, GE, WA, GP, and ML. The QualifiedOut of Range column provides the number of matrix spikes that had percent recoveries outside the acceptancelimits compared to the total number analyzed; the other columns provide the mean recovery, standard deviation,percent bias, and the minimum and maximum recoveries.
Method BlanksMethod BlanksMethod blanks, or laboratory blanks, are used to determine the existence and magnitude of contaminationproblems resulting from the analytical process. Method blanks are deionized water to which all reagents areadded in the same proportions used in sample processing. When method blanks have detectable concen-trations of the analytes, the laboratory must determine the cause and take corrective action to eliminate thecontamination.
Tables 61–66 list the statistical information for analytes detected in method blanks for EX, GE, WA, GP, ML,and TM. The Frequency of Detection column provides the number of method blanks analyzed for each analyteduring the quarter that had detectable concentrations compared to the total number that were analyzed. Theother columns list the mean result, standard deviation, and minimum and maximum results.
Field BlanksField BlanksField blanks (called QA blanks in the tables) are used to identify possible sources of contamination from theprocessing and shipping of samples. Field blanks are sample bottles filled with deionized water prior to wellsampling; the bottles are not opened at the sampling site. The field blanks are sent along with, and analyzed inthe same manner as, the samples. Positive results from field blanks can result from analytical bias, contami-nated sample bottles, contaminated deionized water, or contamination during shipping or analysis. The resultsfrom all samples in the sample delivery group are evaluated by the laboratory and data validators to determinethe cause of the contamination and the corrective action to be taken.

Quality Control SamplesQuality Control SamplesESH-EMS-2000408ESH-EMS-2000408 Page Page 6161 Fourth Quarter 2000Fourth Quarter 2000
Tables 67–72 list the statistical information for the field blanks by analyte for EX, GE, WA, GP, ML, and TM. TheFrequency of Detection column gives the number of field blanks analyzed for each analyte during the quarterthat had detectable concentrations compared to the total number analyzed. The other columns list the meanresult, standard deviation, and minimum and maximum results.
Trip BlanksTrip BlanksTrip blanks are vials of deionized water sent to the laboratory for volatiles analysis with each shipping coolercontaining volatiles samples. Trip blanks are used to check for contamination resulting from shipping, primarilydue to the breaking of the vial’s seal because of depressurization during air transport. Trip blanks are used alsoto test the laboratories’ reliability. The blanks are prepared by adding preservative to a 40 mL vial, filling itcompletely with deionized water, and sealing the top with a Teflon-lined septum cap. The results from allsamples in the sample delivery group are evaluated by the laboratory and data validators to determine thecause of the contamination and the corrective action to be taken.
Tables 73–76 list the statistical information for the analytes detected in trip blanks by EX, GE, WA, and ML. TheFrequency of Detection column gives the number of trip blanks analyzed for each analyte during the quarterthat had detectable concentrations compared to the total number analyzed. The other columns list the meanresult, standard deviation, and minimum and maximum results.
Equipment Blanks or RinsatesEquipment Blanks or RinsatesEquipment blanks (called EPT blanks in the tables) or rinsates are used to determine if sampling equipmentthat has been cleaned in the field is contaminated. Prior to sampling, deionized water is poured over or pumpedthrough portions of the sampling equipment that come in contact with the sample. If the equipment blank iscontaminated, the field cleaning procedure must be evaluated to determine the cause of the contamination.Results for all samples collected with equipment cleaned in the field must be evaluated to determine whetherthe contamination is isolated or generalized.
No information about equipment blanks was provided for fourth quarter 2000.
Blanks ResultsBlanks Results
The blanks results tables in Appendix C list the dates, field measurements, and analytical results for thesampling blanks. See Appendix B for a key to the abbreviations used in the tables.
REPRESENTATIVENESSREPRESENTATIVENESSA representative sample is a sample that can be expected to exhibit the average properties of the populationbeing sampled. Representativeness for groundwater samples can be affected by using a bailer to collect thesample from the well, metal casings in the well, and turbidity (suspended particulates) in the sample. Theresults may be biased positively or negatively.
If a well is bailed, VOAs are biased negatively due to aeration of the sample in the sampling process. Table 77lists the wells that were bailed during fourth quarter 2000.
For metal casings, the bias for metals can be positive or negative depending on whether the casing is releasingor absorbing metals. Table 78 lists the wells with metal casings that were sampled during fourth quarter 2000.
If turbidity is greater than 15 NTU, the metals can be biased positively or negatively, and the radionuclides—particularly those that are determined by gamma spectroscopy—can be masked due to self-absorption.Table 79 lists the wells that had turbidity results greater than 15 NTU during fourth quarter 2000.

Quality Control SamplesQuality Control SamplesESH-EMS-2000408ESH-EMS-2000408 Page Page 6262 Fourth Quarter 2000Fourth Quarter 2000
COMPARABILITYCOMPARABILITYComparability is evaluated by confirming that the laboratories used the same standardized procedures forsample preparation and analysis, that the reporting units are the same, and that similar quantitation limits wereobtained. The analytical methods, reporting units, and EQLs reported by each laboratory are given in tables 12–17 in the Analytical Data Review section. Tables 39–40 list the analytes and wells where a result from onelaboratory was more than twice the corresponding result from the other laboratory.
COMPLETENESSCOMPLETENESSCompleteness is evaluated by comparing the wells scheduled for sampling with the wells sampled andcomparing the requested analyses with the analytical data received. The number of wells sampled and therequested analyses are determined from the chains of custody. Tables 80–82 list the reasons the laboratoriesdid not perform certain analyses on samples from wells that could be sampled. For fourth quarter 2000, onlyEX, GE, and WA did not perform certain analyses. See the Sample Scheduling, Field Notes, and AnalyticalResults sections of this report for more information on wells scheduled but not sampled this quarter.
Table 18.Table 18. Wells Providing Blind Replicate Samples and Associated BlanksWells Providing Blind Replicate Samples and Associated Blanks
WellSampleDate Replicate
AssociatedBlank
BGO 10AA 11/02/00 QA 31D QA 32DBGO 11DR 12/18/00 QA 33D QA 34DBGO 12CX 11/28/00 QA 35D QA 36DBGO 16AR 12/16/00 QA 37D QA 38DBGO 18A 11/02/00 QA 39D QA 40DBGO 27C 11/06/00 QA 41D QA 42DBGO 37C 11/15/00 QA 43D QA 44DBGO 43D 11/07/00 QA 45D QA 46DBGO 46B 11/09/00 QA 47D QA 48DBGO 48C 11/07/00 QA 49D QA 50DBGO 49C 11/10/00 QA 51D QA 52DBGX 12C 12/05/00 QA 53D QA 54DBRD 5D 11/02/00 QA 59D QA 60DCRP 3D 11/16/00 QA 65D Not applicableCRP 16DU 12/07/00 QA 67D Not applicableCRP 17DU 12/07/00 QA 69D Not applicableDOB 20 12/13/00 QA 79D QA 80DFSB 79A 10/03/00 QA 1D QA 2DFSB 87A 10/03/00 QA 3D QA 4DFSB 99A 10/04/00 QA 5D QA 6DFSB110C 10/04/00 QA 7D QA 8DFSB120C 10/09/00 QA 9D QA 10DHSB 65B 10/10/00 QA 11D QA 12DHSB 86A 10/11/00 QA 13D QA 14DHSB102C 10/12/00 QA 15D QA 16DHSB122A 10/12/00 QA 17D QA 18DHSB139A 10/16/00 QA 19D QA 20DHSB140A 10/16/00 QA 21D QA 22DHSB146A 10/17/00 QA 23D QA 24DLFW 43B 10/02/00 QA 55D QA 56DLFW 45D 11/10/00 QA 57D QA 58DMCB 15C 10/25/00 QA 81D QA 82DRPC 8DL 10/30/00 QA 61D QA 62DRPC 11DM 12/11/00 QA 63D QA 64DRRP 3 Not sampled QA 83D QA 84DRWM 1 10/05/00 QA 25D Not applicableRWM 7 11/07/00 QA 27D Not applicableRWM 12 12/11/00 QA 29D Not applicableSRW 12C 11/21/00 QA 77D Not applicable

Quality Control SamplesQuality Control SamplesESH-EMS-2000408ESH-EMS-2000408 Page Page 6363 Fourth Quarter 2000Fourth Quarter 2000
WellSampleDate Replicate
AssociatedBlank
TBG 1 12/05/00 QA 71D QA 72DTNX 9D 11/17/00 QA 73D QA 74DXSB 1A 11/16/00 QA 75D QA 76D
Table 19.Table 19. Analytes Not Showing Measurable Concentrations above EstimatedAnalytes Not Showing Measurable Concentrations above EstimatedQuantitation Limits in Any Replicated or Duplicated Samples for GE, WA, EX,Quantitation Limits in Any Replicated or Duplicated Samples for GE, WA, EX,and MLand ML
AnalyteNumber of AnalysesGE WA EX ML
Acetone 1 3 5 6Acetonitrile – 2 4 –Acrolein – 2 4 –Acrylonitrile – 2 4 –Aldrin – 20 – –Allyl chloride – 2 4 –Antimony 22 60 – –Arsenic 24 63 6 –alpha-Benzene hexachloride – 20 – –delta-Benzene hexachloride – 20 – –Boron 14 60 – –Bromochloromethane – – 4 –Bromodichloromethane 19 54 21 9Bromoform 19 54 21 9Bromomethane 19 54 21 9Carbon disulfide 1 3 5 6alpha-Chlordane – 20 – –gamma-Chlordane – 20 – –Chlorobenzene 19 54 21 9Chloroethane 19 54 21 9Chloroethene 19 54 21 9Chloromethane 19 54 21 9Chloroprene – 2 4 –Cyanide 33 57 – –p,p´-DDD – 20 – –p,p´-DDE – 20 – –p,p´-DDT – 20 – –Dibromochloromethane 19 54 21 91,2-Dibromo-3-chloropropane – 2 4 –1,2-Dibromoethane – 2 4 –Dibromomethane 2 4 4 –trans-1,4-Dichloro-2-butene – 2 4 –Dichlorodifluoromethane – 2 4 –1,2-Dichloroethane 19 54 21 92,4-Dichlorophenoxyacetic acid – 17 – –1,2-Dichloropropane 19 54 21 91,3-Dichloropropane – – 4 –2,2-Dichloropropane – – 4 –1,1-Dichloropropene – – 4 –cis-1,3-Dichloropropene 19 54 21 9trans-1,3-Dichloropropene 19 54 21 9Dieldrin – 20 – –Endosulfan sulfate – 20 – –Endosulfan I – 20 – –Endosulfan II – 20 – –Endrin – 20 – –Endrin aldehyde – 20 – –

Quality Control SamplesQuality Control SamplesESH-EMS-2000408ESH-EMS-2000408 Page Page 6464 Fourth Quarter 2000Fourth Quarter 2000
AnalyteNumber of AnalysesGE WA EX ML
Ethylbenzene 19 54 21 9Fluoride 7 – – –Heptachlor – 20 – –Hexachlorodibenzo-p-dioxins – 14 – –Hexachlorodibenzo-p-furans – 14 – –2-Hexanone 1 3 5 6Iodomethane – 2 4 –Isobutyl alcohol – 2 4 –Isodrin – 20 – –Kepone – 20 – –Lindane – 20 – –Methacrylonitrile – 2 4 –Methoxychlor – 20 – –Methyl ethyl ketone 1 3 5 6Methyl isobutyl ketone 1 3 5 6PCB 1016 6 20 – –PCB 1221 6 20 – –PCB 1232 6 20 – –PCB 1248 6 20 – –PCB 1254 6 20 – –PCB 1260 6 20 – –Pentachlorodibenzo-p-dioxins – 14 – –Pentachlorodibenzo-p-furans – 14 – –Phenols 17 51 – –Propionitrile – 2 4 –Selenium 24 63 6 –Silver 24 63 6 –Styrene 1 3 5 6Sulfide – 12 – –2,4,5-T – 17 – –2,3,7,8-TCDD – 14 – –Tetrachlorodibenzo-p-dioxins – 14 – –Tetrachlorodibenzo-p-furans – 14 – –1,1,1,2-Tetrachloroethane – 2 4 –1,1,2,2-Tetrachloroethane 19 54 21 9Tin 14 60 – –Toxaphene – 20 – –2,4,5-TP (Silvex) – 17 – –1,1,1-Trichloroethane 19 56 24 101,1,2-Trichloroethane 19 54 21 91,2,3-Trichloropropane – 2 4 –Vanadium 10 6 – –Vinyl acetate – 2 5 6Xylenes 13 49 5 6
– No replicate or duplicate analyses were performed.
Table 20.Table 20. Analytes Not Showing Measurable Concentrations above EstimatedAnalytes Not Showing Measurable Concentrations above EstimatedQuantitation Limits in Any Replicated or Duplicated Samples for GP and TMQuantitation Limits in Any Replicated or Duplicated Samples for GP and TM
AnalyteNumber of AnalysesGP TM
Antimony-124 – 2Antimony-125 33 4Barium-133 – 2Bismuth-212 22 2Cerium-144 13 2

Quality Control SamplesQuality Control SamplesESH-EMS-2000408ESH-EMS-2000408 Page Page 6565 Fourth Quarter 2000Fourth Quarter 2000
AnalyteNumber of AnalysesGP TM
Cesium-134 33 4Cobalt-57 9 2Cobalt-58 – 2Cobalt-60 33 4Curium-242 24 –Europium-152 33 4Manganese-54 9 2Neptunium-237 12 –Plutonium-239/240 23 –Plutonium-244 4 –Promethium-144 9 2Promethium-146 33 4Ruthenium-106 9 2Sodium-22 9 2Thorium-228 33 –Thorium-232 33 –Tin-113 – 2Yttrium-88 9 2Zinc-65 9 2Zirconium-95 – 2
– No replicate or duplicate analyses were performed.
Table 21.Table 21. Intralaboratory MRD Indices for EXIntralaboratory MRD Indices for EX
Analyte RDL
In-house DuplicatesNumber ofDup. Pairs MRD MRDadj
Blind ReplicatesNumber ofDup. Pairs MRD MRDadj
Aluminum 200 µg/L 0 - - 3 0.00 0.00Barium 10 µg/L 0 - - 3 0.87 0.50Benzene 500 µg/L 0 - - 8 0.00 0.00Cadmium 10 µg/L 0 - - 3 0.00 0.00Carbon tetrachloride 500 µg/L 0 - - 8 0.00 0.002-Chloroethyl vinyl ether 2,500 µg/L 0 - - 7 0.00 0.00Chloroform 500 µg/L 0 - - 8 0.00 0.00Chromium 10 µg/L 0 - - 3 0.00 0.001,2-Dichlorobenzene 5 µg/L 0 - - 2 0.00 0.001,3-Dichlorobenzene 5 µg/L 0 - - 2 0.00 0.001,4-Dichlorobenzene 5 µg/L 0 - - 2 0.00 0.001,1-Dichloroethane 500 µg/L 0 - - 8 0.00 0.001,1-Dichloroethylene 500 µg/L 0 - - 8 0.00 0.00cis-1,2-Dichloroethylene 2,500 µg/L 0 - - 9 0.00 0.00trans-1,2-Dichloroethylene 500 µg/L 0 - - 8 0.00 0.00Dichloromethane 1,000 µg/L 0 - - 8 0.00 0.001,4-Dioxane 500 µg/L 0 - - 2 0.00 0.00Ethyl methacrylate 5 µg/L 0 - - 2 0.00 0.00Iron 200 µg/L 0 - - 1 0.00 0.00Lead 10 µg/L 0 - - 6 9.44 3.95Mercury 0.5 µg/L 0 - - 4 0.00 0.00Methyl methacrylate 20 µg/L 0 - - 2 0.00 0.00Nitrate-nitrite as nitrogen 1,000 µg/L 4 0.87 0.71 2 4.49 4.49Pentachloroethane 200 µg/L 0 - - 2 0.00 0.00Tetrachloroethylene 100 µg/L 0 - - 8 1.69 1.69Toluene 500 µg/L 0 - - 8 0.00 0.00

Quality Control SamplesQuality Control SamplesESH-EMS-2000408ESH-EMS-2000408 Page Page 6666 Fourth Quarter 2000Fourth Quarter 2000
Analyte RDL
In-house DuplicatesNumber ofDup. Pairs MRD MRDadj
Blind ReplicatesNumber ofDup. Pairs MRD MRDadj
Trichloroethylene 5 µg/L 0 - - 9 7.91 4.80Trichlorofluoromethane 2,500 µg/L 0 - - 9 0.00 0.00
- No replicate or duplicate analyses could be calculated.
Note: An MRD of 0.00 indicates no difference between any of the pairs of results used in calculating the MRD.
Table 22.Table 22. Intralaboratory MRD Indices for GEIntralaboratory MRD Indices for GE
Analyte RDL
In-house DuplicatesNumber ofDup. Pairs MRD MRDadj
Blind ReplicatesNumber ofDup. Pairs MRD MRDadj
Alkalinity (as CaCO3) 18,600 µg/L 1 0.00 0.00 0 - -Aluminum 50.0 µg/L 0 - - 5 30.17 30.17Barium 6.43 µg/L 0 - - 0 - -Benzene 1.0 µg/L 0 - - 0 - -Beryllium 5.0 µg/L 0 - - 12 0.00 0.00Cadmium 5.0 µg/L 0 - - 5 0.00 0.00Calcium † 0 - - 0 - -Carbon tetrachloride 1.0 µg/L 0 - - 0 - -Chloride † 1 4.78 4.78 0 - -2-Chloroethyl vinyl ether 5.0 µg/L 0 - - 0 - -Chloroform 1.0 µg/L 0 - - 0 - -Chromium 5.0 µg/L 0 - - 0 - -Cobalt 5.0 µg/L 0 - - 0 - -Copper 5.0 µg/L 0 - - 0 - -1,1-Dichloroethane 1.0 µg/L 0 - - 0 - -1,1-Dichloroethylene 1.0 µg/L 0 - - 0 - -1,2-Dichloroethylene 2.0 µg/L 0 - - 0 - -trans-1,2-Dichloroethylene 1.0 µg/L 0 - - 0 - -Dichloromethane 5.0 µg/L 0 - - 0 - -Iron 50.0 µg/L 0 - - 0 - -Lead 5.0 µg/L 0 - - 5 0.00 0.00Lithium 10.0 µg/L 0 - - 0 - -Magnesium † 0 - - 0 - -Manganese 10.0 µg/L 0 - - 0 - -Mercury 0.2 µg/L 0 - - 7 1.10 0.58Nickel 5.0 µg/L 0 - - 0 - -Nitrate-nitrite as nitrogen 50.0 µg/L 27 2.56 2.56 10 22.87 22.30PCB 1242 0.1 µg/L 0 - - 0 - -pH † 31 0.91 0.91 12 4.52 4.52Potassium † 0 - - 0 - -Sodium † 0 - - 0 - -Specific conductance † 25 1.40 1.40 12 26.10 26.10Sulfate 705 µg/L 3 4.50 1.89 0 - -Tetrachloroethylene 1.0 µg/L 0 - - 0 - -Thallium 10.0 µg/L 0 - - 7 0.00 0.00Toluene 1.0 µg/L 0 - - 0 - -Total dissolved solids 44,000 µg/L 5 0.32 0.27 0 - -Total organic carbon 432 µg/L 5 0.73 0.22 0 - -Total organic halogens 10.0 µg/L 5 3.29 3.29 0 - -

Quality Control SamplesQuality Control SamplesESH-EMS-2000408ESH-EMS-2000408 Page Page 6767 Fourth Quarter 2000Fourth Quarter 2000
Analyte RDL
In-house DuplicatesNumber ofDup. Pairs MRD MRDadj
Blind ReplicatesNumber ofDup. Pairs MRD MRDadj
Total phosphates (as P) 50.0 µg/L 1 16.67 6.00 0 - -Trichloroethylene 1.0 µg/L 0 - - 0 - -Trichlorofluoromethane 1.0 µg/L 0 - - 0 - -Uranium 50.0 µg/L 0 - - 1 0.00 0.00Zinc 5.0 µg/L 0 - - 0 - -
† No detection limit, or no replicate or duplicate results below detection limit.- No replicate or duplicate analyses could be calculated.
Note: An MRD of 0.00 indicates no difference between any of the pairs of results used in calculating the MRD. MRD resultsgreater than or equal to 20 appear in bold.
Table 23.Table 23. Intralaboratory MRD Matrix Spike Indices forIntralaboratory MRD Matrix Spike Indices for GE GE
Analyte RDL
In-house DuplicatesNumber ofDup. Pairs MRD MRDadj
Benzene † 12 2.20 2.20Chlorobenzene † 12 3.60 3.601,1-Dichloroethylene † 12 3.84 3.84PCB 1260 † 2 1.65 1.65Toluene † 14 4.34 4.34Trichloroethylene † 12 3.17 3.17
† No detection limit, or no replicate or duplicate results below detection limit.Note: An MRD of 0.00 indicates no difference between any of the pairs of results used in calculating the MRD.
Table 24.Table 24. Intralaboratory MRD Indices for WAIntralaboratory MRD Indices for WA
Analyte RDL
In-house DuplicatesNumber ofDup. Pairs MRD MRDadj
Blind ReplicatesNumber ofDup. Pairs MRD MRDadj
Acenaphthene 23.2 µg/L 10 0.00 0.00 0 - -Acenaphthylene 23.2 µg/L 10 0.00 0.00 0 - -Acetophenone 23.2 µg/L 10 0.00 0.00 0 - -2-Acetylaminofluorene 23.2 µg/L 10 0.00 0.00 0 - -Alkalinity (as CaCO3) 13,400 µg/L 15 3.27 2.94 12 26.61 23.70Aluminum 146 µg/L 4 10.58 4.42 0 - -4-Aminobiphenyl 23.2 µg/L 10 0.00 0.00 0 - -Aniline 23.2 µg/L 10 0.00 0.00 0 - -Anthracene 23.2 µg/L 10 0.00 0.00 0 - -Aramite 46.4 µg/L 10 0.00 0.00 0 - -Barium 3.2 µg/L 17 10.69 9.86 12 5.05 4.31Benzene 5.0 µg/L 11 0.11 0.04 11 0.00 0.00beta-Benzene hexachloride 0.108 µg/L 10 0.00 0.00 0 - -Benzo[a]anthracene 23.2 µg/L 10 0.00 0.00 0 - -Benzo[b]fluoranthene 23.2 µg/L 10 0.00 0.00 0 - -Benzo[k]fluoranthene 23.2 µg/L 10 0.00 0.00 0 - -Benzoic acid 58.0 µg/L 10 0.00 0.00 0 - -

Quality Control SamplesQuality Control SamplesESH-EMS-2000408ESH-EMS-2000408 Page Page 6868 Fourth Quarter 2000Fourth Quarter 2000
Analyte RDL
In-house DuplicatesNumber ofDup. Pairs MRD MRDadj
Blind ReplicatesNumber ofDup. Pairs MRD MRDadj
Benzo[g,h,i]perylene 23.2 µg/L 10 0.00 0.00 0 - -Benzo[a]pyrene 23.2 µg/L 10 0.00 0.00 0 - -Benzyl alcohol 23.2 µg/L 10 0.00 0.00 0 - -Beryllium 1.6 µg/L 4 0.00 0.00 0 - -Bis(2-chloroethoxy) methane 23.2 µg/L 10 0.00 0.00 0 - -Bis(2-chloroethyl) ether 23.2 µg/L 10 0.00 0.00 0 - -Bis(2-chloroisopropyl) ether 23.2 µg/L 10 0.00 0.00 0 - -Bis(2-ethylhexyl) phthalate 36.9 µg/L 10 0.00 0.00 0 - -4-Bromophenyl phenyl ether 23.2 µg/L 10 0.00 0.00 0 - -Butylbenzyl phthalate 23.2 µg/L 10 0.00 0.00 0 - -2-sec-Butyl-4,6-dinitrophenol 116 µg/L 10 0.00 0.00 0 - -Cadmium 4.7 µg/L 17 0.00 0.00 12 0.00 0.00Carbon tetrachloride 5.0 µg/L 12 0.00 0.00 11 0.00 0.004-Chloroaniline 23.2 µg/L 10 0.00 0.00 0 - -Chlorobenzilate 23.2 µg/L 10 0.00 0.00 0 - -4-Chloro-m-cresol 23.2 µg/L 10 0.00 0.00 0 - -2-Chloroethyl vinyl ether † 12 0.00 0.00 10 0.00 0.00Chloroform 5.0 µg/L 13 1.86 1.78 12 1.81 1.812-Chloronaphthalene 23.2 µg/L 10 0.00 0.00 0 - -2-Chlorophenol 23.2 µg/L 10 0.00 0.00 0 - -4-Chlorophenyl phenyl ether 23.2 µg/L 10 0.00 0.00 0 - -Chromium 7.0 µg/L 17 0.03 0.03 12 0.00 0.00Chrysene 23.2 µg/L 10 0.00 0.00 0 - -Cobalt 4.5 µg/L 3 0.00 0.00 0 - -Copper 15.0 µg/L 17 0.58 0.37 12 1.57 0.52m-Cresol 10.4 µg/L 3 0.00 0.00 0 - -m/p-Cresol 23.2 µg/L 7 0.00 0.00 0 - -o-Cresol 23.2 µg/L 10 0.00 0.00 0 - -p-Cresol 10.4 µg/L 3 0.00 0.00 0 - -Diallate 23.2 µg/L 10 0.00 0.00 0 - -Dibenz[a,h]anthracene 23.2 µg/L 10 0.00 0.00 0 - -Dibenzofuran 23.2 µg/L 10 0.00 0.00 0 - -Di-n-butyl phthalate 23.2 µg/L 10 0.00 0.00 0 - -1,2-Dichlorobenzene 23.2 µg/L 10 0.00 0.00 0 - -1,3-Dichlorobenzene 23.2 µg/L 10 0.00 0.00 0 - -1,4-Dichlorobenzene 23.2 µg/L 10 0.00 0.00 0 - -3,3´-Dichlorobenzidine 23.2 µg/L 10 0.00 0.00 0 - -1,1-Dichloroethane 5.0 µg/L 12 2.71 2.32 12 1.66 1.551,1-Dichloroethylene 5.0 µg/L 11 0.00 0.00 12 0.15 0.101,2-Dichloroethylene 5.0 µg/L 0 - - 0 - -cis-1,2-Dichloroethylene 5.0 µg/L 3 5.77 5.77 0 - -trans-1,2-Dichloroethylene 5.0 µg/L 11 0.00 0.00 12 11.81 11.81Dichloromethane 16.9 µg/L 11 0.00 0.00 11 0.00 0.002,4-Dichlorophenol 23.2 µg/L 10 0.00 0.00 0 - -2,6-Dichlorophenol 23.2 µg/L 10 0.00 0.00 0 - -Diethyl phthalate 23.2 µg/L 10 0.00 0.00 0 - -Dimethoate 1.09 µg/L 7 0.00 0.00 0 - -2,4-Dimethyl phenol 23.2 µg/L 10 0.00 0.00 0 - -Dimethyl phthalate 23.2 µg/L 10 0.00 0.00 0 - -p-Dimethylaminoazobenzene 23.2 µg/L 10 0.00 0.00 0 - -7,12-Dimethylbenz[a]anthracene 23.2 µg/L 10 0.00 0.00 0 - -3,3´-Dimethylbenzidine 23.2 µg/L 10 0.00 0.00 0 - -a,a-Dimethylphenethylamine 23.2 µg/L 10 0.00 0.00 0 - -1,3-Dinitrobenzene 23.2 µg/L 10 0.00 0.00 0 - -2,4-Dinitrophenol 58.0 µg/L 10 0.00 0.00 0 - -

Quality Control SamplesQuality Control SamplesESH-EMS-2000408ESH-EMS-2000408 Page Page 6969 Fourth Quarter 2000Fourth Quarter 2000
Analyte RDL
In-house DuplicatesNumber ofDup. Pairs MRD MRDadj
Blind ReplicatesNumber ofDup. Pairs MRD MRDadj
2,4-Dinitrotoluene 23.2 µg/L 10 0.00 0.00 0 - -2,6-Dinitrotoluene 23.2 µg/L 10 0.00 0.00 0 - -Di-n-octyl phthalate 23.2 µg/L 10 0.00 0.00 0 - -1,4-Dioxane 22.2 µg/L 10 4.08 4.08 0 - -Diphenylamine 23.2 µg/L 10 0.00 0.00 0 - -Disulfoton 1.09 µg/L 7 0.00 0.00 0 - -Ethyl methacrylate 23.2 µg/L 10 0.00 0.00 0 - -Ethyl methanesulfonate 23.2 µg/L 10 0.00 0.00 0 - -Famphur 2.61 µg/L 7 0.00 0.00 0 - -Fluoranthene 23.2 µg/L 10 0.00 0.00 0 - -Fluorene 23.2 µg/L 10 0.00 0.00 0 - -Heptachlor epoxide 0.108 µg/L 10 4.68 1.83 0 - -Hexachlorobenzene 23.2 µg/L 10 0.00 0.00 0 - -Hexachlorobutadiene 23.2 µg/L 10 0.00 0.00 0 - -Hexachlorocyclopentadiene 23.2 µg/L 10 0.00 0.00 0 - -Hexachloroethane 23.2 µg/L 10 0.00 0.00 0 - -Hexachlorophene 580 µg/L 10 0.00 0.00 0 - -Hexachloropropene 23.2 µg/L 10 0.00 0.00 0 - -Indeno[1,2,3-c,d]pyrene 23.2 µg/L 10 0.00 0.00 0 - -Iron 74.0 µg/L 4 3.45 2.26 0 - -Isophorone 23.2 µg/L 10 0.00 0.00 0 - -Isosafrole 23.2 µg/L 10 0.00 0.00 0 - -Lead 47.0 µg/L 17 0.00 0.00 11 0.00 0.00Lithium 2.7 µg/L 17 0.94 0.53 11 4.41 3.77Mercury 0.7 µg/L 17 0.12 0.12 12 0.69 0.39Methapyrilene 23.2 µg/L 10 0.00 0.00 0 - -2-Methyl-4,6-dinitrophenol 58.0 µg/L 10 0.00 0.00 0 - -Methyl methacrylate 23.2 µg/L 10 0.00 0.00 0 - -Methyl methanesulfonate 23.2 µg/L 10 0.00 0.00 0 - -3-Methylcholanthrene 23.2 µg/L 10 0.00 0.00 0 - -2-Methylnaphthalene 23.2 µg/L 10 0.00 0.00 0 - -Naphthalene 23.2 µg/L 10 0.00 0.00 0 - -1,4-Naphthoquinone 23.2 µg/L 10 0.00 0.00 0 - -1-Naphthylamine 23.2 µg/L 10 0.00 0.00 0 - -2-Naphthylamine 23.2 µg/L 10 0.00 0.00 0 - -Nickel 26.0 µg/L 17 0.00 0.00 12 0.00 0.00Nitrate-nitrite as nitrogen 30.0 µg/L 15 1.56 1.39 12 10.67 8.39m-Nitroaniline 58.0 µg/L 10 0.00 0.00 0 - -o-Nitroaniline 58.0 µg/L 10 0.00 0.00 0 - -p-Nitroaniline 58.0 µg/L 10 0.00 0.00 0 - -Nitrobenzene 23.2 µg/L 10 0.00 0.00 0 - -2-Nitrophenol 23.2 µg/L 10 0.00 0.00 0 - -4-Nitrophenol 58.0 µg/L 10 0.00 0.00 0 - -4-Nitroquinoline-1-oxide 46.4 µg/L 10 0.00 0.00 0 - -N-Nitrosodi-n-butylamine 23.2 µg/L 10 0.00 0.00 0 - -N-Nitrosodiethylamine 23.2 µg/L 10 0.00 0.00 0 - -N-Nitrosodimethylamine 23.2 µg/L 10 0.00 0.00 0 - -N-Nitrosodiphenylamine 23.2 µg/L 10 0.00 0.00 0 - -N-Nitrosodipropylamine 23.2 µg/L 10 0.00 0.00 0 - -N-Nitrosomethylethylamine 23.2 µg/L 10 0.00 0.00 0 - -N-Nitrosomorpholine 23.2 µg/L 10 0.00 0.00 0 - -N-Nitrosopiperidine 116 µg/L 10 0.00 0.00 0 - -N-Nitrosopyrrolidine 23.2 µg/L 10 0.00 0.00 0 - -5-Nitro-o-toluidine 23.2 µg/L 10 0.00 0.00 0 - -Parathion 1.09 µg/L 7 0.00 0.00 0 - -

Quality Control SamplesQuality Control SamplesESH-EMS-2000408ESH-EMS-2000408 Page Page 7070 Fourth Quarter 2000Fourth Quarter 2000
Analyte RDL
In-house DuplicatesNumber ofDup. Pairs MRD MRDadj
Blind ReplicatesNumber ofDup. Pairs MRD MRDadj
Parathion methyl 1.09 µg/L 7 0.00 0.00 0 - -PCB 1242 1.06 µg/L 8 0.00 0.00 0 - -Pentachlorobenzene 23.2 µg/L 10 0.00 0.00 0 - -Pentachloroethane 23.2 µg/L 10 0.00 0.00 0 - -Pentachloronitrobenzene 116 µg/L 10 0.00 0.00 0 - -Pentachlorophenol 58.0 µg/L 10 0.00 0.00 0 - -pH † 3 2.10 2.10 0 - -Phenacetin 23.2 µg/L 10 0.00 0.00 0 - -Phenanthrene 23.2 µg/L 10 0.00 0.00 0 - -Phenol 23.2 µg/L 10 0.00 0.00 0 - -p-Phenylenediamine 23.2 µg/L 10 0.00 0.00 0 - -Phorate 1.09 µg/L 7 0.00 0.00 0 - -2-Picoline 23.2 µg/L 10 0.00 0.00 0 - -Pronamid 23.2 µg/L 10 0.00 0.00 0 - -Pyrene 23.2 µg/L 10 0.00 0.00 0 - -Pyridine 23.2 µg/L 10 0.00 0.00 0 - -Safrole 23.2 µg/L 10 0.00 0.00 0 - -Specific conductance † 4 0.87 0.87 0 - -Sulfate 704 µg/L 13 1.48 0.60 11 0.31 0.25Sulfotepp 1.09 µg/L 7 0.00 0.00 0 - -1,2,4,5-Tetrachlorobenzene 23.2 µg/L 10 0.00 0.00 0 - -Tetrachloroethylene 5.0 µg/L 12 0.85 0.52 11 0.83 0.302,3,4,6-Tetrachlorophenol 23.2 µg/L 10 0.00 0.00 0 - -Thallium 55.0 µg/L 4 0.00 0.00 0 - -Thionazin 1.09 µg/L 7 0.00 0.00 0 - -Toluene 5.0 µg/L 11 0.00 0.00 11 0.00 0.00o-Toluidine 23.2 µg/L 10 0.00 0.00 0 - -Total dissolved solids 50,000 µg/L 14 8.26 4.97 10 36.05 30.71Total organic carbon 1,000 µg/L 16 0.30 0.09 12 0.00 0.00Total organic halogens 133 µg/L 13 2.58 0.90 11 0.10 0.041,2,4-Trichlorobenzene 23.2 µg/L 10 0.00 0.00 0 - -Trichloroethylene 5.0 µg/L 16 1.91 1.89 12 2.29 2.29Trichlorofluoromethane 5.0 µg/L 11 0.00 0.00 11 0.00 0.002,4,5-Trichlorophenol 58.0 µg/L 10 0.00 0.00 0 - -2,4,6-Trichlorophenol 23.2 µg/L 10 0.00 0.00 0 - -O,O,O-Triethyl phosphorothioate 1.09 µg/L 7 0.00 0.00 0 - -1,3,5-Trinitrobenzene 23.2 µg/L 10 0.00 0.00 0 - -Uranium † 1 2.82 2.82 0 - -Zinc 53.0 µg/L 17 0.10 0.07 12 0.00 0.00
† No detection limit, or no replicate or duplicate results below detection limit.- No replicate or duplicate analyses could be calculated.
Note: An MRD of 0.00 indicates no difference between any of the pairs of results used in calculating the MRD. MRD resultsgreater than or equal to 20 appear in bold.
Table 25.Table 25. Intralaboratory MRD Indices for GPIntralaboratory MRD Indices for GP
Analyte RDL
In-house DuplicatesNumber ofDup. Pairs MRD MRDadj
Blind ReplicatesNumber ofDup. Pairs MRD MRDadj
Actinium-228 1.41E-08 µCi/mL 12 0.00 0.00 2 0.00 0.00Americium-241 6.64E-10 µCi/mL 9 8.71 8.71 1 0.00 0.00

Quality Control SamplesQuality Control SamplesESH-EMS-2000408ESH-EMS-2000408 Page Page 7171 Fourth Quarter 2000Fourth Quarter 2000
Analyte RDL
In-house DuplicatesNumber ofDup. Pairs MRD MRDadj
Blind ReplicatesNumber ofDup. Pairs MRD MRDadj
Bismuth-214 6.76E-09 µCi/mL 8 6.20 5.15 2 40.74 40.74Carbon-14 4.65E-08 µCi/mL 15 1.30 0.78 10 2.41 1.55Cesium-137 3.59E-09 µCi/mL 13 0.00 0.00 2 0.00 0.00Curium-243/244 1.8E-09 µCi/mL 9 0.73 0.73 1 0.00 0.00Curium-245/246 9.03E-10 µCi/mL 10 4.37 2.49 1 0.00 0.00Europium-154 9.06E-09 µCi/mL 11 3.25 1.19 2 0.00 0.00Europium-155 1.14E-08 µCi/mL 11 0.00 0.00 2 0.00 0.00Gross alpha 3.09E-09 µCi/mL 21 7.76 6.18 13 15.30 10.22Iodine-129 2.0E-09 µCi/mL 9 11.37 9.62 1 0.00 0.00Lead-212 7.19E-09 µCi/mL 13 3.48 1.35 2 0.00 0.00Nickel-63 1.66E-07 µCi/mL 9 0.00 0.00 0 - -Nonvolatile beta 6.28E-09 µCi/mL 19 4.25 3.23 12 13.44 12.46Plutonium-238 2.62E-09 µCi/mL 8 0.00 0.00 1 0.00 0.00Potassium-40 4.0E-08 µCi/mL 11 0.00 0.00 2 0.00 0.00Radium, total alpha-
emitting1.69E-09 µCi/mL 6 6.04 3.09 0 - -
Radium-226 7.4E-10 µCi/mL 23 13.80 12.93 10 41.19 34.39Radium-228 1.64E-09 µCi/mL 27 1.40 0.47 11 0.00 0.00Radon-222 † 2 8.98 8.98 1 4.58 4.58Strontium-89/90 3.04E-09 µCi/mL 5 17.30 17.08 0 - -Strontium-90 1.15E-09 µCi/mL 29 1.76 0.71 8 17.94 17.94Technetium-99 2.31E-08 µCi/mL 10 6.77 3.22 1 0.00 0.00Thallium-208 3.4E-09 µCi/mL 7 1.09 0.34 2 0.00 0.00Thorium-230 8.39E-10 µCi/mL 11 1.41 0.46 2 0.00 0.00Tritium 7.76E-07 µCi/mL 21 2.59 2.59 12 16.10 13.47Uranium-233/234 1.15E-09 µCi/mL 12 1.63 1.63 2 0.00 0.00Uranium-235 1.42E-09 µCi/mL 10 4.61 2.85 2 0.00 0.00Uranium-238 1.09E-09 µCi/mL 11 3.02 3.02 2 0.00 0.00
† No detection limit, or no replicate or duplicate results below detection limit.- No replicate or duplicate analyses could be calculated.
Note: An MRD of 0.00 indicates no difference between any of the pairs of results used in calculating the MRD. MRD resultsgreater than or equal to 20 appear in bold.
Table 26.Table 26. Intralaboratory MRD Indices for MLIntralaboratory MRD Indices for ML
Analyte RDL
In-house DuplicatesNumber ofDup. Pairs MRD MRDadj
Blind ReplicatesNumber ofDup. Pairs MRD MRDadj
Actinium-228 1.29E-07 µCi/mL 1 0.00 0.00 0 - -Benzene 200 µg/L 0 - - 3 0.00 0.00Carbon tetrachloride 200 µg/L 0 - - 3 0.00 0.00Chloroform 200 µg/L 0 - - 3 0.00 0.001,1-Dichloroethane 200 µg/L 0 - - 3 0.00 0.001,1-Dichloroethylene 200 µg/L 0 - - 3 0.00 0.001,2-Dichloroethylene † 0 - - 2 5.56 5.56cis-1,2-Dichloroethylene 100 µg/L 0 - - 1 0.00 0.00trans-1,2-Dichloroethylene 100 µg/L 0 - - 1 0.00 0.00Dichloromethane 2,000 µg/L 0 - - 3 0.00 0.00Gross alpha 9.14E-09 µCi/mL 3 1.83 0.66 3 0.00 0.00Lead-212 4.14E-08 µCi/mL 1 0.00 0.00 0 - -Nonvolatile beta 6.6E-09 µCi/mL 2 0.00 0.00 2 11.17 3.77

Quality Control SamplesQuality Control SamplesESH-EMS-2000408ESH-EMS-2000408 Page Page 7272 Fourth Quarter 2000Fourth Quarter 2000
Analyte RDL
In-house DuplicatesNumber ofDup. Pairs MRD MRDadj
Blind ReplicatesNumber ofDup. Pairs MRD MRDadj
Tetrachloroethylene 200 µg/L 0 - - 3 0.00 0.00Toluene 200 µg/L 0 - - 3 0.00 0.00Trichloroethylene 1.0 µg/L 0 - - 3 2.53 2.53Tritium † 5 13.62 13.62 3 24.43 24.43
† No detection limit, or no replicate or duplicate results below detection limit.- No replicate or duplicate analyses could be calculated.
Note: An MRD of 0.00 indicates no difference between any of the pairs of results used in calculating the MRD. MRD resultsgreater than or equal to 20 appear in bold.
Table 27.Table 27. Intralaboratory MRD Indices for TMIntralaboratory MRD Indices for TM
Analyte RDL
In-house DuplicatesNumber ofDup. Pairs MRD MRDadj
Blind ReplicatesNumber ofDup. Pairs MRD MRDadj
Actinium-228 4.842E-08 µCi/mL 2 0.00 0.00 0 - -Bismuth-214 2.97E-08 µCi/mL 2 19.22 9.56 0 - -Cesium-137 1.351E-08 µCi/mL 2 0.00 0.00 0 - -Europium-154 3.404E-08 µCi/mL 2 0.00 0.00 0 - -Europium-155 2.241E-08 µCi/mL 2 0.00 0.00 0 - -Gross alpha 1.6E-09 µCi/mL 74 9.47 5.95 15 9.18 5.75Iodine-129 5.5E-09 µCi/mL 1 0.00 0.00 0 - -Lead-212 2.141E-08 µCi/mL 2 0.00 0.00 0 - -Nonvolatile beta 1.87E-09 µCi/mL 61 11.92 6.73 13 15.57 7.35Potassium-40 1.591E-07 µCi/mL 2 0.00 0.00 0 - -Radium, total alpha-emitting 1.08E-09 µCi/mL 42 26.04 21.85 9 29.82 24.31Radium-228 2.35E-09 µCi/mL 11 3.60 1.35 7 5.66 2.12Radon-222 † 1 38.43 38.43 0 - -Strontium-90 1.75E-09 µCi/mL 18 0.86 0.86 9 0.00 0.00Technetium-99 2.018E-08 µCi/mL 1 0.00 0.00 0 - -Thallium-208 3.945E-08 µCi/mL 1 0.00 0.00 0 - -Tritium 1.45E-06 µCi/mL 78 11.36 10.32 12 23.37 23.31
† No detection limit, or no replicate or duplicate results below detection limit.- No replicate or duplicate analyses could be calculated.
Note: An MRD of 0.00 indicates no difference between any of the pairs of results used in calculating the MRD. MRD resultsgreater than or equal to 20 appear in bold.
Table 28.Table 28. Interlaboratory MRD and t-Interlaboratory MRD and t-testtest Results for Analytes with at Least One Pair of Results for Analytes with at Least One Pair ofResults above the RDL for EM and WAResults above the RDL for EM and WA
Analyte RDL Unit MRDt-testProbability
Aluminum 200 µg/L 0.00 -Barium 10.0 µg/L 0.65 .500Benzene 25.0 µg/L 0.00 -2-Chloroethyl vinyl ether 2,500 µg/L 0.00 -Chloroform 25.0 µg/L 0.00 -1,4-Dichlorobenzene 23.2 µg/L 0.00 -

Quality Control SamplesQuality Control SamplesESH-EMS-2000408ESH-EMS-2000408 Page Page 7373 Fourth Quarter 2000Fourth Quarter 2000
Analyte RDL Unit MRDt-testProbability
1,1-Dichloroethane 25.0 µg/L 0.00 -1,1-Dichloroethylene 25.0 µg/L 0.00 -cis-1,2-Dichloroethylene 2,500 µg/L 0.00 -trans-1,2-Dichloroethylene 25.0 µg/L 0.00 -Dichloromethane 60.3 µg/L 0.00 -Iron 200 µg/L 0.00 -Lead 47.0 µg/L 0.00 -Mercury 0.7 µg/L 0.00 -Nitrate-nitrite as nitrogen 1,000 µg/L 34.94 .893Tetrachloroethylene 10.0 µg/L 0.00 -Trichloroethylene 5.0 µg/L 3.01 .322Trichlorofluoromethane 25.0 µg/L 0.00 -
- Could not calculate because there are no differences between pairs.
Note: Values less than .050 indicate a probability of less than 1 in 20 that the results for that analyte are the same fromboth laboratories. MRD results greater than or equal to 20 appear in bold; results less than or equal to 0.05 appearin bold italic.
Table 29.Table 29. Interlaboratory MRD and t-Interlaboratory MRD and t-testtest Results for Analytes with at Least One Pair of Results for Analytes with at Least One Pair ofResults above the RDL for GE and WAResults above the RDL for GE and WA
Analyte RDL Unit MRDt-testProbability
Alkalinity (as CaCO3) 13,400 µg/L 25.83 .304Aluminum 146 µg/L 10.62 .374Barium 6.43 µg/L 7.71 .179Benzene 5.0 µg/L 0.00 -Beryllium 5.0 µg/L 0.00 -Cadmium 5.0 µg/L 0.00 -Carbon tetrachloride 5.0 µg/L 0.00 -2-Chloroethyl vinyl ether 5.0 µg/L 71.11 .000Chloroform 5.0 µg/L 2.38 .337Chromium 7.0 µg/L 0.00 -Copper 15.0 µg/L 4.28 .5121,1-Dichloroethane 5.0 µg/L 3.72 .2701,1-Dichloroethylene 5.0 µg/L 2.64 .337trans-1,2-Dichloroethylene 5.0 µg/L 9.14 .339Dichloromethane 12.1 µg/L 2.04 .195Lead 47.0 µg/L 0.00 -Lithium 10.0 µg/L 11.95 .153Mercury 0.7 µg/L 0.23 .331Nickel 26.0 µg/L 0.00 -Nitrate-nitrite as nitrogen 50.0 µg/L 38.42 .630Sulfate 704 µg/L 3.53 .123Tetrachloroethylene 5.0 µg/L 4.21 .171Thallium 55.0 µg/L 0.00 -Toluene 5.0 µg/L 0.00 -Total dissolved solids 50,000 µg/L 32.17 .243Total organic carbon 1,000 µg/L 0.00 -Total organic halogens 133 µg/L 2.21 .168Trichloroethylene 5.0 µg/L 5.24 .558Uranium 50.0 µg/L 0.00 -

Quality Control SamplesQuality Control SamplesESH-EMS-2000408ESH-EMS-2000408 Page Page 7474 Fourth Quarter 2000Fourth Quarter 2000
Analyte RDL Unit MRDt-testProbability
Zinc 53.0 µg/L 0.00 -
- Could not calculate because there are no differences between pairs.
Note: Values less than .050 indicate a probability of less than 1 in 20 that the results for that analyte are the same fromboth laboratories. MRD results greater than or equal to 20 appear in bold; results less than or equal to 0.05 appearin bold italic.
Table 30.Table 30. Interlaboratory MRD and t-Interlaboratory MRD and t-testest Results for Analytes with at Least One Pair oft Results for Analytes with at Least One Pair ofResults above the RDL for EX and MLResults above the RDL for EX and ML
Analyte RDL Unit MRDt-testProbability
cis-1,2-Dichloroethylene 500 µg/L 0.00 -Tetrachloroethylene 200 µg/L 9.35 .192Trichloroethylene 5.0 µg/L 25.11 .268
- Could not calculate because there are no differences between pairs.
Note: Values less than .050 indicate a probability of less than 1 in 20 that the results for that analyte are the same fromboth laboratories. MRD results greater than or equal to 20 appear in bold; results less than or equal to 0.05 appearin bold italic.
Table 31.Table 31. Interlaboratory MRD and t-Interlaboratory MRD and t-testtest Results for Analytes with at Least One Pair of Results for Analytes with at Least One Pair ofResults above the RDL for GP and TMResults above the RDL for GP and TM
Analyte RDL Unit MRDt-testProbability
Actinium-228 3.21E-08 µCi/mL 0.00 -Bismuth-214 6.82E-09 µCi/mL 98.05 .701Cesium-137 8.31E-09 µCi/mL 0.00 -Europium-154 2.226E-08 µCi/mL 0.00 -Europium-155 1.26E-08 µCi/mL 45.82 -Gross alpha 1.77E-09 µCi/mL 15.26 .382Iodine-129 4.44E-09 µCi/mL 0.00 -Lead-212 1.263E-08 µCi/mL 0.00 -Nonvolatile beta 3.07E-09 µCi/mL 16.67 .212Potassium-40 1.164E-07 µCi/mL 0.00 -Radium, total alpha-emitting 1.14E-09 µCi/mL 14.38 .640Radium-228 2.11E-09 µCi/mL 1.80 .221Strontium-90 1.56E-09 µCi/mL 5.82 .333Technetium-99 2.31E-08 µCi/mL 0.00 -Tritium 1.41E-06 µCi/mL 20.66 .814
† No detection limit, or no replicate or duplicate results below detection limit.- Could not calculate because there are no differences between pairs.
Note: Values less than .050 indicate a probability of less than 1 in 20 that the results for that analyte are the same fromboth laboratories. MRD results greater than or equal to 20 appear in bold; results less than or equal to 0.05 appearin bold italic.

Quality Control SamplesQuality Control SamplesESH-EMS-2000408ESH-EMS-2000408 Page Page 7575 Fourth Quarter 2000Fourth Quarter 2000
Table 32.Table 32. GE SamplGE Samples and Blind Replicates Yielding Results Where One Is More Thanes and Blind Replicates Yielding Results Where One Is More ThanTwiceTwice Another Another
Analyte Wells
Aluminum FSB120CNitrate-nitrite as nitrogen FSB 79ASpecific conductance FSB 79A
Table 33.Table 33. WA Samples and Blind Replicates Yielding Results Where One Is More ThanWA Samples and Blind Replicates Yielding Results Where One Is More ThanTwice AnotherTwice Another
Analyte Wells
Alkalinity (as CaCO3) BGO 27C, BGO 43Dtrans-1,2-Dichloroethylene BGO 37CTotal dissolved solids BGO 10AA, BGO 16AR, BGO 27C
Table 34.Table 34. WA Samples and Laboratory Duplicates Yielding Results Where One Is MoreWA Samples and Laboratory Duplicates Yielding Results Where One Is MoreThan TwiceThan Twice Another Another
Analyte Wells
Barium BGO 37D
Table 35.Table 35. GP Samples and Blind Replicates Yielding Results Where One Is More ThanGP Samples and Blind Replicates Yielding Results Where One Is More ThanTwice AnotherTwice Another
Analyte Wells
Bismuth-214 BRD 5DGross alpha FSB120CNonvolatile beta FSB120CRadium-226 BGO 11DR, TBG 1Strontium-90 BGO 48CTritium FSB120C
Table 36.Table 36. GP Samples and Laboratory Duplicates Yielding Results Where One Is MoreGP Samples and Laboratory Duplicates Yielding Results Where One Is MoreThan TwiceThan Twice Another Another
Analyte Wells
Americium-241 FIN 2TKRadium-226 FIN 2TK, HIN600TK

Quality Control SamplesQuality Control SamplesESH-EMS-2000408ESH-EMS-2000408 Page Page 7676 Fourth Quarter 2000Fourth Quarter 2000
Table 37.Table 37. TM Samples and Blind Replicates Yielding Results Where One Is More ThanTM Samples and Blind Replicates Yielding Results Where One Is More ThanTwice AnotherTwice Another
Analyte Wells
Radium, total alpha-emitting BGO 46BTritium BGO 11DR
Table 38.Table 38. TM Samples and Laboratory Duplicates Yielding Results Where One Is MoreTM Samples and Laboratory Duplicates Yielding Results Where One Is MoreThan Twice AnotherThan Twice Another
Analyte Wells
Radium, total alpha-emitting BGO 14DR, BGO 19DR, BGO 34D, BGO 41A, BSE 1C1, BSW 3D2,BSW 7D2
Tritium LAW 2C
Table 39.Table 39. Analytes with One Laboratory’s Result Greater Than Twice the ReAnalytes with One Laboratory’s Result Greater Than Twice the Result from thesult from theOther Laboratory between GE and WAOther Laboratory between GE and WA
Analyte Wells
Alkalinity (as CaCO3) BGO 27C2-Chloroethyl vinyl ether BGO 10AA, BGO 11DR, BGO 12CX, BGO 16AR, BGO 18A, BGO 27C,
BGO 37C, BGO 43D, BGO 46B, BGO 48C, BGO 49C, BGX 12Ctrans-1,2-Dichloroethylene BGO 37CLithium BGO 18ANitrate-nitrite as nitrogen BGO 11DR, BGO 16AR, BGX 12C, FSB 79A, HSB102C, HSB122ATotal dissolved solids BGO 27C
Table 40.Table 40. Analytes withAnalytes with One Laboratory’s Result Greater Than Twice the Result from the One Laboratory’s Result Greater Than Twice the Result from theOther Laboratory between GP and TMOther Laboratory between GP and TM
Analyte Wells
Bismuth-214 TBG 1Gross alpha RPC 8DLNonvolatile beta FSB120C, RPC 8DLRadium, total alpha-emitting BGO 12CXRadon-222 TBG 1Specific conductance FSB 79AStrontium-90 BGO 48CTritium RPC 11DM

Quality Control SamplesQuality Control SamplesESH-EMS-2000408ESH-EMS-2000408 Page Page 7777 Fourth Quarter 2000Fourth Quarter 2000
Table 41.Table 41. Quality Control Standards for Selected Analyses for EXQuality Control Standards for Selected Analyses for EX
AnalyteCertifiedValue
PerformanceAcceptance Limits
EXResult
FunctionalGuideline Code
Acids (Lot 596)
o-Cresol (2-Methylphenol) (µg/L) 111 35.3–128 72.0p-Cresol (4-Methylphenol) (µg/L) 39.5 12.1–45.7 27.0Pentachlorophenol (µg/L) 134 41.7–168 120Phenol (µg/L) 30.6 6.06–37.9 24.02,4,6-Trichlorophenol (µg/L) 124 53.5–142 96.0
Base/Neutrals (Lot 596)
Anthracene (µg/L) 139 65.5–162 120Benzo[k]fluoranthene (µg/L) 57.6 21.0–72.5 54.0Bis(2-ethylhexyl) phthalate (µg/L) 113 45.6–144 1002-Chloronaphthalene (µg/L) 70.2 27.2–81.6 60.0Chrysene (µg/L) 25.0 11.6–30.7 23.0Dibenz(a,h)anthracene 30.1 10.8–38.9 29.0Dibenzofuran (µg/L) 102 48.5–113 88.01,2-Dichlorobenzene (µg/L) 153 35.8–175 1101,4-Dichlorobenzene (µg/L) 32.3 7.10–38.1 24.02,4-Dinitrotoluene (µg/L) 51.9 21.7–59.8 46.02,6-Dinitrotoluene (µg/L) 75.0 38.5–85.0 66.0Fluoranthene (µg/L) 86.6 40.4-108 vNaphthalene (µg/L) 75.5 26.8–86.1 62.0Pyrene (µg/L) 102 47.7–124 90.01,2,4-Trichlorobenzene (µg/L) 143 41.7–162 98.0
Cations (Lot 443)
Calcium (µg/L) 101,000 90,900–111,000 97,700Magnesium (µg/L) 65,200 58,000–72,400 65,000Potassium (µg/L) 67,100 61,100–73,100 62,700Sodium (µg/L) 114,000 100,000–128,000 110,000
Cyanide and Phenol (Lot 99105)
Cyanide, total (µg/L) 906 661–1,150 1,140Phenols (µg/L) 169 128–210 155 J
Grease and Oil (Lot 99103)
Grease and oil (gravimetric) (mg/bottle) 29.7 17.8–37.1 22.4
Herbicides (Lot 3236)
2-sec-Butyl-4,6-dinotrophenol (Dinoseb) (µg/L) 40.3 13.2–52.0 34.02,4-Dichlorophenoxyacetic acid (µg/L) 40.6 20.3–60.9 2.80 u2,4,5-T (µg/L) 25.0 12.5–37.5 36.02,4,5-TP (Silvex) (µg/L) 80.3 40.2–120 90.0
Inorganics (Lot 3444)
Alkalinity (as CaCO3) (µg/L) 72,500 67,500–81,900 69,000Chloride (µg/L) 19,800 17,600–22,400 21,800Fluoride (µg/L) 4,030 3,630–4,430 4,040Nitrate as nitrogen (µg/L) 8,510 7,660–9,360 8,520pH (pH units) 8.97 8.77–9.17 9.07Potassium (µg/L) 32,000 27,500–37,400 31,200Sodium (µg/L) 53,200 48,100–59,100 54,100Specific conductance (µS/cm) 338 283–385 345Sulfate (µg/L) 17,800 15,300–20,100 18,200

Quality Control SamplesQuality Control SamplesESH-EMS-2000408ESH-EMS-2000408 Page Page 7878 Fourth Quarter 2000Fourth Quarter 2000
AnalyteCertifiedValue
PerformanceAcceptance Limits
EXResult
FunctionalGuideline Code
Nutrients (Lot 99104)
Ammonia as nitrogen (µg/L) 11,800 9,910–13,700 12,000Nitrate-nitrite as nitrogen (µg/L) 5,820 5,180–6,460 6,150Total phosphates (as P) (µg/L) 4,910 4,170–5,650 5,880 u
PCBs (Lot 595)
PCB 1242 (µg/L) 10.5 6.10–12.8 9.0
Pesticides (Lot 3236)
Aldrin (µg/L) 1.64 0.902–2.38 1.70Dieldrin (µg/L) 1.23 0.677–1.78 1.20Endrin (µg/L) 1.39 0.973–1.81 1.50Heptachlor (µg/L) 4.26 2.34–6.18 3.80Heptachlor epoxide (µg/L) 4.58 2.52–6.64 4.90Lindane (µg/L) 2.00 1.10–2.90 2.20Methoxychlor (µg/L) 35.9 19.7–52.1 39.0
Total Petroleum Hydrocarbons (Lot 8925)
Total petroleum hydrocarbons, infrared (mg/L) 75.2 46.9–97.5 112 u
Toxaphene (Lot 3236)
Toxaphene (µg/L) 12.8 7.04–18.6 13.0
Trace Metals (Lot 99105)
Aluminum (µg/L) 2,330 1,910–2,750 2,370Antimony (µg/L) 373 280–440 361Arsenic (µg/L) 701 526–827 669Barium (µg/L) 395 324–466 374Beryllium (µg/L) 593 486–700 594Boron (µg/L) 195 160–230 199Cadmium (µg/L) 77.8 63.8–91.8 68.3Chromium (µg/L) 791 649–933 819Cobalt (µg/L) 441 362–520 462Copper (µg/L) 348 285–411 335Iron (µg/L) 2,610 2,140–3,080 2,700Lead (µg/L) 106 86.9–125 99.6Manganese (µg/L) 787 645–929 787Mercury (µg/L) 10.3 7.73–12.9 10.9Molybdenum (µg/L) 573 470–676 588Nickel (µg/L) 1,210 992–1,430 1,240Selenium (µg/L) 406 305–479 404Silver (µg/L) 457 375–539 448Strontium (µg/L) 164 134–194 158Thallium (µg/L) 471 353–556 450Vanadium (µg/L) 509 417–601 506Zinc (µg/L) 1,050 861–1,240 1,090
Turbidity (Lot 3444)
Turbidity (NTU) 2.73 2.32–3.19 2.82
Volatiles (Lot 596)
Benzene (µg/L) 28.0 21.7–34.9 31.0Bromodichloromethane (µg/L) 55.4 42.6–69.0 69.0Bromoform (µg/L) 72.3 52.9–93.0 89.0Carbon tetrachloride (µg/L) 60.5 44.5–75.3 65.0Chlorobenzene (µg/L) 51.5 40.3–61.8 56.0Chloroform (µg/L) 46.3 35.5–56.6 52.0
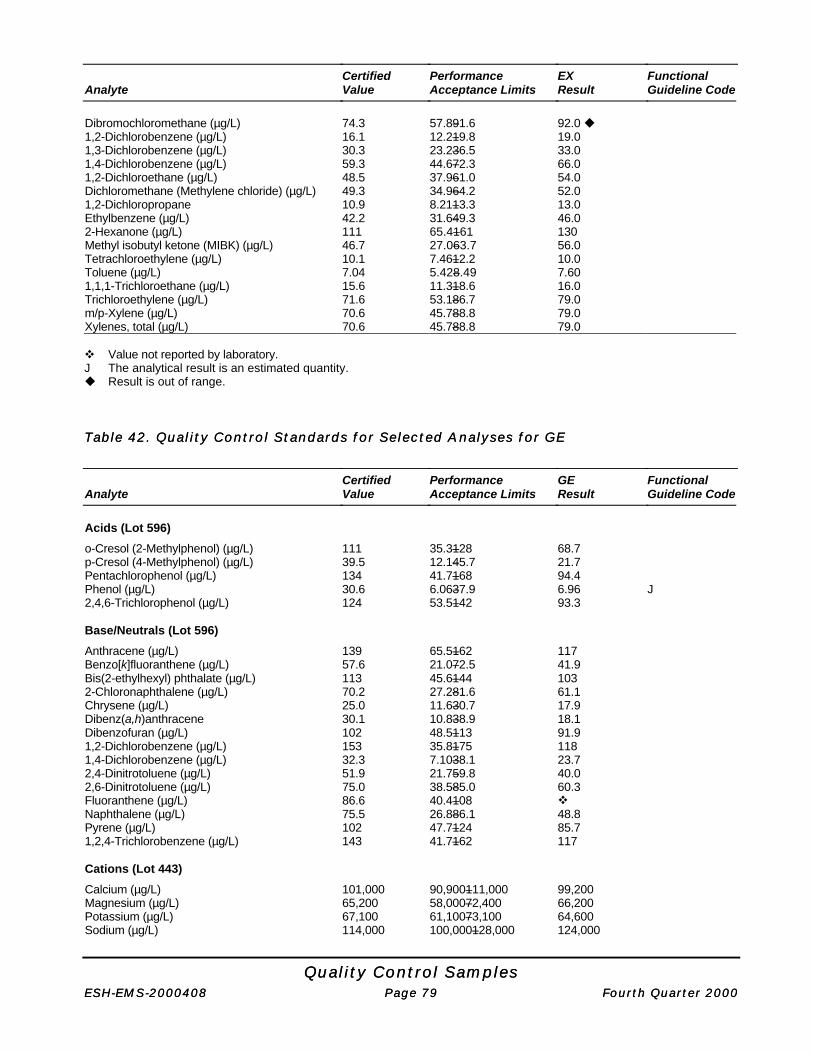
Quality Control SamplesQuality Control SamplesESH-EMS-2000408ESH-EMS-2000408 Page Page 7979 Fourth Quarter 2000Fourth Quarter 2000
AnalyteCertifiedValue
PerformanceAcceptance Limits
EXResult
FunctionalGuideline Code
Dibromochloromethane (µg/L) 74.3 57.8–91.6 92.0 u1,2-Dichlorobenzene (µg/L) 16.1 12.2–19.8 19.01,3-Dichlorobenzene (µg/L) 30.3 23.2–36.5 33.01,4-Dichlorobenzene (µg/L) 59.3 44.6–72.3 66.01,2-Dichloroethane (µg/L) 48.5 37.9–61.0 54.0Dichloromethane (Methylene chloride) (µg/L) 49.3 34.9–64.2 52.01,2-Dichloropropane 10.9 8.21–13.3 13.0Ethylbenzene (µg/L) 42.2 31.6–49.3 46.02-Hexanone (µg/L) 111 65.4–161 130Methyl isobutyl ketone (MIBK) (µg/L) 46.7 27.0–63.7 56.0Tetrachloroethylene (µg/L) 10.1 7.46–12.2 10.0Toluene (µg/L) 7.04 5.42–8.49 7.601,1,1-Trichloroethane (µg/L) 15.6 11.3–18.6 16.0Trichloroethylene (µg/L) 71.6 53.1–86.7 79.0m/p-Xylene (µg/L) 70.6 45.7–88.8 79.0Xylenes, total (µg/L) 70.6 45.7–88.8 79.0
v Value not reported by laboratory.J The analytical result is an estimated quantity.u Result is out of range.
Table 42.Table 42. Quality Control Standards for Selected Analyses for GEQuality Control Standards for Selected Analyses for GE
AnalyteCertifiedValue
PerformanceAcceptance Limits
GEResult
FunctionalGuideline Code
Acids (Lot 596)
o-Cresol (2-Methylphenol) (µg/L) 111 35.3–128 68.7p-Cresol (4-Methylphenol) (µg/L) 39.5 12.1–45.7 21.7Pentachlorophenol (µg/L) 134 41.7–168 94.4Phenol (µg/L) 30.6 6.06–37.9 6.96 J2,4,6-Trichlorophenol (µg/L) 124 53.5–142 93.3
Base/Neutrals (Lot 596)
Anthracene (µg/L) 139 65.5–162 117Benzo[k]fluoranthene (µg/L) 57.6 21.0–72.5 41.9Bis(2-ethylhexyl) phthalate (µg/L) 113 45.6–144 1032-Chloronaphthalene (µg/L) 70.2 27.2–81.6 61.1Chrysene (µg/L) 25.0 11.6–30.7 17.9Dibenz(a,h)anthracene 30.1 10.8–38.9 18.1Dibenzofuran (µg/L) 102 48.5–113 91.91,2-Dichlorobenzene (µg/L) 153 35.8–175 1181,4-Dichlorobenzene (µg/L) 32.3 7.10–38.1 23.72,4-Dinitrotoluene (µg/L) 51.9 21.7–59.8 40.02,6-Dinitrotoluene (µg/L) 75.0 38.5–85.0 60.3Fluoranthene (µg/L) 86.6 40.4–108 vNaphthalene (µg/L) 75.5 26.8–86.1 48.8Pyrene (µg/L) 102 47.7–124 85.71,2,4-Trichlorobenzene (µg/L) 143 41.7–162 117
Cations (Lot 443)
Calcium (µg/L) 101,000 90,900–111,000 99,200Magnesium (µg/L) 65,200 58,000–72,400 66,200Potassium (µg/L) 67,100 61,100–73,100 64,600Sodium (µg/L) 114,000 100,000–128,000 124,000

Quality Control SamplesQuality Control SamplesESH-EMS-2000408ESH-EMS-2000408 Page Page 8080 Fourth Quarter 2000Fourth Quarter 2000
AnalyteCertifiedValue
PerformanceAcceptance Limits
GEResult
FunctionalGuideline Code
Cyanide and Phenol (Lot 99105)
Cyanide, total (µg/L) 906 661–1,150 699Phenols (µg/L) 169 128–210 161 J
Grease and Oil (Lot 99103)
Grease and oil (gravimetric) (mg/bottle) 29.7 17.8–37.1 28.7
Herbicides (Lot 3236)
2-sec-Butyl-4,6-dinotrophenol (Dinoseb) (µg/L) 40.3 13.2–52.0 v2,4-Dichlorophenoxyacetic acid (µg/L) 40.6 20.3–60.9 33.52,4,5-T (µg/L) 25.0 12.5–37.5 23.22,4,5-TP (Silvex) (µg/L) 80.3 40.2–120 71.6
Inorganics (Lot 3444)
Alkalinity (as CaCO3) (µg/L) 72,500 67,500–81,900 67,700Chloride (µg/L) 19,800 17,600–22,400 20,400Fluoride (µg/L) 4,030 3,630–4,430 3,900Nitrate as nitrogen (µg/L) 8,510 7,660–9,360 8,780pH (pH units) 8.97 8.77–9.17 8.90Potassium (µg/L) 32,000 27,500–37,400 31,900Sodium (µg/L) 53,200 48,100–59,100 54,600Specific conductance (µS/cm) 338 283–385 350Sulfate (µg/L) 17,800 15,300–20,100 16,900Total dissolved solids (µg/L) 297,000 244,000–333,000 272,000
Nutrients (Lot 99104)
Ammonia as nitrogen (µg/L) 11,800 9,910–13,700 10,700Nitrate-nitrite as nitrogen (µg/L) 5,820 5,180–6,460 5,750Total phosphates (as P) (µg/L) 4,910 4,170–5,650 4,860
PCBs (Lot 595)
PCB 1242 (µg/L) 10.5 6.10–12.8 10.7
Pesticides (Lot 3236)
Aldrin (µg/L) 1.64 0.902–2.38 1.11Dieldrin (µg/L) 1.23 0.677–1.78 0.978Endrin (µg/L) 1.39 0.973–1.81 0.998Heptachlor (µg/L) 4.26 2.34–6.18 3.18Heptachlor epoxide (µg/L) 4.58 2.52–6.64 3.17Lindane (µg/L) 2.00 1.10–2.90 1.45Methoxychlor (µg/L) 35.9 19.7–52.1 30.1
Total Petroleum Hydrocarbons (Lot 8925)
Total petroleum hydrocarbons, infrared (mg/L) 75.2 46.9–97.5 †
Toxaphene (Lot 3236)
Toxaphene (µg/L) 12.8 7.04–18.6 v
Trace Metals (Lot 99105)
Aluminum (µg/L) 2,330 1,910–2,750 2,390Antimony (µg/L) 373 280–440 382Arsenic (µg/L) 701 526–827 692Barium (µg/L) 395 324–466 390Beryllium (µg/L) 593 486–700 576Boron (µg/L) 195 160–230 202Cadmium (µg/L) 77.8 63.8–91.8 76.6

Quality Control SamplesQuality Control SamplesESH-EMS-2000408ESH-EMS-2000408 Page Page 8181 Fourth Quarter 2000Fourth Quarter 2000
AnalyteCertifiedValue
PerformanceAcceptance Limits
GEResult
FunctionalGuideline Code
Chromium (µg/L) 791 649–933 803Cobalt (µg/L) 441 362–520 448Copper (µg/L) 348 285–411 341Iron (µg/L) 2,610 2,140–3,080 2,590Lead (µg/L) 106 86.9–125 108Manganese (µg/L) 787 645–929 792Mercury (µg/L) 10.3 7.73–12.9 9.63Molybdenum (µg/L) 573 470–676 575Nickel (µg/L) 1,210 992–1,430 1,220Selenium (µg/L) 406 305–479 393Silver (µg/L) 457 375–539 412Strontium (µg/L) 164 134–194 163Thallium (µg/L) 471 353–556 469Vanadium (µg/L) 509 417–601 504Zinc (µg/L) 1,050 861–1,240 1,040
Turbidity (Lot 3444)
Turbidity (NTU) 2.73 2.32–3.19 2.53
Volatiles (Lot 596)
Benzene (µg/L) 28.0 21.7–34.9 25.2Bromodichloromethane (µg/L) 55.4 42.6–69.0 50.6Bromoform (µg/L) 72.3 52.9–93.0 80.6Carbon tetrachloride (µg/L) 60.5 44.5–75.3 51.4Chlorobenzene (µg/L) 51.5 40.3–61.8 48.0Chloroform (µg/L) 46.3 35.5–56.6 41.3Dibromochloromethane (µg/L) 74.3 57.8–91.6 73.21,2-Dichlorobenzene (µg/L) 16.1 12.2–19.8 15.71,3-Dichlorobenzene (µg/L) 30.3 23.2–36.5 29.21,4-Dichlorobenzene (µg/L) 59.3 44.6–72.3 54.41,2-Dichloroethane (µg/L) 48.5 37.9–61.0 43.0Dichloromethane (Methylene chloride) (µg/L) 49.3 34.9–64.2 48.51,2-Dichloropropane 10.9 8.21–13.3 10.0Ethylbenzene (µg/L) 42.2 31.6–49.3 36.62-Hexanone (µg/L) 111 65.4–161 82.1Methyl isobutyl ketone (MIBK) (µg/L) 46.7 27.0–63.7 42.8Tetrachloroethylene (µg/L) 10.1 7.46–12.2 9.61Toluene (µg/L) 7.04 5.42–8.49 6.391,1,1-Trichloroethane (µg/L) 15.6 11.3–18.6 13.5Trichloroethylene (µg/L) 71.6 53.1–86.7 64.4m/p-Xylene (µg/L) 70.6 45.7–88.8 63.8Xylenes, total (µg/L) 70.6 45.7–88.8 63.8
J The analytical result is an estimated quantity.v Value not reported by laboratory.u Result is out of range.† The laboratory was not asked to report the results for this analysis.
Table 43.Table 43. Quality Control Standards for Selected Analyses for WAQuality Control Standards for Selected Analyses for WA
AnalyteCertifiedValue
PerformanceAcceptance Limits
WAResult
FunctionalGuideline Code
Acids (Lot 596)
o-Cresol (2-Methylphenol) (µg/L) 111 35.3–128 52.8p-Cresol (4-Methylphenol) (µg/L) 39.5 12.1–45.7 17.4

Quality Control SamplesQuality Control SamplesESH-EMS-2000408ESH-EMS-2000408 Page Page 8282 Fourth Quarter 2000Fourth Quarter 2000
AnalyteCertifiedValue
PerformanceAcceptance Limits
WAResult
FunctionalGuideline Code
Pentachlorophenol (µg/L) 134 41.7–168 70.5Phenol (µg/L) 30.6 6.06–37.9 6.62 J2,4,6-Trichlorophenol (µg/L) 124 53.5–142 75.6
Base/Neutrals (Lot 596)
Anthracene (µg/L) 139 65.5–162 158Benzo[k]fluoranthene (µg/L) 57.6 21.0–72.5 52.2Bis(2-ethylhexyl) phthalate (µg/L) 113 45.6–144 1192-Chloronaphthalene (µg/L) 70.2 27.2–81.6 68.1Chrysene (µg/L) 25.0 11.6–30.7 22.3Dibenz(a,h)anthracene 30.1 10.8–38.9 25.4Dibenzofuran (µg/L) 102 48.5–113 93.11,2-Dichlorobenzene (µg/L) 153 35.8–175 1451,4-Dichlorobenzene (µg/L) 32.3 7.10–38.1 24.82,4-Dinitrotoluene (µg/L) 51.9 21.7–59.8 44.82,6-Dinitrotoluene (µg/L) 75.0 38.5–85.0 67.9Fluoranthene (µg/L) 86.6 40.4–108 vNaphthalene (µg/L) 75.5 26.8–86.1 61.9Pyrene (µg/L) 102 47.7–124 1211,2,4-Trichlorobenzene (µg/L) 143 41.7–162 144
Cations (Lot 443)
Calcium (µg/L) 101,000 90,900–111,000 99,500Magnesium (µg/L) 65,200 58,000–72,400 66,200Potassium (µg/L) 67,100 61,100–73,100 67,200Sodium (µg/L) 114,000 100,000–128,000 108,000
Cyanide and Phenol (Lot 99105)
Cyanide, total (µg/L) 906 661–1,150 815Phenols (µg/L) 169 128–210 145
Grease and Oil (Lot 99103)
Grease and oil (gravimetric) (mg/bottle) 29.7 17.8–37.1 16.3 u
Herbicides (Lot 3236)
2-sec-Butyl-4,6-dinotrophenol (Dinoseb) (µg/L) 40.3 13.2–52.0 2.65 u2,4-Dichlorophenoxyacetic acid (µg/L) 40.6 20.3–60.9 44.12,4,5-T (µg/L) 25.0 12.5–37.5 31.82,4,5-TP (Silvex) (µg/L) 80.3 40.2–120 79.2
Inorganics (Lot 3444)
Alkalinity (as CaCO3) (µg/L) 72,500 67,500–81,900 70,000Chloride (µg/L) 19,800 17,600–22,400 22,200Fluoride (µg/L) 4,030 3,630–4,430 4,380Nitrate as nitrogen (µg/L) 8,510 7,660–9,360 8,340pH (pH units) 8.97 8.77–9.17 8.82Potassium (µg/L) 32,000 27,500–37,400 31,700Sodium (µg/L) 53,200 48,100–59,100 50,100Specific conductance (µS/cm) 338 283–385 306Sulfate (µg/L) 17,800 15,300–20,100 17,900Total dissolved solids (µg/L) 297,000 244,000–333,000 281,000
Nutrients (Lot 99104)
Ammonia as nitrogen (µg/L) 11,800 9,910–13,700 14,200 uNitrate-nitrite as nitrogen (µg/L) 5,820 5,180–6,460 5,570

Quality Control SamplesQuality Control SamplesESH-EMS-2000408ESH-EMS-2000408 Page Page 8383 Fourth Quarter 2000Fourth Quarter 2000
AnalyteCertifiedValue
PerformanceAcceptance Limits
WAResult
FunctionalGuideline Code
Total phosphates (as P) (µg/L) 4,910 4,170–5,650 5,100
PCBs (Lot 595)
PCB 1242 (µg/L) 10.5 6.10–12.8 7.75
Pesticides (Lot 3236)
Aldrin (µg/L) 1.64 0.902–2.38 1.23Dieldrin (µg/L) 1.23 0.677–1.78 1.09Endrin (µg/L) 1.39 0.973–1.81 1.40Heptachlor (µg/L) 4.26 2.34–6.18 3.94Heptachlor epoxide (µg/L) 4.58 2.52–6.64 3.57Lindane (µg/L) 2.00 1.10–2.90 1.50Methoxychlor (µg/L) 35.9 19.7–52.1 <2.50 u
Total Petroleum Hydrocarbons (Lot 8925)
Total petroleum hydrocarbons, infrared (mg/L) 75.2 46.9–97.5 82.4 J
Toxaphene (Lot 3236)
Toxaphene (µg/L) 12.8 7.04–18.6 7.01 u
Trace Metals (Lot 99105)
Aluminum (µg/L) 2,330 1,910–2,750 2,410Antimony (µg/L) 373 280–440 385Arsenic (µg/L) 701 526–827 706Barium (µg/L) 395 324–466 398Beryllium (µg/L) 593 486–700 586Boron (µg/L) 195 160–230 192 JCadmium (µg/L) 77.8 63.8–91.8 78.3Chromium (µg/L) 791 649–933 800Cobalt (µg/L) 441 362–520 458Copper (µg/L) 348 285–411 346Iron (µg/L) 2,610 2,140–3,080 2,620Lead (µg/L) 106 86.9–125 109Manganese (µg/L) 787 645–929 827Mercury (µg/L) 10.3 7.73–12.9 10.6Molybdenum (µg/L) 573 470–676 574Nickel (µg/L) 1,210 992–1,430 1,240Selenium (µg/L) 406 305–479 421Silver (µg/L) 457 375–539 462Strontium (µg/L) 164 134–194 165Thallium (µg/L) 471 353–556 482Vanadium (µg/L) 509 417–601 520Zinc (µg/L) 1,050 861–1,240 1,070
Turbidity (Lot 3444)
Turbidity (NTU) 2.73 2.32–3.19 3.29 u
Volatiles (Lot 596)
Benzene (µg/L) 28.0 21.7–34.9 26.6Bromodichloromethane (µg/L) 55.4 42.6–69.0 52.5Bromoform (µg/L) 72.3 52.9–93.0 62.3Carbon tetrachloride (µg/L) 60.5 44.5–75.3 50.0Chlorobenzene (µg/L) 51.5 40.3–61.8 52.6Chloroform (µg/L) 46.3 35.5–56.6 46.9Dibromochloromethane (µg/L) 74.3 57.8–91.6 69.91,2-Dichlorobenzene (µg/L) 16.1 12.2–19.8 13.41,3-Dichlorobenzene (µg/L) 30.3 23.2–36.5 26.6

Quality Control SamplesQuality Control SamplesESH-EMS-2000408ESH-EMS-2000408 Page Page 8484 Fourth Quarter 2000Fourth Quarter 2000
AnalyteCertifiedValue
PerformanceAcceptance Limits
WAResult
FunctionalGuideline Code
1,4-Dichlorobenzene (µg/L) 59.3 44.6–72.3 58.41,2-Dichloroethane (µg/L) 48.5 37.9–61.0 43.7Dichloromethane (Methylene chloride) (µg/L) 49.3 34.9–64.2 53.61,2-Dichloropropane 10.9 8.21–13.3 9.54Ethylbenzene (µg/L) 42.2 31.6–49.3 43.02-Hexanone (µg/L) 111 65.4–161 94.7Methyl isobutyl ketone (MIBK) (µg/L) 46.7 27.0–63.7 32.0Tetrachloroethylene (µg/L) 10.1 7.46–12.2 vToluene (µg/L) 7.04 5.42–8.49 6.541,1,1-Trichloroethane (µg/L) 15.6 11.3–18.6 12.7Trichloroethylene (µg/L) 71.6 53.1–86.7 71.2m/p-Xylene (µg/L) 70.6 45.7–88.8 72.9Xylenes, total (µg/L) 70.6 45.7–88.8 74.8
J The analytical result is an estimated quantity.v Value not reported by laboratory.u Result is out of range.
Table 44.Table 44. Quality Control Standards for Selected Analyses for EMQuality Control Standards for Selected Analyses for EM
AnalyteCertifiedValue
PerformanceAcceptance Limits
EMResult
FunctionalGuideline Code
Acids (Lot 596)
o-Cresol (2-Methylphenol) (µg/L) 111 35.3–128 †p-Cresol (4-Methylphenol) (µg/L) 39.5 12.1–45.7 †Pentachlorophenol (µg/L) 134 41.7–168 †Phenol (µg/L) 30.6 6.06–37.9 †2,4,6-Trichlorophenol (µg/L) 124 53.5–142 †
Base/Neutrals (Lot 596)
Anthracene (µg/L) 139 65.5–162 †Benzo[k]fluoranthene (µg/L) 57.6 21.0–72.5 †Bis(2-ethylhexyl) phthalate (µg/L) 113 45.6–144 †2-Chloronaphthalene (µg/L) 70.2 27.2–81.6 †Chrysene (µg/L) 25.0 11.6–30.7 †Dibenz(a,h)anthracene 30.1 10.8–38.9 †Dibenzofuran (µg/L) 102 48.5–113 †1,2-Dichlorobenzene (µg/L) 153 35.8–175 †1,4-Dichlorobenzene (µg/L) 32.3 7.10–38.1 †2,4-Dinitrotoluene (µg/L) 51.9 21.7–59.8 †2,6-Dinitrotoluene (µg/L) 75.0 38.5–85.0 †Fluoranthene (µg/L) 86.6 40.4–108 †Naphthalene (µg/L) 75.5 26.8–86.1 †Pyrene (µg/L) 102 47.7–124 †1,2,4-Trichlorobenzene (µg/L) 143 41.7–162 †
Cations (Lot 443)
Calcium (µg/L) 101,000 90,900–111,000 †Magnesium (µg/L) 65,200 58,000–72,400 †Potassium (µg/L) 67,100 61,100–73,100 †Sodium (µg/L) 114,000 100,000–128,000 †
Cyanide and Phenol (Lot 99105)
Cyanide, total (µg/L) 906 661–1,150 †
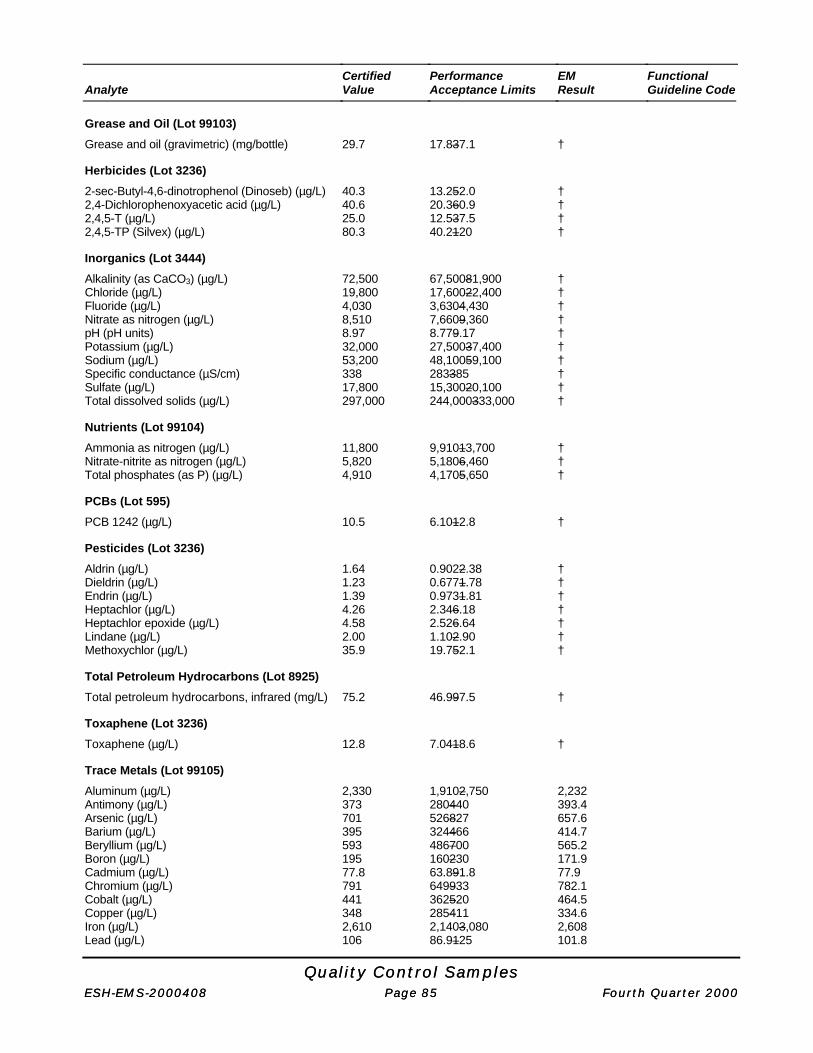
Quality Control SamplesQuality Control SamplesESH-EMS-2000408ESH-EMS-2000408 Page Page 8585 Fourth Quarter 2000Fourth Quarter 2000
AnalyteCertifiedValue
PerformanceAcceptance Limits
EMResult
FunctionalGuideline Code
Grease and Oil (Lot 99103)
Grease and oil (gravimetric) (mg/bottle) 29.7 17.8–37.1 †
Herbicides (Lot 3236)
2-sec-Butyl-4,6-dinotrophenol (Dinoseb) (µg/L) 40.3 13.2–52.0 †2,4-Dichlorophenoxyacetic acid (µg/L) 40.6 20.3–60.9 †2,4,5-T (µg/L) 25.0 12.5–37.5 †2,4,5-TP (Silvex) (µg/L) 80.3 40.2–120 †
Inorganics (Lot 3444)
Alkalinity (as CaCO3) (µg/L) 72,500 67,500–81,900 †Chloride (µg/L) 19,800 17,600–22,400 †Fluoride (µg/L) 4,030 3,630–4,430 †Nitrate as nitrogen (µg/L) 8,510 7,660–9,360 †pH (pH units) 8.97 8.77–9.17 †Potassium (µg/L) 32,000 27,500–37,400 †Sodium (µg/L) 53,200 48,100–59,100 †Specific conductance (µS/cm) 338 283–385 †Sulfate (µg/L) 17,800 15,300–20,100 †Total dissolved solids (µg/L) 297,000 244,000–333,000 †
Nutrients (Lot 99104)
Ammonia as nitrogen (µg/L) 11,800 9,910–13,700 †Nitrate-nitrite as nitrogen (µg/L) 5,820 5,180–6,460 †Total phosphates (as P) (µg/L) 4,910 4,170–5,650 †
PCBs (Lot 595)
PCB 1242 (µg/L) 10.5 6.10–12.8 †
Pesticides (Lot 3236)
Aldrin (µg/L) 1.64 0.902–2.38 †Dieldrin (µg/L) 1.23 0.677–1.78 †Endrin (µg/L) 1.39 0.973–1.81 †Heptachlor (µg/L) 4.26 2.34–6.18 †Heptachlor epoxide (µg/L) 4.58 2.52–6.64 †Lindane (µg/L) 2.00 1.10–2.90 †Methoxychlor (µg/L) 35.9 19.7–52.1 †
Total Petroleum Hydrocarbons (Lot 8925)
Total petroleum hydrocarbons, infrared (mg/L) 75.2 46.9–97.5 †
Toxaphene (Lot 3236)
Toxaphene (µg/L) 12.8 7.04–18.6 †
Trace Metals (Lot 99105)
Aluminum (µg/L) 2,330 1,910–2,750 2,232Antimony (µg/L) 373 280–440 393.4Arsenic (µg/L) 701 526–827 657.6Barium (µg/L) 395 324–466 414.7Beryllium (µg/L) 593 486–700 565.2Boron (µg/L) 195 160–230 171.9Cadmium (µg/L) 77.8 63.8–91.8 77.9Chromium (µg/L) 791 649–933 782.1Cobalt (µg/L) 441 362–520 464.5Copper (µg/L) 348 285–411 334.6Iron (µg/L) 2,610 2,140–3,080 2,608Lead (µg/L) 106 86.9–125 101.8

Quality Control SamplesQuality Control SamplesESH-EMS-2000408ESH-EMS-2000408 Page Page 8686 Fourth Quarter 2000Fourth Quarter 2000
AnalyteCertifiedValue
PerformanceAcceptance Limits
EMResult
FunctionalGuideline Code
Manganese (µg/L) 787 645–929 821.9Mercury (µg/L) 10.3 7.73–12.9 10.3Molybdenum (µg/L) 573 470–676 589.9Nickel (µg/L) 1,210 992–1,430 1,237Selenium (µg/L) 406 305–479 385.4Silver (µg/L) 457 375–539 472Strontium (µg/L) 164 134–194 120 uThallium (µg/L) 471 353–556 460.8Vanadium (µg/L) 509 417–601 482.4Zinc (µg/L) 1,050 861–1,240 1,075
Turbidity (Lot 3444)
Turbidity (NTU) 2.73 2.32–3.19 †
Volatiles (Lot 596)
Benzene (µg/L) 28.0 21.7–34.9 vBromodichloromethane (µg/L) 55.4 42.6–69.0 vBromoform (µg/L) 72.3 52.9–93.0 vCarbon tetrachloride (µg/L) 60.5 44.5–75.3 vChlorobenzene (µg/L) 51.5 40.3–61.8 vChloroform (µg/L) 46.3 35.5–56.6 vDibromochloromethane (µg/L) 74.3 57.8–91.6 v1,2-Dichlorobenzene (µg/L) 16.1 12.2–19.8 v1,3-Dichlorobenzene (µg/L) 30.3 23.2–36.5 v1,4-Dichlorobenzene (µg/L) 59.3 44.6–72.3 v1,2-Dichloroethane (µg/L) 48.5 37.9–61.0 vDichloromethane (Methylene chloride) (µg/L) 49.3 34.9–64.2 v1,2-Dichloropropane 10.9 8.21–13.3 vEthylbenzene (µg/L) 42.2 31.6–49.3 v2-Hexanone (µg/L) 111 65.4–161 vMethyl isobutyl ketone (MIBK) (µg/L) 46.7 27.0–63.7 vTetrachloroethylene (µg/L) 10.1 7.46–12.2 vToluene (µg/L) 7.04 5.42–8.49 v1,1,1-Trichloroethane (µg/L) 15.6 11.3–18.6 vTrichloroethylene (µg/L) 71.6 53.1–86.7 vm/p-Xylene (µg/L) 70.6 45.7–88.8 vXylenes, total (µg/L) 70.6 45.7–88.8 v
† The laboratory was not asked to report the results for this analysis.u Result is out of range.v Value not reported by laboratory.
Table 45.Table 45. Quality Control Standards for Selected Analyses for MLQuality Control Standards for Selected Analyses for ML
AnalyteCertifiedValue
PerformanceAcceptance Limits
MLResult
FunctionalGuideline Code
Acids (Lot 596)
o-Cresol (2-Methylphenol) (µg/L) 111 35.3–128 58.7p-Cresol (4-Methylphenol) (µg/L) 39.5 12.1–45.7 20.9Pentachlorophenol (µg/L) 134 41.7–168 108Phenol (µg/L) 30.6 6.06–37.9 8.332,4,6-Trichlorophenol (µg/L) 124 53.5–142 92.6
Base/Neutrals (Lot 596)
Anthracene (µg/L) 139 65.5–162 122

Quality Control SamplesQuality Control SamplesESH-EMS-2000408ESH-EMS-2000408 Page Page 8787 Fourth Quarter 2000Fourth Quarter 2000
AnalyteCertifiedValue
PerformanceAcceptance Limits
MLResult
FunctionalGuideline Code
Benzo[k]fluoranthene (µg/L) 57.6 21.0–72.5 53.6Bis(2-ethylhexyl) phthalate (µg/L) 113 45.6–144 99.42-Chloronaphthalene (µg/L) 70.2 27.2–81.6 47.8Chrysene (µg/L) 25.0 11.6–30.7 22.9Dibenz(a,h)anthracene 30.1 10.8–38.9 27.4Dibenzofuran (µg/L) 102 48.5–113 71.01,2-Dichlorobenzene (µg/L) 153 35.8–175 79.71,4-Dichlorobenzene (µg/L) 32.3 7.10–38.1 16.62,4-Dinitrotoluene (µg/L) 51.9 21.7–59.8 45.22,6-Dinitrotoluene (µg/L) 75.0 38.5–85.0 63.4Fluoranthene (µg/L) 86.6 40.4–108 vNaphthalene (µg/L) 75.5 26.8–86.1 44.7Pyrene (µg/L) 102 47.7–124 86.51,2,4-Trichlorobenzene (µg/L) 143 41.7–162 83.8
Cations (Lot 443)
Calcium (µg/L) 101,000 90,900–111,000 †Magnesium (µg/L) 65,200 58,000–72,400 †Potassium (µg/L) 67,100 61,100–73,100 †Sodium (µg/L) 114,000 100,000–128,000 †
Cyanide and Phenol (Lot 99105)
Cyanide, total (µg/L) 906 661–1,150 †Phenols (µg/L) 169 128–210 †
Grease and Oil (Lot 99103)
Grease and oil (gravimetric) (mg/bottle) 29.7 17.8–37.1 †
Herbicides (Lot 3236)
2-sec-Butyl-4,6-dinotrophenol (Dinoseb) (µg/L) 40.3 13.2–52.0 †2,4-Dichlorophenoxyacetic acid (µg/L) 40.6 20.3–60.9 †2,4,5-T (µg/L) 25.0 12.5–37.5 †2,4,5-TP (Silvex) (µg/L) 80.3 40.2–120 †
Inorganics (Lot 3444)
Alkalinity (as CaCO3) (µg/L) 72,500 67,500–81,900 †Chloride (µg/L) 19,800 17,600–22,400 †Fluoride (µg/L) 4,030 3,630–4,430 †Nitrate as nitrogen (µg/L) 8,510 7,660–9,360 †pH (pH units) 8.97 8.77–9.17 †Potassium (µg/L) 32,000 27,500–37,400 †Sodium (µg/L) 53,200 48,100–59,100 †Specific conductance (µS/cm) 338 283–385 †Sulfate (µg/L) 17,800 15,300–20,100 †Total dissolved solids (µg/L) 297,000 244,000–333,000 †
Nutrients (Lot 99104)
Ammonia as nitrogen (µg/L) 11,800 9,910–13,700 †Nitrate-nitrite as nitrogen (µg/L) 5,820 5,180–6,460 †Total phosphates (as P) (µg/L) 4,910 4,170–5,650 †
PCBs (Lot 595)
PCB 1242 (µg/L) 10.5 6.10–12.8 <1.0 u
Pesticides (Lot 3236)
Aldrin (µg/L) 1.64 0.902–2.38 1.36Dieldrin (µg/L) 1.23 0.677–1.78 1.11

Quality Control SamplesQuality Control SamplesESH-EMS-2000408ESH-EMS-2000408 Page Page 8888 Fourth Quarter 2000Fourth Quarter 2000
AnalyteCertifiedValue
PerformanceAcceptance Limits
MLResult
FunctionalGuideline Code
Endrin (µg/L) 1.39 0.973–1.81 1.42Heptachlor (µg/L) 4.26 2.34–6.18 5.27Heptachlor epoxide (µg/L) 4.58 2.52–6.64 5.81Lindane (µg/L) 2.00 1.10–2.90 1.79Methoxychlor (µg/L) 35.9 19.7–52.1 35.4
Total Petroleum Hydrocarbons (Lot 8925)
Total petroleum hydrocarbons, infrared (mg/L) 75.2 46.9–97.5 †
Toxaphene (Lot 3236)
Toxaphene (µg/L) 12.8 7.04–18.6 †
Trace Metals (Lot 99105)
Aluminum (µg/L) 2,330 1,910–2,750 2,330Antimony (µg/L) 373 280–440 364Arsenic (µg/L) 701 526–827 673Barium (µg/L) 395 324–466 386Beryllium (µg/L) 593 486–700 561Boron (µg/L) 195 160–230 †Cadmium (µg/L) 77.8 63.8–91.8 74.3Chromium (µg/L) 791 649–933 770Cobalt (µg/L) 441 362–520 436Copper (µg/L) 348 285–411 337Iron (µg/L) 2,610 2,140–3,080 2,580Lead (µg/L) 106 86.9–125 105Manganese (µg/L) 787 645–929 779Mercury (µg/L) 10.3 7.73–12.9 9.54Molybdenum (µg/L) 573 470–676 †Nickel (µg/L) 1,210 992–1,430 1,190Selenium (µg/L) 406 305–479 384Silver (µg/L) 457 375–539 445Strontium (µg/L) 164 134–194 †Thallium (µg/L) 471 353–556 462Vanadium (µg/L) 509 417–601 497Zinc (µg/L) 1,050 861–1,240 1,020
Turbidity (Lot 3444)
Turbidity (NTU) 2.73 2.32–3.19 †
Volatiles (Lot 596)
Benzene (µg/L) 28.0 21.7–34.9 24.7Bromodichloromethane (µg/L) 55.4 42.6–69.0 55.0Bromoform (µg/L) 72.3 52.9–93.0 72.8Carbon tetrachloride (µg/L) 60.5 44.5–75.3 52.8Chlorobenzene (µg/L) 51.5 40.3–61.8 50.5Chloroform (µg/L) 46.3 35.5–56.6 43.8Dibromochloromethane (µg/L) 74.3 57.8–91.6 72.81,2-Dichlorobenzene (µg/L) 16.1 12.2–19.8 †1,3-Dichlorobenzene (µg/L) 30.3 23.2–36.5 < 2.0 u1,4-Dichlorobenzene (µg/L) 59.3 44.6–72.3 †1,2-Dichloroethane (µg/L) 48.5 37.9–61.0 44.6Dichloromethane (Methylene chloride) (µg/L) 49.3 34.9–64.2 49.11,2-Dichloropropane 10.9 8.21–13.3 11.1Ethylbenzene (µg/L) 42.2 31.6–49.3 40.92-Hexanone (µg/L) 111 65.4–161 113Methyl isobutyl ketone (MIBK) (µg/L) 46.7 27.0–63.7 48.5Tetrachloroethylene (µg/L) 10.1 7.46–12.2 8.26Toluene (µg/L) 7.04 5.42–8.49 7.34
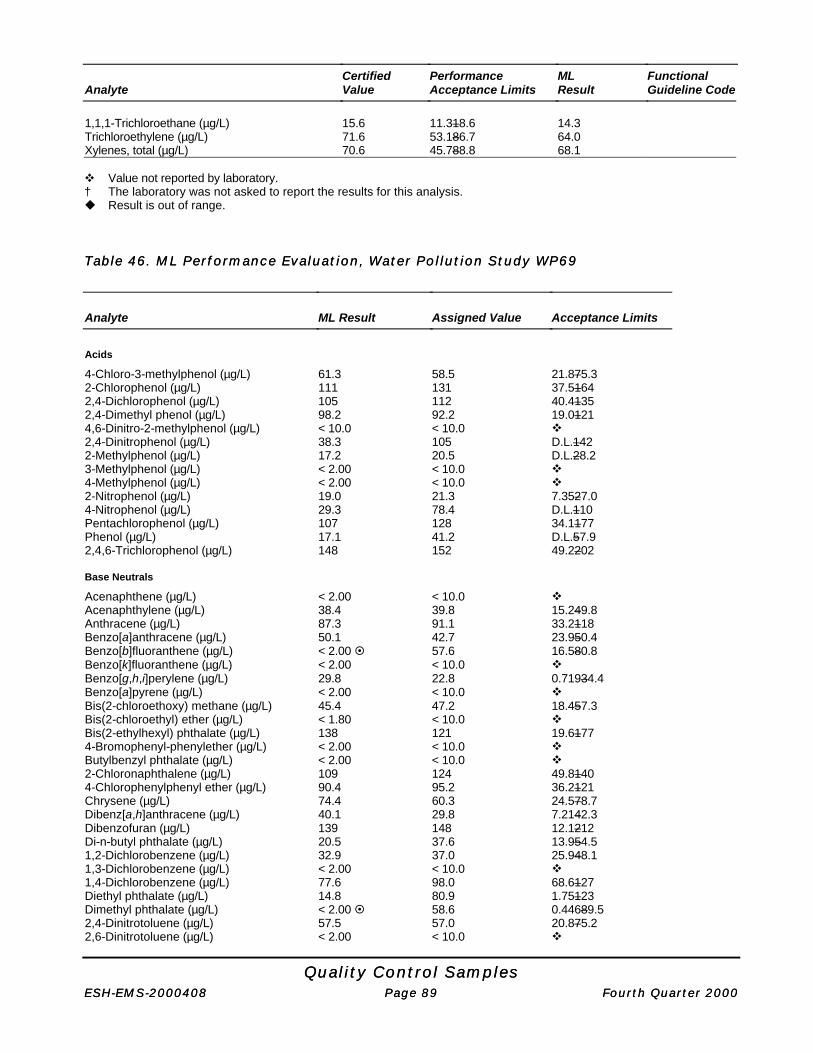
Quality Control SamplesQuality Control SamplesESH-EMS-2000408ESH-EMS-2000408 Page Page 8989 Fourth Quarter 2000Fourth Quarter 2000
AnalyteCertifiedValue
PerformanceAcceptance Limits
MLResult
FunctionalGuideline Code
1,1,1-Trichloroethane (µg/L) 15.6 11.3–18.6 14.3Trichloroethylene (µg/L) 71.6 53.1–86.7 64.0Xylenes, total (µg/L) 70.6 45.7–88.8 68.1
v Value not reported by laboratory.† The laboratory was not asked to report the results for this analysis.u Result is out of range.
Table 46.Table 46. ML Performance Evaluation, Water Pollution Study WP69ML Performance Evaluation, Water Pollution Study WP69
Analyte ML Result Assigned Value Acceptance Limits
Acids
4-Chloro-3-methylphenol (µg/L) 61.3 58.5 21.8–75.32-Chlorophenol (µg/L) 111 131 37.5–1642,4-Dichlorophenol (µg/L) 105 112 40.4–1352,4-Dimethyl phenol (µg/L) 98.2 92.2 19.0–1214,6-Dinitro-2-methylphenol (µg/L) < 10.0 < 10.0 v2,4-Dinitrophenol (µg/L) 38.3 105 D.L.–1422-Methylphenol (µg/L) 17.2 20.5 D.L.–28.23-Methylphenol (µg/L) < 2.00 < 10.0 v4-Methylphenol (µg/L) < 2.00 < 10.0 v2-Nitrophenol (µg/L) 19.0 21.3 7.35–27.04-Nitrophenol (µg/L) 29.3 78.4 D.L.–110Pentachlorophenol (µg/L) 107 128 34.1–177Phenol (µg/L) 17.1 41.2 D.L.–57.92,4,6-Trichlorophenol (µg/L) 148 152 49.2–202
Base Neutrals
Acenaphthene (µg/L) < 2.00 < 10.0 vAcenaphthylene (µg/L) 38.4 39.8 15.2–49.8Anthracene (µg/L) 87.3 91.1 33.2–118Benzo[a]anthracene (µg/L) 50.1 42.7 23.9–50.4Benzo[b]fluoranthene (µg/L) < 2.00 ¤ 57.6 16.5–80.8Benzo[k]fluoranthene (µg/L) < 2.00 < 10.0 vBenzo[g,h,i]perylene (µg/L) 29.8 22.8 0.719–34.4Benzo[a]pyrene (µg/L) < 2.00 < 10.0 vBis(2-chloroethoxy) methane (µg/L) 45.4 47.2 18.4–57.3Bis(2-chloroethyl) ether (µg/L) < 1.80 < 10.0 vBis(2-ethylhexyl) phthalate (µg/L) 138 121 19.6–1774-Bromophenyl-phenylether (µg/L) < 2.00 < 10.0 vButylbenzyl phthalate (µg/L) < 2.00 < 10.0 v2-Chloronaphthalene (µg/L) 109 124 49.8–1404-Chlorophenylphenyl ether (µg/L) 90.4 95.2 36.2–121Chrysene (µg/L) 74.4 60.3 24.5–78.7Dibenz[a,h]anthracene (µg/L) 40.1 29.8 7.21–42.3Dibenzofuran (µg/L) 139 148 12.1–212Di-n-butyl phthalate (µg/L) 20.5 37.6 13.9–54.51,2-Dichlorobenzene (µg/L) 32.9 37.0 25.9–48.11,3-Dichlorobenzene (µg/L) < 2.00 < 10.0 v1,4-Dichlorobenzene (µg/L) 77.6 98.0 68.6–127Diethyl phthalate (µg/L) 14.8 80.9 1.75–123Dimethyl phthalate (µg/L) < 2.00 ¤ 58.6 0.446–89.52,4-Dinitrotoluene (µg/L) 57.5 57.0 20.8–75.22,6-Dinitrotoluene (µg/L) < 2.00 < 10.0 v

Quality Control SamplesQuality Control SamplesESH-EMS-2000408ESH-EMS-2000408 Page Page 9090 Fourth Quarter 2000Fourth Quarter 2000
Analyte ML Result Assigned Value Acceptance Limits
Di-n-octyl phthalate (µg/L) < 2.00 < 10.0 vFluoranthene (µg/L) < 2.00 < 10.0 vFluorene (µg/L) 43.3 42.2 17.9–54.9Hexachlorobenzene (µg/L) < 2.00 < 10.0 vHexachlorobutadiene (µg/L) 116 166 29.5–198Hexachlorocyclopentadiene (µg/L) < 2.00 < 10.0 vHexachloroethane (µg/L) < 2.00 < 10.0 vIndeno[1,2,3-cd]pyrene (µg/L) 47.1 37.8 6.93–50.6Isophorone (µg/L) 138 139 46.9–1852-Methylnaphthalene (µg/L) < 2.00 < 10.0 vNaphthalene (µg/L) 121 140 33.9–1822-Nitroaniline (µg/L) < 5.00 < 10.0 v3-Nitroaniline (µg/L) < 5.00 < 10.0 v4-Nitroaniline (µg/L) < 24.00 < 10.0 vNitrobenzene (µg/L) 52.1 56.8 19.6–73.9N-Nitrosodiphenylamine (µg/L) < 2.00 < 10.0 vN-Nitrosodi-n-propylamine (µg/L) 128 131 40.8–170Phenanthrene (µg/L) 53.8 53.5 25.5–67.8Pyrene (µg/L) 39.2 35.4 11.4–52.01,2,4-Trichlotobenzene (µg/L) 97.9 114 33.3–135
Cyanide
Cyanide, total (mg/L) 0.635 0.686 0.476–0.882
PCBs in H20 (Standard 1)
PCB 1248 (µg/L) 3.39 2.84 1.17–3.95
PCBs in H20 (Standard 2)
PCB 1260 (µg/L) 2.36 u 1.92 0.816–2.58
Pesticides
Aldrin (µg/L) 1.04 1.32 0.336–1.79alpha-BHC (µg/L) 4.20 4.68 1.82–6.43beta-BHC (µg/L) 1.92 2.46 0.767–3.74delta-BHC (µg/L) < 0.05 < 0.100 vgamma-BHC (Lindane) (µg/L) 6.62 7.42 2.48–10.7alpha-Chlordane (µg/L) 3.61 4.40 0.980–7.28gamma-Chlordane (µg/L) < 0.05 < 0.100 vp,p’-DDD (µg/L) 4.45 4.94 2.43–6.89p,p’-DDE (µg/L) 1.75 2.23 1.05–3.04p,p’-DDT (µg/L) 4.04 4.02 1.84–5.44Dieldrin (µg/L) 1.62 2.02 1.04–2.79Endrin (µg/L) 6.80 7.24 2.78–10.3Endrin aldehyde (µg/L) < 0.05 <0.100 vEndrin ketone (µg/L) < 0.05 <0.100 vEndosulfan I (µg/L) < 0.05 <0.100 vEndosulfan II (µg/L) 18.0 27.5 5.40–44.1Endosulfan sulfate (µg/L) 16.2 18.8 3.20–30.9Heptachlor (µg/L) 1.13 1.44 0.384–2.00Heptachlor epoxide (µg/L) 1.78 2.00 1.02–2.57Methoxychlor (µg/L) 2.34 2.71 0.775–4.69Toxaphene (µg/L) 2.53 2.99 0.794–4.93
Trace Metals
Aluminum (µg/L) 801 891 757–1,020Antimony (µg/L) 695 700 494–841Arsenic (µg/L) 303 317 264–373Barium (µg/L) 1,480 1,540 1,310–1,750Beryllium (µg/L) 336 342 290–386

Quality Control SamplesQuality Control SamplesESH-EMS-2000408ESH-EMS-2000408 Page Page 9191 Fourth Quarter 2000Fourth Quarter 2000
Analyte ML Result Assigned Value Acceptance Limits
Cadmium (µg/L) 476 493 421–560Calcium (mg/L) 60.8 u 54.4 48.6–61.7Chromium (µg/L) 741 759 662–858Cobalt (µg/L) 534 529 465–593Copper (µg/L) 425 446 404–491Iron (µg/L) 1,090 1,090 964–1,230Lead (µg/L) 759 785 687–880Magnesium (mg/L) 10.0 9.68 8.41–10.9Manganese (µg/L) 562 574 515–638Mercury (µg/L) 2.92 2.72 1.93–3.50Nickel (µg/L) 1,920 1,950 1,770–2,170Potassium (mg/L) 29.8 28.6 24.7–32.6Selenium (µg/L) 857 885 703–1,020Silver (µg/L) 266 272 233–312Sodium (mg/L) 65.0 63.9 57.6–70.2Thallium (µg/L) 456 477 384–554Vanadium (µg/L) 4,810 4,940 4,460–5,430Zinc (µg/L) 632 630 557–710
Volatiles
Acetone (µg/L) < 10.0 < 5.00 vBenzene (µg/L) 27.9 29.3 20.9–38.0Bromodichloromethane (µg/L) 64.1 59.1 42.0–76.9Bromoform (µg/L) 68.1 55.9 36.5–76.5Bromomethane (µg/L) < 1.00 < 5.00 v2-Butanone (Methyl ethyl ketone) (µg/L) < 5.00 < 5.00 vCarbon disulfide (µg/L) < 5.00 < 5.00 vCarbon tetrachloride (µg/L) 70.8 61.1 37.7–86.2Chlorobenzene (µg/L) 36.5 35.1 25.0–44.6Chlorodibromomethane (µg/L) 50.6 46.0 30.4–61.1Chloroethane (µg/L) < 1.00 < 5.00 vChloroform (µg/L) 50.9 48.4 33.6–62.1Chloromethane (µg/L) < 1.00 < 5.00 v1,1-Dichloroethane (µg/L) < 1.00 < 5.00 v1,2-Dichloroethane (µg/L) 47.9 44.7 30.9–59.61,1-Dichloroethylene (µg/L) 12.1 12.4 5.07–21.51,2-Dichloropropane (µg/L) < 1.00 < 5.00 vEthylbenzene (µg/L) 15.2 15.0 10.3–19.42-Hexanone (µg/L) < 5.00 < 5.00 vMethylene chloride (µg/L) 29.9 29.8 18.8–41.5Methyl isobutyl ketone (µg/L) 76.0 83.1 31.9–129Styrene (µg/L) < 1.00 < 5.00 v1,1,2,2-Tetrachoroethane (µg/L) < 1.00 < 5.00 vTetrachloroethylene (µg/L) 38.7 36.2 23.9–46.5Toluene (µg/L) 19.8 19.3 13.6–24.51,1,1-Trichloroethane (µg/L) 41.1 34.7 22.6–45.81,1,2-Trichloroethane (µg/L) 130 129 87.2–168Trichlotoethylene (µg/L) 35.0 35.6 23.2–46.1Vinyl acetate (µg/L) < 5.00 < 5.00 vVinyl chloride (µg/L) < 1.00 < 5.00 vXylenes, total (µg/L) 60.7 60.3 34.0–82.9
v Acceptance limits were not provided.¤ Result is not acceptable.u Laboratory was asked to check for error.D.L. Detection limit

Quality Control SamplesQuality Control SamplesESH-EMS-2000408ESH-EMS-2000408 Page Page 9292 Fourth Quarter 2000Fourth Quarter 2000
Table 47.Table 47. Laboratory Control Sample Recoveries for GELaboratory Control Sample Recoveries for GE
AnalyteQualifiedOut of Range†
MeanRecovery (%)
StandardDeviation
MinimumRecovery (%)
MaximumRecovery (%)
EPA160.1Total dissolved solids 0/8 99.8 1.58 97.0 102
EPA300.0Sulfate 0/3 99.7 2.89 98.0 103
EPA310.1Alkalinity (as CaCO3) 0/5 97.2 0.84 96.0 98.0
EPA353.1Nitrate-nitrite as nitrogen 0/19 101 8.55 82.0 117
EPA365.4Total phosphates (as P) 1/1 75.0 — 75.0 75.0
EPA6010BAluminum 0/12 103 4.12 93.0 110Antimony 0/10 103 4.88 93.0 109Arsenic 0/10 101 5.60 91.0 110Barium 0/10 104 4.34 94.0 108Beryllium 0/3 102 1.53 101 104Boron 0/7 98.3 5.44 88.0 104Cadmium 0/10 104 6.97 94.0 115Calcium 0/3 106 1.53 104 107Chromium 0/10 105 6.15 95.0 114Cobalt 0/3 104 2.0 102 106Copper 0/10 101 4.16 91.0 105Iron 0/3 104 0.0 104 104Lead 0/19 104 5.67 93.0 116Magnesium 0/3 104 1.53 103 106Manganese 0/3 103 2.08 101 105Nickel 0/10 105 6.88 94.0 114Potassium 0/3 99.7 2.89 98.0 103Selenium 0/10 99.3 5.46 89.0 107Silver 0/10 97.9 3.78 91.0 103Sodium 0/3 104 2.31 103 107Thallium 0/3 103 1.73 102 105Tin 0/7 103 8.18 90.0 113Uranium 0/8 101 4.16 94.0 106Vanadium 0/3 102 3.06 99.0 105Zinc 0/10 103 5.64 91.0 110
EPA6020Aluminum 0/6 106 2.88 101 108Antimony 1/6 121 7.53 106 126Arsenic 0/6 94.2 6.08 87.0 103Barium 0/6 99.7 5.20 93.0 105Beryllium 0/23 112 6.51 92.0 119Cadmium 0/18 99.3 4.39 92.0 106Chromium 0/6 106 6.62 95.0 115Cobalt 0/6 97.8 2.93 94.0 102Copper 0/6 96.7 5.65 87.0 102Iron 1/6 424 777 103 2,010Lead 0/7 91.4 2.76 86.0 94.0Lithium 1/8 108 12.4 95.0 131Nickel 0/6 95.8 3.31 93.0 100Selenium 0/6 88.5 5.50 82.0 97.0Silver 0/6 104 8.77 89.0 111Thallium 15/17 55.9 10.5 42.0 82.0

Quality Control SamplesQuality Control SamplesESH-EMS-2000408ESH-EMS-2000408 Page Page 9393 Fourth Quarter 2000Fourth Quarter 2000
AnalyteQualifiedOut of Range†
MeanRecovery (%)
StandardDeviation
MinimumRecovery (%)
MaximumRecovery (%)
Tin 1/6 117 12.7 105 139Vanadium 0/6 101 7.42 91.0 114Zinc 0/6 96.3 4.50 89.0 103
EPA7470AMercury 0/24 97.8 7.75 84.0 113
EPA8082PCB 1260 0/1 76.0 — 76.0 76.0
EPA8260BBenzene 0/29 99.2 7.74 88.0 116Chlorobenzene 0/28 97.8 6.62 83.0 1091,1-Dichloroethylene 0/28 101 11.6 75.0 127Tetrachloroethylene 0/1 121 — 121 121Toluene 0/29 93.8 8.31 76.0 108Trichloroethylene 0/27 98.1 7.62 85.0 115Xylenes 0/1 94.0 — 94.0 94.0
EPA8270CBis(2-ethylhexyl) phthalate 0/4 102 37.5 76.0 157
EPA9012ACyanide 0/11 96.9 5.45 88.0 104
EPA9020BTotal organic halogens 0/4 94.0 7.12 88.0 102
EPA9040BpH 0/23 100 0.39 100 101
EPA9050ASpecific conductance 0/14 99.9 1.99 96.0 102
EPA9056Chloride 0/1 99.0 — 99.0 99.0Fluoride 0/1 105 — 105 105Sulfate 0/2 98.5 0.71 98.0 99.0
EPA9060Total organic carbon 0/5 97.0 7.62 90.0 110
EPA9066Phenols 0/2 101 9.19 94.0 107
SM2320BAlkalinity (as CaCO3) 0/2 95.5 0.71 95.0 96.0
† Number of batches qualified that exhibit poor laboratory control sample and blank spike recovery due to interferencecompared to the total number of batches containing laboratory control samples and blank spikes.
— Standard deviation cannot be determined.
Note: A value of 0 is reported as 0.0.

Quality Control SamplesQuality Control SamplesESH-EMS-2000408ESH-EMS-2000408 Page Page 9494 Fourth Quarter 2000Fourth Quarter 2000
Table 48.Table 48. Laboratory Control Sample Recoveries for WALaboratory Control Sample Recoveries for WA
AnalyteQualifiedOut of Range†
MeanRecovery (%)
StandardDeviation
MinimumRecovery (%)
MaximumRecovery (%)
EPA160.1Total dissolved solids 0/48 102 6.21 91.0 117
EPA310.1Alkalinity (as CaCO3) 0/38 99.1 3.44 94.0 108
EPA353.2Nitrate-nitrite as nitrogen 0/11 104 3.71 99.4 109
EPA6010BAluminum 0/5 101 1.30 99.5 102Antimony 0/15 99.0 1.24 97.2 102Arsenic 0/15 97.9 1.54 96.1 101Barium 0/15 97.7 0.95 96.8 99.9Beryllium 0/5 99.5 2.55 96.5 102Boron 0/15 101 1.47 99.7 103Cadmium 0/15 99.4 0.94 98.2 101Chromium 0/15 99.2 1.16 97.5 102Cobalt 0/4 99.0 0.71 98.4 99.8Copper 0/15 98.2 1.34 96.5 101Iron 0/5 98.6 0.69 97.6 99.5Lead 0/15 98.5 1.0 97.1 100Lithium 0/15 104 1.52 102 107Nickel 0/15 98.4 1.05 96.9 100Selenium 0/15 99.9 1.96 96.8 103Silver 0/15 99.5 1.44 96.7 102Thallium 0/6 101 2.19 98.7 105Tin 0/15 97.9 1.31 96.2 101Vanadium 0/4 100 1.18 99.4 102Zinc 0/15 99.9 1.12 98.0 102
EPA7470AMercury 0/14 103 4.65 90.3 109
EPA8081AAldrin 0/9 87.8 20.9 60.0 115p,p´-DDT 2/9 112 19.9 82.0 144Dieldrin 3/9 114 21.3 76.0 140Endrin 6/9 133 21.7 94.0 162Heptachlor 1/9 105 23.3 75.0 145Lindane 1/9 93.9 20.4 65.0 125
EPA8082PCB 1254 1/10 118 37.3 76.0 213
EPA8141Dimethoate 0/1 68.5 — 68.5 68.5Disulfoton 0/1 117 — 117 117Famphur 0/1 68.2 — 68.2 68.2Parathion 0/1 88.0 — 88.0 88.0Parathion methyl 0/1 86.5 — 86.5 86.5Phorate 0/1 98.5 — 98.5 98.5Sulfotepp 0/1 89.5 — 89.5 89.5Thionazin 0/1 94.5 — 94.5 94.5O,O,O-Triethyl
phosphorothioate0/1 98.5 — 98.5 98.5

Quality Control SamplesQuality Control SamplesESH-EMS-2000408ESH-EMS-2000408 Page Page 9595 Fourth Quarter 2000Fourth Quarter 2000
AnalyteQualifiedOut of Range†
MeanRecovery (%)
StandardDeviation
MinimumRecovery (%)
MaximumRecovery (%)
EPA8141ADimethoate 0/8 80.4 18.4 49.5 115Disulfoton 0/8 72.7 11.8 57.0 86.5Famphur 0/8 86.8 22.1 42.2 104Parathion 0/8 89.8 16.3 60.5 111Parathion methyl 0/8 87.7 14.8 59.0 102Phorate 0/8 85.4 18.7 58.0 112Sulfotepp 0/8 77.3 19.2 45.5 104Thionazin 0/8 90.1 16.4 61.0 116O,O,O-Triethyl
phosphorothioate0/8 86.5 15.7 63.5 111
EPA8151A2,4-Dichlorophenoxyacetic
acid2/8 103 33.1 27.4 131
2,4,5-T 4/8 125 25.5 78.0 1522,4,5-TP (Silvex) 1/8 98.0 11.0 74.8 111
EPA8260BBenzene 0/32 97.9 4.92 91.3 109Chlorobenzene 0/32 102 4.36 91.1 1091,1-Dichloroethylene 0/32 84.4 7.98 71.3 104Toluene 0/32 102 4.13 92.8 111Trichloroethylene 0/32 96.5 4.94 88.0 112
EPA8270CAcenaphthene 3/8 43.2 30.6 0.0 74.64-Chloro-m-cresol 3/8 41.0 29.6 0.0 73.62-Chlorophenol 3/8 38.5 27.6 0.0 72.81,4-Dichlorobenzene 3/8 34.1 24.7 0.0 64.62,4-Dinitrotoluene 3/8 44.7 32.9 0.0 77.44-Nitrophenol 2/8 37.2 33.5 0.0 78.3N-Nitrosodipropylamine 3/8 39.9 29.0 0.0 81.8Pentachlorophenol 3/8 35.6 33.4 0.0 81.9Phenol 2/8 35.8 28.5 0.0 72.3Pyrene 3/8 50.3 36.5 0.0 89.11,2,4-Trichlorobenzene 3/8 36.4 26.6 0.0 66.7
EPA8280AHexachlorodibenzo-p-dioxins 0/7 101 3.39 94.0 105Hexachlorodibenzo-p-furans 0/7 109 6.32 99.0 116Pentachlorodibenzo-p-furans 0/14 114 8.23 99.0 1262,3,7,8-TCDD 0/8 106 12.2 77.0 114Tetrachlorodibenzo-p-dioxins 0/7 110 3.85 102 114Tetrachlorodibenzo-p-furans 0/7 98.0 3.0 92.0 102
EPA9014Cyanide 0/46 99.9 5.69 82.0 114
EPA9020BTotal organic halogens 0/16 99.7 6.11 86.8 110
EPA9034Sulfide 0/16 98.9 2.94 89.9 102
EPA9050ASpecific conductance 0/6 97.7 2.21 93.6 100
EPA9056Sulfate 0/9 96.1 1.36 92.5 96.9

Quality Control SamplesQuality Control SamplesESH-EMS-2000408ESH-EMS-2000408 Page Page 9696 Fourth Quarter 2000Fourth Quarter 2000
AnalyteQualifiedOut of Range†
MeanRecovery (%)
StandardDeviation
MinimumRecovery (%)
MaximumRecovery (%)
EPA9060Total organic carbon 0/10 104 2.39 101 106
EPA9066Phenols 0/22 91.9 5.67 83.7 99.5
† Number of batches qualified that exhibit poor laboratory control sample and blank spike recovery due to interferencecompared to the total number of batches containing laboratory control samples and blank spikes.
— Standard deviation cannot be determined.
Note: A value of 0 is reported as 0.0.
Table 49.Table 49. Laboratory Control Sample Recoveries forLaboratory Control Sample Recoveries for GP GP
AnalyteQualifiedOut of Range†
MeanRecovery (%)
StandardDeviation
MinimumRecovery (%)
MaximumRecovery (%)
EPIA-001Gross alpha 1/26 101 12.0 80.0 125Nonvolatile beta 0/24 102 5.83 90.0 118
EPIA-002Tritium 0/23 100 3.96 90.0 106
EPIA-003Carbon-14 0/22 98.3 5.63 87.0 118
EPIA-004Strontium-89/90 0/6 97.2 8.52 90.0 113Strontium-90 0/14 101 9.01 88.0 116
EPIA-005Technetium-99 0/14 109 5.07 100 115
EPIA-006Iodine-129 0/12 98.9 7.68 85.0 109
EPIA-007Radon-222 0/2 82.5 0.71 82.0 83.0
EPIA-008Radium-226 0/18 98.0 10.2 85.0 114
EPIA-009Radium-228 3/21 88.0 8.34 76.0 102
EPIA-010Radium, total alpha-emitting 0/6 92.3 6.59 83.0 102
EPIA-011Americium-241 0/9 106 5.28 98.0 117Curium-243/244 0/11 99.1 7.70 86.0 112Plutonium-239/240 0/9 93.4 6.80 86.0 103Uranium-238 0/15 98.1 9.60 86.0 115
EPIA-012Thorium-232 0/16 96.4 5.29 83.0 103

Quality Control SamplesQuality Control SamplesESH-EMS-2000408ESH-EMS-2000408 Page Page 9797 Fourth Quarter 2000Fourth Quarter 2000
AnalyteQualifiedOut of Range†
MeanRecovery (%)
StandardDeviation
MinimumRecovery (%)
MaximumRecovery (%)
EPIA-013Cesium-137 0/13 92.2 4.27 83.0 99.0
EPIA-022Nickel-63 0/9 89.4 6.11 80.0 101
EPIA-032Neptunium-237 0/3 106 5.03 101 111
† Number of batches qualified that exhibit poor laboratory control sample and blank spike recovery due to interferencecompared to the total number of batches containing laboratory control samples and blank spikes.
Table 50.Table 50. Laboratory Control Sample RecoverieLaboratory Control Sample Recoveries for MLs for ML
AnalyteQualifiedOut of Range†
MeanRecovery (%)
StandardDeviation
MinimumRecovery (%)
MaximumRecovery (%)
EPA8260BBenzene 0/13 104 3.68 96.0 108Chlorobenzene 0/13 106 4.87 94.0 1121,1-Dichloroethylene 0/13 90.0 5.79 76.0 100Toluene 0/13 106 3.43 96.0 110Trichloroethylene 0/13 108 6.06 97.0 114
EPIA-001Gross alpha 2/5 84.4 6.07 77.0 91.0Nonvolatile beta 0/3 101 2.52 99.0 104
EPIA-002Tritium 0/6 100 4.24 96.0 106
† Number of batches qualified that exhibit poor laboratory control sample and blank spike recovery due to interferencecompared to the total number of batches containing laboratory control samples and blank spikes.
Table 51.Table 51. Laboratory Control Sample Recoveries for TMLaboratory Control Sample Recoveries for TM
AnalyteQualifiedOut of Range†
MeanRecovery (%)
StandardDeviation
MinimumRecovery (%)
MaximumRecovery (%)
ASTMD5174MUranium 0/1 106 — 106 106
EICHROMTC1MODTechnetium-99 0/1 109 — 109 109
EMLSR02MODStrontium-90 3/19 89.9 9.56 73.3 108
EPA900.0MODGross alpha 0/68 105 4.47 93.8 115Nonvolatile beta 0/57 105 3.97 96.2 113
EPA901.1MODCesium-137 0/2 104 6.94 98.9 109Cobalt-60 0/2 97.8 5.08 94.2 101

Quality Control SamplesQuality Control SamplesESH-EMS-2000408ESH-EMS-2000408 Page Page 9898 Fourth Quarter 2000Fourth Quarter 2000
AnalyteQualifiedOut of Range†
MeanRecovery (%)
StandardDeviation
MinimumRecovery (%)
MaximumRecovery (%)
EPA902.0MODIodine-129 0/1 102 — 102 102
EPA903.0MODRadium, total alpha-emitting 0/41 99.2 8.08 83.3 119
EPA904.0MODRadium-228 0/13 94.3 9.52 80.5 112
EPA906.0MODTritium 1/70 98.8 10.0 81.7 120
† Number of batches qualified that exhibit poor laboratory control sample and blank spike recovery due to interferencecompared to the total number of batches containing laboratory control samples and blank spikes.
— Standard deviation cannot be determined.
Note: A value of 0 is reported as 0.0.
Table 52.Table 52. Surrogate Recoveries for EXSurrogate Recoveries for EX
AnalyteQualifiedOut of Range†
MeanRecovery (%)
StandardDeviation
MinimumRecovery (%)
MaximumRecovery (%)
EPA8021Bp-Bromofluorobenzene 43/105 104 15.2 73.0 134
EPA8081ADecachlorobiphenyl 0/3 91.0 18.2 80.0 112Tetrachloro-m-xylene 0/3 80.7 10.3 72.0 92.0
EPA8082Decachlorobiphenyl 0/3 110 2.52 107 112Tetrachloro-m-xylene 0/3 91.7 6.51 85.0 98.0
EPA8260Bp-Bromofluorobenzene 25/339 104 6.88 87.0 1341,2-Dichloroethane-d4 33/339 102 8.81 80.0 126Toluene-d8 10/339 101 4.91 87.0 115
EPA8270C2-Fluorobiphenyl 0/3 77.0 11.1 65.0 87.02-Fluorophenol 0/3 60.7 7.64 54.0 69.0Nitrobenzene-d5 0/3 73.0 11.3 60.0 80.0Phenol-d5 0/3 66.3 7.02 59.0 73.0p-Terphenyl-d14 0/3 92.3 8.50 86.0 1022,4,6-Tribromophenol (surr) 0/3 99.0 11.0 88.0 110
† Number of batches qualified that exhibit poor surrogate recovery due to interference compared to the total number ofbatches containing surrogates.

Quality Control SamplesQuality Control SamplesESH-EMS-2000408ESH-EMS-2000408 Page Page 9999 Fourth Quarter 2000Fourth Quarter 2000
Table 53.Table 53. Surrogate Recoveries Surrogate Recoveries for GEfor GE
AnalyteQualifiedOut of Range†
MeanRecovery (%)
StandardDeviation
MinimumRecovery (%)
MaximumRecovery (%)
EPA8082Decachlorobiphenyl 0/10 68.3 14.7 43.9 87.0Tetrachloro-m-xylene 0/10 59.7 5.61 49.6 67.0
EPA8260Bp-Bromofluorobenzene 11/107 102 9.48 87.6 127Dibromofluoromethane 10/107 99.7 10.5 82.0 126Toluene-d8 31/109 97.8 9.42 85.9 116
EPA8270C2-Fluorobiphenyl 0/19 81.4 6.94 65.5 91.02-Fluorophenol 5/17 34.1 23.7 0.0 63.7Nitrobenzene-d5 0/19 79.2 6.36 66.4 87.7Phenol-d5 5/17 23.5 17.2 0.0 50.2p-Terphenyl-d14 0/19 86.8 10.5 66.2 1092,4,6-Tribromophenol (surr) 5/17 58.1 40.5 0.0 97.9
† Number of batches qualified that exhibit poor surrogate recovery due to interference compared to the total number ofbatches containing surrogates.
Note: A value of 0 is reported as 0.0.
Table 54.Table 54. Surrogate Recoveries for WASurrogate Recoveries for WA
AnalyteQualifiedOut of Range†
MeanRecovery (%)
StandardDeviation
MinimumRecovery (%)
MaximumRecovery (%)
EPA8021BBromochloromethane 0/4 77.7 8.50 65.2 83.2
EPA8081ADecachlorobiphenyl 2/54 86.8 22.6 9.72 170Tetrachloro-m-xylene 2/56 78.0 26.7 2.79 132
EPA8082Decachlorobiphenyl 2/54 90.8 25.0 54.0 181Tetrachloro-m-xylene 1/53 82.6 24.7 3.50 145
EPA8141Triphenyl phosphate 0/7 97.2 8.49 79.5 105Tributyl phosphate 0/7 89.6 20.4 59.5 112
EPA8141ADecachlorobiphenyl 0/1 78.0 — 78.0 78.0Triphenyl phosphate 12/41 119 53.3 0.0 284Tributyl phosphate 16/41 128 54.2 0.0 286
EPA8151A2,4-Dichlorophenylacetic acid 8/50 76.9 31.4 4.15 124
EPA8260Bp-Bromofluorobenzene 50/376 90.9 5.53 74.0 1121,2-Dichloroethane-d4 50/376 99.9 12.1 72.0 124Toluene-d8 17/376 101 5.07 85.0 119

Quality Control SamplesQuality Control SamplesESH-EMS-2000408ESH-EMS-2000408 Page Page 100100 Fourth Quarter 2000Fourth Quarter 2000
AnalyteQualifiedOut of Range†
MeanRecovery (%)
StandardDeviation
MinimumRecovery (%)
MaximumRecovery (%)
EPA8270C2-Fluorobiphenyl 15/51 48.4 32.4 0.0 1382-Fluorophenol 12/51 37.2 25.7 0.0 84.0Nitrobenzene-d5 15/51 49.2 34.4 0.0 132Phenol-d5 8/51 32.1 23.0 0.0 76.9p-Terphenyl-d14 15/51 69.4 40.7 0.0 1662,4,6-Tribromophenol (surr) 7/51 45.8 25.9 0.0 85.3
EPA8280ACarbon 13-labeled 1,2,3,6,7,8-
HXCDD2/44 68.2 8.61 45.0 85.0
Carbon 13-labeled 2,3,7,8-TCDD
1/46 71.2 10.9 46.0 108
Carbon 13-labeled 2,3,7,8-TCDF
2/44 65.0 8.20 33.0 77.0
Carbon 13-labeled HPCDF 1/44 72.5 10.6 41.0 89.0
† Number of batches qualified that exhibit poor surrogate recovery due to interference compared to the total number ofbatches containing surrogates.
— Standard deviation cannot be determined.
Note: A value of 0 is reported as 0.0.
Table 55.Table 55. Surrogate Recoveries for MLSurrogate Recoveries for ML
AnalyteQualifiedOut of Range†
MeanRecovery (%)
StandardDeviation
MinimumRecovery (%)
MaximumRecovery (%)
EPA8260Bp-Bromofluorobenzene 87/89 82.6 1.78 78.4 88.1Dibromofluoromethane 0/89 105 6.15 89.5 115Toluene-d8 0/89 99.0 1.96 92.4 104
† Number of batches qualified that exhibit poor surrogate recovery due to interference compared to the total number ofbatches containing surrogates.
Table 56.Table 56. Matrix Spike Recoveries for EXMatrix Spike Recoveries for EX
AnalyteQualifiedOut of Range†
MeanRecovery (%)
StandardDeviation Bias (%)
MinimumRecovery (%)
MaximumRecovery (%)
EPA300.0Nitrate-nitrite as nitrogen 0/5 91.6 6.66 -8.40 85.0 100
EPA6010BAluminum 0/6 103 13.5 3.0 91.0 121Arsenic 0/8 96.1 10.5 -3.90 86.0 113Barium 0/4 93.8 7.23 -6.20 87.0 104Boron 0/4 106 11.0 6.0 95.0 116Cadmium 0/8 95.8 11.4 -4.20 85.0 114Chromium 0/4 92.8 5.91 -7.20 87.0 101Iron 0/4 107 9.07 7.0 98.0 116Lead 0/12 90.5 9.14 -9.50 81.0 109Manganese 0/4 99.3 14.8 -0.70 85.0 113Selenium 0/8 98.9 11.9 -1.10 88.0 118
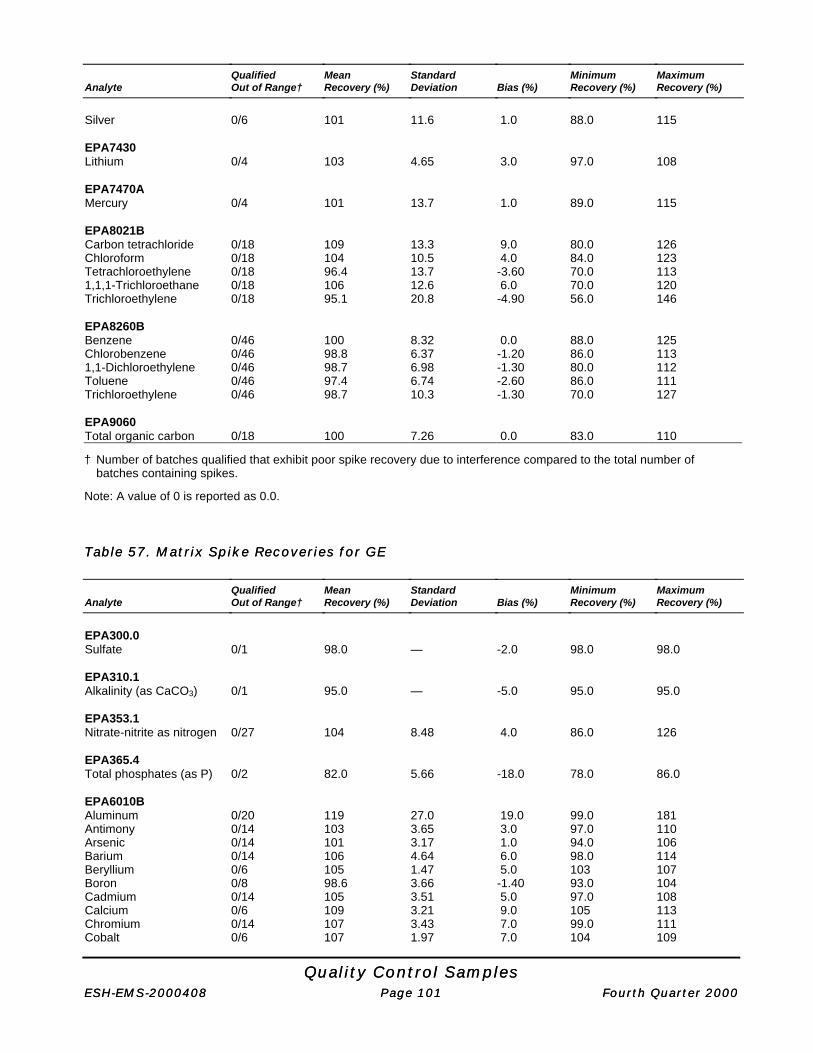
Quality Control SamplesQuality Control SamplesESH-EMS-2000408ESH-EMS-2000408 Page Page 101101 Fourth Quarter 2000Fourth Quarter 2000
AnalyteQualifiedOut of Range†
MeanRecovery (%)
StandardDeviation Bias (%)
MinimumRecovery (%)
MaximumRecovery (%)
Silver 0/6 101 11.6 1.0 88.0 115
EPA7430Lithium 0/4 103 4.65 3.0 97.0 108
EPA7470AMercury 0/4 101 13.7 1.0 89.0 115
EPA8021BCarbon tetrachloride 0/18 109 13.3 9.0 80.0 126Chloroform 0/18 104 10.5 4.0 84.0 123Tetrachloroethylene 0/18 96.4 13.7 -3.60 70.0 1131,1,1-Trichloroethane 0/18 106 12.6 6.0 70.0 120Trichloroethylene 0/18 95.1 20.8 -4.90 56.0 146
EPA8260BBenzene 0/46 100 8.32 0.0 88.0 125Chlorobenzene 0/46 98.8 6.37 -1.20 86.0 1131,1-Dichloroethylene 0/46 98.7 6.98 -1.30 80.0 112Toluene 0/46 97.4 6.74 -2.60 86.0 111Trichloroethylene 0/46 98.7 10.3 -1.30 70.0 127
EPA9060Total organic carbon 0/18 100 7.26 0.0 83.0 110
† Number of batches qualified that exhibit poor spike recovery due to interference compared to the total number ofbatches containing spikes.
Note: A value of 0 is reported as 0.0.
Table 57.Table 57. Matrix Spike Recoveries for GEMatrix Spike Recoveries for GE
AnalyteQualifiedOut of Range†
MeanRecovery (%)
StandardDeviation Bias (%)
MinimumRecovery (%)
MaximumRecovery (%)
EPA300.0Sulfate 0/1 98.0 — -2.0 98.0 98.0
EPA310.1Alkalinity (as CaCO3) 0/1 95.0 — -5.0 95.0 95.0
EPA353.1Nitrate-nitrite as nitrogen 0/27 104 8.48 4.0 86.0 126
EPA365.4Total phosphates (as P) 0/2 82.0 5.66 -18.0 78.0 86.0
EPA6010BAluminum 0/20 119 27.0 19.0 99.0 181Antimony 0/14 103 3.65 3.0 97.0 110Arsenic 0/14 101 3.17 1.0 94.0 106Barium 0/14 106 4.64 6.0 98.0 114Beryllium 0/6 105 1.47 5.0 103 107Boron 0/8 98.6 3.66 -1.40 93.0 104Cadmium 0/14 105 3.51 5.0 97.0 108Calcium 0/6 109 3.21 9.0 105 113Chromium 0/14 107 3.43 7.0 99.0 111Cobalt 0/6 107 1.97 7.0 104 109

Quality Control SamplesQuality Control SamplesESH-EMS-2000408ESH-EMS-2000408 Page Page 102102 Fourth Quarter 2000Fourth Quarter 2000
AnalyteQualifiedOut of Range†
MeanRecovery (%)
StandardDeviation Bias (%)
MinimumRecovery (%)
MaximumRecovery (%)
Copper 0/14 102 5.09 2.0 91.0 109Iron 0/6 110 5.75 10.0 106 121Lead 0/28 105 3.27 5.0 97.0 110Magnesium 0/6 108 3.19 8.0 104 113Manganese 0/6 107 2.80 7.0 103 110Nickel 0/14 107 3.59 7.0 98.0 110Potassium 0/6 103 2.34 3.0 100 106Selenium 0/14 98.9 2.93 -1.10 93.0 104Silver 0/14 99.1 2.97 -0.90 94.0 105Sodium 0/6 114 11.7 14.0 103 133Thallium 0/6 106 2.42 6.0 103 109Tin 0/8 103 5.26 3.0 94.0 109Uranium 0/9 105 3.93 5.0 100 111Vanadium 0/6 105 2.61 5.0 102 108Zinc 0/14 103 4.74 3.0 92.0 108
EPA6020Aluminum 0/12 108 4.96 8.0 101 117Antimony 0/12 129 14.0 29.0 105 152Arsenic 0/12 89.3 9.04 -10.7 73.0 102Barium 0/12 99.4 10.2 -0.60 89.0 115Beryllium 0/44 114 7.36 14.0 96.0 128Cadmium 0/35 101 5.36 1.0 88.0 115Chromium 0/12 104 6.28 4.0 94.0 113Cobalt 0/12 99.5 4.10 -0.50 94.0 108Copper 0/12 96.7 6.97 -3.30 85.0 110Iron 0/12 434 764 334 99.0 2,080Lead 0/14 90.0 6.45 -10.0 82.0 100Lithium 0/14 113 12.8 13.0 86.0 133Nickel 0/12 96.3 3.55 -3.70 93.0 104Selenium 0/12 82.3 8.12 -17.7 67.0 92.0Silver 0/12 105 7.08 5.0 90.0 110Thallium 0/34 57.1 15.8 -42.9 -2.0 83.0Tin 0/12 119 11.5 19.0 109 142Vanadium 0/12 102 8.0 2.0 86.0 109Zinc 0/12 84.5 21.8 -15.5 39.0 102
EPA7470AMercury 0/40 103 10.5 3.0 75.0 132
EPA8082PCB 1260 0/2 60.5 0.71 -39.5 60.0 61.0
EPA8260BBenzene 0/14 96.6 7.35 -3.40 82.0 110Chlorobenzene 0/14 92.4 9.43 -7.60 67.0 1051,1-Dichloroethylene 0/14 95.6 9.70 -4.40 84.0 112Toluene 0/15 86.5 12.1 -13.5 63.0 101Trichloroethylene 0/14 86.1 20.6 -13.9 30.0 110
EPA9012ACyanide 0/9 81.8 32.6 -18.2 39.0 155
EPA9020BTotal organic halogens 0/4 103 5.23 3.0 99.0 110
EPA9056Chloride 0/1 90.0 — -10.0 90.0 90.0Fluoride 0/1 101 — 1.0 101 101Sulfate 0/2 100 4.24 0.0 97.0 103

Quality Control SamplesQuality Control SamplesESH-EMS-2000408ESH-EMS-2000408 Page Page 103103 Fourth Quarter 2000Fourth Quarter 2000
AnalyteQualifiedOut of Range†
MeanRecovery (%)
StandardDeviation Bias (%)
MinimumRecovery (%)
MaximumRecovery (%)
EPA9060Total organic carbon 0/6 101 5.39 1.0 96.0 111
EPA9066Phenols 0/4 98.5 10.4 -1.50 87.0 110
† Number of batches qualified that exhibit poor spike recovery due to interference compared to the total number ofbatches containing spikes.
— Standard deviation cannot be determined.
Note: A value of 0 is reported as 0.0.
Table 58.Table 58. Matrix Spike Recoveries for WAMatrix Spike Recoveries for WA
AnalyteQualifiedOut of Range†
MeanRecovery (%)
StandardDeviation Bias (%)
MinimumRecovery (%)
MaximumRecovery (%)
EPA353.2Nitrate-nitrite as nitrogen 0/16 97.0 7.07 -3.0 84.0 110
EPA6010BAluminum 0/4 103 4.38 3.0 99.6 109Antimony 0/17 101 1.56 1.0 97.7 103Arsenic 0/17 101 1.95 1.0 96.4 104Barium 0/17 99.1 1.83 -0.90 95.7 103Beryllium 0/4 101 3.32 1.0 97.0 105Boron 0/17 100 1.50 0.0 97.9 104Cadmium 0/17 101 1.90 1.0 98.8 105Chromium 0/17 100 1.63 0.0 97.7 103Cobalt 0/3 99.1 1.21 -0.90 97.7 100Copper 0/17 98.2 1.76 -1.80 94.0 102Iron 0/4 102 5.51 2.0 98.1 110Lead 0/17 101 1.63 1.0 98.5 104Lithium 0/17 107 5.89 7.0 100 127Nickel 0/17 98.8 1.50 -1.20 96.1 101Selenium 0/17 101 2.0 1.0 97.3 105Silver 0/17 99.3 1.94 -0.70 95.2 103Thallium 0/4 101 2.52 1.0 98.6 104Tin 0/17 100 1.33 0.0 98.2 103Vanadium 0/3 100 0.64 0.0 99.8 101Zinc 0/17 99.4 1.35 -0.60 96.6 102
EPA7470AMercury 0/17 93.5 8.01 -6.50 79.8 116
EPA8021BCarbon tetrachloride 0/1 67.3 — -32.7 67.3 67.3Chloroform 0/1 78.1 — -21.9 78.1 78.1Tetrachloroethylene 0/1 54.4 — -45.6 54.4 54.41,1,1-Trichloroethane 0/1 70.8 — -29.2 70.8 70.8Trichloroethylene 0/1 71.7 — -28.3 71.7 71.7
EPA8081AAldrin 0/9 88.9 21.3 -11.1 45.0 110p,p´-DDT 0/9 110 23.0 10.0 58.0 130Dieldrin 0/9 111 24.9 11.0 56.0 138Endrin 0/9 131 29.1 31.0 66.0 156Heptachlor 0/9 101 25.8 1.0 45.0 125
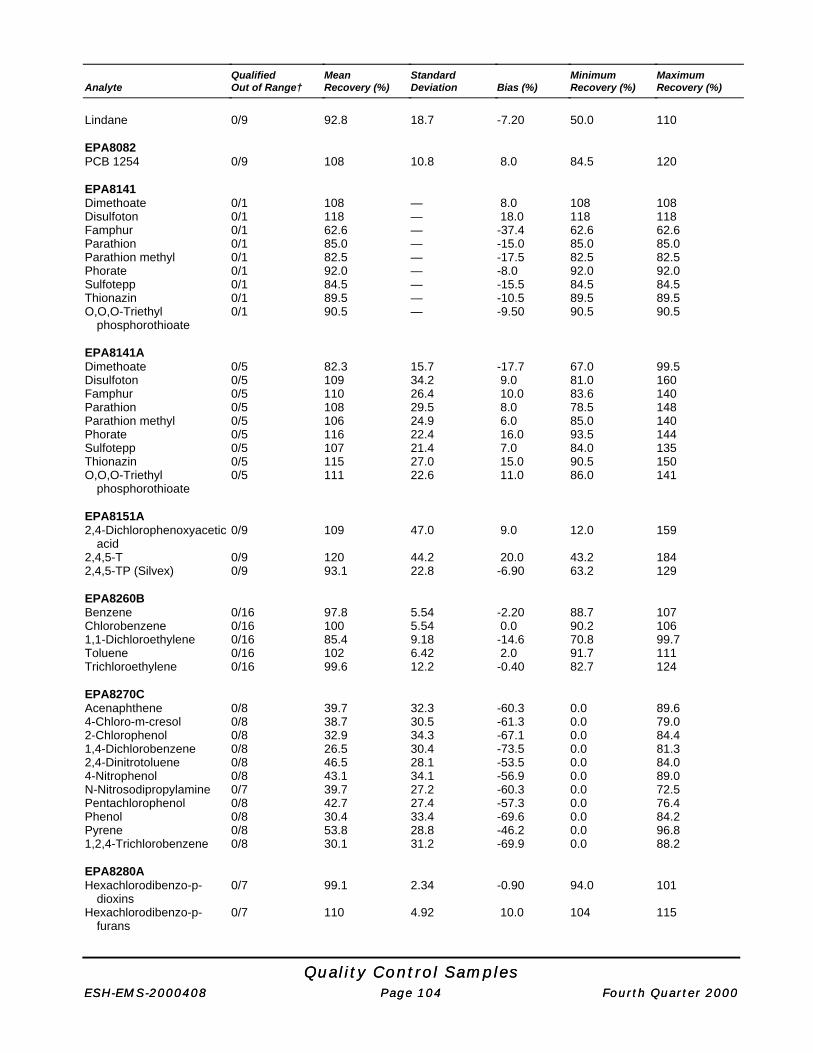
Quality Control SamplesQuality Control SamplesESH-EMS-2000408ESH-EMS-2000408 Page Page 104104 Fourth Quarter 2000Fourth Quarter 2000
AnalyteQualifiedOut of Range†
MeanRecovery (%)
StandardDeviation Bias (%)
MinimumRecovery (%)
MaximumRecovery (%)
Lindane 0/9 92.8 18.7 -7.20 50.0 110
EPA8082PCB 1254 0/9 108 10.8 8.0 84.5 120
EPA8141Dimethoate 0/1 108 — 8.0 108 108Disulfoton 0/1 118 — 18.0 118 118Famphur 0/1 62.6 — -37.4 62.6 62.6Parathion 0/1 85.0 — -15.0 85.0 85.0Parathion methyl 0/1 82.5 — -17.5 82.5 82.5Phorate 0/1 92.0 — -8.0 92.0 92.0Sulfotepp 0/1 84.5 — -15.5 84.5 84.5Thionazin 0/1 89.5 — -10.5 89.5 89.5O,O,O-Triethyl
phosphorothioate0/1 90.5 — -9.50 90.5 90.5
EPA8141ADimethoate 0/5 82.3 15.7 -17.7 67.0 99.5Disulfoton 0/5 109 34.2 9.0 81.0 160Famphur 0/5 110 26.4 10.0 83.6 140Parathion 0/5 108 29.5 8.0 78.5 148Parathion methyl 0/5 106 24.9 6.0 85.0 140Phorate 0/5 116 22.4 16.0 93.5 144Sulfotepp 0/5 107 21.4 7.0 84.0 135Thionazin 0/5 115 27.0 15.0 90.5 150O,O,O-Triethyl
phosphorothioate0/5 111 22.6 11.0 86.0 141
EPA8151A2,4-Dichlorophenoxyacetic
acid0/9 109 47.0 9.0 12.0 159
2,4,5-T 0/9 120 44.2 20.0 43.2 1842,4,5-TP (Silvex) 0/9 93.1 22.8 -6.90 63.2 129
EPA8260BBenzene 0/16 97.8 5.54 -2.20 88.7 107Chlorobenzene 0/16 100 5.54 0.0 90.2 1061,1-Dichloroethylene 0/16 85.4 9.18 -14.6 70.8 99.7Toluene 0/16 102 6.42 2.0 91.7 111Trichloroethylene 0/16 99.6 12.2 -0.40 82.7 124
EPA8270CAcenaphthene 0/8 39.7 32.3 -60.3 0.0 89.64-Chloro-m-cresol 0/8 38.7 30.5 -61.3 0.0 79.02-Chlorophenol 0/8 32.9 34.3 -67.1 0.0 84.41,4-Dichlorobenzene 0/8 26.5 30.4 -73.5 0.0 81.32,4-Dinitrotoluene 0/8 46.5 28.1 -53.5 0.0 84.04-Nitrophenol 0/8 43.1 34.1 -56.9 0.0 89.0N-Nitrosodipropylamine 0/7 39.7 27.2 -60.3 0.0 72.5Pentachlorophenol 0/8 42.7 27.4 -57.3 0.0 76.4Phenol 0/8 30.4 33.4 -69.6 0.0 84.2Pyrene 0/8 53.8 28.8 -46.2 0.0 96.81,2,4-Trichlorobenzene 0/8 30.1 31.2 -69.9 0.0 88.2
EPA8280AHexachlorodibenzo-p-
dioxins0/7 99.1 2.34 -0.90 94.0 101
Hexachlorodibenzo-p-furans
0/7 110 4.92 10.0 104 115

Quality Control SamplesQuality Control SamplesESH-EMS-2000408ESH-EMS-2000408 Page Page 105105 Fourth Quarter 2000Fourth Quarter 2000
AnalyteQualifiedOut of Range†
MeanRecovery (%)
StandardDeviation Bias (%)
MinimumRecovery (%)
MaximumRecovery (%)
Pentachlorodibenzo-p-furans
0/14 115 9.15 15.0 97.0 126
2,3,7,8-TCDD 0/7 108 2.64 8.0 103 111Tetrachlorodibenzo-p-
dioxins0/7 108 2.64 8.0 103 111
Tetrachlorodibenzo-p-furans
0/7 96.0 2.45 -4.0 91.0 98.0
EPA9014Cyanide 0/15 98.2 9.35 -1.80 71.8 114
EPA9020BTotal organic halogens 0/13 83.3 20.7 -16.7 50.7 112
EPA9034Sulfide 0/4 93.7 4.69 -6.30 88.7 100
EPA9056Sulfate 0/14 99.5 3.76 -0.50 92.1 106
EPA9060Total organic carbon 0/16 106 7.50 6.0 88.2 117
EPA9066Phenols 0/13 93.1 3.55 -6.90 87.1 98.6
† Number of batches qualified that exhibit poor spike recovery due to interference compared to the total number ofbatches containing spikes.
— Standard deviation cannot be determined.
Note: A value of 0 is reported as 0.0.
Table 59.Table 59. Matrix Spike Recoveries for GPMatrix Spike Recoveries for GP
AnalyteQualifiedOut of Range†
MeanRecovery (%)
StandardDeviation Bias (%)
MinimumRecovery (%)
MaximumRecovery (%)
EPIA-001Gross alpha 0/30 18.5 319 -81.5 -1,620 121Nonvolatile beta 0/29 90.0 55.7 -10.0 -178 155
EPIA-002Tritium 0/21 2.0 346 -98.0 -1,220 403
EPIA-003Carbon-14 0/18 97.6 4.09 -2.40 88.0 105
EPIA-004Strontium-89/90 0/6 90.2 7.03 -9.80 82.0 99.0Strontium-90 0/32 95.9 14.5 -4.10 64.0 144
EPIA-005Technetium-99 0/13 106 5.53 6.0 95.0 113
EPIA-006Iodine-129 0/12 92.8 7.90 -7.20 78.0 104

Quality Control SamplesQuality Control SamplesESH-EMS-2000408ESH-EMS-2000408 Page Page 106106 Fourth Quarter 2000Fourth Quarter 2000
AnalyteQualifiedOut of Range†
MeanRecovery (%)
StandardDeviation Bias (%)
MinimumRecovery (%)
MaximumRecovery (%)
EPIA-007Radon-222 0/2 96.5 3.54 -3.50 94.0 99.0
EPIA-008Radium-226 0/23 99.1 12.2 -0.90 82.0 124
EPIA-009Radium-228 0/32 91.9 8.89 -8.10 82.0 113
EPIA-010Radium, total alpha-
emitting0/6 95.0 4.86 -5.0 88.0 100
EPIA-011Americium-241 0/11 103 9.08 3.0 84.0 119Curium-243/244 0/12 100 5.09 0.0 93.0 109Plutonium-239/240 0/11 91.8 7.81 -8.20 76.0 103Uranium-238 0/14 98.7 9.55 -1.30 85.0 116
EPIA-012Thorium-232 0/16 98.8 9.20 -1.20 85.0 118
EPIA-013Cesium-137 0/15 97.2 8.39 -2.80 78.0 107
EPIA-022Nickel-63 0/11 93.4 7.55 -6.60 83.0 105
EPIA-032Neptunium-237 0/6 110 1.60 10.0 108 112
† Number of batches qualified that exhibit poor spike recovery due to interference compared to the total number ofbatches containing spikes.
Note: A value of 0 is reported as 0.0.
Table 60.Table 60. Matrix Spike Recoveries for MLMatrix Spike Recoveries for ML
AnalyteQualifiedOut of Range†
MeanRecovery (%)
StandardDeviation Bias (%)
MinimumRecovery (%)
MaximumRecovery (%)
EPA8260BBenzene 0/10 104 2.06 4.0 101 107Chlorobenzene 0/10 104 2.58 4.0 101 1081,1-Dichloroethylene 0/10 97.2 4.98 -2.80 90.0 104Toluene 0/10 106 2.30 6.0 102 109Trichloroethylene 0/10 110 8.04 10.0 102 127
EPIA-001Gross alpha 0/8 80.9 11.4 -19.1 61.0 100Nonvolatile beta 0/4 96.3 1.71 -3.70 94.0 98.0
EPIA-002Tritium 0/14 99.9 3.41 -0.10 94.0 105
† Number of batches qualified that exhibit poor spike recovery due to interference compared to the total number ofbatches containing spikes.

Quality Control SamplesQuality Control SamplesESH-EMS-2000408ESH-EMS-2000408 Page Page 107107 Fourth Quarter 2000Fourth Quarter 2000
Table 61.Table 61. Analytes Detected in Method Blanks forAnalytes Detected in Method Blanks for EX EX
AnalyteFrequencyof Detection† Mean Result
StandardDeviation Minimum/Maximum Results
EPA300.0Nitrate-nitrite as nitrogen 0/7 100 0.0 100/100 µg/L
EPA6010BAluminum 3/12 168 59.8 42.5/200 µg/LAntimony 0/1 100 — 100/100 µg/LArsenic 1/15 9.60 1.55 3.98/10.0 µg/LBarium 1/6 8.45 3.81 0.67/10.0 µg/LBeryllium 0/1 1.0 — 1.0/1.0 µg/LBoron 0/11 100 0.0 100/100 µg/LCadmium 0/15 10.0 0.0 10.0/10.0 µg/LChromium 0/6 10.0 0.0 10.0/10.0 µg/LCopper 0/1 20.0 — 20.0/20.0 µg/LIron 7/12 92.0 95.8 6.46/200 µg/LLead 0/17 10.0 0.0 10.0/10.0 µg/LManganese 1/10 9.10 2.86 0.96/10.0 µg/LNickel 0/1 50.0 — 50.0/50.0 µg/LSelenium 0/15 10.0 0.0 10.0/10.0 µg/LSilver 0/8 20.0 0.0 20.0/20.0 µg/LThallium 0/1 10.0 — 10.0/10.0 µg/LZinc 0/1 20.0 — 20.0/20.0 µg/L
EPA7430Lithium 0/10 2.0 0.0 2.0/2.0 µg/L
EPA7470AMercury 0/8 0.50 0.0 0.50/0.50 µg/L
EPA8021BCarbon tetrachloride 0/8 1.0 0.0 1.0/1.0 µg/LChloroform 0/8 1.0 0.0 1.0/1.0 µg/LTetrachloroethylene 0/8 1.0 0.0 1.0/1.0 µg/L1,1,1-Trichloroethane 0/8 1.0 0.0 1.0/1.0 µg/LTrichloroethylene 0/8 1.0 0.0 1.0/1.0 µg/L
EPA8081AAldrin 0/1 0.10 — 0.10/0.10 µg/Lalpha-Benzene hexachloride 0/1 0.10 — 0.10/0.10 µg/Lbeta-Benzene hexachloride 0/1 0.10 — 0.10/0.10 µg/Ldelta-Benzene hexachloride 0/1 0.10 — 0.10/0.10 µg/Lalpha-Chlordane 0/1 0.10 — 0.10/0.10 µg/Lgamma-Chlordane 0/1 0.10 — 0.10/0.10 µg/Lp,p´-DDD 0/1 0.20 — 0.20/0.20 µg/Lp,p´-DDE 0/1 0.20 — 0.20/0.20 µg/Lp,p´-DDT 0/1 0.20 — 0.20/0.20 µg/LDieldrin 0/1 0.20 — 0.20/0.20 µg/LEndosulfan sulfate 0/1 0.20 — 0.20/0.20 µg/LEndosulfan I 0/1 0.10 — 0.10/0.10 µg/LEndosulfan II 0/1 0.20 — 0.20/0.20 µg/LEndrin 0/1 0.20 — 0.20/0.20 µg/LEndrin aldehyde 0/1 0.20 — 0.20/0.20 µg/LHeptachlor 0/1 0.10 — 0.10/0.10 µg/LHeptachlor epoxide 0/1 0.10 — 0.10/0.10 µg/LLindane 0/1 0.10 — 0.10/0.10 µg/LToxaphene 0/1 2.0 — 2.0/2.0 µg/L
EPA8082PCB 1016 0/1 1.0 — 1.0/1.0 µg/LPCB 1221 0/1 1.0 — 1.0/1.0 µg/L

Quality Control SamplesQuality Control SamplesESH-EMS-2000408ESH-EMS-2000408 Page Page 108108 Fourth Quarter 2000Fourth Quarter 2000
AnalyteFrequencyof Detection† Mean Result
StandardDeviation Minimum/Maximum Results
PCB 1232 0/1 1.0 — 1.0/1.0 µg/LPCB 1242 0/1 2.0 — 2.0/2.0 µg/LPCB 1248 0/1 1.0 — 1.0/1.0 µg/LPCB 1254 0/1 1.0 — 1.0/1.0 µg/LPCB 1260 0/1 1.0 — 1.0/1.0 µg/L
EPA8260BAcetone 0/7 20.0 0.0 20.0/20.0 µg/LAcetonitrile 0/6 200 0.0 200/200 µg/LAcrolein 0/7 50.0 0.0 50.0/50.0 µg/LAcrylonitrile 0/7 10.0 0.0 10.0/10.0 µg/LAllyl chloride 0/6 5.0 0.0 5.0/5.0 µg/LBenzene 0/34 5.0 0.0 5.0/5.0 µg/LBromochloromethane 0/6 5.0 0.0 5.0/5.0 µg/LBromodichloromethane 0/34 5.0 0.0 5.0/5.0 µg/LBromoform 0/34 5.0 0.0 5.0/5.0 µg/LBromomethane 0/34 5.0 0.0 5.0/5.0 µg/LCarbon disulfide 0/7 5.0 0.0 5.0/5.0 µg/LCarbon tetrachloride 0/35 5.0 0.0 5.0/5.0 µg/LChlorobenzene 0/34 5.0 0.0 5.0/5.0 µg/LChloroethane 0/34 5.0 0.0 5.0/5.0 µg/LChloroethene 0/34 5.0 0.0 5.0/5.0 µg/L2-Chloroethyl vinyl ether 0/31 5.0 0.0 5.0/5.0 µg/LChloroform 0/35 5.0 0.0 5.0/5.0 µg/LChloromethane 0/34 5.0 0.0 5.0/5.0 µg/LChloroprene 0/6 20.0 0.0 20.0/20.0 µg/LDibromochloromethane 0/34 5.0 0.0 5.0/5.0 µg/L1,2-Dibromo-3-chloropropane 0/6 10.0 0.0 10.0/10.0 µg/L1,2-Dibromoethane 0/6 5.0 0.0 5.0/5.0 µg/LDibromomethane 0/6 5.0 0.0 5.0/5.0 µg/L1,2-Dichlorobenzene 0/7 5.0 0.0 5.0/5.0 µg/L1,3-Dichlorobenzene 0/7 5.0 0.0 5.0/5.0 µg/L1,4-Dichlorobenzene 0/7 5.0 0.0 5.0/5.0 µg/Ltrans-1,4-Dichloro-2-butene 0/6 20.0 0.0 20.0/20.0 µg/LDichlorodifluoromethane 0/6 5.0 0.0 5.0/5.0 µg/L1,1-Dichloroethane 0/34 5.0 0.0 5.0/5.0 µg/L1,2-Dichloroethane 0/34 5.0 0.0 5.0/5.0 µg/L1,1-Dichloroethylene 0/34 5.0 0.0 5.0/5.0 µg/L1,2-Dichloroethylene 0/1 5.0 — 5.0/5.0 µg/Lcis-1,2-Dichloroethylene 0/33 5.0 0.0 5.0/5.0 µg/Ltrans-1,2-Dichloroethylene 0/34 5.0 0.0 5.0/5.0 µg/LDichloromethane 3/34 9.27 2.39 1.60/10.0 µg/L1,2-Dichloropropane 0/34 5.0 0.0 5.0/5.0 µg/L1,3-Dichloropropane 0/6 5.0 0.0 5.0/5.0 µg/L2,2-Dichloropropane 0/6 5.0 0.0 5.0/5.0 µg/L1,1-Dichloropropene 0/6 5.0 0.0 5.0/5.0 µg/Lcis-1,3-Dichloropropene 0/34 5.0 0.0 5.0/5.0 µg/Ltrans-1,3-Dichloropropene 0/34 5.0 0.0 5.0/5.0 µg/L1,4-Dioxane 0/6 500 0.0 500/500 µg/LEthyl methacrylate 0/6 5.0 0.0 5.0/5.0 µg/LEthylbenzene 0/34 5.0 0.0 5.0/5.0 µg/L2-Hexanone 0/7 20.0 0.0 20.0/20.0 µg/LIodomethane 0/6 5.0 0.0 5.0/5.0 µg/LIsobutyl alcohol 0/6 500 0.0 500/500 µg/LMethacrylonitrile 0/6 200 0.0 200/200 µg/LMethyl ethyl ketone 0/7 20.0 0.0 20.0/20.0 µg/LMethyl isobutyl ketone 0/7 10.0 0.0 10.0/10.0 µg/LMethyl methacrylate 0/6 20.0 0.0 20.0/20.0 µg/LPentachloroethane 0/6 200 0.0 200/200 µg/LPropionitrile 0/6 200 0.0 200/200 µg/LStyrene 0/7 5.0 0.0 5.0/5.0 µg/L

Quality Control SamplesQuality Control SamplesESH-EMS-2000408ESH-EMS-2000408 Page Page 109109 Fourth Quarter 2000Fourth Quarter 2000
AnalyteFrequencyof Detection† Mean Result
StandardDeviation Minimum/Maximum Results
1,1,1,2-Tetrachloroethane 0/6 5.0 0.0 5.0/5.0 µg/L1,1,2,2-Tetrachloroethane 0/34 5.0 0.0 5.0/5.0 µg/LTetrachloroethylene 0/35 5.0 0.0 5.0/5.0 µg/LToluene 0/34 5.0 0.0 5.0/5.0 µg/L1,1,1-Trichloroethane 0/35 5.0 0.0 5.0/5.0 µg/L1,1,2-Trichloroethane 0/34 5.0 0.0 5.0/5.0 µg/LTrichloroethylene 0/35 5.0 0.0 5.0/5.0 µg/LTrichlorofluoromethane 0/33 5.0 0.0 5.0/5.0 µg/L1,2,3-Trichloropropane 0/6 5.0 0.0 5.0/5.0 µg/LVinyl acetate 0/7 5.0 0.0 5.0/5.0 µg/LXylenes 0/7 10.0 0.0 10.0/10.0 µg/L
EPA8270CAcenaphthene 0/1 10.0 — 10.0/10.0 µg/LAcenaphthylene 0/1 10.0 — 10.0/10.0 µg/LAnthracene 0/1 10.0 — 10.0/10.0 µg/LBenzidine 0/1 10.0 — 10.0/10.0 µg/LBenzo[a]anthracene 0/1 10.0 — 10.0/10.0 µg/LBenzo[b]fluoranthene 0/1 10.0 — 10.0/10.0 µg/LBenzo[k]fluoranthene 0/1 10.0 — 10.0/10.0 µg/LBenzo[g,h,i]perylene 0/1 10.0 — 10.0/10.0 µg/LBenzo[a]pyrene 0/1 10.0 — 10.0/10.0 µg/LBis(2-chloroethoxy) methane 0/1 10.0 — 10.0/10.0 µg/LBis(2-chloroethyl) ether 0/1 10.0 — 10.0/10.0 µg/LBis(2-chloroisopropyl) ether 0/1 10.0 — 10.0/10.0 µg/LBis(2-ethylhexyl) phthalate 0/1 10.0 — 10.0/10.0 µg/L4-Bromophenyl phenyl ether 0/1 10.0 — 10.0/10.0 µg/LButylbenzyl phthalate 0/1 10.0 — 10.0/10.0 µg/L4-Chloro-m-cresol 0/1 10.0 — 10.0/10.0 µg/L2-Chloronaphthalene 0/1 10.0 — 10.0/10.0 µg/L2-Chlorophenol 0/1 10.0 — 10.0/10.0 µg/L4-Chlorophenyl phenyl ether 0/1 10.0 — 10.0/10.0 µg/LChrysene 0/1 10.0 — 10.0/10.0 µg/LDibenz[a,h]anthracene 0/1 10.0 — 10.0/10.0 µg/LDi-n-butyl phthalate 0/1 10.0 — 10.0/10.0 µg/L3,3´-Dichlorobenzidine 0/1 10.0 — 10.0/10.0 µg/L2,4-Dichlorophenol 0/1 10.0 — 10.0/10.0 µg/LDiethyl phthalate 0/1 10.0 — 10.0/10.0 µg/L2,4-Dimethyl phenol 0/1 10.0 — 10.0/10.0 µg/LDimethyl phthalate 0/1 10.0 — 10.0/10.0 µg/L2,4-Dinitrophenol 0/1 25.0 — 25.0/25.0 µg/L2,4-Dinitrotoluene 0/1 10.0 — 10.0/10.0 µg/L2,6-Dinitrotoluene 0/1 10.0 — 10.0/10.0 µg/LDi-n-octyl phthalate 0/1 10.0 — 10.0/10.0 µg/L1,2-Diphenylhydrazine 0/1 10.0 — 10.0/10.0 µg/LFluoranthene 0/1 10.0 — 10.0/10.0 µg/LFluorene 0/1 10.0 — 10.0/10.0 µg/LHexachlorobenzene 0/1 10.0 — 10.0/10.0 µg/LHexachlorobutadiene 0/1 10.0 — 10.0/10.0 µg/LHexachlorocyclopentadiene 0/1 10.0 — 10.0/10.0 µg/LHexachloroethane 0/1 10.0 — 10.0/10.0 µg/LIndeno[1,2,3-c,d]pyrene 0/1 10.0 — 10.0/10.0 µg/LIsophorone 0/1 10.0 — 10.0/10.0 µg/L2-Methyl-4,6-dinitrophenol 0/1 25.0 — 25.0/25.0 µg/LNaphthalene 0/1 10.0 — 10.0/10.0 µg/LNitrobenzene 0/1 10.0 — 10.0/10.0 µg/L2-Nitrophenol 0/1 10.0 — 10.0/10.0 µg/L4-Nitrophenol 0/1 25.0 — 25.0/25.0 µg/LN-Nitrosodimethylamine 0/1 25.0 — 25.0/25.0 µg/LN-Nitrosodiphenylamine 0/1 10.0 — 10.0/10.0 µg/LN-Nitrosodipropylamine 0/1 10.0 — 10.0/10.0 µg/L

Quality Control SamplesQuality Control SamplesESH-EMS-2000408ESH-EMS-2000408 Page Page 110110 Fourth Quarter 2000Fourth Quarter 2000
AnalyteFrequencyof Detection† Mean Result
StandardDeviation Minimum/Maximum Results
Pentachlorophenol 0/1 25.0 — 25.0/25.0 µg/LPhenanthrene 0/1 10.0 — 10.0/10.0 µg/LPhenol 0/1 10.0 — 10.0/10.0 µg/LPyrene 0/1 10.0 — 10.0/10.0 µg/L1,2,4-Trichlorobenzene 0/1 10.0 — 10.0/10.0 µg/L2,4,6-Trichlorophenol 0/1 25.0 — 25.0/25.0 µg/L
EPA9014Cyanide 0/1 10.0 — 10.0/10.0 µg/L
EPA9060Total organic carbon 0/9 5,000 0.0 5,000/5,000 µg/L
† Number of times analyte was detected compared to the total number of method blanks for the analyte.— Standard deviation cannot be determined.
Note: If the analyte was not detected in the method blank(s), detection limit information appears in the Mean Result andMinimum/Maximum Results columns.
Table 62.Table 62. Analytes Detected in Method Blanks for GEAnalytes Detected in Method Blanks for GE
AnalyteFrequencyof Detection† Mean Result
StandardDeviation Minimum/Maximum Results
EPA160.1Total dissolved solids 0/8 10,000 0.0 10,000/10,000 µg/L
EPA300.0Sulfate 0/3 200 0.0 200/200 µg/L
EPA353.1Nitrate-nitrite as nitrogen 6/18 36.7 17.5 10.0/50.0 µg/L
EPA365.4Total phosphates (as P) 0/1 50.0 — 50.0/50.0 µg/L
EPA6010BAluminum 0/12 50.0 0.0 50.0/50.0 µg/LAntimony 0/10 10.0 0.0 10.0/10.0 µg/LArsenic 1/10 4.82 0.59 3.15/5.0 µg/LBarium 1/10 4.80 0.62 3.03/5.0 µg/LBeryllium 0/3 5.0 0.0 5.0/5.0 µg/LBoron 0/7 50.0 0.0 50.0/50.0 µg/LCadmium 0/10 5.0 0.0 5.0/5.0 µg/LCalcium 0/3 100 0.0 100/100 µg/LChromium 0/10 5.0 0.0 5.0/5.0 µg/LCobalt 0/3 5.0 0.0 5.0/5.0 µg/LCopper 0/10 5.0 0.0 5.0/5.0 µg/LIron 0/3 50.0 0.0 50.0/50.0 µg/LLead 1/19 4.93 0.29 3.72/5.0 µg/LMagnesium 1/3 14.6 9.31 3.88/20.0 µg/LManganese 0/3 10.0 0.0 10.0/10.0 µg/LNickel 0/10 5.0 0.0 5.0/5.0 µg/LPotassium 0/3 100 0.0 100/100 µg/LSelenium 1/10 4.77 0.72 2.74/5.0 µg/LSilver 3/10 3.74 2.04 0.49/5.0 µg/LSodium 0/3 100 0.0 100/100 µg/L
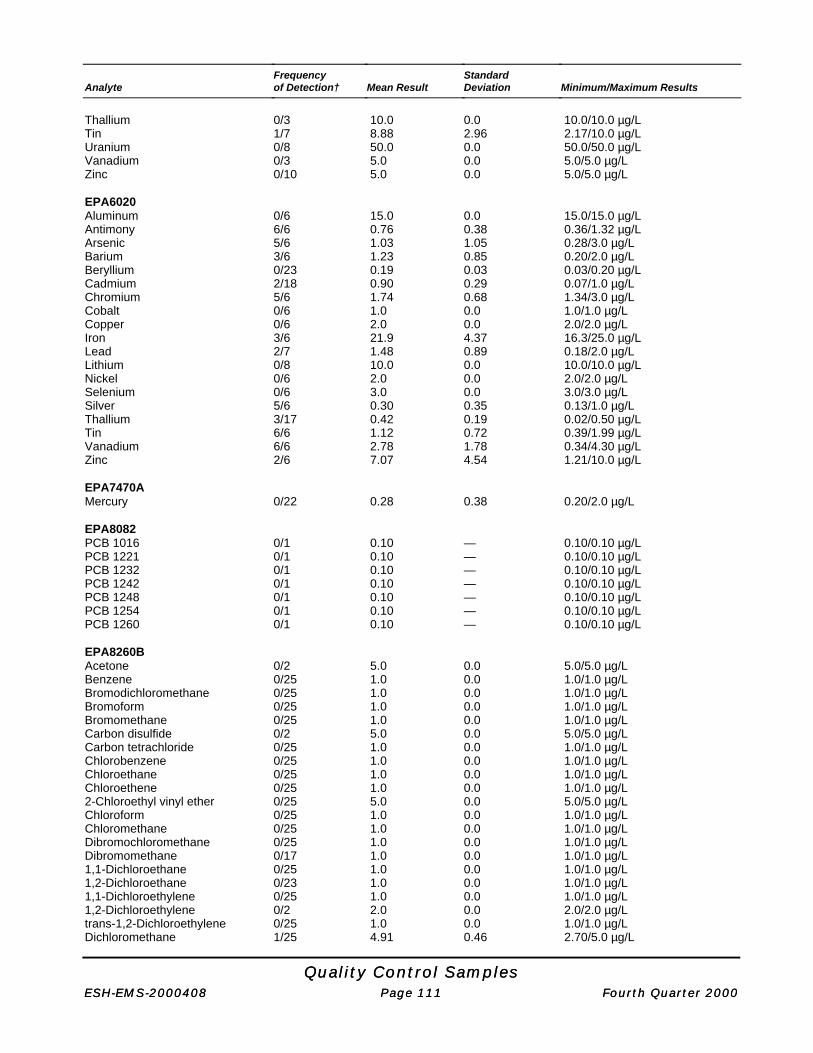
Quality Control SamplesQuality Control SamplesESH-EMS-2000408ESH-EMS-2000408 Page Page 111111 Fourth Quarter 2000Fourth Quarter 2000
AnalyteFrequencyof Detection† Mean Result
StandardDeviation Minimum/Maximum Results
Thallium 0/3 10.0 0.0 10.0/10.0 µg/LTin 1/7 8.88 2.96 2.17/10.0 µg/LUranium 0/8 50.0 0.0 50.0/50.0 µg/LVanadium 0/3 5.0 0.0 5.0/5.0 µg/LZinc 0/10 5.0 0.0 5.0/5.0 µg/L
EPA6020Aluminum 0/6 15.0 0.0 15.0/15.0 µg/LAntimony 6/6 0.76 0.38 0.36/1.32 µg/LArsenic 5/6 1.03 1.05 0.28/3.0 µg/LBarium 3/6 1.23 0.85 0.20/2.0 µg/LBeryllium 0/23 0.19 0.03 0.03/0.20 µg/LCadmium 2/18 0.90 0.29 0.07/1.0 µg/LChromium 5/6 1.74 0.68 1.34/3.0 µg/LCobalt 0/6 1.0 0.0 1.0/1.0 µg/LCopper 0/6 2.0 0.0 2.0/2.0 µg/LIron 3/6 21.9 4.37 16.3/25.0 µg/LLead 2/7 1.48 0.89 0.18/2.0 µg/LLithium 0/8 10.0 0.0 10.0/10.0 µg/LNickel 0/6 2.0 0.0 2.0/2.0 µg/LSelenium 0/6 3.0 0.0 3.0/3.0 µg/LSilver 5/6 0.30 0.35 0.13/1.0 µg/LThallium 3/17 0.42 0.19 0.02/0.50 µg/LTin 6/6 1.12 0.72 0.39/1.99 µg/LVanadium 6/6 2.78 1.78 0.34/4.30 µg/LZinc 2/6 7.07 4.54 1.21/10.0 µg/L
EPA7470AMercury 0/22 0.28 0.38 0.20/2.0 µg/L
EPA8082PCB 1016 0/1 0.10 — 0.10/0.10 µg/LPCB 1221 0/1 0.10 — 0.10/0.10 µg/LPCB 1232 0/1 0.10 — 0.10/0.10 µg/LPCB 1242 0/1 0.10 — 0.10/0.10 µg/LPCB 1248 0/1 0.10 — 0.10/0.10 µg/LPCB 1254 0/1 0.10 — 0.10/0.10 µg/LPCB 1260 0/1 0.10 — 0.10/0.10 µg/L
EPA8260BAcetone 0/2 5.0 0.0 5.0/5.0 µg/LBenzene 0/25 1.0 0.0 1.0/1.0 µg/LBromodichloromethane 0/25 1.0 0.0 1.0/1.0 µg/LBromoform 0/25 1.0 0.0 1.0/1.0 µg/LBromomethane 0/25 1.0 0.0 1.0/1.0 µg/LCarbon disulfide 0/2 5.0 0.0 5.0/5.0 µg/LCarbon tetrachloride 0/25 1.0 0.0 1.0/1.0 µg/LChlorobenzene 0/25 1.0 0.0 1.0/1.0 µg/LChloroethane 0/25 1.0 0.0 1.0/1.0 µg/LChloroethene 0/25 1.0 0.0 1.0/1.0 µg/L2-Chloroethyl vinyl ether 0/25 5.0 0.0 5.0/5.0 µg/LChloroform 0/25 1.0 0.0 1.0/1.0 µg/LChloromethane 0/25 1.0 0.0 1.0/1.0 µg/LDibromochloromethane 0/25 1.0 0.0 1.0/1.0 µg/LDibromomethane 0/17 1.0 0.0 1.0/1.0 µg/L1,1-Dichloroethane 0/25 1.0 0.0 1.0/1.0 µg/L1,2-Dichloroethane 0/23 1.0 0.0 1.0/1.0 µg/L1,1-Dichloroethylene 0/25 1.0 0.0 1.0/1.0 µg/L1,2-Dichloroethylene 0/2 2.0 0.0 2.0/2.0 µg/Ltrans-1,2-Dichloroethylene 0/25 1.0 0.0 1.0/1.0 µg/LDichloromethane 1/25 4.91 0.46 2.70/5.0 µg/L

Quality Control SamplesQuality Control SamplesESH-EMS-2000408ESH-EMS-2000408 Page Page 112112 Fourth Quarter 2000Fourth Quarter 2000
AnalyteFrequencyof Detection† Mean Result
StandardDeviation Minimum/Maximum Results
1,2-Dichloropropane 0/25 1.0 0.0 1.0/1.0 µg/Lcis-1,3-Dichloropropene 0/25 1.0 0.0 1.0/1.0 µg/Ltrans-1,3-Dichloropropene 0/25 1.0 0.0 1.0/1.0 µg/LEthylbenzene 0/25 1.0 0.0 1.0/1.0 µg/L2-Hexanone 0/2 5.0 0.0 5.0/5.0 µg/LMethyl ethyl ketone 0/2 5.0 0.0 5.0/5.0 µg/LMethyl isobutyl ketone 0/2 5.0 0.0 5.0/5.0 µg/LStyrene 0/2 1.0 0.0 1.0/1.0 µg/L1,1,2,2-Tetrachloroethane 0/25 1.0 0.0 1.0/1.0 µg/LTetrachloroethylene 0/25 1.0 0.0 1.0/1.0 µg/LToluene 0/25 1.0 0.0 1.0/1.0 µg/L1,1,1-Trichloroethane 0/25 1.0 0.0 1.0/1.0 µg/L1,1,2-Trichloroethane 0/25 1.0 0.0 1.0/1.0 µg/LTrichloroethylene 0/25 1.0 0.0 1.0/1.0 µg/LTrichlorofluoromethane 0/25 1.0 0.0 1.0/1.0 µg/LVinyl acetate 0/2 5.0 0.0 5.0/5.0 µg/LXylenes 0/17 3.0 0.0 3.0/3.0 µg/L
EPA8270CBis(2-ethylhexyl) phthalate 1/3 32.3 54.3 1.0/95.0 µg/L
EPA9012ACyanide 1/10 4.80 0.64 2.99/5.0 µg/L
EPA9020BTotal organic halogens 0/4 10.0 0.0 10.0/10.0 µg/L
EPA9056Chloride 0/1 100 — 100/100 µg/LFluoride 0/1 50.0 — 50.0/50.0 µg/LSulfate 0/2 200 0.0 200/200 µg/L
EPA9060Total organic carbon 4/5 102 74.5 40.9/200 µg/L
EPA9066Phenols 1/2 4.50 0.71 3.99/5.0 µg/L
† Number of times analyte was detected compared to the total number of method blanks for the analyte.— Standard deviation cannot be determined.
Note: If the analyte was not detected in the method blank(s), detection limit information appears in the Mean Result andMinimum/Maximum Results columns.
Table 63.Table 63. Analytes Detected in Method Blanks for WAAnalytes Detected in Method Blanks for WA
AnalyteFrequencyof Detection† Mean Result
StandardDeviation Minimum/Maximum Results
EPA160.1Total dissolved solids 10/25 32,500 21,900 5,000/50,000 µg/L
EPA310.1Alkalinity (as CaCO3) 2/20 6.23 1.49 0.96/6.70 meq/L
EPA353.2Nitrate-nitrite as nitrogen 1/11 18.8 3.92 7.0/20.0 µg/L

Quality Control SamplesQuality Control SamplesESH-EMS-2000408ESH-EMS-2000408 Page Page 113113 Fourth Quarter 2000Fourth Quarter 2000
AnalyteFrequencyof Detection† Mean Result
StandardDeviation Minimum/Maximum Results
EPA6010BAluminum 1/5 121 55.8 21.2/146 µg/LAntimony 0/15 27.0 0.0 27.0/27.0 µg/LArsenic 0/15 40.0 0.0 40.0/40.0 µg/LBarium 9/15 0.94 0.73 0.22/1.80 µg/LBeryllium 1/5 1.31 0.64 0.16/1.60 µg/LBoron 0/15 266 0.0 266/266 µg/LCadmium 0/15 4.70 0.0 4.70/4.70 µg/LChromium 1/15 6.60 1.55 1.0/7.0 µg/LCobalt 1/4 3.78 1.45 1.60/4.50 µg/LCopper 2/15 13.2 4.75 1.50/15.0 µg/LIron 0/5 74.0 0.0 74.0/74.0 µg/LLead 0/15 47.0 0.0 47.0/47.0 µg/LLithium 1/15 2.55 0.59 0.42/2.70 µg/LNickel 0/15 26.0 0.0 26.0/26.0 µg/LSelenium 0/15 66.0 0.0 66.0/66.0 µg/LSilver 3/15 4.12 1.81 0.51/5.0 µg/LThallium 0/6 55.0 0.0 55.0/55.0 µg/LTin 0/15 70.0 0.0 70.0/70.0 µg/LVanadium 1/4 5.50 2.80 1.30/6.90 µg/LZinc 0/15 53.0 0.0 53.0/53.0 µg/L
EPA7470AMercury 0/14 0.70 0.0 0.70/0.70 µg/L
EPA8081AAldrin 0/10 0.05 0.0 0.05/0.05 µg/Lalpha-Benzene hexachloride 0/10 0.05 0.0 0.05/0.05 µg/Lbeta-Benzene hexachloride 0/10 0.05 0.0 0.05/0.05 µg/Ldelta-Benzene hexachloride 0/10 0.05 0.0 0.05/0.05 µg/Lalpha-Chlordane 0/10 0.05 0.0 0.05/0.05 µg/Lgamma-Chlordane 0/10 0.05 0.0 0.05/0.05 µg/Lp,p´-DDD 0/10 0.10 0.0 0.10/0.10 µg/Lp,p´-DDE 0/10 0.10 0.0 0.10/0.10 µg/Lp,p´-DDT 0/10 0.10 0.0 0.10/0.10 µg/LDieldrin 0/10 0.10 0.0 0.10/0.10 µg/LEndosulfan sulfate 0/10 0.10 0.0 0.10/0.10 µg/LEndosulfan I 0/10 0.05 0.0 0.05/0.05 µg/LEndosulfan II 0/10 0.10 0.0 0.10/0.10 µg/LEndrin 0/10 0.10 0.0 0.10/0.10 µg/LEndrin aldehyde 0/10 0.10 0.0 0.10/0.10 µg/LHeptachlor 0/10 0.05 0.0 0.05/0.05 µg/LHeptachlor epoxide 0/10 0.05 0.0 0.05/0.05 µg/LIsodrin 0/10 0.10 0.0 0.10/0.10 µg/LKepone 0/10 0.50 0.0 0.50/0.50 µg/LLindane 0/10 0.05 0.0 0.05/0.05 µg/LMethoxychlor 0/10 0.50 0.0 0.50/0.50 µg/LToxaphene 0/10 5.0 0.0 5.0/5.0 µg/L
EPA8082PCB 1016 0/10 1.0 0.0 1.0/1.0 µg/LPCB 1221 0/10 2.0 0.0 2.0/2.0 µg/LPCB 1232 0/10 1.0 0.0 1.0/1.0 µg/LPCB 1242 1/10 1.72 2.29 1.0/8.23 µg/LPCB 1248 0/10 1.0 0.0 1.0/1.0 µg/LPCB 1254 0/10 1.0 0.0 1.0/1.0 µg/LPCB 1260 0/10 1.0 0.0 1.0/1.0 µg/L
EPA8141Dimethoate 0/1 0.50 — 0.50/0.50 µg/L

Quality Control SamplesQuality Control SamplesESH-EMS-2000408ESH-EMS-2000408 Page Page 114114 Fourth Quarter 2000Fourth Quarter 2000
AnalyteFrequencyof Detection† Mean Result
StandardDeviation Minimum/Maximum Results
Disulfoton 0/1 0.50 — 0.50/0.50 µg/LFamphur 0/1 1.20 — 1.20/1.20 µg/LParathion 0/1 0.50 — 0.50/0.50 µg/LParathion methyl 0/1 0.50 — 0.50/0.50 µg/LPhorate 0/1 0.50 — 0.50/0.50 µg/LSulfotepp 0/1 0.50 — 0.50/0.50 µg/LThionazin 0/1 0.50 — 0.50/0.50 µg/LO,O,O-Triethyl phosphorothioate 0/1 0.50 — 0.50/0.50 µg/L
EPA8141ADimethoate 1/8 0.46 0.11 0.18/0.50 µg/LDisulfoton 0/8 0.50 0.0 0.50/0.50 µg/LFamphur 0/8 1.20 0.0 1.20/1.20 µg/LParathion 0/8 0.50 0.0 0.50/0.50 µg/LParathion methyl 0/8 0.50 0.0 0.50/0.50 µg/LPhorate 0/8 0.50 0.0 0.50/0.50 µg/LSulfotepp 0/8 0.50 0.0 0.50/0.50 µg/LThionazin 0/8 0.50 0.0 0.50/0.50 µg/LO,O,O-Triethyl phosphorothioate 0/8 0.50 0.0 0.50/0.50 µg/L
EPA8151A2,4-Dichlorophenoxyacetic acid 0/8 1.0 0.0 1.0/1.0 µg/L2,4,5-T 0/8 0.50 0.0 0.50/0.50 µg/L2,4,5-TP (Silvex) 0/8 0.50 0.0 0.50/0.50 µg/L
EPA8260BAcetone 1/10 9.74 0.83 7.39/10.0 µg/LAcetonitrile 0/9 20.0 0.0 20.0/20.0 µg/LAcrolein 0/9 20.0 0.0 20.0/20.0 µg/LAcrylonitrile 0/9 5.0 0.0 5.0/5.0 µg/LAllyl chloride 0/9 10.0 0.0 10.0/10.0 µg/LBenzene 0/50 5.0 0.0 5.0/5.0 µg/LBromodichloromethane 0/50 5.0 0.0 5.0/5.0 µg/LBromoform 0/50 5.0 0.0 5.0/5.0 µg/LBromomethane 5/50 9.21 2.38 1.96/10.0 µg/LCarbon disulfide 0/10 5.0 0.0 5.0/5.0 µg/LCarbon tetrachloride 0/50 5.0 0.0 5.0/5.0 µg/LChlorobenzene 0/50 5.0 0.0 5.0/5.0 µg/LChloroethane 0/50 10.0 0.0 10.0/10.0 µg/LChloroethene 0/50 10.0 0.0 10.0/10.0 µg/L2-Chloroethyl vinyl ether 0/40 10.0 0.0 10.0/10.0 µg/LChloroform 0/50 5.0 0.0 5.0/5.0 µg/LChloromethane 0/50 10.0 0.0 10.0/10.0 µg/LChloroprene 0/9 5.0 0.0 5.0/5.0 µg/LDibromochloromethane 0/50 5.0 0.0 5.0/5.0 µg/L1,2-Dibromo-3-chloropropane 0/9 5.0 0.0 5.0/5.0 µg/L1,2-Dibromoethane 0/9 5.0 0.0 5.0/5.0 µg/LDibromomethane 0/9 5.0 0.0 5.0/5.0 µg/Ltrans-1,4-Dichloro-2-butene 0/9 20.0 0.0 20.0/20.0 µg/LDichlorodifluoromethane 0/9 10.0 0.0 10.0/10.0 µg/L1,1-Dichloroethane 0/50 5.0 0.0 5.0/5.0 µg/L1,2-Dichloroethane 0/50 5.0 0.0 5.0/5.0 µg/L1,1-Dichloroethylene 0/50 5.0 0.0 5.0/5.0 µg/L1,2-Dichloroethylene 0/2 5.0 0.0 5.0/5.0 µg/Lcis-1,2-Dichloroethylene 0/9 5.0 0.0 5.0/5.0 µg/Ltrans-1,2-Dichloroethylene 0/48 5.0 0.0 5.0/5.0 µg/LDichloromethane 42/50 7.61 3.44 4.11/20.9 µg/L1,2-Dichloropropane 0/50 5.0 0.0 5.0/5.0 µg/Lcis-1,3-Dichloropropene 0/50 5.0 0.0 5.0/5.0 µg/Ltrans-1,3-Dichloropropene 0/50 5.0 0.0 5.0/5.0 µg/LEthylbenzene 0/50 5.0 0.0 5.0/5.0 µg/L
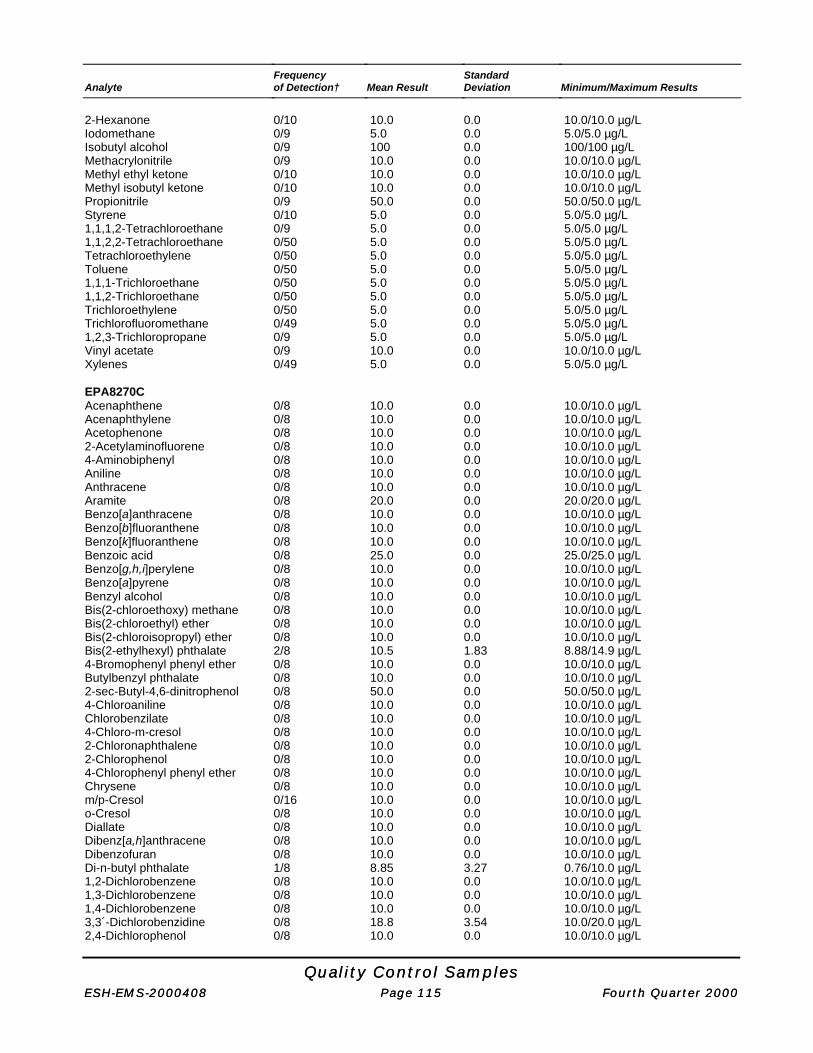
Quality Control SamplesQuality Control SamplesESH-EMS-2000408ESH-EMS-2000408 Page Page 115115 Fourth Quarter 2000Fourth Quarter 2000
AnalyteFrequencyof Detection† Mean Result
StandardDeviation Minimum/Maximum Results
2-Hexanone 0/10 10.0 0.0 10.0/10.0 µg/LIodomethane 0/9 5.0 0.0 5.0/5.0 µg/LIsobutyl alcohol 0/9 100 0.0 100/100 µg/LMethacrylonitrile 0/9 10.0 0.0 10.0/10.0 µg/LMethyl ethyl ketone 0/10 10.0 0.0 10.0/10.0 µg/LMethyl isobutyl ketone 0/10 10.0 0.0 10.0/10.0 µg/LPropionitrile 0/9 50.0 0.0 50.0/50.0 µg/LStyrene 0/10 5.0 0.0 5.0/5.0 µg/L1,1,1,2-Tetrachloroethane 0/9 5.0 0.0 5.0/5.0 µg/L1,1,2,2-Tetrachloroethane 0/50 5.0 0.0 5.0/5.0 µg/LTetrachloroethylene 0/50 5.0 0.0 5.0/5.0 µg/LToluene 0/50 5.0 0.0 5.0/5.0 µg/L1,1,1-Trichloroethane 0/50 5.0 0.0 5.0/5.0 µg/L1,1,2-Trichloroethane 0/50 5.0 0.0 5.0/5.0 µg/LTrichloroethylene 0/50 5.0 0.0 5.0/5.0 µg/LTrichlorofluoromethane 0/49 5.0 0.0 5.0/5.0 µg/L1,2,3-Trichloropropane 0/9 5.0 0.0 5.0/5.0 µg/LVinyl acetate 0/9 10.0 0.0 10.0/10.0 µg/LXylenes 0/49 5.0 0.0 5.0/5.0 µg/L
EPA8270CAcenaphthene 0/8 10.0 0.0 10.0/10.0 µg/LAcenaphthylene 0/8 10.0 0.0 10.0/10.0 µg/LAcetophenone 0/8 10.0 0.0 10.0/10.0 µg/L2-Acetylaminofluorene 0/8 10.0 0.0 10.0/10.0 µg/L4-Aminobiphenyl 0/8 10.0 0.0 10.0/10.0 µg/LAniline 0/8 10.0 0.0 10.0/10.0 µg/LAnthracene 0/8 10.0 0.0 10.0/10.0 µg/LAramite 0/8 20.0 0.0 20.0/20.0 µg/LBenzo[a]anthracene 0/8 10.0 0.0 10.0/10.0 µg/LBenzo[b]fluoranthene 0/8 10.0 0.0 10.0/10.0 µg/LBenzo[k]fluoranthene 0/8 10.0 0.0 10.0/10.0 µg/LBenzoic acid 0/8 25.0 0.0 25.0/25.0 µg/LBenzo[g,h,i]perylene 0/8 10.0 0.0 10.0/10.0 µg/LBenzo[a]pyrene 0/8 10.0 0.0 10.0/10.0 µg/LBenzyl alcohol 0/8 10.0 0.0 10.0/10.0 µg/LBis(2-chloroethoxy) methane 0/8 10.0 0.0 10.0/10.0 µg/LBis(2-chloroethyl) ether 0/8 10.0 0.0 10.0/10.0 µg/LBis(2-chloroisopropyl) ether 0/8 10.0 0.0 10.0/10.0 µg/LBis(2-ethylhexyl) phthalate 2/8 10.5 1.83 8.88/14.9 µg/L4-Bromophenyl phenyl ether 0/8 10.0 0.0 10.0/10.0 µg/LButylbenzyl phthalate 0/8 10.0 0.0 10.0/10.0 µg/L2-sec-Butyl-4,6-dinitrophenol 0/8 50.0 0.0 50.0/50.0 µg/L4-Chloroaniline 0/8 10.0 0.0 10.0/10.0 µg/LChlorobenzilate 0/8 10.0 0.0 10.0/10.0 µg/L4-Chloro-m-cresol 0/8 10.0 0.0 10.0/10.0 µg/L2-Chloronaphthalene 0/8 10.0 0.0 10.0/10.0 µg/L2-Chlorophenol 0/8 10.0 0.0 10.0/10.0 µg/L4-Chlorophenyl phenyl ether 0/8 10.0 0.0 10.0/10.0 µg/LChrysene 0/8 10.0 0.0 10.0/10.0 µg/Lm/p-Cresol 0/16 10.0 0.0 10.0/10.0 µg/Lo-Cresol 0/8 10.0 0.0 10.0/10.0 µg/LDiallate 0/8 10.0 0.0 10.0/10.0 µg/LDibenz[a,h]anthracene 0/8 10.0 0.0 10.0/10.0 µg/LDibenzofuran 0/8 10.0 0.0 10.0/10.0 µg/LDi-n-butyl phthalate 1/8 8.85 3.27 0.76/10.0 µg/L1,2-Dichlorobenzene 0/8 10.0 0.0 10.0/10.0 µg/L1,3-Dichlorobenzene 0/8 10.0 0.0 10.0/10.0 µg/L1,4-Dichlorobenzene 0/8 10.0 0.0 10.0/10.0 µg/L3,3´-Dichlorobenzidine 0/8 18.8 3.54 10.0/20.0 µg/L2,4-Dichlorophenol 0/8 10.0 0.0 10.0/10.0 µg/L
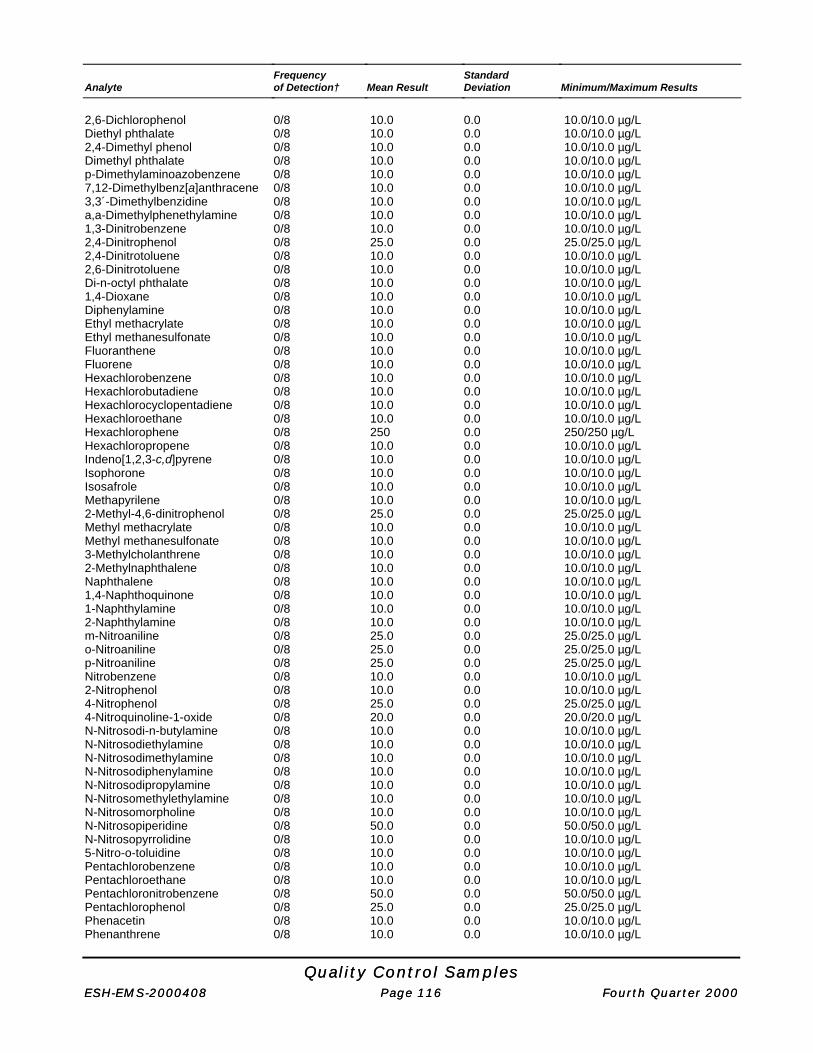
Quality Control SamplesQuality Control SamplesESH-EMS-2000408ESH-EMS-2000408 Page Page 116116 Fourth Quarter 2000Fourth Quarter 2000
AnalyteFrequencyof Detection† Mean Result
StandardDeviation Minimum/Maximum Results
2,6-Dichlorophenol 0/8 10.0 0.0 10.0/10.0 µg/LDiethyl phthalate 0/8 10.0 0.0 10.0/10.0 µg/L2,4-Dimethyl phenol 0/8 10.0 0.0 10.0/10.0 µg/LDimethyl phthalate 0/8 10.0 0.0 10.0/10.0 µg/Lp-Dimethylaminoazobenzene 0/8 10.0 0.0 10.0/10.0 µg/L7,12-Dimethylbenz[a]anthracene 0/8 10.0 0.0 10.0/10.0 µg/L3,3´-Dimethylbenzidine 0/8 10.0 0.0 10.0/10.0 µg/La,a-Dimethylphenethylamine 0/8 10.0 0.0 10.0/10.0 µg/L1,3-Dinitrobenzene 0/8 10.0 0.0 10.0/10.0 µg/L2,4-Dinitrophenol 0/8 25.0 0.0 25.0/25.0 µg/L2,4-Dinitrotoluene 0/8 10.0 0.0 10.0/10.0 µg/L2,6-Dinitrotoluene 0/8 10.0 0.0 10.0/10.0 µg/LDi-n-octyl phthalate 0/8 10.0 0.0 10.0/10.0 µg/L1,4-Dioxane 0/8 10.0 0.0 10.0/10.0 µg/LDiphenylamine 0/8 10.0 0.0 10.0/10.0 µg/LEthyl methacrylate 0/8 10.0 0.0 10.0/10.0 µg/LEthyl methanesulfonate 0/8 10.0 0.0 10.0/10.0 µg/LFluoranthene 0/8 10.0 0.0 10.0/10.0 µg/LFluorene 0/8 10.0 0.0 10.0/10.0 µg/LHexachlorobenzene 0/8 10.0 0.0 10.0/10.0 µg/LHexachlorobutadiene 0/8 10.0 0.0 10.0/10.0 µg/LHexachlorocyclopentadiene 0/8 10.0 0.0 10.0/10.0 µg/LHexachloroethane 0/8 10.0 0.0 10.0/10.0 µg/LHexachlorophene 0/8 250 0.0 250/250 µg/LHexachloropropene 0/8 10.0 0.0 10.0/10.0 µg/LIndeno[1,2,3-c,d]pyrene 0/8 10.0 0.0 10.0/10.0 µg/LIsophorone 0/8 10.0 0.0 10.0/10.0 µg/LIsosafrole 0/8 10.0 0.0 10.0/10.0 µg/LMethapyrilene 0/8 10.0 0.0 10.0/10.0 µg/L2-Methyl-4,6-dinitrophenol 0/8 25.0 0.0 25.0/25.0 µg/LMethyl methacrylate 0/8 10.0 0.0 10.0/10.0 µg/LMethyl methanesulfonate 0/8 10.0 0.0 10.0/10.0 µg/L3-Methylcholanthrene 0/8 10.0 0.0 10.0/10.0 µg/L2-Methylnaphthalene 0/8 10.0 0.0 10.0/10.0 µg/LNaphthalene 0/8 10.0 0.0 10.0/10.0 µg/L1,4-Naphthoquinone 0/8 10.0 0.0 10.0/10.0 µg/L1-Naphthylamine 0/8 10.0 0.0 10.0/10.0 µg/L2-Naphthylamine 0/8 10.0 0.0 10.0/10.0 µg/Lm-Nitroaniline 0/8 25.0 0.0 25.0/25.0 µg/Lo-Nitroaniline 0/8 25.0 0.0 25.0/25.0 µg/Lp-Nitroaniline 0/8 25.0 0.0 25.0/25.0 µg/LNitrobenzene 0/8 10.0 0.0 10.0/10.0 µg/L2-Nitrophenol 0/8 10.0 0.0 10.0/10.0 µg/L4-Nitrophenol 0/8 25.0 0.0 25.0/25.0 µg/L4-Nitroquinoline-1-oxide 0/8 20.0 0.0 20.0/20.0 µg/LN-Nitrosodi-n-butylamine 0/8 10.0 0.0 10.0/10.0 µg/LN-Nitrosodiethylamine 0/8 10.0 0.0 10.0/10.0 µg/LN-Nitrosodimethylamine 0/8 10.0 0.0 10.0/10.0 µg/LN-Nitrosodiphenylamine 0/8 10.0 0.0 10.0/10.0 µg/LN-Nitrosodipropylamine 0/8 10.0 0.0 10.0/10.0 µg/LN-Nitrosomethylethylamine 0/8 10.0 0.0 10.0/10.0 µg/LN-Nitrosomorpholine 0/8 10.0 0.0 10.0/10.0 µg/LN-Nitrosopiperidine 0/8 50.0 0.0 50.0/50.0 µg/LN-Nitrosopyrrolidine 0/8 10.0 0.0 10.0/10.0 µg/L5-Nitro-o-toluidine 0/8 10.0 0.0 10.0/10.0 µg/LPentachlorobenzene 0/8 10.0 0.0 10.0/10.0 µg/LPentachloroethane 0/8 10.0 0.0 10.0/10.0 µg/LPentachloronitrobenzene 0/8 50.0 0.0 50.0/50.0 µg/LPentachlorophenol 0/8 25.0 0.0 25.0/25.0 µg/LPhenacetin 0/8 10.0 0.0 10.0/10.0 µg/LPhenanthrene 0/8 10.0 0.0 10.0/10.0 µg/L

Quality Control SamplesQuality Control SamplesESH-EMS-2000408ESH-EMS-2000408 Page Page 117117 Fourth Quarter 2000Fourth Quarter 2000
AnalyteFrequencyof Detection† Mean Result
StandardDeviation Minimum/Maximum Results
Phenol 0/8 10.0 0.0 10.0/10.0 µg/Lp-Phenylenediamine 0/8 10.0 0.0 10.0/10.0 µg/L2-Picoline 0/8 10.0 0.0 10.0/10.0 µg/LPronamid 0/8 10.0 0.0 10.0/10.0 µg/LPyrene 0/8 10.0 0.0 10.0/10.0 µg/LPyridine 0/8 10.0 0.0 10.0/10.0 µg/LSafrole 0/8 10.0 0.0 10.0/10.0 µg/L1,2,4,5-Tetrachlorobenzene 0/8 10.0 0.0 10.0/10.0 µg/L2,3,4,6-Tetrachlorophenol 0/8 10.0 0.0 10.0/10.0 µg/Lo-Toluidine 0/8 10.0 0.0 10.0/10.0 µg/L1,2,4-Trichlorobenzene 0/8 10.0 0.0 10.0/10.0 µg/L2,4,5-Trichlorophenol 0/8 25.0 0.0 25.0/25.0 µg/L2,4,6-Trichlorophenol 0/8 10.0 0.0 10.0/10.0 µg/L1,3,5-Trinitrobenzene 0/8 10.0 0.0 10.0/10.0 µg/L
EPA8280AHexachlorodibenzo-p-dioxins 0/7 1.56 0.10 1.50/1.70 µg/LHexachlorodibenzo-p-furans 0/7 1.54 0.15 1.20/1.60 µg/LPentachlorodibenzo-p-furans 0/14 1.86 0.34 1.10/2.20 µg/L2,3,7,8-TCDD 0/8 1.24 0.11 1.20/1.50 µg/LTetrachlorodibenzo-p-dioxins 0/7 1.24 0.11 1.20/1.50 µg/LTetrachlorodibenzo-p-furans 0/7 1.11 0.04 1.10/1.20 µg/L
EPA9014Cyanide 0/23 15.2 0.0 15.2/15.2 µg/L
EPA9020BTotal organic halogens 0/16 120 0.0 120/120 µg/L
EPA9034Sulfide 0/8 10,000 0.0 10,000/10,000 µg/L
EPA9050ASpecific conductance 0/3 8.90 0.0 8.90/8.90 µS/cm
EPA9056Sulfate 1/9 321 57.3 168/340 µg/L
EPA9060Total organic carbon 0/10 1,000 0.0 1,000/1,000 µg/L
EPA9066Phenols 0/16 37.0 0.0 37.0/37.0 µg/L
† Number of times analyte was detected compared to the total number of method blanks for the analyte.— Standard deviation cannot be determined.
Note: If the analyte was not detected in the method blank(s), detection limit information appears in the Mean Result andMinimum/Maximum Results columns.
Table 64.Table 64. Analytes Detected in Method Blanks for GPAnalytes Detected in Method Blanks for GP
AnalyteFrequencyof Detection† Mean Result
StandardDeviation Minimum/Maximum Results
EPIA-001Gross alpha 2/26 2.01E-10 4.22E-10 -5.53E-10/1.65E-09 µCi/mL

Quality Control SamplesQuality Control SamplesESH-EMS-2000408ESH-EMS-2000408 Page Page 118118 Fourth Quarter 2000Fourth Quarter 2000
AnalyteFrequencyof Detection† Mean Result
StandardDeviation Minimum/Maximum Results
Nonvolatile beta 0/24 3.71E-10 5.16E-10 -5.00E-10/1.52E-09 µCi/mLEPIA-002Tritium 0/23 -5.98E-08 3.14E-07 -7.81E-07/4.23E-07 µCi/mL
EPIA-003Carbon-14 0/22 -4.34E-10 9.63E-09 -1.30E-08/3.55E-08 µCi/mL
EPIA-004Strontium-89/90 0/6 -3.56E-10 4.16E-10 -8.87E-10/3.46E-10 µCi/mLStrontium-90 1/14 1.08E-10 2.74E-10 -3.13E-10/7.04E-10 µCi/mL
EPIA-005Technetium-99 0/14 -2.03E-09 9.87E-09 -2.31E-08/1.82E-08 µCi/mL
EPIA-006Iodine-129 0/12 5.30E-11 3.52E-10 -5.08E-10/7.08E-10 µCi/mL
EPIA-007Radon-222 0/2 1.23E-08 4.88E-09 8.80E-09/1.57E-08 µCi/mL
EPIA-008Radium-226 0/18 2.15E-10 2.37E-10 -1.82E-10/7.48E-10 µCi/mL
EPIA-009Radium-228 0/21 3.32E-10 2.86E-10 -1.02E-10/8.31E-10 µCi/mL
EPIA-010Radium, total alpha-emitting 0/6 2.34E-10 5.09E-10 -2.10E-11/1.27E-09 µCi/mL
EPIA-011Americium-241 1/9 1.67E-10 1.72E-10 -2.26E-11/4.64E-10 µCi/mLCurium-242 0/11 7.20E-12 1.60E-11 -1.54E-11/3.47E-11 µCi/mLCurium-243/244 1/11 1.21E-10 1.20E-10 -2.26E-11/4.07E-10 µCi/mLCurium-245/246 1/11 1.35E-10 9.85E-11 0.0/3.17E-10 µCi/mLPlutonium-238 0/9 8.31E-11 1.76E-10 -8.95E-11/3.98E-10 µCi/mLPlutonium-239/240 0/9 1.46E-10 1.63E-10 -4.62E-12/4.43E-10 µCi/mLPlutonium-244 0/1 1.03E-10 — 1.03E-10/1.03E-10 µCi/mLUranium-233/234 0/15 7.08E-11 1.45E-10 -6.60E-11/3.70E-10 µCi/mLUranium-235 0/15 3.57E-11 1.07E-10 -5.87E-11/3.87E-10 µCi/mLUranium-238 0/15 -5.32E-11 2.00E-10 -7.60E-10/4.55E-11 µCi/mL
EPIA-012Thorium-228 0/16 1.06E-10 3.33E-10 -1.67E-10/1.25E-09 µCi/mLThorium-230 3/16 2.39E-10 3.14E-10 -1.87E-11/9.15E-10 µCi/mLThorium-232 0/16 1.20E-11 6.22E-11 -7.10E-11/2.07E-10 µCi/mL
EPIA-013Actinium-228 0/13 3.02E-09 2.90E-09 2.98E-11/9.61E-09 µCi/mLAntimony-125 0/13 -4.76E-10 1.35E-09 -2.69E-09/1.31E-09 µCi/mLBismuth-212 0/8 5.71E-09 7.53E-09 -6.91E-09/1.97E-08 µCi/mLBismuth-214 0/8 2.85E-09 1.81E-09 1.00E-09/6.08E-09 µCi/mLCerium-144 0/7 -4.64E-10 6.01E-09 -8.66E-09/7.20E-09 µCi/mLCesium-134 0/13 -4.65E-10 7.46E-10 -1.34E-09/1.41E-09 µCi/mLCesium-137 0/13 6.30E-10 6.34E-10 -1.38E-10/2.11E-09 µCi/mLCobalt-57 0/6 -5.71E-10 5.14E-10 -1.11E-09/1.13E-10 µCi/mLCobalt-60 0/13 5.37E-11 7.87E-10 -7.40E-10/2.41E-09 µCi/mLEuropium-152 0/13 1.09E-09 3.39E-09 -5.25E-09/8.74E-09 µCi/mL
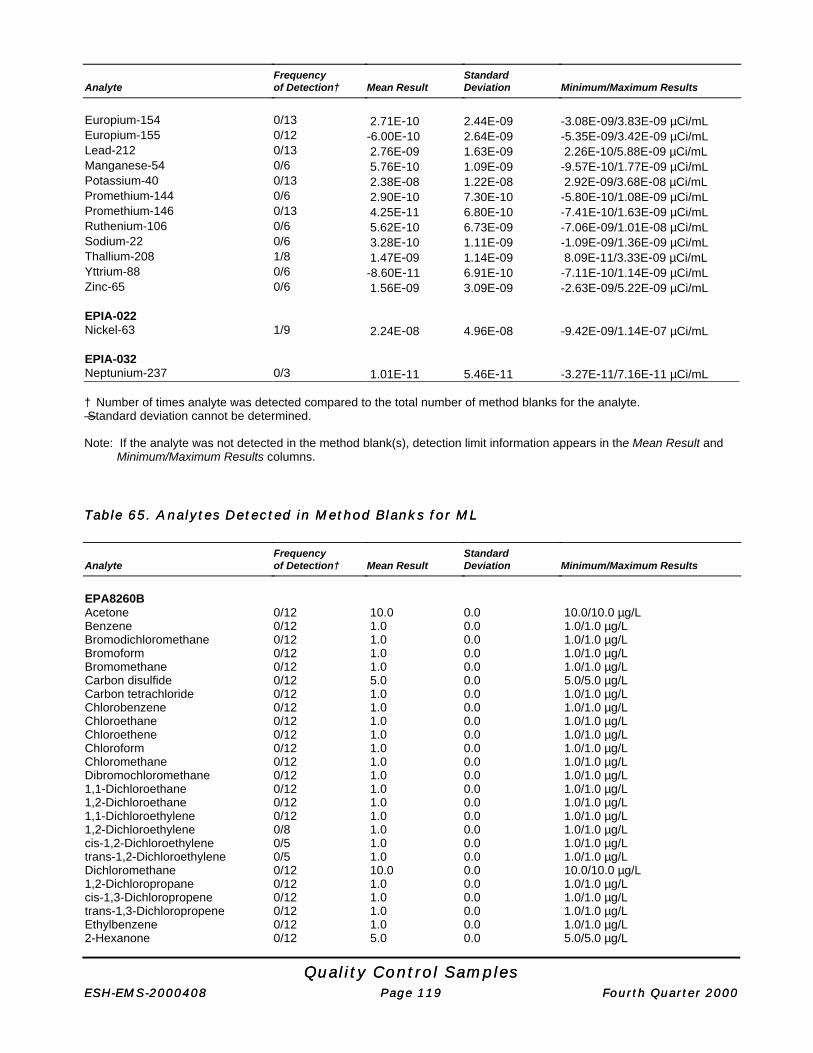
Quality Control SamplesQuality Control SamplesESH-EMS-2000408ESH-EMS-2000408 Page Page 119119 Fourth Quarter 2000Fourth Quarter 2000
AnalyteFrequencyof Detection† Mean Result
StandardDeviation Minimum/Maximum Results
Europium-154 0/13 2.71E-10 2.44E-09 -3.08E-09/3.83E-09 µCi/mLEuropium-155 0/12 -6.00E-10 2.64E-09 -5.35E-09/3.42E-09 µCi/mLLead-212 0/13 2.76E-09 1.63E-09 2.26E-10/5.88E-09 µCi/mLManganese-54 0/6 5.76E-10 1.09E-09 -9.57E-10/1.77E-09 µCi/mLPotassium-40 0/13 2.38E-08 1.22E-08 2.92E-09/3.68E-08 µCi/mLPromethium-144 0/6 2.90E-10 7.30E-10 -5.80E-10/1.08E-09 µCi/mLPromethium-146 0/13 4.25E-11 6.80E-10 -7.41E-10/1.63E-09 µCi/mLRuthenium-106 0/6 5.62E-10 6.73E-09 -7.06E-09/1.01E-08 µCi/mLSodium-22 0/6 3.28E-10 1.11E-09 -1.09E-09/1.36E-09 µCi/mLThallium-208 1/8 1.47E-09 1.14E-09 8.09E-11/3.33E-09 µCi/mLYttrium-88 0/6 -8.60E-11 6.91E-10 -7.11E-10/1.14E-09 µCi/mLZinc-65 0/6 1.56E-09 3.09E-09 -2.63E-09/5.22E-09 µCi/mL
EPIA-022Nickel-63 1/9 2.24E-08 4.96E-08 -9.42E-09/1.14E-07 µCi/mL
EPIA-032Neptunium-237 0/3 1.01E-11 5.46E-11 -3.27E-11/7.16E-11 µCi/mL
† Number of times analyte was detected compared to the total number of method blanks for the analyte.— Standard deviation cannot be determined.
Note: If the analyte was not detected in the method blank(s), detection limit information appears in the Mean Result andMinimum/Maximum Results columns.
Table 65.Table 65. Analytes Detected in Method Blanks for MLAnalytes Detected in Method Blanks for ML
AnalyteFrequencyof Detection† Mean Result
StandardDeviation Minimum/Maximum Results
EPA8260BAcetone 0/12 10.0 0.0 10.0/10.0 µg/LBenzene 0/12 1.0 0.0 1.0/1.0 µg/LBromodichloromethane 0/12 1.0 0.0 1.0/1.0 µg/LBromoform 0/12 1.0 0.0 1.0/1.0 µg/LBromomethane 0/12 1.0 0.0 1.0/1.0 µg/LCarbon disulfide 0/12 5.0 0.0 5.0/5.0 µg/LCarbon tetrachloride 0/12 1.0 0.0 1.0/1.0 µg/LChlorobenzene 0/12 1.0 0.0 1.0/1.0 µg/LChloroethane 0/12 1.0 0.0 1.0/1.0 µg/LChloroethene 0/12 1.0 0.0 1.0/1.0 µg/LChloroform 0/12 1.0 0.0 1.0/1.0 µg/LChloromethane 0/12 1.0 0.0 1.0/1.0 µg/LDibromochloromethane 0/12 1.0 0.0 1.0/1.0 µg/L1,1-Dichloroethane 0/12 1.0 0.0 1.0/1.0 µg/L1,2-Dichloroethane 0/12 1.0 0.0 1.0/1.0 µg/L1,1-Dichloroethylene 0/12 1.0 0.0 1.0/1.0 µg/L1,2-Dichloroethylene 0/8 1.0 0.0 1.0/1.0 µg/Lcis-1,2-Dichloroethylene 0/5 1.0 0.0 1.0/1.0 µg/Ltrans-1,2-Dichloroethylene 0/5 1.0 0.0 1.0/1.0 µg/LDichloromethane 0/12 10.0 0.0 10.0/10.0 µg/L1,2-Dichloropropane 0/12 1.0 0.0 1.0/1.0 µg/Lcis-1,3-Dichloropropene 0/12 1.0 0.0 1.0/1.0 µg/Ltrans-1,3-Dichloropropene 0/12 1.0 0.0 1.0/1.0 µg/LEthylbenzene 0/12 1.0 0.0 1.0/1.0 µg/L2-Hexanone 0/12 5.0 0.0 5.0/5.0 µg/L

Quality Control SamplesQuality Control SamplesESH-EMS-2000408ESH-EMS-2000408 Page Page 120120 Fourth Quarter 2000Fourth Quarter 2000
AnalyteFrequencyof Detection† Mean Result
StandardDeviation Minimum/Maximum Results
Methyl ethyl ketone 0/12 5.0 0.0 5.0/5.0 µg/LMethyl isobutyl ketone 0/12 5.0 0.0 5.0/5.0 µg/LStyrene 0/12 1.0 0.0 1.0/1.0 µg/L1,1,2,2-Tetrachloroethane 0/12 1.0 0.0 1.0/1.0 µg/LTetrachloroethylene 0/12 1.0 0.0 1.0/1.0 µg/LToluene 0/12 1.0 0.0 1.0/1.0 µg/L1,1,1-Trichloroethane 0/12 1.0 0.0 1.0/1.0 µg/L1,1,2-Trichloroethane 0/12 1.0 0.0 1.0/1.0 µg/LTrichloroethylene 0/12 1.0 0.0 1.0/1.0 µg/LVinyl acetate 0/12 5.0 0.0 5.0/5.0 µg/LXylenes 0/12 1.0 0.0 1.0/1.0 µg/L
EPIA-001Gross alpha 0/5 8.25E-10 2.24E-09 -1.33E-09/4.47E-09 µCi/mLNonvolatile beta 0/3 1.61E-09 6.96E-10 8.33E-10/2.18E-09 µCi/mL
EPIA-002Tritium 0/6 3.26E-08 2.31E-07 -1.85E-07/4.37E-07 µCi/mL
† Number of times analyte was detected compared to the total number of method blanks for the analyte.
Note: If the analyte was not detected in the method blank(s), detection limit information appears in the Mean Result andMinimum/Maximum Results columns.
Table 66.Table 66. Analytes Detected in Method Blanks for TMAnalytes Detected in Method Blanks for TM
AnalyteFrequencyof Detection† Mean Result
StandardDeviation Minimum/Maximum Results
ASTMD5174MUranium 0/1 0.30 — 0.30/0.30 µg/L
EICHROMTC1MODTechnetium-99 0/1 3.11E-09 — 3.11E-09/3.11E-09 µCi/mL
EMLSR02MODStrontium-90 0/19 -4.42E-11 4.69E-10 -7.30E-10/9.90E-10 µCi/mL
EPA900.0MODGross alpha 0/68 2.65E-12 1.46E-10 -3.40E-10/2.90E-10 µCi/mLNonvolatile beta 3/57 5.74E-11 6.16E-10 -5.10E-10/3.90E-09 µCi/mL
EPA901.1MODCesium-137 0/2 4.76E-09 2.04E-09 3.31E-09/6.20E-09 µCi/mLCobalt-60 0/2 -1.61E-09 2.22E-09 -3.18E-09/-4.00E-11 µCi/mL
EPA902.0MODIodine-129 1/1 2.65E-09 — 2.65E-09/2.65E-09 µCi/mL
EPA903.0MODRadium, total alpha-emitting 35/41 1.26E-09 8.88E-10 2.00E-11/3.17E-09 µCi/mL
EPA904.0MODRadium-228 6/13 8.22E-10 7.41E-10 -1.90E-10/1.97E-09 µCi/mL

Quality Control SamplesQuality Control SamplesESH-EMS-2000408ESH-EMS-2000408 Page Page 121121 Fourth Quarter 2000Fourth Quarter 2000
AnalyteFrequencyof Detection† Mean Result
StandardDeviation Minimum/Maximum Results
EPA906.0MODTritium 2/70 -3.40E-08 7.26E-07 -3.70E-06/1.95E-06 µCi/mL
† Number of times analyte was detected compared to the total number of method blanks for the analyte.— Standard deviation cannot be determined.
Table 67.Table 67. Analytes Detected in Field Blanks for EXAnalytes Detected in Field Blanks for EX
AnalyteFrequencyof Detection† Mean Result
StandardDeviation Minimum/Maximum Results
EPA300.0Nitrate-nitrite as nitrogen 0/3 1,000 0.0 1,000/1,000 µg/L
EPA6010BAluminum 1/3 90.3 95.1 32.3/200 µg/LArsenic 0/3 10.0 0.0 10.0/10.0 µg/LBarium 0/3 10.0 0.0 10.0/10.0 µg/LCadmium 0/3 10.0 0.0 10.0/10.0 µg/LChromium 0/3 8.71 2.23 6.13/10.0 µg/LIron 0/1 46.5 — 46.5/46.5 µg/LLead 0/6 10.0 0.0 10.0/10.0 µg/LSelenium 0/3 10.0 0.0 10.0/10.0 µg/LSilver 0/3 20.0 0.0 20.0/20.0 µg/L
EPA7470AMercury 0/4 0.50 0.0 0.50/0.50 µg/L
† Number of times analyte was detected compared to the total number of field blanks for the analyte.— Standard deviation cannot be determined.
Note: If the analyte was not detected in the field blank(s), detection limit information appears in the Mean Result andMinimum/Maximum Results columns.
Table 68.Table 68. Analytes Detected in Field Blanks for GEAnalytes Detected in Field Blanks for GE
AnalyteFrequencyof Detection† Mean Result
StandardDeviation Minimum/Maximum Results
EPA353.1Nitrate-nitrite as nitrogen 2/13 58.5 116 10.0/440 µg/L
EPA6010BAluminum 0/5 50.0 0.0 50.0/50.0 µg/LLead 0/5 5.0 0.0 5.0/5.0 µg/LUranium 0/1 50.0 — 50.0/50.0 µg/L
EPA6020Beryllium 2/12 0.20 0.0 0.20/0.20 µg/LCadmium 1/5 0.90 0.22 0.51/1.0 µg/LThallium 4/7 0.50 0.0 0.50/0.50 µg/L
EPA7470AMercury 0/7 0.20 0.0 0.20/0.20 µg/L

Quality Control SamplesQuality Control SamplesESH-EMS-2000408ESH-EMS-2000408 Page Page 122122 Fourth Quarter 2000Fourth Quarter 2000
AnalyteFrequencyof Detection† Mean Result
StandardDeviation Minimum/Maximum Results
EPA9040BpH 13/13 5.70 0.25 5.23/6.31 pH
EPA9050ASpecific conductance 12/12 6.18 17.0 1.04/60.0 µS/cm
† Number of times analyte was detected compared to the total number of field blanks for the analyte.— Standard deviation cannot be determined.
Note: If the analyte was not detected in the field blank(s), detection limit information appears in the Mean Result andMinimum/Maximum Results columns.
Table 69.Table 69. Analytes Detected in Field Blanks for WAAnalytes Detected in Field Blanks for WA
AnalyteFrequencyof Detection† Mean Result
StandardDeviation Minimum/Maximum Results
EPA160.1Total dissolved solids 5/14 30,900 19,000 8,000/52,000 µg/L
EPA310.1Alkalinity (as CaCO3) 5/12 8.01 6.61 0.96/25.0 meq/L
EPA353.2Nitrate-nitrite as nitrogen 1/12 14.3 7.34 2.0/20.0 µg/L
EPA6010BAntimony 0/12 27.0 0.0 27.0/27.0 µg/LArsenic 0/12 40.0 0.0 40.0/40.0 µg/LBarium 3/12 1.02 0.79 0.19/2.60 µg/LBoron 0/12 266 0.0 266/266 µg/LCadmium 0/12 4.70 0.0 4.70/4.70 µg/LChromium 2/12 5.56 2.61 0.98/7.0 µg/LCopper 0/12 13.9 3.90 1.50/15.0 µg/LLead 0/12 47.0 0.0 47.0/47.0 µg/LLithium 0/12 2.20 0.94 0.30/2.70 µg/LNickel 0/12 26.0 0.0 26.0/26.0 µg/LSelenium 0/12 66.0 0.0 66.0/66.0 µg/LSilver 0/12 4.66 1.17 0.96/5.0 µg/LTin 0/12 70.0 0.0 70.0/70.0 µg/LZinc 0/12 53.0 0.0 53.0/53.0 µg/L
EPA7470AMercury 0/12 0.70 0.0 0.70/0.70 µg/L
EPA9014Cyanide 0/15 15.2 0.0 15.2/15.2 µg/L
EPA9020BTotal organic halogens 0/13 122 4.88 120/133 µg/L
EPA9056Sulfate 10/12 228 150 53.0/674 µg/L
EPA9060Total organic carbon 7/12 455 410 105/1,000 µg/L

Quality Control SamplesQuality Control SamplesESH-EMS-2000408ESH-EMS-2000408 Page Page 123123 Fourth Quarter 2000Fourth Quarter 2000
AnalyteFrequencyof Detection† Mean Result
StandardDeviation Minimum/Maximum Results
EPA9066Phenols 0/12 37.0 0.0 37.0/37.0 µg/L
† Number of times analyte was detected compared to the total number of field blanks for the analyte.
Note: If the analyte was not detected in the field blank(s), detection limit information appears in the Mean Result andMinimum/Maximum Results columns.
Table 70.Table 70. Analytes Detected in Field Blanks for GPAnalytes Detected in Field Blanks for GP
AnalyteFrequencyof Detection† Mean Result
StandardDeviation Minimum/Maximum Results
EPIA-001Gross alpha 0/14 1.10E-10 2.35E-10 -1.91E-10/5.15E-10 µCi/mLNonvolatile beta 2/12 9.07E-10 2.44E-09 -5.15E-10/8.33E-09 µCi/mL
EPIA-002Tritium 0/12 -1.89E-07 4.53E-07 -1.11E-06/2.94E-07 µCi/mL
EPIA-003Carbon-14 0/13 2.87E-09 6.09E-09 -8.32E-09/1.45E-08 µCi/mL
EPIA-004Strontium-90 0/15 -7.00E-12 3.04E-10 -3.44E-10/5.82E-10 µCi/mL
EPIA-005Technetium-99 0/1 7.06E-10 — 7.06E-10/7.06E-10 µCi/mL
EPIA-006Iodine-129 0/1 -1.48E-10 — -1.48E-10/-1.48E-10 µCi/mL
EPIA-007Radon-222 0/1 2.82E-08 — 2.82E-08/2.82E-08 µCi/mL
EPIA-008Radium-226 7/15 4.95E-10 5.41E-10 -1.76E-10/1.42E-09 µCi/mL
EPIA-009Radium-228 0/14 3.70E-10 2.99E-10 -3.82E-10/8.33E-10 µCi/mL
EPIA-011Americium-241 0/1 0.0 — 0.0/0.0 µCi/mLCurium-242 0/1 0.0 — 0.0/0.0 µCi/mLCurium-243/244 0/1 -6.26E-11 — -6.26E-11/-6.26E-11 µCi/mLCurium-245/246 0/1 3.57E-11 — 3.57E-11/3.57E-11 µCi/mLPlutonium-238 0/1 -4.99E-11 — -4.99E-11/-4.99E-11 µCi/mLPlutonium-239/240 0/1 4.99E-11 — 4.99E-11/4.99E-11 µCi/mLUranium-233/234 0/2 2.34E-11 1.78E-11 1.08E-11/3.60E-11 µCi/mLUranium-235 0/2 -1.99E-11 7.21E-12 -2.50E-11/-1.48E-11 µCi/mLUranium-238 0/2 2.07E-11 0.0 2.05E-11/2.08E-11 µCi/mL
EPIA-012Thorium-228 0/2 9.70E-12 1.40E-10 -8.96E-11/1.09E-10 µCi/mLThorium-230 0/2 -9.24E-11 9.98E-11 -1.63E-10/-2.18E-11 µCi/mL

Quality Control SamplesQuality Control SamplesESH-EMS-2000408ESH-EMS-2000408 Page Page 124124 Fourth Quarter 2000Fourth Quarter 2000
AnalyteFrequencyof Detection† Mean Result
StandardDeviation Minimum/Maximum Results
Thorium-232 0/2 -1.06E-11 2.49E-11 -2.82E-11/6.99E-12 µCi/mL
EPIA-013Actinium-228 0/2 7.74E-09 8.06E-10 7.17E-09/8.31E-09 µCi/mLAntimony-125 0/2 -9.98E-10 1.01E-09 -1.71E-09/-2.85E-10 µCi/mLBismuth-212 0/2 8.76E-09 1.01E-08 1.62E-09/1.59E-08 µCi/mLBismuth-214 0/2 4.17E-09 3.75E-09 1.52E-09/6.82E-09 µCi/mLCerium-144 0/1 2.66E-09 — 2.66E-09/2.66E-09 µCi/mLCesium-134 0/2 4.24E-10 1.71E-10 3.03E-10/5.45E-10 µCi/mLCesium-137 1/2 2.21E-09 2.83E-09 2.07E-10/4.21E-09 µCi/mLCobalt-60 0/2 -8.20E-11 8.57E-10 -6.88E-10/5.24E-10 µCi/mLEuropium-152 0/2 1.49E-09 1.49E-09 4.38E-10/2.54E-09 µCi/mLEuropium-154 0/2 -2.27E-09 2.52E-09 -4.05E-09/-4.83E-10 µCi/mLEuropium-155 0/2 -1.92E-09 2.55E-09 -3.72E-09/-1.18E-10 µCi/mLLead-212 0/2 1.95E-09 9.19E-11 1.88E-09/2.01E-09 µCi/mLPotassium-40 2/2 4.86E-08 3.82E-09 4.59E-08/5.13E-08 µCi/mLPromethium-146 0/2 -4.93E-10 2.92E-10 -6.99E-10/-2.86E-10 µCi/mLThallium-208 0/2 3.25E-09 3.39E-10 3.01E-09/3.49E-09 µCi/mL
EPIA-032Neptunium-237 0/1 -9.28E-12 — -9.28E-12/-9.28E-12 µCi/mL
† Number of times analyte was detected compared to the total number of field blanks for the analyte.— Standard deviation cannot be determined.
Note: If the analyte was not detected in the field blank(s), detection limit information appears in the Mean Result andMinimum/Maximum Results columns.
Table 71.Table 71. Analytes Detected in Field Blanks for MLAnalytes Detected in Field Blanks for ML
AnalyteFrequencyof Detection† Mean Result
StandardDeviation Minimum/Maximum Results
EPIA-001Gross alpha 0/3 6.05E-10 9.61E-10 -5.04E-10/1.16E-09 µCi/mLNonvolatile beta 0/2 1.95E-09 2.89E-09 -9.48E-11/3.99E-09 µCi/mL
EPIA-002Tritium 0/3 9.70E-08 1.54E-07 -2.86E-08/2.69E-07 µCi/mL
† Number of times analyte was detected compared to the total number of field blanks for the analyte.
Note: If the analyte was not detected in the field blank(s), detection limit information appears in the Mean Result andMinimum/Maximum Results columns.
Table 72.Table 72. Analytes Detected in Field Blanks for TMAnalytes Detected in Field Blanks for TM
AnalyteFrequencyof Detection† Mean Result
StandardDeviation Minimum/Maximum Results
EMLSR02MODStrontium-90 0/10 -1.82E-10 6.42E-10 -1.23E-09/9.00E-10 µCi/mL

Quality Control SamplesQuality Control SamplesESH-EMS-2000408ESH-EMS-2000408 Page Page 125125 Fourth Quarter 2000Fourth Quarter 2000
AnalyteFrequencyof Detection† Mean Result
StandardDeviation Minimum/Maximum Results
EPA900.0MODGross alpha 2/16 1.16E-10 3.88E-10 -3.70E-10/8.50E-10 µCi/mLNonvolatile beta 3/15 6.30E-10 1.81E-09 -1.33E-09/5.68E-09 µCi/mL
EPA903.0MODRadium, total alpha-emitting 3/15 1.90E-09 1.29E-09 2.00E-10/4.62E-09 µCi/mL
EPA904.0MODRadium-228 0/10 8.41E-10 7.59E-10 -4.60E-10/2.00E-09 µCi/mL
EPA906.0MODTritium 0/15 -5.40E-08 3.41E-07 -7.80E-07/4.40E-07 µCi/mL
† Number of times analyte was detected compared to the total number of field blanks for the analyte.
Note: If the analyte was not detected in the field blank(s), detection limit information appears in the Mean Result andMinimum/Maximum Results columns.
Table 73.Table 73. Analytes Detected in Trip Blanks for EXAnalytes Detected in Trip Blanks for EX
AnalyteFrequencyof Detection† Mean Result
StandardDeviation Minimum/Maximum Results
EPA8021BCarbon tetrachloride 0/5 1.0 0.0 1.0/1.0 µg/LChloroform 0/5 1.0 0.0 1.0/1.0 µg/LTetrachloroethylene 0/5 1.0 0.0 1.0/1.0 µg/L1,1,1-Trichloroethane 0/5 1.0 0.0 1.0/1.0 µg/LTrichloroethylene 0/5 1.0 0.0 1.0/1.0 µg/L
EPA8260BAcetone 0/6 20.0 0.0 20.0/20.0 µg/LAcetonitrile 0/6 200 0.0 200/200 µg/LAcrolein 0/7 50.0 0.0 50.0/50.0 µg/LAcrylonitrile 0/7 10.0 0.0 10.0/10.0 µg/LAllyl chloride 0/6 5.0 0.0 5.0/5.0 µg/LBenzene 0/18 5.0 0.0 5.0/5.0 µg/LBromochloromethane 0/6 5.0 0.0 5.0/5.0 µg/LBromodichloromethane 0/18 5.0 0.0 5.0/5.0 µg/LBromoform 0/18 5.0 0.0 5.0/5.0 µg/LBromomethane 0/18 5.0 0.0 5.0/5.0 µg/LCarbon disulfide 0/6 5.0 0.0 5.0/5.0 µg/LCarbon tetrachloride 0/18 5.0 0.0 5.0/5.0 µg/LChlorobenzene 0/18 5.0 0.0 5.0/5.0 µg/LChloroethane 0/18 5.0 0.0 5.0/5.0 µg/LChloroethene 0/18 5.0 0.0 5.0/5.0 µg/L2-Chloroethyl vinyl ether 0/12 5.0 0.0 5.0/5.0 µg/LChloroform 0/18 5.0 0.0 5.0/5.0 µg/LChloromethane 0/18 5.0 0.0 5.0/5.0 µg/LChloroprene 0/6 20.0 0.0 20.0/20.0 µg/LDibromochloromethane 0/18 5.0 0.0 5.0/5.0 µg/L1,2-Dibromo-3-chloropropane 0/6 10.0 0.0 10.0/10.0 µg/L1,2-Dibromoethane 0/6 5.0 0.0 5.0/5.0 µg/LDibromomethane 0/6 5.0 0.0 5.0/5.0 µg/L1,2-Dichlorobenzene 0/7 5.0 0.0 5.0/5.0 µg/L1,3-Dichlorobenzene 0/7 5.0 0.0 5.0/5.0 µg/L1,4-Dichlorobenzene 0/7 5.0 0.0 5.0/5.0 µg/Ltrans-1,4-Dichloro-2-butene 0/6 20.0 0.0 20.0/20.0 µg/L

Quality Control SamplesQuality Control SamplesESH-EMS-2000408ESH-EMS-2000408 Page Page 126126 Fourth Quarter 2000Fourth Quarter 2000
AnalyteFrequencyof Detection† Mean Result
StandardDeviation Minimum/Maximum Results
Dichlorodifluoromethane 0/6 5.0 0.0 5.0/5.0 µg/L1,1-Dichloroethane 0/18 5.0 0.0 5.0/5.0 µg/L1,2-Dichloroethane 0/18 5.0 0.0 5.0/5.0 µg/L1,1-Dichloroethylene 0/18 5.0 0.0 5.0/5.0 µg/Lcis-1,2-Dichloroethylene 0/17 5.0 0.0 5.0/5.0 µg/Ltrans-1,2-Dichloroethylene 0/18 5.0 0.0 5.0/5.0 µg/LDichloromethane 5/18 7.27 3.98 1.60/10.0 µg/L1,2-Dichloropropane 0/18 5.0 0.0 5.0/5.0 µg/L1,3-Dichloropropane 0/6 5.0 0.0 5.0/5.0 µg/L2,2-Dichloropropane 0/6 5.0 0.0 5.0/5.0 µg/L1,1-Dichloropropene 0/6 5.0 0.0 5.0/5.0 µg/Lcis-1,3-Dichloropropene 0/18 5.0 0.0 5.0/5.0 µg/Ltrans-1,3-Dichloropropene 0/18 5.0 0.0 5.0/5.0 µg/L1,4-Dioxane 0/6 500 0.0 500/500 µg/LEthyl methacrylate 0/6 5.0 0.0 5.0/5.0 µg/LEthylbenzene 0/18 5.0 0.0 5.0/5.0 µg/L2-Hexanone 0/6 20.0 0.0 20.0/20.0 µg/LIodomethane 0/6 5.0 0.0 5.0/5.0 µg/LIsobutyl alcohol 0/6 500 0.0 500/500 µg/LMethacrylonitrile 0/6 200 0.0 200/200 µg/LMethyl ethyl ketone 0/6 20.0 0.0 20.0/20.0 µg/LMethyl isobutyl ketone 0/6 10.0 0.0 10.0/10.0 µg/LMethyl methacrylate 0/6 20.0 0.0 20.0/20.0 µg/LPentachloroethane 0/6 200 0.0 200/200 µg/LPropionitrile 0/6 200 0.0 200/200 µg/LStyrene 0/6 5.0 0.0 5.0/5.0 µg/L1,1,1,2-Tetrachloroethane 0/6 5.0 0.0 5.0/5.0 µg/L1,1,2,2-Tetrachloroethane 0/18 5.0 0.0 5.0/5.0 µg/LTetrachloroethylene 0/18 5.0 0.0 5.0/5.0 µg/LToluene 0/18 5.0 0.0 5.0/5.0 µg/L1,1,1-Trichloroethane 0/18 5.0 0.0 5.0/5.0 µg/L1,1,2-Trichloroethane 0/18 5.0 0.0 5.0/5.0 µg/LTrichloroethylene 0/18 5.0 0.0 5.0/5.0 µg/LTrichlorofluoromethane 0/17 5.0 0.0 5.0/5.0 µg/L1,2,3-Trichloropropane 0/6 5.0 0.0 5.0/5.0 µg/LVinyl acetate 0/6 5.0 0.0 5.0/5.0 µg/LXylenes 0/6 10.0 0.0 10.0/10.0 µg/L
† Number of times analyte was detected compared to the total number of trip blanks for the analyte.
Note: If the analyte was not detected in the trip blank(s), detection limit information appears in the Mean Result andMinimum/Maximum Results columns.
Table 74.Table 74. Analytes DetectAnalytes Detected in Trip Blanks for GEed in Trip Blanks for GE
AnalyteFrequencyof Detection† Mean Result
StandardDeviation Minimum/Maximum Results
EPA8260BAcetone 0/1 5.0 — 5.0/5.0 µg/LBenzene 0/16 1.0 0.0 1.0/1.0 µg/LBromodichloromethane 0/16 1.0 0.0 1.0/1.0 µg/LBromoform 0/16 1.0 0.0 1.0/1.0 µg/LBromomethane 0/16 1.0 0.0 1.0/1.0 µg/LCarbon disulfide 0/1 5.0 — 5.0/5.0 µg/LCarbon tetrachloride 0/16 1.0 0.0 1.0/1.0 µg/LChlorobenzene 0/16 1.0 0.0 1.0/1.0 µg/LChloroethane 0/16 1.0 0.0 1.0/1.0 µg/L

Quality Control SamplesQuality Control SamplesESH-EMS-2000408ESH-EMS-2000408 Page Page 127127 Fourth Quarter 2000Fourth Quarter 2000
AnalyteFrequencyof Detection† Mean Result
StandardDeviation Minimum/Maximum Results
Chloroethene 0/16 1.0 0.0 1.0/1.0 µg/L2-Chloroethyl vinyl ether 0/15 5.0 0.0 5.0/5.0 µg/LChloroform 0/16 1.0 0.0 1.0/1.0 µg/LChloromethane 0/16 1.0 0.0 1.0/1.0 µg/LDibromochloromethane 0/16 1.0 0.0 1.0/1.0 µg/LDibromomethane 0/8 1.0 0.0 1.0/1.0 µg/L1,1-Dichloroethane 0/16 1.0 0.0 1.0/1.0 µg/L1,2-Dichloroethane 0/15 1.0 0.0 1.0/1.0 µg/L1,1-Dichloroethylene 0/16 1.0 0.0 1.0/1.0 µg/L1,2-Dichloroethylene 0/1 2.0 — 2.0/2.0 µg/Ltrans-1,2-Dichloroethylene 0/15 1.0 0.0 1.0/1.0 µg/LDichloromethane 0/16 4.58 1.15 1.59/5.0 µg/L1,2-Dichloropropane 0/16 1.0 0.0 1.0/1.0 µg/Lcis-1,3-Dichloropropene 0/16 1.0 0.0 1.0/1.0 µg/Ltrans-1,3-Dichloropropene 0/16 1.0 0.0 1.0/1.0 µg/LEthylbenzene 0/16 1.0 0.0 1.0/1.0 µg/L2-Hexanone 0/1 5.0 — 5.0/5.0 µg/LMethyl ethyl ketone 0/1 5.0 — 5.0/5.0 µg/LMethyl isobutyl ketone 0/1 5.0 — 5.0/5.0 µg/LStyrene 0/1 1.0 — 1.0/1.0 µg/L1,1,2,2-Tetrachloroethane 0/16 1.0 0.0 1.0/1.0 µg/LTetrachloroethylene 0/16 1.0 0.0 1.0/1.0 µg/LToluene 0/16 1.0 0.0 1.0/1.0 µg/L1,1,1-Trichloroethane 0/16 1.0 0.0 1.0/1.0 µg/L1,1,2-Trichloroethane 0/16 1.0 0.0 1.0/1.0 µg/LTrichloroethylene 0/16 1.0 0.0 1.0/1.0 µg/LTrichlorofluoromethane 0/15 1.0 0.0 1.0/1.0 µg/LVinyl acetate 0/1 5.0 — 5.0/5.0 µg/LXylenes 0/9 3.0 0.0 3.0/3.0 µg/L
† Number of times analyte was detected compared to the total number of trip blanks for the analyte.— Standard deviation cannot be determined.
Note: If the analyte was not detected in the trip blank(s), detection limit information appears in the Mean Result andMinimum/Maximum Results columns.
Table 75.Table 75. Analytes Detected in Trip Blanks for WAAnalytes Detected in Trip Blanks for WA
AnalyteFrequencyof Detection† Mean Result
StandardDeviation Minimum/Maximum Results
EPA8260BAcetone 0/13 9.40 1.46 6.0/10.0 µg/LAcetonitrile 1/12 19.4 1.96 13.2/20.0 µg/LAcrolein 8/12 20.0 0.0 20.0/20.0 µg/LAcrylonitrile 0/12 5.0 0.0 5.0/5.0 µg/LAllyl chloride 0/12 10.0 0.0 10.0/10.0 µg/LBenzene 0/33 5.0 0.0 5.0/5.0 µg/LBromodichloromethane 0/33 5.0 0.0 5.0/5.0 µg/LBromoform 0/33 5.0 0.0 5.0/5.0 µg/LBromomethane 0/33 10.0 0.0 10.0/10.0 µg/LCarbon disulfide 0/13 5.0 0.0 5.0/5.0 µg/LCarbon tetrachloride 0/33 5.0 0.0 5.0/5.0 µg/LChlorobenzene 0/33 5.0 0.0 5.0/5.0 µg/LChloroethane 0/33 10.0 0.0 10.0/10.0 µg/LChloroethene 0/33 10.0 0.0 10.0/10.0 µg/L2-Chloroethyl vinyl ether 20/20 10.0 0.0 10.0/10.0 µg/LChloroform 0/33 5.0 0.0 5.0/5.0 µg/LChloromethane 0/33 10.0 0.0 10.0/10.0 µg/L

Quality Control SamplesQuality Control SamplesESH-EMS-2000408ESH-EMS-2000408 Page Page 128128 Fourth Quarter 2000Fourth Quarter 2000
AnalyteFrequencyof Detection† Mean Result
StandardDeviation Minimum/Maximum Results
Chloroprene 0/12 5.0 0.0 5.0/5.0 µg/LDibromochloromethane 0/33 5.0 0.0 5.0/5.0 µg/L1,2-Dibromo-3-chloropropane 0/12 5.0 0.0 5.0/5.0 µg/L1,2-Dibromoethane 0/12 5.0 0.0 5.0/5.0 µg/LDibromomethane 0/12 5.0 0.0 5.0/5.0 µg/L1,4-Dichlorobenzene 0/2 5.0 0.0 5.0/5.0 µg/Ltrans-1,4-Dichloro-2-butene 0/12 20.0 0.0 20.0/20.0 µg/LDichlorodifluoromethane 0/12 10.0 0.0 10.0/10.0 µg/L1,1-Dichloroethane 0/33 5.0 0.0 5.0/5.0 µg/L1,2-Dichloroethane 0/33 5.0 0.0 5.0/5.0 µg/L1,1-Dichloroethylene 0/33 5.0 0.0 5.0/5.0 µg/L1,2-Dichloroethylene 0/1 5.0 — 5.0/5.0 µg/Lcis-1,2-Dichloroethylene 0/11 5.0 0.0 5.0/5.0 µg/Ltrans-1,2-Dichloroethylene 0/32 5.0 0.0 5.0/5.0 µg/LDichloromethane 7/33 7.41 2.75 4.04/14.3 µg/L1,2-Dichloropropane 0/33 5.0 0.0 5.0/5.0 µg/Lcis-1,3-Dichloropropene 0/33 5.0 0.0 5.0/5.0 µg/Ltrans-1,3-Dichloropropene 0/33 5.0 0.0 5.0/5.0 µg/LEthylbenzene 0/33 5.0 0.0 5.0/5.0 µg/L2-Hexanone 0/13 10.0 0.0 10.0/10.0 µg/LIodomethane 0/12 5.0 0.0 5.0/5.0 µg/LIsobutyl alcohol 0/12 100 0.0 100/100 µg/LMethacrylonitrile 0/12 10.0 0.0 10.0/10.0 µg/LMethyl ethyl ketone 0/13 10.0 0.0 10.0/10.0 µg/LMethyl isobutyl ketone 1/13 9.49 1.84 3.38/10.0 µg/LPropionitrile 0/12 50.0 0.0 50.0/50.0 µg/LStyrene 0/13 5.0 0.0 5.0/5.0 µg/L1,1,1,2-Tetrachloroethane 0/12 5.0 0.0 5.0/5.0 µg/L1,1,2,2-Tetrachloroethane 0/33 5.0 0.0 5.0/5.0 µg/LTetrachloroethylene 0/33 5.0 0.0 5.0/5.0 µg/LToluene 0/33 5.0 0.0 5.0/5.0 µg/L1,1,1-Trichloroethane 0/33 5.0 0.0 5.0/5.0 µg/L1,1,2-Trichloroethane 0/33 5.0 0.0 5.0/5.0 µg/LTrichloroethylene 0/33 5.0 0.0 5.0/5.0 µg/LTrichlorofluoromethane 0/32 5.0 0.0 5.0/5.0 µg/L1,2,3-Trichloropropane 0/12 5.0 0.0 5.0/5.0 µg/LVinyl acetate 0/12 10.0 0.0 10.0/10.0 µg/LXylenes 0/32 5.0 0.0 5.0/5.0 µg/L
† Number of times analyte was detected compared to the total number of trip blanks for the analyte.— Standard deviation cannot be determined.
Note: If the analyte was not detected in the trip blank(s), detection limit information appears in the Mean Result andMinimum/Maximum Results columns.
Table 76.Table 76. Analytes Detected in Trip Blanks for MLAnalytes Detected in Trip Blanks for ML
AnalyteFrequencyof Detection† Mean Result
StandardDeviation Minimum/Maximum Results
EPA8260BAcetone 1/11 9.43 1.88 3.78/10.0 µg/LBenzene 0/11 1.0 0.0 1.0/1.0 µg/LBromodichloromethane 0/11 1.0 0.0 1.0/1.0 µg/LBromoform 0/11 1.0 0.0 1.0/1.0 µg/LBromomethane 0/11 1.0 0.0 1.0/1.0 µg/LCarbon disulfide 0/11 5.0 0.0 5.0/5.0 µg/LCarbon tetrachloride 0/11 1.0 0.0 1.0/1.0 µg/L

Quality Control SamplesQuality Control SamplesESH-EMS-2000408ESH-EMS-2000408 Page Page 129129 Fourth Quarter 2000Fourth Quarter 2000
AnalyteFrequencyof Detection† Mean Result
StandardDeviation Minimum/Maximum Results
Chlorobenzene 0/11 1.0 0.0 1.0/1.0 µg/LChloroethane 0/11 1.0 0.0 1.0/1.0 µg/LChloroethene 0/11 1.0 0.0 1.0/1.0 µg/LChloroform 0/11 1.0 0.0 1.0/1.0 µg/LChloromethane 0/11 1.0 0.0 1.0/1.0 µg/LDibromochloromethane 0/11 1.0 0.0 1.0/1.0 µg/L1,1-Dichloroethane 0/11 1.0 0.0 1.0/1.0 µg/L1,2-Dichloroethane 0/11 1.0 0.0 1.0/1.0 µg/L1,1-Dichloroethylene 0/11 1.0 0.0 1.0/1.0 µg/L1,2-Dichloroethylene 0/6 1.0 0.0 1.0/1.0 µg/Lcis-1,2-Dichloroethylene 0/5 1.0 0.0 1.0/1.0 µg/Ltrans-1,2-Dichloroethylene 0/5 1.0 0.0 1.0/1.0 µg/LDichloromethane 0/11 10.0 0.0 10.0/10.0 µg/L1,2-Dichloropropane 0/11 1.0 0.0 1.0/1.0 µg/Lcis-1,3-Dichloropropene 0/11 1.0 0.0 1.0/1.0 µg/Ltrans-1,3-Dichloropropene 0/11 1.0 0.0 1.0/1.0 µg/LEthylbenzene 0/11 1.0 0.0 1.0/1.0 µg/L2-Hexanone 0/11 5.0 0.0 5.0/5.0 µg/LMethyl ethyl ketone 0/11 5.0 0.0 5.0/5.0 µg/LMethyl isobutyl ketone 0/11 5.0 0.0 5.0/5.0 µg/LStyrene 0/11 1.0 0.0 1.0/1.0 µg/L1,1,2,2-Tetrachloroethane 0/11 1.0 0.0 1.0/1.0 µg/LTetrachloroethylene 0/11 1.0 0.0 1.0/1.0 µg/LToluene 0/11 1.0 0.0 1.0/1.0 µg/L1,1,1-Trichloroethane 0/11 1.0 0.0 1.0/1.0 µg/L1,1,2-Trichloroethane 0/11 1.0 0.0 1.0/1.0 µg/LTrichloroethylene 0/11 1.0 0.0 1.0/1.0 µg/LVinyl acetate 0/11 5.0 0.0 5.0/5.0 µg/LXylenes 0/11 1.0 0.0 1.0/1.0 µg/L
† Number of times analyte was detected compared to the total number of trip blanks for the analyte.
Note: If the analyte was not detected in the trip blank(s), detection limit information appears in the Mean Result andMinimum/Maximum Results columns.
Table 77.Table 77. Bailed WellsBailed Wells
Well Date
AS 1 11/08/00AS 1 12/06/00AS 8 11/08/00AS 8 12/06/00AS 9 11/08/00AS 9 12/06/00AS 11 11/08/00AS 11 12/06/00RPC 8DL 10/30/00TCM 1 11/21/00TIR 1L 11/21/00TIR 1M 11/21/00TIR 1U 11/21/00TIR 2 11/22/00TNX 13D 11/20/00TNX 14D 11/20/00TNX 15D 11/20/00TNX 17D 11/21/00TNX 18D 11/20/00

Quality Control SamplesQuality Control SamplesESH-EMS-2000408ESH-EMS-2000408 Page Page 130130 Fourth Quarter 2000Fourth Quarter 2000
Well Date
TNX 19D 11/20/00TNX 20D 11/20/00TNX 22D 11/21/00
Table 78.Table 78. Sampled Wells with Metal CasingsSampled Wells with Metal Casings
Well Casing Well Casing
MSB 29TA Carbon steel RWM 14B Carbon steelMSB 55TA Carbon steel RWM 14C Carbon steelMSB 82TA Carbon steel RWM 15B Carbon steelRSD 2C Steel RWM 17B Stainless steelRWM 1 Carbon steel RWM 17D Carbon steelRWM 3 Carbon steel TNX 13D Stainless steelRWM 4 Carbon steel TNX 14D Stainless steelRWM 5 Carbon steel TNX 15D Stainless steelRWM 6 Carbon steel TNX 16D Stainless steelRWM 7 Carbon steel TNX 17D Stainless steelRWM 8 Carbon steel TNX 18D Stainless steelRWM 9 Carbon steel TNX 19D Stainless steelRWM 10 Carbon steel TNX 20D Stainless steelRWM 11 Carbon steel TNX 21D Stainless steelRWM 13B Carbon steel TNX 22D Stainless steelRWM 13C Carbon steel TNX 26D Stainless steel
Table 79.Table 79. Wells That Had Turbidity Greater Than 1Wells That Had Turbidity Greater Than 15 NTU5 NTU
Well Date Results (in NTU)
AS 1 11/08/00 795AS 1 12/06/00 1,000AS 8 11/08/00 1,000AS 8 12/06/00 1,000AS 9 12/06/00 1,000AS 11 11/08/00 25.0AS 11 12/06/00 1,000BGO 32D 12/18/00 37.2BGX 11D 12/16/00 38.8BSW 1C1 12/04/00 448BSW 1C2 12/04/00 907BSW 1C3 12/04/00 409BSW 1C4 12/05/00 507BSW 1D1 12/05/00 67.0BSW 1D2 12/05/00 54.2BSW 2C1 12/06/00 407BSW 2C2 12/06/00 385BSW 2D2 12/06/00 529BSW 2D3 12/06/00 20.3BSW 3C4 12/30/00 1,000BSW 3D2 12/27/00 81.0BSW 4C1 12/27/00 1,000BSW 4C2 12/30/00 111BSW 4C3 12/27/00 540BSW 4D2 12/27/00 19.0BSW 4D3 12/27/00 95.4BSW 5C1 12/20/00 22.0

Quality Control SamplesQuality Control SamplesESH-EMS-2000408ESH-EMS-2000408 Page Page 131131 Fourth Quarter 2000Fourth Quarter 2000
Well Date Results (in NTU)
BSW 5C3 12/21/00 17.5BSW 5C4 12/21/00 35.0BSW 5D1 12/20/00 286BSW 5D2 12/21/00 40.7BSW 5D3 12/21/00 283BSW 6C1 12/08/00 166BSW 6C2 12/08/00 19.6BSW 6C3 12/13/00 449BSW 6C4 12/14/00 44.1BSW 6D3 12/14/00 106BSW 7C1 12/29/00 1,000BSW 7C2 12/29/00 1,000BSW 7C3 12/29/00 540BSW 7C4 12/30/00 1,000BSW 7D2 12/29/00 708BSW 7D3 12/29/00 186BSW 8C1 12/22/00 273BSW 8C2 12/22/00 290BSW 8C3 12/23/00 1,000BSW 8C4 12/23/00 1,000BSW 8D1 12/22/00 605BSW 8D3 12/23/00 30.0CRP 17DU 11/20/00 43.7CRP 17DU 12/07/00 146FSB107D 10/30/00 65.0FSL 1D 10/20/00 60.4FSL 3D 10/09/00 18.2FSS 2D 12/04/00 38.8HAA 3D 10/31/00 74.3HSB 86D 10/25/00 27.0HSB142D 12/19/00 23.4KDB 1 10/19/00 28.4KDB 1 12/29/00 23.9KDB 4 12/29/00 105KDB 5 10/19/00 19.6RPC 7DU 10/31/00 43.6RPC 11DU 11/07/00 21.8RPC 14DU 11/07/00 47.5RPC 14DU 12/13/00 162SRW 17DR 11/21/00 17.1SRW 18 11/20/00 34.4TCM 7 12/13/00 23.0TNX 21D 12/06/00 24.5TNX 36D 11/30/00 72.5
Table 80.Table 80. Analyses Not Performed by EXAnalyses Not Performed by EX
Well Analyte Reason
TBG 4 Aluminum, mercury, lead, nitrate-nitrite as nitrogen Canceled–laboratory did not receive bottlesTBG 5 Aluminum, mercury, lead, nitrate-nitrite as nitrogen Canceled–laboratory did not receive bottles

Quality Control SamplesQuality Control SamplesESH-EMS-2000408ESH-EMS-2000408 Page Page 132132 Fourth Quarter 2000Fourth Quarter 2000
Table 81.Table 81. Analyses Not Performed by GEAnalyses Not Performed by GE
Well Analyte Reason
BSE 1C3 Carbon-14 CanceledBGO 51D Carbon-14 Canceled
Table 82.Table 82. Analyses Not Performed by WAAnalyses Not Performed by WA
Well Analyte Reason
BGO 14CR Appendix IX BNAs Canceled–bottles were not labeledBGO 31D Aluminum, antimony, arsenic, barium, cadmium,
chromium, copper, iron, mercury, lead, lithium,nickel, selenium, silver, tin, zinc
Canceled–bottles were not labeled
BGO 37C Phenols Canceled–volume depleted

Site IndexSite IndexESH-EMS-2000408ESH-EMS-2000408 Page Page 133133 Fourth Quarter 2000Fourth Quarter 2000
Site IndexSite IndexTable 83 provides information about sites, locations, and well series. Some locations were not available.
Table 83.Table 83. Sites and Locations by Well SeriesSites and Locations by Well Series
Well Series Site Location
ABP A-Area Metals Burning Pit South of the burning/rubble pitsABW A Area near Firing Range North of Road D-1 and east of Road 1-7AC A-Area Cluster Perimeter Wells and M-Area Plume Definition
WellsACB A-Area Coal Pile Runoff Containment Basin Southeast of A AreaAMB Metallurgical Laboratory Seepage Basin At the eastern edge of A AreaAMP A-Area Rubble PileAOB Motor Shop Oil Basin At the south edge of A Area near NPDES
Outfall A-14ARP A-Area Burning/Rubble Pits and A-Area Ash Pile West of Road D, south of A AreaAS Injection Wells of the C-Area ReactorASB Savannah River Laboratory Seepage Basins Across the road from the Savannah River
Technology Center (formerly the SavannahRiver Laboratory)
BGO Burial Grounds Perimeter Southern E AreaBGX E-Area Vaults near the Burial Grounds Northern E AreaBRD Road A Chemical Basin (Baxley Road) East of D AreaBRR Burma Road Rubble Pit Southwest of F AreaBSE Multiscreened Wells for the Burial Ground Complex Southeast
Plume AreaSoutheast edge of the Old Burial Ground
BTP Characterization Piezometers for the Proposed Sanitary Landfill Site B, off Road E-2
CBR N-Area (Central Shops) Burning/Rubble Pit south of the FordBuilding Seepage Basin
Southeast of N Area
CCB C-Area Coal Pile Runoff Containment Basin Southeast of C AreaCDB C-Area Disassembly Basin Near the C-Area reactor buildingCDS 108-3C Bioremediation Facility Near the C-Area reactor buildingCMP Chemicals, Metals, and Pesticides Pits West of Road C, approximately two miles
southeast of N AreaCRP C-Area Burning/Rubble Pit Southeast of N AreaCSA Hydrofluoric Acid Spill Area South of Road 3 in N AreaCSB C-Area Reactor Seepage Basins Southern C Area, west of the reactor buildingCSD N-Area (Central Shops) Diesel Spill Southwest of N AreaCSL N-Area (Central Shops) Sludge LagoonCSO Fire Department Training Facility Southeast portion of N-Area
CSR N-Area (Central Shops) Burning/Rubble Pits North of N AreaDBP D-Area Burning/Rubble Pits Western portion of D AreaDCB D-Area Coal Pile Runoff Containment Basin and Ash Basins South (containment basin) and southwest
(ash basins) of D AreaDOB D-Area Oil Seepage Basin North of D AreaDOL D-Area Oil Seepage Basin North of D Area
FAB Surrounding the 288-1F Ash Basin East of F Area and south of the F-Areaacid/caustic basin
FAL F-Area A Line Adjacent to the F-Area canyon buildingFBP F-Area Burning/Rubble Pits North of Road C and west of F AreaFCA F-Area Canyon Building Central F AreaFCB F-Area Coal Pile Runoff Containment Basin Southeast of F AreaFET F-Area Effluent Treatment Cooling Water Basin South of F Area

Site IndexSite IndexESH-EMS-2000408ESH-EMS-2000408 Page Page 134134 Fourth Quarter 2000Fourth Quarter 2000
Well Series Site Location
FEX F-Area Seepage Basins Groundwater Remediation, Hot SpotExtraction Wells
FIN F-Area Seepage Basins Groundwater Remediation, Hot SpotInjection Wells
South of Road C
FIW F-Area Seepage Basins Southwest portion of F AreaFNB Old F-Area Seepage Basin North of F AreaFOB F-Area Seepage Basins West-southwestern edge of F AreaFRB F-Area Retention BasinFSB F-Area Seepage Basins South of Road C; east of Road C-4FSL F-Area Inactive Process Sewer Line South of Road C; east of Road C-4FSS F-Area Sludge Land Application SiteFST Savannah River Ecology Laboratory Flowing Springs Site Adjacent to Aquatic Ecology Laboratory
(Road C)FTF F-Area Tank Farm
GBW Background Well near Hawthorne Fire Tower West of Road 2-1.1F
HAA H-Area Tank Farm Groundwater Operable UnitHAP H-Area Auxiliary Pump Pit At the east end of H Area near the coal pile
runoff containment basinHCA H-Area Canyon BuildingHCB H-Area Coal Pile Runoff Containment Basin East of H AreaHET H-Area Effluent Treatment Cooling Water Basin Southwest of H AreaHEX H-Area Seepage Basins Groundwater Remediation, Hot Spot
Extraction WellsEast of Road 4
HHP HP-52 Outfall Area and Warners PondHIN H-Area Seepage Basins Groundwater Remediation, Hot Spot
Injection WellsSouth of Road E
HIW H-Area Injection Wells Near the H-Area seepage basinsHMD Hazardous Waste/Mixed Waste Disposal Facility Northwest of the burial ground expansionHR3 Old H-Area Retention Basin Southeast of the intersection of Roads 4
and EHR8 H-Area Retention Basin Southeast of the intersection of Roads 4
and EHSB H-Area Seepage Basins Southwest of H Area and the intersection of
Roads 4 and EHSL H-Area Inactive Process Sewer Line Extends from the southwest portion of H Area
to north of the H-Area seepage basinsHSS H-Area Sludge Land Application Site Southeast of H AreaHTF H-Area Tank Farm At the south end of H AreaHWP Warner’s Pond and HP-52 OutfallHWS Hazardous Waste Storage Facility Northwest of N AreaHXB Ford Building Seepage Basin In the southeast portion of N Area
IDB Interim Waste Technology Site Characterization Wells, Site B Two miles northeast of H AreaIDP Interim Waste Technology Site Characterization Wells, Site P South of B Area and north of Highway 125IDQ Interim Waste Technology Site Characterization Wells, Site Q Adjacent to Site P, South or B Area and north
of Highway 125KAB K-Area Ash Basin Southwest of K AreaKBP K-Area Bingham Pump Outage PitKCB K-Area Coal Pile Runoff Containment Basin West of K Area, between the K-Area ash
basin and reactor seepage basinKDB K-Area Disassembly BasinKDT K-Area Diesel Tank Central K Area, north of the disassembly
basinKRB K-Area Retention Basin Northwest of K AreaKRP K-Area Burning/Rubble PitKSB K-Area Reactor Seepage Basin West of K AreaKSM K-Area Tritium Sump Near the K-Area process water storage tankKSS K-Area Sludge Land Application Site Southeast of K Area
LAC L-Area Acid/Caustic Basin

Site IndexSite IndexESH-EMS-2000408ESH-EMS-2000408 Page Page 135135 Fourth Quarter 2000Fourth Quarter 2000
Well Series Site Location
LAW L-Area Research Wells North of Road B and east of Road B-2.13LBP L-Area Bingham Pump Outage PitLCO L-Area Oil and Chemical Basin South of L AreaLDB L-Area Disassembly BasinLDS 108-3L Bioremediation FacilityLFW Sanitary Landfill South of Road CLRP L-Area Burning/Rubble Pit Northwest of L AreaLSB L-Area Reactor Seepage Basin Southeast of L Area, adjacent to the L-Area
oil and chemical basinMCB Miscellaneous Chemical Basin West of Road D near the A-Area metals
burning pitMSB M-Area Hazardous Waste Management Facility (HWMF) and
M-Area Plume Definition WellsSouth of A Area and M Area and west of
Road D (HWMF)
NBG Wells between the F-Area Canyon Building and the Naval FuelMaterial Facility
Between the canyon building and the NavalFuel Material Facility
P SRS Baseline Hydrogeologic Investigation Observation WellClustersB-Area Microbiology Wells (P 29 Cluster)East of H-Area Perimeter Fence (P 27 Cluster) East of the H-Area perimeter fenceR-Area Bedrock Exploration Hydrology Wells (P 20 Cluster)T-Area (TNX) Background Wells (P 26 Cluster)
PB L-Area Cooling Pond Dam PiezometersPBP P-Area Bingham Pump Outage PitPCB P-Area Coal Pile Runoff Containment Basin Southeast of the coal pile and south of P AreaPDB P-Area Disassembly BasinPRP P-Area Burning/Rubble Pit West of P AreaPSB P-Area Reactor Seepage Basins Southwest of the reactor buildingPSS Par Pond Sludge Land Application Site South of PAR PondPW Production Wells
RAC R-Area Acid/Caustic Basin South of R Area, just south of Road GRBP R-Area Bingham Pump Outage PitRBW R-Area Reactor Seepage Basins Northwest of R AreaRCP R-Area Coal Pile West of the R-Area reactor buildingRDB R-Area Disassembly BasinRPC R-Area Reactor Seepage Basins Northwest of R AreaRRP R-Area Burning/Rubble Pits Southeast of R Area and Road GRSA Series A, R-Area Reactor Seepage Basins Northwest of R AreaRSB Series B, R-Area Reactor Seepage Basins Northwest of R AreaRSC Series C, R-Area Reactor Seepage Basins Northwest of R AreaRSD Series D, between R-Area Reactor Seepage Basin and R-Area
Disassembly BasinNorthwest of R Area
RSE Series E, R-Area Reactor Seepage Basins Northwest of R AreaRSF Series F, R-Area Reactor Seepage Basins Northwest of R AreaRSP R-Area Reactor Seepage Basins Northwest of R AreaRWM M-Area Recovery Wells
SBG S-Area Defense Waste Processing FacilitySCA S-Area Vitrification BuildingSLP S-Area Low-Point Pump Pit At the south end of S AreaSRW Silverton Road Waste Site South of Silverton RoadSSM M-Area Southern SectorTBG T-Area Burying Ground Within the T-Area fenceTCM TNX Permeable Wall Demonstration Well InstallationTIR TNX Intrinsic Remediation PiezometersTNX TNX-Area Assessment WellsTRW TNX-Area Test Recovery Wells

Site IndexSite IndexESH-EMS-2000408ESH-EMS-2000408 Page Page 136136 Fourth Quarter 2000Fourth Quarter 2000
Well Series Site Location
XSB New T-Area (TNX) Seepage Basin In the southwest corner of T Area
YSB Old T-Area (TNX) Seepage Basin In the east section of T Area, across Road A-4.7 miles from the TNX process area
YSC Y-Area Waste Solidification and Disposal Facility North of the intersection of Roads F and 4
ZBG Z-Area Saltstone FacilityZDT Z-Area Low-Point Drain Tank Southeastern S Area
SITE HISTORYSITE HISTORYGeographical descriptions in the text are based on true north rather than SRS grid coordinates.
The following sections describe facilities at approximately 100 locations within designated areas at SRS. Thesections are arranged in the following order:
• acid/caustic basins
• burning/rubble, rubble, and metals burning pits
• coal pile runoff containment basins, ash basins, and coal piles
• disassembly basins
• seepage and retention basins
• operating buildings and facilities
• plume monitoring
• radioactive waste storage and disposal facilities
• sanitary landfill and interim sanitary landfill
• sludge application sites
• other sites
Acid/Caustic BasinsAcid/Caustic BasinsThe acid/caustic basins in F Area, H Area, K Area, L Area, P Area, and R Area are unlined earthen pits(approximately 50 by 50 by 7 feet deep). These pits received dilute sulfuric acid and sodium hydroxide solutionsused to regenerate ion-exchange units in power plant water purification processes at the reactor andseparations areas in the center of SRS. The basins allowed mixing and neutralization of the dilute solutionsbefore their discharge to nearby streams.
The basins were constructed between 1952 and 1955. They are uncovered, and most are dry except duringperiods of prolonged precipitation. The R-Area and L-Area basins were abandoned in 1964 and 1968,respectively. The other basins remained in service until 1982, when the water purification systems either wereshut down or modernized. However, the H-Area basin continued to receive steam condensate from a hose boxand drainage from a chemical pad until the basin was abandoned in 1985. During July through September1993, the F-, H-, K-, and P-Area basins were dewatered, vegetation was removed and disposed of, the basins

Site IndexSite IndexESH-EMS-2000408ESH-EMS-2000408 Page Page 137137 Fourth Quarter 2000Fourth Quarter 2000
were filled with compacted soil from the Burma Road clay pit, a grass cover was established, and the fenceswere reinstalled.
Burning/Rubble, Rubble, and Metals Burning PitsBurning/Rubble, Rubble, and Metals Burning PitsFrom 1951 to 1973, burnable wastes—such as paper, wood, plastics, rubber, oil, degreasers, and drummedsolvents—were received and burned monthly in one or more of the burning/rubble pits in the following areas: A,C, D, F, K, L, N, P, and R. In 1973, waste no longer was burned at the pits, which were covered with a layer ofsoil. Rubble wastes—including paper, wood, cans, concrete, and empty galvanized-steel barrels and drums—then were disposed of in the pits until they reached capacity and were covered with soil. All burning/rubble pitswere inactive by 1981, and all are covered except the R-Area pit, which has not been backfilled. Lithium-aluminum alloy, aluminum pieces, metal drums, other metal scraps, and plastic pipe were deposited andburned periodically in the A-Area metals burning pit, beginning about 1952. In 1974, the solid materialsremaining on the site were covered with soil, and the pit was regraded. The site is inactive.
The Burma Road rubble pit consists of two excavated earthen pits that may contain paint cans, fluorescent lightfixtures, metal, concrete, lumber, poles, and glass. Unknown quantities of refuse were deposited here fromapproximately 1973 through 1983. The pit is inactive and has been covered with soil.
Coal Pile Runoff Containment Basins, Ash Basins, and Coal PilesCoal Pile Runoff Containment Basins, Ash Basins, and Coal PilesElectricity and steam at SRS are generated by burning coal. Coal piles originally existed in the following areas:A, C, D, F, H, K, L, P, and R. The facilities generally contained a 90-day reserve of coal that was not rotated.During long-term exposure to the environment, chemical and biological oxidation of sulfur compounds in coalresulted in the formation of sulfuric acid.
The R-Area coal pile was removed in 1964, and the L-Area coal pile was removed in 1968. To achievecompliance with the National Pollutant Discharge Elimination System (NPDES) permit issued in 1977, coal pilerunoff containment basins in A Area and D Area were completed in October 1978, and basins in C Area, FArea, H Area, K Area, and P Area were completed in March 1981. The coal piles in C Area and F Area wereremoved in 1985. In 1991, the K-Area coal pile was reduced to a 2-inch base, and 75 percent of the P-Area coalpile was removed.
Currently, rainwater runoff from the remaining coal piles in A, D, H, K, and P Areas flows into the coal pile runoffcontainment basins via gravity flow ditches and sewers. The basins allow mixing of the runoff and its seepageinto the subsurface, thus preventing the entry of large surges of low-pH runoff into surface streams. The basinsin C and F Areas also still collect runoff, although no coal remains at either location. Ash sluice water from theD-Area and K-Area powerhouses has been discharged to the D-Area ash basins and the K-Area ash basin,respectively, since 1951.
F-Area Ash BasinF-Area Ash Basin
The F-Area ash basin was monitored for the first time during second quarter 1994.
R-Area Coal PileR-Area Coal Pile
Two wells were installed in 1990 inside the boundaries of the former coal storage area, originally forgroundwater assessment in relation to the R-Area coal pile.
Disassembly BasinsDisassembly BasinsThe disassembly basins, also called fuel and target storage basins, are concrete-lined, open tanks of water nextto the reactor rooms inside the reactor buildings in C, K, L, P, and R Areas. Irradiated assemblies (reactor fueland target rods) were rinsed and stored in the basins prior to their shipment to the separations areas. Someradioactivity was transferred to the basin water from leaks in porous components and as a liquid or oxidecorrosion film on the irradiated components.
Site IndexSite IndexESH-EMS-2000408ESH-EMS-2000408 Page Page 138138 Fourth Quarter 2000Fourth Quarter 2000
Sand filters were used to remove radioactive particulates from the disassembly basin water. The filtered waterwas circulated through deionizers to remove additional constituents and was purged periodically throughregenerated deionizers to the reactor seepage basins.
Seepage and Retention BasinsSeepage and Retention BasinsSeepage, retention, and settling basins have been used at SRS to store or dispose of wastewater from variousoperations. Seepage and retention basins in the following areas are monitored: A, C, F, H, K, L, M, N, P, R, T,and the Savannah River Laboratory.
C-Area Reactor Seepage BasinsC-Area Reactor Seepage Basins
These basins have received low-level radioactive purge water from the disassembly basin since 1957.
F-Area Seepage Basins and Inactive Process Sewer LineF-Area Seepage Basins and Inactive Process Sewer Line
Beginning in 1955, the F-Area seepage basins received F-Area wastewater containing low-level radioactivityand chemicals, including chromium, mercury, nitric acid, and sodium hydroxide. Clay caps were completed in1991 when the basins were closed.
Ford Building Seepage BasinFord Building Seepage Basin
The Ford Building seepage basin received low-level radioactive wastewater from Ford Building operations(repairing heat exchangers) from 1964 to January 1984.
H-Area Retention BasinsH-Area Retention Basins
A small, unlined earthen retention basin (the old H-Area retention basin) was used from 1955 to 1973 to providetemporary emergency storage for cooling water from the chemical separations process that contained radio-nuclides and possible trace quantities of chemicals.
A larger, rubber-lined retention basin replaced the original basin in 1973 and still is in use for receipt of divertedcooling water or tank farm stormwater runoff.
H-Area Seepage Basins and Inactive Process Sewer LineH-Area Seepage Basins and Inactive Process Sewer Line
Starting in 1955, the H-Area seepage basins received wastewater from H Area containing low-level radioactivityand chemicals, including nitric acid, mercury, and sodium hydroxide. Basin 3 has been inactive since 1962.Basins 1, 2, and 4 operated from 1980 until they were taken out of service in the fourth quarter of 1988. Claycaps were completed early in 1991 when the basins were closed.
K-Area Reactor Seepage BasinK-Area Reactor Seepage Basin
This basin has received low-level radioactive purge water from the disassembly basin since 1957.
L-Area Reactor Seepage BasinL-Area Reactor Seepage Basin
This basin has received low-level radioactive purge water from the disassembly basin since 1957.
M-Area Hazardous Waste Management FacilityM-Area Hazardous Waste Management Facility
The unlined M-Area settling basin, in operation from 1958 until 1985, received wastewater containing metal-cleaning solvents, depleted uranium, and other chemicals and metals from fuel fabrication processes in M Area.Because surface water flowed from this basin, it is classified as a settling basin rather than a seepage basin.Water from the basin flowed through an overflow ditch to Lost Lake, a shallow upland depression. A seepagearea formed adjacent to the ditch and Lost Lake. The M-Area hazardous waste management facility comprisesthe settling basin, overflow ditch, seepage area, and Lost Lake. A closure cap was completed on the basinduring 1989/1990.

Site IndexSite IndexESH-EMS-2000408ESH-EMS-2000408 Page Page 139139 Fourth Quarter 2000Fourth Quarter 2000
Since the beginning of a full-scale recovery system for groundwater remediation in April 1985, groundwater flowhas changed markedly near this facility, and changes over time in concentrations of analytes are difficult tointerpret. See the Plume Monitoring section of this chapter for more information on remediation.
Metallurgical Laboratory Seepage BasinMetallurgical Laboratory Seepage Basin
The Metallurgical Laboratory seepage basin received wastewater effluent from the Metallurgical Laboratorybuilding from 1956 until 1985. Wastewater released to the basin consisted of small quantities (5 to 10 gallonsper day) of laboratory wastes—mostly rinse water—from metallographic sample preparation (degreasing,cleaning, etching) and corrosion testing of stainless steel and nickel-based alloys. Noncontact cooling water(approximately 900 gallons per day) also was discharged. The basin has been dewatered, backfilled, andcapped with low-permeability clay.
New T-Area (TNX) Seepage BasinNew T-Area (TNX) Seepage Basin
The new TNX seepage basin replaced the old TNX seepage basin and operated from 1980 to 1988.
Old F-Area Seepage BasinOld F-Area Seepage Basin
The old F-Area seepage basin, the first seepage basin constructed in F Area, was used for disposal of waste-water from the canyon building from November 1954 until May 1955, when it was abandoned. During operation,the seepage basin received a variety of wastewaters, including evaporator overheads, laundry wastewater, andan unknown amount of chemicals. For three months in 1969, spent nitric acid solutions used to etch depleteduranium were discharged to the basin. In 1984, low-level contaminated water was released to the basin.
Old T-Area (TNX) Seepage BasinOld T-Area (TNX) Seepage Basin
The old TNX seepage basin received waste from pilot-scale tests conducted at TNX from 1958 to 1980. In1981, the basin wall was breached and the impounded water was drained into the adjacent wetlands. The basinthen was backfilled with a sand and clay mixture, and the top was capped with clay.
P-Area Reactor Seepage BasinsP-Area Reactor Seepage Basins
These basins have received low-level radioactive purge water from the P-Area disassembly basin since 1957.
R-Area Reactor Seepage BasinsR-Area Reactor Seepage Basins
On November 8, 1957, an experimental fuel element failed during a calorimeter test in the emergency sectionof the R-Area disassembly basin. Following this incident, the original seepage basin received approximately2,700 Ci of nonvolatile beta activity, including strontium-90 and cesium-137, each of which has a half-life ofabout 30 years. Much of the released radioactivity was contained in that basin, which was backfilled inDecember 1957. Five more basins were put into operation in 1957 and 1958 to assist in containing theradioactivity.
In 1960, Basins 2 through 5 were closed and backfilled. The ground surface above Basins 1 through 5 wastreated with herbicide and covered with asphalt. In addition, a kaolinite cap and dike were constructed over andaround Basin 1 and the northwest end of Basin 3 to minimize lateral movement of the radioactive contamina-tion. Basin 6, which received water directly from the disassembly basin from 1960 until 1964, was backfilled in1977.
Savannah River Laboratory Seepage BasinsSavannah River Laboratory Seepage Basins
The Savannah River Laboratory seepage basins received low-level radioactive laboratory wastewater throughunderground drains until they were taken out of service in October 1982. Two basins were put into operation in1954; one more was added in 1958 and another in 1960 to provide additional holding capacity.
An exception to the practice of discharging only low-level alpha or beta-gamma wastewater was made in 1971,when 0.68 Ci of curium from a leaking separator pit in the Savannah River Laboratory radioactive waste tankswas disposed of in the basins. Approximately 34 million gallons of wastewater were discharged to the basinsduring their operating life.

Site IndexSite IndexESH-EMS-2000408ESH-EMS-2000408 Page Page 140140 Fourth Quarter 2000Fourth Quarter 2000
Operating Buildings and FacilitiesOperating Buildings and Facilities
Defense Waste Processing Facility (S-Area Vitrification Building)Defense Waste Processing Facility (S-Area Vitrification Building)
The DWPF, also known as the S-Area vitrification building or S-Area canyon, contains the process and auxiliaryequipment to incorporate high-level radioactive waste into leach-resistant glass. The facility began radioactiveoperations in 1996.
F-Area Canyon Building and A-Line Uranium Recovery FacilityF-Area Canyon Building and A-Line Uranium Recovery Facility
At the canyon building, irradiated product from the reactors is dissolved using nitric acid, and the desiredradionuclides are separated from fission products. At the A-Line uranium recovery facility, adjacent to thecanyon building, uranium oxide is produced from uranyl nitrate.
FF--Area Effluent Treatment Cooling Water BasinArea Effluent Treatment Cooling Water Basin
The F-Area effluent treatment cooling water basin receives diverted cooling water from the separationsprocesses. The cooling water is sent from the basin to the F-Area and H-Area effluent treatment facility (ETF) ifcontaminated or to a permitted outfall if uncontaminated. The ETF, on the south side of H Area, was placed inservice in 1988 to treat wastewater formerly sent to the F-Area and H-Area seepage basins. In addition tocooling water, it also receives separations area stormwater runoff and condensed overheads from theevaporators in the tank farms. The treatment facility removes hazardous and radioactive contaminants fromthese low-level liquid wastes and concentrates them for immobilization as saltstone.
H-Area Auxiliary Pump PitH-Area Auxiliary Pump Pit
The H-Area auxiliary pump pit facility will pump high-level radioactive sludge and precipitate from the H-Areatank farm to the S-Area low-point pump pit en route to the vitrification facility. When the pumps are shut down,this facility will collect the solution in a temporary holding tank via gravity flow lines.
H-Area Canyon BuildingH-Area Canyon Building
As in F Area, materials from the reactors are dissolved at the canyon building, and the desired radionuclidesare separated from waste products.
H-Area Effluent Treatment Cooling Water BasinH-Area Effluent Treatment Cooling Water Basin
For more information, see the F-Area Effluent Treatment Cooling Water Basin section.
K-Area Tritium SumpK-Area Tritium Sump
A single well, installed in 1992, monitors the water table just west of the K-Area reactor. The well was placednear the K-Area process water storage tank, which stores water collected in sumps within the K-Area reactorbuilding. Tritium activity in this sump water has been reported at greater than 5 Ci/mL.
N-Area Hazardous Waste Storage FacilityN-Area Hazardous Waste Storage Facility
Building 645-N of the hazardous waste storage facility has been in service since 1983, 645-2N since 1987, and645-4N since 1984. Buildings 645-N and 645-4N contain hazardous waste, and building 645-2N contains mixedwaste (a mixture of low-level radioactive waste and hazardous waste). Wastes are stored inside the buildings indrums placed on diked concrete floors designed to contain liquid spills.
Naval Fuel Material FacilityNaval Fuel Material Facility
The Naval Fuel Material Facility was used to produce HEU (highly enriched uranium) for naval reactors untilshutdown in 1989. Monitoring wells in the NBG series are located between the canyon building and the NavalFuel Material Facility.
S-Area FacilitiesS-Area Facilities
S-Area contains several facilities for processing high-level radioactive waste from the F-Area and H-Area tankfarms into borosilicate glass solidified within stainless steel canisters. The glass is stored temporarily in

Site IndexSite IndexESH-EMS-2000408ESH-EMS-2000408 Page Page 141141 Fourth Quarter 2000Fourth Quarter 2000
specially designed storage buildings within S Area. Eventual permanent disposal is expected to be in an offsitefederal geologic repository.
S-Area Low-Point Pump PitS-Area Low-Point Pump Pit
The S-Area low-point pump pit receives high-level radioactive sludge and precipitate from the H-Area tank farmand pumps it to the defense waste processing facility (DWPF) vitrification building; it also receives waste beingrecycled from the vitrification building back to the tank farm. As at the H-Area auxiliary pump pit, when thepumps are shut down, the sludge and precipitate remaining in the line drain back into a temporary holding tankvia gravity flow lines.
Z-Area Low-Point Drain TankZ-Area Low-Point Drain Tank
The Z-Area low-point drain tank facility receives low-level radioactive salt solution from the H-Area tank farmand pumps it to the Z-Area salt solution holding tank. When the H-Area pump is shut down, the low-point draintank can collect the solution remaining in the lines via gravity flow.
Z-Area Saltstone Manufacturing and Disposal FacilityZ-Area Saltstone Manufacturing and Disposal Facility
The Z-Area saltstone manufacturing and disposal facility processes and permanently disposes of low-levelradioactive salt solution supernatant from the underground storage tanks at F Area and H Area and from ETFconcentrate.
The facility began radioactive operations in June 1990. In November 1992, a tank in the Z-Area saltstonemanufacturing and disposal facility overflowed, and a portion of the liquid leaked from the building into a stormdrain. Approximately 2 gallons of solution reached a drainage pipe that flows into a series of sedimentationbasins and eventually into McQueen Branch. Sediment samples showed small amounts of cesium-137exceeding those amounts observed in the Savannah River, but within the activity ranges in site streams.
Plume MonitoringPlume Monitoring
A Area and M AreaA Area and M Area
In addition to the groundwater monitoring conducted at specific locations in A Area and M Area, numerousplume definition wells also monitor a 5-square-mile area to assess the extent of volatile organic contamination.The first plume definition wells were installed soon after discovery of the contamination in June 1981.
The plume definition well network extends from the region north of SRTC, between Road 1 and the SRSboundary, south to wells near the miscellaneous chemical basin and the metals burning pit, and from TimsBranch in the east toward the Silverton Road waste site in the west. The plume encompasses approximatelythree square miles and consists primarily of trichloroethylene, tetrachloroethylene, and 1,1,1-trichloroethane.
Separations and Waste Management AreasSeparations and Waste Management Areas
A number of wells were installed in the separations areas in 1951 and 1952. These wells, which range fromapproximately 15 to 90 feet in depth, are used to measure water table elevations and monitor for radioactiveconstituents (gross alpha, nonvolatile beta, and tritium) in the groundwater in and around F Area and H Area.They have steel casings that could affect the metal concentrations in the water.
Radioactive Waste Storage and Disposal FacilitiesRadioactive Waste Storage and Disposal Facilities
Burial GroundsBurial Grounds
The burial grounds have been used for storage and disposal of radioactive solid waste produced at SRS orshipped from other facilities since 1952. The original area, known as the old burial ground, contains low-levelalpha and beta-gamma trenches, intermediate-level beta-gamma trenches, and alpha waste trenches. As thetrenches were filled, they were covered with soil. When the old burial ground was filled in 1974, operationsmoved to the adjacent low-level radioactive waste disposal facility (LLRWDF).

Site IndexSite IndexESH-EMS-2000408ESH-EMS-2000408 Page Page 142142 Fourth Quarter 2000Fourth Quarter 2000
The sections of the LLRWDF currently being operated, known as the Solid Waste Disposal Facility (SWDF),contain trenches for only radioactive waste. Concrete vaults, known as the E-Area vaults, have beenconstructed east and north of the LLRWDF for disposal of solid radioactive waste. The first waste was placedthere in September 1994.
Mixed waste storage building 643/29E, within the boundaries of the LLRWDF, has been in use since March1987. The adjacent mixed waste storage building, 643/43E, was completed in July 1995, and the facility beganreceiving waste later that same month.
Until 1965, transuranic (TRU) waste was placed in plastic bags and cardboard boxes and buried in earthentrenches. Between 1965 and 1974, lower level TRU waste was buried unencapsulated in trenches, and higherlevel TRU waste was buried in retrievable concrete containers or encapsulated in concrete. Since 1974, TRUwastes contaminated with greater than 0.01 Ci/g have been stored in watertight containers on concrete padswith monitoring sumps. TRU waste storage pads 1–19 are on the FFA’s list of RCRA-regulated units.
Since mid-1984, newly generated low-level beta-gamma waste has been placed in metal boxes or metal drums.Currently, it is disposed of in engineered trenches and covered with at least 4 feet of soil. Some wastes that donot have forms that are easily placed in containers are disposed of in shallow land-burial slit trenches.
Mixed wastes stored or disposed of within the old burial ground and portions of the LLRWDF include cadmium,lead, mercury, and tritiated pump oil. Some of the waste is contained in welded stainless steel containers ormetal drums and stored within concrete cylinders. Degraded radioactive organic solvents and tritiated pump oilhave been stored in 22 underground storage tanks in the old burial ground. In addition, two areas of the oldburial ground were used for incineration of solvents.
The burial ground complex, comprising the old burial ground, solvent storage tanks S01–S22, and portions ofthe LLRWDF, is monitored by the following:
Burial Ground Expansion (E-Area Vaults)—This site is located in the northern section of E Area and ismonitored by the BGX well series.
Hazardous Waste/Mixed Waste Disposal Facility—This site is northwest of the burial ground expansion andis monitored by the HMD well series.
Old Burial Ground—The old burial ground is in the southern portion of E Area and is monitored by wells in theBG and BGO well series.
Radioactive Waste Burial Ground—The LLRWDF, which includes the mixed waste management facility(MWMF), is monitored by wells in the BGO well series.
Tank FarmsTank Farms
Liquid radioactive wastes are stored and processed at the tank farms, which comprise subsurface tankscontaining high-level aqueous radioactive wastes in the form of sludges, supernatant liquid of varying saltconcentrations, and saltcake. Approximately 129 million liters of waste are stored in the tanks.
The high-level liquid waste volume is reduced in the tank farm evaporators. Certain tanks are used forpretreatment of the wastes before they are processed at the DWPF into saltstone (low-level waste) or a glassform (high-level waste). As described earlier, saltstone manufacturing and disposal is ongoing; vitrification wastested during 1995, and the DWPF began production operations in 1996. Pretreatment processes at the tankfarms include in-tank precipitation and extended sludge processing.
More information about the function of the tank farms may be found in previous sections of this chapter,including the discussions of the F-Area effluent treatment cooling water basin, the H-Area auxiliary pump pit,S Area, the S-Area low-point pump pit, the DWPF, the Z-Area low-point drain tank, and the Z-Area saltstonemanufacturing and disposal facility.

Site IndexSite IndexESH-EMS-2000408ESH-EMS-2000408 Page Page 143143 Fourth Quarter 2000Fourth Quarter 2000
Because of restrictions on the disposal of purge water, monitoring wells at the tank farms are bailed and notpurged.
F-Area Tank Farm—The F-Area tank farm comprises 22 subsurface tanks. In 1961, Tank 8 was overfilled,causing soil and possible groundwater contamination.
H-Area Tank Farm—The H-Area tank farm comprises 29 subsurface tanks. In 1960, Tank 16 leaked anunknown quantity (a few tens of gallons to a few hundred gallons) of waste into the soil. The tank’s remainingwaste was removed by 1972.
Several other releases of waste from H-Area tanks have occurred, including a spill of approximately 100 gallonsat Tank 13 in 1983. In 1989, approximately 500 pounds of volume-reduced waste leaked from a transfer line atTank 37. The leak sites have been cleaned up or stabilized to prevent the spread of contamination. Both the F-Area and H-Area sites are being monitored for gross alpha, nonvolatile beta, and tritium.
Sanitary Landfill and Interim Sanitary LandfillSanitary Landfill and Interim Sanitary LandfillThe sanitary landfill began receiving waste from office, cafeteria, and industrial activities during 1974. Materialssuch as paper, plastics, rubber, wood, cardboard, rags, metal debris, pesticide bags, empty cans, carcasses,asbestos in bags, and sludge from the site’s wastewater treatment plant are placed in unlined trenches andcovered daily with soil or a fabric substitute. The original section of the landfill and its southern expansion, with atotal area of approximately 54 acres, have been filled. Operations at the portion of approximately 16 acresknown as the northern expansion, or the interim sanitary landfill, were discontinued in November 1994.
Sanitary landfills are intended to receive only nonradioactive, nonhazardous waste. However, until October1992, some hazardous wastes (specifically, solvent-laden rags and wipes used for cleaning, decontamination,and instrument calibration) were buried in portions of the original 32-acre landfill and its southern expansion.
Sludge Application SitesSludge Application SitesThese sites originally were the subject of a research program using domestic sewage sludge to reclaim borrowpits and to enhance forest productivity at SRS. In 1980, sludge was applied to the following application sites:K Area, Kato Road, Lower Kato Road, Orangeburg, PAR Pond, Road F, Sandy (Lucy), Second PAR PondBorrow Pit, and 40-Acre Hardwood. After sludge was applied to the sites, hardwoods and pines were planted toquantify the effectiveness of the sludge as a fertilizer and soil conditioner.
Sludge from Aiken and Augusta municipal wastewater treatment plants was applied to the following sites:F Area, H Area, Kato Road, Lower Kato Road, Orangeburg, Road F, Sandy (Lucy), Second PAR Pond BorrowPit, and 40-Acre Hardwood. Wastewater sludge was applied to the K Area and PAR Pond sites in 1981 and1988. Revegetating of the sites is continuing.
In November 1993, groundwater monitoring was discontinued at the Kato Road, Lower Kato Road, Orangeburg,Road F, Sandy (Lucy), and 40-Acre Hardwood sites because they have not received applications of sewagesludge since 1981, and historical monitoring results show no impact from sludge applications. Monitoring wascanceled after first quarter 1994.
HH-Area Sanitary Sludge Land Application SiteArea Sanitary Sludge Land Application Site
Sewage sludge from SRS sanitary wastewater treatment plants was disposed of at this 13-acre site southeastof H Area from November 1990 to May 1992.
KK-Area and PAR Pond Sludge Land Application Sites (Formerly KArea and PAR Pond Sludge Land Application Sites (Formerly K-Area Borrow Pit andArea Borrow Pit andPAR Pond Borrow Pit Sites)PAR Pond Borrow Pit Sites)
In 1981, sludge from Aiken and Augusta municipal wastewater treatment plants was applied to the K-Area andPAR Pond borrow pits. In 1988, the N-Area sanitary sewage sludge lagoon was closed, and the lagoon sludgewas applied to the K Area and PAR Pond borrow pits. In 1989, the K-Area location (now called the K-Areasludge land application site) was declared a RCRA/CERCLA unit because of the presence of chlordane in thelagoon sludge applied to the site.

Site IndexSite IndexESH-EMS-2000408ESH-EMS-2000408 Page Page 144144 Fourth Quarter 2000Fourth Quarter 2000
Other SitesOther Sites
BB--Area Gas StationArea Gas Station
Elevated benzene, which could be the result of old underground gasoline or diesel storage tanks, has beendetected near B Area. EMS has inspected the area and believes there may be two underground storage tankssoutheast of B Area. The first suspected tank appears to be at an abandoned gas station between Kato Roadand Road C-2. The second appears to be an old diesel tank in front of a storage and laboratory facility.
Baseline Hydrogeologic Investigation Observation Well ClustersBaseline Hydrogeologic Investigation Observation Well Clusters
Wells in the P series that provide baseline hydrogeologic investigation data are located in numerous locationsacross SRS.
Chemicals, Metals, and Pesticides PitsChemicals, Metals, and Pesticides Pits
The chemicals, metals, and pesticides pits were used from 1971 to 1979 to dispose of oil in drums, organicsolvents, and small amounts of pesticides and metals. In 1984, the pits were excavated to form two trenches,backfilled, and capped. During excavation, most of the contaminated material (liquid in original drums, freeliquid placed in drums during excavation, and contaminated soil) was moved to the hazardous waste storagefacility.
DD-Area-Area Oil Disposal Basin Oil Disposal Basin
The D-Area oil disposal basin was constructed in 1952 and received waste oil products from D Area that wereunacceptable for incineration in the powerhouse boilers. These waste oils may have contained hydrogensulfide, chlorinated organics, or other chemicals. In 1975, the oil basin was removed from service and backfilledwith soil.
Interim Waste Technology Site Characterization WellsInterim Waste Technology Site Characterization Wells
Characterization wells monitor interim waste technology sites B, L, Q, and P.
KK--Area Diesel Tank SpillArea Diesel Tank Spill
Following the discovery in 1989 of a leaking buried diesel supply line, most of the diesel-contaminated soil wasremoved from this area except where continued excavation would have jeopardized the structural integrity of anunderground storage tank.
L-Area Acid/Caustic Basin and L-Area Oil and Chemical BasinL-Area Acid/Caustic Basin and L-Area Oil and Chemical Basin
From 1961 to 1979, the L-Area oil and chemical basin received small quantities of radioactive oil and chemicalwaste that could not be discharged to effluent streams, regular seepage basins, or the 200 Areas’ wastemanagement systems. The waste came from throughout SRS, primarily from the reactor areas and thecontaminated-equipment workshop through a pipeline known to have leaked. The basin has been inactive since1979.
M-Area Recovery WellsM-Area Recovery Wells
The RWM well series identifies the M-Area recovery wells. The first wells were installed in 1982 and 1983, withpumps added in 1985. Additional wells were installed in 1985, 1990, 1993, and 1996. The RWM wells pumpcontaminated groundwater to air strippers, which remove volatile organic compounds from the water before it isreturned to the ground.
Miscellaneous Chemical BasinMiscellaneous Chemical Basin
The miscellaneous chemical basin, in operation by 1956, was closed and graded in 1974. No records documentthe materials disposed of at this location. However, soil gas investigations revealed volatile organics in the near-surface soils at the basin. It is assumed that the site was used for disposal of waste solvents, liquid chemicalwastes, and possibly waste oil. The basin is inactive.

Site IndexSite IndexESH-EMS-2000408ESH-EMS-2000408 Page Page 145145 Fourth Quarter 2000Fourth Quarter 2000
Motor Shop Oil BasinMotor Shop Oil Basin
This unlined basin was placed in service in 1977 to receive liquid effluent from the Motor Shop, including tracequantities of engine oil, grease, kerosene, ethylene glycol, and soap. All waste passed through an oil skimmerprior to discharge into the basin. All discharges to the basin were terminated in August 1983. The basin isinactive but collects rainwater during periods of heavy precipitation.
N-Area Diesel Spill Hazardous Waste Storage FacilityN-Area Diesel Spill Hazardous Waste Storage Facility
The tanks have been filled with inert material, and the pipelines have been disconnected at this site.
N-Area Fire Department Training FacilityN-Area Fire Department Training Facility
The fire department training facility, also known as the N-Area burnable-oil basin, is a shallow pit surrounded byan 18-inch-high asphalt dike. It was used from 1979 to 1982 by the SRS Fire Department to train personnel inthe use of firefighting equipment. After this time, the area was excavated and backfilled.
N-Area Hydrofluoric Acid SpillN-Area Hydrofluoric Acid Spill
It is uncertain whether a spill occurred at the hydrofluoric acid spill area or if contaminated soil or containerswere buried there. The spill or burial occurred prior to 1970, and an identification sign is the only evidence thatmaterial was released.
Production WellsProduction Wells
The PW series wells are production wells scattered across SRS.
Road A (Baxley Road) Chemical BasinRoad A (Baxley Road) Chemical Basin
The Road A chemical basin is reported to have received miscellaneous radioactive and chemical aqueouswaste, but no records of the materials disposed of at the basin are available. The basin was closed andbackfilled in 1973. The BRD well series is being monitored for environmental-screening constituents only.
Silverton Road Waste SiteSilverton Road Waste Site
The Silverton Road waste site, south of Silverton Road, was used for disposal of metal shavings, constructiondebris, tires, drums, tanks, and miscellaneous other items. The startup date is unknown, and no records ofwaste disposal activities were kept. Operations at this location ended in 1974, and the waste material is coveredwith soil and vegetation.
TNX Burying GroundTNX Burying Ground
The TNX burying ground was created to dispose of debris from an experimental evaporator that exploded at TArea in 1953. The buried material included contaminated conduit, tin, drums, structural steel, and depleteduranium. Although most of this material was excavated and sent to the LLRWDF between 1980 and 1984, anestimated 27 kg of uranyl nitrate remains buried at this location. See the New TNX Seepage Basin section formore information on the unit.

Site IndexSite IndexESH-EMS-2000408ESH-EMS-2000408 Page Page 146146 Fourth Quarter 2000Fourth Quarter 2000
NOTESNOTES

GlossaryGlossaryESH-EMS-2000408ESH-EMS-2000408 Page Page 147147 Fourth Quarter 2000Fourth Quarter 2000
GlossaryGlossaryAlso see p. B-1 for abbreviations and qualifiers used in the results tables in Appendix B.
2,4-D. 2,4-Dichlorophenoxyacetic acid.
absolute difference. The unsigned result of the subtraction of any two numbers.
accuracy. The degree of agreement between an observed value and an accepted reference value or a measureof the over- or underestimation of reported concentrations.
advisory range. A range of acceptable analytical results established by the provider of known samples.
aerated sample. Groundwater sample supplied or charged with air. Aeration can occur naturally or during wellpumping.
aliquot. A portion of a sample being used for analysis.
analyte. Analyzed constituent.
analytical detection limit. The lowest reasonably accurate concentration of an analyte that can be detected. Thisvalue varies depending on the method, instrument, and dilution used.
APHA. American Public Health Association.
Appendix IX. A list of constituents specified by Appendix IX in the Code of Federal Regulations, Title 40, Part 264(EPA, 1999). Analysis for Appendix IX constituents is required by the Resource Conservation and Recovery Act(RCRA) under specified conditions.
associated samples. Samples analyzed by a laboratory in the same batch with field or laboratory blanks.
ASTM. American Society for Testing and Materials.
bail. To remove water from a well by lowering a container into the water, allowing it to fill with water, and removing itfrom the well.
blank. Aliquot of deionized water generated by laboratory or sampling personnel and analyzed like a groundwatersample. See equipment blank, field blank, laboratory blank, and trip blank.
blank spike. An organic-free water sample spiked with target analytes, extracted, and analyzed with the regularsamples for organic parameters to monitor the performance of all steps in the analysis process.
blind replicate. A second sample taken from a well at the same time as the primary sample and sent to thelaboratory for analysis as an unknown.
BNA. Base/neutral and acid extractables. Groups of organic compounds analyzed as part of the Appendix IX andPriority Pollutants suites; also, a group of compounds that can be analyzed by EPA Method 8270.
Bq/L. Becquerels per liter. A measurement of radioactivity.
cation. Positively charged ion.
CERCLA. Comprehensive Environmental Response, Compensation, and Liability Act, commonly known asSuperfund.

GlossaryGlossaryESH-EMS-2000408ESH-EMS-2000408 Page Page 148148 Fourth Quarter 2000Fourth Quarter 2000
certified value. The known concentration of an analyte in a referenced sample.
CFR. Code of Federal Regulations. Sections of this annual document contain EPA standards and regulations forenvironmental monitoring.
chain-of-custody record. A form that documents the collection, transport, analysis, and disposal of well samples.
common analyses. Common parameters tested for, and generally found, in drinking water.
comparability. An evaluation made by confirming that the laboratories used the same standardized proceduresfor sample preparation and analysis, that the reporting units are the same, and that similar detection and quantita-tion limits were obtained.
completeness. An evaluation based on a comparison of the wells scheduled for sampling to the wells sampled,also a comparison of the requested analyses to the analytical data received.
deionized water. Water from which all charged species or ionizable organic and inorganic salts have beenremoved.
detection limit. See analytical detection limit.
dilution factor. The mathematical factor by which a sample is diluted to bring the concentration of an analyte inthe sample within the analytical range of an instrument (e.g., 1 mL sample + 9 mL solvent = 1:10 dilution, or adilution factor of 10).
DL. See analytical detection limit.
DNAPL. Dense nonaqueous phase liquid.
DOE. U.S. Department of Energy.
drinking water standards. Federal primary and secondary drinking water standards, as set forth by the EPA.
duplicate. Duplicate sample; an aliquot of a primary sample.
duplicate result. A result obtained from identical analyses performed on more than one aliquot of a primarysample.
DWS. See drinking water standards.
E. A code letter used in the analytical data tables that signifies exponential notation (e.g., 3.4E+03 = 3.4 × 103 =3,400).
EM. EPD/EMS Laboratory at SRS.
EMAX Laboratories. EMAX Laboratories, Inc., of Torrance, CA.
EMS. The Environmental Monitoring Section of the Environmental Protection Department at SRS.
EMS code. See qualifier.
Environmental Physics. Environmental Physics, Inc., of Charleston, SC (subcontractor for General Engineering).
environmental-screening analyses. A group of analyses that forms the core of the EPD/EMS GroundwaterMonitoring Program each quarter. See the Sample Scheduling section of this report for a complete list ofconstituents.

GlossaryGlossaryESH-EMS-2000408ESH-EMS-2000408 Page Page 149149 Fourth Quarter 2000Fourth Quarter 2000
EPA. U.S. Environmental Protection Agency.
EPD. Environmental Protection Department at SRS.
EPD/EMS. Environmental Protection Department’s Environmental Monitoring Section at SRS.
EQL. See estimated quantitation limit.
equipment blank. A sample of deionized water that is opened at the sampling location and poured or pumpedthrough the sampling device. Equipment blanks are used to identify possible contaminants in the samplingequipment.
ES. See QST Environmental.
estimated quantitation limit (EQL). The lowest concentration reliably achieved within specified limits of precisionand accuracy during routine laboratory operating conditions. The EQL is generally 5× to 10× the method detectionlimit (MDL); however, it may be nominally chosen within these guidelines to simplify data reporting. For manyanalytes, the EQL analyte concentration is selected as the lowest nonzero standard in the calibration curve.
EX. See EMAX Laboratories.
Fibers/L. Fibers per liter. A unit of measurement for asbestos.
field blank. A sample container of deionized water sent to a laboratory under an alias as a quality control check.
field qualifier. See sample interference field qualifier. Due to space limitations, sample interference fieldqualifiers are referred to as field qualifiers in the analytical results tables in Appendix B.
flagging criteria. Criteria established to help determine the relative concentration and testing frequency foranalytes. See the Flagging Criteria section of this report for further information.
functional guideline code. See qualifier.
gamma PHA. A group of analyses performed to determine activities of gamma-emitting radionuclides.
GC. See Gulf Coast.
GC VOA. Gas chromatographic volatile organics analyses. Also used to refer to a group of volatile organiccompounds that can be analyzed by gas chromatography.
GCMS VOA. Gas chromatograph/mass spectrometer volatile organics analyses. Also used to refer to a group ofvolatile organic compounds analyzed by gas chromatography and mass spectrometry methods.
GE. See General Engineering.
General Engineering. General Engineering Laboratories of Charleston, SC.
General Engineering Laboratories Mobile Laboratory. The Mobile Laboratory, associated with GeneralEngineering Laboratories of Charleston, SC.
GP. See Environmental Physics.
Gulf Coast. Gulf Coast of Chicago, IL (owned by Recra).
halogen. Any of the elements of the halogen family, which consists of fluorine, chlorine, bromine, iodine, andastatine.

GlossaryGlossaryESH-EMS-2000408ESH-EMS-2000408 Page Page 150150 Fourth Quarter 2000Fourth Quarter 2000
herbicides/pesticides. A suite of analyses. See the Sample Scheduling section of this report for furtherinformation.
holding time. The length of time during which an analysis of a sample can be reliably performed. Holding timesvary depending on which constituents are being analyzed.
interlaboratory comparisons. Comparisons conducted between two or more laboratories.
intralaboratory comparisons. Comparisons conducted within a single laboratory.
ion. An isolated electron or positron or an atom or molecule that has acquired a net electric charge by the loss orgain of one or more electrons.
laboratory blank. Deionized water or solvent sample generated by the laboratory. One blank is analyzed with eachbatch of samples as an in-house check of analytical procedures and equipment.
laboratory control sample. A deionized water sample that is spiked with the target analyte, digested, andanalyzed with the regular samples for inorganic parameters to monitor the performance of all steps in the analysisprocess.
MA. See Microanalytical Laboratories.
major ions. A group of analyses performed in the EPD/EMS Groundwater Monitoring Program to determine theconcentrations of calcium, magnesium, potassium, and silica ions and the alkalinity of a sample.
matrix spike. A known quantity of a target analyte added to at least 5% of the samples prior to sample preparationto evaluate the effect of the sample matrix on the analytical procedure.
MDL. See method detection limit.
mean. The arithmetic mean; a single number that typifies a set of numbers.
method detection limit (MDL). A reproducible analyte- and method-specific detection limit: the minimumconcentration of a substance that can be measured and reported with 99% confidence that the analyteconcentration is greater than zero.
mg/L. Milligrams per liter.
µCi. Microcurie; unit of radioactivity equivalent to 3.7 × 10⁴ disintegrations per second.
µCi/mL. Microcuries per milliliter.
µg/L. Micrograms per liter.
µS/cm. Microsiemens per centimeter, equivalent to micromhos per centimeter. The unit of conductance across twopoints, used as the measure of specific conductance in analytical data tables.
Microanalytical Laboratories. Microanalytical Laboratories, Inc., of Gainesville, FL (subcontractor for QSTEnvironmental ).
Microseeps Laboratory. Microseeps Inc., of Pittsburgh, PA
ML. See General Engineering Laboratories Mobile Laboratory.
modifier. See qualifier.

GlossaryGlossaryESH-EMS-2000408ESH-EMS-2000408 Page Page 151151 Fourth Quarter 2000Fourth Quarter 2000
MRD. Mean relative difference. See the Quality Control Samples section of this report for further information.
MS. See Microseeps Inc.
msl. Mean sea level.
NTU. Nephelometric turbidity units. The standard unit of turbidity measurement.
null hypothesis. A statement, which can be tested statistically, of no difference in a characteristic of a populationor distribution.
organic. A chemical compound based on carbon chains or rings and containing hydrogen with or without oxygen,nitrogen, or other elements.
PCB. Polychlorinated biphenyl.
pCi. Picocurie; a unit of radioactivity equivalent to 3.7 × 10⁻² disintegrations per second.
pCi/L. Picocuries per liter.
pCi/mL. Picocuries per milliliter.
piezometer. An instrument used to measure the potentiometric surface of groundwater. Also, a well designed forthis purpose.
plume. A volume of contaminated air or water originating at a point-source emission (e.g., a smokestack) or awaste source (e.g., a hazardous-waste disposal site).
potentiometric surface. The surface to which water in an aquifer would rise by hydrostatic pressure if unconfined.
precision. A measure of the repeatability of a measurement, evaluated from the results of duplicate samples andsplits.
primary laboratory. A laboratory having a contract with EPD/EMS to perform a specific set of analyses; a primarylaboratory may subcontract this work to other laboratories.
purge. To remove water from a well prior to sampling, generally by pumping or bailing. Under the EPD/EMSGroundwater Monitoring Program, two well volumes generally are purged before sampling.
QA. Quality assurance.
QC. Quality control.
QST Environmental. QST Environmental, of Gainesville, FL.
qualifier. A code used to convey additional information about an analytical result. Also called a modifier. Specifictypes include functional guideline codes, STORET codes, and EMS codes. See Appendix B for additionalinformation.
radioisotopes. Radioactive isotopes.
radionuclide. A nuclide at an unstable, high-energy level that seeks a more stable, low-energy level by emittingparticles of energy. Through these emissions, the nuclear configuration decays to simpler nuclides.
RCRA. See Resource Conservation and Recovery Act.

GlossaryGlossaryESH-EMS-2000408ESH-EMS-2000408 Page Page 152152 Fourth Quarter 2000Fourth Quarter 2000
RCRA site. Solid-waste management unit under RCRA regulation.
RDL. See reference detection limit.
Recra LabNet Philadelphia. Recra LabNet Philadelphia, of Lionville, PA.
reference detection limit (RDL). The detection limit chosen to allow comparison of several analyses with differentdetection limits. For the purposes of this report, the individual detection limits of at least 90% of the analyses areless than the reference detection limit. See the Quality Control Samples section of this report for furtherinformation.
relative percent difference (RPD). A commonly used estimate of precision when only two samples are available.Precision is the agreement among a set of replicate measurements without assumption of the true value. Precisionis estimated by means of duplicate analyses.
replicate. Replicate sample. Used in this report to mean only those duplicate samples sent to the laboratory asunknowns. See blind replicate.
representativeness. The quality of exhibiting the average properties of the population being sampled.
Resource Conservation and Recovery Act (RCRA). Federal legislation that regulates the transport, treatment,and disposal of solid and hazardous wastes.
RFI Program. RCRA Facility Investigation Program. EPA-regulated investigation of a solid-waste managementunit with regard to its potential impact on the environment.
RFI/RI Program. RCRA Facility Investigation/Remedial Investigation Program. At SRS, an expansion of the RFIProgram that includes CERCLA and hazardous-substance regulations.
RPD. See relative percent difference.
run date. The calendar date denoting when an analysis is performed.
sample interference field qualifier. See also field qualifier. This describes interferences encountered duringsample collection that could affect analytical results. It is used to qualify analytical data based on field condition.
sample quantitation limit (SQL). The sample-specific EQL, which is the EQL multiplied by factors of concentra-tion, dilution, aliquot size, and percent solids.
sample-specific EQL (ssEQL). The EQL multiplied by factors of concentration, dilution, aliquot size, and percentsolids. Also called the SQL.
sample-specific MDL (ssMDL). The MDL multiplied by factors of concentration, dilution, aliquot size, and percentsolids. For radiological analyses it is known as the sample-specific minimum detectable concentration.
sampling device. Anything used in sampling, especially portable (nondedicated) pumps and bailers. Possiblesource of sample contamination if not cleaned thoroughly between uses.
SCDHEC. South Carolina Department of Health and Environmental Control.
seepage basin. An excavation that receives wastewater. Designed to prevent overflow or surface runoff.
settling basin. A temporary holding basin (excavation) that receives wastewater.
significance of probability. The probability of observing a statistical value as significant as, or more significantthan, the value actually observed.

GlossaryGlossaryESH-EMS-2000408ESH-EMS-2000408 Page Page 153153 Fourth Quarter 2000Fourth Quarter 2000
site custodian. WSRC employee responsible for ensuring that a site is monitored.
SQL. See sample quantitation limit.
SRL. Savannah River Laboratory at SRS; now Savannah River Technology Center (SRTC).
SRP. Savannah River Plant; now Savannah River Site (SRS).
SRS. Savannah River Site.
SRTC. Savannah River Technology Center.
STORET. EPA national database for storage and retrieval of water quality information and monitoring data; someof the qualifiers listed in the Analytical Results section of this report (Appendix B) are based on STORET codes.
STORET code. See qualifier.
surrogate. An organic compound similar in composition and test performance to one of the analytes of interest;known quantities are used in an analysis as a quality assurance measure.
tank farm. An installation of interconnected underground tanks used for storage of high-level radioactive liquidwastes.
Thermo NUtech. Thermo NUtech, of Oak Ridge, TM (subcontractor for Recra LabNet Philadelphia and QSTEnvironmental).
TL. See Triangle Laboratories.
TM. See Thermo NUtech.
TOC. Top of casing. The elevation of the casing at the top of a well; used as a reference for water-levelmeasurements.
Triangle Laboratories. Triangle Laboratories, Inc., of Durham, NC (subcontractor for Environmental Science &Engineering).
trip blank. A sample container of deionized water that is transported to the well sample location, treated as a wellsample, and sent to the laboratory for analysis; trip blanks are used to check for contamination resulting fromtransport, shipping, and site conditions.
t-test. Statistical method used to determine if the means of groups of observations are equal.
turbidity. A measure of the concentration of sediment or suspended particles in solution.
U. Unclassified.
USDWS. U.S. Public Health Service drinking water standard.
validation and verification. The standard, in-depth review process to which laboratory analytical data aresubjected before being used. The data verification process confirms that the required samples were collectedand documented, the required analyses were performed on the samples, and the analytical results werereported correctly. The data validation process determines the usefulness of each analytical result based on QCand method requirements. The information evaluated during this process includes COC forms, analyticalnarrative summaries, and analytical result data files.

GlossaryGlossaryESH-EMS-2000408ESH-EMS-2000408 Page Page 154154 Fourth Quarter 2000Fourth Quarter 2000
volatile organic compounds. A broad range of organic compounds, commonly halogenated, that vaporize atambient, or relatively low, temperatures (e.g., acetone, benzene, chloroform, and methyl alcohol).
WA. See Recra LabNet Philadelphia.
well volume. The volume of water between the well water surface and the bottom of the screen; the volume ofwater standing inside the well casing.
wellhead. The top of a well.
WSRC. Westinghouse Savannah River Company.

ReferencesReferencesESH-EMS-2000408ESH-EMS-2000408 Page Page 155155 Fourth Quarter 2000Fourth Quarter 2000
ReferencesReferencesAmerican Public Health Association, American Water Works Association, and Water Pollution Control Federation.1985. Standard Methods for the Examination of Water and Wastewater, 16th edition. Washington, DC.
American Society for Testing and Materials. 1992. Annual Book of ASTM Standards, Volume 11.02. Philadelphia,PA.
Environmental Protection Agency. 1977. National Interim Primary Drinking Water Regulations, EPA-570/9-76-003.Washington, DC.
Environmental Protection Agency. 1980. Prescribed Procedures for Measurement of Radioactivity in DrinkingWater, EPA-600/4-80-032 (method 901.1). Cincinnati, OH.
Environmental Protection Agency. 1982. Methods for Organic Chemical Analysis of Municipal and IndustrialWastewater, PB83-201798 (method 625). Cincinnati, OH.
Environmental Protection Agency. 1983. Methods for Chemical Analysis of Water and Wastes, PB84-128677(methods 200.7, 282.2, 310.1, 350.1, 351.2, 413.1, 418.1, and 420.1). Cincinnati, OH.
Environmental Protection Agency. 1986a. RCRA Ground-Water Monitoring Technical Enforcement GuidanceDocument, OSWER-9950.1. Washington, DC: Office of Waste Programs Enforcement.
Environmental Protection Agency. 1986b. Test Methods for Evaluating Solid Waste, Volumes 1A, 1B, and 1C, thirdedition, SW-846 (methods 6010, 8080, 8150, 8240, 8270, 8280, 9020, 9030, and 9060). Washington, DC.
Environmental Protection Agency. 1988a. Laboratory Data Validation Functional Guidelines for EvaluatingOrganics Analyses. Washington, DC: Office of Solid Waste and Emergency Response.
Environmental Protection Agency. 1988b. Laboratory Data Validation Functional Guidelines for InorganicsAnalyses, Draft. Washington, DC: Office of Solid Waste and Emergency Response.
Environmental Protection Agency. 1990. “National Primary and Secondary Drinking Water Regulations; SyntheticOrganic Chemicals and Inorganic Chemicals; Proposed Rule” in Federal Register, July 25, 1990, pp.30369−30448. Washington, DC.
Environmental Protection Agency. 1991a. “Guidelines Establishing Test Procedures for the Analysis of Pollutants”in Code of Federal Regulations, Title 40, Part 136, pp. 293−575. Washington, DC.
Environmental Protection Agency. 1991b. National Functional Guidelines for Organic Data Review, Draft.Washington, DC: Office of Solid Waste and Emergency Response.
Environmental Protection Agency. 1991c. “National Primary Drinking Water Regulations; Radionuclides; ProposedFederal Register, July 18, 1991, pp. 33052−33127. Washington, DC.
Environmental Protection Agency. 1991d. Test Method: The Determination of Inorganic Anions in Water by IonChromatography Method 300.0, Revised August 1991. Cincinnati, OH.
Environmental Protection Agency. 1991e USEPA Contract Laboratory Program, Statement of Work (CLP SOW) forOrganics Analysis, Multi-Media, Multi-Concentration, ILM03.0. Washington, DC.
Environmental Protection Agency. 1997a. “National Primary Drinking Water Regulations” in Code of FederalRegulations, pp. 288–432. Washington, DC.

ReferencesReferencesESH-EMS-2000408ESH-EMS-2000408 Page Page 156156 Fourth Quarter 2000Fourth Quarter 2000
Environmental Protection Agency. 1997b. “National Secondary Drinking Water Regulations” in Code of FederalRegulations, pp. 473–474. Washington, DC.
Environmental Protection Agency. 1999. “Standards for Owners and Operators of Hazardous Waste Treatment,Code of Federal Regulations, Title 40, Part 264, App. IX. Washington, DC.
Environmental Protection Agency. 2000a. “National Primary Drinking Water Regulations” in Code of FederalRegulations. Washington, DC.
Environmental Protection Agency. 2000b. “National Secondary Drinking Water Regulations” in Code of FederalRegulations. Washington, DC.
Keith, L.H. 1991. Environmental Sampling and Analysis: A Practical Guide. Chelsea, MI: Lewis Publishers.
South Carolina Department of Health and Environmental Control. 1981. State Primary Drinking Water Regulations,R.61−58.5. Columbia, SC.
U.S. Department of Energy. 1986. Savannah River Plant Environmental Report for 1985, Volumes I and II,DPSPU-86-30-1. Aiken, SC.
U.S. Department of Energy. 1987. Savannah River Plant Environmental Report for 1986, Volumes I and II,DPSPU-87-30-1. Aiken, SC.
U.S. Department of Energy. 1988a. Geohydrology Program Report. Aiken, SC: Environmental Division, SavannahRiver Operations Office.
U.S. Department of Energy. 1988b. Savannah River Plant Environmental Report for 1987, Volumes I and II,DPSPU-88-30-1. Aiken, SC.
U.S. Department of Energy. 1989a. Geoscience Implementation Plan. Aiken, SC: Environmental Division,Savannah River Operations Office.
U.S. Department of Energy. 1989b. Savannah River Site Environmental Report for 1988, Volumes I and II, WSRC-RP-89-59-1. Aiken, SC.
Westinghouse Savannah River Company. Environmental Geochemistry Group Operating Handbook, Section1.800, “Analytical Data Qualification,” October 19, 1998. ESH-EMS-970437. Aiken, SC.

AddendumAddendumESH-EMS-2000408ESH-EMS-2000408 Page Page 157157 Fourth Quarter 2000Fourth Quarter 2000
Addendum: MS Third Quarter ResultsAddendum: MS Third Quarter ResultsQuality Control StandardsQuality Control StandardsDuring third quarter 2000, EPD/EMS conducted quality assessments of EM, EX, GE, WA, ML, and MSlaboratories. Each laboratory received a set of certified environmental quality control standards fromEnvironmental Resource Associates (ERA) of Arvada, CO (lot numbers 442, 584, 587, 590, 3229, 3230, 3432,3438, 8922, 9989, 99101, and 99102). Each laboratory’s results were compared with the ERA-certified valuesand performance acceptance limits (PALs). The PALs are listed as guidelines for acceptable analytical resultsgiven the limitations of the EPA methods used to determine these parameters. The PALs closely approximatethe 95% confidence interval. Because MS results arrived after publication of the third quarter report, thisaddendum includes them. MS results and the certified values and limits are listed in table 84.
MS does not perform the following analyses: cations, grease and oil, herbicides, inorganics, nutrients, andturbidity. Consequently, the laboratory was not requested to report the results for these analyses. MS was notasked to perform analyses for phenols, total petroleum hydrocarbons, trace metals, and xylenes.
Forty-five analyses were requested of MS. MS reported results for all 45, of which 42, or 93.3%, were within thePALs. The results included, in addition to those requested on the delivery order, analyses for 19 trace metals;the trace metal results all fell within the PALs.
Table 84.Table 84. Quality Control Standards for Selected AnalQuality Control Standards for Selected Analyses for MSyses for MS
AnalyteCertifiedValue
PerformanceAcceptance Limits
MSResult
FunctionalGuideline Code
Acids (Lot 590)
2-Chlorophenol (µg/L) 88.8 36.5–99.8 55.0o-Cresol (2-Methylphenol) (µg/L) 133 42.3–154 73.0Pentachlorophenol (µg/L) 93.6 29.1–118 75.02,4,5-Trichlorophenol (µg/L) 82.1 32.3–94.9 66.02,4,6-Trichlorophenol (µg/L) 72.8 31.4–83.4 61.0
Base/Neutrals (Lot 590)
Anthracene (µg/L) 65.3 30.8–76.1 51.0Benzo[a]anthracene (µg/L) 56.8 23.8–67.5 50.0Bis(2-ethylhexyl) phthalate (µg/L) 50.1 20.2–63.9 49.0Chrysene (µg/L) 39.9 18.4–48.9 38.0Dibenzofuran (µg/L) 30.2 14.4–33.5 24.01,2-Dichlorobenzene (µg/L) 120 28.1–137 61.0Diethylphthalate (µg/L) 50.4 12.1–65.0 47.02,4-Dinitrotoluene (µg/L) 134 56.1–154 95.02,6-Dinitrotoluene (µg/L) 97.6 50.1–111 73.0Naphthalene (µg/L) 145 51.4–165 90.0N-Nitrosodi-n-propylamine (µg/L) 110 46.5–135 69.0Phenanthrene (µg/L) 73.2 39.6–84.3 60.0Pyrene (µg/L) 27.9 13.0–33.9 29.01,2,4-Trichlorobenzene (µg/L) 123 35.9–140 70.0
Cations (Lot 442)
Calcium (µg/L) 19,500 17,600–21,500 †Magnesium (µg/L) 15,900 14,200–17,600 †Potassium (µg/L) 28,200 25,700–30,700 †Sodium (µg/L) 22,300 19,600–25,000 †
Cyanide and Phenol (Lot 9989)
Cyanide, total (µg/L) 785 573–997 †

AddendumAddendumESH-EMS-2000408ESH-EMS-2000408 Page Page 158158 Fourth Quarter 2000Fourth Quarter 2000
AnalyteCertifiedValue
PerformanceAcceptance Limits
MSResult
FunctionalGuideline Code
Phenols (µg/L) 377 286–467 †
Grease and Oil (Lot 99102)
Grease and oil (gravimetric) (mg/bottle) 17.8 10.7–22.2 †
Herbicides (Lot 3230)
2-sec-Butyl-4,6-dinotrophenol (µg/L) 15.1 4.95–19.5 †2,4-Dichlorophenoxyacetic acid (µg/L) 9.27 4.64–13.9 †2,4,5-TP (Silvex) (µg/L) 14.7 7.35–22.1 †
Inorganics (Lot 3438)
Alkalinity (as CaCO3) (µg/L) 79,000 73,500–88,900 †Bromide (µg/L) 255 227–288 †Chloride (µg/L) 6,010 5,340–6,780 †Fluoride (µg/L) 2,890 2,600–3,180 †Nitrate as nitrogen (µg/L) 9,060 8,150–10,000 †pH (pH units) 9.13 8.93–9.33 †Potassium (µg/L) 31,300 26,900–36,500 †Sodium (µg/L) 66,500 60,100–73,700 †Specific conductance (µS/cm) 383 320–436 †Sulfate (µg/L) 54,900 47,000–62,000 †Total dissolved solids (µg/L) 353,000 289,000–395,000 †
Nutrients (Lot 99102)
Ammonia as nitrogen (µg/L) 17,800 14,900–20,600 †Nitrate-nitrite as nitrogen (µg/L) 5,390 4,800–5,990 †Total phosphates (as P) (µg/L) 2,360 2,010–2,720 †
PCBs (Lot 584)
PCB 1248 (µg/L) 5.35 2.87–6.92 3.2
Pesticides (Lot 3229)
Aldrin (µg/L) 1.12 0.616–1.62 0.96Dieldrin (µg/L) 1.27 0.699–1.84 1.20Endrin (µg/L) 0.631 0.442–0.82 0.88 uHeptachlor (µg/L) 1.79 0.985–2.60 1.90Heptachlor epoxide (µg/L) 0.953 0.524–1.38 1.20Lindane (gamma-BHC) (µg/L) 1.02 0.561–1.48 0.96Methoxychlor (µg/L) 20.7 11.4–30.0 25.0
Total Petroleum Hydrocarbons (Lot 8922)
Total petroleum hydrocarbons, infrared (mg/L) 54.6 34.0–70.8 †
Toxaphene (Lot 3229)
Toxaphene (µg/L) 8.18 4.50–11.9 †
Trace Metals (Lot 99101)
Aluminum (µg/L) 797 654–940 †800Antimony (µg/L) 254 191–300 †250Arsenic (µg/L) 388 291–458 †450Barium (µg/L) 791 649–933 †790Beryllium (µg/L) 456 374–538 †450Boron (µg/L) 242 198–301 †Cadmium (µg/L) 167 137–197 †170Chromium (µg/L) 493 404–581 †500Cobalt (µg/L) 954 782–1,130 †990Copper (µg/L) 86.6 71.0–102 †80.0

AddendumAddendumESH-EMS-2000408ESH-EMS-2000408 Page Page 159159 Fourth Quarter 2000Fourth Quarter 2000
AnalyteCertifiedValue
PerformanceAcceptance Limits
MSResult
FunctionalGuideline Code
Iron (µg/L) 1,240 1,020–1,460 †1,200Lead (µg/L) 605 496–714 †630Manganese (µg/L) 571 468–674 †570Mercury (µg/L) 5.97 4.47–7.46 †5.90Molybdenum (µg/L) 548 449–646 †Nickel (µg/L) 2,490 2,050–2,940 †2,600Selenium (µg/L) 1,480 1,110–1,750 †1,500Silver (µg/L) 513 421–606 †540Strontium (µg/L) 256 210–302 †Thallium (µg/L) 321 241–379 †340Vanadium (µg/L) 228 187–269 †230Zinc (µg/L) 1,340 1,100–1,580 †1,400
Turbidity (Lot 3432)
Turbidity (NTU) 1.50 1.28–1.75 †
Volatiles (Lot 587)
Benzene (µg/L) 62.2 48.2–77.5 50.0Bromodichloromethane (µg/L) 15.8 12.1–19.6 14.0Bromoform (µg/L) 76.4 55.9–98.3 65.0Carbon tetrachloride (µg/L) 108 79.3–134 <5.0 uChlorobenzene (µg/L) 16.0 12.5–19.1 13.0Chloroform (µg/L) 63.8 49.0–78.0 58.0Dibromochloromethane (µg/L) 97.1 75.6–120 83.01,2-Dichlorobenzene (µg/L) 56.8 43.2–69.8 †1,3-Dichlorobenzene (µg/L) 49.9 38.2–60.1 †1,4-Dichlorobenzene (µg/L) 110 82.6–134 †1,1-Dichloroethane (µg/L) 25.5 18.3–32.4 25.01,2-Dichloroethane (µg/L) 137 107–173 130Dichloromethane (Methylene chloride) (µg/L) 83.7 59.2–109 82.01,2-Dichloropropane 24.3 18.3–29.8 21.0Ethylbenzene (µg/L) 63.4 47.4–74.0 52.04-Methyl-2-pentanone (MIBK) (µg/L) 59.4 34.4–81.1 50.0Styrene 36.8 25.6–44.8 34.0Tetrachloroethylene (µg/L) 36.7 27.1–44.3 31.0Toluene (µg/L) 132 102–159 <100 u1,1,1-Trichloroethane (µg/L) 85.4 61.7–102 72.0Trichloroethylene (µg/L) 85.9 63.8–104 74.0p-Xylene (µg/L) 144 93.2–181 120†
† The laboratory was not asked to report the results for this analysis.u Result is out of range.

Appendix A. Water-Level DataAppendix A. Water-Level DataESH-EMS-2000408ESH-EMS-2000408 Page Page 11 Fourth Quarter 2000Fourth Quarter 2000
Appendix A. Water-Level DataAppendix A. Water-Level DataDuring fourth quarter 2000, water-level measurements were obtained for hydrogeologic projects. Most of thedata presented on the following pages were obtained as concurrent data for hydrogeologic interpretation in theA/M and F/H areas. Only water levels were measured for this project; no field tests of water characteristics wereconducted. RCS Corporation of Aiken, SC, collected the data.

Appendix A. Water-Level DataAppendix A. Water-Level DataESH-EMS-2000408ESH-EMS-2000408 Page Page 22 Fourth Quarter 2000Fourth Quarter 2000
NOTESNOTES

WATER-LEVEL DATAWATER-LEVEL DATA
ESH-EMS-2000408ESH-EMS-2000408 A-A-33 Fourth Quarter 2000Fourth Quarter 2000
WELL ABP 2AMEASUREMENTS CONDUCTED IN THE FIELD
Sample date: 12/30/00 Time: 14:20Depth to water: 152.96 ft (46.62m) below TOCWater elevation: 218.94 ft (66.73m) msl
WELL ABP 3CMEASUREMENTS CONDUCTED IN THE FIELD
Sample date: 12/30/00 Time: 14:14Depth to water: 160.88 ft (49.04m) below TOCWater elevation: 193.62 ft (59.02m) msl
WELL ABP 8CMEASUREMENTS CONDUCTED IN THE FIELD
Sample date: 12/30/00 Time: 14:22Depth to water: 178.97 ft (54.55m) below TOCWater elevation: 193.13 ft (58.87m) msl
WELL AC 2AMEASUREMENTS CONDUCTED IN THE FIELD
Sample date: 12/27/00 Time: 11:12Depth to water: 127.81 ft (38.96m) below TOCWater elevation: 216.89 ft (66.11m) msl
WELL AC 2BMEASUREMENTS CONDUCTED IN THE FIELD
Sample date: 12/27/00 Time: 11:12Depth to water: 120.06 ft (36.59m) below TOCWater elevation: 224.74 ft (68.50m) msl
WELL AC 3AMEASUREMENTS CONDUCTED IN THE FIELD
Sample date: 12/30/00 Time: 11:36Depth to water: 95.94 ft (29.24m) below TOCWater elevation: 206.36 ft (62.90m) msl
WELL AC 3BMEASUREMENTS CONDUCTED IN THE FIELD
Sample date: 12/30/00 Time: 11:36Depth to water: 94.17 ft (28.70m) below TOCWater elevation: 208.33 ft (63.50m) msl
WELL ACB 2AMEASUREMENTS CONDUCTED IN THE FIELD
Sample date: 12/29/00 Time: 14:45Depth to water: Not availableWater elevation: 349.8 ft (106.62m) msl
WELL AMB 4AMEASUREMENTS CONDUCTED IN THE FIELD
Sample date: 12/31/00 Time: 15:31Depth to water: 166.58 ft (50.77m) below TOCWater elevation: 213.92 ft (65.20m) msl
WELL AMB 4BMEASUREMENTS CONDUCTED IN THE FIELD
Sample date: 12/31/00 Time: 15:32Depth to water: 160.62 ft (48.96m) below TOCWater elevation: 219.78 ft (66.99m) msl
WELL AMB 4DMEASUREMENTS CONDUCTED IN THE FIELD
Sample date: 12/31/00 Time: 15:33Depth to water: 154.02 ft (46.95m) below TOCWater elevation: 226.28 ft (68.97m) msl
WELL AMB 7MEASUREMENTS CONDUCTED IN THE FIELD
Sample date: 12/31/00 Time: 15:33Depth to water: 140.39 ft (42.79m) below TOCWater elevation: 229.51 ft (69.96m) msl
WELL AMB 7AMEASUREMENTS CONDUCTED IN THE FIELD
Sample date: 12/31/00 Time: 15:33Depth to water: 159.8 ft (48.71m) below TOCWater elevation: 213.8 ft (65.17m) msl
WELL AMB 7BMEASUREMENTS CONDUCTED IN THE FIELD
Sample date: 12/31/00 Time: 15:34Depth to water: 152.9 ft (46.60m) below TOCWater elevation: 220.1 ft (67.09m) msl
WELL AMB 9DMEASUREMENTS CONDUCTED IN THE FIELD
Sample date: 12/31/00 Time: 15:34Depth to water: 140.65 ft (42.87m) below TOCWater elevation: 227.25 ft (69.27m) msl
WELL AMB 10AMEASUREMENTS CONDUCTED IN THE FIELD
Sample date: 12/31/00 Time: 15:34Depth to water: 152.15 ft (46.38m) below TOCWater elevation: 214.35 ft (65.33m) msl

WATER-LEVEL DATAWATER-LEVEL DATA
ESH-EMS-2000408ESH-EMS-2000408 A-A-44 Fourth Quarter 2000Fourth Quarter 2000
WELL AMB 10BMEASUREMENTS CONDUCTED IN THE FIELD
Sample date: 12/31/00 Time: 15:35Depth to water: 147.85 ft (45.07m) below TOCWater elevation: 218.55 ft (66.61m) msl
WELL AMB 12DMEASUREMENTS CONDUCTED IN THE FIELD
Sample date: 12/31/00 Time: 15:35Depth to water: 139.92 ft (42.65m) below TOCWater elevation: 229.88 ft (70.07m) msl
WELL AMB 13ARMEASUREMENTS CONDUCTED IN THE FIELD
Sample date: 12/31/00 Time: 15:35Depth to water: 150.1 ft (45.75m) below TOCWater elevation: 215 ft (65.53m) msl
WELL AMB 15DMEASUREMENTS CONDUCTED IN THE FIELD
Sample date: 12/31/00 Time: 15:36Depth to water: 153.25 ft (46.71m) below TOCWater elevation: 230.15 ft (70.15m) msl
WELL AMB 16DMEASUREMENTS CONDUCTED IN THE FIELD
Sample date: 12/31/00 Time: 15:36Depth to water: 152.05 ft (46.35m) below TOCWater elevation: 228.35 ft (69.60m) msl
WELL AMB 17AMEASUREMENTS CONDUCTED IN THE FIELD
Sample date: 12/31/00 Time: 15:36Depth to water: 165.1 ft (50.32m) below TOCWater elevation: 214 ft (65.23m) msl
WELL AMB 18AMEASUREMENTS CONDUCTED IN THE FIELD
Sample date: 12/31/00 Time: 15:37Depth to water: 163.45 ft (49.82m) below TOCWater elevation: 213.85 ft (65.18m) msl
WELL AMB 18CMEASUREMENTS CONDUCTED IN THE FIELD
Sample date: 12/31/00 Time: 15:37Depth to water: 147.29 ft (44.89m) below TOCWater elevation: 228.71 ft (69.71m) msl
WELL AMB 19CMEASUREMENTS CONDUCTED IN THE FIELD
Sample date: 12/31/00 Time: 15:37Depth to water: 139.05 ft (42.38m) below TOCWater elevation: 224.65 ft (68.47m) msl
WELL AOB 1MEASUREMENTS CONDUCTED IN THE FIELD
Sample date: 12/28/00 Time: 16:31Depth to water: Not availableWater elevation: 341.1 ft (103.97m) msl
WELL AOB 2MEASUREMENTS CONDUCTED IN THE FIELD
Sample date: 12/28/00 Time: 16:33Depth to water: Not availableWater elevation: 345.4 ft (105.28m) msl
WELL AOB 2MEASUREMENTS CONDUCTED IN THE FIELD
Sample date: 12/29/00 Time: 14:38Depth to water: 115.55 ft (35.22m) below TOCWater elevation: 229.85 ft (70.06m) msl
WELL AOB 3MEASUREMENTS CONDUCTED IN THE FIELD
Sample date: 12/28/00 Time: 16:45Depth to water: 121.35 ft (36.99m) below TOCWater elevation: 231.25 ft (70.49m) msl
WELL ARP 1AMEASUREMENTS CONDUCTED IN THE FIELD
Sample date: 12/30/00 Time: 15:38Depth to water: 140.22 ft (42.74m) below TOCWater elevation: 214.88 ft (65.50m) msl
WELL ARP 2MEASUREMENTS CONDUCTED IN THE FIELD
Sample date: 12/30/00 Time: 15:29Depth to water: 122.75 ft (37.41m) below TOCWater elevation: 214.55 ft (65.40m) msl
WELL ARP 3MEASUREMENTS CONDUCTED IN THE FIELD
Sample date: 12/30/00 Time: 15:23Depth to water: 122.99 ft (37.49m) below TOCWater elevation: 216.81 ft (66.08m) msl

WATER-LEVEL DATAWATER-LEVEL DATA
ESH-EMS-2000408ESH-EMS-2000408 A-A-55 Fourth Quarter 2000Fourth Quarter 2000
WELL ARP 4MEASUREMENTS CONDUCTED IN THE FIELD
Sample date: 12/30/00 Time: 15:42Depth to water: 133.72 ft (40.76m) below TOCWater elevation: 214.68 ft (65.44m) msl
WELL ASB 1AMEASUREMENTS CONDUCTED IN THE FIELD
Sample date: 12/31/00 Time: 15:38Depth to water: 113.72 ft (34.66m) below TOCWater elevation: 235.38 ft (71.74m) msl
WELL ASB 2ARMEASUREMENTS CONDUCTED IN THE FIELD
Sample date: 12/31/00 Time: 15:38Depth to water: 121.61 ft (37.07m) below TOCWater elevation: 233.99 ft (71.32m) msl
WELL ASB 2CRMEASUREMENTS CONDUCTED IN THE FIELD
Sample date: 12/31/00 Time: 15:38Depth to water: 136.75 ft (41.68m) below TOCWater elevation: 218.85 ft (66.71m) msl
WELL ASB 3ARMEASUREMENTS CONDUCTED IN THE FIELD
Sample date: 12/31/00 Time: 15:39Depth to water: 107.45 ft (32.75m) below TOCWater elevation: 234.15 ft (71.37m) msl
WELL ASB 3CRMEASUREMENTS CONDUCTED IN THE FIELD
Sample date: 12/31/00 Time: 15:39Depth to water: 123.25 ft (37.57m) below TOCWater elevation: 218.25 ft (66.52m) msl
WELL ASB 4MEASUREMENTS CONDUCTED IN THE FIELD
Sample date: 12/31/00 Time: 15:39Depth to water: 102.65 ft (31.29m) below TOCWater elevation: 232.95 ft (71.00m) msl
WELL ASB 5ARMEASUREMENTS CONDUCTED IN THE FIELD
Sample date: 12/31/00 Time: 15:40Depth to water: 114.85 ft (35.01m) below TOCWater elevation: 232.15 ft (70.76m) msl
WELL ASB 5CMEASUREMENTS CONDUCTED IN THE FIELD
Sample date: 12/31/00 Time: 15:40Depth to water: 129.32 ft (39.42m) below TOCWater elevation: 217.98 ft (66.44m) msl
WELL ASB 6AMEASUREMENTS CONDUCTED IN THE FIELD
Sample date: 12/31/00 Time: 15:40Depth to water: 114.31 ft (34.84m) below TOCWater elevation: 235.89 ft (71.90m) msl
WELL ASB 6AAMEASUREMENTS CONDUCTED IN THE FIELD
Sample date: 12/31/00 Time: 15:40Depth to water: 141.6 ft (43.16m) below TOCWater elevation: 212.6 ft (64.80m) msl
WELL ASB 6CMEASUREMENTS CONDUCTED IN THE FIELD
Sample date: 12/31/00 Time: 15:41Depth to water: 133.9 ft (40.81m) below TOCWater elevation: 219.7 ft (66.97m) msl
WELL ASB 6TAMEASUREMENTS CONDUCTED IN THE FIELD
Sample date: 12/31/00 Time: 15:41Depth to water: 147.09 ft (44.83m) below TOCWater elevation: 205.81 ft (62.73m) msl
WELL ASB 8MEASUREMENTS CONDUCTED IN THE FIELD
Sample date: 12/31/00 Time: 15:41Depth to water: 119.45 ft (36.41m) below TOCWater elevation: 229.55 ft (69.97m) msl
WELL ASB 8AMEASUREMENTS CONDUCTED IN THE FIELD
Sample date: 12/31/00 Time: 15:42Depth to water: 136.69 ft (41.66m) below TOCWater elevation: 212.61 ft (64.80m) msl
WELL ASB 8BMEASUREMENTS CONDUCTED IN THE FIELD
Sample date: 12/31/00 Time: 15:42Depth to water: 137.95 ft (42.05m) below TOCWater elevation: 211.85 ft (64.57m) msl

WATER-LEVEL DATAWATER-LEVEL DATA
ESH-EMS-2000408ESH-EMS-2000408 A-A-66 Fourth Quarter 2000Fourth Quarter 2000
WELL ASB 8CMEASUREMENTS CONDUCTED IN THE FIELD
Sample date: 12/31/00 Time: 15:42Depth to water: 135.01 ft (41.15m) below TOCWater elevation: 214.69 ft (65.44m) msl
WELL ASB 8TAMEASUREMENTS CONDUCTED IN THE FIELD
Sample date: 12/31/00 Time: 15:44Depth to water: 140.45 ft (42.81m) below TOCWater elevation: 209.15 ft (63.75m) msl
WELL ASB 9MEASUREMENTS CONDUCTED IN THE FIELD
Sample date: 12/30/00 Time: 11:36Depth to water: 74.19 ft (22.61m) below TOCWater elevation: 234.81 ft (71.57m) msl
WELL ASB 9MEASUREMENTS CONDUCTED IN THE FIELD
Sample date: 12/31/00 Time: 15:43Depth to water: Not availableWater elevation: 309 ft (94.18m) msl
WELL ASB 9MEASUREMENTS CONDUCTED IN THE FIELD
Sample date: 12/31/00 Time: 15:43Depth to water: Not availableWater elevation: 309 ft (94.18m) msl
WELL ASB 9BMEASUREMENTS CONDUCTED IN THE FIELD
Sample date: 12/31/00 Time: 15:44Depth to water: 93.75 ft (28.58m) below TOCWater elevation: 215.25 ft (65.61m) msl
WELL ASB 9CMEASUREMENTS CONDUCTED IN THE FIELD
Sample date: 12/31/00 Time: 15:44Depth to water: 94.45 ft (28.79m) below TOCWater elevation: 215.45 ft (65.67m) msl
WELL ASB 10CRMEASUREMENTS CONDUCTED IN THE FIELD
Sample date: 12/31/00 Time: 15:45Depth to water: 131.75 ft (40.16m) below TOCWater elevation: 217.45 ft (66.28m) msl
WELL BGO 1DMEASUREMENTS CONDUCTED IN THE FIELD
Sample date: 12/30/00 Time: 6:58Depth to water: 54.95 ft (16.75m) below TOCWater elevation: 240.15 ft (73.20m) msl
WELL BGO 2DMEASUREMENTS CONDUCTED IN THE FIELD
Sample date: 12/30/00 Time: 6:59Depth to water: 55.05 ft (16.78m) below TOCWater elevation: 244.35 ft (74.48m) msl
WELL BGO 3AMEASUREMENTS CONDUCTED IN THE FIELD
Sample date: 12/30/00 Time: 7:00Depth to water: 130.18 ft (39.68m) below TOCWater elevation: 161.72 ft (49.29m) msl
WELL BGO 3CMEASUREMENTS CONDUCTED IN THE FIELD
Sample date: 12/30/00 Time: 7:00Depth to water: 67 ft (20.42m) below TOCWater elevation: 224.9 ft (68.55m) msl
WELL BGO 3DRMEASUREMENTS CONDUCTED IN THE FIELD
Sample date: 12/30/00 Time: 7:01Depth to water: 62.3 ft (18.99m) below TOCWater elevation: 229.2 ft (69.86m) msl
WELL BGO 4DMEASUREMENTS CONDUCTED IN THE FIELD
Sample date: 12/30/00 Time: 7:01Depth to water: 67.03 ft (20.43m) below TOCWater elevation: 230.47 ft (70.25m) msl
WELL BGO 5CMEASUREMENTS CONDUCTED IN THE FIELD
Sample date: 12/30/00 Time: 7:02Depth to water: 83.72 ft (25.52m) below TOCWater elevation: 212.38 ft (64.73m) msl
WELL BGO 5DMEASUREMENTS CONDUCTED IN THE FIELD
Sample date: 12/30/00 Time: 7:02Depth to water: 69.39 ft (21.15m) below TOCWater elevation: 226.91 ft (69.16m) msl

WATER-LEVEL DATAWATER-LEVEL DATA
ESH-EMS-2000408ESH-EMS-2000408 A-A-77 Fourth Quarter 2000Fourth Quarter 2000
WELL BGO 6AMEASUREMENTS CONDUCTED IN THE FIELD
Sample date: 12/30/00 Time: 7:03Depth to water: 127.69 ft (38.92m) below TOCWater elevation: 157.91 ft (48.13m) msl
WELL BGO 6BMEASUREMENTS CONDUCTED IN THE FIELD
Sample date: 12/30/00 Time: 7:03Depth to water: 71.31 ft (21.74m) below TOCWater elevation: 215.49 ft (65.68m) msl
WELL BGO 6CMEASUREMENTS CONDUCTED IN THE FIELD
Sample date: 12/30/00 Time: 7:04Depth to water: 69.64 ft (21.23m) below TOCWater elevation: 215.96 ft (65.83m) msl
WELL BGO 6DMEASUREMENTS CONDUCTED IN THE FIELD
Sample date: 12/30/00 Time: 7:04Depth to water: 57.23 ft (17.44m) below TOCWater elevation: 228.27 ft (69.58m) msl
WELL BGO 7DMEASUREMENTS CONDUCTED IN THE FIELD
Sample date: 12/30/00 Time: 7:05Depth to water: 58.6 ft (17.86m) below TOCWater elevation: 228.4 ft (69.62m) msl
WELL BGO 8ARMEASUREMENTS CONDUCTED IN THE FIELD
Sample date: 12/30/00 Time: 7:06Depth to water: 127.18 ft (38.76m) below TOCWater elevation: 159.42 ft (48.59m) msl
WELL BGO 8CMEASUREMENTS CONDUCTED IN THE FIELD
Sample date: 12/30/00 Time: 7:06Depth to water: 68.08 ft (20.75m) below TOCWater elevation: 219.82 ft (67.00m) msl
WELL BGO 8DMEASUREMENTS CONDUCTED IN THE FIELD
Sample date: 12/30/00 Time: 7:06Depth to water: 59.29 ft (18.07m) below TOCWater elevation: 228.51 ft (69.65m) msl
WELL BGO 9AAMEASUREMENTS CONDUCTED IN THE FIELD
Sample date: 12/21/00 Time: 15:52Depth to water: 128.22 ft (39.08m) below TOCWater elevation: 156.58 ft (47.73m) msl
WELL BGO 9DMEASUREMENTS CONDUCTED IN THE FIELD
Sample date: 12/21/00 Time: 15:48Depth to water: 59 ft (17.98m) below TOCWater elevation: 226.1 ft (68.92m) msl
WELL BGO 10AAMEASUREMENTS CONDUCTED IN THE FIELD
Sample date: 12/21/00 Time: 15:56Depth to water: 144.32 ft (43.99m) below TOCWater elevation: 156.38 ft (47.67m) msl
WELL BGO 10ARMEASUREMENTS CONDUCTED IN THE FIELD
Sample date: 12/21/00 Time: 15:44Depth to water: 143.55 ft (43.75m) below TOCWater elevation: 156.95 ft (47.84m) msl
WELL BGO 10BMEASUREMENTS CONDUCTED IN THE FIELD
Sample date: 12/21/00 Time: 15:58Depth to water: 85.22 ft (25.98m) below TOCWater elevation: 215.78 ft (65.77m) msl
WELL BGO 10CMEASUREMENTS CONDUCTED IN THE FIELD
Sample date: 12/21/00 Time: 15:44Depth to water: 85.6 ft (26.09m) below TOCWater elevation: 215.7 ft (65.75m) msl
WELL BGO 10DRMEASUREMENTS CONDUCTED IN THE FIELD
Sample date: 12/21/00 Time: 15:45Depth to water: 72.35 ft (22.05m) below TOCWater elevation: 228.05 ft (69.51m) msl
WELL BGO 11DRMEASUREMENTS CONDUCTED IN THE FIELD
Sample date: 12/21/00 Time: 15:39Depth to water: 77.8 ft (23.71m) below TOCWater elevation: 227.4 ft (69.31m) msl

WATER-LEVEL DATAWATER-LEVEL DATA
ESH-EMS-2000408ESH-EMS-2000408 A-A-88 Fourth Quarter 2000Fourth Quarter 2000
WELL BGO 12AXMEASUREMENTS CONDUCTED IN THE FIELD
Sample date: 12/21/00 Time: 15:33Depth to water: 156.91 ft (47.83m) below TOCWater elevation: 155.89 ft (47.52m) msl
WELL BGO 12CXMEASUREMENTS CONDUCTED IN THE FIELD
Sample date: 12/21/00 Time: 15:36Depth to water: 86.18 ft (26.27m) below TOCWater elevation: 227.12 ft (69.23m) msl
WELL BGO 12DRMEASUREMENTS CONDUCTED IN THE FIELD
Sample date: 12/21/00 Time: 15:36Depth to water: 96.87 ft (29.53m) below TOCWater elevation: 216.73 ft (66.06m) msl
WELL BGO 13DRMEASUREMENTS CONDUCTED IN THE FIELD
Sample date: 12/21/00 Time: 15:30Depth to water: 92.25 ft (28.12m) below TOCWater elevation: 227.05 ft (69.21m) msl
WELL BGO 14ARMEASUREMENTS CONDUCTED IN THE FIELD
Sample date: 12/21/00 Time: 15:21Depth to water: 143.35 ft (43.69m) below TOCWater elevation: 157.35 ft (47.96m) msl
WELL BGO 14CRMEASUREMENTS CONDUCTED IN THE FIELD
Sample date: 12/21/00 Time: 15:20Depth to water: 80.75 ft (24.61m) below TOCWater elevation: 219.75 ft (66.98m) msl
WELL BGO 14DRMEASUREMENTS CONDUCTED IN THE FIELD
Sample date: 12/21/00 Time: 15:19Depth to water: 73.5 ft (22.40m) below TOCWater elevation: 226.8 ft (69.13m) msl
WELL BGO 15DMEASUREMENTS CONDUCTED IN THE FIELD
Sample date: 12/21/00 Time: 15:08Depth to water: 72.27 ft (22.03m) below TOCWater elevation: 226.43 ft (69.02m) msl
WELL BGO 16ARMEASUREMENTS CONDUCTED IN THE FIELD
Sample date: 12/30/00 Time: 7:07Depth to water: 144.32 ft (43.99m) below TOCWater elevation: 159.38 ft (48.58m) msl
WELL BGO 16BMEASUREMENTS CONDUCTED IN THE FIELD
Sample date: 12/30/00 Time: 7:08Depth to water: 90.08 ft (27.46m) below TOCWater elevation: 215.02 ft (65.54m) msl
WELL BGO 16DMEASUREMENTS CONDUCTED IN THE FIELD
Sample date: 12/30/00 Time: 7:08Depth to water: 77.04 ft (23.48m) below TOCWater elevation: 227.56 ft (69.36m) msl
WELL BGO 18AMEASUREMENTS CONDUCTED IN THE FIELD
Sample date: 12/30/00 Time: 7:09Depth to water: 135.35 ft (41.26m) below TOCWater elevation: 159.85 ft (48.72m) msl
WELL BGO 18DMEASUREMENTS CONDUCTED IN THE FIELD
Sample date: 12/30/00 Time: 7:09Depth to water: 66.66 ft (20.32m) below TOCWater elevation: 228.24 ft (69.57m) msl
WELL BGO 19DRMEASUREMENTS CONDUCTED IN THE FIELD
Sample date: 12/30/00 Time: 7:10Depth to water: 66.48 ft (20.26m) below TOCWater elevation: 227.32 ft (69.29m) msl
WELL BGO 20AMEASUREMENTS CONDUCTED IN THE FIELD
Sample date: 12/30/00 Time: 7:11Depth to water: 114 ft (34.75m) below TOCWater elevation: 169.9 ft (51.79m) msl
WELL BGO 20AAMEASUREMENTS CONDUCTED IN THE FIELD
Sample date: 12/30/00 Time: 7:11Depth to water: 123.74 ft (37.72m) below TOCWater elevation: 159.86 ft (48.73m) msl

WATER-LEVEL DATAWATER-LEVEL DATA
ESH-EMS-2000408ESH-EMS-2000408 A-A-99 Fourth Quarter 2000Fourth Quarter 2000
WELL BGO 20BMEASUREMENTS CONDUCTED IN THE FIELD
Sample date: 12/30/00 Time: 7:11Depth to water: 58.4 ft (17.80m) below TOCWater elevation: 225.1 ft (68.61m) msl
WELL BGO 20CMEASUREMENTS CONDUCTED IN THE FIELD
Sample date: 12/30/00 Time: 7:12Depth to water: 56.9 ft (17.34m) below TOCWater elevation: 226.6 ft (69.07m) msl
WELL BGO 20DMEASUREMENTS CONDUCTED IN THE FIELD
Sample date: 12/30/00 Time: 7:12Depth to water: 53.27 ft (16.24m) below TOCWater elevation: 230.43 ft (70.24m) msl
WELL BGO 21DMEASUREMENTS CONDUCTED IN THE FIELD
Sample date: 12/30/00 Time: 7:13Depth to water: 54 ft (16.46m) below TOCWater elevation: 231.4 ft (70.53m) msl
WELL BGO 22DXMEASUREMENTS CONDUCTED IN THE FIELD
Sample date: 12/30/00 Time: 7:13Depth to water: 53.82 ft (16.40m) below TOCWater elevation: 231.88 ft (70.68m) msl
WELL BGO 23DMEASUREMENTS CONDUCTED IN THE FIELD
Sample date: 12/30/00 Time: 7:14Depth to water: 60.05 ft (18.30m) below TOCWater elevation: 229.15 ft (69.85m) msl
WELL BGO 24DMEASUREMENTS CONDUCTED IN THE FIELD
Sample date: 12/30/00 Time: 7:14Depth to water: 58.81 ft (17.93m) below TOCWater elevation: 234.39 ft (71.44m) msl
WELL BGO 25AMEASUREMENTS CONDUCTED IN THE FIELD
Sample date: 12/21/00 Time: 15:11Depth to water: 138.38 ft (42.18m) below TOCWater elevation: 158.12 ft (48.20m) msl
WELL BGO 26AMEASUREMENTS CONDUCTED IN THE FIELD
Sample date: 12/21/00 Time: 14:13Depth to water: 129.5 ft (39.47m) below TOCWater elevation: 157.7 ft (48.07m) msl
WELL BGO 26DMEASUREMENTS CONDUCTED IN THE FIELD
Sample date: 12/21/00 Time: 14:13Depth to water: 61.55 ft (18.76m) below TOCWater elevation: 223.95 ft (68.26m) msl
WELL BGO 27CMEASUREMENTS CONDUCTED IN THE FIELD
Sample date: 12/21/00 Time: 14:52Depth to water: 58.8 ft (17.92m) below TOCWater elevation: 217.2 ft (66.20m) msl
WELL BGO 27DMEASUREMENTS CONDUCTED IN THE FIELD
Sample date: 12/21/00 Time: 14:51Depth to water: 52.73 ft (16.07m) below TOCWater elevation: 223.57 ft (68.14m) msl
WELL BGO 28DMEASUREMENTS CONDUCTED IN THE FIELD
Sample date: 12/21/00 Time: 14:54Depth to water: 54.95 ft (16.75m) below TOCWater elevation: 222.45 ft (67.80m) msl
WELL BGO 29AMEASUREMENTS CONDUCTED IN THE FIELD
Sample date: 12/21/00 Time: 14:07Depth to water: 106 ft (32.31m) below TOCWater elevation: 158.2 ft (48.22m) msl
WELL BGO 29CMEASUREMENTS CONDUCTED IN THE FIELD
Sample date: 12/21/00 Time: 14:07Depth to water: 45.9 ft (13.99m) below TOCWater elevation: 218.9 ft (66.72m) msl
WELL BGO 29DMEASUREMENTS CONDUCTED IN THE FIELD
Sample date: 12/21/00 Time: 14:08Depth to water: 43 ft (13.11m) below TOCWater elevation: 222.5 ft (67.82m) msl

WATER-LEVEL DATAWATER-LEVEL DATA
ESH-EMS-2000408ESH-EMS-2000408 A-A-1010 Fourth Quarter 2000Fourth Quarter 2000
WELL BGO 30CMEASUREMENTS CONDUCTED IN THE FIELD
Sample date: 12/30/00 Time: 7:15Depth to water: 58.28 ft (17.76m) below TOCWater elevation: 216.22 ft (65.90m) msl
WELL BGO 30DMEASUREMENTS CONDUCTED IN THE FIELD
Sample date: 12/30/00 Time: 7:16Depth to water: 50.35 ft (15.35m) below TOCWater elevation: 224.45 ft (68.41m) msl
WELL BGO 31CMEASUREMENTS CONDUCTED IN THE FIELD
Sample date: 12/30/00 Time: 7:16Depth to water: 51.25 ft (15.62m) below TOCWater elevation: 221.85 ft (67.62m) msl
WELL BGO 31DMEASUREMENTS CONDUCTED IN THE FIELD
Sample date: 12/30/00 Time: 7:16Depth to water: 51.23 ft (15.62m) below TOCWater elevation: 222.47 ft (67.81m) msl
WELL BGO 32DMEASUREMENTS CONDUCTED IN THE FIELD
Sample date: 12/29/00 Time: 10:58Depth to water: 57.95 ft (17.66m) below TOCWater elevation: 223.75 ft (68.20m) msl
WELL BGO 33CMEASUREMENTS CONDUCTED IN THE FIELD
Sample date: 12/29/00 Time: 10:59Depth to water: 86.29 ft (26.30m) below TOCWater elevation: 193.11 ft (58.86m) msl
WELL BGO 33DMEASUREMENTS CONDUCTED IN THE FIELD
Sample date: 12/29/00 Time: 11:00Depth to water: 51.75 ft (15.77m) below TOCWater elevation: 228.55 ft (69.66m) msl
WELL BGO 34DMEASUREMENTS CONDUCTED IN THE FIELD
Sample date: 12/29/00 Time: 11:01Depth to water: 44.32 ft (13.51m) below TOCWater elevation: 230.58 ft (70.28m) msl
WELL BGO 35CMEASUREMENTS CONDUCTED IN THE FIELD
Sample date: 12/29/00 Time: 11:03Depth to water: 45 ft (13.72m) below TOCWater elevation: 228.4 ft (69.62m) msl
WELL BGO 35DMEASUREMENTS CONDUCTED IN THE FIELD
Sample date: 12/29/00 Time: 11:03Depth to water: 40.9 ft (12.47m) below TOCWater elevation: 232.6 ft (70.90m) msl
WELL BGO 36DMEASUREMENTS CONDUCTED IN THE FIELD
Sample date: 12/29/00 Time: 11:03Depth to water: 39.98 ft (12.19m) below TOCWater elevation: 235.42 ft (71.76m) msl
WELL BGO 37CMEASUREMENTS CONDUCTED IN THE FIELD
Sample date: 12/29/00 Time: 11:04Depth to water: 56.43 ft (17.20m) below TOCWater elevation: 229.87 ft (70.07m) msl
WELL BGO 37DMEASUREMENTS CONDUCTED IN THE FIELD
Sample date: 12/29/00 Time: 11:04Depth to water: 49.8 ft (15.18m) below TOCWater elevation: 237.5 ft (72.39m) msl
WELL BGO 38DMEASUREMENTS CONDUCTED IN THE FIELD
Sample date: 12/29/00 Time: 11:05Depth to water: 55.01 ft (16.77m) below TOCWater elevation: 236.59 ft (72.11m) msl
WELL BGO 39AMEASUREMENTS CONDUCTED IN THE FIELD
Sample date: 12/29/00 Time: 11:06Depth to water: 130.28 ft (39.71m) below TOCWater elevation: 165.62 ft (50.48m) msl
WELL BGO 39CMEASUREMENTS CONDUCTED IN THE FIELD
Sample date: 12/29/00 Time: 11:06Depth to water: 66.65 ft (20.32m) below TOCWater elevation: 229.75 ft (70.03m) msl

WATER-LEVEL DATAWATER-LEVEL DATA
ESH-EMS-2000408ESH-EMS-2000408 A-A-1111 Fourth Quarter 2000Fourth Quarter 2000
WELL BGO 39DMEASUREMENTS CONDUCTED IN THE FIELD
Sample date: 12/29/00 Time: 11:07Depth to water: 60.08 ft (18.31m) below TOCWater elevation: 235.62 ft (71.82m) msl
WELL BGO 40DMEASUREMENTS CONDUCTED IN THE FIELD
Sample date: 12/21/00 Time: 15:04Depth to water: 69.9 ft (21.31m) below TOCWater elevation: 218.5 ft (66.60m) msl
WELL BGO 41AMEASUREMENTS CONDUCTED IN THE FIELD
Sample date: 12/21/00 Time: 15:15Depth to water: 143.63 ft (43.78m) below TOCWater elevation: 156.67 ft (47.75m) msl
WELL BGO 42CMEASUREMENTS CONDUCTED IN THE FIELD
Sample date: 12/21/00 Time: 15:26Depth to water: 78.62 ft (23.96m) below TOCWater elevation: 219.28 ft (66.84m) msl
WELL BGO 43AMEASUREMENTS CONDUCTED IN THE FIELD
Sample date: 12/21/00 Time: 16:05Depth to water: 156.15 ft (47.60m) below TOCWater elevation: 158.75 ft (48.39m) msl
WELL BGO 43AAMEASUREMENTS CONDUCTED IN THE FIELD
Sample date: 12/21/00 Time: 16:03Depth to water: 159.2 ft (48.52m) below TOCWater elevation: 155.1 ft (47.28m) msl
WELL BGO 43CRMEASUREMENTS CONDUCTED IN THE FIELD
Sample date: 12/21/00 Time: 16:08Depth to water: 94.7 ft (28.86m) below TOCWater elevation: 220.6 ft (67.24m) msl
WELL BGO 43DMEASUREMENTS CONDUCTED IN THE FIELD
Sample date: 12/21/00 Time: 16:06Depth to water: 87.92 ft (26.80m) below TOCWater elevation: 227.38 ft (69.31m) msl
WELL BGO 44AMEASUREMENTS CONDUCTED IN THE FIELD
Sample date: 12/30/00 Time: 11:00Depth to water: 129.03 ft (39.33m) below TOCWater elevation: 156.27 ft (47.63m) msl
WELL BGO 44AAMEASUREMENTS CONDUCTED IN THE FIELD
Sample date: 12/30/00 Time: 11:00Depth to water: 127.1 ft (38.74m) below TOCWater elevation: 158.2 ft (48.22m) msl
WELL BGO 44BMEASUREMENTS CONDUCTED IN THE FIELD
Sample date: 12/30/00 Time: 11:01Depth to water: 67.72 ft (20.64m) below TOCWater elevation: 217.48 ft (66.29m) msl
WELL BGO 44CMEASUREMENTS CONDUCTED IN THE FIELD
Sample date: 12/30/00 Time: 11:01Depth to water: 68.35 ft (20.83m) below TOCWater elevation: 217.25 ft (66.22m) msl
WELL BGO 44DMEASUREMENTS CONDUCTED IN THE FIELD
Sample date: 12/30/00 Time: 11:02Depth to water: 56.25 ft (17.15m) below TOCWater elevation: 229.15 ft (69.85m) msl
WELL BGO 45AMEASUREMENTS CONDUCTED IN THE FIELD
Sample date: 12/21/00 Time: 14:59Depth to water: 119.9 ft (36.55m) below TOCWater elevation: 159 ft (48.46m) msl
WELL BGO 45BMEASUREMENTS CONDUCTED IN THE FIELD
Sample date: 12/21/00 Time: 15:00Depth to water: 63.15 ft (19.25m) below TOCWater elevation: 215.45 ft (65.67m) msl
WELL BGO 45CMEASUREMENTS CONDUCTED IN THE FIELD
Sample date: 12/21/00 Time: 15:01Depth to water: 59.55 ft (18.15m) below TOCWater elevation: 219.05 ft (66.77m) msl

WATER-LEVEL DATAWATER-LEVEL DATA
ESH-EMS-2000408ESH-EMS-2000408 A-A-1212 Fourth Quarter 2000Fourth Quarter 2000
WELL BGO 45DMEASUREMENTS CONDUCTED IN THE FIELD
Sample date: 12/21/00 Time: 15:02Depth to water: 55 ft (16.76m) below TOCWater elevation: 223.6 ft (68.15m) msl
WELL BGO 46BMEASUREMENTS CONDUCTED IN THE FIELD
Sample date: 12/28/00 Time: 14:01Depth to water: 50.73 ft (15.46m) below TOCWater elevation: 214.67 ft (65.43m) msl
WELL BGO 46CMEASUREMENTS CONDUCTED IN THE FIELD
Sample date: 12/28/00 Time: 14:02Depth to water: 48.92 ft (14.91m) below TOCWater elevation: 216.18 ft (65.89m) msl
WELL BGO 46DMEASUREMENTS CONDUCTED IN THE FIELD
Sample date: 12/28/00 Time: 14:03Depth to water: 43.85 ft (13.37m) below TOCWater elevation: 221.25 ft (67.44m) msl
WELL BGO 47AMEASUREMENTS CONDUCTED IN THE FIELD
Sample date: 12/28/00 Time: 14:04Depth to water: 106 ft (32.31m) below TOCWater elevation: 160.9 ft (49.04m) msl
WELL BGO 47CMEASUREMENTS CONDUCTED IN THE FIELD
Sample date: 12/28/00 Time: 14:07Depth to water: 48.21 ft (14.69m) below TOCWater elevation: 219.39 ft (66.87m) msl
WELL BGO 47DMEASUREMENTS CONDUCTED IN THE FIELD
Sample date: 12/28/00 Time: 14:07Depth to water: 44.95 ft (13.70m) below TOCWater elevation: 222.45 ft (67.80m) msl
WELL BGO 48CMEASUREMENTS CONDUCTED IN THE FIELD
Sample date: 12/28/00 Time: 14:08Depth to water: 56.54 ft (17.23m) below TOCWater elevation: 220.06 ft (67.08m) msl
WELL BGO 48DMEASUREMENTS CONDUCTED IN THE FIELD
Sample date: 12/28/00 Time: 14:10Depth to water: 54.12 ft (16.50m) below TOCWater elevation: 222.78 ft (67.90m) msl
WELL BGO 49AMEASUREMENTS CONDUCTED IN THE FIELD
Sample date: 12/30/00 Time: 7:18Depth to water: 107.65 ft (32.81m) below TOCWater elevation: 163.55 ft (49.85m) msl
WELL BGO 49CMEASUREMENTS CONDUCTED IN THE FIELD
Sample date: 12/30/00 Time: 7:18Depth to water: 47.72 ft (14.55m) below TOCWater elevation: 223.38 ft (68.09m) msl
WELL BGO 49DMEASUREMENTS CONDUCTED IN THE FIELD
Sample date: 12/30/00 Time: 7:18Depth to water: 41.95 ft (12.79m) below TOCWater elevation: 229.55 ft (69.97m) msl
WELL BGO 50AMEASUREMENTS CONDUCTED IN THE FIELD
Sample date: 12/28/00 Time: 13:53Depth to water: 96.8 ft (29.50m) below TOCWater elevation: 158.6 ft (48.34m) msl
WELL BGO 50CMEASUREMENTS CONDUCTED IN THE FIELD
Sample date: 12/28/00 Time: 13:56Depth to water: 40.16 ft (12.24m) below TOCWater elevation: 215.34 ft (65.64m) msl
WELL BGO 50DMEASUREMENTS CONDUCTED IN THE FIELD
Sample date: 12/28/00 Time: 13:56Depth to water: 34.75 ft (10.59m) below TOCWater elevation: 221.25 ft (67.44m) msl
WELL BGO 51AMEASUREMENTS CONDUCTED IN THE FIELD
Sample date: 12/30/00 Time: 7:19Depth to water: 125.62 ft (38.29m) below TOCWater elevation: 163.68 ft (49.89m) msl
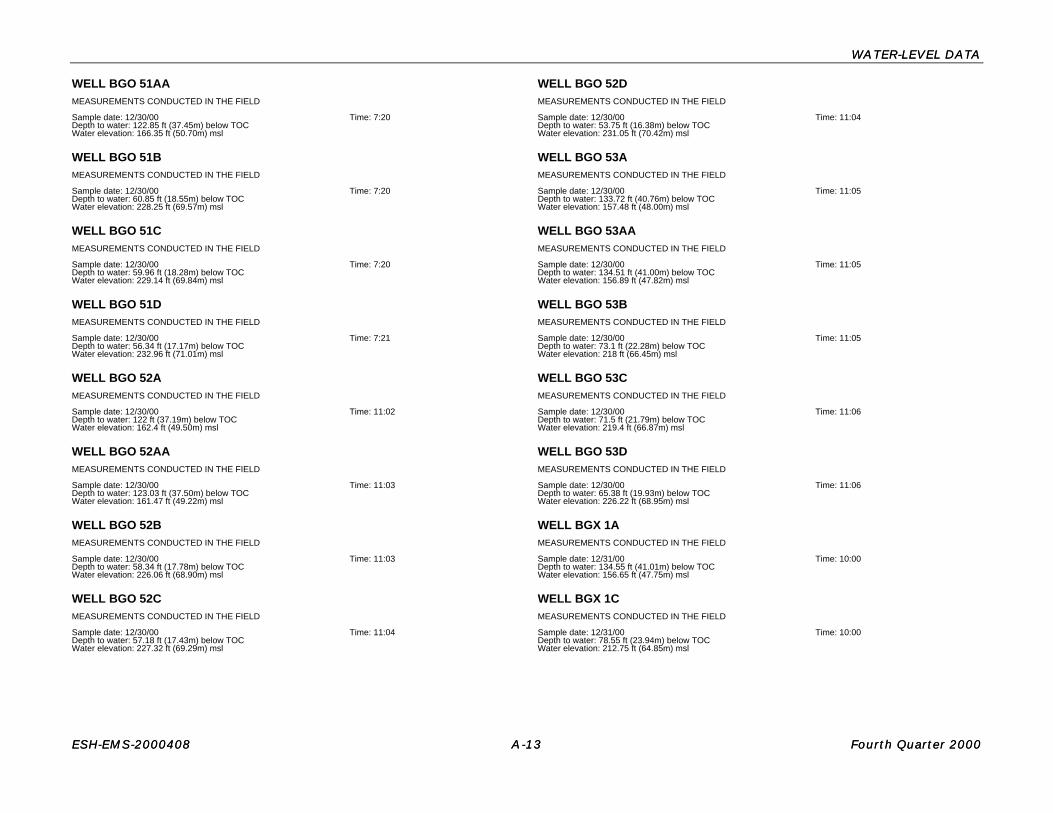
WATER-LEVEL DATAWATER-LEVEL DATA
ESH-EMS-2000408ESH-EMS-2000408 A-A-1313 Fourth Quarter 2000Fourth Quarter 2000
WELL BGO 51AAMEASUREMENTS CONDUCTED IN THE FIELD
Sample date: 12/30/00 Time: 7:20Depth to water: 122.85 ft (37.45m) below TOCWater elevation: 166.35 ft (50.70m) msl
WELL BGO 51BMEASUREMENTS CONDUCTED IN THE FIELD
Sample date: 12/30/00 Time: 7:20Depth to water: 60.85 ft (18.55m) below TOCWater elevation: 228.25 ft (69.57m) msl
WELL BGO 51CMEASUREMENTS CONDUCTED IN THE FIELD
Sample date: 12/30/00 Time: 7:20Depth to water: 59.96 ft (18.28m) below TOCWater elevation: 229.14 ft (69.84m) msl
WELL BGO 51DMEASUREMENTS CONDUCTED IN THE FIELD
Sample date: 12/30/00 Time: 7:21Depth to water: 56.34 ft (17.17m) below TOCWater elevation: 232.96 ft (71.01m) msl
WELL BGO 52AMEASUREMENTS CONDUCTED IN THE FIELD
Sample date: 12/30/00 Time: 11:02Depth to water: 122 ft (37.19m) below TOCWater elevation: 162.4 ft (49.50m) msl
WELL BGO 52AAMEASUREMENTS CONDUCTED IN THE FIELD
Sample date: 12/30/00 Time: 11:03Depth to water: 123.03 ft (37.50m) below TOCWater elevation: 161.47 ft (49.22m) msl
WELL BGO 52BMEASUREMENTS CONDUCTED IN THE FIELD
Sample date: 12/30/00 Time: 11:03Depth to water: 58.34 ft (17.78m) below TOCWater elevation: 226.06 ft (68.90m) msl
WELL BGO 52CMEASUREMENTS CONDUCTED IN THE FIELD
Sample date: 12/30/00 Time: 11:04Depth to water: 57.18 ft (17.43m) below TOCWater elevation: 227.32 ft (69.29m) msl
WELL BGO 52DMEASUREMENTS CONDUCTED IN THE FIELD
Sample date: 12/30/00 Time: 11:04Depth to water: 53.75 ft (16.38m) below TOCWater elevation: 231.05 ft (70.42m) msl
WELL BGO 53AMEASUREMENTS CONDUCTED IN THE FIELD
Sample date: 12/30/00 Time: 11:05Depth to water: 133.72 ft (40.76m) below TOCWater elevation: 157.48 ft (48.00m) msl
WELL BGO 53AAMEASUREMENTS CONDUCTED IN THE FIELD
Sample date: 12/30/00 Time: 11:05Depth to water: 134.51 ft (41.00m) below TOCWater elevation: 156.89 ft (47.82m) msl
WELL BGO 53BMEASUREMENTS CONDUCTED IN THE FIELD
Sample date: 12/30/00 Time: 11:05Depth to water: 73.1 ft (22.28m) below TOCWater elevation: 218 ft (66.45m) msl
WELL BGO 53CMEASUREMENTS CONDUCTED IN THE FIELD
Sample date: 12/30/00 Time: 11:06Depth to water: 71.5 ft (21.79m) below TOCWater elevation: 219.4 ft (66.87m) msl
WELL BGO 53DMEASUREMENTS CONDUCTED IN THE FIELD
Sample date: 12/30/00 Time: 11:06Depth to water: 65.38 ft (19.93m) below TOCWater elevation: 226.22 ft (68.95m) msl
WELL BGX 1AMEASUREMENTS CONDUCTED IN THE FIELD
Sample date: 12/31/00 Time: 10:00Depth to water: 134.55 ft (41.01m) below TOCWater elevation: 156.65 ft (47.75m) msl
WELL BGX 1CMEASUREMENTS CONDUCTED IN THE FIELD
Sample date: 12/31/00 Time: 10:00Depth to water: 78.55 ft (23.94m) below TOCWater elevation: 212.75 ft (64.85m) msl

WATER-LEVEL DATAWATER-LEVEL DATA
ESH-EMS-2000408ESH-EMS-2000408 A-A-1414 Fourth Quarter 2000Fourth Quarter 2000
WELL BGX 1DMEASUREMENTS CONDUCTED IN THE FIELD
Sample date: 12/31/00 Time: 10:00Depth to water: 64.68 ft (19.71m) below TOCWater elevation: 226.62 ft (69.07m) msl
WELL BGX 2BMEASUREMENTS CONDUCTED IN THE FIELD
Sample date: 12/31/00 Time: 10:00Depth to water: 82.45 ft (25.13m) below TOCWater elevation: 208.85 ft (63.66m) msl
WELL BGX 2DMEASUREMENTS CONDUCTED IN THE FIELD
Sample date: 12/30/00 Time: 11:09Depth to water: 82.45 ft (25.13m) below TOCWater elevation: 208.65 ft (63.60m) msl
WELL BGX 3DMEASUREMENTS CONDUCTED IN THE FIELD
Sample date: 12/31/00 Time: 10:00Depth to water: 80.12 ft (24.42m) below TOCWater elevation: 211.08 ft (64.34m) msl
WELL BGX 4AMEASUREMENTS CONDUCTED IN THE FIELD
Sample date: 12/31/00 Time: 10:00Depth to water: 136.97 ft (41.75m) below TOCWater elevation: 153.93 ft (46.92m) msl
WELL BGX 4CMEASUREMENTS CONDUCTED IN THE FIELD
Sample date: 12/31/00 Time: 10:00Depth to water: 80.45 ft (24.52m) below TOCWater elevation: 210.35 ft (64.12m) msl
WELL BGX 4DMEASUREMENTS CONDUCTED IN THE FIELD
Sample date: 12/31/00 Time: 10:00Depth to water: 79.56 ft (24.25m) below TOCWater elevation: 211.34 ft (64.42m) msl
WELL BGX 5DMEASUREMENTS CONDUCTED IN THE FIELD
Sample date: 12/30/00 Time: 11:10Depth to water: 80.4 ft (24.51m) below TOCWater elevation: 204.6 ft (62.36m) msl
WELL BGX 6DMEASUREMENTS CONDUCTED IN THE FIELD
Sample date: 12/30/00 Time: 11:10Depth to water: 75.03 ft (22.87m) below TOCWater elevation: 201.97 ft (61.56m) msl
WELL BGX 7DMEASUREMENTS CONDUCTED IN THE FIELD
Sample date: 12/30/00 Time: 11:11Depth to water: 77.2 ft (23.53m) below TOCWater elevation: 202 ft (61.57m) msl
WELL BGX 8DRMEASUREMENTS CONDUCTED IN THE FIELD
Sample date: 12/30/00 Time: 11:11Depth to water: 75.97 ft (23.16m) below TOCWater elevation: 202.23 ft (61.64m) msl
WELL BGX 9DMEASUREMENTS CONDUCTED IN THE FIELD
Sample date: 12/30/00 Time: 11:11Depth to water: 55.14 ft (16.81m) below TOCWater elevation: 224.26 ft (68.36m) msl
WELL BGX 10DMEASUREMENTS CONDUCTED IN THE FIELD
Sample date: 12/30/00 Time: 11:12Depth to water: 53.8 ft (16.40m) below TOCWater elevation: 223.1 ft (68.00m) msl
WELL BGX 11DMEASUREMENTS CONDUCTED IN THE FIELD
Sample date: 12/30/00 Time: 11:13Depth to water: 44.82 ft (13.66m) below TOCWater elevation: 231.48 ft (70.56m) msl
WELL BGX 12CMEASUREMENTS CONDUCTED IN THE FIELD
Sample date: 12/30/00 Time: 11:13Depth to water: 43.46 ft (13.25m) below TOCWater elevation: 231.64 ft (70.60m) msl
WELL BGX 12DMEASUREMENTS CONDUCTED IN THE FIELD
Sample date: 12/30/00 Time: 11:13Depth to water: 40.73 ft (12.41m) below TOCWater elevation: 234.47 ft (71.47m) msl
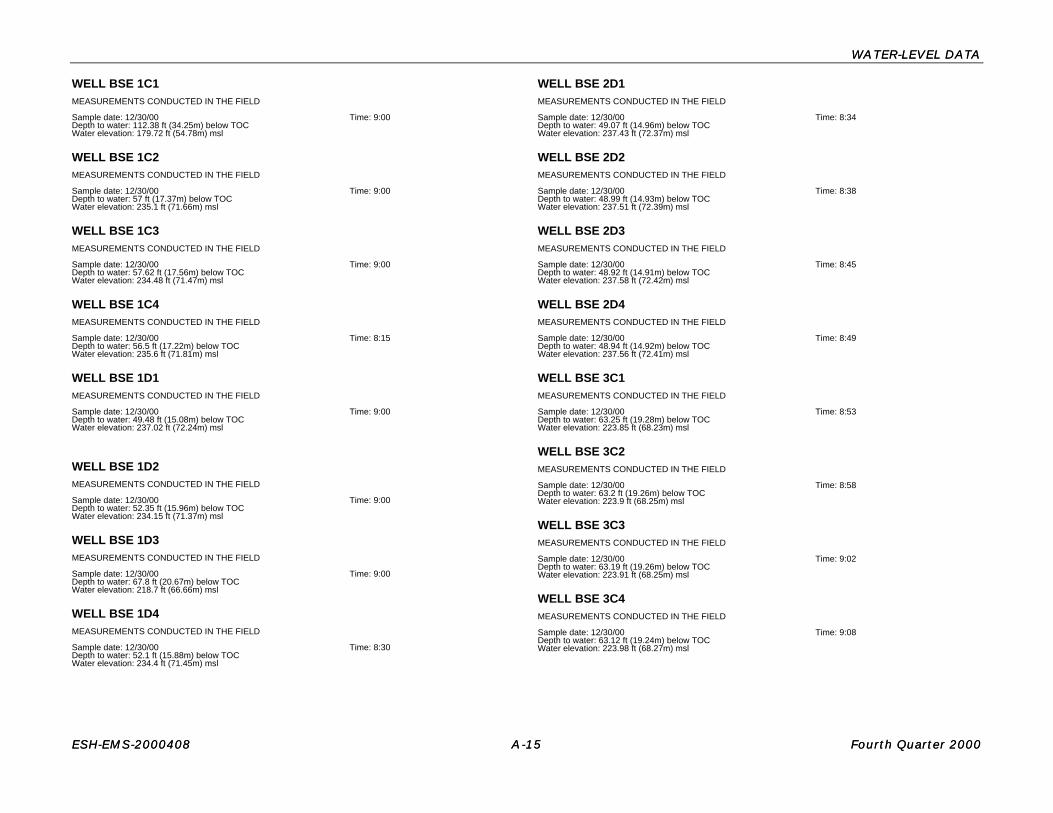
WATER-LEVEL DATAWATER-LEVEL DATA
ESH-EMS-2000408ESH-EMS-2000408 A-A-1515 Fourth Quarter 2000Fourth Quarter 2000
WELL BSE 1C1MEASUREMENTS CONDUCTED IN THE FIELD
Sample date: 12/30/00 Time: 9:00Depth to water: 112.38 ft (34.25m) below TOCWater elevation: 179.72 ft (54.78m) msl
WELL BSE 1C2MEASUREMENTS CONDUCTED IN THE FIELD
Sample date: 12/30/00 Time: 9:00Depth to water: 57 ft (17.37m) below TOCWater elevation: 235.1 ft (71.66m) msl
WELL BSE 1C3MEASUREMENTS CONDUCTED IN THE FIELD
Sample date: 12/30/00 Time: 9:00Depth to water: 57.62 ft (17.56m) below TOCWater elevation: 234.48 ft (71.47m) msl
WELL BSE 1C4MEASUREMENTS CONDUCTED IN THE FIELD
Sample date: 12/30/00 Time: 8:15Depth to water: 56.5 ft (17.22m) below TOCWater elevation: 235.6 ft (71.81m) msl
WELL BSE 1D1MEASUREMENTS CONDUCTED IN THE FIELD
Sample date: 12/30/00 Time: 9:00Depth to water: 49.48 ft (15.08m) below TOCWater elevation: 237.02 ft (72.24m) msl
WELL BSE 1D2MEASUREMENTS CONDUCTED IN THE FIELD
Sample date: 12/30/00 Time: 9:00Depth to water: 52.35 ft (15.96m) below TOCWater elevation: 234.15 ft (71.37m) msl
WELL BSE 1D3MEASUREMENTS CONDUCTED IN THE FIELD
Sample date: 12/30/00 Time: 9:00Depth to water: 67.8 ft (20.67m) below TOCWater elevation: 218.7 ft (66.66m) msl
WELL BSE 1D4MEASUREMENTS CONDUCTED IN THE FIELD
Sample date: 12/30/00 Time: 8:30Depth to water: 52.1 ft (15.88m) below TOCWater elevation: 234.4 ft (71.45m) msl
WELL BSE 2D1MEASUREMENTS CONDUCTED IN THE FIELD
Sample date: 12/30/00 Time: 8:34Depth to water: 49.07 ft (14.96m) below TOCWater elevation: 237.43 ft (72.37m) msl
WELL BSE 2D2MEASUREMENTS CONDUCTED IN THE FIELD
Sample date: 12/30/00 Time: 8:38Depth to water: 48.99 ft (14.93m) below TOCWater elevation: 237.51 ft (72.39m) msl
WELL BSE 2D3MEASUREMENTS CONDUCTED IN THE FIELD
Sample date: 12/30/00 Time: 8:45Depth to water: 48.92 ft (14.91m) below TOCWater elevation: 237.58 ft (72.42m) msl
WELL BSE 2D4MEASUREMENTS CONDUCTED IN THE FIELD
Sample date: 12/30/00 Time: 8:49Depth to water: 48.94 ft (14.92m) below TOCWater elevation: 237.56 ft (72.41m) msl
WELL BSE 3C1MEASUREMENTS CONDUCTED IN THE FIELD
Sample date: 12/30/00 Time: 8:53Depth to water: 63.25 ft (19.28m) below TOCWater elevation: 223.85 ft (68.23m) msl
WELL BSE 3C2MEASUREMENTS CONDUCTED IN THE FIELD
Sample date: 12/30/00 Time: 8:58Depth to water: 63.2 ft (19.26m) below TOCWater elevation: 223.9 ft (68.25m) msl
WELL BSE 3C3MEASUREMENTS CONDUCTED IN THE FIELD
Sample date: 12/30/00 Time: 9:02Depth to water: 63.19 ft (19.26m) below TOCWater elevation: 223.91 ft (68.25m) msl
WELL BSE 3C4MEASUREMENTS CONDUCTED IN THE FIELD
Sample date: 12/30/00 Time: 9:08Depth to water: 63.12 ft (19.24m) below TOCWater elevation: 223.98 ft (68.27m) msl

WATER-LEVEL DATAWATER-LEVEL DATA
ESH-EMS-2000408ESH-EMS-2000408 A-A-1616 Fourth Quarter 2000Fourth Quarter 2000
WELL BSE 3D1MEASUREMENTS CONDUCTED IN THE FIELD
Sample date: 12/30/00 Time: 9:15Depth to water: 61.74 ft (18.82m) below TOCWater elevation: 225.36 ft (68.69m) msl
WELL BSE 3D2MEASUREMENTS CONDUCTED IN THE FIELD
Sample date: 12/30/00 Time: 9:22Depth to water: 63.46 ft (19.34m) below TOCWater elevation: 223.64 ft (68.17m) msl
WELL BSE 3D3MEASUREMENTS CONDUCTED IN THE FIELD
Sample date: 12/30/00 Time: 9:26Depth to water: 60.15 ft (18.33m) below TOCWater elevation: 226.95 ft (69.18m) msl
WELL BSE 3D4MEASUREMENTS CONDUCTED IN THE FIELD
Sample date: 12/30/00 Time: 9:31Depth to water: 58.9 ft (17.95m) below TOCWater elevation: 228.2 ft (69.56m) msl
WELL BSW 1C1MEASUREMENTS CONDUCTED IN THE FIELD
Sample date: 12/28/00 Time: 13:37Depth to water: 43.36 ft (13.22m) below TOCWater elevation: 213.34 ft (65.03m) msl
WELL BSW 1C2MEASUREMENTS CONDUCTED IN THE FIELD
Sample date: 12/28/00 Time: 13:37Depth to water: 43.31 ft (13.20m) below TOCWater elevation: 213.39 ft (65.04m) msl
WELL BSW 1C3MEASUREMENTS CONDUCTED IN THE FIELD
Sample date: 12/28/00 Time: 13:37Depth to water: 44.31 ft (13.51m) below TOCWater elevation: 212.39 ft (64.74m) msl
WELL BSW 1C4MEASUREMENTS CONDUCTED IN THE FIELD
Sample date: 12/28/00 Time: 13:38Depth to water: 44.6 ft (13.59m) below TOCWater elevation: 212.1 ft (64.65m) msl
WELL BSW 1D1MEASUREMENTS CONDUCTED IN THE FIELD
Sample date: 12/28/00 Time: 13:38Depth to water: 37.89 ft (11.55m) below TOCWater elevation: 218.71 ft (66.66m) msl
WELL BSW 1D2MEASUREMENTS CONDUCTED IN THE FIELD
Sample date: 12/28/00 Time: 13:38Depth to water: 37.87 ft (11.54m) below TOCWater elevation: 218.73 ft (66.67m) msl
WELL BSW 1D3MEASUREMENTS CONDUCTED IN THE FIELD
Sample date: 12/28/00 Time: 13:38Depth to water: 38.2 ft (11.64m) below TOCWater elevation: 218.4 ft (66.57m) msl
WELL BSW 2C1MEASUREMENTS CONDUCTED IN THE FIELD
Sample date: 12/28/00 Time: 13:39Depth to water: 27.32 ft (8.33m) below TOCWater elevation: 214.08 ft (65.25m) msl
WELL BSW 2C2MEASUREMENTS CONDUCTED IN THE FIELD
Sample date: 12/28/00 Time: 13:39Depth to water: 29.25 ft (8.92m) below TOCWater elevation: 212.15 ft (64.66m) msl
WELL BSW 2C3MEASUREMENTS CONDUCTED IN THE FIELD
Sample date: 12/28/00 Time: 13:39Depth to water: 29.27 ft (8.92m) below TOCWater elevation: 212.13 ft (64.66m) msl
WELL BSW 2D1MEASUREMENTS CONDUCTED IN THE FIELD
Sample date: 12/28/00 Time: 13:39Depth to water: 22.97 ft (7.00m) below TOCWater elevation: 218.93 ft (66.73m) msl
WELL BSW 2D2MEASUREMENTS CONDUCTED IN THE FIELD
Sample date: 12/28/00 Time: 13:40Depth to water: 22.63 ft (6.90m) below TOCWater elevation: 219.27 ft (66.83m) msl

WATER-LEVEL DATAWATER-LEVEL DATA
ESH-EMS-2000408ESH-EMS-2000408 A-A-1717 Fourth Quarter 2000Fourth Quarter 2000
WELL BSW 2D3MEASUREMENTS CONDUCTED IN THE FIELD
Sample date: 12/28/00 Time: 13:40Depth to water: 23.04 ft (7.02m) below TOCWater elevation: 218.86 ft (66.71m) msl
WELL BSW 3C1MEASUREMENTS CONDUCTED IN THE FIELD
Sample date: 12/28/00 Time: 13:40Depth to water: 43.12 ft (13.14m) below TOCWater elevation: 217.28 ft (66.23m) msl
WELL BSW 3C2MEASUREMENTS CONDUCTED IN THE FIELD
Sample date: 12/28/00 Time: 13:41Depth to water: 45.39 ft (13.84m) below TOCWater elevation: 215.01 ft (65.54m) msl
WELL BSW 3C3MEASUREMENTS CONDUCTED IN THE FIELD
Sample date: 12/28/00 Time: 13:41Depth to water: 45.66 ft (13.92m) below TOCWater elevation: 214.74 ft (65.45m) msl
WELL BSW 3C4MEASUREMENTS CONDUCTED IN THE FIELD
Sample date: 12/28/00 Time: 13:41Depth to water: 45.97 ft (14.01m) below TOCWater elevation: 214.33 ft (65.33m) msl
WELL BSW 3D1MEASUREMENTS CONDUCTED IN THE FIELD
Sample date: 12/28/00 Time: 13:41Depth to water: 39.8 ft (12.13m) below TOCWater elevation: 219.7 ft (66.97m) msl
WELL BSW 3D2MEASUREMENTS CONDUCTED IN THE FIELD
Sample date: 12/28/00 Time: 13:42Depth to water: 40.11 ft (12.23m) below TOCWater elevation: 219.39 ft (66.87m) msl
WELL BSW 4C1MEASUREMENTS CONDUCTED IN THE FIELD
Sample date: 12/28/00 Time: 13:43Depth to water: 49.76 ft (15.17m) below TOCWater elevation: 217.84 ft (66.40m) msl
WELL BSW 4C3MEASUREMENTS CONDUCTED IN THE FIELD
Sample date: 12/28/00 Time: 13:43Depth to water: 51.07 ft (15.57m) below TOCWater elevation: 216.43 ft (65.97m) msl
WELL BSW 4D1MEASUREMENTS CONDUCTED IN THE FIELD
Sample date: 12/28/00 Time: 13:43Depth to water: 48.76 ft (14.86m) below TOCWater elevation: 219.84 ft (67.01m) msl
WELL BSW 4D2MEASUREMENTS CONDUCTED IN THE FIELD
Sample date: 12/28/00 Time: 13:43Depth to water: 48.88 ft (14.90m) below TOCWater elevation: 219.62 ft (66.94m) msl
WELL BSW 4D3MEASUREMENTS CONDUCTED IN THE FIELD
Sample date: 12/28/00 Time: 13:44Depth to water: 49.26 ft (15.01m) below TOCWater elevation: 219.34 ft (66.86m) msl
WELL BSW 5C1MEASUREMENTS CONDUCTED IN THE FIELD
Sample date: 12/28/00 Time: 13:44Depth to water: 45.39 ft (13.84m) below TOCWater elevation: 211.91 ft (64.59m) msl
WELL BSW 5C2MEASUREMENTS CONDUCTED IN THE FIELD
Sample date: 12/28/00 Time: 13:44Depth to water: 46.04 ft (14.03m) below TOCWater elevation: 211.16 ft (64.36m) msl
WELL BSW 5C3MEASUREMENTS CONDUCTED IN THE FIELD
Sample date: 12/28/00 Time: 13:44Depth to water: 46.05 ft (14.04m) below TOCWater elevation: 210.95 ft (64.30m) msl
WELL BSW 5C4MEASUREMENTS CONDUCTED IN THE FIELD
Sample date: 12/28/00 Time: 13:45Depth to water: 46.26 ft (14.10m) below TOCWater elevation: 210.94 ft (64.30m) msl

WATER-LEVEL DATAWATER-LEVEL DATA
ESH-EMS-2000408ESH-EMS-2000408 A-A-1818 Fourth Quarter 2000Fourth Quarter 2000
WELL BSW 5D1MEASUREMENTS CONDUCTED IN THE FIELD
Sample date: 12/28/00 Time: 13:45Depth to water: 42 ft (12.80m) below TOCWater elevation: 215.2 ft (65.59m) msl
WELL BSW 5D2MEASUREMENTS CONDUCTED IN THE FIELD
Sample date: 12/28/00 Time: 13:45Depth to water: 42.01 ft (12.80m) below TOCWater elevation: 215.29 ft (65.62m) msl
WELL BSW 5D3MEASUREMENTS CONDUCTED IN THE FIELD
Sample date: 12/28/00 Time: 13:45Depth to water: 42.14 ft (12.84m) below TOCWater elevation: 215.26 ft (65.61m) msl
WELL BSW 6C1MEASUREMENTS CONDUCTED IN THE FIELD
Sample date: 12/28/00 Time: 13:17Depth to water: 33.83 ft (10.31m) below TOCWater elevation: 210.27 ft (64.09m) msl
WELL BSW 6C2MEASUREMENTS CONDUCTED IN THE FIELD
Sample date: 12/28/00 Time: 13:17Depth to water: 34.83 ft (10.62m) below TOCWater elevation: 209.27 ft (63.79m) msl
WELL BSW 6C3MEASUREMENTS CONDUCTED IN THE FIELD
Sample date: 12/28/00 Time: 13:18Depth to water: 34.16 ft (10.41m) below TOCWater elevation: 209.74 ft (63.93m) msl
WELL BSW 6C4MEASUREMENTS CONDUCTED IN THE FIELD
Sample date: 12/28/00 Time: 13:18Depth to water: 34.93 ft (10.65m) below TOCWater elevation: 209.17 ft (63.76m) msl
WELL BSW 6D1MEASUREMENTS CONDUCTED IN THE FIELD
Sample date: 12/28/00 Time: 13:19Depth to water: Not availableWater elevation: Not available
WELL BSW 6D2MEASUREMENTS CONDUCTED IN THE FIELD
Sample date: 12/28/00 Time: 13:19Depth to water: 32.37 ft (9.87m) below TOCWater elevation: 212.23 ft (64.69m) msl
WELL BSW 6D3MEASUREMENTS CONDUCTED IN THE FIELD
Sample date: 12/28/00 Time: 13:20Depth to water: 32.44 ft (9.89m) below TOCWater elevation: 212.16 ft (64.67m) msl
WELL BSW 7C1MEASUREMENTS CONDUCTED IN THE FIELD
Sample date: 12/28/00 Time: 13:46Depth to water: 38.13 ft (11.62m) below TOCWater elevation: 211.17 ft (64.37m) msl
WELL BSW 7C2MEASUREMENTS CONDUCTED IN THE FIELD
Sample date: 12/28/00 Time: 13:46Depth to water: 38.27 ft (11.66m) below TOCWater elevation: 211.03 ft (64.32m) msl
WELL BSW 7C3MEASUREMENTS CONDUCTED IN THE FIELD
Sample date: 12/28/00 Time: 13:46Depth to water: 38.61 ft (11.77m) below TOCWater elevation: 210.69 ft (64.22m) msl
WELL BSW 7C4MEASUREMENTS CONDUCTED IN THE FIELD
Sample date: 12/28/00 Time: 13:47Depth to water: 40.05 ft (12.21m) below TOCWater elevation: 209.25 ft (63.78m) msl
WELL BSW 7D1MEASUREMENTS CONDUCTED IN THE FIELD
Sample date: 12/28/00 Time: 13:47Depth to water: 36.79 ft (11.21m) below TOCWater elevation: 213.81 ft (65.17m) msl
WELL BSW 7D2MEASUREMENTS CONDUCTED IN THE FIELD
Sample date: 12/28/00 Time: 13:47Depth to water: 36.7 ft (11.19m) below TOCWater elevation: 214 ft (65.23m) msl

WATER-LEVEL DATAWATER-LEVEL DATA
ESH-EMS-2000408ESH-EMS-2000408 A-A-1919 Fourth Quarter 2000Fourth Quarter 2000
WELL BSW 7D3MEASUREMENTS CONDUCTED IN THE FIELD
Sample date: 12/28/00 Time: 13:47Depth to water: 37.22 ft (11.34m) below TOCWater elevation: 213.48 ft (65.07m) msl
WELL BSW 8C1MEASUREMENTS CONDUCTED IN THE FIELD
Sample date: 12/28/00 Time: 13:48Depth to water: 19.74 ft (6.02m) below TOCWater elevation: 214.26 ft (65.31m) msl
WELL BSW 8C2MEASUREMENTS CONDUCTED IN THE FIELD
Sample date: 12/28/00 Time: 13:48Depth to water: 19.92 ft (6.07m) below TOCWater elevation: 214.08 ft (65.25m) msl
WELL BSW 8C3MEASUREMENTS CONDUCTED IN THE FIELD
Sample date: 12/28/00 Time: 13:48Depth to water: 20.19 ft (6.15m) below TOCWater elevation: 213.81 ft (65.17m) msl
WELL BSW 8C4MEASUREMENTS CONDUCTED IN THE FIELD
Sample date: 12/28/00 Time: 13:48Depth to water: 20.81 ft (6.34m) below TOCWater elevation: 213.29 ft (65.01m) msl
WELL BSW 8D1MEASUREMENTS CONDUCTED IN THE FIELD
Sample date: 12/28/00 Time: 13:49Depth to water: 17.23 ft (5.25m) below TOCWater elevation: 216.27 ft (65.92m) msl
WELL BSW 8D2MEASUREMENTS CONDUCTED IN THE FIELD
Sample date: 12/28/00 Time: 13:49Depth to water: 17.72 ft (5.40m) below TOCWater elevation: 215.78 ft (65.77m) msl
WELL BSW 8D3MEASUREMENTS CONDUCTED IN THE FIELD
Sample date: 12/28/00 Time: 13:49Depth to water: 17.72 ft (5.40m) below TOCWater elevation: 215.68 ft (65.74m) msl
WELL FIW 1IDMEASUREMENTS CONDUCTED IN THE FIELD
Sample date: 12/20/00 Time: 13:33Depth to water: 77.19 ft (23.53m) below TOCWater elevation: 216.71 ft (66.05m) msl
WELL FIW 1MCMEASUREMENTS CONDUCTED IN THE FIELD
Sample date: 12/20/00 Time: 13:32Depth to water: 82.1 ft (25.02m) below TOCWater elevation: 211.6 ft (64.50m) msl
WELL FIW 2ICMEASUREMENTS CONDUCTED IN THE FIELD
Sample date: 12/20/00 Time: 14:39Depth to water: 79.3 ft (24.17m) below TOCWater elevation: 211.2 ft (64.37m) msl
WELL FIW 2MAMEASUREMENTS CONDUCTED IN THE FIELD
Sample date: 12/20/00 Time: 14:37Depth to water: 142.35 ft (43.39m) below TOCWater elevation: 150.35 ft (45.83m) msl
WELL FIW 2MCMEASUREMENTS CONDUCTED IN THE FIELD
Sample date: 12/20/00 Time: 14:33Depth to water: 74.75 ft (22.78m) below TOCWater elevation: 211.05 ft (64.33m) msl
WELL FIW 2MDMEASUREMENTS CONDUCTED IN THE FIELD
Sample date: 12/20/00 Time: 14:40Depth to water: 74.7 ft (22.77m) below TOCWater elevation: 216.1 ft (65.87m) msl
WELL FOB 5CMEASUREMENTS CONDUCTED IN THE FIELD
Sample date: 12/20/00 Time: 9:56Depth to water: 64.5 ft (19.66m) below TOCWater elevation: 194.3 ft (59.22m) msl
WELL FOB 7AMEASUREMENTS CONDUCTED IN THE FIELD
Sample date: 12/20/00 Time: 8:50Depth to water: 145.7 ft (44.41m) below TOCWater elevation: 152.2 ft (46.39m) msl

WATER-LEVEL DATAWATER-LEVEL DATA
ESH-EMS-2000408ESH-EMS-2000408 A-A-2020 Fourth Quarter 2000Fourth Quarter 2000
WELL FOB 7CMEASUREMENTS CONDUCTED IN THE FIELD
Sample date: 12/20/00 Time: 8:51Depth to water: 89.75 ft (27.36m) below TOCWater elevation: 208.65 ft (63.60m) msl
WELL FOB 9CMEASUREMENTS CONDUCTED IN THE FIELD
Sample date: 12/20/00 Time: 10:31Depth to water: 83.85 ft (25.56m) below TOCWater elevation: 211.15 ft (64.36m) msl
WELL FOB 11CMEASUREMENTS CONDUCTED IN THE FIELD
Sample date: 12/20/00 Time: 15:58Depth to water: 50.6 ft (15.42m) below TOCWater elevation: 213.1 ft (64.95m) msl
WELL FSB 0PCMEASUREMENTS CONDUCTED IN THE FIELD
Sample date: 12/20/00 Time: 15:24Depth to water: 39.6 ft (12.07m) below TOCWater elevation: 193.1 ft (58.86m) msl
WELL FSB 0PDMEASUREMENTS CONDUCTED IN THE FIELD
Sample date: 12/31/00 Time: 10:30Depth to water: 52.96 ft (16.14m) below TOCWater elevation: 201.74 ft (61.49m) msl
WELL FSB 25PCMEASUREMENTS CONDUCTED IN THE FIELD
Sample date: 12/20/00 Time: 15:23Depth to water: 39.7 ft (12.10m) below TOCWater elevation: 194.1 ft (59.16m) msl
WELL FSB 25PDMEASUREMENTS CONDUCTED IN THE FIELD
Sample date: 12/20/00 Time: 9:54Depth to water: 53.1 ft (16.19m) below TOCWater elevation: 201.5 ft (61.42m) msl
WELL FSB 50PCMEASUREMENTS CONDUCTED IN THE FIELD
Sample date: 12/20/00 Time: 15:23Depth to water: 39.8 ft (12.13m) below TOCWater elevation: 191.4 ft (58.34m) msl
WELL FSB 50PDMEASUREMENTS CONDUCTED IN THE FIELD
Sample date: 12/20/00 Time: 9:51Depth to water: 55.7 ft (16.98m) below TOCWater elevation: 202.3 ft (61.66m) msl
WELL FSB 76MEASUREMENTS CONDUCTED IN THE FIELD
Sample date: 12/20/00 Time: 13:30Depth to water: 77.7 ft (23.68m) below TOCWater elevation: 216.5 ft (65.99m) msl
WELL FSB 76AMEASUREMENTS CONDUCTED IN THE FIELD
Sample date: 12/20/00 Time: 13:28Depth to water: 139.82 ft (42.62m) below TOCWater elevation: 154.08 ft (46.96m) msl
WELL FSB 76BMEASUREMENTS CONDUCTED IN THE FIELD
Sample date: 12/20/00 Time: 13:27Depth to water: 143.53 ft (43.75m) below TOCWater elevation: 150.27 ft (45.80m) msl
WELL FSB 76CMEASUREMENTS CONDUCTED IN THE FIELD
Sample date: 12/20/00 Time: 13:26Depth to water: 82.15 ft (25.04m) below TOCWater elevation: 211.45 ft (64.45m) msl
WELL FSB 77MEASUREMENTS CONDUCTED IN THE FIELD
Sample date: 12/20/00 Time: 14:26Depth to water: 62.15 ft (18.94m) below TOCWater elevation: 211.15 ft (64.36m) msl
WELL FSB 78MEASUREMENTS CONDUCTED IN THE FIELD
Sample date: 12/29/00 Time: 9:54Depth to water: Not availableWater elevation: Not available
WELL FSB 78AMEASUREMENTS CONDUCTED IN THE FIELD
Sample date: 12/20/00 Time: 10:57Depth to water: 117.8 ft (35.91m) below TOCWater elevation: 154.8 ft (47.18m) msl

WATER-LEVEL DATAWATER-LEVEL DATA
ESH-EMS-2000408ESH-EMS-2000408 A-A-2121 Fourth Quarter 2000Fourth Quarter 2000
WELL FSB 78BMEASUREMENTS CONDUCTED IN THE FIELD
Sample date: 12/20/00 Time: 10:55Depth to water: 119.7 ft (36.49m) below TOCWater elevation: 153.1 ft (46.67m) msl
WELL FSB 78CMEASUREMENTS CONDUCTED IN THE FIELD
Sample date: 12/20/00 Time: 10:58Depth to water: 71.2 ft (21.70m) below TOCWater elevation: 202.3 ft (61.66m) msl
WELL FSB 79MEASUREMENTS CONDUCTED IN THE FIELD
Sample date: 12/29/00 Time: 9:46Depth to water: 26.82 ft (8.17m) below TOCWater elevation: 190.98 ft (58.21m) msl
WELL FSB 79AMEASUREMENTS CONDUCTED IN THE FIELD
Sample date: 12/20/00 Time: 11:15Depth to water: 61.5 ft (18.75m) below TOCWater elevation: 156.6 ft (47.73m) msl
WELL FSB 79BMEASUREMENTS CONDUCTED IN THE FIELD
Sample date: 12/20/00 Time: 11:16Depth to water: 61.4 ft (18.71m) below TOCWater elevation: 156.8 ft (47.79m) msl
WELL FSB 79CMEASUREMENTS CONDUCTED IN THE FIELD
Sample date: 12/29/00 Time: 9:47Depth to water: 25.25 ft (7.70m) below TOCWater elevation: 193.15 ft (58.87m) msl
WELL FSB 87AMEASUREMENTS CONDUCTED IN THE FIELD
Sample date: 12/20/00 Time: 10:23Depth to water: 135.2 ft (41.21m) below TOCWater elevation: 152.6 ft (46.51m) msl
WELL FSB 87BMEASUREMENTS CONDUCTED IN THE FIELD
Sample date: 12/20/00 Time: 10:22Depth to water: 138.25 ft (42.14m) below TOCWater elevation: 149.25 ft (45.49m) msl
WELL FSB 87CMEASUREMENTS CONDUCTED IN THE FIELD
Sample date: 12/20/00 Time: 10:21Depth to water: 80.7 ft (24.60m) below TOCWater elevation: 206.8 ft (63.03m) msl
WELL FSB 87DMEASUREMENTS CONDUCTED IN THE FIELD
Sample date: 12/20/00 Time: 10:20Depth to water: 76.28 ft (23.25m) below TOCWater elevation: 211.02 ft (64.32m) msl
WELL FSB 88CMEASUREMENTS CONDUCTED IN THE FIELD
Sample date: 12/20/00 Time: 14:02Depth to water: 71.65 ft (21.84m) below TOCWater elevation: 211.35 ft (64.42m) msl
WELL FSB 88DMEASUREMENTS CONDUCTED IN THE FIELD
Sample date: 12/20/00 Time: 14:03Depth to water: 66.95 ft (20.41m) below TOCWater elevation: 215.45 ft (65.67m) msl
WELL FSB 89CMEASUREMENTS CONDUCTED IN THE FIELD
Sample date: 12/20/00 Time: 14:12Depth to water: 70.5 ft (21.49m) below TOCWater elevation: 210.8 ft (64.25m) msl
WELL FSB 89DMEASUREMENTS CONDUCTED IN THE FIELD
Sample date: 12/20/00 Time: 14:12Depth to water: 66.4 ft (20.24m) below TOCWater elevation: 214.8 ft (65.47m) msl
WELL FSB 90CMEASUREMENTS CONDUCTED IN THE FIELD
Sample date: 12/20/00 Time: 14:14Depth to water: 69.35 ft (21.14m) below TOCWater elevation: 209.05 ft (63.72m) msl
WELL FSB 90DMEASUREMENTS CONDUCTED IN THE FIELD
Sample date: 12/29/00 Time: 9:47Depth to water: Not availableWater elevation: Not available

WATER-LEVEL DATAWATER-LEVEL DATA
ESH-EMS-2000408ESH-EMS-2000408 A-A-2222 Fourth Quarter 2000Fourth Quarter 2000
WELL FSB 91CMEASUREMENTS CONDUCTED IN THE FIELD
Sample date: 12/20/00 Time: 14:21Depth to water: 69.9 ft (21.31m) below TOCWater elevation: 209.4 ft (63.83m) msl
WELL FSB 91DMEASUREMENTS CONDUCTED IN THE FIELD
Sample date: 12/20/00 Time: 14:23Depth to water: 66.9 ft (20.39m) below TOCWater elevation: 212.3 ft (64.71m) msl
WELL FSB 92CMEASUREMENTS CONDUCTED IN THE FIELD
Sample date: 12/20/00 Time: 14:50Depth to water: 68.7 ft (20.94m) below TOCWater elevation: 207 ft (63.09m) msl
WELL FSB 92DMEASUREMENTS CONDUCTED IN THE FIELD
Sample date: 12/29/00 Time: 9:48Depth to water: 66.03 ft (20.13m) below TOCWater elevation: 209.87 ft (63.97m) msl
WELL FSB 93CMEASUREMENTS CONDUCTED IN THE FIELD
Sample date: 12/20/00 Time: 14:53Depth to water: 70.95 ft (21.63m) below TOCWater elevation: 205.25 ft (62.56m) msl
WELL FSB 93DMEASUREMENTS CONDUCTED IN THE FIELD
Sample date: 12/20/00 Time: 14:55Depth to water: 68.25 ft (20.80m) below TOCWater elevation: 207.85 ft (63.35m) msl
WELL FSB 94CMEASUREMENTS CONDUCTED IN THE FIELD
Sample date: 12/20/00 Time: 10:52Depth to water: 77.95 ft (23.76m) below TOCWater elevation: 203.15 ft (61.92m) msl
WELL FSB 94DRMEASUREMENTS CONDUCTED IN THE FIELD
Sample date: 12/29/00 Time: 9:49Depth to water: 74.31 ft (22.65m) below TOCWater elevation: 206.19 ft (62.85m) msl
WELL FSB 95CRMEASUREMENTS CONDUCTED IN THE FIELD
Sample date: 12/29/00 Time: 9:49Depth to water: 82.55 ft (25.16m) below TOCWater elevation: 201.45 ft (61.40m) msl
WELL FSB 95DRMEASUREMENTS CONDUCTED IN THE FIELD
Sample date: 12/29/00 Time: 9:50Depth to water: 71.85 ft (21.90m) below TOCWater elevation: 212.25 ft (64.69m) msl
WELL FSB 96ARMEASUREMENTS CONDUCTED IN THE FIELD
Sample date: 12/20/00 Time: 10:01Depth to water: 129.5 ft (39.47m) below TOCWater elevation: 151.7 ft (46.24m) msl
WELL FSB 97AMEASUREMENTS CONDUCTED IN THE FIELD
Sample date: 12/20/00 Time: 10:47Depth to water: 135.55 ft (41.32m) below TOCWater elevation: 150.55 ft (45.89m) msl
WELL FSB 97CMEASUREMENTS CONDUCTED IN THE FIELD
Sample date: 12/29/00 Time: 9:50Depth to water: 81.61 ft (24.88m) below TOCWater elevation: 204.49 ft (62.33m) msl
WELL FSB 97DMEASUREMENTS CONDUCTED IN THE FIELD
Sample date: 12/29/00 Time: 9:51Depth to water: 78.15 ft (23.82m) below TOCWater elevation: 207.85 ft (63.35m) msl
WELL FSB 98ARMEASUREMENTS CONDUCTED IN THE FIELD
Sample date: 12/20/00 Time: 10:43Depth to water: 134 ft (40.84m) below TOCWater elevation: 150 ft (45.72m) msl
WELL FSB 98CMEASUREMENTS CONDUCTED IN THE FIELD
Sample date: 12/29/00 Time: 9:51Depth to water: 78 ft (23.77m) below TOCWater elevation: 206.5 ft (62.94m) msl

WATER-LEVEL DATAWATER-LEVEL DATA
ESH-EMS-2000408ESH-EMS-2000408 A-A-2323 Fourth Quarter 2000Fourth Quarter 2000
WELL FSB 98DMEASUREMENTS CONDUCTED IN THE FIELD
Sample date: 12/29/00 Time: 9:52Depth to water: 74.45 ft (22.69m) below TOCWater elevation: 210.05 ft (64.02m) msl
WELL FSB 99AMEASUREMENTS CONDUCTED IN THE FIELD
Sample date: 12/20/00 Time: 10:38Depth to water: 138.4 ft (42.18m) below TOCWater elevation: 149.2 ft (45.48m) msl
WELL FSB 99CMEASUREMENTS CONDUCTED IN THE FIELD
Sample date: 12/20/00 Time: 10:40Depth to water: 79.27 ft (24.16m) below TOCWater elevation: 208.43 ft (63.53m) msl
WELL FSB 99DMEASUREMENTS CONDUCTED IN THE FIELD
Sample date: 12/20/00 Time: 10:41Depth to water: 74.4 ft (22.68m) below TOCWater elevation: 213.2 ft (64.98m) msl
WELL FSB100AMEASUREMENTS CONDUCTED IN THE FIELD
Sample date: 12/20/00 Time: 14:28Depth to water: 135.85 ft (41.41m) below TOCWater elevation: 150.15 ft (45.77m) msl
WELL FSB100PCMEASUREMENTS CONDUCTED IN THE FIELD
Sample date: 12/20/00 Time: 15:26Depth to water: 38.38 ft (11.70m) below TOCWater elevation: 191.62 ft (58.41m) msl
WELL FSB100PDMEASUREMENTS CONDUCTED IN THE FIELD
Sample date: 12/20/00 Time: 9:49Depth to water: 51.45 ft (15.68m) below TOCWater elevation: 201.45 ft (61.40m) msl
WELL FSB101AMEASUREMENTS CONDUCTED IN THE FIELD
Sample date: 12/20/00 Time: 14:31Depth to water: 134.8 ft (41.09m) below TOCWater elevation: 150.4 ft (45.84m) msl
WELL FSB102CMEASUREMENTS CONDUCTED IN THE FIELD
Sample date: 12/20/00 Time: 15:31Depth to water: 7.7 ft (2.35m) below TOCWater elevation: 193.4 ft (58.95m) msl
WELL FSB103CMEASUREMENTS CONDUCTED IN THE FIELD
Sample date: 12/20/00 Time: 9:46Depth to water: 47.8 ft (14.57m) below TOCWater elevation: 194.6 ft (59.31m) msl
WELL FSB104CMEASUREMENTS CONDUCTED IN THE FIELD
Sample date: 12/20/00 Time: 14:59Depth to water: 24.47 ft (7.46m) below TOCWater elevation: 194.63 ft (59.32m) msl
WELL FSB104DMEASUREMENTS CONDUCTED IN THE FIELD
Sample date: 12/20/00 Time: 15:01Depth to water: 22.65 ft (6.90m) below TOCWater elevation: 196.55 ft (59.91m) msl
WELL FSB105CMEASUREMENTS CONDUCTED IN THE FIELD
Sample date: 12/20/00 Time: 10:16Depth to water: 82.9 ft (25.27m) below TOCWater elevation: 202.9 ft (61.84m) msl
WELL FSB105DRMEASUREMENTS CONDUCTED IN THE FIELD
Sample date: 12/20/00 Time: 10:16Depth to water: 78.1 ft (23.81m) below TOCWater elevation: 207.5 ft (63.25m) msl
WELL FSB106CMEASUREMENTS CONDUCTED IN THE FIELD
Sample date: 12/20/00 Time: 15:34Depth to water: 37.6 ft (11.46m) below TOCWater elevation: 197.5 ft (60.20m) msl
WELL FSB106DMEASUREMENTS CONDUCTED IN THE FIELD
Sample date: 12/20/00 Time: 15:36Depth to water: Not availableWater elevation: Not available

WATER-LEVEL DATAWATER-LEVEL DATA
ESH-EMS-2000408ESH-EMS-2000408 A-A-2424 Fourth Quarter 2000Fourth Quarter 2000
WELL FSB107CMEASUREMENTS CONDUCTED IN THE FIELD
Sample date: 12/20/00 Time: 14:18Depth to water: 62 ft (18.90m) below TOCWater elevation: 208.9 ft (63.67m) msl
WELL FSB107DMEASUREMENTS CONDUCTED IN THE FIELD
Sample date: 12/29/00 Time: 9:52Depth to water: 58.35 ft (17.79m) below TOCWater elevation: 212.65 ft (64.82m) msl
WELL FSB108DMEASUREMENTS CONDUCTED IN THE FIELD
Sample date: 12/20/00 Time: 8:50Depth to water: 81.9 ft (24.96m) below TOCWater elevation: 216.1 ft (65.87m) msl
WELL FSB109DMEASUREMENTS CONDUCTED IN THE FIELD
Sample date: 12/20/00 Time: 10:35Depth to water: 78.7 ft (23.99m) below TOCWater elevation: 214.4 ft (65.35m) msl
WELL FSB110CMEASUREMENTS CONDUCTED IN THE FIELD
Sample date: 12/20/00 Time: 15:18Depth to water: 38.7 ft (11.80m) below TOCWater elevation: 195.8 ft (59.68m) msl
WELL FSB110DMEASUREMENTS CONDUCTED IN THE FIELD
Sample date: 12/29/00 Time: 9:53Depth to water: 36 ft (10.97m) below TOCWater elevation: 198.5 ft (60.50m) msl
WELL FSB111CMEASUREMENTS CONDUCTED IN THE FIELD
Sample date: 12/20/00 Time: 14:06Depth to water: 65.55 ft (19.98m) below TOCWater elevation: 210.75 ft (64.24m) msl
WELL FSB111DMEASUREMENTS CONDUCTED IN THE FIELD
Sample date: 12/20/00 Time: 14:08Depth to water: 62.3 ft (18.99m) below TOCWater elevation: 214.3 ft (65.32m) msl
WELL FSB112AMEASUREMENTS CONDUCTED IN THE FIELD
Sample date: 12/20/00 Time: 15:09Depth to water: 77.35 ft (23.58m) below TOCWater elevation: 151.75 ft (46.25m) msl
WELL FSB112CMEASUREMENTS CONDUCTED IN THE FIELD
Sample date: 12/20/00 Time: 15:10Depth to water: 33.5 ft (10.21m) below TOCWater elevation: 195.6 ft (59.62m) msl
WELL FSB112DMEASUREMENTS CONDUCTED IN THE FIELD
Sample date: 12/20/00 Time: 15:11Depth to water: 31.05 ft (9.46m) below TOCWater elevation: 198.55 ft (60.52m) msl
WELL FSB113AMEASUREMENTS CONDUCTED IN THE FIELD
Sample date: 12/20/00 Time: 15:43Depth to water: 64.35 ft (19.61m) below TOCWater elevation: 158.85 ft (48.42m) msl
WELL FSB113CMEASUREMENTS CONDUCTED IN THE FIELD
Sample date: 12/20/00 Time: 15:43Depth to water: 23.68 ft (7.22m) below TOCWater elevation: 199.22 ft (60.72m) msl
WELL FSB113DMEASUREMENTS CONDUCTED IN THE FIELD
Sample date: 12/20/00 Time: 15:45Depth to water: 19.02 ft (5.80m) below TOCWater elevation: 203.48 ft (62.02m) msl
WELL FSB114AMEASUREMENTS CONDUCTED IN THE FIELD
Sample date: 12/20/00 Time: 13:57Depth to water: 97.95 ft (29.86m) below TOCWater elevation: 154.05 ft (46.96m) msl
WELL FSB114CMEASUREMENTS CONDUCTED IN THE FIELD
Sample date: 12/20/00 Time: 13:59Depth to water: 41.65 ft (12.70m) below TOCWater elevation: 210.55 ft (64.18m) msl

WATER-LEVEL DATAWATER-LEVEL DATA
ESH-EMS-2000408ESH-EMS-2000408 A-A-2525 Fourth Quarter 2000Fourth Quarter 2000
WELL FSB114DMEASUREMENTS CONDUCTED IN THE FIELD
Sample date: 12/20/00 Time: 13:59Depth to water: 37.25 ft (11.35m) below TOCWater elevation: 214.95 ft (65.52m) msl
WELL FSB115CMEASUREMENTS CONDUCTED IN THE FIELD
Sample date: 12/20/00 Time: 13:08Depth to water: 23.85 ft (7.27m) below TOCWater elevation: 183.95 ft (56.07m) msl
WELL FSB115DMEASUREMENTS CONDUCTED IN THE FIELD
Sample date: 12/20/00 Time: 13:08Depth to water: 19.15 ft (5.84m) below TOCWater elevation: 189.35 ft (57.71m) msl
WELL FSB116CMEASUREMENTS CONDUCTED IN THE FIELD
Sample date: 12/20/00 Time: 13:13Depth to water: 14.6 ft (4.45m) below TOCWater elevation: 187.9 ft (57.27m) msl
WELL FSB116DMEASUREMENTS CONDUCTED IN THE FIELD
Sample date: 12/20/00 Time: 13:12Depth to water: 13.4 ft (4.08m) below TOCWater elevation: 189.5 ft (57.76m) msl
WELL FSB117DMEASUREMENTS CONDUCTED IN THE FIELD
Sample date: 12/20/00 Time: 15:28Depth to water: 31.65 ft (9.65m) below TOCWater elevation: 199.05 ft (60.67m) msl
WELL FSB118DMEASUREMENTS CONDUCTED IN THE FIELD
Sample date: 12/20/00 Time: 15:47Depth to water: 34.4 ft (10.49m) below TOCWater elevation: 208.9 ft (63.67m) msl
WELL FSB119DMEASUREMENTS CONDUCTED IN THE FIELD
Sample date: 12/29/00 Time: 9:53Depth to water: Not availableWater elevation: Not available
WELL FSB120AMEASUREMENTS CONDUCTED IN THE FIELD
Sample date: 12/20/00 Time: 9:33Depth to water: 118.15 ft (36.01m) below TOCWater elevation: 161.95 ft (49.36m) msl
WELL FSB120CMEASUREMENTS CONDUCTED IN THE FIELD
Sample date: 12/20/00 Time: 9:35Depth to water: 78.3 ft (23.87m) below TOCWater elevation: 201.4 ft (61.39m) msl
WELL FSB120DMEASUREMENTS CONDUCTED IN THE FIELD
Sample date: 12/20/00 Time: 9:36Depth to water: 75.28 ft (22.95m) below TOCWater elevation: 205.22 ft (62.55m) msl
WELL FSB121CMEASUREMENTS CONDUCTED IN THE FIELD
Sample date: 12/20/00 Time: 9:25Depth to water: 57.68 ft (17.58m) below TOCWater elevation: 198.82 ft (60.60m) msl
WELL FSB121DRMEASUREMENTS CONDUCTED IN THE FIELD
Sample date: 12/20/00 Time: 9:27Depth to water: 53.85 ft (16.41m) below TOCWater elevation: 201.65 ft (61.46m) msl
WELL FSB122CMEASUREMENTS CONDUCTED IN THE FIELD
Sample date: 12/20/00 Time: 15:04Depth to water: 23.53 ft (7.17m) below TOCWater elevation: 194.47 ft (59.28m) msl
WELL FSB122DMEASUREMENTS CONDUCTED IN THE FIELD
Sample date: 12/20/00 Time: 15:05Depth to water: 20.28 ft (6.18m) below TOCWater elevation: 197.32 ft (60.14m) msl
WELL FSB123CMEASUREMENTS CONDUCTED IN THE FIELD
Sample date: 12/20/00 Time: 15:51Depth to water: 30.05 ft (9.16m) below TOCWater elevation: 208.05 ft (63.41m) msl

WATER-LEVEL DATAWATER-LEVEL DATA
ESH-EMS-2000408ESH-EMS-2000408 A-A-2626 Fourth Quarter 2000Fourth Quarter 2000
WELL FSB123DMEASUREMENTS CONDUCTED IN THE FIELD
Sample date: 12/20/00 Time: 15:53Depth to water: 28.5 ft (8.69m) below TOCWater elevation: 209.6 ft (63.89m) msl
WELL FSB150PCMEASUREMENTS CONDUCTED IN THE FIELD
Sample date: 12/20/00 Time: 15:16Depth to water: 43.1 ft (13.14m) below TOCWater elevation: 193.7 ft (59.04m) msl
WELL FSB150PDMEASUREMENTS CONDUCTED IN THE FIELD
Sample date: 12/20/00 Time: 9:57Depth to water: 57.28 ft (17.46m) below TOCWater elevation: 202.12 ft (61.61m) msl
WELL FSL 1DMEASUREMENTS CONDUCTED IN THE FIELD
Sample date: 12/21/00 Time: 9:16Depth to water: 89.66 ft (27.33m) below TOCWater elevation: 221.14 ft (67.40m) msl
WELL FSL 2DMEASUREMENTS CONDUCTED IN THE FIELD
Sample date: 12/21/00 Time: 9:28Depth to water: 83.95 ft (25.59m) below TOCWater elevation: 221.85 ft (67.62m) msl
WELL FSL 3DMEASUREMENTS CONDUCTED IN THE FIELD
Sample date: 12/21/00 Time: 9:35Depth to water: 82.62 ft (25.18m) below TOCWater elevation: 219.38 ft (66.87m) msl
WELL FSL 4DMEASUREMENTS CONDUCTED IN THE FIELD
Sample date: 12/21/00 Time: 9:48Depth to water: 80.55 ft (24.55m) below TOCWater elevation: 213.55 ft (65.09m) msl
WELL FSL 5DMEASUREMENTS CONDUCTED IN THE FIELD
Sample date: 12/21/00 Time: 9:51Depth to water: 74.1 ft (22.59m) below TOCWater elevation: 217.7 ft (66.36m) msl
WELL FSL 6DMEASUREMENTS CONDUCTED IN THE FIELD
Sample date: 12/21/00 Time: 9:55Depth to water: 69.08 ft (21.06m) below TOCWater elevation: 217.12 ft (66.18m) msl
WELL FSL 7DMEASUREMENTS CONDUCTED IN THE FIELD
Sample date: 12/20/00 Time: 13:20Depth to water: 71.2 ft (21.70m) below TOCWater elevation: 216.4 ft (65.96m) msl
WELL FSL 8DMEASUREMENTS CONDUCTED IN THE FIELD
Sample date: 12/20/00 Time: 13:38Depth to water: 73.72 ft (22.47m) below TOCWater elevation: 217.08 ft (66.17m) msl
WELL FSL 9DMEASUREMENTS CONDUCTED IN THE FIELD
Sample date: 12/20/00 Time: 13:54Depth to water: 70.5 ft (21.49m) below TOCWater elevation: 215.4 ft (65.65m) msl
WELL FSL 10CMEASUREMENTS CONDUCTED IN THE FIELD
Sample date: 12/21/00 Time: 9:30Depth to water: 56.8 ft (17.31m) below TOCWater elevation: 210 ft (64.01m) msl
WELL FSL 11CMEASUREMENTS CONDUCTED IN THE FIELD
Sample date: 12/21/00 Time: 9:38Depth to water: 90.25 ft (27.51m) below TOCWater elevation: 210.45 ft (64.15m) msl
WELL FSS 1DMEASUREMENTS CONDUCTED IN THE FIELD
Sample date: 12/21/00 Time: 10:09Depth to water: 45.9 ft (13.99m) below TOCWater elevation: 220.1 ft (67.09m) msl
WELL FSS 2DMEASUREMENTS CONDUCTED IN THE FIELD
Sample date: 12/21/00 Time: 10:12Depth to water: 41.97 ft (12.79m) below TOCWater elevation: 219.63 ft (66.94m) msl

WATER-LEVEL DATAWATER-LEVEL DATA
ESH-EMS-2000408ESH-EMS-2000408 A-A-2727 Fourth Quarter 2000Fourth Quarter 2000
WELL FSS 3DMEASUREMENTS CONDUCTED IN THE FIELD
Sample date: 12/21/00 Time: 10:15Depth to water: 40.6 ft (12.38m) below TOCWater elevation: 217.6 ft (66.33m) msl
WELL FSS 4DMEASUREMENTS CONDUCTED IN THE FIELD
Sample date: 12/21/00 Time: 10:04Depth to water: 75.55 ft (23.03m) below TOCWater elevation: 216.25 ft (65.91m) msl
WELL HIW 1MDMEASUREMENTS CONDUCTED IN THE FIELD
Sample date: 12/30/00 Time: 11:14Depth to water: 36.1 ft (11.00m) below TOCWater elevation: 238.5 ft (72.70m) msl
WELL HIW 1PDMEASUREMENTS CONDUCTED IN THE FIELD
Sample date: 12/30/00 Time: 11:15Depth to water: 39.03 ft (11.90m) below TOCWater elevation: 237.37 ft (72.35m) msl
WELL HIW 2AMEASUREMENTS CONDUCTED IN THE FIELD
Sample date: 12/30/00 Time: 11:15Depth to water: 111.62 ft (34.02m) below TOCWater elevation: 166.38 ft (50.71m) msl
WELL HIW 2DMEASUREMENTS CONDUCTED IN THE FIELD
Sample date: 12/30/00 Time: 11:16Depth to water: 43.53 ft (13.27m) below TOCWater elevation: 234.27 ft (71.41m) msl
WELL HIW 2MCMEASUREMENTS CONDUCTED IN THE FIELD
Sample date: 12/30/00 Time: 11:16Depth to water: 40.1 ft (12.22m) below TOCWater elevation: 230.8 ft (70.35m) msl
WELL HIW 3MCMEASUREMENTS CONDUCTED IN THE FIELD
Sample date: 12/30/00 Time: 11:17Depth to water: 44.07 ft (13.43m) below TOCWater elevation: 229.93 ft (70.08m) msl
WELL HIW 5MCMEASUREMENTS CONDUCTED IN THE FIELD
Sample date: 12/30/00 Time: 11:18Depth to water: 39.6 ft (12.07m) below TOCWater elevation: 228.6 ft (69.68m) msl
WELL HMD 1DMEASUREMENTS CONDUCTED IN THE FIELD
Sample date: 12/20/00 Time: 9:27Depth to water: 59.67 ft (18.19m) below TOCWater elevation: 204.83 ft (62.43m) msl
WELL HMD 2DMEASUREMENTS CONDUCTED IN THE FIELD
Sample date: 12/20/00 Time: 9:16Depth to water: 64.22 ft (19.57m) below TOCWater elevation: 196.88 ft (60.01m) msl
WELL HMD 3DMEASUREMENTS CONDUCTED IN THE FIELD
Sample date: 12/20/00 Time: 9:09Depth to water: 62.87 ft (19.16m) below TOCWater elevation: 196.63 ft (59.93m) msl
WELL HMD 4DMEASUREMENTS CONDUCTED IN THE FIELD
Sample date: 12/20/00 Time: 8:49Depth to water: 53.89 ft (16.43m) below TOCWater elevation: 197.01 ft (60.05m) msl
WELL HSB 0PCMEASUREMENTS CONDUCTED IN THE FIELD
Sample date: 12/19/00 Time: 14:30Depth to water: 18.86 ft (5.75m) below TOCWater elevation: 210.94 ft (64.30m) msl
WELL HSB 0PDMEASUREMENTS CONDUCTED IN THE FIELD
Sample date: 12/19/00 Time: 14:49Depth to water: 19.81 ft (6.04m) below TOCWater elevation: 213.29 ft (65.01m) msl
WELL HSB 25PCMEASUREMENTS CONDUCTED IN THE FIELD
Sample date: 12/19/00 Time: 14:31Depth to water: 18.61 ft (5.67m) below TOCWater elevation: 210.89 ft (64.28m) msl

WATER-LEVEL DATAWATER-LEVEL DATA
ESH-EMS-2000408ESH-EMS-2000408 A-A-2828 Fourth Quarter 2000Fourth Quarter 2000
WELL HSB 25PDMEASUREMENTS CONDUCTED IN THE FIELD
Sample date: 12/19/00 Time: 14:48Depth to water: 19.23 ft (5.86m) below TOCWater elevation: 213.27 ft (65.01m) msl
WELL HSB 50PCMEASUREMENTS CONDUCTED IN THE FIELD
Sample date: 12/19/00 Time: 14:29Depth to water: 20.76 ft (6.33m) below TOCWater elevation: 210.94 ft (64.30m) msl
WELL HSB 50PDMEASUREMENTS CONDUCTED IN THE FIELD
Sample date: 12/19/00 Time: 14:52Depth to water: 19.07 ft (5.81m) below TOCWater elevation: 213.23 ft (64.99m) msl
WELL HSB 65MEASUREMENTS CONDUCTED IN THE FIELD
Sample date: 12/30/00 Time: 11:18Depth to water: 36.51 ft (11.13m) below TOCWater elevation: 235.49 ft (71.78m) msl
WELL HSB 65AMEASUREMENTS CONDUCTED IN THE FIELD
Sample date: 12/30/00 Time: 11:18Depth to water: 103.8 ft (31.64m) below TOCWater elevation: 169.8 ft (51.76m) msl
WELL HSB 65BMEASUREMENTS CONDUCTED IN THE FIELD
Sample date: 12/30/00 Time: 11:19Depth to water: 49.5 ft (15.09m) below TOCWater elevation: 224.2 ft (68.34m) msl
WELL HSB 65CMEASUREMENTS CONDUCTED IN THE FIELD
Sample date: 12/30/00 Time: 11:19Depth to water: 37.18 ft (11.33m) below TOCWater elevation: 236.42 ft (72.06m) msl
WELL HSB 66MEASUREMENTS CONDUCTED IN THE FIELD
Sample date: 12/30/00 Time: 11:19Depth to water: 69.66 ft (21.23m) below TOCWater elevation: 210.54 ft (64.17m) msl
WELL HSB 67MEASUREMENTS CONDUCTED IN THE FIELD
Sample date: 12/20/00 Time: 7:04Depth to water: 16.78 ft (5.11m) below TOCWater elevation: 221.02 ft (67.37m) msl
WELL HSB 68MEASUREMENTS CONDUCTED IN THE FIELD
Sample date: 12/19/00 Time: 15:00Depth to water: 34.85 ft (10.62m) below TOCWater elevation: 215.25 ft (65.61m) msl
WELL HSB 68AMEASUREMENTS CONDUCTED IN THE FIELD
Sample date: 12/19/00 Time: 15:03Depth to water: 78.8 ft (24.02m) below TOCWater elevation: 170.6 ft (52.00m) msl
WELL HSB 68BMEASUREMENTS CONDUCTED IN THE FIELD
Sample date: 12/19/00 Time: 15:02Depth to water: 36.1 ft (11.00m) below TOCWater elevation: 213.9 ft (65.20m) msl
WELL HSB 68CMEASUREMENTS CONDUCTED IN THE FIELD
Sample date: 12/19/00 Time: 15:03Depth to water: 35.7 ft (10.88m) below TOCWater elevation: 214.4 ft (65.35m) msl
WELL HSB 69MEASUREMENTS CONDUCTED IN THE FIELD
Sample date: 12/19/00 Time: 14:54Depth to water: 22.75 ft (6.93m) below TOCWater elevation: 213.25 ft (65.00m) msl
WELL HSB 69AMEASUREMENTS CONDUCTED IN THE FIELD
Sample date: 12/19/00 Time: 14:53Depth to water: 65.95 ft (20.10m) below TOCWater elevation: 170.65 ft (52.01m) msl
WELL HSB 70MEASUREMENTS CONDUCTED IN THE FIELD
Sample date: 12/30/00 Time: 11:20Depth to water: 24.55 ft (7.48m) below TOCWater elevation: 218.25 ft (66.52m) msl

WATER-LEVEL DATAWATER-LEVEL DATA
ESH-EMS-2000408ESH-EMS-2000408 A-A-2929 Fourth Quarter 2000Fourth Quarter 2000
WELL HSB 70CMEASUREMENTS CONDUCTED IN THE FIELD
Sample date: 12/30/00 Time: 11:20Depth to water: 25 ft (7.62m) below TOCWater elevation: 218.1 ft (66.48m) msl
WELL HSB 71MEASUREMENTS CONDUCTED IN THE FIELD
Sample date: 12/19/00 Time: 14:13Depth to water: Not availableWater elevation: Not available
WELL HSB 71CMEASUREMENTS CONDUCTED IN THE FIELD
Sample date: 12/19/00 Time: 14:17Depth to water: 23.77 ft (7.25m) below TOCWater elevation: 217.83 ft (66.40m) msl
WELL HSB 83AMEASUREMENTS CONDUCTED IN THE FIELD
Sample date: 12/20/00 Time: 7:32Depth to water: 65.61 ft (20.00m) below TOCWater elevation: 171.69 ft (52.33m) msl
WELL HSB 83BMEASUREMENTS CONDUCTED IN THE FIELD
Sample date: 12/20/00 Time: 7:33Depth to water: 15.99 ft (4.87m) below TOCWater elevation: 221.01 ft (67.36m) msl
WELL HSB 83CMEASUREMENTS CONDUCTED IN THE FIELD
Sample date: 12/20/00 Time: 7:34Depth to water: 14.09 ft (4.29m) below TOCWater elevation: 223.01 ft (67.97m) msl
WELL HSB 83DMEASUREMENTS CONDUCTED IN THE FIELD
Sample date: 12/20/00 Time: 7:35Depth to water: 14.01 ft (4.27m) below TOCWater elevation: 222.99 ft (67.97m) msl
WELL HSB 84AMEASUREMENTS CONDUCTED IN THE FIELD
Sample date: 12/19/00 Time: 14:45Depth to water: 58.3 ft (17.77m) below TOCWater elevation: 170.4 ft (51.94m) msl
WELL HSB 84BMEASUREMENTS CONDUCTED IN THE FIELD
Sample date: 12/19/00 Time: 14:47Depth to water: 21 ft (6.40m) below TOCWater elevation: 207.9 ft (63.37m) msl
WELL HSB 84CMEASUREMENTS CONDUCTED IN THE FIELD
Sample date: 12/19/00 Time: 14:47Depth to water: 19.1 ft (5.82m) below TOCWater elevation: 210 ft (64.01m) msl
WELL HSB 84DMEASUREMENTS CONDUCTED IN THE FIELD
Sample date: 12/19/00 Time: 14:47Depth to water: 15.83 ft (4.83m) below TOCWater elevation: 212.97 ft (64.91m) msl
WELL HSB 85AMEASUREMENTS CONDUCTED IN THE FIELD
Sample date: 12/20/00 Time: 8:30Depth to water: 126.81 ft (38.65m) below TOCWater elevation: 167.59 ft (51.08m) msl
WELL HSB 85BMEASUREMENTS CONDUCTED IN THE FIELD
Sample date: 12/20/00 Time: 8:30Depth to water: 63.4 ft (19.32m) below TOCWater elevation: 231.1 ft (70.44m) msl
WELL HSB 85CMEASUREMENTS CONDUCTED IN THE FIELD
Sample date: 12/20/00 Time: 8:32Depth to water: 57.48 ft (17.52m) below TOCWater elevation: 236.62 ft (72.12m) msl
WELL HSB 86AMEASUREMENTS CONDUCTED IN THE FIELD
Sample date: 12/20/00 Time: 10:20Depth to water: 95.41 ft (29.08m) below TOCWater elevation: 166.99 ft (50.90m) msl
WELL HSB 86BMEASUREMENTS CONDUCTED IN THE FIELD
Sample date: 12/20/00 Time: 10:22Depth to water: 45.66 ft (13.92m) below TOCWater elevation: 216.24 ft (65.91m) msl

WATER-LEVEL DATAWATER-LEVEL DATA
ESH-EMS-2000408ESH-EMS-2000408 A-A-3030 Fourth Quarter 2000Fourth Quarter 2000
WELL HSB 86CMEASUREMENTS CONDUCTED IN THE FIELD
Sample date: 12/20/00 Time: 10:25Depth to water: 46.02 ft (14.03m) below TOCWater elevation: 216.88 ft (66.11m) msl
WELL HSB 86DMEASUREMENTS CONDUCTED IN THE FIELD
Sample date: 12/20/00 Time: 10:20Depth to water: 46.28 ft (14.11m) below TOCWater elevation: 216.72 ft (66.06m) msl
WELL HSB100CMEASUREMENTS CONDUCTED IN THE FIELD
Sample date: 12/20/00 Time: 11:27Depth to water: 35.22 ft (10.74m) below TOCWater elevation: 224.98 ft (68.57m) msl
WELL HSB100DMEASUREMENTS CONDUCTED IN THE FIELD
Sample date: 12/20/00 Time: 11:27Depth to water: 25.81 ft (7.87m) below TOCWater elevation: 234.29 ft (71.41m) msl
WELL HSB100PCMEASUREMENTS CONDUCTED IN THE FIELD
Sample date: 12/19/00 Time: 14:32Depth to water: 21.16 ft (6.45m) below TOCWater elevation: 208.84 ft (63.66m) msl
WELL HSB100PDMEASUREMENTS CONDUCTED IN THE FIELD
Sample date: 12/19/00 Time: 14:50Depth to water: 13.21 ft (4.03m) below TOCWater elevation: 212.79 ft (64.86m) msl
WELL HSB101CMEASUREMENTS CONDUCTED IN THE FIELD
Sample date: 12/20/00 Time: 11:21Depth to water: 34.64 ft (10.56m) below TOCWater elevation: 223.86 ft (68.23m) msl
WELL HSB101DMEASUREMENTS CONDUCTED IN THE FIELD
Sample date: 12/20/00 Time: 11:22Depth to water: 27.87 ft (8.49m) below TOCWater elevation: 230.83 ft (70.36m) msl
WELL HSB102CMEASUREMENTS CONDUCTED IN THE FIELD
Sample date: 12/20/00 Time: 11:11Depth to water: 36.03 ft (10.98m) below TOCWater elevation: 222.97 ft (67.96m) msl
WELL HSB102DMEASUREMENTS CONDUCTED IN THE FIELD
Sample date: 12/20/00 Time: 11:11Depth to water: 30.9 ft (9.42m) below TOCWater elevation: 227.7 ft (69.40m) msl
WELL HSB103CMEASUREMENTS CONDUCTED IN THE FIELD
Sample date: 12/20/00 Time: 11:06Depth to water: 25.89 ft (7.89m) below TOCWater elevation: 221.51 ft (67.52m) msl
WELL HSB103DMEASUREMENTS CONDUCTED IN THE FIELD
Sample date: 12/20/00 Time: 11:04Depth to water: 25.27 ft (7.70m) below TOCWater elevation: 222.33 ft (67.77m) msl
WELL HSB104CMEASUREMENTS CONDUCTED IN THE FIELD
Sample date: 12/20/00 Time: 11:00Depth to water: 29.77 ft (9.07m) below TOCWater elevation: 218.13 ft (66.49m) msl
WELL HSB104DMEASUREMENTS CONDUCTED IN THE FIELD
Sample date: 12/20/00 Time: 11:02Depth to water: 27.79 ft (8.47m) below TOCWater elevation: 220.01 ft (67.06m) msl
WELL HSB105CMEASUREMENTS CONDUCTED IN THE FIELD
Sample date: 12/20/00 Time: 6:02Depth to water: 32.51 ft (9.91m) below TOCWater elevation: 216.99 ft (66.14m) msl
WELL HSB105DMEASUREMENTS CONDUCTED IN THE FIELD
Sample date: 12/20/00 Time: 5:58Depth to water: 29.37 ft (8.95m) below TOCWater elevation: 220.13 ft (67.10m) msl

WATER-LEVEL DATAWATER-LEVEL DATA
ESH-EMS-2000408ESH-EMS-2000408 A-A-3131 Fourth Quarter 2000Fourth Quarter 2000
WELL HSB106CMEASUREMENTS CONDUCTED IN THE FIELD
Sample date: 12/19/00 Time: 15:23Depth to water: 33.65 ft (10.26m) below TOCWater elevation: 219.25 ft (66.83m) msl
WELL HSB106DMEASUREMENTS CONDUCTED IN THE FIELD
Sample date: 12/19/00 Time: 15:23Depth to water: 31.61 ft (9.63m) below TOCWater elevation: 221.29 ft (67.45m) msl
WELL HSB107CMEASUREMENTS CONDUCTED IN THE FIELD
Sample date: 12/19/00 Time: 15:24Depth to water: 45.15 ft (13.76m) below TOCWater elevation: 216.45 ft (65.97m) msl
WELL HSB107DMEASUREMENTS CONDUCTED IN THE FIELD
Sample date: 12/19/00 Time: 15:25Depth to water: 42.41 ft (12.93m) below TOCWater elevation: 219.89 ft (67.02m) msl
WELL HSB108CMEASUREMENTS CONDUCTED IN THE FIELD
Sample date: 12/19/00 Time: 15:30Depth to water: 51.1 ft (15.58m) below TOCWater elevation: 215.1 ft (65.56m) msl
WELL HSB108DMEASUREMENTS CONDUCTED IN THE FIELD
Sample date: 12/19/00 Time: 15:30Depth to water: 48.1 ft (14.66m) below TOCWater elevation: 218.2 ft (66.51m) msl
WELL HSB109CMEASUREMENTS CONDUCTED IN THE FIELD
Sample date: 12/19/00 Time: 15:31Depth to water: 46.15 ft (14.07m) below TOCWater elevation: 215.45 ft (65.67m) msl
WELL HSB109DMEASUREMENTS CONDUCTED IN THE FIELD
Sample date: 12/19/00 Time: 15:33Depth to water: 44.55 ft (13.58m) below TOCWater elevation: 216.65 ft (66.04m) msl
WELL HSB110CMEASUREMENTS CONDUCTED IN THE FIELD
Sample date: 12/19/00 Time: 15:33Depth to water: 40.26 ft (12.27m) below TOCWater elevation: 215.44 ft (65.67m) msl
WELL HSB110DMEASUREMENTS CONDUCTED IN THE FIELD
Sample date: 12/19/00 Time: 15:36Depth to water: 39.9 ft (12.16m) below TOCWater elevation: 215.7 ft (65.75m) msl
WELL HSB111CMEASUREMENTS CONDUCTED IN THE FIELD
Sample date: 12/19/00 Time: 15:39Depth to water: Not availableWater elevation: Not available
WELL HSB111DMEASUREMENTS CONDUCTED IN THE FIELD
Sample date: 12/19/00 Time: 15:41Depth to water: 41.69 ft (12.71m) below TOCWater elevation: 214.31 ft (65.32m) msl
WELL HSB111EMEASUREMENTS CONDUCTED IN THE FIELD
Sample date: 12/19/00 Time: 15:41Depth to water: 41.42 ft (12.62m) below TOCWater elevation: 214.48 ft (65.37m) msl
WELL HSB112CMEASUREMENTS CONDUCTED IN THE FIELD
Sample date: 12/20/00 Time: 10:49Depth to water: 38.32 ft (11.68m) below TOCWater elevation: 216.58 ft (66.01m) msl
WELL HSB112DMEASUREMENTS CONDUCTED IN THE FIELD
Sample date: 12/20/00 Time: 10:48Depth to water: 39.44 ft (12.02m) below TOCWater elevation: 215.66 ft (65.73m) msl
WELL HSB112EMEASUREMENTS CONDUCTED IN THE FIELD
Sample date: 12/20/00 Time: 10:45Depth to water: 39.62 ft (12.08m) below TOCWater elevation: 215.48 ft (65.68m) msl

WATER-LEVEL DATAWATER-LEVEL DATA
ESH-EMS-2000408ESH-EMS-2000408 A-A-3232 Fourth Quarter 2000Fourth Quarter 2000
WELL HSB113CMEASUREMENTS CONDUCTED IN THE FIELD
Sample date: 12/20/00 Time: 10:36Depth to water: 44.6 ft (13.59m) below TOCWater elevation: 216.4 ft (65.96m) msl
WELL HSB113DMEASUREMENTS CONDUCTED IN THE FIELD
Sample date: 12/20/00 Time: 10:40Depth to water: 45.54 ft (13.88m) below TOCWater elevation: 215.36 ft (65.64m) msl
WELL HSB114CMEASUREMENTS CONDUCTED IN THE FIELD
Sample date: 12/20/00 Time: 10:30Depth to water: 47.43 ft (14.46m) below TOCWater elevation: 216.37 ft (65.95m) msl
WELL HSB114DMEASUREMENTS CONDUCTED IN THE FIELD
Sample date: 12/20/00 Time: 10:31Depth to water: 47.62 ft (14.51m) below TOCWater elevation: 216.38 ft (65.95m) msl
WELL HSB115CMEASUREMENTS CONDUCTED IN THE FIELD
Sample date: 12/20/00 Time: 10:15Depth to water: 51.58 ft (15.72m) below TOCWater elevation: 217.72 ft (66.36m) msl
WELL HSB115DMEASUREMENTS CONDUCTED IN THE FIELD
Sample date: 12/20/00 Time: 10:15Depth to water: 51.41 ft (15.67m) below TOCWater elevation: 217.69 ft (66.35m) msl
WELL HSB116CMEASUREMENTS CONDUCTED IN THE FIELD
Sample date: 12/20/00 Time: 10:02Depth to water: 37.77 ft (11.51m) below TOCWater elevation: 219.73 ft (66.97m) msl
WELL HSB116DMEASUREMENTS CONDUCTED IN THE FIELD
Sample date: 12/20/00 Time: 10:00Depth to water: 36.8 ft (11.22m) below TOCWater elevation: 220 ft (67.06m) msl
WELL HSB117AMEASUREMENTS CONDUCTED IN THE FIELD
Sample date: 12/19/00 Time: 14:18Depth to water: 72.35 ft (22.05m) below TOCWater elevation: 164.95 ft (50.28m) msl
WELL HSB117CMEASUREMENTS CONDUCTED IN THE FIELD
Sample date: 12/19/00 Time: 14:20Depth to water: 20.76 ft (6.33m) below TOCWater elevation: 216.64 ft (66.03m) msl
WELL HSB117DMEASUREMENTS CONDUCTED IN THE FIELD
Sample date: 12/19/00 Time: 14:21Depth to water: 19.8 ft (6.04m) below TOCWater elevation: 217.8 ft (66.39m) mslWELL HSB118AMEASUREMENTS CONDUCTED IN THE FIELD
Sample date: 12/20/00 Time: 10:09Depth to water: 81.3 ft (24.78m) below TOCWater elevation: 166 ft (50.60m) msl
WELL HSB119AMEASUREMENTS CONDUCTED IN THE FIELD
Sample date: 12/20/00 Time: 9:57Depth to water: 91.62 ft (27.93m) below TOCWater elevation: 165.48 ft (50.44m) msl
WELL HSB120AMEASUREMENTS CONDUCTED IN THE FIELD
Sample date: 12/20/00 Time: 9:53Depth to water: 103.48 ft (31.54m) below TOCWater elevation: 164.72 ft (50.21m) msl
WELL HSB121AMEASUREMENTS CONDUCTED IN THE FIELD
Sample date: 12/20/00 Time: 11:50Depth to water: 104.93 ft (31.98m) below TOCWater elevation: 169.67 ft (51.72m) msl
WELL HSB122AMEASUREMENTS CONDUCTED IN THE FIELD
Sample date: 12/20/00 Time: 11:46Depth to water: 101.53 ft (30.95m) below TOCWater elevation: 170.07 ft (51.84m) msl

WATER-LEVEL DATAWATER-LEVEL DATA
ESH-EMS-2000408ESH-EMS-2000408 A-A-3333 Fourth Quarter 2000Fourth Quarter 2000
WELL HSB123AMEASUREMENTS CONDUCTED IN THE FIELD
Sample date: 12/20/00 Time: 11:44Depth to water: 94.86 ft (28.91m) below TOCWater elevation: 170.84 ft (52.07m) msl
WELL HSB124ARMEASUREMENTS CONDUCTED IN THE FIELD
Sample date: 12/20/00 Time: 11:33Depth to water: 96.58 ft (29.44m) below TOCWater elevation: 170.22 ft (51.88m) msl
WELL HSB125CMEASUREMENTS CONDUCTED IN THE FIELD
Sample date: 12/20/00 Time: 7:12Depth to water: 10.44 ft (3.18m) below TOCWater elevation: 221.46 ft (67.50m) msl
WELL HSB125DMEASUREMENTS CONDUCTED IN THE FIELD
Sample date: 12/20/00 Time: 7:13Depth to water: 13.44 ft (4.10m) below TOCWater elevation: 218.26 ft (66.53m) msl
WELL HSB126CMEASUREMENTS CONDUCTED IN THE FIELD
Sample date: 12/20/00 Time: 6:12Depth to water: 8.91 ft (2.72m) below TOCWater elevation: 203.69 ft (62.09m) msl
WELL HSB126DMEASUREMENTS CONDUCTED IN THE FIELD
Sample date: 12/20/00 Time: 6:14Depth to water: 8.07 ft (2.46m) below TOCWater elevation: 204.63 ft (62.37m) msl
WELL HSB127CMEASUREMENTS CONDUCTED IN THE FIELD
Sample date: 12/19/00 Time: 15:09Depth to water: 17.7 ft (5.40m) below TOCWater elevation: 208 ft (63.40m) msl
WELL HSB127DMEASUREMENTS CONDUCTED IN THE FIELD
Sample date: 12/19/00 Time: 15:11Depth to water: 16.67 ft (5.08m) below TOCWater elevation: 209.43 ft (63.84m) msl
WELL HSB129CMEASUREMENTS CONDUCTED IN THE FIELD
Sample date: 12/19/00 Time: 14:26Depth to water: 11.11 ft (3.39m) below TOCWater elevation: 203.99 ft (62.18m) msl
WELL HSB129DMEASUREMENTS CONDUCTED IN THE FIELD
Sample date: 12/19/00 Time: 14:25Depth to water: 7.91 ft (2.41m) below TOCWater elevation: 206.79 ft (63.03m) msl
WELL HSB130CMEASUREMENTS CONDUCTED IN THE FIELD
Sample date: 12/20/00 Time: 6:47Depth to water: 18.97 ft (5.78m) below TOCWater elevation: 199.33 ft (60.76m) msl
WELL HSB130DMEASUREMENTS CONDUCTED IN THE FIELD
Sample date: 12/20/00 Time: 6:44Depth to water: 19.23 ft (5.86m) below TOCWater elevation: 199.37 ft (60.77m) msl
WELL HSB131CMEASUREMENTS CONDUCTED IN THE FIELD
Sample date: 12/20/00 Time: 6:21Depth to water: 8.29 ft (2.53m) below TOCWater elevation: 203.41 ft (62.00m) msl
WELL HSB131DMEASUREMENTS CONDUCTED IN THE FIELD
Sample date: 12/20/00 Time: 6:24Depth to water: 7.29 ft (2.22m) below TOCWater elevation: 204.81 ft (62.43m) msl
WELL HSB132CMEASUREMENTS CONDUCTED IN THE FIELD
Sample date: 12/20/00 Time: 7:54Depth to water: 20.71 ft (6.31m) below TOCWater elevation: 219.79 ft (66.99m) msl
WELL HSB132DMEASUREMENTS CONDUCTED IN THE FIELD
Sample date: 12/20/00 Time: 7:51Depth to water: 21.11 ft (6.43m) below TOCWater elevation: 219.59 ft (66.93m) msl

WATER-LEVEL DATAWATER-LEVEL DATA
ESH-EMS-2000408ESH-EMS-2000408 A-A-3434 Fourth Quarter 2000Fourth Quarter 2000
WELL HSB133CMEASUREMENTS CONDUCTED IN THE FIELD
Sample date: 12/20/00 Time: 7:43Depth to water: 65.98 ft (20.11m) below TOCWater elevation: 189.62 ft (57.80m) msl
WELL HSB133DMEASUREMENTS CONDUCTED IN THE FIELD
Sample date: 12/20/00 Time: 7:41Depth to water: 40.15 ft (12.24m) below TOCWater elevation: 215.15 ft (65.58m) msl
WELL HSB134CMEASUREMENTS CONDUCTED IN THE FIELD
Sample date: 12/20/00 Time: 6:59Depth to water: 19.63 ft (5.98m) below TOCWater elevation: 218.77 ft (66.68m) msl
WELL HSB134DMEASUREMENTS CONDUCTED IN THE FIELD
Sample date: 12/20/00 Time: 6:57Depth to water: 20.65 ft (6.29m) below TOCWater elevation: 217.45 ft (66.28m) msl
WELL HSB135CMEASUREMENTS CONDUCTED IN THE FIELD
Sample date: 12/19/00 Time: 14:58Depth to water: 26.62 ft (8.11m) below TOCWater elevation: 205.38 ft (62.60m) msl
WELL HSB135DMEASUREMENTS CONDUCTED IN THE FIELD
Sample date: 12/19/00 Time: 14:56Depth to water: 19.61 ft (5.98m) below TOCWater elevation: 212.69 ft (64.83m) msl
WELL HSB136CMEASUREMENTS CONDUCTED IN THE FIELD
Sample date: 12/19/00 Time: 14:42Depth to water: 17.08 ft (5.21m) below TOCWater elevation: 210.82 ft (64.26m) msl
WELL HSB136DMEASUREMENTS CONDUCTED IN THE FIELD
Sample date: 12/19/00 Time: 14:43Depth to water: 14.61 ft (4.45m) below TOCWater elevation: 213.39 ft (65.04m) msl
WELL HSB137CMEASUREMENTS CONDUCTED IN THE FIELD
Sample date: 12/19/00 Time: 14:35Depth to water: 22.7 ft (6.92m) below TOCWater elevation: 213.3 ft (65.01m) msl
WELL HSB137DMEASUREMENTS CONDUCTED IN THE FIELD
Sample date: 12/19/00 Time: 14:33Depth to water: 21.52 ft (6.56m) below TOCWater elevation: 215.08 ft (65.56m) msl
WELL HSB138DMEASUREMENTS CONDUCTED IN THE FIELD
Sample date: 12/19/00 Time: 13:49Depth to water: 32.85 ft (10.01m) below TOCWater elevation: 219.55 ft (66.92m) msl
WELL HSB139AMEASUREMENTS CONDUCTED IN THE FIELD
Sample date: 12/19/00 Time: 15:19Depth to water: 61.7 ft (18.81m) below TOCWater elevation: 172 ft (52.43m) msl
WELL HSB139CMEASUREMENTS CONDUCTED IN THE FIELD
Sample date: 12/19/00 Time: 15:18Depth to water: 21.8 ft (6.64m) below TOCWater elevation: 212 ft (64.62m) msl
WELL HSB139DMEASUREMENTS CONDUCTED IN THE FIELD
Sample date: 12/19/00 Time: 15:15Depth to water: 18.3 ft (5.58m) below TOCWater elevation: 215.5 ft (65.69m) msl
WELL HSB140AMEASUREMENTS CONDUCTED IN THE FIELD
Sample date: 12/20/00 Time: 6:28Depth to water: 62.33 ft (19.00m) below TOCWater elevation: 173.57 ft (52.90m) msl
WELL HSB140CMEASUREMENTS CONDUCTED IN THE FIELD
Sample date: 12/20/00 Time: 6:30Depth to water: 30.52 ft (9.30m) below TOCWater elevation: 205.08 ft (62.51m) msl

WATER-LEVEL DATAWATER-LEVEL DATA
ESH-EMS-2000408ESH-EMS-2000408 A-A-3535 Fourth Quarter 2000Fourth Quarter 2000
WELL HSB140DMEASUREMENTS CONDUCTED IN THE FIELD
Sample date: 12/20/00 Time: 6:30Depth to water: 24.16 ft (7.36m) below TOCWater elevation: 212.04 ft (64.63m) msl
WELL HSB141AMEASUREMENTS CONDUCTED IN THE FIELD
Sample date: 12/20/00 Time: 7:59Depth to water: 80.69 ft (24.59m) below TOCWater elevation: 173.91 ft (53.01m) msl
WELL HSB141CRMEASUREMENTS CONDUCTED IN THE FIELD
Sample date: 12/20/00 Time: 7:59Depth to water: 28.91 ft (8.81m) below TOCWater elevation: 225.39 ft (68.70m) msl
WELL HSB141DMEASUREMENTS CONDUCTED IN THE FIELD
Sample date: 12/20/00 Time: 8:01Depth to water: 22.51 ft (6.86m) below TOCWater elevation: 232.29 ft (70.80m) msl
WELL HSB142CMEASUREMENTS CONDUCTED IN THE FIELD
Sample date: 12/19/00 Time: 14:07Depth to water: 5.75 ft (1.75m) below TOCWater elevation: 198.25 ft (60.43m) msl
WELL HSB142DMEASUREMENTS CONDUCTED IN THE FIELD
Sample date: 12/19/00 Time: 14:09Depth to water: 6.39 ft (1.95m) below TOCWater elevation: 197.81 ft (60.29m) msl
WELL HSB143CMEASUREMENTS CONDUCTED IN THE FIELD
Sample date: 12/30/00 Time: 11:21Depth to water: 15.08 ft (4.60m) below TOCWater elevation: 207.12 ft (63.13m) msl
WELL HSB143DMEASUREMENTS CONDUCTED IN THE FIELD
Sample date: 12/30/00 Time: 11:21Depth to water: 20.6 ft (6.28m) below TOCWater elevation: 202.3 ft (61.66m) msl
WELL HSB144AMEASUREMENTS CONDUCTED IN THE FIELD
Sample date: 12/19/00 Time: 14:37Depth to water: 66.62 ft (20.31m) below TOCWater elevation: 168.98 ft (51.51m) msl
WELL HSB145CMEASUREMENTS CONDUCTED IN THE FIELD
Sample date: 12/20/00 Time: 6:07Depth to water: 24.46 ft (7.46m) below TOCWater elevation: 211.24 ft (64.39m) msl
WELL HSB145DMEASUREMENTS CONDUCTED IN THE FIELD
Sample date: 12/20/00 Time: 6:07Depth to water: 22.37 ft (6.82m) below TOCWater elevation: 213.83 ft (65.18m) msl
WELL HSB146AMEASUREMENTS CONDUCTED IN THE FIELD
Sample date: 12/20/00 Time: 8:13Depth to water: 66.62 ft (20.31m) below TOCWater elevation: 184.98 ft (56.38m) msl
WELL HSB146CMEASUREMENTS CONDUCTED IN THE FIELD
Sample date: 12/20/00 Time: 8:13Depth to water: 43.76 ft (13.34m) below TOCWater elevation: 208.54 ft (63.56m) msl
WELL HSB146DMEASUREMENTS CONDUCTED IN THE FIELD
Sample date: 12/20/00 Time: 8:09Depth to water: 34.79 ft (10.60m) below TOCWater elevation: 218.31 ft (66.54m) msl
WELL HSB147DMEASUREMENTS CONDUCTED IN THE FIELD
Sample date: 12/19/00 Time: 13:49Depth to water: 41.34 ft (12.60m) below TOCWater elevation: 225.96 ft (68.87m) msl
WELL HSB148CMEASUREMENTS CONDUCTED IN THE FIELD
ample date: 12/20/00 Time: 6:36Depth to water: 50.22 ft (15.31m) below TOCWater elevation: 200.68 ft (61.17m) msl

WATER-LEVEL DATAWATER-LEVEL DATA
ESH-EMS-2000408ESH-EMS-2000408 A-A-3636 Fourth Quarter 2000Fourth Quarter 2000
WELL HSB148DMEASUREMENTS CONDUCTED IN THE FIELD
Sample date: 12/20/00 Time: 6:37Depth to water: 40.31 ft (12.29m) below TOCWater elevation: 210.79 ft (64.25m) msl
WELL HSB149DMEASUREMENTS CONDUCTED IN THE FIELD
Sample date: 12/19/00 Time: 15:13Depth to water: 23.56 ft (7.18m) below TOCWater elevation: 216.44 ft (65.97m) msl
WELL HSB150DMEASUREMENTS CONDUCTED IN THE FIELD
Sample date: 12/20/00 Time: 7:29Depth to water: 15.25 ft (4.65m) below TOCWater elevation: 223.75 ft (68.20m) msl
WELL HSB150PCMEASUREMENTS CONDUCTED IN THE FIELD
Sample date: 12/19/00 Time: 14:23Depth to water: 19.52 ft (5.95m) below TOCWater elevation: 212.18 ft (64.67m) msl
WELL HSB151CMEASUREMENTS CONDUCTED IN THE FIELD
Sample date: 12/19/00 Time: 14:06Depth to water: 6.83 ft (2.08m) below TOCWater elevation: 206.77 ft (63.02m) msl
WELL HSB151DMEASUREMENTS CONDUCTED IN THE FIELD
Sample date: 12/19/00 Time: 14:06Depth to water: 7.51 ft (2.29m) below TOCWater elevation: 206.09 ft (62.82m) msl
WELL HSB152CMEASUREMENTS CONDUCTED IN THE FIELD
Sample date: 12/19/00 Time: 13:59Depth to water: 16.08 ft (4.90m) below TOCWater elevation: 198.02 ft (60.36m) msl
WELL HSB152DMEASUREMENTS CONDUCTED IN THE FIELD
Sample date: 12/19/00 Time: 14:00Depth to water: 12.86 ft (3.92m) below TOCWater elevation: 201.24 ft (61.34m) msl
WELL HSL 1DMEASUREMENTS CONDUCTED IN THE FIELD
Sample date: 12/20/00 Time: 11:30Depth to water: 28.81 ft (8.78m) below TOCWater elevation: 235.19 ft (71.69m) msl
WELL HSL 2DMEASUREMENTS CONDUCTED IN THE FIELD
Sample date: 12/30/00 Time: 11:22Depth to water: 24.9 ft (7.59m) below TOCWater elevation: 240.6 ft (73.34m) msl
WELL HSL 3DMEASUREMENTS CONDUCTED IN THE FIELD
Sample date: 12/30/00 Time: 11:22Depth to water: 19.85 ft (6.05m) below TOCWater elevation: 247.75 ft (75.52m) msl
WELL HSL 4DMEASUREMENTS CONDUCTED IN THE FIELD
Sample date: 12/30/00 Time: 11:23Depth to water: 13.75 ft (4.19m) below TOCWater elevation: 259.45 ft (79.08m) msl
WELL HSL 5DMEASUREMENTS CONDUCTED IN THE FIELD
Sample date: 12/30/00 Time: 11:24Depth to water: 11.4 ft (3.47m) below TOCWater elevation: 265.2 ft (80.83m) msl
WELL HSL 6DMEASUREMENTS CONDUCTED IN THE FIELD
Sample date: 12/30/00 Time: 11:24Depth to water: 23.77 ft (7.25m) below TOCWater elevation: 256.23 ft (78.10m) msl
WELL HSL 7DMEASUREMENTS CONDUCTED IN THE FIELD
Sample date: 12/30/00 Time: 11:24Depth to water: 27.68 ft (8.44m) below TOCWater elevation: 256.12 ft (78.07m) msl
WELL HSL 8DMEASUREMENTS CONDUCTED IN THE FIELD
Sample date: 12/30/00 Time: 11:25Depth to water: 31.45 ft (9.59m) below TOCWater elevation: 257.25 ft (78.41m) msl
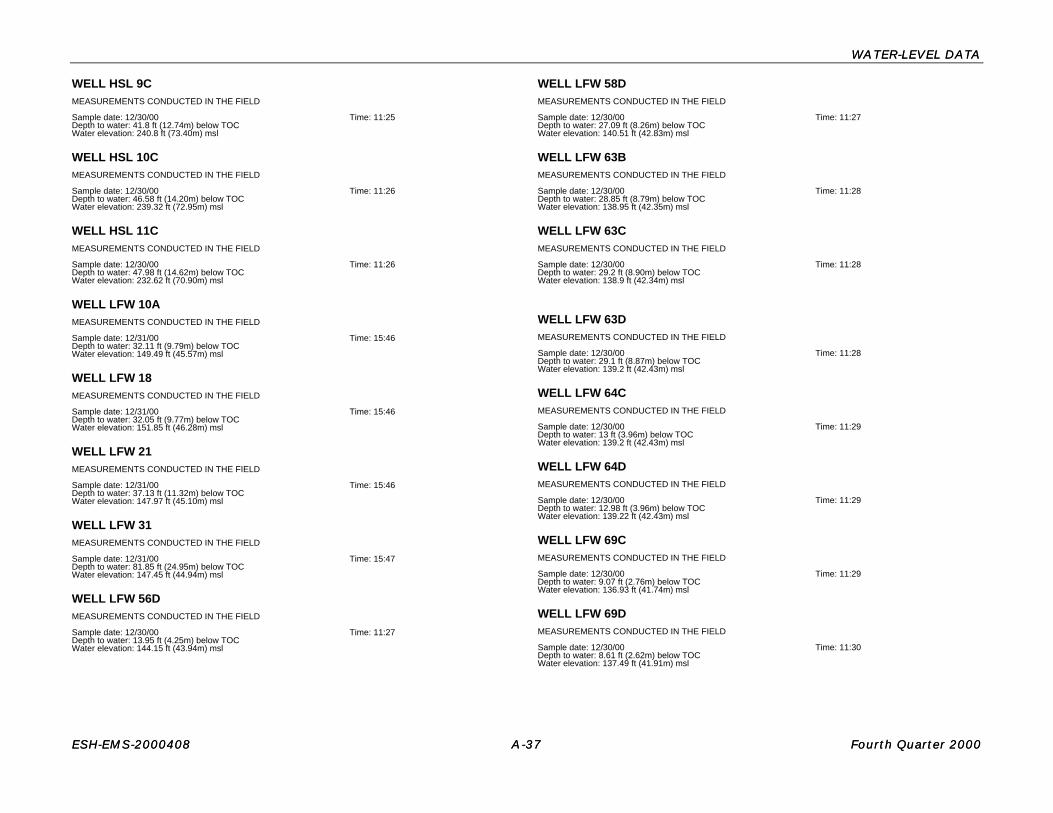
WATER-LEVEL DATAWATER-LEVEL DATA
ESH-EMS-2000408ESH-EMS-2000408 A-A-3737 Fourth Quarter 2000Fourth Quarter 2000
WELL HSL 9CMEASUREMENTS CONDUCTED IN THE FIELD
Sample date: 12/30/00 Time: 11:25Depth to water: 41.8 ft (12.74m) below TOCWater elevation: 240.8 ft (73.40m) msl
WELL HSL 10CMEASUREMENTS CONDUCTED IN THE FIELD
Sample date: 12/30/00 Time: 11:26Depth to water: 46.58 ft (14.20m) below TOCWater elevation: 239.32 ft (72.95m) msl
WELL HSL 11CMEASUREMENTS CONDUCTED IN THE FIELD
Sample date: 12/30/00 Time: 11:26Depth to water: 47.98 ft (14.62m) below TOCWater elevation: 232.62 ft (70.90m) msl
WELL LFW 10AMEASUREMENTS CONDUCTED IN THE FIELD
Sample date: 12/31/00 Time: 15:46Depth to water: 32.11 ft (9.79m) below TOCWater elevation: 149.49 ft (45.57m) msl
WELL LFW 18MEASUREMENTS CONDUCTED IN THE FIELD
Sample date: 12/31/00 Time: 15:46Depth to water: 32.05 ft (9.77m) below TOCWater elevation: 151.85 ft (46.28m) msl
WELL LFW 21MEASUREMENTS CONDUCTED IN THE FIELD
Sample date: 12/31/00 Time: 15:46Depth to water: 37.13 ft (11.32m) below TOCWater elevation: 147.97 ft (45.10m) msl
WELL LFW 31MEASUREMENTS CONDUCTED IN THE FIELD
Sample date: 12/31/00 Time: 15:47Depth to water: 81.85 ft (24.95m) below TOCWater elevation: 147.45 ft (44.94m) msl
WELL LFW 56DMEASUREMENTS CONDUCTED IN THE FIELD
Sample date: 12/30/00 Time: 11:27Depth to water: 13.95 ft (4.25m) below TOCWater elevation: 144.15 ft (43.94m) msl
WELL LFW 58DMEASUREMENTS CONDUCTED IN THE FIELD
Sample date: 12/30/00 Time: 11:27Depth to water: 27.09 ft (8.26m) below TOCWater elevation: 140.51 ft (42.83m) msl
WELL LFW 63BMEASUREMENTS CONDUCTED IN THE FIELD
Sample date: 12/30/00 Time: 11:28Depth to water: 28.85 ft (8.79m) below TOCWater elevation: 138.95 ft (42.35m) msl
WELL LFW 63CMEASUREMENTS CONDUCTED IN THE FIELD
Sample date: 12/30/00 Time: 11:28Depth to water: 29.2 ft (8.90m) below TOCWater elevation: 138.9 ft (42.34m) msl
WELL LFW 63DMEASUREMENTS CONDUCTED IN THE FIELD
Sample date: 12/30/00 Time: 11:28Depth to water: 29.1 ft (8.87m) below TOCWater elevation: 139.2 ft (42.43m) msl
WELL LFW 64CMEASUREMENTS CONDUCTED IN THE FIELD
Sample date: 12/30/00 Time: 11:29Depth to water: 13 ft (3.96m) below TOCWater elevation: 139.2 ft (42.43m) msl
WELL LFW 64DMEASUREMENTS CONDUCTED IN THE FIELD
Sample date: 12/30/00 Time: 11:29Depth to water: 12.98 ft (3.96m) below TOCWater elevation: 139.22 ft (42.43m) msl
WELL LFW 69CMEASUREMENTS CONDUCTED IN THE FIELD
Sample date: 12/30/00 Time: 11:29Depth to water: 9.07 ft (2.76m) below TOCWater elevation: 136.93 ft (41.74m) msl
WELL LFW 69DMEASUREMENTS CONDUCTED IN THE FIELD
Sample date: 12/30/00 Time: 11:30Depth to water: 8.61 ft (2.62m) below TOCWater elevation: 137.49 ft (41.91m) msl

WATER-LEVEL DATAWATER-LEVEL DATA
ESH-EMS-2000408ESH-EMS-2000408 A-A-3838 Fourth Quarter 2000Fourth Quarter 2000
WELL MCB 2MEASUREMENTS CONDUCTED IN THE FIELD
Sample date: 12/30/00 Time: 15:00Depth to water: 108.34 ft (33.02m) below TOCWater elevation: 220.06 ft (67.08m) msl
WELL MCB 5CMEASUREMENTS CONDUCTED IN THE FIELD
Sample date: 12/30/00 Time: 14:50Depth to water: 147.47 ft (44.95m) below TOCWater elevation: 191.63 ft (58.41m) msl
WELL MCB 6CMEASUREMENTS CONDUCTED IN THE FIELD
Sample date: 12/30/00 Time: 14:56Depth to water: 139.81 ft (42.61m) below TOCWater elevation: 192.29 ft (58.61m) msl
WELL MCB 7CMEASUREMENTS CONDUCTED IN THE FIELD
Sample date: 12/30/00 Time: 14:46Depth to water: 146.97 ft (44.80m) below TOCWater elevation: 190.73 ft (58.14m) msl
WELL MCB 9DMEASUREMENTS CONDUCTED IN THE FIELD
Sample date: 12/30/00 Time: 15:13Depth to water: 123.75 ft (37.72m) below TOCWater elevation: 219.15 ft (66.80m) msl
WELL MSB 1BMEASUREMENTS CONDUCTED IN THE FIELD
Sample date: 12/27/00 Time: 8:26Depth to water: 146.84 ft (44.76m) below TOCWater elevation: 207.96 ft (63.39m) msl
WELL MSB 1CMEASUREMENTS CONDUCTED IN THE FIELD
Sample date: 12/27/00 Time: 8:27Depth to water: 141.99 ft (43.28m) below TOCWater elevation: 213.11 ft (64.96m) msl
WELL MSB 1DMEASUREMENTS CONDUCTED IN THE FIELD
Sample date: 12/27/00 Time: 8:27Depth to water: 128.45 ft (39.15m) below TOCWater elevation: 226.35 ft (68.99m) msl
WELL MSB 2BMEASUREMENTS CONDUCTED IN THE FIELD
Sample date: 12/27/00 Time: 8:52Depth to water: 145.74 ft (44.42m) below TOCWater elevation: 208.86 ft (63.66m) msl
WELL MSB 2CMEASUREMENTS CONDUCTED IN THE FIELD
Sample date: 12/27/00 Time: 8:52Depth to water: 140.28 ft (42.76m) below TOCWater elevation: 214.42 ft (65.36m) msl
WELL MSB 2DMEASUREMENTS CONDUCTED IN THE FIELD
Sample date: 12/27/00 Time: 8:54Depth to water: 126.81 ft (38.65m) below TOCWater elevation: 226.99 ft (69.19m) msl
WELL MSB 3BMEASUREMENTS CONDUCTED IN THE FIELD
Sample date: 12/27/00 Time: 12:14Depth to water: Not availableWater elevation: 361 ft (110.03m) msl
WELL MSB 3CMEASUREMENTS CONDUCTED IN THE FIELD
Sample date: 12/27/00 Time: 9:08Depth to water: 144.86 ft (44.15m) below TOCWater elevation: 215.94 ft (65.82m) msl
WELL MSB 4BMEASUREMENTS CONDUCTED IN THE FIELD
Sample date: 12/27/00 Time: 8:02Depth to water: 148.28 ft (45.20m) below TOCWater elevation: 207.02 ft (63.10m) msl
WELL MSB 4CMEASUREMENTS CONDUCTED IN THE FIELD
Sample date: 12/27/00 Time: 8:02Depth to water: 143.59 ft (43.77m) below TOCWater elevation: 211.61 ft (64.50m) msl
WELL MSB 4DMEASUREMENTS CONDUCTED IN THE FIELD
Sample date: 12/27/00 Time: 8:03Depth to water: 129.96 ft (39.61m) below TOCWater elevation: 225.54 ft (68.75m) msl

WATER-LEVEL DATAWATER-LEVEL DATA
ESH-EMS-2000408ESH-EMS-2000408 A-A-3939 Fourth Quarter 2000Fourth Quarter 2000
WELL MSB 5AMEASUREMENTS CONDUCTED IN THE FIELD
Sample date: 12/27/00 Time: 6:59Depth to water: 120.81 ft (36.82m) below TOCWater elevation: 223.79 ft (68.21m) msl
WELL MSB 5BMEASUREMENTS CONDUCTED IN THE FIELD
Sample date: 12/27/00 Time: 7:00Depth to water: 138.59 ft (42.24m) below TOCWater elevation: 206.41 ft (62.91m) msl
WELL MSB 5CMEASUREMENTS CONDUCTED IN THE FIELD
Sample date: 12/27/00 Time: 7:00Depth to water: 125.81 ft (38.35m) below TOCWater elevation: 219.39 ft (66.87m) msl
WELL MSB 6AMEASUREMENTS CONDUCTED IN THE FIELD
Sample date: 12/27/00 Time: 6:07Depth to water: 120.89 ft (36.85m) below TOCWater elevation: 222.91 ft (67.94m) msl
WELL MSB 6BMEASUREMENTS CONDUCTED IN THE FIELD
Sample date: 12/27/00 Time: 6:07Depth to water: 140.13 ft (42.71m) below TOCWater elevation: 203.77 ft (62.11m) msl
WELL MSB 6CMEASUREMENTS CONDUCTED IN THE FIELD
Sample date: 12/27/00 Time: 6:08Depth to water: 124.18 ft (37.85m) below TOCWater elevation: 219.62 ft (66.94m) msl
WELL MSB 7AMEASUREMENTS CONDUCTED IN THE FIELD
Sample date: 12/27/00 Time: 6:22Depth to water: 119.83 ft (36.52m) below TOCWater elevation: 224.47 ft (68.42m) msl
WELL MSB 7BMEASUREMENTS CONDUCTED IN THE FIELD
Sample date: 12/27/00 Time: 6:22Depth to water: 139.99 ft (42.67m) below TOCWater elevation: 204.11 ft (62.21m) msl
WELL MSB 7CMEASUREMENTS CONDUCTED IN THE FIELD
Sample date: 12/27/00 Time: 6:23Depth to water: 125.77 ft (38.34m) below TOCWater elevation: 218.73 ft (66.67m) msl
WELL MSB 8AMEASUREMENTS CONDUCTED IN THE FIELD
Sample date: 12/28/00 Time: 11:02Depth to water: Not availableWater elevation: 344.2 ft (104.91m) msl
WELL MSB 8BMEASUREMENTS CONDUCTED IN THE FIELD
Sample date: 12/28/00 Time: 11:03Depth to water: 137.62 ft (41.95m) below TOCWater elevation: 206.28 ft (62.87m) msl
WELL MSB 8CMEASUREMENTS CONDUCTED IN THE FIELD
Sample date: 12/28/00 Time: 11:03Depth to water: Not availableWater elevation: 344 ft (104.85m) msl
WELL MSB 9AMEASUREMENTS CONDUCTED IN THE FIELD
Sample date: 12/27/00 Time: 9:45Depth to water: 150.81 ft (45.97m) below TOCWater elevation: 208.29 ft (63.49m) msl
WELL MSB 9CMEASUREMENTS CONDUCTED IN THE FIELD
Sample date: 12/27/00 Time: 9:45Depth to water: 133.44 ft (40.67m) below TOCWater elevation: 226.16 ft (68.93m) msl
WELL MSB 10AMEASUREMENTS CONDUCTED IN THE FIELD
Sample date: 12/27/00 Time: 10:24Depth to water: 148.86 ft (45.37m) below TOCWater elevation: 208.34 ft (63.50m) msl
WELL MSB 10BMEASUREMENTS CONDUCTED IN THE FIELD
Sample date: 12/27/00 Time: 10:25Depth to water: 146.87 ft (44.77m) below TOCWater elevation: 210.73 ft (64.23m) msl

WATER-LEVEL DATAWATER-LEVEL DATA
ESH-EMS-2000408ESH-EMS-2000408 A-A-4040 Fourth Quarter 2000Fourth Quarter 2000
WELL MSB 10CMEASUREMENTS CONDUCTED IN THE FIELD
Sample date: 12/27/00 Time: 10:25Depth to water: 131.88 ft (40.20m) below TOCWater elevation: 225.22 ft (68.65m) msl
WELL MSB 11AMEASUREMENTS CONDUCTED IN THE FIELD
Sample date: 12/27/00 Time: 9:22Depth to water: 156.31 ft (47.64m) below TOCWater elevation: 209.09 ft (63.73m) msl
WELL MSB 11CMEASUREMENTS CONDUCTED IN THE FIELD
Sample date: 12/27/00 Time: 9:22Depth to water: 148.03 ft (45.12m) below TOCWater elevation: 217.47 ft (66.29m) msl
WELL MSB 11FMEASUREMENTS CONDUCTED IN THE FIELD
Sample date: 12/27/00 Time: 9:23Depth to water: 139.52 ft (42.53m) below TOCWater elevation: 226.08 ft (68.91m) msl
WELL MSB 12AMEASUREMENTS CONDUCTED IN THE FIELD
Sample date: 12/27/00 Time: 10:06Depth to water: 141.48 ft (43.12m) below TOCWater elevation: 208.22 ft (63.47m) msl
WELL MSB 12BMEASUREMENTS CONDUCTED IN THE FIELD
Sample date: 12/27/00 Time: 7:15Depth to water: 139.29 ft (42.46m) below TOCWater elevation: 211.01 ft (64.32m) msl
WELL MSB 12TAMEASUREMENTS CONDUCTED IN THE FIELD
Sample date: 12/27/00 Time: 7:15Depth to water: 159.29 ft (48.55m) below TOCWater elevation: 190.71 ft (58.13m) msl
WELL MSB 13AMEASUREMENTS CONDUCTED IN THE FIELD
Sample date: 12/27/00 Time: 7:32Depth to water: 140.03 ft (42.68m) below TOCWater elevation: 206.67 ft (62.99m) msl
WELL MSB 13CCMEASUREMENTS CONDUCTED IN THE FIELD
Sample date: 12/27/00 Time: 7:31Depth to water: 125.9 ft (38.37m) below TOCWater elevation: 221 ft (67.36m) msl
WELL MSB 13DMEASUREMENTS CONDUCTED IN THE FIELD
Sample date: 12/27/00 Time: 7:32Depth to water: 123.22 ft (37.56m) below TOCWater elevation: 224.38 ft (68.39m) msl
WELL MSB 15AMEASUREMENTS CONDUCTED IN THE FIELD
Sample date: 12/27/00 Time: 9:56Depth to water: 151.46 ft (46.17m) below TOCWater elevation: 216.24 ft (65.91m) msl
WELL MSB 15AAMEASUREMENTS CONDUCTED IN THE FIELD
Sample date: 12/27/00 Time: 9:56Depth to water: 159.36 ft (48.57m) below TOCWater elevation: 209.84 ft (63.96m) msl
WELL MSB 15DMEASUREMENTS CONDUCTED IN THE FIELD
Sample date: 12/27/00 Time: 9:57Depth to water: 141.52 ft (43.14m) below TOCWater elevation: 226.98 ft (69.18m) msl
WELL MSB 16AMEASUREMENTS CONDUCTED IN THE FIELD
Sample date: 12/28/00 Time: 11:41Depth to water: 152.35 ft (46.44m) below TOCWater elevation: 215.15 ft (65.58m) msl
WELL MSB 16CMEASUREMENTS CONDUCTED IN THE FIELD
Sample date: 12/28/00 Time: 11:42Depth to water: 140.82 ft (42.92m) below TOCWater elevation: 226.78 ft (69.12m) msl
WELL MSB 17BMEASUREMENTS CONDUCTED IN THE FIELD
Sample date: 12/27/00 Time: 5:22Depth to water: 137.3 ft (41.85m) below TOCWater elevation: 221.9 ft (67.64m) msl

WATER-LEVEL DATAWATER-LEVEL DATA
ESH-EMS-2000408ESH-EMS-2000408 A-A-4141 Fourth Quarter 2000Fourth Quarter 2000
WELL MSB 17BBMEASUREMENTS CONDUCTED IN THE FIELD
Sample date: 12/27/00 Time: 5:23Depth to water: 149.69 ft (45.63m) below TOCWater elevation: 209.31 ft (63.80m) msl
WELL MSB 18AMEASUREMENTS CONDUCTED IN THE FIELD
Sample date: 12/27/00 Time: 4:54Depth to water: 133.09 ft (40.57m) below TOCWater elevation: 208.81 ft (63.65m) msl
WELL MSB 18BMEASUREMENTS CONDUCTED IN THE FIELD
Sample date: 12/27/00 Time: 4:55Depth to water: 124.11 ft (37.83m) below TOCWater elevation: 217.99 ft (66.44m) msl
WELL MSB 19BMEASUREMENTS CONDUCTED IN THE FIELD
Sample date: 12/29/00 Time: 16:51Depth to water: 86.91 ft (26.49m) below TOCWater elevation: 213.49 ft (65.07m) msl
WELL MSB 19CMEASUREMENTS CONDUCTED IN THE FIELD
Sample date: 12/29/00 Time: 16:53Depth to water: 69.28 ft (21.12m) below TOCWater elevation: 231.52 ft (70.57m) msl
WELL MSB 20AMEASUREMENTS CONDUCTED IN THE FIELD
Sample date: 12/30/00 Time: 16:22Depth to water: 140.39 ft (42.79m) below TOCWater elevation: 214.91 ft (65.51m) msl
WELL MSB 20CMEASUREMENTS CONDUCTED IN THE FIELD
Sample date: 12/27/00 Time: 12:14Depth to water: Not availableWater elevation: 354.7 ft (108.11m) msl
WELL MSB 21BMEASUREMENTS CONDUCTED IN THE FIELD
Sample date: 12/27/00 Time: 10:41Depth to water: 138.78 ft (42.30m) below TOCWater elevation: 216.22 ft (65.90m) msl
WELL MSB 21CMEASUREMENTS CONDUCTED IN THE FIELD
Sample date: 12/27/00 Time: 10:41Depth to water: 129.12 ft (39.36m) below TOCWater elevation: 225.68 ft (68.79m) msl
WELL MSB 21TAMEASUREMENTS CONDUCTED IN THE FIELD
Sample date: 12/27/00 Time: 10:42Depth to water: 163.54 ft (49.85m) below TOCWater elevation: 191.06 ft (58.24m) msl
WELL MSB 24MEASUREMENTS CONDUCTED IN THE FIELD
Sample date: 12/29/00 Time: 13:29Depth to water: 147.08 ft (44.83m) below TOCWater elevation: 233.12 ft (71.06m) msl
WELL MSB 24AMEASUREMENTS CONDUCTED IN THE FIELD
Sample date: 12/29/00 Time: 13:26Depth to water: 161.27 ft (49.16m) below TOCWater elevation: 220.33 ft (67.16m) msl
WELL MSB 25MEASUREMENTS CONDUCTED IN THE FIELD
Sample date: 12/30/00 Time: 11:37Depth to water: 129.8 ft (39.56m) below TOCWater elevation: 237.1 ft (72.27m) msl
WELL MSB 25AMEASUREMENTS CONDUCTED IN THE FIELD
Sample date: 12/30/00 Time: 11:37Depth to water: 155 ft (47.24m) below TOCWater elevation: 211.4 ft (64.44m) msl
WELL MSB 26MEASUREMENTS CONDUCTED IN THE FIELD
Sample date: 12/27/00 Time: 11:48Depth to water: 134.22 ft (40.91m) below TOCWater elevation: 227.48 ft (69.34m) msl
WELL MSB 26BMEASUREMENTS CONDUCTED IN THE FIELD
Sample date: 12/27/00 Time: 11:49Depth to water: 148.71 ft (45.33m) below TOCWater elevation: 214.09 ft (65.26m) msl

WATER-LEVEL DATAWATER-LEVEL DATA
ESH-EMS-2000408ESH-EMS-2000408 A-A-4242 Fourth Quarter 2000Fourth Quarter 2000
WELL MSB 27MEASUREMENTS CONDUCTED IN THE FIELD
Sample date: 12/29/00 Time: 13:38Depth to water: Not availableWater elevation: 375.5 ft (114.45m) msl
WELL MSB 27BMEASUREMENTS CONDUCTED IN THE FIELD
Sample date: 12/29/00 Time: 13:43Depth to water: 155.85 ft (47.50m) below TOCWater elevation: 220.95 ft (67.35m) msl
WELL MSB 27TAMEASUREMENTS CONDUCTED IN THE FIELD
Sample date: 12/29/00 Time: 13:41Depth to water: 179.11 ft (54.59m) below TOCWater elevation: 197.49 ft (60.20m) msl
WELL MSB 28MEASUREMENTS CONDUCTED IN THE FIELD
Sample date: 12/27/00 Time: 11:39Depth to water: 128.19 ft (39.07m) below TOCWater elevation: 226.61 ft (69.07m) msl
WELL MSB 28AMEASUREMENTS CONDUCTED IN THE FIELD
Sample date: 12/27/00 Time: 11:39Depth to water: 155.55 ft (47.41m) below TOCWater elevation: 199.45 ft (60.79m) msl
WELL MSB 29AMEASUREMENTS CONDUCTED IN THE FIELD
Sample date: 12/31/00 Time: 15:47Depth to water: 147.58 ft (44.98m) below TOCWater elevation: 217.62 ft (66.33m) msl
WELL MSB 29BMEASUREMENTS CONDUCTED IN THE FIELD
Sample date: 12/31/00 Time: 15:48Depth to water: 142.03 ft (43.29m) below TOCWater elevation: 222.97 ft (67.96m) msl
WELL MSB 29CMEASUREMENTS CONDUCTED IN THE FIELD
Sample date: 12/31/00 Time: 15:48Depth to water: 134.98 ft (41.14m) below TOCWater elevation: 230.02 ft (70.11m) msl
WELL MSB 29DMEASUREMENTS CONDUCTED IN THE FIELD
Sample date: 12/31/00 Time: 15:48Depth to water: 132.68 ft (40.44m) below TOCWater elevation: 232.22 ft (70.78m) msl
WELL MSB 29TAMEASUREMENTS CONDUCTED IN THE FIELD
Sample date: 12/31/00 Time: 15:49Depth to water: 155.94 ft (47.53m) below TOCWater elevation: 209.06 ft (63.72m) msl
WELL MSB 30AMEASUREMENTS CONDUCTED IN THE FIELD
Sample date: 12/27/00 Time: 11:57Depth to water: 159.62 ft (48.65m) below TOCWater elevation: 195.38 ft (59.55m) msl
WELL MSB 30AAMEASUREMENTS CONDUCTED IN THE FIELD
Sample date: 12/27/00 Time: 11:28Depth to water: 133.2 ft (40.60m) below TOCWater elevation: 219.8 ft (67.00m) msl
WELL MSB 30CCMEASUREMENTS CONDUCTED IN THE FIELD
Sample date: 12/27/00 Time: 11:28Depth to water: 132.66 ft (40.44m) below TOCWater elevation: 221.34 ft (67.47m) msl
WELL MSB 31AMEASUREMENTS CONDUCTED IN THE FIELD
Sample date: 12/28/00 Time: 16:23Depth to water: 152.9 ft (46.60m) below TOCWater elevation: 195.2 ft (59.50m) msl
WELL MSB 31BMEASUREMENTS CONDUCTED IN THE FIELD
Sample date: 12/28/00 Time: 16:24Depth to water: 136.49 ft (41.60m) below TOCWater elevation: 211.81 ft (64.56m) msl
WELL MSB 31CMEASUREMENTS CONDUCTED IN THE FIELD
Sample date: 12/28/00 Time: 16:24Depth to water: 118.51 ft (36.12m) below TOCWater elevation: 229.59 ft (69.98m) msl

WATER-LEVEL DATAWATER-LEVEL DATA
ESH-EMS-2000408ESH-EMS-2000408 A-A-4343 Fourth Quarter 2000Fourth Quarter 2000
WELL MSB 31CCMEASUREMENTS CONDUCTED IN THE FIELD
Sample date: 12/28/00 Time: 16:25Depth to water: 136.6 ft (41.64m) below TOCWater elevation: 212 ft (64.62m) msl
WELL MSB 32MEASUREMENTS CONDUCTED IN THE FIELD
Sample date: 12/29/00 Time: 17:01Depth to water: 33.42 ft (10.19m) below TOCWater elevation: 221.68 ft (67.57m) msl
WELL MSB 32BMEASUREMENTS CONDUCTED IN THE FIELD
Sample date: 12/29/00 Time: 17:01Depth to water: 46.6 ft (14.20m) below TOCWater elevation: 208.8 ft (63.64m) msl
WELL MSB 32CMEASUREMENTS CONDUCTED IN THE FIELD
Sample date: 12/29/00 Time: 16:56Depth to water: 41.76 ft (12.73m) below TOCWater elevation: 213.94 ft (65.21m) msl
WELL MSB 33MEASUREMENTS CONDUCTED IN THE FIELD
Sample date: 12/28/00 Time: 16:06Depth to water: Not availableWater elevation: 255.9 ft (78.00m) msl
WELL MSB 33AMEASUREMENTS CONDUCTED IN THE FIELD
Sample date: 12/28/00 Time: 16:00Depth to water: 52.3 ft (15.94m) below TOCWater elevation: 203.1 ft (61.91m) msl
WELL MSB 33BMEASUREMENTS CONDUCTED IN THE FIELD
Sample date: 12/28/00 Time: 16:02Depth to water: 49.24 ft (15.01m) below TOCWater elevation: 205.76 ft (62.72m) msl
WELL MSB 33CMEASUREMENTS CONDUCTED IN THE FIELD
Sample date: 12/28/00 Time: 16:03Depth to water: 46.15 ft (14.07m) below TOCWater elevation: 209.15 ft (63.75m) msl
WELL MSB 33TAMEASUREMENTS CONDUCTED IN THE FIELD
Sample date: 12/28/00 Time: 16:04Depth to water: Not availableWater elevation: 255.5 ft (77.88m) msl
WELL MSB 34AMEASUREMENTS CONDUCTED IN THE FIELD
Sample date: 12/28/00 Time: 11:45Depth to water: 169.8 ft (51.76m) below TOCWater elevation: 214.2 ft (65.29m) msl
WELL MSB 34BMEASUREMENTS CONDUCTED IN THE FIELD
Sample date: 12/28/00 Time: 11:43Depth to water: 160.7 ft (48.98m) below TOCWater elevation: 223.3 ft (68.06m) msl
WELL MSB 34CMEASUREMENTS CONDUCTED IN THE FIELD
Sample date: 12/28/00 Time: 11:40Depth to water: 159.4 ft (48.59m) below TOCWater elevation: 224.5 ft (68.43m) msl
WELL MSB 34TAMEASUREMENTS CONDUCTED IN THE FIELD
Sample date: 12/28/00 Time: 11:37Depth to water: 184.7 ft (56.30m) below TOCWater elevation: 198.7 ft (60.56m) msl
WELL MSB 35AMEASUREMENTS CONDUCTED IN THE FIELD
Sample date: 12/28/00 Time: 16:42Depth to water: 137.21 ft (41.82m) below TOCWater elevation: 213.69 ft (65.13m) msl
WELL MSB 35BMEASUREMENTS CONDUCTED IN THE FIELD
Sample date: 12/28/00 Time: 16:43Depth to water: 135.33 ft (41.25m) below TOCWater elevation: 216.27 ft (65.92m) msl
WELL MSB 35DMEASUREMENTS CONDUCTED IN THE FIELD
Sample date: 12/31/00 Time: 15:49Depth to water: Not availableWater elevation: 351.9 ft (107.26m) msl
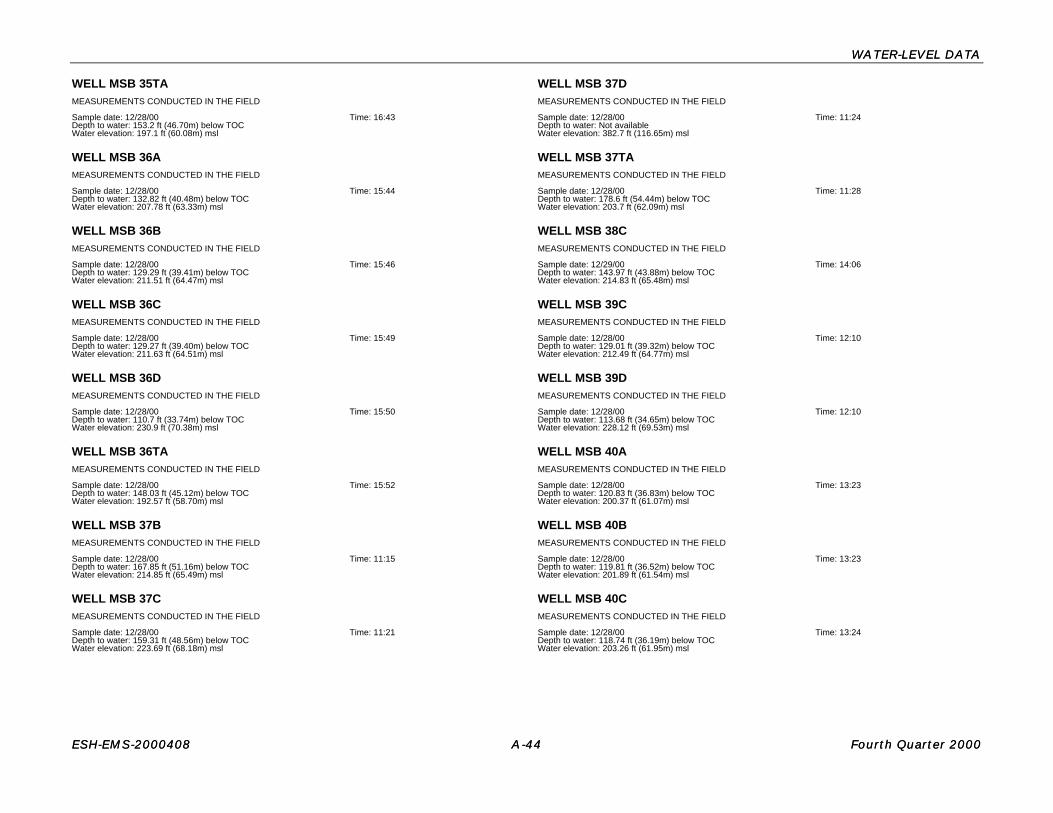
WATER-LEVEL DATAWATER-LEVEL DATA
ESH-EMS-2000408ESH-EMS-2000408 A-A-4444 Fourth Quarter 2000Fourth Quarter 2000
WELL MSB 35TAMEASUREMENTS CONDUCTED IN THE FIELD
Sample date: 12/28/00 Time: 16:43Depth to water: 153.2 ft (46.70m) below TOCWater elevation: 197.1 ft (60.08m) msl
WELL MSB 36AMEASUREMENTS CONDUCTED IN THE FIELD
Sample date: 12/28/00 Time: 15:44Depth to water: 132.82 ft (40.48m) below TOCWater elevation: 207.78 ft (63.33m) msl
WELL MSB 36BMEASUREMENTS CONDUCTED IN THE FIELD
Sample date: 12/28/00 Time: 15:46Depth to water: 129.29 ft (39.41m) below TOCWater elevation: 211.51 ft (64.47m) msl
WELL MSB 36CMEASUREMENTS CONDUCTED IN THE FIELD
Sample date: 12/28/00 Time: 15:49Depth to water: 129.27 ft (39.40m) below TOCWater elevation: 211.63 ft (64.51m) msl
WELL MSB 36DMEASUREMENTS CONDUCTED IN THE FIELD
Sample date: 12/28/00 Time: 15:50Depth to water: 110.7 ft (33.74m) below TOCWater elevation: 230.9 ft (70.38m) msl
WELL MSB 36TAMEASUREMENTS CONDUCTED IN THE FIELD
Sample date: 12/28/00 Time: 15:52Depth to water: 148.03 ft (45.12m) below TOCWater elevation: 192.57 ft (58.70m) msl
WELL MSB 37BMEASUREMENTS CONDUCTED IN THE FIELD
Sample date: 12/28/00 Time: 11:15Depth to water: 167.85 ft (51.16m) below TOCWater elevation: 214.85 ft (65.49m) msl
WELL MSB 37CMEASUREMENTS CONDUCTED IN THE FIELD
Sample date: 12/28/00 Time: 11:21Depth to water: 159.31 ft (48.56m) below TOCWater elevation: 223.69 ft (68.18m) msl
WELL MSB 37DMEASUREMENTS CONDUCTED IN THE FIELD
Sample date: 12/28/00 Time: 11:24Depth to water: Not availableWater elevation: 382.7 ft (116.65m) msl
WELL MSB 37TAMEASUREMENTS CONDUCTED IN THE FIELD
Sample date: 12/28/00 Time: 11:28Depth to water: 178.6 ft (54.44m) below TOCWater elevation: 203.7 ft (62.09m) msl
WELL MSB 38CMEASUREMENTS CONDUCTED IN THE FIELD
Sample date: 12/29/00 Time: 14:06Depth to water: 143.97 ft (43.88m) below TOCWater elevation: 214.83 ft (65.48m) msl
WELL MSB 39CMEASUREMENTS CONDUCTED IN THE FIELD
Sample date: 12/28/00 Time: 12:10Depth to water: 129.01 ft (39.32m) below TOCWater elevation: 212.49 ft (64.77m) msl
WELL MSB 39DMEASUREMENTS CONDUCTED IN THE FIELD
Sample date: 12/28/00 Time: 12:10Depth to water: 113.68 ft (34.65m) below TOCWater elevation: 228.12 ft (69.53m) msl
WELL MSB 40AMEASUREMENTS CONDUCTED IN THE FIELD
Sample date: 12/28/00 Time: 13:23Depth to water: 120.83 ft (36.83m) below TOCWater elevation: 200.37 ft (61.07m) msl
WELL MSB 40BMEASUREMENTS CONDUCTED IN THE FIELD
Sample date: 12/28/00 Time: 13:23Depth to water: 119.81 ft (36.52m) below TOCWater elevation: 201.89 ft (61.54m) msl
WELL MSB 40CMEASUREMENTS CONDUCTED IN THE FIELD
Sample date: 12/28/00 Time: 13:24Depth to water: 118.74 ft (36.19m) below TOCWater elevation: 203.26 ft (61.95m) msl

WATER-LEVEL DATAWATER-LEVEL DATA
ESH-EMS-2000408ESH-EMS-2000408 A-A-4545 Fourth Quarter 2000Fourth Quarter 2000
WELL MSB 40DMEASUREMENTS CONDUCTED IN THE FIELD
Sample date: 12/28/00 Time: 13:24Depth to water: 99.32 ft (30.27m) below TOCWater elevation: 223.58 ft (68.15m) msl
WELL MSB 40TAMEASUREMENTS CONDUCTED IN THE FIELD
Sample date: 12/28/00 Time: 13:22Depth to water: 133.4 ft (40.66m) below TOCWater elevation: 187.5 ft (57.15m) msl
WELL MSB 41BMEASUREMENTS CONDUCTED IN THE FIELD
Sample date: 12/30/00 Time: 12:21Depth to water: 109.84 ft (33.48m) below TOCWater elevation: 214.16 ft (65.28m) msl
WELL MSB 41CMEASUREMENTS CONDUCTED IN THE FIELD
Sample date: 12/30/00 Time: 12:19Depth to water: 110.05 ft (33.54m) below TOCWater elevation: 214.55 ft (65.40m) msl
WELL MSB 41DMEASUREMENTS CONDUCTED IN THE FIELD
Sample date: 12/30/00 Time: 12:17Depth to water: 84.11 ft (25.64m) below TOCWater elevation: 240.89 ft (73.42m) msl
WELL MSB 41TAMEASUREMENTS CONDUCTED IN THE FIELD
Sample date: 12/30/00 Time: 12:23Depth to water: 119.8 ft (36.52m) below TOCWater elevation: 203.9 ft (62.15m) msl
WELL MSB 42AMEASUREMENTS CONDUCTED IN THE FIELD
Sample date: 12/31/00 Time: 10:03Depth to water: 162.37 ft (49.49m) below TOCWater elevation: 214.13 ft (65.27m) msl
WELL MSB 42BMEASUREMENTS CONDUCTED IN THE FIELD
Sample date: 12/31/00 Time: 10:05Depth to water: 155.46 ft (47.38m) below TOCWater elevation: 220.94 ft (67.34m) msl
WELL MSB 42CMEASUREMENTS CONDUCTED IN THE FIELD
Sample date: 12/31/00 Time: 10:07Depth to water: Not availableWater elevation: Not available
WELL MSB 42CMEASUREMENTS CONDUCTED IN THE FIELD
Sample date: 12/31/00 Time: 10:07Depth to water: Not availableWater elevation: 376.4 ft (114.73m) msl
WELL MSB 42DMEASUREMENTS CONDUCTED IN THE FIELD
Sample date: 12/31/00 Time: 10:09Depth to water: 148.85 ft (45.37m) below TOCWater elevation: 227.55 ft (69.36m) msl
WELL MSB 42TAMEASUREMENTS CONDUCTED IN THE FIELD
Sample date: 12/31/00 Time: 10:00Depth to water: 176.06 ft (53.66m) below TOCWater elevation: 200.54 ft (61.13m) msl
WELL MSB 43AMEASUREMENTS CONDUCTED IN THE FIELD
Sample date: 12/31/00 Time: 15:50Depth to water: 128.95 ft (39.30m) below TOCWater elevation: 228.75 ft (69.72m) msl
WELL MSB 43BMEASUREMENTS CONDUCTED IN THE FIELD
Sample date: 12/31/00 Time: 15:50Depth to water: 128.98 ft (39.31m) below TOCWater elevation: 228.82 ft (69.75m) msl
WELL MSB 43DMEASUREMENTS CONDUCTED IN THE FIELD
Sample date: 12/31/00 Time: 15:50Depth to water: 126.73 ft (38.63m) below TOCWater elevation: 231.27 ft (70.49m) msl
WELL MSB 43TAMEASUREMENTS CONDUCTED IN THE FIELD
Sample date: 12/31/00 Time: 15:51Depth to water: 157.95 ft (48.14m) below TOCWater elevation: 199.55 ft (60.82m) msl

WATER-LEVEL DATAWATER-LEVEL DATA
ESH-EMS-2000408ESH-EMS-2000408 A-A-4646 Fourth Quarter 2000Fourth Quarter 2000
WELL MSB 44AMEASUREMENTS CONDUCTED IN THE FIELD
Sample date: 12/29/00 Time: 14:20Depth to water: 163.05 ft (49.70m) below TOCWater elevation: 213.85 ft (65.18m) msl
WELL MSB 45AMEASUREMENTS CONDUCTED IN THE FIELD
Sample date: 12/28/00 Time: 11:50Depth to water: 169.3 ft (51.60m) below TOCWater elevation: 211.5 ft (64.47m) msl
WELL MSB 45BMEASUREMENTS CONDUCTED IN THE FIELD
Sample date: 12/28/00 Time: 11:55Depth to water: 160.2 ft (48.83m) below TOCWater elevation: 220.7 ft (67.27m) msl
WELL MSB 45CMEASUREMENTS CONDUCTED IN THE FIELD
Sample date: 12/28/00 Time: 11:53Depth to water: Not availableWater elevation: 380.8 ft (116.07m) msl
WELL MSB 46AMEASUREMENTS CONDUCTED IN THE FIELD
Sample date: 12/29/00 Time: 9:59Depth to water: 161.33 ft (49.17m) below TOCWater elevation: 211.27 ft (64.40m) msl
WELL MSB 46BMEASUREMENTS CONDUCTED IN THE FIELD
Sample date: 12/29/00 Time: 9:55Depth to water: 147.86 ft (45.07m) below TOCWater elevation: 225.74 ft (68.81m) msl
WELL MSB 46CMEASUREMENTS CONDUCTED IN THE FIELD
Sample date: 12/29/00 Time: 10:00Depth to water: 9.9 ft (3.02m) below TOCWater elevation: 362.7 ft (110.55m) msl
WELL MSB 46CMEASUREMENTS CONDUCTED IN THE FIELD
Sample date: 12/30/00 Time: 11:31Depth to water: Not availableWater elevation: Not available
WELL MSB 47BMEASUREMENTS CONDUCTED IN THE FIELD
Sample date: 12/29/00 Time: 11:30Depth to water: 148.01 ft (45.11m) below TOCWater elevation: 220.69 ft (67.27m) msl
WELL MSB 47CMEASUREMENTS CONDUCTED IN THE FIELD
Sample date: 12/29/00 Time: 11:32Depth to water: 140.72 ft (42.89m) below TOCWater elevation: 228.28 ft (69.58m) msl
WELL MSB 47DMEASUREMENTS CONDUCTED IN THE FIELD
Sample date: 12/29/00 Time: 11:34Depth to water: 139.59 ft (42.55m) below TOCWater elevation: 229.21 ft (69.86m) msl
WELL MSB 47TAMEASUREMENTS CONDUCTED IN THE FIELD
Sample date: 12/29/00 Time: 11:28Depth to water: 156.15 ft (47.60m) below TOCWater elevation: 212.55 ft (64.79m) msl
WELL MSB 48AMEASUREMENTS CONDUCTED IN THE FIELD
Sample date: 12/29/00 Time: 11:56Depth to water: Not availableWater elevation: 361.6 ft (110.22m) msl
WELL MSB 48AMEASUREMENTS CONDUCTED IN THE FIELD
Sample date: 12/31/00 Time: 15:51Depth to water: 142.26 ft (43.36m) below TOCWater elevation: 219.34 ft (66.86m) msl
WELL MSB 48BMEASUREMENTS CONDUCTED IN THE FIELD
Sample date: 12/29/00 Time: 11:54Depth to water: 141.58 ft (43.15m) below TOCWater elevation: 219.82 ft (67.00m) msl
WELL MSB 48CMEASUREMENTS CONDUCTED IN THE FIELD
Sample date: 12/29/00 Time: 12:03Depth to water: 141.78 ft (43.22m) below TOCWater elevation: 220.52 ft (67.22m) msl

WATER-LEVEL DATAWATER-LEVEL DATA
ESH-EMS-2000408ESH-EMS-2000408 A-A-4747 Fourth Quarter 2000Fourth Quarter 2000
WELL MSB 48DMEASUREMENTS CONDUCTED IN THE FIELD
Sample date: 12/29/00 Time: 12:06Depth to water: 133.86 ft (40.80m) below TOCWater elevation: 228.74 ft (69.72m) msl
WELL MSB 48TAMEASUREMENTS CONDUCTED IN THE FIELD
Sample date: 12/29/00 Time: 12:00Depth to water: 143.43 ft (43.72m) below TOCWater elevation: 218.47 ft (66.59m) msl
WELL MSB 49AMEASUREMENTS CONDUCTED IN THE FIELD
Sample date: 12/30/00 Time: 16:05Depth to water: 140.37 ft (42.79m) below TOCWater elevation: 194.33 ft (59.23m) msl
WELL MSB 49BMEASUREMENTS CONDUCTED IN THE FIELD
Sample date: 12/30/00 Time: 16:06Depth to water: 134.09 ft (40.87m) below TOCWater elevation: 200.01 ft (60.96m) msl
WELL MSB 49DMEASUREMENTS CONDUCTED IN THE FIELD
Sample date: 12/30/00 Time: 16:07Depth to water: 109.58 ft (33.40m) below TOCWater elevation: 224.72 ft (68.50m) msl
WELL MSB 50BMEASUREMENTS CONDUCTED IN THE FIELD
Sample date: 12/29/00 Time: 16:20Depth to water: 22.76 ft (6.94m) below TOCWater elevation: 200.94 ft (61.25m) msl
WELL MSB 51BMEASUREMENTS CONDUCTED IN THE FIELD
Sample date: 12/30/00 Time: 10:29Depth to water: 60.01 ft (18.29m) below TOCWater elevation: 203.19 ft (61.93m) msl
WELL MSB 51DMEASUREMENTS CONDUCTED IN THE FIELD
Sample date: 12/30/00 Time: 10:31Depth to water: 54.23 ft (16.53m) below TOCWater elevation: 207.97 ft (63.39m) msl
WELL MSB 52BMEASUREMENTS CONDUCTED IN THE FIELD
Sample date: 12/30/00 Time: 11:58Depth to water: 102.23 ft (31.16m) below TOCWater elevation: 219.47 ft (66.90m) msl
WELL MSB 52DMEASUREMENTS CONDUCTED IN THE FIELD
Sample date: 12/30/00 Time: 12:00Depth to water: 88.02 ft (26.83m) below TOCWater elevation: 233.58 ft (71.20m) msl
WELL MSB 53BMEASUREMENTS CONDUCTED IN THE FIELD
Sample date: 12/30/00 Time: 13:20Depth to water: 126.32 ft (38.50m) below TOCWater elevation: 217.98 ft (66.44m) msl
WELL MSB 53CMEASUREMENTS CONDUCTED IN THE FIELD
Sample date: 12/30/00 Time: 13:28Depth to water: 126.34 ft (38.51m) below TOCWater elevation: 218.86 ft (66.71m) msl
WELL MSB 53DMEASUREMENTS CONDUCTED IN THE FIELD
Sample date: 12/30/00 Time: 13:26Depth to water: 115.39 ft (35.17m) below TOCWater elevation: 229.41 ft (69.93m) msl
WELL MSB 54BMEASUREMENTS CONDUCTED IN THE FIELD
Sample date: 12/28/00 Time: 17:37Depth to water: 154.6 ft (47.12m) below TOCWater elevation: 218.8 ft (66.69m) msl
WELL MSB 54CMEASUREMENTS CONDUCTED IN THE FIELD
Sample date: 12/28/00 Time: 17:38Depth to water: 150.49 ft (45.87m) below TOCWater elevation: 222.91 ft (67.94m) msl
WELL MSB 54DMEASUREMENTS CONDUCTED IN THE FIELD
Sample date: 12/28/00 Time: 17:38Depth to water: 144.61 ft (44.08m) below TOCWater elevation: 228.99 ft (69.80m) msl

WATER-LEVEL DATAWATER-LEVEL DATA
ESH-EMS-2000408ESH-EMS-2000408 A-A-4848 Fourth Quarter 2000Fourth Quarter 2000
WELL MSB 54TAMEASUREMENTS CONDUCTED IN THE FIELD
Sample date: 12/28/00 Time: 17:39Depth to water: 157 ft (47.85m) below TOCWater elevation: 216.5 ft (65.99m) msl
WELL MSB 55BMEASUREMENTS CONDUCTED IN THE FIELD
Sample date: 12/31/00 Time: 9:10Depth to water: 150.78 ft (45.96m) below TOCWater elevation: 217.92 ft (66.42m) msl
WELL MSB 55CMEASUREMENTS CONDUCTED IN THE FIELD
Sample date: 12/31/00 Time: 9:17Depth to water: 143.98 ft (43.89m) below TOCWater elevation: 225.42 ft (68.71m) msl
WELL MSB 55DMEASUREMENTS CONDUCTED IN THE FIELD
Sample date: 12/31/00 Time: 9:05Depth to water: 135.05 ft (41.16m) below TOCWater elevation: 232.65 ft (70.91m) msl
WELL MSB 55HCMEASUREMENTS CONDUCTED IN THE FIELD
Sample date: 12/31/00 Time: 9:13Depth to water: 139.6 ft (42.55m) below TOCWater elevation: 229.1 ft (69.83m) msl
WELL MSB 55TAMEASUREMENTS CONDUCTED IN THE FIELD
Sample date: 12/31/00 Time: 9:15Depth to water: 158.28 ft (48.24m) below TOCWater elevation: 210.42 ft (64.14m) msl
WELL MSB 56DMEASUREMENTS CONDUCTED IN THE FIELD
Sample date: 12/31/00 Time: 8:50Depth to water: 62.01 ft (18.90m) below TOCWater elevation: 217.49 ft (66.29m) msl
WELL MSB 59DMEASUREMENTS CONDUCTED IN THE FIELD
Sample date: 12/27/00 Time: 9:35Depth to water: 133.38 ft (40.65m) below TOCWater elevation: 225.92 ft (68.86m) msl
WELL MSB 62BMEASUREMENTS CONDUCTED IN THE FIELD
Sample date: 12/27/00 Time: 7:50Depth to water: 141.43 ft (43.11m) below TOCWater elevation: 207.67 ft (63.30m) msl
WELL MSB 62CMEASUREMENTS CONDUCTED IN THE FIELD
Sample date: 12/27/00 Time: 7:50Depth to water: 129.41 ft (39.44m) below TOCWater elevation: 219.69 ft (66.96m) msl
WELL MSB 62DMEASUREMENTS CONDUCTED IN THE FIELD
Sample date: 12/27/00 Time: 7:51Depth to water: 124.39 ft (37.91m) below TOCWater elevation: 225.11 ft (68.61m) msl
WELL MSB 63BMEASUREMENTS CONDUCTED IN THE FIELD
Sample date: 12/28/00 Time: 10:48Depth to water: 139.66 ft (42.57m) below TOCWater elevation: 207.24 ft (63.17m) msl
WELL MSB 63CMEASUREMENTS CONDUCTED IN THE FIELD
Sample date: 12/28/00 Time: 10:49Depth to water: 129.97 ft (39.62m) below TOCWater elevation: 217.03 ft (66.15m) msl
WELL MSB 63DMEASUREMENTS CONDUCTED IN THE FIELD
Sample date: 12/28/00 Time: 10:49Depth to water: 121.03 ft (36.89m) below TOCWater elevation: 225.77 ft (68.82m) msl
WELL MSB 64CMEASUREMENTS CONDUCTED IN THE FIELD
Sample date: 12/27/00 Time: 6:43Depth to water: 129.38 ft (39.44m) below TOCWater elevation: 219.02 ft (66.76m) msl
WELL MSB 64DMEASUREMENTS CONDUCTED IN THE FIELD
Sample date: 12/27/00 Time: 6:43Depth to water: 124.21 ft (37.86m) below TOCWater elevation: 224.39 ft (68.39m) msl

WATER-LEVEL DATAWATER-LEVEL DATA
ESH-EMS-2000408ESH-EMS-2000408 A-A-4949 Fourth Quarter 2000Fourth Quarter 2000
WELL MSB 65DMEASUREMENTS CONDUCTED IN THE FIELD
Sample date: 12/29/00 Time: 9:30Depth to water: 121.01 ft (36.88m) below TOCWater elevation: 228.19 ft (69.55m) msl
WELL MSB 66BMEASUREMENTS CONDUCTED IN THE FIELD
Sample date: 12/28/00 Time: 12:05Depth to water: 168.55 ft (51.37m) below TOCWater elevation: 214.85 ft (65.49m) msl
WELL MSB 66CMEASUREMENTS CONDUCTED IN THE FIELD
Sample date: 12/28/00 Time: 12:02Depth to water: 159.1 ft (48.49m) below TOCWater elevation: 224.3 ft (68.37m) msl
WELL MSB 67DMEASUREMENTS CONDUCTED IN THE FIELD
Sample date: 12/31/00 Time: 16:05Depth to water: Not availableWater elevation: 365 ft (111.25m) msl
WELL MSB 68BMEASUREMENTS CONDUCTED IN THE FIELD
Sample date: 12/31/00 Time: 16:06Depth to water: 141.29 ft (43.07m) below TOCWater elevation: 215.61 ft (65.72m) msl
WELL MSB 68CMEASUREMENTS CONDUCTED IN THE FIELD
Sample date: 12/31/00 Time: 16:06Depth to water: 135.81 ft (41.40m) below TOCWater elevation: 220.89 ft (67.33m) msl
WELL MSB 69BMEASUREMENTS CONDUCTED IN THE FIELD
Sample date: 12/28/00 Time: 17:40Depth to water: 164.34 ft (50.09m) below TOCWater elevation: 217.16 ft (66.19m) msl
WELL MSB 69CMEASUREMENTS CONDUCTED IN THE FIELD
Sample date: 12/28/00 Time: 17:40Depth to water: 158.2 ft (48.22m) below TOCWater elevation: 223.4 ft (68.09m) msl
WELL MSB 69DMEASUREMENTS CONDUCTED IN THE FIELD
Sample date: 12/28/00 Time: 17:41Depth to water: 152.39 ft (46.45m) below TOCWater elevation: 229.61 ft (69.99m) msl
WELL MSB 69TAMEASUREMENTS CONDUCTED IN THE FIELD
Sample date: 12/28/00 Time: 17:41Depth to water: 169.31 ft (51.61m) below TOCWater elevation: 212.09 ft (64.65m) msl
WELL MSB 70CMEASUREMENTS CONDUCTED IN THE FIELD
Sample date: 12/27/00 Time: 5:09Depth to water: 147.86 ft (45.07m) below TOCWater elevation: 213.94 ft (65.21m) msl
WELL MSB 70DMEASUREMENTS CONDUCTED IN THE FIELD
Sample date: 12/27/00 Time: 5:09Depth to water: 144.52 ft (44.05m) below TOCWater elevation: 217.68 ft (66.35m) msl
WELL MSB 71BMEASUREMENTS CONDUCTED IN THE FIELD
Sample date: 12/27/00 Time: 5:46Depth to water: 131.45 ft (40.07m) below TOCWater elevation: 213.25 ft (65.00m) msl
WELL MSB 72BMEASUREMENTS CONDUCTED IN THE FIELD
Sample date: 12/28/00 Time: 12:53Depth to water: 130.88 ft (39.89m) below TOCWater elevation: 197.32 ft (60.14m) msl
WELL MSB 73BMEASUREMENTS CONDUCTED IN THE FIELD
Sample date: 12/30/00 Time: 15:48Depth to water: 141.38 ft (43.09m) below TOCWater elevation: 198.22 ft (60.42m) msl
WELL MSB 74BMEASUREMENTS CONDUCTED IN THE FIELD
Sample date: 12/30/00 Time: 11:32Depth to water: 106.24 ft (32.38m) below TOCWater elevation: 208.26 ft (63.48m) msl

WATER-LEVEL DATAWATER-LEVEL DATA
ESH-EMS-2000408ESH-EMS-2000408 A-A-5050 Fourth Quarter 2000Fourth Quarter 2000
WELL MSB 74CMEASUREMENTS CONDUCTED IN THE FIELD
Sample date: 12/30/00 Time: 11:32Depth to water: 106.32 ft (32.41m) below TOCWater elevation: 208.68 ft (63.61m) msl
WELL MSB 74DMEASUREMENTS CONDUCTED IN THE FIELD
Sample date: 12/30/00 Time: 11:33Depth to water: 86.7 ft (26.43m) below TOCWater elevation: 228.4 ft (69.62m) msl
WELL MSB 75BMEASUREMENTS CONDUCTED IN THE FIELD
Sample date: 12/28/00 Time: 12:23Depth to water: 119.47 ft (36.41m) below TOCWater elevation: 207.23 ft (63.16m) msl
WELL MSB 75CMEASUREMENTS CONDUCTED IN THE FIELD
Sample date: 12/28/00 Time: 12:24Depth to water: 119.85 ft (36.53m) below TOCWater elevation: 207.65 ft (63.29m) msl
WELL MSB 76CMEASUREMENTS CONDUCTED IN THE FIELD
Sample date: 12/27/00 Time: 5:38Depth to water: 135.32 ft (41.25m) below TOCWater elevation: 217.08 ft (66.17m) msl
WELL MSB 77BMEASUREMENTS CONDUCTED IN THE FIELD
Sample date: 12/30/00 Time: 12:59Depth to water: 139.82 ft (42.62m) below TOCWater elevation: 217.38 ft (66.26m) msl
WELL MSB 77CMEASUREMENTS CONDUCTED IN THE FIELD
Sample date: 12/30/00 Time: 13:01Depth to water: 137.34 ft (41.86m) below TOCWater elevation: 219.86 ft (67.01m) msl
WELL MSB 77DMEASUREMENTS CONDUCTED IN THE FIELD
Sample date: 12/30/00 Time: 13:03Depth to water: 127.7 ft (38.92m) below TOCWater elevation: 229.7 ft (70.01m) msl
WELL MSB 78DRMEASUREMENTS CONDUCTED IN THE FIELD
Sample date: 12/27/00 Time: 5:31Depth to water: 143.51 ft (43.74m) below TOCWater elevation: 220.19 ft (67.11m) msl
WELL MSB 79BMEASUREMENTS CONDUCTED IN THE FIELD
Sample date: 12/29/00 Time: 16:32Depth to water: 143.21 ft (43.65m) below TOCWater elevation: 204.69 ft (62.39m) msl
WELL MSB 79CMEASUREMENTS CONDUCTED IN THE FIELD
Sample date: 12/29/00 Time: 16:33Depth to water: 140.82 ft (42.92m) below TOCWater elevation: 206.98 ft (63.09m) msl
WELL MSB 81BMEASUREMENTS CONDUCTED IN THE FIELD
Sample date: 12/30/00 Time: 12:47Depth to water: 50.27 ft (15.32m) below TOCWater elevation: 216.73 ft (66.06m) msl
WELL MSB 82AMEASUREMENTS CONDUCTED IN THE FIELD
Sample date: 12/28/00 Time: 17:42Depth to water: 155.87 ft (47.51m) below TOCWater elevation: 218.43 ft (66.58m) msl
WELL MSB 82BMEASUREMENTS CONDUCTED IN THE FIELD
Sample date: 12/28/00 Time: 17:43Depth to water: 158.08 ft (48.18m) below TOCWater elevation: 216.12 ft (65.87m) msl
WELL MSB 82CMEASUREMENTS CONDUCTED IN THE FIELD
Sample date: 12/28/00 Time: 17:43Depth to water: 149.76 ft (45.65m) below TOCWater elevation: 224.14 ft (68.32m) msl
WELL MSB 82DMEASUREMENTS CONDUCTED IN THE FIELD
Sample date: 12/28/00 Time: 17:43Depth to water: 144.02 ft (43.90m) below TOCWater elevation: 229.58 ft (69.98m) msl

WATER-LEVEL DATAWATER-LEVEL DATA
ESH-EMS-2000408ESH-EMS-2000408 A-A-5151 Fourth Quarter 2000Fourth Quarter 2000
WELL MSB 82TAMEASUREMENTS CONDUCTED IN THE FIELD
Sample date: 12/28/00 Time: 17:44Depth to water: 163.62 ft (49.87m) below TOCWater elevation: 210.08 ft (64.03m) msl
WELL MSB 83BMEASUREMENTS CONDUCTED IN THE FIELD
Sample date: 12/28/00 Time: 17:46Depth to water: 153.43 ft (46.77m) below TOCWater elevation: 218.37 ft (66.56m) msl
WELL MSB 83CMEASUREMENTS CONDUCTED IN THE FIELD
Sample date: 12/28/00 Time: 17:46Depth to water: 147.21 ft (44.87m) below TOCWater elevation: 224.79 ft (68.52m) msl
WELL MSB 83TAMEASUREMENTS CONDUCTED IN THE FIELD
Sample date: 12/28/00 Time: 17:47Depth to water: 159.02 ft (48.47m) below TOCWater elevation: 212.68 ft (64.83m) msl
WELL MSB 84AMEASUREMENTS CONDUCTED IN THE FIELD
Sample date: 12/28/00 Time: 17:48Depth to water: 177.02 ft (53.96m) below TOCWater elevation: 184.48 ft (56.23m) msl
WELL MSB 84CMEASUREMENTS CONDUCTED IN THE FIELD
Sample date: 12/28/00 Time: 17:48Depth to water: 135.78 ft (41.39m) below TOCWater elevation: 226.12 ft (68.92m) msl
WELL MSB 85BMEASUREMENTS CONDUCTED IN THE FIELD
Sample date: 12/29/00 Time: 12:33Depth to water: 163.16 ft (49.73m) below TOCWater elevation: 217.14 ft (66.19m) msl
WELL MSB 85CMEASUREMENTS CONDUCTED IN THE FIELD
Sample date: 12/29/00 Time: 12:38Depth to water: 160.56 ft (48.94m) below TOCWater elevation: 220.34 ft (67.16m) msl
WELL MSB 85DMEASUREMENTS CONDUCTED IN THE FIELD
Sample date: 12/29/00 Time: 12:30Depth to water: 151.91 ft (46.30m) below TOCWater elevation: 228.89 ft (69.77m) msl
WELL MSB 85TAMEASUREMENTS CONDUCTED IN THE FIELD
Sample date: 12/29/00 Time: 12:34Depth to water: 163.49 ft (49.83m) below TOCWater elevation: 216.91 ft (66.11m) msl
WELL MSB 86CMEASUREMENTS CONDUCTED IN THE FIELD
Sample date: 12/29/00 Time: 12:15Depth to water: 135.95 ft (41.44m) below TOCWater elevation: 221.05 ft (67.38m) msl
WELL MSB 87BMEASUREMENTS CONDUCTED IN THE FIELD
Sample date: 12/29/00 Time: 15:26Depth to water: 121.01 ft (36.88m) below TOCWater elevation: 214.99 ft (65.53m) msl
WELL MSB 87CMEASUREMENTS CONDUCTED IN THE FIELD
Sample date: 12/29/00 Time: 15:24Depth to water: 100.3 ft (30.57m) below TOCWater elevation: 236.3 ft (72.03m) msl
WELL MSB 88BMEASUREMENTS CONDUCTED IN THE FIELD
Sample date: 12/28/00 Time: 12:40Depth to water: 38.95 ft (11.87m) below TOCWater elevation: 199.15 ft (60.70m) msl
WELL MSB 88CMEASUREMENTS CONDUCTED IN THE FIELD
Sample date: 12/28/00 Time: 12:41Depth to water: 35.39 ft (10.79m) below TOCWater elevation: 201.81 ft (61.51m) msl
WELL MSB 89BMEASUREMENTS CONDUCTED IN THE FIELD
Sample date: 12/29/00 Time: 16:41Depth to water: 135.38 ft (41.26m) below TOCWater elevation: 204.02 ft (62.19m) msl

WATER-LEVEL DATAWATER-LEVEL DATA
ESH-EMS-2000408ESH-EMS-2000408 A-A-5252 Fourth Quarter 2000Fourth Quarter 2000
WELL MSB 89CMEASUREMENTS CONDUCTED IN THE FIELD
Sample date: 12/29/00 Time: 16:38Depth to water: 113.98 ft (34.74m) below TOCWater elevation: 225.82 ft (68.83m) msl
WELL MSB 90CMEASUREMENTS CONDUCTED IN THE FIELD
Sample date: 12/28/00 Time: 17:45Depth to water: 117.33 ft (35.76m) below TOCWater elevation: 228.07 ft (69.52m) msl
WELL MSB 90TBMEASUREMENTS CONDUCTED IN THE FIELD
Sample date: 12/28/00 Time: 17:45Depth to water: 140.63 ft (42.86m) below TOCWater elevation: 204.37 ft (62.29m) msl
WELL MSB 91CMEASUREMENTS CONDUCTED IN THE FIELD
Sample date: 12/30/00 Time: 11:33Depth to water: 108.15 ft (32.96m) below TOCWater elevation: 226.65 ft (69.08m) msl
WELL MSB 92CMEASUREMENTS CONDUCTED IN THE FIELD
Sample date: 12/31/00 Time: 8:35Depth to water: 113.68 ft (34.65m) below TOCWater elevation: 226.12 ft (68.92m) msl
WELL SRW 1MEASUREMENTS CONDUCTED IN THE FIELD
Sample date: 12/30/00 Time: 17:53Depth to water: 106.99 ft (32.61m) below TOCWater elevation: 208.21 ft (63.46m) msl
WELL SRW 1BBMEASUREMENTS CONDUCTED IN THE FIELD
Sample date: 12/30/00 Time: 17:54Depth to water: 113.41 ft (34.57m) below TOCWater elevation: 202.89 ft (61.84m) msl
WELL SRW 2AMEASUREMENTS CONDUCTED IN THE FIELD
Sample date: 12/30/00 Time: 17:50Depth to water: 118.61 ft (36.15m) below TOCWater elevation: 201.99 ft (61.57m) msl
WELL SRW 2BMEASUREMENTS CONDUCTED IN THE FIELD
Sample date: 12/30/00 Time: 17:48Depth to water: 117.67 ft (35.87m) below TOCWater elevation: 202.93 ft (61.85m) msl
WELL SRW 3AMEASUREMENTS CONDUCTED IN THE FIELD
Sample date: 12/30/00 Time: 17:38Depth to water: 122.96 ft (37.48m) below TOCWater elevation: 209.14 ft (63.75m) msl
WELL SRW 3BBMEASUREMENTS CONDUCTED IN THE FIELD
Sample date: 12/30/00 Time: 17:46Depth to water: 128.29 ft (39.10m) below TOCWater elevation: 204.01 ft (62.18m) msl
WELL SRW 4BBMEASUREMENTS CONDUCTED IN THE FIELD
Sample date: 12/30/00 Time: 18:07Depth to water: 118 ft (35.97m) below TOCWater elevation: 202.6 ft (61.75m) msl
WELL SRW 8BBMEASUREMENTS CONDUCTED IN THE FIELD
Sample date: 12/30/00 Time: 16:47Depth to water: 89.95 ft (27.42m) below TOCWater elevation: 199.55 ft (60.82m) msl
WELL SRW 9MEASUREMENTS CONDUCTED IN THE FIELD
Sample date: 12/30/00 Time: 16:52Depth to water: 59.74 ft (18.21m) below TOCWater elevation: 193.66 ft (59.03m) msl
WELL SRW 9AMEASUREMENTS CONDUCTED IN THE FIELD
Sample date: 12/30/00 Time: 17:11Depth to water: 59.18 ft (18.04m) below TOCWater elevation: 194.12 ft (59.17m) msl
WELL SRW 10BBMEASUREMENTS CONDUCTED IN THE FIELD
Sample date: 12/30/00 Time: 18:00Depth to water: 102.02 ft (31.10m) below TOCWater elevation: 200.78 ft (61.20m) msl

WATER-LEVEL DATAWATER-LEVEL DATA
ESH-EMS-2000408ESH-EMS-2000408 A-A-5353 Fourth Quarter 2000Fourth Quarter 2000
WELL SRW 11BBMEASUREMENTS CONDUCTED IN THE FIELD
Sample date: 12/30/00 Time: 18:03Depth to water: 95.48 ft (29.10m) below TOCWater elevation: 201.02 ft (61.27m) msl
WELL SRW 12AMEASUREMENTS CONDUCTED IN THE FIELD
Sample date: 12/30/00 Time: 17:02Depth to water: 47.01 ft (14.33m) below TOCWater elevation: 189.29 ft (57.70m) msl
WELL SRW 12CMEASUREMENTS CONDUCTED IN THE FIELD
Sample date: 12/30/00 Time: 17:00Depth to water: 46.8 ft (14.26m) below TOCWater elevation: 189.5 ft (57.76m) msl
WELL SRW 13AMEASUREMENTS CONDUCTED IN THE FIELD
Sample date: 12/30/00 Time: 16:40Depth to water: 100.69 ft (30.69m) below TOCWater elevation: 197.01 ft (60.05m) msl
WELL SRW 13BMEASUREMENTS CONDUCTED IN THE FIELD
Sample date: 12/30/00 Time: 16:39Depth to water: 98.97 ft (30.17m) below TOCWater elevation: 198.73 ft (60.57m) msl
WELL SRW 13CMEASUREMENTS CONDUCTED IN THE FIELD
Sample date: 12/30/00 Time: 16:39Depth to water: 92.26 ft (28.12m) below TOCWater elevation: 205.44 ft (62.62m) msl
WELL SRW 14AMEASUREMENTS CONDUCTED IN THE FIELD
Sample date: 12/30/00 Time: 16:31Depth to water: 128.18 ft (39.07m) below TOCWater elevation: 198.82 ft (60.60m) msl
WELL SRW 14BMEASUREMENTS CONDUCTED IN THE FIELD
Sample date: 12/30/00 Time: 16:30Depth to water: 126.13 ft (38.44m) below TOCWater elevation: 200.77 ft (61.20m) msl
WELL SRW 15AMEASUREMENTS CONDUCTED IN THE FIELD
Sample date: 12/30/00 Time: 18:17Depth to water: 114.33 ft (34.85m) below TOCWater elevation: 204.77 ft (62.41m) msl
WELL SRW 15BMEASUREMENTS CONDUCTED IN THE FIELD
Sample date: 12/30/00 Time: 18:22Depth to water: 114.29 ft (34.84m) below TOCWater elevation: 204.81 ft (62.43m) msl
WELL SRW 15CMEASUREMENTS CONDUCTED IN THE FIELD
Sample date: 12/30/00 Time: 18:20Depth to water: 110.89 ft (33.80m) below TOCWater elevation: 208.21 ft (63.46m) msl
WELL SRW 16AMEASUREMENTS CONDUCTED IN THE FIELD
Sample date: 12/30/00 Time: 17:26Depth to water: 137.34 ft (41.86m) below TOCWater elevation: 209.46 ft (63.84m) msl
WELL SRW 16BMEASUREMENTS CONDUCTED IN THE FIELD
Sample date: 12/30/00 Time: 17:22Depth to water: 136.71 ft (41.67m) below TOCWater elevation: 210.09 ft (64.04m) msl
WELL SRW 16C
MEASUREMENTS CONDUCTED IN THE FIELD
Sample date: 12/30/00 Time: 17:20Depth to water: 136.03 ft (41.46m) below TOCWater elevation: 210.57 ft (64.18m) msl
ESH-EMS-2000408ESH-EMS-2000408 Fourth Quarter 2000Fourth Quarter 2000
Go to Appendix B, Analytical Results Tables.

Appendix C. Sampling Blanks ResultsAppendix C. Sampling Blanks ResultsESH-EMS-2000408ESH-EMS-2000408 Page Page 11 Fourth Quarter 2000Fourth Quarter 2000
Appendix C. Sampling Blanks ResultsAppendix C. Sampling Blanks ResultsThis section presents the analytical results for sampling blanks analyzed during fourth quarter 2000.
Appendix C. Sampling Blanks ResultsAppendix C. Sampling Blanks ResultsESH-EMS-2000408ESH-EMS-2000408 Page Page 22 Fourth Quarter 2000Fourth Quarter 2000
NOTESNOTES

SAMPLING BLANKS RESULTSSAMPLING BLANKS RESULTS
ESH-EMS-2000408ESH-EMS-2000408 C-C-33 Fourth Quarter 2000Fourth Quarter 2000
WELL QA 2DMEASUREMENTS CONDUCTED IN THE FIELD
Sample date: 10/03/00 Time: Not availableWater temperature: Not availableAir temperature: Not availablepH: Not available Total alkalinity (as CaCO3): Not availableSp. conductance: Not available Phenolphthalein alkalinity: Not availableTurbidity: Not availableNo water was evacuated from the well prior to sampling.
ANALYSES
F Analyte Result FG S EMS SQL Unit Lab Method
0 Aluminum, total recoverable <50.0 U 50.0 µg/L GE EPA6010B0 Beryllium, total recoverable <0.200 U 0.200 µg/L GE EPA60200 Cadmium, total recoverable <1.00 U 1.00 µg/L GE EPA60200 Lead, total recoverable <5.00 U 5.00 µg/L GE EPA6010B0 Nitrate-nitrite as nitrogen 440 50.0 µg/L GE EPA353.10 pH 6.31 J Q 0.100 pH GE EPA9040B0 Specific conductance 60.0 1.00 µS/cm GE EPA9050A0 Gross alpha 1.94E-10±4.08E-10 U 9.28E-10 µCi/mL GP EPIA-0010 Nonvolatile beta 1.21E-09±8.74E-10 U 1.79E-09 µCi/mL GP EPIA-0010 Tritium -3.78E-07±3.06E-07 U 5.68E-07 µCi/mL GP EPIA-002
WELL QA 4DMEASUREMENTS CONDUCTED IN THE FIELD
Sample date: 10/03/00 Time: 12:03Water temperature: 24°CAir temperature: 29.9°CpH: 5.7 Total alkalinity (as CaCO3): 1 mg/LSp. conductance: 2 µS/cm Phenolphthalein alkalinity: 0 mg/LTurbidity: 0 NTU
ANALYSES
F Analyte Result FG S EMS SQL Unit Lab Method
0 Aluminum, total recoverable <50.0 U 50.0 µg/L GE EPA6010B0 Beryllium, total recoverable <0.200 U 0.200 µg/L GE EPA60200 Cadmium, total recoverable <1.00 U 1.00 µg/L GE EPA60200 Lead, total recoverable <5.00 U 5.00 µg/L GE EPA6010B0 Nitrate-nitrite as nitrogen <20.0 U V 50.0 µg/L GE EPA353.10 pH 5.85 J Q 0.100 pH GE EPA9040B0 Specific conductance 1.08 1.00 µS/cm GE EPA9050A0 Gross alpha -1.02E-10±2.50E-10 U 9.14E-10 µCi/mL GP EPIA-0010 Nonvolatile beta 6.13E-10±6.63E-10 U 1.43E-09 µCi/mL GP EPIA-0010 Tritium 2.91E-07±3.40E-07 U 5.70E-07 µCi/mL GP EPIA-002
WELL QA 6DMEASUREMENTS CONDUCTED IN THE FIELD
Sample date: 10/04/00 Time: 15:15Water temperature: 24.8°CAir temperature: 32.5°CpH: 6.6 Total alkalinity (as CaCO3): 0 mg/LSp. conductance: 4 µS/cm Phenolphthalein alkalinity: 0 mg/LTurbidity: 1 NTUNo water was evacuated from the well prior to sampling.
ANALYSES
F Analyte Result FG S EMS SQL Unit Lab Method
0 Aluminum, total recoverable <50.0 U 50.0 µg/L GE EPA6010B0 Beryllium, total recoverable <0.200 U 0.200 µg/L GE EPA60200 Cadmium, total recoverable <1.00 U 1.00 µg/L GE EPA60200 Lead, total recoverable <5.00 U 5.00 µg/L GE EPA6010B0 Nitrate-nitrite as nitrogen <20.0 U V 50.0 µg/L GE EPA353.10 pH 5.93 J Q 0.100 pH GE EPA9040B0 Specific conductance 1.04 1.00 µS/cm GE EPA9050A0 Gross alpha 2.66E-10±4.11E-10 U 8.79E-10 µCi/mL GP EPIA-0010 Nonvolatile beta -3.08E-10±6.59E-10 U 1.70E-09 µCi/mL GP EPIA-0010 Tritium 1.14E-07±3.56E-07 U 6.15E-07 µCi/mL GP EPIA-002
WELL QA 8DMEASUREMENTS CONDUCTED IN THE FIELD
Sample date: 10/04/00 Time: 12:15Water temperature: 24.8°CAir temperature: 38.5°CpH: 6.6 Total alkalinity (as CaCO3): 1 mg/LSp. conductance: 4 µS/cm Phenolphthalein alkalinity: 0 mg/LTurbidity: 1 NTU
ANALYSES
F Analyte Result FG S EMS SQL Unit Lab Method
0 Aluminum, total recoverable <50.0 U 50.0 µg/L GE EPA6010B0 Beryllium, total recoverable 0.200 0.200 µg/L GE EPA60200 Cadmium, total recoverable <1.00 U 1.00 µg/L GE EPA60200 Lead, total recoverable <5.00 U 5.00 µg/L GE EPA6010B0 Nitrate-nitrite as nitrogen <20.0 U V 50.0 µg/L GE EPA353.10 pH 5.75 J Q 0.100 pH GE EPA9040B0 Specific conductance 1.27 1.00 µS/cm GE EPA9050A0 Gross alpha 5.15E-10±4.75E-10 U 7.31E-10 µCi/mL GP EPIA-0010 Nonvolatile beta 8.33E-09±1.27E-09 1.45E-09 µCi/mL GP EPIA-0010 Tritium -1.71E-08±3.51E-07 U 6.17E-07 µCi/mL GP EPIA-002
WELL QA 10DMEASUREMENTS CONDUCTED IN THE FIELD
Sample date: 10/09/00 Time: 14:40Water temperature: 23.7°CAir temperature: 24.3°CpH: 8.1 Total alkalinity (as CaCO3): 1 mg/LSp. conductance: 0 µS/cm Phenolphthalein alkalinity: 0 mg/LTurbidity: 0 NTUNo water was evacuated from the well prior to sampling.
ANALYSES
F Analyte Result FG S EMS SQL Unit Lab Method
0 Aluminum, total recoverable <50.0 U 50.0 µg/L GE EPA6010B0 Beryllium, total recoverable <0.200 U 0.200 µg/L GE EPA60200 Cadmium, total recoverable 0.510 J I 1.00 µg/L GE EPA60200 Lead, total recoverable <5.00 U 5.00 µg/L GE EPA6010B0 Nitrate-nitrite as nitrogen <10.0 U V 50.0 µg/L GE EPA353.10 Nitrate-nitrite as nitrogen <10.0 U V 50.0 µg/L GE EPA353.10 pH 5.78 J Q 0.100 pH GE EPA9040B0 Specific conductance 1.33 1.00 µS/cm GE EPA9050A0 Gross alpha 3.72E-10±4.40E-10 U 8.70E-10 µCi/mL GP EPIA-0010 Nonvolatile beta 1.78E-09±7.75E-10 J I 1.42E-09 µCi/mL GP EPIA-0010 Tritium -2.96E-07±3.31E-07 U 6.02E-07 µCi/mL GP EPIA-002
WELL QA 12DMEASUREMENTS CONDUCTED IN THE FIELD
Sample date: 10/10/00 Time: 15:13Water temperature: 24°CAir temperature: 23.9°CpH: 7.3 Total alkalinity (as CaCO3): 1 mg/LSp. conductance: 4 µS/cm Phenolphthalein alkalinity: 0 mg/LTurbidity: 0 NTU
ANALYSES
F Analyte Result FG S EMS SQL Unit Lab Method
0 Beryllium, total recoverable <0.200 U 0.200 µg/L GE EPA60200 Mercury, total recoverable <0.200 U 0.200 µg/L GE EPA7470A0 Nitrate-nitrite as nitrogen <10.0 U V 50.0 µg/L GE EPA353.10 pH 5.62 J Q 0.100 pH GE EPA9040B0 Specific conductance 1.54 1.00 µS/cm GE EPA9050A0 Thallium, total recoverable 0.500 R L C 0.500 µg/L GE EPA60200 Gross alpha -6.70E-11±2.28E-10 U 8.08E-10 µCi/mL GP EPIA-0010 Nonvolatile beta -4.62E-10±5.82E-10 U 1.57E-09 µCi/mL GP EPIA-0010 Tritium -1.11E-06±4.03E-07 U 7.74E-07 µCi/mL GP EPIA-002

SAMPLING BLANKS RESULTSSAMPLING BLANKS RESULTS
ESH-EMS-2000408ESH-EMS-2000408 C-C-44 Fourth Quarter 2000Fourth Quarter 2000
WELL QA 14DMEASUREMENTS CONDUCTED IN THE FIELD
Sample date: 10/11/00 Time: Not availableWater temperature: Not availableAir temperature: Not availablepH: Not available Total alkalinity (as CaCO3): Not availableSp. conductance: Not available Phenolphthalein alkalinity: Not availableTurbidity: Not availableNo water was evacuated from the well prior to sampling.
ANALYSES
F Analyte Result FG S EMS SQL Unit Lab Method
0 Beryllium, total recoverable <0.200 U 0.200 µg/L GE EPA60200 Mercury, total recoverable <0.200 U 0.200 µg/L GE EPA7470A0 Nitrate-nitrite as nitrogen <10.0 U V 50.0 µg/L GE EPA353.10 pH 5.77 J Q 0.100 pH GE EPA9040B0 Specific conductance 1.28 1.00 µS/cm GE EPA9050A0 Thallium, total recoverable <0.500 JU L CI 0.500 µg/L GE EPA60200 Gross alpha 4.13E-10±7.17E-10 U 1.58E-09 µCi/mL GP EPIA-0010 Nonvolatile beta -1.20E-10±1.21E-09 U 2.97E-09 µCi/mL GP EPIA-0010 Tritium 3.96E-08±3.97E-07 U 6.90E-07 µCi/mL GP EPIA-002
WELL QA 16DMEASUREMENTS CONDUCTED IN THE FIELD
Sample date: 10/13/00 Time: Not availableWater temperature: Not availableAir temperature: Not availablepH: Not available Total alkalinity (as CaCO3): Not availableSp. conductance: Not available Phenolphthalein alkalinity: Not availableTurbidity: Not availableNo water was evacuated from the well prior to sampling.
ANALYSES
F Analyte Result FG S EMS SQL Unit Lab Method
0 Beryllium, total recoverable <0.200 U 0.200 µg/L GE EPA60200 Mercury, total recoverable <0.200 U 0.200 µg/L GE EPA7470A0 Nitrate-nitrite as nitrogen 20.0 J I 50.0 µg/L GE EPA353.10 pH 5.55 J Q 0.100 pH GE EPA9040B0 Specific conductance 1.12 1.00 µS/cm GE EPA9050A0 Thallium, total recoverable 0.500 R L C 0.500 µg/L GE EPA60200 Gross alpha 4.77E-11±2.83E-10 U 7.89E-10 µCi/mL GP EPIA-0010 Nonvolatile beta 2.05E-11±6.15E-10 U 1.48E-09 µCi/mL GP EPIA-0010 Tritium 4.17E-08±3.53E-07 U 6.14E-07 µCi/mL GP EPIA-002
WELL QA 18DMEASUREMENTS CONDUCTED IN THE FIELD
Sample date: 10/12/00 Time: 11:02Water temperature: 24.4°CAir temperature: 33.1°CpH: 8.7 Total alkalinity (as CaCO3): 1 mg/LSp. conductance: 4 µS/cm Phenolphthalein alkalinity: 0 mg/LTurbidity: 0 NTU
ANALYSES
F Analyte Result FG S EMS SQL Unit Lab Method
0 Beryllium, total recoverable <0.200 U 0.200 µg/L GE EPA60200 Mercury, total recoverable <0.200 U 0.200 µg/L GE EPA7470A0 Nitrate-nitrite as nitrogen <50.0 U 50.0 µg/L GE EPA353.10 pH 5.59 J Q 0.100 pH GE EPA9040B0 pH 5.51 0.100 pH GE EPA9040B0 Specific conductance 1.62 1.00 µS/cm GE EPA9050A0 Thallium, total recoverable 0.500 R L C 0.500 µg/L GE EPA60200 Gross alpha -6.97E-11±2.81E-10 U 9.13E-10 µCi/mL GP EPIA-0010 Nonvolatile beta -5.15E-10±6.18E-10 U 1.67E-09 µCi/mL GP EPIA-0010 Tritium 1.64E-07±3.59E-07 U 6.14E-07 µCi/mL GP EPIA-002
WELL QA 20DMEASUREMENTS CONDUCTED IN THE FIELD
Sample date: 10/16/00 Time: Not availableWater temperature: Not availableAir temperature: Not availablepH: Not available Total alkalinity (as CaCO3): Not availableSp. conductance: Not available Phenolphthalein alkalinity: Not availableTurbidity: Not availableNo water was evacuated from the well prior to sampling.
ANALYSES
F Analyte Result FG S EMS SQL Unit Lab Method
0 Beryllium, total recoverable <0.200 U 0.200 µg/L GE EPA60200 Mercury, total recoverable <0.200 U 0.200 µg/L GE EPA7470A0 Nitrate-nitrite as nitrogen <50.0 U 50.0 µg/L GE EPA353.10 pH 5.63 J Q 0.100 pH GE EPA9040B0 Specific conductance 1.21 1.00 µS/cm GE EPA9050A0 Thallium, total recoverable <0.500 JU L CI 0.500 µg/L GE EPA60200 Gross alpha -1.91E-10±3.16E-10 U 1.37E-09 µCi/mL GP EPIA-0010 Nonvolatile beta 9.83E-11±1.39E-09 U 3.34E-09 µCi/mL GP EPIA-0010 Tritium -7.59E-07±3.73E-07 U 7.05E-07 µCi/mL GP EPIA-002
WELL QA 22DMEASUREMENTS CONDUCTED IN THE FIELD
Sample date: 10/16/00 Time: Not availableWater temperature: Not availableAir temperature: Not availablepH: Not available Total alkalinity (as CaCO3): Not availableSp. conductance: Not available Phenolphthalein alkalinity: Not availableTurbidity: Not availableNo water was evacuated from the well prior to sampling.
ANALYSES
F Analyte Result FG S EMS SQL Unit Lab Method
0 Beryllium, total recoverable <0.200 U 0.200 µg/L GE EPA60200 Mercury, total recoverable <0.200 U 0.200 µg/L GE EPA7470A0 Nitrate-nitrite as nitrogen <50.0 U 50.0 µg/L GE EPA353.10 pH 5.62 J Q 0.100 pH GE EPA9040B0 Specific conductance 1.21 1.00 µS/cm GE EPA9050A0 Thallium, total recoverable <0.500 JU L CI 0.500 µg/L GE EPA60200 Gross alpha U 1.78E-09 µCi/mL GP EPIA-0010 Nonvolatile beta 5.16E-10±1.49E-09 U 3.45E-09 µCi/mL GP EPIA-0010 Tritium -6.58E-07±3.73E-07 U 6.98E-07 µCi/mL GP EPIA-002
WELL QA 24DMEASUREMENTS CONDUCTED IN THE FIELD
Sample date: 10/17/00 Time: 13:56Water temperature: 23°CAir temperature: 25.5°CpH: 5.4 Total alkalinity (as CaCO3): 1 mg/LSp. conductance: 3 µS/cm Phenolphthalein alkalinity: 0 mg/LTurbidity: 0 NTU
ANALYSES
F Analyte Result FG S EMS SQL Unit Lab Method
0 Beryllium, total recoverable 0.200 0.200 µg/L GE EPA60200 Mercury, total recoverable <0.200 U 0.200 µg/L GE EPA7470A0 Nitrate-nitrite as nitrogen <50.0 U 50.0 µg/L GE EPA353.10 pH 5.23 J Q 0.100 pH GE EPA9040B0 Specific conductance 1.40 1.00 µS/cm GE EPA9050A0 Thallium, total recoverable 0.500 J L I 0.500 µg/L GE EPA60200 Gross alpha 1.95E-10±5.34E-10 U 1.28E-09 µCi/mL GP EPIA-0010 Nonvolatile beta -2.81E-10±7.12E-10 U 1.79E-09 µCi/mL GP EPIA-0010 Tritium 2.94E-07±3.50E-07 U 5.89E-07 µCi/mL GP EPIA-002

SAMPLING BLANKS RESULTSSAMPLING BLANKS RESULTS
ESH-EMS-2000408ESH-EMS-2000408 C-C-55 Fourth Quarter 2000Fourth Quarter 2000
WELL QA 32DMEASUREMENTS CONDUCTED IN THE FIELD
Sample date: 11/02/00 Time: 10:21Water temperature: 22.6°CAir temperature: 23.8°CpH: 6.6 Total alkalinity (as CaCO3): 1 mg/LSp. conductance: 0 µS/cm Phenolphthalein alkalinity: 0 mg/LTurbidity: 1 NTU
ANALYSES
F Analyte Result FG S EMS SQL Unit Lab Method
0 Antimony, total recoverable <27.0 U 27.0 µg/L WA EPA6010B0 Arsenic, total recoverable <40.0 U 40.0 µg/L WA EPA6010B0 Barium, total recoverable <1.80 U 1.80 µg/L WA EPA6010B0 Boron, total recoverable <266 U 266 µg/L WA EPA6010B0 Cadmium, total recoverable <4.70 U 4.70 µg/L WA EPA6010B0 Chromium, total recoverable <7.00 U 7.00 µg/L WA EPA6010B0 Copper, total recoverable <15.0 U 15.0 µg/L WA EPA6010B0 Cyanide <15.2 U 15.2 µg/L WA EPA90140 Lead, total recoverable <47.0 U 47.0 µg/L WA EPA6010B0 Lithium, total recoverable <2.70 U 2.70 µg/L WA EPA6010B0 Mercury, total recoverable <0.700 U 0.700 µg/L WA EPA7470A0 Nickel, total recoverable <26.0 U 26.0 µg/L WA EPA6010B0 Nitrate-nitrite as nitrogen <9.00 U V 20.0 µg/L WA EPA353.20 Phenols <37.0 U 37.0 µg/L WA EPA90660 Selenium, total recoverable <66.0 U 66.0 µg/L WA EPA6010B0 Silver, total recoverable <5.00 U 5.00 µg/L WA EPA6010B0 Sulfate <170 U V 340 µg/L WA EPA90560 Tin, total recoverable <70.0 U 70.0 µg/L WA EPA6010B0 Total dissolved solids 8,000 J I 6 50,000 µg/L WA EPA160.10 Total organic carbon <1,000 U 1,000 µg/L WA EPA90600 Total organic halogens <120 U 120 µg/L WA EPA9020B0 Zinc, total recoverable <53.0 U 53.0 µg/L WA EPA6010B0 Carbon-14 -2.48E-09±5.02E-09 U 8.89E-09 µCi/mL GP EPIA-0030 Gross alpha -3.00E-11±3.30E-10 U 6.50E-10 µCi/mL TM EPA900.0M0 Nonvolatile beta -1.33E-09±8.40E-10 U 1.45E-09 µCi/mL TM EPA900.0M0 Radium, total alpha-emitting 7.00E-10±5.00E-10 U V 6.60E-10 µCi/mL TM EPA903.0M0 Radium-226 -4.87E-11±2.84E-10 U 6.34E-10 µCi/mL GP EPIA-0080 Radium-228 2.07E-10±5.64E-10 U 1.04E-09 µCi/mL GP EPIA-0090 Radium-228 2.00E-09±7.00E-10 U V 9.80E-10 µCi/mL TM EPA904.0M0 Strontium-90 -2.71E-10±4.06E-10 U 9.56E-10 µCi/mL GP EPIA-0040 Strontium-90 2.30E-10±7.00E-10 JU L C 1.22E-09 µCi/mL TM EMLSR02M0 Tritium -2.70E-07±7.10E-07 U 1.28E-06 µCi/mL TM EPA906.0M
WELL QA 32DMEASUREMENTS CONDUCTED IN THE FIELD
Sample date: 11/02/00 Time: 10:21Water temperature: 22.6°CAir temperature: 23.8°CpH: 6.6 Total alkalinity (as CaCO3): 1 mg/LSp. conductance: 0 µS/cm Phenolphthalein alkalinity: 0 mg/LTurbidity: 1 NTU
ANALYSES
F Analyte Result FG S EMS SQL Unit Lab Method
0 Alkalinity (as CaCO3) 6.30 J I 6 6,700 mg/L WA EPA310.1
WELL QA 34DMEASUREMENTS CONDUCTED IN THE FIELD
Sample date: 12/18/00 Time: Not availableWater temperature: Not availableAir temperature: Not availablepH: Not available Total alkalinity (as CaCO3): Not availableSp. conductance: Not available Phenolphthalein alkalinity: Not availableTurbidity: Not availableNo water was evacuated from the well prior to sampling.
Well QA 34D collected on 12/18/00 (cont.)
ANALYSES
F Analyte Result FG S EMS SQL Unit Lab Method
0 Alkalinity (as CaCO3) <0.960 U V 6,700 mg/L WA EPA310.10 Antimony, total recoverable <27.0 U 27.0 µg/L WA EPA6010B0 Arsenic, total recoverable <40.0 U 40.0 µg/L WA EPA6010B0 Barium, total recoverable <0.320 U V 1.80 µg/L WA EPA6010B0 Boron, total recoverable <266 U 266 µg/L WA EPA6010B0 Cadmium, total recoverable <4.70 U 4.70 µg/L WA EPA6010B0 Chromium, total recoverable <7.00 U 7.00 µg/L WA EPA6010B0 Copper, total recoverable <15.0 U 15.0 µg/L WA EPA6010B0 Cyanide <15.2 U 15.2 µg/L WA EPA90140 Lead, total recoverable <47.0 U 47.0 µg/L WA EPA6010B0 Lithium, total recoverable <2.70 U 2.70 µg/L WA EPA6010B0 Mercury, total recoverable <0.700 U 0.700 µg/L WA EPA7470A0 Nickel, total recoverable <26.0 U 26.0 µg/L WA EPA6010B0 Nitrate-nitrite as nitrogen <2.00 U V 20.0 µg/L WA EPA353.20 Phenols <37.0 U 37.0 µg/L WA EPA90660 Selenium, total recoverable <66.0 U 66.0 µg/L WA EPA6010B0 Silver, total recoverable <5.00 U 5.00 µg/L WA EPA6010B0 Sulfate 53.0 J I 6 340 µg/L WA EPA90560 Tin, total recoverable <70.0 U 70.0 µg/L WA EPA6010B0 Total dissolved solids <50,000 U 50,000 µg/L WA EPA160.10 Total organic carbon 125 J I 6 1,000 µg/L WA EPA90600 Total organic halogens <133 U 133 µg/L WA EPA9020B0 Zinc, total recoverable <53.0 U 53.0 µg/L WA EPA6010B0 Carbon-14 8.99E-09±1.80E-08 U 3.05E-08 µCi/mL GP EPIA-0030 Gross alpha 2.50E-10±5.10E-10 U 8.30E-10 µCi/mL TM EPA900.0M0 Nonvolatile beta -6.80E-10±9.20E-10 U 1.51E-09 µCi/mL TM EPA900.0M0 Radium, total alpha-emitting 9.10E-10±4.90E-10 U V 1.90E-10 µCi/mL TM EPA903.0M0 Radium-226 2.96E-10±2.53E-10 U 3.80E-10 µCi/mL GP EPIA-0080 Radium-228 3.75E-10±6.06E-10 U 1.03E-09 µCi/mL GP EPIA-0090 Radium-228 4.31E-10±7.18E-10 U 1.22E-09 µCi/mL GP EPIA-0090 Strontium-90 -3.41E-11±1.71E-10 U 3.93E-10 µCi/mL GP EPIA-0040 Tritium 5.00E-08±7.00E-07 U 1.23E-06 µCi/mL TM EPA906.0M
WELL QA 36DMEASUREMENTS CONDUCTED IN THE FIELD
Sample date: 11/28/00 Time: Not availableWater temperature: Not availableAir temperature: Not availablepH: Not available Total alkalinity (as CaCO3): Not availableSp. conductance: Not available Phenolphthalein alkalinity: Not availableTurbidity: Not availableNo water was evacuated from the well prior to sampling.
ANALYSES
F Analyte Result FG S EMS SQL Unit Lab Method
0 Alkalinity (as CaCO3) <6.70 U 6,700 mg/L WA EPA310.10 Antimony, total recoverable <27.0 U 27.0 µg/L WA EPA6010B0 Arsenic, total recoverable <40.0 U 40.0 µg/L WA EPA6010B0 Barium, total recoverable <0.720 U V 1.80 µg/L WA EPA6010B0 Boron, total recoverable <266 U 266 µg/L WA EPA6010B0 Cadmium, total recoverable <4.70 U 4.70 µg/L WA EPA6010B0 Chromium, total recoverable <0.980 JU 4 7.00 µg/L WA EPA6010B0 Copper, total recoverable <1.50 U V 15.0 µg/L WA EPA6010B0 Cyanide <15.2 U 15.2 µg/L WA EPA90140 Cyanide <15.2 U 15.2 µg/L WA EPA90140 Lead, total recoverable <47.0 U 47.0 µg/L WA EPA6010B0 Lithium, total recoverable <2.70 U 2.70 µg/L WA EPA6010B0 Mercury, total recoverable <0.700 U 0.700 µg/L WA EPA7470A0 Nickel, total recoverable <26.0 U 26.0 µg/L WA EPA6010B0 Nitrate-nitrite as nitrogen <20.0 U 20.0 µg/L WA EPA353.20 Phenols <37.0 U 37.0 µg/L WA EPA90660 Selenium, total recoverable <66.0 U 66.0 µg/L WA EPA6010B0 Silver, total recoverable <0.960 JU 4 5.00 µg/L WA EPA6010B0 Sulfate 176 J I 6 340 µg/L WA EPA90560 Tin, total recoverable <70.0 U 70.0 µg/L WA EPA6010B0 Total dissolved solids <50,000 U 50,000 µg/L WA EPA160.10 Total organic carbon <1,000 U 1,000 µg/L WA EPA90600 Total organic halogens <120 U 120 µg/L WA EPA9020B0 Zinc, total recoverable <53.0 U 53.0 µg/L WA EPA6010B0 Carbon-14 -8.32E-09±6.24E-09 U 1.13E-08 µCi/mL GP EPIA-0030 Gross alpha 7.60E-10±4.80E-10 J I 6 5.50E-10 µCi/mL TM EPA900.0M0 Nonvolatile beta 5.68E-09±1.24E-09 6 1.47E-09 µCi/mL TM EPA900.0M

SAMPLING BLANKS RESULTSSAMPLING BLANKS RESULTS
ESH-EMS-2000408ESH-EMS-2000408 C-C-66 Fourth Quarter 2000Fourth Quarter 2000
Well QA 36D collected on 11/28/00 (cont.)
F Analyte Result FG S EMS SQL Unit Lab Method
0 Radium, total alpha-emitting 1.11E-09±6.70E-10 U V 8.30E-10 µCi/mL TM EPA903.0M0 Radium-226 1.12E-09±6.19E-10 J IK I6 7.88E-10 µCi/mL GP EPIA-0080 Radium-228 3.94E-10±4.90E-10 U 9.92E-10 µCi/mL GP EPIA-0090 Strontium-90 -2.88E-10±2.08E-10 U 3.75E-10 µCi/mL GP EPIA-0040 Tritium -2.80E-07±7.30E-07 U 1.31E-06 µCi/mL TM EPA906.0M
WELL QA 38DMEASUREMENTS CONDUCTED IN THE FIELD
Sample date: 12/16/00 Time: Not availableWater temperature: Not availableAir temperature: Not availablepH: Not available Total alkalinity (as CaCO3): Not availableSp. conductance: Not available Phenolphthalein alkalinity: Not availableTurbidity: Not availableNo water was evacuated from the well prior to sampling.
ANALYSES
F Analyte Result FG S EMS SQL Unit Lab Method
0 Alkalinity (as CaCO3) <6.70 U 6,700 mg/L WA EPA310.10 Antimony, total recoverable <27.0 U 27.0 µg/L WA EPA6010B0 Arsenic, total recoverable <40.0 U 40.0 µg/L WA EPA6010B0 Barium, total recoverable 1.10 J I 6 1.80 µg/L WA EPA6010B0 Boron, total recoverable <266 U 266 µg/L WA EPA6010B0 Cadmium, total recoverable <4.70 U 4.70 µg/L WA EPA6010B0 Chromium, total recoverable <7.00 U 7.00 µg/L WA EPA6010B0 Copper, total recoverable <15.0 U 15.0 µg/L WA EPA6010B0 Cyanide <15.2 U 15.2 µg/L WA EPA90140 Lead, total recoverable <47.0 U 47.0 µg/L WA EPA6010B0 Lithium, total recoverable <2.70 U 2.70 µg/L WA EPA6010B0 Mercury, total recoverable <0.700 U 0.700 µg/L WA EPA7470A0 Nickel, total recoverable <26.0 U 26.0 µg/L WA EPA6010B0 Nitrate-nitrite as nitrogen <20.0 U 20.0 µg/L WA EPA353.20 Phenols <37.0 U 37.0 µg/L WA EPA90660 Selenium, total recoverable <66.0 U 66.0 µg/L WA EPA6010B0 Silver, total recoverable <5.00 U 5.00 µg/L WA EPA6010B0 Sulfate 256 J I 6 340 µg/L WA EPA90560 Tin, total recoverable <70.0 U 70.0 µg/L WA EPA6010B0 Total dissolved solids <50,000 U 50,000 µg/L WA EPA160.10 Total organic carbon <281 U V 1,000 µg/L WA EPA90600 Total organic halogens <133 U 133 µg/L WA EPA9020B0 Zinc, total recoverable <53.0 U 53.0 µg/L WA EPA6010B0 Carbon-14 1.45E-08±1.82E-08 U 3.07E-08 µCi/mL GP EPIA-0030 Gross alpha 8.50E-10±4.20E-10 J I 6 1.50E-10 µCi/mL TM EPA900.0M0 Nonvolatile beta 3.24E-09±6.40E-10 6 9.00E-11 µCi/mL TM EPA900.0M0 Radium, total alpha-emitting 2.27E-09±9.70E-10 U V 1.10E-09 µCi/mL TM EPA903.0M0 Radium-226 -1.30E-10±2.55E-10 U 6.12E-10 µCi/mL GP EPIA-0080 Radium-228 8.29E-10±5.44E-10 U 1.05E-09 µCi/mL GP EPIA-0090 Radium-228 1.06E-09±5.50E-10 U V 8.40E-10 µCi/mL TM EPA904.0M0 Strontium-90 -2.39E-10±2.69E-10 U 6.47E-10 µCi/mL GP EPIA-0040 Strontium-90 9.00E-10±1.06E-09 JU L C 1.77E-09 µCi/mL TM EMLSR02M0 Tritium 3.40E-07±8.10E-07 U 1.38E-06 µCi/mL TM EPA906.0M
WELL QA 40DMEASUREMENTS CONDUCTED IN THE FIELD
Sample date: 11/02/00 Time: 11:55Water temperature: 22.9°CAir temperature: 29.1°CpH: 6.3 Total alkalinity (as CaCO3): 1 mg/LSp. conductance: 1 µS/cm Phenolphthalein alkalinity: 0 mg/LTurbidity: 0 NTU
ANALYSES
F Analyte Result FG S EMS SQL Unit Lab Method
0 Alkalinity (as CaCO3) 2.10 J I 6 6,700 mg/L WA EPA310.10 Antimony, total recoverable <27.0 U 27.0 µg/L WA EPA6010B0 Arsenic, total recoverable <40.0 U 40.0 µg/L WA EPA6010B0 Barium, total recoverable <1.80 U 1.80 µg/L WA EPA6010B0 Boron, total recoverable <266 U 266 µg/L WA EPA6010B0 Cadmium, total recoverable <4.70 U 4.70 µg/L WA EPA6010B0 Chromium, total recoverable <7.00 U 7.00 µg/L WA EPA6010B
Well QA 40D collected on 11/02/00 (cont.)
F Analyte Result FG S EMS SQL Unit Lab Method
0 Copper, total recoverable <15.0 U 15.0 µg/L WA EPA6010B0 Cyanide <15.2 U 15.2 µg/L WA EPA90140 Cyanide <15.2 U 15.2 µg/L WA EPA90140 Lead, total recoverable <47.0 U 47.0 µg/L WA EPA6010B0 Lithium, total recoverable <2.70 U 2.70 µg/L WA EPA6010B0 Mercury, total recoverable <0.700 U 0.700 µg/L WA EPA7470A0 Nickel, total recoverable <26.0 U 26.0 µg/L WA EPA6010B0 Nitrate-nitrite as nitrogen <8.00 U V 20.0 µg/L WA EPA353.20 Phenols <37.0 U 37.0 µg/L WA EPA90660 Selenium, total recoverable <66.0 U 66.0 µg/L WA EPA6010B0 Silver, total recoverable <5.00 U 5.00 µg/L WA EPA6010B0 Sulfate <168 U V 340 µg/L WA EPA90560 Tin, total recoverable <70.0 U 70.0 µg/L WA EPA6010B0 Total dissolved solids 10,000 J I 6 50,000 µg/L WA EPA160.10 Total dissolved solids 10,000 J I 6 50,000 µg/L WA EPA160.10 Total organic carbon <1,000 U 1,000 µg/L WA EPA90600 Total organic halogens <120 U 120 µg/L WA EPA9020B0 Zinc, total recoverable <53.0 U 53.0 µg/L WA EPA6010B0 Carbon-14 3.14E-10±5.21E-09 U 9.02E-09 µCi/mL GP EPIA-0030 Gross alpha 2.00E-11±3.20E-10 U 6.00E-10 µCi/mL TM EPA900.0M0 Nonvolatile beta -4.00E-11±8.60E-10 U 1.37E-09 µCi/mL TM EPA900.0M0 Radium, total alpha-emitting 1.59E-09±7.70E-10 U V 9.60E-10 µCi/mL TM EPA903.0M0 Radium, total alpha-emitting 2.01E-09±7.70E-10 J I 6 8.30E-10 µCi/mL TM EPA903.0M0 Radium-226 1.42E-09±7.16E-10 J I 6 8.72E-10 µCi/mL GP EPIA-0080 Radium-228 1.31E-10±5.04E-10 U 9.33E-10 µCi/mL GP EPIA-0090 Radium-228 8.20E-10±6.50E-10 U 1.05E-09 µCi/mL TM EPA904.0M0 Radium-228 1.67E-09±6.80E-10 U V 9.90E-10 µCi/mL TM EPA904.0M0 Strontium-90 2.51E-11±4.11E-10 U 9.17E-10 µCi/mL GP EPIA-0040 Strontium-90 -1.14E-09±2.15E-09 JU L C 4.02E-09 µCi/mL TM EMLSR02M0 Tritium 1.00E-07±7.60E-07 U 1.33E-06 µCi/mL TM EPA906.0M
WELL QA 42DMEASUREMENTS CONDUCTED IN THE FIELD
Sample date: 11/06/00 Time: 10:53Water temperature: 19.9°CAir temperature: 20.4°CpH: 6.7 Total alkalinity (as CaCO3): 1 mg/LSp. conductance: 3 µS/cm Phenolphthalein alkalinity: 0 mg/LTurbidity: 0 NTU
ANALYSES
F Analyte Result FG S EMS SQL Unit Lab Method
0 Alkalinity (as CaCO3) <6.70 U 6,700 mg/L WA EPA310.10 Antimony, total recoverable <27.0 U 27.0 µg/L WA EPA6010B0 Arsenic, total recoverable <40.0 U 40.0 µg/L WA EPA6010B0 Barium, total recoverable <0.490 U V 1.80 µg/L WA EPA6010B0 Boron, total recoverable <266 U 266 µg/L WA EPA6010B0 Cadmium, total recoverable <4.70 U 4.70 µg/L WA EPA6010B0 Chromium, total recoverable <7.00 U 7.00 µg/L WA EPA6010B0 Copper, total recoverable <15.0 U 15.0 µg/L WA EPA6010B0 Cyanide <15.2 U 15.2 µg/L WA EPA90140 Lead, total recoverable <47.0 U 47.0 µg/L WA EPA6010B0 Lithium, total recoverable <2.70 U 2.70 µg/L WA EPA6010B0 Mercury, total recoverable <0.700 U 0.700 µg/L WA EPA7470A0 Nickel, total recoverable <26.0 U 26.0 µg/L WA EPA6010B0 Nitrate-nitrite as nitrogen <10.0 U V 40.0 µg/L WA EPA353.20 Phenols <37.0 U 37.0 µg/L WA EPA90660 Selenium, total recoverable <66.0 U 66.0 µg/L WA EPA6010B0 Silver, total recoverable <5.00 U 5.00 µg/L WA EPA6010B0 Sulfate 201 J I 6 340 µg/L WA EPA90560 Tin, total recoverable <70.0 U 70.0 µg/L WA EPA6010B0 Total dissolved solids <34,000 U V 50,000 µg/L WA EPA160.10 Total organic carbon 169 J I 6 1,000 µg/L WA EPA90600 Total organic halogens <120 U 120 µg/L WA EPA9020B0 Zinc, total recoverable <53.0 U 53.0 µg/L WA EPA6010B0 Carbon-14 5.27E-10±5.56E-09 U 9.60E-09 µCi/mL GP EPIA-0030 Gross alpha -8.00E-11±5.90E-10 U 1.05E-09 µCi/mL TM EPA900.0M0 Nonvolatile beta 1.90E-10±1.01E-09 U 1.59E-09 µCi/mL TM EPA900.0M0 Radium, total alpha-emitting 5.00E-10±4.10E-10 U 5.60E-10 µCi/mL TM EPA903.0M0 Radium-226 7.60E-11±2.79E-10 U 5.36E-10 µCi/mL GP EPIA-0080 Radium-228 2.13E-10±4.30E-10 JU L C 9.32E-10 µCi/mL GP EPIA-0090 Strontium-90 -2.89E-11±4.02E-10 U 9.83E-10 µCi/mL GP EPIA-0040 Tritium -1.10E-07±7.50E-07 U 1.32E-06 µCi/mL TM EPA906.0M

SAMPLING BLANKS RESULTSSAMPLING BLANKS RESULTS
ESH-EMS-2000408ESH-EMS-2000408 C-C-77 Fourth Quarter 2000Fourth Quarter 2000
WELL QA 44DMEASUREMENTS CONDUCTED IN THE FIELD
Sample date: 11/15/00 Time: 15:07Water temperature: 22.6°CAir temperature: 17.8°CpH: 5 Total alkalinity (as CaCO3): 0 mg/LSp. conductance: 1 µS/cm Phenolphthalein alkalinity: 0 mg/LTurbidity: 0 NTU
ANALYSES
F Analyte Result FG S EMS SQL Unit Lab Method
0 Alkalinity (as CaCO3) 2.05 J I 6 6,700 mg/L WA EPA310.10 Antimony, total recoverable <27.0 U 27.0 µg/L WA EPA6010B0 Arsenic, total recoverable <40.0 U 40.0 µg/L WA EPA6010B0 Barium, total recoverable <1.80 U 1.80 µg/L WA EPA6010B0 Boron, total recoverable <266 U 266 µg/L WA EPA6010B0 Cadmium, total recoverable <4.70 U 4.70 µg/L WA EPA6010B0 Chromium, total recoverable <7.00 U 7.00 µg/L WA EPA6010B0 Copper, total recoverable <15.0 U 15.0 µg/L WA EPA6010B0 Cyanide <15.2 JU Q 15.2 µg/L WA EPA90140 Lead, total recoverable <47.0 U 47.0 µg/L WA EPA6010B0 Lithium, total recoverable <0.300 U V 2.70 µg/L WA EPA6010B0 Mercury, total recoverable <0.700 U 0.700 µg/L WA EPA7470A0 Nickel, total recoverable <26.0 U 26.0 µg/L WA EPA6010B0 Nitrate-nitrite as nitrogen <20.0 U 20.0 µg/L WA EPA353.20 Phenols <37.0 U 37.0 µg/L WA EPA90660 Selenium, total recoverable <66.0 U 66.0 µg/L WA EPA6010B0 Silver, total recoverable <5.00 U 5.00 µg/L WA EPA6010B0 Sulfate 226 J I 6 340 µg/L WA EPA90560 Tin, total recoverable <70.0 U 70.0 µg/L WA EPA6010B0 Total dissolved solids <12,000 JU QV 50,000 µg/L WA EPA160.10 Total dissolved solids <11,000 JU QV 50,000 µg/L WA EPA160.10 Total organic carbon 107 J I 6 1,000 µg/L WA EPA90600 Total organic halogens <120 JU L I 120 µg/L WA EPA9020B0 Zinc, total recoverable <53.0 U 53.0 µg/L WA EPA6010B0 Carbon-14 5.14E-09±5.57E-09 U 9.32E-09 µCi/mL GP EPIA-0030 Gross alpha 1.00E-10±4.60E-10 U 8.10E-10 µCi/mL TM EPA900.0M0 Nonvolatile beta -4.00E-11±9.30E-10 U 1.50E-09 µCi/mL TM EPA900.0M1 Radium, total alpha-emitting 4.08E-09±1.69E-09 J I 6 1.52E-09 µCi/mL TM EPA903.0M1 Radium, total alpha-emitting 2.60E-09±1.39E-09 J I 6 1.52E-09 µCi/mL TM EPA903.0M0 Radium-226 9.22E-10±5.06E-10 J I 6 5.37E-10 µCi/mL GP EPIA-0080 Radium-228 4.13E-10±5.80E-10 U 1.23E-09 µCi/mL GP EPIA-0090 Strontium-90 5.09E-10±4.77E-10 U 9.78E-10 µCi/mL GP EPIA-0040 Tritium 4.40E-07±8.00E-07 U 1.36E-06 µCi/mL TM EPA906.0M
WELL QA 46DMEASUREMENTS CONDUCTED IN THE FIELD
Sample date: 11/07/00 Time: 10:29Water temperature: 24.3°CAir temperature: 27.2°CpH: 5.3 Total alkalinity (as CaCO3): 0 mg/LSp. conductance: 18 µS/cm Phenolphthalein alkalinity: 0 mg/LTurbidity: 0 NTU
ANALYSES
F Analyte Result FG S EMS SQL Unit Lab Method
0 Alkalinity (as CaCO3) <13.4 U 13,400 mg/L WA EPA310.10 Antimony, total recoverable <27.0 U 27.0 µg/L WA EPA6010B0 Arsenic, total recoverable <40.0 U 40.0 µg/L WA EPA6010B0 Barium, total recoverable <0.740 U V 1.80 µg/L WA EPA6010B0 Boron, total recoverable <266 U 266 µg/L WA EPA6010B0 Cadmium, total recoverable <4.70 U 4.70 µg/L WA EPA6010B0 Chromium, total recoverable <7.00 U 7.00 µg/L WA EPA6010B0 Copper, total recoverable <15.0 U 15.0 µg/L WA EPA6010B0 Cyanide <15.2 JU L I 15.2 µg/L WA EPA90140 Lead, total recoverable <47.0 U 47.0 µg/L WA EPA6010B0 Lithium, total recoverable <2.70 U 2.70 µg/L WA EPA6010B0 Mercury, total recoverable <0.700 U 0.700 µg/L WA EPA7470A0 Nickel, total recoverable <26.0 U 26.0 µg/L WA EPA6010B0 Nitrate-nitrite as nitrogen <20.0 U 20.0 µg/L WA EPA353.20 Phenols <37.0 U 37.0 µg/L WA EPA90660 Selenium, total recoverable <66.0 U 66.0 µg/L WA EPA6010B0 Silver, total recoverable <5.00 U 5.00 µg/L WA EPA6010B0 Sulfate 225 J I 6 340 µg/L WA EPA9056
Well QA 46D collected on 11/07/00 (cont.)
F Analyte Result FG S EMS SQL Unit Lab Method
0 Tin, total recoverable <70.0 U 70.0 µg/L WA EPA6010B0 Total dissolved solids <31,000 JU QV 50,000 µg/L WA EPA160.10 Total organic carbon 144 J IQ 6 1,000 µg/L WA EPA90600 Total organic halogens <120 U 120 µg/L WA EPA9020B0 Zinc, total recoverable <53.0 U 53.0 µg/L WA EPA6010B0 Carbon-14 3.15E-10±5.64E-09 U 9.75E-09 µCi/mL GP EPIA-0030 Gross alpha -3.30E-10±4.40E-10 U 9.00E-10 µCi/mL TM EPA900.0M0 Nonvolatile beta 2.20E-10±7.70E-10 U 1.20E-09 µCi/mL TM EPA900.0M0 Radium, total alpha-emitting 1.99E-09±9.30E-10 U V 1.15E-09 µCi/mL TM EPA903.0M0 Radium-226 1.02E-09±4.74E-10 J I 6 5.54E-10 µCi/mL GP EPIA-0080 Radium-228 -3.82E-10±4.05E-10 JU L C 9.93E-10 µCi/mL GP EPIA-0090 Radium-228 1.30E-10±6.20E-10 U 1.09E-09 µCi/mL TM EPA904.0M0 Strontium-90 5.82E-10±5.47E-10 U 1.14E-09 µCi/mL GP EPIA-0040 Strontium-90 -4.60E-10±6.30E-10 U 1.20E-09 µCi/mL TM EMLSR02M0 Tritium 6.00E-08±7.80E-07 U 1.36E-06 µCi/mL TM EPA906.0M
WELL QA 48DMEASUREMENTS CONDUCTED IN THE FIELD
Sample date: 11/09/00 Time: 13:26Water temperature: 25.1°CAir temperature: 25.7°CpH: 5.3 Total alkalinity (as CaCO3): 0 mg/LSp. conductance: 1 µS/cm Phenolphthalein alkalinity: 0 mg/LTurbidity: 0 NTU
ANALYSES
F Analyte Result FG S EMS SQL Unit Lab Method
0 Alkalinity (as CaCO3) 25.0 6 13,400 mg/L WA EPA310.10 Antimony, total recoverable <27.0 U 27.0 µg/L WA EPA6010B0 Arsenic, total recoverable <40.0 U 40.0 µg/L WA EPA6010B0 Barium, total recoverable 2.60 6 1.80 µg/L WA EPA6010B0 Boron, total recoverable <266 U 266 µg/L WA EPA6010B0 Cadmium, total recoverable <4.70 U 4.70 µg/L WA EPA6010B0 Chromium, total recoverable 1.20 J I 6 7.00 µg/L WA EPA6010B0 Copper, total recoverable <15.0 U 15.0 µg/L WA EPA6010B0 Cyanide <15.2 U 15.2 µg/L WA EPA90140 Cyanide <15.2 U 15.2 µg/L WA EPA90140 Lead, total recoverable <47.0 U 47.0 µg/L WA EPA6010B0 Lithium, total recoverable <1.40 U V 2.70 µg/L WA EPA6010B0 Mercury, total recoverable <0.700 U 0.700 µg/L WA EPA7470A0 Nickel, total recoverable <26.0 U 26.0 µg/L WA EPA6010B0 Nitrate-nitrite as nitrogen <20.0 U 20.0 µg/L WA EPA353.20 Phenols <37.0 U 37.0 µg/L WA EPA90660 Selenium, total recoverable <66.0 U 66.0 µg/L WA EPA6010B0 Silver, total recoverable <5.00 U 5.00 µg/L WA EPA6010B0 Sulfate 674 6 340 µg/L WA EPA90560 Tin, total recoverable <70.0 U 70.0 µg/L WA EPA6010B0 Total dissolved solids 52,000 J Q 6 50,000 µg/L WA EPA160.10 Total organic carbon 156 J I 6 1,000 µg/L WA EPA90600 Total organic halogens <120 JU Q 120 µg/L WA EPA9020B0 Total organic halogens <120 JU Q 120 µg/L WA EPA9020B0 Zinc, total recoverable <53.0 U 53.0 µg/L WA EPA6010B0 Carbon-14 3.93E-09±5.02E-09 U 8.45E-09 µCi/mL GP EPIA-0030 Radium-226 1.22E-09±5.17E-10 J IK I6 4.56E-10 µCi/mL GP EPIA-0080 Radium-228 8.33E-10±6.17E-10 U 1.20E-09 µCi/mL GP EPIA-0090 Strontium-90 3.53E-10±3.24E-10 U 6.64E-10 µCi/mL GP EPIA-0040 Strontium-90 2.98E-10±3.07E-10 U 6.32E-10 µCi/mL GP EPIA-004
WELL QA 48DMEASUREMENTS CONDUCTED IN THE FIELD
Sample date: 11/10/00 Time: Not availableWater temperature: Not availableAir temperature: Not availablepH: Not available Total alkalinity (as CaCO3): Not availableSp. conductance: Not available Phenolphthalein alkalinity: Not availableTurbidity: Not availableNo water was evacuated from the well prior to sampling.
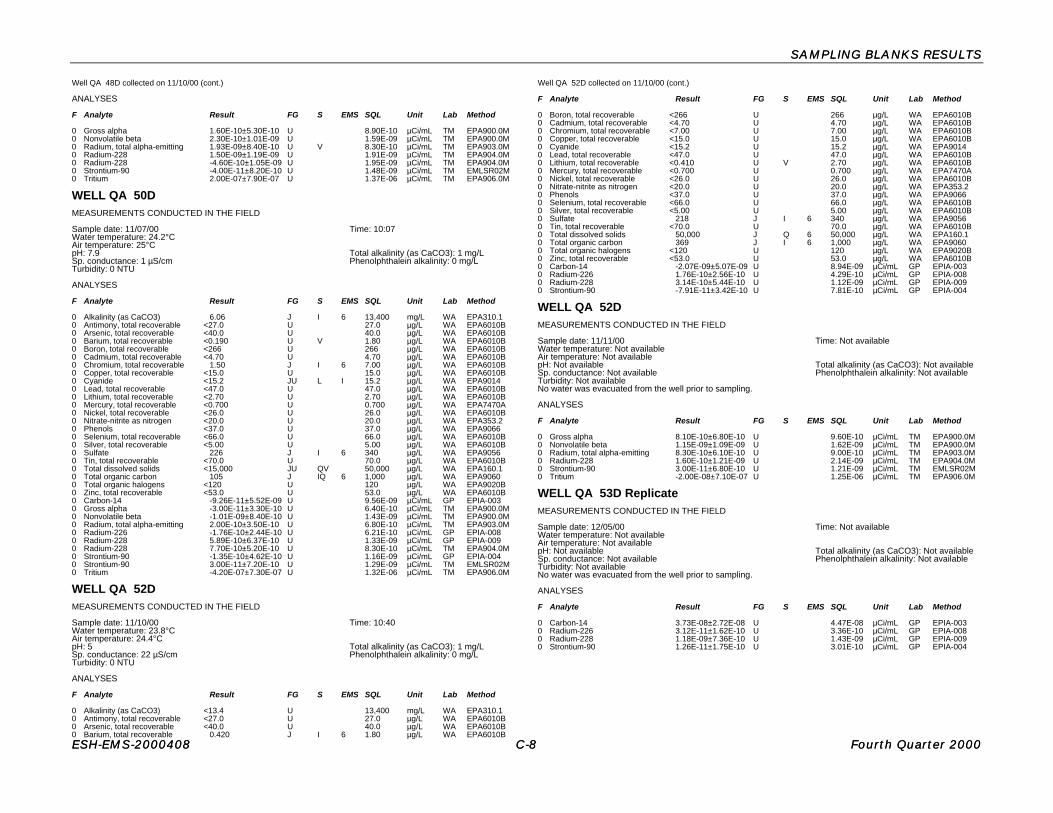
SAMPLING BLANKS RESULTSSAMPLING BLANKS RESULTS
ESH-EMS-2000408ESH-EMS-2000408 C-C-88 Fourth Quarter 2000Fourth Quarter 2000
Well QA 48D collected on 11/10/00 (cont.)
ANALYSES
F Analyte Result FG S EMS SQL Unit Lab Method
0 Gross alpha 1.60E-10±5.30E-10 U 8.90E-10 µCi/mL TM EPA900.0M0 Nonvolatile beta 2.30E-10±1.01E-09 U 1.59E-09 µCi/mL TM EPA900.0M0 Radium, total alpha-emitting 1.93E-09±8.40E-10 U V 8.30E-10 µCi/mL TM EPA903.0M0 Radium-228 1.50E-09±1.19E-09 U 1.91E-09 µCi/mL TM EPA904.0M0 Radium-228 -4.60E-10±1.05E-09 U 1.95E-09 µCi/mL TM EPA904.0M0 Strontium-90 -4.00E-11±8.20E-10 U 1.48E-09 µCi/mL TM EMLSR02M0 Tritium 2.00E-07±7.90E-07 U 1.37E-06 µCi/mL TM EPA906.0M
WELL QA 50DMEASUREMENTS CONDUCTED IN THE FIELD
Sample date: 11/07/00 Time: 10:07Water temperature: 24.2°CAir temperature: 25°CpH: 7.9 Total alkalinity (as CaCO3): 1 mg/LSp. conductance: 1 µS/cm Phenolphthalein alkalinity: 0 mg/LTurbidity: 0 NTU
ANALYSES
F Analyte Result FG S EMS SQL Unit Lab Method
0 Alkalinity (as CaCO3) 6.06 J I 6 13,400 mg/L WA EPA310.10 Antimony, total recoverable <27.0 U 27.0 µg/L WA EPA6010B0 Arsenic, total recoverable <40.0 U 40.0 µg/L WA EPA6010B0 Barium, total recoverable <0.190 U V 1.80 µg/L WA EPA6010B0 Boron, total recoverable <266 U 266 µg/L WA EPA6010B0 Cadmium, total recoverable <4.70 U 4.70 µg/L WA EPA6010B0 Chromium, total recoverable 1.50 J I 6 7.00 µg/L WA EPA6010B0 Copper, total recoverable <15.0 U 15.0 µg/L WA EPA6010B0 Cyanide <15.2 JU L I 15.2 µg/L WA EPA90140 Lead, total recoverable <47.0 U 47.0 µg/L WA EPA6010B0 Lithium, total recoverable <2.70 U 2.70 µg/L WA EPA6010B0 Mercury, total recoverable <0.700 U 0.700 µg/L WA EPA7470A0 Nickel, total recoverable <26.0 U 26.0 µg/L WA EPA6010B0 Nitrate-nitrite as nitrogen <20.0 U 20.0 µg/L WA EPA353.20 Phenols <37.0 U 37.0 µg/L WA EPA90660 Selenium, total recoverable <66.0 U 66.0 µg/L WA EPA6010B0 Silver, total recoverable <5.00 U 5.00 µg/L WA EPA6010B0 Sulfate 226 J I 6 340 µg/L WA EPA90560 Tin, total recoverable <70.0 U 70.0 µg/L WA EPA6010B0 Total dissolved solids <15,000 JU QV 50,000 µg/L WA EPA160.10 Total organic carbon 105 J IQ 6 1,000 µg/L WA EPA90600 Total organic halogens <120 U 120 µg/L WA EPA9020B0 Zinc, total recoverable <53.0 U 53.0 µg/L WA EPA6010B0 Carbon-14 -9.26E-11±5.52E-09 U 9.56E-09 µCi/mL GP EPIA-0030 Gross alpha -3.00E-11±3.30E-10 U 6.40E-10 µCi/mL TM EPA900.0M0 Nonvolatile beta -1.01E-09±8.40E-10 U 1.43E-09 µCi/mL TM EPA900.0M0 Radium, total alpha-emitting 2.00E-10±3.50E-10 U 6.80E-10 µCi/mL TM EPA903.0M0 Radium-226 -1.76E-10±2.44E-10 U 6.21E-10 µCi/mL GP EPIA-0080 Radium-228 5.89E-10±6.37E-10 U 1.33E-09 µCi/mL GP EPIA-0090 Radium-228 7.70E-10±5.20E-10 U 8.30E-10 µCi/mL TM EPA904.0M0 Strontium-90 -1.35E-10±4.62E-10 U 1.16E-09 µCi/mL GP EPIA-0040 Strontium-90 3.00E-11±7.20E-10 U 1.29E-09 µCi/mL TM EMLSR02M0 Tritium -4.20E-07±7.30E-07 U 1.32E-06 µCi/mL TM EPA906.0M
WELL QA 52DMEASUREMENTS CONDUCTED IN THE FIELD
Sample date: 11/10/00 Time: 10:40Water temperature: 23.8°CAir temperature: 24.4°CpH: 5 Total alkalinity (as CaCO3): 1 mg/LSp. conductance: 22 µS/cm Phenolphthalein alkalinity: 0 mg/LTurbidity: 0 NTU
ANALYSES
F Analyte Result FG S EMS SQL Unit Lab Method
0 Alkalinity (as CaCO3) <13.4 U 13,400 mg/L WA EPA310.10 Antimony, total recoverable <27.0 U 27.0 µg/L WA EPA6010B0 Arsenic, total recoverable <40.0 U 40.0 µg/L WA EPA6010B0 Barium, total recoverable 0.420 J I 6 1.80 µg/L WA EPA6010B
Well QA 52D collected on 11/10/00 (cont.)
F Analyte Result FG S EMS SQL Unit Lab Method
0 Boron, total recoverable <266 U 266 µg/L WA EPA6010B0 Cadmium, total recoverable <4.70 U 4.70 µg/L WA EPA6010B0 Chromium, total recoverable <7.00 U 7.00 µg/L WA EPA6010B0 Copper, total recoverable <15.0 U 15.0 µg/L WA EPA6010B0 Cyanide <15.2 U 15.2 µg/L WA EPA90140 Lead, total recoverable <47.0 U 47.0 µg/L WA EPA6010B0 Lithium, total recoverable <0.410 U V 2.70 µg/L WA EPA6010B0 Mercury, total recoverable <0.700 U 0.700 µg/L WA EPA7470A0 Nickel, total recoverable <26.0 U 26.0 µg/L WA EPA6010B0 Nitrate-nitrite as nitrogen <20.0 U 20.0 µg/L WA EPA353.20 Phenols <37.0 U 37.0 µg/L WA EPA90660 Selenium, total recoverable <66.0 U 66.0 µg/L WA EPA6010B0 Silver, total recoverable <5.00 U 5.00 µg/L WA EPA6010B0 Sulfate 218 J I 6 340 µg/L WA EPA90560 Tin, total recoverable <70.0 U 70.0 µg/L WA EPA6010B0 Total dissolved solids 50,000 J Q 6 50,000 µg/L WA EPA160.10 Total organic carbon 369 J I 6 1,000 µg/L WA EPA90600 Total organic halogens <120 U 120 µg/L WA EPA9020B0 Zinc, total recoverable <53.0 U 53.0 µg/L WA EPA6010B0 Carbon-14 -2.07E-09±5.07E-09 U 8.94E-09 µCi/mL GP EPIA-0030 Radium-226 1.76E-10±2.56E-10 U 4.29E-10 µCi/mL GP EPIA-0080 Radium-228 3.14E-10±5.44E-10 U 1.12E-09 µCi/mL GP EPIA-0090 Strontium-90 -7.91E-11±3.42E-10 U 7.81E-10 µCi/mL GP EPIA-004
WELL QA 52DMEASUREMENTS CONDUCTED IN THE FIELD
Sample date: 11/11/00 Time: Not availableWater temperature: Not availableAir temperature: Not availablepH: Not available Total alkalinity (as CaCO3): Not availableSp. conductance: Not available Phenolphthalein alkalinity: Not availableTurbidity: Not availableNo water was evacuated from the well prior to sampling.
ANALYSES
F Analyte Result FG S EMS SQL Unit Lab Method
0 Gross alpha 8.10E-10±6.80E-10 U 9.60E-10 µCi/mL TM EPA900.0M0 Nonvolatile beta 1.15E-09±1.09E-09 U 1.62E-09 µCi/mL TM EPA900.0M0 Radium, total alpha-emitting 8.30E-10±6.10E-10 U 9.00E-10 µCi/mL TM EPA903.0M0 Radium-228 1.60E-10±1.21E-09 U 2.14E-09 µCi/mL TM EPA904.0M0 Strontium-90 3.00E-11±6.80E-10 U 1.21E-09 µCi/mL TM EMLSR02M0 Tritium -2.00E-08±7.10E-07 U 1.25E-06 µCi/mL TM EPA906.0M
WELL QA 53D ReplicateMEASUREMENTS CONDUCTED IN THE FIELD
Sample date: 12/05/00 Time: Not availableWater temperature: Not availableAir temperature: Not availablepH: Not available Total alkalinity (as CaCO3): Not availableSp. conductance: Not available Phenolphthalein alkalinity: Not availableTurbidity: Not availableNo water was evacuated from the well prior to sampling.
ANALYSES
F Analyte Result FG S EMS SQL Unit Lab Method
0 Carbon-14 3.73E-08±2.72E-08 U 4.47E-08 µCi/mL GP EPIA-0030 Radium-226 3.12E-11±1.62E-10 U 3.36E-10 µCi/mL GP EPIA-0080 Radium-228 1.18E-09±7.36E-10 U 1.43E-09 µCi/mL GP EPIA-0090 Strontium-90 1.26E-11±1.75E-10 U 3.01E-10 µCi/mL GP EPIA-004

SAMPLING BLANKS RESULTSSAMPLING BLANKS RESULTS
ESH-EMS-2000408ESH-EMS-2000408 C-C-99 Fourth Quarter 2000Fourth Quarter 2000
WELL QA 54DMEASUREMENTS CONDUCTED IN THE FIELD
Sample date: 12/05/00 Time: Not availableWater temperature: Not availableAir temperature: Not availablepH: Not available Total alkalinity (as CaCO3): Not availableSp. conductance: Not available Phenolphthalein alkalinity: Not availableTurbidity: Not availableNo water was evacuated from the well prior to sampling.
ANALYSES
F Analyte Result FG S EMS SQL Unit Lab Method
0 Alkalinity (as CaCO3) <6.70 U 6,700 mg/L WA EPA310.10 Antimony, total recoverable <27.0 U 27.0 µg/L WA EPA6010B0 Arsenic, total recoverable <40.0 U 40.0 µg/L WA EPA6010B0 Barium, total recoverable <0.280 U V 1.80 µg/L WA EPA6010B0 Boron, total recoverable <266 U 266 µg/L WA EPA6010B0 Cadmium, total recoverable <4.70 U 4.70 µg/L WA EPA6010B0 Chromium, total recoverable <7.00 U 7.00 µg/L WA EPA6010B0 Copper, total recoverable <15.0 U 15.0 µg/L WA EPA6010B0 Cyanide <15.2 U 15.2 µg/L WA EPA90140 Lead, total recoverable <47.0 U 47.0 µg/L WA EPA6010B0 Lithium, total recoverable <2.70 U 2.70 µg/L WA EPA6010B0 Mercury, total recoverable <0.700 U 0.700 µg/L WA EPA7470A0 Nickel, total recoverable <26.0 U 26.0 µg/L WA EPA6010B0 Nitrate-nitrite as nitrogen 3.00 J I 6 20.0 µg/L WA EPA353.20 Phenols <37.0 U 37.0 µg/L WA EPA90660 Selenium, total recoverable <66.0 U 66.0 µg/L WA EPA6010B0 Silver, total recoverable <5.00 U 5.00 µg/L WA EPA6010B0 Sulfate 147 J I 6 340 µg/L WA EPA90560 Tin, total recoverable <70.0 U 70.0 µg/L WA EPA6010B0 Total dissolved solids <50,000 JU Q 50,000 µg/L WA EPA160.10 Total organic carbon <1,000 U 1,000 µg/L WA EPA90600 Total organic halogens <120 JU L I 120 µg/L WA EPA9020B0 Zinc, total recoverable <53.0 U 53.0 µg/L WA EPA6010B0 Carbon-14 9.28E-09±2.60E-08 U 4.45E-08 µCi/mL GP EPIA-0030 Gross alpha -3.00E-11±3.40E-10 U 3.80E-10 µCi/mL TM EPA900.0M0 Nonvolatile beta -7.00E-10±7.50E-10 U 7.60E-10 µCi/mL TM EPA900.0M0 Radium, total alpha-emitting 4.62E-09±1.30E-09 U V 9.90E-10 µCi/mL TM EPA903.0M0 Radium, total alpha-emitting 3.11E-09±1.03E-09 U V 9.40E-10 µCi/mL TM EPA903.0M0 Radium-226 7.49E-10±2.87E-10 J I 6 1.96E-10 µCi/mL GP EPIA-0080 Radium-228 4.24E-10±4.83E-10 U 9.89E-10 µCi/mL GP EPIA-0090 Radium-228 7.60E-10±6.60E-10 U 1.08E-09 µCi/mL TM EPA904.0M0 Strontium-90 -3.23E-10±2.01E-10 U 3.65E-10 µCi/mL GP EPIA-0040 Strontium-90 -3.44E-10±2.21E-10 U 4.00E-10 µCi/mL GP EPIA-0040 Strontium-90 -1.23E-09±1.09E-09 U 2.07E-09 µCi/mL TM EMLSR02M0 Tritium 1.30E-07±7.30E-07 U 1.27E-06 µCi/mL TM EPA906.0M
WELL QA 56DMEASUREMENTS CONDUCTED IN THE FIELD
Sample date: 11/09/00 Time: Not availableWater temperature: Not availableAir temperature: Not availablepH: Not available Total alkalinity (as CaCO3): Not availableSp. conductance: Not available Phenolphthalein alkalinity: Not availableTurbidity: Not availableNo water was evacuated from the well prior to sampling.
ANALYSES
F Analyte Result FG S EMS SQL Unit Lab Method
0 Arsenic, total recoverable <10.0 U 10.0 µg/L EX EPA6010B0 Barium, total recoverable <10.0 U 10.0 µg/L EX EPA6010B0 Cadmium, total recoverable <10.0 U 10.0 µg/L EX EPA6010B0 Chromium, total recoverable <10.0 U 10.0 µg/L EX EPA6010B0 Lead, total recoverable <10.0 U 10.0 µg/L EX EPA6010B0 Mercury, total recoverable <0.500 U 0.500 µg/L EX EPA7470A0 Selenium, total recoverable <10.0 U 10.0 µg/L EX EPA6010B0 Silver, total recoverable <20.0 U 20.0 µg/L EX EPA6010B0 Gross alpha -5.04E-10±1.62E-09 U 8.55E-09 µCi/mL ML EPIA-0010 Nonvolatile beta -9.48E-11±1.47E-09 U 6.56E-09 µCi/mL ML EPIA-0010 Tritium -2.86E-08±3.25E-07 U 5.78E-07 µCi/mL ML EPIA-002
WELL QA 58DMEASUREMENTS CONDUCTED IN THE FIELD
Sample date: 11/10/00 Time: Not availableWater temperature: Not availableAir temperature: Not availablepH: Not available Total alkalinity (as CaCO3): Not availableSp. conductance: Not available Phenolphthalein alkalinity: Not availableTurbidity: Not availableNo water was evacuated from the well prior to sampling.
ANALYSES
F Analyte Result FG S EMS SQL Unit Lab Method
0 Arsenic, total recoverable <10.0 U 10.0 µg/L EX EPA6010B0 Barium, total recoverable <10.0 U 10.0 µg/L EX EPA6010B0 Cadmium, total recoverable <10.0 U 10.0 µg/L EX EPA6010B0 Chromium, total recoverable <6.13 JU 4 10.0 µg/L EX EPA6010B0 Lead, total recoverable <10.0 U 10.0 µg/L EX EPA6010B0 Mercury, total recoverable <0.500 U 0.500 µg/L EX EPA7470A0 Selenium, total recoverable <10.0 U 10.0 µg/L EX EPA6010B0 Silver, total recoverable <20.0 U 20.0 µg/L EX EPA6010B0 Gross alpha 1.16E-09±1.99E-09 U 8.49E-09 µCi/mL ML EPIA-0010 Nonvolatile beta 3.99E-09±2.02E-09 U 6.55E-09 µCi/mL ML EPIA-0010 Tritium 2.69E-07±3.20E-07 U 5.36E-07 µCi/mL ML EPIA-002
WELL QA 60DMEASUREMENTS CONDUCTED IN THE FIELD
Sample date: 11/02/00 Time: Not availableWater temperature: Not availableAir temperature: Not availablepH: Not available Total alkalinity (as CaCO3): Not availableSp. conductance: Not available Phenolphthalein alkalinity: Not availableTurbidity: Not availableNo water was evacuated from the well prior to sampling.
ANALYSES
F Analyte Result FG S EMS SQL Unit Lab Method
0 Actinium-228 8.31E-09±7.68E-09 U 1.46E-08 µCi/mL GP EPIA-0130 Antimony-125 -1.71E-09±5.38E-09 U 9.04E-09 µCi/mL GP EPIA-0130 Bismuth-212 1.62E-09±2.78E-08 U 2.89E-08 µCi/mL GP EPIA-0130 Bismuth-214 6.82E-09±9.67E-09 U 8.99E-09 µCi/mL GP EPIA-0130 Cerium-144 2.66E-09±1.34E-08 U 2.31E-08 µCi/mL GP EPIA-0130 Cesium-134 5.45E-10±2.32E-09 U 3.47E-09 µCi/mL GP EPIA-0130 Cesium-137 2.07E-10±1.92E-09 U 3.31E-09 µCi/mL GP EPIA-0130 Cobalt-60 -6.88E-10±1.83E-09 U 3.16E-09 µCi/mL GP EPIA-0130 Europium-152 4.38E-10±5.88E-09 U 1.01E-08 µCi/mL GP EPIA-0130 Europium-154 -4.83E-10±5.16E-09 U 9.20E-09 µCi/mL GP EPIA-0130 Europium-155 -1.18E-10±7.20E-09 U 1.24E-08 µCi/mL GP EPIA-0130 Gross alpha -1.82E-10±2.42E-10 U 4.97E-10 µCi/mL GP EPIA-0010 Lead-212 1.88E-09±5.61E-09 U 6.89E-09 µCi/mL GP EPIA-0130 Potassium-40 5.13E-08±4.07E-08 J I 3.28E-08 µCi/mL GP EPIA-0130 Promethium-146 -6.99E-10±2.63E-09 U 4.41E-09 µCi/mL GP EPIA-0130 Radium-226 -5.93E-11±3.86E-10 U 8.38E-10 µCi/mL GP EPIA-0080 Thallium-208 3.01E-09±4.24E-09 U 4.40E-09 µCi/mL GP EPIA-0130 Thorium-228 1.09E-10±1.07E-10 U 1.83E-10 µCi/mL GP EPIA-0120 Thorium-230 -1.63E-10±7.60E-11 U 2.45E-10 µCi/mL GP EPIA-0120 Thorium-232 -2.82E-11±3.74E-11 U 1.31E-10 µCi/mL GP EPIA-0120 Uranium-233/234 3.60E-11±5.89E-11 U 1.08E-10 µCi/mL GP EPIA-0110 Uranium-235 -1.48E-11±1.72E-11 U 1.43E-10 µCi/mL GP EPIA-0110 Uranium-238 2.05E-11±4.10E-11 U 6.14E-11 µCi/mL GP EPIA-011
WELL QA 62DMEASUREMENTS CONDUCTED IN THE FIELD
Sample date: 10/30/00 Time: 11:13Water temperature: 22.3°CAir temperature: 21.9°CpH: 5.6 Total alkalinity (as CaCO3): 2 mg/LSp. conductance: 33 µS/cm Phenolphthalein alkalinity: 0 mg/LTurbidity: 0 NTU Field Qualifier(s): B

SAMPLING BLANKS RESULTSSAMPLING BLANKS RESULTS
ESH-EMS-2000408ESH-EMS-2000408 C-C-1010 Fourth Quarter 2000Fourth Quarter 2000
Well QA 62D collected on 10/30/00 (cont.)
ANALYSES
F Analyte Result FG S EMS SQL Unit Lab Method
0 Gross alpha 2.30E-10±3.90E-10 U 6.30E-10 µCi/mL TM EPA900.0M0 Nonvolatile beta 8.50E-10±9.90E-10 U 1.48E-09 µCi/mL TM EPA900.0M0 Strontium-90 2.00E-10±8.80E-10 U 1.56E-09 µCi/mL TM EMLSR02M0 Tritium -5.20E-07±7.90E-07 U 1.43E-06 µCi/mL TM EPA906.0M
WELL QA 64DMEASUREMENTS CONDUCTED IN THE FIELD
Sample date: 12/11/00 Time: 10:18Water temperature: 19.5°CAir temperature: 15.3°CpH: 6.6 Total alkalinity (as CaCO3): 0 mg/LSp. conductance: 0 µS/cm Phenolphthalein alkalinity: 0 mg/LTurbidity: 0 NTU
ANALYSES
F Analyte Result FG S EMS SQL Unit Lab Method
0 Gross alpha -2.90E-10±4.70E-10 U 9.40E-10 µCi/mL TM EPA900.0M0 Nonvolatile beta -1.00E-11±9.60E-10 U 1.52E-09 µCi/mL TM EPA900.0M0 Strontium-90 -3.40E-10±8.60E-10 U 1.58E-09 µCi/mL TM EMLSR02M0 Tritium -7.80E-07±9.10E-07 U 1.64E-06 µCi/mL TM EPA906.0M
WELL QA 72DMEASUREMENTS CONDUCTED IN THE FIELD
Sample date: 12/05/00 Time: Not availableWater temperature: Not availableAir temperature: Not availablepH: Not available Total alkalinity (as CaCO3): Not availableSp. conductance: Not available Phenolphthalein alkalinity: Not availableTurbidity: Not availableNo water was evacuated from the well prior to sampling.
ANALYSES
F Analyte Result FG S EMS SQL Unit Lab Method
0 Aluminum, total recoverable <200 U 200 µg/L EX EPA6010B0 Lead, total recoverable <10.0 U 10.0 µg/L EX EPA6010B0 Mercury, total recoverable <0.500 U 0.500 µg/L EX EPA7470A0 Nitrate-nitrite as nitrogen <1,000 U 1,000 µg/L EX EPA300.00 Uranium, total recoverable <50.0 U 50.0 µg/L GE EPA6010B0 Actinium-228 7.17E-09±1.12E-08 U 1.32E-08 µCi/mL GP EPIA-0130 Americium-241 0.00E+00±2.00E-09 U 9.24E-11 µCi/mL GP EPIA-0110 Antimony-125 -2.85E-10±4.72E-09 U 8.01E-09 µCi/mL GP EPIA-0130 Bismuth-212 1.59E-08±1.50E-08 U 2.71E-08 µCi/mL GP EPIA-0130 Bismuth-214 1.52E-09±5.71E-09 U 7.10E-09 µCi/mL GP EPIA-0130 Cesium-134 3.03E-10±1.97E-09 U 2.92E-09 µCi/mL GP EPIA-0130 Cesium-137 4.21E-09±4.96E-09 R 4 3.09E-09 µCi/mL GP EPIA-0130 Cobalt-60 5.24E-10±2.11E-09 U 3.31E-09 µCi/mL GP EPIA-0130 Curium-242 0.00E+00±2.00E-09 U 1.02E-10 µCi/mL GP EPIA-0110 Curium-243/244 -6.26E-11±9.84E-11 U 3.42E-10 µCi/mL GP EPIA-0110 Curium-245/246 3.57E-11±7.16E-11 U 1.07E-10 µCi/mL GP EPIA-0110 Europium-152 2.54E-09±5.98E-09 U 9.02E-09 µCi/mL GP EPIA-0130 Europium-154 -4.05E-09±4.86E-09 U 7.96E-09 µCi/mL GP EPIA-0130 Europium-155 -3.72E-09±6.40E-09 U 1.09E-08 µCi/mL GP EPIA-0130 Gross alpha -1.05E-10±2.91E-10 U 7.33E-10 µCi/mL GP EPIA-0010 Iodine-129 -1.48E-10±2.70E-10 U 4.78E-10 µCi/mL GP EPIA-0060 Lead-212 2.01E-09±6.42E-09 U 6.29E-09 µCi/mL GP EPIA-0130 Neptunium-237 -9.28E-12±1.86E-11 U 2.04E-10 µCi/mL GP EPIA-0320 Plutonium-238 -4.99E-11±1.79E-10 U 5.33E-10 µCi/mL GP EPIA-0110 Plutonium-239/240 4.99E-11±1.15E-10 U 2.71E-10 µCi/mL GP EPIA-0110 Potassium-40 4.59E-08±2.17E-08 R 4 4.36E-08 µCi/mL GP EPIA-0130 Promethium-146 -2.86E-10±2.25E-09 U 3.80E-09 µCi/mL GP EPIA-0130 Radium-226 5.42E-10±2.92E-10 J I 6 2.65E-10 µCi/mL GP EPIA-0080 Radium-226 3.05E-10±2.40E-10 U 3.29E-10 µCi/mL GP EPIA-0080 Radium-228 4.08E-10±4.87E-10 U 1.00E-09 µCi/mL GP EPIA-0090 Radon-222 2.82E-08±3.25E-08 U 5.45E-08 µCi/mL GP EPIA-0070 Strontium-90 -1.30E-10±2.17E-10 U 3.79E-10 µCi/mL GP EPIA-0040 Technetium-99 7.06E-10±8.68E-09 U 2.11E-08 µCi/mL GP EPIA-0050 Thallium-208 3.49E-09±2.02E-09 U 3.72E-09 µCi/mL GP EPIA-0130 Thorium-228 -8.96E-11±1.51E-10 U 3.59E-10 µCi/mL GP EPIA-012
Well QA 72D collected on 12/05/00 (cont.)
F Analyte Result FG S EMS SQL Unit Lab Method
0 Thorium-230 -2.18E-11±6.51E-11 U 1.82E-10 µCi/mL GP EPIA-0120 Thorium-232 6.99E-12±3.17E-11 U 8.91E-11 µCi/mL GP EPIA-0120 Uranium-233/234 1.08E-11±4.39E-11 U 1.29E-10 µCi/mL GP EPIA-0110 Uranium-235 -2.50E-11±2.26E-11 U 1.69E-10 µCi/mL GP EPIA-0110 Uranium-238 2.08E-11±4.16E-11 U 6.23E-11 µCi/mL GP EPIA-011
WELL QA 74CMEASUREMENTS CONDUCTED IN THE FIELD
Sample date: 10/02/00 Time: Not availableWater temperature: Not availableAir temperature: Not availablepH: Not available Total alkalinity (as CaCO3): Not availableSp. conductance: Not available Phenolphthalein alkalinity: Not availableTurbidity: Not availableNo water was evacuated from the well prior to sampling.
ANALYSES
F Analyte Result FG S EMS SQL Unit Lab Method
1 Aluminum, total recoverable 38.6 J I 6 200 µg/L EX EPA6010B0 Arsenic, total recoverable <10.0 U 10.0 µg/L EX EPA6010B0 Barium, total recoverable <10.0 U 10.0 µg/L EX EPA6010B0 Cadmium, total recoverable <10.0 U 10.0 µg/L EX EPA6010B0 Chromium, total recoverable <10.0 U 10.0 µg/L EX EPA6010B0 Iron, total recoverable <46.5 U V 200 µg/L EX EPA6010B0 Lead, total recoverable <10.0 U 10.0 µg/L EX EPA6010B0 Selenium, total recoverable <10.0 U 10.0 µg/L EX EPA6010B0 Silver, total recoverable <20.0 U 20.0 µg/L EX EPA6010B0 Gross alpha 1.16E-09±1.99E-09 JU L C 8.50E-09 µCi/mL ML EPIA-0010 Tritium 5.06E-08±3.98E-07 U 5.72E-07 µCi/mL ML EPIA-002
WELL QA 74DMEASUREMENTS CONDUCTED IN THE FIELD
Sample date: 11/17/00 Time: 11:43Water temperature: 22.8°CAir temperature: 14.1°CpH: 7.2 Total alkalinity (as CaCO3): 1 mg/LSp. conductance: 1 µS/cm Phenolphthalein alkalinity: 0 mg/LTurbidity: 0 NTU
ANALYSES
F Analyte Result FG S EMS SQL Unit Lab Method
0 Gross alpha -1.60E-10±4.50E-10 U 8.70E-10 µCi/mL TM EPA900.0M
WELL QA 76DMEASUREMENTS CONDUCTED IN THE FIELD
Sample date: 11/16/00 Time: Not availableWater temperature: Not availableAir temperature: Not availablepH: Not available Total alkalinity (as CaCO3): Not availableSp. conductance: Not available Phenolphthalein alkalinity: Not availableTurbidity: Not availableNo water was evacuated from the well prior to sampling.
ANALYSES
F Analyte Result FG S EMS SQL Unit Lab Method
0 Aluminum, total recoverable <32.3 U V 200 µg/L EX EPA6010B0 Lead, total recoverable <10.0 U 10.0 µg/L EX EPA6010B0 Mercury, total recoverable <0.500 U 0.500 µg/L EX EPA7470A0 Nitrate-nitrite as nitrogen <1,000 U 1,000 µg/L EX EPA300.00 Nitrate-nitrite as nitrogen <1,000 U 1,000 µg/L EX EPA300.00 Gross alpha -3.70E-10±5.90E-10 U 1.11E-09 µCi/mL TM EPA900.0M

SAMPLING BLANKS RESULTSSAMPLING BLANKS RESULTS
ESH-EMS-2000408ESH-EMS-2000408 C-C-1111 Fourth Quarter 2000Fourth Quarter 2000
WELL QA 82BMEASUREMENTS CONDUCTED IN THE FIELD
Sample date: 10/25/00 Time: Not availableWater temperature: Not availableAir temperature: Not availablepH: Not available Total alkalinity (as CaCO3): Not availableSp. conductance: Not available Phenolphthalein alkalinity: Not availableTurbidity: Not availableNo water was evacuated from the well prior to sampling.
ANALYSES
F Analyte Result FG S EMS SQL Unit Lab Method
0 Carbon-14 7.32E-09±5.38E-09 U 8.85E-09 µCi/mL GP EPIA-0030 Nonvolatile beta 1.70E-09±1.16E-09 J I 6 1.69E-09 µCi/mL TM EPA900.0M0 Tritium 2.70E-07±8.10E-07 U 1.38E-06 µCi/mL TM EPA906.0M
WELL QA 82DMEASUREMENTS CONDUCTED IN THE FIELD
Sample date: 12/12/00 Time: Not availableWater temperature: Not availableAir temperature: Not availablepH: Not available Total alkalinity (as CaCO3): Not availableSp. conductance: Not available Phenolphthalein alkalinity: Not availableTurbidity: Not availableNo water was evacuated from the well prior to sampling.
ANALYSES
F Analyte Result FG S EMS SQL Unit Lab Method
0 Lead, total recoverable <10.0 U 10.0 µg/L EX EPA6010B
WELL TRP100DMEASUREMENTS CONDUCTED IN THE FIELD
Sample date: 10/10/00 Time: Not availableWater temperature: Not availableAir temperature: Not availablepH: Not available Total alkalinity (as CaCO3): Not availableSp. conductance: Not available Phenolphthalein alkalinity: Not availableTurbidity: Not availableNo water was evacuated from the well prior to sampling.
ANALYSES
F Analyte Result FG S EMS SQL Unit Lab Method
0 Benzene <1.00 U 1.00 µg/L GE EPA8260B0 Bromodichloromethane <1.00 U 1.00 µg/L GE EPA8260B0 Bromoform <1.00 U 1.00 µg/L GE EPA8260B0 Bromomethane <1.00 U 1.00 µg/L GE EPA8260B0 Carbon tetrachloride <1.00 U 1.00 µg/L GE EPA8260B0 Chlorobenzene <1.00 U 1.00 µg/L GE EPA8260B0 Chloroethane <1.00 U 1.00 µg/L GE EPA8260B0 Chloroethene (Vinyl chloride) <1.00 U 1.00 µg/L GE EPA8260B0 2-Chloroethyl vinyl ether <5.00 U 5.00 µg/L GE EPA8260B0 Chloroform <1.00 U 1.00 µg/L GE EPA8260B0 Chloromethane <1.00 U 1.00 µg/L GE EPA8260B0 Dibromochloromethane <1.00 U 1.00 µg/L GE EPA8260B0 1,1-Dichloroethane <1.00 U 1.00 µg/L GE EPA8260B0 1,2-Dichloroethane <1.00 U 1.00 µg/L GE EPA8260B0 1,1-Dichloroethylene <1.00 U 1.00 µg/L GE EPA8260B0 trans-1,2-Dichloroethylene <1.00 U 1.00 µg/L GE EPA8260B0 Dichloromethane <1.59 U V 5.00 µg/L GE EPA8260B0 1,2-Dichloropropane <1.00 U 1.00 µg/L GE EPA8260B0 cis-1,3-Dichloropropene <1.00 U 1.00 µg/L GE EPA8260B0 trans-1,3-Dichloropropene <1.00 U 1.00 µg/L GE EPA8260B0 Ethylbenzene <1.00 U 1.00 µg/L GE EPA8260B0 1,1,2,2-Tetrachloroethane <1.00 U 1.00 µg/L GE EPA8260B0 Tetrachloroethylene <1.00 U 1.00 µg/L GE EPA8260B0 Toluene <1.00 U 1.00 µg/L GE EPA8260B0 1,1,1-Trichloroethane <1.00 U 1.00 µg/L GE EPA8260B0 1,1,2-Trichloroethane <1.00 U 1.00 µg/L GE EPA8260B0 Trichloroethylene <1.00 U 1.00 µg/L GE EPA8260B0 Trichlorofluoromethane <1.00 U 1.00 µg/L GE EPA8260B
WELL TRP101DMEASUREMENTS CONDUCTED IN THE FIELD
Sample date: 10/12/00 Time: Not availableWater temperature: Not availableAir temperature: Not availablepH: Not available Total alkalinity (as CaCO3): Not availableSp. conductance: Not available Phenolphthalein alkalinity: Not availableTurbidity: Not availableNo water was evacuated from the well prior to sampling.
ANALYSES
F Analyte Result FG S EMS SQL Unit Lab Method
0 Benzene <1.00 U 1.00 µg/L GE EPA8260B0 Bromodichloromethane <1.00 U 1.00 µg/L GE EPA8260B0 Bromoform <1.00 U 1.00 µg/L GE EPA8260B0 Bromomethane <1.00 U 1.00 µg/L GE EPA8260B0 Carbon tetrachloride <1.00 U 1.00 µg/L GE EPA8260B0 Chlorobenzene <1.00 U 1.00 µg/L GE EPA8260B0 Chloroethane <1.00 U 1.00 µg/L GE EPA8260B0 Chloroethene (Vinyl chloride) <1.00 U 1.00 µg/L GE EPA8260B0 2-Chloroethyl vinyl ether <5.00 U 5.00 µg/L GE EPA8260B0 Chloroform <1.00 U 1.00 µg/L GE EPA8260B0 Chloromethane <1.00 U 1.00 µg/L GE EPA8260B0 Dibromochloromethane <1.00 U 1.00 µg/L GE EPA8260B0 1,1-Dichloroethane <1.00 U 1.00 µg/L GE EPA8260B0 1,2-Dichloroethane <1.00 U 1.00 µg/L GE EPA8260B0 1,1-Dichloroethylene <1.00 U 1.00 µg/L GE EPA8260B0 trans-1,2-Dichloroethylene <1.00 U 1.00 µg/L GE EPA8260B0 Dichloromethane <1.69 U V 5.00 µg/L GE EPA8260B0 1,2-Dichloropropane <1.00 U 1.00 µg/L GE EPA8260B0 cis-1,3-Dichloropropene <1.00 U 1.00 µg/L GE EPA8260B0 trans-1,3-Dichloropropene <1.00 U 1.00 µg/L GE EPA8260B0 Ethylbenzene <1.00 U 1.00 µg/L GE EPA8260B0 1,1,2,2-Tetrachloroethane <1.00 U 1.00 µg/L GE EPA8260B0 Tetrachloroethylene <1.00 U 1.00 µg/L GE EPA8260B0 Toluene <1.00 U 1.00 µg/L GE EPA8260B0 1,1,1-Trichloroethane <1.00 U 1.00 µg/L GE EPA8260B0 1,1,2-Trichloroethane <1.00 U 1.00 µg/L GE EPA8260B0 Trichloroethylene <1.00 U 1.00 µg/L GE EPA8260B0 Trichlorofluoromethane <1.00 U 1.00 µg/L GE EPA8260B
WELL TRP102DMEASUREMENTS CONDUCTED IN THE FIELD
Sample date: 11/03/00 Time: Not availableWater temperature: Not availableAir temperature: Not availablepH: Not available Total alkalinity (as CaCO3): Not availableSp. conductance: Not available Phenolphthalein alkalinity: Not availableTurbidity: Not availableNo water was evacuated from the well prior to sampling.
ANALYSES
F Analyte Result FG S EMS SQL Unit Lab Method
0 Benzene <1.00 U 1.00 µg/L GE EPA8260B0 Bromodichloromethane <1.00 U 1.00 µg/L GE EPA8260B0 Bromoform <1.00 U 1.00 µg/L GE EPA8260B0 Bromomethane <1.00 U 1.00 µg/L GE EPA8260B0 Carbon tetrachloride <1.00 U 1.00 µg/L GE EPA8260B0 Chlorobenzene <1.00 U 1.00 µg/L GE EPA8260B0 Chloroethane <1.00 U 1.00 µg/L GE EPA8260B0 Chloroethene (Vinyl chloride) <1.00 U 1.00 µg/L GE EPA8260B0 2-Chloroethyl vinyl ether <5.00 U 5.00 µg/L GE EPA8260B0 Chloroform <1.00 U 1.00 µg/L GE EPA8260B0 Chloromethane <1.00 U 1.00 µg/L GE EPA8260B0 Dibromochloromethane <1.00 U 1.00 µg/L GE EPA8260B0 1,1-Dichloroethane <1.00 U 1.00 µg/L GE EPA8260B0 1,2-Dichloroethane <1.00 U 1.00 µg/L GE EPA8260B0 1,1-Dichloroethylene <1.00 U 1.00 µg/L GE EPA8260B0 trans-1,2-Dichloroethylene <1.00 U 1.00 µg/L GE EPA8260B0 Dichloromethane <5.00 U 5.00 µg/L GE EPA8260B0 1,2-Dichloropropane <1.00 U 1.00 µg/L GE EPA8260B0 cis-1,3-Dichloropropene <1.00 U 1.00 µg/L GE EPA8260B0 trans-1,3-Dichloropropene <1.00 U 1.00 µg/L GE EPA8260B0 Ethylbenzene <1.00 U 1.00 µg/L GE EPA8260B
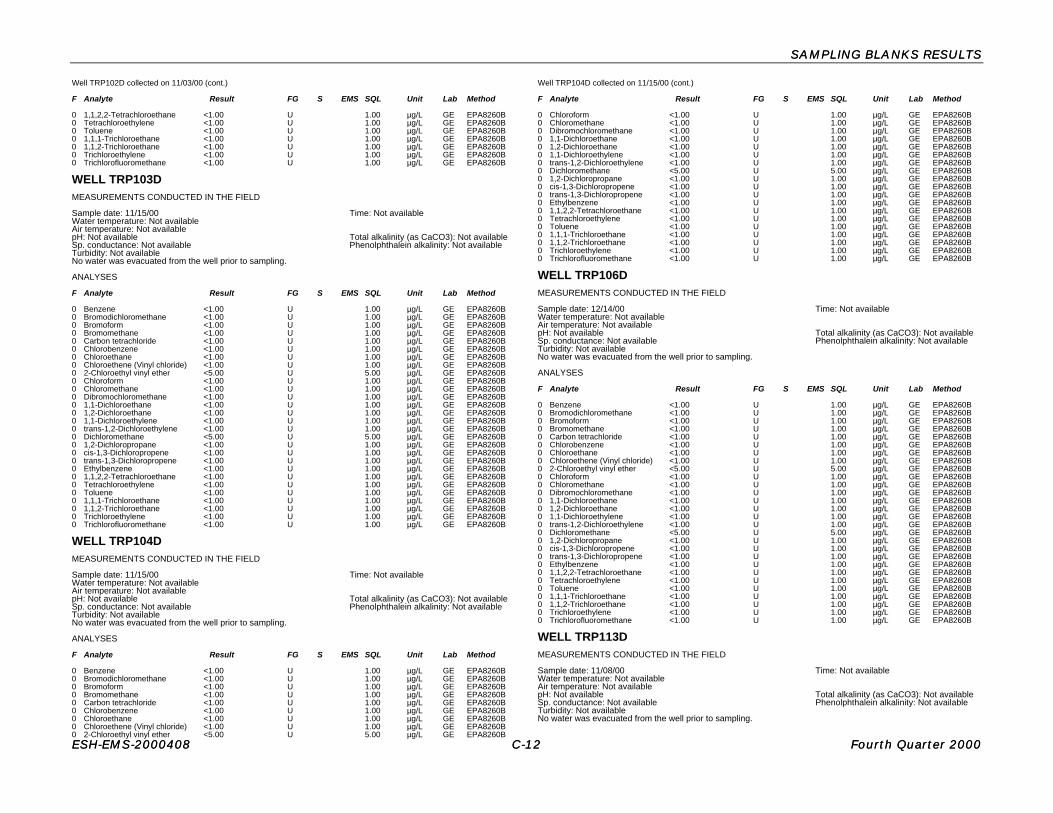
SAMPLING BLANKS RESULTSSAMPLING BLANKS RESULTS
ESH-EMS-2000408ESH-EMS-2000408 C-C-1212 Fourth Quarter 2000Fourth Quarter 2000
Well TRP102D collected on 11/03/00 (cont.)
F Analyte Result FG S EMS SQL Unit Lab Method
0 1,1,2,2-Tetrachloroethane <1.00 U 1.00 µg/L GE EPA8260B0 Tetrachloroethylene <1.00 U 1.00 µg/L GE EPA8260B0 Toluene <1.00 U 1.00 µg/L GE EPA8260B0 1,1,1-Trichloroethane <1.00 U 1.00 µg/L GE EPA8260B0 1,1,2-Trichloroethane <1.00 U 1.00 µg/L GE EPA8260B0 Trichloroethylene <1.00 U 1.00 µg/L GE EPA8260B0 Trichlorofluoromethane <1.00 U 1.00 µg/L GE EPA8260B
WELL TRP103DMEASUREMENTS CONDUCTED IN THE FIELD
Sample date: 11/15/00 Time: Not availableWater temperature: Not availableAir temperature: Not availablepH: Not available Total alkalinity (as CaCO3): Not availableSp. conductance: Not available Phenolphthalein alkalinity: Not availableTurbidity: Not availableNo water was evacuated from the well prior to sampling.
ANALYSES
F Analyte Result FG S EMS SQL Unit Lab Method
0 Benzene <1.00 U 1.00 µg/L GE EPA8260B0 Bromodichloromethane <1.00 U 1.00 µg/L GE EPA8260B0 Bromoform <1.00 U 1.00 µg/L GE EPA8260B0 Bromomethane <1.00 U 1.00 µg/L GE EPA8260B0 Carbon tetrachloride <1.00 U 1.00 µg/L GE EPA8260B0 Chlorobenzene <1.00 U 1.00 µg/L GE EPA8260B0 Chloroethane <1.00 U 1.00 µg/L GE EPA8260B0 Chloroethene (Vinyl chloride) <1.00 U 1.00 µg/L GE EPA8260B0 2-Chloroethyl vinyl ether <5.00 U 5.00 µg/L GE EPA8260B0 Chloroform <1.00 U 1.00 µg/L GE EPA8260B0 Chloromethane <1.00 U 1.00 µg/L GE EPA8260B0 Dibromochloromethane <1.00 U 1.00 µg/L GE EPA8260B0 1,1-Dichloroethane <1.00 U 1.00 µg/L GE EPA8260B0 1,2-Dichloroethane <1.00 U 1.00 µg/L GE EPA8260B0 1,1-Dichloroethylene <1.00 U 1.00 µg/L GE EPA8260B0 trans-1,2-Dichloroethylene <1.00 U 1.00 µg/L GE EPA8260B0 Dichloromethane <5.00 U 5.00 µg/L GE EPA8260B0 1,2-Dichloropropane <1.00 U 1.00 µg/L GE EPA8260B0 cis-1,3-Dichloropropene <1.00 U 1.00 µg/L GE EPA8260B0 trans-1,3-Dichloropropene <1.00 U 1.00 µg/L GE EPA8260B0 Ethylbenzene <1.00 U 1.00 µg/L GE EPA8260B0 1,1,2,2-Tetrachloroethane <1.00 U 1.00 µg/L GE EPA8260B0 Tetrachloroethylene <1.00 U 1.00 µg/L GE EPA8260B0 Toluene <1.00 U 1.00 µg/L GE EPA8260B0 1,1,1-Trichloroethane <1.00 U 1.00 µg/L GE EPA8260B0 1,1,2-Trichloroethane <1.00 U 1.00 µg/L GE EPA8260B0 Trichloroethylene <1.00 U 1.00 µg/L GE EPA8260B0 Trichlorofluoromethane <1.00 U 1.00 µg/L GE EPA8260B
WELL TRP104DMEASUREMENTS CONDUCTED IN THE FIELD
Sample date: 11/15/00 Time: Not availableWater temperature: Not availableAir temperature: Not availablepH: Not available Total alkalinity (as CaCO3): Not availableSp. conductance: Not available Phenolphthalein alkalinity: Not availableTurbidity: Not availableNo water was evacuated from the well prior to sampling.
ANALYSES
F Analyte Result FG S EMS SQL Unit Lab Method
0 Benzene <1.00 U 1.00 µg/L GE EPA8260B0 Bromodichloromethane <1.00 U 1.00 µg/L GE EPA8260B0 Bromoform <1.00 U 1.00 µg/L GE EPA8260B0 Bromomethane <1.00 U 1.00 µg/L GE EPA8260B0 Carbon tetrachloride <1.00 U 1.00 µg/L GE EPA8260B0 Chlorobenzene <1.00 U 1.00 µg/L GE EPA8260B0 Chloroethane <1.00 U 1.00 µg/L GE EPA8260B0 Chloroethene (Vinyl chloride) <1.00 U 1.00 µg/L GE EPA8260B0 2-Chloroethyl vinyl ether <5.00 U 5.00 µg/L GE EPA8260B
Well TRP104D collected on 11/15/00 (cont.)
F Analyte Result FG S EMS SQL Unit Lab Method
0 Chloroform <1.00 U 1.00 µg/L GE EPA8260B0 Chloromethane <1.00 U 1.00 µg/L GE EPA8260B0 Dibromochloromethane <1.00 U 1.00 µg/L GE EPA8260B0 1,1-Dichloroethane <1.00 U 1.00 µg/L GE EPA8260B0 1,2-Dichloroethane <1.00 U 1.00 µg/L GE EPA8260B0 1,1-Dichloroethylene <1.00 U 1.00 µg/L GE EPA8260B0 trans-1,2-Dichloroethylene <1.00 U 1.00 µg/L GE EPA8260B0 Dichloromethane <5.00 U 5.00 µg/L GE EPA8260B0 1,2-Dichloropropane <1.00 U 1.00 µg/L GE EPA8260B0 cis-1,3-Dichloropropene <1.00 U 1.00 µg/L GE EPA8260B0 trans-1,3-Dichloropropene <1.00 U 1.00 µg/L GE EPA8260B0 Ethylbenzene <1.00 U 1.00 µg/L GE EPA8260B0 1,1,2,2-Tetrachloroethane <1.00 U 1.00 µg/L GE EPA8260B0 Tetrachloroethylene <1.00 U 1.00 µg/L GE EPA8260B0 Toluene <1.00 U 1.00 µg/L GE EPA8260B0 1,1,1-Trichloroethane <1.00 U 1.00 µg/L GE EPA8260B0 1,1,2-Trichloroethane <1.00 U 1.00 µg/L GE EPA8260B0 Trichloroethylene <1.00 U 1.00 µg/L GE EPA8260B0 Trichlorofluoromethane <1.00 U 1.00 µg/L GE EPA8260B
WELL TRP106DMEASUREMENTS CONDUCTED IN THE FIELD
Sample date: 12/14/00 Time: Not availableWater temperature: Not availableAir temperature: Not availablepH: Not available Total alkalinity (as CaCO3): Not availableSp. conductance: Not available Phenolphthalein alkalinity: Not availableTurbidity: Not availableNo water was evacuated from the well prior to sampling.
ANALYSES
F Analyte Result FG S EMS SQL Unit Lab Method
0 Benzene <1.00 U 1.00 µg/L GE EPA8260B0 Bromodichloromethane <1.00 U 1.00 µg/L GE EPA8260B0 Bromoform <1.00 U 1.00 µg/L GE EPA8260B0 Bromomethane <1.00 U 1.00 µg/L GE EPA8260B0 Carbon tetrachloride <1.00 U 1.00 µg/L GE EPA8260B0 Chlorobenzene <1.00 U 1.00 µg/L GE EPA8260B0 Chloroethane <1.00 U 1.00 µg/L GE EPA8260B0 Chloroethene (Vinyl chloride) <1.00 U 1.00 µg/L GE EPA8260B0 2-Chloroethyl vinyl ether <5.00 U 5.00 µg/L GE EPA8260B0 Chloroform <1.00 U 1.00 µg/L GE EPA8260B0 Chloromethane <1.00 U 1.00 µg/L GE EPA8260B0 Dibromochloromethane <1.00 U 1.00 µg/L GE EPA8260B0 1,1-Dichloroethane <1.00 U 1.00 µg/L GE EPA8260B0 1,2-Dichloroethane <1.00 U 1.00 µg/L GE EPA8260B0 1,1-Dichloroethylene <1.00 U 1.00 µg/L GE EPA8260B0 trans-1,2-Dichloroethylene <1.00 U 1.00 µg/L GE EPA8260B0 Dichloromethane <5.00 U 5.00 µg/L GE EPA8260B0 1,2-Dichloropropane <1.00 U 1.00 µg/L GE EPA8260B0 cis-1,3-Dichloropropene <1.00 U 1.00 µg/L GE EPA8260B0 trans-1,3-Dichloropropene <1.00 U 1.00 µg/L GE EPA8260B0 Ethylbenzene <1.00 U 1.00 µg/L GE EPA8260B0 1,1,2,2-Tetrachloroethane <1.00 U 1.00 µg/L GE EPA8260B0 Tetrachloroethylene <1.00 U 1.00 µg/L GE EPA8260B0 Toluene <1.00 U 1.00 µg/L GE EPA8260B0 1,1,1-Trichloroethane <1.00 U 1.00 µg/L GE EPA8260B0 1,1,2-Trichloroethane <1.00 U 1.00 µg/L GE EPA8260B0 Trichloroethylene <1.00 U 1.00 µg/L GE EPA8260B0 Trichlorofluoromethane <1.00 U 1.00 µg/L GE EPA8260B
WELL TRP113DMEASUREMENTS CONDUCTED IN THE FIELD
Sample date: 11/08/00 Time: Not availableWater temperature: Not availableAir temperature: Not availablepH: Not available Total alkalinity (as CaCO3): Not availableSp. conductance: Not available Phenolphthalein alkalinity: Not availableTurbidity: Not availableNo water was evacuated from the well prior to sampling.

SAMPLING BLANKS RESULTSSAMPLING BLANKS RESULTS
ESH-EMS-2000408ESH-EMS-2000408 C-C-1313 Fourth Quarter 2000Fourth Quarter 2000
Well TRP113D collected on 11/08/00 (cont.)
ANALYSES
F Analyte Result FG S EMS SQL Unit Lab Method
0 Benzene <5.00 U 5.00 µg/L EX EPA8260B0 Bromodichloromethane <5.00 U 5.00 µg/L EX EPA8260B0 Bromoform <5.00 U 5.00 µg/L EX EPA8260B0 Bromomethane <5.00 U 5.00 µg/L EX EPA8260B0 Carbon tetrachloride <5.00 U 5.00 µg/L EX EPA8260B0 Chlorobenzene <5.00 U 5.00 µg/L EX EPA8260B0 Chloroethane <5.00 U 5.00 µg/L EX EPA8260B0 Chloroethene (Vinyl chloride) <5.00 U 5.00 µg/L EX EPA8260B0 2-Chloroethyl vinyl ether <5.00 U 5.00 µg/L EX EPA8260B0 Chloroform <5.00 U 5.00 µg/L EX EPA8260B0 Chloromethane <5.00 U 5.00 µg/L EX EPA8260B0 Dibromochloromethane <5.00 U 5.00 µg/L EX EPA8260B0 1,1-Dichloroethane <5.00 U 5.00 µg/L EX EPA8260B0 1,2-Dichloroethane <5.00 U 5.00 µg/L EX EPA8260B0 1,1-Dichloroethylene <5.00 U 5.00 µg/L EX EPA8260B0 cis-1,2-Dichloroethylene <5.00 U 5.00 µg/L EX EPA8260B0 trans-1,2-Dichloroethylene <5.00 U 5.00 µg/L EX EPA8260B0 Dichloromethane <1.70 U V 10.0 µg/L EX EPA8260B0 1,2-Dichloropropane <5.00 U 5.00 µg/L EX EPA8260B0 cis-1,3-Dichloropropene <5.00 U 5.00 µg/L EX EPA8260B0 trans-1,3-Dichloropropene <5.00 U 5.00 µg/L EX EPA8260B0 Ethylbenzene <5.00 U 5.00 µg/L EX EPA8260B0 1,1,2,2-Tetrachloroethane <5.00 U 5.00 µg/L EX EPA8260B0 Tetrachloroethylene <5.00 U 5.00 µg/L EX EPA8260B0 Toluene <5.00 U 5.00 µg/L EX EPA8260B0 1,1,1-Trichloroethane <5.00 U 5.00 µg/L EX EPA8260B0 1,1,2-Trichloroethane <5.00 U 5.00 µg/L EX EPA8260B0 Trichloroethylene <5.00 U 5.00 µg/L EX EPA8260B0 Trichlorofluoromethane <5.00 U 5.00 µg/L EX EPA8260B
WELL TRP114DMEASUREMENTS CONDUCTED IN THE FIELD
Sample date: 10/09/00 Time: Not availableWater temperature: Not availableAir temperature: Not availablepH: Not available Total alkalinity (as CaCO3): Not availableSp. conductance: Not available Phenolphthalein alkalinity: Not availableTurbidity: Not availableNo water was evacuated from the well prior to sampling.
ANALYSES
F Analyte Result FG S EMS SQL Unit Lab Method
0 Acetone <10.0 JU L O 10.0 µg/L ML EPA8260B0 Benzene <1.00 JU L O 1.00 µg/L ML EPA8260B0 Bromodichloromethane <1.00 JU L O 1.00 µg/L ML EPA8260B0 Bromoform <1.00 JU L O 1.00 µg/L ML EPA8260B0 Bromomethane <1.00 JU L O 1.00 µg/L ML EPA8260B0 Carbon disulfide <5.00 JU L O 5.00 µg/L ML EPA8260B0 Carbon tetrachloride <1.00 JU L O 1.00 µg/L ML EPA8260B0 Chlorobenzene <1.00 JU L O 1.00 µg/L ML EPA8260B0 Chloroethane <1.00 JU L O 1.00 µg/L ML EPA8260B0 Chloroethene (Vinyl chloride) <1.00 JU L O 1.00 µg/L ML EPA8260B0 Chloroform <1.00 JU L O 1.00 µg/L ML EPA8260B0 Chloromethane <1.00 JU L O 1.00 µg/L ML EPA8260B0 Dibromochloromethane <1.00 JU L O 1.00 µg/L ML EPA8260B0 1,1-Dichloroethane <1.00 JU L O 1.00 µg/L ML EPA8260B0 1,2-Dichloroethane <1.00 JU L O 1.00 µg/L ML EPA8260B0 1,1-Dichloroethylene <1.00 JU L O 1.00 µg/L ML EPA8260B0 cis-1,2-Dichloroethylene <1.00 JU L O 1.00 µg/L ML EPA8260B0 trans-1,2-Dichloroethylene <1.00 JU L O 1.00 µg/L ML EPA8260B0 Dichloromethane <10.0 JU L O 10.0 µg/L ML EPA8260B0 1,2-Dichloropropane <1.00 JU L O 1.00 µg/L ML EPA8260B0 cis-1,3-Dichloropropene <1.00 JU L O 1.00 µg/L ML EPA8260B0 trans-1,3-Dichloropropene <1.00 JU L O 1.00 µg/L ML EPA8260B0 Ethylbenzene <1.00 JU L O 1.00 µg/L ML EPA8260B0 2-Hexanone <5.00 JU L O 5.00 µg/L ML EPA8260B0 Methyl ethyl ketone <5.00 JU L O 5.00 µg/L ML EPA8260B0 Methyl isobutyl ketone <5.00 JU L O 5.00 µg/L ML EPA8260B0 Styrene <1.00 JU L O 1.00 µg/L ML EPA8260B0 1,1,2,2-Tetrachloroethane <1.00 JU L O 1.00 µg/L ML EPA8260B0 Tetrachloroethylene <1.00 JU L O 1.00 µg/L ML EPA8260B0 Toluene <1.00 JU L O 1.00 µg/L ML EPA8260B
Well TRP114D collected on 10/09/00 (cont.)
F Analyte Result FG S EMS SQL Unit Lab Method
0 1,1,1-Trichloroethane <1.00 JU L O 1.00 µg/L ML EPA8260B0 1,1,2-Trichloroethane <1.00 JU L O 1.00 µg/L ML EPA8260B0 Trichloroethylene <1.00 JU L O 1.00 µg/L ML EPA8260B0 Vinyl acetate <5.00 JU L O 5.00 µg/L ML EPA8260B0 Xylenes <1.00 JU L O 1.00 µg/L ML EPA8260B
WELL TRP115DMEASUREMENTS CONDUCTED IN THE FIELD
Sample date: 12/07/00 Time: Not availableWater temperature: Not availableAir temperature: Not availablepH: Not available Total alkalinity (as CaCO3): Not availableSp. conductance: Not available Phenolphthalein alkalinity: Not availableTurbidity: Not availableNo water was evacuated from the well prior to sampling.
ANALYSES
F Analyte Result FG S EMS SQL Unit Lab Method
0 Acetone <10.0 JU L O 10.0 µg/L ML EPA8260B0 Benzene <1.00 JU L O 1.00 µg/L ML EPA8260B0 Bromodichloromethane <1.00 JU L O 1.00 µg/L ML EPA8260B0 Bromoform <1.00 JU L O 1.00 µg/L ML EPA8260B0 Bromomethane <1.00 JU L O 1.00 µg/L ML EPA8260B0 Carbon disulfide <5.00 JU L O 5.00 µg/L ML EPA8260B0 Carbon tetrachloride <1.00 JU L O 1.00 µg/L ML EPA8260B0 Chlorobenzene <1.00 JU L O 1.00 µg/L ML EPA8260B0 Chloroethane <1.00 JU L O 1.00 µg/L ML EPA8260B0 Chloroethene (Vinyl chloride) <1.00 JU L O 1.00 µg/L ML EPA8260B0 Chloroform <1.00 JU L O 1.00 µg/L ML EPA8260B0 Chloromethane <1.00 JU L O 1.00 µg/L ML EPA8260B0 Dibromochloromethane <1.00 JU L O 1.00 µg/L ML EPA8260B0 1,1-Dichloroethane <1.00 JU L O 1.00 µg/L ML EPA8260B0 1,2-Dichloroethane <1.00 JU L O 1.00 µg/L ML EPA8260B0 1,1-Dichloroethylene <1.00 JU L O 1.00 µg/L ML EPA8260B0 1,2-Dichloroethylene <1.00 JU L O 1.00 µg/L ML EPA8260B0 Dichloromethane <10.0 JU L O 10.0 µg/L ML EPA8260B0 1,2-Dichloropropane <1.00 JU L O 1.00 µg/L ML EPA8260B0 cis-1,3-Dichloropropene <1.00 JU L O 1.00 µg/L ML EPA8260B0 trans-1,3-Dichloropropene <1.00 JU L O 1.00 µg/L ML EPA8260B0 Ethylbenzene <1.00 JU L O 1.00 µg/L ML EPA8260B0 2-Hexanone <5.00 JU L O 5.00 µg/L ML EPA8260B0 Methyl ethyl ketone <5.00 JU L O 5.00 µg/L ML EPA8260B0 Methyl isobutyl ketone <5.00 JU L O 5.00 µg/L ML EPA8260B0 Styrene <1.00 JU L O 1.00 µg/L ML EPA8260B0 1,1,2,2-Tetrachloroethane <1.00 JU L O 1.00 µg/L ML EPA8260B0 Tetrachloroethylene <1.00 JU L O 1.00 µg/L ML EPA8260B0 Toluene <1.00 JU L O 1.00 µg/L ML EPA8260B0 1,1,1-Trichloroethane <1.00 JU L O 1.00 µg/L ML EPA8260B0 1,1,2-Trichloroethane <1.00 JU L O 1.00 µg/L ML EPA8260B0 Trichloroethylene <1.00 JU L O 1.00 µg/L ML EPA8260B0 Vinyl acetate <5.00 JU L O 5.00 µg/L ML EPA8260B0 Xylenes <1.00 JU L O 1.00 µg/L ML EPA8260B
WELL TRP117DMEASUREMENTS CONDUCTED IN THE FIELD
Sample date: 10/06/00 Time: Not availableWater temperature: Not availableAir temperature: Not availablepH: Not available Total alkalinity (as CaCO3): Not availableSp. conductance: Not available Phenolphthalein alkalinity: Not availableTurbidity: Not availableNo water was evacuated from the well prior to sampling.
ANALYSES
F Analyte Result FG S EMS SQL Unit Lab Method
0 Acrolein <50.0 U 50.0 µg/L EX EPA8260B0 Acrylonitrile <10.0 U 10.0 µg/L EX EPA8260B0 Benzene <5.00 U 5.00 µg/L EX EPA8260B0 Bromodichloromethane <5.00 U 5.00 µg/L EX EPA8260B0 Bromoform <5.00 U 5.00 µg/L EX EPA8260B

SAMPLING BLANKS RESULTSSAMPLING BLANKS RESULTS
ESH-EMS-2000408ESH-EMS-2000408 C-C-1414 Fourth Quarter 2000Fourth Quarter 2000
Well TRP117D collected on 10/06/00 (cont.)
F Analyte Result FG S EMS SQL Unit Lab Method
0 Bromomethane <5.00 U 5.00 µg/L EX EPA8260B0 Carbon tetrachloride <5.00 U 5.00 µg/L EX EPA8260B0 Chlorobenzene <5.00 U 5.00 µg/L EX EPA8260B0 Chloroethane <5.00 U 5.00 µg/L EX EPA8260B0 Chloroethene (Vinyl chloride) <5.00 U 5.00 µg/L EX EPA8260B0 2-Chloroethyl vinyl ether <5.00 U 5.00 µg/L EX EPA8260B0 Chloroform <5.00 U 5.00 µg/L EX EPA8260B0 Chloromethane <5.00 U 5.00 µg/L EX EPA8260B0 Dibromochloromethane <5.00 U 5.00 µg/L EX EPA8260B0 1,2-Dichlorobenzene <5.00 U 5.00 µg/L EX EPA8260B0 1,3-Dichlorobenzene <5.00 U 5.00 µg/L EX EPA8260B0 1,4-Dichlorobenzene <5.00 U 5.00 µg/L EX EPA8260B0 1,1-Dichloroethane <5.00 U 5.00 µg/L EX EPA8260B0 1,2-Dichloroethane <5.00 U 5.00 µg/L EX EPA8260B0 1,1-Dichloroethylene <5.00 U 5.00 µg/L EX EPA8260B0 trans-1,2-Dichloroethylene <5.00 U 5.00 µg/L EX EPA8260B0 Dichloromethane <10.0 U 10.0 µg/L EX EPA8260B0 1,2-Dichloropropane <5.00 U 5.00 µg/L EX EPA8260B0 cis-1,3-Dichloropropene <5.00 U 5.00 µg/L EX EPA8260B0 trans-1,3-Dichloropropene <5.00 U 5.00 µg/L EX EPA8260B0 Ethylbenzene <5.00 U 5.00 µg/L EX EPA8260B0 1,1,2,2-Tetrachloroethane <5.00 U 5.00 µg/L EX EPA8260B0 Tetrachloroethylene <5.00 U 5.00 µg/L EX EPA8260B0 Toluene <5.00 U 5.00 µg/L EX EPA8260B0 1,1,1-Trichloroethane <5.00 U 5.00 µg/L EX EPA8260B0 1,1,2-Trichloroethane <5.00 U 5.00 µg/L EX EPA8260B0 Trichloroethylene <5.00 U 5.00 µg/L EX EPA8260B
WELL TRP118DMEASUREMENTS CONDUCTED IN THE FIELD
Sample date: 10/24/00 Time: Not availableWater temperature: Not availableAir temperature: Not availablepH: Not available Total alkalinity (as CaCO3): Not availableSp. conductance: Not available Phenolphthalein alkalinity: Not availableTurbidity: Not availableNo water was evacuated from the well prior to sampling.
ANALYSES
F Analyte Result FG S EMS SQL Unit Lab Method
0 Carbon tetrachloride <1.00 U 1.00 µg/L EX EPA8021B0 Chloroform <1.00 U 1.00 µg/L EX EPA8021B0 Tetrachloroethylene <1.00 U 1.00 µg/L EX EPA8021B0 1,1,1-Trichloroethane <1.00 U 1.00 µg/L EX EPA8021B0 Trichloroethylene <1.00 U 1.00 µg/L EX EPA8021B
WELL TRP119DMEASUREMENTS CONDUCTED IN THE FIELD
Sample date: 10/25/00 Time: Not availableWater temperature: Not availableAir temperature: Not availablepH: Not available Total alkalinity (as CaCO3): Not availableSp. conductance: Not available Phenolphthalein alkalinity: Not availableTurbidity: Not availableNo water was evacuated from the well prior to sampling.
ANALYSES
F Analyte Result FG S EMS SQL Unit Lab Method
0 Carbon tetrachloride <1.00 U 1.00 µg/L EX EPA8021B0 Chloroform <1.00 U 1.00 µg/L EX EPA8021B0 Tetrachloroethylene <1.00 U 1.00 µg/L EX EPA8021B0 1,1,1-Trichloroethane <1.00 U 1.00 µg/L EX EPA8021B0 Trichloroethylene <1.00 U 1.00 µg/L EX EPA8021B
WELL TRP120DMEASUREMENTS CONDUCTED IN THE FIELD
Sample date: 10/25/00 Time: Not availableWater temperature: Not availableAir temperature: Not availablepH: Not available Total alkalinity (as CaCO3): Not availableSp. conductance: Not available Phenolphthalein alkalinity: Not availableTurbidity: Not availableNo water was evacuated from the well prior to sampling.
ANALYSES
F Analyte Result FG S EMS SQL Unit Lab Method
0 Carbon tetrachloride <1.00 U 1.00 µg/L EX EPA8021B0 Chloroform <1.00 U 1.00 µg/L EX EPA8021B0 Tetrachloroethylene <1.00 U 1.00 µg/L EX EPA8021B0 1,1,1-Trichloroethane <1.00 U 1.00 µg/L EX EPA8021B0 Trichloroethylene <1.00 U 1.00 µg/L EX EPA8021B
WELL TRP122DMEASUREMENTS CONDUCTED IN THE FIELD
Sample date: 10/31/00 Time: Not availableWater temperature: Not availableAir temperature: Not availablepH: Not available Total alkalinity (as CaCO3): Not availableSp. conductance: Not available Phenolphthalein alkalinity: Not availableTurbidity: Not availableNo water was evacuated from the well prior to sampling.
ANALYSES
F Analyte Result FG S EMS SQL Unit Lab Method
0 Carbon tetrachloride <1.00 U 1.00 µg/L EX EPA8021B0 Chloroform <1.00 U 1.00 µg/L EX EPA8021B0 Tetrachloroethylene <1.00 U 1.00 µg/L EX EPA8021B0 1,1,1-Trichloroethane <1.00 U 1.00 µg/L EX EPA8021B0 Trichloroethylene <1.00 U 1.00 µg/L EX EPA8021B
WELL TRP135CMEASUREMENTS CONDUCTED IN THE FIELD
Sample date: 11/03/00 Time: Not availableWater temperature: Not availableAir temperature: Not availablepH: Not available Total alkalinity (as CaCO3): Not availableSp. conductance: Not available Phenolphthalein alkalinity: Not availableTurbidity: Not availableNo water was evacuated from the well prior to sampling.
ANALYSES
F Analyte Result FG S EMS SQL Unit Lab Method
0 Benzene <5.00 U 5.00 µg/L WA EPA8260B0 Bromodichloromethane <5.00 U 5.00 µg/L WA EPA8260B0 Bromoform <5.00 U 5.00 µg/L WA EPA8260B0 Bromomethane <10.0 U 10.0 µg/L WA EPA8260B0 Carbon tetrachloride <5.00 U 5.00 µg/L WA EPA8260B0 Chlorobenzene <5.00 U 5.00 µg/L WA EPA8260B0 Chloroethane <10.0 U 10.0 µg/L WA EPA8260B0 Chloroethene (Vinyl chloride) <10.0 U 10.0 µg/L WA EPA8260B0 2-Chloroethyl vinyl ether 10.0 R 4 10.0 µg/L WA EPA8260B0 Chloroform <5.00 U 5.00 µg/L WA EPA8260B0 Chloromethane <10.0 U 10.0 µg/L WA EPA8260B0 Dibromochloromethane <5.00 U 5.00 µg/L WA EPA8260B0 1,1-Dichloroethane <5.00 U 5.00 µg/L WA EPA8260B0 1,2-Dichloroethane <5.00 U 5.00 µg/L WA EPA8260B0 1,1-Dichloroethylene <5.00 U 5.00 µg/L WA EPA8260B0 trans-1,2-Dichloroethylene <5.00 U 5.00 µg/L WA EPA8260B0 Dichloromethane <5.01 U V 5.00 µg/L WA EPA8260B0 1,2-Dichloropropane <5.00 U 5.00 µg/L WA EPA8260B0 cis-1,3-Dichloropropene <5.00 U 5.00 µg/L WA EPA8260B0 trans-1,3-Dichloropropene <5.00 U 5.00 µg/L WA EPA8260B0 Ethylbenzene <5.00 U 5.00 µg/L WA EPA8260B

SAMPLING BLANKS RESULTSSAMPLING BLANKS RESULTS
ESH-EMS-2000408ESH-EMS-2000408 C-C-1515 Fourth Quarter 2000Fourth Quarter 2000
Well TRP135C collected on 11/03/00 (cont.)
F Analyte Result FG S EMS SQL Unit Lab Method
0 1,1,2,2-Tetrachloroethane <5.00 U 5.00 µg/L WA EPA8260B0 Tetrachloroethylene <5.00 U 5.00 µg/L WA EPA8260B0 Toluene <5.00 U 5.00 µg/L WA EPA8260B0 1,1,1-Trichloroethane <5.00 U 5.00 µg/L WA EPA8260B0 1,1,2-Trichloroethane <5.00 U 5.00 µg/L WA EPA8260B0 Trichloroethylene <5.00 U 5.00 µg/L WA EPA8260B0 Trichlorofluoromethane <5.00 U 5.00 µg/L WA EPA8260B0 Xylenes <5.00 U 5.00 µg/L WA EPA8260B
WELL TRP137DMEASUREMENTS CONDUCTED IN THE FIELD
Sample date: 10/19/00 Time: Not availableWater temperature: Not availableAir temperature: Not availablepH: Not available Total alkalinity (as CaCO3): Not availableSp. conductance: Not available Phenolphthalein alkalinity: Not availableTurbidity: Not availableNo water was evacuated from the well prior to sampling.
ANALYSES
F Analyte Result FG S EMS SQL Unit Lab Method
0 Carbon tetrachloride <1.00 U 1.00 µg/L EX EPA8021B0 Chloroform <1.00 U 1.00 µg/L EX EPA8021B0 Tetrachloroethylene <1.00 U 1.00 µg/L EX EPA8021B0 1,1,1-Trichloroethane <1.00 U 1.00 µg/L EX EPA8021B0 Trichloroethylene <1.00 U 1.00 µg/L EX EPA8021B
WELL TRP175DMEASUREMENTS CONDUCTED IN THE FIELD
Sample date: 11/02/00 Time: Not availableWater temperature: Not availableAir temperature: Not availablepH: Not available Total alkalinity (as CaCO3): Not availableSp. conductance: Not available Phenolphthalein alkalinity: Not availableTurbidity: Not availableNo water was evacuated from the well prior to sampling.
ANALYSES
F Analyte Result FG S EMS SQL Unit Lab Method
0 Acetone <20.0 U 20.0 µg/L EX EPA8260B0 Acetonitrile (Methyl cyanide) <200 U 200 µg/L EX EPA8260B0 Acrolein <50.0 U 50.0 µg/L EX EPA8260B0 Acrylonitrile <10.0 U 10.0 µg/L EX EPA8260B0 Allyl chloride <5.00 U 5.00 µg/L EX EPA8260B0 Benzene <5.00 U 5.00 µg/L EX EPA8260B0 Bromochloromethane <5.00 U 5.00 µg/L EX EPA8260B0 Bromodichloromethane <5.00 U 5.00 µg/L EX EPA8260B0 Bromoform <5.00 U 5.00 µg/L EX EPA8260B0 Bromomethane <5.00 U 5.00 µg/L EX EPA8260B0 Carbon disulfide <5.00 U 5.00 µg/L EX EPA8260B0 Carbon tetrachloride <5.00 U 5.00 µg/L EX EPA8260B0 Chlorobenzene <5.00 U 5.00 µg/L EX EPA8260B0 Chloroethane <5.00 U 5.00 µg/L EX EPA8260B0 Chloroethene (Vinyl chloride) <5.00 U 5.00 µg/L EX EPA8260B0 Chloroform <5.00 U 5.00 µg/L EX EPA8260B0 Chloromethane <5.00 U 5.00 µg/L EX EPA8260B0 Chloroprene <20.0 U 20.0 µg/L EX EPA8260B0 Dibromochloromethane <5.00 U 5.00 µg/L EX EPA8260B0 1,2-Dibromo-3-chloropropane <10.0 U 10.0 µg/L EX EPA8260B0 1,2-Dibromoethane <5.00 U 5.00 µg/L EX EPA8260B0 Dibromomethane <5.00 U 5.00 µg/L EX EPA8260B0 1,2-Dichlorobenzene <5.00 U 5.00 µg/L EX EPA8260B0 1,3-Dichlorobenzene <5.00 U 5.00 µg/L EX EPA8260B0 1,4-Dichlorobenzene <5.00 U 5.00 µg/L EX EPA8260B0 trans-1,4-Dichloro-2-butene <20.0 U 20.0 µg/L EX EPA8260B0 Dichlorodifluoromethane <5.00 U 5.00 µg/L EX EPA8260B0 1,1-Dichloroethane <5.00 U 5.00 µg/L EX EPA8260B0 1,2-Dichloroethane <5.00 U 5.00 µg/L EX EPA8260B0 1,1-Dichloroethylene <5.00 U 5.00 µg/L EX EPA8260B0 cis-1,2-Dichloroethylene <5.00 U 5.00 µg/L EX EPA8260B
Well TRP175D collected on 11/02/00 (cont.)
F Analyte Result FG S EMS SQL Unit Lab Method
0 trans-1,2-Dichloroethylene <5.00 U 5.00 µg/L EX EPA8260B0 Dichloromethane <10.0 U 10.0 µg/L EX EPA8260B0 1,2-Dichloropropane <5.00 U 5.00 µg/L EX EPA8260B0 1,3-Dichloropropane <5.00 U 5.00 µg/L EX EPA8260B0 2,2-Dichloropropane <5.00 U 5.00 µg/L EX EPA8260B0 1,1-Dichloropropene <5.00 U 5.00 µg/L EX EPA8260B0 cis-1,3-Dichloropropene <5.00 U 5.00 µg/L EX EPA8260B0 trans-1,3-Dichloropropene <5.00 U 5.00 µg/L EX EPA8260B0 1,4-Dioxane <500 U 500 µg/L EX EPA8260B0 Ethyl methacrylate <5.00 U 5.00 µg/L EX EPA8260B0 Ethylbenzene <5.00 U 5.00 µg/L EX EPA8260B0 2-Hexanone <20.0 U 20.0 µg/L EX EPA8260B0 Iodomethane (Methyl iodide) <5.00 U 5.00 µg/L EX EPA8260B0 Isobutyl alcohol <500 U 500 µg/L EX EPA8260B0 Methacrylonitrile <200 U 200 µg/L EX EPA8260B0 Methyl ethyl ketone <20.0 U 20.0 µg/L EX EPA8260B0 Methyl isobutyl ketone <10.0 U 10.0 µg/L EX EPA8260B0 Methyl methacrylate <20.0 U 20.0 µg/L EX EPA8260B0 Pentachloroethane <200 U 200 µg/L EX EPA8260B0 Propionitrile <200 U 200 µg/L EX EPA8260B0 Styrene <5.00 U 5.00 µg/L EX EPA8260B0 1,1,1,2-Tetrachloroethane <5.00 U 5.00 µg/L EX EPA8260B0 1,1,2,2-Tetrachloroethane <5.00 U 5.00 µg/L EX EPA8260B0 Tetrachloroethylene <5.00 U 5.00 µg/L EX EPA8260B0 Toluene <5.00 U 5.00 µg/L EX EPA8260B0 1,1,1-Trichloroethane <5.00 U 5.00 µg/L EX EPA8260B0 1,1,2-Trichloroethane <5.00 U 5.00 µg/L EX EPA8260B0 Trichloroethylene <5.00 U 5.00 µg/L EX EPA8260B0 Trichlorofluoromethane <5.00 U 5.00 µg/L EX EPA8260B0 1,2,3-Trichloropropane <5.00 U 5.00 µg/L EX EPA8260B0 Vinyl acetate <5.00 U 5.00 µg/L EX EPA8260B0 Xylenes <10.0 U 10.0 µg/L EX EPA8260B
WELL TRP176DMEASUREMENTS CONDUCTED IN THE FIELD
Sample date: 11/03/00 Time: Not availableWater temperature: Not availableAir temperature: Not availablepH: Not available Total alkalinity (as CaCO3): Not availableSp. conductance: Not available Phenolphthalein alkalinity: Not availableTurbidity: Not availableNo water was evacuated from the well prior to sampling.
ANALYSES
F Analyte Result FG S EMS SQL Unit Lab Method
0 Acetone <20.0 U 20.0 µg/L EX EPA8260B0 Acetonitrile (Methyl cyanide) <200 U 200 µg/L EX EPA8260B0 Acrolein <50.0 U 50.0 µg/L EX EPA8260B0 Acrylonitrile <10.0 U 10.0 µg/L EX EPA8260B0 Allyl chloride <5.00 U 5.00 µg/L EX EPA8260B0 Benzene <5.00 U 5.00 µg/L EX EPA8260B0 Bromochloromethane <5.00 U 5.00 µg/L EX EPA8260B0 Bromodichloromethane <5.00 U 5.00 µg/L EX EPA8260B0 Bromoform <5.00 U 5.00 µg/L EX EPA8260B0 Bromomethane <5.00 U 5.00 µg/L EX EPA8260B0 Carbon disulfide <5.00 U 5.00 µg/L EX EPA8260B0 Carbon tetrachloride <5.00 U 5.00 µg/L EX EPA8260B0 Chlorobenzene <5.00 U 5.00 µg/L EX EPA8260B0 Chloroethane <5.00 U 5.00 µg/L EX EPA8260B0 Chloroethene (Vinyl chloride) <5.00 U 5.00 µg/L EX EPA8260B0 Chloroform <5.00 U 5.00 µg/L EX EPA8260B0 Chloromethane <5.00 U 5.00 µg/L EX EPA8260B0 Chloroprene <20.0 U 20.0 µg/L EX EPA8260B0 Dibromochloromethane <5.00 U 5.00 µg/L EX EPA8260B0 1,2-Dibromo-3-chloropropane <10.0 U 10.0 µg/L EX EPA8260B0 1,2-Dibromoethane <5.00 U 5.00 µg/L EX EPA8260B0 Dibromomethane <5.00 U 5.00 µg/L EX EPA8260B0 1,2-Dichlorobenzene <5.00 U 5.00 µg/L EX EPA8260B0 1,3-Dichlorobenzene <5.00 U 5.00 µg/L EX EPA8260B0 1,4-Dichlorobenzene <5.00 U 5.00 µg/L EX EPA8260B0 trans-1,4-Dichloro-2-butene <20.0 U 20.0 µg/L EX EPA8260B0 Dichlorodifluoromethane <5.00 U 5.00 µg/L EX EPA8260B0 1,1-Dichloroethane <5.00 U 5.00 µg/L EX EPA8260B0 1,2-Dichloroethane <5.00 U 5.00 µg/L EX EPA8260B
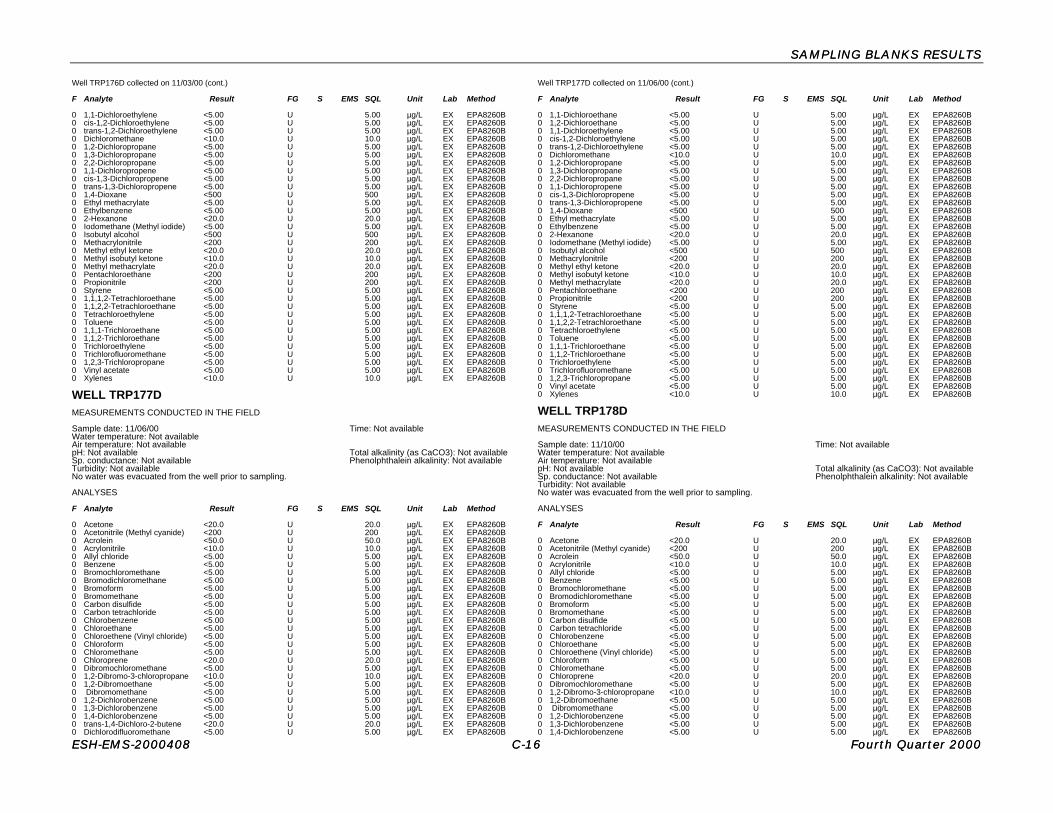
SAMPLING BLANKS RESULTSSAMPLING BLANKS RESULTS
ESH-EMS-2000408ESH-EMS-2000408 C-C-1616 Fourth Quarter 2000Fourth Quarter 2000
Well TRP176D collected on 11/03/00 (cont.)
F Analyte Result FG S EMS SQL Unit Lab Method
0 1,1-Dichloroethylene <5.00 U 5.00 µg/L EX EPA8260B0 cis-1,2-Dichloroethylene <5.00 U 5.00 µg/L EX EPA8260B0 trans-1,2-Dichloroethylene <5.00 U 5.00 µg/L EX EPA8260B0 Dichloromethane <10.0 U 10.0 µg/L EX EPA8260B0 1,2-Dichloropropane <5.00 U 5.00 µg/L EX EPA8260B0 1,3-Dichloropropane <5.00 U 5.00 µg/L EX EPA8260B0 2,2-Dichloropropane <5.00 U 5.00 µg/L EX EPA8260B0 1,1-Dichloropropene <5.00 U 5.00 µg/L EX EPA8260B0 cis-1,3-Dichloropropene <5.00 U 5.00 µg/L EX EPA8260B0 trans-1,3-Dichloropropene <5.00 U 5.00 µg/L EX EPA8260B0 1,4-Dioxane <500 U 500 µg/L EX EPA8260B0 Ethyl methacrylate <5.00 U 5.00 µg/L EX EPA8260B0 Ethylbenzene <5.00 U 5.00 µg/L EX EPA8260B0 2-Hexanone <20.0 U 20.0 µg/L EX EPA8260B0 Iodomethane (Methyl iodide) <5.00 U 5.00 µg/L EX EPA8260B0 Isobutyl alcohol <500 U 500 µg/L EX EPA8260B0 Methacrylonitrile <200 U 200 µg/L EX EPA8260B0 Methyl ethyl ketone <20.0 U 20.0 µg/L EX EPA8260B0 Methyl isobutyl ketone <10.0 U 10.0 µg/L EX EPA8260B0 Methyl methacrylate <20.0 U 20.0 µg/L EX EPA8260B0 Pentachloroethane <200 U 200 µg/L EX EPA8260B0 Propionitrile <200 U 200 µg/L EX EPA8260B0 Styrene <5.00 U 5.00 µg/L EX EPA8260B0 1,1,1,2-Tetrachloroethane <5.00 U 5.00 µg/L EX EPA8260B0 1,1,2,2-Tetrachloroethane <5.00 U 5.00 µg/L EX EPA8260B0 Tetrachloroethylene <5.00 U 5.00 µg/L EX EPA8260B0 Toluene <5.00 U 5.00 µg/L EX EPA8260B0 1,1,1-Trichloroethane <5.00 U 5.00 µg/L EX EPA8260B0 1,1,2-Trichloroethane <5.00 U 5.00 µg/L EX EPA8260B0 Trichloroethylene <5.00 U 5.00 µg/L EX EPA8260B0 Trichlorofluoromethane <5.00 U 5.00 µg/L EX EPA8260B0 1,2,3-Trichloropropane <5.00 U 5.00 µg/L EX EPA8260B0 Vinyl acetate <5.00 U 5.00 µg/L EX EPA8260B0 Xylenes <10.0 U 10.0 µg/L EX EPA8260B
WELL TRP177DMEASUREMENTS CONDUCTED IN THE FIELD
Sample date: 11/06/00 Time: Not availableWater temperature: Not availableAir temperature: Not availablepH: Not available Total alkalinity (as CaCO3): Not availableSp. conductance: Not available Phenolphthalein alkalinity: Not availableTurbidity: Not availableNo water was evacuated from the well prior to sampling.
ANALYSES
F Analyte Result FG S EMS SQL Unit Lab Method
0 Acetone <20.0 U 20.0 µg/L EX EPA8260B0 Acetonitrile (Methyl cyanide) <200 U 200 µg/L EX EPA8260B0 Acrolein <50.0 U 50.0 µg/L EX EPA8260B0 Acrylonitrile <10.0 U 10.0 µg/L EX EPA8260B0 Allyl chloride <5.00 U 5.00 µg/L EX EPA8260B0 Benzene <5.00 U 5.00 µg/L EX EPA8260B0 Bromochloromethane <5.00 U 5.00 µg/L EX EPA8260B0 Bromodichloromethane <5.00 U 5.00 µg/L EX EPA8260B0 Bromoform <5.00 U 5.00 µg/L EX EPA8260B0 Bromomethane <5.00 U 5.00 µg/L EX EPA8260B0 Carbon disulfide <5.00 U 5.00 µg/L EX EPA8260B0 Carbon tetrachloride <5.00 U 5.00 µg/L EX EPA8260B0 Chlorobenzene <5.00 U 5.00 µg/L EX EPA8260B0 Chloroethane <5.00 U 5.00 µg/L EX EPA8260B0 Chloroethene (Vinyl chloride) <5.00 U 5.00 µg/L EX EPA8260B0 Chloroform <5.00 U 5.00 µg/L EX EPA8260B0 Chloromethane <5.00 U 5.00 µg/L EX EPA8260B0 Chloroprene <20.0 U 20.0 µg/L EX EPA8260B0 Dibromochloromethane <5.00 U 5.00 µg/L EX EPA8260B0 1,2-Dibromo-3-chloropropane <10.0 U 10.0 µg/L EX EPA8260B0 1,2-Dibromoethane <5.00 U 5.00 µg/L EX EPA8260B0 Dibromomethane <5.00 U 5.00 µg/L EX EPA8260B0 1,2-Dichlorobenzene <5.00 U 5.00 µg/L EX EPA8260B0 1,3-Dichlorobenzene <5.00 U 5.00 µg/L EX EPA8260B0 1,4-Dichlorobenzene <5.00 U 5.00 µg/L EX EPA8260B0 trans-1,4-Dichloro-2-butene <20.0 U 20.0 µg/L EX EPA8260B0 Dichlorodifluoromethane <5.00 U 5.00 µg/L EX EPA8260B
Well TRP177D collected on 11/06/00 (cont.)
F Analyte Result FG S EMS SQL Unit Lab Method
0 1,1-Dichloroethane <5.00 U 5.00 µg/L EX EPA8260B0 1,2-Dichloroethane <5.00 U 5.00 µg/L EX EPA8260B0 1,1-Dichloroethylene <5.00 U 5.00 µg/L EX EPA8260B0 cis-1,2-Dichloroethylene <5.00 U 5.00 µg/L EX EPA8260B0 trans-1,2-Dichloroethylene <5.00 U 5.00 µg/L EX EPA8260B0 Dichloromethane <10.0 U 10.0 µg/L EX EPA8260B0 1,2-Dichloropropane <5.00 U 5.00 µg/L EX EPA8260B0 1,3-Dichloropropane <5.00 U 5.00 µg/L EX EPA8260B0 2,2-Dichloropropane <5.00 U 5.00 µg/L EX EPA8260B0 1,1-Dichloropropene <5.00 U 5.00 µg/L EX EPA8260B0 cis-1,3-Dichloropropene <5.00 U 5.00 µg/L EX EPA8260B0 trans-1,3-Dichloropropene <5.00 U 5.00 µg/L EX EPA8260B0 1,4-Dioxane <500 U 500 µg/L EX EPA8260B0 Ethyl methacrylate <5.00 U 5.00 µg/L EX EPA8260B0 Ethylbenzene <5.00 U 5.00 µg/L EX EPA8260B0 2-Hexanone <20.0 U 20.0 µg/L EX EPA8260B0 Iodomethane (Methyl iodide) <5.00 U 5.00 µg/L EX EPA8260B0 Isobutyl alcohol <500 U 500 µg/L EX EPA8260B0 Methacrylonitrile <200 U 200 µg/L EX EPA8260B0 Methyl ethyl ketone <20.0 U 20.0 µg/L EX EPA8260B0 Methyl isobutyl ketone <10.0 U 10.0 µg/L EX EPA8260B0 Methyl methacrylate <20.0 U 20.0 µg/L EX EPA8260B0 Pentachloroethane <200 U 200 µg/L EX EPA8260B0 Propionitrile <200 U 200 µg/L EX EPA8260B0 Styrene <5.00 U 5.00 µg/L EX EPA8260B0 1,1,1,2-Tetrachloroethane <5.00 U 5.00 µg/L EX EPA8260B0 1,1,2,2-Tetrachloroethane <5.00 U 5.00 µg/L EX EPA8260B0 Tetrachloroethylene <5.00 U 5.00 µg/L EX EPA8260B0 Toluene <5.00 U 5.00 µg/L EX EPA8260B0 1,1,1-Trichloroethane <5.00 U 5.00 µg/L EX EPA8260B0 1,1,2-Trichloroethane <5.00 U 5.00 µg/L EX EPA8260B0 Trichloroethylene <5.00 U 5.00 µg/L EX EPA8260B0 Trichlorofluoromethane <5.00 U 5.00 µg/L EX EPA8260B0 1,2,3-Trichloropropane <5.00 U 5.00 µg/L EX EPA8260B0 Vinyl acetate <5.00 U 5.00 µg/L EX EPA8260B0 Xylenes <10.0 U 10.0 µg/L EX EPA8260B
WELL TRP178DMEASUREMENTS CONDUCTED IN THE FIELD
Sample date: 11/10/00 Time: Not availableWater temperature: Not availableAir temperature: Not availablepH: Not available Total alkalinity (as CaCO3): Not availableSp. conductance: Not available Phenolphthalein alkalinity: Not availableTurbidity: Not availableNo water was evacuated from the well prior to sampling.
ANALYSES
F Analyte Result FG S EMS SQL Unit Lab Method
0 Acetone <20.0 U 20.0 µg/L EX EPA8260B0 Acetonitrile (Methyl cyanide) <200 U 200 µg/L EX EPA8260B0 Acrolein <50.0 U 50.0 µg/L EX EPA8260B0 Acrylonitrile <10.0 U 10.0 µg/L EX EPA8260B0 Allyl chloride <5.00 U 5.00 µg/L EX EPA8260B0 Benzene <5.00 U 5.00 µg/L EX EPA8260B0 Bromochloromethane <5.00 U 5.00 µg/L EX EPA8260B0 Bromodichloromethane <5.00 U 5.00 µg/L EX EPA8260B0 Bromoform <5.00 U 5.00 µg/L EX EPA8260B0 Bromomethane <5.00 U 5.00 µg/L EX EPA8260B0 Carbon disulfide <5.00 U 5.00 µg/L EX EPA8260B0 Carbon tetrachloride <5.00 U 5.00 µg/L EX EPA8260B0 Chlorobenzene <5.00 U 5.00 µg/L EX EPA8260B0 Chloroethane <5.00 U 5.00 µg/L EX EPA8260B0 Chloroethene (Vinyl chloride) <5.00 U 5.00 µg/L EX EPA8260B0 Chloroform <5.00 U 5.00 µg/L EX EPA8260B0 Chloromethane <5.00 U 5.00 µg/L EX EPA8260B0 Chloroprene <20.0 U 20.0 µg/L EX EPA8260B0 Dibromochloromethane <5.00 U 5.00 µg/L EX EPA8260B0 1,2-Dibromo-3-chloropropane <10.0 U 10.0 µg/L EX EPA8260B0 1,2-Dibromoethane <5.00 U 5.00 µg/L EX EPA8260B0 Dibromomethane <5.00 U 5.00 µg/L EX EPA8260B0 1,2-Dichlorobenzene <5.00 U 5.00 µg/L EX EPA8260B0 1,3-Dichlorobenzene <5.00 U 5.00 µg/L EX EPA8260B0 1,4-Dichlorobenzene <5.00 U 5.00 µg/L EX EPA8260B

SAMPLING BLANKS RESULTSSAMPLING BLANKS RESULTS
ESH-EMS-2000408ESH-EMS-2000408 C-C-1717 Fourth Quarter 2000Fourth Quarter 2000
Well TRP178D collected on 11/10/00 (cont.)
F Analyte Result FG S EMS SQL Unit Lab Method
0 trans-1,4-Dichloro-2-butene <20.0 U 20.0 µg/L EX EPA8260B0 Dichlorodifluoromethane <5.00 U 5.00 µg/L EX EPA8260B0 1,1-Dichloroethane <5.00 U 5.00 µg/L EX EPA8260B0 1,2-Dichloroethane <5.00 U 5.00 µg/L EX EPA8260B0 1,1-Dichloroethylene <5.00 U 5.00 µg/L EX EPA8260B0 cis-1,2-Dichloroethylene <5.00 U 5.00 µg/L EX EPA8260B0 trans-1,2-Dichloroethylene <5.00 U 5.00 µg/L EX EPA8260B0 Dichloromethane <10.0 U 10.0 µg/L EX EPA8260B0 1,2-Dichloropropane <5.00 U 5.00 µg/L EX EPA8260B0 1,3-Dichloropropane <5.00 U 5.00 µg/L EX EPA8260B0 2,2-Dichloropropane <5.00 U 5.00 µg/L EX EPA8260B0 1,1-Dichloropropene <5.00 U 5.00 µg/L EX EPA8260B0 cis-1,3-Dichloropropene <5.00 U 5.00 µg/L EX EPA8260B0 trans-1,3-Dichloropropene <5.00 U 5.00 µg/L EX EPA8260B0 1,4-Dioxane <500 U 500 µg/L EX EPA8260B0 Ethyl methacrylate <5.00 U 5.00 µg/L EX EPA8260B0 Ethylbenzene <5.00 U 5.00 µg/L EX EPA8260B0 2-Hexanone <20.0 U 20.0 µg/L EX EPA8260B0 Iodomethane (Methyl iodide) <5.00 U 5.00 µg/L EX EPA8260B0 Isobutyl alcohol <500 U 500 µg/L EX EPA8260B0 Methacrylonitrile <200 U 200 µg/L EX EPA8260B0 Methyl ethyl ketone <20.0 U 20.0 µg/L EX EPA8260B0 Methyl isobutyl ketone <10.0 U 10.0 µg/L EX EPA8260B0 Methyl methacrylate <20.0 U 20.0 µg/L EX EPA8260B0 Pentachloroethane <200 U 200 µg/L EX EPA8260B0 Propionitrile <200 U 200 µg/L EX EPA8260B0 Styrene <5.00 U 5.00 µg/L EX EPA8260B0 1,1,1,2-Tetrachloroethane <5.00 U 5.00 µg/L EX EPA8260B0 1,1,2,2-Tetrachloroethane <5.00 U 5.00 µg/L EX EPA8260B0 Tetrachloroethylene <5.00 U 5.00 µg/L EX EPA8260B0 Toluene <5.00 U 5.00 µg/L EX EPA8260B0 1,1,1-Trichloroethane <5.00 U 5.00 µg/L EX EPA8260B0 1,1,2-Trichloroethane <5.00 U 5.00 µg/L EX EPA8260B0 Trichloroethylene <5.00 U 5.00 µg/L EX EPA8260B0 Trichlorofluoromethane <5.00 U 5.00 µg/L EX EPA8260B0 1,2,3-Trichloropropane <5.00 U 5.00 µg/L EX EPA8260B0 Vinyl acetate <5.00 U 5.00 µg/L EX EPA8260B0 Xylenes <10.0 U 10.0 µg/L EX EPA8260B
WELL TRP179DMEASUREMENTS CONDUCTED IN THE FIELD
Sample date: 11/29/00 Time: Not availableWater temperature: Not availableAir temperature: Not availablepH: Not available Total alkalinity (as CaCO3): Not availableSp. conductance: Not available Phenolphthalein alkalinity: Not availableTurbidity: Not availableNo water was evacuated from the well prior to sampling.
ANALYSES
F Analyte Result FG S EMS SQL Unit Lab Method
0 Acetone <20.0 U 20.0 µg/L EX EPA8260B0 Acetonitrile (Methyl cyanide) <200 U 200 µg/L EX EPA8260B0 Acrolein <50.0 U 50.0 µg/L EX EPA8260B0 Acrylonitrile <10.0 U 10.0 µg/L EX EPA8260B0 Allyl chloride <5.00 U 5.00 µg/L EX EPA8260B0 Benzene <5.00 U 5.00 µg/L EX EPA8260B0 Bromochloromethane <5.00 U 5.00 µg/L EX EPA8260B0 Bromodichloromethane <5.00 U 5.00 µg/L EX EPA8260B0 Bromoform <5.00 U 5.00 µg/L EX EPA8260B0 Bromomethane <5.00 U 5.00 µg/L EX EPA8260B0 Carbon disulfide <5.00 U 5.00 µg/L EX EPA8260B0 Carbon tetrachloride <5.00 U 5.00 µg/L EX EPA8260B0 Chlorobenzene <5.00 U 5.00 µg/L EX EPA8260B0 Chloroethane <5.00 U 5.00 µg/L EX EPA8260B0 Chloroethene (Vinyl chloride) <5.00 U 5.00 µg/L EX EPA8260B0 Chloroform <5.00 U 5.00 µg/L EX EPA8260B0 Chloromethane <5.00 U 5.00 µg/L EX EPA8260B0 Chloroprene <20.0 U 20.0 µg/L EX EPA8260B0 Dibromochloromethane <5.00 U 5.00 µg/L EX EPA8260B0 1,2-Dibromo-3-chloropropane <10.0 U 10.0 µg/L EX EPA8260B0 1,2-Dibromoethane <5.00 U 5.00 µg/L EX EPA8260B0 Dibromomethane <5.00 U 5.00 µg/L EX EPA8260B0 1,2-Dichlorobenzene <5.00 U 5.00 µg/L EX EPA8260B
Well TRP179D collected on 11/29/00 (cont.)
F Analyte Result FG S EMS SQL Unit Lab Method
0 1,3-Dichlorobenzene <5.00 U 5.00 µg/L EX EPA8260B0 1,4-Dichlorobenzene <5.00 U 5.00 µg/L EX EPA8260B0 trans-1,4-Dichloro-2-butene <20.0 U 20.0 µg/L EX EPA8260B0 Dichlorodifluoromethane <5.00 U 5.00 µg/L EX EPA8260B0 1,1-Dichloroethane <5.00 U 5.00 µg/L EX EPA8260B0 1,2-Dichloroethane <5.00 U 5.00 µg/L EX EPA8260B0 1,1-Dichloroethylene <5.00 U 5.00 µg/L EX EPA8260B0 cis-1,2-Dichloroethylene <5.00 U 5.00 µg/L EX EPA8260B0 trans-1,2-Dichloroethylene <5.00 U 5.00 µg/L EX EPA8260B0 Dichloromethane <10.0 U 10.0 µg/L EX EPA8260B0 1,2-Dichloropropane <5.00 U 5.00 µg/L EX EPA8260B0 1,3-Dichloropropane <5.00 U 5.00 µg/L EX EPA8260B0 2,2-Dichloropropane <5.00 U 5.00 µg/L EX EPA8260B0 1,1-Dichloropropene <5.00 U 5.00 µg/L EX EPA8260B0 cis-1,3-Dichloropropene <5.00 U 5.00 µg/L EX EPA8260B0 trans-1,3-Dichloropropene <5.00 U 5.00 µg/L EX EPA8260B0 1,4-Dioxane <500 U 500 µg/L EX EPA8260B0 Ethyl methacrylate <5.00 U 5.00 µg/L EX EPA8260B0 Ethylbenzene <5.00 U 5.00 µg/L EX EPA8260B0 2-Hexanone <20.0 U 20.0 µg/L EX EPA8260B0 Iodomethane (Methyl iodide) <5.00 U 5.00 µg/L EX EPA8260B0 Isobutyl alcohol <500 U 500 µg/L EX EPA8260B0 Methacrylonitrile <200 U 200 µg/L EX EPA8260B0 Methyl ethyl ketone <20.0 U 20.0 µg/L EX EPA8260B0 Methyl isobutyl ketone <10.0 U 10.0 µg/L EX EPA8260B0 Methyl methacrylate <20.0 U 20.0 µg/L EX EPA8260B0 Pentachloroethane <200 U 200 µg/L EX EPA8260B0 Propionitrile <200 U 200 µg/L EX EPA8260B0 Styrene <5.00 U 5.00 µg/L EX EPA8260B0 1,1,1,2-Tetrachloroethane <5.00 U 5.00 µg/L EX EPA8260B0 1,1,2,2-Tetrachloroethane <5.00 U 5.00 µg/L EX EPA8260B0 Tetrachloroethylene <5.00 U 5.00 µg/L EX EPA8260B0 Toluene <5.00 U 5.00 µg/L EX EPA8260B0 1,1,1-Trichloroethane <5.00 U 5.00 µg/L EX EPA8260B0 1,1,2-Trichloroethane <5.00 U 5.00 µg/L EX EPA8260B0 Trichloroethylene <5.00 U 5.00 µg/L EX EPA8260B0 Trichlorofluoromethane <5.00 U 5.00 µg/L EX EPA8260B0 1,2,3-Trichloropropane <5.00 U 5.00 µg/L EX EPA8260B0 Vinyl acetate <5.00 U 5.00 µg/L EX EPA8260B0 Xylenes <10.0 U 10.0 µg/L EX EPA8260B
WELL TRP182DMEASUREMENTS CONDUCTED IN THE FIELD
Sample date: 11/13/00 Time: Not availableWater temperature: Not availableAir temperature: Not availablepH: Not available Total alkalinity (as CaCO3): Not availableSp. conductance: Not available Phenolphthalein alkalinity: Not availableTurbidity: Not availableNo water was evacuated from the well prior to sampling.
ANALYSES
F Analyte Result FG S EMS SQL Unit Lab Method
0 Acetone <20.0 U 20.0 µg/L EX EPA8260B0 Acetonitrile (Methyl cyanide) <200 U 200 µg/L EX EPA8260B0 Acrolein <50.0 U 50.0 µg/L EX EPA8260B0 Acrylonitrile <10.0 U 10.0 µg/L EX EPA8260B0 Allyl chloride <5.00 U 5.00 µg/L EX EPA8260B0 Benzene <5.00 U 5.00 µg/L EX EPA8260B0 Bromochloromethane <5.00 U 5.00 µg/L EX EPA8260B0 Bromodichloromethane <5.00 U 5.00 µg/L EX EPA8260B0 Bromoform <5.00 U 5.00 µg/L EX EPA8260B0 Bromomethane <5.00 U 5.00 µg/L EX EPA8260B0 Carbon disulfide <5.00 U 5.00 µg/L EX EPA8260B0 Carbon tetrachloride <5.00 U 5.00 µg/L EX EPA8260B0 Chlorobenzene <5.00 U 5.00 µg/L EX EPA8260B0 Chloroethane <5.00 U 5.00 µg/L EX EPA8260B0 Chloroethene (Vinyl chloride) <5.00 U 5.00 µg/L EX EPA8260B0 Chloroform <5.00 U 5.00 µg/L EX EPA8260B0 Chloromethane <5.00 U 5.00 µg/L EX EPA8260B0 Chloroprene <20.0 U 20.0 µg/L EX EPA8260B0 Dibromochloromethane <5.00 U 5.00 µg/L EX EPA8260B0 1,2-Dibromo-3-chloropropane <10.0 U 10.0 µg/L EX EPA8260B0 1,2-Dibromoethane <5.00 U 5.00 µg/L EX EPA8260B

SAMPLING BLANKS RESULTSSAMPLING BLANKS RESULTS
ESH-EMS-2000408ESH-EMS-2000408 C-C-1818 Fourth Quarter 2000Fourth Quarter 2000
Well TRP182D collected on 11/13/00 (cont.)
F Analyte Result FG S EMS SQL Unit Lab Method
0 Dibromomethane <5.00 U 5.00 µg/L EX EPA8260B0 1,2-Dichlorobenzene <5.00 U 5.00 µg/L EX EPA8260B0 1,3-Dichlorobenzene <5.00 U 5.00 µg/L EX EPA8260B0 1,4-Dichlorobenzene <5.00 U 5.00 µg/L EX EPA8260B0 trans-1,4-Dichloro-2-butene <20.0 U 20.0 µg/L EX EPA8260B0 Dichlorodifluoromethane <5.00 U 5.00 µg/L EX EPA8260B0 1,1-Dichloroethane <5.00 U 5.00 µg/L EX EPA8260B0 1,2-Dichloroethane <5.00 U 5.00 µg/L EX EPA8260B0 1,1-Dichloroethylene <5.00 U 5.00 µg/L EX EPA8260B0 cis-1,2-Dichloroethylene <5.00 U 5.00 µg/L EX EPA8260B0 trans-1,2-Dichloroethylene <5.00 U 5.00 µg/L EX EPA8260B0 Dichloromethane <10.0 U 10.0 µg/L EX EPA8260B0 1,2-Dichloropropane <5.00 U 5.00 µg/L EX EPA8260B0 1,3-Dichloropropane <5.00 U 5.00 µg/L EX EPA8260B0 2,2-Dichloropropane <5.00 U 5.00 µg/L EX EPA8260B0 1,1-Dichloropropene <5.00 U 5.00 µg/L EX EPA8260B0 cis-1,3-Dichloropropene <5.00 U 5.00 µg/L EX EPA8260B0 trans-1,3-Dichloropropene <5.00 U 5.00 µg/L EX EPA8260B0 1,4-Dioxane <500 U 500 µg/L EX EPA8260B0 Ethyl methacrylate <5.00 U 5.00 µg/L EX EPA8260B0 Ethylbenzene <5.00 U 5.00 µg/L EX EPA8260B0 2-Hexanone <20.0 U 20.0 µg/L EX EPA8260B0 Iodomethane (Methyl iodide) <5.00 U 5.00 µg/L EX EPA8260B0 Isobutyl alcohol <500 U 500 µg/L EX EPA8260B0 Methacrylonitrile <200 U 200 µg/L EX EPA8260B0 Methyl ethyl ketone <20.0 U 20.0 µg/L EX EPA8260B0 Methyl isobutyl ketone <10.0 U 10.0 µg/L EX EPA8260B0 Methyl methacrylate <20.0 U 20.0 µg/L EX EPA8260B0 Pentachloroethane <200 U 200 µg/L EX EPA8260B0 Propionitrile <200 U 200 µg/L EX EPA8260B0 Styrene <5.00 U 5.00 µg/L EX EPA8260B0 1,1,1,2-Tetrachloroethane <5.00 U 5.00 µg/L EX EPA8260B0 1,1,2,2-Tetrachloroethane <5.00 U 5.00 µg/L EX EPA8260B0 Tetrachloroethylene <5.00 U 5.00 µg/L EX EPA8260B0 Toluene <5.00 U 5.00 µg/L EX EPA8260B0 1,1,1-Trichloroethane <5.00 U 5.00 µg/L EX EPA8260B0 1,1,2-Trichloroethane <5.00 U 5.00 µg/L EX EPA8260B0 Trichloroethylene <5.00 U 5.00 µg/L EX EPA8260B0 Trichlorofluoromethane <5.00 U 5.00 µg/L EX EPA8260B0 1,2,3-Trichloropropane <5.00 U 5.00 µg/L EX EPA8260B0 Vinyl acetate <5.00 U 5.00 µg/L EX EPA8260B0 Xylenes <10.0 U 10.0 µg/L EX EPA8260B
WELL TRP183DMEASUREMENTS CONDUCTED IN THE FIELD
Sample date: 11/10/00 Time: Not availableWater temperature: Not availableAir temperature: Not availablepH: Not available Total alkalinity (as CaCO3): Not availableSp. conductance: Not available Phenolphthalein alkalinity: Not availableTurbidity: Not availableNo water was evacuated from the well prior to sampling.
ANALYSES
F Analyte Result FG S EMS SQL Unit Lab Method
0 Acetone <10.0 U 10.0 µg/L WA EPA8260B0 Acetonitrile (Methyl cyanide) <20.0 U 20.0 µg/L WA EPA8260B0 Acrolein <20.0 U 20.0 µg/L WA EPA8260B0 Acrylonitrile <5.00 U 5.00 µg/L WA EPA8260B0 Allyl chloride <10.0 U 10.0 µg/L WA EPA8260B0 Benzene <5.00 U 5.00 µg/L WA EPA8260B0 Bromodichloromethane <5.00 U 5.00 µg/L WA EPA8260B0 Bromoform <5.00 U 5.00 µg/L WA EPA8260B0 Bromomethane <10.0 U 10.0 µg/L WA EPA8260B0 Carbon disulfide <5.00 U 5.00 µg/L WA EPA8260B0 Carbon tetrachloride <5.00 U 5.00 µg/L WA EPA8260B0 Chlorobenzene <5.00 U 5.00 µg/L WA EPA8260B0 Chloroethane <10.0 U 10.0 µg/L WA EPA8260B0 Chloroethene (Vinyl chloride) <10.0 U 10.0 µg/L WA EPA8260B0 Chloroform <5.00 U 5.00 µg/L WA EPA8260B0 Chloromethane <10.0 U 10.0 µg/L WA EPA8260B0 Chloroprene <5.00 U 5.00 µg/L WA EPA8260B0 Dibromochloromethane <5.00 U 5.00 µg/L WA EPA8260B0 1,2-Dibromo-3-chloropropane <5.00 U 5.00 µg/L WA EPA8260B
Well TRP183D collected on 11/10/00 (cont.)
F Analyte Result FG S EMS SQL Unit Lab Method
0 1,2-Dibromoethane <5.00 U 5.00 µg/L WA EPA8260B0 Dibromomethane <5.00 U 5.00 µg/L WA EPA8260B0 1,4-Dichlorobenzene <5.00 U 5.00 µg/L WA EPA8260B0 trans-1,4-Dichloro-2-butene <20.0 U 20.0 µg/L WA EPA8260B0 Dichlorodifluoromethane <10.0 U 10.0 µg/L WA EPA8260B0 1,1-Dichloroethane <5.00 U 5.00 µg/L WA EPA8260B0 1,2-Dichloroethane <5.00 U 5.00 µg/L WA EPA8260B0 1,1-Dichloroethylene <5.00 U 5.00 µg/L WA EPA8260B0 trans-1,2-Dichloroethylene <5.00 U 5.00 µg/L WA EPA8260B0 Dichloromethane <4.19 U V 5.00 µg/L WA EPA8260B0 1,2-Dichloropropane <5.00 U 5.00 µg/L WA EPA8260B0 cis-1,3-Dichloropropene <5.00 U 5.00 µg/L WA EPA8260B0 trans-1,3-Dichloropropene <5.00 U 5.00 µg/L WA EPA8260B0 Ethylbenzene <5.00 U 5.00 µg/L WA EPA8260B0 2-Hexanone <10.0 U 10.0 µg/L WA EPA8260B0 Iodomethane (Methyl iodide) <5.00 U 5.00 µg/L WA EPA8260B0 Isobutyl alcohol <100 U 100 µg/L WA EPA8260B0 Methacrylonitrile <10.0 U 10.0 µg/L WA EPA8260B0 Methyl ethyl ketone <10.0 U 10.0 µg/L WA EPA8260B0 Methyl isobutyl ketone <10.0 U 10.0 µg/L WA EPA8260B0 Propionitrile <50.0 U 50.0 µg/L WA EPA8260B0 Styrene <5.00 U 5.00 µg/L WA EPA8260B0 1,1,1,2-Tetrachloroethane <5.00 U 5.00 µg/L WA EPA8260B0 1,1,2,2-Tetrachloroethane <5.00 U 5.00 µg/L WA EPA8260B0 Tetrachloroethylene <5.00 U 5.00 µg/L WA EPA8260B0 Toluene <5.00 U 5.00 µg/L WA EPA8260B0 1,1,1-Trichloroethane <5.00 U 5.00 µg/L WA EPA8260B0 1,1,2-Trichloroethane <5.00 U 5.00 µg/L WA EPA8260B0 Trichloroethylene <5.00 U 5.00 µg/L WA EPA8260B0 Trichlorofluoromethane <5.00 U 5.00 µg/L WA EPA8260B0 1,2,3-Trichloropropane <5.00 U 5.00 µg/L WA EPA8260B0 Vinyl acetate <10.0 U 10.0 µg/L WA EPA8260B0 Xylenes <5.00 U 5.00 µg/L WA EPA8260B
WELL TRP185DMEASUREMENTS CONDUCTED IN THE FIELD
Sample date: 11/09/00 Time: Not availableWater temperature: Not availableAir temperature: Not availablepH: Not available Total alkalinity (as CaCO3): Not availableSp. conductance: Not available Phenolphthalein alkalinity: Not availableTurbidity: Not availableNo water was evacuated from the well prior to sampling.
ANALYSES
F Analyte Result FG S EMS SQL Unit Lab Method
0 Acetone <10.0 U 10.0 µg/L WA EPA8260B0 Acetonitrile (Methyl cyanide) <20.0 U 20.0 µg/L WA EPA8260B0 Acrolein <20.0 U 20.0 µg/L WA EPA8260B0 Acrylonitrile <5.00 U 5.00 µg/L WA EPA8260B0 Allyl chloride <10.0 U 10.0 µg/L WA EPA8260B0 Benzene <5.00 U 5.00 µg/L WA EPA8260B0 Bromodichloromethane <5.00 U 5.00 µg/L WA EPA8260B0 Bromoform <5.00 U 5.00 µg/L WA EPA8260B0 Bromomethane <10.0 U 10.0 µg/L WA EPA8260B0 Carbon disulfide <5.00 U 5.00 µg/L WA EPA8260B0 Carbon tetrachloride <5.00 U 5.00 µg/L WA EPA8260B0 Chlorobenzene <5.00 U 5.00 µg/L WA EPA8260B0 Chloroethane <10.0 U 10.0 µg/L WA EPA8260B0 Chloroethene (Vinyl chloride) <10.0 U 10.0 µg/L WA EPA8260B0 Chloroform <5.00 U 5.00 µg/L WA EPA8260B0 Chloromethane <10.0 U 10.0 µg/L WA EPA8260B0 Chloroprene <5.00 U 5.00 µg/L WA EPA8260B0 Dibromochloromethane <5.00 U 5.00 µg/L WA EPA8260B0 1,2-Dibromo-3-chloropropane <5.00 U 5.00 µg/L WA EPA8260B0 1,2-Dibromoethane <5.00 U 5.00 µg/L WA EPA8260B0 Dibromomethane <5.00 U 5.00 µg/L WA EPA8260B0 trans-1,4-Dichloro-2-butene <20.0 U 20.0 µg/L WA EPA8260B0 Dichlorodifluoromethane <10.0 U 10.0 µg/L WA EPA8260B0 1,1-Dichloroethane <5.00 U 5.00 µg/L WA EPA8260B0 1,2-Dichloroethane <5.00 U 5.00 µg/L WA EPA8260B0 1,1-Dichloroethylene <5.00 U 5.00 µg/L WA EPA8260B0 cis-1,2-Dichloroethylene <5.00 U 5.00 µg/L WA EPA8260B0 trans-1,2-Dichloroethylene <5.00 U 5.00 µg/L WA EPA8260B

SAMPLING BLANKS RESULTSSAMPLING BLANKS RESULTS
ESH-EMS-2000408ESH-EMS-2000408 C-C-1919 Fourth Quarter 2000Fourth Quarter 2000
Well TRP185D collected on 11/09/00 (cont.)
F Analyte Result FG S EMS SQL Unit Lab Method
0 Dichloromethane <4.71 U V 5.00 µg/L WA EPA8260B0 1,2-Dichloropropane <5.00 U 5.00 µg/L WA EPA8260B0 cis-1,3-Dichloropropene <5.00 U 5.00 µg/L WA EPA8260B0 trans-1,3-Dichloropropene <5.00 U 5.00 µg/L WA EPA8260B0 Ethylbenzene <5.00 U 5.00 µg/L WA EPA8260B0 2-Hexanone <10.0 U 10.0 µg/L WA EPA8260B0 Iodomethane (Methyl iodide) <5.00 U 5.00 µg/L WA EPA8260B0 Isobutyl alcohol <100 U 100 µg/L WA EPA8260B0 Methacrylonitrile <10.0 U 10.0 µg/L WA EPA8260B0 Methyl ethyl ketone <10.0 U 10.0 µg/L WA EPA8260B0 Methyl isobutyl ketone <10.0 U 10.0 µg/L WA EPA8260B0 Propionitrile <50.0 U 50.0 µg/L WA EPA8260B0 Styrene <5.00 U 5.00 µg/L WA EPA8260B0 1,1,1,2-Tetrachloroethane <5.00 U 5.00 µg/L WA EPA8260B0 1,1,2,2-Tetrachloroethane <5.00 U 5.00 µg/L WA EPA8260B0 Tetrachloroethylene <5.00 U 5.00 µg/L WA EPA8260B0 Toluene <5.00 U 5.00 µg/L WA EPA8260B0 1,1,1-Trichloroethane <5.00 U 5.00 µg/L WA EPA8260B0 1,1,2-Trichloroethane <5.00 U 5.00 µg/L WA EPA8260B0 Trichloroethylene <5.00 U 5.00 µg/L WA EPA8260B0 Trichlorofluoromethane <5.00 U 5.00 µg/L WA EPA8260B0 1,2,3-Trichloropropane <5.00 U 5.00 µg/L WA EPA8260B0 Vinyl acetate <10.0 U 10.0 µg/L WA EPA8260B0 Xylenes <5.00 U 5.00 µg/L WA EPA8260B
WELL TRP186DMEASUREMENTS CONDUCTED IN THE FIELD
Sample date: 11/17/00 Time: Not availableWater temperature: Not availableAir temperature: Not availablepH: Not available Total alkalinity (as CaCO3): Not availableSp. conductance: Not available Phenolphthalein alkalinity: Not availableTurbidity: Not availableNo water was evacuated from the well prior to sampling.
ANALYSES
F Analyte Result FG S EMS SQL Unit Lab Method
0 Acetone <10.0 JU L O 10.0 µg/L WA EPA8260B0 Acetonitrile (Methyl cyanide) <20.0 JU L O 20.0 µg/L WA EPA8260B0 Acrolein <20.0 JU L O 20.0 µg/L WA EPA8260B0 Acrylonitrile <5.00 JU L O 5.00 µg/L WA EPA8260B0 Allyl chloride <10.0 JU L O 10.0 µg/L WA EPA8260B0 Benzene <5.00 JU L O 5.00 µg/L WA EPA8260B0 Bromodichloromethane <5.00 JU L O 5.00 µg/L WA EPA8260B0 Bromoform <5.00 JU L O 5.00 µg/L WA EPA8260B0 Bromomethane <10.0 JU L O 10.0 µg/L WA EPA8260B0 Carbon disulfide <5.00 JU L O 5.00 µg/L WA EPA8260B0 Carbon tetrachloride <5.00 JU L O 5.00 µg/L WA EPA8260B0 Chlorobenzene <5.00 JU L O 5.00 µg/L WA EPA8260B0 Chloroethane <10.0 JU L O 10.0 µg/L WA EPA8260B0 Chloroethene (Vinyl chloride) <10.0 JU L O 10.0 µg/L WA EPA8260B0 Chloroform <5.00 JU L O 5.00 µg/L WA EPA8260B0 Chloromethane <10.0 JU L O 10.0 µg/L WA EPA8260B0 Chloroprene <5.00 JU L O 5.00 µg/L WA EPA8260B0 Dibromochloromethane <5.00 JU L O 5.00 µg/L WA EPA8260B0 1,2-Dibromo-3-chloropropane <5.00 JU L O 5.00 µg/L WA EPA8260B0 1,2-Dibromoethane <5.00 JU L O 5.00 µg/L WA EPA8260B0 Dibromomethane <5.00 JU L O 5.00 µg/L WA EPA8260B0 trans-1,4-Dichloro-2-butene <20.0 JU L O 20.0 µg/L WA EPA8260B0 Dichlorodifluoromethane <10.0 JU L O 10.0 µg/L WA EPA8260B0 1,1-Dichloroethane <5.00 JU L O 5.00 µg/L WA EPA8260B0 1,2-Dichloroethane <5.00 JU L O 5.00 µg/L WA EPA8260B0 1,1-Dichloroethylene <5.00 JU L O 5.00 µg/L WA EPA8260B0 cis-1,2-Dichloroethylene <5.00 JU L O 5.00 µg/L WA EPA8260B0 trans-1,2-Dichloroethylene <5.00 JU L O 5.00 µg/L WA EPA8260B0 Dichloromethane <9.01 JU LV O 5.00 µg/L WA EPA8260B0 1,2-Dichloropropane <5.00 JU L O 5.00 µg/L WA EPA8260B0 cis-1,3-Dichloropropene <5.00 JU L O 5.00 µg/L WA EPA8260B0 trans-1,3-Dichloropropene <5.00 JU L O 5.00 µg/L WA EPA8260B0 Ethylbenzene <5.00 JU L O 5.00 µg/L WA EPA8260B0 2-Hexanone <10.0 JU L O 10.0 µg/L WA EPA8260B0 Iodomethane (Methyl iodide) <5.00 JU L O 5.00 µg/L WA EPA8260B0 Isobutyl alcohol <100 JU L O 100 µg/L WA EPA8260B0 Methacrylonitrile <10.0 JU L O 10.0 µg/L WA EPA8260B
Well TRP186D collected on 11/17/00 (cont.)
F Analyte Result FG S EMS SQL Unit Lab Method
0 Methyl ethyl ketone <10.0 JU L O 10.0 µg/L WA EPA8260B0 Methyl isobutyl ketone <10.0 JU L O 10.0 µg/L WA EPA8260B0 Propionitrile <50.0 JU L O 50.0 µg/L WA EPA8260B0 Styrene <5.00 JU L O 5.00 µg/L WA EPA8260B0 1,1,1,2-Tetrachloroethane <5.00 JU L O 5.00 µg/L WA EPA8260B0 1,1,2,2-Tetrachloroethane <5.00 JU L O 5.00 µg/L WA EPA8260B0 Tetrachloroethylene <5.00 JU L O 5.00 µg/L WA EPA8260B0 Toluene <5.00 JU L O 5.00 µg/L WA EPA8260B0 1,1,1-Trichloroethane <5.00 JU L O 5.00 µg/L WA EPA8260B0 1,1,2-Trichloroethane <5.00 JU L O 5.00 µg/L WA EPA8260B0 Trichloroethylene <5.00 JU L O 5.00 µg/L WA EPA8260B0 Trichlorofluoromethane <5.00 JU L O 5.00 µg/L WA EPA8260B0 1,2,3-Trichloropropane <5.00 JU L O 5.00 µg/L WA EPA8260B0 Vinyl acetate <10.0 JU L O 10.0 µg/L WA EPA8260B0 Xylenes <5.00 JU L O 5.00 µg/L WA EPA8260B
WELL TRP187DMEASUREMENTS CONDUCTED IN THE FIELD
Sample date: 11/28/00 Time: Not availableWater temperature: Not availableAir temperature: Not availablepH: Not available Total alkalinity (as CaCO3): Not availableSp. conductance: Not available Phenolphthalein alkalinity: Not availableTurbidity: Not availableNo water was evacuated from the well prior to sampling.
ANALYSES
F Analyte Result FG S EMS SQL Unit Lab Method
0 Acetone <6.21 U V 10.0 µg/L WA EPA8260B0 Acetonitrile (Methyl cyanide) 13.2 J IK O8 20.0 µg/L WA EPA8260B0 Acrolein 20.0 R 4 20.0 µg/L WA EPA8260B0 Acrylonitrile <5.00 U 5.00 µg/L WA EPA8260B0 Allyl chloride <10.0 U 10.0 µg/L WA EPA8260B0 Benzene <5.00 U 5.00 µg/L WA EPA8260B0 Bromodichloromethane <5.00 U 5.00 µg/L WA EPA8260B0 Bromoform <5.00 U 5.00 µg/L WA EPA8260B0 Bromomethane <10.0 U 10.0 µg/L WA EPA8260B0 Carbon disulfide <5.00 U 5.00 µg/L WA EPA8260B0 Carbon tetrachloride <5.00 U 5.00 µg/L WA EPA8260B0 Chlorobenzene <5.00 U 5.00 µg/L WA EPA8260B0 Chloroethane <10.0 U 10.0 µg/L WA EPA8260B0 Chloroethene (Vinyl chloride) <10.0 U 10.0 µg/L WA EPA8260B0 Chloroform <5.00 U 5.00 µg/L WA EPA8260B0 Chloromethane <10.0 U 10.0 µg/L WA EPA8260B0 Chloroprene <5.00 U 5.00 µg/L WA EPA8260B0 Dibromochloromethane <5.00 U 5.00 µg/L WA EPA8260B0 1,2-Dibromo-3-chloropropane <5.00 U 5.00 µg/L WA EPA8260B0 1,2-Dibromoethane <5.00 U 5.00 µg/L WA EPA8260B0 Dibromomethane <5.00 U 5.00 µg/L WA EPA8260B0 trans-1,4-Dichloro-2-butene <20.0 U 20.0 µg/L WA EPA8260B0 Dichlorodifluoromethane <10.0 U 10.0 µg/L WA EPA8260B0 1,1-Dichloroethane <5.00 U 5.00 µg/L WA EPA8260B0 1,2-Dichloroethane <5.00 U 5.00 µg/L WA EPA8260B0 1,1-Dichloroethylene <5.00 U 5.00 µg/L WA EPA8260B0 cis-1,2-Dichloroethylene <5.00 U 5.00 µg/L WA EPA8260B0 trans-1,2-Dichloroethylene <5.00 U 5.00 µg/L WA EPA8260B0 Dichloromethane <7.88 U V 5.00 µg/L WA EPA8260B0 1,2-Dichloropropane <5.00 U 5.00 µg/L WA EPA8260B0 cis-1,3-Dichloropropene <5.00 U 5.00 µg/L WA EPA8260B0 trans-1,3-Dichloropropene <5.00 U 5.00 µg/L WA EPA8260B0 Ethylbenzene <5.00 U 5.00 µg/L WA EPA8260B0 2-Hexanone <10.0 U 10.0 µg/L WA EPA8260B0 Iodomethane (Methyl iodide) <5.00 U 5.00 µg/L WA EPA8260B0 Isobutyl alcohol <100 U 100 µg/L WA EPA8260B0 Methacrylonitrile <10.0 U 10.0 µg/L WA EPA8260B0 Methyl ethyl ketone <10.0 U 10.0 µg/L WA EPA8260B0 Methyl isobutyl ketone <10.0 U 10.0 µg/L WA EPA8260B0 Propionitrile <50.0 U 50.0 µg/L WA EPA8260B0 Styrene <5.00 U 5.00 µg/L WA EPA8260B0 1,1,1,2-Tetrachloroethane <5.00 U 5.00 µg/L WA EPA8260B0 1,1,2,2-Tetrachloroethane <5.00 U 5.00 µg/L WA EPA8260B0 Tetrachloroethylene <5.00 U 5.00 µg/L WA EPA8260B0 Toluene <5.00 U 5.00 µg/L WA EPA8260B0 1,1,1-Trichloroethane <5.00 U 5.00 µg/L WA EPA8260B
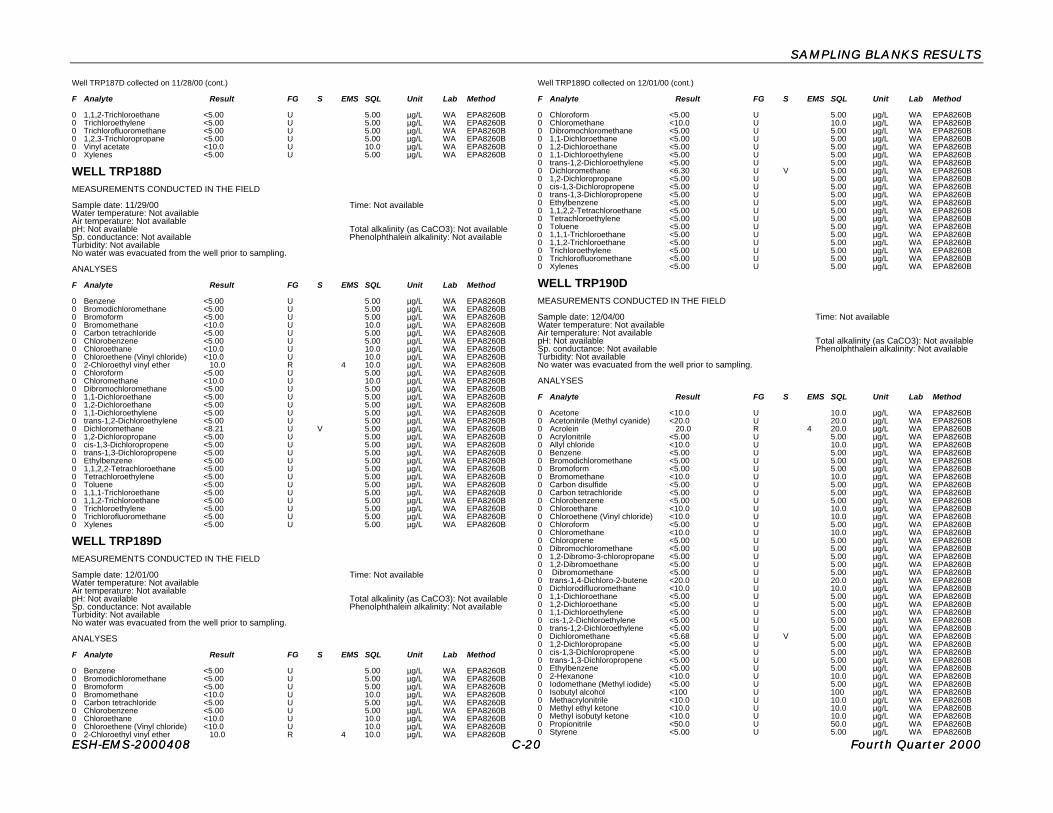
SAMPLING BLANKS RESULTSSAMPLING BLANKS RESULTS
ESH-EMS-2000408ESH-EMS-2000408 C-C-2020 Fourth Quarter 2000Fourth Quarter 2000
Well TRP187D collected on 11/28/00 (cont.)
F Analyte Result FG S EMS SQL Unit Lab Method
0 1,1,2-Trichloroethane <5.00 U 5.00 µg/L WA EPA8260B0 Trichloroethylene <5.00 U 5.00 µg/L WA EPA8260B0 Trichlorofluoromethane <5.00 U 5.00 µg/L WA EPA8260B0 1,2,3-Trichloropropane <5.00 U 5.00 µg/L WA EPA8260B0 Vinyl acetate <10.0 U 10.0 µg/L WA EPA8260B0 Xylenes <5.00 U 5.00 µg/L WA EPA8260B
WELL TRP188DMEASUREMENTS CONDUCTED IN THE FIELD
Sample date: 11/29/00 Time: Not availableWater temperature: Not availableAir temperature: Not availablepH: Not available Total alkalinity (as CaCO3): Not availableSp. conductance: Not available Phenolphthalein alkalinity: Not availableTurbidity: Not availableNo water was evacuated from the well prior to sampling.
ANALYSES
F Analyte Result FG S EMS SQL Unit Lab Method
0 Benzene <5.00 U 5.00 µg/L WA EPA8260B0 Bromodichloromethane <5.00 U 5.00 µg/L WA EPA8260B0 Bromoform <5.00 U 5.00 µg/L WA EPA8260B0 Bromomethane <10.0 U 10.0 µg/L WA EPA8260B0 Carbon tetrachloride <5.00 U 5.00 µg/L WA EPA8260B0 Chlorobenzene <5.00 U 5.00 µg/L WA EPA8260B0 Chloroethane <10.0 U 10.0 µg/L WA EPA8260B0 Chloroethene (Vinyl chloride) <10.0 U 10.0 µg/L WA EPA8260B0 2-Chloroethyl vinyl ether 10.0 R 4 10.0 µg/L WA EPA8260B0 Chloroform <5.00 U 5.00 µg/L WA EPA8260B0 Chloromethane <10.0 U 10.0 µg/L WA EPA8260B0 Dibromochloromethane <5.00 U 5.00 µg/L WA EPA8260B0 1,1-Dichloroethane <5.00 U 5.00 µg/L WA EPA8260B0 1,2-Dichloroethane <5.00 U 5.00 µg/L WA EPA8260B0 1,1-Dichloroethylene <5.00 U 5.00 µg/L WA EPA8260B0 trans-1,2-Dichloroethylene <5.00 U 5.00 µg/L WA EPA8260B0 Dichloromethane <8.21 U V 5.00 µg/L WA EPA8260B0 1,2-Dichloropropane <5.00 U 5.00 µg/L WA EPA8260B0 cis-1,3-Dichloropropene <5.00 U 5.00 µg/L WA EPA8260B0 trans-1,3-Dichloropropene <5.00 U 5.00 µg/L WA EPA8260B0 Ethylbenzene <5.00 U 5.00 µg/L WA EPA8260B0 1,1,2,2-Tetrachloroethane <5.00 U 5.00 µg/L WA EPA8260B0 Tetrachloroethylene <5.00 U 5.00 µg/L WA EPA8260B0 Toluene <5.00 U 5.00 µg/L WA EPA8260B0 1,1,1-Trichloroethane <5.00 U 5.00 µg/L WA EPA8260B0 1,1,2-Trichloroethane <5.00 U 5.00 µg/L WA EPA8260B0 Trichloroethylene <5.00 U 5.00 µg/L WA EPA8260B0 Trichlorofluoromethane <5.00 U 5.00 µg/L WA EPA8260B0 Xylenes <5.00 U 5.00 µg/L WA EPA8260B
WELL TRP189DMEASUREMENTS CONDUCTED IN THE FIELD
Sample date: 12/01/00 Time: Not availableWater temperature: Not availableAir temperature: Not availablepH: Not available Total alkalinity (as CaCO3): Not availableSp. conductance: Not available Phenolphthalein alkalinity: Not availableTurbidity: Not availableNo water was evacuated from the well prior to sampling.
ANALYSES
F Analyte Result FG S EMS SQL Unit Lab Method
0 Benzene <5.00 U 5.00 µg/L WA EPA8260B0 Bromodichloromethane <5.00 U 5.00 µg/L WA EPA8260B0 Bromoform <5.00 U 5.00 µg/L WA EPA8260B0 Bromomethane <10.0 U 10.0 µg/L WA EPA8260B0 Carbon tetrachloride <5.00 U 5.00 µg/L WA EPA8260B0 Chlorobenzene <5.00 U 5.00 µg/L WA EPA8260B0 Chloroethane <10.0 U 10.0 µg/L WA EPA8260B0 Chloroethene (Vinyl chloride) <10.0 U 10.0 µg/L WA EPA8260B0 2-Chloroethyl vinyl ether 10.0 R 4 10.0 µg/L WA EPA8260B
Well TRP189D collected on 12/01/00 (cont.)
F Analyte Result FG S EMS SQL Unit Lab Method
0 Chloroform <5.00 U 5.00 µg/L WA EPA8260B0 Chloromethane <10.0 U 10.0 µg/L WA EPA8260B0 Dibromochloromethane <5.00 U 5.00 µg/L WA EPA8260B0 1,1-Dichloroethane <5.00 U 5.00 µg/L WA EPA8260B0 1,2-Dichloroethane <5.00 U 5.00 µg/L WA EPA8260B0 1,1-Dichloroethylene <5.00 U 5.00 µg/L WA EPA8260B0 trans-1,2-Dichloroethylene <5.00 U 5.00 µg/L WA EPA8260B0 Dichloromethane <6.30 U V 5.00 µg/L WA EPA8260B0 1,2-Dichloropropane <5.00 U 5.00 µg/L WA EPA8260B0 cis-1,3-Dichloropropene <5.00 U 5.00 µg/L WA EPA8260B0 trans-1,3-Dichloropropene <5.00 U 5.00 µg/L WA EPA8260B0 Ethylbenzene <5.00 U 5.00 µg/L WA EPA8260B0 1,1,2,2-Tetrachloroethane <5.00 U 5.00 µg/L WA EPA8260B0 Tetrachloroethylene <5.00 U 5.00 µg/L WA EPA8260B0 Toluene <5.00 U 5.00 µg/L WA EPA8260B0 1,1,1-Trichloroethane <5.00 U 5.00 µg/L WA EPA8260B0 1,1,2-Trichloroethane <5.00 U 5.00 µg/L WA EPA8260B0 Trichloroethylene <5.00 U 5.00 µg/L WA EPA8260B0 Trichlorofluoromethane <5.00 U 5.00 µg/L WA EPA8260B0 Xylenes <5.00 U 5.00 µg/L WA EPA8260B
WELL TRP190DMEASUREMENTS CONDUCTED IN THE FIELD
Sample date: 12/04/00 Time: Not availableWater temperature: Not availableAir temperature: Not availablepH: Not available Total alkalinity (as CaCO3): Not availableSp. conductance: Not available Phenolphthalein alkalinity: Not availableTurbidity: Not availableNo water was evacuated from the well prior to sampling.
ANALYSES
F Analyte Result FG S EMS SQL Unit Lab Method
0 Acetone <10.0 U 10.0 µg/L WA EPA8260B0 Acetonitrile (Methyl cyanide) <20.0 U 20.0 µg/L WA EPA8260B0 Acrolein 20.0 R 4 20.0 µg/L WA EPA8260B0 Acrylonitrile <5.00 U 5.00 µg/L WA EPA8260B0 Allyl chloride <10.0 U 10.0 µg/L WA EPA8260B0 Benzene <5.00 U 5.00 µg/L WA EPA8260B0 Bromodichloromethane <5.00 U 5.00 µg/L WA EPA8260B0 Bromoform <5.00 U 5.00 µg/L WA EPA8260B0 Bromomethane <10.0 U 10.0 µg/L WA EPA8260B0 Carbon disulfide <5.00 U 5.00 µg/L WA EPA8260B0 Carbon tetrachloride <5.00 U 5.00 µg/L WA EPA8260B0 Chlorobenzene <5.00 U 5.00 µg/L WA EPA8260B0 Chloroethane <10.0 U 10.0 µg/L WA EPA8260B0 Chloroethene (Vinyl chloride) <10.0 U 10.0 µg/L WA EPA8260B0 Chloroform <5.00 U 5.00 µg/L WA EPA8260B0 Chloromethane <10.0 U 10.0 µg/L WA EPA8260B0 Chloroprene <5.00 U 5.00 µg/L WA EPA8260B0 Dibromochloromethane <5.00 U 5.00 µg/L WA EPA8260B0 1,2-Dibromo-3-chloropropane <5.00 U 5.00 µg/L WA EPA8260B0 1,2-Dibromoethane <5.00 U 5.00 µg/L WA EPA8260B0 Dibromomethane <5.00 U 5.00 µg/L WA EPA8260B0 trans-1,4-Dichloro-2-butene <20.0 U 20.0 µg/L WA EPA8260B0 Dichlorodifluoromethane <10.0 U 10.0 µg/L WA EPA8260B0 1,1-Dichloroethane <5.00 U 5.00 µg/L WA EPA8260B0 1,2-Dichloroethane <5.00 U 5.00 µg/L WA EPA8260B0 1,1-Dichloroethylene <5.00 U 5.00 µg/L WA EPA8260B0 cis-1,2-Dichloroethylene <5.00 U 5.00 µg/L WA EPA8260B0 trans-1,2-Dichloroethylene <5.00 U 5.00 µg/L WA EPA8260B0 Dichloromethane <5.68 U V 5.00 µg/L WA EPA8260B0 1,2-Dichloropropane <5.00 U 5.00 µg/L WA EPA8260B0 cis-1,3-Dichloropropene <5.00 U 5.00 µg/L WA EPA8260B0 trans-1,3-Dichloropropene <5.00 U 5.00 µg/L WA EPA8260B0 Ethylbenzene <5.00 U 5.00 µg/L WA EPA8260B0 2-Hexanone <10.0 U 10.0 µg/L WA EPA8260B0 Iodomethane (Methyl iodide) <5.00 U 5.00 µg/L WA EPA8260B0 Isobutyl alcohol <100 U 100 µg/L WA EPA8260B0 Methacrylonitrile <10.0 U 10.0 µg/L WA EPA8260B0 Methyl ethyl ketone <10.0 U 10.0 µg/L WA EPA8260B0 Methyl isobutyl ketone <10.0 U 10.0 µg/L WA EPA8260B0 Propionitrile <50.0 U 50.0 µg/L WA EPA8260B0 Styrene <5.00 U 5.00 µg/L WA EPA8260B
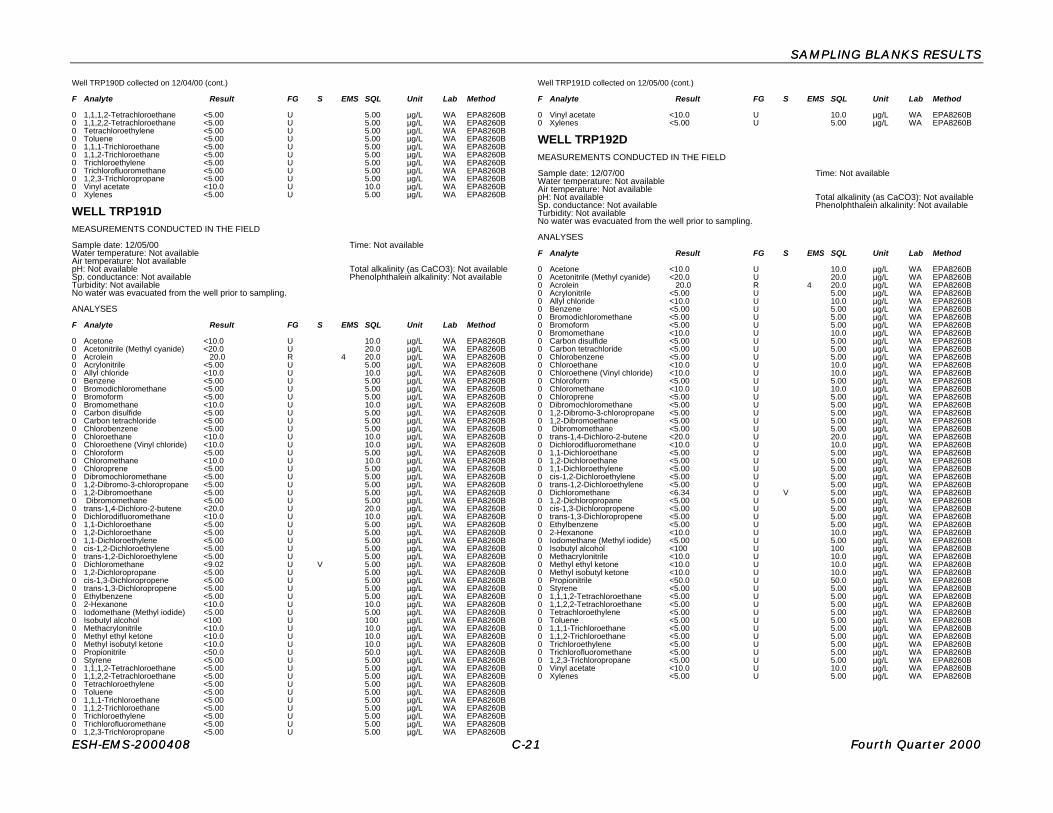
SAMPLING BLANKS RESULTSSAMPLING BLANKS RESULTS
ESH-EMS-2000408ESH-EMS-2000408 C-C-2121 Fourth Quarter 2000Fourth Quarter 2000
Well TRP190D collected on 12/04/00 (cont.)
F Analyte Result FG S EMS SQL Unit Lab Method
0 1,1,1,2-Tetrachloroethane <5.00 U 5.00 µg/L WA EPA8260B0 1,1,2,2-Tetrachloroethane <5.00 U 5.00 µg/L WA EPA8260B0 Tetrachloroethylene <5.00 U 5.00 µg/L WA EPA8260B0 Toluene <5.00 U 5.00 µg/L WA EPA8260B0 1,1,1-Trichloroethane <5.00 U 5.00 µg/L WA EPA8260B0 1,1,2-Trichloroethane <5.00 U 5.00 µg/L WA EPA8260B0 Trichloroethylene <5.00 U 5.00 µg/L WA EPA8260B0 Trichlorofluoromethane <5.00 U 5.00 µg/L WA EPA8260B0 1,2,3-Trichloropropane <5.00 U 5.00 µg/L WA EPA8260B0 Vinyl acetate <10.0 U 10.0 µg/L WA EPA8260B0 Xylenes <5.00 U 5.00 µg/L WA EPA8260B
WELL TRP191DMEASUREMENTS CONDUCTED IN THE FIELD
Sample date: 12/05/00 Time: Not availableWater temperature: Not availableAir temperature: Not availablepH: Not available Total alkalinity (as CaCO3): Not availableSp. conductance: Not available Phenolphthalein alkalinity: Not availableTurbidity: Not availableNo water was evacuated from the well prior to sampling.
ANALYSES
F Analyte Result FG S EMS SQL Unit Lab Method
0 Acetone <10.0 U 10.0 µg/L WA EPA8260B0 Acetonitrile (Methyl cyanide) <20.0 U 20.0 µg/L WA EPA8260B0 Acrolein 20.0 R 4 20.0 µg/L WA EPA8260B0 Acrylonitrile <5.00 U 5.00 µg/L WA EPA8260B0 Allyl chloride <10.0 U 10.0 µg/L WA EPA8260B0 Benzene <5.00 U 5.00 µg/L WA EPA8260B0 Bromodichloromethane <5.00 U 5.00 µg/L WA EPA8260B0 Bromoform <5.00 U 5.00 µg/L WA EPA8260B0 Bromomethane <10.0 U 10.0 µg/L WA EPA8260B0 Carbon disulfide <5.00 U 5.00 µg/L WA EPA8260B0 Carbon tetrachloride <5.00 U 5.00 µg/L WA EPA8260B0 Chlorobenzene <5.00 U 5.00 µg/L WA EPA8260B0 Chloroethane <10.0 U 10.0 µg/L WA EPA8260B0 Chloroethene (Vinyl chloride) <10.0 U 10.0 µg/L WA EPA8260B0 Chloroform <5.00 U 5.00 µg/L WA EPA8260B0 Chloromethane <10.0 U 10.0 µg/L WA EPA8260B0 Chloroprene <5.00 U 5.00 µg/L WA EPA8260B0 Dibromochloromethane <5.00 U 5.00 µg/L WA EPA8260B0 1,2-Dibromo-3-chloropropane <5.00 U 5.00 µg/L WA EPA8260B0 1,2-Dibromoethane <5.00 U 5.00 µg/L WA EPA8260B0 Dibromomethane <5.00 U 5.00 µg/L WA EPA8260B0 trans-1,4-Dichloro-2-butene <20.0 U 20.0 µg/L WA EPA8260B0 Dichlorodifluoromethane <10.0 U 10.0 µg/L WA EPA8260B0 1,1-Dichloroethane <5.00 U 5.00 µg/L WA EPA8260B0 1,2-Dichloroethane <5.00 U 5.00 µg/L WA EPA8260B0 1,1-Dichloroethylene <5.00 U 5.00 µg/L WA EPA8260B0 cis-1,2-Dichloroethylene <5.00 U 5.00 µg/L WA EPA8260B0 trans-1,2-Dichloroethylene <5.00 U 5.00 µg/L WA EPA8260B0 Dichloromethane <9.02 U V 5.00 µg/L WA EPA8260B0 1,2-Dichloropropane <5.00 U 5.00 µg/L WA EPA8260B0 cis-1,3-Dichloropropene <5.00 U 5.00 µg/L WA EPA8260B0 trans-1,3-Dichloropropene <5.00 U 5.00 µg/L WA EPA8260B0 Ethylbenzene <5.00 U 5.00 µg/L WA EPA8260B0 2-Hexanone <10.0 U 10.0 µg/L WA EPA8260B0 Iodomethane (Methyl iodide) <5.00 U 5.00 µg/L WA EPA8260B0 Isobutyl alcohol <100 U 100 µg/L WA EPA8260B0 Methacrylonitrile <10.0 U 10.0 µg/L WA EPA8260B0 Methyl ethyl ketone <10.0 U 10.0 µg/L WA EPA8260B0 Methyl isobutyl ketone <10.0 U 10.0 µg/L WA EPA8260B0 Propionitrile <50.0 U 50.0 µg/L WA EPA8260B0 Styrene <5.00 U 5.00 µg/L WA EPA8260B0 1,1,1,2-Tetrachloroethane <5.00 U 5.00 µg/L WA EPA8260B0 1,1,2,2-Tetrachloroethane <5.00 U 5.00 µg/L WA EPA8260B0 Tetrachloroethylene <5.00 U 5.00 µg/L WA EPA8260B0 Toluene <5.00 U 5.00 µg/L WA EPA8260B0 1,1,1-Trichloroethane <5.00 U 5.00 µg/L WA EPA8260B0 1,1,2-Trichloroethane <5.00 U 5.00 µg/L WA EPA8260B0 Trichloroethylene <5.00 U 5.00 µg/L WA EPA8260B0 Trichlorofluoromethane <5.00 U 5.00 µg/L WA EPA8260B0 1,2,3-Trichloropropane <5.00 U 5.00 µg/L WA EPA8260B
Well TRP191D collected on 12/05/00 (cont.)
F Analyte Result FG S EMS SQL Unit Lab Method
0 Vinyl acetate <10.0 U 10.0 µg/L WA EPA8260B0 Xylenes <5.00 U 5.00 µg/L WA EPA8260B
WELL TRP192DMEASUREMENTS CONDUCTED IN THE FIELD
Sample date: 12/07/00 Time: Not availableWater temperature: Not availableAir temperature: Not availablepH: Not available Total alkalinity (as CaCO3): Not availableSp. conductance: Not available Phenolphthalein alkalinity: Not availableTurbidity: Not availableNo water was evacuated from the well prior to sampling.
ANALYSES
F Analyte Result FG S EMS SQL Unit Lab Method
0 Acetone <10.0 U 10.0 µg/L WA EPA8260B0 Acetonitrile (Methyl cyanide) <20.0 U 20.0 µg/L WA EPA8260B0 Acrolein 20.0 R 4 20.0 µg/L WA EPA8260B0 Acrylonitrile <5.00 U 5.00 µg/L WA EPA8260B0 Allyl chloride <10.0 U 10.0 µg/L WA EPA8260B0 Benzene <5.00 U 5.00 µg/L WA EPA8260B0 Bromodichloromethane <5.00 U 5.00 µg/L WA EPA8260B0 Bromoform <5.00 U 5.00 µg/L WA EPA8260B0 Bromomethane <10.0 U 10.0 µg/L WA EPA8260B0 Carbon disulfide <5.00 U 5.00 µg/L WA EPA8260B0 Carbon tetrachloride <5.00 U 5.00 µg/L WA EPA8260B0 Chlorobenzene <5.00 U 5.00 µg/L WA EPA8260B0 Chloroethane <10.0 U 10.0 µg/L WA EPA8260B0 Chloroethene (Vinyl chloride) <10.0 U 10.0 µg/L WA EPA8260B0 Chloroform <5.00 U 5.00 µg/L WA EPA8260B0 Chloromethane <10.0 U 10.0 µg/L WA EPA8260B0 Chloroprene <5.00 U 5.00 µg/L WA EPA8260B0 Dibromochloromethane <5.00 U 5.00 µg/L WA EPA8260B0 1,2-Dibromo-3-chloropropane <5.00 U 5.00 µg/L WA EPA8260B0 1,2-Dibromoethane <5.00 U 5.00 µg/L WA EPA8260B0 Dibromomethane <5.00 U 5.00 µg/L WA EPA8260B0 trans-1,4-Dichloro-2-butene <20.0 U 20.0 µg/L WA EPA8260B0 Dichlorodifluoromethane <10.0 U 10.0 µg/L WA EPA8260B0 1,1-Dichloroethane <5.00 U 5.00 µg/L WA EPA8260B0 1,2-Dichloroethane <5.00 U 5.00 µg/L WA EPA8260B0 1,1-Dichloroethylene <5.00 U 5.00 µg/L WA EPA8260B0 cis-1,2-Dichloroethylene <5.00 U 5.00 µg/L WA EPA8260B0 trans-1,2-Dichloroethylene <5.00 U 5.00 µg/L WA EPA8260B0 Dichloromethane <6.34 U V 5.00 µg/L WA EPA8260B0 1,2-Dichloropropane <5.00 U 5.00 µg/L WA EPA8260B0 cis-1,3-Dichloropropene <5.00 U 5.00 µg/L WA EPA8260B0 trans-1,3-Dichloropropene <5.00 U 5.00 µg/L WA EPA8260B0 Ethylbenzene <5.00 U 5.00 µg/L WA EPA8260B0 2-Hexanone <10.0 U 10.0 µg/L WA EPA8260B0 Iodomethane (Methyl iodide) <5.00 U 5.00 µg/L WA EPA8260B0 Isobutyl alcohol <100 U 100 µg/L WA EPA8260B0 Methacrylonitrile <10.0 U 10.0 µg/L WA EPA8260B0 Methyl ethyl ketone <10.0 U 10.0 µg/L WA EPA8260B0 Methyl isobutyl ketone <10.0 U 10.0 µg/L WA EPA8260B0 Propionitrile <50.0 U 50.0 µg/L WA EPA8260B0 Styrene <5.00 U 5.00 µg/L WA EPA8260B0 1,1,1,2-Tetrachloroethane <5.00 U 5.00 µg/L WA EPA8260B0 1,1,2,2-Tetrachloroethane <5.00 U 5.00 µg/L WA EPA8260B0 Tetrachloroethylene <5.00 U 5.00 µg/L WA EPA8260B0 Toluene <5.00 U 5.00 µg/L WA EPA8260B0 1,1,1-Trichloroethane <5.00 U 5.00 µg/L WA EPA8260B0 1,1,2-Trichloroethane <5.00 U 5.00 µg/L WA EPA8260B0 Trichloroethylene <5.00 U 5.00 µg/L WA EPA8260B0 Trichlorofluoromethane <5.00 U 5.00 µg/L WA EPA8260B0 1,2,3-Trichloropropane <5.00 U 5.00 µg/L WA EPA8260B0 Vinyl acetate <10.0 U 10.0 µg/L WA EPA8260B0 Xylenes <5.00 U 5.00 µg/L WA EPA8260B

SAMPLING BLANKS RESULTSSAMPLING BLANKS RESULTS
ESH-EMS-2000408ESH-EMS-2000408 C-C-2222 Fourth Quarter 2000Fourth Quarter 2000
WELL TRP193DMEASUREMENTS CONDUCTED IN THE FIELD
Sample date: 12/18/00 Time: Not availableWater temperature: Not availableAir temperature: Not availablepH: Not available Total alkalinity (as CaCO3): Not availableSp. conductance: Not available Phenolphthalein alkalinity: Not availableTurbidity: Not availableNo water was evacuated from the well prior to sampling.
ANALYSES
F Analyte Result FG S EMS SQL Unit Lab Method
0 Acetone <10.0 U 10.0 µg/L WA EPA8260B0 Acetonitrile (Methyl cyanide) <20.0 U 20.0 µg/L WA EPA8260B0 Acrolein 20.0 R 4 20.0 µg/L WA EPA8260B0 Acrylonitrile <5.00 U 5.00 µg/L WA EPA8260B0 Allyl chloride <10.0 U 10.0 µg/L WA EPA8260B0 Benzene <5.00 U 5.00 µg/L WA EPA8260B0 Bromodichloromethane <5.00 U 5.00 µg/L WA EPA8260B0 Bromoform <5.00 U 5.00 µg/L WA EPA8260B0 Bromomethane <10.0 U 10.0 µg/L WA EPA8260B0 Carbon disulfide <5.00 U 5.00 µg/L WA EPA8260B0 Carbon tetrachloride <5.00 U 5.00 µg/L WA EPA8260B0 Chlorobenzene <5.00 U 5.00 µg/L WA EPA8260B0 Chloroethane <10.0 U 10.0 µg/L WA EPA8260B0 Chloroethene (Vinyl chloride) <10.0 U 10.0 µg/L WA EPA8260B0 Chloroform <5.00 U 5.00 µg/L WA EPA8260B0 Chloromethane <10.0 U 10.0 µg/L WA EPA8260B0 Chloroprene <5.00 U 5.00 µg/L WA EPA8260B0 Dibromochloromethane <5.00 U 5.00 µg/L WA EPA8260B0 1,2-Dibromo-3-chloropropane <5.00 U 5.00 µg/L WA EPA8260B0 1,2-Dibromoethane <5.00 U 5.00 µg/L WA EPA8260B0 Dibromomethane <5.00 U 5.00 µg/L WA EPA8260B0 trans-1,4-Dichloro-2-butene <20.0 U 20.0 µg/L WA EPA8260B0 Dichlorodifluoromethane <10.0 U 10.0 µg/L WA EPA8260B0 1,1-Dichloroethane <5.00 U 5.00 µg/L WA EPA8260B0 1,2-Dichloroethane <5.00 U 5.00 µg/L WA EPA8260B0 1,1-Dichloroethylene <5.00 U 5.00 µg/L WA EPA8260B0 cis-1,2-Dichloroethylene <5.00 U 5.00 µg/L WA EPA8260B0 trans-1,2-Dichloroethylene <5.00 U 5.00 µg/L WA EPA8260B0 Dichloromethane <14.3 U V 5.00 µg/L WA EPA8260B0 1,2-Dichloropropane <5.00 U 5.00 µg/L WA EPA8260B0 cis-1,3-Dichloropropene <5.00 U 5.00 µg/L WA EPA8260B0 trans-1,3-Dichloropropene <5.00 U 5.00 µg/L WA EPA8260B0 Ethylbenzene <5.00 U 5.00 µg/L WA EPA8260B0 2-Hexanone <10.0 U 10.0 µg/L WA EPA8260B0 Iodomethane (Methyl iodide) <5.00 U 5.00 µg/L WA EPA8260B0 Isobutyl alcohol <100 U 100 µg/L WA EPA8260B0 Methacrylonitrile <10.0 U 10.0 µg/L WA EPA8260B0 Methyl ethyl ketone <10.0 U 10.0 µg/L WA EPA8260B0 Methyl isobutyl ketone <10.0 U 10.0 µg/L WA EPA8260B0 Propionitrile <50.0 U 50.0 µg/L WA EPA8260B0 Styrene <5.00 U 5.00 µg/L WA EPA8260B0 1,1,1,2-Tetrachloroethane <5.00 U 5.00 µg/L WA EPA8260B0 1,1,2,2-Tetrachloroethane <5.00 U 5.00 µg/L WA EPA8260B0 Tetrachloroethylene <5.00 U 5.00 µg/L WA EPA8260B0 Toluene <5.00 U 5.00 µg/L WA EPA8260B0 1,1,1-Trichloroethane <5.00 U 5.00 µg/L WA EPA8260B0 1,1,2-Trichloroethane <5.00 U 5.00 µg/L WA EPA8260B0 Trichloroethylene <5.00 U 5.00 µg/L WA EPA8260B0 Trichlorofluoromethane <5.00 U 5.00 µg/L WA EPA8260B0 1,2,3-Trichloropropane <5.00 U 5.00 µg/L WA EPA8260B0 Vinyl acetate <10.0 U 10.0 µg/L WA EPA8260B0 Xylenes <5.00 U 5.00 µg/L WA EPA8260B
WELL TRP194DMEASUREMENTS CONDUCTED IN THE FIELD
Sample date: 12/20/00 Time: Not availableWater temperature: Not availableAir temperature: Not availablepH: Not available Total alkalinity (as CaCO3): Not availableSp. conductance: Not available Phenolphthalein alkalinity: Not availableTurbidity: Not availableNo water was evacuated from the well prior to sampling.
ANALYSES
F Analyte Result FG S EMS SQL Unit Lab Method
0 Acetone <10.0 U 10.0 µg/L WA EPA8260B0 Acetonitrile (Methyl cyanide) <20.0 U 20.0 µg/L WA EPA8260B0 Acrolein 20.0 R 4 20.0 µg/L WA EPA8260B0 Acrylonitrile <5.00 U 5.00 µg/L WA EPA8260B0 Allyl chloride <10.0 U 10.0 µg/L WA EPA8260B0 Benzene <5.00 U 5.00 µg/L WA EPA8260B0 Bromodichloromethane <5.00 U 5.00 µg/L WA EPA8260B0 Bromoform <5.00 U 5.00 µg/L WA EPA8260B0 Bromomethane <10.0 U 10.0 µg/L WA EPA8260B0 Carbon disulfide <5.00 U 5.00 µg/L WA EPA8260B0 Carbon tetrachloride <5.00 U 5.00 µg/L WA EPA8260B0 Chlorobenzene <5.00 U 5.00 µg/L WA EPA8260B0 Chloroethane <10.0 U 10.0 µg/L WA EPA8260B0 Chloroethene (Vinyl chloride) <10.0 U 10.0 µg/L WA EPA8260B0 Chloroform <5.00 U 5.00 µg/L WA EPA8260B0 Chloromethane <10.0 U 10.0 µg/L WA EPA8260B0 Chloroprene <5.00 U 5.00 µg/L WA EPA8260B0 Dibromochloromethane <5.00 U 5.00 µg/L WA EPA8260B0 1,2-Dibromo-3-chloropropane <5.00 U 5.00 µg/L WA EPA8260B0 1,2-Dibromoethane <5.00 U 5.00 µg/L WA EPA8260B0 Dibromomethane <5.00 U 5.00 µg/L WA EPA8260B0 trans-1,4-Dichloro-2-butene <20.0 U 20.0 µg/L WA EPA8260B0 Dichlorodifluoromethane <10.0 U 10.0 µg/L WA EPA8260B0 1,1-Dichloroethane <5.00 U 5.00 µg/L WA EPA8260B0 1,2-Dichloroethane <5.00 U 5.00 µg/L WA EPA8260B0 1,1-Dichloroethylene <5.00 U 5.00 µg/L WA EPA8260B0 cis-1,2-Dichloroethylene <5.00 U 5.00 µg/L WA EPA8260B0 trans-1,2-Dichloroethylene <5.00 U 5.00 µg/L WA EPA8260B2 Dichloromethane 6.70 5.00 µg/L WA EPA8260B0 1,2-Dichloropropane <5.00 U 5.00 µg/L WA EPA8260B0 cis-1,3-Dichloropropene <5.00 U 5.00 µg/L WA EPA8260B0 trans-1,3-Dichloropropene <5.00 U 5.00 µg/L WA EPA8260B0 Ethylbenzene <5.00 U 5.00 µg/L WA EPA8260B0 2-Hexanone <10.0 U 10.0 µg/L WA EPA8260B0 Iodomethane (Methyl iodide) <5.00 U 5.00 µg/L WA EPA8260B0 Isobutyl alcohol <100 U 100 µg/L WA EPA8260B0 Methacrylonitrile <10.0 U 10.0 µg/L WA EPA8260B0 Methyl ethyl ketone <10.0 U 10.0 µg/L WA EPA8260B0 Methyl isobutyl ketone <10.0 U 10.0 µg/L WA EPA8260B0 Propionitrile <50.0 U 50.0 µg/L WA EPA8260B0 Styrene <5.00 U 5.00 µg/L WA EPA8260B0 1,1,1,2-Tetrachloroethane <5.00 U 5.00 µg/L WA EPA8260B0 1,1,2,2-Tetrachloroethane <5.00 U 5.00 µg/L WA EPA8260B0 Tetrachloroethylene <5.00 U 5.00 µg/L WA EPA8260B0 Toluene <5.00 U 5.00 µg/L WA EPA8260B0 1,1,1-Trichloroethane <5.00 U 5.00 µg/L WA EPA8260B0 1,1,2-Trichloroethane <5.00 U 5.00 µg/L WA EPA8260B0 Trichloroethylene <5.00 U 5.00 µg/L WA EPA8260B0 Trichlorofluoromethane <5.00 U 5.00 µg/L WA EPA8260B0 1,2,3-Trichloropropane <5.00 U 5.00 µg/L WA EPA8260B0 Vinyl acetate <10.0 U 10.0 µg/L WA EPA8260B0 Xylenes <5.00 U 5.00 µg/L WA EPA8260B

SAMPLING BLANKS RESULTSSAMPLING BLANKS RESULTS
ESH-EMS-2000408ESH-EMS-2000408 C-C-2323 Fourth Quarter 2000Fourth Quarter 2000
WELL TRP195DMEASUREMENTS CONDUCTED IN THE FIELD
Sample date: 12/20/00 Time: Not availableWater temperature: Not availableAir temperature: Not availablepH: Not available Total alkalinity (as CaCO3): Not availableSp. conductance: Not available Phenolphthalein alkalinity: Not availableTurbidity: Not availableNo water was evacuated from the well prior to sampling.
ANALYSES
F Analyte Result FG S EMS SQL Unit Lab Method
0 Acetone <10.0 U 10.0 µg/L WA EPA8260B0 Acetonitrile (Methyl cyanide) <20.0 U 20.0 µg/L WA EPA8260B0 Acrolein 20.0 R 4 20.0 µg/L WA EPA8260B0 Acrylonitrile <5.00 U 5.00 µg/L WA EPA8260B0 Allyl chloride <10.0 U 10.0 µg/L WA EPA8260B0 Benzene <5.00 U 5.00 µg/L WA EPA8260B0 Bromodichloromethane <5.00 U 5.00 µg/L WA EPA8260B0 Bromoform <5.00 U 5.00 µg/L WA EPA8260B0 Bromomethane <10.0 U 10.0 µg/L WA EPA8260B0 Carbon disulfide <5.00 U 5.00 µg/L WA EPA8260B0 Carbon tetrachloride <5.00 U 5.00 µg/L WA EPA8260B0 Chlorobenzene <5.00 U 5.00 µg/L WA EPA8260B0 Chloroethane <10.0 U 10.0 µg/L WA EPA8260B0 Chloroethene (Vinyl chloride) <10.0 U 10.0 µg/L WA EPA8260B0 Chloroform <5.00 U 5.00 µg/L WA EPA8260B0 Chloromethane <10.0 U 10.0 µg/L WA EPA8260B0 Chloroprene <5.00 U 5.00 µg/L WA EPA8260B0 Dibromochloromethane <5.00 U 5.00 µg/L WA EPA8260B0 1,2-Dibromo-3-chloropropane <5.00 U 5.00 µg/L WA EPA8260B0 1,2-Dibromoethane <5.00 U 5.00 µg/L WA EPA8260B0 Dibromomethane <5.00 U 5.00 µg/L WA EPA8260B0 trans-1,4-Dichloro-2-butene <20.0 U 20.0 µg/L WA EPA8260B0 Dichlorodifluoromethane <10.0 U 10.0 µg/L WA EPA8260B0 1,1-Dichloroethane <5.00 U 5.00 µg/L WA EPA8260B0 1,2-Dichloroethane <5.00 U 5.00 µg/L WA EPA8260B0 1,1-Dichloroethylene <5.00 U 5.00 µg/L WA EPA8260B0 cis-1,2-Dichloroethylene <5.00 U 5.00 µg/L WA EPA8260B0 trans-1,2-Dichloroethylene <5.00 U 5.00 µg/L WA EPA8260B2 Dichloromethane 8.24 5.00 µg/L WA EPA8260B0 1,2-Dichloropropane <5.00 U 5.00 µg/L WA EPA8260B0 cis-1,3-Dichloropropene <5.00 U 5.00 µg/L WA EPA8260B0 trans-1,3-Dichloropropene <5.00 U 5.00 µg/L WA EPA8260B0 Ethylbenzene <5.00 U 5.00 µg/L WA EPA8260B0 2-Hexanone <10.0 U 10.0 µg/L WA EPA8260B0 Iodomethane (Methyl iodide) <5.00 U 5.00 µg/L WA EPA8260B0 Isobutyl alcohol <100 U 100 µg/L WA EPA8260B0 Methacrylonitrile <10.0 U 10.0 µg/L WA EPA8260B0 Methyl ethyl ketone <10.0 U 10.0 µg/L WA EPA8260B0 Methyl isobutyl ketone <10.0 U 10.0 µg/L WA EPA8260B0 Propionitrile <50.0 U 50.0 µg/L WA EPA8260B0 Styrene <5.00 U 5.00 µg/L WA EPA8260B0 1,1,1,2-Tetrachloroethane <5.00 U 5.00 µg/L WA EPA8260B0 1,1,2,2-Tetrachloroethane <5.00 U 5.00 µg/L WA EPA8260B0 Tetrachloroethylene <5.00 U 5.00 µg/L WA EPA8260B0 Toluene <5.00 U 5.00 µg/L WA EPA8260B0 1,1,1-Trichloroethane <5.00 U 5.00 µg/L WA EPA8260B0 1,1,2-Trichloroethane <5.00 U 5.00 µg/L WA EPA8260B0 Trichloroethylene <5.00 U 5.00 µg/L WA EPA8260B0 Trichlorofluoromethane <5.00 U 5.00 µg/L WA EPA8260B0 1,2,3-Trichloropropane <5.00 U 5.00 µg/L WA EPA8260B0 Vinyl acetate <10.0 U 10.0 µg/L WA EPA8260B0 Xylenes <5.00 U 5.00 µg/L WA EPA8260B
WELL TRP196DMEASUREMENTS CONDUCTED IN THE FIELD
Sample date: 12/21/00 Time: Not availableWater temperature: Not availableAir temperature: Not availablepH: Not available Total alkalinity (as CaCO3): Not availableSp. conductance: Not available Phenolphthalein alkalinity: Not availableTurbidity: Not availableNo water was evacuated from the well prior to sampling.
ANALYSES
F Analyte Result FG S EMS SQL Unit Lab Method
0 Acetone <6.00 U V 10.0 µg/L WA EPA8260B0 Acetonitrile (Methyl cyanide) <20.0 U 20.0 µg/L WA EPA8260B0 Acrolein 20.0 R 4 20.0 µg/L WA EPA8260B0 Acrylonitrile <5.00 U 5.00 µg/L WA EPA8260B0 Allyl chloride <10.0 U 10.0 µg/L WA EPA8260B0 Benzene <5.00 U 5.00 µg/L WA EPA8260B0 Bromodichloromethane <5.00 U 5.00 µg/L WA EPA8260B0 Bromoform <5.00 U 5.00 µg/L WA EPA8260B0 Bromomethane <10.0 U 10.0 µg/L WA EPA8260B0 Carbon disulfide <5.00 U 5.00 µg/L WA EPA8260B0 Carbon tetrachloride <5.00 U 5.00 µg/L WA EPA8260B0 Chlorobenzene <5.00 U 5.00 µg/L WA EPA8260B0 Chloroethane <10.0 U 10.0 µg/L WA EPA8260B0 Chloroethene (Vinyl chloride) <10.0 U 10.0 µg/L WA EPA8260B0 Chloroform <5.00 U 5.00 µg/L WA EPA8260B0 Chloromethane <10.0 U 10.0 µg/L WA EPA8260B0 Chloroprene <5.00 U 5.00 µg/L WA EPA8260B0 Dibromochloromethane <5.00 U 5.00 µg/L WA EPA8260B0 1,2-Dibromo-3-chloropropane <5.00 U 5.00 µg/L WA EPA8260B0 1,2-Dibromoethane <5.00 U 5.00 µg/L WA EPA8260B0 Dibromomethane <5.00 U 5.00 µg/L WA EPA8260B0 trans-1,4-Dichloro-2-butene <20.0 U 20.0 µg/L WA EPA8260B0 Dichlorodifluoromethane <10.0 U 10.0 µg/L WA EPA8260B0 1,1-Dichloroethane <5.00 U 5.00 µg/L WA EPA8260B0 1,2-Dichloroethane <5.00 U 5.00 µg/L WA EPA8260B0 1,1-Dichloroethylene <5.00 U 5.00 µg/L WA EPA8260B0 cis-1,2-Dichloroethylene <5.00 U 5.00 µg/L WA EPA8260B0 trans-1,2-Dichloroethylene <5.00 U 5.00 µg/L WA EPA8260B0 Dichloromethane <7.10 U V 5.00 µg/L WA EPA8260B0 1,2-Dichloropropane <5.00 U 5.00 µg/L WA EPA8260B0 cis-1,3-Dichloropropene <5.00 U 5.00 µg/L WA EPA8260B0 trans-1,3-Dichloropropene <5.00 U 5.00 µg/L WA EPA8260B0 Ethylbenzene <5.00 U 5.00 µg/L WA EPA8260B0 2-Hexanone <10.0 U 10.0 µg/L WA EPA8260B0 Iodomethane (Methyl iodide) <5.00 U 5.00 µg/L WA EPA8260B0 Isobutyl alcohol <100 U 100 µg/L WA EPA8260B0 Methacrylonitrile <10.0 U 10.0 µg/L WA EPA8260B0 Methyl ethyl ketone <10.0 U 10.0 µg/L WA EPA8260B0 Methyl isobutyl ketone <10.0 U 10.0 µg/L WA EPA8260B0 Propionitrile <50.0 U 50.0 µg/L WA EPA8260B0 Styrene <5.00 U 5.00 µg/L WA EPA8260B0 1,1,1,2-Tetrachloroethane <5.00 U 5.00 µg/L WA EPA8260B0 1,1,2,2-Tetrachloroethane <5.00 U 5.00 µg/L WA EPA8260B0 Tetrachloroethylene <5.00 U 5.00 µg/L WA EPA8260B0 Toluene <5.00 U 5.00 µg/L WA EPA8260B0 1,1,1-Trichloroethane <5.00 U 5.00 µg/L WA EPA8260B0 1,1,2-Trichloroethane <5.00 U 5.00 µg/L WA EPA8260B0 Trichloroethylene <5.00 U 5.00 µg/L WA EPA8260B0 Trichlorofluoromethane <5.00 U 5.00 µg/L WA EPA8260B0 1,2,3-Trichloropropane <5.00 U 5.00 µg/L WA EPA8260B0 Vinyl acetate <10.0 U 10.0 µg/L WA EPA8260B0 Xylenes <5.00 U 5.00 µg/L WA EPA8260B

SAMPLING BLANKS RESULTSSAMPLING BLANKS RESULTS
ESH-EMS-2000408ESH-EMS-2000408 C-C-2424 Fourth Quarter 2000Fourth Quarter 2000
WELL TRP202DMEASUREMENTS CONDUCTED IN THE FIELD
Sample date: 11/17/00 Time: Not availableWater temperature: Not availableAir temperature: Not availablepH: Not available Total alkalinity (as CaCO3): Not availableSp. conductance: Not available Phenolphthalein alkalinity: Not availableTurbidity: Not availableNo water was evacuated from the well prior to sampling.
ANALYSES
F Analyte Result FG S EMS SQL Unit Lab Method
0 Benzene <5.00 U 5.00 µg/L WA EPA8260B0 Bromodichloromethane <5.00 U 5.00 µg/L WA EPA8260B0 Bromoform <5.00 U 5.00 µg/L WA EPA8260B0 Bromomethane <10.0 U 10.0 µg/L WA EPA8260B0 Carbon tetrachloride <5.00 U 5.00 µg/L WA EPA8260B0 Chlorobenzene <5.00 U 5.00 µg/L WA EPA8260B0 Chloroethane <10.0 U 10.0 µg/L WA EPA8260B0 Chloroethene (Vinyl chloride) <10.0 U 10.0 µg/L WA EPA8260B0 2-Chloroethyl vinyl ether 10.0 R 4 10.0 µg/L WA EPA8260B0 Chloroform <5.00 U 5.00 µg/L WA EPA8260B0 Chloromethane <10.0 U 10.0 µg/L WA EPA8260B0 Dibromochloromethane <5.00 U 5.00 µg/L WA EPA8260B0 1,1-Dichloroethane <5.00 U 5.00 µg/L WA EPA8260B0 1,2-Dichloroethane <5.00 U 5.00 µg/L WA EPA8260B0 1,1-Dichloroethylene <5.00 U 5.00 µg/L WA EPA8260B0 trans-1,2-Dichloroethylene <5.00 U 5.00 µg/L WA EPA8260B0 Dichloromethane <8.91 U V 5.00 µg/L WA EPA8260B0 1,2-Dichloropropane <5.00 U 5.00 µg/L WA EPA8260B0 cis-1,3-Dichloropropene <5.00 U 5.00 µg/L WA EPA8260B0 trans-1,3-Dichloropropene <5.00 U 5.00 µg/L WA EPA8260B0 Ethylbenzene <5.00 U 5.00 µg/L WA EPA8260B0 1,1,2,2-Tetrachloroethane <5.00 U 5.00 µg/L WA EPA8260B0 Tetrachloroethylene <5.00 U 5.00 µg/L WA EPA8260B0 Toluene <5.00 U 5.00 µg/L WA EPA8260B0 1,1,1-Trichloroethane <5.00 U 5.00 µg/L WA EPA8260B0 1,1,2-Trichloroethane <5.00 U 5.00 µg/L WA EPA8260B0 Trichloroethylene <5.00 U 5.00 µg/L WA EPA8260B0 Trichlorofluoromethane <5.00 U 5.00 µg/L WA EPA8260B0 Xylenes <5.00 U 5.00 µg/L WA EPA8260B
WELL TRP203CMEASUREMENTS CONDUCTED IN THE FIELD
Sample date: 11/01/00 Time: Not availableWater temperature: Not availableAir temperature: Not availablepH: Not available Total alkalinity (as CaCO3): Not availableSp. conductance: Not available Phenolphthalein alkalinity: Not availableTurbidity: Not availableNo water was evacuated from the well prior to sampling.
ANALYSES
F Analyte Result FG S EMS SQL Unit Lab Method
0 Benzene <5.00 U 5.00 µg/L WA EPA8260B0 Bromodichloromethane <5.00 U 5.00 µg/L WA EPA8260B0 Bromoform <5.00 U 5.00 µg/L WA EPA8260B0 Bromomethane <10.0 U 10.0 µg/L WA EPA8260B0 Carbon tetrachloride <5.00 U 5.00 µg/L WA EPA8260B0 Chlorobenzene <5.00 U 5.00 µg/L WA EPA8260B0 Chloroethane <10.0 U 10.0 µg/L WA EPA8260B0 Chloroethene (Vinyl chloride) <10.0 U 10.0 µg/L WA EPA8260B0 2-Chloroethyl vinyl ether 10.0 R 4 10.0 µg/L WA EPA8260B0 Chloroform <5.00 U 5.00 µg/L WA EPA8260B0 Chloromethane <10.0 U 10.0 µg/L WA EPA8260B0 Dibromochloromethane <5.00 U 5.00 µg/L WA EPA8260B0 1,1-Dichloroethane <5.00 U 5.00 µg/L WA EPA8260B0 1,2-Dichloroethane <5.00 U 5.00 µg/L WA EPA8260B0 1,1-Dichloroethylene <5.00 U 5.00 µg/L WA EPA8260B0 trans-1,2-Dichloroethylene <5.00 U 5.00 µg/L WA EPA8260B0 Dichloromethane <5.24 U V 5.00 µg/L WA EPA8260B0 1,2-Dichloropropane <5.00 U 5.00 µg/L WA EPA8260B0 cis-1,3-Dichloropropene <5.00 U 5.00 µg/L WA EPA8260B0 trans-1,3-Dichloropropene <5.00 U 5.00 µg/L WA EPA8260B
Well TRP203C collected on 11/01/00 (cont.)
F Analyte Result FG S EMS SQL Unit Lab Method
0 Ethylbenzene <5.00 U 5.00 µg/L WA EPA8260B0 1,1,2,2-Tetrachloroethane <5.00 U 5.00 µg/L WA EPA8260B0 Tetrachloroethylene <5.00 U 5.00 µg/L WA EPA8260B0 Toluene <5.00 U 5.00 µg/L WA EPA8260B0 1,1,1-Trichloroethane <5.00 U 5.00 µg/L WA EPA8260B0 1,1,2-Trichloroethane <5.00 U 5.00 µg/L WA EPA8260B0 Trichloroethylene <5.00 U 5.00 µg/L WA EPA8260B0 Trichlorofluoromethane <5.00 U 5.00 µg/L WA EPA8260B0 Xylenes <5.00 U 5.00 µg/L WA EPA8260B
WELL TRP204DMEASUREMENTS CONDUCTED IN THE FIELD
Sample date: 11/27/00 Time: Not availableWater temperature: Not availableAir temperature: Not availablepH: Not available Total alkalinity (as CaCO3): Not availableSp. conductance: Not available Phenolphthalein alkalinity: Not availableTurbidity: Not availableNo water was evacuated from the well prior to sampling.
ANALYSES
F Analyte Result FG S EMS SQL Unit Lab Method
0 Benzene <5.00 U 5.00 µg/L EX EPA8260B0 Bromodichloromethane <5.00 U 5.00 µg/L EX EPA8260B0 Bromoform <5.00 U 5.00 µg/L EX EPA8260B0 Bromomethane <5.00 U 5.00 µg/L EX EPA8260B0 Carbon tetrachloride <5.00 U 5.00 µg/L EX EPA8260B0 Chlorobenzene <5.00 U 5.00 µg/L EX EPA8260B0 Chloroethane <5.00 U 5.00 µg/L EX EPA8260B0 Chloroethene (Vinyl chloride) <5.00 U 5.00 µg/L EX EPA8260B0 2-Chloroethyl vinyl ether <5.00 U 5.00 µg/L EX EPA8260B0 Chloroform <5.00 U 5.00 µg/L EX EPA8260B0 Chloromethane <5.00 U 5.00 µg/L EX EPA8260B0 Dibromochloromethane <5.00 U 5.00 µg/L EX EPA8260B0 1,1-Dichloroethane <5.00 U 5.00 µg/L EX EPA8260B0 1,2-Dichloroethane <5.00 U 5.00 µg/L EX EPA8260B0 1,1-Dichloroethylene <5.00 U 5.00 µg/L EX EPA8260B0 cis-1,2-Dichloroethylene <5.00 U 5.00 µg/L EX EPA8260B0 trans-1,2-Dichloroethylene <5.00 U 5.00 µg/L EX EPA8260B0 Dichloromethane <10.0 U 10.0 µg/L EX EPA8260B0 1,2-Dichloropropane <5.00 U 5.00 µg/L EX EPA8260B0 cis-1,3-Dichloropropene <5.00 U 5.00 µg/L EX EPA8260B0 trans-1,3-Dichloropropene <5.00 U 5.00 µg/L EX EPA8260B0 Ethylbenzene <5.00 U 5.00 µg/L EX EPA8260B0 1,1,2,2-Tetrachloroethane <5.00 U 5.00 µg/L EX EPA8260B0 Tetrachloroethylene <5.00 U 5.00 µg/L EX EPA8260B0 Toluene <5.00 U 5.00 µg/L EX EPA8260B0 1,1,1-Trichloroethane <5.00 U 5.00 µg/L EX EPA8260B0 1,1,2-Trichloroethane <5.00 U 5.00 µg/L EX EPA8260B0 Trichloroethylene <5.00 U 5.00 µg/L EX EPA8260B0 Trichlorofluoromethane <5.00 U 5.00 µg/L EX EPA8260B
WELL TRP205DMEASUREMENTS CONDUCTED IN THE FIELD
Sample date: 11/17/00 Time: Not availableWater temperature: Not availableAir temperature: Not availablepH: Not available Total alkalinity (as CaCO3): Not availableSp. conductance: Not available Phenolphthalein alkalinity: Not availableTurbidity: Not availableNo water was evacuated from the well prior to sampling.
ANALYSES
F Analyte Result FG S EMS SQL Unit Lab Method
0 Acetone <10.0 JU L O 10.0 µg/L ML EPA8260B0 Benzene <1.00 JU L O 1.00 µg/L ML EPA8260B0 Bromodichloromethane <1.00 JU L O 1.00 µg/L ML EPA8260B0 Bromoform <1.00 JU L O 1.00 µg/L ML EPA8260B0 Bromomethane <1.00 JU L O 1.00 µg/L ML EPA8260B0 Carbon disulfide <5.00 JU L O 5.00 µg/L ML EPA8260B

SAMPLING BLANKS RESULTSSAMPLING BLANKS RESULTS
ESH-EMS-2000408ESH-EMS-2000408 C-C-2525 Fourth Quarter 2000Fourth Quarter 2000
Well TRP205D collected on 11/17/00 (cont.)
F Analyte Result FG S EMS SQL Unit Lab Method
0 Carbon tetrachloride <1.00 JU L O 1.00 µg/L ML EPA8260B0 Chlorobenzene <1.00 JU L O 1.00 µg/L ML EPA8260B0 Chloroethane <1.00 JU L O 1.00 µg/L ML EPA8260B0 Chloroethene (Vinyl chloride) <1.00 JU L O 1.00 µg/L ML EPA8260B0 Chloroform <1.00 JU L O 1.00 µg/L ML EPA8260B0 Chloromethane <1.00 JU L O 1.00 µg/L ML EPA8260B0 Dibromochloromethane <1.00 JU L O 1.00 µg/L ML EPA8260B0 1,1-Dichloroethane <1.00 JU L O 1.00 µg/L ML EPA8260B0 1,2-Dichloroethane <1.00 JU L O 1.00 µg/L ML EPA8260B0 1,1-Dichloroethylene <1.00 JU L O 1.00 µg/L ML EPA8260B0 1,2-Dichloroethylene <1.00 JU L O 1.00 µg/L ML EPA8260B0 Dichloromethane <10.0 JU L O 10.0 µg/L ML EPA8260B0 1,2-Dichloropropane <1.00 JU L O 1.00 µg/L ML EPA8260B0 cis-1,3-Dichloropropene <1.00 JU L O 1.00 µg/L ML EPA8260B0 trans-1,3-Dichloropropene <1.00 JU L O 1.00 µg/L ML EPA8260B0 Ethylbenzene <1.00 JU L O 1.00 µg/L ML EPA8260B0 2-Hexanone <5.00 JU L O 5.00 µg/L ML EPA8260B0 Methyl ethyl ketone <5.00 JU L O 5.00 µg/L ML EPA8260B0 Methyl isobutyl ketone <5.00 JU L O 5.00 µg/L ML EPA8260B0 Styrene <1.00 JU L O 1.00 µg/L ML EPA8260B0 1,1,2,2-Tetrachloroethane <1.00 JU L O 1.00 µg/L ML EPA8260B0 Tetrachloroethylene <1.00 JU L O 1.00 µg/L ML EPA8260B0 Toluene <1.00 JU L O 1.00 µg/L ML EPA8260B0 1,1,1-Trichloroethane <1.00 JU L O 1.00 µg/L ML EPA8260B0 1,1,2-Trichloroethane <1.00 JU L O 1.00 µg/L ML EPA8260B0 Trichloroethylene <1.00 JU L O 1.00 µg/L ML EPA8260B0 Vinyl acetate <5.00 JU L O 5.00 µg/L ML EPA8260B0 Xylenes <1.00 JU L O 1.00 µg/L ML EPA8260B
WELL TRP206DMEASUREMENTS CONDUCTED IN THE FIELD
Sample date: 11/20/00 Time: Not availableWater temperature: Not availableAir temperature: Not availablepH: Not available Total alkalinity (as CaCO3): Not availableSp. conductance: Not available Phenolphthalein alkalinity: Not availableTurbidity: Not availableNo water was evacuated from the well prior to sampling.
ANALYSES
F Analyte Result FG S EMS SQL Unit Lab Method
0 Acetone <10.0 JU L O 10.0 µg/L ML EPA8260B0 Benzene <1.00 JU L O 1.00 µg/L ML EPA8260B0 Bromodichloromethane <1.00 JU L O 1.00 µg/L ML EPA8260B0 Bromoform <1.00 JU L O 1.00 µg/L ML EPA8260B0 Bromomethane <1.00 JU L O 1.00 µg/L ML EPA8260B0 Carbon disulfide <5.00 JU L O 5.00 µg/L ML EPA8260B0 Carbon tetrachloride <1.00 JU L O 1.00 µg/L ML EPA8260B0 Chlorobenzene <1.00 JU L O 1.00 µg/L ML EPA8260B0 Chloroethane <1.00 JU L O 1.00 µg/L ML EPA8260B0 Chloroethene (Vinyl chloride) <1.00 JU L O 1.00 µg/L ML EPA8260B0 Chloroform <1.00 JU L O 1.00 µg/L ML EPA8260B0 Chloromethane <1.00 JU L O 1.00 µg/L ML EPA8260B0 Dibromochloromethane <1.00 JU L O 1.00 µg/L ML EPA8260B0 1,1-Dichloroethane <1.00 JU L O 1.00 µg/L ML EPA8260B0 1,2-Dichloroethane <1.00 JU L O 1.00 µg/L ML EPA8260B0 1,1-Dichloroethylene <1.00 JU L O 1.00 µg/L ML EPA8260B0 1,2-Dichloroethylene <1.00 JU L O 1.00 µg/L ML EPA8260B0 Dichloromethane <10.0 JU L O 10.0 µg/L ML EPA8260B0 1,2-Dichloropropane <1.00 JU L O 1.00 µg/L ML EPA8260B0 cis-1,3-Dichloropropene <1.00 JU L O 1.00 µg/L ML EPA8260B0 trans-1,3-Dichloropropene <1.00 JU L O 1.00 µg/L ML EPA8260B0 Ethylbenzene <1.00 JU L O 1.00 µg/L ML EPA8260B0 2-Hexanone <5.00 JU L O 5.00 µg/L ML EPA8260B0 Methyl ethyl ketone <5.00 JU L O 5.00 µg/L ML EPA8260B0 Methyl isobutyl ketone <5.00 JU L O 5.00 µg/L ML EPA8260B0 Styrene <1.00 JU L O 1.00 µg/L ML EPA8260B0 1,1,2,2-Tetrachloroethane <1.00 JU L O 1.00 µg/L ML EPA8260B0 Tetrachloroethylene <1.00 JU L O 1.00 µg/L ML EPA8260B0 Toluene <1.00 JU L O 1.00 µg/L ML EPA8260B0 1,1,1-Trichloroethane <1.00 JU L O 1.00 µg/L ML EPA8260B0 1,1,2-Trichloroethane <1.00 JU L O 1.00 µg/L ML EPA8260B0 Trichloroethylene <1.00 JU L O 1.00 µg/L ML EPA8260B0 Vinyl acetate <5.00 JU L O 5.00 µg/L ML EPA8260B
Well TRP206D collected on 11/20/00 (cont.)
F Analyte Result FG S EMS SQL Unit Lab Method
0 Xylenes <1.00 JU L O 1.00 µg/L ML EPA8260B
WELL TRP207DMEASUREMENTS CONDUCTED IN THE FIELD
Sample date: 11/21/00 Time: Not availableWater temperature: Not availableAir temperature: Not availablepH: Not available Total alkalinity (as CaCO3): Not availableSp. conductance: Not available Phenolphthalein alkalinity: Not availableTurbidity: Not availableNo water was evacuated from the well prior to sampling.
ANALYSES
F Analyte Result FG S EMS SQL Unit Lab Method
0 Acetone <10.0 JU L O 10.0 µg/L ML EPA8260B0 Benzene <1.00 JU L O 1.00 µg/L ML EPA8260B0 Bromodichloromethane <1.00 JU L O 1.00 µg/L ML EPA8260B0 Bromoform <1.00 JU L O 1.00 µg/L ML EPA8260B0 Bromomethane <1.00 JU L O 1.00 µg/L ML EPA8260B0 Carbon disulfide <5.00 JU L O 5.00 µg/L ML EPA8260B0 Carbon tetrachloride <1.00 JU L O 1.00 µg/L ML EPA8260B0 Chlorobenzene <1.00 JU L O 1.00 µg/L ML EPA8260B0 Chloroethane <1.00 JU L O 1.00 µg/L ML EPA8260B0 Chloroethene (Vinyl chloride) <1.00 JU L O 1.00 µg/L ML EPA8260B0 Chloroform <1.00 JU L O 1.00 µg/L ML EPA8260B0 Chloromethane <1.00 JU L O 1.00 µg/L ML EPA8260B0 Dibromochloromethane <1.00 JU L O 1.00 µg/L ML EPA8260B0 1,1-Dichloroethane <1.00 JU L O 1.00 µg/L ML EPA8260B0 1,2-Dichloroethane <1.00 JU L O 1.00 µg/L ML EPA8260B0 1,1-Dichloroethylene <1.00 JU L O 1.00 µg/L ML EPA8260B0 1,2-Dichloroethylene <1.00 JU L O 1.00 µg/L ML EPA8260B0 Dichloromethane <10.0 JU L O 10.0 µg/L ML EPA8260B0 1,2-Dichloropropane <1.00 JU L O 1.00 µg/L ML EPA8260B0 cis-1,3-Dichloropropene <1.00 JU L O 1.00 µg/L ML EPA8260B0 trans-1,3-Dichloropropene <1.00 JU L O 1.00 µg/L ML EPA8260B0 Ethylbenzene <1.00 JU L O 1.00 µg/L ML EPA8260B0 2-Hexanone <5.00 JU L O 5.00 µg/L ML EPA8260B0 Methyl ethyl ketone <5.00 JU L O 5.00 µg/L ML EPA8260B0 Methyl isobutyl ketone <5.00 JU L O 5.00 µg/L ML EPA8260B0 Styrene <1.00 JU L O 1.00 µg/L ML EPA8260B0 1,1,2,2-Tetrachloroethane <1.00 JU L O 1.00 µg/L ML EPA8260B0 Tetrachloroethylene <1.00 JU L O 1.00 µg/L ML EPA8260B0 Toluene <1.00 JU L O 1.00 µg/L ML EPA8260B0 1,1,1-Trichloroethane <1.00 JU L O 1.00 µg/L ML EPA8260B0 1,1,2-Trichloroethane <1.00 JU L O 1.00 µg/L ML EPA8260B0 Trichloroethylene <1.00 JU L O 1.00 µg/L ML EPA8260B0 Vinyl acetate <5.00 JU L O 5.00 µg/L ML EPA8260B0 Xylenes <1.00 JU L O 1.00 µg/L ML EPA8260B
WELL TRP208DMEASUREMENTS CONDUCTED IN THE FIELD
Sample date: 12/05/00 Time: Not availableWater temperature: Not availableAir temperature: Not availablepH: Not available Total alkalinity (as CaCO3): Not availableSp. conductance: Not available Phenolphthalein alkalinity: Not availableTurbidity: Not availableNo water was evacuated from the well prior to sampling.
ANALYSES
F Analyte Result FG S EMS SQL Unit Lab Method
0 Acetone <10.0 JU L O 10.0 µg/L ML EPA8260B0 Benzene <1.00 JU L O 1.00 µg/L ML EPA8260B0 Bromodichloromethane <1.00 JU L O 1.00 µg/L ML EPA8260B0 Bromoform <1.00 JU L O 1.00 µg/L ML EPA8260B0 Bromomethane <1.00 JU L O 1.00 µg/L ML EPA8260B0 Carbon disulfide <5.00 JU L O 5.00 µg/L ML EPA8260B0 Carbon tetrachloride <1.00 JU L O 1.00 µg/L ML EPA8260B0 Chlorobenzene <1.00 JU L O 1.00 µg/L ML EPA8260B

SAMPLING BLANKS RESULTSSAMPLING BLANKS RESULTS
ESH-EMS-2000408ESH-EMS-2000408 C-C-2626 Fourth Quarter 2000Fourth Quarter 2000
Well TRP208D collected on 12/05/00 (cont.)
F Analyte Result FG S EMS SQL Unit Lab Method
0 Chloroethane <1.00 JU L O 1.00 µg/L ML EPA8260B0 Chloroethene (Vinyl chloride) <1.00 JU L O 1.00 µg/L ML EPA8260B0 Chloroform <1.00 JU L O 1.00 µg/L ML EPA8260B0 Chloromethane <1.00 JU L O 1.00 µg/L ML EPA8260B0 Dibromochloromethane <1.00 JU L O 1.00 µg/L ML EPA8260B0 1,1-Dichloroethane <1.00 JU L O 1.00 µg/L ML EPA8260B0 1,2-Dichloroethane <1.00 JU L O 1.00 µg/L ML EPA8260B0 1,1-Dichloroethylene <1.00 JU L O 1.00 µg/L ML EPA8260B0 1,2-Dichloroethylene <1.00 JU L O 1.00 µg/L ML EPA8260B0 Dichloromethane <10.0 JU L O 10.0 µg/L ML EPA8260B0 1,2-Dichloropropane <1.00 JU L O 1.00 µg/L ML EPA8260B0 cis-1,3-Dichloropropene <1.00 JU L O 1.00 µg/L ML EPA8260B0 trans-1,3-Dichloropropene <1.00 JU L O 1.00 µg/L ML EPA8260B0 Ethylbenzene <1.00 JU L O 1.00 µg/L ML EPA8260B0 2-Hexanone <5.00 JU L O 5.00 µg/L ML EPA8260B0 Methyl ethyl ketone <5.00 JU L O 5.00 µg/L ML EPA8260B0 Methyl isobutyl ketone <5.00 JU L O 5.00 µg/L ML EPA8260B0 Styrene <1.00 JU L O 1.00 µg/L ML EPA8260B0 1,1,2,2-Tetrachloroethane <1.00 JU L O 1.00 µg/L ML EPA8260B0 Tetrachloroethylene <1.00 JU L O 1.00 µg/L ML EPA8260B0 Toluene <1.00 JU L O 1.00 µg/L ML EPA8260B0 1,1,1-Trichloroethane <1.00 JU L O 1.00 µg/L ML EPA8260B0 1,1,2-Trichloroethane <1.00 JU L O 1.00 µg/L ML EPA8260B0 Trichloroethylene <1.00 JU L O 1.00 µg/L ML EPA8260B0 Vinyl acetate <5.00 JU L O 5.00 µg/L ML EPA8260B0 Xylenes <1.00 JU L O 1.00 µg/L ML EPA8260B
WELL TRP209DMEASUREMENTS CONDUCTED IN THE FIELD
Sample date: 12/06/00 Time: Not availableWater temperature: Not availableAir temperature: Not availablepH: Not available Total alkalinity (as CaCO3): Not availableSp. conductance: Not available Phenolphthalein alkalinity: Not availableTurbidity: Not availableNo water was evacuated from the well prior to sampling.
ANALYSES
F Analyte Result FG S EMS SQL Unit Lab Method
0 Acetone 3.78 J IL O8 10.0 µg/L ML EPA8260B0 Benzene <1.00 JU L O 1.00 µg/L ML EPA8260B0 Bromodichloromethane <1.00 JU L O 1.00 µg/L ML EPA8260B0 Bromoform <1.00 JU L O 1.00 µg/L ML EPA8260B0 Bromomethane <1.00 JU L O 1.00 µg/L ML EPA8260B0 Carbon disulfide <5.00 JU L O 5.00 µg/L ML EPA8260B0 Carbon tetrachloride <1.00 JU L O 1.00 µg/L ML EPA8260B0 Chlorobenzene <1.00 JU L O 1.00 µg/L ML EPA8260B0 Chloroethane <1.00 JU L O 1.00 µg/L ML EPA8260B0 Chloroethene (Vinyl chloride) <1.00 JU L O 1.00 µg/L ML EPA8260B0 Chloroform <1.00 JU L O 1.00 µg/L ML EPA8260B0 Chloromethane <1.00 JU L O 1.00 µg/L ML EPA8260B0 Dibromochloromethane <1.00 JU L O 1.00 µg/L ML EPA8260B0 1,1-Dichloroethane <1.00 JU L O 1.00 µg/L ML EPA8260B0 1,2-Dichloroethane <1.00 JU L O 1.00 µg/L ML EPA8260B0 1,1-Dichloroethylene <1.00 JU L O 1.00 µg/L ML EPA8260B0 1,2-Dichloroethylene <1.00 JU L O 1.00 µg/L ML EPA8260B0 Dichloromethane <10.0 JU L O 10.0 µg/L ML EPA8260B0 1,2-Dichloropropane <1.00 JU L O 1.00 µg/L ML EPA8260B0 cis-1,3-Dichloropropene <1.00 JU L O 1.00 µg/L ML EPA8260B0 trans-1,3-Dichloropropene <1.00 JU L O 1.00 µg/L ML EPA8260B0 Ethylbenzene <1.00 JU L O 1.00 µg/L ML EPA8260B0 2-Hexanone <5.00 JU L O 5.00 µg/L ML EPA8260B0 Methyl ethyl ketone <5.00 JU L O 5.00 µg/L ML EPA8260B0 Methyl isobutyl ketone <5.00 JU L O 5.00 µg/L ML EPA8260B0 Styrene <1.00 JU L O 1.00 µg/L ML EPA8260B0 1,1,2,2-Tetrachloroethane <1.00 JU L O 1.00 µg/L ML EPA8260B0 Tetrachloroethylene <1.00 JU L O 1.00 µg/L ML EPA8260B0 Toluene <1.00 JU L O 1.00 µg/L ML EPA8260B0 1,1,1-Trichloroethane <1.00 JU L O 1.00 µg/L ML EPA8260B0 1,1,2-Trichloroethane <1.00 JU L O 1.00 µg/L ML EPA8260B0 Trichloroethylene <1.00 JU L O 1.00 µg/L ML EPA8260B0 Vinyl acetate <5.00 JU L O 5.00 µg/L ML EPA8260B0 Xylenes <1.00 JU L O 1.00 µg/L ML EPA8260B
WELL TRP219DMEASUREMENTS CONDUCTED IN THE FIELD
Sample date: 11/16/00 Time: Not availableWater temperature: Not availableAir temperature: Not availablepH: Not available Total alkalinity (as CaCO3): Not availableSp. conductance: Not available Phenolphthalein alkalinity: Not availableTurbidity: Not availableNo water was evacuated from the well prior to sampling.
ANALYSES
F Analyte Result FG S EMS SQL Unit Lab Method
0 Benzene <5.00 U 5.00 µg/L EX EPA8260B0 Bromodichloromethane <5.00 U 5.00 µg/L EX EPA8260B0 Bromoform <5.00 U 5.00 µg/L EX EPA8260B0 Bromomethane <5.00 U 5.00 µg/L EX EPA8260B0 Carbon tetrachloride <5.00 U 5.00 µg/L EX EPA8260B0 Chlorobenzene <5.00 U 5.00 µg/L EX EPA8260B0 Chloroethane <5.00 U 5.00 µg/L EX EPA8260B0 Chloroethene (Vinyl chloride) <5.00 U 5.00 µg/L EX EPA8260B0 2-Chloroethyl vinyl ether <5.00 U 5.00 µg/L EX EPA8260B0 Chloroform <5.00 U 5.00 µg/L EX EPA8260B0 Chloromethane <5.00 U 5.00 µg/L EX EPA8260B0 Dibromochloromethane <5.00 U 5.00 µg/L EX EPA8260B0 1,1-Dichloroethane <5.00 U 5.00 µg/L EX EPA8260B0 1,2-Dichloroethane <5.00 U 5.00 µg/L EX EPA8260B0 1,1-Dichloroethylene <5.00 U 5.00 µg/L EX EPA8260B0 cis-1,2-Dichloroethylene <5.00 U 5.00 µg/L EX EPA8260B0 trans-1,2-Dichloroethylene <5.00 U 5.00 µg/L EX EPA8260B0 Dichloromethane <10.0 U 10.0 µg/L EX EPA8260B0 1,2-Dichloropropane <5.00 U 5.00 µg/L EX EPA8260B0 cis-1,3-Dichloropropene <5.00 U 5.00 µg/L EX EPA8260B0 trans-1,3-Dichloropropene <5.00 U 5.00 µg/L EX EPA8260B0 Ethylbenzene <5.00 U 5.00 µg/L EX EPA8260B0 1,1,2,2-Tetrachloroethane <5.00 U 5.00 µg/L EX EPA8260B0 Tetrachloroethylene <5.00 U 5.00 µg/L EX EPA8260B0 Toluene <5.00 U 5.00 µg/L EX EPA8260B0 1,1,1-Trichloroethane <5.00 U 5.00 µg/L EX EPA8260B0 1,1,2-Trichloroethane <5.00 U 5.00 µg/L EX EPA8260B0 Trichloroethylene <5.00 U 5.00 µg/L EX EPA8260B0 Trichlorofluoromethane <5.00 U 5.00 µg/L EX EPA8260B
WELL TRP220DMEASUREMENTS CONDUCTED IN THE FIELD
Sample date: 11/20/00 Time: Not availableWater temperature: Not availableAir temperature: Not availablepH: Not available Total alkalinity (as CaCO3): Not availableSp. conductance: Not available Phenolphthalein alkalinity: Not availableTurbidity: Not availableNo water was evacuated from the well prior to sampling.
ANALYSES
F Analyte Result FG S EMS SQL Unit Lab Method
0 Benzene <5.00 U 5.00 µg/L EX EPA8260B0 Bromodichloromethane <5.00 U 5.00 µg/L EX EPA8260B0 Bromoform <5.00 U 5.00 µg/L EX EPA8260B0 Bromomethane <5.00 U 5.00 µg/L EX EPA8260B0 Carbon tetrachloride <5.00 U 5.00 µg/L EX EPA8260B0 Chlorobenzene <5.00 U 5.00 µg/L EX EPA8260B0 Chloroethane <5.00 U 5.00 µg/L EX EPA8260B0 Chloroethene (Vinyl chloride) <5.00 U 5.00 µg/L EX EPA8260B0 2-Chloroethyl vinyl ether <5.00 U 5.00 µg/L EX EPA8260B0 Chloroform <5.00 U 5.00 µg/L EX EPA8260B0 Chloromethane <5.00 U 5.00 µg/L EX EPA8260B0 Dibromochloromethane <5.00 U 5.00 µg/L EX EPA8260B0 1,1-Dichloroethane <5.00 U 5.00 µg/L EX EPA8260B0 1,2-Dichloroethane <5.00 U 5.00 µg/L EX EPA8260B0 1,1-Dichloroethylene <5.00 U 5.00 µg/L EX EPA8260B0 cis-1,2-Dichloroethylene <5.00 U 5.00 µg/L EX EPA8260B0 trans-1,2-Dichloroethylene <5.00 U 5.00 µg/L EX EPA8260B0 Dichloromethane <10.0 U 10.0 µg/L EX EPA8260B0 1,2-Dichloropropane <5.00 U 5.00 µg/L EX EPA8260B0 cis-1,3-Dichloropropene <5.00 U 5.00 µg/L EX EPA8260B

SAMPLING BLANKS RESULTSSAMPLING BLANKS RESULTS
ESH-EMS-2000408ESH-EMS-2000408 C-C-2727 Fourth Quarter 2000Fourth Quarter 2000
Well TRP220D collected on 11/20/00 (cont.)
F Analyte Result FG S EMS SQL Unit Lab Method
0 trans-1,3-Dichloropropene <5.00 U 5.00 µg/L EX EPA8260B0 Ethylbenzene <5.00 U 5.00 µg/L EX EPA8260B0 1,1,2,2-Tetrachloroethane <5.00 U 5.00 µg/L EX EPA8260B0 Tetrachloroethylene <5.00 U 5.00 µg/L EX EPA8260B0 Toluene <5.00 U 5.00 µg/L EX EPA8260B0 1,1,1-Trichloroethane <5.00 U 5.00 µg/L EX EPA8260B0 1,1,2-Trichloroethane <5.00 U 5.00 µg/L EX EPA8260B0 Trichloroethylene <5.00 U 5.00 µg/L EX EPA8260B0 Trichlorofluoromethane <5.00 U 5.00 µg/L EX EPA8260B
WELL TRP227DMEASUREMENTS CONDUCTED IN THE FIELD
Sample date: 11/30/00 Time: Not availableWater temperature: Not availableAir temperature: Not availablepH: Not available Total alkalinity (as CaCO3): Not availableSp. conductance: Not available Phenolphthalein alkalinity: Not availableTurbidity: Not availableNo water was evacuated from the well prior to sampling.
ANALYSES
F Analyte Result FG S EMS SQL Unit Lab Method
0 Benzene <5.00 U 5.00 µg/L EX EPA8260B0 Bromodichloromethane <5.00 U 5.00 µg/L EX EPA8260B0 Bromoform <5.00 U 5.00 µg/L EX EPA8260B0 Bromomethane <5.00 U 5.00 µg/L EX EPA8260B0 Carbon tetrachloride <5.00 U 5.00 µg/L EX EPA8260B0 Chlorobenzene <5.00 U 5.00 µg/L EX EPA8260B0 Chloroethane <5.00 U 5.00 µg/L EX EPA8260B0 Chloroethene (Vinyl chloride) <5.00 U 5.00 µg/L EX EPA8260B0 2-Chloroethyl vinyl ether <5.00 U 5.00 µg/L EX EPA8260B0 Chloroform <5.00 U 5.00 µg/L EX EPA8260B0 Chloromethane <5.00 U 5.00 µg/L EX EPA8260B0 Dibromochloromethane <5.00 U 5.00 µg/L EX EPA8260B0 1,1-Dichloroethane <5.00 U 5.00 µg/L EX EPA8260B0 1,2-Dichloroethane <5.00 U 5.00 µg/L EX EPA8260B0 1,1-Dichloroethylene <5.00 U 5.00 µg/L EX EPA8260B0 cis-1,2-Dichloroethylene <5.00 U 5.00 µg/L EX EPA8260B0 trans-1,2-Dichloroethylene <5.00 U 5.00 µg/L EX EPA8260B0 Dichloromethane <10.0 U 10.0 µg/L EX EPA8260B0 1,2-Dichloropropane <5.00 U 5.00 µg/L EX EPA8260B0 cis-1,3-Dichloropropene <5.00 U 5.00 µg/L EX EPA8260B0 trans-1,3-Dichloropropene <5.00 U 5.00 µg/L EX EPA8260B0 Ethylbenzene <5.00 U 5.00 µg/L EX EPA8260B0 1,1,2,2-Tetrachloroethane <5.00 U 5.00 µg/L EX EPA8260B0 Tetrachloroethylene <5.00 U 5.00 µg/L EX EPA8260B0 Toluene <5.00 U 5.00 µg/L EX EPA8260B0 1,1,1-Trichloroethane <5.00 U 5.00 µg/L EX EPA8260B0 1,1,2-Trichloroethane <5.00 U 5.00 µg/L EX EPA8260B0 Trichloroethylene <5.00 U 5.00 µg/L EX EPA8260B0 Trichlorofluoromethane <5.00 U 5.00 µg/L EX EPA8260B
WELL TRP228CMEASUREMENTS CONDUCTED IN THE FIELD
Sample date: 10/03/00 Time: Not availableWater temperature: Not availableAir temperature: Not availablepH: Not available Total alkalinity (as CaCO3): Not availableSp. conductance: Not available Phenolphthalein alkalinity: Not availableTurbidity: Not availableNo water was evacuated from the well prior to sampling.
ANALYSES
F Analyte Result FG S EMS SQL Unit Lab Method
0 Acetone <10.0 U 10.0 µg/L WA EPA8260B0 Acetonitrile (Methyl cyanide) <20.0 U 20.0 µg/L WA EPA8260B0 Acrolein <20.0 U 20.0 µg/L WA EPA8260B0 Acrylonitrile <5.00 U 5.00 µg/L WA EPA8260B0 Allyl chloride <10.0 U 10.0 µg/L WA EPA8260B0 Benzene <5.00 U 5.00 µg/L WA EPA8260B
Well TRP228C collected on 10/03/00 (cont.)
F Analyte Result FG S EMS SQL Unit Lab Method
0 Bromodichloromethane <5.00 U 5.00 µg/L WA EPA8260B0 Bromoform <5.00 U 5.00 µg/L WA EPA8260B0 Bromomethane <10.0 U 10.0 µg/L WA EPA8260B0 Carbon disulfide <5.00 U 5.00 µg/L WA EPA8260B0 Carbon tetrachloride <5.00 U 5.00 µg/L WA EPA8260B0 Chlorobenzene <5.00 U 5.00 µg/L WA EPA8260B0 Chloroethane <10.0 U 10.0 µg/L WA EPA8260B0 Chloroethene (Vinyl chloride) <10.0 U 10.0 µg/L WA EPA8260B0 Chloroform <5.00 U 5.00 µg/L WA EPA8260B0 Chloromethane <10.0 U 10.0 µg/L WA EPA8260B0 Chloroprene <5.00 U 5.00 µg/L WA EPA8260B0 Dibromochloromethane <5.00 U 5.00 µg/L WA EPA8260B0 1,2-Dibromo-3-chloropropane <5.00 U 5.00 µg/L WA EPA8260B0 1,2-Dibromoethane <5.00 U 5.00 µg/L WA EPA8260B0 Dibromomethane <5.00 U 5.00 µg/L WA EPA8260B0 1,4-Dichlorobenzene <5.00 U 5.00 µg/L WA EPA8260B0 trans-1,4-Dichloro-2-butene <20.0 U 20.0 µg/L WA EPA8260B0 Dichlorodifluoromethane <10.0 U 10.0 µg/L WA EPA8260B0 1,1-Dichloroethane <5.00 U 5.00 µg/L WA EPA8260B0 1,2-Dichloroethane <5.00 U 5.00 µg/L WA EPA8260B0 1,1-Dichloroethylene <5.00 U 5.00 µg/L WA EPA8260B0 trans-1,2-Dichloroethylene <5.00 U 5.00 µg/L WA EPA8260B2 Dichloromethane 8.31 8 5.00 µg/L WA EPA8260B0 1,2-Dichloropropane <5.00 U 5.00 µg/L WA EPA8260B0 cis-1,3-Dichloropropene <5.00 U 5.00 µg/L WA EPA8260B0 trans-1,3-Dichloropropene <5.00 U 5.00 µg/L WA EPA8260B0 Ethylbenzene <5.00 U 5.00 µg/L WA EPA8260B0 2-Hexanone <10.0 U 10.0 µg/L WA EPA8260B0 Iodomethane (Methyl iodide) <5.00 U 5.00 µg/L WA EPA8260B0 Isobutyl alcohol <100 U 100 µg/L WA EPA8260B0 Methacrylonitrile <10.0 U 10.0 µg/L WA EPA8260B0 Methyl ethyl ketone <10.0 U 10.0 µg/L WA EPA8260B0 Methyl isobutyl ketone <10.0 U 10.0 µg/L WA EPA8260B0 Propionitrile <50.0 U 50.0 µg/L WA EPA8260B0 Styrene <5.00 U 5.00 µg/L WA EPA8260B0 1,1,1,2-Tetrachloroethane <5.00 U 5.00 µg/L WA EPA8260B0 1,1,2,2-Tetrachloroethane <5.00 U 5.00 µg/L WA EPA8260B0 Tetrachloroethylene <5.00 U 5.00 µg/L WA EPA8260B0 Toluene <5.00 U 5.00 µg/L WA EPA8260B0 1,1,1-Trichloroethane <5.00 U 5.00 µg/L WA EPA8260B0 1,1,2-Trichloroethane <5.00 U 5.00 µg/L WA EPA8260B0 Trichloroethylene <5.00 U 5.00 µg/L WA EPA8260B0 Trichlorofluoromethane <5.00 U 5.00 µg/L WA EPA8260B0 1,2,3-Trichloropropane <5.00 U 5.00 µg/L WA EPA8260B0 Vinyl acetate <10.0 U 10.0 µg/L WA EPA8260B0 Xylenes <5.00 U 5.00 µg/L WA EPA8260B
WELL TRP228DMEASUREMENTS CONDUCTED IN THE FIELD
Sample date: 12/12/00 Time: Not availableWater temperature: Not availableAir temperature: Not availablepH: Not available Total alkalinity (as CaCO3): Not availableSp. conductance: Not available Phenolphthalein alkalinity: Not availableTurbidity: Not availableNo water was evacuated from the well prior to sampling.
ANALYSES
F Analyte Result FG S EMS SQL Unit Lab Method
0 Acetone <10.0 JU L O 10.0 µg/L ML EPA8260B0 Benzene <1.00 JU L O 1.00 µg/L ML EPA8260B0 Bromodichloromethane <1.00 JU L O 1.00 µg/L ML EPA8260B0 Bromoform <1.00 JU L O 1.00 µg/L ML EPA8260B0 Bromomethane <1.00 JU L O 1.00 µg/L ML EPA8260B0 Carbon disulfide <5.00 JU L O 5.00 µg/L ML EPA8260B0 Carbon tetrachloride <1.00 JU L O 1.00 µg/L ML EPA8260B0 Chlorobenzene <1.00 JU L O 1.00 µg/L ML EPA8260B0 Chloroethane <1.00 JU L O 1.00 µg/L ML EPA8260B0 Chloroethene (Vinyl chloride) <1.00 JU L O 1.00 µg/L ML EPA8260B0 Chloroform <1.00 JU L O 1.00 µg/L ML EPA8260B0 Chloromethane <1.00 JU L O 1.00 µg/L ML EPA8260B0 Dibromochloromethane <1.00 JU L O 1.00 µg/L ML EPA8260B0 1,1-Dichloroethane <1.00 JU L O 1.00 µg/L ML EPA8260B0 1,2-Dichloroethane <1.00 JU L O 1.00 µg/L ML EPA8260B

SAMPLING BLANKS RESULTSSAMPLING BLANKS RESULTS
ESH-EMS-2000408ESH-EMS-2000408 C-C-2828 Fourth Quarter 2000Fourth Quarter 2000
Well TRP228D collected on 12/12/00 (cont.)
F Analyte Result FG S EMS SQL Unit Lab Method
0 1,1-Dichloroethylene <1.00 JU L O 1.00 µg/L ML EPA8260B0 cis-1,2-Dichloroethylene <1.00 JU L O 1.00 µg/L ML EPA8260B0 trans-1,2-Dichloroethylene <1.00 JU L O 1.00 µg/L ML EPA8260B0 Dichloromethane <10.0 JU L O 10.0 µg/L ML EPA8260B0 1,2-Dichloropropane <1.00 JU L O 1.00 µg/L ML EPA8260B0 cis-1,3-Dichloropropene <1.00 JU L O 1.00 µg/L ML EPA8260B0 trans-1,3-Dichloropropene <1.00 JU L O 1.00 µg/L ML EPA8260B0 Ethylbenzene <1.00 JU L O 1.00 µg/L ML EPA8260B0 2-Hexanone <5.00 JU L O 5.00 µg/L ML EPA8260B0 Methyl ethyl ketone <5.00 JU L O 5.00 µg/L ML EPA8260B0 Methyl isobutyl ketone <5.00 JU L O 5.00 µg/L ML EPA8260B0 Styrene <1.00 JU L O 1.00 µg/L ML EPA8260B0 1,1,2,2-Tetrachloroethane <1.00 JU L O 1.00 µg/L ML EPA8260B0 Tetrachloroethylene <1.00 JU L O 1.00 µg/L ML EPA8260B0 Toluene <1.00 JU L O 1.00 µg/L ML EPA8260B0 1,1,1-Trichloroethane <1.00 JU L O 1.00 µg/L ML EPA8260B0 1,1,2-Trichloroethane <1.00 JU L O 1.00 µg/L ML EPA8260B0 Trichloroethylene <1.00 JU L O 1.00 µg/L ML EPA8260B0 Vinyl acetate <5.00 JU L O 5.00 µg/L ML EPA8260B0 Xylenes <1.00 JU L O 1.00 µg/L ML EPA8260B
WELL TRP229DMEASUREMENTS CONDUCTED IN THE FIELD
Sample date: 12/13/00 Time: Not availableWater temperature: Not availableAir temperature: Not availablepH: Not available Total alkalinity (as CaCO3): Not availableSp. conductance: Not available Phenolphthalein alkalinity: Not availableTurbidity: Not availableNo water was evacuated from the well prior to sampling.
ANALYSES
F Analyte Result FG S EMS SQL Unit Lab Method
0 Acetone <10.0 JU L O 10.0 µg/L ML EPA8260B0 Benzene <1.00 JU L O 1.00 µg/L ML EPA8260B0 Bromodichloromethane <1.00 JU L O 1.00 µg/L ML EPA8260B0 Bromoform <1.00 JU L O 1.00 µg/L ML EPA8260B0 Bromomethane <1.00 JU L O 1.00 µg/L ML EPA8260B0 Carbon disulfide <5.00 JU L O 5.00 µg/L ML EPA8260B0 Carbon tetrachloride <1.00 JU L O 1.00 µg/L ML EPA8260B0 Chlorobenzene <1.00 JU L O 1.00 µg/L ML EPA8260B0 Chloroethane <1.00 JU L O 1.00 µg/L ML EPA8260B0 Chloroethene (Vinyl chloride) <1.00 JU L O 1.00 µg/L ML EPA8260B0 Chloroform <1.00 JU L O 1.00 µg/L ML EPA8260B0 Chloromethane <1.00 JU L O 1.00 µg/L ML EPA8260B0 Dibromochloromethane <1.00 JU L O 1.00 µg/L ML EPA8260B0 1,1-Dichloroethane <1.00 JU L O 1.00 µg/L ML EPA8260B0 1,2-Dichloroethane <1.00 JU L O 1.00 µg/L ML EPA8260B0 1,1-Dichloroethylene <1.00 JU L O 1.00 µg/L ML EPA8260B0 cis-1,2-Dichloroethylene <1.00 JU L O 1.00 µg/L ML EPA8260B0 trans-1,2-Dichloroethylene <1.00 JU L O 1.00 µg/L ML EPA8260B0 Dichloromethane <10.0 JU L O 10.0 µg/L ML EPA8260B0 1,2-Dichloropropane <1.00 JU L O 1.00 µg/L ML EPA8260B0 cis-1,3-Dichloropropene <1.00 JU L O 1.00 µg/L ML EPA8260B0 trans-1,3-Dichloropropene <1.00 JU L O 1.00 µg/L ML EPA8260B0 Ethylbenzene <1.00 JU L O 1.00 µg/L ML EPA8260B0 2-Hexanone <5.00 JU L O 5.00 µg/L ML EPA8260B0 Methyl ethyl ketone <5.00 JU L O 5.00 µg/L ML EPA8260B0 Methyl isobutyl ketone <5.00 JU L O 5.00 µg/L ML EPA8260B0 Styrene <1.00 JU L O 1.00 µg/L ML EPA8260B0 1,1,2,2-Tetrachloroethane <1.00 JU L O 1.00 µg/L ML EPA8260B0 Tetrachloroethylene <1.00 JU L O 1.00 µg/L ML EPA8260B0 Toluene <1.00 JU L O 1.00 µg/L ML EPA8260B0 1,1,1-Trichloroethane <1.00 JU L O 1.00 µg/L ML EPA8260B0 1,1,2-Trichloroethane <1.00 JU L O 1.00 µg/L ML EPA8260B0 Trichloroethylene <1.00 JU L O 1.00 µg/L ML EPA8260B0 Vinyl acetate <5.00 JU L O 5.00 µg/L ML EPA8260B0 Xylenes <1.00 JU L O 1.00 µg/L ML EPA8260B
WELL TRP230DMEASUREMENTS CONDUCTED IN THE FIELD
Sample date: 12/14/00 Time: Not availableWater temperature: Not availableAir temperature: Not availablepH: Not available Total alkalinity (as CaCO3): Not availableSp. conductance: Not available Phenolphthalein alkalinity: Not availableTurbidity: Not availableNo water was evacuated from the well prior to sampling.
ANALYSES
F Analyte Result FG S EMS SQL Unit Lab Method
0 Acetone <10.0 JU L O 10.0 µg/L ML EPA8260B0 Benzene <1.00 JU L O 1.00 µg/L ML EPA8260B0 Bromodichloromethane <1.00 JU L O 1.00 µg/L ML EPA8260B0 Bromoform <1.00 JU L O 1.00 µg/L ML EPA8260B0 Bromomethane <1.00 JU L O 1.00 µg/L ML EPA8260B0 Carbon disulfide <5.00 JU L O 5.00 µg/L ML EPA8260B0 Carbon tetrachloride <1.00 JU L O 1.00 µg/L ML EPA8260B0 Chlorobenzene <1.00 JU L O 1.00 µg/L ML EPA8260B0 Chloroethane <1.00 JU L O 1.00 µg/L ML EPA8260B0 Chloroethene (Vinyl chloride) <1.00 JU L O 1.00 µg/L ML EPA8260B0 Chloroform <1.00 JU L O 1.00 µg/L ML EPA8260B0 Chloromethane <1.00 JU L O 1.00 µg/L ML EPA8260B0 Dibromochloromethane <1.00 JU L O 1.00 µg/L ML EPA8260B0 1,1-Dichloroethane <1.00 JU L O 1.00 µg/L ML EPA8260B0 1,2-Dichloroethane <1.00 JU L O 1.00 µg/L ML EPA8260B0 1,1-Dichloroethylene <1.00 JU L O 1.00 µg/L ML EPA8260B0 cis-1,2-Dichloroethylene <1.00 JU L O 1.00 µg/L ML EPA8260B0 trans-1,2-Dichloroethylene <1.00 JU L O 1.00 µg/L ML EPA8260B0 Dichloromethane <10.0 JU L O 10.0 µg/L ML EPA8260B0 1,2-Dichloropropane <1.00 JU L O 1.00 µg/L ML EPA8260B0 cis-1,3-Dichloropropene <1.00 JU L O 1.00 µg/L ML EPA8260B0 trans-1,3-Dichloropropene <1.00 JU L O 1.00 µg/L ML EPA8260B0 Ethylbenzene <1.00 JU L O 1.00 µg/L ML EPA8260B0 2-Hexanone <5.00 JU L O 5.00 µg/L ML EPA8260B0 Methyl ethyl ketone <5.00 JU L O 5.00 µg/L ML EPA8260B0 Methyl isobutyl ketone <5.00 JU L O 5.00 µg/L ML EPA8260B0 Styrene <1.00 JU L O 1.00 µg/L ML EPA8260B0 1,1,2,2-Tetrachloroethane <1.00 JU L O 1.00 µg/L ML EPA8260B0 Tetrachloroethylene <1.00 JU L O 1.00 µg/L ML EPA8260B0 Toluene <1.00 JU L O 1.00 µg/L ML EPA8260B0 1,1,1-Trichloroethane <1.00 JU L O 1.00 µg/L ML EPA8260B0 1,1,2-Trichloroethane <1.00 JU L O 1.00 µg/L ML EPA8260B0 Trichloroethylene <1.00 JU L O 1.00 µg/L ML EPA8260B0 Vinyl acetate <5.00 JU L O 5.00 µg/L ML EPA8260B0 Xylenes <1.00 JU L O 1.00 µg/L ML EPA8260B
WELL TRP231DMEASUREMENTS CONDUCTED IN THE FIELD
Sample date: 12/15/00 Time: Not availableWater temperature: Not availableAir temperature: Not availablepH: Not available Total alkalinity (as CaCO3): Not availableSp. conductance: Not available Phenolphthalein alkalinity: Not availableTurbidity: Not availableNo water was evacuated from the well prior to sampling.
ANALYSES
F Analyte Result FG S EMS SQL Unit Lab Method
0 Acetone <10.0 JU L O 10.0 µg/L ML EPA8260B0 Benzene <1.00 JU L O 1.00 µg/L ML EPA8260B0 Bromodichloromethane <1.00 JU L O 1.00 µg/L ML EPA8260B0 Bromoform <1.00 JU L O 1.00 µg/L ML EPA8260B0 Bromomethane <1.00 JU L O 1.00 µg/L ML EPA8260B0 Carbon disulfide <5.00 JU L O 5.00 µg/L ML EPA8260B0 Carbon tetrachloride <1.00 JU L O 1.00 µg/L ML EPA8260B0 Chlorobenzene <1.00 JU L O 1.00 µg/L ML EPA8260B0 Chloroethane <1.00 JU L O 1.00 µg/L ML EPA8260B0 Chloroethene (Vinyl chloride) <1.00 JU L O 1.00 µg/L ML EPA8260B0 Chloroform <1.00 JU L O 1.00 µg/L ML EPA8260B0 Chloromethane <1.00 JU L O 1.00 µg/L ML EPA8260B0 Dibromochloromethane <1.00 JU L O 1.00 µg/L ML EPA8260B0 1,1-Dichloroethane <1.00 JU L O 1.00 µg/L ML EPA8260B

SAMPLING BLANKS RESULTSSAMPLING BLANKS RESULTS
ESH-EMS-2000408ESH-EMS-2000408 C-C-2929 Fourth Quarter 2000Fourth Quarter 2000
Well TRP231D collected on 12/15/00 (cont.)
F Analyte Result FG S EMS SQL Unit Lab Method
0 1,2-Dichloroethane <1.00 JU L O 1.00 µg/L ML EPA8260B0 1,1-Dichloroethylene <1.00 JU L O 1.00 µg/L ML EPA8260B0 cis-1,2-Dichloroethylene <1.00 JU L O 1.00 µg/L ML EPA8260B0 trans-1,2-Dichloroethylene <1.00 JU L O 1.00 µg/L ML EPA8260B0 Dichloromethane <10.0 JU L O 10.0 µg/L ML EPA8260B0 1,2-Dichloropropane <1.00 JU L O 1.00 µg/L ML EPA8260B0 cis-1,3-Dichloropropene <1.00 JU L O 1.00 µg/L ML EPA8260B0 trans-1,3-Dichloropropene <1.00 JU L O 1.00 µg/L ML EPA8260B0 Ethylbenzene <1.00 JU L O 1.00 µg/L ML EPA8260B0 2-Hexanone <5.00 JU L O 5.00 µg/L ML EPA8260B0 Methyl ethyl ketone <5.00 JU L O 5.00 µg/L ML EPA8260B0 Methyl isobutyl ketone <5.00 JU L O 5.00 µg/L ML EPA8260B0 Styrene <1.00 JU L O 1.00 µg/L ML EPA8260B0 1,1,2,2-Tetrachloroethane <1.00 JU L O 1.00 µg/L ML EPA8260B0 Tetrachloroethylene <1.00 JU L O 1.00 µg/L ML EPA8260B0 Toluene <1.00 JU L O 1.00 µg/L ML EPA8260B0 1,1,1-Trichloroethane <1.00 JU L O 1.00 µg/L ML EPA8260B0 1,1,2-Trichloroethane <1.00 JU L O 1.00 µg/L ML EPA8260B0 Trichloroethylene <1.00 JU L O 1.00 µg/L ML EPA8260B0 Vinyl acetate <5.00 JU L O 5.00 µg/L ML EPA8260B0 Xylenes <1.00 JU L O 1.00 µg/L ML EPA8260B
WELL TRP232CMEASUREMENTS CONDUCTED IN THE FIELD
Sample date: 11/13/00 Time: Not availableWater temperature: Not availableAir temperature: Not availablepH: Not available Total alkalinity (as CaCO3): Not availableSp. conductance: Not available Phenolphthalein alkalinity: Not availableTurbidity: Not availableNo water was evacuated from the well prior to sampling.
ANALYSES
F Analyte Result FG S EMS SQL Unit Lab Method
0 Benzene <1.00 U 1.00 µg/L GE EPA8260B0 Bromodichloromethane <1.00 U 1.00 µg/L GE EPA8260B0 Bromoform <1.00 U 1.00 µg/L GE EPA8260B0 Bromomethane <1.00 U 1.00 µg/L GE EPA8260B0 Carbon tetrachloride <1.00 U 1.00 µg/L GE EPA8260B0 Chlorobenzene <1.00 U 1.00 µg/L GE EPA8260B0 Chloroethane <1.00 U 1.00 µg/L GE EPA8260B0 Chloroethene (Vinyl chloride) <1.00 U 1.00 µg/L GE EPA8260B0 2-Chloroethyl vinyl ether <5.00 U 5.00 µg/L GE EPA8260B0 Chloroform <1.00 U 1.00 µg/L GE EPA8260B0 Chloromethane <1.00 U 1.00 µg/L GE EPA8260B0 Dibromochloromethane <1.00 U 1.00 µg/L GE EPA8260B0 Dibromomethane <1.00 U 1.00 µg/L GE EPA8260B0 1,1-Dichloroethane <1.00 U 1.00 µg/L GE EPA8260B0 1,2-Dichloroethane <1.00 U 1.00 µg/L GE EPA8260B0 1,1-Dichloroethylene <1.00 U 1.00 µg/L GE EPA8260B0 trans-1,2-Dichloroethylene <1.00 U 1.00 µg/L GE EPA8260B0 Dichloromethane <5.00 U 5.00 µg/L GE EPA8260B0 1,2-Dichloropropane <1.00 U 1.00 µg/L GE EPA8260B0 cis-1,3-Dichloropropene <1.00 U 1.00 µg/L GE EPA8260B0 trans-1,3-Dichloropropene <1.00 U 1.00 µg/L GE EPA8260B0 Ethylbenzene <1.00 U 1.00 µg/L GE EPA8260B0 1,1,2,2-Tetrachloroethane <1.00 U 1.00 µg/L GE EPA8260B0 Tetrachloroethylene <1.00 U 1.00 µg/L GE EPA8260B0 Toluene <1.00 U 1.00 µg/L GE EPA8260B0 1,1,1-Trichloroethane <1.00 U 1.00 µg/L GE EPA8260B0 1,1,2-Trichloroethane <1.00 U 1.00 µg/L GE EPA8260B0 Trichloroethylene <1.00 U 1.00 µg/L GE EPA8260B0 Trichlorofluoromethane <1.00 U 1.00 µg/L GE EPA8260B0 Xylenes <3.00 U 3.00 µg/L GE EPA8260B
WELL TRP233DMEASUREMENTS CONDUCTED IN THE FIELD
Sample date: 11/07/00 Time: Not availableWater temperature: Not availableAir temperature: Not availablepH: Not available Total alkalinity (as CaCO3): Not availableSp. conductance: Not available Phenolphthalein alkalinity: Not availableTurbidity: Not availableNo water was evacuated from the well prior to sampling.
ANALYSES
F Analyte Result FG S EMS SQL Unit Lab Method
0 Benzene <5.00 U 5.00 µg/L WA EPA8260B0 Bromodichloromethane <5.00 U 5.00 µg/L WA EPA8260B0 Bromoform <5.00 U 5.00 µg/L WA EPA8260B0 Bromomethane <10.0 U 10.0 µg/L WA EPA8260B0 Carbon tetrachloride <5.00 U 5.00 µg/L WA EPA8260B0 Chlorobenzene <5.00 U 5.00 µg/L WA EPA8260B0 Chloroethane <10.0 U 10.0 µg/L WA EPA8260B0 Chloroethene (Vinyl chloride) <10.0 U 10.0 µg/L WA EPA8260B0 2-Chloroethyl vinyl ether 10.0 R 4 10.0 µg/L WA EPA8260B0 Chloroform <5.00 U 5.00 µg/L WA EPA8260B0 Chloromethane <10.0 U 10.0 µg/L WA EPA8260B0 Dibromochloromethane <5.00 U 5.00 µg/L WA EPA8260B0 1,1-Dichloroethane <5.00 U 5.00 µg/L WA EPA8260B0 1,2-Dichloroethane <5.00 U 5.00 µg/L WA EPA8260B0 1,1-Dichloroethylene <5.00 U 5.00 µg/L WA EPA8260B0 trans-1,2-Dichloroethylene <5.00 U 5.00 µg/L WA EPA8260B0 Dichloromethane <5.94 U V 5.00 µg/L WA EPA8260B0 1,2-Dichloropropane <5.00 U 5.00 µg/L WA EPA8260B0 cis-1,3-Dichloropropene <5.00 U 5.00 µg/L WA EPA8260B0 trans-1,3-Dichloropropene <5.00 U 5.00 µg/L WA EPA8260B0 Ethylbenzene <5.00 U 5.00 µg/L WA EPA8260B0 1,1,2,2-Tetrachloroethane <5.00 U 5.00 µg/L WA EPA8260B0 Tetrachloroethylene <5.00 U 5.00 µg/L WA EPA8260B0 Toluene <5.00 U 5.00 µg/L WA EPA8260B0 1,1,1-Trichloroethane <5.00 U 5.00 µg/L WA EPA8260B0 1,1,2-Trichloroethane <5.00 U 5.00 µg/L WA EPA8260B0 Trichloroethylene <5.00 U 5.00 µg/L WA EPA8260B0 Trichlorofluoromethane <5.00 U 5.00 µg/L WA EPA8260B0 Xylenes <5.00 U 5.00 µg/L WA EPA8260B
WELL TRP233DMEASUREMENTS CONDUCTED IN THE FIELD
Sample date: 11/13/00 Time: Not availableWater temperature: Not availableAir temperature: Not availablepH: Not available Total alkalinity (as CaCO3): Not availableSp. conductance: Not available Phenolphthalein alkalinity: Not availableTurbidity: Not availableNo water was evacuated from the well prior to sampling.
ANALYSES
F Analyte Result FG S EMS SQL Unit Lab Method
0 Benzene <5.00 JU L O 5.00 µg/L WA EPA8260B0 Benzene <5.00 JU L O 5.00 µg/L WA EPA8260B0 Bromodichloromethane <5.00 JU L O 5.00 µg/L WA EPA8260B0 Bromodichloromethane <5.00 JU L O 5.00 µg/L WA EPA8260B0 Bromoform <5.00 JU L O 5.00 µg/L WA EPA8260B0 Bromoform <5.00 JU L O 5.00 µg/L WA EPA8260B0 Bromomethane <10.0 JU L LO 10.0 µg/L WA EPA8260B0 Bromomethane <10.0 JU L LO 10.0 µg/L WA EPA8260B0 Carbon tetrachloride <5.00 JU L O 5.00 µg/L WA EPA8260B0 Carbon tetrachloride <5.00 JU L O 5.00 µg/L WA EPA8260B0 Chlorobenzene <5.00 JU L O 5.00 µg/L WA EPA8260B0 Chlorobenzene <5.00 JU L O 5.00 µg/L WA EPA8260B0 Chloroethane <10.0 JU L O 10.0 µg/L WA EPA8260B0 Chloroethane <10.0 JU L O 10.0 µg/L WA EPA8260B0 Chloroethene (Vinyl chloride) <10.0 JU L O 10.0 µg/L WA EPA8260B0 Chloroethene (Vinyl chloride) <10.0 JU L O 10.0 µg/L WA EPA8260B0 2-Chloroethyl vinyl ether 10.0 R L O4 10.0 µg/L WA EPA8260B0 2-Chloroethyl vinyl ether 10.0 R L O4 10.0 µg/L WA EPA8260B0 Chloroform <5.00 JU L O 5.00 µg/L WA EPA8260B0 Chloroform <5.00 JU L O 5.00 µg/L WA EPA8260B

SAMPLING BLANKS RESULTSSAMPLING BLANKS RESULTS
ESH-EMS-2000408ESH-EMS-2000408 C-C-3030 Fourth Quarter 2000Fourth Quarter 2000
Well TRP233D collected on 11/13/00 (cont.)
F Analyte Result FG S EMS SQL Unit Lab Method
0 Chloromethane <10.0 JU L O 10.0 µg/L WA EPA8260B0 Chloromethane <10.0 JU L O 10.0 µg/L WA EPA8260B0 Dibromochloromethane <5.00 JU L O 5.00 µg/L WA EPA8260B0 Dibromochloromethane <5.00 JU L O 5.00 µg/L WA EPA8260B0 1,1-Dichloroethane <5.00 JU L O 5.00 µg/L WA EPA8260B0 1,1-Dichloroethane <5.00 JU L O 5.00 µg/L WA EPA8260B0 1,2-Dichloroethane <5.00 JU L O 5.00 µg/L WA EPA8260B0 1,2-Dichloroethane <5.00 JU L O 5.00 µg/L WA EPA8260B0 1,1-Dichloroethylene <5.00 JU L O 5.00 µg/L WA EPA8260B0 1,1-Dichloroethylene <5.00 JU L O 5.00 µg/L WA EPA8260B0 trans-1,2-Dichloroethylene <5.00 JU L O 5.00 µg/L WA EPA8260B0 trans-1,2-Dichloroethylene <5.00 JU L O 5.00 µg/L WA EPA8260B0 Dichloromethane <12.7 JU LV O 5.00 µg/L WA EPA8260B0 Dichloromethane <5.03 JU LV O 5.00 µg/L WA EPA8260B0 1,2-Dichloropropane <5.00 JU L O 5.00 µg/L WA EPA8260B0 1,2-Dichloropropane <5.00 JU L O 5.00 µg/L WA EPA8260B0 cis-1,3-Dichloropropene <5.00 JU L O 5.00 µg/L WA EPA8260B0 cis-1,3-Dichloropropene <5.00 JU L O 5.00 µg/L WA EPA8260B0 trans-1,3-Dichloropropene <5.00 JU L O 5.00 µg/L WA EPA8260B0 trans-1,3-Dichloropropene <5.00 JU L O 5.00 µg/L WA EPA8260B0 Ethylbenzene <5.00 JU L O 5.00 µg/L WA EPA8260B0 Ethylbenzene <5.00 JU L O 5.00 µg/L WA EPA8260B0 1,1,2,2-Tetrachloroethane <5.00 JU L O 5.00 µg/L WA EPA8260B0 1,1,2,2-Tetrachloroethane <5.00 JU L O 5.00 µg/L WA EPA8260B0 Tetrachloroethylene <5.00 JU L O 5.00 µg/L WA EPA8260B0 Tetrachloroethylene <5.00 JU L O 5.00 µg/L WA EPA8260B0 Toluene <5.00 JU L O 5.00 µg/L WA EPA8260B0 Toluene <5.00 JU L O 5.00 µg/L WA EPA8260B0 1,1,1-Trichloroethane <5.00 JU L O 5.00 µg/L WA EPA8260B0 1,1,1-Trichloroethane <5.00 JU L O 5.00 µg/L WA EPA8260B0 1,1,2-Trichloroethane <5.00 JU L O 5.00 µg/L WA EPA8260B0 1,1,2-Trichloroethane <5.00 JU L O 5.00 µg/L WA EPA8260B0 Trichloroethylene <5.00 JU L O 5.00 µg/L WA EPA8260B0 Trichloroethylene <5.00 JU L O 5.00 µg/L WA EPA8260B0 Trichlorofluoromethane <5.00 JU L O 5.00 µg/L WA EPA8260B0 Trichlorofluoromethane <5.00 JU L O 5.00 µg/L WA EPA8260B0 Xylenes <5.00 JU L O 5.00 µg/L WA EPA8260B0 Xylenes <5.00 JU L O 5.00 µg/L WA EPA8260B
WELL TRP234DMEASUREMENTS CONDUCTED IN THE FIELD
Sample date: 11/08/00 Time: Not availableWater temperature: Not availableAir temperature: Not availablepH: Not available Total alkalinity (as CaCO3): Not availableSp. conductance: Not available Phenolphthalein alkalinity: Not availableTurbidity: Not availableNo water was evacuated from the well prior to sampling.
ANALYSES
F Analyte Result FG S EMS SQL Unit Lab Method
0 Benzene <5.00 U 5.00 µg/L WA EPA8260B0 Bromodichloromethane <5.00 U 5.00 µg/L WA EPA8260B0 Bromoform <5.00 U 5.00 µg/L WA EPA8260B0 Bromomethane <10.0 U 10.0 µg/L WA EPA8260B0 Carbon tetrachloride <5.00 U 5.00 µg/L WA EPA8260B0 Chlorobenzene <5.00 U 5.00 µg/L WA EPA8260B0 Chloroethane <10.0 U 10.0 µg/L WA EPA8260B0 Chloroethene (Vinyl chloride) <10.0 U 10.0 µg/L WA EPA8260B0 2-Chloroethyl vinyl ether 10.0 R 4 10.0 µg/L WA EPA8260B0 Chloroform <5.00 U 5.00 µg/L WA EPA8260B0 Chloromethane <10.0 U 10.0 µg/L WA EPA8260B0 Dibromochloromethane <5.00 U 5.00 µg/L WA EPA8260B0 1,1-Dichloroethane <5.00 U 5.00 µg/L WA EPA8260B0 1,2-Dichloroethane <5.00 U 5.00 µg/L WA EPA8260B0 1,1-Dichloroethylene <5.00 U 5.00 µg/L WA EPA8260B0 trans-1,2-Dichloroethylene <5.00 U 5.00 µg/L WA EPA8260B0 Dichloromethane <5.00 U 5.00 µg/L WA EPA8260B0 1,2-Dichloropropane <5.00 U 5.00 µg/L WA EPA8260B0 cis-1,3-Dichloropropene <5.00 U 5.00 µg/L WA EPA8260B0 trans-1,3-Dichloropropene <5.00 U 5.00 µg/L WA EPA8260B0 Ethylbenzene <5.00 U 5.00 µg/L WA EPA8260B0 1,1,2,2-Tetrachloroethane <5.00 U 5.00 µg/L WA EPA8260B0 Tetrachloroethylene <5.00 U 5.00 µg/L WA EPA8260B
Well TRP234D collected on 11/08/00 (cont.)
F Analyte Result FG S EMS SQL Unit Lab Method
0 Toluene <5.00 U 5.00 µg/L WA EPA8260B0 1,1,1-Trichloroethane <5.00 U 5.00 µg/L WA EPA8260B0 1,1,2-Trichloroethane <5.00 U 5.00 µg/L WA EPA8260B0 Trichloroethylene <5.00 U 5.00 µg/L WA EPA8260B0 Trichlorofluoromethane <5.00 U 5.00 µg/L WA EPA8260B0 Xylenes <5.00 U 5.00 µg/L WA EPA8260B
WELL TRP234DMEASUREMENTS CONDUCTED IN THE FIELD
Sample date: 11/14/00 Time: Not availableWater temperature: Not availableAir temperature: Not availablepH: Not available Total alkalinity (as CaCO3): Not availableSp. conductance: Not available Phenolphthalein alkalinity: Not availableTurbidity: Not availableNo water was evacuated from the well prior to sampling.
ANALYSES
F Analyte Result FG S EMS SQL Unit Lab Method
0 Benzene <5.00 JU L O 5.00 µg/L WA EPA8260B0 Bromodichloromethane <5.00 JU L O 5.00 µg/L WA EPA8260B0 Bromoform <5.00 JU L O 5.00 µg/L WA EPA8260B0 Bromomethane <10.0 JU L LO 10.0 µg/L WA EPA8260B0 Carbon tetrachloride <5.00 JU L O 5.00 µg/L WA EPA8260B0 Chlorobenzene <5.00 JU L O 5.00 µg/L WA EPA8260B0 Chloroethane <10.0 JU L O 10.0 µg/L WA EPA8260B0 Chloroethene (Vinyl chloride) <10.0 JU L O 10.0 µg/L WA EPA8260B0 2-Chloroethyl vinyl ether 10.0 R L O4 10.0 µg/L WA EPA8260B0 Chloroform <5.00 JU L O 5.00 µg/L WA EPA8260B0 Chloromethane <10.0 JU L O 10.0 µg/L WA EPA8260B0 Dibromochloromethane <5.00 JU L O 5.00 µg/L WA EPA8260B0 1,1-Dichloroethane <5.00 JU L O 5.00 µg/L WA EPA8260B0 1,2-Dichloroethane <5.00 JU L O 5.00 µg/L WA EPA8260B0 1,1-Dichloroethylene <5.00 JU L O 5.00 µg/L WA EPA8260B0 trans-1,2-Dichloroethylene <5.00 JU L O 5.00 µg/L WA EPA8260B0 Dichloromethane <14.1 JU LV O 5.00 µg/L WA EPA8260B0 1,2-Dichloropropane <5.00 JU L O 5.00 µg/L WA EPA8260B0 cis-1,3-Dichloropropene <5.00 JU L O 5.00 µg/L WA EPA8260B0 trans-1,3-Dichloropropene <5.00 JU L O 5.00 µg/L WA EPA8260B0 Ethylbenzene <5.00 JU L O 5.00 µg/L WA EPA8260B0 1,1,2,2-Tetrachloroethane <5.00 JU L O 5.00 µg/L WA EPA8260B0 Tetrachloroethylene <5.00 JU L O 5.00 µg/L WA EPA8260B0 Toluene <5.00 JU L O 5.00 µg/L WA EPA8260B0 1,1,1-Trichloroethane <5.00 JU L O 5.00 µg/L WA EPA8260B0 1,1,2-Trichloroethane <5.00 JU L O 5.00 µg/L WA EPA8260B0 Trichloroethylene <5.00 JU L O 5.00 µg/L WA EPA8260B0 Trichlorofluoromethane <5.00 JU L O 5.00 µg/L WA EPA8260B0 Xylenes <5.00 JU L O 5.00 µg/L WA EPA8260B
WELL TRP235DMEASUREMENTS CONDUCTED IN THE FIELD
Sample date: 11/08/00 Time: Not availableWater temperature: Not availableAir temperature: Not availablepH: Not available Total alkalinity (as CaCO3): Not availableSp. conductance: Not available Phenolphthalein alkalinity: Not availableTurbidity: Not availableNo water was evacuated from the well prior to sampling.
ANALYSES
F Analyte Result FG S EMS SQL Unit Lab Method
0 Benzene <1.00 U 1.00 µg/L GE EPA8260B0 Bromodichloromethane <1.00 U 1.00 µg/L GE EPA8260B0 Bromoform <1.00 U 1.00 µg/L GE EPA8260B0 Bromomethane <1.00 U 1.00 µg/L GE EPA8260B0 Carbon tetrachloride <1.00 U 1.00 µg/L GE EPA8260B0 Chlorobenzene <1.00 U 1.00 µg/L GE EPA8260B0 Chloroethane <1.00 U 1.00 µg/L GE EPA8260B0 Chloroethene (Vinyl chloride) <1.00 U 1.00 µg/L GE EPA8260B0 2-Chloroethyl vinyl ether <5.00 U 5.00 µg/L GE EPA8260B

SAMPLING BLANKS RESULTSSAMPLING BLANKS RESULTS
ESH-EMS-2000408ESH-EMS-2000408 C-C-3131 Fourth Quarter 2000Fourth Quarter 2000
Well TRP235D collected on 11/08/00 (cont.)
F Analyte Result FG S EMS SQL Unit Lab Method
0 Chloroform <1.00 U 1.00 µg/L GE EPA8260B0 Chloromethane <1.00 U 1.00 µg/L GE EPA8260B0 Dibromochloromethane <1.00 U 1.00 µg/L GE EPA8260B0 Dibromomethane <1.00 U 1.00 µg/L GE EPA8260B0 1,1-Dichloroethane <1.00 U 1.00 µg/L GE EPA8260B0 1,2-Dichloroethane <1.00 U 1.00 µg/L GE EPA8260B0 1,1-Dichloroethylene <1.00 U 1.00 µg/L GE EPA8260B0 trans-1,2-Dichloroethylene <1.00 U 1.00 µg/L GE EPA8260B0 Dichloromethane <5.00 U 5.00 µg/L GE EPA8260B0 1,2-Dichloropropane <1.00 U 1.00 µg/L GE EPA8260B0 cis-1,3-Dichloropropene <1.00 U 1.00 µg/L GE EPA8260B0 trans-1,3-Dichloropropene <1.00 U 1.00 µg/L GE EPA8260B0 Ethylbenzene <1.00 U 1.00 µg/L GE EPA8260B0 1,1,2,2-Tetrachloroethane <1.00 U 1.00 µg/L GE EPA8260B0 Tetrachloroethylene <1.00 U 1.00 µg/L GE EPA8260B0 Toluene <1.00 U 1.00 µg/L GE EPA8260B0 1,1,1-Trichloroethane <1.00 U 1.00 µg/L GE EPA8260B0 1,1,2-Trichloroethane <1.00 U 1.00 µg/L GE EPA8260B0 Trichloroethylene <1.00 U 1.00 µg/L GE EPA8260B0 Trichlorofluoromethane <1.00 U 1.00 µg/L GE EPA8260B0 Xylenes <3.00 U 3.00 µg/L GE EPA8260B
WELL TRP235DMEASUREMENTS CONDUCTED IN THE FIELD
Sample date: 11/29/00 Time: Not availableWater temperature: Not availableAir temperature: Not availablepH: Not available Total alkalinity (as CaCO3): Not availableSp. conductance: Not available Phenolphthalein alkalinity: Not availableTurbidity: Not availableNo water was evacuated from the well prior to sampling.
ANALYSES
F Analyte Result FG S EMS SQL Unit Lab Method
0 Benzene <1.00 JU L O 1.00 µg/L GE EPA8260B0 Bromodichloromethane <1.00 JU L O 1.00 µg/L GE EPA8260B0 Bromoform <1.00 JU L O 1.00 µg/L GE EPA8260B0 Bromomethane <1.00 JU L O 1.00 µg/L GE EPA8260B0 Carbon tetrachloride <1.00 JU L O 1.00 µg/L GE EPA8260B0 Chlorobenzene <1.00 JU L IO 1.00 µg/L GE EPA8260B0 Chloroethane <1.00 JU L O 1.00 µg/L GE EPA8260B0 Chloroethene (Vinyl chloride) <1.00 JU L O 1.00 µg/L GE EPA8260B0 2-Chloroethyl vinyl ether <5.00 JU L O 5.00 µg/L GE EPA8260B0 Chloroform <1.00 JU L O 1.00 µg/L GE EPA8260B0 Chloromethane <1.00 JU L O 1.00 µg/L GE EPA8260B0 Dibromochloromethane <1.00 JU L O 1.00 µg/L GE EPA8260B0 Dibromomethane <1.00 JU L O 1.00 µg/L GE EPA8260B0 1,1-Dichloroethane <1.00 JU L O 1.00 µg/L GE EPA8260B0 1,2-Dichloroethane <1.00 JU L O 1.00 µg/L GE EPA8260B0 1,1-Dichloroethylene <1.00 JU L O 1.00 µg/L GE EPA8260B0 trans-1,2-Dichloroethylene <1.00 JU L O 1.00 µg/L GE EPA8260B0 Dichloromethane <5.00 JU L O 5.00 µg/L GE EPA8260B0 1,2-Dichloropropane <1.00 JU L O 1.00 µg/L GE EPA8260B0 cis-1,3-Dichloropropene <1.00 JU L O 1.00 µg/L GE EPA8260B0 trans-1,3-Dichloropropene <1.00 JU L O 1.00 µg/L GE EPA8260B0 Ethylbenzene <1.00 JU L O 1.00 µg/L GE EPA8260B0 1,1,2,2-Tetrachloroethane <1.00 JU L O 1.00 µg/L GE EPA8260B0 Tetrachloroethylene <1.00 JU L O 1.00 µg/L GE EPA8260B0 Toluene <1.00 JU L IO 1.00 µg/L GE EPA8260B0 1,1,1-Trichloroethane <1.00 JU L O 1.00 µg/L GE EPA8260B0 1,1,2-Trichloroethane <1.00 JU L O 1.00 µg/L GE EPA8260B0 Trichloroethylene <1.00 JU L O 1.00 µg/L GE EPA8260B0 Trichlorofluoromethane <1.00 JU L O 1.00 µg/L GE EPA8260B0 Xylenes <3.00 JU L O 3.00 µg/L GE EPA8260B
WELL TRP236DMEASUREMENTS CONDUCTED IN THE FIELD
Sample date: 11/09/00 Time: Not availableWater temperature: Not availableAir temperature: Not availablepH: Not available Total alkalinity (as CaCO3): Not availableSp. conductance: Not available Phenolphthalein alkalinity: Not availableTurbidity: Not availableNo water was evacuated from the well prior to sampling.
ANALYSES
F Analyte Result FG S EMS SQL Unit Lab Method
0 Benzene <1.00 U 1.00 µg/L GE EPA8260B0 Bromodichloromethane <1.00 U 1.00 µg/L GE EPA8260B0 Bromoform <1.00 U 1.00 µg/L GE EPA8260B0 Bromomethane <1.00 U 1.00 µg/L GE EPA8260B0 Carbon tetrachloride <1.00 U 1.00 µg/L GE EPA8260B0 Chlorobenzene <1.00 U 1.00 µg/L GE EPA8260B0 Chloroethane <1.00 U 1.00 µg/L GE EPA8260B0 Chloroethene (Vinyl chloride) <1.00 U 1.00 µg/L GE EPA8260B0 2-Chloroethyl vinyl ether <5.00 U 5.00 µg/L GE EPA8260B0 Chloroform <1.00 U 1.00 µg/L GE EPA8260B0 Chloromethane <1.00 U 1.00 µg/L GE EPA8260B0 Dibromochloromethane <1.00 U 1.00 µg/L GE EPA8260B0 Dibromomethane <1.00 U 1.00 µg/L GE EPA8260B0 1,1-Dichloroethane <1.00 U 1.00 µg/L GE EPA8260B0 1,2-Dichloroethane <1.00 U 1.00 µg/L GE EPA8260B0 1,1-Dichloroethylene <1.00 U 1.00 µg/L GE EPA8260B0 trans-1,2-Dichloroethylene <1.00 U 1.00 µg/L GE EPA8260B0 Dichloromethane <5.00 U 5.00 µg/L GE EPA8260B0 1,2-Dichloropropane <1.00 U 1.00 µg/L GE EPA8260B0 cis-1,3-Dichloropropene <1.00 U 1.00 µg/L GE EPA8260B0 trans-1,3-Dichloropropene <1.00 U 1.00 µg/L GE EPA8260B0 Ethylbenzene <1.00 U 1.00 µg/L GE EPA8260B0 1,1,2,2-Tetrachloroethane <1.00 U 1.00 µg/L GE EPA8260B0 Tetrachloroethylene <1.00 U 1.00 µg/L GE EPA8260B0 Toluene <1.00 U 1.00 µg/L GE EPA8260B0 1,1,1-Trichloroethane <1.00 U 1.00 µg/L GE EPA8260B0 1,1,2-Trichloroethane <1.00 U 1.00 µg/L GE EPA8260B0 Trichloroethylene <1.00 U 1.00 µg/L GE EPA8260B0 Trichlorofluoromethane <1.00 U 1.00 µg/L GE EPA8260B0 Xylenes <3.00 U 3.00 µg/L GE EPA8260B
WELL TRP236DMEASUREMENTS CONDUCTED IN THE FIELD
Sample date: 11/17/00 Time: Not availableWater temperature: Not availableAir temperature: Not availablepH: Not available Total alkalinity (as CaCO3): Not availableSp. conductance: Not available Phenolphthalein alkalinity: Not availableTurbidity: Not availableNo water was evacuated from the well prior to sampling.
ANALYSES
F Analyte Result FG S EMS SQL Unit Lab Method
0 Benzene <1.00 U 1.00 µg/L GE EPA8260B0 Bromodichloromethane <1.00 U 1.00 µg/L GE EPA8260B0 Bromoform <1.00 U 1.00 µg/L GE EPA8260B0 Bromomethane <1.00 U 1.00 µg/L GE EPA8260B0 Carbon tetrachloride <1.00 U 1.00 µg/L GE EPA8260B0 Chlorobenzene <1.00 U 1.00 µg/L GE EPA8260B0 Chloroethane <1.00 U 1.00 µg/L GE EPA8260B0 Chloroethene (Vinyl chloride) <1.00 U 1.00 µg/L GE EPA8260B0 2-Chloroethyl vinyl ether <5.00 U 5.00 µg/L GE EPA8260B0 Chloroform <1.00 U 1.00 µg/L GE EPA8260B0 Chloromethane <1.00 U 1.00 µg/L GE EPA8260B0 Dibromochloromethane <1.00 U 1.00 µg/L GE EPA8260B0 Dibromomethane <1.00 U 1.00 µg/L GE EPA8260B0 1,1-Dichloroethane <1.00 U 1.00 µg/L GE EPA8260B0 1,1-Dichloroethylene <1.00 U 1.00 µg/L GE EPA8260B0 trans-1,2-Dichloroethylene <1.00 U 1.00 µg/L GE EPA8260B0 Dichloromethane <5.00 U 5.00 µg/L GE EPA8260B0 1,2-Dichloropropane <1.00 U 1.00 µg/L GE EPA8260B0 cis-1,3-Dichloropropene <1.00 U 1.00 µg/L GE EPA8260B

SAMPLING BLANKS RESULTSSAMPLING BLANKS RESULTS
ESH-EMS-2000408ESH-EMS-2000408 C-C-3232 Fourth Quarter 2000Fourth Quarter 2000
Well TRP236D collected on 11/17/00 (cont.)
F Analyte Result FG S EMS SQL Unit Lab Method
0 trans-1,3-Dichloropropene <1.00 U 1.00 µg/L GE EPA8260B0 Ethylbenzene <1.00 U 1.00 µg/L GE EPA8260B0 1,1,2,2-Tetrachloroethane <1.00 U 1.00 µg/L GE EPA8260B0 Tetrachloroethylene <1.00 U 1.00 µg/L GE EPA8260B0 Toluene <1.00 U 1.00 µg/L GE EPA8260B0 1,1,1-Trichloroethane <1.00 U 1.00 µg/L GE EPA8260B0 1,1,2-Trichloroethane <1.00 U 1.00 µg/L GE EPA8260B0 Trichloroethylene <1.00 U 1.00 µg/L GE EPA8260B0 Trichlorofluoromethane <1.00 U 1.00 µg/L GE EPA8260B0 Xylenes <3.00 U 3.00 µg/L GE EPA8260B
WELL TRP238DMEASUREMENTS CONDUCTED IN THE FIELD
Sample date: 12/13/00 Time: Not availableWater temperature: Not availableAir temperature: Not availablepH: Not available Total alkalinity (as CaCO3): Not availableSp. conductance: Not available Phenolphthalein alkalinity: Not availableTurbidity: Not availableNo water was evacuated from the well prior to sampling.
ANALYSES
F Analyte Result FG S EMS SQL Unit Lab Method
0 Benzene <5.00 U 5.00 µg/L EX EPA8260B0 Bromodichloromethane <5.00 U 5.00 µg/L EX EPA8260B0 Bromoform <5.00 U 5.00 µg/L EX EPA8260B0 Bromomethane <5.00 U 5.00 µg/L EX EPA8260B0 Carbon tetrachloride <5.00 U 5.00 µg/L EX EPA8260B0 Chlorobenzene <5.00 U 5.00 µg/L EX EPA8260B0 Chloroethane <5.00 U 5.00 µg/L EX EPA8260B0 Chloroethene (Vinyl chloride) <5.00 U 5.00 µg/L EX EPA8260B0 2-Chloroethyl vinyl ether <5.00 U 5.00 µg/L EX EPA8260B0 Chloroform <5.00 U 5.00 µg/L EX EPA8260B0 Chloromethane <5.00 U 5.00 µg/L EX EPA8260B0 Dibromochloromethane <5.00 U 5.00 µg/L EX EPA8260B0 1,1-Dichloroethane <5.00 U 5.00 µg/L EX EPA8260B0 1,2-Dichloroethane <5.00 U 5.00 µg/L EX EPA8260B0 1,1-Dichloroethylene <5.00 U 5.00 µg/L EX EPA8260B0 cis-1,2-Dichloroethylene <5.00 U 5.00 µg/L EX EPA8260B0 trans-1,2-Dichloroethylene <5.00 U 5.00 µg/L EX EPA8260B0 Dichloromethane 2.00 J I 8 10.0 µg/L EX EPA8260B0 1,2-Dichloropropane <5.00 U 5.00 µg/L EX EPA8260B0 cis-1,3-Dichloropropene <5.00 U 5.00 µg/L EX EPA8260B0 trans-1,3-Dichloropropene <5.00 U 5.00 µg/L EX EPA8260B0 Ethylbenzene <5.00 U 5.00 µg/L EX EPA8260B0 1,1,2,2-Tetrachloroethane <5.00 U 5.00 µg/L EX EPA8260B0 Tetrachloroethylene <5.00 U 5.00 µg/L EX EPA8260B0 Toluene <5.00 U 5.00 µg/L EX EPA8260B0 1,1,1-Trichloroethane <5.00 U 5.00 µg/L EX EPA8260B0 1,1,2-Trichloroethane <5.00 U 5.00 µg/L EX EPA8260B0 Trichloroethylene <5.00 U 5.00 µg/L EX EPA8260B0 Trichlorofluoromethane <5.00 U 5.00 µg/L EX EPA8260B
WELL TRP239DMEASUREMENTS CONDUCTED IN THE FIELD
Sample date: 12/14/00 Time: Not availableWater temperature: Not availableAir temperature: Not availablepH: Not available Total alkalinity (as CaCO3): Not availableSp. conductance: Not available Phenolphthalein alkalinity: Not availableTurbidity: Not availableNo water was evacuated from the well prior to sampling.
ANALYSES
F Analyte Result FG S EMS SQL Unit Lab Method
0 Benzene <5.00 U 5.00 µg/L EX EPA8260B0 Bromodichloromethane <5.00 U 5.00 µg/L EX EPA8260B0 Bromoform <5.00 U 5.00 µg/L EX EPA8260B0 Bromomethane <5.00 U 5.00 µg/L EX EPA8260B0 Carbon tetrachloride <5.00 U 5.00 µg/L EX EPA8260B
Well TRP239D collected on 12/14/00 (cont.)
F Analyte Result FG S EMS SQL Unit Lab Method
0 Chlorobenzene <5.00 U 5.00 µg/L EX EPA8260B0 Chloroethane <5.00 U 5.00 µg/L EX EPA8260B0 Chloroethene (Vinyl chloride) <5.00 U 5.00 µg/L EX EPA8260B0 2-Chloroethyl vinyl ether <5.00 U 5.00 µg/L EX EPA8260B0 Chloroform <5.00 U 5.00 µg/L EX EPA8260B0 Chloromethane <5.00 U 5.00 µg/L EX EPA8260B0 Dibromochloromethane <5.00 U 5.00 µg/L EX EPA8260B0 1,1-Dichloroethane <5.00 U 5.00 µg/L EX EPA8260B0 1,2-Dichloroethane <5.00 U 5.00 µg/L EX EPA8260B0 1,1-Dichloroethylene <5.00 U 5.00 µg/L EX EPA8260B0 cis-1,2-Dichloroethylene <5.00 U 5.00 µg/L EX EPA8260B0 trans-1,2-Dichloroethylene <5.00 U 5.00 µg/L EX EPA8260B0 Dichloromethane 1.70 J I 8 10.0 µg/L EX EPA8260B0 1,2-Dichloropropane <5.00 U 5.00 µg/L EX EPA8260B0 cis-1,3-Dichloropropene <5.00 U 5.00 µg/L EX EPA8260B0 trans-1,3-Dichloropropene <5.00 U 5.00 µg/L EX EPA8260B0 Ethylbenzene <5.00 U 5.00 µg/L EX EPA8260B0 1,1,2,2-Tetrachloroethane <5.00 U 5.00 µg/L EX EPA8260B0 Tetrachloroethylene <5.00 U 5.00 µg/L EX EPA8260B0 Toluene <5.00 U 5.00 µg/L EX EPA8260B0 1,1,1-Trichloroethane <5.00 U 5.00 µg/L EX EPA8260B0 1,1,2-Trichloroethane <5.00 U 5.00 µg/L EX EPA8260B0 Trichloroethylene <5.00 U 5.00 µg/L EX EPA8260B0 Trichlorofluoromethane <5.00 U 5.00 µg/L EX EPA8260B
WELL TRP240DMEASUREMENTS CONDUCTED IN THE FIELD
Sample date: 12/19/00 Time: Not availableWater temperature: Not availableAir temperature: Not availablepH: Not available Total alkalinity (as CaCO3): Not availableSp. conductance: Not available Phenolphthalein alkalinity: Not availableTurbidity: Not availableNo water was evacuated from the well prior to sampling.
ANALYSES
F Analyte Result FG S EMS SQL Unit Lab Method
0 Benzene <5.00 U 5.00 µg/L EX EPA8260B0 Bromodichloromethane <5.00 U 5.00 µg/L EX EPA8260B0 Bromoform <5.00 U 5.00 µg/L EX EPA8260B0 Bromomethane <5.00 U 5.00 µg/L EX EPA8260B0 Carbon tetrachloride <5.00 U 5.00 µg/L EX EPA8260B0 Chlorobenzene <5.00 U 5.00 µg/L EX EPA8260B0 Chloroethane <5.00 U 5.00 µg/L EX EPA8260B0 Chloroethene (Vinyl chloride) <5.00 U 5.00 µg/L EX EPA8260B0 2-Chloroethyl vinyl ether <5.00 U 5.00 µg/L EX EPA8260B0 Chloroform <5.00 U 5.00 µg/L EX EPA8260B0 Chloromethane <5.00 U 5.00 µg/L EX EPA8260B0 Dibromochloromethane <5.00 U 5.00 µg/L EX EPA8260B0 1,1-Dichloroethane <5.00 U 5.00 µg/L EX EPA8260B0 1,2-Dichloroethane <5.00 U 5.00 µg/L EX EPA8260B0 1,1-Dichloroethylene <5.00 U 5.00 µg/L EX EPA8260B0 cis-1,2-Dichloroethylene <5.00 U 5.00 µg/L EX EPA8260B0 trans-1,2-Dichloroethylene <5.00 U 5.00 µg/L EX EPA8260B0 Dichloromethane 2.10 J I 8 10.0 µg/L EX EPA8260B0 1,2-Dichloropropane <5.00 U 5.00 µg/L EX EPA8260B0 cis-1,3-Dichloropropene <5.00 U 5.00 µg/L EX EPA8260B0 trans-1,3-Dichloropropene <5.00 U 5.00 µg/L EX EPA8260B0 Ethylbenzene <5.00 U 5.00 µg/L EX EPA8260B0 1,1,2,2-Tetrachloroethane <5.00 U 5.00 µg/L EX EPA8260B0 Tetrachloroethylene <5.00 U 5.00 µg/L EX EPA8260B0 Toluene <5.00 U 5.00 µg/L EX EPA8260B0 1,1,1-Trichloroethane <5.00 U 5.00 µg/L EX EPA8260B0 1,1,2-Trichloroethane <5.00 U 5.00 µg/L EX EPA8260B0 Trichloroethylene <5.00 U 5.00 µg/L EX EPA8260B0 Trichlorofluoromethane <5.00 U 5.00 µg/L EX EPA8260B

SAMPLING BLANKS RESULTSSAMPLING BLANKS RESULTS
ESH-EMS-2000408ESH-EMS-2000408 C-C-3333 Fourth Quarter 2000Fourth Quarter 2000
WELL TRP246DMEASUREMENTS CONDUCTED IN THE FIELD
Sample date: 12/13/00 Time: Not availableWater temperature: Not availableAir temperature: Not availablepH: Not available Total alkalinity (as CaCO3): Not availableSp. conductance: Not available Phenolphthalein alkalinity: Not availableTurbidity: Not availableNo water was evacuated from the well prior to sampling.
ANALYSES
F Analyte Result FG S EMS SQL Unit Lab Method
0 Benzene <5.00 U 5.00 µg/L WA EPA8260B0 Bromodichloromethane <5.00 U 5.00 µg/L WA EPA8260B0 Bromoform <5.00 U 5.00 µg/L WA EPA8260B0 Bromomethane <10.0 U 10.0 µg/L WA EPA8260B0 Carbon tetrachloride <5.00 U 5.00 µg/L WA EPA8260B0 Chlorobenzene <5.00 U 5.00 µg/L WA EPA8260B0 Chloroethane <10.0 U 10.0 µg/L WA EPA8260B0 Chloroethene (Vinyl chloride) <10.0 U 10.0 µg/L WA EPA8260B0 2-Chloroethyl vinyl ether 10.0 R 4 10.0 µg/L WA EPA8260B0 Chloroform <5.00 U 5.00 µg/L WA EPA8260B0 Chloromethane <10.0 U 10.0 µg/L WA EPA8260B0 Dibromochloromethane <5.00 U 5.00 µg/L WA EPA8260B0 1,1-Dichloroethane <5.00 U 5.00 µg/L WA EPA8260B0 1,2-Dichloroethane <5.00 U 5.00 µg/L WA EPA8260B0 1,1-Dichloroethylene <5.00 U 5.00 µg/L WA EPA8260B0 cis-1,2-Dichloroethylene <5.00 U 5.00 µg/L WA EPA8260B0 trans-1,2-Dichloroethylene <5.00 U 5.00 µg/L WA EPA8260B0 Dichloromethane <5.19 U V 5.00 µg/L WA EPA8260B0 1,2-Dichloropropane <5.00 U 5.00 µg/L WA EPA8260B0 cis-1,3-Dichloropropene <5.00 U 5.00 µg/L WA EPA8260B0 trans-1,3-Dichloropropene <5.00 U 5.00 µg/L WA EPA8260B0 Ethylbenzene <5.00 U 5.00 µg/L WA EPA8260B0 1,1,2,2-Tetrachloroethane <5.00 U 5.00 µg/L WA EPA8260B0 Tetrachloroethylene <5.00 U 5.00 µg/L WA EPA8260B0 Toluene <5.00 U 5.00 µg/L WA EPA8260B0 1,1,1-Trichloroethane <5.00 U 5.00 µg/L WA EPA8260B0 1,1,2-Trichloroethane <5.00 U 5.00 µg/L WA EPA8260B0 Trichloroethylene <5.00 U 5.00 µg/L WA EPA8260B0 Trichlorofluoromethane <5.00 U 5.00 µg/L WA EPA8260B
WELL TRP247DMEASUREMENTS CONDUCTED IN THE FIELD
Sample date: 12/18/00 Time: Not availableWater temperature: Not availableAir temperature: Not availablepH: Not available Total alkalinity (as CaCO3): Not availableSp. conductance: Not available Phenolphthalein alkalinity: Not availableTurbidity: Not availableNo water was evacuated from the well prior to sampling.
ANALYSES
F Analyte Result FG S EMS SQL Unit Lab Method
0 Benzene <1.00 U 1.00 µg/L GE EPA8260B0 Bromodichloromethane <1.00 U 1.00 µg/L GE EPA8260B0 Bromoform <1.00 U 1.00 µg/L GE EPA8260B0 Bromomethane <1.00 U 1.00 µg/L GE EPA8260B0 Carbon tetrachloride <1.00 U 1.00 µg/L GE EPA8260B0 Chlorobenzene <1.00 U 1.00 µg/L GE EPA8260B0 Chloroethane <1.00 U 1.00 µg/L GE EPA8260B0 Chloroethene (Vinyl chloride) <1.00 U 1.00 µg/L GE EPA8260B0 2-Chloroethyl vinyl ether <5.00 U 5.00 µg/L GE EPA8260B0 Chloroform <1.00 U 1.00 µg/L GE EPA8260B0 Chloromethane <1.00 U 1.00 µg/L GE EPA8260B0 Dibromochloromethane <1.00 U 1.00 µg/L GE EPA8260B0 1,1-Dichloroethane <1.00 U 1.00 µg/L GE EPA8260B0 1,2-Dichloroethane <1.00 U 1.00 µg/L GE EPA8260B0 1,1-Dichloroethylene <1.00 U 1.00 µg/L GE EPA8260B0 trans-1,2-Dichloroethylene <1.00 U 1.00 µg/L GE EPA8260B0 Dichloromethane <5.00 U 5.00 µg/L GE EPA8260B0 1,2-Dichloropropane <1.00 U 1.00 µg/L GE EPA8260B0 cis-1,3-Dichloropropene <1.00 U 1.00 µg/L GE EPA8260B0 trans-1,3-Dichloropropene <1.00 U 1.00 µg/L GE EPA8260B
Well TRP247D collected on 12/18/00 (cont.)
F Analyte Result FG S EMS SQL Unit Lab Method
0 Ethylbenzene <1.00 U 1.00 µg/L GE EPA8260B0 1,1,2,2-Tetrachloroethane <1.00 U 1.00 µg/L GE EPA8260B0 Tetrachloroethylene <1.00 U 1.00 µg/L GE EPA8260B0 Toluene <1.00 JU L I 1.00 µg/L GE EPA8260B0 1,1,1-Trichloroethane <1.00 U 1.00 µg/L GE EPA8260B0 1,1,2-Trichloroethane <1.00 U 1.00 µg/L GE EPA8260B0 Trichloroethylene <1.00 JU L I 1.00 µg/L GE EPA8260B0 Trichlorofluoromethane <1.00 U 1.00 µg/L GE EPA8260B
WELL TRP248CMEASUREMENTS CONDUCTED IN THE FIELD
Sample date: 10/09/00 Time: Not availableWater temperature: Not availableAir temperature: Not availablepH: Not available Total alkalinity (as CaCO3): Not availableSp. conductance: Not available Phenolphthalein alkalinity: Not availableTurbidity: Not availableNo water was evacuated from the well prior to sampling.
ANALYSES
F Analyte Result FG S EMS SQL Unit Lab Method
0 Benzene <5.00 U 5.00 µg/L EX EPA8260B0 Bromodichloromethane <5.00 U 5.00 µg/L EX EPA8260B0 Bromoform <5.00 U 5.00 µg/L EX EPA8260B0 Bromomethane <5.00 U 5.00 µg/L EX EPA8260B0 Carbon tetrachloride <5.00 U 5.00 µg/L EX EPA8260B0 Chlorobenzene <5.00 U 5.00 µg/L EX EPA8260B0 Chloroethane <5.00 U 5.00 µg/L EX EPA8260B0 Chloroethene (Vinyl chloride) <5.00 U 5.00 µg/L EX EPA8260B0 2-Chloroethyl vinyl ether <5.00 U 5.00 µg/L EX EPA8260B0 Chloroform <5.00 U 5.00 µg/L EX EPA8260B0 Chloromethane <5.00 U 5.00 µg/L EX EPA8260B0 Dibromochloromethane <5.00 U 5.00 µg/L EX EPA8260B0 1,1-Dichloroethane <5.00 U 5.00 µg/L EX EPA8260B0 1,2-Dichloroethane <5.00 U 5.00 µg/L EX EPA8260B0 1,1-Dichloroethylene <5.00 U 5.00 µg/L EX EPA8260B0 cis-1,2-Dichloroethylene <5.00 U 5.00 µg/L EX EPA8260B0 trans-1,2-Dichloroethylene <5.00 U 5.00 µg/L EX EPA8260B0 Dichloromethane <10.0 U 10.0 µg/L EX EPA8260B0 1,2-Dichloropropane <5.00 U 5.00 µg/L EX EPA8260B0 cis-1,3-Dichloropropene <5.00 U 5.00 µg/L EX EPA8260B0 trans-1,3-Dichloropropene <5.00 U 5.00 µg/L EX EPA8260B0 Ethylbenzene <5.00 U 5.00 µg/L EX EPA8260B0 1,1,2,2-Tetrachloroethane <5.00 U 5.00 µg/L EX EPA8260B0 Tetrachloroethylene <5.00 U 5.00 µg/L EX EPA8260B0 Toluene <5.00 U 5.00 µg/L EX EPA8260B0 1,1,1-Trichloroethane <5.00 U 5.00 µg/L EX EPA8260B0 1,1,2-Trichloroethane <5.00 U 5.00 µg/L EX EPA8260B0 Trichloroethylene <5.00 U 5.00 µg/L EX EPA8260B0 Trichlorofluoromethane <5.00 U 5.00 µg/L EX EPA8260B
WELL TRP250BMEASUREMENTS CONDUCTED IN THE FIELD
Sample date: 10/26/00 Time: Not availableWater temperature: Not availableAir temperature: Not availablepH: Not available Total alkalinity (as CaCO3): Not availableSp. conductance: Not available Phenolphthalein alkalinity: Not availableTurbidity: Not availableNo water was evacuated from the well prior to sampling.
ANALYSES
F Analyte Result FG S EMS SQL Unit Lab Method
0 Acetone <10.0 U 10.0 µg/L WA EPA8260B0 Benzene <5.00 U 5.00 µg/L WA EPA8260B0 Bromodichloromethane <5.00 U 5.00 µg/L WA EPA8260B0 Bromoform <5.00 U 5.00 µg/L WA EPA8260B0 Bromomethane <10.0 U 10.0 µg/L WA EPA8260B0 Carbon disulfide <5.00 U 5.00 µg/L WA EPA8260B0 Carbon tetrachloride <5.00 U 5.00 µg/L WA EPA8260B
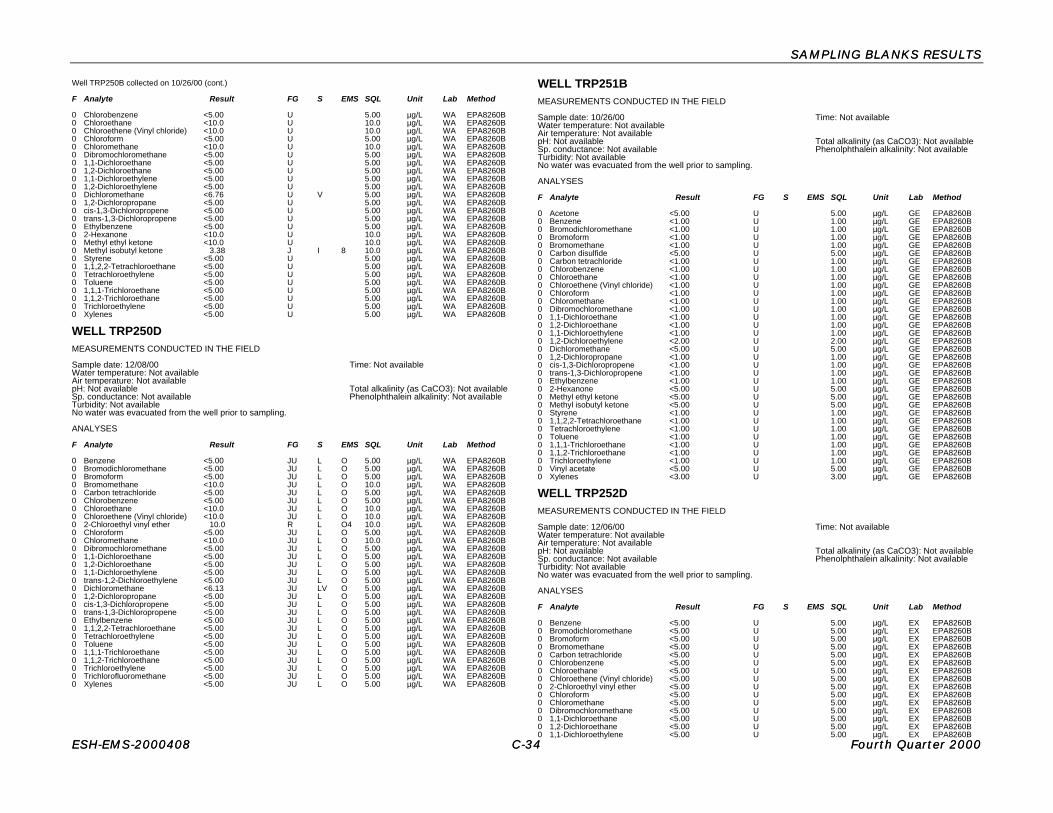
SAMPLING BLANKS RESULTSSAMPLING BLANKS RESULTS
ESH-EMS-2000408ESH-EMS-2000408 C-C-3434 Fourth Quarter 2000Fourth Quarter 2000
Well TRP250B collected on 10/26/00 (cont.)
F Analyte Result FG S EMS SQL Unit Lab Method
0 Chlorobenzene <5.00 U 5.00 µg/L WA EPA8260B0 Chloroethane <10.0 U 10.0 µg/L WA EPA8260B0 Chloroethene (Vinyl chloride) <10.0 U 10.0 µg/L WA EPA8260B0 Chloroform <5.00 U 5.00 µg/L WA EPA8260B0 Chloromethane <10.0 U 10.0 µg/L WA EPA8260B0 Dibromochloromethane <5.00 U 5.00 µg/L WA EPA8260B0 1,1-Dichloroethane <5.00 U 5.00 µg/L WA EPA8260B0 1,2-Dichloroethane <5.00 U 5.00 µg/L WA EPA8260B0 1,1-Dichloroethylene <5.00 U 5.00 µg/L WA EPA8260B0 1,2-Dichloroethylene <5.00 U 5.00 µg/L WA EPA8260B0 Dichloromethane <6.76 U V 5.00 µg/L WA EPA8260B0 1,2-Dichloropropane <5.00 U 5.00 µg/L WA EPA8260B0 cis-1,3-Dichloropropene <5.00 U 5.00 µg/L WA EPA8260B0 trans-1,3-Dichloropropene <5.00 U 5.00 µg/L WA EPA8260B0 Ethylbenzene <5.00 U 5.00 µg/L WA EPA8260B0 2-Hexanone <10.0 U 10.0 µg/L WA EPA8260B0 Methyl ethyl ketone <10.0 U 10.0 µg/L WA EPA8260B0 Methyl isobutyl ketone 3.38 J I 8 10.0 µg/L WA EPA8260B0 Styrene <5.00 U 5.00 µg/L WA EPA8260B0 1,1,2,2-Tetrachloroethane <5.00 U 5.00 µg/L WA EPA8260B0 Tetrachloroethylene <5.00 U 5.00 µg/L WA EPA8260B0 Toluene <5.00 U 5.00 µg/L WA EPA8260B0 1,1,1-Trichloroethane <5.00 U 5.00 µg/L WA EPA8260B0 1,1,2-Trichloroethane <5.00 U 5.00 µg/L WA EPA8260B0 Trichloroethylene <5.00 U 5.00 µg/L WA EPA8260B0 Xylenes <5.00 U 5.00 µg/L WA EPA8260B
WELL TRP250DMEASUREMENTS CONDUCTED IN THE FIELD
Sample date: 12/08/00 Time: Not availableWater temperature: Not availableAir temperature: Not availablepH: Not available Total alkalinity (as CaCO3): Not availableSp. conductance: Not available Phenolphthalein alkalinity: Not availableTurbidity: Not availableNo water was evacuated from the well prior to sampling.
ANALYSES
F Analyte Result FG S EMS SQL Unit Lab Method
0 Benzene <5.00 JU L O 5.00 µg/L WA EPA8260B0 Bromodichloromethane <5.00 JU L O 5.00 µg/L WA EPA8260B0 Bromoform <5.00 JU L O 5.00 µg/L WA EPA8260B0 Bromomethane <10.0 JU L O 10.0 µg/L WA EPA8260B0 Carbon tetrachloride <5.00 JU L O 5.00 µg/L WA EPA8260B0 Chlorobenzene <5.00 JU L O 5.00 µg/L WA EPA8260B0 Chloroethane <10.0 JU L O 10.0 µg/L WA EPA8260B0 Chloroethene (Vinyl chloride) <10.0 JU L O 10.0 µg/L WA EPA8260B0 2-Chloroethyl vinyl ether 10.0 R L O4 10.0 µg/L WA EPA8260B0 Chloroform <5.00 JU L O 5.00 µg/L WA EPA8260B0 Chloromethane <10.0 JU L O 10.0 µg/L WA EPA8260B0 Dibromochloromethane <5.00 JU L O 5.00 µg/L WA EPA8260B0 1,1-Dichloroethane <5.00 JU L O 5.00 µg/L WA EPA8260B0 1,2-Dichloroethane <5.00 JU L O 5.00 µg/L WA EPA8260B0 1,1-Dichloroethylene <5.00 JU L O 5.00 µg/L WA EPA8260B0 trans-1,2-Dichloroethylene <5.00 JU L O 5.00 µg/L WA EPA8260B0 Dichloromethane <6.13 JU LV O 5.00 µg/L WA EPA8260B0 1,2-Dichloropropane <5.00 JU L O 5.00 µg/L WA EPA8260B0 cis-1,3-Dichloropropene <5.00 JU L O 5.00 µg/L WA EPA8260B0 trans-1,3-Dichloropropene <5.00 JU L O 5.00 µg/L WA EPA8260B0 Ethylbenzene <5.00 JU L O 5.00 µg/L WA EPA8260B0 1,1,2,2-Tetrachloroethane <5.00 JU L O 5.00 µg/L WA EPA8260B0 Tetrachloroethylene <5.00 JU L O 5.00 µg/L WA EPA8260B0 Toluene <5.00 JU L O 5.00 µg/L WA EPA8260B0 1,1,1-Trichloroethane <5.00 JU L O 5.00 µg/L WA EPA8260B0 1,1,2-Trichloroethane <5.00 JU L O 5.00 µg/L WA EPA8260B0 Trichloroethylene <5.00 JU L O 5.00 µg/L WA EPA8260B0 Trichlorofluoromethane <5.00 JU L O 5.00 µg/L WA EPA8260B0 Xylenes <5.00 JU L O 5.00 µg/L WA EPA8260B
WELL TRP251BMEASUREMENTS CONDUCTED IN THE FIELD
Sample date: 10/26/00 Time: Not availableWater temperature: Not availableAir temperature: Not availablepH: Not available Total alkalinity (as CaCO3): Not availableSp. conductance: Not available Phenolphthalein alkalinity: Not availableTurbidity: Not availableNo water was evacuated from the well prior to sampling.
ANALYSES
F Analyte Result FG S EMS SQL Unit Lab Method
0 Acetone <5.00 U 5.00 µg/L GE EPA8260B0 Benzene <1.00 U 1.00 µg/L GE EPA8260B0 Bromodichloromethane <1.00 U 1.00 µg/L GE EPA8260B0 Bromoform <1.00 U 1.00 µg/L GE EPA8260B0 Bromomethane <1.00 U 1.00 µg/L GE EPA8260B0 Carbon disulfide <5.00 U 5.00 µg/L GE EPA8260B0 Carbon tetrachloride <1.00 U 1.00 µg/L GE EPA8260B0 Chlorobenzene <1.00 U 1.00 µg/L GE EPA8260B0 Chloroethane <1.00 U 1.00 µg/L GE EPA8260B0 Chloroethene (Vinyl chloride) <1.00 U 1.00 µg/L GE EPA8260B0 Chloroform <1.00 U 1.00 µg/L GE EPA8260B0 Chloromethane <1.00 U 1.00 µg/L GE EPA8260B0 Dibromochloromethane <1.00 U 1.00 µg/L GE EPA8260B0 1,1-Dichloroethane <1.00 U 1.00 µg/L GE EPA8260B0 1,2-Dichloroethane <1.00 U 1.00 µg/L GE EPA8260B0 1,1-Dichloroethylene <1.00 U 1.00 µg/L GE EPA8260B0 1,2-Dichloroethylene <2.00 U 2.00 µg/L GE EPA8260B0 Dichloromethane <5.00 U 5.00 µg/L GE EPA8260B0 1,2-Dichloropropane <1.00 U 1.00 µg/L GE EPA8260B0 cis-1,3-Dichloropropene <1.00 U 1.00 µg/L GE EPA8260B0 trans-1,3-Dichloropropene <1.00 U 1.00 µg/L GE EPA8260B0 Ethylbenzene <1.00 U 1.00 µg/L GE EPA8260B0 2-Hexanone <5.00 U 5.00 µg/L GE EPA8260B0 Methyl ethyl ketone <5.00 U 5.00 µg/L GE EPA8260B0 Methyl isobutyl ketone <5.00 U 5.00 µg/L GE EPA8260B0 Styrene <1.00 U 1.00 µg/L GE EPA8260B0 1,1,2,2-Tetrachloroethane <1.00 U 1.00 µg/L GE EPA8260B0 Tetrachloroethylene <1.00 U 1.00 µg/L GE EPA8260B0 Toluene <1.00 U 1.00 µg/L GE EPA8260B0 1,1,1-Trichloroethane <1.00 U 1.00 µg/L GE EPA8260B0 1,1,2-Trichloroethane <1.00 U 1.00 µg/L GE EPA8260B0 Trichloroethylene <1.00 U 1.00 µg/L GE EPA8260B0 Vinyl acetate <5.00 U 5.00 µg/L GE EPA8260B0 Xylenes <3.00 U 3.00 µg/L GE EPA8260B
WELL TRP252DMEASUREMENTS CONDUCTED IN THE FIELD
Sample date: 12/06/00 Time: Not availableWater temperature: Not availableAir temperature: Not availablepH: Not available Total alkalinity (as CaCO3): Not availableSp. conductance: Not available Phenolphthalein alkalinity: Not availableTurbidity: Not availableNo water was evacuated from the well prior to sampling.
ANALYSES
F Analyte Result FG S EMS SQL Unit Lab Method
0 Benzene <5.00 U 5.00 µg/L EX EPA8260B0 Bromodichloromethane <5.00 U 5.00 µg/L EX EPA8260B0 Bromoform <5.00 U 5.00 µg/L EX EPA8260B0 Bromomethane <5.00 U 5.00 µg/L EX EPA8260B0 Carbon tetrachloride <5.00 U 5.00 µg/L EX EPA8260B0 Chlorobenzene <5.00 U 5.00 µg/L EX EPA8260B0 Chloroethane <5.00 U 5.00 µg/L EX EPA8260B0 Chloroethene (Vinyl chloride) <5.00 U 5.00 µg/L EX EPA8260B0 2-Chloroethyl vinyl ether <5.00 U 5.00 µg/L EX EPA8260B0 Chloroform <5.00 U 5.00 µg/L EX EPA8260B0 Chloromethane <5.00 U 5.00 µg/L EX EPA8260B0 Dibromochloromethane <5.00 U 5.00 µg/L EX EPA8260B0 1,1-Dichloroethane <5.00 U 5.00 µg/L EX EPA8260B0 1,2-Dichloroethane <5.00 U 5.00 µg/L EX EPA8260B0 1,1-Dichloroethylene <5.00 U 5.00 µg/L EX EPA8260B
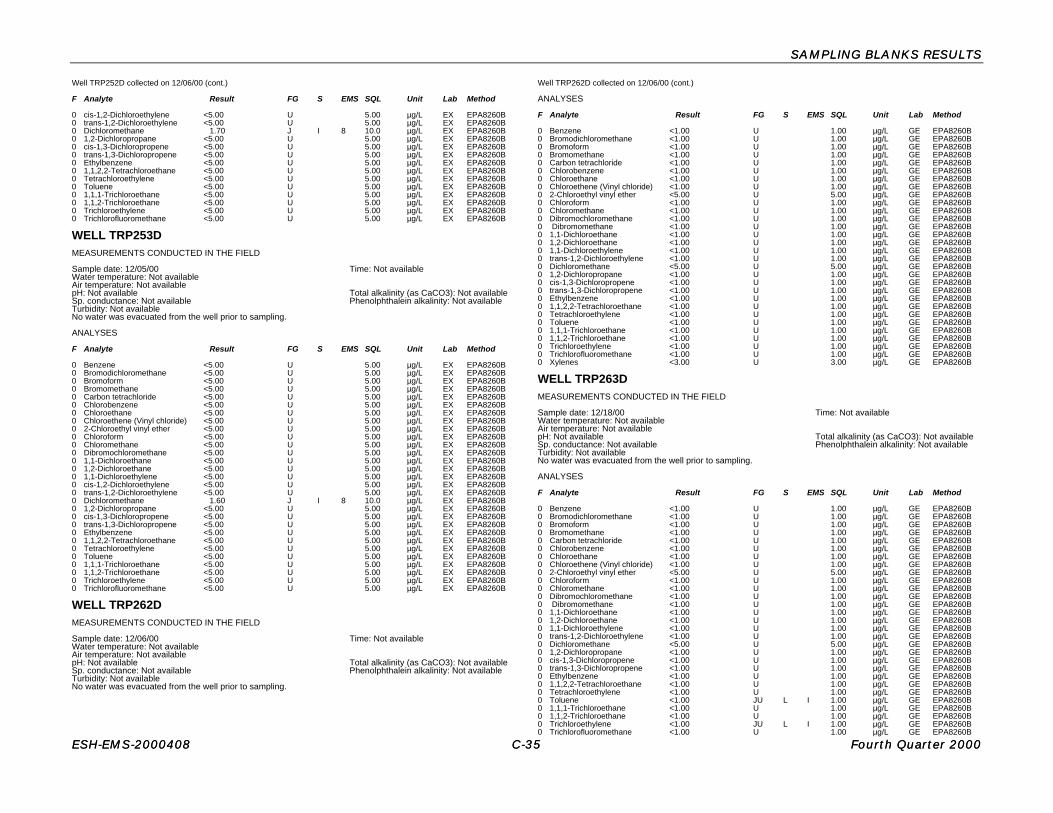
SAMPLING BLANKS RESULTSSAMPLING BLANKS RESULTS
ESH-EMS-2000408ESH-EMS-2000408 C-C-3535 Fourth Quarter 2000Fourth Quarter 2000
Well TRP252D collected on 12/06/00 (cont.)
F Analyte Result FG S EMS SQL Unit Lab Method
0 cis-1,2-Dichloroethylene <5.00 U 5.00 µg/L EX EPA8260B0 trans-1,2-Dichloroethylene <5.00 U 5.00 µg/L EX EPA8260B0 Dichloromethane 1.70 J I 8 10.0 µg/L EX EPA8260B0 1,2-Dichloropropane <5.00 U 5.00 µg/L EX EPA8260B0 cis-1,3-Dichloropropene <5.00 U 5.00 µg/L EX EPA8260B0 trans-1,3-Dichloropropene <5.00 U 5.00 µg/L EX EPA8260B0 Ethylbenzene <5.00 U 5.00 µg/L EX EPA8260B0 1,1,2,2-Tetrachloroethane <5.00 U 5.00 µg/L EX EPA8260B0 Tetrachloroethylene <5.00 U 5.00 µg/L EX EPA8260B0 Toluene <5.00 U 5.00 µg/L EX EPA8260B0 1,1,1-Trichloroethane <5.00 U 5.00 µg/L EX EPA8260B0 1,1,2-Trichloroethane <5.00 U 5.00 µg/L EX EPA8260B0 Trichloroethylene <5.00 U 5.00 µg/L EX EPA8260B0 Trichlorofluoromethane <5.00 U 5.00 µg/L EX EPA8260B
WELL TRP253DMEASUREMENTS CONDUCTED IN THE FIELD
Sample date: 12/05/00 Time: Not availableWater temperature: Not availableAir temperature: Not availablepH: Not available Total alkalinity (as CaCO3): Not availableSp. conductance: Not available Phenolphthalein alkalinity: Not availableTurbidity: Not availableNo water was evacuated from the well prior to sampling.
ANALYSES
F Analyte Result FG S EMS SQL Unit Lab Method
0 Benzene <5.00 U 5.00 µg/L EX EPA8260B0 Bromodichloromethane <5.00 U 5.00 µg/L EX EPA8260B0 Bromoform <5.00 U 5.00 µg/L EX EPA8260B0 Bromomethane <5.00 U 5.00 µg/L EX EPA8260B0 Carbon tetrachloride <5.00 U 5.00 µg/L EX EPA8260B0 Chlorobenzene <5.00 U 5.00 µg/L EX EPA8260B0 Chloroethane <5.00 U 5.00 µg/L EX EPA8260B0 Chloroethene (Vinyl chloride) <5.00 U 5.00 µg/L EX EPA8260B0 2-Chloroethyl vinyl ether <5.00 U 5.00 µg/L EX EPA8260B0 Chloroform <5.00 U 5.00 µg/L EX EPA8260B0 Chloromethane <5.00 U 5.00 µg/L EX EPA8260B0 Dibromochloromethane <5.00 U 5.00 µg/L EX EPA8260B0 1,1-Dichloroethane <5.00 U 5.00 µg/L EX EPA8260B0 1,2-Dichloroethane <5.00 U 5.00 µg/L EX EPA8260B0 1,1-Dichloroethylene <5.00 U 5.00 µg/L EX EPA8260B0 cis-1,2-Dichloroethylene <5.00 U 5.00 µg/L EX EPA8260B0 trans-1,2-Dichloroethylene <5.00 U 5.00 µg/L EX EPA8260B0 Dichloromethane 1.60 J I 8 10.0 µg/L EX EPA8260B0 1,2-Dichloropropane <5.00 U 5.00 µg/L EX EPA8260B0 cis-1,3-Dichloropropene <5.00 U 5.00 µg/L EX EPA8260B0 trans-1,3-Dichloropropene <5.00 U 5.00 µg/L EX EPA8260B0 Ethylbenzene <5.00 U 5.00 µg/L EX EPA8260B0 1,1,2,2-Tetrachloroethane <5.00 U 5.00 µg/L EX EPA8260B0 Tetrachloroethylene <5.00 U 5.00 µg/L EX EPA8260B0 Toluene <5.00 U 5.00 µg/L EX EPA8260B0 1,1,1-Trichloroethane <5.00 U 5.00 µg/L EX EPA8260B0 1,1,2-Trichloroethane <5.00 U 5.00 µg/L EX EPA8260B0 Trichloroethylene <5.00 U 5.00 µg/L EX EPA8260B0 Trichlorofluoromethane <5.00 U 5.00 µg/L EX EPA8260B
WELL TRP262DMEASUREMENTS CONDUCTED IN THE FIELD
Sample date: 12/06/00 Time: Not availableWater temperature: Not availableAir temperature: Not availablepH: Not available Total alkalinity (as CaCO3): Not availableSp. conductance: Not available Phenolphthalein alkalinity: Not availableTurbidity: Not availableNo water was evacuated from the well prior to sampling.
Well TRP262D collected on 12/06/00 (cont.)
ANALYSES
F Analyte Result FG S EMS SQL Unit Lab Method
0 Benzene <1.00 U 1.00 µg/L GE EPA8260B0 Bromodichloromethane <1.00 U 1.00 µg/L GE EPA8260B0 Bromoform <1.00 U 1.00 µg/L GE EPA8260B0 Bromomethane <1.00 U 1.00 µg/L GE EPA8260B0 Carbon tetrachloride <1.00 U 1.00 µg/L GE EPA8260B0 Chlorobenzene <1.00 U 1.00 µg/L GE EPA8260B0 Chloroethane <1.00 U 1.00 µg/L GE EPA8260B0 Chloroethene (Vinyl chloride) <1.00 U 1.00 µg/L GE EPA8260B0 2-Chloroethyl vinyl ether <5.00 U 5.00 µg/L GE EPA8260B0 Chloroform <1.00 U 1.00 µg/L GE EPA8260B0 Chloromethane <1.00 U 1.00 µg/L GE EPA8260B0 Dibromochloromethane <1.00 U 1.00 µg/L GE EPA8260B0 Dibromomethane <1.00 U 1.00 µg/L GE EPA8260B0 1,1-Dichloroethane <1.00 U 1.00 µg/L GE EPA8260B0 1,2-Dichloroethane <1.00 U 1.00 µg/L GE EPA8260B0 1,1-Dichloroethylene <1.00 U 1.00 µg/L GE EPA8260B0 trans-1,2-Dichloroethylene <1.00 U 1.00 µg/L GE EPA8260B0 Dichloromethane <5.00 U 5.00 µg/L GE EPA8260B0 1,2-Dichloropropane <1.00 U 1.00 µg/L GE EPA8260B0 cis-1,3-Dichloropropene <1.00 U 1.00 µg/L GE EPA8260B0 trans-1,3-Dichloropropene <1.00 U 1.00 µg/L GE EPA8260B0 Ethylbenzene <1.00 U 1.00 µg/L GE EPA8260B0 1,1,2,2-Tetrachloroethane <1.00 U 1.00 µg/L GE EPA8260B0 Tetrachloroethylene <1.00 U 1.00 µg/L GE EPA8260B0 Toluene <1.00 U 1.00 µg/L GE EPA8260B0 1,1,1-Trichloroethane <1.00 U 1.00 µg/L GE EPA8260B0 1,1,2-Trichloroethane <1.00 U 1.00 µg/L GE EPA8260B0 Trichloroethylene <1.00 U 1.00 µg/L GE EPA8260B0 Trichlorofluoromethane <1.00 U 1.00 µg/L GE EPA8260B0 Xylenes <3.00 U 3.00 µg/L GE EPA8260B
WELL TRP263DMEASUREMENTS CONDUCTED IN THE FIELD
Sample date: 12/18/00 Time: Not availableWater temperature: Not availableAir temperature: Not availablepH: Not available Total alkalinity (as CaCO3): Not availableSp. conductance: Not available Phenolphthalein alkalinity: Not availableTurbidity: Not availableNo water was evacuated from the well prior to sampling.
ANALYSES
F Analyte Result FG S EMS SQL Unit Lab Method
0 Benzene <1.00 U 1.00 µg/L GE EPA8260B0 Bromodichloromethane <1.00 U 1.00 µg/L GE EPA8260B0 Bromoform <1.00 U 1.00 µg/L GE EPA8260B0 Bromomethane <1.00 U 1.00 µg/L GE EPA8260B0 Carbon tetrachloride <1.00 U 1.00 µg/L GE EPA8260B0 Chlorobenzene <1.00 U 1.00 µg/L GE EPA8260B0 Chloroethane <1.00 U 1.00 µg/L GE EPA8260B0 Chloroethene (Vinyl chloride) <1.00 U 1.00 µg/L GE EPA8260B0 2-Chloroethyl vinyl ether <5.00 U 5.00 µg/L GE EPA8260B0 Chloroform <1.00 U 1.00 µg/L GE EPA8260B0 Chloromethane <1.00 U 1.00 µg/L GE EPA8260B0 Dibromochloromethane <1.00 U 1.00 µg/L GE EPA8260B0 Dibromomethane <1.00 U 1.00 µg/L GE EPA8260B0 1,1-Dichloroethane <1.00 U 1.00 µg/L GE EPA8260B0 1,2-Dichloroethane <1.00 U 1.00 µg/L GE EPA8260B0 1,1-Dichloroethylene <1.00 U 1.00 µg/L GE EPA8260B0 trans-1,2-Dichloroethylene <1.00 U 1.00 µg/L GE EPA8260B0 Dichloromethane <5.00 U 5.00 µg/L GE EPA8260B0 1,2-Dichloropropane <1.00 U 1.00 µg/L GE EPA8260B0 cis-1,3-Dichloropropene <1.00 U 1.00 µg/L GE EPA8260B0 trans-1,3-Dichloropropene <1.00 U 1.00 µg/L GE EPA8260B0 Ethylbenzene <1.00 U 1.00 µg/L GE EPA8260B0 1,1,2,2-Tetrachloroethane <1.00 U 1.00 µg/L GE EPA8260B0 Tetrachloroethylene <1.00 U 1.00 µg/L GE EPA8260B0 Toluene <1.00 JU L I 1.00 µg/L GE EPA8260B0 1,1,1-Trichloroethane <1.00 U 1.00 µg/L GE EPA8260B0 1,1,2-Trichloroethane <1.00 U 1.00 µg/L GE EPA8260B0 Trichloroethylene <1.00 JU L I 1.00 µg/L GE EPA8260B0 Trichlorofluoromethane <1.00 U 1.00 µg/L GE EPA8260B

SAMPLING BLANKS RESULTSSAMPLING BLANKS RESULTS
ESH-EMS-2000408ESH-EMS-2000408 C-C-3636 Fourth Quarter 2000Fourth Quarter 2000
Well TRP263D collected on 12/18/00 (cont.)
F Analyte Result FG S EMS SQL Unit Lab Method
0 Xylenes <3.00 U 3.00 µg/L GE EPA8260B
WELL TRP266DMEASUREMENTS CONDUCTED IN THE FIELD
Sample date: 12/11/00 Time: Not availableWater temperature: Not availableAir temperature: Not availablepH: Not available Total alkalinity (as CaCO3): Not availableSp. conductance: Not available Phenolphthalein alkalinity: Not availableTurbidity: Not availableNo water was evacuated from the well prior to sampling.
ANALYSES
F Analyte Result FG S EMS SQL Unit Lab Method
0 Benzene <5.00 U 5.00 µg/L WA EPA8260B0 Bromodichloromethane <5.00 U 5.00 µg/L WA EPA8260B0 Bromoform <5.00 U 5.00 µg/L WA EPA8260B0 Bromomethane <10.0 U 10.0 µg/L WA EPA8260B0 Carbon tetrachloride <5.00 U 5.00 µg/L WA EPA8260B0 Chlorobenzene <5.00 U 5.00 µg/L WA EPA8260B0 Chloroethane <10.0 U 10.0 µg/L WA EPA8260B0 Chloroethene (Vinyl chloride) <10.0 U 10.0 µg/L WA EPA8260B0 2-Chloroethyl vinyl ether 10.0 R 4 10.0 µg/L WA EPA8260B0 Chloroform <5.00 U 5.00 µg/L WA EPA8260B0 Chloromethane <10.0 U 10.0 µg/L WA EPA8260B0 Dibromochloromethane <5.00 U 5.00 µg/L WA EPA8260B0 1,1-Dichloroethane <5.00 U 5.00 µg/L WA EPA8260B0 1,2-Dichloroethane <5.00 U 5.00 µg/L WA EPA8260B0 1,1-Dichloroethylene <5.00 U 5.00 µg/L WA EPA8260B0 trans-1,2-Dichloroethylene <5.00 U 5.00 µg/L WA EPA8260B0 Dichloromethane <4.49 U V 5.00 µg/L WA EPA8260B0 1,2-Dichloropropane <5.00 U 5.00 µg/L WA EPA8260B0 cis-1,3-Dichloropropene <5.00 U 5.00 µg/L WA EPA8260B0 trans-1,3-Dichloropropene <5.00 U 5.00 µg/L WA EPA8260B0 Ethylbenzene <5.00 U 5.00 µg/L WA EPA8260B0 1,1,2,2-Tetrachloroethane <5.00 U 5.00 µg/L WA EPA8260B0 Tetrachloroethylene <5.00 U 5.00 µg/L WA EPA8260B0 Toluene <5.00 U 5.00 µg/L WA EPA8260B0 1,1,1-Trichloroethane <5.00 U 5.00 µg/L WA EPA8260B0 1,1,2-Trichloroethane <5.00 U 5.00 µg/L WA EPA8260B0 Trichloroethylene <5.00 U 5.00 µg/L WA EPA8260B0 Trichlorofluoromethane <5.00 U 5.00 µg/L WA EPA8260B0 Xylenes <5.00 U 5.00 µg/L WA EPA8260B
WELL TRP267DMEASUREMENTS CONDUCTED IN THE FIELD
Sample date: 12/11/00 Time: Not availableWater temperature: Not availableAir temperature: Not availablepH: Not available Total alkalinity (as CaCO3): Not availableSp. conductance: Not available Phenolphthalein alkalinity: Not availableTurbidity: Not availableNo water was evacuated from the well prior to sampling.
ANALYSES
F Analyte Result FG S EMS SQL Unit Lab Method
0 Benzene <5.00 U 5.00 µg/L WA EPA8260B0 Bromodichloromethane <5.00 U 5.00 µg/L WA EPA8260B0 Bromoform <5.00 U 5.00 µg/L WA EPA8260B0 Bromomethane <10.0 U 10.0 µg/L WA EPA8260B0 Carbon tetrachloride <5.00 U 5.00 µg/L WA EPA8260B0 Chlorobenzene <5.00 U 5.00 µg/L WA EPA8260B0 Chloroethane <10.0 U 10.0 µg/L WA EPA8260B0 Chloroethene (Vinyl chloride) <10.0 U 10.0 µg/L WA EPA8260B0 2-Chloroethyl vinyl ether 10.0 R 4 10.0 µg/L WA EPA8260B0 Chloroform <5.00 U 5.00 µg/L WA EPA8260B0 Chloromethane <10.0 U 10.0 µg/L WA EPA8260B0 Dibromochloromethane <5.00 U 5.00 µg/L WA EPA8260B0 1,1-Dichloroethane <5.00 U 5.00 µg/L WA EPA8260B0 1,2-Dichloroethane <5.00 U 5.00 µg/L WA EPA8260B
Well TRP267D collected on 12/11/00 (cont.)
F Analyte Result FG S EMS SQL Unit Lab Method
0 1,1-Dichloroethylene <5.00 U 5.00 µg/L WA EPA8260B0 trans-1,2-Dichloroethylene <5.00 U 5.00 µg/L WA EPA8260B0 Dichloromethane <10.2 U V 5.00 µg/L WA EPA8260B0 1,2-Dichloropropane <5.00 U 5.00 µg/L WA EPA8260B0 cis-1,3-Dichloropropene <5.00 U 5.00 µg/L WA EPA8260B0 trans-1,3-Dichloropropene <5.00 U 5.00 µg/L WA EPA8260B0 Ethylbenzene <5.00 U 5.00 µg/L WA EPA8260B0 1,1,2,2-Tetrachloroethane <5.00 U 5.00 µg/L WA EPA8260B0 Tetrachloroethylene <5.00 U 5.00 µg/L WA EPA8260B0 Toluene <5.00 U 5.00 µg/L WA EPA8260B0 1,1,1-Trichloroethane <5.00 U 5.00 µg/L WA EPA8260B0 1,1,2-Trichloroethane <5.00 U 5.00 µg/L WA EPA8260B0 Trichloroethylene <5.00 U 5.00 µg/L WA EPA8260B0 Trichlorofluoromethane <5.00 U 5.00 µg/L WA EPA8260B0 Xylenes <5.00 U 5.00 µg/L WA EPA8260B
WELL TRP268DMEASUREMENTS CONDUCTED IN THE FIELD
Sample date: 12/14/00 Time: Not availableWater temperature: Not availableAir temperature: Not availablepH: Not available Total alkalinity (as CaCO3): Not availableSp. conductance: Not available Phenolphthalein alkalinity: Not availableTurbidity: Not availableNo water was evacuated from the well prior to sampling.
ANALYSES
F Analyte Result FG S EMS SQL Unit Lab Method
0 Benzene <5.00 U 5.00 µg/L WA EPA8260B0 Bromodichloromethane <5.00 U 5.00 µg/L WA EPA8260B0 Bromoform <5.00 U 5.00 µg/L WA EPA8260B0 Bromomethane <10.0 U 10.0 µg/L WA EPA8260B0 Carbon tetrachloride <5.00 U 5.00 µg/L WA EPA8260B0 Chlorobenzene <5.00 U 5.00 µg/L WA EPA8260B0 Chloroethane <10.0 U 10.0 µg/L WA EPA8260B0 Chloroethene (Vinyl chloride) <10.0 U 10.0 µg/L WA EPA8260B0 2-Chloroethyl vinyl ether 10.0 R 4 10.0 µg/L WA EPA8260B0 Chloroform <5.00 U 5.00 µg/L WA EPA8260B0 Chloromethane <10.0 U 10.0 µg/L WA EPA8260B0 Dibromochloromethane <5.00 U 5.00 µg/L WA EPA8260B0 1,1-Dichloroethane <5.00 U 5.00 µg/L WA EPA8260B0 1,2-Dichloroethane <5.00 U 5.00 µg/L WA EPA8260B0 1,1-Dichloroethylene <5.00 U 5.00 µg/L WA EPA8260B0 trans-1,2-Dichloroethylene <5.00 U 5.00 µg/L WA EPA8260B0 Dichloromethane <8.18 U V 5.00 µg/L WA EPA8260B0 1,2-Dichloropropane <5.00 U 5.00 µg/L WA EPA8260B0 cis-1,3-Dichloropropene <5.00 U 5.00 µg/L WA EPA8260B0 trans-1,3-Dichloropropene <5.00 U 5.00 µg/L WA EPA8260B0 Ethylbenzene <5.00 U 5.00 µg/L WA EPA8260B0 1,1,2,2-Tetrachloroethane <5.00 U 5.00 µg/L WA EPA8260B0 Tetrachloroethylene <5.00 U 5.00 µg/L WA EPA8260B0 Toluene <5.00 U 5.00 µg/L WA EPA8260B0 1,1,1-Trichloroethane <5.00 U 5.00 µg/L WA EPA8260B0 1,1,2-Trichloroethane <5.00 U 5.00 µg/L WA EPA8260B0 Trichloroethylene <5.00 U 5.00 µg/L WA EPA8260B0 Trichlorofluoromethane <5.00 U 5.00 µg/L WA EPA8260B0 Xylenes <5.00 U 5.00 µg/L WA EPA8260B
WELL TRP269DMEASUREMENTS CONDUCTED IN THE FIELD
Sample date: 12/19/00 Time: Not availableWater temperature: Not availableAir temperature: Not availablepH: Not available Total alkalinity (as CaCO3): Not availableSp. conductance: Not available Phenolphthalein alkalinity: Not availableTurbidity: Not availableNo water was evacuated from the well prior to sampling.

SAMPLING BLANKS RESULTSSAMPLING BLANKS RESULTS
ESH-EMS-2000408ESH-EMS-2000408 C-C-3737 Fourth Quarter 2000Fourth Quarter 2000
Well TRP269D collected on 12/19/00 (cont.)
ANALYSES
F Analyte Result FG S EMS SQL Unit Lab Method
0 Benzene <5.00 U 5.00 µg/L WA EPA8260B0 Bromodichloromethane <5.00 U 5.00 µg/L WA EPA8260B0 Bromoform <5.00 U 5.00 µg/L WA EPA8260B0 Bromomethane <10.0 U 10.0 µg/L WA EPA8260B0 Carbon tetrachloride <5.00 U 5.00 µg/L WA EPA8260B0 Chlorobenzene <5.00 U 5.00 µg/L WA EPA8260B0 Chloroethane <10.0 U 10.0 µg/L WA EPA8260B0 Chloroethene (Vinyl chloride) <10.0 U 10.0 µg/L WA EPA8260B0 2-Chloroethyl vinyl ether 10.0 R 4 10.0 µg/L WA EPA8260B0 Chloroform <5.00 U 5.00 µg/L WA EPA8260B0 Chloromethane <10.0 U 10.0 µg/L WA EPA8260B0 Dibromochloromethane <5.00 U 5.00 µg/L WA EPA8260B0 1,1-Dichloroethane <5.00 U 5.00 µg/L WA EPA8260B0 1,2-Dichloroethane <5.00 U 5.00 µg/L WA EPA8260B0 1,1-Dichloroethylene <5.00 U 5.00 µg/L WA EPA8260B0 trans-1,2-Dichloroethylene <5.00 U 5.00 µg/L WA EPA8260B2 Dichloromethane 8.91 8 5.00 µg/L WA EPA8260B0 1,2-Dichloropropane <5.00 U 5.00 µg/L WA EPA8260B0 cis-1,3-Dichloropropene <5.00 U 5.00 µg/L WA EPA8260B0 trans-1,3-Dichloropropene <5.00 U 5.00 µg/L WA EPA8260B0 Ethylbenzene <5.00 U 5.00 µg/L WA EPA8260B0 1,1,2,2-Tetrachloroethane <5.00 U 5.00 µg/L WA EPA8260B0 Tetrachloroethylene <5.00 U 5.00 µg/L WA EPA8260B0 Toluene <5.00 U 5.00 µg/L WA EPA8260B0 1,1,1-Trichloroethane <5.00 U 5.00 µg/L WA EPA8260B0 1,1,2-Trichloroethane <5.00 U 5.00 µg/L WA EPA8260B0 Trichloroethylene <5.00 U 5.00 µg/L WA EPA8260B0 Trichlorofluoromethane <5.00 U 5.00 µg/L WA EPA8260B0 Xylenes <5.00 U 5.00 µg/L WA EPA8260B
WELL TRP270DMEASUREMENTS CONDUCTED IN THE FIELD
Sample date: 12/19/00 Time: Not availableWater temperature: Not availableAir temperature: Not availablepH: Not available Total alkalinity (as CaCO3): Not availableSp. conductance: Not available Phenolphthalein alkalinity: Not availableTurbidity: Not availableNo water was evacuated from the well prior to sampling.
ANALYSES
F Analyte Result FG S EMS SQL Unit Lab Method
0 Benzene <5.00 U 5.00 µg/L WA EPA8260B0 Bromodichloromethane <5.00 U 5.00 µg/L WA EPA8260B0 Bromoform <5.00 U 5.00 µg/L WA EPA8260B0 Bromomethane <10.0 U 10.0 µg/L WA EPA8260B0 Carbon tetrachloride <5.00 U 5.00 µg/L WA EPA8260B0 Chlorobenzene <5.00 U 5.00 µg/L WA EPA8260B0 Chloroethane <10.0 U 10.0 µg/L WA EPA8260B0 Chloroethene (Vinyl chloride) <10.0 U 10.0 µg/L WA EPA8260B0 2-Chloroethyl vinyl ether 10.0 R 4 10.0 µg/L WA EPA8260B0 Chloroform <5.00 U 5.00 µg/L WA EPA8260B0 Chloromethane <10.0 U 10.0 µg/L WA EPA8260B0 Dibromochloromethane <5.00 U 5.00 µg/L WA EPA8260B0 1,1-Dichloroethane <5.00 U 5.00 µg/L WA EPA8260B0 1,2-Dichloroethane <5.00 U 5.00 µg/L WA EPA8260B0 1,1-Dichloroethylene <5.00 U 5.00 µg/L WA EPA8260B0 trans-1,2-Dichloroethylene <5.00 U 5.00 µg/L WA EPA8260B2 Dichloromethane 5.33 8 5.00 µg/L WA EPA8260B0 1,2-Dichloropropane <5.00 U 5.00 µg/L WA EPA8260B0 cis-1,3-Dichloropropene <5.00 U 5.00 µg/L WA EPA8260B0 trans-1,3-Dichloropropene <5.00 U 5.00 µg/L WA EPA8260B0 Ethylbenzene <5.00 U 5.00 µg/L WA EPA8260B0 1,1,2,2-Tetrachloroethane <5.00 U 5.00 µg/L WA EPA8260B0 Tetrachloroethylene <5.00 U 5.00 µg/L WA EPA8260B0 Toluene <5.00 U 5.00 µg/L WA EPA8260B0 1,1,1-Trichloroethane <5.00 U 5.00 µg/L WA EPA8260B0 1,1,2-Trichloroethane <5.00 U 5.00 µg/L WA EPA8260B0 Trichloroethylene <5.00 U 5.00 µg/L WA EPA8260B0 Trichlorofluoromethane <5.00 U 5.00 µg/L WA EPA8260B0 Xylenes <5.00 U 5.00 µg/L WA EPA8260B
WELL TRP271DMEASUREMENTS CONDUCTED IN THE FIELD
Sample date: 12/27/00 Time: Not availableWater temperature: Not availableAir temperature: Not availablepH: Not available Total alkalinity (as CaCO3): Not availableSp. conductance: Not available Phenolphthalein alkalinity: Not availableTurbidity: Not availableNo water was evacuated from the well prior to sampling.
ANALYSES
F Analyte Result FG S EMS SQL Unit Lab Method
0 Benzene <5.00 U 5.00 µg/L WA EPA8260B0 Bromodichloromethane <5.00 U 5.00 µg/L WA EPA8260B0 Bromoform <5.00 U 5.00 µg/L WA EPA8260B0 Bromomethane <10.0 U 10.0 µg/L WA EPA8260B0 Carbon tetrachloride <5.00 U 5.00 µg/L WA EPA8260B0 Chlorobenzene <5.00 U 5.00 µg/L WA EPA8260B0 Chloroethane <10.0 U 10.0 µg/L WA EPA8260B0 Chloroethene (Vinyl chloride) <10.0 U 10.0 µg/L WA EPA8260B0 2-Chloroethyl vinyl ether 10.0 R 4 10.0 µg/L WA EPA8260B0 Chloroform <5.00 U 5.00 µg/L WA EPA8260B0 Chloromethane <10.0 U 10.0 µg/L WA EPA8260B0 Dibromochloromethane <5.00 U 5.00 µg/L WA EPA8260B0 1,1-Dichloroethane <5.00 U 5.00 µg/L WA EPA8260B0 1,2-Dichloroethane <5.00 U 5.00 µg/L WA EPA8260B0 1,1-Dichloroethylene <5.00 U 5.00 µg/L WA EPA8260B0 trans-1,2-Dichloroethylene <5.00 U 5.00 µg/L WA EPA8260B2 Dichloromethane 5.61 8 5.00 µg/L WA EPA8260B0 1,2-Dichloropropane <5.00 U 5.00 µg/L WA EPA8260B0 cis-1,3-Dichloropropene <5.00 U 5.00 µg/L WA EPA8260B0 trans-1,3-Dichloropropene <5.00 U 5.00 µg/L WA EPA8260B0 Ethylbenzene <5.00 U 5.00 µg/L WA EPA8260B0 1,1,2,2-Tetrachloroethane <5.00 U 5.00 µg/L WA EPA8260B0 Tetrachloroethylene <5.00 U 5.00 µg/L WA EPA8260B0 Toluene <5.00 U 5.00 µg/L WA EPA8260B0 1,1,1-Trichloroethane <5.00 U 5.00 µg/L WA EPA8260B0 1,1,2-Trichloroethane <5.00 U 5.00 µg/L WA EPA8260B0 Trichloroethylene <5.00 U 5.00 µg/L WA EPA8260B0 Trichlorofluoromethane <5.00 U 5.00 µg/L WA EPA8260B0 Xylenes <5.00 U 5.00 µg/L WA EPA8260B
WELL TRP272DMEASUREMENTS CONDUCTED IN THE FIELD
Sample date: 12/27/00 Time: Not availableWater temperature: Not availableAir temperature: Not availablepH: Not available Total alkalinity (as CaCO3): Not availableSp. conductance: Not available Phenolphthalein alkalinity: Not availableTurbidity: Not availableNo water was evacuated from the well prior to sampling.
ANALYSES
F Analyte Result FG S EMS SQL Unit Lab Method
0 Benzene <5.00 U 5.00 µg/L WA EPA8260B0 Bromodichloromethane <5.00 U 5.00 µg/L WA EPA8260B0 Bromoform <5.00 U 5.00 µg/L WA EPA8260B0 Bromomethane <10.0 U 10.0 µg/L WA EPA8260B0 Carbon tetrachloride <5.00 U 5.00 µg/L WA EPA8260B0 Chlorobenzene <5.00 U 5.00 µg/L WA EPA8260B0 Chloroethane <10.0 U 10.0 µg/L WA EPA8260B0 Chloroethene (Vinyl chloride) <10.0 U 10.0 µg/L WA EPA8260B0 2-Chloroethyl vinyl ether 10.0 R 4 10.0 µg/L WA EPA8260B0 Chloroform <5.00 U 5.00 µg/L WA EPA8260B0 Chloromethane <10.0 U 10.0 µg/L WA EPA8260B0 Dibromochloromethane <5.00 U 5.00 µg/L WA EPA8260B0 1,1-Dichloroethane <5.00 U 5.00 µg/L WA EPA8260B0 1,2-Dichloroethane <5.00 U 5.00 µg/L WA EPA8260B0 1,1-Dichloroethylene <5.00 U 5.00 µg/L WA EPA8260B0 trans-1,2-Dichloroethylene <5.00 U 5.00 µg/L WA EPA8260B1 Dichloromethane 4.04 J I 8 5.00 µg/L WA EPA8260B0 1,2-Dichloropropane <5.00 U 5.00 µg/L WA EPA8260B0 cis-1,3-Dichloropropene <5.00 U 5.00 µg/L WA EPA8260B0 trans-1,3-Dichloropropene <5.00 U 5.00 µg/L WA EPA8260B
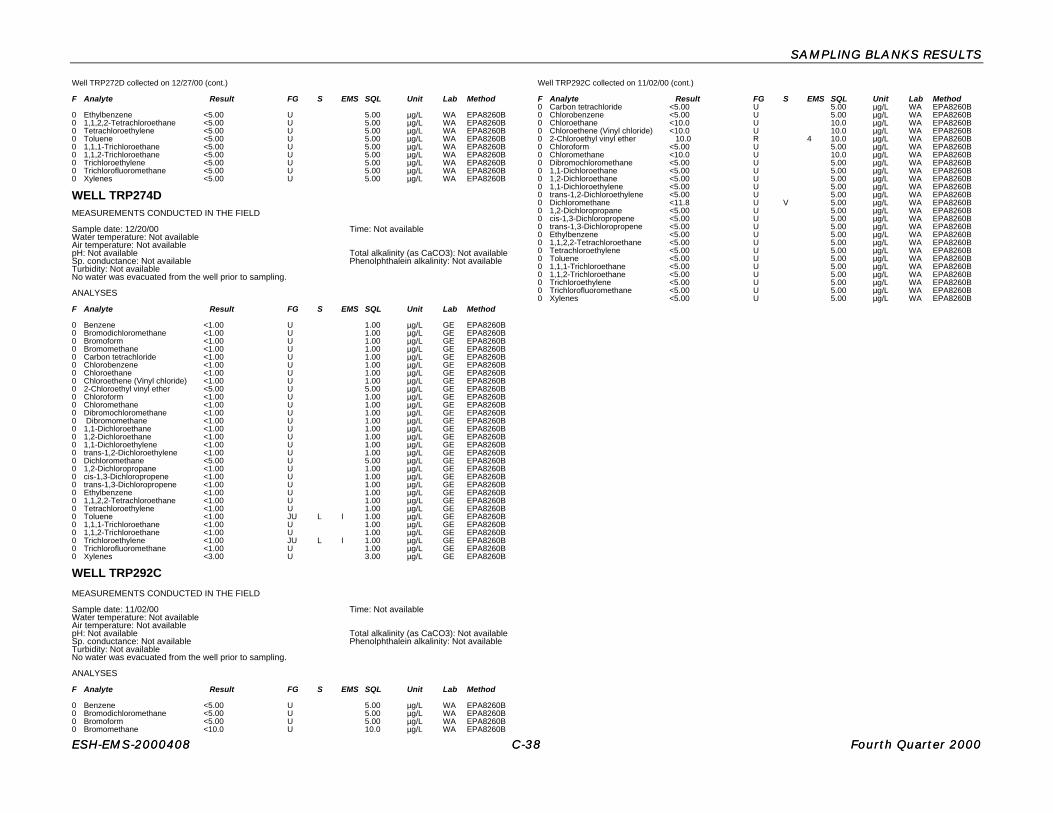
SAMPLING BLANKS RESULTSSAMPLING BLANKS RESULTS
ESH-EMS-2000408ESH-EMS-2000408 C-C-3838 Fourth Quarter 2000Fourth Quarter 2000
Well TRP272D collected on 12/27/00 (cont.)
F Analyte Result FG S EMS SQL Unit Lab Method
0 Ethylbenzene <5.00 U 5.00 µg/L WA EPA8260B0 1,1,2,2-Tetrachloroethane <5.00 U 5.00 µg/L WA EPA8260B0 Tetrachloroethylene <5.00 U 5.00 µg/L WA EPA8260B0 Toluene <5.00 U 5.00 µg/L WA EPA8260B0 1,1,1-Trichloroethane <5.00 U 5.00 µg/L WA EPA8260B0 1,1,2-Trichloroethane <5.00 U 5.00 µg/L WA EPA8260B0 Trichloroethylene <5.00 U 5.00 µg/L WA EPA8260B0 Trichlorofluoromethane <5.00 U 5.00 µg/L WA EPA8260B0 Xylenes <5.00 U 5.00 µg/L WA EPA8260B
WELL TRP274DMEASUREMENTS CONDUCTED IN THE FIELD
Sample date: 12/20/00 Time: Not availableWater temperature: Not availableAir temperature: Not availablepH: Not available Total alkalinity (as CaCO3): Not availableSp. conductance: Not available Phenolphthalein alkalinity: Not availableTurbidity: Not availableNo water was evacuated from the well prior to sampling.
ANALYSES
F Analyte Result FG S EMS SQL Unit Lab Method
0 Benzene <1.00 U 1.00 µg/L GE EPA8260B0 Bromodichloromethane <1.00 U 1.00 µg/L GE EPA8260B0 Bromoform <1.00 U 1.00 µg/L GE EPA8260B0 Bromomethane <1.00 U 1.00 µg/L GE EPA8260B0 Carbon tetrachloride <1.00 U 1.00 µg/L GE EPA8260B0 Chlorobenzene <1.00 U 1.00 µg/L GE EPA8260B0 Chloroethane <1.00 U 1.00 µg/L GE EPA8260B0 Chloroethene (Vinyl chloride) <1.00 U 1.00 µg/L GE EPA8260B0 2-Chloroethyl vinyl ether <5.00 U 5.00 µg/L GE EPA8260B0 Chloroform <1.00 U 1.00 µg/L GE EPA8260B0 Chloromethane <1.00 U 1.00 µg/L GE EPA8260B0 Dibromochloromethane <1.00 U 1.00 µg/L GE EPA8260B0 Dibromomethane <1.00 U 1.00 µg/L GE EPA8260B0 1,1-Dichloroethane <1.00 U 1.00 µg/L GE EPA8260B0 1,2-Dichloroethane <1.00 U 1.00 µg/L GE EPA8260B0 1,1-Dichloroethylene <1.00 U 1.00 µg/L GE EPA8260B0 trans-1,2-Dichloroethylene <1.00 U 1.00 µg/L GE EPA8260B0 Dichloromethane <5.00 U 5.00 µg/L GE EPA8260B0 1,2-Dichloropropane <1.00 U 1.00 µg/L GE EPA8260B0 cis-1,3-Dichloropropene <1.00 U 1.00 µg/L GE EPA8260B0 trans-1,3-Dichloropropene <1.00 U 1.00 µg/L GE EPA8260B0 Ethylbenzene <1.00 U 1.00 µg/L GE EPA8260B0 1,1,2,2-Tetrachloroethane <1.00 U 1.00 µg/L GE EPA8260B0 Tetrachloroethylene <1.00 U 1.00 µg/L GE EPA8260B0 Toluene <1.00 JU L I 1.00 µg/L GE EPA8260B0 1,1,1-Trichloroethane <1.00 U 1.00 µg/L GE EPA8260B0 1,1,2-Trichloroethane <1.00 U 1.00 µg/L GE EPA8260B0 Trichloroethylene <1.00 JU L I 1.00 µg/L GE EPA8260B0 Trichlorofluoromethane <1.00 U 1.00 µg/L GE EPA8260B0 Xylenes <3.00 U 3.00 µg/L GE EPA8260B
WELL TRP292C
MEASUREMENTS CONDUCTED IN THE FIELD
Sample date: 11/02/00 Time: Not availableWater temperature: Not availableAir temperature: Not availablepH: Not available Total alkalinity (as CaCO3): Not availableSp. conductance: Not available Phenolphthalein alkalinity: Not availableTurbidity: Not availableNo water was evacuated from the well prior to sampling.
ANALYSES
F Analyte Result FG S EMS SQL Unit Lab Method
0 Benzene <5.00 U 5.00 µg/L WA EPA8260B0 Bromodichloromethane <5.00 U 5.00 µg/L WA EPA8260B0 Bromoform <5.00 U 5.00 µg/L WA EPA8260B0 Bromomethane <10.0 U 10.0 µg/L WA EPA8260B
Well TRP292C collected on 11/02/00 (cont.)
F Analyte Result FG S EMS SQL Unit Lab Method0 Carbon tetrachloride <5.00 U 5.00 µg/L WA EPA8260B0 Chlorobenzene <5.00 U 5.00 µg/L WA EPA8260B0 Chloroethane <10.0 U 10.0 µg/L WA EPA8260B0 Chloroethene (Vinyl chloride) <10.0 U 10.0 µg/L WA EPA8260B0 2-Chloroethyl vinyl ether 10.0 R 4 10.0 µg/L WA EPA8260B0 Chloroform <5.00 U 5.00 µg/L WA EPA8260B0 Chloromethane <10.0 U 10.0 µg/L WA EPA8260B0 Dibromochloromethane <5.00 U 5.00 µg/L WA EPA8260B0 1,1-Dichloroethane <5.00 U 5.00 µg/L WA EPA8260B0 1,2-Dichloroethane <5.00 U 5.00 µg/L WA EPA8260B0 1,1-Dichloroethylene <5.00 U 5.00 µg/L WA EPA8260B0 trans-1,2-Dichloroethylene <5.00 U 5.00 µg/L WA EPA8260B0 Dichloromethane <11.8 U V 5.00 µg/L WA EPA8260B0 1,2-Dichloropropane <5.00 U 5.00 µg/L WA EPA8260B0 cis-1,3-Dichloropropene <5.00 U 5.00 µg/L WA EPA8260B0 trans-1,3-Dichloropropene <5.00 U 5.00 µg/L WA EPA8260B0 Ethylbenzene <5.00 U 5.00 µg/L WA EPA8260B0 1,1,2,2-Tetrachloroethane <5.00 U 5.00 µg/L WA EPA8260B0 Tetrachloroethylene <5.00 U 5.00 µg/L WA EPA8260B0 Toluene <5.00 U 5.00 µg/L WA EPA8260B0 1,1,1-Trichloroethane <5.00 U 5.00 µg/L WA EPA8260B0 1,1,2-Trichloroethane <5.00 U 5.00 µg/L WA EPA8260B0 Trichloroethylene <5.00 U 5.00 µg/L WA EPA8260B0 Trichlorofluoromethane <5.00 U 5.00 µg/L WA EPA8260B0 Xylenes <5.00 U 5.00 µg/L WA EPA8260B