-7.7 .,, n88- 15624 - nasa · n88- 15624-7.7_.,, / ... for the determination of the angular...
TRANSCRIPT

N88- 15624
-7.7_.,,
/
1987
NASA/ASEE SUMMER FACULTY RESEARCH FELLOWSHIP PROGRAM
MARSHALL SPACE FLIGHT CENTER
THE UNIVERSITY OF ALABAMA IN HUNTSVILLE
ANALYSIS OF RELATIVISTIC NUCLEUS-NUCLEUS INTERACTIONS
IN EMULSION CHAMBERS
Prepared By:
Academic Rank:
University and Department:
NASA/MSFC:
Laboratory:Division:
Branch:
NASA Colleague:
Date:
Contract No.:
Stephen C. McGuire
Associate Professor
Alabama A&M University
Department of Physics
Space Science
Astrophysics
High Energy
Astrophysics
Thomas A. Parnell
August 7, 1987
The University ofAlabama in Huntsville
NGT-01-008-021
XXIV
https://ntrs.nasa.gov/search.jsp?R=19880006242 2018-06-15T22:38:39+00:00Z

TABLE OF CONTENTS
I •
II.
III.
IV.
V•
VI.
VII.
ABSTRACT
ACKNOWLEDGEMENTS
LIST OF FIGURES
INTRODUCTION .................................
OBJECTIVES ...................................
ooeooooeoeooooeooooooeooooooeoooo•ooo
ooe•ooeooooooooeoeooooooooooo
oooooooooeoooooooooooooee•ooeo
••co•••••••••••eeoc••e•
•••••••••co•o••••••••••
of Emission Angles ....
Linear Momenta .......
DEVELOPMENT .........................
AND RECOMMENDATIONS ..............
•eseeeeeooeeeeeoeeoeooooeeeeeeeeeeo
••oeeeeoeeoeoooeeeeeoeoeooeoe•ooooo
EXPERIMENT DESCRIPTION
DATA REDUCTION METHODS
a. Determination
b. Calculation of
SOFTWARE
CONCLUSIONS
REFERENCES
APPENDIX A
Page No.
ii
iii
iv
1
3
4
5
5
7
9
i0
ii
16
XXIV-i

ABSTRACT
We report on the development of a computer-assisted methodfor the determination of the angular distribution data forsecondary particles produced in relativistic nucleus-nucleuscollisions in emulsions. The method is applied to emulsiondetectors that were placed in a constant, uniform magneticfield and exposed to beams of 60 and 200 GeV/nucleon160 ions at the Super Proton Synchrotron (SPS) of theEuropean Center for Nuclear Research (CERN). Linear
regression analysis is used to determine the azimuthal and
polar emission angles from measured track coordinate data.The software, written in BASIC, is designed to be machine
independent, and adaptable to an automated system for
acquiring the track coordinates. The fitting algorithm is
deterministic, and takes into account the experimental
uncertainty in the measured points. Further, a procedure
for using the track data to estimate the linear momenta of
the charged particles observed in the detectors is included.
XXlV-ii

ACKNOWLEDGEMENTS
The author expresses his appreciation to Thomas A. Parnelland James H. Derrickson for serving as technical monitorsduring his appointment as a NASA/ASEE Summer FacultyFellow. Thanks also go to Yoshiyaki Takahashi for helpfuldiscussions regarding the construction and performancecharacteristics of the emulsion detectors, to Fred Berry forassistance with the computer system, and to Taka Tabuki forproviding experimental data for testing the software.Lastly, the financial support of the NASA/ASEE SummerFaculty Fellowship Program, Gerald F. Karr, director andErnestine Cothran, co-director, is gratefully acknowledged.
XXlV-iii

LIST OF FIGURES
Figure
Figure
Figure
Figure
i •
•
•
•
Sketch of the experimental arrangement
showing the approximate dimensions of
the detector ............................
Cross sectional view of the chamber
configuration designated as 5A2 for the
EMU05 experiment ........................
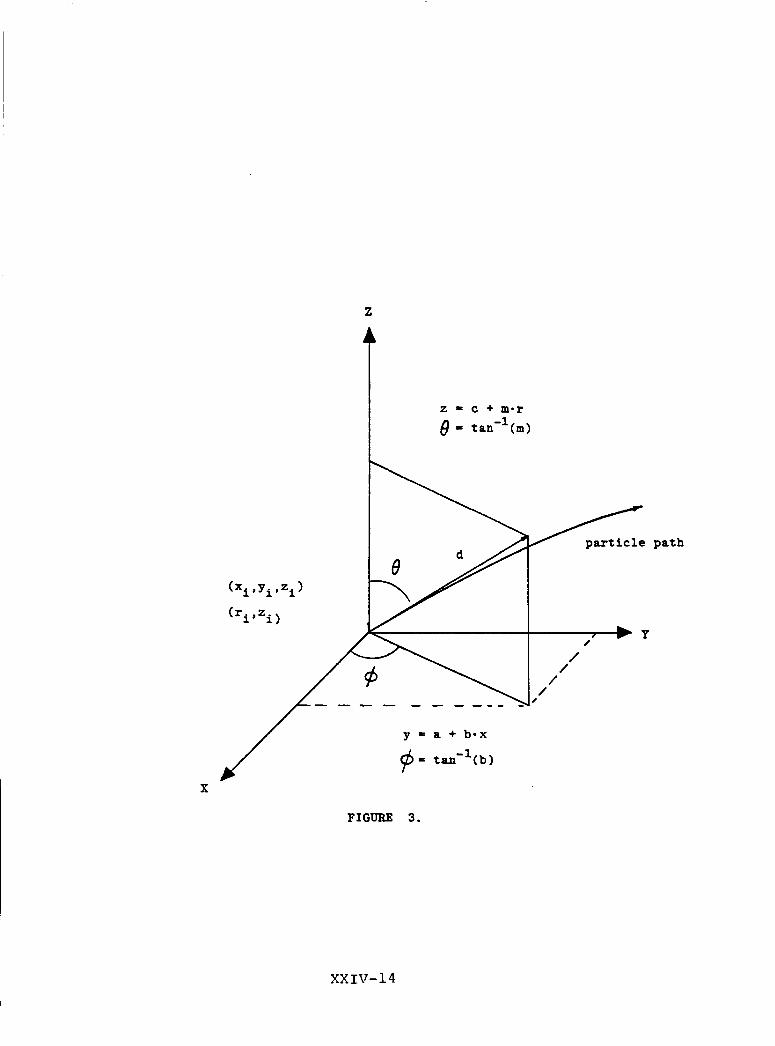
Coordinate system diagram illustratingthe use of track coordinates to obtain
emission angles .........................
Schematic diagram used to show how the
radius of curvature is related to the
measured distances, &x i ................
Page
12
13
14
15
No.
XXIV-iv

I. INTRODUCTION
In this paper we report on the development of a dataanalysis method for the rapid determination of the azimuthaland polar emission angles of particles produced in nucleus-nucleus collisions observed in emulsion chambers exposed torelativistic 160 beams. The method makes use of the trackcoordinate (x,y,z) data that is presently obtained by visualinspection of the developed emulsion plates, using scanningmicroscopes. Although our initial application focusses onstudying charged pions, the method is applicable to data for
any emitted particle. The results of this work will be
applied to the analysis of heavy ion cosmic ray interactions
that are observed in emulsion chambers flown at high
altitudes I. Events from these cosmic ray experiments are
especially valuable since they often occur at energies that
are substantially greater than those readily achievable with
present-day particle accelerators.
The angular distributions of secondary particles, generated
in the collision of two nuclei, contain information on the
dynamics of the nuclear interaction process. Events that
are characterized by large numbers of secondary particles
and large transverse momenta are likely candidates to
exhibit new fundamental phenomena. One such phenomenon is a
new state of matter, the quark-gluon plasma (QGP), that is
expected to occur in relativistic collisions that involveunusually high energy densities _. Another example rests in
the idea that, if the collisions are simple superpositions
of proton-like collisions, the produced particles are
expected to be emitted isotropically in the center-of-mass
frame. In each of these cases, it is very important to
examine and understand the angular distributions of
particles produced in high energy nuclear interactions,
specifically with respect to non-statistical structure that
may contain signatures of new physics 3,4.
Emulsion chambers are well established as a tool for
observing nuclear interactions involving energetic charged
projectiles. They have the advantages of being relatively
durable and easy to prepare. They can be used to accurately
measure the charge and energy of the primary projectile, in
addition to the emission angles associated with fragments
XXlV-i
and secondary particles produced for the highest energynuclear interactions. However, being passive detectors,they require a lengthy and somewhat involved set ofdeveloping and scanning procedures in order to obtain theraw data needed for analyzing the events they record. Evenafter the emulsion plates are developed, considerablelaboratory work is needed to obtain angular distributiondata.
XXIV-2
II. OBJECTIVES
The primary objective of this project is to analyzesecondary particle distribution data, recorded in emulsionsfrom the EMUO5experiment 5, for the existence of non-statistical structures. To accomplish this objective, itwas necessary to develop appropriate computer software thatcould be used to find the azimuthal and polar emissionangles from particle track coordinate data. The softwareincludes error analysis, and it has been tested successfullywith data for which the results are known. In particular,the angular distributions of charged pions, observed in theEMU05 experiment, are to be examined for deviations fromisotropy in the center-of-mass frame.
XXIV-3

III. EXPERIMENTDESCRIPTION
For the EMU05 experiment, pulsed beams of 160 with energiesof 60 and 200 GeV/nucleon were provided by the Super ProtonSynchrotron (SPS) at the European Center for NuclearResearch (CERN). _The pulse duration was 2s with a totalintensity of 3x10 _ ions/cm 2 pulse. The integrated exposuregiven to a chamber was 104 ions. The beam size was2.54cmx2.54cm (i sq. in.) and each chamber was exposed tobeam spills shifted laterally from each other by I cm.Proportional counter measurements at the chamber, located 30cm downstream from the beamline end, indicated the beam tobe 98% pure.
The chamber used in this work consisted of stacked emulsionplates separated by layers of lead, CR39 plastic andpolystyrene. A sketch of the experimental arrangement,showing the approximate dimensions of the chamber, isprovided in figure i. The chamber was placed inside auniform, 1.8 Tesla magnetic field. A cross sectional viewof the detector configuration for which our analysis methodwas developed, is provided in figure 2. In this case, eachemulsion plate had a 70_m base coated on both sideswith 50um of emulsion. The separation between the emulsionplates is not constant, but gradually increases in thedirection of the beam. This facilitates the measurement ofthe track curvature, the identification of the charge of theemitted particle, and places an upper limit of 10 GeV on theenergy of the secondary particles that can be analyzed.Also, lead plates are placed near the front of the detectorwhere the density of emulsion plates is greater to increasethe likelihood of collisions there. This feature alsoimproves the accuracy with which the position of thecollision vertex and the track angles can be determined.
XXIV-4

IV. DATA REDUCTIONMETHODS
IV.a. Determination of Emission Angles
The method employed to find the polar and azimuthal emissionangles consists essentially of fitting the set of positioncoordinates, (xi,Y_,Zi), for a given track, to the equationof a straight line °. The situation is illustrated in figure3. The vector d points in the initial direction of motionof the emitted particle. Since the paths are curved, it isrecognized from the outset that this approach can be used toobtain a good estimate of the initial direction of motion ofthe outgoing particle, at the point of collision.Consequently, only those points closest to the collisionvertex are used in the calculation.
First, a fit to the line y = a + bx is found using the setof points, (xi,Yi), in the x-y plane. The azimuthal angle,@, is then simply obtained from
= tan-i (b) , (i)
where b is the slope of the line. The procedure is repeatedfor the set of points, (ri,zi) , in the r-z plane where
and z = c + mr.
= _ 2 2 (2)ri (xi) + (yi) '
The angle 0 is then obtained from
-I= tan (m) . (3)
This procedure is performed for each track associated withthe event.
Values for b and m are obtained by the minimization of achi-square quantity given by
XXIV-5

2 N . - Y(xi;a,b)X (a,b) Z [Yi
2= ) , (4)
i=l _i
where _. is the experimental uncertainty in the ith point.The res61ting conditions,
_X2 = 08a
and (5)
2
__i_= 0_b
must be satisfied, and in doing so yield two equations in
two unknowns that are readily solvable for the constants
a(c) and b(m). An estimate of the probable uncertainties in
the constants can be obtained if the data are treated as
independent with each contributing its own bit of
uncertainty to the parameters. Consideration of the
propagation of errors shows that the variance, af, in thevalue of any function will be
2 N 2 8f
_f = Z si I_---)2 (6)
i=l Yi
where f = a(c), b(m).
If, however, the individual measurement errors of the points
a i, are not known, then a more accurate estimate of the
probable uncertainties in the parameters a(c) and b(m) can
be obtained via the following procedure. Set a i = 1 in
equations (4), (5), and (6), and multiply the values
of _f by the additional factor,
/ 2× /(N-2) '
2where × is computed by (4). In essence, this latter
procedure is equivalent to assuming that one obtains a good
fit.
XXIV-6

IV.b Calculations of the Linear Momenta
As suggested in the introduction, it is important toidentify those events in which a large amount of linearmomentum of the incident projectile is transferred to thetarget nucleus. This may be done by careful examination ofthe linear momenta reaction products 7.
The radius of curvature of the path of a secondary particleis related directly to its linear momentum• To show this,consider the motion of a charged particle in a magneticfield• The magnetic force on the particle is given by
F = q(vxB) , (7)
where q is the charge on the particle, v is its velocity,
and B is the magnetic field. In the present case, B is
assumed to be uniform and oriented in the positive y-
direction. Thus, the magnitude of the force can be written
as
F = qvbsin(e') , (8)
where 8' is the angle between v and B, and the direction of
F is everywhere perpendicular to the plane formed by v and
B. The curved motion is described in terms of a centripetal
acceleration so that,
qvBsin(8') = mv2/R , (9)
where m is the mass of the particle and R is its radius of
curvature. Since p = my is the linear momentum of the
particle, we have
p = qBRsinS' . (i0)
For convenience, equation (i0) may be expressed as 8
p(GeV/c) = 0 29979 q B(T) R(cm) sinS' (Ii)
where q takes on the value ±I for pions.
XXIV-7

We can derive an estimate of R from the measured trackcoordinates using the scheme illustrated in figure 4.the figure,
From
Li = R sins i (12)
where L is the distance along the symmetry axis of thedetector, in this case the z-direction, to the ith emulsionplate. Also, note that
AX i = R(I - COSS i) . (13)
The quantity Ax i is the perpendicular distance from the beamdirection. These last two equations can be combined to give
R = _xi/[l - cos(sin-l(Li/R)) I . (14)
Since we are interested in obtaining a solution to this
last, non-linear equation for R in terms of ax:, this may
best be done by approximating the cos(x) and s_n-I(x)
functions by their series forms, i.e.,
2 4 6
cos(x) = 1 x + x x +- 2--T _! 6! +Ixl < ®
3 5
x 1.3.x + . ixl < 1sin-l(x) = x + _ + 2.4.5 ""
Using only the first order terms, we obtain
R = (Li)2/2Axi .
Clearly, this approximation is best suited for measurements
involving the coordinates of the first few emulsion plates
nearest the interaction vertex, and for reaction products
with large p values.
XXIV-8
V. SOFTWAREDEVELOPMENT
A computer code that makes use of the analysis methodsdescribed in th_ previous section was written for theCommodore AMIGA_ computer. The code is written in BASIC andis designed to be machine independent. It is expected thatthe code will be executed under the BASIC interpretersupplied with the computer. For input, the program requiresfiles that contain the track coordinate (x,y,z) data thathave been obtained for each event by scanning the developedemulsion plates. At present, the program returns thecorresponding angles, 8 and @ for each track, and it alsohas a provision for estimating the linear momenta of theemitted particles, based upon the track radius of curvatureand the magnetic field. Early tests, employing idealizedtrack data, as well as actual track data from a few plates,indicate that the code is operating correctly. A currentsource listing, to be regarded as preliminary, is providedin Appendix A along with a logic diagram for the code. Adetailed description will appear elsewhere, afterfinalization of the software.
XXlV-9

VI. CONCLUSIONSAND RECOMMENDATIONS
Initial development work on the computer software fordetermining the emission angles and estimating the linearmomenta of particles emitted in nucleus-nucleus collisionsobserved in emulsions has been completed. The software hasbeen tested successfully for correct operation usingidealized track data and partial data from the EMU05 ,experiment. Further testing of the code with complete trackdata for EMU05 events is recommended to confirm the accuracyof the calculations.
Additional heavy ion experiments involving emulsion chambersof the 5A2 design are planned for the SPS accelerator. Thefirst will employ a 32S beam and is scheduled for September,1987. Another will use a 208pb beam that is anticipatedbeing available during the Fall of 1989. Also, the HighEnergy Astrophysics Branch of SSL has been involved over thepast i0 years in a collaborative research program, theJapanese American Collaborative Emulsion Experiment (JACEE),the purpose of which is to study charge particle cosmic rayinteractions in emulsion chambers flown at high altitude.To date, seven balloon flights have been conducted and dataanalysis has been completed for five of these. In view ofthe large amount of data anticipated to be available fromthese two efforts, it is recommended that an automatedsystem of coordinate data recording be incorporated with thecode development work presently underway in order to reducethe time between plate scanning and final analysis of theangular distributions. Such a system will be especiallyvaluable for analyzing events having high multiplicities.
The present method of calculating the emission angles willwork best when data are available for a few closely spacedplates near the interaction vertex of the event. It istherefore of interest to explore alternative means offitting the track data that make use of functions thatbetter represent the curved path. An initial approach wouldinclude using higher order polynomial functionapproximations to the path, and finding the tangent to thecurve at the interaction vertex.
XXIV-IO
VII. REFERENCES
•
•
•
•
5.
•
•
8.
9.
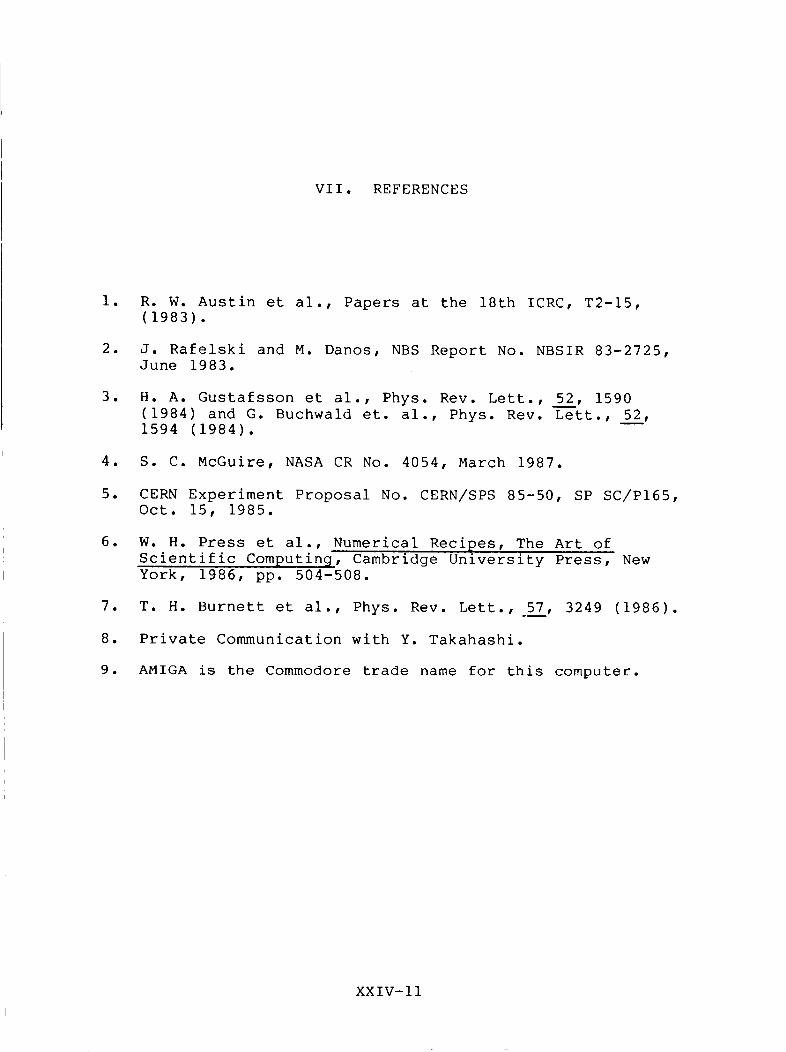
R. W. Austin et al., Papers at the 18th ICRC, T2-15,
(1983).
J. Rafelski and M. Danos, NBS Report No. NBSIR 83-2725,June 1983.
H. A. Gustafsson et al., Phys. Rev. Lett., 52, 1590
(1984) and G. Buchwald et. al., Phys. Rev. Lett., 52,
1594 (1984)•
S. C. McGuire, NASA CR No. 4054, March 1987.
CERN Experiment Proposal No. CERN/SPS 85-50, SP SC/P165,
Oct. 15, 1985.
W. H. Press et al., Numerical Recipes, The Art of
Scientific Computing, Cambridge University Press, New
York, 1986, pp. 504-508•
T. H. Burnett et al., Phys. Rev. Lett., 57, 3249 (1986)•
Private Communication with Y. Takahashi.
AMIGA is the Commodore trade name for this computer.
XXIV-II

MaqnefField
I. _ TeslaIIII
Emul_ion-6ap Chamber
Oxyqen beam
FIGURE 1.
XXIV-12

OP_GFNAE PAGE IS
OF POOR QUALITY
0
e_ID
0
e,.
0
E
I!
0
XXIV-13
= tan-l(m)
X
(xi,Yi,Z i )
(ri,zi)
y=a+b-x
FIGURE 3.
//
//
XXIV-14

0
!X
XXIV-15

APPENDIX A
Logic Diagram and Source Listing of the Track Coordinate
Analysis Program
XXIV-16

INITIALIZEVARI._LF.SI
C}£C_VALIDITYOF"
I
T
IPEITCmFITSTQA]I STRAI_T LI_E
,L
4,
ESTIMATEll-.E I"IREXCI.RVATLIRE
'I£_l_m..Al_i
[ PIA_)PTOTAL ]
PRINT IPI _1_ PTOT_L
XXIV-17

10 REM****PROGRAM TO CALCULATE THE AZIMUTHAL AND POLAR EMISSION***
20 REM ANGLES FROM THE EMU05 EXPERIMENT DATA.*****
30 ********************************************************
40 DIM A(4),X(50),Y(50),Z(50),SIG(50),R(50)
50 XMAX=80000!:YMAX=80000!:ZMAX=47680!
&O ANGFAC=(180!/3.14159):PFAC%=I
80 CONST = .299?9: BFIELD = 1.8
90 OP = 1!: QN = -i!
100 REM*****READ IN THE TRACK DATA.**************
110 REM*****IiNITS SHOULD BE MICRONS*********************
200 INPUT "FILENAME= '°,FILENAM$
210 OPEN FILENAM$ FOR INPUT AS I
212 LPRINT "DATA FILE = ", FILENAM$
215 REM ********
217 LPRI_T
_eo REM******_***
c25 INPUT #1, NRAY%
22? LPRINT " NRAY= ",NnAY%
228 REM******
_30 PPR = 0!: FFL = O!:PPRTOT=O!:PPLTOT=O!
240 FCR J% = i TO NRAY'I
245 LP_INT ......... INPUT TRACK DATA FOLLOWS .......
_46 LF'RZNT
250 NPTS% = 0
360 FOR K% = I TO 40
2?0 NPTS% = NPTS% + !
275 REM*****_*
280 INPUT #I, X(K%),Y<K_I>,Z(K%),SIG(K%>
285 R(K%) = SQR(X(K%)*X(K_I) + Y(K_)*Y(K_))
290 LPRINT USING "########.##"; X(K%),Y(K%),:(K%),R(K_),SIG(K%>
300 IF X(K%) = -I! THEN NPTS_ = NPTS_ - i: GOTO 320
305 REM END INNER LOOP
310 NEXT K%
320 REM*****PERFORM FIT TO A STRAIGHT LINE AND******
330 REM ***BASED ON THE FITTED DATA , FIND THE EMISSION ANGLES.*****
33_ LPRINT " EMISSION ANGLES FOLLOW ...........
335 GOSUB 1000
340 R,M*******************
345 GOTO 510
350 REM*****BASED ON ITS ESTIMATED RADIUS OF CURVATURE, DETERMINE
351REM THE LINEAR MOMENTUM OF THE TRACK.*********************
360 FOR IR% = I TO NPTS%
370 RI - Z(IR_)*Z(IR_)
300 RI - RI/(2!*X(IRX))
390 R = R + RI
4O0 NEXT IR%
410 FLN=NPTSX:AVR = R/FLN:AVR=AVR/IO000!
420 PMOM = CONST*QP*BFIELD*AVR
430 PF'R = PMOM*SIN(THETA)
440 PPL = PMOM*COS(THETA)
450 PPRTOT = PPRTOT + PPR
460 PPLTOT = PPLTOT + PPL
490 REM*****_****
480 LPRINT USING "#########.##"; PMOM,PPR,PPRTOT,PPL,PPLTOT
490 REM****
5O0 LPRINT
510 REM ****GET DATA FOR THE NEXT TRACK, OR
530 REM END OUTER **************************
540 NEXT J_
545 *************************
550 CLOSE #I
560 *************************
570 END
XXIV-18ORIGINAL PAGE IS
OF POOR QUALITy

ORIGINAL PAGE IS
On POOR QUALITY580 REM
1000 REM***GUBPROORAM TO PERFORM A BEST FIT TO STRAIGHT LINES;
1005 REM IN TIIE X-Y AND R-Z PLANES. THESE FITS WILL BE*********
1010 REM_* TO DETERMINE THE AZIMUTHAL AND POLAR EMISSION ANGLES******
1012 REM NOTE:** Y = B*X + A IS THE FORM OF THE STRAIGHT LINE.******
1015 REM*****N*FIRST CONSTRUCT THE SUMS OVER THE DATA POINTS
10_0 REM NCEDED FOR THE CALCULATION OF THE CONSTANTS.******
1030 SX=O:SY=O:S=O:SXX=O:SXY=O
1045 REM****USE ONLY A FRACTION OF THE AVAILABLE POINTS.*****
1050 NPTSH% = NPTS¼/PFAC%
lObO FOR J21 = 1 TO NPTSHX
1070 SIGSQR = SIG(J2X>*SIG(J2X)
1090 SXY = SXY + X(J2%)*Y(J2%)/SIGSQR
1100 SXX = SXX + X(J2%)*X(J2%)/SIGSQR
11_0 SX = SX + X(J2%)/SIGSQR
1_30 SY = SY + Y(J2%)/SIGSQR
1150 S = S + I!/S!GSQR
11b0 NEXT J21
1170 ****************************
1180 REMX_**THE NEXT STEP IS TO CALCULATE THE VALUES
1190 _EM OF THE PARAMSTERS A AND B FOR THE AZIMUTHAL ANGLE.*****
1_00 DELTA = S*SXX - SX_SX
1210 AP!_I = (SXX*SY - SX*SXY)/DELTA
1_'20 BFHI = (S*SXY - SX*SY)/DELTA
1230 _EM _*_*_FIND THE UNCERTAINTY iN THE A AND B.****
1;?_0 SIGMAA = SXX/DELTA:SIGMAA = SOR(SIGMAA>
1250 SIGMAB = S/DELTA:SIGMAS = SQR(SIGMAB)
1760 ************************************
1770 REM***_*CALCULATE A CHISQUARE VALUE FOR THE FIT.*****
1780 REM AND RE-EStIMATE THE UNCERTAI_4TIES IN A AND B.***
1790 SREG=O_
1800 FOR I% = 1 TO NPTSH%
1810 YP = BPHi*X(I%) + APHI
1820 RESI = (Y(I%) - YP)/SIG(I%)
1830 RESI = RESI*RESI
1840 SRES = SRES + RESI
1850 NEXT I_
I_0 CHISQR = SRES
1870 EFACT - CHISQR/(NPTSHX - e)
1880 EFACT = SQR(EFACT)
1890 REM*****REESTIMATE THE UNCERTAINTY IN THE FITTED CONSTANTS.*****
1900 SIGMAA = SIGMAA*EFACT
1910 SIGMAN = SIGMAB*EFACT
1912 REM*******NEXT, CALCULATE THE ANGLE PHI.***********
1915 PHI = ATN(BPHI):PHI = ANGFAC*PHI
1917 LPRINT " A SIGMAA B SIGMAB PHI"
1924 IF (X(1) < O! AND Y(1) < 0!) THEN PHI = PHI + 1SO!:GOTO 1929
1925 IF X(1) < O! THEN FHI = PHI + 180!: SOTO 1929
19e6 IF Y(1) < O! THEN PHI = PHI + 360!: GOTO 1929
1929 REM *************************
1930 LPRINT USING "######.##";APHI,SIGMAA,BPHI,SIGMAB_PHI
1940 LPRINT
2000 REM****NOW DO THE SAME FOR THE POLAR ANGLE******
2005 REM *_***X --> R AND Y --> Z.**********
2010 SR=O:SZ=O:SRR=O:SRZ=O:S=O
2005 FOR _I_ = I TO NPTSH%
200_ SIGSQR = SIG(J1_)*SIG(J11)
_010 _R = SR + R(JI_)/SIGSQR
2015 SZ = SZ + Z(J1%)/SIGSQR
20_0 S_R = SRR + R(JI%)*R(J1%)/SIGSOR
2030 SRZ = SRZ + R(J1%)*_(JIX)/SIGSQR
2035 S = S+ I!/SIGSQR
2O4O NEXT J11
2042 REM_****FIND THE FITTED CONSTANTS, A AND B FOR THE DETERMINATION OF
2043 REM THE ANGLES.*****
XXIV-19

2045
2047
2050
a052
2055
205b
eo5720o0
eOb2
2O65
_0_7
20o8
_070
2072
2075
_077
20flO
2081
20_2
e:>s3
_085
20Sb
2090
2270
2_S0
DELTA = S_SRR - SR*SR
Ar_ETA = (SRR*SZ - Sn*SRZ)/DELTA
BTHETA = (S*SRZ - SR*SZ)/DELTA
:_EM****NOW FIND THE UNCERTAINTIES IN THE FITTED CONSTANTS.********
SRES = O!
SIGMAA = SQR(SRR/DELTA): SIGMAB = SQR(S/DELTA)
FOR I% = 1 TO NPTSH%
_P = BTHETA*R(I%) + ATHETA
RESI = (Z(IX) - ZP)/SIG(IX)
RESI = RESI*RESI
_RES = SRES + RESI
NEXT I_
CHISQR = SRES
EFACT = CHISQR/(NPTSHZ - 2)
EFACT = SQR(EFACT)
SIGMAA = SIGMAA._EFACT
SIGMAB = SIGNAB*EFACT
RFM _****_NEXT_ FIND THE ANGLE *************************
THETA = ATN(I!/BTHETA):THETA = ANGFAC*THETA
IF Z(1) _. O! THEN THETA = THETA ÷ 180!
LPRINT " A SIGMAA B SIGMAB THETA"
LPRINT USING "######.##"IATHETA, SIGMAA,BTHETA,SIGMAB,THETA
LPRINT
RETURN
XXIV-20