‡* Ⱶ berndt jill coleman-wasik - minnesota department...
TRANSCRIPT

Geochemical factors influencing methylmercury production and partitioning in sulfate-impacted lake sediments
Logan Bailey†, Nathan Johnson‡*, Carl MitchellⱵ, ‖Daniel Engstrom+, Michael Berndt˧, & ‖Jill Coleman-Wasik+
†Water Resources Science Program, University of Minnesota; ‡Department of Civil Engineering, University
of Minnesota Duluth; ⱵDepartment of Physical and Environmental Sciences, University of Toronto –
Scarborough; ‖+St. Croix Watershed Research Station, Science Museum of Minnesota, ˧Minnesota Department of Natural Resources, Division of Lands and Minerals;
*Corresponding author, email: [email protected], phone: 218-726-6435, fax: 218-726-6445
Final Project Data Report
with initial interpretations
6/30/2014
Table of Contents
Summary…………………………………………………………………………………………………………………………………………………3
Background……………………………………………………………………………………………………………………………………………..4
Methods…………………………………………………………………………………………………………………………………………….……5
Site Description…………………………………………………………………………………………………………………………………5
Sampling Collection…………………………………………………………………………………………………………………..………6
Methylation and Demethylation Rate Potentials & Mercury Analyses………………………………………………8
Chemical Analysis………………………………………………………………………………………………………………………………9
Data Analysis……………………….……………………………………………………………………………………………….…………10
Results & Discussion………………………………………………………………………….………………………………………….……….11
Geochemical Context of Sites..…………………………………………………..………………………………………………..…11
Sediment Depth Profiles……………………………………………………………………………………………………..….……….15
Methylation potential and solid-phase MeHg..…………………………………………………………………..….……….17
Influence of Sulfide on MeHg Production…………………………………………………………………………..……………18
Mercury Partitioning……………………………………………………………………………………………………………………….21
Conclusions……………………………………………………………………………………………………………………………………………26
References………………………………………………………………………………………………………………………………………….…28
Appendix A: Data Tables……………………………………………………………………………………………………………………..…31
2

Summary
Sediment samples from several lakes and wetlands within the mining-impacted St. Louis River
Watershed were studied extensively as part of a larger Mine Water Research Advisory Panel (MWRAP)
study of methylmercury (MeHg) production and transport in sulfur-impacted ecosystems. Sediment
from sulfur-impacted and non sulfur-impacted lake and wetland sites was collected during four major
sampling trips between May 2012 and June 2013. Trends in MeHg and the associated sulfur
geochemistry were investigated both spatially and seasonally among the sites to understand the effect
of high sulfur loads on MeHg production and transport. The purpose of this report is to present and
share data and provide preliminary interpretations to other MWRAP groups, with the intent of initiating
a larger coordinated analysis which will produce final interpretations.
Mercury dynamics in sulfur-impacted sediments (>60 µmol/L sulfide in porewater) appeared to be
governed by different mechanisms than in sediments unimpacted by high sulfur loading (<20 µmol/L
sulfide in porewater). Net MeHg production appeared to be the dominant mechanism governing the
quantity of MeHg in both the solid and dissolved phase in low sulfur sediments. However, sulfur
impacted sediments had uniformly low net MeHg production, likely due to high sulfide concentrations
inhibiting MeHg formation. High sulfide concentrations also appeared to increase MeHg partitioning
into the aqueous phase, often leading to porewater MeHg in sulfur impacted sediments higher than
what would be expected based on the solid-phase MeHg present.
3

Background
Mercury (Hg) is a trace metal with known adverse health effects and a pollutant of concern across the
globe. Mercury pollution in soils and aquatic sediments is predominantly a result of atmospheric
deposition of anthropogenic sources (Morel 1998). The form of mercury of greatest environmental
concern is methylmercury (MeHg), as it is a highly potent neurotoxin which bioaccumulates in the food
chain (Morel 1998). Methylation of inorganic mercury in the environment is primarily a result of the
activity of sulfate-reducing bacteria (SRB) (Compeau & Bartha 1985, Gilmour et al. 1992), which are
active in anoxic sediment and the anoxic bottom waters of lakes. In addition to the activity of SRB, the
bioavailability of inorganic mercury also influences MeHg production, as bacterial uptake of inorganic
mercury is required for methylation to occur. Evidence suggests bacteria predominantly uptake
dissolved Hg(II) complexes whereas particle-bound mercury is biologically unavailable (Benoit et al.
2001; Skyllberg et al. 2003), though nanoparticulate HgS may also be available for uptake (Zhang et al.
2012). Demethylation (the transformation of MeHg back to inorganic mercury) also occurs under a
variety of conditions, as a result of biotic and abiotic processes in both aerobic and anaerobic
environments (Bridou et al. 2011). Thus, net MeHg production is expected to be most dependent on the
activity of SRB, the bioavailability of inorganic mercury, and the activity of demethylating bacteria.
MeHg concentrations in porewater are of particular concern due to the potential for transport into
surface waters, which is the primary mechanism for MeHg accumulation in biota (Mason et al. 2005).
Sulfur can influence porewater MeHg concentrations in at least three ways: (1) the presence of sulfate
promotes metabolic activity of methylating sulfate-reducing bacteria, (2) sulfide-Hg bonds may reduce
the bioavailability of inorganic mercury (Benoit et al. 2001, Hsu-Kim et al. 2013), and (3) reduced organic
or inorganic sulfur ligands can increase the partitioning of MeHg in the porewater (Dyrssen & Wedborg
1991; Jay et al. 2000; Jonsson et al. 2010).
4

5
Northern Minnesota has been home to iron mining for more than a century and a legacy of these
activities is a landscape of large open pits, tailings basins, and waste rock piles with sulfur concentrations
in excess of the regional background. Sulfate in these landscapes, which forms from the oxidation of
sulfide minerals in the waste rock, eventually makes its way into the downstream wetlands and lakes , In
the area south of the Laurentian divide, this water eventually drains to the St. Louis River. The purpose
of this study is to examine the effect of high sulfur-loading on MeHg dynamics in fresh water sediment,
and is part of a larger effort by the Minnesota Department of Natural Resources (MN DNR) to better
understand the impact of sulfur from past, present, and future mining activity on MeHg production and
transport. This report will present the data collected and provide preliminary interpretations which will
be considered and refined in light of the work performed by other project partners.
Methods
Site Description
Two lakes and three wetlands with varying sulfur loads were investigated in this study. All sites were
located in the upper reaches of the St. Louis River watershed in northeastern Minnesota, USA, an area
influenced by historic and ongoing taconite-ore mining activity. Lake Manganika (N 47.49◦, W 92.57◦) is a
hypereutrophic lake of maximum depth ~25 feet and surface area ~0.67 km2, subjected to high sulfur
and organic carbon loading from two inlets: dewatering activities from a taconite pit, and discharge
from an approximately 4.2 MGD (16,000 m3/day) local municipal wastewater plant (Berndt & Bavin
2011). Surface water sulfate concentrations range from 200-600 mg/L and an extremely high amount
of algal growth has historically been observed. Inlet and outlet MeHg concentrations reported by
Berndt & Bavin (2011) indicated that the lake was a net exporter of MeHg and hypothesized that MeHg
was being produced in and released from sediments. Lake McQuade (N 47.42◦, W 92.77◦) is a
mesotrophic lake with a maximum depth ~20 feet and surface area ~0.68 km2, with comparably lower

surface water sulfate concentrations (30-120 mg/L in 2012); however, consistent with inlet river sulfate,
observations of surface waters were approximately 300 mg/L during summer 2013. Lake McQuade also
stratified in early summer (limnetic surface between 8-10 feet), with a hypolimnion persisting through
mid-September.
The Long Lake Creek wetland (N 47.42◦, W 92.56◦) is a ~0.14 km2 sulfate-impacted boreal peatland
located downstream from mining activities with typical upstream sulfate concentrations between 200-
300 mg/L. However, fall season pumping of mine-pit water increased the inlet sulfate concentrations to
above 500 mg/L in both 2011 and 2012 between the months of September and November. The
periphery of the LLC wetland is dominated by typical fen/bog vegetation (sedges, woody shrubs, and
mosses) that grades to a cattail (Typha) margin fringing an open-water pool through which Long Lake
Creek flows. Observations of inlet and outlet stream concentrations at LLC by Berndt & Bavin (2011)
showed that significant sulfate reduction occurs in the wetland. MeHg in the wetland outlet was
elevated above MeHg in inlet waters, particularly during high flows. The West Two River wetland (N
47.465◦, W 92.77◦) is a large sedge peatland fringing the northern margins of a small pond. It is
subjected to low sulfur loading and comprised of organic-rich sediment and peat with open water
sulfate concentrations <5 mg/L. The West Swan River wetland (N 47.24◦, W 92.80◦) is a riparian wetland
with intermediate sulfate-loading comprised of a thin peat layer overlying inorganic sediment.
Sample Collection
Field samples were collected on four sampling trips, occurring in the months of May, July, and October
2012 and June 2013. Due to a persistence of winter conditions in spring 2013, the June 2013 sampling
date also reflected late spring conditions (similar to May 2012). West Swan River was replaced with
West Two River after May 2012, in an effort to include a low-sulfur wetland with similar geomorphology
and vegetation to the high-sulfur Long Lake Creek.
6
Sediment was collected from lake sites at two locations: a deeper basin location (>15 feet) and a
shallower basin location (8-10 feet). The shallower locations at lake sites corresponded with depths
very near the limnetic surface through most of the summer. The deep sampling locations were labeled
as 'Mng 1' and 'McQ 3’; the shallower sampling locations were labeled as 'Mng 2' and 'McQ 2'. At
wetland sites, sediment from a single location in the near shore open water area was targeted (2-3 feet
water depth at Long Lake Creek, 4-6 feet at West Two River). As a part of the larger project, samples
were also collected from within the peat and peat pore fluids, but due to the significantly different
geochemistry and hydrology of the peatland, results are summarized in a separate report (Johnson et al.
2013).
At each sample location, multiple cores were collected using a HTH Teknik gravity corer (70-mm
polycarbonate core tube) and composited to obtain sufficient sediment volume for both solid-phase
analysis and pore-water extraction. One set of replicate cores from each location was sub-sectioned
into 0-2, 2-4, & 4-8 cm depth intervals and composited to concurrently investigate depth trends. Two
additional samples at each location were comprised of only the top 4 cm of sediment from replicate,
composited cores.
In an effort to minimize oxidation of anoxic sediments during sample collection, handling, and
allocation, nitrogen gas was used to purge the head space in collection jars while the samples were
being extracted and composited, and jars were immediately placed in an oxygen-free environment upon
completion of core sectioning. Porewater was extracted from the sediment samples using a 5 cm rhizon
sampler (tension lysimeter with polyvinylpyrrolidine/polyethersulfone membrane, Seeberg-Elverfeld et
al. 2005) with a nominal filter size of 0.2 microns attached to an evacuated borosilicate glass serum
bottle. Samples for analysis of solid-phase constituents were homogenized, allocated, and preserved in
oxygen free conditions independently of porewater samples All solid-phase samples were immediately
7
frozen and, with the exception of AVS, freeze-dried and homogenized prior to chemical analysis. All
solid-phase measurements were adjusted to a dry-weight basis.
Methylation and Demethylation Rate Potentials and Mercury Analyses
The potential for inorganic mercury methylation and MeHg demethylation were assessed via enriched
stable isotope incubation techniques (Hintelmann et al., 2000; Mitchell and Gilmour, 2008). Potential
methylation and demethylation rate constants were measured by injecting sediment cores with a
mixture of stable isotope-enriched 200Hg2+ & Me201Hg+ (94.3% 200Hg2+ and 84.7% Me201Hg+) equilibrated
with anoxic, filtered pore water, incubating the cores at in-situ temperatures for approximately 5 hours,
freezing to finish the assays, and measuring the generation of enriched Me200Hg+ and loss of enriched
Me201Hg+ via ICP-MS detection. Soil cores were spiked through injection septa spaced at 1 cm intervals
on the core tubes using a 100 µl gastight syringe.
Prior to mercury analysis, freeze-dried and homogenized sediment samples were microwave digested in
concentrated nitric acid for THg determination. For total mercury (THg) analysis (including detection of
enriched isotopes), sample digestates were diluted with deionized water and ~0.5% by volume of BrCl
was added to oxidize all Hg in the sample to Hg(II). After allowing to react overnight, THg was
characterized following the USEPA method 1631 using a Tekran 2600 automated Hg analysis system,
with the final detection of Hg by ICP-MS. The Tekran 2600 system automates Hg reduction by addition
of SnCl2 and dual gold trap amalgamation of vapour. Rather than standard detection via fluorescence
spectroscopy, the Tekran is hyphenated to the ICP-MS and the amalgamated Hg vapour is released into
the ICP-MS for isotope detection. Samples for MeHg analysis were distilled according to the methods of
Horvat et al. (1993), but with the addition of a different enriched MeHg isotope (Me199Hg) and
quantified by isotope-dilution techniques (Hintelmann and Evans, 1997). All analyses used calculations
from Hintelmann and Ogrinc (2003) to account for the <100% enrichment of isotopes in calculating
8

enriched 200Hg and 201Hg concentration in THg and MeHg, as well as in calculating ambient THg and
MeHg levels from the dominant naturally occurring 202Hg isotope.
Final concentrations of mercury isotopes were using to calculate methylation and demethylation rates.
The ratio of kmeth/kdemeth was used as a metric for in-situ net MeHg production rate.
𝑘𝑚𝑒𝑡ℎ =[𝑀𝑒200𝐻𝑔] [𝑇200𝐻𝑔]⁄
𝑡𝑖
𝑘𝑑𝑒𝑚𝑒𝑡ℎ =([𝑇201𝐻𝑔] − [𝑀𝑒201𝐻𝑔]) [𝑇201𝐻𝑔]⁄
𝑡𝑖
𝑡𝑖 = 𝑖𝑛𝑐𝑢𝑏𝑎𝑡𝑖𝑜𝑛𝑡𝑖𝑚𝑒[ℎ𝑟𝑠]
Clean hands protocols were utilized for mercury samples throughout sample handling, preservation, and
analysis, and pore water samples were preserved by adding 0.5% HCl. Pore waters were analyzed for
MeHg by isotope-dilution ICP-MS following distillation, as explained above for sediment samples
(Hintelmann and Evans, 1997; Horvat et al., 1993). Pore waters were analyzed for THg according to
USEPA method 1631, using a Tekran 2600 automated mercury analyzer. Where reported, inorganic
mercury (iHg) concentrations were calculated by subtracting the MeHg concentration from the THg
concentration, i.e. mercury was assumed to exist as either MeHg or iHg.
Chemical Analysis
Sediment samples were analyzed for acid-volatile sulfide at the St. Croix Watershed Research Station
(SCWRS), using the SCWRS laboratory standard operating procedure adopted from standard method
4500-S2- (Eaton 2005). Weakly extractable metals were quantified in a subset (July only) of sediment
samples for Fe, Al, Mn, Zn, Ca, K, Mg, & Na. Following an acid extraction (0.5N HCl), metal
concentrations measured on a PE SCIEX ELAN 6000 ICP-Mass Spectrometer. Though redox-active sulfur
9

may change form rapidly (seasonally) in sediment-solid phases, the total quantity of metals in sediment
is not expected to vary significantly over the course of the study. Sediment total carbon (TC) and total
nitrogen (TN) was measured using a CHNS elemental analyzer. Sediment bulk density and water content
were calculated (ASTM D2216-10). Ignition tests were used to quantify sediment organic and mineral
composition (ASTM D7348).
Porewater samples for anion analysis were acidified to a pH<3 with HCl and bubbled with N2 gas to
remove dissolved sulfide, with a non-acidified duplicate sample used for chloride analysis.
Concentrations of sulfate (SO42-), nitrate (NO3
-), phosphate (PO42-), and chloride (Cl-) were measured via
ion chromatography (Method 300.1, USEPA 1997) on a Dionex ICS 1100 system. Porewater samples for
dissolved sulfide (H2S + HS-) analysis were filtered into an evacuated serum bottle preloaded with ZnAc
and NaOH preservative and quantified using automated methylene blue method (4500-S2- E.) (Eaton
2005). Porewater ferrous iron (Fe2+) concentrations were measure photometrically using the
Phenanthroline Method (3500-FeB) (Eaton 2005). Porewater ammonium was analyzed colorimetrically
(SCWRS laboratory) using the phenolate method (Lachat QuikChem method 10-107-06-1-B). Dissolved
organic carbon (DOC) and dissolved inorganic carbon (DIC) were quantified on a Teledyne-Tekmar Torch
Combustion TOC Analyzer. Carbon lability in porewater was assessed by analyzing samples for specific
ultraviolet absorption at 254nm (SUVA) and spectral slope ratio on a Varian Cary 50 scanning UV-Vis
spectrophotometer to provide an indication of aromaticity and relative molecular weight, respectively.
Additionally, in-situ porewater measurements included temperature, pH, and ORP using electrodes.
Data Analysis
For each sampling location a weighted average of measurements from three independent core samples
(each comprised of several composited cores) between 0-4 cm depth was primarily used to characterize
physical and chemical conditions in surficial sediment 12
(𝐴0−2+𝐴2−4)+𝐵0−4+𝐶0−43
. This approach applies to
10
all reported values in both solid phase and porewater samples except for those related to the direct
analysis of depth dependent trends.
Because the timescales for MeHg production, degradation, and partitioning are not known with
certainty, equilibrium conditions in the sediment cannot be assumed. Observed ratios of porewater to
solid phase concentrations cannot be properly thought of as representing equilibrium conditions if
active methylation or demethylation processes are maintaining higher or lower concentrations in
sediment pore water than would be present at equilibrium with the solid phase. In place of equilibrium
constants, therefore, an apparent partitioning coefficient (KD*) is reported for inorganic and methyl-
mercury, defined by the ratio of solid-phase concentration to filtered porewater concentration.
Inorganic mercury, in both solid and dissolved phases, is defined as the difference between the quantity
of total mercury and MeHg.
𝐾𝐷∗(𝐴) = �[𝐶]𝑠𝑜𝑙𝑖𝑑 �
𝑛𝑔𝑘𝑔�
[𝐶]𝑝𝑤 �𝑛𝑔𝐿 ��
Results & Discussion
A. Geochemical Context of Sites
The overwhelming majority of mercury mass in the sediment upon which methylation, demethylation,
and partitioning processes act exists on the solid phase as inorganic mercury. Concentrations were
between 50 and 300 ng/g at all sampling locations except Manganika’s shallow site (Mng2) which had by
far the highest mercury levels, averaging 773 ng/g (Fig 1a). Solid phase MeHg concentrations typically
comprised less than 2% of the total mercury present in the sediments (Fig 1c). Porewater total- and
methyl- mercury concentrations were typically less than 0.1% of the total mercury pool (Fig 1b & d).
11

Concentrations of porewater sulfide reflect a combination of the degree of sulfate loading and sulfate
reducing activity, and often exceeded 1200 µM in the sulfur impacted lake sediments and 200 µM in the
sulfur-impacted open water wetland sediment. Dissolved sulfide was typically below 10 µM in non-
sulfur impacted sediments (Fig 2). FeWEM:AVS ratios were greater than 2 at the non-sulfur impacted sites
and near 1.0 at sulfur-impacted sites, a pattern which reflects the long term sulfur accumulation from
historic sulfur-loading relative to the available iron pool (Fig 3) . The likely mechanism producing solid
phase sulfur compounds is precipitation reactions between aqueous sulfide and iron species. Thus,
continual loads of sulfur to sediment appear to reduce the pool of labile ferrous iron available for
precipitating sulfide out of the aqueous phase. Diminished porewater ferrous iron concentrations (< 10
μmol/L) at sulfur-impacted sites reflect this process, and are consistent with the high observed dissolved
sulfide concentrations (Fig 3).
12

Fig. 1 Mercury concentrations at each site: (a) total mercury in the solid phase, (b) total mercury in porewater, (c) MeHg in the solid phase, (d) MeHg in porewater.
0
100
200
300
400
500
600
700
800
900
Mng 1 Mng 2 McQ 2 McQ 3 LLC 1 WTR 1
THg (Solid) [ng/g]
May '12July '12October '12June '13
0
2
4
6
8
10
12
14
16
Mng 1 Mng 2 McQ 2 McQ 3 LLC 1 WTR 1
THg (PW) [ng/L]
May '12July '12October '12June '13
0.0
0.5
1.0
1.5
2.0
2.5
3.0
3.5
Mng 1 Mng 2 McQ 2 McQ 3 LLC 1 WTR 1
MeHg (Solid) [ng/g] May '12July '12October '12June '13
0
1
2
3
4
5
6
7
8
Mng 1 Mng 2 McQ 2 McQ 3 LLC 1 WTR 1
MeHg (PW) [ng/L]
May '12
July '12
October '12
June '13
(a) (b)
(c)
(d)
13

Fig. 2. (top) Average porewater sulfide concentrations (log scale) at each sampling location. Fig. 3. (bottom) Ratio of extracted Iron to AVS, overlaid with porewater iron (II) concentrations. From July 2012 data.
1
10
100
1000
Mng 1 Mng 2 McQ 2 McQ 3 LLC 1 WTR 1
log
Sulfi
de [µ
mol
/L]
Porewater Sulfide May '12July '12October '12June '13
1
10
100
0
1
2
3
4
5
6
7
Mng 1 Mng 2 McQ 2 McQ 3 LLC 1 WTR 1Fe
[µm
ol/L
]
SEM
/ A
VS
SEM/AVS Ratio SEM:AVS
Pore-water Fe(II)
14
B. Sediment Depth Profiles
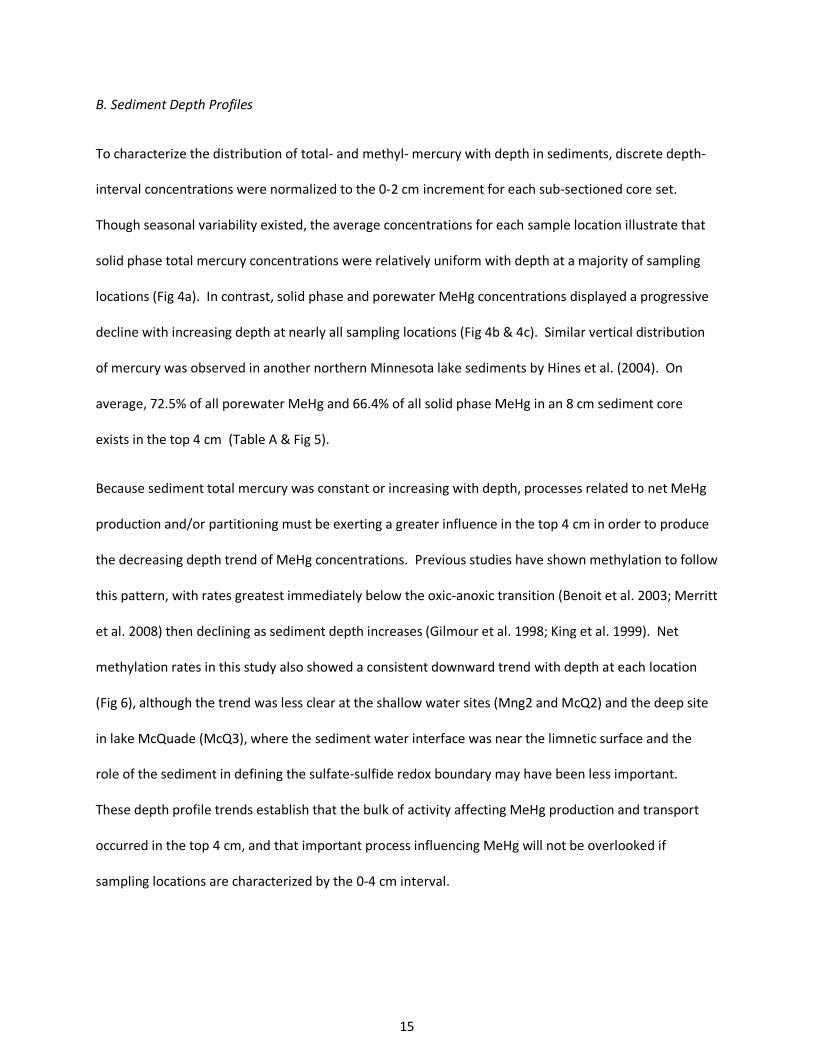
To characterize the distribution of total- and methyl- mercury with depth in sediments, discrete depth-
interval concentrations were normalized to the 0-2 cm increment for each sub-sectioned core set.
Though seasonal variability existed, the average concentrations for each sample location illustrate that
solid phase total mercury concentrations were relatively uniform with depth at a majority of sampling
locations (Fig 4a). In contrast, solid phase and porewater MeHg concentrations displayed a progressive
decline with increasing depth at nearly all sampling locations (Fig 4b & 4c). Similar vertical distribution
of mercury was observed in another northern Minnesota lake sediments by Hines et al. (2004). On
average, 72.5% of all porewater MeHg and 66.4% of all solid phase MeHg in an 8 cm sediment core
exists in the top 4 cm (Table A & Fig 5).
Because sediment total mercury was constant or increasing with depth, processes related to net MeHg
production and/or partitioning must be exerting a greater influence in the top 4 cm in order to produce
the decreasing depth trend of MeHg concentrations. Previous studies have shown methylation to follow
this pattern, with rates greatest immediately below the oxic-anoxic transition (Benoit et al. 2003; Merritt
et al. 2008) then declining as sediment depth increases (Gilmour et al. 1998; King et al. 1999). Net
methylation rates in this study also showed a consistent downward trend with depth at each location
(Fig 6), although the trend was less clear at the shallow water sites (Mng2 and McQ2) and the deep site
in lake McQuade (McQ3), where the sediment water interface was near the limnetic surface and the
role of the sediment in defining the sulfate-sulfide redox boundary may have been less important.
These depth profile trends establish that the bulk of activity affecting MeHg production and transport
occurred in the top 4 cm, and that important process influencing MeHg will not be overlooked if
sampling locations are characterized by the 0-4 cm interval.
15
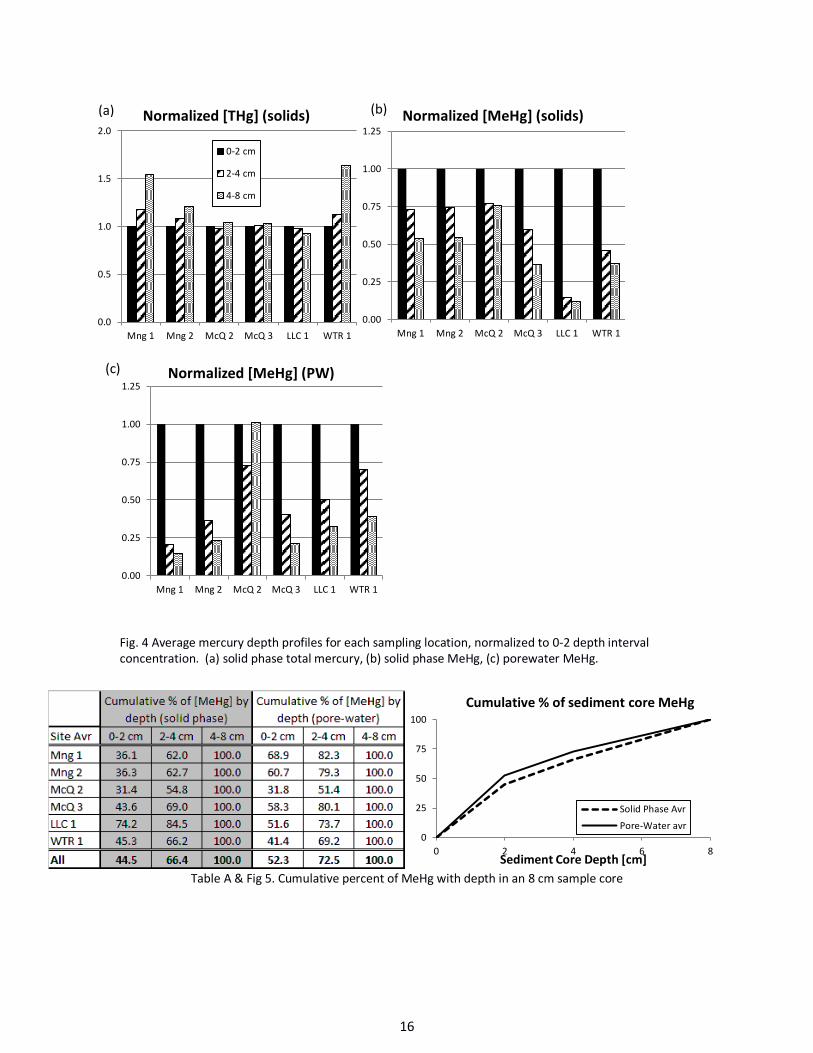
Fig. 4 Average mercury depth profiles for each sampling location, normalized to 0-2 depth interval concentration. (a) solid phase total mercury, (b) solid phase MeHg, (c) porewater MeHg.
Table A & Fig 5. Cumulative percent of MeHg with depth in an 8 cm sample core
0.0
0.5
1.0
1.5
2.0
Mng 1 Mng 2 McQ 2 McQ 3 LLC 1 WTR 1
Normalized [THg] (solids)
0-2 cm
2-4 cm
4-8 cm
0.00
0.25
0.50
0.75
1.00
1.25
Mng 1 Mng 2 McQ 2 McQ 3 LLC 1 WTR 1
Normalized [MeHg] (solids)
0.00
0.25
0.50
0.75
1.00
1.25
Mng 1 Mng 2 McQ 2 McQ 3 LLC 1 WTR 1
Normalized [MeHg] (PW)
0
25
50
75
100
0 2 4 6 8Sediment Core Depth [cm]
Cumulative % of sediment core MeHg
Solid Phase AvrPore-Water avr
(a) (b)
(c)
16

Fig. 6. Average depth profile of net methylation, normalized to 0-2 cm value.
C. Methylation potential and solid phase MeHg
Previous research has proposed that %MeHg in sediments ( [MeHg]/[THg] ) is a good estimator for long
term methylation potential (Drott 2007b). This long-term proxy of methylation potential was strongly
correlated with the instantaneous measures of net methylation potential determined experimentally
with stable isotopes. This implies that the instantaneous measures of net methylation potential
quantified during this study are consistent with historic net methylation rates as reflected in the
accumulation of solid phase MeHg (Fig 7). This trend was consistent for individual samples as well,
though the values depicted in Fig 7 represent the average (0-4 cm) of replicate cores for each site during
different seasons. The low-sulfur wetland, WTR, had consistently high net methylation potentials
relative to %MeHg in the solid phase, largely owing to low rates of demethylation. The shallow site at
McQuade had a high methylation potential and low demethylation potential in July 2012 (Fig 7), leading
to a large net methylation potential that was not reflected in solid phase %MeHg.. Sulfate consumption
was observed in the bottom waters of Lake McQuade during this time (Bailey et al. 2014). A depletion
of oxygen and nitrate near the limnetic surface may have caused active sulfate reduction in surficial
sediments and/or overlying water and contributed to higher methylation rates at this time. The only
0.00
0.25
0.50
0.75
1.00
1.25
1.50
Mng 1 Mng 2 McQ 2 McQ 3 LLC 1 WTR 1
norm
aliz
ed k
met
h/kd
emet
h
Normalized Net Methylation Potential
0-2 cm
2-4 cm
4-8 cm
17

high-sulfate sample having solid-phase %MeHg greater than 0.6 % was the Long Lake Creek site in June
2013, following the large inundation of the wetland with high sulfate water in Fall 2012 (Johnson et al.
2014).
Fig. 7. Comparison of solid phase %MeHg, which represents long-term methylation potential, with experimentally measured net methylation rates. Triangles denote wetland sediment, circles denote lake sediment. Shaded symbols correspond to sulfur-impacted sites, while open symbols correspond to sites with low sulfur loading.
D. Influence of Sulfide on MeHg Production
Figure 8 shows two distinct regions in a plot of coincident measurements of %MeHg in the solid phase
and dissolved sulfide in porewater (log scale). At lower sulfide concentrations (<25 µmol/L) there is a
positive relationship between solid-phase %MeHg (0.7 % – 2.2 %) and sulfide. At high sulfide
concentrations (>60 µmol/L) %MeHg is consistently low (<0.6 %), aside from one exception (June 2013
LLC), with neither a positive or negative trend. The only observation of greater than 1 % MeHg in
sediments of the high sulfate sites also came during June 2013 at Long Lake Creek. The highest sulfide
observed in sediment from the low sulfate sites was from Lake McQuade’s deep site during June 2013,
and this had a relatively lower % MeHg (Fig 8).
0.0
1.0
2.0
3.0
0 1 2 3 4 5 6 7 8
% M
eHg
kmeth / kdemeth
%MeHg (solids) v. Net Methylation WSRWTRLLCMcQMng
June 2013 July 2012
18
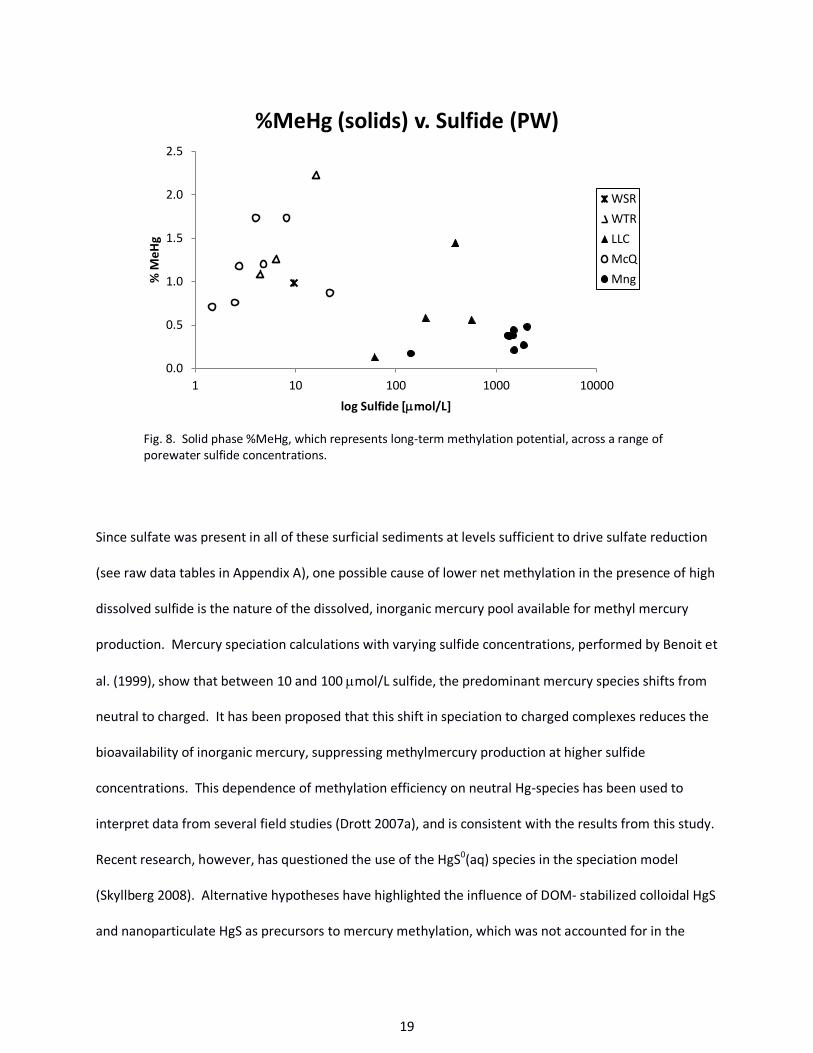
Fig. 8. Solid phase %MeHg, which represents long-term methylation potential, across a range of porewater sulfide concentrations.
Since sulfate was present in all of these surficial sediments at levels sufficient to drive sulfate reduction
(see raw data tables in Appendix A), one possible cause of lower net methylation in the presence of high
dissolved sulfide is the nature of the dissolved, inorganic mercury pool available for methyl mercury
production. Mercury speciation calculations with varying sulfide concentrations, performed by Benoit et
al. (1999), show that between 10 and 100 µmol/L sulfide, the predominant mercury species shifts from
neutral to charged. It has been proposed that this shift in speciation to charged complexes reduces the
bioavailability of inorganic mercury, suppressing methylmercury production at higher sulfide
concentrations. This dependence of methylation efficiency on neutral Hg-species has been used to
interpret data from several field studies (Drott 2007a), and is consistent with the results from this study.
Recent research, however, has questioned the use of the HgS0(aq) species in the speciation model
(Skyllberg 2008). Alternative hypotheses have highlighted the influence of DOM- stabilized colloidal HgS
and nanoparticulate HgS as precursors to mercury methylation, which was not accounted for in the
0.0
0.5
1.0
1.5
2.0
2.5
1 10 100 1000 10000
% M
eHg
log Sulfide [µmol/L]
%MeHg (solids) v. Sulfide (PW)
WSRWTRLLCMcQMng
19

Benoit (1999) model (Zhang et al 2012; Hsu-Kim et al 2013). Regardless of the specific mechanism,
observations show that among the sulfate-impacted freshwater sediments sampled in this study,
conditions changed between approximately 20 and 60 µmol/L dissolved sulfide in a manner that
appears to inhibit net methyl mercury production.
Although %MeHg in the solid phase is often considered a proxy for net methylation potential,
instantaneous in-situ measurements of %MeHg in the porewater are a result of not only the production
of MeHg in the sediment, but also transport processes and differences between inorganic Hg and MeHg
partitioning. At low sulfide concentrations (<25 µmol/L), porewater the trend of %MeHg in the pore
water resembles that of %MeHg in the solid phase, generally increasing with increased sulfide
concentrations (Fig 9). At higher sulfide concentrations (> 60 µmol/L) however, porewater %MeHg, was
not consistently low. Porewater %MeHg in excess of 55% was observed in Lake Manganika sediments in
May 2012 at a time when net methylation potentials were some of the lowest observed in the study.
Fig. 9. Porewater %MeHg values across a range of porewater sulfide concentrations.
0
20
40
60
80
1 10 100 1000 10000
% M
eHg
log Sulfide [µmol/L]
%MeHg (PW) v. Sulfide (PW)
WSRWTRLLCMcQMng
20

The variation in porewater %MeHg observed in sediments having high dissolved sulfide, combined with
the uniformly low solid phase % MeHg in sediments having high dissolved sulfide, illustrates a clear
difference in the processes influencing porewater %MeHg between low and high sulfide conditions (Fig
10). Low sulfide sites display a strong correlation (R2 = 0.91) between porewater and solid phase
%MeHg. Conversely, high sulfide sites display no correlation (R2 = 0.04) between porewater and solid
phase %MeHg. These distinct differences imply that in environments with high sulfide concentrations,
porewater %MeHg does not mirror net methylation potential (as reflected in the accumulation of MeHg
on the solid phase), but rather may be governed by partitioning and/or transport processes.
Fig. 10. Comparison of solid phase and porewater %MeHg values, with data points separated into two groups based on porewater sulfide concentration
E. Mercury Partitioning
At low sulfide concentrations, apparent MeHg partitioning coefficients display little variability (ranging
from log values of 3.2 to 3.7) (Fig 11a). At high sulfide conditions, apparent MeHg partitioning
coefficients are more variable and generally lower (average log KD*=3.11 at >60 µmol/L sulfide, average
0
20
40
60
80
0.00 0.50 1.00 1.50 2.00 2.50
% M
eHg
(PW
)
% MeHg (solid)
%MeHg (PW) v. %MeHg (solid)
Low Sulfide (<25 umol) Mud
High-Sulfide (>60 umol) Mud
21

log KD*=3.53 at <25 µmol/L sulfide), signifying an increase in the relative proportion of MeHg in the pore
waters versus the solid phase. Since net methylation potentials were substantially lower at the high
sulfide sites (Fig 7), the higher proportion of MeHg in the liquid phase is not likely to be a result of rapid
MeHg production and release to sediment pore fluids.
This trend of lower apparent partitioning coefficients across a wide range of increasing pore water
sulfide concentrations is stronger in the late spring months, but less apparent in the summer and fall (Fig
11b). A possible explanation for this behavior is more active methylation and demethylation conditions
in sediments during the mid-summer months. Warmer temperatures during summer months
correspond with increased biological activity and likely rapid rates of biologically-driven
methylation/demethylation in sediment pore fluids, potentially making porewater MeHg dependent on
these reaction rates. By contrast spring conditions, following months of relatively less biological activity
under cold temperatures, may more closely reflect equilibrium conditions between the solid and
porewater phases. Under these conditions, the presence of elevated sulfide, a strong ligand for MeHg,
could act to pull additional MeHg into the pore fluids from the pool on the solid phase. Unopposed by
active methylation/demethylation in sediment pore fluids, the release of MeHg from the sediment solid
phase could act to elevate concentrations in sediment pore fluids relative to times when biological
demethylation is more active. It has been hypothesized that kinetics may be an important factor in
understanding mercury partitioning (Hsu-Kim et al. 2013) as the kinetics of mercury-ligand binding is on
the order of days (Miller et al. 2004).
22
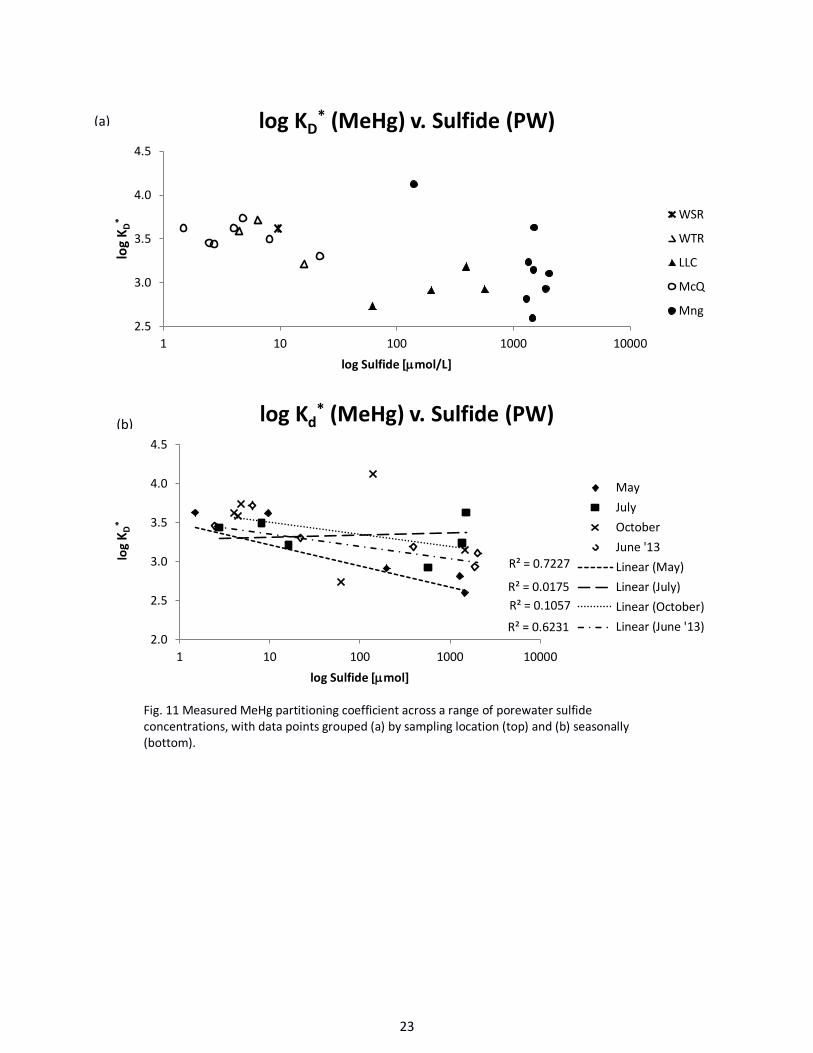
Fig. 11 Measured MeHg partitioning coefficient across a range of porewater sulfide concentrations, with data points grouped (a) by sampling location (top) and (b) seasonally (bottom).
2.5
3.0
3.5
4.0
4.5
1 10 100 1000 10000
log
K D*
log Sulfide [µmol/L]
log KD* (MeHg) v. Sulfide (PW)
WSR
WTR
LLC
McQ
Mng
R² = 0.7227
R² = 0.0175 R² = 0.1057
R² = 0.6231 2.0
2.5
3.0
3.5
4.0
4.5
1 10 100 1000 10000
log
K D*
log Sulfide [µmol]
log Kd* (MeHg) v. Sulfide (PW)
MayJulyOctoberJune '13Linear (May)Linear (July)Linear (October)Linear (June '13)
(a)
(b)
23

Fig . 12. Measured partitioning coefficient of inorganic mercury across a range of porewater sulfide concentrations.
Since a vast majority of the MeHg in sediments resides on the solid phase, porewater %MeHg depends
strongly on the partitioning of both MeHg partitioning and inorganic mercury partitioning. Though some
variability was present at sulfide concentrations above 100 μM, this study found no clear trend in
inorganic mercury partitioning across a wide range of pore water sulfide concentrations. This suggests
that the influence of sulfide on pore water % MeHg is due to changes in MeHg production (at low sulfide
concentrations) or partitioning (at high sulfide concentrations) rather than due to solid-liquid
partitioning of inorganic mercury (Fig 12). Previous studies in freshwater systems at low sulfur
conditions have often used porewater %MeHg as an estimation of net methylation (Jeremiason et al.
2006, Mitchell et al. 2008, Coleman-Wasik et al. 2012), but in environments with high porewater sulfide
concentrations this assumption may not be appropriate.
Organic carbon often plays an important role in mercury partitioning in sediments because it can bind
dissolved mercury (Berndt and Bavin 2012) and also stabilize nanocolloidal HgS crystals (Gerbig et al.,
2011, Zhang et al., 2011). While no apparent trend existed between log KD* for MeHg and DOC in this
study (Fig 13 a), the absolute concentration of MeHg generally increased with increasing DOC except in
sediments of Lake Manganika (Fig 13b). It should also be noted that the sampling locations had a
3.0
4.0
5.0
6.0
1 10 100 1000 10000
log
K D*
log Sulfide [µmol/L]
log KD* (Hgi) v. Sulfide (PW)
WSR
WTR
LLC
McQ
Mng
24

relatively narrow range of DOC relative to the observed range in sulfide (Figs 8-12). This lack of
correlation remained when log KD* was compared to SUVA and slope ratio (appendix) indicating that
SUVA and slope ratio may not adequately predict mercury-ligand strength in sites from similar
geochemical settings. Overall, pore water sulfide was the only analyte that displayed a correlation with
varying MeHg partition coefficients.
Fig. 13. (a) Measured MeHg partitioning coefficient as a function of DOC concentration (b) MeHg concentration vs. DOC concentration.
2.5
3.0
3.5
4.0
4.5
0 5 10 15 20 25 30 35
log
K D*
DOC [mg/L]
log KD* (MeHg) v. DOC (PW)
WSR
WTR
LLC
McQ
Mng
25
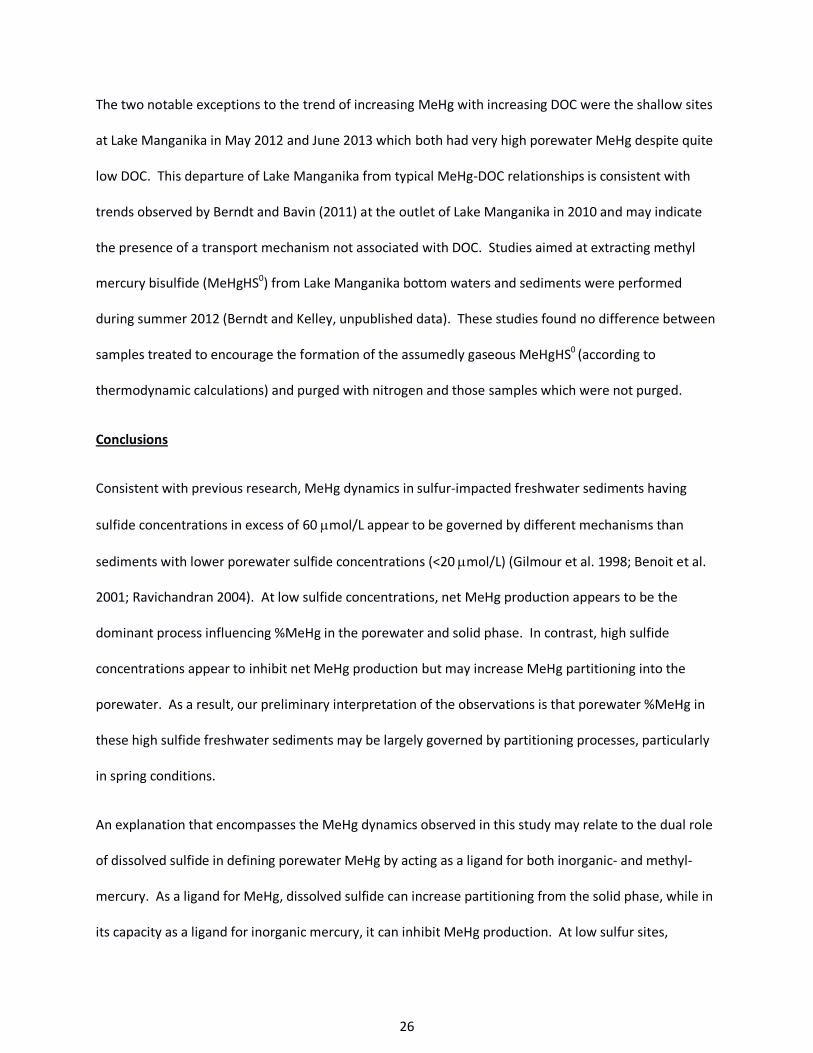
The two notable exceptions to the trend of increasing MeHg with increasing DOC were the shallow sites
at Lake Manganika in May 2012 and June 2013 which both had very high porewater MeHg despite quite
low DOC. This departure of Lake Manganika from typical MeHg-DOC relationships is consistent with
trends observed by Berndt and Bavin (2011) at the outlet of Lake Manganika in 2010 and may indicate
the presence of a transport mechanism not associated with DOC. Studies aimed at extracting methyl
mercury bisulfide (MeHgHS0) from Lake Manganika bottom waters and sediments were performed
during summer 2012 (Berndt and Kelley, unpublished data). These studies found no difference between
samples treated to encourage the formation of the assumedly gaseous MeHgHS0 (according to
thermodynamic calculations) and purged with nitrogen and those samples which were not purged.
Conclusions
Consistent with previous research, MeHg dynamics in sulfur-impacted freshwater sediments having
sulfide concentrations in excess of 60 µmol/L appear to be governed by different mechanisms than
sediments with lower porewater sulfide concentrations (<20 µmol/L) (Gilmour et al. 1998; Benoit et al.
2001; Ravichandran 2004). At low sulfide concentrations, net MeHg production appears to be the
dominant process influencing %MeHg in the porewater and solid phase. In contrast, high sulfide
concentrations appear to inhibit net MeHg production but may increase MeHg partitioning into the
porewater. As a result, our preliminary interpretation of the observations is that porewater %MeHg in
these high sulfide freshwater sediments may be largely governed by partitioning processes, particularly
in spring conditions.
An explanation that encompasses the MeHg dynamics observed in this study may relate to the dual role
of dissolved sulfide in defining porewater MeHg by acting as a ligand for both inorganic- and methyl-
mercury. As a ligand for MeHg, dissolved sulfide can increase partitioning from the solid phase, while in
its capacity as a ligand for inorganic mercury, it can inhibit MeHg production. At low sulfur sites,
26
porewater sulfide may not be present in large enough concentrations to have an important impact on
either inorganic- or methyl- mercury. Sulfide itself, therefore may have little influence over MeHg
production or partitioning but simply be indicative of active sulfate reduction. At high sulfur sites,
dissolved sulfide likely exists at concentrations sufficient (100 μmol/L) for it to act as an important ligand
for both inorganic- and methyl- mercury. Sulfide’s role as a methylation inhibitor will have the greatest
influence under active biological conditions (summer/fall) with robust methylation and demethylation
activity in pore waters, while its role as a ligand for binding MeHg may be more important under less
active biological conditions (early spring).
These findings may have implications in efforts to reduce MeHg concentrations within and export from
freshwater systems with large sulfur loads, such as those impacted by mining activity in Northeastern
Minnesota. This study suggests that high sulfur loading can influence porewater MeHg concentrations
in a number of ways, and that the influence may not be confined to biotic processes during summer
months. Thus, the potential influence of dissolved, inorganic sulfide on MeHg should also be accounted
for during seasons with low biological activity and in areas with sulfide concentrations high enough to
inhibit methylation.
27

References
ASTM D2216-10 (2010). Standard test methods for laboratory determination of water (moisture) content of soil and rock by mass. ASTM International, West Conshohocken, PA. doi: 10.1520/D2216-10.
ASTM D7348 (2008). Standard test methods for loss on ignition (LOI) of soil combustion residues. ASTM
International, West Conshohocken, PA. Bailey, L.T., Johnson, N.W., Mitchell, C.P.J., Engstrom, D.R., Berndt, M.E., Coleman-Wasik, J.K. (2014)
Seasonal and spatial variations in methylmercury in the water column of sulfate-impacted lakes. Project Report. Minnesota Department of Natural Resources, Division of Lands and Minerals, St. Paul, MN.
Benoit, J. M., Gilmour, C. C., & Mason, R. P. (2001). The influence of sulfide on solid-phase mercury bioavailability for methylation by pure cultures of Desulfobulbus propionicus (1pr3). Environmental science & technology, 35(1), 127-132.
Benoit, J. M., Gilmour, C. C., Heyes, A., Mason, R. P., & Miller, C. L. (2003, January). Geochemical and biological
controls over methylmercury production and degradation in aquatic ecosystems. In ACS symposium series (Vol. 835, pp. 262-297). Washington, DC; American Chemical Society; 1999.
Benoit, J. M., Gilmour, C. C., Mason, R. P., & Heyes, A. (1999). Sulfide controls on mercury speciation and
bioavailability to methylating bacteria in sediment pore waters. Environmental Science & Technology, 33(6), 951-957.
Berndt, M. E., & Bavin, T. K. (2012). Methylmercury and dissolved organic carbon relationships in a wetland-rich
watershed impacted by elevated sulfate from mining. Environmental Pollution, 161, 321-327. Berndt, M.E., & Bavin T.K. (2011) Sulfur and Mercury Cycling in Five Wetlands and a Lake Receiving Sulfate from
Taconite Mines in Northeastern Minnesota: A Report to Iron Ore Cooperative Research Program, Minnesota Department of Natural Resources, Division of Lands and Minerals, St. Paul, MN, pp. 77.
Bridou, R., Monperrus, M., Gonzalez, P. R., Guyoneaud, R., & Amouroux, D. (2011). Simultaneous determination of
mercury methylation and demethylation capacities of various sulfate-reducing bacteria using species-specific isotopic tracers. Environmental Toxicology and Chemistry, 30(2), 337-344.
Coleman Wasik, J. K., Mitchell, C. P., Engstrom, D. R., Swain, E. B., Monson, B. A., Balogh, S. J., Jeremiason, J. D.,
Branfireun, B. A., Eggert S. L., Kolka, R. K., & Almendinger, J. E. (2012). Methylmercury declines in a boreal peatland when experimental sulfate deposition decreases.Environmental science & technology, 46(12), 6663-6671.
Compeau, G. C., & Bartha, R. (1985). Sulfate-reducing bacteria: principal methylators of mercury in anoxic estuarine
sediment. Applied and environmental microbiology, 50(2), 498-502. Drott, A., Lambertsson, L., Björn, E., & Skyllberg, U. (2007a). Importance of dissolved neutral mercury sulfides for
methyl mercury production in contaminated sediments. Environmental science & technology, 41(7), 2270-2276.
Drott, A., Lambertsson, L., Björn, E., & Skyllberg, U. (2007b). Do potential methylation rates reflect accumulated
methyl mercury in contaminated sediments?. Environmental science & technology, 42(1), 153-158.
28
Dyrssen, D., & Wedborg, M. (1991). The sulphur-mercury (II) system in natural waters. Water Air & Soil Pollution, 56(1), 507-519.
Eaton, A. D. (Ed.). (2005). Standard methods for the examination of water and wastewater. Gerbig, C. A., Kim, C. S., Stegemeier, J. P., Ryan, J. N., & Aiken, G. R. (2011). Formation of nanocolloidal
metacinnabar in mercury-DOM-sulfide systems. Environmental science & technology, 45(21), 9180-9187. Gilmour, C. C., Henry, E. A., & Mitchell, R. (1992). Sulfate stimulation of mercury methylation in freshwater
sediments. Environmental Science & Technology, 26(11), 22 Gilmour, C. C., Riedel, G. S., Ederington, M. C., Bell, J. T., Gill, G. A., & Stordal, M. C. (1998). Methylmercury
concentrations and production rates across a trophic gradient in the northern Everglades. Biogeochemistry, 40(2-3), 327-345.
Hines, N. A., Brezonik, P. L., & Engstrom, D. R. (2004). Sediment and porewater profiles and fluxes of mercury and
methylmercury in a small seepage lake in northern Minnesota. Environmental science & technology, 38(24), 6610-6617.
Hintelmann, H., & Evans, R. D. (1997). Application of stable isotopes in environmental tracer studies–Measurement
of monomethylmercury (CH3Hg+) by isotope dilution ICP-MS and detection of species transformation. Fresenius' journal of analytical chemistry, 358(3), 378-385.
Hintelmann, H., Keppel-Jones, K., & Evans, R. D. (2000). Constants of mercury methylation and demethylation rates
in sediments and comparison of tracer and ambient mercury availability. Environmental toxicology and chemistry, 19(9), 2204-2211.
Hintelmann, H., & Ogrinc, N. (2003, January). Determination of stable mercury isotopes by ICP/MS and their
application in environmental studies. In ACS symposium series (Vol. 835, pp. 321-338). Washington, DC; American Chemical Society; 1999.
Horvat, M., Liang, L., & Bloom, N. S. (1993). Comparison of distillation with other current isolation methods for the
determination of methyl mercury compounds in low level environmental samples: Part II. Water. Analytica Chimica Acta, 282(1), 153-168.
Hsu-Kim, H., Kucharzyk, K. H., Zhang, T., & Deshusses, M. A. (2013). Mechanisms regulating mercury bioavailability
for methylating microorganisms in the aquatic environment: A critical review. Environmental science & technology, 47(6), 2441-2456.
Jay, J. A., Morel, F. M., & Hemond, H. F. (2000). Mercury speciation in the presence of polysulfides. Environmental
science & technology, 34(11), 2196-2200. Jeremiason, J. D., Engstrom, D. R., Swain, E. B., Nater, E. A., Johnson, B. M., Almendinger, J. E., Monson, B. A. &
Kolka, R. K. (2006). Sulfate addition increases methylmercury production in an experimental wetland. Environmental science & technology, 40(12), 3800-3806.
Johnson, N. W., Mitchell, C. P., Engstrom, D. R., Bailey, L. T., Kelley, M., Berndt, M. E. (2014) Methyl mercury
production and transport in a sulfate-impacted sub-boreal wetland. Preliminary Project Report. MN Department of Natural Resources, Division of Lands and Minerals
Jonsson, S., Skyllberg, U., and Bjorn, E. (2010) Substantial emission of gaseous monomethylmercury from
contaminated water-sediment microcosms. Env. Sci. and Technol. 44, 278-283.
29

King, J. K., Saunders, F. M., Lee, R. F., & Jahnke, R. A. (1999). Coupling mercury methylation rates to sulfate reduction rates in marine sediments.Environmental Toxicology and Chemistry, 18(7), 1362-1369.
Mason, R. P., Abbott, M. L., Bodaly, R. A., Bullock, O. R., Jr, J., Driscoll, C. T., ... & Swain, E. B. (2005). Monitoring the
response to changing mercury deposition. Environmental science & technology, 39(1), 14A-22A. Merritt, K. A., & Amirbahman, A. (2008). Methylmercury cycling in estuarine sediment pore waters (Penobscot
River estuary, Maine, USA). Limnology and Oceanography, 53(3), 1064. Miller, C. L., Southworth, G., Brooks, S., Liang, L., & Gu, B. (2009). Kinetic controls on the complexation between
mercury and dissolved organic matter in a contaminated environment. Environmental science & technology, 43(22), 8548-8553.
Mitchell, C. P., Branfireun, B. A., & Kolka, R. K. (2008). Assessing sulfate and carbon controls on net methylmercury
production in peatlands: An in situ mesocosm approach. Applied Geochemistry, 23(3), 503-518. Mitchell, C. P., & Gilmour, C. C. (2008). Methylmercury production in a Chesapeake Bay salt marsh. Journal of
Geophysical Research: Biogeosciences (2005–2012), 113(G2). Morel, F. M., Kraepiel, A. M., & Amyot, M. (1998). The chemical cycle and bioaccumulation of mercury. Annual
review of ecology and systematics, 543-566. Ravichandran, M. (2004). Interactions between mercury and dissolved organic matter––a
review. Chemosphere, 55(3), 319-331. Seeberg-Elverfeld, J., & Schlueter, M. (2005). U.S. Patent Application 11/262,034. Skyllberg, U. (2008). Competition among thiols and inorganic sulfides and polysulfides for Hg and MeHg in wetland
soils and sediments under suboxic conditions: Illumination of controversies and implications for MeHg net production. Journal of Geophysical Research: Biogeosciences (2005–2012),113(G2).
Skyllberg, U., Qian, J., Frech, W., Xia, K., & Bleam, W. F. (2003). Distribution of mercury, methyl mercury and
organic sulphur species in soil, soil solution and stream of a boreal forest catchment. Biogeochemistry, 64(1), 53-76.
US EPA (1997). Method 300.1, Determination of Inorganic Anions in Drinking Water by Ion Chromatography.
Office of Water, Washington, DC. US EPA (2001). Method 1630, Methyl Mercury in Water by Distillation, Aqueous Ethylation, Purge and Trap, and
Cold Vapor Atomic Fluorescence Spectrometry. Office of Water, Washington, DC. US EPA (2002). Method 1631, Revision E: Mercury in Water by Oxidation, Purge and Trap, and Cold Vapor Atomic
Fluorescence Spectrometry. Office of Water, Washington, DC. Zhang, T., Kim, B., Levard, C., Reinsch, B. C., Lowry, G. V., Deshusses, M. A., & Hsu-Kim, H. (2012). Methylation of
mercury by bacteria exposed to dissolved, nanoparticulate, and microparticulate mercuric sulfides.Environmental science & technology, 46(13), 6950-6958.
30

Appendix A: Raw Data Tables
Lake Manganika - Plot 1 Sediment Porewater (1 of 2)
Parameter Units A(0-2) A(2-4) A(4-8) B(0-4) C(0-4) A(0-2) A(2-4) A(4-8) B(0-4) C(0-4) A(0-2) A(2-4) A(4-8) B(0-4) C(0-4)
Sulfate [mg/L] 2.5 3.7 10.9 8.3 2.5 2.6 2.3 3.6 2.8 6.4 52.7 25.1 10.8 48.8 51.3
Nitrate [mg/L] 0.1 0.2 1.1 0.7 0.5 0.7 0.3 1.4 2.6
Phosphate [mg/L] 5.9 12.6 22.1 8.8 8.8 13.6 3.0 32.9 16.4 12.6 12.2 18.2 26.9 15.2 16.0
Chloride [mg/L] 116.2 692.4
Ferrous Iron [mmol/L] 0.011 0.005 0.004 0.004 0.007 0.004 0.002 0.006 0.003 0.004 0.004 0.005 0.006 0.007 0.007
Sulfide [mmol/L] 1152 1720 1648 898 1542 1631 1301 882 906 1656 1678 1661 716 829 1954
Ammonium [mg/L] 42.5 57.7
DIC [mg/L] 202.0 226.9 231.7 220.9 207.1 211.3 234.4 273.0 216.8 206.7 191.8
DOC [mg/L] 78.1 10.5 10.3 19.9 26.1 42.5 15.4 17.2 18.3 23.3 13.9
SUVA [Lm-1mg-1] 1.0 6.4 7.8 3.7 3.8 1.1 2.6 2.3 3.1
MeHg [ng/L] 2.51 0.52 0.01 2.78 1.16 0.69 0.19 0.19 0.80 0.87 2.91 0.32 0.23 0.73 0.56
THg [ng/L] 5.38 2.31 1.22 2.86 3.14 3.88 1.72 1.63 2.28 2.57 8.83 3.06 1.78 24.18 3.88
iHg [ng/L] 2.9 1.78 1.21 0.08 1.98 3.18 1.53 1.44 1.48 1.70 5.92 2.73 1.56 23.45 3.32
% MeHg [] 46.8 22.6 0.8 97.2 36.9 17.9 10.9 11.9 35.1 33.9 32.9 10.5 12.7 3.0 14.4
Analytes
Mercury Analysis
5/15/2012 7/24/2012 10/6/2012
31
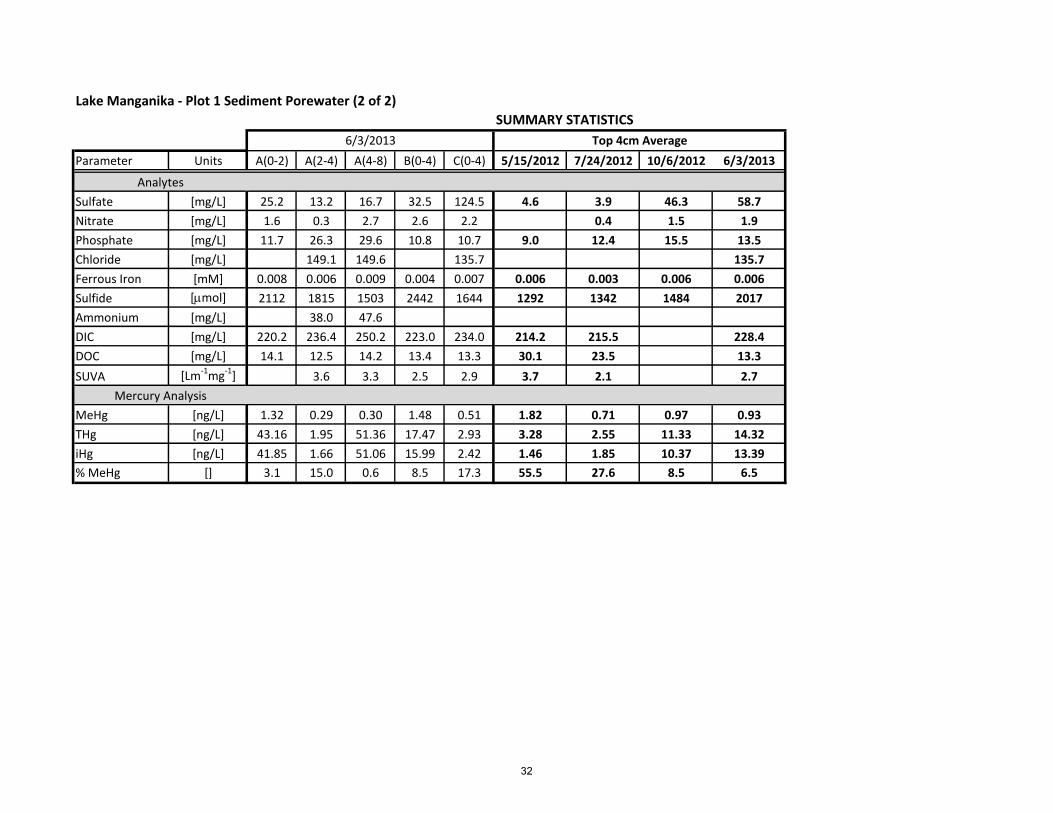
Lake Manganika - Plot 1 Sediment Porewater (2 of 2)
SUMMARY STATISTICS
Parameter Units A(0-2) A(2-4) A(4-8) B(0-4) C(0-4) 5/15/2012 7/24/2012 10/6/2012 6/3/2013
Sulfate [mg/L] 25.2 13.2 16.7 32.5 124.5 4.6 3.9 46.3 58.7
Nitrate [mg/L] 1.6 0.3 2.7 2.6 2.2 0.4 1.5 1.9
Phosphate [mg/L] 11.7 26.3 29.6 10.8 10.7 9.0 12.4 15.5 13.5
Chloride [mg/L] 149.1 149.6 135.7 135.7
Ferrous Iron [mM] 0.008 0.006 0.009 0.004 0.007 0.006 0.003 0.006 0.006
Sulfide [mmol] 2112 1815 1503 2442 1644 1292 1342 1484 2017
Ammonium [mg/L] 38.0 47.6
DIC [mg/L] 220.2 236.4 250.2 223.0 234.0 214.2 215.5 228.4
DOC [mg/L] 14.1 12.5 14.2 13.4 13.3 30.1 23.5 13.3
SUVA [Lm-1mg-1] 3.6 3.3 2.5 2.9 3.7 2.1 2.7
MeHg [ng/L] 1.32 0.29 0.30 1.48 0.51 1.82 0.71 0.97 0.93
THg [ng/L] 43.16 1.95 51.36 17.47 2.93 3.28 2.55 11.33 14.32
iHg [ng/L] 41.85 1.66 51.06 15.99 2.42 1.46 1.85 10.37 13.39
% MeHg [] 3.1 15.0 0.6 8.5 17.3 55.5 27.6 8.5 6.5
Analytes
Mercury Analysis
6/3/2013 Top 4cm Average
32

Lake Manganika - Plot 1 Solid Phase (1 of 3)
Parameter Units A(0-2) A(2-4) A(4-8) A(0-2) A(2-4) A(4-8)
AVS [mmol/g] 139.3 166.0 252.8 307.9 284.9 383.5
%C-Organic [] 23.4 22.3 21.9 24.9 21.0 21.1
%C-Calcite [] 37.0 31.6 29.9 31.7 32.8 32.2
%C-Inorganic [] 39.6 46.1 48.2 43.5 46.1 46.7
Dry density [g/cc] 0.06 0.07 0.07 0.06 0.07 0.07
dry/wet [] 0.06 0.07 0.07 0.05 0.07 0.07
A(0-2) A(2-4) A(4-8) B(0-2) B(2-4) B(4-8) C(0-2) C(2-4) C(4-8) A(0-2) A(2-4) A(4-8) B(0-2) B(2-4) B(4-8) C(0-2) C(2-4) C(4-8)
MeHg [ng/g] 1.15 1.14 1.05 1.23 0.95 0.94 1.43 1.20 0.78 1.34 0.93 0.69 1.15 1.12 0.69 1.56 1.15 0.75
THg [ng/g] 355.3 260.5 397.8 246.2 402.3 412.3 302.7 323.2 392.8 320.9 361.8 386.9 286.0 373.3 474.4 256.6 355.5 451.2
iHg [ng/g] 354.2 259.4 396.7 245.0 401.4 411.4 301.3 322.0 392.0 319.5 360.8 386.2 284.9 372.2 473.7 255.0 354.3 450.5
% MeHg [] 0.32 0.44 0.26 0.50 0.24 0.23 0.47 0.37 0.20 0.42 0.26 0.18 0.40 0.30 0.15 0.61 0.32 0.17
log KD (THg) [] 4.82 5.05 5.51 4.92 5.32 5.38
log KD (MeHg) [] 2.66 3.34 5.02 3.29 3.69 3.55
Kmeth [d-1] 0.006 0.010 0.003 0.007 0.004 0.002 0.006 0.003 0.002 0.024 0.012 0.011 0.013 0.008 0.006 0.010 0.006 0.005
Kdemeth [hr-1] 0.088 0.071 0.073 0.086 0.077 0.105 0.104 0.105 0.104 0.084 0.086 0.065 0.087 0.096 0.097 0.110 0.110 0.126
Km/Kd [] 0.07 0.14 0.04 0.08 0.05 0.02 0.05 0.02 0.02 0.28 0.14 0.17 0.15 0.08 0.07 0.09 0.06 0.04
A(0-2) A(2-4) A(4-8) A(0-2) A(2-4) A(4-8)
Fe [g/kg] 17.4 16.8 18.3
Al [g/kg] 22.9 21.8 21.1
Mn [g/kg] 1.1 0.9 0.9
Zn [g/kg] 0.2 0.1 0.1
Ca [g/kg] 105.4 93.7 93.5
K [g/kg] 9.1 5.6 4.3
Mg [g/kg] 8.2 7.1 6.5
Na [g/kg] -27.4 -32.0 -33.2 4.5 1.8
7.3 7.3
0.8 0.5
106.8 100.4
0.1 0.1
1.2 1.3
4.6 5.3
16.8 19.9
Metals Extract B(0-4) C(0-4) B(0-4) C(0-4)
0.07 0.07 0.05 0.06
Mercury Analysis
0.08 0.08 0.05 0.06
41.6 40.5 43.4 46.5
161.6 191.6 248.3 358.7
35.8 37.6 32.6 30.4
22.5 22.0 24.0 23.1
5/15/2012 7/24/2012
B(0-4) C(0-4) B(0-4) C(0-4)
33
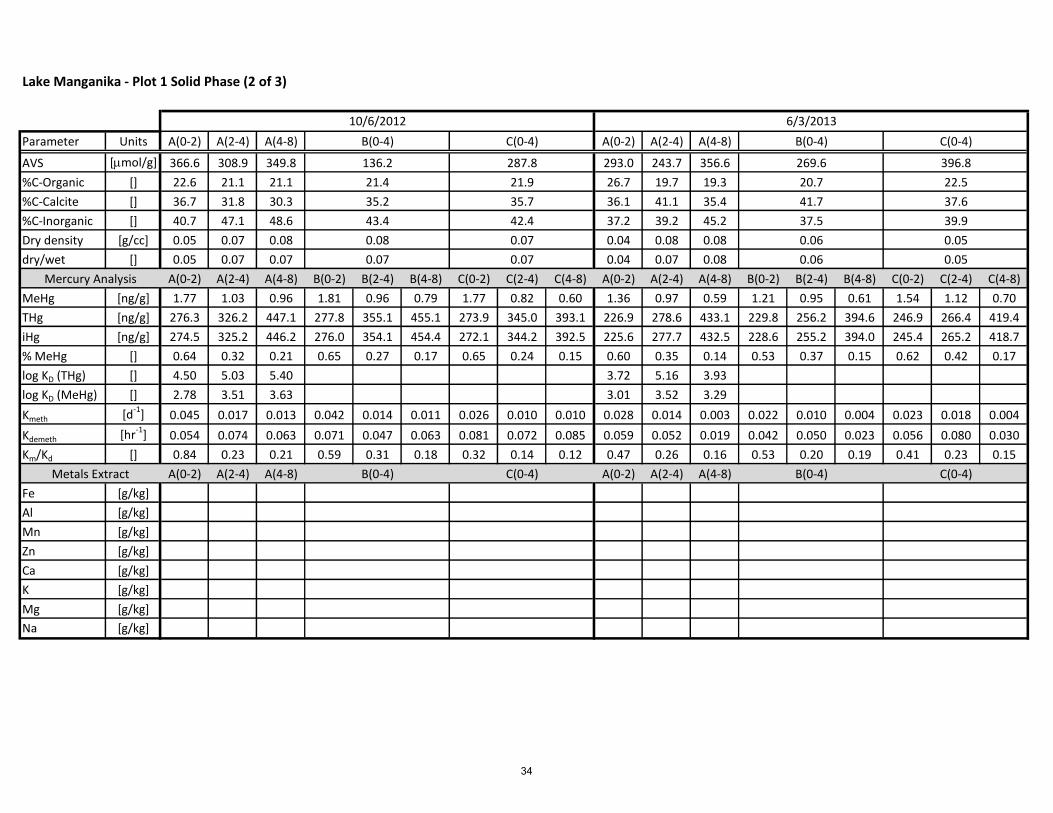
Lake Manganika - Plot 1 Solid Phase (2 of 3)
Parameter Units A(0-2) A(2-4) A(4-8) A(0-2) A(2-4) A(4-8)
AVS [mmol/g] 366.6 308.9 349.8 293.0 243.7 356.6
%C-Organic [] 22.6 21.1 21.1 26.7 19.7 19.3
%C-Calcite [] 36.7 31.8 30.3 36.1 41.1 35.4
%C-Inorganic [] 40.7 47.1 48.6 37.2 39.2 45.2
Dry density [g/cc] 0.05 0.07 0.08 0.04 0.08 0.08
dry/wet [] 0.05 0.07 0.07 0.04 0.07 0.08
A(0-2) A(2-4) A(4-8) B(0-2) B(2-4) B(4-8) C(0-2) C(2-4) C(4-8) A(0-2) A(2-4) A(4-8) B(0-2) B(2-4) B(4-8) C(0-2) C(2-4) C(4-8)
MeHg [ng/g] 1.77 1.03 0.96 1.81 0.96 0.79 1.77 0.82 0.60 1.36 0.97 0.59 1.21 0.95 0.61 1.54 1.12 0.70
THg [ng/g] 276.3 326.2 447.1 277.8 355.1 455.1 273.9 345.0 393.1 226.9 278.6 433.1 229.8 256.2 394.6 246.9 266.4 419.4
iHg [ng/g] 274.5 325.2 446.2 276.0 354.1 454.4 272.1 344.2 392.5 225.6 277.7 432.5 228.6 255.2 394.0 245.4 265.2 418.7
% MeHg [] 0.64 0.32 0.21 0.65 0.27 0.17 0.65 0.24 0.15 0.60 0.35 0.14 0.53 0.37 0.15 0.62 0.42 0.17
log KD (THg) [] 4.50 5.03 5.40 3.72 5.16 3.93
log KD (MeHg) [] 2.78 3.51 3.63 3.01 3.52 3.29
Kmeth [d-1] 0.045 0.017 0.013 0.042 0.014 0.011 0.026 0.010 0.010 0.028 0.014 0.003 0.022 0.010 0.004 0.023 0.018 0.004
Kdemeth [hr-1] 0.054 0.074 0.063 0.071 0.047 0.063 0.081 0.072 0.085 0.059 0.052 0.019 0.042 0.050 0.023 0.056 0.080 0.030
Km/Kd [] 0.84 0.23 0.21 0.59 0.31 0.18 0.32 0.14 0.12 0.47 0.26 0.16 0.53 0.20 0.19 0.41 0.23 0.15
A(0-2) A(2-4) A(4-8) A(0-2) A(2-4) A(4-8)
Fe [g/kg]
Al [g/kg]
Mn [g/kg]
Zn [g/kg]
Ca [g/kg]
K [g/kg]
Mg [g/kg]
Na [g/kg]
Mercury Analysis
Metals Extract
0.06 0.05
B(0-4) C(0-4) B(0-4)
0.07 0.07
C(0-4)
21.9
37.5 39.9
0.08 0.07 0.06 0.05
43.4 42.4
269.6 396.8136.2 287.8
20.7 22.5
35.2 35.7 41.7 37.6
21.4
C(0-4) B(0-4) C(0-4)
10/6/2012 6/3/2013
B(0-4)
34
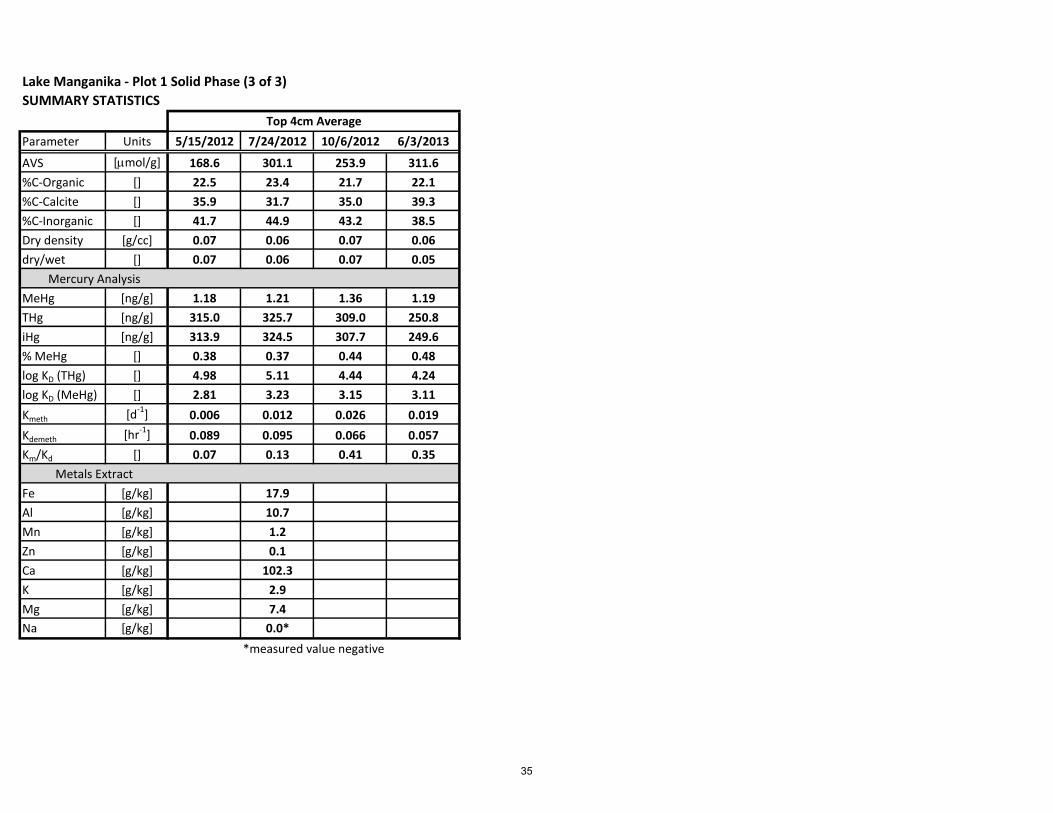
Lake Manganika - Plot 1 Solid Phase (3 of 3)
SUMMARY STATISTICS
Parameter Units 5/15/2012 7/24/2012 10/6/2012 6/3/2013
AVS [mmol/g] 168.6 301.1 253.9 311.6
%C-Organic [] 22.5 23.4 21.7 22.1
%C-Calcite [] 35.9 31.7 35.0 39.3
%C-Inorganic [] 41.7 44.9 43.2 38.5
Dry density [g/cc] 0.07 0.06 0.07 0.06
dry/wet [] 0.07 0.06 0.07 0.05
MeHg [ng/g] 1.18 1.21 1.36 1.19
THg [ng/g] 315.0 325.7 309.0 250.8
iHg [ng/g] 313.9 324.5 307.7 249.6
% MeHg [] 0.38 0.37 0.44 0.48
log KD (THg) [] 4.98 5.11 4.44 4.24
log KD (MeHg) [] 2.81 3.23 3.15 3.11
Kmeth [d-1] 0.006 0.012 0.026 0.019
Kdemeth [hr-1] 0.089 0.095 0.066 0.057
Km/Kd [] 0.07 0.13 0.41 0.35
Fe [g/kg] 17.9
Al [g/kg] 10.7
Mn [g/kg] 1.2
Zn [g/kg] 0.1
Ca [g/kg] 102.3
K [g/kg] 2.9
Mg [g/kg] 7.4
Na [g/kg] 0.0*
*measured value negative
Mercury Analysis
Metals Extract
Top 4cm Average
35

Lake Manganika - Plot 2 Sediment Porewater (1 of 2)
Parameter Units A(0-2) A(2-4) A(4-8) B(0-4) C(0-4) A(0-2) A(2-4) A(4-8) B(0-4) C(0-4) A(0-2) A(2-4) A(4-8) B(0-4) C(0-4)
Sulfate [mg/L] 68.3 80.3 200.3 92.6 51.3 42.3 10.7 14.9 31.6 34.8 168.2 83.4 50.5 208.4 167.3
Nitrate [mg/L] 0.0 0.9 0.0 0.0 0.7 0.0 0.2 0.0 0.5 0.3 0.0 0.0 0.3 0.0 0.0
Phosphate [mg/L] 0.0 2.1 0.0 0.0 0.0 3.8 5.6 6.1 6.6 8.0 4.4 6.0 7.1 4.1 3.9
Chloride [mg/L] 1043
Ferrous Iron [mmol/L] 0.009 0.011 0.007 0.007 0.007 0.013 0.005 0.004 0.002 0.001 0.003 0.002 0.009 0.003 0.004
Sulfide [mmol/L] 1405 1563 1453 1340 1555 2292 981 1519 1379 1504 35 524 288 109 32
Ammonium [mg/L] 6.6 3.7
DIC [mg/L] 140.5 150.3 109.0 155.2 154.2 171.8 190.5 169.0 174.6 171.8 184.1 191.4 157.7 169.4
DOC [mg/L] 10.9 6.6 5.9 6.9 9.0 11.2 9.2 10.0 10.0 10.7 11.4 11.1 9.8 5.6
SUVA [Lm-1mg-1] 6.6 10.1 9.9 9.5 7.7 4.0 3.9 3.4 3.2 4.4 4.9 4.5 8.4
MeHg [ng/L] 9.42 5.69 0.42 8.21 7.61 0.38 0.08 0.18 0.27 0.63 0.15 0.09 0.06 0.08 0.11
THg [ng/L] 14.61 9.96 2.39 10.86 11.75 4.17 2.06 2.37 2.87 3.06 3.58 4.88 1.53 9.09 2.09
iHg [ng/L] 5.2 4.27 1.96 2.65 4.15 3.79 1.98 2.19 2.60 2.43 3.43 4.80 1.47 9.02 1.97
% MeHg [] 64.5 57.2 17.6 75.6 64.7 9.1 3.9 7.7 9.5 20.7 4.2 1.8 3.9 0.8 5.4
Mercury Analysis
5/15/2012 7/24/2012 10/6/2012
Analytes
36

Lake Manganika - Plot 2 Sediment Porewater (2 of 2)
SUMMARY STATISTICS
Parameter Units A(0-2) A(2-4) A(4-8) B(0-4) C(0-4) 5/15/2012 7/24/2012 10/6/2012 6/3/2013
Sulfate [mg/L] 69.1 77.1 24.5 38.2 72.7 31.0 167.2 45.3
Nitrate [mg/L] 1.1 0.2 0.4 2.3 0.4 0.3 0.0 1.1
Phosphate [mg/L] 6.4 6.7 6.9 5.9 0.4 6.5 4.4 6.5
Chloride [mg/L] 84.6 81.4 82.7 84.8 83.8
Ferrous Iron [mM] 0.005 0.002 0.003 0.004 0.003 0.008 0.004 0.003 0.004
Sulfide [mmol] 2321 939 1154 2121 1902 1460 1507 140 1884
Ammonium [mg/L] 11.2
DIC [mg/L] 139.8 147.0 158.7 163.2 157.3 151.6 175.8 163.5 154.6
DOC [mg/L] 9.9 6.4 7.4 9.4 9.4 8.2 10.3 7.7 9.0
SUVA [Lm-1mg-1] 3.6 5.2 5.4 4.5 3.5 8.5 3.3 6.4 4.0
MeHg [ng/L] 6.59 0.27 2.09 1.10 7.79 0.38 0.10 2.21
THg [ng/L] 10.18 35.21 43.65 6.40 4.42 11.63 3.02 5.14 11.17
iHg [ng/L] 3.59 34.95 4.30 3.32 3.84 2.64 5.04 8.96
% MeHg [] 64.8 0.8 32.7 24.9 67.0 12.6 2.0 19.8
Mercury Analysis
6/3/2013 Top 4cm Average
Analytes
37

Lake Manganika - Plot 2 Solid Phase (1 of 3)
Parameter Units A(0-2) A(2-4) A(4-8) A(0-2) A(2-4) A(4-8)
AVS [mmol/g] 182.2 160.8 159.6 488.7 441.2 515.8
%C-Organic [] 19.9 20.0 19.2 24.9 21.0 21.1
%C-Calcite [] 31.8 30.7 27.3 31.7 32.8 32.2
%C-Inorganic [] 48.3 49.3 53.5 43.5 46.1 46.7
Dry density [g/cc] 0.10 0.11 0.14 0.06 0.07 0.07
dry/wet [] 0.09 0.11 0.13 0.05 0.07 0.07
A(0-2) A(2-4) A(4-8) B(0-2) B(2-4) B(4-8) C(0-2) C(2-4) C(4-8) A(0-2) A(2-4) A(4-8) B(0-2) B(2-4) B(4-8) C(0-2) C(2-4) C(4-8)
MeHg [ng/g] 3.55 3.13 1.10 3.69 2.30 1.17 3.00 2.75 1.02 1.75 1.22 1.30 1.78 1.67 1.14 1.89 1.40 1.08
THg [ng/g] 824.9 831.0 964.1 772.2 840.9 971.9 802.3 823.4 1022.1 706.2 805.9 842.9 772.0 830.6 859.5 764.5 809.5 877.0
iHg [ng/g] 821.4 827.9 963.0 768.5 838.6 970.7 799.3 820.7 1021.1 704.4 804.7 841.6 770.3 828.9 858.4 762.6 808.1 875.9
% MeHg [] 0.43 0.38 0.11 0.48 0.27 0.12 0.37 0.33 0.10 0.25 0.15 0.15 0.23 0.20 0.13 0.25 0.17 0.12
log KD (THg) [] 4.75 4.92 5.61 5.23 5.59 5.55
log KD (MeHg) [] 2.58 2.74 3.42 3.67 4.18 3.85
Kmeth [d-1] 0.017 0.014 0.010 0.016 0.011 0.009 0.015 0.014 0.010 0.037 0.012 0.021 0.026 0.013 0.007 0.025 0.007 0.013
Kdemeth [hr-1] 0.103 0.072 0.124 0.100 0.118 0.120 0.118 0.101 0.067 0.006 0.038 0.056 0.022 0.060 0.123 0.067
Km/Kd [] 0.16 0.19 0.08 0.16 0.09 0.08 0.13 0.14 0.15 6.01 0.54 0.47 0.32 0.42 0.05 0.19
A(0-2) A(2-4) A(4-8) A(0-2) A(2-4) A(4-8)
Fe [g/kg] 22.0 22.4 26.9
Al [g/kg] 56.9 56.9 14.5
Mn [g/kg] 3.1 3.1 3.6
Zn [g/kg] 0.4 0.4 0.7
Ca [g/kg] 164.2 166.7 158.3
K [g/kg] 12.7 11.7 2.1
Mg [g/kg] 19.4 19.6 19.0
Na [g/kg] -69.3 -72.3 41.0 -71.4 -67.8
19.4 19.6
12.0 11.7
159.4 155.7
0.4 0.4
3.2 3.1
58.1 58.5
23.0 22.7
Mercury Analysis
Metals Extract B(0-4) C(0-4) B(0-4) C(0-4)
0.11 0.10 0.047 0.057
0.11 0.11 0.048 0.059
51.3 49.0 43.4 46.5
28.8 31.0 32.6 30.4
242.8 227.6 627.7 470.8
19.9 20.0 24.0 23.1
5/15/2012 7/24/2012
B(0-4) C(0-4) B(0-4) C(0-4)
38
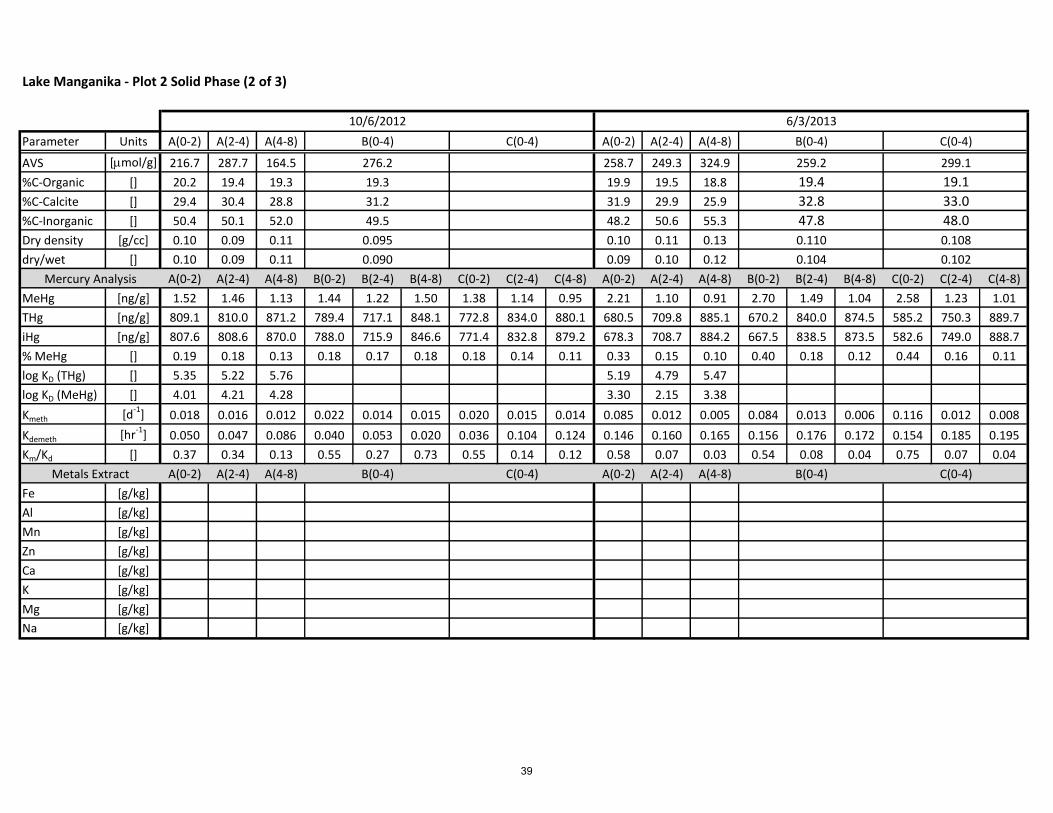
Lake Manganika - Plot 2 Solid Phase (2 of 3)
Parameter Units A(0-2) A(2-4) A(4-8) A(0-2) A(2-4) A(4-8)
AVS [mmol/g] 216.7 287.7 164.5 258.7 249.3 324.9
%C-Organic [] 20.2 19.4 19.3 19.9 19.5 18.8
%C-Calcite [] 29.4 30.4 28.8 31.9 29.9 25.9
%C-Inorganic [] 50.4 50.1 52.0 48.2 50.6 55.3
Dry density [g/cc] 0.10 0.09 0.11 0.10 0.11 0.13
dry/wet [] 0.10 0.09 0.11 0.09 0.10 0.12
A(0-2) A(2-4) A(4-8) B(0-2) B(2-4) B(4-8) C(0-2) C(2-4) C(4-8) A(0-2) A(2-4) A(4-8) B(0-2) B(2-4) B(4-8) C(0-2) C(2-4) C(4-8)
MeHg [ng/g] 1.52 1.46 1.13 1.44 1.22 1.50 1.38 1.14 0.95 2.21 1.10 0.91 2.70 1.49 1.04 2.58 1.23 1.01
THg [ng/g] 809.1 810.0 871.2 789.4 717.1 848.1 772.8 834.0 880.1 680.5 709.8 885.1 670.2 840.0 874.5 585.2 750.3 889.7
iHg [ng/g] 807.6 808.6 870.0 788.0 715.9 846.6 771.4 832.8 879.2 678.3 708.7 884.2 667.5 838.5 873.5 582.6 749.0 888.7
% MeHg [] 0.19 0.18 0.13 0.18 0.17 0.18 0.18 0.14 0.11 0.33 0.15 0.10 0.40 0.18 0.12 0.44 0.16 0.11
log KD (THg) [] 5.35 5.22 5.76 5.19 4.79 5.47
log KD (MeHg) [] 4.01 4.21 4.28 3.30 2.15 3.38
Kmeth [d-1] 0.018 0.016 0.012 0.022 0.014 0.015 0.020 0.015 0.014 0.085 0.012 0.005 0.084 0.013 0.006 0.116 0.012 0.008
Kdemeth [hr-1] 0.050 0.047 0.086 0.040 0.053 0.020 0.036 0.104 0.124 0.146 0.160 0.165 0.156 0.176 0.172 0.154 0.185 0.195
Km/Kd [] 0.37 0.34 0.13 0.55 0.27 0.73 0.55 0.14 0.12 0.58 0.07 0.03 0.54 0.08 0.04 0.75 0.07 0.04
A(0-2) A(2-4) A(4-8) A(0-2) A(2-4) A(4-8)
Fe [g/kg]
Al [g/kg]
Mn [g/kg]
Zn [g/kg]
Ca [g/kg]
K [g/kg]
Mg [g/kg]
Na [g/kg]
B(0-4) C(0-4) B(0-4) C(0-4)
Mercury Analysis
Metals Extract
0.110 0.108
0.090 0.104 0.102
0.095
32.8 33.0
49.5 47.8 48.0
31.2
276.2 259.2 299.1
19.3 19.4 19.1
10/6/2012 6/3/2013
B(0-4) C(0-4) B(0-4) C(0-4)
39

Lake Manganika - Plot 2 Solid Phase (3 of 3)
SUMMARY STATISTICS
Parameter Units 5/15/2012 7/24/2012 10/6/2012 6/3/2013
AVS [mmol/g] 214.0 521.1 264.2 270.8
%C-Organic [] 19.9 23.4 19.5 19.4
%C-Calcite [] 30.4 31.7 30.6 32.2
%C-Inorganic [] 49.7 44.9 49.9 48.4
Dry density [g/cc] 0.11 0.06 0.10 0.11
dry/wet [] 0.10 0.06 0.09 0.10
MeHg [ng/g] 3.07 1.62 1.36 1.88
THg [ng/g] 815.8 781.5 788.7 706.0
iHg [ng/g] 812.7 779.8 787.4 704.1
% MeHg [] 0.38 0.21 0.17 0.27
log KD (THg) [] 4.85 5.41 5.19 4.80
log KD (MeHg) [] 2.60 3.63 4.12 2.93
Kmeth [d-1] 0.014 0.020 0.018 0.054
Kdemeth [hr-1] 0.102 0.061 0.055 0.163
Km/Kd [] 0.15 1.74 0.37 0.35
Fe [g/kg] 22.6
Al [g/kg] 57.8
Mn [g/kg] 3.1
Zn [g/kg] 0.4
Ca [g/kg] 160.2
K [g/kg] 11.9
Mg [g/kg] 19.5
Na [g/kg] 0.0*
*measured value negative
Metals Extract
Mercury Analysis
Top 4cm Average
40
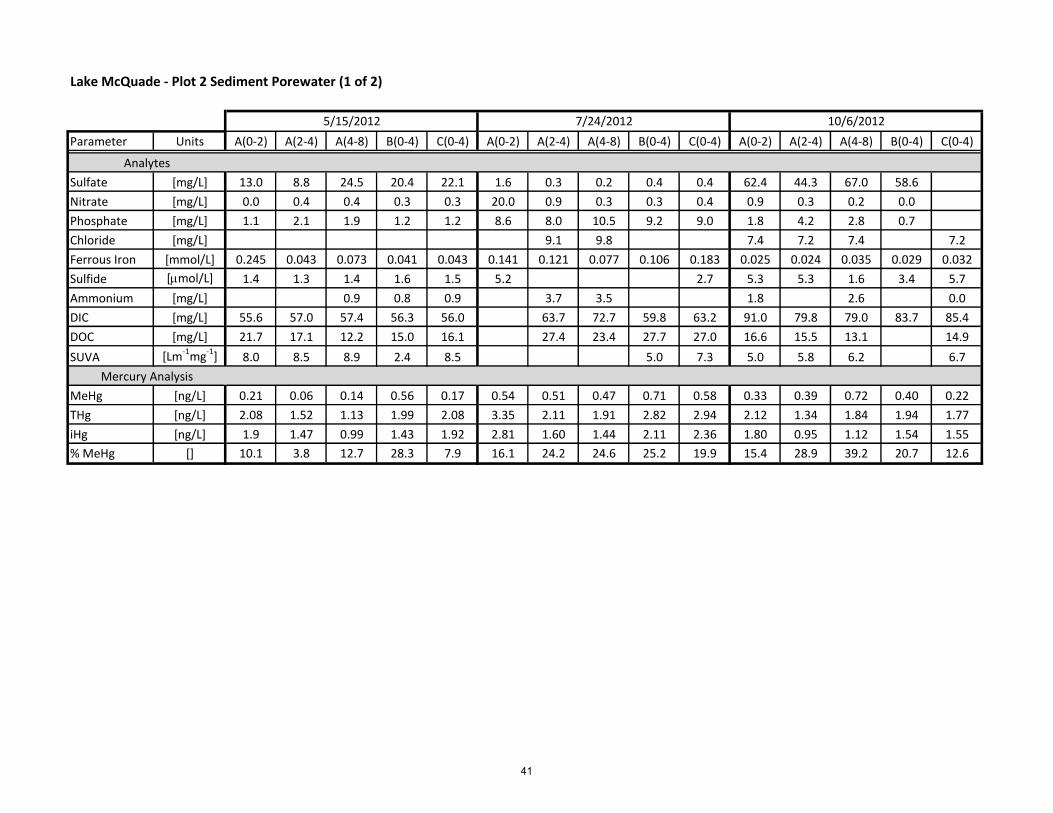
Lake McQuade - Plot 2 Sediment Porewater (1 of 2)
Parameter Units A(0-2) A(2-4) A(4-8) B(0-4) C(0-4) A(0-2) A(2-4) A(4-8) B(0-4) C(0-4) A(0-2) A(2-4) A(4-8) B(0-4) C(0-4)
Sulfate [mg/L] 13.0 8.8 24.5 20.4 22.1 1.6 0.3 0.2 0.4 0.4 62.4 44.3 67.0 58.6
Nitrate [mg/L] 0.0 0.4 0.4 0.3 0.3 20.0 0.9 0.3 0.3 0.4 0.9 0.3 0.2 0.0
Phosphate [mg/L] 1.1 2.1 1.9 1.2 1.2 8.6 8.0 10.5 9.2 9.0 1.8 4.2 2.8 0.7
Chloride [mg/L] 9.1 9.8 7.4 7.2 7.4 7.2
Ferrous Iron [mmol/L] 0.245 0.043 0.073 0.041 0.043 0.141 0.121 0.077 0.106 0.183 0.025 0.024 0.035 0.029 0.032
Sulfide [mmol/L] 1.4 1.3 1.4 1.6 1.5 5.2 2.7 5.3 5.3 1.6 3.4 5.7
Ammonium [mg/L] 0.9 0.8 0.9 3.7 3.5 1.8 2.6 0.0
DIC [mg/L] 55.6 57.0 57.4 56.3 56.0 63.7 72.7 59.8 63.2 91.0 79.8 79.0 83.7 85.4
DOC [mg/L] 21.7 17.1 12.2 15.0 16.1 27.4 23.4 27.7 27.0 16.6 15.5 13.1 14.9
SUVA [Lm-1mg-1] 8.0 8.5 8.9 2.4 8.5 5.0 7.3 5.0 5.8 6.2 6.7
MeHg [ng/L] 0.21 0.06 0.14 0.56 0.17 0.54 0.51 0.47 0.71 0.58 0.33 0.39 0.72 0.40 0.22
THg [ng/L] 2.08 1.52 1.13 1.99 2.08 3.35 2.11 1.91 2.82 2.94 2.12 1.34 1.84 1.94 1.77
iHg [ng/L] 1.9 1.47 0.99 1.43 1.92 2.81 1.60 1.44 2.11 2.36 1.80 0.95 1.12 1.54 1.55
% MeHg [] 10.1 3.8 12.7 28.3 7.9 16.1 24.2 24.6 25.2 19.9 15.4 28.9 39.2 20.7 12.6
Mercury Analysis
5/15/2012 7/24/2012 10/6/2012
Analytes
41

Lake McQuade - Plot 2 Sediment Porewater (2 of 2)
SUMMARY STATISTICS
Parameter Units A(0-2) A(2-4) A(4-8) B(0-4) C(0-4) 5/15/2012 7/24/2012 10/6/2012 6/3/2013
Sulfate [mg/L] 11.3 20.5 25.3 20.2 27.3 17.8 0.6 56.0 21.1
Nitrate [mg/L] 3.7 0.5 0.3 0.7 0.1 0.3 3.7 0.3 1.0
Phosphate [mg/L] 4.4 3.8 2.8 3.1 2.9 1.3 8.8 1.9 3.4
Chloride [mg/L] 10.5 10.6 11.8 12.2 1.5 7.2 11.4
Ferrous Iron [mM] 0.032 0.024 0.030 0.023 0.045 0.076 0.140 0.029 0.032
Sulfide [mmol] 2.8 3.1 3.0 3.7 0.8 1.5 2.7 4.8 2.5
Ammonium [mg/L] 0.8 0.8 0.8 0.7 0.85 0.73
DIC [mg/L] 53.3 43.7 45.5 41.1 41.8 56.2 61.5 84.8 43.8
DOC [mg/L] 22.6 15.9 12.6 17.3 15.3 16.8 27.4 15.5 17.3
SUVA [Lm-1mg-1] 6.8 5.6 5.3 5.8 5.5 6.4 6.2 6.0 5.8
MeHg [ng/L] 0.65 0.33 0.19 0.54 0.31 0.29 0.61 0.33 0.45
THg [ng/L] 9.15 6.03 4.45 1.87 2.04 1.96 2.83 1.81 3.83
iHg [ng/L] 8.51 5.70 4.26 1.33 1.73 1.67 2.23 1.49 3.39
% MeHg [] 7.0 5.5 4.3 28.9 15.2 14.7 21.4 18.0 11.6
Mercury Analysis
6/3/2013 Top 4cm Average
Analytes
42
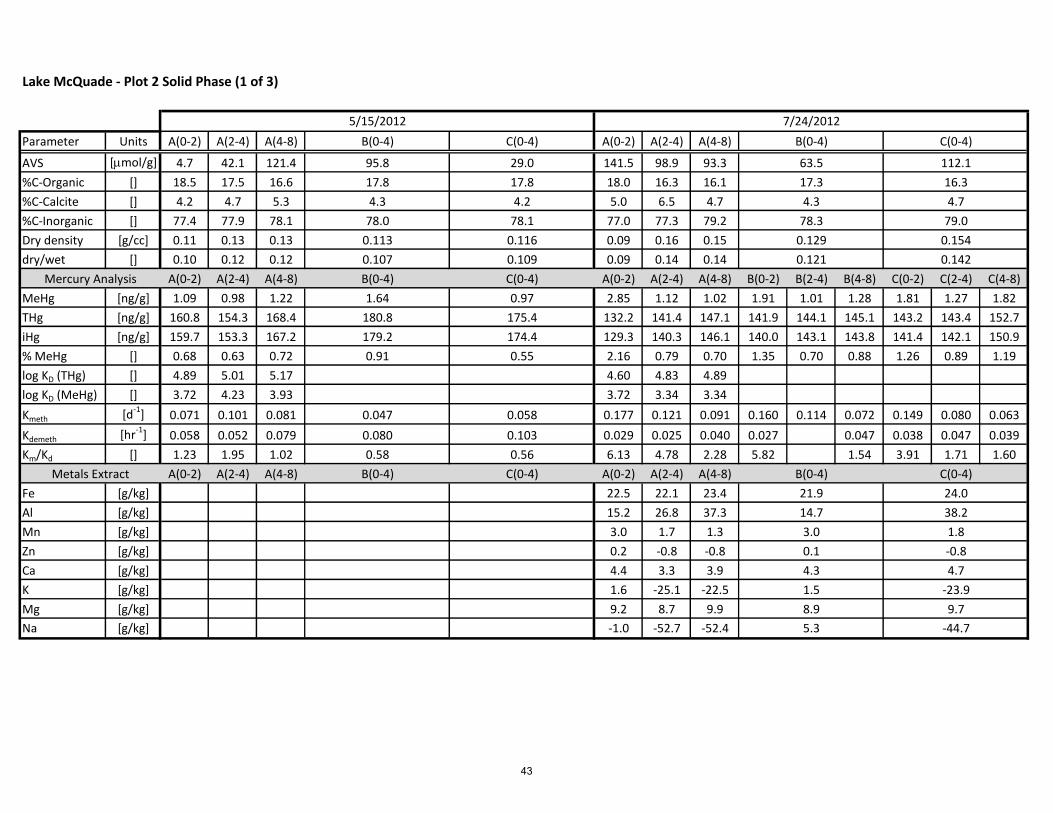
Lake McQuade - Plot 2 Solid Phase (1 of 3)
Parameter Units A(0-2) A(2-4) A(4-8) A(0-2) A(2-4) A(4-8)
AVS [mmol/g] 4.7 42.1 121.4 141.5 98.9 93.3
%C-Organic [] 18.5 17.5 16.6 18.0 16.3 16.1
%C-Calcite [] 4.2 4.7 5.3 5.0 6.5 4.7
%C-Inorganic [] 77.4 77.9 78.1 77.0 77.3 79.2
Dry density [g/cc] 0.11 0.13 0.13 0.09 0.16 0.15
dry/wet [] 0.10 0.12 0.12 0.09 0.14 0.14
A(0-2) A(2-4) A(4-8) A(0-2) A(2-4) A(4-8) B(0-2) B(2-4) B(4-8) C(0-2) C(2-4) C(4-8)
MeHg [ng/g] 1.09 0.98 1.22 2.85 1.12 1.02 1.91 1.01 1.28 1.81 1.27 1.82
THg [ng/g] 160.8 154.3 168.4 132.2 141.4 147.1 141.9 144.1 145.1 143.2 143.4 152.7
iHg [ng/g] 159.7 153.3 167.2 129.3 140.3 146.1 140.0 143.1 143.8 141.4 142.1 150.9
% MeHg [] 0.68 0.63 0.72 2.16 0.79 0.70 1.35 0.70 0.88 1.26 0.89 1.19
log KD (THg) [] 4.89 5.01 5.17 4.60 4.83 4.89
log KD (MeHg) [] 3.72 4.23 3.93 3.72 3.34 3.34
Kmeth [d-1] 0.071 0.101 0.081 0.177 0.121 0.091 0.160 0.114 0.072 0.149 0.080 0.063
Kdemeth [hr-1] 0.058 0.052 0.079 0.029 0.025 0.040 0.027 0.047 0.038 0.047 0.039
Km/Kd [] 1.23 1.95 1.02 6.13 4.78 2.28 5.82 1.54 3.91 1.71 1.60
A(0-2) A(2-4) A(4-8) A(0-2) A(2-4) A(4-8)
Fe [g/kg] 22.5 22.1 23.4
Al [g/kg] 15.2 26.8 37.3
Mn [g/kg] 3.0 1.7 1.3
Zn [g/kg] 0.2 -0.8 -0.8
Ca [g/kg] 4.4 3.3 3.9
K [g/kg] 1.6 -25.1 -22.5
Mg [g/kg] 9.2 8.7 9.9
Na [g/kg] -1.0 -52.7 -52.4
1.64
180.8
179.2
0.91
0.047
0.55
174.4
175.4
17.8 17.8
B(0-4) C(0-4)
5.3 -44.7
8.9 9.7
1.5 -23.9
4.3 4.7
0.1 -0.8
3.0 1.8
14.7 38.2
21.9 24.0
Mercury Analysis
Metals Extract B(0-4) C(0-4) B(0-4) C(0-4)
0.97
0.080
0.58
0.058
0.103
0.56
0.107 0.109 0.121 0.142
0.113 0.116 0.129 0.154
78.0 78.1 78.3 79.0
4.3 4.2 4.3 4.7
17.3 16.3
B(0-4) C(0-4) B(0-4) C(0-4)
95.8 29.0 63.5 112.1
5/15/2012 7/24/2012
43
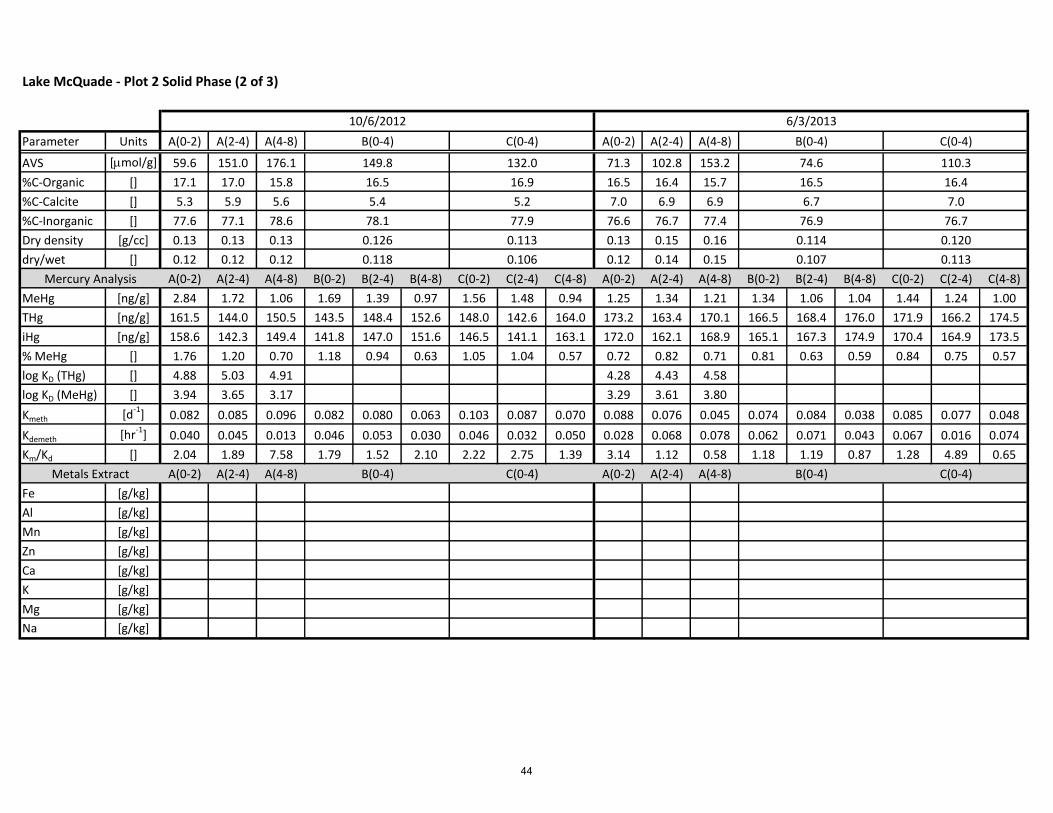
Lake McQuade - Plot 2 Solid Phase (2 of 3)
Parameter Units A(0-2) A(2-4) A(4-8) A(0-2) A(2-4) A(4-8)
AVS [mmol/g] 59.6 151.0 176.1 71.3 102.8 153.2
%C-Organic [] 17.1 17.0 15.8 16.5 16.4 15.7
%C-Calcite [] 5.3 5.9 5.6 7.0 6.9 6.9
%C-Inorganic [] 77.6 77.1 78.6 76.6 76.7 77.4
Dry density [g/cc] 0.13 0.13 0.13 0.13 0.15 0.16
dry/wet [] 0.12 0.12 0.12 0.12 0.14 0.15
A(0-2) A(2-4) A(4-8) B(0-2) B(2-4) B(4-8) C(0-2) C(2-4) C(4-8) A(0-2) A(2-4) A(4-8) B(0-2) B(2-4) B(4-8) C(0-2) C(2-4) C(4-8)
MeHg [ng/g] 2.84 1.72 1.06 1.69 1.39 0.97 1.56 1.48 0.94 1.25 1.34 1.21 1.34 1.06 1.04 1.44 1.24 1.00
THg [ng/g] 161.5 144.0 150.5 143.5 148.4 152.6 148.0 142.6 164.0 173.2 163.4 170.1 166.5 168.4 176.0 171.9 166.2 174.5
iHg [ng/g] 158.6 142.3 149.4 141.8 147.0 151.6 146.5 141.1 163.1 172.0 162.1 168.9 165.1 167.3 174.9 170.4 164.9 173.5
% MeHg [] 1.76 1.20 0.70 1.18 0.94 0.63 1.05 1.04 0.57 0.72 0.82 0.71 0.81 0.63 0.59 0.84 0.75 0.57
log KD (THg) [] 4.88 5.03 4.91 4.28 4.43 4.58
log KD (MeHg) [] 3.94 3.65 3.17 3.29 3.61 3.80
Kmeth [d-1] 0.082 0.085 0.096 0.082 0.080 0.063 0.103 0.087 0.070 0.088 0.076 0.045 0.074 0.084 0.038 0.085 0.077 0.048
Kdemeth [hr-1] 0.040 0.045 0.013 0.046 0.053 0.030 0.046 0.032 0.050 0.028 0.068 0.078 0.062 0.071 0.043 0.067 0.016 0.074
Km/Kd [] 2.04 1.89 7.58 1.79 1.52 2.10 2.22 2.75 1.39 3.14 1.12 0.58 1.18 1.19 0.87 1.28 4.89 0.65
A(0-2) A(2-4) A(4-8) A(0-2) A(2-4) A(4-8)
Fe [g/kg]
Al [g/kg]
Mn [g/kg]
Zn [g/kg]
Ca [g/kg]
K [g/kg]
Mg [g/kg]
Na [g/kg]
B(0-4) C(0-4) B(0-4) C(0-4)
Mercury Analysis
Metals Extract
0.114 0.120
0.118 0.106 0.107 0.113
0.126 0.113
6.7 7.0
78.1 77.9 76.9 76.7
5.4 5.2
16.5 16.9 16.5 16.4
C(0-4) B(0-4) C(0-4)B(0-4)
149.8 132.0 74.6
10/6/2012 6/3/2013
110.3
44

Lake McQuade - Plot 2 Solid Phase (3 of 3)
SUMMARY STATISTICS
Parameter Units 5/15/2012 7/24/2012 10/6/2012 6/3/2013
AVS [mmol/g] 49.4 98.6 129.1 90.6
%C-Organic [] 17.8 16.9 16.8 16.4
%C-Calcite [] 4.3 4.9 5.4 6.8
%C-Inorganic [] 77.9 78.2 77.8 76.7
Dry density [g/cc] 0.12 0.14 0.12 0.13
dry/wet [] 0.11 0.13 0.11 0.12
MeHg [ng/g] 1.22 1.66 1.78 1.28
THg [ng/g] 171.3 141.0 148.0 168.3
iHg [ng/g] 170.0 139.4 146.2 167.0
% MeHg [] 0.71 1.18 1.20 0.76
log KD (THg) [] 4.94 4.70 4.91 4.64
log KD (MeHg) [] 3.63 3.44 3.74 3.46
Kmeth [d-1] 0.063 0.134 0.087 0.081
Kdemeth [hr-1] 0.079 0.033 0.044 0.052
Km/Kd [] 0.91 4.47 2.04 2.13
Fe [g/kg] 22.7
Al [g/kg] 24.7
Mn [g/kg] 2.4
Zn [g/kg] 0.0*
Ca [g/kg] 4.3
K [g/kg] 0.0*
Mg [g/kg] 9.2
Na [g/kg] 0.0*
*measured value negative
Metals Extract
Mercury Analysis
Top 4cm Average
45

Lake McQuade - Plot 2 Solid Phase (1 of 3)
Parameter Units A(0-2) A(2-4) A(4-8) A(0-2) A(2-4) A(4-8)
AVS [mmol/g] 4.7 42.1 121.4 141.5 98.9 93.3
%C-Organic [] 18.5 17.5 16.6 18.0 16.3 16.1
%C-Calcite [] 4.2 4.7 5.3 5.0 6.5 4.7
%C-Inorganic [] 77.4 77.9 78.1 77.0 77.3 79.2
Dry density [g/cc] 0.11 0.13 0.13 0.09 0.16 0.15
dry/wet [] 0.10 0.12 0.12 0.09 0.14 0.14
A(0-2) A(2-4) A(4-8) A(0-2) A(2-4) A(4-8) B(0-2) B(2-4) B(4-8) C(0-2) C(2-4) C(4-8)
MeHg [ng/g] 1.09 0.98 1.22 2.85 1.12 1.02 1.91 1.01 1.28 1.81 1.27 1.82
THg [ng/g] 160.8 154.3 168.4 132.2 141.4 147.1 141.9 144.1 145.1 143.2 143.4 152.7
iHg [ng/g] 159.7 153.3 167.2 129.3 140.3 146.1 140.0 143.1 143.8 141.4 142.1 150.9
% MeHg [] 0.68 0.63 0.72 2.16 0.79 0.70 1.35 0.70 0.88 1.26 0.89 1.19
log KD (THg) [] 4.89 5.01 5.17 4.60 4.83 4.89
log KD (MeHg) [] 3.72 4.23 3.93 3.72 3.34 3.34
Kmeth [d-1] 0.071 0.101 0.081 0.177 0.121 0.091 0.160 0.114 0.072 0.149 0.080 0.063
Kdemeth [hr-1] 0.058 0.052 0.079 0.029 0.025 0.040 0.027 0.047 0.038 0.047 0.039
Km/Kd [] 1.23 1.95 1.02 6.13 4.78 2.28 5.82 1.54 3.91 1.71 1.60
A(0-2) A(2-4) A(4-8) A(0-2) A(2-4) A(4-8)
Fe [g/kg] 22.5 22.1 23.4
Al [g/kg] 15.2 26.8 37.3
Mn [g/kg] 3.0 1.7 1.3
Zn [g/kg] 0.2 -0.8 -0.8
Ca [g/kg] 4.4 3.3 3.9
K [g/kg] 1.6 -25.1 -22.5
Mg [g/kg] 9.2 8.7 9.9
Na [g/kg] -1.0 -52.7 -52.4
1.64
180.8
179.2
0.91
0.047
0.55
174.4
175.4
17.8 17.8
B(0-4) C(0-4)
5.3 -44.7
8.9 9.7
1.5 -23.9
4.3 4.7
0.1 -0.8
3.0 1.8
14.7 38.2
21.9 24.0
Mercury Analysis
Metals Extract B(0-4) C(0-4) B(0-4) C(0-4)
0.97
0.080
0.58
0.058
0.103
0.56
0.107 0.109 0.121 0.142
0.113 0.116 0.129 0.154
78.0 78.1 78.3 79.0
4.3 4.2 4.3 4.7
17.3 16.3
B(0-4) C(0-4) B(0-4) C(0-4)
95.8 29.0 63.5 112.1
5/15/2012 7/24/2012
46

Lake McQuade - Plot 2 Solid Phase (2 of 3)
Parameter Units A(0-2) A(2-4) A(4-8) A(0-2) A(2-4) A(4-8)
AVS [mmol/g] 59.6 151.0 176.1 71.3 102.8 153.2
%C-Organic [] 17.1 17.0 15.8 16.5 16.4 15.7
%C-Calcite [] 5.3 5.9 5.6 7.0 6.9 6.9
%C-Inorganic [] 77.6 77.1 78.6 76.6 76.7 77.4
Dry density [g/cc] 0.13 0.13 0.13 0.13 0.15 0.16
dry/wet [] 0.12 0.12 0.12 0.12 0.14 0.15
A(0-2) A(2-4) A(4-8) B(0-2) B(2-4) B(4-8) C(0-2) C(2-4) C(4-8) A(0-2) A(2-4) A(4-8) B(0-2) B(2-4) B(4-8) C(0-2) C(2-4) C(4-8)
MeHg [ng/g] 2.84 1.72 1.06 1.69 1.39 0.97 1.56 1.48 0.94 1.25 1.34 1.21 1.34 1.06 1.04 1.44 1.24 1.00
THg [ng/g] 161.5 144.0 150.5 143.5 148.4 152.6 148.0 142.6 164.0 173.2 163.4 170.1 166.5 168.4 176.0 171.9 166.2 174.5
iHg [ng/g] 158.6 142.3 149.4 141.8 147.0 151.6 146.5 141.1 163.1 172.0 162.1 168.9 165.1 167.3 174.9 170.4 164.9 173.5
% MeHg [] 1.76 1.20 0.70 1.18 0.94 0.63 1.05 1.04 0.57 0.72 0.82 0.71 0.81 0.63 0.59 0.84 0.75 0.57
log KD (THg) [] 4.88 5.03 4.91 4.28 4.43 4.58
log KD (MeHg) [] 3.94 3.65 3.17 3.29 3.61 3.80
Kmeth [d-1] 0.082 0.085 0.096 0.082 0.080 0.063 0.103 0.087 0.070 0.088 0.076 0.045 0.074 0.084 0.038 0.085 0.077 0.048
Kdemeth [hr-1] 0.040 0.045 0.013 0.046 0.053 0.030 0.046 0.032 0.050 0.028 0.068 0.078 0.062 0.071 0.043 0.067 0.016 0.074
Km/Kd [] 2.04 1.89 7.58 1.79 1.52 2.10 2.22 2.75 1.39 3.14 1.12 0.58 1.18 1.19 0.87 1.28 4.89 0.65
A(0-2) A(2-4) A(4-8) A(0-2) A(2-4) A(4-8)
Fe [g/kg]
Al [g/kg]
Mn [g/kg]
Zn [g/kg]
Ca [g/kg]
K [g/kg]
Mg [g/kg]
Na [g/kg]
B(0-4) C(0-4) B(0-4) C(0-4)
Mercury Analysis
Metals Extract
0.114 0.120
0.118 0.106 0.107 0.113
0.126 0.113
6.7 7.0
78.1 77.9 76.9 76.7
5.4 5.2
16.5 16.9 16.5 16.4
C(0-4) B(0-4) C(0-4)B(0-4)
149.8 132.0 74.6
10/6/2012 6/3/2013
110.3
47

Lake McQuade - Plot 2 Solid Phase (3 of 3)
SUMMARY STATISTICS
Parameter Units 5/15/2012 7/24/2012 10/6/2012 6/3/2013
AVS [mmol/g] 49.4 98.6 129.1 90.6
%C-Organic [] 17.8 16.9 16.8 16.4
%C-Calcite [] 4.3 4.9 5.4 6.8
%C-Inorganic [] 77.9 78.2 77.8 76.7
Dry density [g/cc] 0.12 0.14 0.12 0.13
dry/wet [] 0.11 0.13 0.11 0.12
MeHg [ng/g] 1.22 1.66 1.78 1.28
THg [ng/g] 171.3 141.0 148.0 168.3
iHg [ng/g] 170.0 139.4 146.2 167.0
% MeHg [] 0.71 1.18 1.20 0.76
log KD (THg) [] 4.94 4.70 4.91 4.64
log KD (MeHg) [] 3.63 3.44 3.74 3.46
Kmeth [d-1] 0.063 0.134 0.087 0.081
Kdemeth [hr-1] 0.079 0.033 0.044 0.052
Km/Kd [] 0.91 4.47 2.04 2.13
Fe [g/kg] 22.7
Al [g/kg] 24.7
Mn [g/kg] 2.4
Zn [g/kg] 0.0*
Ca [g/kg] 4.3
K [g/kg] 0.0*
Mg [g/kg] 9.2
Na [g/kg] 0.0*
*measured value negative
Metals Extract
Mercury Analysis
Top 4cm Average
48

Lake McQuade - Plot 3 Sediment Porewater (1 of 2)
Parameter Units A(0-2) A(2-4) A(4-8) B(0-4) C(0-4) A(0-2) A(2-4) A(4-8) B(0-4) C(0-4) A(0-2) A(2-4) A(4-8) B(0-4) C(0-4)
Sulfate [mg/L] 0.3 0.2 0.2 0.3 0.5 2.5 4.1 3.3 5.6 7.4
Nitrate [mg/L] 0.4 0.4 0.3 0.2 0.4 0.7 0.2 1.0 0.2 0.3
Phosphate [mg/L] 10.3 13.0 14.0 10.2 11.2 8.7 8.4 9.2 7.0 5.8
Chloride [mg/L] 11.3 11.7 10.8 7.4 7.5 7.2
Ferrous Iron [mmol/L] 0.069 0.093 0.118 0.036 0.062 0.055 0.054 0.083 0.031 0.046
Sulfide [mmol/L] 6.5 10.9 8.1 7.6 5.2 7.4 3.4 3.4 2.4
Ammonium [mg/L] 8.5 5.5 11.4 7.1 5.6
DIC [mg/L] 50.5 61.9 81.5 49.9 48.5 89.5 102.7 88.7 87.0 97.4
DOC [mg/L] 27.6 25.8 24.4 25.1 26.1 25.8 28.0 25.5 25.6 23.4
SUVA [Lm-1mg-1] 6.2 5.8 4.5 5.0 5.6 5.6 5.8 7.4 5.2 6.0
MeHg [ng/L] 1.80 0.67 0.33 1.22 0.64 0.68 0.39 0.29 1.20 0.62
THg [ng/L] 3.82 2.21 1.91 3.38 2.31 3.48 1.88 1.84 2.39 2.16
iHg [ng/L] 2.02 1.55 1.58 2.17 1.67 2.80 1.49 1.55 1.19 1.55
% MeHg [] 47.1 30.1 17.2 36.0 27.7 19.5 20.5 15.7 50.4 28.5
Mercury Analysis
5/15/2012 7/24/2012 10/6/2012
Analytes
49

Lake McQuade - Plot 3 Sediment Porewater (2 of 2)
SUMMARY STATISTICS
Parameter Units A(0-2) A(2-4) A(4-8) B(0-4) C(0-4) 5/15/2012 7/24/2012 10/6/2012 6/3/2013
Sulfate [mg/L] 2.2 2.0 1.5 4.1 2.6 0.4 5.5 2.9
Nitrate [mg/L] 0.4 0.3 0.2 0.2 0.3 0.3 0.3 0.3
Phosphate [mg/L] 5.8 6.7 12.4 7.8 7.3 11.0 7.2 7.1
Chloride [mg/L] 10.2 10.2 10.0 9.2 10.8 7.3 9.7
Ferrous Iron [mM] 0.010 0.058 0.083 0.065 0.020 0.060 0.044 0.040
Sulfide [mmol] 31.8 26.2 5.3 13.9 23.1 8.1 4.0 22.0
Ammonium [mg/L] 4.5 5.6 7.0 5.4 6.5 5.2
DIC [mg/L] 34.2 68.7 76.9 79.8 70.6 51.5 93.5 67.3
DOC [mg/L] 8.3 20.0 21.8 19.4 20.2 26.0 25.3 17.9
SUVA [Lm-1mg-1] 13.0 5.9 5.9 5.7 5.1 5.5 5.6 6.8
MeHg [ng/L] 1.57 0.42 0.04 0.84 0.76 1.03 0.78 0.86
THg [ng/L] 12.00 2.32 1.51 11.26 14.15 2.90 2.41 10.86
iHg [ng/L] 10.42 1.91 1.47 10.42 13.39 1.87 1.63 9.99
% MeHg [] 13.1 18.0 2.4 7.4 5.4 35.5 32.5 8.0
Mercury Analysis
6/3/2013 Top 4cm Average
Analytes
50
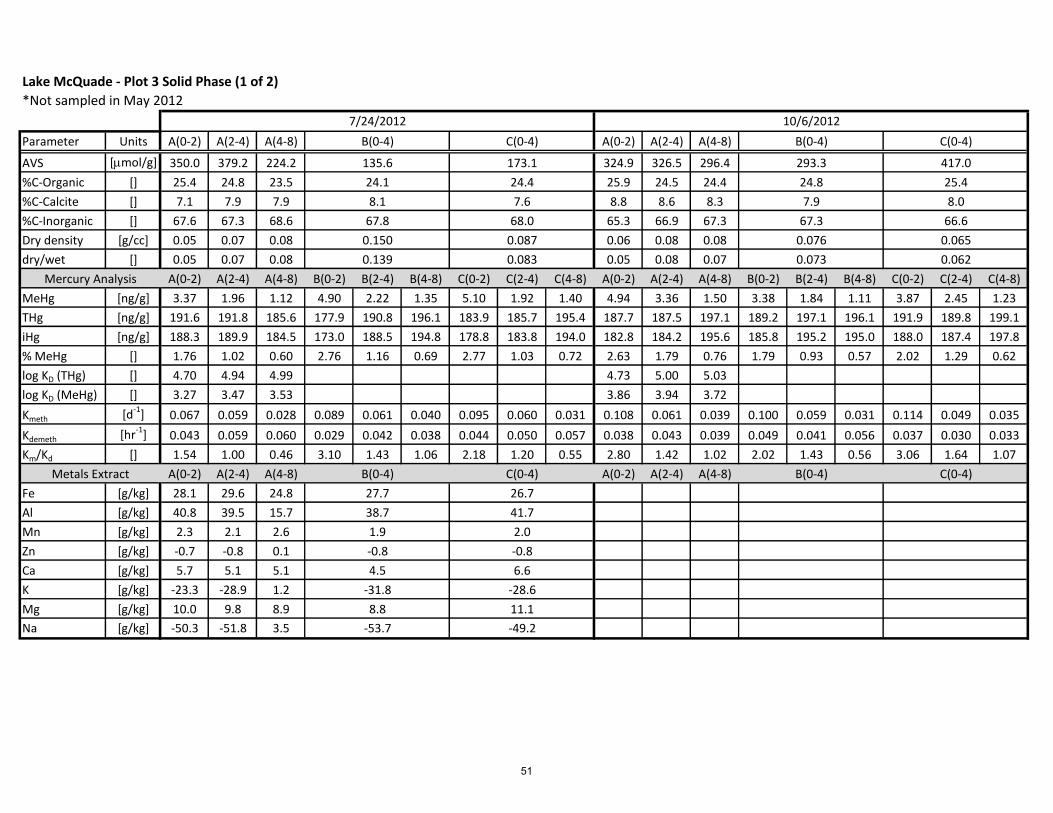
Lake McQuade - Plot 3 Solid Phase (1 of 2)
*Not sampled in May 2012
Parameter Units A(0-2) A(2-4) A(4-8) A(0-2) A(2-4) A(4-8)
AVS [mmol/g] 350.0 379.2 224.2 324.9 326.5 296.4
%C-Organic [] 25.4 24.8 23.5 25.9 24.5 24.4
%C-Calcite [] 7.1 7.9 7.9 8.8 8.6 8.3
%C-Inorganic [] 67.6 67.3 68.6 65.3 66.9 67.3
Dry density [g/cc] 0.05 0.07 0.08 0.06 0.08 0.08
dry/wet [] 0.05 0.07 0.08 0.05 0.08 0.07
A(0-2) A(2-4) A(4-8) B(0-2) B(2-4) B(4-8) C(0-2) C(2-4) C(4-8) A(0-2) A(2-4) A(4-8) B(0-2) B(2-4) B(4-8) C(0-2) C(2-4) C(4-8)
MeHg [ng/g] 3.37 1.96 1.12 4.90 2.22 1.35 5.10 1.92 1.40 4.94 3.36 1.50 3.38 1.84 1.11 3.87 2.45 1.23
THg [ng/g] 191.6 191.8 185.6 177.9 190.8 196.1 183.9 185.7 195.4 187.7 187.5 197.1 189.2 197.1 196.1 191.9 189.8 199.1
iHg [ng/g] 188.3 189.9 184.5 173.0 188.5 194.8 178.8 183.8 194.0 182.8 184.2 195.6 185.8 195.2 195.0 188.0 187.4 197.8
% MeHg [] 1.76 1.02 0.60 2.76 1.16 0.69 2.77 1.03 0.72 2.63 1.79 0.76 1.79 0.93 0.57 2.02 1.29 0.62
log KD (THg) [] 4.70 4.94 4.99 4.73 5.00 5.03
log KD (MeHg) [] 3.27 3.47 3.53 3.86 3.94 3.72
Kmeth [d-1] 0.067 0.059 0.028 0.089 0.061 0.040 0.095 0.060 0.031 0.108 0.061 0.039 0.100 0.059 0.031 0.114 0.049 0.035
Kdemeth [hr-1] 0.043 0.059 0.060 0.029 0.042 0.038 0.044 0.050 0.057 0.038 0.043 0.039 0.049 0.041 0.056 0.037 0.030 0.033
Km/Kd [] 1.54 1.00 0.46 3.10 1.43 1.06 2.18 1.20 0.55 2.80 1.42 1.02 2.02 1.43 0.56 3.06 1.64 1.07
A(0-2) A(2-4) A(4-8) A(0-2) A(2-4) A(4-8)
Fe [g/kg] 28.1 29.6 24.8
Al [g/kg] 40.8 39.5 15.7
Mn [g/kg] 2.3 2.1 2.6
Zn [g/kg] -0.7 -0.8 0.1
Ca [g/kg] 5.7 5.1 5.1
K [g/kg] -23.3 -28.9 1.2
Mg [g/kg] 10.0 9.8 8.9
Na [g/kg] -50.3 -51.8 3.5 -53.7 -49.2
8.8 11.1
-31.8 -28.6
4.5 6.6
-0.8 -0.8
1.9 2.0
38.7 41.7
27.7 26.7
Mercury Analysis
Metals Extract B(0-4) C(0-4) B(0-4) C(0-4)
0.139 0.083 0.073 0.062
0.150 0.087 0.076 0.065
67.8 68.0 67.3 66.6
8.1 7.6 7.9 8.0
7/24/2012 10/6/2012
B(0-4) C(0-4) B(0-4) C(0-4)
24.1 24.4 24.8 25.4
135.6 173.1 293.3 417.0
51

Lake McQuade - Plot 3 Solid Phase (2 of 2)
Parameter Units A(0-2) A(2-4) A(4-8) 5/15/2012 7/24/2012 10/6/2012 6/3/2013
AVS [mmol/g] 533.7 438.1 361.4 224.4 345.3 418.5
%C-Organic [] 24.5 23.6 23.0 24.5 25.1 23.3
%C-Calcite [] 12.8 12.2 11.0 7.7 8.2 11.7
%C-Inorganic [] 62.7 64.2 66.0 67.7 66.7 65.0
Dry density [g/cc] 0.07 0.09 0.09 0.10 0.07 0.07
dry/wet [] 0.06 0.09 0.08 0.09 0.07 0.07
A(0-2) A(2-4) A(4-8) B(0-2) B(2-4) B(4-8) C(0-2) C(2-4) C(4-8)
MeHg [ng/g] 2.09 1.63 1.07 2.62 1.46 1.00 1.42 1.22 0.92 3.24 3.31 1.74
THg [ng/g] 209.7 207.0 210.0 198.5 201.4 198.6 191.5 191.8 200.8 187.0 190.5 200.0
iHg [ng/g] 207.6 205.3 208.9 195.9 199.9 197.6 190.1 190.6 199.9 183.7 187.2 198.2
% MeHg [] 1.00 0.79 0.51 1.32 0.73 0.51 0.74 0.63 0.46 1.74 1.74 0.87
log KD (THg) [] 4.24 4.95 5.14 4.81 4.90 4.27
log KD (MeHg) [] 2.80 3.27 4.15 3.50 3.63 3.30
Kmeth [d-1] 0.045 0.044 0.024 0.040 0.034 0.023 0.041 0.026 0.024 0.072 0.082 0.039
Kdemeth [hr-1] 0.074 0.057 0.044 0.062 0.055 0.052 0.070 0.011 0.067 0.044 0.040 0.055
Km/Kd [] 0.61 0.76 0.54 0.65 0.62 0.45 0.59 2.49 0.35 1.74 2.06 0.95
A(0-2) A(2-4) A(4-8)
Fe [g/kg] 27.8
Al [g/kg] 40.2
Mn [g/kg] 2.0
Zn [g/kg] 0.0*
Ca [g/kg] 5.5
K [g/kg] 0.0*
Mg [g/kg] 9.9
Na [g/kg] 0.0*
*measured value negative
Top 4cm Average
B(0-4) C(0-4)
Mercury Analysis
Metals Extract
0.067 0.072
0.070 0.075
65.5 66.0
11.1 11.4
6/3/2013
B(0-4)
23.4 22.6
C(0-4)
402.2 367.3
52
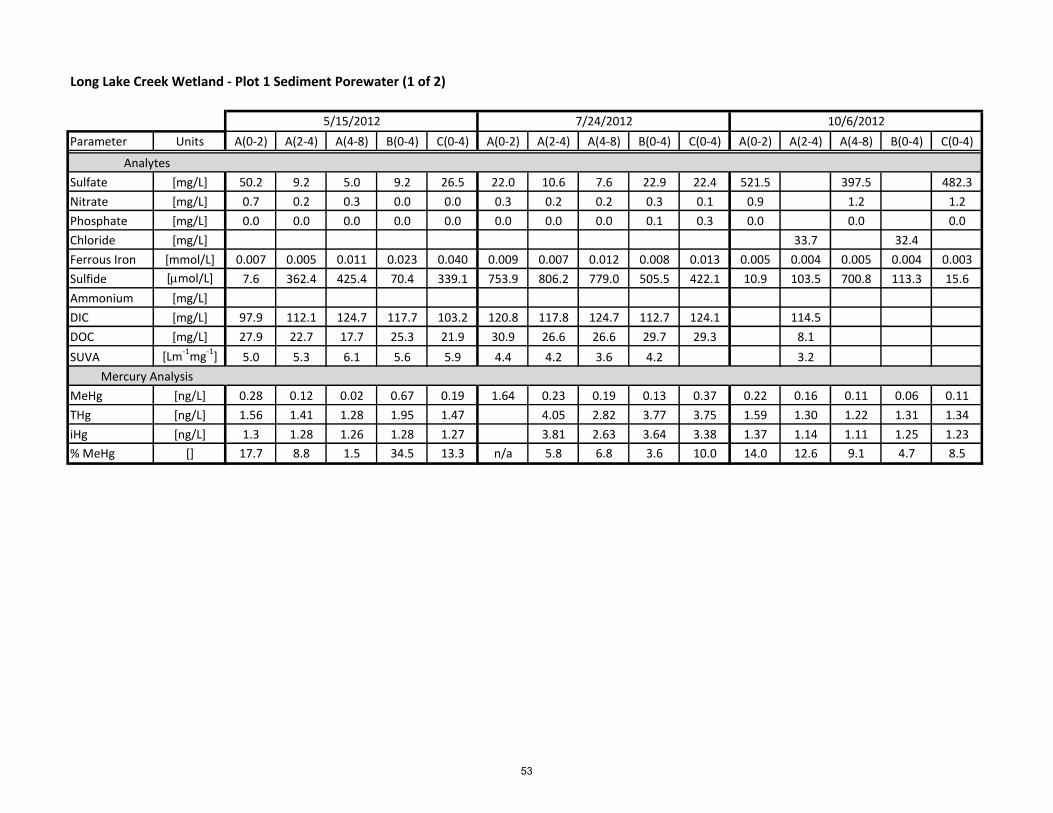
Long Lake Creek Wetland - Plot 1 Sediment Porewater (1 of 2)
Parameter Units A(0-2) A(2-4) A(4-8) B(0-4) C(0-4) A(0-2) A(2-4) A(4-8) B(0-4) C(0-4) A(0-2) A(2-4) A(4-8) B(0-4) C(0-4)
Sulfate [mg/L] 50.2 9.2 5.0 9.2 26.5 22.0 10.6 7.6 22.9 22.4 521.5 397.5 482.3
Nitrate [mg/L] 0.7 0.2 0.3 0.0 0.0 0.3 0.2 0.2 0.3 0.1 0.9 1.2 1.2
Phosphate [mg/L] 0.0 0.0 0.0 0.0 0.0 0.0 0.0 0.0 0.1 0.3 0.0 0.0 0.0
Chloride [mg/L] 33.7 32.4
Ferrous Iron [mmol/L] 0.007 0.005 0.011 0.023 0.040 0.009 0.007 0.012 0.008 0.013 0.005 0.004 0.005 0.004 0.003
Sulfide [mmol/L] 7.6 362.4 425.4 70.4 339.1 753.9 806.2 779.0 505.5 422.1 10.9 103.5 700.8 113.3 15.6
Ammonium [mg/L]
DIC [mg/L] 97.9 112.1 124.7 117.7 103.2 120.8 117.8 124.7 112.7 124.1 114.5
DOC [mg/L] 27.9 22.7 17.7 25.3 21.9 30.9 26.6 26.6 29.7 29.3 8.1
SUVA [Lm-1mg-1] 5.0 5.3 6.1 5.6 5.9 4.4 4.2 3.6 4.2 3.2
MeHg [ng/L] 0.28 0.12 0.02 0.67 0.19 1.64 0.23 0.19 0.13 0.37 0.22 0.16 0.11 0.06 0.11
THg [ng/L] 1.56 1.41 1.28 1.95 1.47 4.05 2.82 3.77 3.75 1.59 1.30 1.22 1.31 1.34
iHg [ng/L] 1.3 1.28 1.26 1.28 1.27 3.81 2.63 3.64 3.38 1.37 1.14 1.11 1.25 1.23
% MeHg [] 17.7 8.8 1.5 34.5 13.3 n/a 5.8 6.8 3.6 10.0 14.0 12.6 9.1 4.7 8.5
Mercury Analysis
5/15/2012 7/24/2012 10/6/2012
Analytes
53

Long Lake Creek Wetland - Plot 1 Sediment Porewater (2 of 2)
SUMMARY STATISTICS
Parameter Units A(0-2) A(2-4) A(4-8) B(0-4) C(0-4) 5/15/2012 7/24/2012 10/6/2012 6/3/2013
Sulfate [mg/L] 15.8 14.7 36.9 22.0 25.8 21.8 20.5 482.3 21.0
Nitrate [mg/L] 4.3 0.7 2.2 0.9 0.5 0.1 0.2 1.2 1.3
Phosphate [mg/L] 0.0 0.0 0.0 0.0 0.0 0.0 0.1 0.0 0.0
Chloride [mg/L] 10.7 12.7 10.9 8.8 32.4 9.9
Ferrous Iron [mM] 0.000 0.000 0.021 0.000 0.000 0.023 0.010 0.004 0.000
Sulfide [mmol] 1197.5 421.6 364.6 198.2 569.2 62.0 393.1
Ammonium [mg/L] 2.0 2.7 3.2 1.1 1.70
DIC [mg/L] 82.1 94.8 111.4 66.7 68.8 108.6 118.7 74.7
DOC [mg/L] 27.9 20.2 15.1 29.2 27.9 24.2 29.2 27.1
SUVA [Lm-1mg-1] 3.1 3.2 4.0 3.3 3.1 5.5 4.3 3.2
MeHg [ng/L] 0.22 0.14 0.14 1.06 0.55 0.36 0.48 0.12 0.60
THg [ng/L] 6.27 3.00 9.95 7.19 16.82 1.63 3.76 1.36 9.55
iHg [ng/L] 6.05 2.86 9.81 6.13 16.27 1.28 3.51 1.24 8.95
% MeHg [] 3.4 4.8 1.4 14.7 3.3 21.8 12.8 9.0 6.2
Mercury Analysis
6/3/2013 Top 4cm Average
Analytes
54

Long Lake Creek Wetland - Plot 1 Solid Phase (1 of 3)
Parameter Units A(0-2) A(2-4) A(4-8) A(0-2) A(2-4) A(4-8)
AVS [mmol/g] 76.4 65.7 107.1 208.3 197.2 120.6
%C-Organic [] 38.8 30.6 34.2 55.3 47.0 27.1
%C-Calcite [] 33.3 42.3 39.8 13.0 22.1 47.0
%C-Inorganic [] 27.9 27.0 26.1 31.7 30.8 25.9
Dry density [g/cc] 0.06 0.09 0.08 0.06 0.06 0.11
dry/wet [] 0.06 0.09 0.08 0.06 0.06 0.10
A(0-2) A(2-4) A(4-8) A(0-2) A(2-4) A(4-8) B(0-2) B(2-4) B(4-8) C(0-2) C(2-4) C(4-8)
MeHg [ng/g] 0.35 0.05 0.08 1.56 0.13 0.01 0.32 0.18 0.07 0.12 0.11 0.22
THg [ng/g] 50.4 53.5 30.9 65.8 54.2 53.3 96.8 87.6 87.9 67.1 64.9 65.3
iHg [ng/g] 50.1 53.5 30.8 64.3 54.1 53.3 96.4 87.4 87.8 66.9 64.8 65.1
% MeHg [] 0.69 0.09 0.26 2.36 0.23 0.01 0.33 0.21 0.08 0.18 0.17 0.34
log KD (THg) [] 4.51 4.58 4.38 4.13 4.28
log KD (MeHg) [] 3.10 2.58 3.60 2.98 2.73 1.46
Kmeth [d-1] 0.014 0.007 0.007 0.008 0.006 0.006 0.011 0.006 0.003 0.007 0.003 0.004
Kdemeth [hr-1] 0.032 0.037 0.033 0.038 0.036 0.045 0.057 0.042 0.042 0.072 0.050 0.044
Km/Kd [] 0.43 0.20 0.21 0.21 0.18 0.13 0.19 0.14 0.08 0.09 0.07 0.10
A(0-2) A(2-4) A(4-8) A(0-2) A(2-4) A(4-8)
Fe [g/kg] 13.4 10.5 8.9
Al [g/kg] 3.4 3.1 -5.7
Mn [g/kg] 5.5 6.6 14.6
Zn [g/kg] -0.2 0.1 -0.2
Ca [g/kg] 52.4 60.9 167.2
K [g/kg] 2.7 0.9 -5.1
Mg [g/kg] 9.0 6.4 6.6
Na [g/kg] -8.3 66.1 -10.3
0.21
0.016
0.044
0.37
0.054 0.051
0.010
0.051
0.16
37.0
37.0
0.060.61
61.7
61.1
0.99
0.064 0.061
B(0-4) C(0-4)
-9.0 -8.5
6.7 8.3
1.2 3.5
123.4 112.2
-0.2 -0.2
10.1 9.9
-5.3 -1.3
9.9 11.6
Mercury Analysis
Metals Extract B(0-4) C(0-4) B(0-4) C(0-4)
0.066 0.063 0.055 0.053
26.1 27.0 26.0 27.8
36.3 33.7 36.3 30.3
100.0 100.5 202.5 207.4
37.6 39.3 37.7 41.8
5/15/2012 7/24/2012
B(0-4) C(0-4) B(0-4) C(0-4)
55
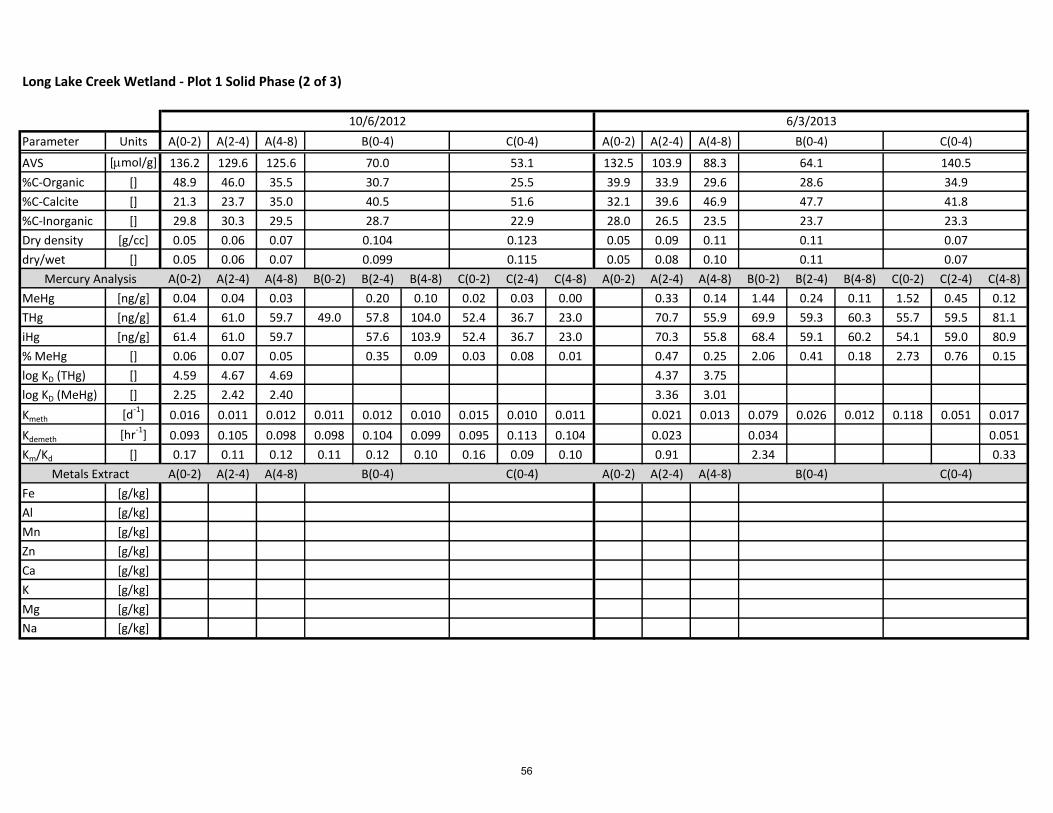
Long Lake Creek Wetland - Plot 1 Solid Phase (2 of 3)
Parameter Units A(0-2) A(2-4) A(4-8) A(0-2) A(2-4) A(4-8)
AVS [mmol/g] 136.2 129.6 125.6 132.5 103.9 88.3
%C-Organic [] 48.9 46.0 35.5 39.9 33.9 29.6
%C-Calcite [] 21.3 23.7 35.0 32.1 39.6 46.9
%C-Inorganic [] 29.8 30.3 29.5 28.0 26.5 23.5
Dry density [g/cc] 0.05 0.06 0.07 0.05 0.09 0.11
dry/wet [] 0.05 0.06 0.07 0.05 0.08 0.10
A(0-2) A(2-4) A(4-8) B(0-2) B(2-4) B(4-8) C(0-2) C(2-4) C(4-8) A(0-2) A(2-4) A(4-8) B(0-2) B(2-4) B(4-8) C(0-2) C(2-4) C(4-8)
MeHg [ng/g] 0.04 0.04 0.03 0.20 0.10 0.02 0.03 0.00 0.33 0.14 1.44 0.24 0.11 1.52 0.45 0.12
THg [ng/g] 61.4 61.0 59.7 49.0 57.8 104.0 52.4 36.7 23.0 70.7 55.9 69.9 59.3 60.3 55.7 59.5 81.1
iHg [ng/g] 61.4 61.0 59.7 57.6 103.9 52.4 36.7 23.0 70.3 55.8 68.4 59.1 60.2 54.1 59.0 80.9
% MeHg [] 0.06 0.07 0.05 0.35 0.09 0.03 0.08 0.01 0.47 0.25 2.06 0.41 0.18 2.73 0.76 0.15
log KD (THg) [] 4.59 4.67 4.69 4.37 3.75
log KD (MeHg) [] 2.25 2.42 2.40 3.36 3.01
Kmeth [d-1] 0.016 0.011 0.012 0.011 0.012 0.010 0.015 0.010 0.011 0.021 0.013 0.079 0.026 0.012 0.118 0.051 0.017
Kdemeth [hr-1] 0.093 0.105 0.098 0.098 0.104 0.099 0.095 0.113 0.104 0.023 0.034 0.051
Km/Kd [] 0.17 0.11 0.12 0.11 0.12 0.10 0.16 0.09 0.10 0.91 2.34 0.33
A(0-2) A(2-4) A(4-8) A(0-2) A(2-4) A(4-8)
Fe [g/kg]
Al [g/kg]
Mn [g/kg]
Zn [g/kg]
Ca [g/kg]
K [g/kg]
Mg [g/kg]
Na [g/kg]
0.104
0.099
0.123
0.115
B(0-4) C(0-4) B(0-4) C(0-4)
Mercury Analysis
Metals Extract
0.11 0.07
0.11 0.07
47.7 41.8
28.7 22.9 23.7 23.3
40.5 51.6
70.0 53.1 64.1 140.5
30.7 25.5 28.6 34.9
10/6/2012 6/3/2013
B(0-4) C(0-4) B(0-4) C(0-4)
56

Long Lake Creek Wetland - Plot 1 Solid Phase (3 of 3)
SUMMARY STATISTICS
Parameter Units 5/15/2012 7/24/2012 10/6/2012 6/3/2013
AVS [mmol/g] 90.5 204.2 85.4 107.6
%C-Organic [] 37.2 43.6 34.6 33.5
%C-Calcite [] 35.9 28.1 38.2 41.8
%C-Inorganic [] 26.9 28.4 27.2 24.7
Dry density [g/cc] 0.07 0.06 0.09 0.08
dry/wet [] 0.07 0.05 0.09 0.08
MeHg [ng/g] 0.29 0.40 0.07 0.91
THg [ng/g] 50.2 72.7 53.0 63.0
iHg [ng/g] 49.9 72.3 53.8 62.2
% MeHg [] 0.58 0.55 0.12 1.45
log KD (THg) [] 4.49 4.29 4.59 3.82
log KD (MeHg) [] 2.91 2.92 2.73 3.18
Kmeth [d-1] 0.012 0.007 0.013 0.066
Kdemeth [hr-1] 0.043 0.049 0.101 0.028
Km/Kd [] 0.30 0.15 0.13 1.63
Fe [g/kg] 11.2
Al [g/kg] 0.0*
Mn [g/kg] 8.7
Zn [g/kg] 0.0*
Ca [g/kg] 97.4
K [g/kg] 2.1
Mg [g/kg] 7.6
Na [g/kg] 3.8
*measured value negative
Metals Extract
Mercury Analysis
Top 4cm Average
57

West Two River Wetland - Plot 1 Sediment Porewater (1 of 2)
Parameter Units A(0-2) A(2-4) A(4-8) B(0-4) C(0-4) A(0-2) A(2-4) A(4-8) B(0-4) C(0-4) A(0-2) A(2-4) A(4-8) B(0-4) C(0-4)
Sulfate [mg/L] 0.8 0.5 0.5 5.5 0.8 2.1 1.0 0.9 0.5
Nitrate [mg/L] 2.1 1.0 0.4 3.5 2.1 0.7 0.1 0.4 0.4
Phosphate [mg/L] 1.3 2.7 2.5 2.0 0.4 0.0 0.8 0.2 0.0
Chloride [mg/L] 1.9 1.7 1.8
Ferrous Iron [mmol/L] 0.033 0.030 0.045 0.027 0.034 0.011 0.013 0.043 0.010 0.009
Sulfide [mmol/L] 3.5 13.8 10.1 20.0 19.8 4.2 5.6 3.4 3.8 4.6
Ammonium [mg/L] 6.3 3.9 2.7 2.5 1.7
DIC [mg/L] 42.4 41.3 52.0 37.6 39.6 35.0 32.7 37.7 41.1
DOC [mg/L] 22.8 23.5 21.7 22.0 24.4 18.2 17.5 18.9 21.7
SUVA [Lm-1mg-1] 3.6 3.2 3.6 4.9 4.8 4.9 4.6 5.0
MeHg [ng/L] 1.37 0.86 0.36 1.06 1.45 0.75 0.38 0.26 0.38 0.41
THg [ng/L] 1.95 1.77 1.08 2.11 2.55 2.83 1.70 1.88 3.15 1.99
iHg [ng/L] 0.58 0.91 0.72 1.06 1.10 2.08 1.32 1.62 2.76 1.58
% MeHg [] 70.3 48.6 33.0 50.1 56.8 26.5 22.1 14.1 12.2 20.8
Mercury Analysis
5/15/2012 7/24/2012 10/6/2012
Analytes
58
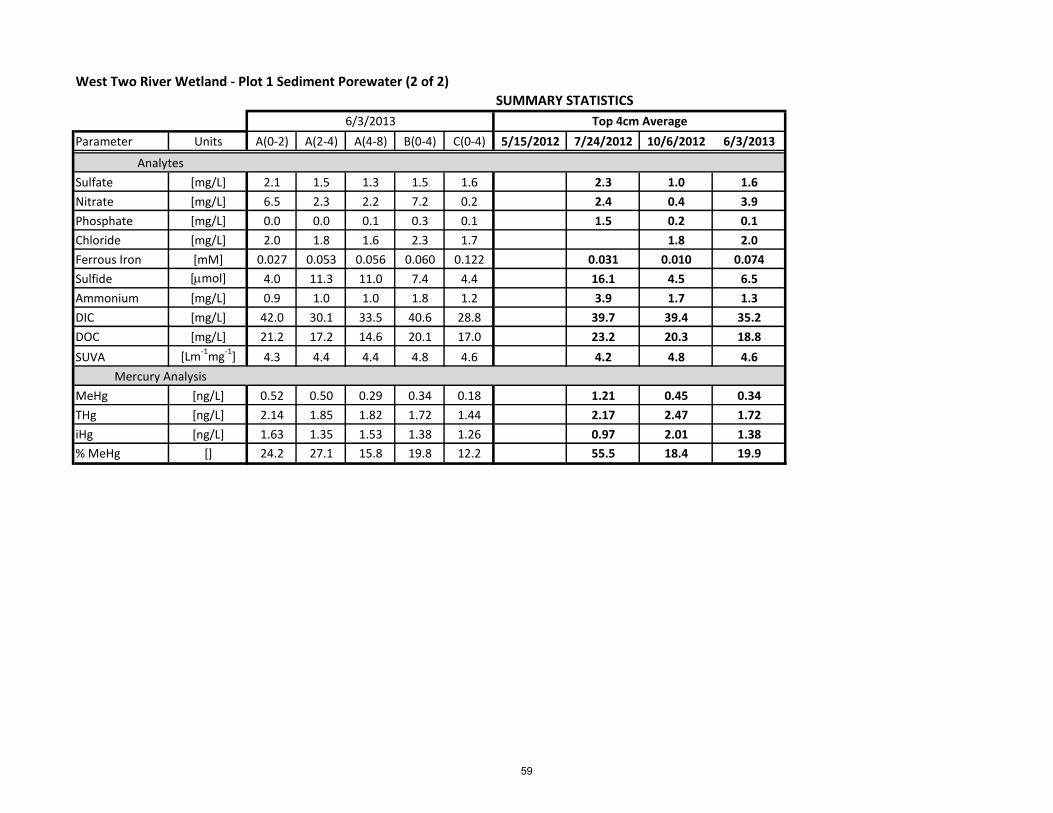
West Two River Wetland - Plot 1 Sediment Porewater (2 of 2)
SUMMARY STATISTICS
Parameter Units A(0-2) A(2-4) A(4-8) B(0-4) C(0-4) 5/15/2012 7/24/2012 10/6/2012 6/3/2013
Sulfate [mg/L] 2.1 1.5 1.3 1.5 1.6 2.3 1.0 1.6
Nitrate [mg/L] 6.5 2.3 2.2 7.2 0.2 2.4 0.4 3.9
Phosphate [mg/L] 0.0 0.0 0.1 0.3 0.1 1.5 0.2 0.1
Chloride [mg/L] 2.0 1.8 1.6 2.3 1.7 1.8 2.0
Ferrous Iron [mM] 0.027 0.053 0.056 0.060 0.122 0.031 0.010 0.074
Sulfide [mmol] 4.0 11.3 11.0 7.4 4.4 16.1 4.5 6.5
Ammonium [mg/L] 0.9 1.0 1.0 1.8 1.2 3.9 1.7 1.3
DIC [mg/L] 42.0 30.1 33.5 40.6 28.8 39.7 39.4 35.2
DOC [mg/L] 21.2 17.2 14.6 20.1 17.0 23.2 20.3 18.8
SUVA [Lm-1mg-1] 4.3 4.4 4.4 4.8 4.6 4.2 4.8 4.6
MeHg [ng/L] 0.52 0.50 0.29 0.34 0.18 1.21 0.45 0.34
THg [ng/L] 2.14 1.85 1.82 1.72 1.44 2.17 2.47 1.72
iHg [ng/L] 1.63 1.35 1.53 1.38 1.26 0.97 2.01 1.38
% MeHg [] 24.2 27.1 15.8 19.8 12.2 55.5 18.4 19.9
Mercury Analysis
6/3/2013 Top 4cm Average
Analytes
59

West Two River Wetland - Plot 1 Solid Phase (1 of 2)
*Not sampled in May 2012
Parameter Units A(0-2) A(2-4) A(4-8) A(0-2) A(2-4) A(4-8)
AVS [mmol/g] 137.6 87.7 43.2 57.8 130.6 38.9
%C-Organic [] 49.6 50.1 49.9 50.6 50.5 50.0
%C-Calcite [] 9.1 8.1 9.8 11.2 10.8 11.0
%C-Inorganic [] 41.3 41.8 40.3 38.3 38.7 38.9
Dry density [g/cc] 0.03 0.05 0.06 0.03 0.03 0.04
dry/wet [] 0.03 0.05 0.05 0.03 0.03 0.04
A(0-2) A(2-4) A(4-8) B(0-2) B(2-4) B(4-8) C(0-2) C(2-4) C(4-8) A(0-2) A(2-4) A(4-8) B(0-2) B(2-4) B(4-8) C(0-2) C(2-4) C(4-8)
MeHg [ng/g] 0.81 0.71 0.80 3.66 1.90 0.78 3.76 1.07 1.13 2.78 1.04 0.92 1.86 1.07 0.83 2.50 1.26 0.92
THg [ng/g] 80.2 91.6 143.4 79.1 84.4 149.0 83.1 117.5 188.7 172.5 198.6 195.7 141.9 160.4 197.1 147.4 153.3 216.9
iHg [ng/g] 79.4 90.9 142.6 75.5 82.5 148.2 79.3 116.5 187.6 169.7 197.6 194.8 140.1 159.4 196.3 144.9 152.1 216.0
% MeHg [] 1.01 0.78 0.56 4.62 2.25 0.53 4.53 0.91 0.60 1.61 0.52 0.47 1.31 0.67 0.42 1.70 0.82 0.43
log KD (THg) [] 4.62 4.71 5.12 4.79 5.07 5.02
log KD (MeHg) [] 2.77 2.92 3.35 3.57 3.44 3.54
Kmeth [d-1] 0.094 0.045 0.026 0.266 0.132 0.037 0.309 0.108 0.062 0.061 0.033 0.016 0.066 0.045 0.027 0.059 0.047 0.022
Kdemeth [hr-1] 0.022 0.016 0.038 0.038 0.035 0.030 0.028 0.032 0.095 0.023 0.016 0.014 0.008 0.010 0.032 0.006 0.010 0.044
Km/Kd [] 4.24 2.76 0.69 7.00 3.77 1.23 10.88 3.44 0.65 2.65 2.09 1.10 8.56 4.38 0.84 10.70 4.58 0.50
A(0-2) A(2-4) A(4-8) A(0-2) A(2-4) A(4-8)
Fe [g/kg] 10.7 9.0 7.7
Al [g/kg] 20.4 23.0 6.7
Mn [g/kg] 0.3 0.6 0.8
Zn [g/kg] 0.1 0.1 0.1
Ca [g/kg] 7.6 16.5 7.9
K [g/kg] 9.3 5.9 -0.2
Mg [g/kg] 3.9 3.8 3.4
Na [g/kg] 16.8 15.8 -0.5 -19.8 -15.7
3.8 3.6
8.3 4.8
7.1 8.7
0.1 0.1
0.4 0.7
20.5 29.0
12.5 8.2
Mercury Analysis
Metals Extract B(0-4) C(0-4) B(0-4) C(0-4)
0.049 0.043 0.034 0.040
0.050 0.044 0.034 0.041
40.3 39.5 39.9 39.3
8.6 10.2 11.1 10.7
51.0 50.3 49.0 49.9
101.5 55.9 177.7 37.7
7/24/2012 10/6/2012
B(0-4) C(0-4) B(0-4) C(0-4)
60
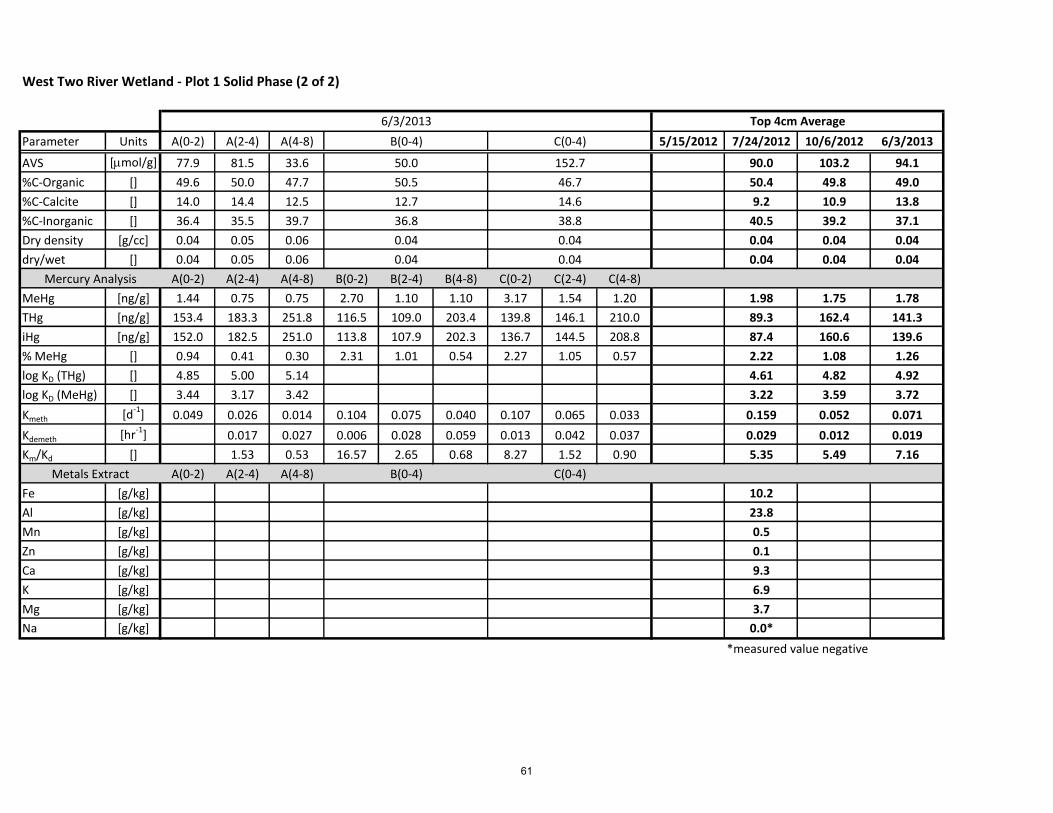
West Two River Wetland - Plot 1 Solid Phase (2 of 2)
Parameter Units A(0-2) A(2-4) A(4-8) 5/15/2012 7/24/2012 10/6/2012 6/3/2013
AVS [mmol/g] 77.9 81.5 33.6 90.0 103.2 94.1
%C-Organic [] 49.6 50.0 47.7 50.4 49.8 49.0
%C-Calcite [] 14.0 14.4 12.5 9.2 10.9 13.8
%C-Inorganic [] 36.4 35.5 39.7 40.5 39.2 37.1
Dry density [g/cc] 0.04 0.05 0.06 0.04 0.04 0.04
dry/wet [] 0.04 0.05 0.06 0.04 0.04 0.04
A(0-2) A(2-4) A(4-8) B(0-2) B(2-4) B(4-8) C(0-2) C(2-4) C(4-8)
MeHg [ng/g] 1.44 0.75 0.75 2.70 1.10 1.10 3.17 1.54 1.20 1.98 1.75 1.78
THg [ng/g] 153.4 183.3 251.8 116.5 109.0 203.4 139.8 146.1 210.0 89.3 162.4 141.3
iHg [ng/g] 152.0 182.5 251.0 113.8 107.9 202.3 136.7 144.5 208.8 87.4 160.6 139.6
% MeHg [] 0.94 0.41 0.30 2.31 1.01 0.54 2.27 1.05 0.57 2.22 1.08 1.26
log KD (THg) [] 4.85 5.00 5.14 4.61 4.82 4.92
log KD (MeHg) [] 3.44 3.17 3.42 3.22 3.59 3.72
Kmeth [d-1] 0.049 0.026 0.014 0.104 0.075 0.040 0.107 0.065 0.033 0.159 0.052 0.071
Kdemeth [hr-1] 0.017 0.027 0.006 0.028 0.059 0.013 0.042 0.037 0.029 0.012 0.019
Km/Kd [] 1.53 0.53 16.57 2.65 0.68 8.27 1.52 0.90 5.35 5.49 7.16
A(0-2) A(2-4) A(4-8)
Fe [g/kg] 10.2
Al [g/kg] 23.8
Mn [g/kg] 0.5
Zn [g/kg] 0.1
Ca [g/kg] 9.3
K [g/kg] 6.9
Mg [g/kg] 3.7
Na [g/kg] 0.0*
*measured value negative
C(0-4)
Mercury Analysis
Metals Extract B(0-4)
0.04 0.04
0.04 0.04
36.8 38.8
12.7 14.6
50.5 46.7
50.0 152.7
6/3/2013 Top 4cm Average
B(0-4) C(0-4)
61
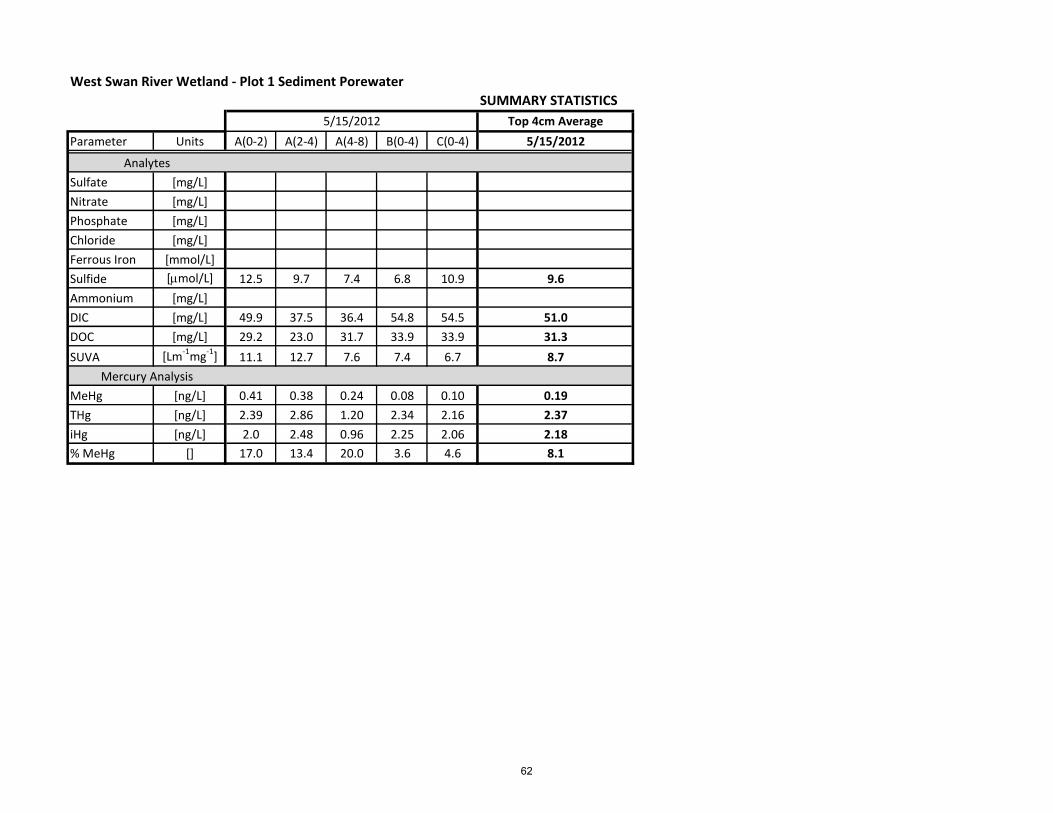
West Swan River Wetland - Plot 1 Sediment Porewater
SUMMARY STATISTICS
Top 4cm Average
Parameter Units A(0-2) A(2-4) A(4-8) B(0-4) C(0-4) 5/15/2012
Sulfate [mg/L]
Nitrate [mg/L]
Phosphate [mg/L]
Chloride [mg/L]
Ferrous Iron [mmol/L]
Sulfide [mmol/L] 12.5 9.7 7.4 6.8 10.9 9.6
Ammonium [mg/L]
DIC [mg/L] 49.9 37.5 36.4 54.8 54.5 51.0
DOC [mg/L] 29.2 23.0 31.7 33.9 33.9 31.3
SUVA [Lm-1mg-1] 11.1 12.7 7.6 7.4 6.7 8.7
MeHg [ng/L] 0.41 0.38 0.24 0.08 0.10 0.19
THg [ng/L] 2.39 2.86 1.20 2.34 2.16 2.37
iHg [ng/L] 2.0 2.48 0.96 2.25 2.06 2.18
% MeHg [] 17.0 13.4 20.0 3.6 4.6 8.1
Mercury Analysis
5/15/2012
Analytes
62

West Swan River Wetland - Plot 1 Solid Phase
SUMMARY STATISTICS
Top 4cm Average
Parameter Units A(0-2) A(2-4) A(4-8) 5/15/2012
AVS [mmol/g] 8.3 3.9 4.7 5.8
%C-Organic [] 15.7 13.1 7.6 13.5
%C-Calcite [] 3.0 2.7 1.7 2.6
%C-Inorganic [] 81.3 84.2 90.7 83.8
Dry density [g/cc] 0.24 0.35 0.63 0.31
dry/wet [] 0.21 0.29 0.46 0.27
A(0-2) A(2-4) A(4-8)
MeHg [ng/g] 1.14 0.59 0.96 0.80
THg [ng/g] 75.4 72.0 57.7 81.8
iHg [ng/g] 74.3 71.4 56.8 81.0
% MeHg [] 1.51 0.81 1.66 0.98
log KD (THg) [] 4.54
log KD (MeHg) [] 3.62
Kmeth [d-1] 0.114 0.047 0.041 0.104
Kdemeth [hr-1] 0.042 0.108 0.000 0.072
Km/Kd [] 2.69 0.44 1.64
A(0-2) A(2-4) A(4-8)
Fe [g/kg]
Al [g/kg]
Mn [g/kg]
Zn [g/kg]
Ca [g/kg]
K [g/kg]
Mg [g/kg]
Na [g/kg]
0.109
0.076
1.42
0.124
0.064
1.94
0.26 0.29
Mercury Analysis
Metals Extract B(0-4) C(0-4)
B(0-4) C(0-4)
0.75
87.6
86.8
0.85
0.79
83.2
84.0
0.94
2.5 2.6
83.4 85.4
0.30 0.35
14.1 12.1
5/15/2012
B(0-4) C(0-4)
4.8 6.4
63