© boardworks ltd 2005 1 of 36 © boardworks ltd 2005 1 of 36 as-level maths: core 2 for edexcel...
TRANSCRIPT

© Boardworks Ltd 20051 of 36 © Boardworks Ltd 20051 of 36
AS-Level Maths: Core 2for Edexcel
C2.8 Integration
This icon indicates the slide contains activities created in Flash. These activities are not editable.
For more detailed instructions, see the Getting Started presentation.

© Boardworks Ltd 20052 of 36
Co
nte
nts
© Boardworks Ltd 20052 of 36
Evaluating definite integrals
Evaluating definite integrals
The area under a curve
The trapezium rule
Examination-style questions

© Boardworks Ltd 20053 of 36
Definite and indefinite integrals
When we find the indefinite integral of a function the answer takes the form of an expression plus a constant of integration.
When we find a definite integral of a function we find the integral between two given limits to give a numerical result.
For example, the definite integral of 6x2 + 5 between x = 1 and x = 3 is written as
It is evaluated as follows:32 + 5 +x x c 1
3
3 2
1(6 + 5)x dx
2(6 + 5) =x dx13
Notice that square brackets are used here …
3 3= (2( ) + 5( )+ )3 (2( ) +1 + )3 5(1)c c
= 69 7= 62
…and rounded brackets here.
c cancels out.

© Boardworks Ltd 20054 of 36
Definite integration
When evaluating a definite integral we can ignore constants of integration because they cancel out.
In general: '( ) = ( ) = ( ) ( )b b
aaf x dx f x f b f a
3 2
1Evaluate x dx
333 2
11
=3
xx dx
3 3(3) (1)
=3 3
13= 9
23= 8

© Boardworks Ltd 20055 of 36
Co
nte
nts
© Boardworks Ltd 20055 of 36
The area under a curve
Evaluating definite integrals
The area under a curve
The trapezium rule
Examination-style questions

© Boardworks Ltd 20056 of 36
The area under a velocity-time graph
The following graph shows how the velocity of a car changes over a period of 40 seconds.
0time (s)
velo
city
(m
/s)
5 10 15 20 25 30 35 40
2
4
6
8
0
The area of each strip represents the distance travelled during a small period of time.
What does the area under the graph represent?
Consider the area of a thin strip of the graph.
The area of the strip = velocity × time = distance
If the strip is thin enough it can be treated as if it is rectangular.
The total area is the total distance travelled.

© Boardworks Ltd 20057 of 36
The area under a velocity-time graph
For example, this graph shows the velocity-time graph for a car in the first 10 seconds after it moves off from rest.
To find the distance travelled by the car over this time we need to find the area under the curve.
0time (s)
velo
city
(m
/s)
2 4 6 8 10
2
4
6
8
0
In many situations the acceleration will not be constant and the velocity-time graph will be curved.
It is possible to estimate this area by dividing it into thin vertical strips and summing their areas.
However, if we know the velocity of the car as a function of time we can find the area moreaccurately by integration.

© Boardworks Ltd 20058 of 36
The area under a curve
To see why the area under a curve can be found by integration, consider a continuous curve y = f(x).
Let A be the area shown between the curve y = f(x) and the x-axis from x = 0 to x.
Now, imagine moving a small distance along the x-axis, δx.
We can call the corresponding increase in area δA and corresponding increase in y δy.
Let’s look more closely at this increase in area.
x
A
x x+δx
δA
y
0
δy

© Boardworks Ltd 20059 of 36
The area under a curve
We can see that δA must be between yδx and (y + δy)δx.
δx
δAy y + δy
δyWe can write this as
yδx < δA < (y + δy)δx
Dividing through by δx gives
Ay y y
x
Now consider the limit as δx and δy → 0:
0lim =x
Ay
x
so =dA
ydx
Integrating both sides with respect to x gives
=A y dx

© Boardworks Ltd 200510 of 36
The area function
The area under a curve y = f(x) is therefore a function of x, which we can write as A(x).
A(x) is the area under the curve from x = 0 to x.
Look what happens when the area function y = A(x) is plotted for some function y = f(x) as x varies.
© Boardworks Ltd 200511 of 36
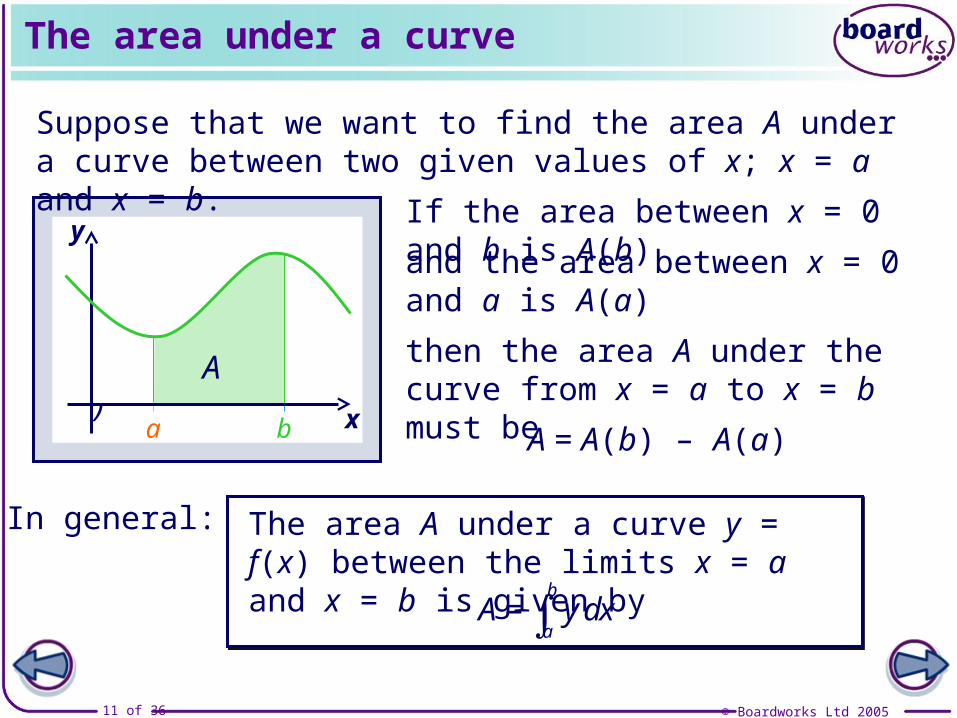
A(b)A(a) A
The area under a curve
y
xa b
Suppose that we want to find the area A under a curve between two given values of x; x = a and x = b.
The area A under a curve y = f(x) between the limits x = a and x = b is given by =
b
aA y dx
If the area between x = 0 and b is A(b)
and the area between x = 0 and a is A(a)
then the area A under the curve from x = a to x = b must be
A = A(b) – A(a)
In general:

© Boardworks Ltd 200512 of 36
The area under a curve
Find the area bounded by the curve y = 2x2 + 1, the x-axis and the lines x = –1 and x = 3.
Start by sketching the graph of y = 2x2 + 1 and shading the required area.
–1 3
A
y = 2x2 + 1
3 2
1= (2 1)A x dx
33
1
2= +
3
xx
3 32(3) 2( 1)= + 3 1
3 3
53= 21
23= 22
The final solution can be written as 22 units2.23
y
x

© Boardworks Ltd 200513 of 36
y
x0 6
Areas below the x-axis
Suppose the area that we are trying to find is below the x-axis. For example:
Find the area bounded by the curve y = x(x – 6) and the x-axis.
This area is given by:6 2
0= ( 6 )A x x dx
63 213 0
= 3x x
3 213= (6) 3(6) 0
= 36
The calculated area is negative because it is below the x-axis.
We write the actual area as 36 units2.
A
y = x(x – 6)

© Boardworks Ltd 200514 of 36
y
x–3 3
Areas below the x-axis
In some cases the area may fall partly below the x-axis and partly above. For example:
Find the area between y = 9x – x3 and the x-axis.
Factorizing gives
y = x(3 + x)(3 – x)
So the graph cuts the x-axis at x = –3, x = 0 and x = 3.
The required area can now be shaded in.
0
Also, x3 is negative so the curve is -shaped.

© Boardworks Ltd 200515 of 36
Areas below the x-axis
Look what happens if we try to find the area under y = 9x – x3 between –3 and 3.
3 33 2 49 12 4 33
(9 ) =x x dx x x
2 4 2 49 91 1
2 4 2 4= (3) (3) ( 3) ( 3) 1 14 4= 20 20
= 0
From the shading on our graph we know the area isn’t 0.
What has happened is that the negative area below the graph has cancelled out the positive area above the graph.
To avoid this we have to find the areas above and below the x-axis separately and then add the two areas together.

© Boardworks Ltd 200516 of 36
Areas below the x-axis
Let’s call the two areas A1 and A2.
y
x–3 30A1
A2
0 31 3
= (9 )A x x dx
2 49 12 4= 0 ( 3) ( 3)
02 49 12 4 3
= x x
14= 20
3 32 0
= (9 )A x x dx
2 49 12 4= (3) (3) 0
32 49 12 4 0
= x x
14= 20
The total area = A1 + A2 = 40 units2.12

© Boardworks Ltd 200517 of 36
x
y
The area between a curve and a line
Suppose we want to find the area between a curve and a line. For example:
Find the area bounded by the curve y = x2 + 1 and the line y = 2x + 4.
Start by sketching the graph, and shading the required area.
Next, we have to find thex-coordinates of the points where the curve and the line intersect.
Solving: x2 + 1 = 2x + 4
x2 – 2x –3 = 0
(x +1)(x – 3) = 0
the curve and the line intersect when x = –1 and x = 3.
–1 3
y = x2 + 1
y = 2x + 4
© Boardworks Ltd 200518 of 36
x
y
The area between a curve and a line
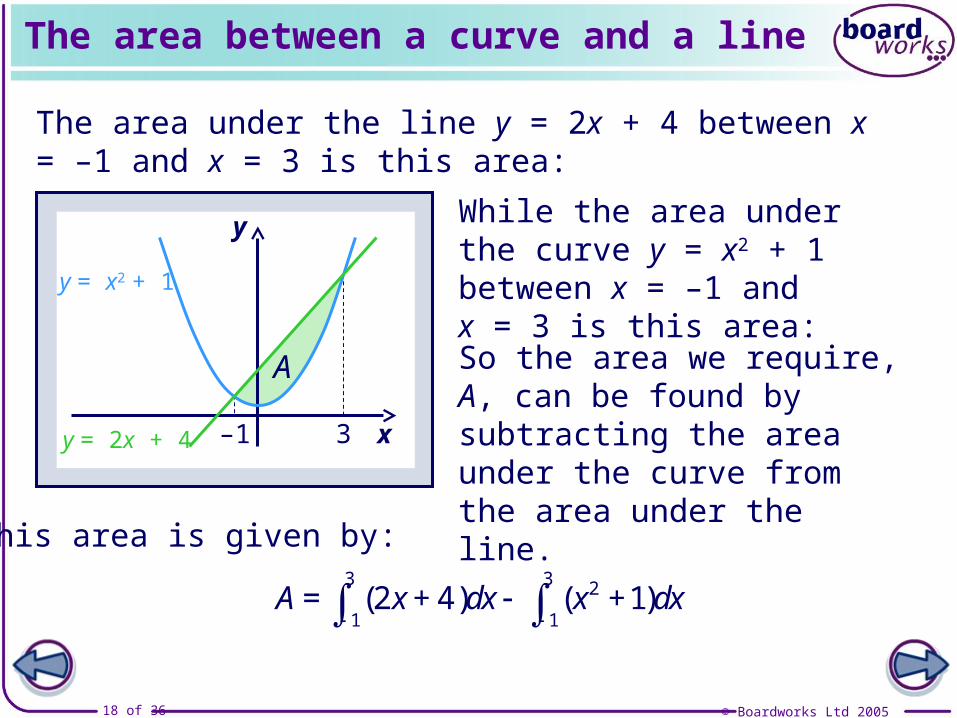
The area under the line y = 2x + 4 between x = –1 and x = 3 is this area:
While the area under the curve y = x2 + 1 between x = –1 and x = 3 is this area:
So the area we require, A, can be found by subtracting the area under the curve from the area under the line.
3 3 2
1 1= (2 + 4) ( +1)A x dx x dx
This area is given by:
A
3–1
y = x2 + 1
y = 2x + 4

© Boardworks Ltd 200519 of 36
The area between a curve and a line
Since the limits are the same these two integrals can be combined to give
3 2
1= (2 + 4) ( +1)A x x dx
3 2
1= ( + 2 + 3)x x dx
33 213 1
= + + 3x x x
13= 9 + 9 + 9 +1 3
23= 9 1
23=10
So the required area is 10 units2.23

© Boardworks Ltd 200520 of 36
The area between two curves
The method used to find the area between a curve and a line can also be used to find the area between two curves.
In general:
The area A between two curves y = f(x) and y = g(x) is given by
= ( ) ( )b
aA f x g x dx
y
x
For example:
Find the area bounded by the curves y = 3 – 2x2 and y = – 1 – x2.
A
a b
y = f(x)
y = g(x)

© Boardworks Ltd 200521 of 36
A
The area between two curves
Start by equating the curves to find out where they intersect.y
x
3 – 2x2 = – 1 – x2
4 – x2 = 0
(2 – x)(2 + x) = 0
So the curves intersect at x = 2 and x = –2.
2 2 2
2(3 2 ) ( 1 )x x dx
2 2
2= (4 )x dx
8 83 3= (8 ) ( 8 )
223=10 units
Simplify the integral:231
3 2= 4A x x
Find the area:
1 13 3= 5 5
y = 3 – 2x2
y = – 1 – x2

© Boardworks Ltd 200522 of 36
Co
nte
nts
© Boardworks Ltd 200522 of 36
The trapezium rule
Evaluating definite integrals
The area under a curve
The trapezium rule
Examination-style questions

© Boardworks Ltd 200523 of 36
Approximating the area under a curve
Sometimes the area under a curve cannot be found by integration.
This may be because we cannot find the integral of the equation of the curve or because we need to find the area under a curve produced from experimental data.
In these cases we can use a method to approximate the area under the curve.
One such method is called the trapezium rule.
It works by dividing the area under a curve into trapeziums and calculating their areas. Remember:
The area of a trapezium = 12 ( )a b h
a
b
h ab
hor

© Boardworks Ltd 200524 of 36
The trapezium rule
To demonstrate the method consider the area under the curve y = x2 + 1.

© Boardworks Ltd 200525 of 36
x
y
a b
The trapezium rule
The more trapeziums the area is divided into the more accurate the estimate.
Suppose we wish to find the area under a curve y = f(x) between x = a and x = b.
y0 y1 y2 y3 y4
We can divide the area into four trapeziums of equal width h.
The parallel sides of the four trapeziums are given by the five ordinates y0, y1, y2, y3 and y4.
hhhh
In general, if there are n trapeziums there will be n + 1 ordinates.

© Boardworks Ltd 200526 of 36
The trapezium rule
The approximate area using the trapezium rule is:
1 1 1 10 1 1 2 2 3 3 42 2 2 2( ) ( + )+ ( + )+ ( + )+ ( + )
b
af x dx h y y h y y h y y h y y
10 1 1 2 2 3 3 42= ( + + + + + + + )h y y y y y y y y
10 1 2 3 42= ( + 2 + 2 + 2 + )h y y y y y
The ordinates have to be spaced out evenly so that the width of each trapezium is the same.
for n trapeziums of equal width h: =b a
hn
In general, the trapezium rule with n trapeziums is:
10 1 2 12( ) ( + 2 + 2 +...+ 2 + )
b
n naf x dx h y y y y y

© Boardworks Ltd 200527 of 36
The trapezium rule
Use the trapezium rule with four trapeziums to estimate the value of
State whether this is an overestimate or an underestimate of the actual area.
2
1
1dx
x
We can use a table to record the value of each ordinate.
The width h of each trapezium =2 1
= 0.254
0.50.5710.6670.81
21.751.51.251x
1=y
x
y4y3y2y1y0

© Boardworks Ltd 200528 of 36
The trapezium rule
We can now work out the area using
10 1 2 12( ) ( + 2 + 2 +...+ 2 + )
b
n naf x dx h y y y y y
with h = 0.25 and the ordinates given by the table, so:
2
1
1dx
x 1
×0.25× 1+ 2(0.8)+ 2(0.667)+ 2(0.571)+ 0.52
= 0.70 (to 2 d.p.)
We can show whether this is an underestimate or an overestimate by sketching the area given by the trapezium rule on the graph of
1=y
x

© Boardworks Ltd 200529 of 36
The trapezium rule
x
y
We can see from this sketch that the approximation given by the trapezium rule is a slight overestimate of the actual area.
21

© Boardworks Ltd 200530 of 36
Overestimates and underestimates
In general, when the gradient of the graph is increasing over the given interval the area given by the trapezium rule will be an overestimate of the actual area.
When the gradient of the graph is decreasing over the given interval the area given by the trapezium rule will be an underestimate of the actual area.

© Boardworks Ltd 200531 of 36
Co
nte
nts
© Boardworks Ltd 200531 of 36
Examination-style questions
Evaluating definite integrals
The area under a curve
The trapezium rule
Examination-style questions

© Boardworks Ltd 200532 of 36
Examination-style question 1
The following diagram shows the curve with equation y = x2 – 4x + 5 and the line y = 8 – 2x.
The line and the curve intersect at the points A and B.
x
y
A
BR
a) Find the coordinates of A and B.
b) Find the area of the shaded region R.

© Boardworks Ltd 200533 of 36
Examination-style question 1
a) Equating the given equations:
x2 – 4x + 5 = 8 – 2x
x2 – 2x – 3 = 0
(x + 1)(x – 3) = 0
x = –1 or x = 3
When x = –1, y = 10 and when x = 3, y = 2.
The coordinates of A are (–1, 10) and the coordinates of B are (3, 2).
b) The area of R is given by3 3 2
1 1= (8 2 ) ( 4 + 5)A x dx x x dx

© Boardworks Ltd 200534 of 36
Examination-style question 1
Combining these gives
3 2
1= ( + 2 + 3)A x x dx
33 213 1
= + + 3x x x
13= 9 + 9 + 9 +1 3
23= 9 1
23=10
So the required area is 10 units2.23

© Boardworks Ltd 200535 of 36
Examination-style question 2
a) Use the trapezium rule with 4 ordinates to estimate to 2 decimal places the value of
b) State whether the estimate given in part a) is an overestimate or underestimate of the area under the curve y = tan x between x = 0 and x = .3
3
0tan x dx
Using a table to record the value of each ordinate:
The width h of each trapezium = 3 =3 9
1.7320.8390.3640y = tan x
0x 9 2
9
3

© Boardworks Ltd 200536 of 36
Examination-style question 2
We can now work out the area using
10 1 2 12( ) ( + 2 + 2 +...+ 2 + )
b
n naf x dx h y y y y y
× 0 + 2(0.364)+ 2(0.839)+1.73218
= 0.72 (to 2 d.p.)
b) Sketching the curve y = tan x shows that the value given in a) is a slight overestimate of the actual area.
with h = and the ordinates given by the table, so: 9
3
0tan x dx
0 x
y
3