company name : nature outdoor recreation and resort (natour) company address : hutan simpan ayer...
TRANSCRIPT

Nature Outdoor Recreation And Resort
(NATOUR)

NATOUR Background
Company Name : Nature Outdoor Recreation and Resort (NATOUR)
Company Address : Hutan Simpan Ayer Hitam, 47100 Puchong, Selangor
Type of Company : Services
Ownership of Company : Shareholder
Capital of Company : Based on share of owner of company
1. Director – 22%
2. Deputy of director – 21%
3. Others – 18%
Web : www.natour.net.my
Office Number : 03 12345678

Organization NATOUR
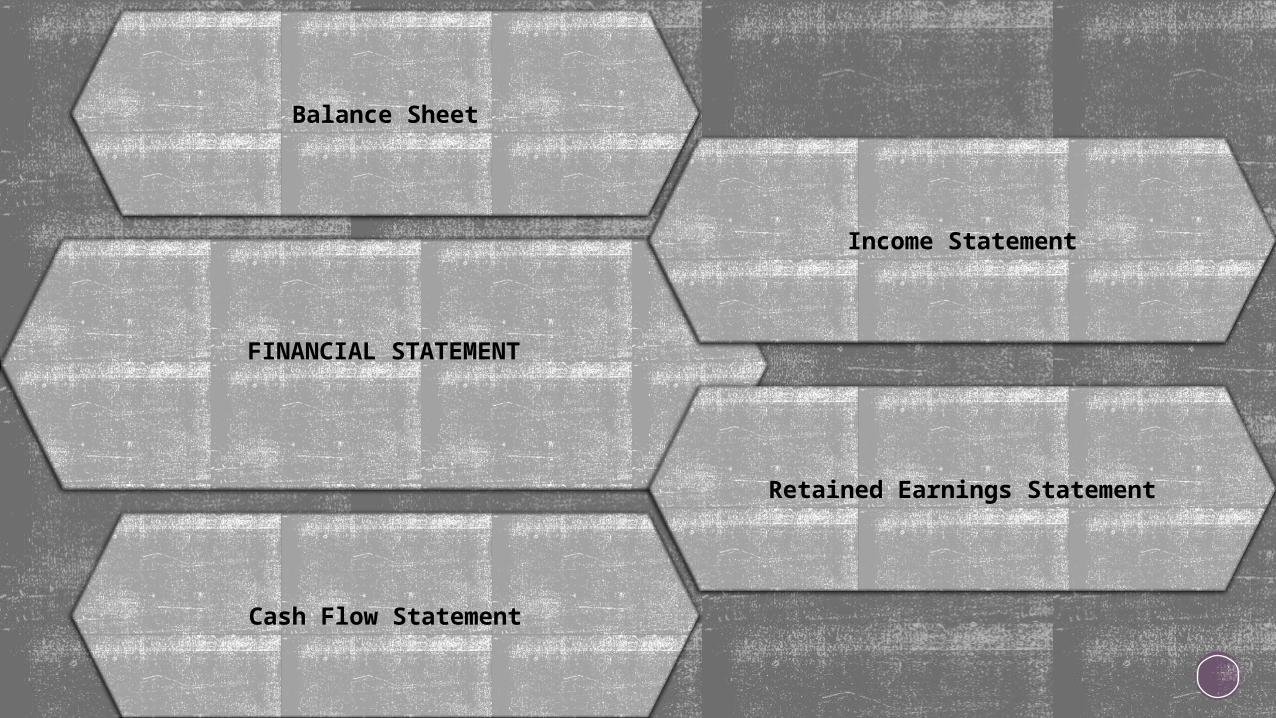
FINANCIAL STATEMENT
Balance Sheet
Income Statement
Retained Earnings Statement
Cash Flow Statement

Balance Sheet
NATOUR Balance Sheet 2013 2012 ChangeAssetsCurrent Assets
CashAccount Receivable
Fixed AssetsPropertyEquipmentVehicle
5,733,100300,000
13,000,0001,485,0001,485,000
4,000,000200,000
13,000,0001,500,0001,500,000
1,733,100100,000
--15,000-15,000
Total Assets 21,973,100 20,200,000 1,773,100 Liabilities And EquityLiabilitiesCurrent Liabilities
Account PayableAccrued Salaries
Long-Term LiabilitiesMortgagesL-T Bank Debt
1,275,000300,000
9,400,0003,730,000
1,500,000429,000
10,000,0004,000,000
-225,000-129,000
-600,000-270,000
Total Liabilities 14,730,000 15,929,000 -1,199,000 Equity
Paid-In CapitalRetained Earnings
4,000,0003,273,100
4,000,000271,000
-3,002,100
Total Equity 7,273,100 4,271,000 3,002,100Total Liabilities And Equity 21,973,100 20,200,000 1,773,000

Income Statement
NATOUR Income Statement Revenue
Service salesInvestment income
2013
4,000,0001,140,000
2012
500,000300,000
Change
3,500,000840,000
Total revenue 5,140,000
800,000
4,340,000
ExpensesSalariesOperating Expenses DepreciationInterest paid
300,000100,00030,000
300,000100,000
-
--
30,000
Total expenses 430,000 400,000
30,000
Operating income 4,710,000 400,000 4,310,000Interest expense 100,000 100,000 -Taxes (29%) 1,336,900 29,000 1,307,900
Net income 3,273,100
271,000
3,002,100

Retained Earnings Statement
NATOUR Retained Earnings Statement
Retained Earnings, 2012Add Income For 2012Subtract Withdrawal (Dividends)
271,00000
Retained Earnings, 2013 3,273,100

Cash Flow Statement
NATOUR Cash Flow Statement 2013
Cash Flow from Operating Activities:Net profits after taxesDepreciationIncrease in Account ReceivableDecrease in Account PayableDecrease in Accrued Salaries
3,273,10030,000
(100,000)(225,000)(129,000)
Cash Flow from Investing Activities:
Decrease in gross fixed assets
30,000
2,849,100
Cash Flow from Financing Activities:
Decrease in mortgageDecrease in L-T DebtChange in stockholders’ equityDividends paid
(600,000)(270,000)
--
30,000
Net Increase in Cash for the Year
(870,000)
2,009,100

RATIO ANALYSIS

Liquidity Ratio
Increase 1.65x (43.08%)In this two years, our company has increase the ability to pay
our short term current liabilities.

Liquidity Ratio
Our QR is same as CR because our company doesn’t has inventory.
Services-based company.

Efficiency Ratio
Increase 118.64 (533.63%)Customers take shorter
period to pay their bills in 2013 compare to 2012.

Efficiency Ratio
Increase 0.2188 (268.47%)Our company is using our fixed asset more extensively on 2013
compare to 2012 to generate sales.

Efficiency Ratio
2012 2013
Increase 0.157x (728%)Our company is using our total asset more extensively on 2013
compare to 2012 to generate sales.

Leverage Ratio
2012 2013
Decrease 12%Total asset covered by total
debt is decreasing from 2012 to 2013

Leverage Ratio
2012 2013
Increase 43.1x (1177.5%)The company ability to pay debt is
increasing from 2012 to 2013. So our company don’t have difficulty to
additional fund.
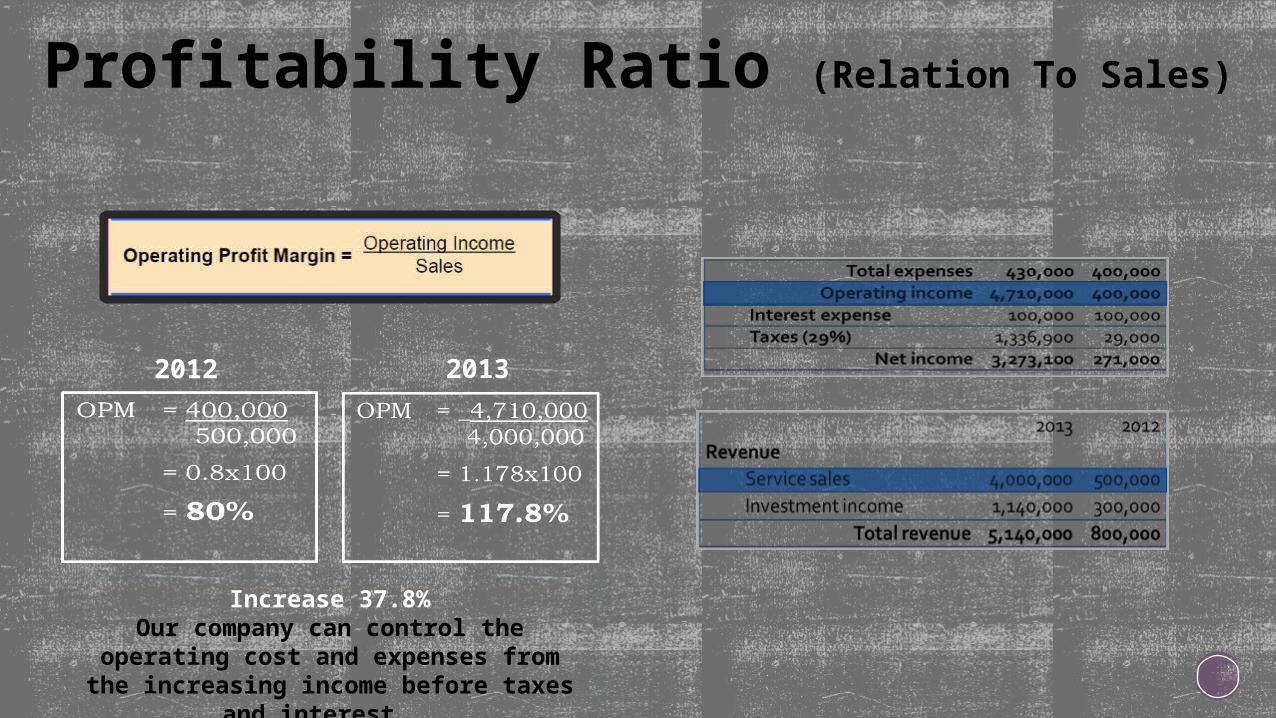
Profitability Ratio (Relation To Sales)
2012 2013
Increase 37.8%Our company can control the
operating cost and expenses from the increasing income before taxes
and interest.

Profitability Ratio (Relation To Sales)
2012 2013
Increase 27.6% Our company can control the
operating cost and expenses from the increasing income after taxes
and interest.

Profitability Ratio (Relation To Investment)
2012 2013
Increase 19% (1050%)Our company ability to generate
operating income with our assets is increasing

Profitability Ratio (Relation To Investment)
2012 2013
Increase 13.56%Our company ability to generate net
income with our assets is increasing.

Profitability Ratio (Relation To Investment)
2012 2013
Increase 38.7%The rate of return on the stockholder investment is
increasing.
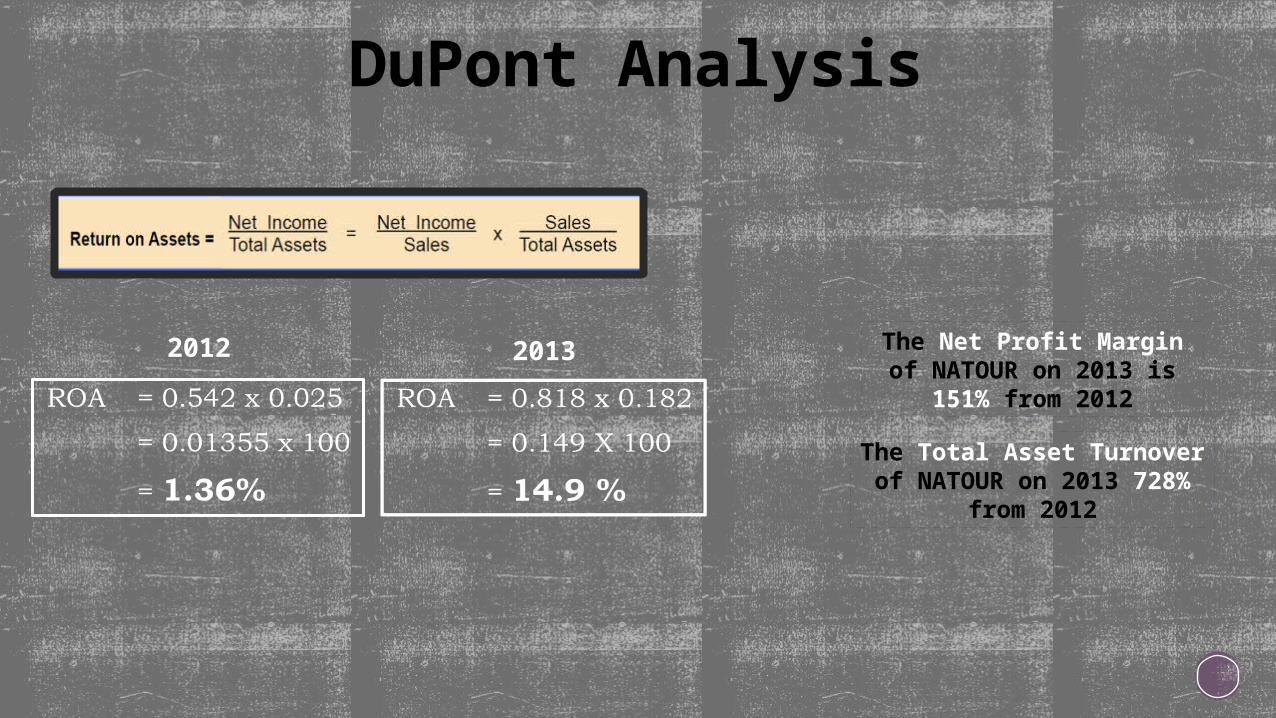
DuPont Analysis
2012 2013 The Net Profit Margin of NATOUR on 2013 is
151% from 2012
The Total Asset Turnover of NATOUR on 2013 728%
from 2012

DuPont Analysis
2012 2013
In conclusion, our company :-Have good management over company’s cost and expenses
Have efficient utilization of company’s assetReasonable usage of debt financing, so our company can still meet our debt obligation even during bad times.