· pdf file• completed design and construction of the new lindis crossing substation, ......
TRANSCRIPT

AuroraE N E R G Y L I M I T E D

ContentsChairman and Chief Executive’s report 2
Trend statement 8
Statement of service performance 9
Network overview 12
Network performance 13
Directors’ report 14
Information on the directors 18
Financial contents 19
Financial statements 20
Notes to the financial statements 26
Independent auditor’s report 49
Company directory 52
Highlightsfor the year ended 30 June 2015
• Aurora Energy continues to be the main contributor of cash to our shareholder Dunedin City Holdings Limited. This year, we paid equivalent dividends of $10 million
• Total equivalent dividends paid to the shareholder since Aurora Energy’s inception are $141.8 million
• Revenue increased by $6.6 million to $99.5 million
• Assets increased in value by 6 percent to $413.9 million
• Energy received into the network was 1,408 gigawatt hours for the year
• Consumer connections increased by 1% to 85,692
• Revised 10-year asset management plan to increase maintenance and renewal capital on the Dunedin network and growth capital for new connections on Central Otago network
• Increased network capacity by 2% to 928 megavolt amperes
• Completed design and construction of the new Lindis Crossing substation, which was livened in March 2015
• Progressed year three of a major, five-year project to modernise and upgrade our network management, control and communication systems, entering into a contract with GE for provision of the major software system
• Completed an increased level of planned pole replacements and major vegetation management projects throughout Dunedin and Central Otago
Front cover: construction of Lindis Crossing substation
AURORA ENERGY 2015 ANNUAL REPORT 1
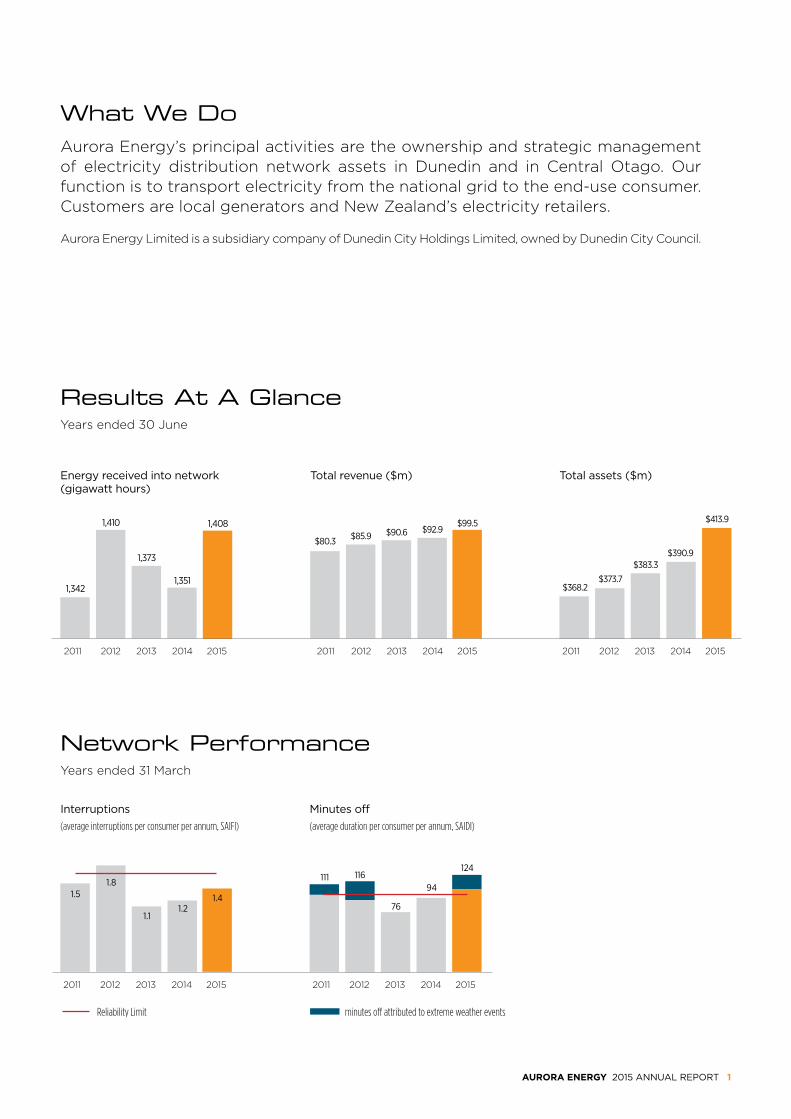
Results At A Glance Years ended 30 June
2011 2012 2013 2014 2015
Energy received into network (gigawatt hours)
2011 2012 2013 2014 2015 2011 2012 2013 2014 2015
Total revenue ($m) Total assets ($m)
$390.9
$413.9
$368.2$373.7
$383.3
$99.5
$80.3 $85.9 $90.6 $92.91,408
1,342
1,410
1,351
1,373
Network Performance Years ended 31 March
2011 2012 2013 2014 2015 2011 2012 2013 2014 2015
Interruptions
(average interruptions per consumer per annum, SAIFI)
Minutes off
(average duration per consumer per annum, SAIDI)
1.51.8
1.2
111
76
94
124
Reliability Limit
1.4
1.1
What We DoAurora Energy’s principal activities are the ownership and strategic management of electricity distribution network assets in Dunedin and in Central Otago. Our function is to transport electricity from the national grid to the end-use consumer. Customers are local generators and New Zealand’s electricity retailers.
Aurora Energy Limited is a subsidiary company of Dunedin City Holdings Limited, owned by Dunedin City Council.
116
minutes off attributed to extreme weather events

Energy powers everyday life. We are proud to supply the electricity infrastructure that underpins the economic and social well-being of the communities we serve in Dunedin, Central Otago and Queenstown Lakes.
Aurora Energy has made substantial progress during the financial year ended 30 June 2015 (FY15) to meet growing demand, renew assets due for replacement and make improvements to the risk profile of its infrastructure assets.
2015 FINANCIAL RESULTS
For the financial year ended 30 June 2015 (FY15), total revenue increased by 7 percent to $99.5 million (FY14: $92.9 million). The increase reflects a combination of growth in consumer connections in Central Otago, the recovery of higher transmission charges in the fourth quarter, and higher energy demand.
Trading profit before tax and subvention payments increased by 2 percent to $18.4 million (FY14: $18.0 million). Net profit before the after-tax value of subvention payments was $13.4 million (FY14: $12.9 million).
Net profit after tax and subvention payments was $8.2 million (FY14: $7.7 million), after a pre-tax subvention payment of $7.3 million (equivalent dividend FY15: $5.3 million, FY14: $5.3 million).
Aurora Energy’s financial position remains strong and the company is well-placed to make the planned network infrastructure investments. Capital expenditure during FY15 increased by 66 percent to $35.4 million (FY14: $21.3 million) and FY15 year-end term borrowings increased by 12 percent to $155.5 million (FY14: $138.8 million). The increases in capital expenditure and borrowings reflect the higher level of asset investment as signalled in Aurora Energy’s ten-year asset management plan.
Total assets increased by 6 percent to $413.9 million (FY14: $390.9 million).
DIVIDENDS
Aurora Energy paid dividends to its shareholder, Dunedin City Holdings Limited, that were equivalent to $10.0 million for the year under review, the same as the previous year (FY14: $10.0 million). Aurora Energy has paid total equivalent dividends of $141.8 million to its shareholder since its inception in 2003.
As a provider of an essential service,
Aurora Energy has a responsibility to consumers and under regulation to provide safe, reliable electricity infrastructure. The reduction in allowable revenues by 4.3% over the current five-year regulatory period and planned asset investment over the same period has potential to constrain the level of future dividends the company is able to pay.
REGULATORY REVIEW
As an electricity distributor, Aurora Energy operates in a highly regulated environment. The Commerce Commission sets the limits on maximum price and targets and incentives for service quality. The Electricity Authority determines the pricing structure and market rules that electricity distributors must follow in charging consumers for supply.
The Commerce Commission’s price-quality path regulation operates in five-year regulatory control periods. After developing economic models for use in determining price and quality limits in early 2014, the Commerce Commission released its draft default price-quality paths for consultation in July 2014. The Commerce Commission then finalised price and quality settings for the next five years for 16 electricity distributors including
CHAIRMAN AND CHIEF EXECUTIVE’S REPORTfor the year ended 30 June 2015
2 AURORA ENERGY 2015 ANNUAL REPORT

Aurora Energy in November 2014.
Aurora Energy’s maximum allowable revenue was set at $56.5 million from 1 April 2015. This reduction of 4.3 percent from last year, represented an improved outcome compared to the draft determination of a reduction of 6.5 percent, and includes the effect of a reduction in the weighted average cost of capital (or WACC) used for regulated businesses from 7.60 to 7.19 percent. For the subsequent four years ending 31 March from 2016 to 2020, Aurora Energy will only be allowed to increase pricing by a rate equivalent to the Consumer Price Index (CPI).
The Commerce Commission has made some positive changes to their forecast and economic models as a result of submissions by Aurora Energy and other lines businesses. The outcome however, means that approximately $6.5 million of planned work will not be compensated for in pricing over the regulatory period. Aurora Energy’s forecast operational expenditure allowance increased by 3.0 percent, only partially reflecting increased expenditure on vegetation and pole remediation that commenced in FY14.
The quality path remains similar to that which has applied in the previous regulatory period, with
SAIDI and SAIFI maintained as the quality of supply measures, quality limits determined by reference to historic reliability performance, normalisation for maximum event days, and the overarching requirement to comply with the quality path for a minimum of two out of three years.
The Commission’s general approach to the quality path results in a ‘sinking lid’ quality target. Aurora Energy’s investment profile significantly influences the extent of planned outages required on the network. These factors, and more stringent health and safety practice involving greater use of de-energised work, could ultimately result in quality targets that are unsustainable.
During the year, the Electricity Authority continued its programme of work related to distribution pricing, transmission pricing and contract review. The Commerce Commission is now embarking on the early stages of review of regulatory settings for electricity distribution businesses in light of the potential impact of emerging technologies. The regulatory landscape is continuing to evolve, and hence there is a continuing level of attendant risk and uncertainty for owners and investors in the distribution sector.
OPERATING PERFORMANCE
Energy received into the network was 1,408 gigawatt hours during FY15, a 4.2 percent increase on FY14. Energy received for delivery increased by 3.7 percent to 1,361 gigawatt hours in FY15 (FY14: 1,313). Consumer connections increased by 1,135 to 85,692 (FY14: 84,557), primarily due to new residential and irrigation connections in the Central Otago area.
Aurora Energy’s network assets are managed by infrastructure specialist Delta Utility Services Limited under a fixed-price, performance-based agreement for ten years from July 2007.
The System Average Interruption Duration Index (SAIDI) measures the average annual outage duration for each consumer supplied. The SAIDI for the regulatory year ended 31 March 2015 was 123.6 minutes, compared with 94.5 minutes for the previous year, and exceeding the performance target of 98.3 minutes (compliance not achieved). An extreme weather event on 24 May 2014 was responsible for 18.4 minutes of the SAIDI outcome as severe storm conditions brought down overhead lines.
The System Average Interruption Frequency Index (SAIFI) measures the average annual number of
AURORA ENERGY 2015 ANNUAL REPORT 3
Construction of Lindis Crossing substation

power interruptions, for each consumer supplied. The SAIFI for the regulatory year ended 31 March 2015 was 1.4, similar to last year’s 1.2 and under the target of 1.67 (compliance achieved).
Network reliability standards were met for each of the two previous regulatory periods of 2013 and 2014. Network reliability remains a central focus of Aurora Energy’s ongoing investment and improvement programmes, and a significant number of reliability initiatives are underway to offset the impact of more stringent compliance limits.
We compensate consumers who are affected by delays in restoring electricity supply following an extended outage. Under our supply agreements with electricity retailers, we are required to pay compensation where the delay is a result of factors within Aurora Energy’s reasonable control. In FY15, $205,372 was paid to electricity retailers in relation to 3,534 consumers affected by supply interruptions, a significant increase on FY14 during which we paid $101,186 in relation to 1,816 consumers affected. Extreme weather events in the last quarter contributed to this result, including a concentrated lightning storm and widespread flooding in Dunedin
together with trees bringing down a line in Central Otago in January.
Aurora Energy is a participant in the Electricity and Gas Complaints Commissioner scheme. We received 98 complaints in FY15 and all were handled within the required service levels established by the Commissioner. A planned outage notification error and higher-than-expected unplanned outages in two locations contributed to an increased number of complaints during the year (FY14: 40). The scheme provides an important mechanism for consumer feedback and useful insight on our performance as a network operator.
NETWORK INVESTMENT
Between 2015 and 2025, we plan to outlay total expenditures of $372 million, increasing preventative maintenance and renewal investment on the Dunedin network, and catering for growing consumer demand on the Central Otago network. We made solid progress on our asset investment programme this year with substantial increases in capital and maintenance spends.
As part of a major project to modernise our network management, control and communication systems, we
completed the first stage of a new advanced distribution management system and combined control centre.
Aurora Energy chose to deploy the GE PowerOn advanced distribution management system to monitor, control and analyse the distribution network. The existing systems in Dunedin and Central Otago have served well, but lack the functionality and flexibility required to accommodate the increasing complexity of modern distribution networks. Planned to go live in FY16, the new system will provide greater visibility of real-time network information and improve the safe and efficient management of the network. The new combined control centre will function 24/7 and will be capable of operating both the Dunedin and Central Otago networks.
We completed communications upgrades started in FY14 at the grid exit point at South Dunedin and in Cromwell, Central Otago. All five substations that connect into the South Dunedin grid exit point are now linked by fibre optic communications.
We invested $35.4 million in capital projects in FY15, including completion of a new, higher-capacity substation at Lindis
4 AURORA ENERGY 2015 ANNUAL REPORT
Community information board for
O-tako-u voltage upgrade project

Crossing, Central Otago to cater for a rapid increase in electricity demand, primarily from irrigation. The project was completed by our contractor, Delta, within a demanding timeframe and without compromise to safety standards.
We gained consent for two other major substation projects in Central Otago - a new Camp Hill substation in Hawea and a new Omakau substation. Construction on both is planned to start during FY16.
We upgraded the power to the O-tako-u area on the Otago Peninsula,
increasing the distribution voltage from 6.6 kilovolts to 11 kilovolts. By increasing the voltage, we are able to deliver power more efficiently and reliably to the O-tako-u area. The upgrade involved
replacement or conversion of 27 existing transformers to operate at 11 kilovolts. We also upgraded the Port Chalmers switchboard and associated protection and cabling to allow for future expansion.
During FY15, close to 800 power poles were replaced or newly installed on the Aurora Energy network, as part of our age-based pole replacement programme. To supplement existing asset condition information, mechanical pole testing using Deuar technology was introduced on the Aurora
Energy network in the last quarter of FY15. Around 500 poles were tested to provide a more accurate assessment of asset condition and remaining life.
In Central Otago, there continued to be high demand for irrigation-driven connections to the Aurora Energy network. During FY15, we connected the electricity supply needed for 3,000 hectares of irrigation schemes across the Clutha, Manuherikia and Ida Valleys.
Vegetation growing in or near power lines is a risk to public safety and a major cause of unplanned outages, particularly when trees clash with lines during extreme weather. A total of $4.3 million of preventative vegetation management work was completed to improve the reliability of the network in FY15, resulting in 34 kilometres of vegetation being cleared from near power lines.
COMMUNITY SUPPORT
Aurora Energy makes its primary contribution to the community by supplying the electricity for everyday life. We also support the communities we serve through sponsorship focused on the areas of youth, education and culture.
Aurora Energy is proud to foster science and technology in the Otago region. We were the prime sponsor of the Aurora Energy Otago Science and Technology Fair for a tenth consecutive year. The 2014 Fair saw more than 320 students compete from 25 schools across the Otago region. The Aurora Energy Premier Award for Best in Fair 2014 was awarded to year 12 Logan Park High School student Meran Campbell-Hood for her exhibition on the detection of soil nutrients in digital photography. More than 200 young scientists received awards for their inspiring exhibitions.
The biennial Festival of Colour brings artistic and cultural experiences from around New Zealand and the world to the Wanaka and Queenstown Lakes communities. In 2015, Aurora Energy was a major sponsor of the festival, which showcased 63 performances across 11 venues. Every year, the event attracts many keen observers with over 11,000 tickets sold during the 2015 Festival. Aurora Energy was pleased to support the sixth Festival of Colour, and the high levels of creative energy it brings to the Otago region.
Ph
oto
Cre
dit
: S
imo
n D
arb
y, W
an
aka P
ho
tog
rap
hy
AURORA ENERGY 2015 ANNUAL REPORT 5
Aurora Energy is gold sponsor of the
Southern Lakes Festival of Colour

SAFETY AND RISK
Aurora Energy has management control of its high voltage electricity network and, as principal duty holder, has responsibility for the safety of its contractors, the public and end-users.
The Board of Directors’ Health and Safety Committee met three times during FY15. The Board endorsed a network-specific Health and Safety Plan, recognising its duties as a Person Conducting a Business or Undertaking or PCBU under the proposed workplace safety legislation. The plan was developed specifically for Aurora Energy and was independently reviewed.
To verify our safety systems and that management processes are robust, Aurora Energy established a Safety Assurance Programme during FY15. Four independent audits were successfully conducted in the period.
During FY15, Aurora Energy maintained compliance with its public safety obligations under the Electricity Act 1992. Pleasingly, our principal contractor, Delta, continued to improve its safety performance.
As a lifeline service provider, Aurora Energy’s resilience in the event of a major natural disaster is critical to our community’s ability to recover quickly. Severe flooding occurred in parts of Dunedin in June. While the impact on the electricity network was isolated and relatively minor, the event provided a useful opportunity for Aurora Energy to participate in the civil defence response and to collaborate with the agencies responsible for other lifeline services such as telecommunications, transport and water.
We initiated work with Transpower to develop a detailed contingency plan in the event, for example, a major earthquake cut supply from the national grid into Dunedin. Limited interconnection capacity between the major points of supply at Halfway Bush and South
Dunedin reduces the available options to re-route power after such an event. The plan will explore options to restore power to as many consumers as possible, as quickly as possible.
EMERGING TECHNOLOGIES
The existing power system was not originally designed to accommodate the new technologies that are emerging, such as local solar and wind generation and grid-connected battery storage. In coming years, the challenge will deepen for electricity networks to maintain an acceptable reliability and quality of supply for its consumers in the face of these emerging technologies and changing usage patterns.
For example, distributed generation sources - such as rooftop photovoltaic systems and wind generation - feed into networks at lower voltage levels, creating reverse power flows and impacting upon voltage quality and overall system coordination.
Widespread adoption of consumer technologies such as home energy management systems, battery storage and electric vehicle charging will change demand profiles. New commercial arrangements will stem from increased on-site generation, larger numbers of small-scale participants, new demand response products and the need for more information on all parts of the network.
FY15 saw a 35 percent increase in the capacity of small solar systems connected to the Aurora Energy network, when compared to FY14. The establishment of charging infrastructure at key locations is underway throughout much of the country, including Otago, supporting a small but increasing number of electric vehicles. A number of other new energy-related technologies and systems are now being actively marketed in New Zealand, with costs continuing to reduce significantly.
Existing networks and industry
structures are capable of evolving to accommodate these changes. A successful transition will require the cooperation and coordination of market participants, the development of suitable standards, an understanding of whole-of-system risks, and a flexible regulatory governance approach. Aurora Energy is working to identify the most efficient means of meeting the new and changing infrastructure requirements that consumer investment in new technologies will place on the existing electricity system.
We continued to actively participate in the New Zealand Smart Grid Forum established in March 2014 to share information and provide advice about the challenges and opportunities for deployment of a smart grid in New Zealand. During FY15, we continued to advance upgrades of our primary control and communication systems that will assist in the eventual transition to other smart grid technologies and ultimately enable Aurora Energy to provide better customer service and operate its network more efficiently.
We are also taking part in initiatives to promote the uptake of electric vehicles in New Zealand under the Drive Electric banner, establishing charging infrastructure at key locations on State Highway One, including on the Aurora Energy network.
6 AURORA ENERGY 2015 ANNUAL REPORT

OUTLOOK
The emergence of new technologies, new energy sources and changing consumer demands are challenging all participants in the energy sector to re-evaluate their future investment decisions, the regulatory framework and customer relationships.
While the direct impact of these trends remains relatively modest for now, over the long term the pace of change is expected to accelerate, pushed by consumer choice and the increasing economic viability of technologies in energy storage, generation and transport.
The conventional pricing models for electricity network businesses rely heavily on energy usage to determine revenues. The impact of emerging technologies and increasing energy efficiency presents challenges for the fair allocation of costs, where the desired outcome is a supply grid that is always available yet can integrate new technologies. Significant evolution of the regulatory model is likely. At the time of writing, both the Commerce Commission and Electricity Authority are turning their attention to regulatory and price settings that can accommodate the transition to a more distributed, consumer-led energy system.
In the near term, we expect overall energy demand to remain stable or increase modestly across the Aurora Energy network. The picture is similar to recent years with flat or declining energy demand in Dunedin (relatively static population and economic activity levels) and increasing demand in Central Otago (from irrigation projects and a growing population). Our capital programme will continue to focus on increased investment and expenditure to replace and upgrade older assets in Dunedin while we build new assets to cater for electricity demand growth in Central Otago.
Over the next five years, our asset management plan provides for sustained investment in both operating and capital expenditure to secure the future reliability of the network for our consumers and the communities we supply. The investment will support the achievement of challenging reliability targets and permit further reductions in network-related risk. The Commerce Commission’s decision to reduce Aurora Energy’s allowable revenue by 4.3 percent is challenging for plans to make $154 million in network improvements over the next five years, and has the potential to constrain Aurora Energy’s future dividend stream.
Grady CameronCHIEF EXECUTIVE
Ian PartonCHAIRMAN
27 August 2015
AURORA ENERGY 2015 ANNUAL REPORT 7

TREND STATEMENT
YEARS ENDED 30 JUNE Note 2015 2014 2013 2012 2011
Energy received into network GWh 1,408 1,351 1,373 1,410 1,342
Energy received for delivery to consumers GWh 1,361 1,313 1,331 1,350 1,314
Energy delivery reliability Minutes 137.3 123.6 77.5 123.9 131.8 (average time without supply per consumer per annum)
Total revenue $000 99,462 92,895 90,560 85,922 80,293
Trading profit before tax $000 18,420 18,024 19,077 18,432 18,013(before subvention payments)
EBIT/average funds employed 6.9% 7.1% 7.4% 7.4% 7.3%
Tax – current year provision $000 3,132 3,037 3,325 3,169 5,386
– prior year (over)/under provision $000 (180) 45 (164) 43 (164)
Net profit for the year $000 13,426 12,900 13,874 13,178 12,791(before after-tax value of subvention payments)
Net profit for the year 1 $000 8,176 7,650 8,624 7,928 12,791 (after subvention payments)
Cashflow from operating activities $000 20,392 24,278 20,228 21,825 26,134
Dividends paid $000 4,750 4,750 8,750 7,104 12,003
Equivalent dividends $000 10,000 10,000 14,000 12,354 12,003(actual dividends plus after-tax value of subvention payments)
Shareholder’s equity $000 182,550 180,983 178,005 177,345 176,512
Total assets $000 413,855 390,882 383,272 373,653 368,165
Capital Expenditure (net) $000 35,421 21,260 18, 841 18,316 22,128
Return on average equity 7.4% 7.2% 7.8% 7.5% 7.3% (before after-tax value of subvention payments)
Equity to total assets 44.1% 46.3% 46.4% 47.5% 47.9%
NOTE:
1 Aurora Energy Limited is part of the Dunedin City Holdings group of companies. Aurora Energy Limited makes pre-tax subvention payments to companies within the Dunedin City Council group of companies, which has the effect of reducing the net profit for the year.
8 AURORA ENERGY 2015 ANNUAL REPORT

STATEMENT OF SERVICE PERFORMANCEfor the year ended 30 June 2015
PERFORMANCE MEASURE TARGET OUTCOME DESCRIPTION
GENERAL OBJECTIVES
• The Statement of Intent (SOI) will be 30 June 2014 Achieved The Statement of Intent for submitted to and approved by Dunedin the 2015 financial year was City Holdings Limited (DCHL), ensuring submitted to and accepted by consistency across the DCHL Group. DCHL prior to 30 June 2014.
• Monthly financial results will be provided Monthly Achieved Monthly financial results were to DCHL in line with the agreed timetable provided to DCHL in line with between Aurora and the Shareholder. the agreed timetable.
• Monthly board reports which review the Monthly Achieved Board reports were produced operating activities of Aurora for and meetings were held each compliance with the goals and objectives month to review the stated in the SOI and the Strategic Plan Company’s compliance with will be prepared. goals and objectives stated in the SOI and Strategic plan.
• Monitor and pursue ownership of an Ownership of an Not achieved Aurora will continue to pursue additional group of utility assets. additional group of opportunities if and when they infrastructure assets arise. No such opportunities were identified during the financial year.
NETWORK OPERATIONS (Regulatory Year Targets – Period Ended 31 March 2015)
• Consumer connections (ICP count) 84,500 average Achieved 85,530 per annum
• Energy received into the network 1,375 Gigawatt hours Not achieved 1,347 per annum
• Load factor % ≥ 54.00% energy into Achieved 54% network/peak kW hours
• Loss ratio % ≤ 6.0% energy into Not achieved 7.3% network less energy delivered/energy into network
• Capacity utilisation % ≥ 30.0% peak Achieved 31% network kW/installed distribution transformer capacity kVA
AURORA ENERGY 2015 ANNUAL REPORT 9

STATEMENT OF SERVICE PERFORMANCEfor the year ended 30 June 2015 – continued
PERFORMANCE MEASURE TARGET OUTCOME DESCRIPTION
NETWORK RELIABILITY (Regulatory Year Targets – Period Ended 31 March 2015)
• SAIDI
- Class B Interruptions Planned ≤ 25.00 minutes Achieved 24.23 minutes
- Class C Interruptions Unplanned ≤ 73.29 minutes Not achieved 99.26 minutes
- Total ≤ 98.29 minutes Not achieved 123.59 minutes
• SAIFI
- Class B Interruptions Planned ≤ 0.15 Achieved 0.12 minutes
- Class C Interruptions Unplanned ≤ 1.52 Achieved 1.25 minutes
- Total ≤ 1.67 Achieved 1.37 minutes
COMMUNITY, PEOPLE, SAFETY AND ENVIRONMENT OBJECTIVES
Community
• Support community initiatives. $40,000 of Achieved More than $40,000 of sponsorship sponsorship was paid to per annum community groups during the year.
• To undertake a review of activities for Reviewed Achieved The Company continually the purposes of being a good corporate reviews its activities which citizen. include sponsoring cultural and education events.
Safety
• Reduce harm to contractors. ≤ 7.50 total recordable Achieved Aurora’s largest contractor injury frequency rate achieved a TRIFR of 4.16 per (TRIFR) per 200,000 200,000 man hours during man hours. the year.
• Zero serious harm events involving 0 Achieved There were no serious harm members of the public. incidents during the year involving the public.
Environment
• No transgression of the environmental No breaches Achieved There were no Resource and resource law occurs. Management Act breaches during the year.
10 AURORA ENERGY 2015 ANNUAL REPORT

STATEMENT OF SERVICE PERFORMANCEfor the year ended 30 June 2015– continued
PERFORMANCE MEASURE TARGET OUTCOME RESULT
$000 $000
FINANCIAL OBJECTIVES
• EBITDA 38,797 Achieved 41,467
• Net profit after income tax 10,949 Achieved 13,426
• Shareholder’s funds 182,372 Achieved 182,550
• Cash flow from operations 24,261 Not achieved 20,392
• Capital expenditure 32,948 Achieved 35,421
• Term debt 158,600 Achieved 155,500
• Dividends 9,500 Achieved 10,000
• Shareholder’s funds to total assets 44.2% Not achieved 44.1%
SPECIFIC OBJECTIVES
• To review the activities undertaken by the Company Achieved to ensure health and safety responsibilities are met. The Company continually monitors all health and safety aspects.
• To prepare a stakeholder engagement plan to identify Achieved stakeholders and their priorities for informed Company The Company undertook an engagement with various decision making. stakeholders.
During the 2015 financial year, the Company broadened its Statement of Intent to include additional operational measures. These measures have also been incorporated into the Company’s 2016 Statement of Intent.
AURORA ENERGY 2015 ANNUAL REPORT 11

MAKARORA
GLENORCHY
QUEENSTOWN
CROMWELL
WANAKA
TARRAS
OMAKAU
ALEXANDRA
ROXBURGH
PORT CHALMERS
MOSGIEL DUNEDIN
TAIERI MOUTH
RAES JUNCTION
NETWORK OVERVIEW
ELECTRICITY DISTRIBUTION NETWORK AT A GLANCE for the year ended 31 March 2015
Number of consumer connections 85,530
Energy received for distribution 1,347 gigawatt hours
Capacity of transformers 928 megavolt amperes
Capacity utilisation 31%
Number of zone substations 38
Number of bulk supply points 5
Length of lines and cables 5,815 kilometres
12 AURORA ENERGY 2015 ANNUAL REPORT

NETWORK PERFORMANCE
These statistics are generally as required to be disclosed by the Commerce Commission Information Disclosure Requirements.
12 months ended 31 March 2015 2014 2013 2012 2011
System Physical Measures
Average length of lines and cables km 5,815 5,796 5,543 5,628 5,621
Average capacity of distribution transformers MVA 928 910 897 880 877
Distribution transformer capacity utilisation 31% 31% 32% 33% 31%
Consumer Measures
Number of consumer connections 85,530 84,362 83,656 82,908 82,368
System maximum demand MW 286 279 284 290 274
Energy received for delivery GWh 1,347 1,321 1,331 1,396 1,340
Average load factor 54% 54% 53% 55% 55%
Average minutes off per fault CAIDI 95(3) 78 69 65(2) 76(1)
Average faults per annum SAIFI 1.4 1.2 1.1 1.8 1.5
Average minutes off per annum SAIDI 124(3) 94 76 116(2) 111(1)
NOTES:
km - kilometres
MVA - megavolt amperes
MW - megawatts
GWh - gigawatt hours
CAIDI - Consumer Average Interruption Duration Index
SAIFI - System Average Interruption Frequency Index
SAIDI - System Average Interruption Duration Index
(1) An extreme weather event in Dunedin on 21 December 2010 was responsible for 12.6 minutes of the SAIDI index and 5 minutes of the CAIDI index in 2011.
(2) Extreme weather events in Dunedin on 12 May 2011 and in Central Otago on 25 October 2011 were responsible for 23.9 minutes of the SAIDI index and 3 minutes of the CAIDI index in 2012.
(3) An extreme weather event in Dunedin on 24 May 2014 was responsible for 18.4 minutes of the SAIDI index and 7 minutes of the CAIDI index in 2015.
AURORA ENERGY 2015 ANNUAL REPORT 13

DIRECTORS’ REPORTfor the year ended 30 June 2015
The Directors of Aurora Energy Limited are pleased to report on the financial results and associated matters for the year ended 30 June 2015.
PRINCIPAL ACTIVITIES OF THE COMPANY
The principal activities of the Company are the ownership and strategic management of its electricity distribution network assets.
Results for the year ended 30 June 2015 $000
Trading profit 18,420
less subvention payment (pre-tax equivalent dividend) 7,292
Operating profit before income tax 11,128
less income tax expense 2,952
Net profit for year 8,176
STATE OF AFFAIRS
The Directors believe that the state of affairs of the Company is satisfactory.
DIVIDENDS
Total dividends of $4.750 million were declared and paid for the year ended 30 June 2015. In addition, a subvention payment of $7.292 million was paid to a member of the Dunedin City Council group of companies. The dividend equivalent of this subvention payment is $5.250 million, giving total equivalent dividends of $10.000 million paid for the year. Equivalent dividends last year amounted to $10.000 million.
RESERVES
The following net transfers have been made to or from reserves:
$000
Cash flow hedge reserve - to (from) (1,859)
Retained earnings - to (from) 3,426
14 AURORA ENERGY 2015 ANNUAL REPORT

DIRECTORS’ REPORTfor the year ended 30 June 2015
REVIEW OF OPERATIONS
The Directors are satisfied with the operating results achieved for the year ended 30 June 2015. The net profit before after-tax value of subvention payments of $13.426 million (2014: $12.900 million) generated a return on average shareholders equity of 7.4% (2014: 7.2%). The after-tax value of subvention payments was $5.250 million (2014: $5.250 million).
The nature of electricity distribution assets is such that significant and ongoing capital expenditure is required to sustain reliability and provide for growth well in advance of resulting revenue increases. The Company has commenced a major programme of capital works that is intended to cater for the current growth in electricity demand in Central Otago and the renewal and upgrade of existing network assets. A total of $35.421 million (FY14: $21.261 million) was invested into network related assets during the year. Major projects included construction of the new Lindis Crossing substation, the commencement of works on another new substation at Camp Hill, and the continuation of system control, communication and protection upgrades.
The Commerce Commission has determined its regulatory starting price adjustments which were effective 1 April 2015 for the current 5 year regulatory period. This determination has resulted in a 4.3 percent reduction in allowable revenue for the year ended 31 March 2016.
FINANCIAL STATEMENTS
The audited financial statements for the year ended 30 June 2015 are attached to this report.
DIRECTORS’ INTERESTS IN CONTRACTS
Disclosures of interests made by Directors are recorded in the Company’s interests register.
These general disclosures of interests are made in accordance with S140 (2) of the Companies Act 1993 and serve as notice that the Directors may benefit from any transaction between the Company and any of the disclosed entities. Details of these declarations are included in the Information on Directors section of this report.
Any significant contracts involving Directors’ interests that were entered into during the year ended 30 June 2015 or existed at that date are disclosed in the related parties section of this report.
DIRECTORS’ REMUNERATION
The remuneration paid to Directors during the year was:
Dr Ian M Parton $ 35,256
Stuart J McLauchlan $ 23,756
David J Frow $ 23,756
Trevor J Kempton $ 20,756
$ 103,524
AURORA ENERGY 2015 ANNUAL REPORT 15

DIRECTORS’ REPORTfor the year ended 30 June 2015
AUDIT AND RISK COMMITTEE
All of the Directors were members of the Audit and Risk Committee of the Board during the year. The Audit and Risk Committee has the responsibility for agreeing the arrangements for audit of the Company’s financial accounts. Its responsibilities include ensuring that appropriate audit consideration is given to the following issues:
• effectiveness of systems and standards of internal control
• quality of management controls
• management of business risk
• compliance with legislation, standards, policies and procedures
• appointing and monitoring the internal audit function.
Crowe Horwath continues as internal auditor to the Company. Specific areas for its review were identified and a number of reviews have been completed, with the results reported to the Audit and Risk Committee and the Board. Review of further areas is on-going and progress is satisfactory.
HEALTH AND SAFETY BOARD COMMITTEE
All of the Directors were members of the Health and Safety Board Committee during the year. Its principal responsibility is to review and make recommendations to the Board on the appropriateness and effectiveness of the Company’s health and safety strategy, performance and governance.
NOMINATION COMMITTEE
All of the Directors were members of the Nomination Committee of the Board during the year. Its principal responsibility is to identify and nominate, for approval by the Shareholder, external candidates to fill board vacancies as they arise.
EMPLOYEES’ REMUNERATION
No staff are employed by Aurora Energy Limited. The management of the Company is currently carried out under contract by Delta Utility Services Limited.
AUDITOR
The Auditor-General is appointed Auditor pursuant to Section 45 of the Energy Companies Act 1992. The Auditor-General has contracted the audit to Audit New Zealand.
16 AURORA ENERGY 2015 ANNUAL REPORT

DIRECTORS’ REPORTfor the year ended 30 June 2015
DIRECTORS’ INSURANCE
In accordance with the Constitution, the Company has arranged policies of Directors’ Liability Insurance that ensure that generally the Directors will incur no monetary loss as a result of actions undertaken by them as Directors, provided that they operate within the law.
DIRECTORS’ BENEFITS
No Director has, since the end of the previous financial year, received or become entitled to receive a benefit other than a benefit included in the total remuneration received or due and receivable by the Directors shown in the financial statements.
There were no notices from Directors requesting to use Company information received in their capacity as Directors that would not otherwise have been available to them.
EVENTS SUBSEQUENT TO BALANCE DATE
The Directors are not aware of any matter or circumstance since the end of the financial year, not otherwise dealt with in this report or the Company’s financial statements, which has significantly or may significantly affect the operation of the Company, the results of those operations or the state of affairs of the Company.
For and on behalf of the Board of Directors
Ian Parton Stuart McLauchlanCHAIRMAN DIRECTOR
27 August 2015
AURORA ENERGY 2015 ANNUAL REPORT 17

INFORMATION ON THE DIRECTORS
Director Qualifications Date Appointed Declarations of Interests
Dr Ian M Parton BE (Hons), October 2012 Chairman – Delta Utility Services Limited
Non-Executive PhD, Director – Auckland Transport Limited
Chairman Dist.F.IPENZ, Director – Construction Techniques Group Limited
CF.Inst.D. Director – Skellerup Holdings Limited
Chancellor – University of Auckland
David J Frow BSc.Eng, October 2012 Chairman and shareholder – Major Consulting Group
Non-Executive CF.Inst.D. Limited
Director Director – Delta Utility Services Limited
Director – ETEL Limited
Director – ETEL Transformers Pty Limited (Aus)
Director – Holmes Fire LP
Director – Rataworks Limited
Senior Consultant – Strata Energy Consulting
Chairman – Bathurst Resources (New Zealand) Limited
(resigned 13 November 2014)
Trevor J Kempton BE (Hons), November 2013 Director – Constructing Excellence (NZ) Limited
Non-Executive M.IPENZ, Director – Delta Utility Services Limited
Director F.NZIM, Director and shareholder – Long Beach Consulting Limited
CM.Inst.D. Director – The Academy of Construction Excellence
(NZ) Limited
Director – Trevian Properties Limited
Councillor – Otago Regional Council
Shareholder – Naylor Love Enterprise Group of companies
Stuart J McLauchlan BCom, June 2007 Chairman – Dunedin International Airport Limited
Non-Executive FCA (PP), Chairman – NZ Sports Hall of Fame
Director CF.Inst.D. Chairman – Pharmac
Chairman and shareholder – Scott Technology Limited
Chairman – University of Otago Foundation Studies Limited
Chairman – UDC Finance Limited
Director – AD Instruments Pty Limited
Director – Cargill Hotel 2002 Limited
Director – Delta Utility Services Limited
Director and shareholder – Dunedin Casinos Limited
Director – Energy Link Limited
Director – HTS 110 Limited
Director – Ngai Tahu Tourism Board
Director – Otago & Southland Employers Association
Director and shareholder – Rosebery Holdings Limited
Director – Scenic Circle Hotels Limited and subsidiaries
Director – University of Otago Holdings Limited
Director – USC Investments Limited
Member – Marsh Advisory Board
Partner – G S McLauchlan & Co
Pro Chancellor – University of Otago
Director – Lund South Limited (resigned 28 July 2014)
Director – XRock Automation Pty Limited
(ceased 4 February 2015)
18 AURORA ENERGY 2015 ANNUAL REPORT
Opposite: Artist Daniel Mead paints mural on
Princes Street transformer, central Dunedin

CONTENTS
Statement of comprehensive income 20
Statement of changes in equity 21
Balance sheet 22
Statement of cash flows 24
Notes to the financial statements 26
Independent auditor’s report 49
FINANCIAL STATEMENTSfor the year ended 30 June 2015
AURORA ENERGY 2015 ANNUAL REPORT 19

Statement of Comprehensive Incomefor the year ended 30 June 2015
2015 2014 Note $000 $000
Operating revenue 3 99,452 92,889
Financial revenue 4 10 6
Total revenue 99,462 92,895
Less expenses
Operating expenses 5 71,560 65,547
Financial expenses 6 9,482 9,324
Total expenditure 81,042 74,871
Profit before tax and subvention 18,420 18,024
Subvention payment provided 7,292 7,292
Profit before tax 11,128 10,732
Income tax expense 9 2,952 3,082
Net profit/(loss) after tax for the year 8,176 7,650
Other comprehensive income
Gain/(loss) on cashflow hedges (1,861) 70
Gain/(loss) on terminated cashflow hedges 2 8
Total other comprehensive income (1,859) 78
Total comprehensive income 6,317 7,728
The accompanying notes and accounting policies form an integral part of these audited financial statements.
20 AURORA ENERGY 2015 ANNUAL REPORT

Statement of Changes in Equityfor the year ended 30 June 2015
2015 2014 Note $000 $000
Equity at beginning of the year 180,983 178,005
Total comprehensive income 6,317 7,728
Less distribution to owner 8 4,750 4,750
Equity at end of the year 182,550 180,983
The accompanying notes and accounting policies form an integral part of these audited financial statements.
AURORA ENERGY 2015 ANNUAL REPORT 21

Balance Sheetas at 30 June 2015
2015 2014 Note $000 $000
EQUITY
Share capital 11 10,000 10,000
Cash flow hedge reserve 12 (904) 955
Retained earnings 13 173,454 170,028
Total equity 182,550 180,983
CURRENT LIABILITIES
Trade and other payables 14 15,221 12,481
Taxation payable 1,376 1,570
Cash flow hedge instruments 21 1,261 0
Total current liabilities 17,858 14,051
NON-CURRENT LIABILITIES
Term borrowings 16 155,500 138,800
Deferred tax liability 17 57,947 57,048
Total non-current liabilities 213,447 195,848
Total liabilities 231,305 209,899
TOTAL EQUITY AND LIABILITIES 413,855 390,882
The accompanying notes and accounting policies form an integral part of these audited financial statements.
22 AURORA ENERGY 2015 ANNUAL REPORT

Balance Sheetas at 30 June 2015 – continued
2015 2014 Note $000 $000
CURRENT ASSETS
Cash and cash equivalents 18 34 57
Trade and other receivables 19 12,752 11,558
Inventories 22 8 8
Other current assets 15 624 68
Inter company advances 399 56
Cash flow hedge instruments 21 0 1,323
Total current assets 13,817 13,070
NON-CURRENT ASSETS
Investments 20 10 10
Deferred tax asset 17 397 27
Property, plant and equipment 23 399,631 377,775
Total non-current assets 400,038 377,812
TOTAL ASSETS 413,855 390,882
For and on behalf of the Board of Directors
Ian Parton Stuart McLauchlanCHAIRMAN DIRECTOR
27 August 2015
The accompanying notes and accounting policies form an integral part of these audited financial statements.
AURORA ENERGY 2015 ANNUAL REPORT 23

Statement of Cash Flowsfor the year ended 30 June 2015
2015 2014 Note $000 $000
CASH FLOWS FROM OPERATING ACTIVITIES
Cash was provided from
Receipts from customers 98,311 92,130
Interest and dividends received 10 6
Income tax refund 0 114
98,321 92,250
Cash was disbursed to
Payments to suppliers 58,705 50,812
Interest paid 9,350 9,296
Intra group tax loss/subvention payments made 859 0
Income tax paid 833 188
Net GST paid/(received) 345 (304)
Subvention payment 7,292 7,292
Inter Company advance 545 688
77,929 67,972
Net cash inflows/(outflows) from operating activities 25 20,392 24,278
CASH FLOWS FROM INVESTING ACTIVITIES
Cash was provided from
Sale of property, plant and equipment 0 26
0 26
Cash was disbursed to
Purchase of property, plant and equipment 32,365 20,765
32,365 20,765
Net cash inflows/(outflows) from investing activities (32,365) (20,739)
The accompanying notes and accounting policies form an integral part of these audited financial statements.
24 AURORA ENERGY 2015 ANNUAL REPORT

Statement of Cash Flowsfor the year ended 30 June 2015 – continued
2015 2014 Note $000 $000
CASH FLOWS FROM FINANCING ACTIVITIES
Cash was provided from
Proceeds from borrowings 49,525 28,300
49,525 28,300
Cash was disbursed to
Repayment of borrowings 32,825 27,100
Dividends paid 4,750 4,750
37,575 31,850
Net cash inflows/(outflows) from financing activities 11,950 (3,550)
Net increase/(decrease) in cash, cash equivalents and bank overdraft (23) (11)
Cash and cash equivalents at beginning of the year 57 68
CASH AND CASH EQUIVALENTS AT END OF THE YEAR 18 34 57
The accompanying notes and accounting policies form an integral part of these audited financial statements.
AURORA ENERGY 2015 ANNUAL REPORT 25

Notes To The Financial Statementsfor the year ended 30 June 2015
1 REPORTING ENTITY
The financial statements are for the reporting entity Aurora Energy Limited (the Company).
The financial statements have been prepared in accordance with the requirements of the Energy Companies Act 1992, the Companies Act 1993 and the Financial Reporting Act 1993.
The Company, incorporated in New Zealand under the Companies Act 1993, is a wholly owned subsidiary of Dunedin City Holdings Limited. Dunedin City Holdings Limited is wholly owned by Dunedin City Council.
Otago Power Limited was a non-trading wholly owned subsidiary of the company. It was not consolidated and its shares were transferred to Dunedin City Holdings Limited on 17 December 2014.
These financial statements are presented in New Zealand dollars, and have been rounded to the nearest thousand.
2 SIGNIFICANT ACCOUNTING POLICIES
STATEMENT OF COMPLIANCE
The Company is a Tier 1 for–profit entity as defined by the External Reporting Board (expenses over $30 million) and has reported in accordance with Tier 1 For-profit Accounting Standards. These annual financial statements are general purpose financial reports which have been prepared in accordance with NZIAS1, additional information as requested by Directors, and in accordance with NZ GAAP. They comply with New Zealand Equivalents to IFRS, and other applicable Financial Reporting Standards, as appropriate for profit orientated entities.
The financial statements were authorised for issue by the Directors on 27 August 2015.
BASIS OF ACCOUNTING
The financial statements have been prepared on the historic cost basis, except for the revaluation of certain assets including cash flow hedge instruments. The going concern assumption has been applied.
The accounting policies set out below have been applied consistently to all periods in these financial statements.
CRITICAL ACCOUNTING JUDGEMENTS, ESTIMATES AND ASSUMPTIONS
In preparing these financial statements the Company has made judgements, estimates and assumptions concerning the future. These estimates and assumptions may differ from the subsequent actual results. Estimates and assumptions are continually evaluated.
The critical accounting judgements, estimates and assumptions of the Company are contained within the following policies.
26 AURORA ENERGY 2015 ANNUAL REPORT

Notes To The Financial Statementsfor the year ended 30 June 2015 – continued
2 SIGNIFICANT ACCOUNTING POLICIES - continued
REVENUE RECOGNITION
Revenue is measured at the fair value of the consideration received or receivable and represents amounts receivable for goods and services provided in the normal course of business, net of discounts and goods and services tax (GST).
Revenue from services rendered is recognised when it is probable that the economic benefits associated with the transaction will flow to the Company.
Sales of goods are recognised when significant risks and rewards of owning the goods are transferred to the buyer, when the revenue can be measured reliably and when management effectively ceases involvement or control.
Interest revenue is accrued on a time basis, by reference to the principal outstanding and at the effective interest rate applicable, which is the rate that exactly discounts estimated future cash receipts through the expected life of the financial asset to that asset’s net carrying amount.
LEASING
Rental income from operating leases is recognised on a straight-line basis over the term of the relevant lease.
Rentals payable under operating leases are charged to income on a straight-line basis over the term of the relevant lease.
Benefits received and receivable as an incentive to enter into an operating lease are also spread on a straight-line basis over the lease term.
BORROWING COSTS
Borrowing costs directly attributable to the acquisition, construction or production of qualifying assets, which are assets that necessarily take a substantial period of time to prepare them for their intended use or sale, are added to the cost of those assets, until such time as the assets are substantially ready for their intended use or sale.
All other borrowing costs are recognised in the Income Statement in the period in which they are incurred.
GOODS AND SERVICES TAX (GST)
Revenues, expenses, assets and liabilities are recognised net of the amount of goods and services tax (GST), except for receivables and payables which are recognised inclusive of GST. The Statement of Cash Flows is inclusive of GST.
AURORA ENERGY 2015 ANNUAL REPORT 27

Notes To The Financial Statementsfor the year ended 30 June 2015 – continued
2 SIGNIFICANT ACCOUNTING POLICIES - continued
TAXATION
The tax expense comprises both current tax and deferred tax.
Current tax is the amount of income tax payable based on the taxable profit for the current year plus any adjustments to income tax payable in respect of prior years.
Deferred tax is the tax expected to be payable or recoverable on differences between the carrying amounts of assets and liabilities in the financial statements and the corresponding tax bases used in the calculation of taxable profit.
Current tax and deferred tax is charged or credited to the income statement except when deferred tax relates to items charged directly to equity. The Company’s liability for current tax is calculated using tax rates that have been enacted by the balance sheet date.
Deferred tax assets and liabilities are generally recognised for all taxable temporary differences. Deferred tax assets are recognised to the extent that it is probable that taxable profits will be available against which deductible temporary differences can be utilised. Such assets and liabilities are not recognised if the temporary difference arises from goodwill or from the initial recognition (other than in a business combination) of other assets and liabilities in a transaction that affects neither the taxable profit nor the accounting profit.
The carrying amount of deferred tax assets is reviewed at each balance sheet date and reduced to the extent that it is no longer probable that sufficient taxable profits will be available to allow all or part of the asset to be recovered.
Deferred tax is calculated at the tax rates that are expected to apply in the period when the liability is settled or the asset is realised. Movements in deferred tax assets and liabilities are charged or credited in the income statement in the financial year that the movement occurs, except when it relates to items charged or credited directly to equity.
PROPERTY, PLANT AND EQUIPMENT
Property plant and equipment are those assets held by the Company for the purpose of carrying on its business activities on an ongoing basis.
All property, plant and equipment are stated at cost less any subsequent accumulated depreciation and any accumulated impairment losses.
Self constructed assets include the direct cost of construction to the extent that they relate to bringing the fixed assets to the location and condition for their intended service.
28 AURORA ENERGY 2015 ANNUAL REPORT

Notes To The Financial Statementsfor the year ended 30 June 2015 – continued
2 SIGNIFICANT ACCOUNTING POLICIES - continued
Depreciation is charged so as to write-off the costs of assets, other than land, and capital work in progress, on the straight-line basis. Rates used have been calculated to allocate the assets’ costs less estimated residual values over their estimated remaining useful lives.
Depreciation of assets commences when the assets are ready for their intended use.
Where parts of an item of property, plant and equipment have different useful lives, they are accounted for as separate items of property, plant and equipment.
Depreciation rates and methods used are:
RATE METHOD
Land no depreciation charged
Buildings 1% to 5% straight line
Electricity network assets 1% to 20% straight line
Plant and equipment 5% to 50% straight line
Motor vehicles 5% to 25% straight line
Office equipment and fittings 5% to 25% straight line
Optical fibre network assets 2% to 10% straight line
Capital work in progress no depreciation charged
An item of property, plant and equipment is de-recognised upon disposal or when no future economic benefits are expected to arise from the continued use of the asset.
Any gain or loss arising on de-recognition of the asset (calculated as the difference between the net disposal proceeds and the carrying amount of the item) is included in the income statement in the year the item is de-recognised.
IMPAIRMENT OF ASSETS
At each balance sheet date, the Company reviews the carrying amounts of its assets to determine whether there is any indication that those assets have suffered an impairment loss. If any such indication exists, the recoverable amount of the asset is estimated in order to determine the extent of the impairment loss (if any). Where the asset does not generate cash flows that are independent from other assets, the Company estimates the recoverable amount of the cash-generating unit to which the asset belongs.
The recoverable amount is the higher of fair value less costs to sell and value in use. In assessing value in use, the estimated future cash flows are discounted to their present value using a pre-tax discount rate that reflects current market assessments of the time value of money and the risks specific to the asset for which the estimates of future cash flows have not been adjusted.
If the recoverable amount of an asset or cash-generating unit is estimated to be less than its carrying amount, the carrying amount of the asset or cash generating unit is reduced to its recoverable amount. Any impairment loss is immediately expensed to the income statement.
AURORA ENERGY 2015 ANNUAL REPORT 29

Notes To The Financial Statementsfor the year ended 30 June 2015 – continued
2 SIGNIFICANT ACCOUNTING POLICIES - continued
Where an impairment loss subsequently reverses, the carrying amount of the asset or cash-generating unit is increased to the revised estimate of its recoverable amount, but only to the extent that the increased carrying amount does not exceed the carrying amount that would have been determined had no impairment loss been recognised for the asset or cash-generating unit in prior years. A reversal of an impairment loss is immediately recognised in the income statement.
INVENTORIES
Inventories are stated at the lower of cost and net realisable value. Cost comprises of direct materials and, where applicable, direct labour costs and those overheads that have been incurred in bringing the inventories to their present location and condition. Cost is calculated using the weighted average method. Net realisable value represents the estimated selling price less all estimated costs of completion and costs to be incurred in marketing, selling and distribution.
CASH AND CASH EQUIVALENTS
Cash and cash equivalents is comprised of cash in hand, deposits held at call with banks, other short term highly liquid investments with original maturities of three months or less and bank overdrafts. Bank overdrafts are shown within borrowings in current liabilities in the balance sheet.
FINANCIAL INSTRUMENTS
Financial instruments are contracts that give rise to financial assets and financial liabilities that are recognised on the Company’s balance sheet when the Company becomes a party to the contractual provisions of the instrument.
TRADE AND OTHER RECEIVABLES
Trade and other receivables are classified as financial assets at cost less any allowances for estimated irrecoverable amounts.
INVESTMENTS
Investments are comprised of long-term equity instrument holdings which are available for sale. These are initially measured at cost, including transaction costs and are assessed annually for impairment. Any resultant losses on impairment are recognised in the income statement for the period in which they occur.
30 AURORA ENERGY 2015 ANNUAL REPORT

Notes To The Financial Statementsfor the year ended 30 June 2015 – continued
2 SIGNIFICANT ACCOUNTING POLICIES - continued
TRADE AND OTHER PAYABLES
Trade and other payables are stated at cost.
BORROWINGS
Borrowings are initially recorded net of directly attributable transaction costs and are measured at subsequent reporting dates at amortised cost. Finance charges, premiums payable on settlement or redemption and direct costs are accounted for on an accrual basis to the Income Statement using the effective interest method and are added to the carrying amount of the instrument to the extent that they are not settled in the period in which they arise.
CASH FLOW HEDGE INSTRUMENTS AND HEDGE ACCOUNTING
The Company’s activities expose it to financial risks of changes in interest rates and foreign currency exchange rates. The Company uses cash flow hedge instruments (interest rate swap contracts and foreign exchange forward contracts) to protect itself from these risks.
The Company does not use cash flow hedge instruments for speculative purposes. Any derivatives that do not qualify for hedge accounting, under the specific NZ IFRS rules, are accounted for as trading instruments, with fair value gains/losses recognised directly in the income statement.
The use of cash flow hedge instruments is governed by policy approved by the Board of Directors in consultation with the Company’s Shareholder.
Cash flow hedge instruments are recognised as a current asset or liability.
Cash flow hedge instruments are recognised at fair value on the date the hedge is entered into and are subsequently re-measured to their fair value. The fair value on initial recognition is the transaction price. Subsequent fair values are based on independent bid prices quoted in active markets for these instruments.
Changes in the fair value of cash flow hedge instruments that are designated and effective as hedges of future cash flows are recognised directly in equity. Any ineffective portion is recognised immediately in the income statement. Hedges that do not result in the recognition of an asset or a liability are recognised in the income statement in the same period in which the hedged item affects net profit or loss.
Changes in the fair value of derivative financial instruments that do not qualify for hedge accounting are recognised in the income statement as they arise.
Hedge accounting is discontinued when the hedging instrument expires, is sold, terminated, exercised, or no longer qualifies for hedge accounting. Any cumulative gain or loss on the hedging instrument recognised in equity is retained in equity until the forecast transaction occurs. If a hedged transaction is no longer expected to occur, the net cumulative gain or loss recognised in equity is transferred to the income statement for the period.
Any financial derivatives or cash flow hedge instruments embedded in other financial instruments or other host contracts are treated as separate instruments when their risks and characteristics are not closely related to those of host contracts and the host contracts are not carried at fair value with unrealised gains or losses reported in the income statement.
AURORA ENERGY 2015 ANNUAL REPORT 31

Notes To The Financial Statementsfor the year ended 30 June 2015 – continued
2 SIGNIFICANT ACCOUNTING POLICIES - continued
PROVISIONS
A provision is recognised in the balance sheet when the Company has a present legal or constructive obligation as a result of a past event, and it is probable that an outflow of economic benefits will be required to settle the obligation.
CHANGES IN ACCOUNTING POLICIES
There have been no changes in accounting policies during the financial year, as the below standards introduced or amended which were relevant to the Company did not have a material impact.
STANDARDS AMENDED OR ISSUED DURING THE YEAR
During the year the following accounting standards which were relevant to the Company became effective or were amended.
STANDARD BRIEF OVERVIEW OF EFFECT ON THE COMPANY
Amendments to NZ IAS 32 The key change from the amendment is the introduction of additional criterion Offsetting Financial Assets that must be met to demonstrate that an entity “currently has legally enforceable and Financial Liabilities right to set off the recognised amounts” and that an entity “intends either to settle on a net basis, or to realise the asset and settle the liability simultaneously”. The Company “sets off” Cash flow hedge instruments as these assets are legally entitled to be offset and could be settled simultaneously.
Amendments to NZ IFRSs IAS 24 Key Management Personnel (KMP) Services – extended the definition arising from the Annual of a ‘related party’ to include management entities. Payments made to a Improvements Project management entity in respect of KMP should be disclosed separately. Some (2010-2012) of the Company’s Directors are paid through a management entity for their director services. This information is disclosed and was already disclosed prior to this amendment.
STANDARDS ISSUED BUT NOT YET EFFECTIVE
The following accounting standards are relevant to the Company, but as they are not yet compulsory have not been adopted.
STANDARD BRIEF OUTLINE
Amendments to NZ IAS 27 Amendments reinstate the equity method as an accounting option forEquity method in separate investments in subsidiaries, joint ventures and associates. Aurora Energy Ltd no financial statements longer has any subsidiaries, joint ventures or associates, but may do in the future. Adoption date: periods Any amendments will be reflected in the treatment and disclosure of these beginning on or after transactions going forward. 1 January 2016
32 AURORA ENERGY 2015 ANNUAL REPORT

Notes To The Financial Statementsfor the year ended 30 June 2015 – continued
2 SIGNIFICANT ACCOUNTING POLICIES - continued
STANDARD BRIEF OUTLINE
Amendments to NZ IAS 1 Changes were made in the following areas to provide clarity for preparers inDisclosure initiatives exercising judgement when presenting their financial reports. Clarification wasAdoption date: periods provided around: beginning on or after • Materiality in the preparation of the financial statements and when it should 1 January 2016 be applied, • The aggregation of line items in the financial statements, and • Note ordering.
The Company will review the new clarifications and ensure the financial statements are appropriately presented. For example, whether notes are in the appropriate order, if materiality has reasonably been used in notes such as the related party note 26 and whether line items on the face of the financial statements were reasonably grouped. No material changes are envisaged.
Amendments to NZ IAS 15 The amendments establish principles for reporting useful information to usersRevenue from Contracts of financial statements about the nature, amount, timing and uncertainty of and Customers revenue and cash flows arising from an entity’s contracts with customers. ThisAdoption date: periods amendment is unlikely to have a major impact on the recognition and reporting beginning on or after of the Company’s revenue. The Company will however review revenue to ensure 1 January 2017 that it is recognised in line with the revised standards and contracts in place.
NZ IFRS 9 (2010) A revised version of NZ IFRS 9 will be released which includes changes to hedge Financial Instruments effectiveness testing, treatment of hedging costs, risk components that can be Adoption date: periods hedged and disclosures. Entities may elect to apply only the accounting for beginning on or after gains and losses from own credit risk without applying the other requirements of 1 January 2018 NZ IFRS 9 at the same time. The Company does not expect any material changes to current treatment or disclosure of its Financial Instruments.
2015 2014 $000 $000
3 OPERATING REVENUE
Sales revenue 98,503 91,878
Avoided transmission constraint and loss revenue 949 1,011
99,452 92,889
4 FINANCIAL REVENUE
Interest and dividends received 10 6
AURORA ENERGY 2015 ANNUAL REPORT 33

Notes To The Financial Statementsfor the year ended 30 June 2015 – continued
2015 2014
$000 $000
5 OTHER EXPENSES Included in the operating expenses of the Company are the following items:
Audit fees
- for audit of financial statements 39 38
- for audit services in relation to regulatory (information disclosure) reporting
- current year 18 18
- prior year 0 20
- for audit services in relation to price and quality thresholds and other regulatory reporting 14 14
Total audit fees 71 90
Transmission costs 33,041 29,671
Depreciation 13,565 13,039
Maintenance costs 13,898 11,384
Other contractor costs 472 842
Directors’ fees 104 107
Bad debts written off 13 59
Lease expense 67 88
Loss on disposal of plant and equipment 0 361
Increase/(decrease) in provision for doubtful, trade and other receivables 10 (49)
6 FINANCIAL EXPENSES Interest - other 0 1
Interest - related parties 9,479 9,311
Interest amortised from cash flow hedge close out 3 12
Total financial expenses 9,482 9,324
7 LEASE COMMITMENTS Non-Cancellable Operating Lease Commitments
Payable within one year 58 57
Payable between one to five years 123 51
Payable later than five years 85 87
266 195
34 AURORA ENERGY 2015 ANNUAL REPORT

Notes To The Financial Statementsfor the year ended 30 June 2015 – continued
2015 2014
$000 $000
8 DIVIDENDS
Interim dividend December $0.250/share ($0.300, 2014) 2,500 3,000
Final dividend June $0.175/share ($0.175, 2014) 1,750 1,750
June $0.050/share ($0.000, 2014) 500 0
$0.475 per share for 2015 ($0.475, 2014) 4,750 4,750
9 INCOME TAX
Operating profit before income tax 11,128 10,732
Tax thereon at 28% (2014: 28%) 3,116 3,005
Plus / (Less) the tax effect of differences
Revenue not liable for taxation 0 (40)
Expenditure (deductible)/non-deductible for taxation purposes 16 72
Under/(over) tax provision in prior years (180) 45
Tax effect of differences (164) 77
Tax expense 2,952 3,082
Represented by
Current tax provision 1,659 1,570
Deferred tax provision 1,473 1,467
Under/(over) tax provision in prior years (180) 45
Income tax 2,952 3,082
Effective tax rate 26.5% 28.7%
IMPUTATION CREDIT ACCOUNT
Aurora Energy Limited is a member of an income tax consolidated group and has access to the income tax consolidated group’s imputation credit account.
AURORA ENERGY 2015 ANNUAL REPORT 35

Notes To The Financial Statementsfor the year ended 30 June 2015 – continued
2015 2014
10 EARNINGS PER SHARE Basic earnings per share is calculated by dividing the net profit/(loss) attributable to the Shareholder of the Company by the weighted average number of ordinary shares on issue during the year.
Number of shares
Weighted average number of ordinary shares 10,000,000 10,000,000
Basic earnings per share in dollars 0.82 0.77
2015 2014 $000 $000
11 EQUITY - Share Capital
Issued capital - 10,000,000 ordinary shares 10,000 10,000
12 CASH FLOW HEDGE RESERVE Balance at beginning of the year 955 877
Net revaluations (2,584) 97
Cash flow hedge closed out 3 10
Deferred tax arising on hedges (note 17) 722 (29)
Balance at end of the year (904) 955
The cash flow hedge reserve is comprised of the cumulative net change in the fair value of effective cash flow hedging instruments relating to interest payments that have not yet occurred and the value received from cash flow hedges that have been closed out and which relate to future periods.
36 AURORA ENERGY 2015 ANNUAL REPORT

Notes To The Financial Statementsfor the year ended 30 June 2015 – continued
2015 2014
$000 $000
13 RETAINED EARNINGS Balance at beginning of the year 170,028 167,128
Net profit for the year 8,176 7,650
Dividend distributions (4,750) (4,750)
Balance at end of the year 173,454 170,028
14 TRADE AND OTHER PAYABLES
Trade payables 5,406 4,808
Due to related parties - other 9,815 7,673
- Dunedin City Holdings Limited 0 0
15,221 12,481
The Directors consider that the carrying amount of trade payables approximates their fair value. Creditors and other payables are non-interest bearing and are normally settled on 30-day terms.
15 OTHER CURRENT ASSETS
GST receivable 624 68
624 68
16 TERM BORROWINGS (secured)
Dunedin City Treasury Limited - related party 155,500 138,800
The term borrowings are secured by a General Security Agreement over all the assets of the Company. Currently, the Company has a facility available of $160.0 million.
The repayment periods on the term borrowings are:
Repayable between one to two years 0 0
Repayable between two to five years 155,500 138,800
The weighted average interest rate for the loan inclusive of any current portion, was 6.26% (2014: 6.59%).
AURORA ENERGY 2015 ANNUAL REPORT 37

Notes To The Financial Statementsfor the year ended 30 June 2015 – continued
17 DEFERRED TAX Closing Closing Closing Opening Balance Balance Balance Balance Charged Charged Sheet Sheet Sheet Sheet to Equity to Income Assets Liabilities Net $000 $000 $000 $000 $000 $000
YEAR ENDED 30 JUNE 2015:
Property, plant and equipment (53,301) 0 (429) 0 (53,730) (53,730)
Provisions (3,350) 0 (822) 44 (4,216) (4,172)
Revaluations of interest rate swaps (370) 722 0 352 0 352
Close out of interest rate swaps 0 0 0 1 (1) 0
Balance at end of the year (57,021) 722 (1,251) 397 (57,947) (57,550)
YEAR ENDED 30 JUNE 2014:
Property, plant and equipment (52,742) 0 (559) 0 (53,301) (53,301)
Provisions (2,450) 0 (900) 26 (3,376) (3,350)
Revaluations of interest rate swaps (344) (26) 0 0 (370) (370)
Close out of interest rate swaps 0 (3) 3 1 (1) 0
Balance at end of the year (55,536) (29) (1,456) 27 (57,048) (57,021)
2015 2014 $000 $000
18 CASH AND CASH EQUIVALENTS Cash and bank 34 57
34 57
Cash and short-term deposits comprise cash held by the Company and short-term bank deposits with an original maturity of three months or less. The carrying amount of these assets approximates their fair value. Short term deposits are made at call deposit rates.
38 AURORA ENERGY 2015 ANNUAL REPORT

Notes To The Financial Statementsfor the year ended 30 June 2015 – continued
2015 2014
$000 $000
19 TRADE AND OTHER RECEIVABLES Trade receivables 12,710 11,643
Less estimated impairment (104) (94)
12,606 11,549
Due from related parties
- Dunedin City Council and Group entities 145 7
- other related parties 1 2
12,752 11,558
The Directors consider that the carrying amount of the trade and other receivables approximates their fair value. The estimated doubtful debts provision relates entirely to individually impaired trade receivable balances.
Past due, but not impaired, receivables are:
Age analysis: 30-60 days 15 21 60-90 days 8 39 90 days plus 313 204
336 264
20 INVESTMENTS Investments – listed companies 10 10
10 10
Investments – listed companies
The Company has acquired small shareholdings in several listed electricity-sector companies. These holdings are considered long-term.
21 CASH FLOW HEDGE INSTRUMENTS
Interest rate swaps revaluations - receivable/(payable) (1,261) 1,323
(1,261) 1,323
22 INVENTORIES
Network spare parts 8 8
8 8
AURORA ENERGY 2015 ANNUAL REPORT 39

Notes To The Financial Statementsfor the year ended 30 June 2015 – continued
23 PROPERTY, PLANT AND EQUIPMENT Optical Plant Motor Office Fibre Construction Land Buildings Network Equipment Vehicles Equipment Network in Progress Total $000 $000 $000 $000 $000 $000 $000 $000 $000
YEAR ENDED 30 JUNE 2015:
Cost Balance at beginning of year 5,282 11,530 450,530 2,224 191 16 4,948 9,195 483,916
Purchases 0 0 23,814 19 0 0 0 11,588 35,421
Disposals 0 0 0 0 0 0 0 0 0
Transfers 0 0 0 0 0 0 14 (14) 0
Total cost 5,282 11,530 474,344 2,243 191 16 4,962 20,769 519,337
Accumulated depreciation Balance at beginning of year 0 1,488 102,401 1,623 64 16 549 0 106,141
Depreciation 0 130 13,136 137 10 0 152 0 13,565
Disposals 0 0 0 0 0 0 0 0 0
Total accumulated depreciation 0 1,618 115,537 1,760 74 16 701 0 119,706
Balance at end of year 5,282 9,912 358,807 483 117 0 4,261 20,769 399,631
YEAR ENDED 30 JUNE 2014:
Cost Balance at beginning of year 4,929 11,530 428,443 2,195 191 16 4,960 10,899 463,163
Purchases 353 0 20,868 29 0 0 11 0 21,261
Disposals 0 0 (485) 0 0 0 (23) 0 (508)
Transfers 0 0 1,704 0 0 0 0 (1,704) 0
Total cost 5,282 11,530 450,530 2,224 191 16 4,948 9,195 483,916
Accumulated depreciation Balance at beginning of year 0 1,358 89,907 1,487 53 16 400 0 93,221
Depreciation 0 130 12,612 136 11 0 151 0 13,040
Disposals 0 0 (118) 0 0 0 (2) 0 (120)
Total accumulated depreciation 0 1,488 102,401 1,623 64 16 549 0 106,141
Balance at end of year 5,282 10,042 348,129 601 127 0 4,399 9,195 377,775
The Directors assess the fair value of land and buildings as the carrying value shown above.
40 AURORA ENERGY 2015 ANNUAL REPORT

Notes To The Financial Statementsfor the year ended 30 June 2015 – continued
2015 2014 $000 $000
24 CAPITAL EXPENDITURE COMMITMENTS
Capital expenditure contracted for at balance date but not provided for in the financial statements 18,191 13,513
18,191 13,513
25 RECONCILIATION OF NET PROFIT FOR THE YEAR TO CASH FLOWS FROM OPERATING ACTIVITIES
Net profit/(loss) for the year 8,176 7,650
Items not involving cash flows
Depreciation 13,565 13,039
Increase/(decrease) in deferred tax 529 1,485
Other non-cash items (1,859) 78
Increase/(decrease) in cash flow hedge valuation 2,584 (97)
Impact of changes in working capital items
(Increase)/decrease in trade and other receivables (1,194) (816)
Increase/(decrease) in trade and other payables 2,740 2,512
Increase (decrease) in provision for tax (194) (312)
(Increase)/decrease in other current assets (556) (306)
(Increase)/decrease in inter Company advance (343) 1,178
Items classified as investing or financing activities
Capital creditors in accounts payable (3,056) (494)
Loss/(gain) on disposal of property, plant and equipment 0 361
Net cash inflows/(outflows) from operating activities 20,392 24,278
AURORA ENERGY 2015 ANNUAL REPORT 41

Notes To The Financial Statementsfor the year ended 30 June 2015 – continued
26 RELATED PARTY TRANSACTIONSThe Company is a wholly owned subsidiary of Dunedin City Holdings Limited. Dunedin City Holdings Limited is wholly owned by Dunedin City Council.
TRANSACTIONS WITH DUNEDIN CITY COUNCIL
The Company undertakes transactions with Dunedin City Council and other Dunedin City Council controlled entities. These transactions are made on commercial terms and conditions at market rates. During the period, the Company provided services and traded with Dunedin City Council Group in respect of the following transactions:
YEAR ENDED 30 JUNE 2015 2014 $000 $000
Purchases of goods and services from Dunedin City Holdings Limited:
Management fees 200 200
Subvention/tax loss offset payment 247 0
447 200
Purchases of goods and services from Dunedin City Council:
Rates and property leases 783 453
Subvention/tax loss offset payment 303 0
1,086 453
Purchases of goods and services from other Dunedin City Council Group entities:
Capital work 24,096 15,661
Network management and operation 20,226 17,502
Interest/facility fees 9,479 9,311
Subvention/tax loss offset payments 512 1,866
Contracting services 837 1,279
Management fees 119 100
Accounting, administration and secretarial 265 263
Sundry and consulting 54 77
Lease of meters 46 45
Subvention expense purchased 7,292 7,292
62,926 53,396
The subvention expense of $7.292 million was made to another company within the Dunedin City Council Group of companies for the purchase of tax losses of $7.292 million.
42 AURORA ENERGY 2015 ANNUAL REPORT

Notes To The Financial Statementsfor the year ended 30 June 2015 – continued
2015 2014
$000 $000
26 RELATED PARTY TRANSACTIONS - continued
At period end the amounts payable by Aurora to Group entities:
Dunedin City Holdings Limited 0 0
Other Dunedin City Council Group entities 166,576 146,473
166,576 146,473
Sales of services to Dunedin City Council:
Other 40 40
40 40
Sales of services to Dunedin City Council Group entities:
Rent 26 26
Service failure penalties 224 54
Other 22 20
272 100
At period end, the amounts receivable by Aurora Energy Limited from Dunedin City Council Group entities are:
Dunedin City Council 4 4
Other Dunedin City Council Group entities: 541 1,382
No related party debts have been written off or forgiven during the year and no provision has been required for impairment of any receivables to related parties.
Aurora Energy Limited undertakes transactions with other related parties in the normal course of business and on an arm’s length commercial basis.
TRANSACTIONS WITH COMPANIES IN WHICH DIRECTORS HAVE AN INTEREST:
Mr S J McLauchlan is Pro Chancellor of the University of Otago. In the ordinary course of business during the financial period covered by this report, services valued at $22,066 were provided to the University of Otago (2014: $23,364). $746 was outstanding at 30 June 2015 (2014: $2,239).
Mr McLauchlan is a Director and Shareholder of Rosebery Holdings Limited. During the financial period covered by this report, services of $23,756 were purchased from Rosebery Holdings Limited (2014: $24,375). No monies were outstanding at 30 June 2015 (2014: nil).
Mr D J Frow is a Director of ETEL Limited. During the financial period covered by this report, services of $53,448 were purchased from ETEL Limited (2014: nil). No monies were outstanding at 30 June 2015 (2014: nil).
Mr T J Kempton is a Councillor on Otago Regional Council. During the financial period covered by this report, services to the value of $26,434 were provided to Otago Regional Council (2014: $23,787). No monies were outstanding at 30 June 2015 (2014: nil).
Mr Kempton is a Director and Shareholder of Long Beach Consulting Limited. During the financial period covered by this report, services of $20,756 were purchased from Long Beach Consulting Limited (2014: $13,667). No monies were outstanding at 30 June 2015 (2014: nil).
AURORA ENERGY 2015 ANNUAL REPORT 43

Notes To The Financial Statementsfor the year ended 30 June 2015 – continued
27 FINANCIAL INSTRUMENT RISKDunedin City Treasury Limited, which is part of the Dunedin City Holdings Group, coordinates access to domestic financial markets for all group members, and provides advice on the management of financial instrument risks to the Company. These risks include interest rate risk, credit risk and liquidity risk.
INTEREST RATE RISK
The Company uses interest rate swap agreements to manage its exposure to interest rate movements on its short-term borrowings by swapping a proportion of those borrowings from floating rates to fixed rates. The treasury policy requires that the amount of the interest hedged is within a series of ranges in set future time periods.
A large part of the Company’s debt is borrowed on a long-term fixed interest rate basis.
The notional principal outstanding with regard to the interest rate swaps is:
2015 2014 $000 $000
Maturing in less than one year 0 0
Maturing between one and five years 0 0
Maturing after five years 50,000 50,000
50,000 50,000
CREDIT RISK
Credit risk on liquid funds and cash flow hedge instruments is limited through the counterparties being banks with high credit ratings assigned by international credit-rating agencies.
The Company’s credit risk is primarily attributable to its trade receivables. The amounts presented in the balance sheet are net of allowances for impairment.
The Company has no significant concentration of credit risk. The exposure is spread over a large number of counterparties.
The carrying amount of financial assets recorded in the financial statements represents the Company’s maximum exposure to credit risk.
The Company’s maximum credit risk for each class of financial instrument is:
2015 2014 $000 $000
Cash and cash equivalents 34 57
Trade and other receivables 12,752 11,558
Short term investments 10 10
Inter company advances 399 56
13,195 11,681
44 AURORA ENERGY 2015 ANNUAL REPORT

Notes To The Financial Statementsfor the year ended 30 June 2015 – continued
27 FINANCIAL INSTRUMENT RISK - continued
CREDIT QUALITY OF FINANCIAL ASSETS
The credit quality of financial assets that are neither past due nor impaired can be assessed by reference to Standard & Poor’s credit ratings (if available) or to historical information about counterparty default rates.
2015 2014 $000 $000
Counterparties with credit ratings
Cash and cash equivalents AA- 34 57
Trade and other receivables AA- 4 4
Counterparties without credit ratings
Trade and other receivables Existing counterparties with no defaults in the past 12,852 11,648
Investment Existing counterparties with no defaults in the past 10 10
LIQUIDITY RISK
Liquidity risk represents the Company’s ability to meet its contractual obligations. The Company evaluates its liquidity requirements on an ongoing basis. In general, the Company generates sufficient cash flows from its operating activities to meet its obligations arising from its financial liabilities and ensures it has credit lines in place to cover potential shortfalls.
The Company maintains credit management and accounts receivable processes aimed at collecting all trade debtors and other receivable balances in cash by their agreed date(s) for payment.
AURORA ENERGY 2015 ANNUAL REPORT 45

Notes To The Financial Statementsfor the year ended 30 June 2015 – continued
27 FINANCIAL INSTRUMENT RISK - continued
The following table analyses the exposure of the Company’s financial assets and liabilities to liquidity risk as at 30 June 2015.
Contractual obligations in respect of interest expense on term borrowings, have not been included in the liquidity risk table as the term debt does not have a contractual end date and the interest is currently payable on a month-by-month basis. Details of the term loan balance and effective interest rate are included in note 16.
The Company’s assets and liabilities are shown at their contractual and carrying values.
Less than 1 to 3 3 Months 1 to 5 More than No 1 Month Months to 1 Year Years 5 Years Maturity Total Maturity Dates $000 $000 $000 $000 $000 $000 $000
Financial assets
Cash and cash equivalents 34 0 0 0 0 0 34
Trade and other receivables 12,752 0 0 0 0 0 12,752
Long term investments 0 0 0 0 0 10 10
Inter Company advance 0 0 399 0 0 0 399
Other current assets 624 0 0 0 0 0 624
13,410 0 399 0 0 10 13,819
Financial liabilities
Trade and other payables 15,221 0 0 0 0 0 15,221
Other current liabilities 0 0 0 0 0 0 0
Taxation payable 0 0 1,376 0 0 0 1,376
Term borrowings 0 0 0 0 0 155,500 155,500
Cash flow hedge 0 0 1,261 0 0 0 1,261
15,221 0 2,637 0 0 155,500 173,358
The following table analyses the exposure of the Company’s financial assets and liabilities to liquidity risk as at 30 June 2014:
Less than 1 to 3 3 Months 1 to 5 More than No 1 Month Months to 1 Year Years 5 Years Maturity Total Maturity Dates $000 $000 $000 $000 $000 $000 $000
Financial assets
Cash and cash equivalents 57 0 0 0 0 0 57
Trade and other receivables 11,558 0 0 0 0 0 11,558
Long term investments 0 0 0 0 0 10 10
Inter Company advance 0 0 56 0 0 0 56
Cash flow hedge 0 0 1,323 0 0 0 1,323
11,615 0 1,379 0 0 10 13,004
Financial liabilities
Trade and other payables 12,481 0 0 0 0 0 12,481
Other current liabilities (68) 0 0 0 0 0 (68)
Taxation payable 0 0 1,570 0 0 0 1,570
Term borrowings 0 0 0 0 0 138,800 138,800
12,413 0 1,570 0 0 138,800 152,783
46 AURORA ENERGY 2015 ANNUAL REPORT

Notes To The Financial Statementsfor the year ended 30 June 2015 – continued
27 FINANCIAL INSTRUMENT RISK - continued
SENSITIVITY ANALYSIS
The table below illustrates the potential profit and loss and equity (excluding retained earnings) impact for the reasonably possible market movements, with all other variables held constant, based on the Company’s financial instrument exposures at the balance date.
Based on historic movements and volatilities, market interest rate movements of plus or minus 1% (100bps) have been used in this analysis.
Fair Value at +100bps -100bps Balance Date Profit Equity Profit Equity $000 $000 $000 $000 $000
Financial liabilities
Cash flow hedge instruments 1,261 0 2,123 0 (2,299)
Term borrowings (unhedged) 65,500 (655) 0 655 0
66,761 (655) 2,123 655 (2,299)
FAIR VALUE OF FINANCIAL INSTRUMENTS
Fair value measurements recognised in the statement of financial position.
The following table provides an analysis of financial instruments that are measured subsequent to initial recognition at fair value, grouped into Levels 1 to 3 based on the degree to which the fair value is observable:
Level 1 Fair value measurements are those derived from quoted prices (unadjusted) in active markets for identical assets or liabilities.
Level 2 Fair value measurements are those derived from inputs other than quoted prices included within Level 1 that are observable for the asset or liability, either directly (i.e. as prices) or indirectly (i.e. derived from prices).
Level 3 Fair value measurements are those derived from valuation techniques that include inputs for the asset or liability that are not based on observable market data (unobservable inputs).
2015
Level 1 Level 2 Level 3 Total $000 $000 $000 $000
Financial liabilities/(assets)
Derivative financial liabilities 0 1,261 0 1,261
0 1,261 0 1,261
2014
Level 1 Level 2 Level 3 Total $000 $000 $000 $000
Financial liabilities/(assets)
Derivative financial liabilities 0 (1,323) 0 (1,323)
0 (1,323) 0 (1,323)
AURORA ENERGY 2015 ANNUAL REPORT 47

Notes To The Financial Statementsfor the year ended 30 June 2015 – continued
28 SEGMENT REPORTINGAurora Energy Limited operates in the electricity distribution sector in the Otago geographical area of New Zealand.
29 CAPITAL MANAGEMENT STRATEGYThe capital of the Company is its equity, which is comprised of subscribed capital and retained earnings and cash flow hedge reserves. Equity is represented by net assets. The Company manages its capital to ensure that it will be able to continue to operate as a going concern and optimises the balance of debt to equity on a prudent basis in consultation with its Shareholder.
The Directors of the Company perform continual reviews of its operating strategies, and financial performance and include in these reviews any strategies required to protect the capital of the Company. The Directors seek to maximise overall returns to the Shareholder of the Company in the medium term, and to maintain the Company’s financial strength.
The Company is required to provide to its Shareholder an annual Statement of Intent. This Statement of Intent includes information on planned distributions by way of dividend for the following three years.
31 EVENTS AFTER BALANCE DATEThere were no significant events after balance date.
48 AURORA ENERGY 2015 ANNUAL REPORT

Independent Auditor’s Report
To the readers ofAurora Energy Limited’s
financial statements and statement of service performancefor the year ended 30 June 2015
The Auditor General is the auditor of Aurora Energy Limited (the company). The Auditor General has appointed me, Ian Lothian, using the staff and resources of Audit New Zealand, to carry out the audit of the financial statements and the statement of service performance of the company on her behalf.
Opinion
Financial statements and the statement of service performance
We have audited:
• the financial statements of the company on pages 20 to 48, that comprise the balance sheet as at 30 June 2015, the statement of comprehensive income, statement of changes in equity and statement of cash flows for the year ended on that date and the notes to the financial statements that include accounting policies and other explanatory information; and
• the statement of service performance of the company on pages 9 to 11.
In our opinion:
• the financial statements of the company:
˚ present fairly, in all material respects:
· its financial position as at 30 June 2015; and
· its financial performance and cash flows for the year then ended; and
˚ have been prepared in accordance with New Zealand equivalents to International Financial Reporting Standards and International Financial Reporting Standards.
• the statement of service performance of the company:
˚ presents fairly, in all material respects, the company’s achievements measured against the performance targets adopted for the year ended 30 June 2015; and
˚ has been prepared in accordance with generally accepted accounting practice.
Our audit was completed on 27 August 2015. This is the date at which our opinion is expressed.
The basis of our opinion is explained below. In addition, we outline the responsibilities of the Board of Directors and our responsibilities, and explain our independence.
AURORA ENERGY 2015 ANNUAL REPORT 49

Independent Auditor’s Report
Basis of opinion
We carried out our audit in accordance with the Auditor General’s Auditing Standards, which incorporate the International Standards on Auditing (New Zealand). Those standards require that we comply with ethical requirements and plan and carry out our audit to obtain reasonable assurance about whether the financial statements and the statement of service performance are free from material misstatement.
Material misstatements are differences or omissions of amounts and disclosures that, in our judgement, are likely to influence readers’ overall understanding of the financial statements and the statement of service performance. If we had found material misstatements that were not corrected, we would have referred to them in our opinion.
An audit involves carrying out procedures to obtain audit evidence about the amounts and disclosures in the financial statements and in the statement of service performance. The procedures selected depend on our judgement, including our assessment of risks of material misstatement of the financial statements and the statement of service performance whether due to fraud or error. In making those risk assessments, we consider internal control relevant to the preparation of the company’s financial statements and statement of service performance in order to design audit procedures that are appropriate in the circumstances but not for the purpose of expressing an opinion on the effectiveness of the company’s internal control.
An audit also involves evaluating:
• the appropriateness of accounting policies used and whether they have been consistently applied;
• the reasonableness of the significant accounting estimates and judgements made by the Board of Directors;
• the adequacy of the disclosures in the financial statements and in the statement of service performance; and
• the overall presentation of the financial statements and the statement of service performance.
We did not examine every transaction, nor do we guarantee complete accuracy of the financial statements and the statement of service performance. Also we did not evaluate the security and controls over the electronic publication of the financial statements and the statement of service performance.
We believe we have obtained sufficient and appropriate audit evidence to provide a basis for our audit opinion.
AUDITOR’S REPORT
50 AURORA ENERGY 2015 ANNUAL REPORT

Independent Auditor’s Report
Responsibilities of the Board of Directors
The Board of Directors is responsible for the preparation and fair presentation of financial statements and a statement of service performance for the company, in accordance with New Zealand equivalents to International Financial Reporting Standards and International Financial Reporting Standards and generally accepted accounting practice.
The Board of Directors is also responsible for such internal control as it determines is necessary to enable the preparation of financial statements and a statement of service performance that are free from material misstatement, whether due to fraud or error. The Board of Directors is also responsible for the publication of the financial statements and the statement of service performance, whether in printed or electronic form.
The Board of Directors’ responsibilities arise from the Energy Companies Act 1992.
Responsibilities of the Auditor
We are responsible for expressing an independent opinion on the financial statements and the statement of service performance and reporting that opinion to you based on our audit. Our responsibility arises from section 15 of the Public Audit Act 2001 and section 45(1) of the Energy Companies Act 1992.
Independence
When carrying out the audit, we followed the independence requirements of the Auditor General, which incorporate the independence requirements of the External Reporting Board.
In addition to the audit we have carried out assignments in regards to the Annual Compliance Statement and the Electricity Distribution Information Disclosure Requirements, which are compatible with those independence requirements. Other than the audit and these assignments, we have no relationship with or interests in the company.
Ian Lothian Audit New ZealandOn behalf of the Auditor GeneralChristchurch, New Zealand
AURORA ENERGY 2015 ANNUAL REPORT 51

DIRECTORSDr Ian Parton (Chair).
David Frow
Trevor Kempton
Stuart McLauchlan
CHIEF EXECUTIVEGrady Cameron
COMPANY SECRETARYGary Dixon
REGISTERED OFFICE10 Halsey Street
Dunedin
New Zealand
BANKERWestpac Banking Corporation
SOLICITORGallaway Cook Allan
AUDITORAudit New Zealand on behalf of the Controller and Auditor-General
TAXATION ADVISORDeloitte
Company Directory
52 AURORA ENERGY 2015 ANNUAL REPORT

Lindis Crossing substation
AURORA ENERGY 2015 ANNUAL REPORT 53

AuroraE N E R G Y L I M I T E D