® ® contributor session on smart mobility performance measures
Post on 18-Dec-2015
218 views
TRANSCRIPT

®
®
Contributor Session on Smart Mobility Performance Measures

2
®
®
Session Objectives
Clarify the Performance Measures and their applications
Evaluate effectiveness through case studies
Provide feedback on appropriateness, clarity and consequences

Smart Mobility Performance Measures (part 1)
®
®
3
Conventional Measure Smart Mobility Measure
SafetyAccident Rates and Severity Modal Accident Rates, Severity
Design Speed Speed Suitability
Mobility
Highway Travel-Time Mobility Modal Travel-Time Mobility
Highway Travel-Time Consistency
Modal Travel-Time Consistency
General Accessibility Activity Connectedness
ADA Accessibility Universal Accessibility (ADA)
Ped & Bike Mode Share Ped & Bike Mode Share
Transit Mode Share Transit Mode Share
Economy
Time Lost to Congestion (VHD) Productivity Lost to Congestion
Capacity, Volume/Capacity Network Optimization
Return on Investment (ROI) ROI Nexus

Smart Mobility Performance Measures (part 2)
®
®
4
Conventional Measure Smart Mobility Measure
Environmental Quality
Vehicle Miles TraveledVMT per capita relative to AB32
Target
Fuel Consumption Energy Consumption
Emissions Emissions, including CO2
Noise Impacts Noise Impacts
Reductions in Ag, Wetlands Land Use Efficiency
Customer Satisfaction
Level of Service Multi-Modal LOS
Speed and Delay Multi-Modal Accessibility

5
®
®
Case Studies
1. RTP with SCS(SB 375 Sustainable Communities Strategy)
2. Context Sensitive Design
3. Corridor System Management Plan

6
®
®
Case #1: RTP + SCS
6
Coordinate transportation (RTP) and land use planning (SCS) to achieve: acceptable levels of travel accessibility regional economic vitalitycost-effective infrastructure investments minimal environmental impacts, induced travelConformity with AB32 and SB375

7
®
®
Case #1 Comparison of Alternatives
Alt A:
Trend-Line Land Use and Transportation
Alt B:
SCS for Transportation and Land Use
Description Almost all growth occurs in suburban and rural areas as single uses rather than mixed-use sites Attempts to add highway capacity and systems management to keep pace with development trend
Growth plan takes advantage of existing transportation and opportunity sites for infill, TOD and mixed-use.
Tailors transportation plan with multi-modal services, providing accessibility to planned growth areas

8
®
®
Case #1 Comparison of Alternatives
Alt A:
Trend-Line Land Use and Transportation
Alt B:
SCS for Transportation and Land Use
Advantages
Follows developer and local government planning practices of recent decades
Invests in highway capacity to reduce congestion to benefit goods movement and essential personal mobility
Reduces VMT/capita and GHG as required under AB32, SB375
Economic investment in central areas sites with potential benefits to environment, socio-economic equity
Responds to demographic shifts
9
®
®
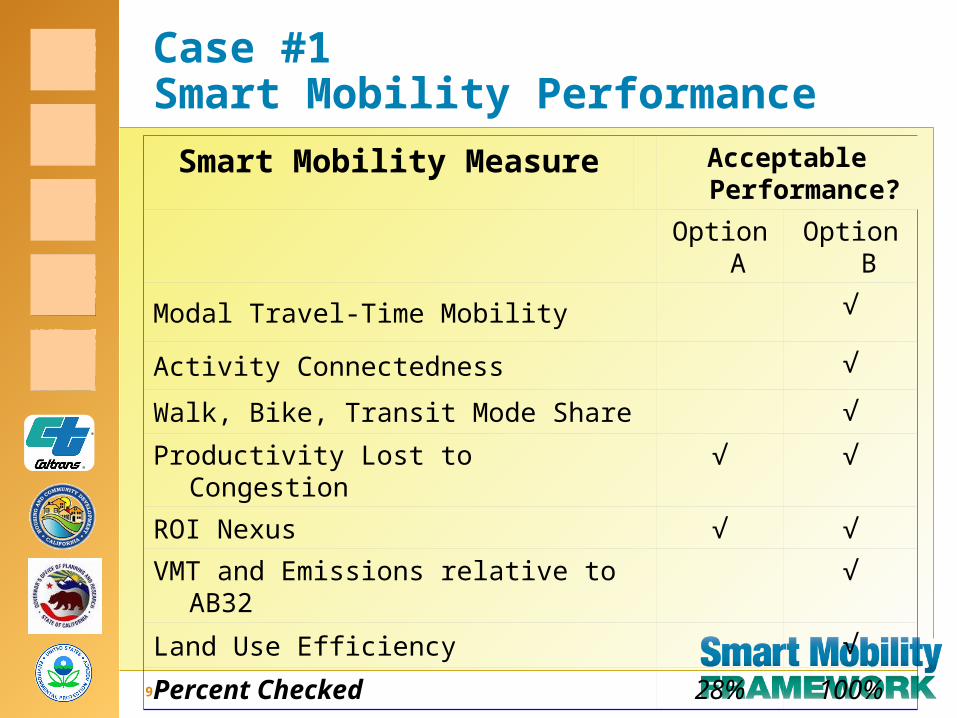
Case #1 Smart Mobility Performance
Smart Mobility Measure Acceptable Performance?
Option A Option B
Modal Travel-Time Mobility √
Activity Connectedness √
Walk, Bike, Transit Mode Share √
Productivity Lost to Congestion √ √
ROI Nexus √ √
VMT and Emissions relative to AB32 √
Land Use Efficiency √
Percent Checked 28% 100%

10
®
®
Case #2: Context Sensitive Design
10
Arterial creates barrier and economic disincentive through established community
Goal to improve safety and convenience for travelers and affected community and sustain community value

Comparison of Alternatives
®
®
11
Alternative A:Conventional Re-Design
Alternative B:Context Sensitive Design
Description Add lanes at intersections as needed to improve traffic LOS
Time traffic signals to accommodate 45mph speeds with minimal delays
Narrow traffic lanes to allow bike lanes or wider sidewalks and landscaping
Redesign for 30mph through alignment curvatures and traffic signals timing
Advantages Improves travel time mobility
Improves bus on-time performance
Reduces emissions
Traffic speeds compatible with adjoining uses
Improves pedestrian environment, economic vitality
Reduces emissions

Case #2Illustrative Performance Evaluation
®
®
12
Smart Mobility Measure Acceptable Performance?
Option A Option B
Speed Suitability √
Multi-Modal Mobility √
Ped and Bike Mode Share √
Network Management √ √
Emissions √ √
Land Use Efficiency √
Multi-Modal Level of Service √
Percent Checked 28% 100%
13
®
®
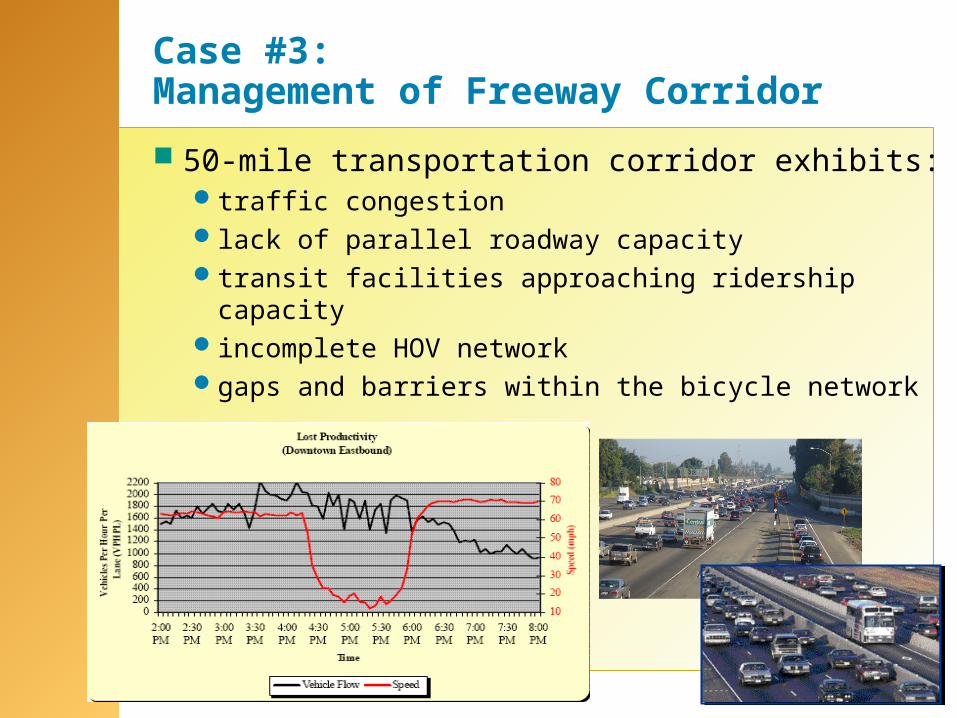
Case #3: Management of Freeway Corridor
13
50-mile transportation corridor exhibits: traffic congestion lack of parallel roadway capacity transit facilities approaching ridership capacity incomplete HOV network gaps and barriers within the bicycle network

14
®
®
Difference in Performance Measures
Compared with CSMP, Smart Mobility measures emphasize safety and service for all modes of travel
Smart Mobility measures consider growth and travel inducement impacts of highway capacity increases, and
Resulting growth in emissions relative to climate law.

15
®
®
Three Questions
1. Are performance measures understandable and relevant to the evaluation?
2. Are the measures effective in determining which project alternative is most consistent with Smart Mobility principles?
3. Are there any biases in the set of measures to be corrected through revision to individual measures or the entire set?