copyright 2009 coastal ocean monitoring center. all right reserved. 0 deep-water oceanographic...
TRANSCRIPT

Copyright 2009 Coastal Ocean Monitoring Center. All right reserved.
http://www.comc.ncku.edu.tw 1
Deep-Water Oceanographic Buoys:Deployments, Measurements, Outcomes
Wind Sea and Swells Characteristics Derived from the Deep-Water Buoy at Western North
Pacific
Ching-Jer Huang
Coastal Ocean Monitoring CenterDepartment of Hydraulic and Ocean Engineering
National Cheng Kung UniversityTainan, Taiwan
May 5-6, 2014

Copyright 2009 Coastal Ocean Monitoring Center. All right reserved.
http://www.comc.ncku.edu.tw 2
Contents:
I. Backgrounds
II. Ocean Monitoring System in Taiwan
III. Applications of the Ocean Monitoring System
IV. Deep-Water Buoy
V. Characteristics of Wind Sea and Swells
VI. Conclusions
Copyright 2009 Coastal Ocean Monitoring Center. All right reserved.
http://www.comc.ncku.edu.tw 3
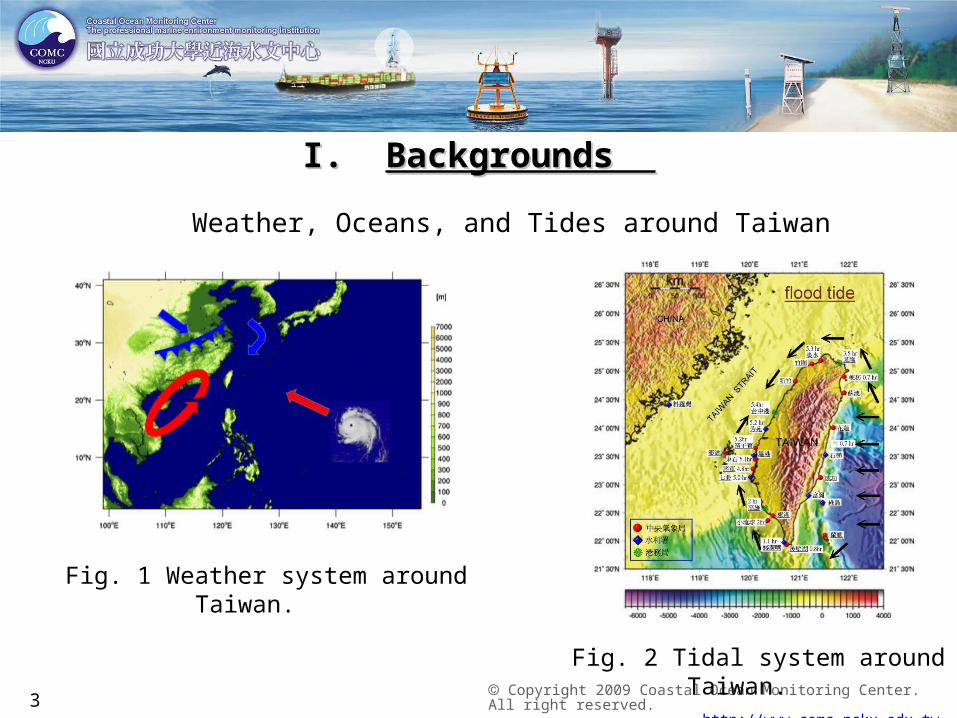
I. I. Backgrounds Backgrounds
Weather, Oceans, and Tides around Taiwan
Fig. 2 Tidal system around Taiwan.
Fig. 1 Weather system around Taiwan.
Copyright 2009 Coastal Ocean Monitoring Center. All right reserved.
http://www.comc.ncku.edu.tw 4
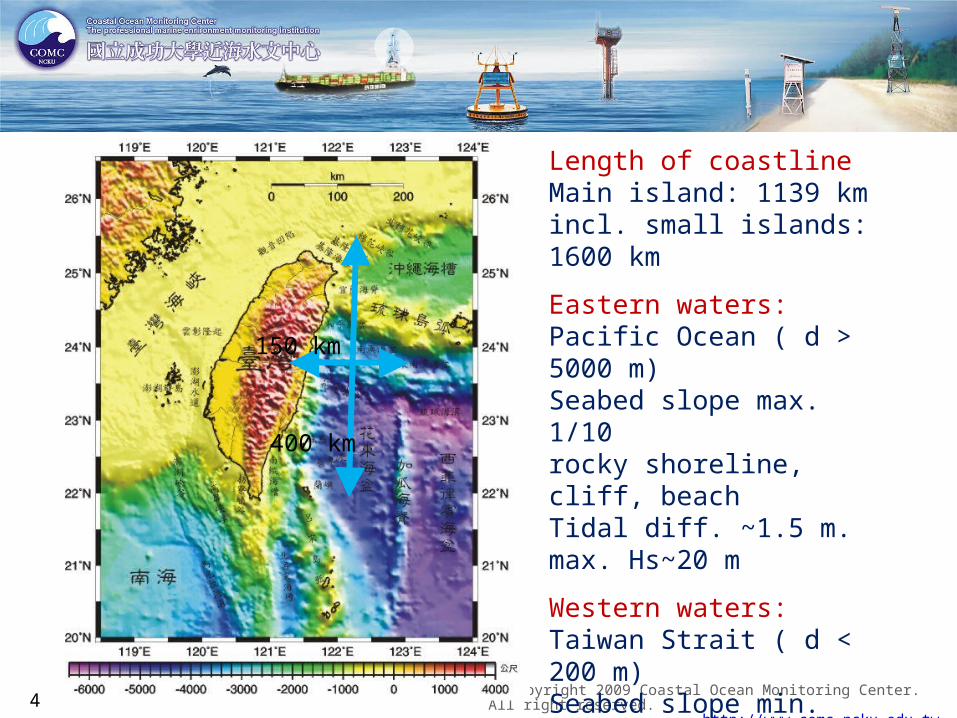
Length of coastline Main island: 1139 kmincl. small islands: 1600 km
Eastern waters:Pacific Ocean ( d > 5000 m)Seabed slope max. 1/10rocky shoreline, cliff, beachTidal diff. ~1.5 m. max. Hs~20 m
Western waters:Taiwan Strait ( d < 200 m)Seabed slope min. 1/1000sandy beaches, dune, wetlandTidal diff. ~4.0 m. max. Hs ~10 m
400 km
150 km

Copyright 2009 Coastal Ocean Monitoring Center. All right reserved.
http://www.comc.ncku.edu.tw 5
II. Ocean Monitoring System in TaiwanII. Ocean Monitoring System in Taiwan
COMC focuses on developing automated meteo-oceanographic measurement systems, supported mainly by Water Resources Agency (WRA) and Central Weather Bureau (CWB).
Coastal Ocean Monitoring Center (COMC),National Cheng Kung University (NCKU)
Copyright 2009 Coastal Ocean Monitoring Center. All right reserved.
http://www.comc.ncku.edu.tw 6
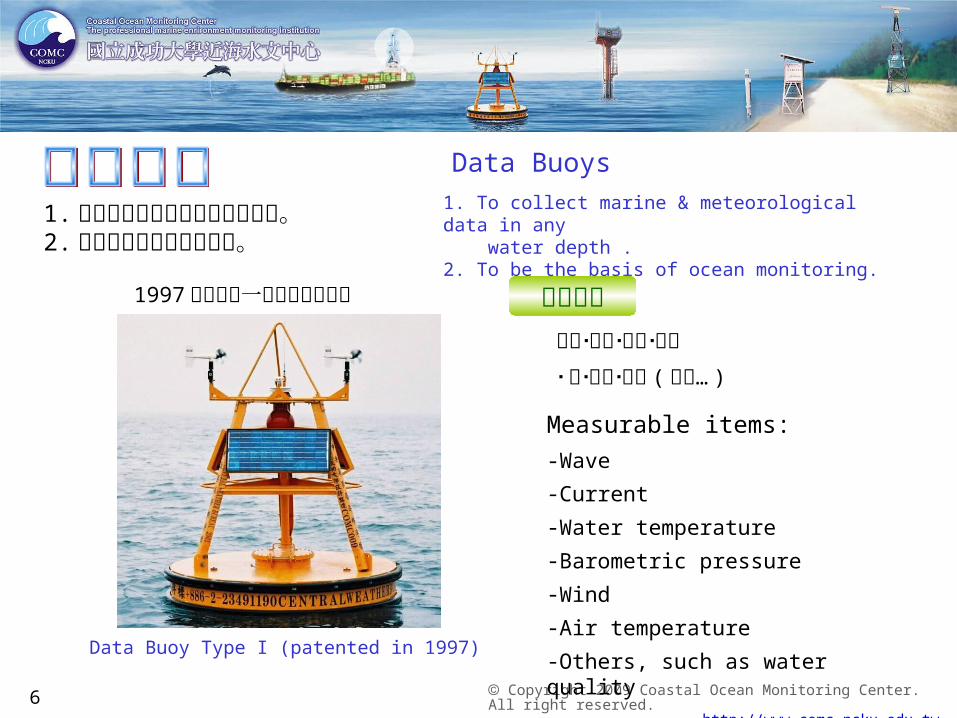
觀測項目1997年取得第一型資料浮標專利
Data Buoys
Data Buoy Type I (patented in 1997)
1.於淺水及深水區蒐集海氣象資料。2.作為近海水文觀測之基礎。
1. To collect marine & meteorological data in any
water depth .2. To be the basis of ocean monitoring.
Measurable items:
-Wave
-Current
-Water temperature
-Barometric pressure
-Wind
-Air temperature
-Others, such as water quality
波浪海流水溫氣壓風氣溫其他 ( 水質… )

Copyright 2009 Coastal Ocean Monitoring Center. All right reserved.
http://www.comc.ncku.edu.tw 7
觀測項目
Permanent Ocean & Coast Observing Permanent Ocean & Coast Observing SystemsSystems
海岸氣象站Coastal weather station
潮位站Tide station
海上觀測樁Ocean observation pile
波浪潮汐海流水溫氣壓風氣溫雨量溼度日照其他
Measurable items :-Wave, tide, and current
-Water temperature
-Barometric pressure
-Wind and air temperature
-Rain, humidity, and sunshine duration
-Others
作為近海水文觀測之基礎 To be the basis of ocean monitoring

Copyright 2009 Coastal Ocean Monitoring Center. All right reserved.
http://www.comc.ncku.edu.tw 8
Radar Images duringTyphoon Nockten
(Oct 24 22:00, 2004)
Measurable items:-Wave height-Wave period-Wave direction-Wave spectrum-Surface current
岸基雷達Land based radarLand based radar
Remote Sensing Systems for Sea-StateRemote Sensing Systems for Sea-State
移動式Vehicle based radarVehicle based radar
船用雷達Vessel based radarVessel based radar
波浪表面流觀測項目
以非接觸之方式,蒐集表面區域的海象資料
To collect marine data from an area of the sea surface by a more convenient way.
2004年那克坦颱風期間海面之雷達影像

Copyright 2009 Coastal Ocean Monitoring Center. All right reserved.
http://www.comc.ncku.edu.tw 9
00:0001:0002:00
.
.
.23:00
00:3001:3002:30
.
.
.23:30
Radio Radio Signal Signal
GSM / GPRS / SatelliteGSM / GPRS / Satellite現場 ((SitesSites ) )
資料品管((Data QC)Data QC)
使用者((Clients)Clients)
RelayRelaystationstation
ADSLADSL
InternetInternet
Real-Time Data TransmissionReal-Time Data Transmission於觀測結束約半小時後,使用者可取得通過品管檢測之資料。
Half an hour after observation, users can access QC-d data.
資料傳輸流程圖 (data transmission)
ADSLADSL
InternetInternet
分鐘 (min)10
observation analysisData
transmission
13 20
Data QCData
transmission
25 30
觀測 分析 資料傳輸 資料品管 資料傳輸
Copyright 2009 Coastal Ocean Monitoring Center. All right reserved.
http://www.comc.ncku.edu.tw 10
III. Applications of the Ocean Monitoring System
During the typhoon period, COMC provides every 6 hours the
following information to the government:
(i)Forecasting water level at main river mouths
(ii) Forecasting of high water levels and arrival times around
Taiwan in 3 days
(iii) Present sea states around Taiwan (based on the data obtained
from buoys)
(iv) Wave height of swells around the coastal area of Taiwan
(v) Run-up and overtopping around some selected seawalls (with
high disaster potential)

Copyright 2009 Coastal Ocean Monitoring Center. All right reserved.
http://www.comc.ncku.edu.tw 11
http://www.jma.go.jp/jma/index.html
Tsunami warning on March 11, 2011 (Tohoku earthquake)
Copyright 2009 Coastal Ocean Monitoring Center. All right reserved.
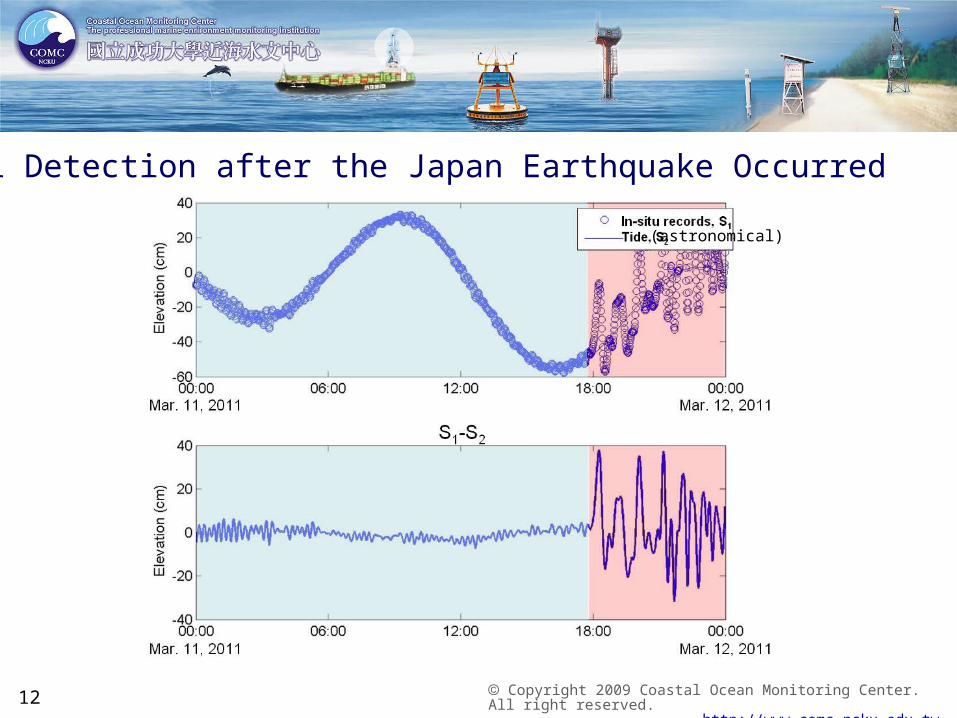
http://www.comc.ncku.edu.tw 12
(astronomical)
Tsunami Detection after the Japan Earthquake Occurred
Copyright 2009 Coastal Ocean Monitoring Center. All right reserved.
http://www.comc.ncku.edu.tw 13
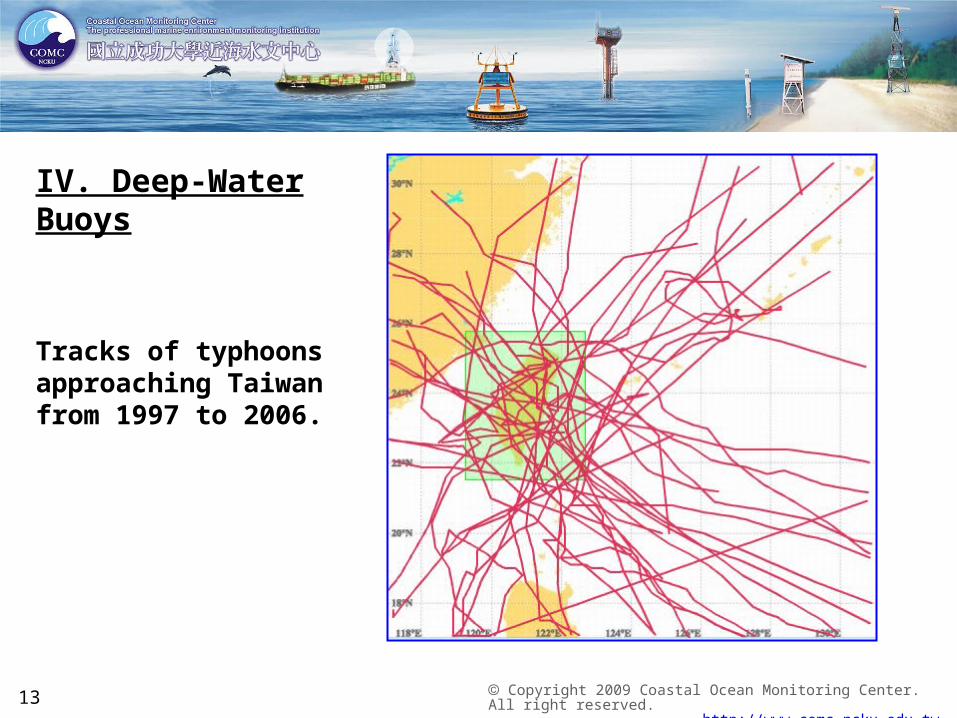
Tracks of typhoons approaching Taiwan from 1997 to 2006.
IV. Deep-Water Buoys

Copyright 2009 Coastal Ocean Monitoring Center. All right reserved.
http://www.comc.ncku.edu.tw 14
Where should we deploy the deep-water buoys?
21o18’ N. , 124o03’ E.
IV. Deep-Water Buoy
Copyright 2009 Coastal Ocean Monitoring Center. All right reserved.
http://www.comc.ncku.edu.tw 15
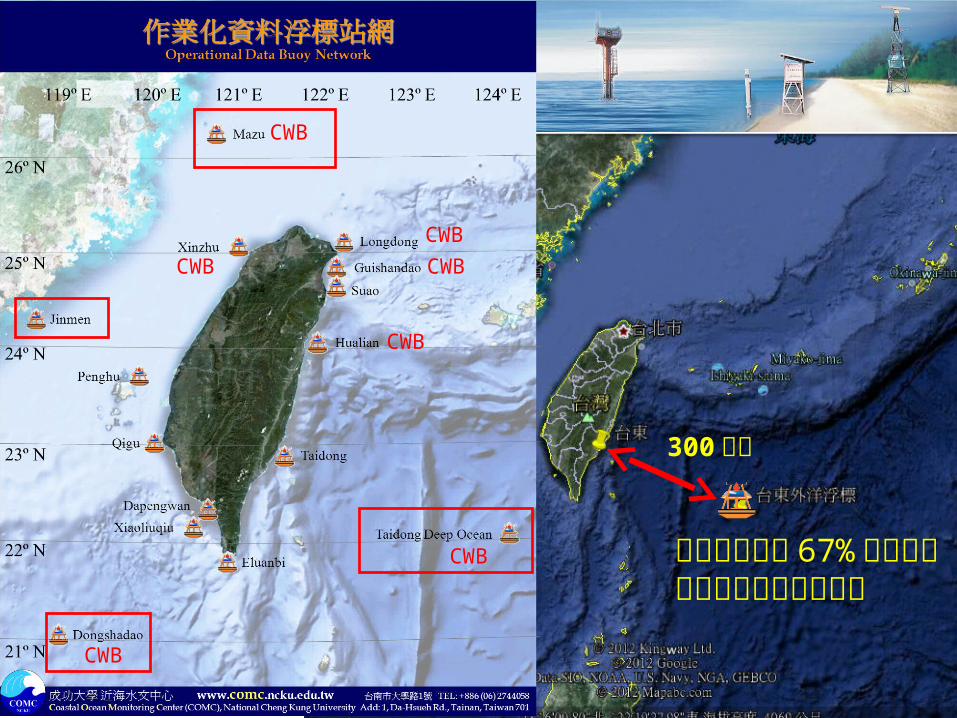
近十年有超過 67%於侵台之前通過台灣東方之海域
CWB
CWB
CWB
CWB
CWB
CWB
CWB
300公里
Copyright 2009 Coastal Ocean Monitoring Center. All right reserved.
http://www.comc.ncku.edu.tw 16
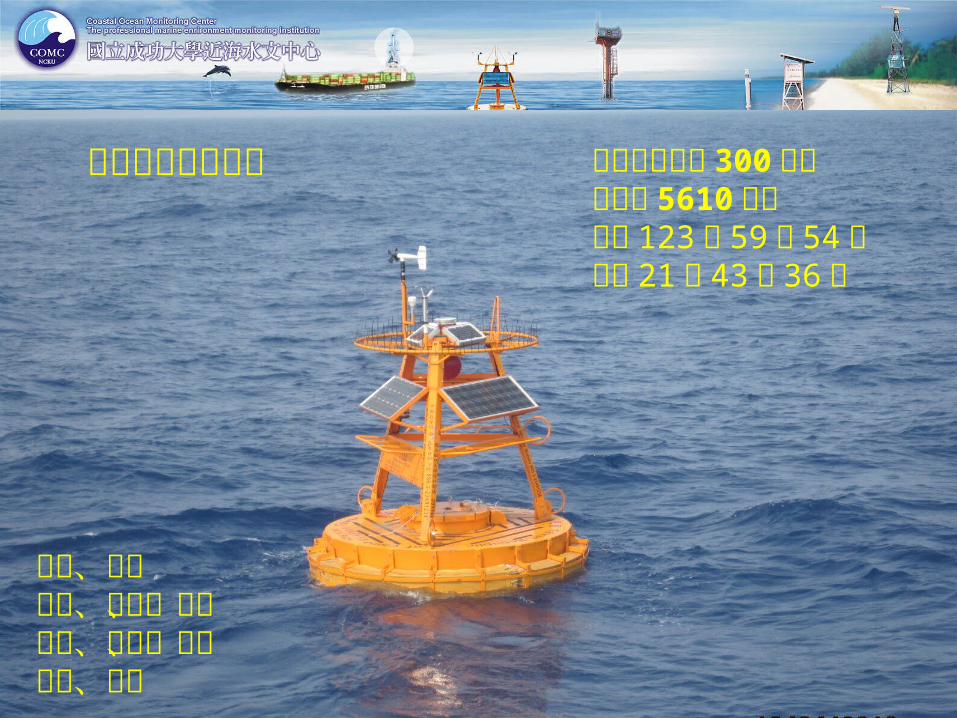
台東外洋資料浮標台東東南邊約 300公里水深達 5610公尺東經 123 度 59 分 54秒北緯 21 度 43 分 36秒
風速、風向波高、週期、波向氣壓、氣溫、水溫流速、流向

Copyright 2009 Coastal Ocean Monitoring Center. All right reserved.
http://www.comc.ncku.edu.tw 17
25 mm nylon rope, 3000 m
Data buoy
19 mm iron chain, 70 m
38 mm nylon rope, 100 m
12 mm PE rope, 3000m
Water depth 5600 m
Sea bed
Anchors
Scope (mooring length/water depth) =1.25
3 glass floats
32 mm iron chain, 27.5 m
19 mm iron chain, 5 m
26 mm iron chain,27.5 m
6 glass floats

Copyright 2009 Coastal Ocean Monitoring Center. All right reserved.
http://www.comc.ncku.edu.tw 18
Instruments Installed on the Data Buoy
Copyright 2009 Coastal Ocean Monitoring Center. All right reserved.
http://www.comc.ncku.edu.tw 19
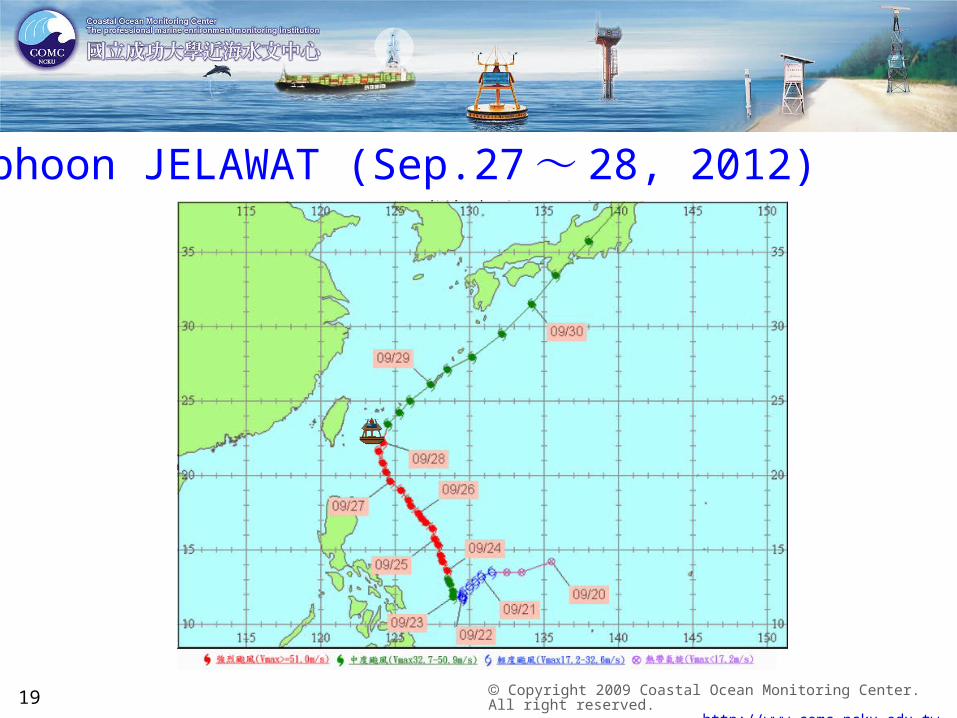
Typhoon JELAWAT (Sep.27 ~ 28, 2012)

Copyright 2009 Coastal Ocean Monitoring Center. All right reserved.
http://www.comc.ncku.edu.tw 20
Significant wave heights and mean wave periods monitored by the Pacific buoy
9/28 0時 18.88m
9/28 0時 11.6s

Copyright 2009 Coastal Ocean Monitoring Center. All right reserved.
http://www.comc.ncku.edu.tw 21
Wind speed and direction9/27 23時, 陣風41.6m/s
平均風30.4m/s

Copyright 2009 Coastal Ocean Monitoring Center. All right reserved.
http://www.comc.ncku.edu.tw 22
Air pressure and temperature
9/28 03時 934.9hPa
9/28 04時,氣溫23.6℃水溫23.5℃

Copyright 2009 Coastal Ocean Monitoring Center. All right reserved.
http://www.comc.ncku.edu.tw 23
Sea surface current9/28 16時 114.2cm/s

Copyright 2009 Coastal Ocean Monitoring Center. All right reserved.
http://www.comc.ncku.edu.tw 24
V. Characteristics of Wind Sea and Swells
5.1 Selection of wave data
5.2 Separation of wind sea and swells
5.3 Propagation of swells
5.4 Generation and disappearance of swells
5.5 Characteristics of wind sea and swells

Copyright 2009 Coastal Ocean Monitoring Center. All right reserved.
http://www.comc.ncku.edu.tw 25
5.1 Selection of Wave Data
Fig. 5.1 Temporal variations in the wind speed at 10 m high from 2010/09/26/12:00 to 2010/09/30/23:00 (Taiwan Time).
Wind Speed and Direction

Copyright 2009 Coastal Ocean Monitoring Center. All right reserved.
http://www.comc.ncku.edu.tw 26
5.1 Selection of Wave DataWind Speed and Direction
Fig. 5.2 Temporal variations in the wind direction at 3 m high from 2010/09/26/12:00 to 2010/09/30/23:00 (Taiwan Time).
Copyright 2009 Coastal Ocean Monitoring Center. All right reserved.
http://www.comc.ncku.edu.tw 27
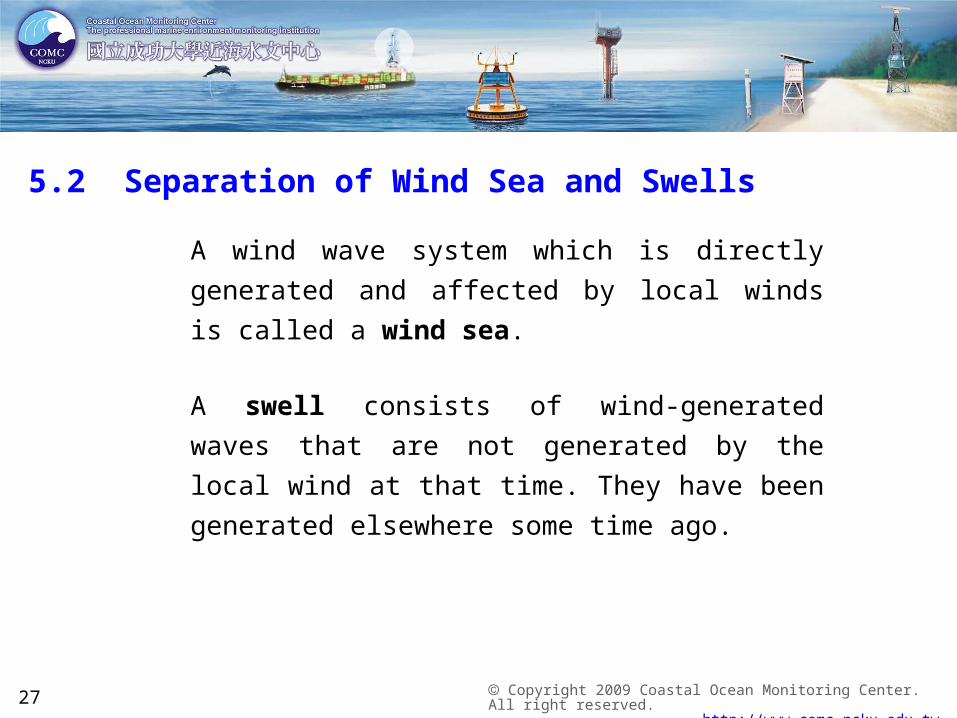
A wind wave system which is directly generated and
affected by local winds is called a wind sea.
A swell consists of wind-generated waves that are not
generated by the local wind at that time. They have been
generated elsewhere some time ago.
5.2 Separation of Wind Sea and Swells

Copyright 2009 Coastal Ocean Monitoring Center. All right reserved.
http://www.comc.ncku.edu.tw 28
Separation of Wind Sea and Swell is based on the wave age (Ag),
which is defined as
: phase velocity of the peak-frequency wave
: wind speed at an elevation of 10 m
: Wind waves (wind sea)
: Swell
Fully-developed Swells:
Mitsuyasu (1981),
Donelan et al. (1993),
5.2 Separation of Wind Sea and Swells
10U
CA p
g
pC
10U
1gA
1gA
4.1gA
29.1gA

Copyright 2009 Coastal Ocean Monitoring Center. All right reserved.
http://www.comc.ncku.edu.tw 29
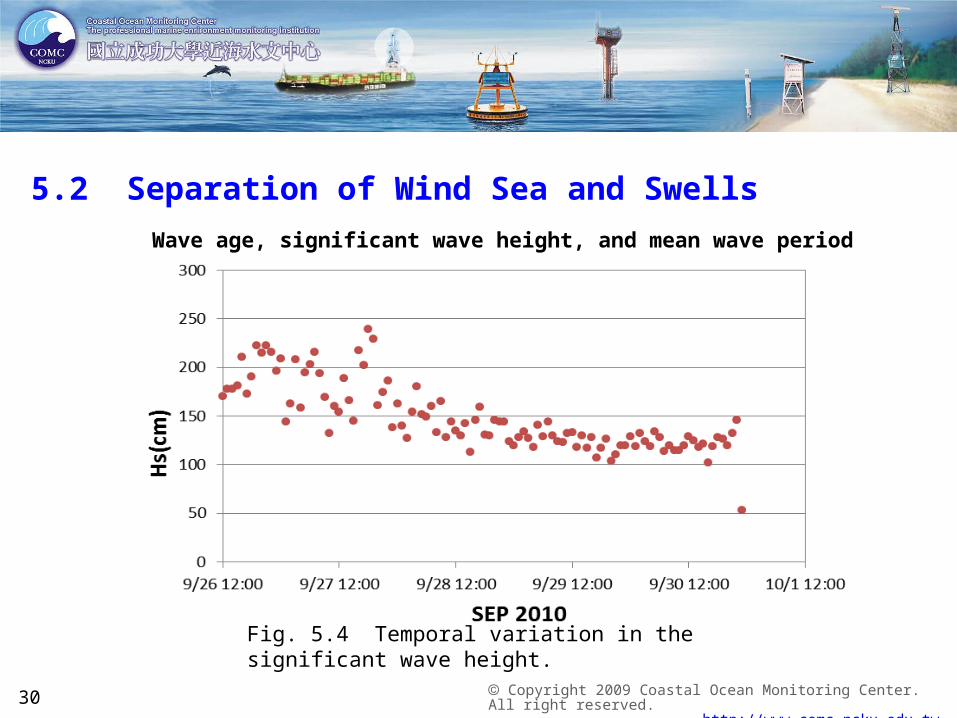
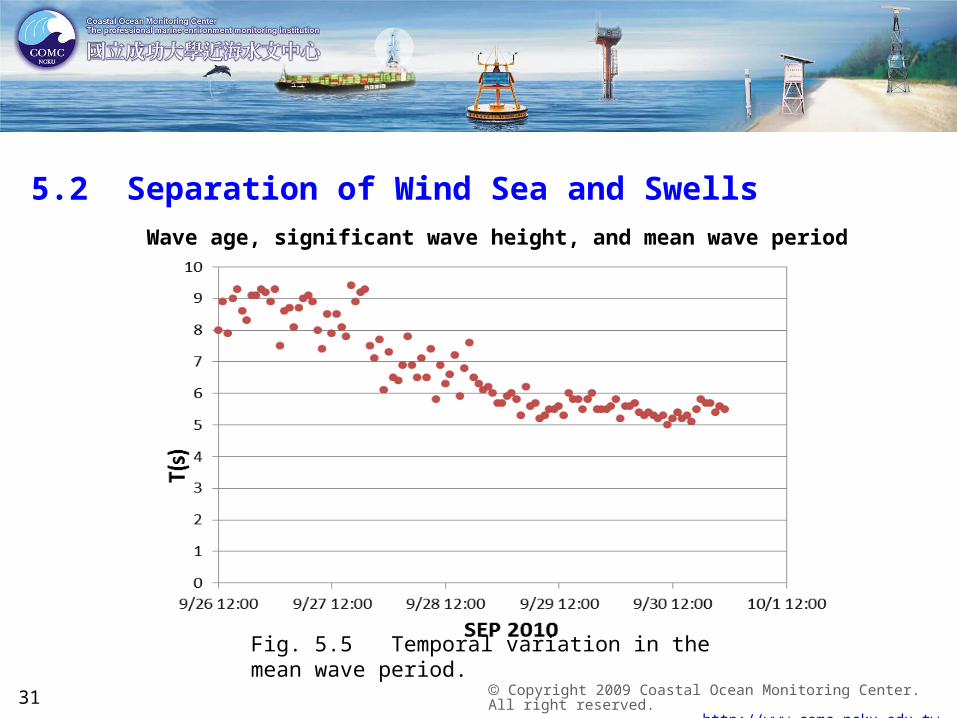
5.2 Separation of Wind Sea and Swells
Wave age, significant wave height, and mean wave period
Fig. 5.3 Temporal variation in the wave age for the waves measured by the deep-water buoy from 2010/09/26/12:00 to 2010/09/30/23:00 (Taiwan Time).
Copyright 2009 Coastal Ocean Monitoring Center. All right reserved.
http://www.comc.ncku.edu.tw 30
5.2 Separation of Wind Sea and Swells
Wave age, significant wave height, and mean wave period
Fig. 5.4 Temporal variation in the significant wave height.
Copyright 2009 Coastal Ocean Monitoring Center. All right reserved.
http://www.comc.ncku.edu.tw 31
5.2 Separation of Wind Sea and Swells
Wave age, significant wave height, and mean wave period
Fig. 5.5 Temporal variation in the mean wave period.

Copyright 2009 Coastal Ocean Monitoring Center. All right reserved.
http://www.comc.ncku.edu.tw 32
5.2 Separation of Wind Sea and Swells
Based on the values of wave age, the waves appear at various times
can be categorized into three Time Zones:
Time Zone I : 2010/09/26/12:00 - 2010/09/27/20:00 (32 hours)
wave age: 2.5 - 3.8, =1.70 - 2.39 m, = 8.0 - 9.3 s
(Swells dominate)
Time Zone II : 2010/09/27/20:00 - 2010/09/28/20:00 (24 hours)
wave age: 1.7 - 2.5, =1.30 - 1.80 m, = 6.1 - 8.0 s
(Swells decrease and wind sea increases)
Time Zone III : 2010/09/28/20:00 - 2010/09/30/23:00 (51 hours)
wave age: 1.3 - 2.2, =1.20 - 1.46 m, = 5.0 - 6.2 s
(Wind sea dominates)
SH meanT
SH meanT
SH meanT
Copyright 2009 Coastal Ocean Monitoring Center. All right reserved.
http://www.comc.ncku.edu.tw 33
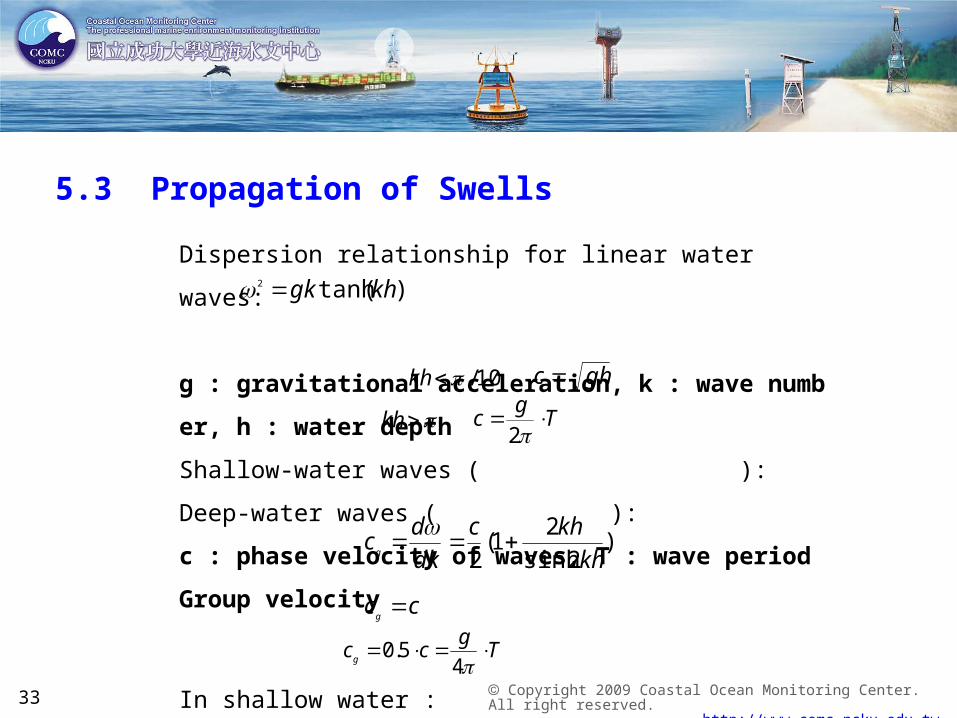
5.3 Propagation of Swells
Dispersion relationship for linear water waves:
g : gravitational acceleration, k : wave number, h : water depth
Shallow-water waves ( ):
Deep-water waves ( ):
c : phase velocity of waves, T : wave period
Group velocity
In shallow water :
In deep water :
)(tanh2 khgk
10/kh
kh Tg
c 2
ghc
)2sinh
21(
2 kh
khc
dk
dcg
ccg
Tg
ccg
4
5.0
Copyright 2009 Coastal Ocean Monitoring Center. All right reserved.
http://www.comc.ncku.edu.tw 34
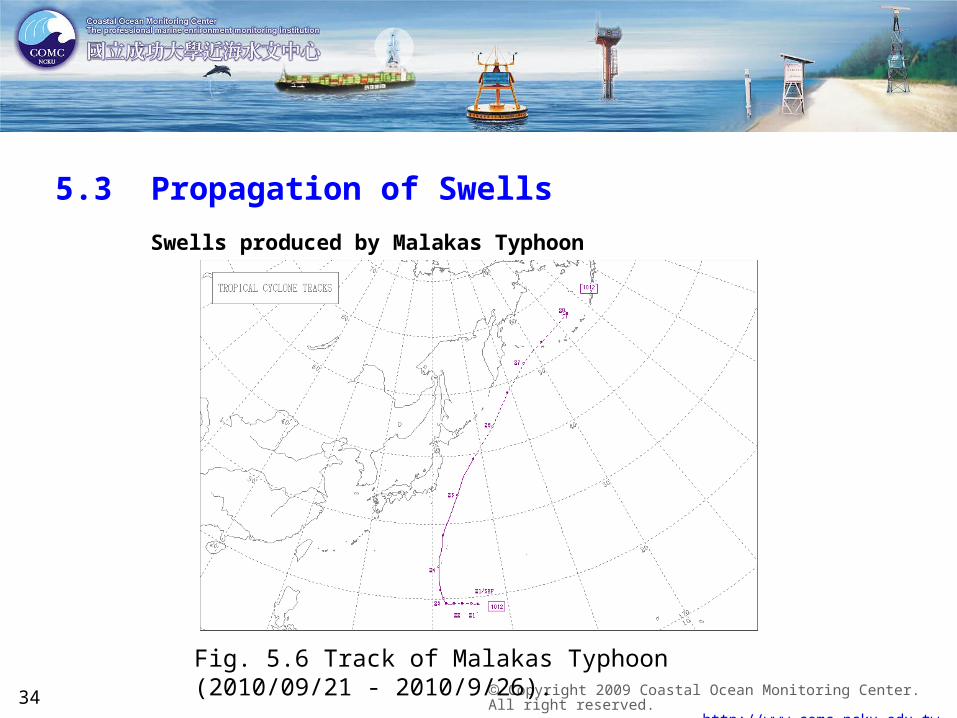
5.3 Propagation of Swells
Swells produced by Malakas Typhoon
Fig. 5.6 Track of Malakas Typhoon (2010/09/21 - 2010/9/26).
Copyright 2009 Coastal Ocean Monitoring Center. All right reserved.
http://www.comc.ncku.edu.tw 35
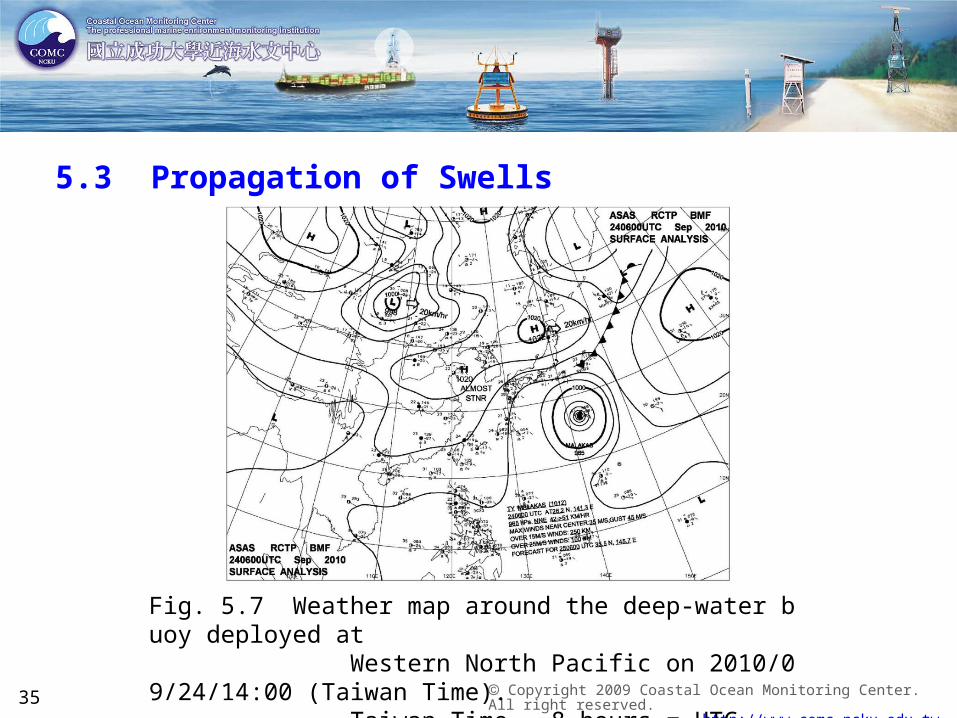
Fig. 5.7 Weather map around the deep-water buoy deployed at Western North Pacific on 2010/09/24/14:00 (Taiwan Time). Taiwan Time - 8 hours = UTC time.
5.3 Propagation of Swells
Copyright 2009 Coastal Ocean Monitoring Center. All right reserved.
http://www.comc.ncku.edu.tw 36
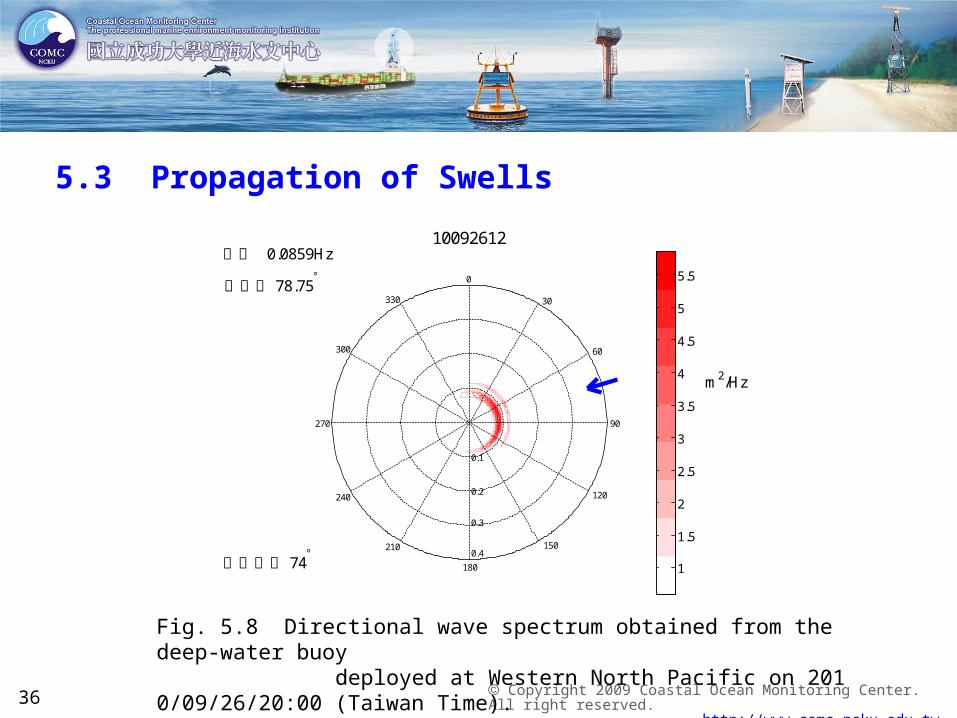
5.3 Propagation of Swells
10092612
0.1
0.2
0.3
0.4
0
30
60
90
120
150
180
210
240
270
300
330
0.0859Hz主頻
78.75主波向
m2/Hz
74平均風向 1
1.5
2
2.5
3
3.5
4
4.5
5
5.5
Fig. 5.8 Directional wave spectrum obtained from the deep-water buoy deployed at Western North Pacific on 2010/09/26/20:00 (Taiwan Time).
Copyright 2009 Coastal Ocean Monitoring Center. All right reserved.
http://www.comc.ncku.edu.tw 37
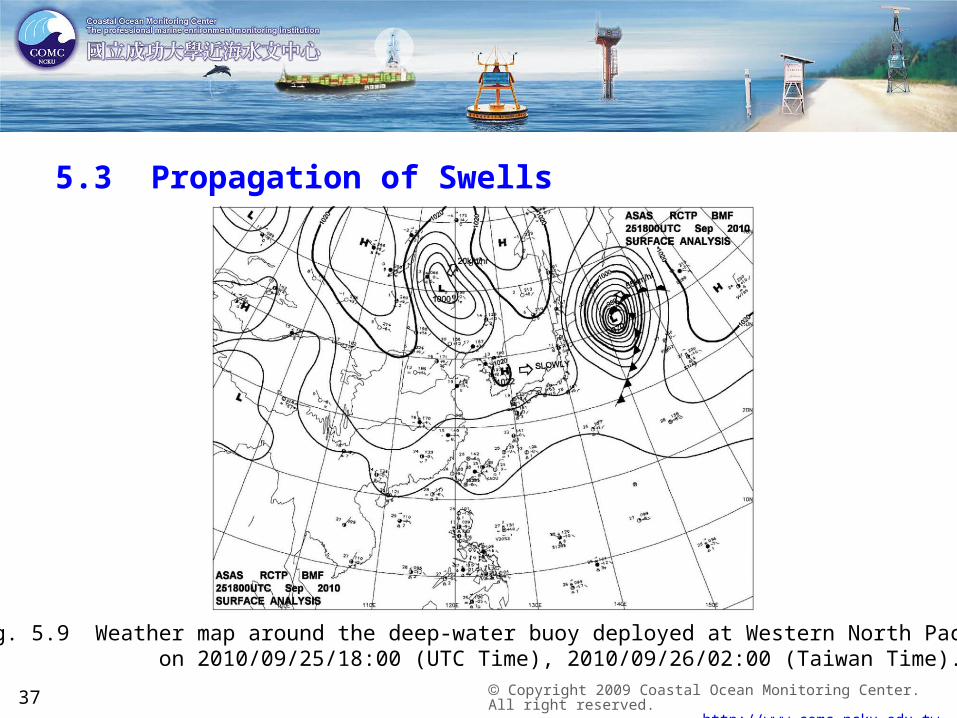
5.3 Propagation of Swells
Fig. 5.9 Weather map around the deep-water buoy deployed at Western North Pacific on 2010/09/25/18:00 (UTC Time), 2010/09/26/02:00 (Taiwan Time).

Copyright 2009 Coastal Ocean Monitoring Center. All right reserved.
http://www.comc.ncku.edu.tw 38
Generation and detection of swells:
From Fig. 5.7, the distance, , from the Malakas Typhoon to the deep-water buoy
is approximately 1165 km.
From Fig. 5.5, the mean wave period in Time Zone I is
The produced swell will take about 46 hours to reach the deep-water buoy.
2010/9/24/14:00 (Taiwan Time, Fig. 5.7) + 46 Hrs = 2010/09/26/12:00 (Taiwan Time)
Consistent with the results shown in Fig. 5.3.
5.4 Generation and Disappearance of Swells
PR
sTZ
0.9
smTg
cg
/025.74
hrsc
Rt
g
P 06.46

Copyright 2009 Coastal Ocean Monitoring Center. All right reserved.
http://www.comc.ncku.edu.tw 39
5.4 Generation and Disappearance of Swells
Disappearance of swells:
The weather map (Fig. 5.9) shows that the Malakas Typhoon landed Japan on 2010/0
9/26/02 (Taiwan Time). The distance, , from the Malakas Typhoon to the deep-wa
ter buoy is approximately 1800 km.
From Fig. 5.5, the mean wave period in Time Zone III is
This effect will be detected by the deep-water buoy 80 hours later.
2010/09/26/02:00 (Taiwan Time, Fig. 5.9) + 80 Hrs = 2010/ 29/10:00 (Ta
iwan Time). Consistent with the results shown in Fig. 5.3.
PR
sTZ 8.0
smTg
cg /4
6.25
hrsc
Rt
g
P 80
Copyright 2009 Coastal Ocean Monitoring Center. All right reserved.
http://www.comc.ncku.edu.tw 40
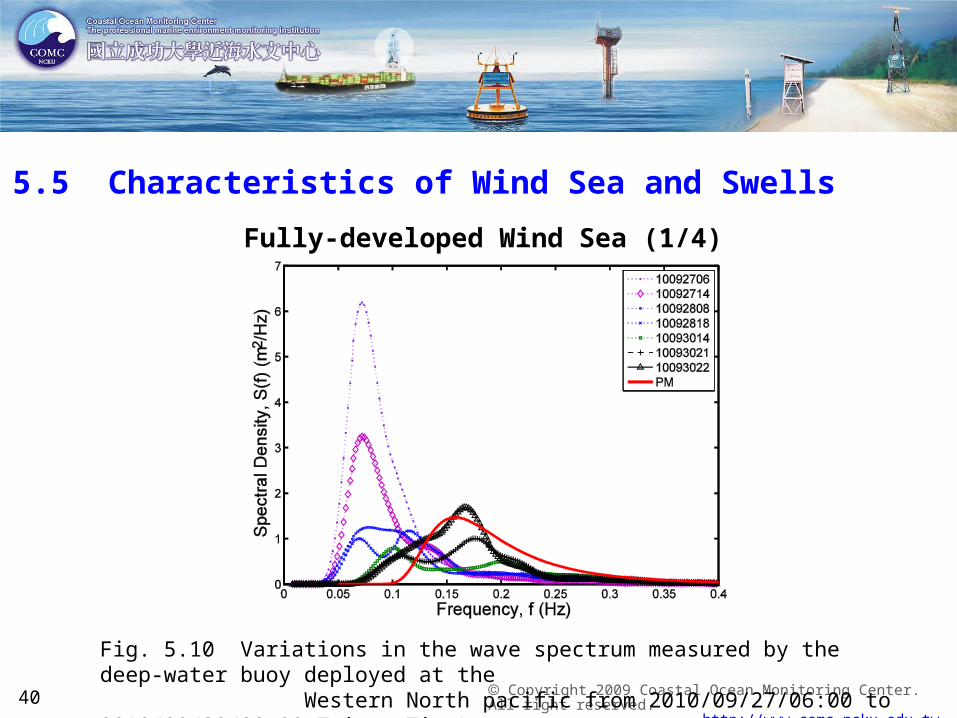
5.5 Characteristics of Wind Sea and Swells
Fully-developed Wind Sea (1/4)
Fig. 5.10 Variations in the wave spectrum measured by the deep-water buoy deployed at the Western North pacific from 2010/09/27/06:00 to 2010/09/30/22:00 Taiwan Time).

Copyright 2009 Coastal Ocean Monitoring Center. All right reserved.
http://www.comc.ncku.edu.tw 41
5.5 Characteristics of Wind Sea and Swells
Fully-developed Wind Sea (2/4)
0 0.05 0.1 0.15 0.2 0.25 0.3 0.35 0.4 0.45 0.50
1
2
3
4
5
6
7
Frequency, f (Hz)
Spe
ctra
l Den
sity
, S(f
) (m
2/H
z)
0 0.05 0.1 0.15 0.2 0.25 0.3 0.35 0.4 0.45 0.50
1
2
3
4
5
6
7
Frequency, f (Hz)
Spe
ctra
l Den
sity
, S(f
) (m
2/H
z)
Fig. 5.11 Comparison of the measured wave spectrum at 2010/09/27/06:00 with the PM spectrum (First Time Zone).
Fig. 5.12 Comparison of the measured wave spectrum at 2010/09/28/08:00 with the PM spectrum (Second Time Zone).
Copyright 2009 Coastal Ocean Monitoring Center. All right reserved.
http://www.comc.ncku.edu.tw 42
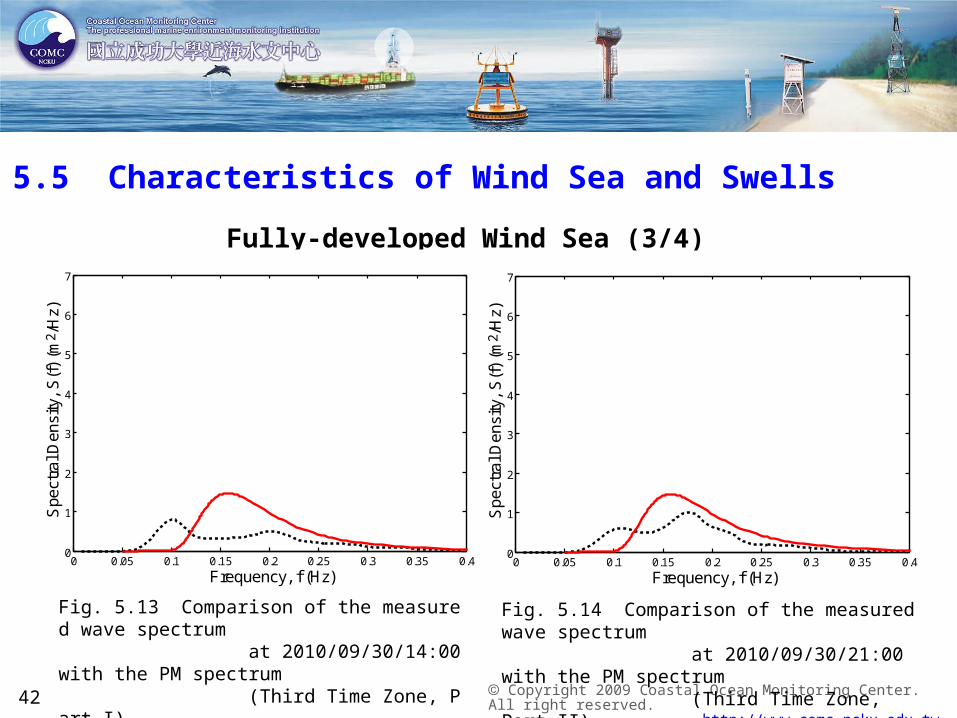
5.5 Characteristics of Wind Sea and Swells
Fully-developed Wind Sea (3/4)
0 0.05 0.1 0.15 0.2 0.25 0.3 0.35 0.40
1
2
3
4
5
6
7
Frequency, f (Hz)
Spe
ctra
l Den
sity
, S
(f)
(m2 /
Hz)
0 0.05 0.1 0.15 0.2 0.25 0.3 0.35 0.40
1
2
3
4
5
6
7
Frequency, f (Hz)
Spe
ctra
l Den
sity
, S
(f)
(m2 /
Hz)
Fig. 5.13 Comparison of the measured wave spectrum at 2010/09/30/14:00 with the PM spectrum (Third Time Zone, Part I).
Fig. 5.14 Comparison of the measured wave spectrum at 2010/09/30/21:00 with the PM spectrum (Third Time Zone, Part II).

Copyright 2009 Coastal Ocean Monitoring Center. All right reserved.
http://www.comc.ncku.edu.tw 43
0 0.05 0.1 0.15 0.2 0.25 0.3 0.35 0.40
1
2
3
4
5
6
7
Frequency, f (Hz)
Spe
ctra
l Den
sity
, S
(f)
(m2 /
Hz)
5.5 Characteristics of Wind Sea and Swells
Fully-developed Wind Sea (4/4)
Fig. 5.15 Comparison of the measured wave spectrum at 2010/09/30/22:00 with the PM spectrum (Third Time Zone, Part III).
Copyright 2009 Coastal Ocean Monitoring Center. All right reserved.
http://www.comc.ncku.edu.tw 44
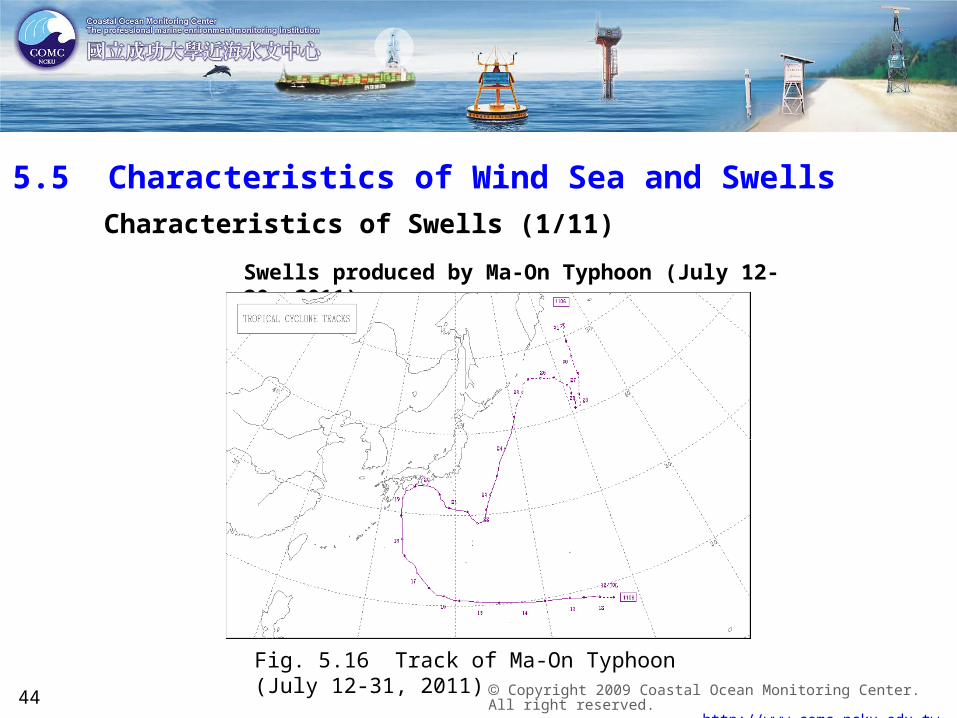
5.5 Characteristics of Wind Sea and Swells
Characteristics of Swells (1/11)
Swells produced by Ma-On Typhoon (July 12-20, 2011)
Fig. 5.16 Track of Ma-On Typhoon (July 12-31, 2011)

Copyright 2009 Coastal Ocean Monitoring Center. All right reserved.
http://www.comc.ncku.edu.tw 45
5.5 Characteristics of Wind Sea and SwellsCharacteristics of Swells (2/11)
Fig. 5.17 Weather map around eastern water of Taiwan on July14, 2011 (14:00, Taiwan Time).

Copyright 2009 Coastal Ocean Monitoring Center. All right reserved.
http://www.comc.ncku.edu.tw 46
5.5 Characteristics of Wind Sea and SwellsCharacteristics of Swells (3/11)
Fig. 5.18 Weather map around eastern water of Taiwan on July19, 2011 (20:00, Taiwan Time).

Copyright 2009 Coastal Ocean Monitoring Center. All right reserved.
http://www.comc.ncku.edu.tw 47
0 10 20 30 40 50 60 70 800
5
10
15
20
Time (hr)
P
eak
Per
iod,
Tp
(s)
0 10 20 30 40 50 60 70 800
10
20
30
40
Win
d S
peed
,
U1
0 (
m/s
)
U10
Tp
5.5 Characteristics of Wind Sea and SwellsCharacteristics of Swells (4/11)
Fig. 5.19 Evolution of peak period of the swell and wind speed measured by the deep-water buoy from July 16, 00:00, 2011 to July 19, 00:00 (Taiwan Time).
Apparent swell appears from 2011/7/16/16:00 (16th Hour) to 2011/7/18/12:00 (60th Hour).
sTp 14

Copyright 2009 Coastal Ocean Monitoring Center. All right reserved.
http://www.comc.ncku.edu.tw 48
11071623
0.1
0.2
0.3
0.4
0
30
60
90
120
150
180
210
240
270
300
330
0.0762Hz主頻
90主波向
m2/Hz
0.2
0.4
0.6
0.8
1
1.2
1.4
1.6
5.5 Characteristics of Wind Sea and SwellsCharacteristics of Swells (5/11)
Fig. 5.20 Directional wave spectrum obtained from the deep-water buoy deployed at Western North Pacific on 2011/07/16/23:00 (Taiwan Time).
Copyright 2009 Coastal Ocean Monitoring Center. All right reserved.
http://www.comc.ncku.edu.tw 49
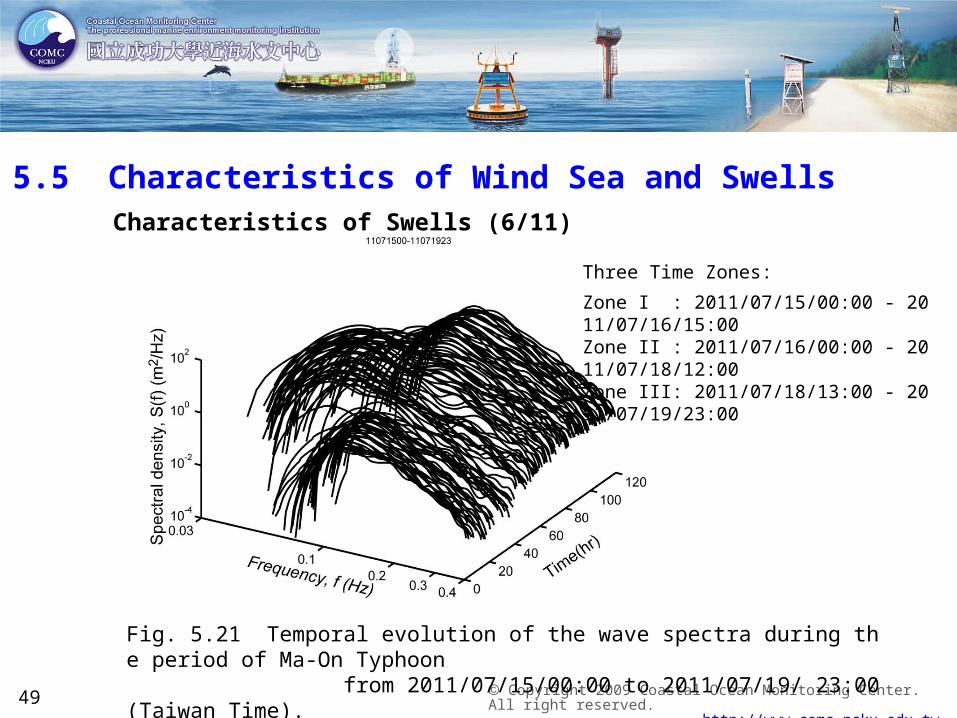
5.5 Characteristics of Wind Sea and SwellsCharacteristics of Swells (6/11)
Fig. 5.21 Temporal evolution of the wave spectra during the period of Ma-On Typhoon from 2011/07/15/00:00 to 2011/07/19/ 23:00 (Taiwan Time).
Three Time Zones:
Zone I : 2011/07/15/00:00 - 2011/07/16/15:00Zone II : 2011/07/16/00:00 - 2011/07/18/12:00Zone III: 2011/07/18/13:00 - 2011/07/19/23:00

Copyright 2009 Coastal Ocean Monitoring Center. All right reserved.
http://www.comc.ncku.edu.tw 50
5.5 Characteristics of Wind Sea and SwellsCharacteristics of Swells (7/11)
Fig. 5.22 Temporal evolution of the wave spectra during the period of Ma-On Typhoon at
Time Zone I (from 2011/07/15/00:00 to 2011/07/19/23:00, Taiwan Time).
Fig. 5.23 Temporal evolution of the wave spectra during the period of Ma-On Typhoon at Time Zone II (from 2011/07/16/00:00 to 2011/07/18/12:00, Taiwan Time).

Copyright 2009 Coastal Ocean Monitoring Center. All right reserved.
http://www.comc.ncku.edu.tw 51
10-2
10-1
100
10-4
10-3
10-2
10-1
100
101
102
Frequency, f (Hz)
Spe
ctra
l Den
sity
, S
(f)
(m2 /
Hz)
Zone IZone IIZone III
5.5 Characteristics of Wind Sea and SwellsCharacteristics of Swells (8/11)
Fig. 5.24 Temporal evolution of the wave spectra during the period of Ma-On Typhoon at Time Zone II (from 2011/07/18/13:00 to 2011/07/19/23:00,
Taiwan Time).
Fig. 5.25 Representative wave spectra obtained by the deep-water buoy deployed at Western North Pacific during the period of Ma-On Typhoon from 2011/07/15/00:00 to 2011/07/17/ 23:00 (Taiwan Time).
Copyright 2009 Coastal Ocean Monitoring Center. All right reserved.
http://www.comc.ncku.edu.tw 52
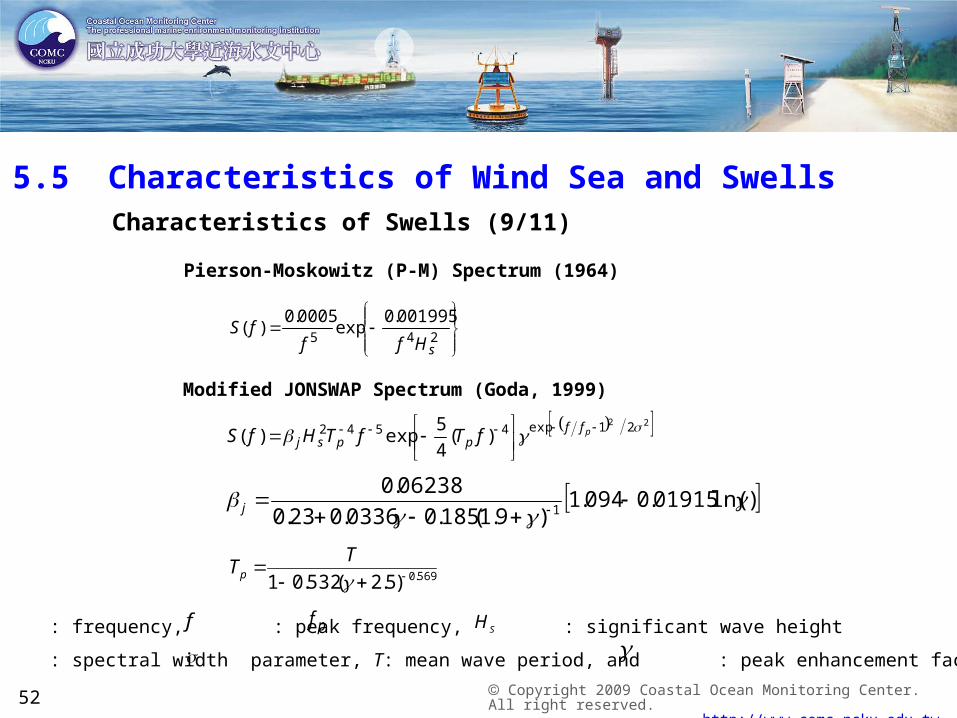
5.5 Characteristics of Wind Sea and SwellsCharacteristics of Swells (9/11)
Pierson-Moskowitz (P-M) Spectrum (1964)
245
001995.0exp
0005.0)(
sHfffS
Modified JONSWAP Spectrum (Goda, 1999)
22 21exp4542 )(4
5exp)(
pff
ppsj fTfTHfS
)ln(01915.0094.1)9.1(185.00336.023.0
06238.01
j
569.0)5.2(532.01
T
Tp
: frequency, : peak frequency, : significant wave height
: spectral width parameter, T: mean wave period, and : peak enhancement factor
f pf SH

Copyright 2009 Coastal Ocean Monitoring Center. All right reserved.
http://www.comc.ncku.edu.tw 53
5.5 Characteristics of Wind Sea and SwellsCharacteristics of Swells (10/11)
Modified Wallops Spectrum (Huang et al., 1981; Goda, 1999)
412 )(
4exp)( fT
mfTHfS pmm
psw
057.1
4)5(
4)1(
)2(7458.014/)1(4
0624.0
mm
mm
m
w
072.1)5.0(259.11
m
TTp
f sHpT
T
: frequency, : peak frequency, : significant wave height
: mean wave period, and : peak enhancement factor

Copyright 2009 Coastal Ocean Monitoring Center. All right reserved.
http://www.comc.ncku.edu.tw 54
5.5 Characteristics of Wind Sea and SwellsCharacteristics of Swells (11/11)
Fig. 5.26 Comparison of measured wave spectrum at Time Zone II with the modified Wallop Spectrum.
Fig. 5.27 Comparison of measured wave spectrum at Time Zone II with the modified JONSWAP Spectrum
.
Comparison of measured wave spectrum at Time Zone II with the modified Wallop Spectrum and the modified JONSWAP spectrum.

Copyright 2009 Coastal Ocean Monitoring Center. All right reserved.
http://www.comc.ncku.edu.tw 55
VI. Conclusions
1. Data buoys are very important platforms for installing various sensors to
monitor the sea states, such as wind speed, wind direction, wave height, wave
direction, currents, etc.
2. The real-time information obtained from the buoys is important for rapid and
effective responses to possible disasters.
3. The deployment of deep-water buoys is a hard task, but the obtained data
provide much earlier precious information for handling possible disasters.

Copyright 2009 Coastal Ocean Monitoring Center. All right reserved.
http://www.comc.ncku.edu.tw 56
VI. Conclusions
1. Data buoys are very important platforms for installing various sensors to
monitor the sea states, such as wind speed, wind direction, wave height, wave
direction, currents, etc.
2. The real-time information obtained from the buoys is important for rapid and
effective responses to possible disasters.
3. The deployment of deep-water buoys is a hard task, but the obtained data
provide much earlier precious information for handling possible disasters.
Copyright 2009 Coastal Ocean Monitoring Center. All right reserved.
http://www.comc.ncku.edu.tw 57
Thank you! Comments are mostly welcome.