· costs of rice production piedad f. moya, ... table 11.1 differential gross marketing margins...
TRANSCRIPT


The Philippine Rice Research Institute (PhilRice) is a chartered government corporate entity under the Department of Agriculture. It was created through Executive Order 1061 on November 5, 1985 (as amended) to help develop high-yielding, cost-reducing, and environment-friendly technologies so farmers can produce enough rice for all Filipinos.
It accomplishes this mission through research, development, and extension work in its central and seven branch stations, coordinating with a network that includes 57 agencies and 70 seed centers strategically located nationwide.
PhilRice has the following certifications: ISO 9001 (Quality Management), ISO 14001:2004 (Environmental Management), and OHSAS 18001:2007 (Occupational Health and Safety Assessment Series).
Mailing address: Maligaya, Science City of Muñoz, 3119, Nueva Ecija Phone: +63 (44) 456-0433, 456-0258, 456-0277Fax: +63 (44) 456-0651 loc 203E-mail: [email protected] page: www.philrice.gov.ph
The International Rice Research Institute (IRRI) is the world’s premier research organization dedicated to reducing poverty and hunger through rice science; improving the health and welfare of rice farmers and consumers; and protecting the rice-growing environment for future generations. IRRI is an independent, nonprofit, research and educational institute, founded in 1960 by the Ford and Rockefeller foundations with support from the Philippine government. The institute, headquartered in Los Baños, Philippines, has offices in 17 rice-growing countries in Asia and Africa, and more than 1,000 staff members.
Working with in-country partners, IRRI develops advanced rice varieties that yield more grain and better withstand pests and disease as well as flooding, drought, and other harmful effects of climate change. More than half of the rice area in Asia is planted to IRRI-bred varieties or their progenies. The institute develops new and improved methods and technologies that enable farmers to manage their farms profitably and sustainably, and recommends rice varieties and agricultural practices suitable to particular farm conditions as well as consumer preferences. IRRI assists national agricultural research and extension systems in formulating and implementing country rice sector strategies.
Mailing address: DAPO Box 7777, Metro Manila, PhilippinesPhone: +63 (2) 580-5600Fax: +63 (2) 580-5699E-mail: [email protected]
The responsibility of this publication rests with the Philippine Rice Research Institute and International Rice Research Institute.
Copyright 2016 © Philippine Rice Research Institute and International Rice Research Institute
Published by: Philippine Rice Research Institute Maligaya, Science City of Muñoz, Nueva Ecija
Suggested Citation
Bordey FH, Moya PF, Beltran JC, Dawe DC, editors. 2016. Competitiveness of Philippine Rice in Asia. Science City of Muñoz (Philippines): Philippine Rice Research Institute and Manila (Philippines): International Rice Research Institute. 172 p.
Editor: Tess RolaCover design, page makeup, and composition: Carlo Dacumos
ISBN No. 9786218022140
v
CONTENTS
List of Tables vii
List of Appendices ix
List of Figures x
List of Abbreviations xi
Foreword xii
Acknowledgments xiv
Executive Summary xvi
I. Overview1. Why this study?Flordeliza H. Bordey, Piedad F. Moya, Jesusa C. Beltran, and David C. Dawe
3
2. The benchmark data: sources, concepts, and methodsFlordeliza H. Bordey, Piedad F. Moya, Jesusa C. Beltran, Cheryll C. Launio, Aileen C. Litonjua, Rowena G. Manalili, Alice B. Mataia, Rhemilyn Z. Relado, Ronell B. Malasa, Irene R. Tanzo, Charmaine G. Yusongco, Suennie Jane C. Paran, Ma. Shiela D. Valencia, Mary Rose L. San Valentin, Esther B. Marciano, and David C. Dawe
9
3. Profile of an Asian rice farmerFlordeliza H. Bordey, Jesusa C. Beltran, Aileen C. Litonjua, Cheryll C. Launio, Rowena G. Manalili, Alice B. Mataia, Ronell B. Malasa, Rhemilyn Z. Relado, Irene R. Tanzo, Suennie Jane C. Paran, and Charmaine G. Yusongco
19
II. Comparative productivity and management practices4. Varieties, seeds, and crop establishmentAileen C. Litonjua, Piedad F. Moya, Jesusa C. Beltran, Flordeliza H. Bordey, Cheryll C. Launio, Rowena G. Manalili, and Alice B. Mataia
31
5. Fertilizer and nutrient managementRowena G. Manalili, Cheryll C. Launio, Jesusa C. Beltran, Aileen C. Litonjua, Alice B. Mataia, Flordeliza H. Bordey, Irene R. Tanzo, and Piedad F. Moya
43
6. Pesticide use and practicesJesusa C. Beltran, Flordeliza H. Bordey, Cheryll C. Launio, Aileen C. Litonjua, Rowena G. Manalili, Alice B. Mataia, Rhemilyn Z. Relado, and Piedad F. Moya
55
7. Labor and mechanizationAlice B. Mataia, Ronell B. Malasa, Jesusa C. Beltran, Flordeliza H. Bordey, Cheryll C. Launio, Aileen C. Litonjua, Rowena G. Manalili, and Piedad F. Moya
75

vi
8. Rice yield and its determinantsFlordeliza H. Bordey, Jesusa C. Beltran, Cheryll C. Launio, Aileen C. Litonjua, Alice B. Mataia, Rowena G. Manalili, and Piedad F. Moya
87
III. Competitiveness9. Costs of rice productionPiedad F. Moya, Flordeliza H. Bordey, Jesusa C. Beltran, Rowena G. Manalili, Cheryll C. Launio, Alice B. Mataia, Aileen C. Litonjua, and David C. Dawe
99
10. Profitability of rice farmingPiedad F. Moya, Flordeliza H. Bordey, Jesusa C. Beltran, Samarendu Mohanty, and David C. Dawe
119
11. Rice prices and marketing marginsJesusa C. Beltran, Flordeliza H. Bordey, Piedad F. Moya, Cheryll C. Launio, Rowena G. Manalili, Esther B. Marciano, Mary Rose L. San Valentin, Ma. Shiela D. Valencia, and David C. Dawe
129
12. Can Philippine rice compete globally?Flordeliza H. Bordey, Piedad F. Moya, Jesusa C. Beltran, Cheryll C. Launio, and David C. Dawe
141
13. Should the Philippines use pricing policy to improve competitiveness in rice production?David C. Dawe
153
Contributors 170

vii
TABLESTable 2.1 Top rice-producing countries in the world, 2013. 9
Table 2.2 Sample distribution, by survey site, crop year 2013-2014. 13
Table 3.1 Farmers’ profile in irrigated rice areas in Asia, 2013. 20
Table 3.2 Types of machinery owned by farmers in six Asian countries, 2013. 23
Table 3.3 Characteristics of farms under various project sites in six countries, 2013.
26
Table 4.1 Number of varieties used in selected Asian countries, by season, crop year 2013-2014.
32
Table 4.2 Average number of varieties planted by farmers in the main parcel per season, in selected Asian countries, crop year 2013-2014.
32
Table 4.3 Top varieties planted by farmer-respondents, by study area and season, crop year 2013-2014.
34
Table 4.4 Percent distribution of farmers who planted the top two varieties, by season and by country, crop year 2013-2014.
35
Table 4.5 Percent distribution of farmers, by seed class, season, and country, crop year 2013-2014.
36
Table 4.6 Methods of crop establishment and seeding rates among sample farms, by country, crop year 2013-2014.
39
Table 4.7 Seeding rate, by seed class, season, and country, crop year 2013-2014.
39
Table 5.1 Average amount of NPK (kg ha-1) used by farmers, by country and by season, crop year 2013-2014.
44
Table 5.2 Average and percent distribution of farmers, by number of fertilizer application, by country and by season, crop year 2013-2014.
47
Table 5.3 Number of fertilizer applications per farmer by plant growth stage, by country, and by season, crop year 2013-2014.
48
Table 5.4 Percent distribution of the top five common grades of fertilizer used by farmers, by country and by season, crop year 2013-2014.
50
Table 5.5 Average price of urea (PhP kg-1), by country and by season, crop year 2013-2014.
51
Table 6.1 Mean number of application of farmers, by type of pesticide, by country, and by season, crop year 2013-2014.
56
Table 6.2 Average amount of pesticides applied by farmers (kg ai ha-1), by type of pesticide across countries and seasons, crop year 2013-2014.
57
Table 6.3 Distribution of farmers (%), by number of herbicide applications, by country, and by season, crop year 2013-2014.
59
Table 6.4 Number of herbicide applications per farmer, by plant growth stage, by country, and by season, crop year 2013-2014.
60
viii
Table 6.5 Distribution of farmer-users, by hazard level of herbicide ai used, by country and by season, crop year 2013-2014.
61
Table 6.6 Distribution of farmers (%), by number of insecticide applications, by country, and by season, crop year 2013-2014.
63
Table 6.7 Number of insecticide applications per farmer, by plant growth stage, by country, and by season, crop year 2013-2014.
64
Table 6.8 Distribution of farmer-users, by hazard level of insecticide common ai used, by country, and by season, crop year 2013-2014.
64
Table 7.1 Total labor use (md ha-1), by major activity and season, six Asian countries, crop year 2013-2014.
76
Table 7.2 Percent adopters of machine, by season and country, crop year 2013-2014.
78
Table 7.3 Percent distribution of labor source, by country and season, crop year 2013-2014.
80
Table 7.4 Labor productivity, by country and season, crop year 2013-2014. 84
Table 8.1 Variables used in the production function estimation. 89
Table 8.2 IV-GMM estimates of the Cobb-Douglas production function 92
Table 8.3 Estimated average change in yield per 1 standard deviation change in significant input (in kg).
93
Table 8.4 Average yield and input use in irrigated rice production in selected Asian countries.
93
Table 8.5 Average effects of categorical variables on yield (in %) 94
Table 9.1 Exchange rates used in the conversion of local currency to US$, 2013.
101
Table 9.2 Comparative mean prices of fertilizer, pesticides, and wage rates across country sites, crop year 2013-2014.
101
Table 9.3a Breakdown of costs, by item of expenditures, high-yielding season, six country sites, crop year 2013-2014
103
Table 9.3b Breakdown of costs, by item of expenditures, low-yielding season, six country sites, crop year 2013-2014.
103
Table 9.4 Average costs of production, by item of expenditures for all seasons in six country sites, crop year 2013-2014.
104
Table 9.5 Pesticide cost per kilogram of paddy (PhP kg-1), six country sites, crop year 2013-2014.
105
Table 9.6 Average costs of labor to produce 1 kg of paddy, by source and across country sites, crop year 2013-2014.
106
Table 10.1 Purchasing power parity exchange rates in 2013. 121
Table 10.2 Mean paddy yield and prices, six country sites, crop year 2013-2014. 121
Table 10.3 Annual costs and returns of rice production (US$ ha-1 yr-1), selected Asian countries, crop year 2013-2014.
122
Table 10.4 Annual household income for rice farming at PPP, selected Asian countries, 2013 (I$).
124

ix
Table 10.5 Ratio of farm income to poverty threshold, irrigated farm households in selected countries in Asia, 2013.
124
Table 11.1 Differential gross marketing margins (GMM) and marketing costs, by function, PhP kg-1 of milled rice.
133
Table 12.1 Estimated import parity price of 25% broken rice. 144
Table 12.2 Cost of dry paddy production, Nueva Ecija, 2013. 147
Table 12.3 Partial budget analysis of labor cost, by crop establishment method (PhP kg-1).
148
Table 12.4 Partial budget analysis of harvesting and threshing costs. 148
Table 13.1 Costs and cost differentials between Philippines and exporters, 2013 (PhP ha-1 crop-1).
165
APPENDICESAppendix Table 6.1 Top 10 common herbicide active ingredients
used by farmers, by country and by season, crop year 2013-2014.
71
Appendix Table 6.2 The WHO-recommended classification of pesticides, by hazard level, 2009.
72
Appendix Table 6.3 Top 10 common insecticide active ingredients used by farmers, by country and by season, crop year 2013-2014.
73
Appendix Table 9.1 Appendix Table 9.1. Average price of seed per season (US$ kg-1), by country, crop year 2013-2014.
111
Appendix Table 9.2 Fertilizer use (kg-1 ha-1), by country and by season, crop year 2013-2014.
111
Appendix Table 10.1a Cost and returns by season, selected Asian countries, US$ ha-1, crop year 2013-2014.
127
Appendix Table 10.1b Cost and returns in the low-yielding season, selected Asian countries, US$ ha-1, crop year 2013-2014.
128
Appendix Table 13.1 Costs and cost differentials between Philippines and exporters, 2013 (US$ ha-1 crop-1).
169

x
FIGURESFig. 1.1 Trends in rice imports, Philippines, 1960-2013 (Source of basic
data: USDA, 2016).3
Fig. 2.1 Location of study sites (Source: https://www.google.com/maps). 10
Fig. 2.2 Common rice-growing calendar in project sites, crop year 2013-2014.
12
Fig. 3.1 Land ownership of farmers, by cropping season, 2013. 22
Fig. 3.2 Share of rice to total household income in six Asian countries, 2013.
23
Fig. 3.3 Percentage of farmers in six Asian countries who borrow capital for their farm operations, 2013.
24
Fig. 4.1 Average yield across both seasons combined, by country and seed class.
37
Fig. 6.1 Percentage of herbicide users, by country and by season, crop year 2013-2014.
58
Fig. 6.2 Percentage of insecticide users, by country and by season, crop year 2013-2014.
62
Fig. 6.3 Percentage of fungicide users, by country and by season, crop year 2013-2014.
65
Fig. 6.4 Percentage of molluscicide users, by country and by season, crop year 2013-2014.
66
Fig. 6.5 Percentage of rodenticide users, by country and by season, crop year 2013-2014..
67
Fig. 7.1 Percent adopters of direct seeding, by country and season, crop year 2013-2014.
78
Fig. 7.2 Percent distribution of labor, by major farm activity and by country in HYS, crop year 2013-2014.
79
Fig. 7.3 Percent distribution of labor, by major farm activity and by country in LYS, crop year 2013-2014.
80
Fig. 8.1 Distribution of paddy yield at 14% MC, by country and season, for crop year 2013-2014.
91
Fig. 9.1 Comparative cost of producing 1 kilogram of paddy in various project sites, crop year 2013-2014.
102
Fig. 9.2 Comparative fertilizer cost to produce 1 kg of paddy, six Asian countries, crop year 2013-2014.
105
Fig. 9.3 Breakdown of labor cost, by major activity, six project sites, crop year 2013-2014.
107
Fig. 9.4 Comparative cost spent on animal and machine power to produce 1 kg of paddy, six project sites, crop year 2013-2014.
108

xi
Fig. 9.5 Land rental costs across six project sites, crop year 2013-2014. 109
Fig. 10.1 Comparative annual gross revenue per hectare, selected Asian rice bowls, crop year 2013-2014.
122
Fig. 11.1 Trends in wholesale prices of milled rice, selected importing and exporting countries in Southeast Asia, 2000-2012.
130
Fig. 11.2 Comparative farmgate and wholesale rice prices. 133
Fig. 12.1 Sensitivity of import parity price relative to variation in price of 25% broken rice and given 35% tariff.
145
Fig. 12.2 Import parity price of 25% broken rice from Vietnam at different tariff levels.
146
Fig. 12.3 Comparative palay yield (t ha-1, 14% MC) and seed cost, by seed class, 2013 dry season, Nueva Ecija.
147
Fig. 13.1 A supply curve for palay in the Philippines, disaggregated by region/ecosystem/season.
154
Fig. 13.2 Farm prices for palay in key rice production areas, 2013. 156
Fig. 13.3 Wholesale prices for milled rice, 2015. 156
Fig. 13.4 Net income from rice farming (US$ ha-1 crop-1), 2013. 157
Fig. 13.5 Labor costs in key rice production areas, 2013. 160
Fig. 13.6 Land rent in key rice production areas, 2013. 161
Fig. 13.7 Fertilizer costs in key rice production areas, 2013. 162
ai active ingredientoC degree CelsiusDAS days after seedingDAT days after transplantingha hectarehp horsepowerhr hourHYS high-yielding seasonI$ International dollarkg kilogram
km kilometerL literLYS low-yielding seasonmd Mandaymm millimetermo monthPhP Philippine pesot tonyr yearUS$ United States dollar
ABBREVIATIONS

xii
FOREWORD
By 2017, the Philippines’ waiver to its commitment to the World Trade Organization in removing its quantitative restriction (QR) on rice will expire. Should the option of negotiating for QR extension become infeasible, imported rice can be brought into the country as long as traders pay the imposed tariff. When this happens, we ask: is the Philippines ready to compete with its neighbors?
Competitiveness is a serious issue. It is about time that the country looks beyond its borders and get manifold perspectives on the global rice situation—a prerequisite in developing the right implements that will encourage our dwindling brood of farmers to continue farming and produce rice with relatively low cost and better returns. This book offers possible answers on burning questions about the plight of the local rice industry and attempts to provide insights on improving the competitiveness of Filipino rice farmers.
Although the emphasis of this work is on the Philippines, much could also be learned about the other major rice-producing countries in Asia, namely: China, India, Indonesia, Thailand, and Vietnam. This book provides information on comparative yield, input uses, and management practices of rice farmers in representative irrigated areas of the six Asian countries. The book also compares the costs of production and marketing, rice income level of farmers in these areas.
The analyses provided here are informed by quantitative data. Although not everything in rice production and marketing can be reduced to numbers, these often shed light on rice issues that are politically sensitive. These facts are vital to the ongoing debates and in charting the course of the Philippine rice industry in the medium term.
The reality is that liberalizing rice trade presents opportunities for growth. However, to be at par with international competitors, it is necessary for local industry players to understand the mechanisms that enable major rice-producing nations to sustain their status and protect the welfare of their consumers as well. Access to the right elements of information, policies, and technologies is critical.
This book integrates these three elements in an easy-to-read language and presents powerful and authentic insights from rice experts themselves, scientists and researchers, extension workers, paddy traders, rice millers and wholesalers, and farmers.

xiii
Though the authors poured considerable time, thought, and research in the preparation of this book, we acknowledge that the book has limitations of its own. Rather than prescribe stringent remedies for the ailments of the local rice industry, the book discusses ideas and methods for the reader to digest and integrate, which makes it a great reference material for policy makers, extension workers, academic professionals and scholars, and all other inquisitive minds whose work concerns the rice sphere.
We hope that, through this book, readers will gain a profound understanding of what it takes to propel the Philippine rice sector further and dispel the myths about rice farming and farmers that we have come to believe as true. Then, we can start introducing simple and better changes for the benefit of both rice producers and consumers.
Matthew K. Morell Calixto M. ProtacioDIRECTOR GENERAL, IRRI EXECUTIVE DIRECTOR, PhilRice

xiv
ACKNOWLEDGMENTS
We would like to acknowledge many individuals who have made the writing and publication of this book possible.
First and foremost, to the Philippine Department of Agriculture through the initiative of the National Rice Program led by Assistant Secretary Edilberto M. De Luna and to the Bureau of Agricultural Research headed by Dr. Nicomedes M. Eleazar, for facilitating the funding of the project. Due recognition is also given to Agriculture Secretary Proceso J. Alcala, without whose final approval, this project would not have materialized. From the beginning, he has shown great enthusiasm for the publication of this book.
Speaking of enthusiasm, we must mention the eager support and inspiration provided by Director Edmund Sana of the DA-Rice Program; Dr. Eufemio T. Rasco, Jr. and Dr. Calixto M. Protacio, former and current Executive Directors of PhilRice; and Dr. Robert S. Zeigler and Dr. Matthew K. Morell, former and current Directors-General of IRRI, without whose insistence and institutional backing, this book would not have seen the light of day.
Credit is also due Dr. Samarendu Mohanty, head of IRRI-Social Sciences Division, and Ms. Rhemilyn Z. Relado, head of PhilRice Socioeconomics Division, who both fully and willingly supported the implementation of this project.
We are also grateful for Dr. V. Bruce J. Tolentino, IRRI’s Deputy Director-General for Communications and Partnerships, for motivating us to work harder to complete the manuscript and for constantly reminding us of its importance.
We also recognize our collaboration with the Philippine Council for Agriculture and Fisheries led by Engr. Ariel T. Cayanan. Their staff—Ms. Estrella V. Tulay, Mr. Jose Reden H. Besenio, Ms. Catherine A. Viray, Ms. Francia M. Macalintal, and Ms. Maria Belen A. Milanes—helped us in the initial data gathering.
We highly appreciate the enormous help provided by our international fieldwork partners. To our country coordinators for doing a great job in organizing the surveys: Xianghai Ding and Xueping Huang (China); KR Karunakaran (India); Putu I. Wardana (Indonesia); Truong Thi Ngoc Chi (Vietnam), and Krissanapong Kraithep (Thailand). To Amornrat Intrman of Suphan Buri Rice Experiment Station (SBRES), Thailand and Dr. Nguyen Cong Thanh-Head of the Division of Industrial Crops, Institute of Agricultural S cience for Southern Vietnam , for their kind assistance in

xv
the marketing survey. To Dr. Fangming Xie of IRRI and Dr. Xianhua Shen and Mr. Wan Yong (Rice Research Institute, Jiangxi Academy of Agricultural Sciences, China), and Rupendra Singh, Pankaj Malik, Yog Raj of Bayer company in Hyderabad and also Aldais Janaiah for making it easy for us to complete the hybrid survey.
Extra special acknowledgment goes to Dr. David Dawe of FAO-UN for patiently taking on the final technical editing of this book. He offered great insights during the conceptualization, writing, and finalization of its contents.
We would also like to thank the highly dedicated IRRI, PhilRice, and DA-BAR staff who helped us in administrative matters and coordination work to publish this book: to Mr. Dehner De Leon, Ms. Mary Grace Salabsabin and Ms. Ma. Potenciana Caisip of IRRI; Ms. Teodora L. Briones, Ms. Anna Liza P. Labay, Ms. Alfrelyn Gregorio, and Mr. Roy F. Tabalno of PhilRice; and Mr. Raymond Patrick Cabrera of DA-BAR.
Many thanks to our homegrown technical experts from PhilRice, Mr. Democrito B. Rebong, Dr. Ceasar Joventino M. Tado, Engr. Eden C. Gagelonia, and Mr. Wilfredo B. Collado for lending their time and expertise to ensure we presented specific subject matters properly. Ms. Guadalupe O. Redondo (†), a former member of the team, deserves mention and our wholehearted thanks for her inestimable help during the early days of this project.
Thanks are also due to Ms. Tess Rola who did the language editing and Mr. Carlo G. Dacumos who made the cover design and book layout.
Our deepest gratitude we reserve to the rice farmers, paddy traders, rice millers, and rice wholesalers in the various country sites who willingly provided all the information that we needed to write this book.
Last and not least, we thank and beg forgiveness of all those who have been with us and saw us over the course of the years in implementing this project and whose names we have failed to mention.
Flordeliza H. Bordey Piedad F. Moya Jesusa C. Beltran David C. Dawe

xvi
EXECUTIVE SUMMARY
Rice is the last frontier of the Philippines’ agricultural protection strategy relative to international trade. In spite of the country’s accession to the World Trade Organization (WTO) in 1995, rice remains in its list of highly sensitive commodities, which exempted it from the removal of quantitative restrictions (QR). The use of QR on rice has been extended twice: the first until 2005 and the second until 2015. The Philippines further obtained a waiver on its commitment to eliminate QR until June 2017. All of these extensions and waivers required the Philippines to offer additional concessions to trading partners. Thus, beyond the current waiver, it may be costly for the country to negotiate for further extension of the QR. But once the QR ends, the Philippine rice industry will be subject to international competition.
The main reason for extending the QR was to make Filipino rice farmers competitive. It was believed then that Philippine rice cannot compete with cheap imported ones and that the income of Filipino farmers will be adversely affected by liberalizing trade. Hence, the extension time for QR was supposed to be used in improving the competitiveness of the Philippine rice industry. Unfortunately, two decades after the country joined the WTO, the competitiveness of the Philippine rice industry is still in question.
To be competitive, farmers and processors must be able to produce rice with the same or superior quality at costs than those of international competitors. Competitiveness is affected by technological capacity, market conditions, and existing domestic and trade policies of participating countries in the world market, as well as by natural endowments. Given the wide variation in geography, production ecosystems, and technological capabilities within a country, some farmers and processors are more competitive than others. It is thus hard to establish a measure of national competitiveness in rice that is directly comparable across countries. A more feasible way is to compare the competitiveness of a set of relatively similar producers in each country that will act as benchmarks.
To do this, a study on Benchmarking the Philippine Rice Economy Relative to Major Rice-Producing Countries in Asia was co-implemented by the Philippine Rice Research Institute and the International Rice Research Institute through funding from the Philippine Department of Agriculture, with some technical assistance from the Food and Agriculture Organization (FAO). As an output of this study, this book has examined the cost of producing paddy rice (ordinary white rice varieties) in irrigated and intensively cultivated areas in six locations: (1) Nueva Ecija, Philippines; (2) Zhejiang, China; (3) West Java, Indonesia; (4) Tamil Nadu, India; (5) SuphanBuri, Thailand; and (6) Can Tho, Vietnam. In addition, yield levels, input use, and crop

xvii
management practices, including their relation to production cost, were assessed. Farm profitability and its relation to poverty were also evaluated.
Aside from this, marketing costs and returns were determined by examining specific marketing chains in Southeast Asia, namely (1) Nueva Ecija – Metro Manila (Philippines); (2) West Java – Jakarta (Indonesia); (3) SuphanBuri – Bangkok (Thailand); and (4) Can Tho – Ho Chi Minh (Vietnam). The competitiveness of Philippine rice relative to that of major exporters was determined. Finally, the book provided insights on policies affecting the rice industry and put forward some recommendations on improving the Philippines’ competitiveness relative to her neighbors.
Production cost, yield, and profitability
Producing paddy rice in Philippine irrigated areas costs less (PhP 12.41 kg-1) compared with similar places in other rice-importing countries such as China and Indonesia. Nevertheless, it is more expensive to produce paddy in the Philippines compared with exporting countries such as India, Thailand, and Vietnam. The least cost producers were in Vietnam, with an average of PhP 6.53 kg-1, only about half that of the Philippines. Labor and machinery costs account for the bulk of the cost difference between the Philippines and the exporters.
The Philippines is also second to the last in terms of annual rice yield per hectare (9.52 t ha-1 yr-1), higher only than India’s. While rice yield in the Philippines is at par with the others during the high-yielding season (HYS), the country has the least yield during the low-yielding season (LYS), owing to less favorable climate. This relatively lower annual yield is another major cause of its higher production cost per unit.
In contrast, Vietnam garnered the highest annual yield of 20.59 t ha-1 yr-1. Not only did Vietnam have the highest yield in both HYS and LYS, it also had the most intensive cropping system—three rice crops per annum. This was made possible by the continuous availability of water, use of early-maturing varieties, direct seeding, and synchronous planting. The high farm productivity in Vietnam is a big contributor to its low production cost per unit.
Our results also show that rice production in intensively irrigated areas in the major rice-producing areas in Asia is profitable, considering the positive values of the net income per hectare. Considering the purchasing power parity, rice area cultivated, and household size, it is also shown that per capita income from rice farming is more than enough to meet the poverty threshold income in all countries, except for China.
xviii
Nevertheless, the latter is quite a different case since rice farm income only accounts for 27% of their total household income.
The Philippines is consistently second to the last in terms of financial profit per hectare, returns above paid-out cost, annual household income in both US and International dollars, and per capita income from rice farming. This occurs not because the farmers are receiving a low price for its paddy but because of low productivity and higher production cost. This suggests that the Philippines has to not only improve its yield but also reduce its production cost to increase profitability.
Marketing costs and margins
Among the four Southeast Asian countries, gross marketing margin (GMM) is highest in the Philippines (PhP 9.06 kg-1) and lowest in Vietnam (PhP 4.55 kg-1). Transportation and milling costs and high returns to management are the main factors responsible for the high GMM in the country.
The wider road networks, particularly in Thailand and Vietnam, gave their market players an advantage to haul more tons of grains per liter of fuel. In addition, mechanization reduced the labor costs incurred in loading and unloading the grains from each point of destination. Milling cost in the Philippines is high due to underutilized rice mills, which, in turn, is caused by the lower volume of paddy supply and the expensive cost of paddy.
Returns above marketing cost were also observed to be highest in the Philippines (PhP 4.43 kg-1). One explanation is the larger number of market intermediaries in the Philippines as compared with those in other countries who must earn a living. Layers of marketing agents for the purchase of paddy are common in the Philippines before the paddy even reaches the miller, while these are not found in other countries.
These show that differences in rice prices come not only from production cost but also from marketing factors.
Competitiveness and policy directions
If QR were eliminated and if prices in 2015 were used, Philippine rice (i.e., regularly milled ordinary white rice) at the domestic wholesale market would be more expensive than rice with similar quality (i.e., ordinary white rice with 25% broken grains) coming from major exporters such as Vietnam, Thailand, and India. Even with 35% tariff rate, imported rice from Vietnam, the least expensive among the three, is about 21% cheaper than the domestic rice. After accounting for exchange rate, tariff rate, and costs of freight, insurance, port administrative charges, and local transport, a kilogram of Vietnam rice can be sold at PhP 27 in the wholesale market while domestic rice is sold at PhP 34.
xix
If wholesale price in the domestic market is reduced after eliminating QR, the farmgate price of paddy will eventually go down. At a milling recovery ratio of 64.5%, the best price that processors can offer to buy a kilogram of dry paddy is estimated at around PhP 12. To maintain the profit margin of farmers, which is estimated at PhP 5 kg-1, their production cost must be reduced to PhP 7 kg-1. Hence, rice yield must be enhanced and production cost needs to be reduced for Filipino farmers (at least those in irrigated areas) to be competitive.
Since labor costs account for the biggest share of production cost in the Philippines, reducing it through mechanization, particularly in harvesting, and adoption of labor-saving practices such as direct seeding in crop establishment can lead to significant cost savings. Subsidizing the use of machinery is sensible, although this has the drawback of reducing employment for landless laborers. Setting aside the potential impact on the incomes of landless laborers, reducing the use of labor through increased use of machinery will have potentially the biggest impact on improving competitiveness.
Nevertheless, a caveat on the use of subsidy in any inputs must be considered. Subsidy can consume large amounts of scarce budgetary resources. If input subsidies lead to less investment in agricultural research, education, and health, then long-term competitiveness will be compromised. And if input subsidies are awarded to only a limited number of farmers to conserve on budgets, then the impact on the overall competitiveness will be very limited and may probably be zero.
Increasing the yield is another way to reduce production cost per unit. Some yield-enhancing factors can be explored. Among several inputs, the use of hybrid rice varieties, particularly during HYS, is one option to increase yield. However, the performance of hybrid rice is location-specific, so careful consideration should be made in promoting this. The proper use of herbicide is one area with some potential in minimizing yield loss. The efficiency of fertilizer use particularly in the HYS is another area for improvement. These should be coupled with enhancement of farmers’ knowledge through education and training.
The Philippines cannot be competitive by enhancing the rice production system alone. Parallel efforts should be made to improve its marketing system to be able to compete globally. To do this, milling efficiency should be improved. This can be done by breeding varieties with similar grain shape and length and with high head rice recovery. Also, farmers should be encouraged to plant fewer varieties as most millers complain about having too many varieties, which makes processing more costly. Mechanizing the drying of paddy can also minimize the high percentage of broken rice and improve the overall quality of milled rice.
Improving the transportation infrastructure and facilities, including the handling systems, can further reduce marketing cost. Cutting on the labor cost through mechanization of loading and unloading can reduce transport cost. In addition, road
xx
widening and creating bypass roads (e.g., those in the outskirts of key cities) can encourage investments in more efficient modes of transporting grains. Revitalizing the railway system can be another long-term means of enhancing transportation efficiency.
Increasing competition among local market players can lead to reduced margins. This can be done by establishing wholesale paddy markets similar to those existing in Thailand. The creation of these markets will eliminate assembly traders and agents and their margins as well, and consequently reduce overall returns to management. The National Food Authority (NFA) is in the best position to handle this function. The NFA does not necessarily have to procure the paddy, but they can provide facilities to establish the wholesale paddy market. In addition, they can provide custom services to both farmers and traders such as weighing, drying, and temporary storage. They can also make marketing information transparent to all players.
Another way to increase marketing competition is to open up the rice marketing system to foreign investors, thereby giving farmers more choices in the sale of their produce. Their entry could bring fresh capital into the market and improve competition with the large domestic marketing players who have a sizeable market share. This is an option that can be studied further.
International competition is both a challenge and an opportunity for the Philippine rice industry. It has both positive and negative effects. If the Philippines decides to embrace a more liberalized rice trade (e.g., removal of QR while maintaining tariff), rice imports will increase and domestic rice price will decline to mirror the cheaper price of rice in the world market. The poor consumers consisting of but not limited to fishers, landless laborers, corn and coconut farmers, and the urban poor will benefit from the more affordable rice. The lower price of rice can also contribute to the further development of the industrial and service sectors. Cheap rice eases the pressure to increase wages, thereby, encouraging entrepreneurs to expand and hire more workers.
On the other hand, cheaper rice means lower prices for rice farmers and processors. This could adversely affect their income if they will not adjust. The analyses provided in this book tried to show the things that could be done to improve competitiveness both at the production and marketing levels. Moreover, the change in price can also encourage producers to venture more into rice-based farming systems and other agriculture-based enterprises that can give them better household income than when they engage solely on the rice monocropping system.
For the past 20 years, protectionism did not lead to an improvement in the competitiveness of the Philippine industry; it was rather lulled into complacency. The country cannot expect new results if the same policy directions continue. It has to face the challenge of liberalization head-on and take the necessary steps to improve competitiveness because it is now a matter of survival. It is time to take that leap of faith.


WHY THIS STUDY?Flordeliza H. Bordey, Piedad F. Moya, Jesusa C. Beltran, and David C. Dawe
Historically, the Philippines has been a net importer of rice, but in the late 1970s, it became a marginal rice exporter (Fig 1.1). This was attributed to the rapid growth in production brought about by widespread adoption of modern rice
varieties during that period (Inocencio and David, 1995). Growth in rice production, however, slowed down from the mid-1980s to the late 1990s, which returned the country into its marginal rice importer slot (Bordey and Castañeda, 2011). Since the early 1990s until the late 2000s, an increasing ratio of rice imports to total consumption has been observed, implying the rising relevance of rice imports to the nation’s food security (Bordey, 2010).
Fig 1.1. Trends in rice imports, Philippines, 1960-2013 (Source of basic data: USDA, 2016)
In spite of the agricultural nature of the nation’s economy and the presence of two (one international and one national) agencies dedicated to improving rice production, why does the Philippines still import rice? This is the question perpetually being asked by many Filipinos, as rice self-sufficiency is always at the forefront of any political administration. Dawe et al. (2006) conjectured that geography has a lot of influence on this. They pointed out that the major traditional rice exporters are all on the mainland of Southeast Asia (Thailand, Vietnam, Cambodia, and Myanmar) and are blessed with major river deltas and vast land suitable for rice production. Meanwhile, traditional importers (the Philippines, Indonesia, and Malaysia) are all islands or narrow peninsulas. They have varied landscapes that are more suitable for growing diversified crops.
1
3

4 Competitiveness of Philippine Rice in Asia
As a result of these differences, we see that Southeast Asia’s rice-exporting countries have a large share of their agricultural land devoted to rice production, whereas agricultural areas in Southeast Asia’s importers are more diversified. Furthermore, the Philippines has more mouths to feed per unit rice area compared with the exporting nations (Dawe, 2012). These show that the Philippines has less comparative advantage in rice production.
Dawe (2013) compared the population-weighted rice area harvested and showed that importing countries (Indonesia, the Philippines, and Malaysia) only have 0.05 ha per person, and exporters (Cambodia, Lao PDR, Thailand, Vietnam, and Myanmar) have 0.129 ha per person. The study also showed that rice production per person is primarily determined by rice area harvested per caput, which, in turn, is principally determined by share of rice area harvested to total crop area. The study concluded that island countries simply have a natural disadvantage in terms of achieving self-sufficiency.
Aside from these broader macro considerations, it is also important to understand at the micro level the competitiveness of Philippine rice production. However, the most recent cross-country studies were conducted more than a decade ago (Moya et al., 2004). To get richer insights on how the Philippines can further improve its competitiveness relative to its rice-producing neighbors, it is essential to update such studies.
Thus, a project entitled “Benchmarking the Philippine Rice Economy Relative to Major Rice Producing Countries in Asia” was commissioned by the Department of Agriculture (DA)-National Rice Program and co-implemented by the Philippine Rice Research Institute (PhilRice) and the International Rice Research Institute (IRRI) with the participation of the Philippine Council for Agriculture and Fisheries (PCAF) and the Food and Agriculture Organization (FAO) of the United Nations. It is fully funded by the Department of Agriculture, through the Bureau of Agricultural Research (BAR).
The study aims to provide the proper perspective on how the country can further improve its competitiveness in rice production and marketing in view of the full integration to the ASEAN Economic Community. It also provides insights on policies being implemented by our neighbors to make their respective rice industry competitive. By understanding the costs of producing and marketing rice amidst different government policies in major rice-producing countries, we will be able to make informed decisions on how best to position the country’s interest in terms of rice food security. This information can be used by our policymakers and planners in crafting programs that will sustain the gains of the current food staple sufficiency program.
And even if the Philippines attains self-sufficiency under the current set of policies (i.e., import restrictions), the domestic price will still be higher than the world price. In that sense, self-sufficiency will not be sustainable, especially when trade restrictions

5
are removed (if quota was replaced by tariff that will be eventually lowered). Thus, if we do not improve our competitiveness, there will always be pressure to import (or smuggle) rice. Unless we become competitive, attaining self-sufficiency will be artificial and short-lived. In a broader context, we can even dream of becoming an exporter if we are that competitive.
With this background in mind, the study specifically aims to a) determine the competitive advantage/disadvantage of the Philippines in rice production; b) determine government policies in selected Asian countries that affect their competitiveness in rice production; c) examine and compare rice yields, input use, and crop management practices in selected Asian countries; d) estimate and compare the costs and returns of producing paddy rice across Asian countries; and e) examine and compare the cost of marketing commercial paddy rice in selected Asian countries.
Organization of the book
This book, which is the major output of the project discussed above consists of three major parts. Part 1 is composed of three chapters. Chapter 1 describes how the project came about and the rationale behind it. Chapter 2 discusses the framework of analysis, from site and sample selection to analytical methods. In Chapter 3, the socioeconomic profiles of the rice farmers are described as well as the characterization of the sample farms.
Part 2 is about the comparative productivity and crop management practices of the six countries included in the study with special reference to the Philippines. Chapters 4, 5, 6, and 7 present the cross-country comparative analyses of crop management practices with respect to seed use, fertilizer use, pesticide use, and labor use, respectively. To summarize Part 2, Chapter 8 did a detailed analysis of the variation of yield across sites. It also attempts to determine the factors affecting productivity through a production function analysis.
Part 3 (Chapters 9, 10, 11, 12, and 13) reports the competitiveness of rice farming across Asia with special reference on Philippine rice. It includes comparison of costs, profitability, and rice marketing systems and gross marketing margins across Asian countries. Chapters 9 and 10 point out who produces the cheapest rice among Asian countries and who gets the highest net income from rice farming while Chapter 11 estimates and compares gross marketing margins across the sites and determine which country is more efficient in marketing in terms of costs. Chapter 12 is devoted to the analysis of Philippine rice competitiveness and suggests possible options for the Philippines to be competitive in reference to her Asian neighbors. Lastly, Chapter 13 presents an analysis of various government policies that affect rice competitiveness across countries with special emphasis on the Philippines.
Why This Study?

6 Competitiveness of Philippine Rice in Asia
References
Bordey FH. 2010. The impacts of research on Philippine rice production. PhD dissertation, University of Illinois, Urbana-Champaign.
Bordey FH, Castañeda AC. 2011. Philippine rice industry primer series. Science City of Muñoz (Philippines): Philippine Rice Research Institute.
Dawe DC. 2013. Geographic determinants of rice self-sufficiency in Southeast Asia, ESA Working Paper no. 13-03. http://www.fao.org/docrep/018/aq656e/aq656e.pdf September 29, 2014.
Dawe DC. 2012. Competitiveness of the Philippine rice industry vis-à-vis SEA nations. Paper presented at the policy seminar “Philippine Rice Trade Policies and Rice Security: Future Directions,” 26 September 2012, AIM Conference Center, Makati City, Philippines.
Dawe DC, Moya PF, Casiwan CB (editors) 2006. Why does the Philippines import rice? Manila (Philippines): International Rice Research Institute and Science City of Muñoz (Philippines): Philippine Rice Research Institute. 166 p.
Moya PF, Dawe DC, Pabale D, Tiongco M, Chien NV, Devarajan S, Djatiharti A, Lai NX, Niyomvit L, Ping HX, Redondo GO, Wardana P. 2004. The economics of intensively irrigated rice in Asia. In: Dobermann A, Witt C, Dawe D, editors. Increasing the productivity of intensive rice systems through site-specific nutrient management. Enfield, N.H. (USA) and Los Baños (Philippines): Science Publishers, Inc. and International Rice Research Institute (IRRI). pp. 29-58.


THE BENCHMARK DATA: SOURCES, CONCEPTS, AND METHODSFlordeliza H. Bordey, Piedad F. Moya, Jesusa C. Beltran, Cheryll C. Launio, Aileen C. Litonjua, Rowena G. Manalili, Alice B. Mataia, Rhemilyn Z. Relado, Ronell B. Malasa, Irene R. Tanzo, Charmaine G. Yusongco, Suennie Jane C. Paran, Ma. Shiela D. Valencia, Mary Rose L. San Valentin, Esther B. Marciano, and David C. Dawe
This chapter describes the general methods used for collecting farm-level data in the areas covered by the project. It also discusses the analytical methods used in the succeeding section on comparative productivity and crop management practices.
A segment also explains the limitations of the data gathered. However, the more technical methods of analyzing production function, farm enterprise budget, gross marketing margin, and competitiveness level are detailed in the respective chapters.
Selection of project domains
The study covers six major rice-producing countries to have a wider view of the rice competitiveness spectrum in Asia. The Philippines, China, and Indonesia represent the importing countries, whereas India, Thailand, and Vietnam are the exporting ones. Four of the countries are in Southeast Asia; China and India are located in East and South Asia, respectively. In 2013, these countries belong to the top 10 rice-producing countries in the world. China, India, and Indonesia are the top three; Vietnam and Thailand are fifth and sixth in rank, respectively; the Philippines is in the eighth slot (Table 2.1). Together, these countries account for 77% of Asia’s area harvested and 80% of production.
Table 2.1. Top rice-producing countries in the world, 2013.
Country Production (million t)
China 205.2 India 159.2 Indonesia 71.3 Bangladesh 51.5 Vietnam 44.0 Thailand 36.1 Myanmar 28.8 Philippines 18.4 Brazil 11. 8 Japan 10.8 Asia 671.0 World 740.9
Source: FAO, 2015
2
9
10 Competitiveness of Philippine Rice in Asia
Comparing the rice industry performance of one country against that of another can be difficult because of the wide variation in rice-growing conditions. To narrow down the comparison, the project focused on provinces or states that are generally irrigated and cultivated at least twice a year, where a greater volume of rice is produced. These are Nueva Ecija (NE), Philippines; Zhejiang (ZJ), China; Tamil Nadu (TN), India; West Java (WJ), Indonesia; SuphanBuri (SB), Thailand; and Can Tho (CT), Vietnam (Fig. 2.1). A more detailed description of each site follows.
Fig. 2.1. Location of study sites (Source: https://www.google.com/maps).
Nueva Ecija, which is located in the Central Luzon plain, is the biggest rice-producing province in the Philippines (Launio et al., 2015), contributing about 8% of the country’s paddy production from 1990 to 2013. About 87% of its harvested area was irrigated mainly through two large-scale irrigation facilities in the province: the Upper Pampanga River Integrated Irrigation System and the Casecnan Multipurpose Irrigation and Power Plant. The central experiment station of the Philippine Rice Research Institute is also established in the province. It has a tropical climate that is normally dry from November to April and wet the rest of the year. It has an average annual rainfall of 1,781 mm and a mean temperature of 27.1 oC (Climate-data.org, 2016).
Zhejiang is situated in the southeast part of China, representing rice cultivation in subtropical climate (Mataia et al., 2015). As the 11th largest rice-producing province, Zhejiang accounts for 2.98% of China’s area harvested and 3.28% of its paddy production. It has abundant sunshine, a mild temperature of 17.9 oC, and a mean

11
annual precipitation of 1,419 mm (Climate-data.org, 2016). The province mirrors the declining rice area in China due to industrialization and diversification of agriculture toward higher value products. Zhejiang is home to the Agricultural Research Station of Jinhua City.
Tamil Nadu, which is found in southern India, is the 6th largest rice-producing state in the country (Bordey et al., 2015). In 2011, it produced 6.55% of India’s production from 4.68% of the area harvested. It has a tropical climate, representing double rice cropping in India, a mean temperature of 28.7 oC, and an average annual rainfall of 1,048 mm (Climate-data.org, 2016). The Tamil Nadu Rice Research Institute is also located in this state. Rice area in Tamil Nadu is concentrated in the Cauvery Delta Zone, which draws water from the Cauvery River. However, an increasing use of bore wells to extract groundwater for irrigating rice fields was observed in recent years.
West Java is the 2nd largest rice-producing province in Indonesia (Litonjua et al., 2015). In 2014, it contributed 16% to Indonesia’s paddy production. In the same year, the province has 1.98 million ha of irrigated area harvested with an average yield of 5.9 t ha-1. It has a tropical climate with a mean annual temperature of 21.0 oC; it receives 3,107 mm of rainfall annually (Climate-data.org, 2016). West Java is home to the Indonesian Center for Rice Research.
SuphanBuri is one of the important rice-producing provinces in the Central Plain in Thailand (Manalili et al., 2015). In 2012, it produced 1.79 million t of rice, about 4.78% of the nation’s production. It has a tropical climate with warm, humid weather and average temperature of 28.1 oC. It is blessed with 1,236 mm of rainfall annually and fertile alluvial soil (Climate-data.org, 2016). The SuphanBuri Rice Research Center of the Rice Department of Thailand is also located in the province.
Can Tho is located in the heart of the Mekong River Delta (MRD). The MRD contributes about 50% of Vietnam’s total paddy output and which comprises 45% of its rice area (Beltran et al., 2015). It has a mean annual rainfall of 1,548 mm and an average temperature of 27.2 oC (Climate-data.org, 2016). Endowed with fertile alluvial soil and abundant freshwater, Can Tho ranked 6th among the leading rice-producing provinces in Vietnam. The Cuu Long Delta Rice Research Institute is also found in this province.
Aside from the importance of each province in rice production in the respective countries, these were former sites of a project conducted by IRRI way back in 1995-1999 entitled “Reversing the Trend of Declining Rice Productivity (RTDP)”. This study was implemented in villages located within a 15-20 km radius of a rice research agency so farmers in these areas have easier access to technology (Dobermann et al., 2004). Due to the existing network of research collaborators, these sites were revisited in the current project to facilitate data gathering.
In the succeeding sections and chapters, these sites or provinces are referred to whenever the countries are mentioned. The farmers included in the survey, being
The BenchMark Data: Sources, Concepts, and Methods

12 Competitiveness of Philippine Rice in Asia
confined to a limited number of villages in an irrigated area in each country, are clearly not representative of the entire country’s farming population. Nevertheless, for the sake of brevity, we often refer to each group of farmers using the country name, as opposed to just the province/area name. Furthermore, because all of these areas are relatively well-served by infrastructure, they are generally integrated with the rest of their respective countries, which means that input and output prices are roughly similar to those in the rest of the country (with the exception of some mountainous or some remote areas). Because of this integration and of the fact that the bulk of rice production in all of these countries comes from irrigated areas, the quantities of inputs used are likely to be somewhat similar in large parts of the country. Thus, while each sample is not nationally representative in a statistical sense, it does bear broad similarities to other key rice production areas in their respective countries.
Coverage period
Data were gathered in all rice planting seasons during crop year 2013-2014. Planting seasons depend on each location and are summarized in Figure 2.2. For the Philippines, dry season is from December to April and wet season is generally from June to October (Launio et al., 2015). Cropping season in Thailand is relatively similar: dry season from November to March and wet season from May to September (Manalili et al., 2015). Because it is located in the southern hemisphere, planting seasons in Indonesia were in reverse order: wet from November to March and dry from May to September (Litonjua et al., 2015). India has thaladi (monsoon) season during October to February and kuruvai (dry) season during June to September (Bordey et al., 2015). China has early season from April to July and late season from July to November (Mataia et al., 2015). Vietnam has three growing seasons: 1) winter-spring during November to February; 2) summer-autumn during March to June; and 3) autumn-winter during July to September (Beltran et al., 2015).
Site Jan Feb Mar Apr May Jun Jul Aug Sep Oct Nov DecPhilippines (Nueva Ecija) Dry season Wet season DryChina(Zhejiang) Early rice season Late rice seasonIndonesia (West Java) Wet season Dry season Wet seasonIndia (Tamil Nadu) Thaladi Kuruvai ThaladiThailand(SuphanBuri) Dry season Wet season Dry seasonVietnam (Can Tho) Winter-spring Summer-autumn Autumn-winter Winter-springNote: Green represents high-yielding season; purple corresponds to low-yielding season; and orange signifies third season. White indicates fallow period.
Fig. 2.2. Common rice-growing calendar in project sites, crop year 2013-2014.

13
To facilitate comparison for purposes of this study, dry, kuruvai, winter-spring, and late rice seasons were categorized as high-yielding season (HYS) because of the higher yield potential of rice brought by the greater solar radiation. In contrast, wet, thaladi, summer-autumn, and early rice seasons were grouped as low-yielding season (LYS) due to the generally lower yield obtained during this period. The autumn-winter season in Vietnam was regarded as third season (TS) since it was the only site with a third crop season.
Sampling procedure
The sample farmers were selected purposively. As much as possible, farmers who participated in the RTDP were traced and included as respondents in this current study. There were less than 30 respondents per site in the RTDP project. Its original participants were chosen to represent a range of farm sizes and economic status (Dobermann et al., 2004). Their farms represent the most common soil types in the area, and their farming practices the most typical in the region. The farmers’ interest in participating in the project over the longer term was also considered in the sample selection process in the former study.
For the current study, a quota sample of 100 respondents per province per season was set. Because some of the original RTDP participants could not be found anymore and because of the need to increase sample size, new respondents were selected by local collaborators based on the following criteria: 1) those living in the same villages, 2) those having at least 10 years of farming experience, 3) those with farms irrigated and planted in crop year 2013-2014, and 4) those willing to be interviewed.
Using the aforementioned criteria, we arrived at the sample distribution summarized in Table 2.2. Details of samples, by name of villages, are presented in the individual monographs published by each country under the project (Beltran et al., 2015; Bordey et al., 2015; Launio et al., 2015; Litonjua et al., 2015; Manalili et al., 2015; Mataia et al., 2015). Replacements were made in succeeding seasons following the same set of criteria because some respondents were not available during the interview period.
Table 2.2. Sample distribution, by survey site, crop year 2013-2014.
Site Samples (no.)
High-yielding season Low-yielding season Third seasonNueva Ecija, Philippines 101 100 -
Zhejiang, China 100 100 -
West Java, Indonesia 100 100 -
Tamil Nadu, India 102 101 -
SuphanBuri, Thailand 100 100 -
Can Tho, Vietnam 100 100 100
The BenchMark Data: Sources, Concepts, and Methods

14 Competitiveness of Philippine Rice in Asia
Data collection method
Farm surveys were conducted through personal interviews guided by structured electronic questionnaires in MS Access format. This improvement over the use of paper-based questionnaires has shortened the data-encoding process. To supplement information on government policies, key informants were also interviewed. Secondary time-series data on production, yield, and area harvested and other complementary information were obtained from the Food and Agriculture Organization (FAO), IRRI’s Rice Knowledge Bank, and Rice Almanac. These were used to describe trends in the rice industry and complement the primary data generated.
Data gathered
Basic demographic traits of farmers such as age, sex, household size, education, participation in rice-production training from 2008 to 2012, membership in farmers’ organization, land tenure, and ownership of capital were gathered during the interview. The household’s gross income from rice and non-rice sources was also asked to estimate the share of rice to total income of the household. Data on farm characteristics, including total area cultivated for rice, number of parcels, sources of irrigation water, and major transport structure in the village, were also collected.
Information on paddy production in the largest parcel was collected during the survey. Farmers were asked about the material inputs they used such as seed, fertilizer, insecticide, herbicide, fungicide, molluscicide, rodenticide, and fuel. Similarly, information on labor use in various farm activities was solicited. Labor sources (whether hired, provided by family labor, including the farmer himself, or part of exchange labor) were inquired about. Similarly, farmers were asked about machinery use. They were also questioned about prices of material inputs, labor wages and contract rates, machine rent per season, annual land rent, interest rates on borrowed capital, and selling price of paddy. Other costs of production such as cost of food, transport, and land tax were also determined.
Data on crop management practices were also elicited. Farmers were asked about their method of crop establishment, quality of seeds they used, and the timing and frequency of fertilizer and pesticide applications they made. Farmers were also requested to give their perceptions on government support. Details on how these data were collected are more clearly shown in the electronic questionnaire used in the survey.

15
Analytical methods
Yield conversion from fresh to dry weight
Yield was estimated by dividing the reported volume of paddy harvested from the largest parcel by the area planted to it. To facilitate yield comparisons across seasons and locations, fresh paddy yields were converted into their dry equivalent. To do this, we used information on general moisture content during harvest period in each location as indicated in the key informant interviews. Dry yield was computed as
(1)
where MCfresh is the moisture content of paddy during harvest period and MCdry is at 14% moisture level. The dry yield was used in calculating partial factor productivity, unit cost, gross revenue, and net returns from rice farming.
Seed quality
The quality of seed was categorized into three: (1) hybrid; (2) high-quality inbred; and (3) low-quality inbred. Hybrid or F1 seeds are those derived from exploiting hybrid vigor from male and female parents (Virmani and Sharma, 1993). High-quality inbred seeds are those that underwent formal seed certification from a national agency (e.g., registered or certified seeds). Low-quality inbred seeds are those obtained by farmers from their own harvest or exchanged with their co-farmers. Truthfully labelled seeds or those branded by seed producers but were not certified are also included in this category.
Converting fertilizer into elemental forms
Fertilizer use was reported by farmers as amounts of different fertilizer grades (composed of various elements in different proportions). To standardize the quantity applied and to allow comparison across farms, the amount from each grade of fertilizer was converted into quantities of its elemental forms: nitrogen (N), phosphorus (P), and potassium (K). The conversion into N is straightforward since one only needs to multiply the volume applied with N concentration. Since P and K occur in their oxide forms in various fertilizer grades (P2O5 and K2O), the concentrations of the oxide forms were further multiplied with factors of 0.4364 and 0.8302 to get the elemental P and K, respectively. The amounts of N, P, and K from various sources were then summed to get the total amount of each nutrient applied by every farmer.
The timing of fertilizer application is expressed in terms of days after transplanting (DAT) or days after seeding (DAS). Depending on the growth stage of the rice plant, fertilizer application was categorized into: 1) basal stage (before planting or 0 day); 2) early vegetative stage (1-15 days); 3) maximum tillering stage (16-45 days); 4) panicle
The BenchMark Data: Sources, Concepts, and Methods
16 Competitiveness of Philippine Rice in Asia
initiation stage (46-60 days); and 5) flowering and maturity stage (>60 days). We only considered fertilizer application on the main rice field and excluded application on seed nurseries. We calculated the number of applications for each growth stage and divided it by the number of farmers to create a measure of how frequently farmers applied fertilizer in each stage (this measure can exceed one).
Converting pesticides into active ingredients
Farmers also apply different types of pesticides that cannot be directly added because of differences in concentrations of the active ingredient (ai). To account for this, each pesticide was converted into the amount (in kg) of ai found in it. The amount of ai from various sources was then summed and categorized according to its use as insecticide, herbicide, fungicide, molluscicide, or rodenticide. The analysis of timing of pesticide application follows that of fertilizer application.
Labor
Data on labor use were collected separately for each farm activity, by gender of the laborer. Labor use of each farm for the whole cropping season was constructed per farm activity by multiplying the number of persons by the number of days they work in the farm, and the number of hours they work within each day. This was divided by 8 hours to construct a man-day (i.e., 1 md = 8 h work). The amount of md was categorized according to source: (1) hired through daily rate or contract rate and (2) labor provided by the farmer, his family members, and exchange workers, where one family works for free on a neighbor’s farm in exchange for the neighbor working an equivalent amount of time on the first family’s farm.
Several major farm activities were considered in the study: (1) land preparation; (2) crop establishment; (3) crop care and management; (4) harvesting and threshing; and (5) postharvest. Land preparation includes sub-activities such as plowing, harrowing, rototilling, side plowing, cleaning and repair of dikes, and construction of water ditches in the field. Crop establishment comprises direct seeding or transplanting, and other activities related to it such as seedbed preparation, raising, pulling, and hauling seedlings into the field. Crop care and maintenance constitute fertilizer and pesticide applications, irrigating and draining the field, and other pest management practices such as manual weeding. Harvesting and threshing, as the name implies, include labor required for cutting and gathering the rice stalks and separating the grains from the stalks. Postharvest activities include cleaning, winnowing, and hauling of paddy output from the farm to the first destination before selling. Because not all farmers dry their harvest, labor for drying was excluded from the analysis at the farm level.
Labor productivity
Labor productivity measures the amount of goods or services produced by one md of labor. It is an important indicator because it approximates the amount of income generated by a unit of labor, which is an important determinant of the standard of
17
living. As the productivity of labor increases, the amount of rural farm income per person also rises. Following the methods of Moya et al. (2004), it was computed by dividing total dry grain output by total md employed in rice production for the whole cropping season.
Data limitation
While the data in this study can provide a lot of quantitative and qualitative information as well as insights about the status of rice production in irrigated and intensively cultivated areas in selected Asian rice bowls, there are limitations that should be considered in the interpretation of results. First, the accuracy of the gathered information is subject to the farmers’ ability to recall their production practices and expenditures in the previous season. Second, the reliability of the information also highly depends on the capability of the translators to accurately translate the responses of farmers from the local dialect to English. Finally, the information gathered only represents a specific rice production ecosystem and results should not be construed to represent the entire country. Despite these limitations, the dataset generated by the project is the most recent source of comparable input-output data on farm-level rice production across selected countries in Asia and can be useful for planners, policymakers, and rice researchers in these areas.
References
Beltran JC, Relado RZ, San Valentin MRL, Tulay EV, Bordey FH, Moya PF, Truong TNC. 2015. Snapshot of Vietnam’s rice production systems in irrigated areas: the Mekong River Delta experience. Science City of Muñoz (Philippines): Philippine Rice Research Institute, and Los Baños (Philippines): International Rice Research Institute. 27 p.
Bordey FH, Marciano EB, Yusongco CG, Besenio JRH, Karunakaran KR, Moya PF. 2015. Revisiting intensive rice cultivation in irrigated areas: the case of Tamil Nadu, India. Science City of Muñoz (Philippines): Philippine Rice Research Institute and Los Baños (Philippines): International Rice Research Institute. 21 p.
Climate-data.org. 2016. Climate data for cities worldwide. http://en.climate-data.org. April 20, 2016.
Dobermann A, Simbahan GC, Moya PF, Adviento MAA, Tiongco M, Witt C, Dawe D. 2004. Methodology for socioeconomic and agronomic on-farm research. In Dobermann A, Witt C, Dawe D, eds. Increasing productivity of intensive rice systems through site-specific nutrient management. Enfield, N.H. (USA): Science Publishers, Inc., and Los Baños (Philippines): International Rice Research Institute (IRRI). p 11-28.
Launio CC, Redondo GO, Tabalno RF, Bordey FH, Moya PF. 2015. Is the Philippines’ leading rice-producing province faring good enough? The case of rice farming in Nueva Ecija. Science City of Muñoz (Philippines): Philippine Rice Research Institute and Los Baños (Philippines): International Rice Research Institute. 24 p.
Litonjua AC, Wardana P, Paran SJC, Valencia MSD, Macalintal FM, Bordey FH, Moya PF. 2015. Socioeconomic and technological profile of a semi-mechanized rice production system: the case of West Java, Indonesia. Science City of Muñoz, Nueva Ecija (Philippines): Philippine Rice Research Institute, and Los Baños (Philippines): International Rice Research Institute. 24 p.
The BenchMark Data: Sources, Concepts, and Methods

18 Competitiveness of Philippine Rice in Asia
Manalili RG, Marciano EB, Viray CA, Tanzo IR, Bordey FH, Moya PF. 2015. The Thailand rice economy under the government rice-pledging scheme: the case of SuphanBuri. Science City of Muñoz (Philippines): Philippine Rice Research Institute and Los Baños (Philippines): International Rice Research Institute. 26 p.
Mataia AB, Valencia MSD, Malasa RB, Milanes MBA, Bordey FH, Moya PF, Xianghai D, Xueping H. 2015. Rice production in the midst of economic development: the case of Jinhua, Zhejiang, China. Science City of Muñoz (Philippines): Philippine Rice Research Institute and Los Baños (Philippines): International Rice Research Institute. 25 p.
Moya PF, Dawe D, Pabale D, Tiongco M, Chien NV, Devarajan S, Djatiharti A, Lai NX, Niyomvit L, Ping HX, Redondo G, Wardana P. 2004. The economics of intensively irrigated rice in Asia. In: Dobermann A, Witt C, Dawe D, eds. Increasing productivity of intensive rice systems through site-specific nutrient management. Enfield, N.H. (USA): Science Publishers, Inc., and Los Baños (Philippines): International Rice Research Institute. p 29-58.
Virmani SS, Sharma HL. 1993. Manual for hybrid rice seed production. Manila (Philippines): International Rice Research Institute.

PROFILE OF AN ASIAN RICE FARMERFlordeliza H. Bordey, Jesusa C. Beltran, Aileen C. Litonjua, Cheryll C. Launio, Rowena G. Manalili, Alice B. Mataia, Ronell B. Malasa, Rhemilyn Z. Relado, Irene R. Tanzo, Suennie Jane C. Paran, and Charmaine G. Yusongco
Majority of the rice that urban people in Asia eat is produced primarily in irrigated areas where farmers produce large surpluses. Yet, little is known about these rice producers. In particular, farmers’ descriptions and their
capacity to produce are mostly footnotes buried in voluminous discussions on increasing production and productivity.
The relation between productivity and farmers’ characteristics and own resources is highlighted in Schultz’s (1964, 1975) “poor-but-efficient” hypothesis: that small farmers in a traditional agricultural setting are believed to be reasonably efficient in allocating resources. They depend largely on their own resources and have spent a long time refining their management skills to come up with the most efficient use of resources in their environment setting. However, farmers have a difficulty in adjusting their allocative decisions in a dynamic agriculture where technical and economic environments continuously change. Following this tradition is a method of measuring contribution to productivity of human capital side by side with technology and other nonconventional factors of production (Hayami and Ruttan, 1970; Kawagoe et al., 1985; Lau and Yotopoulos, 1989). More recent studies in Nigeria show the effect of socioeconomic factors on rice productivity (Akinbile, 2007; Ayoola et al., 2011).
The characteristics of rice farmers can affect their ability to manage their farm well. Age can signify richness of farming knowledge and experience, but it can also imply something that has to do with physical vigor in supervising field activities. Education and training can improve human capital and affect the management skills of farmers. Similarly, ownership of productive farm assets such as land, machinery, and capital can affect their decision about what type of production system to implement. A farm profile that, for example, describes size, availability of water, and proximity to market can also have implications on the production decisions of farmers.
This chapter compares and contrasts farmers and their farms to give a deeper context on why productivity could differ in various irrigated areas in Asia: Philippines (Nueva Ecija); China (Zhejiang); Indonesia (West Java); India (Tamil Nadu); Thailand (SuphanBuri); and Vietnam (Can Tho). Through this, we hope to provide a better perspective of farming conditions in these areas. Note that because the farm samples were not selected randomly across the country, most of the characteristics discussed in this chapter should not be considered as nationally representative. This is because
3
19
20 Competitiveness of Philippine Rice in Asia
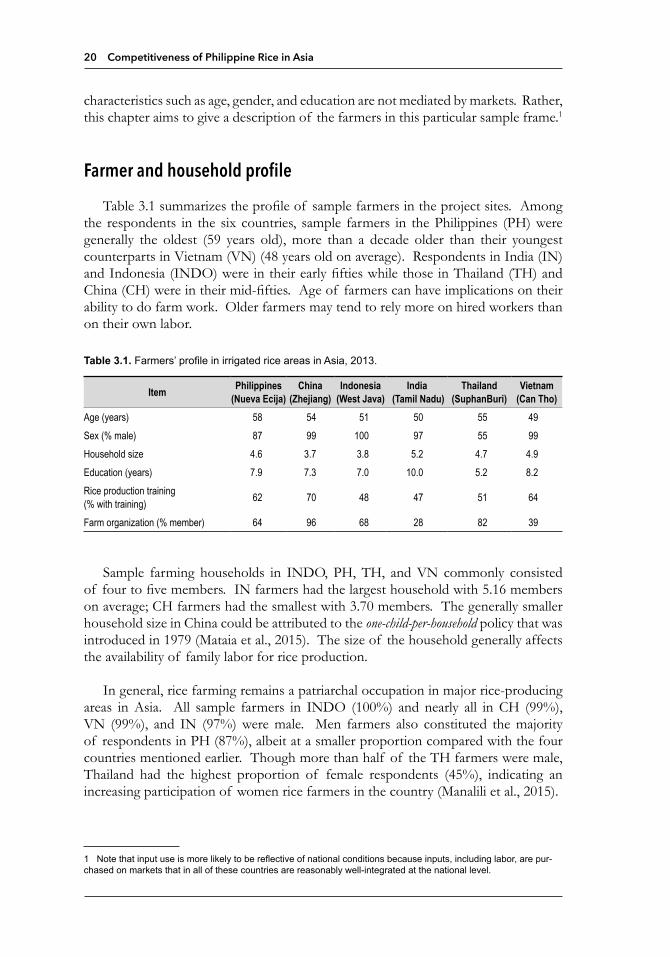
characteristics such as age, gender, and education are not mediated by markets. Rather, this chapter aims to give a description of the farmers in this particular sample frame.1
Farmer and household profile
Table 3.1 summarizes the profile of sample farmers in the project sites. Among the respondents in the six countries, sample farmers in the Philippines (PH) were generally the oldest (59 years old), more than a decade older than their youngest counterparts in Vietnam (VN) (48 years old on average). Respondents in India (IN) and Indonesia (INDO) were in their early fifties while those in Thailand (TH) and China (CH) were in their mid-fifties. Age of farmers can have implications on their ability to do farm work. Older farmers may tend to rely more on hired workers than on their own labor.
Table 3.1. Farmers’ profile in irrigated rice areas in Asia, 2013.
Item Philippines (Nueva Ecija)
China (Zhejiang)
Indonesia (West Java)
India (Tamil Nadu)
Thailand (SuphanBuri)
Vietnam (Can Tho)
Age (years) 58 54 51 50 55 49Sex (% male) 87 99 100 97 55 99Household size 4.6 3.7 3.8 5.2 4.7 4.9Education (years) 7.9 7.3 7.0 10.0 5.2 8.2Rice production training (% with training) 62 70 48 47 51 64
Farm organization (% member) 64 96 68 28 82 39
Sample farming households in INDO, PH, TH, and VN commonly consisted of four to five members. IN farmers had the largest household with 5.16 members on average; CH farmers had the smallest with 3.70 members. The generally smaller household size in China could be attributed to the one-child-per-household policy that was introduced in 1979 (Mataia et al., 2015). The size of the household generally affects the availability of family labor for rice production.
In general, rice farming remains a patriarchal occupation in major rice-producing areas in Asia. All sample farmers in INDO (100%) and nearly all in CH (99%), VN (99%), and IN (97%) were male. Men farmers also constituted the majority of respondents in PH (87%), albeit at a smaller proportion compared with the four countries mentioned earlier. Though more than half of the TH farmers were male, Thailand had the highest proportion of female respondents (45%), indicating an increasing participation of women rice farmers in the country (Manalili et al., 2015).
1 Note that input use is more likely to be reflective of national conditions because inputs, including labor, are pur-chased on markets that in all of these countries are reasonably well-integrated at the national level.
21
Education, training, and organization
Education and training
Farmers in India had the highest educational attainment, on average, with 10 years of formal schooling (Table 3.1). This means that IN farmers had completed elementary and lower secondary education. PH and VN farmers both had an average of 8 years, while those in CH and INDO had 7 years. This indicates that farmers here have not finished secondary education in general. TH farmers had the shortest formal schooling, only 5 years, which means that they were not able to complete elementary schooling.
A bigger proportion of CH farmers (70%), followed by PH farmers (62%), had attended rice production-related training from 2008 to 2012. In China, farmers obtained training from agricultural input companies, national extension agencies, township administrations, and research institutions. India had the least number of farmers who were trained in rice production, only 47%. The relatively higher educational attainment of IN farmers could partly explain their need for less training.
Membership in farm organizations
About 96% of sample farmers in CH were members of farm organizations, the highest in six countries. This could be attributed to the rapid development of cooperatives as encouraged by China’s innovative management of agricultural organizations (MOA, 2011). It was followed by TH with 82% of its sample farmers being members of organizations. Association-affiliated respondents (about two-thirds) also dominated in PH and INDO. About 38% of sample respondents in VN had joined organizations. IN had the least proportion of respondents (28%) who are connected to farmer groups. The greater presence of farmer organizations might indicate the ease in delivery of public services such as extension and credit.
Land tenure
Land ownership in CH and VN is different from that in other countries because farmland in these two countries is state-owned. Nevertheless, farmers were given the right to use the land and full control over all production decisions. Land rights were stipulated in the Rural Land Contract Law in China (Van Tongeren and Huang, 2004) and in the 1986 doimoi (a new model) policy in Vietnam (Hoanh et al., 2002). In contrast, owning land in PH, INDO, IN, and TH implies that farmers have control not only over production decisions but also on land sale. Nevertheless, other forms of tenure exist in these countries. PH has lease where land use was paid in terms of a fixed volume of paddy rice. INDO has share tenancy where payment is dictated by a sharing arrangement with the landlord. Some 3% of IN farmers rent temple lands. Land rental paid in cash is more prevalent in TH where 53% of farmers practice it.
Profile of an Asian Rice Farmer

22 Competitiveness of Philippine Rice in Asia
About 98-100% of sample farmers in CH during the high- and low-yielding seasons own the land they cultivate (Fig. 3.1). It was followed by IN where 93-95% of farmers were land owners. About 88% of INDO sample farmers were also farm owners. Meanwhile, 87-93% of farmers in VN also own their farm. About 61-64% of PH respondents were also owner-cultivators, while only about half of TH sample farmers were in the same category.
Fig. 3.1. Land ownership of farmers, by cropping season, 2013.
Ownership of farm machinery
Table 3.2 summarizes the types of machinery owned by farmers. The two-wheel tractor, a farm implement used for land preparation, was most common in TH where 90% of the farmers were owners. It was also relatively popular in PH and IN where 42% and 39% of the farmers own this equipment. The four-wheel tractor is also used for land preparation; it is bigger and requires more power. Owing to its size and the consequent larger acquisition cost, only a few farmers own it. In India, 19% of the farmers have their own four-wheel tractors.
Only 10% and 11% of farmers in PH and INDO own a power thresher, a machine used to separate grains from the stalks. The thresher is commonly used only in these two areas (Launio et al., 2015; Litonjua et al., 2015). This is not surprising because of the popularity of combine harvesters among farmers in CH, IN, TH, and VN (see chapter on Labor and mechanization). In spite of this machine’s popular use, it is only in CH where some 7% of farmers own it. This shows that owning a combine harvester is not a prerequisite for use in these areas.

23
Table 3.2. Types of machinery owned by farmers in six Asian countries, 2013.
MachinePhilippines
(Nueva Ecija)China
(Zhejiang)Indonesia
(West Java)India
(Tamil Nadu)Thailand
(Suphan Buri)Vietnam
(Can Tho)
Two-wheel tractor 42 14 17 39 90 1
Four-wheel tractor 0 5 1 19 7 3
Thresher 10 1 11 0 0 0
Combine harvester 0 7 0 0 0 0Water pump 12 8 33 19 69 89
The water pump is another important farm equipment particularly among farmers in VN. About 87% of Vietnamese farmers own a water pump, which is used more for draining the field instead of irrigating it. Draining the field is important particularly after the October flooding, which coincides with the start of the winter-spring season in VN. On the other hand, only 8% of farmers in CH own a water pump. The lesser reliance of CH farmers on it could stem from the fact that large irrigation canals exist in the area.
Income profile
Figure 3.2 shows the share of rice to total household income. The small contribution of rice to total household income of farmers in CH (27%) indicates that Chinese households have diverse income sources. As Mataia et al. (2015) discussed, most of the farmers have off-farm employment during the off-season where they obtain higher income. This reflects the rapid economic development and the fast-rising income in China in the last decade, as well as the ‘forced’ reliance on other sources of income because of the very small farm sizes.
Fig. 3.2. Share of rice to total household income in six Asian countries, 2013.
Profile of an Asian Rice Farmer
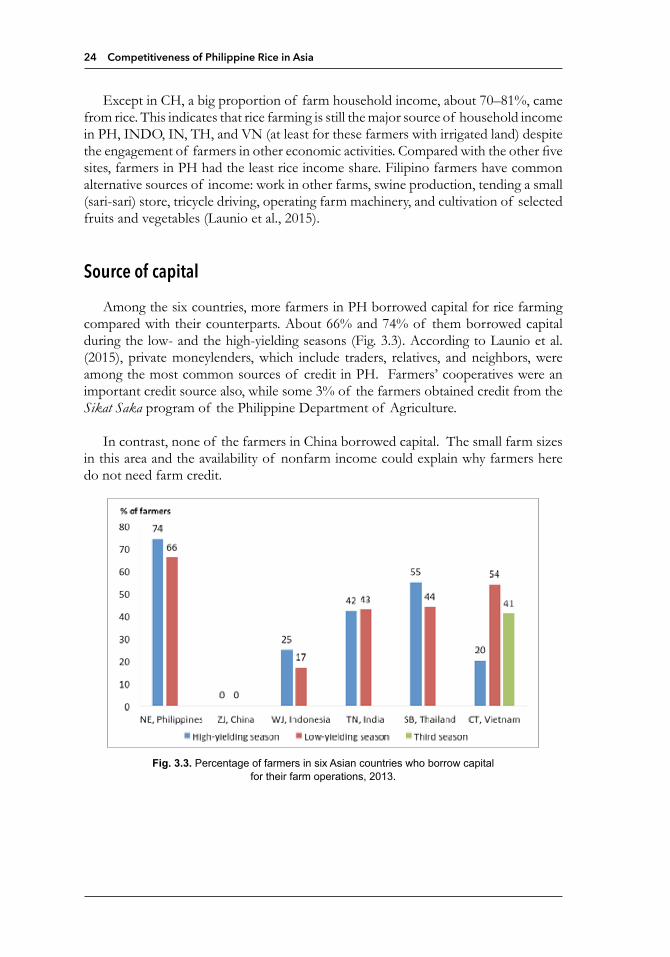
24 Competitiveness of Philippine Rice in Asia
Except in CH, a big proportion of farm household income, about 70–81%, came from rice. This indicates that rice farming is still the major source of household income in PH, INDO, IN, TH, and VN (at least for these farmers with irrigated land) despite the engagement of farmers in other economic activities. Compared with the other five sites, farmers in PH had the least rice income share. Filipino farmers have common alternative sources of income: work in other farms, swine production, tending a small (sari-sari) store, tricycle driving, operating farm machinery, and cultivation of selected fruits and vegetables (Launio et al., 2015).
Source of capital
Among the six countries, more farmers in PH borrowed capital for rice farming compared with their counterparts. About 66% and 74% of them borrowed capital during the low- and the high-yielding seasons (Fig. 3.3). According to Launio et al. (2015), private moneylenders, which include traders, relatives, and neighbors, were among the most common sources of credit in PH. Farmers’ cooperatives were an important credit source also, while some 3% of the farmers obtained credit from the Sikat Saka program of the Philippine Department of Agriculture.
In contrast, none of the farmers in China borrowed capital. The small farm sizes in this area and the availability of nonfarm income could explain why farmers here do not need farm credit.
Fig. 3.3. Percentage of farmers in six Asian countries who borrow capital for their farm operations, 2013.

25
Farm characteristics
Farm size
Chinese farmers typically cultivated two to three parcels of land, while those in IN worked on only one parcel (Table 3.3). TH farmers had the biggest rice area at 4.4–4.5 ha season-1, followed by IN farmers who had 3.1–3.3 ha. On the other hand, CH respondents cultivated the smallest area (only 0.4–0.6 ha). The smaller farm size in CH could be attributed to increasing competition in land use between agricultural, industrial, and residential purposes, which became prevalent because of the fast economic development in China. Key informants also mentioned farmers’ area planted to rice getting smaller as they grow fruit trees, vegetables, and ornamental plants used for landscaping in urban areas.
Accessibility to market
Farms in PH and TH are about 5–6 km away from the nearest market center, where inputs can be sourced from and outlets can be located. In contrast, farms in VN and CH are only 2–3 km away. Majority of farm-to-market roads in CH and PH are concrete, whereas those in IN, TH, and VN are a combination of asphalt and concrete. In contrast, while some farm-to-market roads are asphalted in INDO, many are still laid with sand and gravel. This implies that rural transportation in INDO could be more difficult than in the others. In Vietnam, rivers are also used to convey harvested paddy to market (Beltran et al., 2015).
Source of irrigation water
All project sites are well irrigated but their primary sources of water differed. In CH, all farmers obtained irrigation water from state canals. Similarly, majority of sample farmers in INDO, PH, and TH also sourced water from government-built irrigation canals. In VN, about 36–55% got water from communal irrigation canals and some 14–17% availed of water from state canals. Almost half of them also obtained water from rivers, streams, and other free-flowing sources during the winter-spring and summer-autumn seasons.
In contrast, a greater majority of IN farmers obtained water from underground using bore wells. In all sites, except in PH, farmers’ use of irrigation water from state canals is free of charge. In addition, electricity used for agricultural purposes such as for pumping out groundwater is subsidized in India (Bordey et al., 2015).
Profile of an Asian Rice Farmer
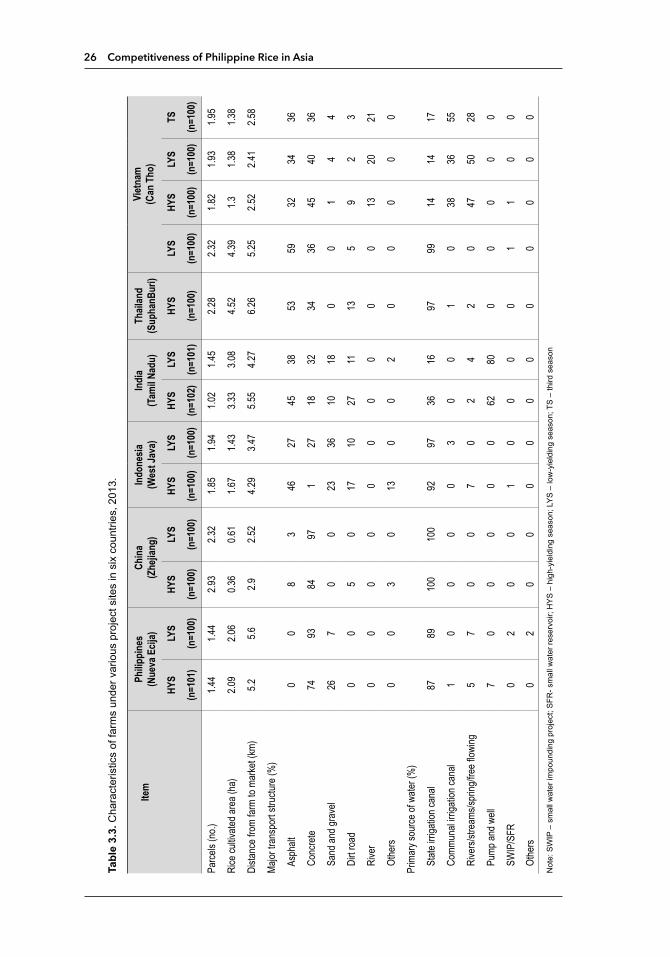
26 Competitiveness of Philippine Rice in Asia
Tabl
e 3.
3. C
hara
cter
istic
s of
farm
s un
der v
ario
us p
roje
ct s
ites
in s
ix c
ount
ries,
201
3.
Item
Philip
pine
s (N
ueva
Ecij
a)Ch
ina
(Zhe
jiang
)In
done
sia
(Wes
t Jav
a)In
dia
(Tam
il Nad
u)Th
ailan
d (S
upha
nBur
i)Vi
etna
m
(Can
Tho
)
HY
SLY
SHY
SLY
SHY
SLY
SHY
SLY
SHY
SLY
SHY
SLY
STS
(n
=101
)(n
=100
)(n
=100
)(n
=100
)(n
=100
)(n
=100
)(n
=102
)(n
=101
)(n
=100
)(n
=100
)(n
=100
)(n
=100
)(n
=100
)
Parce
ls (n
o.)1.4
41.4
42.9
32.3
21.8
51.9
41.0
21.4
52.2
82.3
21.8
21.9
31.9
5
Rice
cultiv
ated a
rea (
ha)
2.09
2.06
0.36
0.61
1.67
1.43
3.33
3.08
4.52
4.39
1.31.3
81.3
8
Dista
nce f
rom
farm
to ma
rket (
km)
5.25.6
2.92.5
24.2
93.4
75.5
54.2
76.2
65.2
52.5
22.4
12.5
8
Major
tran
spor
t stru
cture
(%)
Asp
halt
00
83
4627
4538
5359
3234
36
Con
crete
7493
8497
127
1832
3436
4540
36
San
d and
grav
el26
70
023
3610
180
01
44
Dirt
road
00
50
1710
2711
135
92
3
Rive
r0
00
00
00
00
013
2021
Othe
rs0
03
013
00
20
00
00
Prim
ary s
ource
of w
ater (
%)
Stat
e irri
gatio
n can
al87
8910
010
092
9736
1697
9914
1417
Com
muna
l irrig
ation
cana
l1
00
00
30
01
038
3655
Rive
rs/str
eams
/sprin
g/fre
e flow
ing5
70
07
02
42
047
5028
Pum
p and
well
70
00
00
6280
00
00
0
SW
IP/S
FR0
20
01
00
00
11
00
Othe
rs0
20
00
00
00
00
00
Not
e: S
WIP
– s
mal
l wat
er im
poun
ding
pro
ject
; SFR
- sm
all w
ater
rese
rvoi
r; H
YS
– h
igh-
yiel
ding
sea
son;
LY
S –
low
-yie
ldin
g se
ason
; TS
– th
ird s
easo
n

27
Summary and implications
Irrigated rice farmers in PH were generally the oldest among those in the different sites. Coupled with having medium-sized farms (about 2 ha) and an average household size of five, the age factor could affect the Filipino farmer’s choice of hiring farm workers and his ability to supervise them effectively. PH farmers are not far behind their neighbors in terms of education and training, but this can still be improved. Although more than 60% own the land that they cultivate, still less than half of them own farm machinery. However, PH farmers can learn from their counterparts in other countries who rely more on active rental market for machinery rather than on ownership to ensure wide use.
By far, PH farmers have the largest percentage of capital borrowings. With informal moneylenders being the main credit source, it can be surmised that the interest cost of borrowing is high. This can affect their choice of rice technology and material inputs.
Finally, while PH farmers have good access to irrigation water like their Asian neighbors, they are the only ones who pay for irrigation services of the government. Regardless of magnitude of irrigation cost, this is a disadvantage that PH farmers face compared with their Asian counterparts.
References
Akinbile LA. 2007. Determinants of productivity level among rice farmers in Ogun State Nigeria. African Crop Science Conference Proceedings8: 1339-1344.
Ayoola JB, Dangbegnon C, Daudu CK, Mando A, Kudi TM, Amapu IY, Adeosun JO, Ezui KS. 2011. Socio-economic factors influencing rice production among male and female farmers in Northern Guinea Savanna Nigeria: lessons for promoting gender equity in action research. Agriculture and Biology Journal of North America 2(6): 1010-1014.
Beltran JC, Relado RZ, San Valentin MRL, Tulay EV, Bordey FH, Moya PF, Truong TNC. 2015. Snapshot of Vietnam’s rice production systems in irrigated Areas: the Mekong River Delta experience. Science City of Muñoz (Philippines): Philippine Rice Research Institute, and Los Baños (Philippines): International Rice Research Institute. 27 p.
Bordey FH, Marciano EB, Yusongco CG, Besenio JRH, Karunakaran KR, Moya PF. 2015. Revisiting intensive rice cultivation in irrigated areas: the case of Tamil Nadu, India. Science City of Muñoz (Philippines): Philippine Rice Research Institute and Los Baños (Philippines): International Rice Research Institute. 21 p.
Hayami Y, Ruttan VW. 1970. Factor prices and technical change in agricultural development: the United States and Japan, 1880-1960. Journal of Political Economy 78: 1115-1141.
Hoanh, CT, Dieu PQ, Que NN, Kam SP, Bolink PM, de Vries S, Son DK, Rala A, Villano L. 2002. Rice supply and demand scenarios in Vietnam. In: Sombilla M, Hossain M, Hardy B, eds. Developments in the Asian rice economy. Los Baños (Philippines): International Rice Research Institute. p 173-210.
Tabl
e 3.
3. C
hara
cter
istic
s of
farm
s un
der v
ario
us p
roje
ct s
ites
in s
ix c
ount
ries,
201
3.
Item
Philip
pine
s (N
ueva
Ecij
a)Ch
ina
(Zhe
jiang
)In
done
sia
(Wes
t Jav
a)In
dia
(Tam
il Nad
u)Th
ailan
d (S
upha
nBur
i)Vi
etna
m
(Can
Tho
)
HY
SLY
SHY
SLY
SHY
SLY
SHY
SLY
SHY
SLY
SHY
SLY
STS
(n
=101
)(n
=100
)(n
=100
)(n
=100
)(n
=100
)(n
=100
)(n
=102
)(n
=101
)(n
=100
)(n
=100
)(n
=100
)(n
=100
)(n
=100
)
Parce
ls (n
o.)1.4
41.4
42.9
32.3
21.8
51.9
41.0
21.4
52.2
82.3
21.8
21.9
31.9
5
Rice
cultiv
ated a
rea (
ha)
2.09
2.06
0.36
0.61
1.67
1.43
3.33
3.08
4.52
4.39
1.31.3
81.3
8
Dista
nce f
rom
farm
to ma
rket (
km)
5.25.6
2.92.5
24.2
93.4
75.5
54.2
76.2
65.2
52.5
22.4
12.5
8
Major
tran
spor
t stru
cture
(%)
Asp
halt
00
83
4627
4538
5359
3234
36
Con
crete
7493
8497
127
1832
3436
4540
36
San
d and
grav
el26
70
023
3610
180
01
44
Dirt
road
00
50
1710
2711
135
92
3
Rive
r0
00
00
00
00
013
2021
Othe
rs0
03
013
00
20
00
00
Prim
ary s
ource
of w
ater (
%)
Stat
e irri
gatio
n can
al87
8910
010
092
9736
1697
9914
1417
Com
muna
l irrig
ation
cana
l1
00
00
30
01
038
3655
Rive
rs/str
eams
/sprin
g/fre
e flow
ing5
70
07
02
42
047
5028
Pum
p and
well
70
00
00
6280
00
00
0
SW
IP/S
FR0
20
01
00
00
11
00
Othe
rs0
20
00
00
00
00
00
Not
e: S
WIP
– s
mal
l wat
er im
poun
ding
pro
ject
; SFR
- sm
all w
ater
rese
rvoi
r; H
YS
– h
igh-
yiel
ding
sea
son;
LY
S –
low
-yie
ldin
g se
ason
; TS
– th
ird s
easo
n
Profile of an Asian Rice Farmer

28 Competitiveness of Philippine Rice in Asia
Kawagoe T, Hayami Y, Ruttan VW. 1985. The intercountry agricultural production function and productivity differences among countries. Journal of Development Economics 19: 113-132.
Lau LJ, Yotopoulos PA. 1989. The meta-production function approach to technological change in world agriculture. Journal of Development Economics 31: 241-269.
Launio CC, Redondo GO, Tabalno RF, Bordey FH, Moya PF. 2015. Is the Philippines’ leading rice-producing province faring good enough? The case of rice farming in Nueva Ecija. Science City of Muñoz (Philippines): Philippine Rice Research Institute and Los Baños (Philippines): International Rice Research Institute. 24 p.
Litonjua AC, Wardana P, Paran SJC, Valencia MSD, Macalintal FM, Bordey FH, Moya PF. 2015. Socioeconomic and technological profile of a semi-mechanized rice production system: The case of West Java, Indonesia. Science City of Muñoz, Nueva Ecija (Philippines): Philippine Rice Research Institute, and Los Baños (Philippines): International Rice Research Institute. 24 p.
Manalili RG, Marciano EB, Viray CA, Tanzo IR, Bordey FH, Moya PF. 2015. The Thailand rice economy under the government rice-pledging scheme: the case of SuphanBuri. Science City of Muñoz (Philippines): Philippine Rice Research Institute and Los Baños (Philippines): International Rice Research Institute. 26 p.
Mataia AB, Valencia MSD, Malasa RB, Milanes MBA, Bordey FH, Moya PF, Xianghai D, Xueping H. 2015. Rice production in the midst of economic ddevelopment: the case of Jinhua, Zhejiang, China. Science City of Muñoz (Philippines): Philippine Rice Research Institute and Los Baños (Philippines): International Rice Research Institute. 25 p.
MOA – Ministry of Agriculture. 2011. Specialized farmer cooperatives. http://www.moa.gov.cn/sjzz/jgs/jggz/ zyhzszd/. January 8, 2015.
Schulz, TW. 1964. Transforming traditional agriculture. Chicago: University of Chicago Press.
Schultz, TW. 1975. The value of the ability to deal with disequilibria. Journal of Economic Literature 13: 827-846.
Van Tongeren FW, Huang J (eds.). 2004. China’s food economy in the early 21st century: development of China’s food economy and its impact on global trade and on the EU .The Hague: Agricultural Economics Research Institute.

29


VARIETIES, SEEDS, AND CROP ESTABLISHMENTAileen C. Litonjua, Piedad F. Moya, Jesusa C. Beltran, Flordeliza H. Bordey, Cheryll C. Launio, Rowena G. Manalili, and Alice B. Mataia
Key messages:• A majority of farmers in all countries plant tagged seed, with the exception of
Vietnam.
• Crop establishment for inbred varieties is by direct seeding in China, Thailand and Vietnam, while the more labor-intensive transplanting is used in the Philippines, Indonesia and India (and for hybrid rice in China).
• Farmers in the Philippines tend to plant a larger number of varieties than their counterparts in other countries. This has advantages (potentially greater adaptability to a wider range of environmental conditions) and disadvantages (more difficult processing for millers).
Choosing the variety to plant is the first step in rice production followed by deciding on seed class, and its method of crop establishment. These are important considerations in rice farming because they influence the maximum
attainable production level. Hence, farmers’ decision on these factors is crucial to improving rice productivity.
Varieties differ in terms of yield, milling recovery, and eating quality, among other traits. Farmers select a rice variety and its seed class based on their most preferred attributes such as high-yielding, high milling recovery, and good eating quality.
Seeds are also classified either as high-quality (i.e., tagged seeds) or low-quality seeds (i.e., farmer-saved seeds). Higher seed class has a yield advantage of 5-20% over farmer-saved seeds (Mataia et al., 2011; Bordey and Nelson, 2012). This advantage is largely attributed to lower weed and pest pressures. Seeds saved from the previous harvest produce weak seedlings and carry more weeds and off-types, rendering the rice crop susceptible to pests and diseases (IRRI, 2016a).
This chapter compares the farmers’ rice varietal and seed use, and crop establishment practices in intensively cultivated irrigated areas in Asia. Information in this chapter can give insights on the implications of variety and seed quality, and crop establishment methods on rice productivity, cost, and labor requirements. This can be a useful reference for those who are interested to learn seed-related practices in selected countries that can be adopted locally to further raise yield and income.
4
31

32 Competitiveness of Philippine Rice in Asia
Varietal use
The use of inbred rice varieties (self-pollinated rice) still dominates across countries and seasons, except in China, during the high-yielding season (HYS) when 100% of the farmers used hybrid rice varieties (F1 seed derived from a cross between the male and female parents). Planting of hybrid rice varieties was observed only in sample sites in China and the Philippines. All sample farmers in India, Indonesia, Thailand, and Vietnam used inbred varieties. Chinese farmers also planted inbred varieties during the low-yielding season (LYS) to maximize cropping intensity1.
A wide range of varieties was used at each site, although more varieties were used at some sites than in others (Table 4.1). Specifically, Filipino farmers as a group used the most number of varieties in both seasons (24 during HYS and 20 during LYS); followed by Indonesia with 16 varieties for both seasons. Thai farmers (again as a group) reported 13 and 17 varieties planted for LYS and HYS, respectively. Note that there are some varieties that are planted in both seasons. This practice of planting different varieties means that farmers have access to many varieties, giving them wider options. However, in spite of this wide range of varieties, most farmers in all sites did not plant different varieties in one parcel in the same season (Table 4.2).
Table 4.1. Number of varieties used in selected Asian countries, by season, crop year 2013-2014.
Country High-yielding season
Low-yielding season All seasons*
Philippines 20 24 35China 2 5 7Indonesia 16 16 23India 8 10 12Thailand 17 13 21Vietnam 6 5 10*Unique varieties, some varieties are planted in both seasons.
Table 4.2. Average number of varieties planted by farmers in the main parcel per season, in selected Asian countries, crop year 2013-2014.
Country High-yielding season
Low-yielding season Third season
Philippines 1.04 1.02China 1.00 1.00Indonesia 1.00 1.01India 1.02 1.06Thailand 1.01 1.06Vietnam 1.00 1.00 1.00
1 Having a subtropical environment (four seasons), Zhejiang, China has a shorter period for growing rice relative to other sites with tropical climate. Hence, inbred rice varieties are planted in the low-yield-ing season because these are early-maturing. On the other hand, hybrid varieties grown during the high-yielding season are late-maturing but are more tolerant of cold temperature.

33
The least number of varieties planted was reported in China with 5 and 2 varieties grown in HYS and LYS, respectively. No same variety was planted during both seasons. Vietnam and India closely followed China, with a total of 10 and 12 varieties planted in both seasons. To minimize mixtures, fewer varieties were used to maintain the same quality and volume for export purposes (Beltran et al., 2015; Mataia et al., 2015). On the other hand, limiting the varieties planted could increase “biotic and abiotic stresses” such as pests and diseases, drought, and salinity (GRiSP, 2013).
It is apparent in the distribution and number of varieties used by farmers across the sites that a great majority of farmers in China, Vietnam, and India planted only two or three varieties in one season. In contrast, farmers in the Philippines, Indonesia, and Thailand planted various varieties. There are advantages and disadvantages for using few or many varieties. Planting a few varieties is important for exporting countries to maintain consistency of quality. For countries with higher pest incidence and other production risks, planting a big number of varieties with wider adaptability to various growing conditions is essential. Hence, government efforts to promote few or more varieties should consider local conditions.
Table 4.3 shows the top three common varieties planted by farmers, by country and season. In the Philippines, SL-8H (19%), a hybrid variety that has resistance to blast and intermediate resistance to bacterial leaf blight, was one of the top three varieties planted by farmers in the HYS (Launio et al., 2015). The other two top varieties planted in this season were NSIC Rc222 (34%) and NSIC Rc216 (10%), which are both inbred. In the LYS, the top three varieties grown were NSIC Rc222 (41%), NSIC Rc216 (15%), and Diamond X (8%). Launio et al. (2015) reported that NSIC Rc222 was also the top choice of farmers in 2012 based on PhilRice’s national survey of rice-based farm households. This variety can yield as much as 10 t ha-1. Additionally, it is a medium to early-maturing variety and is moderately resistant to brown planthoppers and green leafhoppers (PhilRice, 2016). Overall, the top two varieties were planted by 53% and 56% of farmers in HYS and LYS, respectively (Table 4.4).
Varieties, Seeds, and Crop Establishment

34 Competitiveness of Philippine Rice in Asia
Table 4.3. Top varieties planted by farmer-respondents, by study area and season, crop year 2013-2014.
High-yielding season Low-yielding season Third season All seasonsNueva Ecija, PhilippinesNSIC Rc222 (34%) NSIC Rc222 (41%) - NSIC Rc222 (37%)*SL-8H (19%) NSIC Rc216 (15%) - NSIC Rc216 (12%)NSIC Rc216 (10%) Diamond X (8%) - *SL-8H (10%)
Zhejiang, China*Yongyou 9 (99%) Jinzao 47 (49%) - *Yongyou 9 (50%)*Yongyou 15 (1%) Jinzao 09 (46%) - Jinzao 47 (25%)
Jinhao 09 (3%) - Jinzao 09 (23%)
West Java, IndonesiaCiherang (49%) Ciherang (41%) - Ciherang (45%)IR-42 (24%) IR-42 (31%) - IR-42 (28%)Gebrug (4%) Sidenok (9%) - Sidenok (7%)
Tamil Nadu, IndiaADT 43 (78%) CR 1009 (41%) - ADT 43 (44%)ADT 45 (9%) BPT 5204 (24%) - CR 1009 (21%)TKM 9 (7%) ADT 43 (10%) - BPT 5204 (12%)
SuphanBuri, ThailandRD 47 (28%) RD 47 (30%) - RD 47 (58%)Phitsanulok 2 (22%) RD 41 (21%) - Phitsanulok 2 (36%)RD 41 (12%) Phitsanulok 2 (14%) - RD 41 (33%)
Can Tho, VietnamIR50404 (70%) IR50404 (73%) IR50404 (74%) IR50404 (72%)Jasmine 85 (23%) OM4218 (22%) OM4218 (20%) OM4218 (15%)OM4218 (4%) OM10424 (3%) OM10424 (2%) Jasmine 85 (8%) *Hybrid varieties
In China, Yongyou 9 was the most popular hybrid variety as it was grown by 99% of the respondents. In LYS, all farmers used inbred rice varieties, specifically Jinzao 47, Jinzao 09, and Jinhao 09. Yongyou varieties were planted by all farmers during HYS, whereas Jinzao varieties were used by 95% of the farmers in LYS (Table 4.4).
Vietnamese farmers prefer early-maturing varieties in order to have three cropping periods (Beltran et al., 2015). Majority of the respondents in all seasons planted IR50404. This was followed by OM4218 and OM10424 in the LYS and the extra season; Jasmine 85 and OM4218 were cultivated in the HYS (Table 4.3). IR50404 is an IRRI-bred high-yielding variety that has high head rice recovery (Beltran et al., 2015). However, the local news reported that the government has discouraged the planting of IR50404. Because of its low quality (i.e., short grain), it is difficult to sell in the local market (Viet Nam News, 2012a, b). About 93–95% of the farmers planted the top two varieties identified in these sites in all cropping seasons (Table 4.4).

35
Table 4.4. Percent distribution of farmers who planted the top two varieties, by season and by country, crop year 2013-2014.
Country High-yielding season
Low-yielding season Third season
Philippines 53 56China 100 95Indonesia 73 72India 87 65Thailand 50 51Vietnam 93 95 94
All farmer-respondents from India planted inbred varieties, specifically ADT 43 in the HYS and CR 1009 in the LYS. In both seasons, ADT 43, CR 1009, and BPT 5204 were the most commonly planted inbred varieties in the study area. ADT 43 is a short-duration variety that is resistant to green leafhoppers, has high tillering ability, and produces medium slender fine rice (TNAU, 2016). CR 1009 is a long-duration, high-yielding variety that is resistant to brown planthoppers (Bordey et al., 2015). BPT 5204 is also a long-duration variety (150 days) that is resistant to blast, suitable for rainfed shallow lowland areas, and commands a high market price (TNAU, 2016; Bordey et al., 2015). The two common varieties were respectively used by 65% and 87% of farmers during LYS and HYS (Table 4.4).
In Indonesia, Ciherang and IR42 were the most popular varieties planted by 72–73% of farmers in both seasons. These two were followed by Gebrug in the HYS and Sidenok in the LYS. Ciherang is a medium to late-maturing variety that is resistant to brown planthopper biotypes 2 and 3 and bacterial leaf blight strains III and IV2. IR42 is a late-maturing variety but is high-yielding, even with moderate fertilizer application (Ponnamperuma, 1979). It also has moderate tolerance for adverse environmental conditions such as salinity and is resistant to tungro virus.
Lastly, Table 4.3 shows that majority of Thai farmers planted RD 47, RD 41, and Phitsanulok2 in both seasons. RD 47 is a non-photoperiod-sensitive variety. RD 41 has high resistance to brown planthoppers and Phitsanulok 2 is resistant to some pests and diseases (Manalili et al., 2015). The top two RD varieties were planted by 40% and 51% of the respondents during HYS and LYS, respectively.
The foregoing shows that farmers’ choice of variety does not depend only on yield, although this is a prime consideration. Farmers also consider other factors such as length of maturity, resistance to pest and diseases, and adaptability to environmental conditions. For exporting countries such as Vietnam, head rice recovery is also important. Hence, these qualities must be also incorporated in breeding objectives, depending on location.
2 Based on a key informant interview.
Varieties, Seeds, and Crop Establishment

36 Competitiveness of Philippine Rice in Asia
Seed class and yield
In general, there are three classes of seeds planted by farmers across all sites and seasons: 1) hybrid seed; 2) tagged inbred seed; and 3) farmer’s seed (see chapter on The benchmark data: sources, concepts, and methods). Hybrid seeds are the first filial (F1) generation of a cross of two rice varieties that are genetically different (Virmani and Sharma, 1993). These take advantage of heterosis, resulting in extra high yield. However, this can be exploited only in one season, hence hybrid rice is recommended to be planted once and it is necessary to buy new seeds every season to avoid a substantial loss in yield. Tagged inbred seeds (e.g., registered and certified seeds) are those that undergo a process of testing for purity and germination. These seeds are considered to be of high quality, indicating less mixture rate, with high germination rate, higher resistance to pests and diseases, and better yield than farmer’s inbred seeds (IRRI, 2016a). Lastly, farmer’s seeds are inbred seeds grown and kept by the farmers themselves for planting in the next cropping season. These seeds are usually grown together with the rice crop for consumption or for sale. It did not pass any certification or tests for germination or purity. Among seed classes, hybrid rice is the most expensive because of its yield advantage relative to tagged seeds and farmer’s seeds.
As discussed earlier, only farmers in China and the Philippines planted hybrid seed. The area planted to hybrid rice rapidly expanded in China because of the influence of its “centrally planned governing system,” suitable farm environment and farmers’ practices, and a quota system that obliged farmers to sell a certain volume of their harvest to government at a predetermined price, regardless of grain quality until the late 1980s (Pandey and Bhandari, 2009). All Chinese sample farmers planted hybrid rice during HYS and inbred varieties during LYS (Table 4.5). Hybrids perform well in HYS because of the more favorable climatic conditions. Moreover, hybrids are suitable for growing in the HYS because these are late-maturing varieties (Mataia et al., 2015).
Table 4.5. Percent distribution of farmers, by seed class, season, and country, crop year 2013-2014.
High-yielding season Low-yielding season
CountryTagged inbred
seedFarmer’s
seedHybrid seed
Tagged inbred seed
Farmer’s seed
Hybrid seed
Philippines 63 10 27 83 11 6China 0 0 100 63 37 0Indonesia 60 40 0 54 46 0India 96 3 1 91 9 0Thailand 80 20 0 90 10 0Vietnam 45 55 0 31 69 0Vietnam* 24 76 0*Third season.

37
Meanwhile, hybrid rice technology was introduced in the Philippines in 1994 (IRRI, 2006), and it was intensively promoted and supported through the Hybrid Rice Commercialization Program in 1998-2010 (Cidro and Radhakrishna, 2005). Hybrid rice became popular among Filipino farmers because of its high yield potential. More farmers planted hybrid rice during HYS than during LYS. This is primarily because climate in the HYS is more favorable. Production risk is high during LYS because of the frequent occurrence of typhoons and the higher amount of rainfall, leading to greater incidence of pests and diseases.
Except in Vietnam, a majority of farmers in all study areas used high-quality tagged inbred seeds in both seasons. Moreover, users of tagged inbred seeds were higher in the HYS than in the LYS. This is to take advantage of the favorable climatic conditions in the HYS. The number of tagged inbred seed users was highest in India and lowest in Vietnam.
Figure 4.1 shows the average yield across both seasons combined, by seed class and country. Results indicate that, in China and the Philippines, yield of hybrid rice is higher than that of inbred rice. Results also indicate that yield of tagged inbred seed was slightly higher than farmer’s seed in these two countries, including Vietnam. However, the reverse was true in India, Indonesia, and Thailand where yield of farmer’s seed was slightly higher than that of tagged inbred seed. This suggests the importance of factors (other than seed class) that affect yield.
Fig. 4.1. Average yield across both seasons combined, by country and seed class.
Varieties, Seeds, and Crop Establishment

38 Competitiveness of Philippine Rice in Asia
Method of crop establishment and seeding rate
Rice crops are generally established using one of two alternative methods: transplanting or direct seeding (De Datta, 1981; Bautista and Javier, 2005). Transplanting involves replanting of rice seedlings grown in nurseries to puddled soil by either machine or hand, while direct seeding consists of sowing the pregerminated and ungerminated seeds on wet or dry puddled soil, respectively (Pandey and Velasco, 2002).
Transplanting was popular in a majority of the study areas (Table 4.6). Almost all farmers in the Philippines and India transplanted rice in both seasons, while complete adoption was observed in Indonesia. In China, transplanting was used in the HYS only, when farmers planted hybrid rice. In the LYS, all Chinese farmers planted inbred varieties and opted to use direct seeding because it is less laborious (Moya et al., 2004) and thus saves on labor cost.
Direct seeding was widely adopted in Vietnam and Thailand in all seasons and in China in the LYS (Table 4.6). As reported by Beltran et al. (2015), farmers in Vietnam adopted direct seeding so that they could plant three rice crops a year. Direct seeding promotes shorter production period as farmers do not need to grow seedlings for 15-30 days; it avoids transplanting shock. In the Philippines, 21% of farmers in the HYS were able to direct seed their crop because there is less rainfall. Establishment of germinated seeds in the soil is difficult when rainfall is heavy (IRRI, 2016b).
The method of crop establishment considerably affects seeding rate. On average, the amount of seed used was higher in direct seeding than in transplanted rice (Table 4.6). Among countries where direct seeding is the prevalent method of establishing rice, Vietnam had the highest seeding rate, more than 200 kg ha-1. It is followed by Thailand at an average of 197 kg ha-1; China during LYS had the lowest at 110 kg ha-1. For transplanted rice, Philippines and India had used almost the same amount (less than 85 kg ha-1) while Indonesia had used less than 25 kg ha-1. China during HYS had the lowest seeding rate of just 14 kg ha-1. Locational differences in seeding rates under each method of crop establishment could be attributed to varietal use—for example, the low seeding rate for expensive hybrid seeds in China in the HYS.
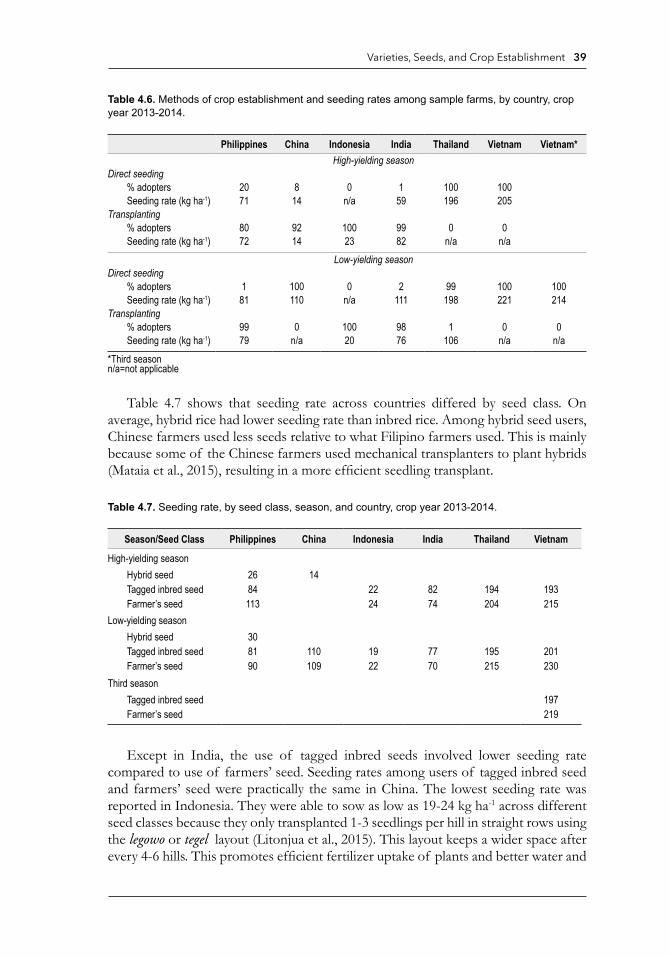
39
Table 4.6. Methods of crop establishment and seeding rates among sample farms, by country, crop year 2013-2014.
Philippines China Indonesia India Thailand Vietnam Vietnam*High-yielding season
Direct seeding% adopters 20 8 0 1 100 100Seeding rate (kg ha-1) 71 14 n/a 59 196 205
Transplanting% adopters 80 92 100 99 0 0Seeding rate (kg ha-1) 72 14 23 82 n/a n/a
Low-yielding seasonDirect seeding
% adopters 1 100 0 2 99 100 100Seeding rate (kg ha-1) 81 110 n/a 111 198 221 214
Transplanting% adopters 99 0 100 98 1 0 0Seeding rate (kg ha-1) 79 n/a 20 76 106 n/a n/a
*Third season n/a=not applicable
Table 4.7 shows that seeding rate across countries differed by seed class. On average, hybrid rice had lower seeding rate than inbred rice. Among hybrid seed users, Chinese farmers used less seeds relative to what Filipino farmers used. This is mainly because some of the Chinese farmers used mechanical transplanters to plant hybrids (Mataia et al., 2015), resulting in a more efficient seedling transplant.
Table 4.7. Seeding rate, by seed class, season, and country, crop year 2013-2014.
Season/Seed Class Philippines China Indonesia India Thailand Vietnam
High-yielding seasonHybrid seed 26 14Tagged inbred seed 84 22 82 194 193Farmer’s seed 113 24 74 204 215
Low-yielding seasonHybrid seed 30Tagged inbred seed 81 110 19 77 195 201Farmer’s seed 90 109 22 70 215 230
Third seasonTagged inbred seed 197Farmer’s seed 219
Except in India, the use of tagged inbred seeds involved lower seeding rate compared to use of farmers’ seed. Seeding rates among users of tagged inbred seed and farmers’ seed were practically the same in China. The lowest seeding rate was reported in Indonesia. They were able to sow as low as 19-24 kg ha-1 across different seed classes because they only transplanted 1-3 seedlings per hill in straight rows using the legowo or tegel layout (Litonjua et al., 2015). This layout keeps a wider space after every 4-6 hills. This promotes efficient fertilizer uptake of plants and better water and
Varieties, Seeds, and Crop Establishment

40 Competitiveness of Philippine Rice in Asia
pest management (Hidayah, 2013), hence, the high yield. Vietnam and Thailand had the highest seeding rates because of this direct seeding practice.
Summary and implications
Results show that majority of the farmers in all study areas planted high-yielding varieties. This implies that yield is a major consideration of farmers in choosing a variety to plant. Aside from yield, farmers also considered other factors such as length of maturity period, resistance to pests and diseases, and higher milling recovery. In addition to yield, these are rice qualities that can be considered in breeding.
Compared with those in the Philippines, farmers in selected countries collectively plant significantly fewer varieties. For Vietnam and India, two exporting countries, this choice was possibly affected by their need to maintain a consistent level of quality. Thailand though used more varieties than these two countries, but they were still relatively fewer than the Philippines. There are notions that too many varieties have been bred and released in the Philippines, which led farmers to plant plenty of varieties. This became a disadvantage to millers because it was difficult to achieve optimal milling rates. However, this could be a practice in managing pests and diseases through increased diversity. Hence, the option to breed more varieties in the future should carefully balance the needs of different stakeholders across the value chain.
Hybrid rice generally has higher yield than inbred rice. The use of hybrid seed in China, however, was confined only during HYS. This indicates that hybrid rice need not be planted in all seasons or in all locations. Breeding and dissemination strategies in the Philippines should target specific locations and seasons.
The yield advantage of tagged inbred seeds over the untagged ones is prominent only in some countries (China, Philippines, and Vietnam) but not in other areas (India, Indonesia, and Thailand). This could imply that factors other than seed could have caused higher yield in the latter group. To maximize the advantage of tagged inbred seed, its relation to other factors of production should be considered.
The quantity of seed used per hectare is strongly affected by crop establishment method. Although direct seeding economizes on labor, it uses more seed than does transplanting, thereby affecting yield. Hence, the net effect on cost of production and farmer profitability should be studied further with larger data sets. Nevertheless, even if transplanting remains the dominant method of crop establishment in the Philippines, there are lessons that might be learned from other countries to reduce the quantity of seeds used and thus save on costs. In this regard, the Indonesian experience might be helpful.
As the Philippines prepares for a competitive rice economy, its farmers have to further improve their farming practices to increase yield and reduce production

41
cost. Farmers’ experiences and techniques in other Asian rice-producing countries can serve as a learning tool for local farmers in improving management practices. However, farmers have to assess the suitability of any of these seed-related practices to local farm conditions before adopting them.
References
Bautista E., Javier E. 2005. The evolution of rice production practices, Philippine Institute for Development Studies (PIDS) Discussion Paper Series No. 2005–14.
Beltran JC, Relado RZ, San Valentin ML, Tulay EV, Bordey FH, Moya PF, Chi TT. 2015. A snapshot of Vietnam’s rice production systems in irrigated areas: The Mekong River Delta experience. Science City of Muñoz, Nueva Ecija (Philippines): Philippine Rice Research Institute, and Los Baños (Philippines) International Rice Research Institute. 27 p.
Bordey FH, Nelson CH. 2012. Productivity of Rice Farming in the Philippines: Patterns and Sources. Philippine Journal of Crop Science 37(3):10-22.
Bordey FH, Marciano EV, Yusongco CG, Besenio JRH, Karunakaran KR, Moya PF. 2015. Revisiting intensive rice cultivation in irrigated areas: the case of Tamil Nadu, India. Science City of Muñoz, Nueva Ecija (Philippines): Philippine Rice Research Institute, and Los Baños (Philippines) International Rice Research Institute. 21 p.
Cidro DA, Radhakrishna RB. 2005. An assessment of the hybrid rice program in the Philippines as perceived by farmers. In: Proceedings of the 21stannual Conference of the AIAEE, San Antonio, Texas. p 357-368. https://www.aiaee.org/attachments/article/998/098. January 29, 2016.
De Datta SK. 1981. Principles and Practices of Rice Production. USA: John Wiley & Sons, Inc.
Diaz C, Hossain M, Merca S, Mew T. 1998. Seed quality and effect on rice yield: Findings from farmer participatory experiments in Central Luzon, Philippines. Philippine Journal of Crop Science 23(2): 11-119.
[GRiSP] Global Rice Science Partnership. 2013. Rice Almanac, 4th ed. Los Baños (Philippines): International Rice Research Institute. 283 p.
Hidayah I. 2013. Farmers’ behavior in the implementation of component PPT (Integrated Plant and Resource Management) in irrigated paddy field farming in Buru Regency, Maluku Province, Indonesia. International Journal of Humanities and Social Science. 3(12): 129-138.
[IRRI] International Rice Research Institute. 2016a. How to ensure seed quality.http://www.knowledgebank.irri.org/step-by-step-production/pre-planting/seed-quality. March 21, 2016.
[IRRI] International Rice Research Institute. 2016b. Wet direct seeding. http://www.knowledgebank.irri.org/training/fact-sheets/crop-establishment/item/wet-direct-seeding-fact-sheet. March 23, 2016.
[IRRI] International Rice Research Institute. 2006. Breeding Program Management.
http://www.knowledgebank.irri.org/ricebreedingcourse/Hybrid_Rice_Breeding_&_Seed_Production.htm. January 29, 2016.
Launio CC, Redondo GO, Tabalno RF, Bordey FH, Moya PF. 2015. Is the Philippines’ leading rice-producing province faring good enough? The case of rice farming in Nueva Ecija. Science City of Muñoz (Philippines): Philippine Rice Research Institute and Los Baños (Philippines): International Rice Research Institute. 24 p.
Varieties, Seeds, and Crop Establishment

42 Competitiveness of Philippine Rice in Asia
Litonjua AC, Wardana P, Paran SJC, Valencia MSD, Macalintal FM, Bordey FH, Moya PF. 2015. Socioeconomic and technological profile of a semi-mechanized rice production system: the case of West Java, Indonesia. Science City of Muñoz, Nueva Ecija (Philippines): Philippine Rice Research Institute, and Los Baños (Philippines): International Rice Research Institute. 24 p.
Manalili RG, Marciano EB, Viray CA, Tanzo IR, Bordey FH, Moya PF. 2015. The Thailand rice economy under the government rice-pledging scheme: the case of SuphanBuri. Science City of Muñoz (Philippines): Philippine Rice Research Institute and Los Baños (Philippines): International Rice Research Institute. 26 p.
Mataia AB, Jamora N, Moya PF, Francisco SR, Dawe DC. 2011. Sources of Decade Rice Yield Growth in the Philippines. Philippine Journal of Crop Science (PJCS), 36(2): 20-29.
Mataia AB, Valencia MSD, Malasa RB, Milanes MBA, Bordey FH, Moya PF, Xianghai D, Xueping H. 2015. Rice production in the midst of economic development: the case of Jinhua, Zhejiang, China. Science City of Muñoz (Philippines): Philippine Rice Research Institute and Los Baños (Philippines): International Rice Research Institute. 25 p.
Moya PF, Dawe D, Pabale D, Tiongco M, Chien NV, Devarajan S, Djatiharti A, Lai NX, Niyomvit L, Ping HX, Redondo G, Wardana P. 2004. The economics of intensively irrigated rice in Asia. In: Dobermann A, Witt C, Dawe D, eds. Increasing productivity of intensive rice systems through site-specific nutrient management. Enfield, N.H. (USA): Science Publishers, Inc., and Los Baños (Philippines): International Rice Research Institute. p 29-58.
Pandey S, Bhandari H. 2009. Economics of hybrid rice in tropical Asia: major issues and opportunities. In: Xie F, Hardy B, eds. Accelerating hybrid rice development. Los Baños (Philippines): International Rice Research Institute. p. 535-548.
Pandey S, Velasco L. 2002. Economics of direct-seeding in Asia: patterns of adoption and research priorities. In Pandey S, Mortimer M, Wade L, Tuong TP, Lopez K, Hardy B. (eds.), Direct Seeding: Research Issue and Opportunities. Proceedings of the International Workshop on Direct Seeding in Asian Rice Systems: Strategic Research Issues and Opportunities, 25–28 January 2000, Bangkok, Thailand. Los Baños (Philippines): International Rice Research Institute. p 3–14.
[PhilRice] Philippine Rice Research Institute. 2016. Rice varieties. http://www.pinoyrice.com/wp-content/uploads/rice-varieties/Tubigan-18.html. January 26, 2016.
Ponnamperuma, FN. 1979. IR42: A rice type for small farmers of South and Southeast Asia. International Rice Research Newsletter, 4(3): 9-10.
[TNAU] Tamil Nadu Agricultural University. 2016. Paddy varieties of Tamil Nadu. http://agritech.tnau.ac.in/expert_system/paddy/TNvarieties.html. March 12, 2016.
Viet Nam News. 2012a. Farmers ignore warnings, plant low-quality rice. http://vietnamnews.vn/agriculture/225609/farmers-ignore-warnings-plant-low-quality-rice.html. December 21, 2015.
Viet Nam News. 2012b. Demand rises for high-grade rice. http://vietnamnews.vn/print/222051/demand-rises-for-high-grade-rice.htm. December 21, 2015.
Virmani SS, Sharma S. 1993. Manual for hybrid seed production. Los Baños (Philippines): International Rice Research Institute.
FERTILIZER AND NUTRIENT MANAGEMENTRowena G. Manalili, Cheryll C. Launio, Jesusa C. Beltran, Aileen C. Litonjua, Alice B. Mataia, Flordeliza H. Bordey, Irene R. Tanzo, and Piedad F. Moya
Key messages:• Inorganic fertilizer supplies the bulk of nutrients in these intensive irrigated rice
systems; organic fertilizer is used sparingly if at all.
• Fertilizer is applied in two to four splits by most farmers; farmers in Vietnam tend to use four splits, while Chinese farmers prefer two splits.
• Farmers in most locations tend to apply about 90 – 110 kg N ha-1, although farmers in China and Indonesia apply much more, with averages per season ranging from 140 to 200 kg N ha-1. P and K are applied in smaller quantities.
• The price of urea, the most widely used fertilizer, is highest in the Philippines, but is roughly similar to prices in Thailand and Vietnam.
Fertilizers play an important role in increasing rice production and improving productivity. This major input, along with the use of high-yielding varieties and good irrigation water management, is one of the major factors that made the
Green Revolution a big success. Majority of the farmers have been applying fertilizer because they recognize its importance in attaining high rice yield. From 1988 to 2002, fertilizer application increased yield by nearly 1 t ha-1 in the rainfed areas, even higher in irrigated areas (Balisacan and Sebastian, 2007).
Nearly all rice farmers use fertilizers, but not all use the best nutrient management practices that would increase rice production. The relatively low fertilizer use and untimely application, accompanied by poor cultural management practices, are the major sources of inefficiency (Sebastian et al., 1999). Efficient fertilizer management integrated with appropriate agronomic and pest management is needed to improve and sustain production and productivity.
This chapter aims to describe the levels of fertilizer use and management of farmers in intensively cultivated irrigated areas in the Philippines and compare these with practices of farmers in selected Asian major rice-producing countries. Fertilizer use in elemental forms of nitrogen (N), phosphorus (P), and potassium (K); frequency and timing of fertilizer applications, fertilizer grades, and comparative price of urea relative to N application of farmers in each country are discussed. To meet these objectives, this paper used benchmark data (see chapter on The benchmark data: sources, concepts, and methods).
5
43

44 Competitiveness of Philippine Rice in Asia
Fertilizer use
De Datta (1981) emphasized the importance of NPK fertilizers. Nitrogen increases plant height, promotes tiller production, and increases leaf and grain size. Its absorption leads to a greater number of spikelets per panicle and a higher percentage of filled grains. It is thus an important material input that affects rice yield. Phosphorus stimulates root development, promotes active tillering, and enables the plant to recover faster when subjected to unfavorable conditions. Potassium increases the weight of the grains and plays an important role in the physiological processes of rice. But unlike N fertilizer, which is practically a raw material in production, P and K fertilizers are stored in the soil and their increased application in 1 year may not result in increased production immediately (Moya et al., 2004).
Table 5.1 shows the average amount of NPK used by farmers, by country and by season. Inorganic fertilizer management practices varied considerably both across and within sites. In terms of N fertilizer use, the Philippines was the third highest among the six countries covered by the study. Rice farmers in the Philippines used 114 kg ha-1 N during the high-yielding season (HYS) and 107 kg ha-1 during the low-yielding season (LYS). Farmers appeared to “overapply” N during LYS and “underapply” during HYS, when one considers optimal N requirements at 56 and 133 kg ha-1 in project sites for LYS and HYS, respectively (Dawe and Moya, 1999 as cited by Dawe et al., 2006; Launio et al., 2015).
Table 5.1. Average amount of NPK (kg ha-1) used by farmers, by country and by season, crop year 2013-2014.
Item Philippines (Nueva Ecija)
China (Zhejiang)
Indonesia (West Java)
India (Tamil Nadu)
Thailand (SuphanBuri)
Vietnam (Can Tho)
High-yielding season N 114 198 * 141 * 105 79 * 93 * P 18 29 * 33 * 21 21 26 * K 25 110 * 36 33 10 * 29Low-yielding season Third season N 107 162 * 148 * 109 88 * 99 97 P 15 20 * 37 * 21 * 22 * 31 * 28 * K 23 90 * 34 * 38 * 10 * 35 * 34 * * significantly different from Philippines at 95% confidence level
Farmers in China applied the highest amount of N fertilizers across all sites and seasons. N use was highest at 198 kg ha-1 during HYS as a result of hybrid rice adoption, which is more responsive to fertilizer inputs (Mataia et al., 2015). The average N fertilizer use during LYS was lower at 162 kg ha-1 because farmers typically planted inbred rice (Mataia et al., 2015). It was also found that Chinese farmers relied more on the use of blanket fertilizer recommendations, which has minimum variability in terms of type and amount of fertilizers applied. These recommendations were given by extension agents who visit their villages. They used significantly higher amounts of NPK compared with Filipino farmers.

45
Rice farmers in Indonesia were the second highest user of N in both HYS and LYS, ranging from 141 to 148 kg ha-1 (Table 5.1). They used significantly higher N than did farmers in the Philippines. The high use of N could be attributed to the lower prices of fertilizer in Indonesia as the country produces its own N and P fertilizers and it is a net exporter of urea. It imports potassium chloride (KCl) (Litonjua et al., 2015). The government of Indonesia provides subsidy on fertilizers to encourage farmers to apply inorganic and organic fertilizers adequately because most of them have a limited capital (Rachman and Sudaryano, 2010 as cited by Litonjua et al., 2015).
Indian farmers used an average of 105 kg ha-1 of N during HYS and 109 kg ha-1 during LYS in their rice farms (Table 5.1). Even with fertilizer subsidy, farmers were not able to optimize the use of fertilizers (especially N) during the HYS. Water availability could be the main factor affecting their decision to apply N fertilizer (Bordey et al., 2015). Indian and Filipino farmers did not significantly differ in their use of N in both seasons.
Farmers in Vietnam applied the second least amount of N in the three cropping seasons. Average N use ranged from 93 to 99 kg ha-1 (Table 5.1). The high cost of inputs, particularly fertilizers, was cited as one of the most common problems in rice production in Vietnam, which would prevent farmers from using the required amount (Beltran et al., 2015).
Vietnamese farmers significantly applied lower N during HYS than did farmers in the Philippines. Even with the lower N applications , rice yields were significantly higher at 8.56 t ha-1 during HYS, 6.33 t ha-1 during LYS and 5.69 t ha-1 during third season compared with those in Nueva Ecija at 5.68 t ha-1 and 3.84 t ha-1 during HYS and LYS, respectively. The seemingly higher land fertility in Vietnam, particularly in the southern part, could be due to the annual flooding of the Mekong River (Beltran et al., 2015).
Farmers in Thailand applied by far the lowest level of N in both seasons. Average N use ranged from 79 to 88 kg ha-1 (Table 5.1). Just like in the Philippines, there was no government subsidy on fertilizers in Thailand, but there was a credit program where farmers can avail of fertilizers through credit cards provided by the Bank of Agriculture and Agricultural Cooperatives (BAAC) (Manalili et al., 2015).
Phosphorus fertilizer was used in moderate amounts in all sites. Filipino farmers applied the lowest level of P (15–18 kg ha-1) in all sites in both seasons. The highest P rate was applied by Indonesian farmers at 33 kg ha-1 during HYS and slightly higher at 37 kg ha-1 during LYS (seasonal difference though) was not statistically significant. All other sites applied P fertilizer ranging from 21 to 29 kg ha-1 during HYS, from 20 to 37 kg ha-1 during LYS, and 28 kg ha-1 during the third season in Vietnam.
Potassium use was more variable across sites. Filipino farmers applied the second least K with just 23–25 kg ha-1. Farmers in China used the highest amount of K at 110 kg ha-1 during HYS and 90 kg ha-1 during LYS. The low K rates in Thailand might be
Fertilizer and Nutrient Management

46 Competitiveness of Philippine Rice in Asia
attributed to the practice that most of the rice straw, which is rich in K, are left in the ground after harvest by the combine harvester (Moya et al., 2004). One ton of rice straw is equivalent to 14 kg K (Dobermann and Fairhust, 2002). Farmers in other sites applied K at amounts ranging from 29 to 38 kg ha-1.
Rice crop response to nutrient application may vary with season. HYS, which is equivalent to dry season, has more favorable weather conditions and higher solar radiation. The rice plant can absorb more nutrients and can produce more grains due to the more abundant solar radiation; hence, N fertilizer application should be higher. Results indicate that it was only in China and Philippines where higher rates of NPK were applied by farmers in the HYS than in the LYS. However, Launio et al. (2015) found that the difference in N application in Nueva Ecija between HYS and LYS was not statistically significant.
This is in contrast to the higher NPK rates applied by farmers in Indonesia, Thailand, India, and Vietnam during LYS (wet season). The differences were insignificant, except for Thailand, where a substantial amount of N was applied during LYS. This may be the case because there was a shortage of irrigation water during the HYS that restricted farmers’ fertilizer application.
Frequency of application
Table 5.2 shows the average number of fertilizer applications made by farmers, by country and season. The average number did not differ much across seasons and across countries. On the average, fertilizers were commonly applied using three splits per season in the Philippines, Indonesia, India, and Thailand. While farmers in Vietnam applied fertilizers more frequently at an average of four splits per season, Chinese farmers had only two per season, the least among the six sites.
Farmers in Indonesia had the most number of applications—up to nine splits, including one on the seedbed per cropping season. However, only a small proportion of the farmers (1–3%) applied fertilizers using six to nine splits. Most of them split fertilizers into two to three applications. This indicates that more Indonesian farmers are now applying fertilizer more frequently compared with 1999 when they used only one to two splits (Moya et al., 2004).
Chinese farmers applied up to a maximum of four splits during both seasons, the lowest among the six countries. The most frequent fertilizer application in Thailand is four times during HYS and five times during LYS. This could be partly explained by the limited water supply during HYS (Manalili et al., 2015). A few farmers in the Philippines and India applied fertilizers up to five splits for both seasons. In the case of Vietnam, some farmers applied up to six splits during the third season. The more frequent fertilizer application in India was due to ample labor supply and low wage rate in the area (Bordey et al., 2015).

47
Timing of fertilizer application
Aside from the amount and frequency of fertilizer application, timing is another factor that affects rice yield and should be considered by farmers. Timing of fertilizer application is expressed in terms of days after transplanting (DAT) or days after seeding (DAS). These were further categorized according to growth stage of the rice plant: 1) basal stage (before planting or 0 day); 2) early vegetative stage (1–15 days); 3) maximum tillering stage (16–45 days); 4) panicle initiation stage (46–60 days); and 5) flowering and maturity stage (>60 days). Discussion on the timing of application is limited only to the main rice field, which excludes those that applied in the seed nurseries. Because some farmers applied more than once per stage, the number of fertilizer applications per farmer could exceed one in any given stage.
Table 5.3 shows the average number of fertilizer applications per farmer by plant growth stage, by country, and by season. Basal application was not practiced by farmers in the Philippines in either season. It was not also common in Thailand and Vietnam, where direct-seeding is a major practice. Basal application is practiced in China (0.4–0.7), Indonesia (0.1–0.2), and India (0.2–0.3).
During HYS, all farmers in the Philippines, China, India, and Vietnam applied at least once – 1-15 DAT/DAS. While majority of Indonesian farmers who applied fertilizer once (0.7) in the same period, far fewer Thai farmers (0.1) practiced the same. In LYS, farmers in the Philippines, India, and Vietnam applied fertilizer once, with
Table 5.2. Average and percent distribution of farmers, by number of fertilizer application, by country, and by season, crop year 2013-2014.
Country Average no. of applications
No. of applications0 1 2 3 4 5 or more
I. High-yielding seasonPhilippines (Nueva Ecija) 2.76 0 2 34 53 8 3China (Zhejiang) 2.49 0 4 48 43 5 0Indonesia (West Java) 2.96 0 1 42 36 10 11India (Tamil Nadu) 2.84 1 2 24 60 13 1Thailand (SuphanBuri) 2.61 0 1 38 60 1 0Vietnam (Can Tho) 3.57 0 0 0 49 45 6
II. Low-yielding season 0Philippines (Nueva Ecija) 2.44 0 2 59 33 5 1China (Zhejiang) 2.36 0 0 65 34 1 0Indonesia (West Java) 2.80 0 2 53 28 7 10India (Tamil Nadu) 2.86 0 1 24 65 8 2Thailand (SuphanBuri) 2.68 0 0 44 49 4 3Vietnam (Can Tho) 3.66 0 0 0 40 54 6
III. Third seasonVietnam (Can Tho) 3.68 0 0 0 40 53 7
Fertilizer and Nutrient Management

48 Competitiveness of Philippine Rice in Asia
some in the latter two countries applying more than once during the early vegetative stage. In contrast, Chinese farmers who applied fertilizer in the same crop stage in LYS decreased their number of applications (0.3), which could be attributed to their use of inbred varieties, which are less fertilizer-responsive than hybrids. The average number of fertilizer applications of Indonesian farmers who applied fertilizer in the same stage increased to 0.9 while the Thai farmers maintained it at 0.1.
It was observed that applying of fertilizers at least once 16–45 DAT/DAS (maximum tillering stage) was practiced by all farmers in both seasons in all countries. In fact, in Vietnam, farmers applied about twice (2.2) during this crop stage. In the Philippines, farmers applied about 1.3 to 1.5 times in the same growth stage.
Some farmers in the Philippines, China, and Vietnam applied fertilizer at about 0.2 times during the panicle initiation stage (45–60 DAT/DAS) in HYS and LYS. More Thai farmers applied fertilizer about 0.7 times during this crop stage in both seasons. Even fewer farmers, particularly in the Philippines, China, India, and Vietnam, applied fertilizer during flowering up to maturity. But still, majority of Thai farmers had 0.5-0.6 times of application rate during this growth stage, whereas Indonesian farmers had 0.2-0.3 times. This shows that, while farmers in the Philippines, China, India, and Vietnam favor fertilizer application in the early stages of rice growth, Thai farmers prefer to apply fertilizer in the later growth stages.
Table 5.3. Number of fertilizer applications per farmer by plant growth stage, by country, and by season, crop year 2013-2014.
Timing (DAT/DAS) Philippines(Nueva Ecija)
China(Zhejiang)
Indonesia(West Java)
India(Tamil Nadu)
Thailand(SuphanBuri)
Vietnam(Can Tho)
High-yielding season (n=101) (n=100) (n=100) (n=101) (n=100) (n=100) <= 0 0.01 0.35 0.24 0.28 0.01 0.001-15 1.01 1.02 0.71 1.07 0.09 1.3316-45 1.50 0.99 1.43 1.09 1.35 2.1646-60 0.16 0.03 0.24 0.42 0.67 0.02>60 0.09 0.01 0.28 0.04 0.49 0.06
Low-yielding season Third season(n=100) (n=100) (n=100) (n=101) (n=100) (n=100) (n=100)
<= 0 0.01 0.73 0.11 0.15 0.00 0.05 0.061-15 1.00 0.29 0.90 1.10 0.09 1.28 1.2816-45 1.33 1.13 1.35 1.10 1.36 2.18 2.1746-60 0.08 0.15 0.25 0.21 0.66 0.11 0.11>60 0.04 0.06 0.18 0.26 0.57 0.04 0.06
Note: Some farmers have more than one application per growth stage. Thus, the numbers in the table exceed 1.DAT - Days after transplanting DAS - Days after seeding

49
Common fertilizer grades
Table 5.4 shows the frequency distribution of common grade of inorganic and organic fertilizers used by farmers, by country and by season. Most farmers used fertilizers from inorganic sources while some used organic fertilizers. Among the various inorganic fertilizers, the use of urea was most widespread. Urea, a source of N that is needed for plant growth, was the most popular fertilizer used by farmers during all seasons in China (38–49%), India (47–48%), Vietnam (38–41%), Philippines (37–42%), and Indonesia (34–36%). It was the second most commonly used fertilizer in Thailand, used by 30–31% of the farmers.
Compound or complete fertilizer (NPK) was the second most popular grade among farmers in the Philippines, China, and Indonesia; it ranked third in Thailand and Vietnam. In India, less than 1% of the farmers used complete fertilizer. Many complete fertilizers with different NPK grades were used in Thailand and Indonesia. While several compounds or mixed fertilizers were used, 15-15-15 and 16-16-16 were very common in Thailand. Grades such as 10-15-15, 10-5-5, 15-15-15, 16-16-16, and 30-6-8 were used by farmers in Indonesia. Complete fertilizer 14-14-14 was very popular in the Philippines, while 15-15-15 was most commonly used in China.
Ammonium phosphate was the most popular fertilizer grade used by 40–42% of the farmers in Thailand. It has also gained popularity in the Philippines with 14–16% of the farmers using it as sources of N and P. Ammonium sulfate was also used by 11% of Filipino farmers in both seasons.
Potassium chloride (KCl) or muriate of potash was also commonly used by famers in Vietnam (15–24%), China (15–24%), and India (16%). It was sparingly used in Indonesia because it is expensive. Among different fertilizer grades, only KCl is imported by Indonesia, leading to a price that is almost four times that of other fertilizers (Litonjua et al., 2015). Di-ammonium phosphate was used by 25% of the farmers in India and by 27% in Vietnam.
Organic fertilizer
Although inorganic fertilizers account for the bulk of nutrients applied by farmers to the rice crop, some farmers prefer organic fertilizer. A small proportion (3%) of farmers in the Philippines, mostly hybrid rice farmers, used organic fertilizers, while 10–29% (depending on the season) of farmers in Indonesia applied an average of about 700–800 kg ha-1 of organic fertilizers (Litonjua et al., 2015).1 West Java had the highest number of users of organic fertilizers among the six sites due to the subsidy program of the government that aims to encourage farmers to apply organic fertilizers to improve soil quality (Litonjua et al., 2015).
Biofertilizers such as neem cake and farmyard manure were used by farmers in
1 This is the average application for farmers who used organic fertilizer, not the average across all farmers.
Fertilizer and Nutrient Management

50 Competitiveness of Philippine Rice in Asia
Tabl
e 5.
4. P
erce
nt d
istri
butio
n of
the
top
five
com
mon
gra
des
of fe
rtiliz
er u
sed
by fa
rmer
s, b
y co
untry
and
by
seas
on, c
rop
year
201
3-20
14.
Philip
pine
s (N
ueva
Ecij
a)Ch
ina
(Zhe
jiang
)In
done
sia(W
est J
ava)
Indi
a(T
amil N
adu)
Thail
and
(Sup
hanB
uri)
Viet
nam
(Can
Tho
)Gr
ade
%Gr
ade
%Gr
ade
%Gr
ade
%Gr
ade
%Gr
ade
%Gr
ade
%Hi
gh-y
ieldin
g se
ason
Urea
37Ur
ea49
Urea
34Ur
ea47
Ammo
nium
phos
phate
42Ur
ea41
Comp
lete
28Co
mplet
e32
Comp
lete
32Di
-amm
onium
ph
osph
ate (D
AP)
25Ur
ea30
di-am
moniu
m ph
osph
ate (D
AP)
27
Ammo
nium
phos
phate
16Mu
riate
of po
tash
(MOP
)/pota
ssium
ch
loride
(KCl
)
15Su
perp
hosp
hate
36 (S
P 36)
18Mu
riate
of po
tash
(MOP
)/pota
ssium
ch
loride
(KCl
)
16Co
mplet
e23
Comp
lete
17
Ammo
nium
sulfa
te11
Calci
um su
perp
hos-
phate
(CaC
H 2PO6)
2Or
ganic
4Ne
em ca
ke3
Ammo
nium
sulfa
te0.3
Muria
te of
potas
h (M
OP)/P
otass
ium
chlor
ide (K
Cl)
14
Potas
sium
nitra
te4
CHN3
O6 (T
rinitro
meth-
ane/N
itrofor
m)1
Muria
te of
potas
h (M
OP)/P
otass
ium
chlor
ide (K
Cl)
1Co
w ma
nure
2Mu
riate
of po
tash
(MOP
)/Pota
ssium
ch
loride
(KCl
)
0.3Ag
rotai
n 20.1
Muria
te of
potas
h (MO
P)/
Potas
sium
chlor
ide (K
Cl)
1Tia
n An (
potas
sium
sulfa
te)1
Micro
nutrie
nts1
Latem
gas
1Lo
w-yie
lding
seas
onTh
ird S
easo
n
Urea
42Ur
ea38
Urea
36Ur
ea48
Ammo
nium
phos
phate
40Ur
ea38
Urea
40
Comp
lete
26Co
mplet
e27
Comp
lete
33Di
-amm
onium
ph
osph
ate25
Urea
30Di
-amm
onium
ph
osph
ate (D
AP)
26di-
ammo
nium
ph
osph
ate (D
AP)
25
Ammo
nium
phos
phate
14Mu
riate
of po
tash
(MOP
)/Pota
ssium
ch
loride
(KCl
)
24Su
perp
hosp
hate
36 (S
P 36)
19Mu
riate
of po
tash
(MOP
)/Pota
ssium
ch
loride
(KCl
)
16Co
mplet
e19
Comp
lete
18Mu
riate
of po
tash
(MOP
)/Pota
ssium
ch
loride
(KCl
)
17
Ammo
nium
sulfa
te11
Supe
rpho
spha
te5
Orga
nic2
Micro
food
2Mu
riate
of po
tash
(MOP
)/Pota
ssium
ch
loride
(KCl
)
0.3Mu
riate
of po
tash
(MOP
)/Pota
ssium
ch
loride
(KCl
)
15Co
mplet
e+te
10
Potas
sium
nitra
te4
CHN3
O6 (T
rinitro
meth-
ane/N
itrofor
m)4
Ammo
nium
sulfa
te0.5
FYM
2Am
moniu
m ph
os-
phate
0.4Co
mplet
e7
Muria
te of
potas
h (MO
P)/
Potas
sium
chlor
ide (K
Cl)
2Ca
lcium
supe
rpho
s-ph
ate (C
aCH 2PO
6)1
Muria
te of
potas
h (M
OP)/P
otass
ium
chlor
ide (K
Cl)
0.5Ne
em ca
ke1
Ammo
nium
sulfa
te0.1

51
India. Neem cake, a by-product from oil extraction from the fruit seed that can be used as fertilizer and pesticides (Lim and Botrell, 1994 as cited by Bordey et al., 2015), was used by 10–19% of the farmers. Farmyard manure was also applied by Indian farmers, although its use in 2013 has gone down substantially compared with that in 1999 (Bordey et al., 2015). A few farmers in India, Thailand, and the Philippines left rice straw in the field for later incorporation into the soil during land preparation.
Comparative prices of urea
Urea was most expensive in the Philippines at an average price of PhP 23.23 kg-1 across seasons (Table 5.5). In contrast, India had the lowest price at only PhP 4.29 kg-1. Here, fertilizer is sold at a government-fixed uniform sale price (Bordey et al., 2015). The second lowest price was seen in Indonesia at PhP 7.92 kg-1. This is due to the fact that Indonesia produces its own fertilizers, making them a net exporter of urea, and the government provides 50–75% subsidy. Big fertilizer companies are government-owned, hence supply and distribution are controlled by the government (Litonjua et al., 2015). Vietnam and Thailand had almost the same level of prices at about PhP 19.70–20.76 kg-1. Just like in the Philippines, there is no fertilizer subsidy documented during the time of the survey in Thailand and Vietnam where prices of urea are high. China is at midlevel, with the price averaging PhP 14.87 kg-1.
Table 5.5. Average price of urea (PhP kg-1), by country and by season, crop year 2013-2014.
Season Philippines (Nueva Ecija)
China (Zhejiang)
Indonesia (West Java)
India (Tamil Nadu)
Thailand (SuphanBuri)
Vietnam (Can Tho)
(PhP kg-1)
High-yielding season 25.49 14.55 7.88 4.28 21.11 18.01Low-yielding season 20.98 15.19 7.97 4.31 20.41 20.87Third season 20.23Average 23.23 14.87 7.92 4.29 20.76 19.70
Summary and implications
Filipino farmers ranked third among those in the six countries in terms of N application in both seasons. Nevertheless it has the lowest P application; it is second to the least in K application. On average, farmers in the Philippines only apply fertilizer thrice during HYS and twice during LYS, which is less frequent compared with Vietnamese farmers who consistently apply around four times every season. A greater frequency of application could improve the efficiency of nutrient uptake of the rice plant, which could be part of the reason for the higher yield in Vietnam compared with that in the Philippines (see chapter on Rice yield and its determinants).
The seasonal difference in the N application in the Philippines was not statistically
Fertilizer and Nutrient Management

52 Competitiveness of Philippine Rice in Asia
significant, even with the adoption of hybrid rice, which is more responsive to N fertilizers. This implies that optimal use of N during HYS (where there is greater solar radiation) was not attained by the farmers. Proper amount of fertilizers, especially N, should be given emphasis to get the full potential of this input in obtaining higher yield during HYS. This could be addressed by intensifying dissemination of information on nutrient management technologies and tools such as the leaf color chart and the rice crop manager.
The Philippines can also learn from the experience of Vietnam where Beltran et al. (2015) implied that the improved N productivity may be due to the successful introduction of site-specific nutrient management (SSNM), which focused more on the proper amount and timing of fertilizer application. Farmers in the Philippines may benefit from understanding their own fields, learning and applying not just optimal rates, but also optimal splitting and timing of applications. Higher fertilizer N efficiency may be achieved through improved timing and application methods, and developing appropriate farm-specific schedules for fertilizer N split applications (De Datta, 1986; IRRI, 2016).
References
Balisacan AM, Sebastian LS et al. 2007. Securing rice, reducing poverty: challenges and policy directions. Los Baños (Philippines): Southeast Asian Regional Center for Graduate Studies and Research in Agriculture (SEARCA), Philippine Rice Research Institute (PhilRice) and Department of Agriculture-Bureau of Agricultural Research (DA-BAR), College, Los Baños, Laguna. 352 p.
Beltran JC, Relado RZ, San Valentin ML, Tulay EV, Bordey FH, Moya PF, Chi TT. 2015. A snapshot of Vietnam’s rice production systems in irrigated areas: The Mekong River Delta experience. Science City of Muñoz, Nueva Ecija (Philippines): Philippine Rice Research Institute, and Los Baños (Philippines) International Rice Research Institute. 27 p.
Bordey FH, Marciano EV, Yusongco CG, Besenio JRH, Karunakaran KR, Moya PF. 2015. Revisiting intensive rice cultivation in irrigated areas: the case of Tamil Nadu, India. Science City of Muñoz, Nueva Ecija (Philippines): Philippine Rice Research Institute, and Los Baños (Philippines) International Rice Research Institute. 20 p.
Dawe DC, Moya PF, Gascon F, Valencia MS, and Jamora N. 2006. Can nitrogen management in Philippine rice production be improved? In: Dawe DC, Moya PE, Casiwan CB, eds. Why does the Philippines import rice? Meeting the challenge of trade liberalization. Manila (Philippines): International Rice Research Institute and Science City of Munoz (Philippines): Philippine Rice Research Institute.
De Datta SK. 1981. Principles and practice of rice production. New York: Wiley and Sons.
De Datta SK.1986. Improving nitrogen fertilizer efficiency in tropical Asia. Chapter nitrogen economy of flooded rice soils. Developments in Plants and Soil Sciences 26: 171–186.
Dobermann A, Fairhust T. 2002. Rice straw management. Better Crops International (special supplement) 2002:7-9.
[IRRI] International Rice Research Institute. 2016. Nutrient management. http://www.knowledgebank.irri.org/training/fact-sheets/nutrient-management/nitrogen-split-applications. March 2016.
Launio CC, Redondo GO, Tabalno RF, Bordey FH, Moya PF. 2015. Is the Philippines’ leading rice-
53
producing province faring good enough? The case of rice farming in Nueva Ecija. Science City of Muñoz (Philippines): Philippine Rice Research Institute and Los Baños (Philippines): International Rice Research Institute. 24 p.
Litonjua AC, Wardana P, Paran SJC, Valencia MSD, Macalintal FM, Bordey FH, Moya PF. 2015. Socioeconomic and technological profile of a semi-mechanized rice production system: the case of West Java, Indonesia. Science City of Muñoz, Nueva Ecija (Philippines): Philippine Rice Research Institute, and Los Baños (Philippines): International Rice Research Institute. 24 p.
Manalili RG, Marciano EB, Viray CA, Tanzo IR, Bordey FH, Moya PF. 2015. The Thailand rice economy under the government rice-pledging scheme: the case of SuphanBuri. Science City of Muñoz (Philippines): Philippine Rice Research Institute and Los Baños (Philippines): International Rice Research Institute. 26 p.
Mataia AB, Valencia MSD, Malasa RB, Milanes MBA, Bordey FH, Moya PF, Xianghai D, Xueping H. 2015. Rice production in the midst of economic development: the case of Jinhua, Zhejiang, China. Science City of Muñoz (Philippines): Philippine Rice Research Institute and Los Baños (Philippines): International Rice Research Institute. 25 p.
Moya PF, Dawe D, Pabale D, Tiongco M, Chien NV, Devarajan S, Djatiharti A, Lai NX, Niyomvit L, Ping HX, Redondo G, Wardana P. 2004. The economics of intensively irrigated rice in Asia. In: Dobermann A, Witt C, Dawe D, eds. Increasing productivity of intensive rice systems through site-specific nutrient management. Enfield, N.H. (USA): Science Publishers, Inc., and Los Baños (Philippines): International Rice Research Institute. p 29-58.
Sebastian LS, Alviola IV PA, Francisco SR. 1999. Bridging the rice yield gap in the Philippines. http://www.fao.org/docrep/003/x6905e/x6905e00.htm. February 5, 2016.
Fertilizer and Nutrient Management

PESTICIDE USE AND PRACTICESJesusa C. Beltran, Flordeliza H. Bordey, Cheryll C. Launio, Aileen C. Litonjua, Rowena G. Manalili, Alice B. Mataia, Rhemilyn Z. Relado, and Piedad F. Moya
Key messages:• Pesticides are widely used by rice farmers in irrigated areas for crop protection.
• Along with farmers in India, those in the Philippines generally use fewer pesticides than in other locations, especially insecticides.
• The toxicity of pesticides used in the Philippines seems to be generally quite low compared with that in other countries, but there is still room for improvement in this regard.
Pesticide application in rice production is a vital activity to protect and enhance yield. It is the frontline defense of farmers against rice pests and diseases. Most farmers consider pesticides as the most reliable pest management instrument
(Heong and Escalada, 1997). However, continuous reliance on pesticides poses a serious threat to non-target plants, animals, human beings, and the environment. Rice pesticides are among the most toxic agrochemicals (Rola and Pingali, 1993). Thus, judicious and proper use of pesticides in rice production is necessary.
This chapter aims to describe the levels of pesticide use and management practices of farmers in intensively cultivated irrigated areas in the Philippines and compare these to the practices of farmers in similar areas in other Asian major rice-producing countries. The amount of active ingredient (ai) used, frequency and timing of pesticide applications, common ai used, and level of toxicity in each country were discussed. To meet these objectives, this paper used benchmark data (see chapter on The benchmark data: sources, concepts, and methods).
Pesticide use
All farmers across countries have long been using various forms of pesticides to control pests and diseases in all seasons. It is either in the form of liquid or wettable powder that is sprayed on the rice crop by diluting them in water and granules that are applied directly to the plants through broadcasting (Moya et al., 2015). Because these chemicals are of different composition, form, and effectiveness, it is not easy to group and analyze them to make a meaningful comparison on the amount of use across farms and seasons. Nevertheless, to facilitate comparison as best as possible, we estimated the mean kilogram (kg) of ai applied per hectare, by pesticide category and by season. The procedure was explained in the chapter on The benchmark data: sources, concepts, and methods.
6
55

56 Competitiveness of Philippine Rice in Asia
Timing of pesticide application is expressed in terms of days after transplanting (DAT) or days after seeding (DAS). These were further categorized according to growth stage of the rice plant: a) basal stage (before planting or 0 day); b) early vegetative stage (1–15 days); c) maximum tillering stage (16–45 days); d) panicle initiation stage (46–60 days); and e) flowering and maturity stage (>60 days). Discussion on the timing of application is limited to applications on the main rice field and excludes applications in the seed nurseries. Because some farmers applied more than once per plant growth stage, the number of pesticide applications per farmer could exceed one in any given stage.
Using benchmark data and results of key informant interviews, some of the most common pest and disease problems reported by farmers across countries include weeds, rats, snails, brown planthoppers, and bacterial leaf blight. Heavy reliance on pesticides was observed in all countries in all seasons in terms of frequency of applications (Table 6.1) and mean kg ai) ha-1 used by farmers (Table 6.2). This is primarily due to the high incidence of pests and diseases as well as the strong desire of farmers to prevent their spread or occurrence in their own farms. Pesticides were often applied as a cocktail of insecticides, herbicides, fungicides, and growth hormones, particularly in Thailand. These were often used as preventive rather than curative measures. For example, all Thai farmers applied pesticides, but only 20% of them reported pest infestations (Manalili et al., 2015). Farmers often make wrong decisions on the existence of pest problems and then on pesticide use (Escalada and Heong, 2004). Indiscriminate and prophylactic applications at set intervals also often lead to injudicious use of pesticides.
Table 6.1. Mean number of application of farmers, by type of pesticide, by country, and by season, crop year 2013-2014.
Type of pesticidePhilippines
(Nueva Ecija)China
(Zhejiang)Indonesia
(West Java)India
(Tamil Nadu)Thailand
(SuphanBuri)Vietnam
(Can Tho)SB MF SB MF SB MF SB MF SB MF SB MF SB MF
High-yielding seasonHerbicides 0.1 1.0 0.7 1.1 0.1 1.2 0.0 0.7 - 2.0 - 1.6Insecticides 0.3 1.5 0.7 4.4 0.8 4.9 0.2 0.9 - 3.4 - 2.7Fungicides 0.0 0.4 0.0 0.7 0.0 1.7 0.0 0.3 - 2.3 - 3.7Molluscicides 0.1 1.1 0.0 0.0 0.1 0.6 0.0 0.0 - 0.1 - 1.4Rodenticides 0.0 0.8 0.0 0.0 0.2 0.7 0.0 0.1 - 0.2 - 0.6
Low-yielding season Third seasonHerbicides 0.1 0.8 - 1.3 0.1 1.2 0.0 0.6 - 2.0 - 1.9 - 2.0Insecticides 0.5 1.8 - 2.0 0.8 5.1 0.2 1.0 - 3.8 - 2.8 - 2.5Fungicides 0.0 0.3 - 0.6 0.0 1.7 0.0 0.3 - 2.3 - 3.4 - 3.7Molluscicides 0.2 1.0 - 0.0 0.0 0.7 0.0 0.0 - 0.0 - 1.5 - 1.3Rodenticides 0.1 0.9 - 0.0 0.1 0.7 0.0 0.1 - 0.1 - 0.9 - 0.9
Note: “-” indicates direct seeding was used (i.e., no seedbed): SB=seedbed; MF=main field.
Overall, pesticide use did not vary much across seasons in any given country. However, it varied substantially across locations (Table 6.2). Rice farmers in the Philippines and India used pesticides least. Their usage were significantly different for all seasons in all specific areas in other countries. In the Philippines, the low usage of

57Pesticide Use and Practices
pesticides is attributed to the relatively high prices, the strong educational campaigns on dangers associated with pesticide use, and adoption of integrated pest management (IPM) in the country (Moya et al., 2015). Rice farms of exporting countries such as Vietnam and Thailand were intensively sprayed with pesticides in all seasons.
Table 6.2. Average amount of pesticides applied by farmers (kg ai ha-1), by type of pesticide across countries and seasons, crop year 2013-2014.
Type of pesticide Philippines (Nueva Ecija)
China (Zhejiang)
Indonesia (West Java)
India (Tamil Nadu)
Thailand (SuphanBuri)
Vietnam (Can Tho)
High-yielding season Herbicides 0.33 0.74* 0.59 0.28 0.76* 0.46 Insecticides 0.24 1.85* 2.38* 0.49* 0.35 0.31 Fungicides 0.05 1.28* 0.34 0.15 0.19 0.86* Molluscicides 0.29 0.00* 0.35 0.00* 0.00* 1.07* Rodenticides 0.03 0.00 0.05 0.05 0.00 0.00 Low-yielding season Third season Herbicides 0.27 0.17 0.72* 0.26 0.87* 0.43 0.44 Insecticides 0.31 0.39 2.78* 0.69 0.36 0.49 0.36 Fungicides 0.05 0.62* 0.27* 0.11 0.19 0.85* 0.89* Molluscicides 0.34 0.00* 0.39 0.00* 0.00* 0.96* 1.00* Rodenticides 0.13 0.00* 0.05 0.00* 0.00* 0.01* 0.00 Note: * indicates significance at 95% confidence level. Test of means is between Philippines and a specific country.
Herbicide use
Herbicide is one of the most common types of pesticide applied by farmers in all countries (Fig. 6.1). Many farmers rely on herbicides to control weeds in their fields because they are cheap and easy to use. About 99% of farmers in Vietnam and Thailand applied herbicides to control weeds in their fields in all seasons. The heavy reliance on herbicides of farmers in these areas is primarily due to the method of crop establishment that they practice, which is direct seeding (see chapter on Variety, seeds, and crop establishment). Direct-seeded rice is more susceptible to weed problems than transplanted rice (Ampong-Nyarko and De Datta, 1991; Moody, 1996; Pingali et al., 1997; Marsh et al., 2005). On the other hand, a significant number of farmers in the Philippines (14–22%) and in India (32–35%) were reported to be non-users of herbicides as they primarily engage in transplanting in both seasons. With transplanted crops, farmers can opt to control weeds through manual weeding. This method of weed control is not possible in direct seeding as plants do not grow in rows and rice plants and weeds typically germinate at the same time.
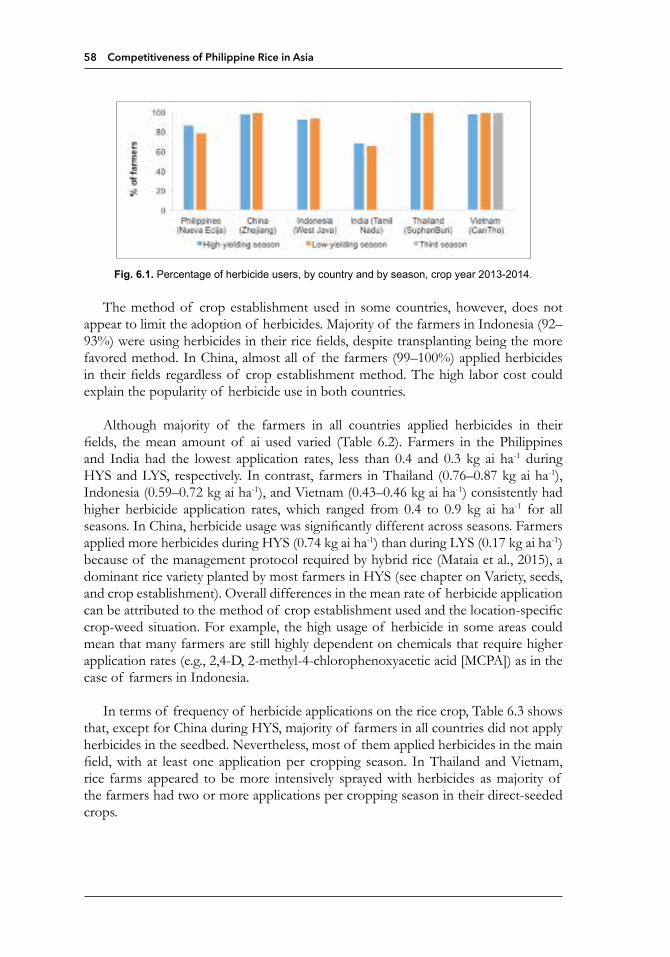
58 Competitiveness of Philippine Rice in Asia
Fig. 6.1. Percentage of herbicide users, by country and by season, crop year 2013-2014.
The method of crop establishment used in some countries, however, does not appear to limit the adoption of herbicides. Majority of the farmers in Indonesia (92–93%) were using herbicides in their rice fields, despite transplanting being the more favored method. In China, almost all of the farmers (99–100%) applied herbicides in their fields regardless of crop establishment method. The high labor cost could explain the popularity of herbicide use in both countries.
Although majority of the farmers in all countries applied herbicides in their fields, the mean amount of ai used varied (Table 6.2). Farmers in the Philippines and India had the lowest application rates, less than 0.4 and 0.3 kg ai ha-1 during HYS and LYS, respectively. In contrast, farmers in Thailand (0.76–0.87 kg ai ha-1), Indonesia (0.59–0.72 kg ai ha-1), and Vietnam (0.43–0.46 kg ai ha-1) consistently had higher herbicide application rates, which ranged from 0.4 to 0.9 kg ai ha-1 for all seasons. In China, herbicide usage was significantly different across seasons. Farmers applied more herbicides during HYS (0.74 kg ai ha-1) than during LYS (0.17 kg ai ha-1) because of the management protocol required by hybrid rice (Mataia et al., 2015), a dominant rice variety planted by most farmers in HYS (see chapter on Variety, seeds, and crop establishment). Overall differences in the mean rate of herbicide application can be attributed to the method of crop establishment used and the location-specific crop-weed situation. For example, the high usage of herbicide in some areas could mean that many farmers are still highly dependent on chemicals that require higher application rates (e.g., 2,4-D, 2-methyl-4-chlorophenoxyacetic acid [MCPA]) as in the case of farmers in Indonesia.
In terms of frequency of herbicide applications on the rice crop, Table 6.3 shows that, except for China during HYS, majority of farmers in all countries did not apply herbicides in the seedbed. Nevertheless, most of them applied herbicides in the main field, with at least one application per cropping season. In Thailand and Vietnam, rice farms appeared to be more intensively sprayed with herbicides as majority of the farmers had two or more applications per cropping season in their direct-seeded crops.

59
Table 6.3. Distribution of farmers (%), by number of herbicide applications, by country, and by season, crop year 2013-2014.
No. of applications
Philippines (Nueva Ecija)
China (Zhejiang)
Indonesia (West Java)
India (Tamil Nadu)
Thailand (SuphanBuri)
Vietnam (Can Tho)
(n=101) (n=100) (n=100) (n=102) (n=100) (n=100) High-yielding season
Seedbed0 92 32 91 98 - -1 8 68 9 2 - -
Main field0 16 5 10 34 1 21 65 80 65 63 21 442 18 12 22 3 62 493 1 2 3 0 12 54 0 1 0 0 3 0
>4 0 0 0 0 1 0
Low-yielding season Third season(n=100) (n=100) (n=100) (n=101) (n=100) (n=100) (n=100)
Seedbed0 89 - 94 96 - - -1 11 - 6 4 - - -
Main field0 25 1 7 38 1 1 11 68 70 70 61 8 24 282 7 29 18 1 82 60 493 0 0 4 0 8 13 184 0 0 0 0 0 2 4
>4 0 0 1 0 1 0 0Note: “-” indicates direct seeding was used (i.e., there was no seedbed).
In general, herbicides sprayed to control weeds in rice are grouped according to the stage in the cropping season when they are applied: pre-plant (no rice crop at all or during fallow period), pre-emergence (0–6 DAT/DAS), early post-emergence (7–15 DAT/DAS), and late post-emergence (>15 DAT/DAS) treatments (De Datta and Baltazar, 1996; E. Martin, PhilRice Supervising Science Research Specialist, pers. commun., 2015). Regardless of frequency of herbicide application, the majority of the first applications in the main field was done within 2 weeks of crop establishment (1–15 DAT/DAS) or during the vegetative stage in all countries per cropping season (Table 6.4). This means that most of the farmers applied either pre-emergence or early post-emergence herbicides in their fields. In Thailand and Vietnam, some farmers had more than one application during the vegetative stage, thus, the values reported exceeded one. This practice implies that a significant number of farmers in these countries applied pre-emergence herbicides, followed by an early post-emergence treatment in their farms. As to farmers with more than one application in each country in all seasons, they also applied late post-emergence herbicides during the maximum tillering stage (16–45 DAT/DAS).
Pesticide Use and Practices
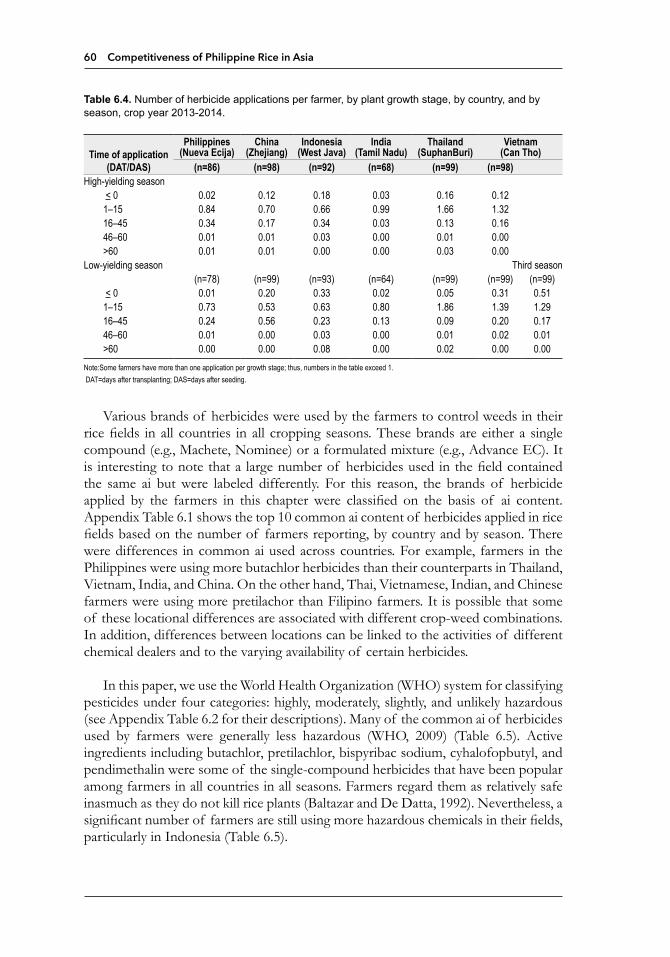
60 Competitiveness of Philippine Rice in Asia
Table 6.4. Number of herbicide applications per farmer, by plant growth stage, by country, and by season, crop year 2013-2014.
Time of application (DAT/DAS)
Philippines (Nueva Ecija)
China (Zhejiang)
Indonesia (West Java)
India (Tamil Nadu)
Thailand (SuphanBuri)
Vietnam (Can Tho)
(n=86) (n=98) (n=92) (n=68) (n=99) (n=98) High-yielding season < 0 0.02 0.12 0.18 0.03 0.16 0.12 1–15 0.84 0.70 0.66 0.99 1.66 1.32 16–45 0.34 0.17 0.34 0.03 0.13 0.16 46–60 0.01 0.01 0.03 0.00 0.01 0.00 >60 0.01 0.01 0.00 0.00 0.03 0.00Low-yielding season Third season
(n=78) (n=99) (n=93) (n=64) (n=99) (n=99) (n=99) < 0 0.01 0.20 0.33 0.02 0.05 0.31 0.51 1–15 0.73 0.53 0.63 0.80 1.86 1.39 1.29 16–45 0.24 0.56 0.23 0.13 0.09 0.20 0.17 46–60 0.01 0.00 0.03 0.00 0.01 0.02 0.01 >60 0.00 0.00 0.08 0.00 0.02 0.00 0.00Note:Some farmers have more than one application per growth stage; thus, numbers in the table exceed 1. DAT=days after transplanting; DAS=days after seeding.
Various brands of herbicides were used by the farmers to control weeds in their rice fields in all countries in all cropping seasons. These brands are either a single compound (e.g., Machete, Nominee) or a formulated mixture (e.g., Advance EC). It is interesting to note that a large number of herbicides used in the field contained the same ai but were labeled differently. For this reason, the brands of herbicide applied by the farmers in this chapter were classified on the basis of ai content. Appendix Table 6.1 shows the top 10 common ai content of herbicides applied in rice fields based on the number of farmers reporting, by country and by season. There were differences in common ai used across countries. For example, farmers in the Philippines were using more butachlor herbicides than their counterparts in Thailand, Vietnam, India, and China. On the other hand, Thai, Vietnamese, Indian, and Chinese farmers were using more pretilachor than Filipino farmers. It is possible that some of these locational differences are associated with different crop-weed combinations. In addition, differences between locations can be linked to the activities of different chemical dealers and to the varying availability of certain herbicides.
In this paper, we use the World Health Organization (WHO) system for classifying pesticides under four categories: highly, moderately, slightly, and unlikely hazardous (see Appendix Table 6.2 for their descriptions). Many of the common ai of herbicides used by farmers were generally less hazardous (WHO, 2009) (Table 6.5). Active ingredients including butachlor, pretilachlor, bispyribac sodium, cyhalofopbutyl, and pendimethalin were some of the single-compound herbicides that have been popular among farmers in all countries in all seasons. Farmers regard them as relatively safe inasmuch as they do not kill rice plants (Baltazar and De Datta, 1992). Nevertheless, a significant number of farmers are still using more hazardous chemicals in their fields, particularly in Indonesia (Table 6.5).

61
Table 6.5. Distribution of farmer-users, by hazard level of herbicide ai used, by country and by season, crop year 2013-2014.
Hazard levelPhilippines
(Nueva Ecija) China
(Zhejiang)Indonesia
(West Java)India
(Tamil Nadu)Thailand
(SuphanBuri)Vietnam
(Can Tho)(n=118) (n=191) (n=165) (n=72) (n=181) (n=152)
High-yielding seasonHighly hazardous 0 2 0 0 0 0Moderately hazardous 15 0 59 3 5 3Slightly hazardous 50 14 17 5 57 80Unlikely hazardous 35 84 24 92 38 17 Low-yielding season Third season
(n=96) (n=171) (n=174) (n=64) (n=175) (n=205) (n=200)Highly hazardous 0 2 0 2 0 0 0Moderately hazardous 22 0 64 0 2 8 4Slightly hazardous 56 1 19 59 65 67 78Unlikely hazardous 22 96 17 39 33 25 18
The most commonly used hazardous chemicals were the herbicides 2,4-D and MCPA. These two are moderately toxic and have been implicated in many health problems, in particular high incidences of skin diseases, polyneuropathy, and gastrointestinal disorders (Pingali and Marquez, 1996). Commercially formulated mixtures of pre-emergence and post-emergence herbicides such as butachlor+propanil and penoxulam+cyhalofopbutyl were also commonly used, given their wider spectrum of control, relative to a single compound (De Datta and Baltazar, 1996). In fact, the trend now in all countries in all seasons is to apply a mixture of two ai (either combined in a tank mix by farmers or as commercially formulated mixture) or to use these herbicides sequentially, with the pre-emergence treatment followed by a post-emergence treatment.
Insecticide use
Insecticides were the most common types of pesticides applied by farmers in all countries in all cropping seasons (Fig. 6.2). Nearly all farmers in China, Indonesia, Thailand, and Vietnam relied on insecticides in controlling their insect problems in all seasons. Some farmers in the Philippines (19% in HYS and 14% in LYS) and India (20% in HYS and 23% in LYS) preferred not to apply insecticides in their fields.
Pesticide Use and Practices

62 Competitiveness of Philippine Rice in Asia
Fig. 6.2. Percentage of insecticide users, by country and by season, crop year 2013-2014.
Although a substantial majority of farmers in all countries used insecticides, the mean kg ai applied by farmers per hectare varied considerably across countries (Table 6.2). Farmers in West Java had the highest usage of insecticides—2.38 and 2.78 kg ai ha-1 in HYS and LYS, respectively. After Indonesia, the next largest users of insecticides were farmers in China, India, Thailand, and Vietnam. In China, farmers used higher amounts of insecticides during HYS (1.85 kg ai ha-1) than during LYS (0.4 kg ai ha-1). The seasonal difference could be attributed to lower temperatures and a shorter growing season in the early rice crop (i.e., LYS), which result in less pest pressure (Moya et al., 2004). The dominant use of hybrid rice seeds in HYS also contributed to the high usage of insecticides in this country (Mataia et al., 2015). Farmers in the Philippines had the least amount of insecticide applied, with just about 0.3 kg ai ha-1 per cropping. Active efforts on IPM extension programs, which encourage less reliance on methods of chemical control, may be partially responsible for the lower usage of insecticides in this area (Moya et al., 2004).
Among the countries/seasons where the major crop establishment method is transplanting, majority of farmers in Indonesia and China (HYS) applied insecticides in the seedbed (Table 6.6). In the Philippines and India, most farmers did not do this.

63
Table 6.6. Distribution of farmers (%), by number of insecticide applications, by country, and by season, crop year 2013-2014.
No. of applications
Philippines (Nueva Ecija)
China (Zhejiang)
Indonesia (West Java)
India (Tamil Nadu)
Thailand (SuphanBuri)
Vietnam (Can Tho)
(n=101) (n=100) (n=100) (n=102) (n=100) (n=100) High-yielding season
Seedbed0 70 28 18 78 - -1 30 72 82 22 - -
Main field0 23 0 0 25 0 11 31 1 4 66 5 162 25 3 8 8 12 273 21 7 18 2 39 334 0 45 21 0 31 19
> 4 1 44 49 0 13 4 Low-yielding season Third season
(n=100) (n=100) (n=100) (n=101) (n=100) (n=100) (n=100)Seedbed
0 54 - 25 78 - - -1 46 - 75 22 - - -
Main field0 15 3 0 31 1 4 01 28 16 0 50 3 10 172 32 64 7 15 10 32 353 17 15 15 4 28 26 334 7 2 21 1 29 16 13
> 4 1 0 57 0 29 12 2Note: “-” indicates direct seeding was used (i.e., there was no seedbed).
Regardless of method of crop establishment, majority of the farmers applied insecticides in the main field (Table 6.6). Farmers in Indonesia intensively sprayed insecticides: most had four (or more than four) applications per cropping in both seasons. Similarly, farmers in China applied four times, on average, during HYS, although this frequency of application was lower in LYS. In Thailand and Vietnam, farmers sprayed, on average, four and three times in a cropping, respectively. Minimal users of insecticides such as the Filipino farmers averaged twice per cropping. In India, farmers typically applied only once per cropping, although the total amount applied was more than that in the Philippines.
Despite the differences in the frequency of application, majority of the farmers sprayed insecticides at maximum tillering (16–45 DAT/DAS) to prevent damage from leaf-feeding insects, particularly leaffolders (Table 6.7). Farmers believed that this insect causes rice yield loss even in the vegetative stage of the rice crop. Except in India and the Philippines, majority of the farmers in all other countries had more than one application of insecticides during this period (values reported are thus more than one). Some farmers, particularly those who applied more than three times, sprayed insecticides during the panicle initiation stage of the crop (46–60 DAT/DAS).
Pesticide Use and Practices

64 Competitiveness of Philippine Rice in Asia
Table 6.7. Number of insecticide applications per farmer, by plant growth stage, by country, and by season, crop year 2013-2014.
Timing (DAT/DAS)Philippines
(Nueva Ecija) China
(Zhejiang)Indonesia
(West Java)India
(Tamil Nadu)Thailand
(SuphanBuri)Vietnam
(Can Tho)
(n=81) (n=100) (n=100) (n=80) (n=100) (n=99)
High-yielding season <0 0.01 0.19 0.01 0.00 0.02 0.001–15 0.37 0.56 0.91 0.13 0.52 0.1516–45 0.99 1.86 2.39 0.89 1.31 1.7346–60 0.23 0.85 0.69 0.08 0.72 0.60>60 0.22 0.89 0.91 0.03 0.82 0.21
Low-yielding season Third season(n=86) (n=97) (n=100) (n=77) (n=99) (n=96) (n=100)
<0 0.00 0.02 0.03 0.00 0.00 0.07 0.011–15 0.41 0.27 0.98 0.12 0.63 0.25 0.1516–45 1.19 1.03 2.32 0.66 1.28 1.85 1.8046–60 0.24 0.40 0.82 0.22 0.73 0.58 0.42>60 0.19 0.31 0.89 0.12 1.19 0.14 0.10
Notes: Some farmers have more than one application per growth stage. Thus, the numbers in the table exceed 1.DAT=days after transplanting; DAS=days after seeding.
In general, the ai used by farmers varied across countries (see Appendix Table 6.3). These differences could be attributed to varying insect problems, activities of different chemical dealers, availability of certain insecticides, and extension efforts regarding pest management in these areas. Many of the common ai of insecticides used by farmers in all countries in all seasons were generally categorized as moderately hazardous (Table 6.8). Most of the highly hazardous insecticides belong to the group comprising organochlorine and organophosphate compounds. Examples are methyl parathion and monocrotophos (organophosphate) and endosulfan (organochlorine), which were already banned due to their toxicity (WHO, 2009).
Table 6.8. Distribution of farmer-users, by hazard level of insecticide common ai used, by country, and by season, crop year 2013-2014.
Hazard levelPhilippines
(Nueva Ecija) China
(Zhejiang)Indonesia
(West Java)India
(Tamil Nadu)Thailand
(SuphanBuri)Vietnam
(Can Tho)(n=118) (n=191) (n=165) (n=72) (n=181) (n=152)
High-yielding seasonHighly hazardous 0 2 0 0 0 0Moderately hazardous 15 0 59 3 5 3Slightly hazardous 50 14 17 5 57 80Unlikely hazardous 35 84 24 92 38 17
Low-yielding season Third season(n=96) (n=171) (n=174) (n=64) (n=175) (n=205) (n=200)
Highly hazardous 0 2 0 2 0 0 0Moderately hazardous 22 0 64 0 2 8 4Slightly hazardous 56 1 19 59 65 67 78Unlikely hazardous 22 96 17 39 33 25 18

65
The continuous use of these banned insecticide compounds is not totally due to their lower price compared with the more modern and safer compounds but also to their broad spectrum of pest toxicity. In addition, there were weaknesses in the enforcement and control of the use of these hazardous chemicals. In some cases, there were few alternatives available to farmers to control pest outbreaks. In Tamil Nadu, more than half of the farmers were using monocrotophos, which is classified as a highly hazardous insecticide (FAO-UN, 1997; WHO 2009). Some of them (11–18%) also used the moderately hazardous profenofos insecticide (PANNA, 2014). These insecticide compounds were popular because of their low price (Bordey et al., 2015) and broad spectrum of pest toxicity (Pham Van Toan, 2011). Since insecticides used in rice production are generally hazardous, farmer-users are very susceptible to pesticide-related illnesses. Rola and Pingali (1993) had reported some cases of hazardous effects on human health.
Fungicide use
Fungicide is another type of pesticides commonly used by farmers. In Vietnam, it was the major pesticide used by farmers (Beltran et al., 2015)—indeed, all Vietnamese farmers applied fungicides (Fig. 6.3). They had a high amount of fungicide usage with a mean application rate of more than 0.8 kg ai ha-1 in all seasons (Table 6.2). Many farmers (94–96%) in Thailand also applied fungicides, but they had a much lower application rate of just 0.19 kg ai ha-1 in one cropping. In Indonesia, most of the farmers (80–84%) reported using fungicides at about 0.3 kg ai ha-1.
Fig. 6.3. Percentage of fungicide users, by country and by season, crop year 2013-2014.
In China, fewer than half of the farmers used fungicides. However, their application rates were high, with a mean value of around 1.3 kg ai ha-1 during HYS and 0.7 kg ai ha-1 during LYS. In the Philippines and India, fungicides were used by about 30% of the farmers. There was a significant increase among Filipino fungicide users when compared with an almost zero application during the 1994-96 farm household survey (Launio et al., 2015). Farmers in India had a mean application rate of about 0.1 kg ai ha-1
, while farmers in the Philippines had the lowest rate, 0.05 kg ai ha-1 in a cropping (Table 6.2).
Pesticide Use and Practices

66 Competitiveness of Philippine Rice in Asia
Among farmers who used fungicides, the most common application frequency was one to two times per crop (although a majority of farmers in the Philippines, China, and India did not use them). Vietnam was the exception, where nearly all farmers applied fungicides three or more times. In all countries, fungicide application is mostly done starting from maximum tillering stage onward.
Molluscicide use
Molluscicide was used infrequently. No farmers in China and India and only 3% of farmers in Thailand applied molluscicides (Fig. 6.4). On the other hand, majority of farmers in Vietnam, the Philippines, and Indonesia used molluscicides. Farmers in Vietnam had the largest usage of molluscicide (1 kg ai ha-1), followed by Indonesia (0.4 kg ai ha-1); the Philippines had the lowest (0.3 kg ai ha-1) (Table 6.2). Although the amount of molluscicide used in the Philippines was relatively low, it remained the first or second (depending on the season) most commonly used pesticide in this area due to snail problems (Launio et al., 2015).
Fig. 6.4. Percentage of molluscicide users, by country and by season, crop year 2013-2014.
Most farmers who used molluscicides in Indonesia and the Philippines applied them only once in the main field per cropping. This was also true among users in Vietnam, although a substantial number had also applied two or more times. The application of molluscicides is usually done during the pre-plant stage in Indonesia. In the Philippines and Vietnam, majority of the farmer-users applied them during the vegetative stage. After the single application, farmers in the Philippines sporadically crushed the eggs and handpicked the remaining snails to prevent their spread in the field (Launio et al., 2015).
Rodenticide use
Rodenticides were the least used type of pesticides (Fig. 6.5). No farmers in China and only 10% of farmers in India and Thailand applied rodenticides. Rat problems were more dominant in the Philippines and Vietnam, where almost half of the farmers used rodenticides. In Indonesia, most farmers (60–64%) did not
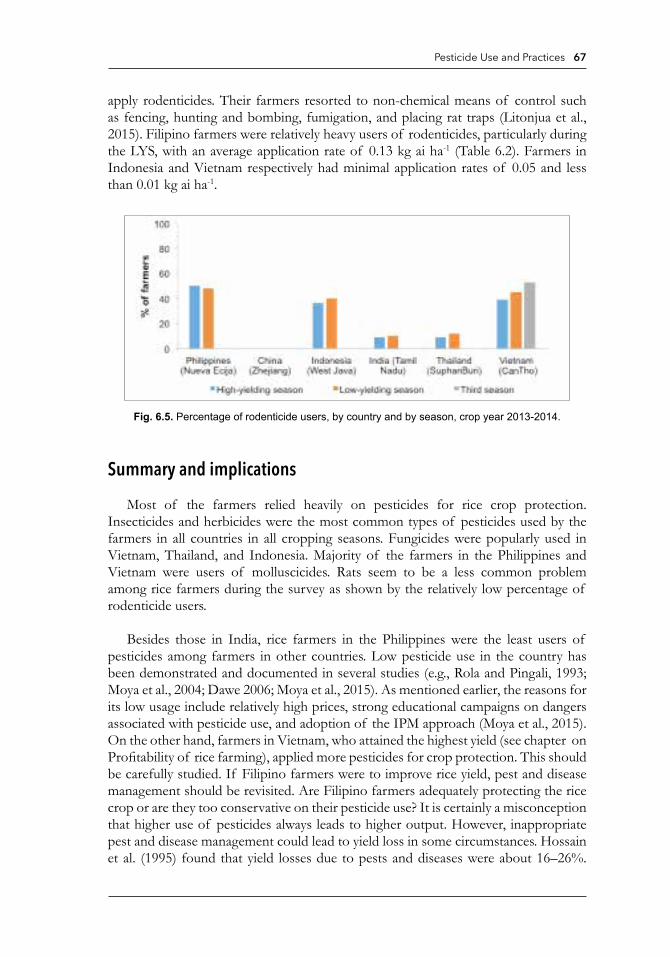
67
apply rodenticides. Their farmers resorted to non-chemical means of control such as fencing, hunting and bombing, fumigation, and placing rat traps (Litonjua et al., 2015). Filipino farmers were relatively heavy users of rodenticides, particularly during the LYS, with an average application rate of 0.13 kg ai ha-1 (Table 6.2). Farmers in Indonesia and Vietnam respectively had minimal application rates of 0.05 and less than 0.01 kg ai ha-1.
Fig. 6.5. Percentage of rodenticide users, by country and by season, crop year 2013-2014.
Summary and implications
Most of the farmers relied heavily on pesticides for rice crop protection. Insecticides and herbicides were the most common types of pesticides used by the farmers in all countries in all cropping seasons. Fungicides were popularly used in Vietnam, Thailand, and Indonesia. Majority of the farmers in the Philippines and Vietnam were users of molluscicides. Rats seem to be a less common problem among rice farmers during the survey as shown by the relatively low percentage of rodenticide users.
Besides those in India, rice farmers in the Philippines were the least users of pesticides among farmers in other countries. Low pesticide use in the country has been demonstrated and documented in several studies (e.g., Rola and Pingali, 1993; Moya et al., 2004; Dawe 2006; Moya et al., 2015). As mentioned earlier, the reasons for its low usage include relatively high prices, strong educational campaigns on dangers associated with pesticide use, and adoption of the IPM approach (Moya et al., 2015). On the other hand, farmers in Vietnam, who attained the highest yield (see chapter on Profitability of rice farming), applied more pesticides for crop protection. This should be carefully studied. If Filipino farmers were to improve rice yield, pest and disease management should be revisited. Are Filipino farmers adequately protecting the rice crop or are they too conservative on their pesticide use? It is certainly a misconception that higher use of pesticides always leads to higher output. However, inappropriate pest and disease management could lead to yield loss in some circumstances. Hossain et al. (1995) found that yield losses due to pests and diseases were about 16–26%.
Pesticide Use and Practices

68 Competitiveness of Philippine Rice in Asia
Inept weed management could lead to a 10–15% yield penalty (Ampong-Nyarko and De Datta, 1991; Oerke, 2006). High weed populations are commonly observed in most Philippine rice farms (Beltran et al., 2011). Weeds should be prevented or controlled earlier as its injury is more at the early stage of the rice crop.
Pesticide use can increase rice production through the reduction of pests and diseases and related crop losses. On the other hand, continuous reliance on pesticides poses a serious threat to both the ecosystem and human health. It could also bring about the buildup pesticide resistance, pest resurgence, and increased incidence of pest outbreaks in the future. For weeds alone, Valverde et al. (2000) found 30 weed species in rice that are already herbicide-resistant throughout the world, particularly to propanil and sulfonylurea compounds. Vietnam and Thailand, the major exporters of rice, were heavy users of pesticides. In fact, farmers in Vietnam applied more pesticides than necessary (Huan et al., 2005). These countries are now facing serious challenges with respect to the amount and toxicity of pesticides used. Nonetheless, these countries are the major sources of the Philippines’ imported rice. Accordingly, the Philippine government should enforce testing for pesticide residue of all imported rice to protect its citizens.
Farmers in the Philippines, like those in other countries, generally applied moderately toxic pesticides. Human pesticide poisoning and illnesses are evidently the highest price paid for pesticide use (Pham Van Hoi et al., 2013). There are efforts to restrict the import and sale of highly toxic chemicals in the country. However, enforcement and adoption of these regulations in the pesticide market have taken time (Norton et al., 2010). The government should strongly act on this by being more strict in the implementation and enforcement of these regulations. Highly toxic chemicals should be strictly banned in the country in favor of safer chemicals. Moreover, IPM or non-chemical agriculture promotion programs should still be disseminated and promoted in order to sustain the low and declining use of pesticides in the country. Sustainable IPM programs are location-specific and require community participation in their design and implementation.
References
Ampong-Nyarko K, De Datta SK. 1991. A handbook for weed control in rice. Manila (Philippines): International Rice Research Institute.
Baltazar AM, De Datta SK. 1992. Weed management in rice. Weed Abstracts 41: 495-508.
Beltran JC, Pannell DJ, Doole G J, White B. 2011. Economic implications of herbicide resistance and high labour costs for management of annual barnyardgrass (Echinochloa crus-galli) in Philippine rice farming systems. Crop Protection. 31: 31-39.
Beltran JC, Relado RZ, San Valentin MRL, Tulay EV, Bordey FH, Moya PF, Truong TNC. 2015. Snapshot of Vietnam’s rice production systems in irrigated areas: the Mekong River Delta experience. Science City of Muñoz (Philippines): Philippine Rice Research Institute, and Los Baños (Philippines): International Rice Research Institute. 27 p.

69
Bordey FH, Marciano EB, Yusongco CG, Besenio JRH, Karunakaran KR, Moya PF. 2015. Revisiting intensive rice cultivation in irrigated areas: the case of Tamil Nadu, India. Science City of Muñoz (Philippines): Philippine Rice Research Institute and Los Baños (Philippines): International Rice Research Institute. 21 p.
Dawe DC. 2006. A second green revolution in the Philippines: insecticide use on rice declines to a low level. In: Dawe D, Moya P, Casiwan C, eds. Why does the Philippines import rice? Meeting the challenge of trade liberalization. Manila (Philippines): International Rice Research Institute and Philippine Rice Research Institute. P 85-88.
De Datta SK, Baltazar AM. 1996. Integrated weed management in rice in Asia. In: Naylor R, ed. Herbicides in Asian rice: transitions in weed management. Palo Alto (California): Institute for International Studies, Stanford University, and Manila (Philippines): International Rice Research Institute. p 145-166.
Escalada MM, Heong KL. 2004. A participatory exercise for modifying rice farmers’ beliefs and practices in stem borer loss assessment. Crop Protection. 24: 11-17.
FAO-UN−Food and Agriculture Organization of the United Nations. 1997. Monocrotophos. http://www.fao.org/ docrep/w5715e/w5715e04.htm. February 15, 2016.
Heong K, Escalada MM. 1997. A comparative analysis of pest management practices of rice farmers in Asia. In: Heong KL, Escalada MM. eds. Pest management of rice farmers in Asia. Manila (Philippines): International Rice Research Institute. p 227-245.
Hossain M, Gascon F, Revilla I. 1995. Constraints to growth in rice in the Philippines. Journal of Agricultural Economics and Development. 33.
Huan NH, Thiet LV, Chien HV, Heong KL. 2005. Farmers’ participatory evaluation of reducing pesticides, fertilizers, and seed rates in rice farming in the Mekong Delta, Vietnam. Crop Prot. 24: 457-464.
Launio CC, Redondo GO, Tabalno RF, Bordey FH, Moya PF. 2015. Is the Philippines’ leading rice-producing province faring good enough? The case of rice farming in Nueva Ecija. Science City of Muñoz (Philippines): Philippine Rice Research Institute and Los Baños (Philippines): International Rice Research Institute. 24 p.
Litonjua AC, Wardana P, Paran SJC, Valencia MSD, Macalintal FM, Bordey FH, Moya PF. 2015. Socioeconomic and technological profile of a semi-mechanized rice production system: The case of West Java, Indonesia. Science City of Muñoz, Nueva Ecija (Philippines): Philippine Rice Research Institute, and Los Baños (Philippines): International Rice Research Institute. 24 p.
Manalili RG, Marciano EB, Viray CA, Tanzo IR, Bordey FH, Moya PF. 2015. The Thailand rice economy under the government rice-pledging scheme: The case of Suphan Buri. Science City of Muñoz (Philippines): Philippine Rice Research Institute and Los Baños (Philippines): International Rice Research Institute. 26 p.
Marsh SP, LLewellyn RS, Casimero MC, Cataquiz GC. 2005. Direct-seeding of rice and herbicide use in the Philippines: implications for weed management. Paper presented at the 49th Australian Agricultural and Resource Economics Society Conference, 8-11 February 2005, Coffs Harbour, New South Wales, Australia.
Mataia AB, Valencia MSD, Malasa RB, Milanes MBA, Bordey FH, Moya PF, Xianghai D, Xueping H. 2015. Rice production in the midst of economic development: the case of Jinhua, Zhejiang, China. Science City of Muñoz (Philippines): Philippine Rice Research Institute and Los Baños (Philippines): International Rice Research Institute. 25 p.
Moody K. 1996. Economic and technological influences on herbicide use in the less developed countries of Asia. In: Naylor R, ed. Herbicides in Asian rice: transitions in weed management. Palo Alto (California): Institute for International Studies, Stanford University, and Manila (Philippines): International Rice Research Institute. p 233-242.
Pesticide Use and Practices

70 Competitiveness of Philippine Rice in Asia
Moya PF, Dawe D, Pabale D, Tiongco M, Chien NV, Devarajan S, Djatiharti A, Lai NX, Niyomvit L, Ping HX, Redondo G, Wardana P. 2004. The economics of intensively irrigated rice in Asia. In: Dobermann A, Witt C, Dawe D, eds. Increasing productivity of intensive rice systems through site-specific nutrient management. Enfield, N.H. (USA): Science Publishers, Inc., and Los Baños (Philippines): International Rice Research Institute. p 29-58.
Moya PF, Kajisa K, Barker R, Mohanty S, Gascon F, San Valentin MR. 2015. Changes in rice farming: insights from five decades of a household-level survey. Los Baños (Philippines): International Rice Research Institute. 145 p.
Norton GW, Heong KL, Johnson D, Savary S. 2010. Rice pest management: issues and opportunities. In: Pandey S, Byerlee D, Dawe D, Dobermann A, Mohanty S, Hardy B, eds. Rice in the global economy: strategic research and policy issues for food security. Los Baños (Philippines): International Rice Research Institute. p 297-332.
Oerke EC. 2006. Crop losses to pest. Journal of Agricultural Science. 144: 31-43.
Pham Van Hoi, Mol A, Oosterveer P. 2013. State governance of pesticide use and trade in Vietnam. NJAS-Wageningen Journal of Life Sciences. 67: 19-26.
Pham Van Toan. 2011. Pesticide use and management in the Mekong Delta and their residues in surface and drinking water. PhD dissertation, United Nations University, Bonn, Germany.
PANNA−Pesticide Action Network of North America. 2014. Profenofos. http://www.pesticideinfo.org/Detail_Chemical.jsp?Rec_Id=PC34257#Toxicity. February 15, 2016.
Pingali PL, Hossain M, Gerpacio RV. 1997. Asian rice bowls: the returning crisis? CAB International in association with International Rice Research Institute (IRRI), Philippines.
Pingali PL, Marquez CB. 1996. Herbicide and rice farmer health: a Philippine study. In: Naylor R, ed. Herbicides in Asian rice: transitions in weed management. Palo Alto (California): Institute for International Studies, Stanford University, and Manila (Philippines): International Rice Research Institute. p 55-68.
Rola AC, Pingali, PL. 1993. Pesticides, rice productivity, and farmers’ health: an economic assessment. Los Baños, Laguna (Philippines): International Rice Research Institute, and Washington, D. C. (USA): World Resources Institute.
Valverde BE, Riches CR, Caseley JC. 2000. Prevention and management of herbicide-resistant weeds in rice: experiences from Central America with Echinochloa colona. Cartago (Costa Rica): S. A. Grafos.
WHO-World Health Organization. 2009. The WHO recommended classification of pesticides by hazard and guidelines to classification 2009. http://www.who.int/ipcs/publications/pesticides_hazard_2009.pdf. December 15, 2015.

71
Active
Ingred
ient
Freq.
%Act
ive Ing
redien
tFre
q.%
Active
Ingred
ient
Freq.
%Act
ive Ing
redien
tFre
q.%
Active
Ingred
ient
Freq.
%Act
ive Ing
redien
tFre
q.%
I. High
-yield
ing se
ason
Butac
hlor
2925
Bensu
lfuron
-meth
yl88
462,4
-D Dim
ethyl A
mine
5332
Pretila
chlor
2839
Pyribe
nzoxim
4223
Pretila
chlor
8455
Pyribe
nzoxim
1614
Peen
oxsula
m55
29Me
tsulfu
ron-m
ethyl
3320
Oxadi
argyl
1419
Pretila
chlor
2916
Butac
hlor 27
.5% + P
ropani
l 27.5%
149
2,4-D
IBE14
12Pre
tilachl
or14
7Gly
phosa
te26
16Me
tsulfu
ron-m
ethyl +
Chlor
imuro
n-ethy
l11
15Bu
tachlo
r + Pro
panil
2112
Pend
imeth
alin13
9Bu
tachlo
r + Pro
panil
1412
Cyhalo
fop-bu
tyl13
7Me
tsulfu
ron-m
ethyl 0
.7% + C
hlorim
uron-e
thyl
2113
Bensu
lfuron
-meth
yl 0.6%
+ Pret
ilachlo
r5
7Gly
phosa
te Iso
propyl
ammo
nium
179
Peno
xsulam
10% +
Cyhal
ofop-b
utyl 50
%12
8MC
PA14
12Gly
phosa
te7
4Par
aquat
2012
Butac
hlor
46
Butac
hlor
148
Bispyr
ibac S
odium
85
Bispyr
ibac S
odium
108
Bispyr
ibac S
odium
32
Triasu
lfuron
64
Pyrazo
sulfur
on3
4Pro
panil
127
Quinc
lorac
64
Pretila
chlor
76
Butac
hlor
32
Dicam
ba Aci
d + 2,4
-Dichl
oroph
enoxy
acetic
Acid
32
Dicofo
l2
3Bis
pyriba
c Sod
ium11
62,4
-Dichl
oroph
enoxy
acetic
Acid
53
Cyhalo
fop-bu
tyl6
5Dic
hlorvo
s3
2Po
tassiu
m MCP
A2
1Dim
ethoat
e2
3Clo
mazon
e 12%
+ Prop
anil 27
% + Gl
yphosa
te5
3Bu
tachlo
r4
3Thi
oben
carb +
2,4-D
IBE3
3MC
PA
32
Etofen
prox
11
Glyph
osate
23
Peno
xsulam
42
Cyhalo
fop-bu
tyl2
1Me
tsulfu
ron-m
ethyl
22
Chlor
antran
iliprol
e1
1Bis
pyriba
c Sod
ium1
1Po
tassiu
m Salt
of Fa
tty Ac
ids4
2Eth
oxysul
furon
20g/l
+ Fen
oxapro
p-P-et
hyl2
1
II. Low
-yield
ing se
ason
Freq.
%Act
ive Ing
redien
tFre
q.%
Active
Ingred
ient
Freq.
%Act
ive Ing
redien
tFre
q.%
Active
Ingred
ient
Freq.
%Act
ive Ing
redien
tFre
q.%
Butac
hlor
2728
Peno
xsulam
7343
2,4-D
Dimeth
yl Ami
ne59
34Pre
tilachl
or27
42Pyr
ibenzo
xim42
24Pre
tilachl
or98
482,4
-D IBE
1415
Bensu
lfuron
-meth
yl46
27Gly
phosa
te28
16Me
tsulfu
ron-m
ethyl+
Chlor
imuro
n-ethy
l9
14Pre
tilachl
or27
15Bis
pyriba
c Sod
ium19
9Bu
tachlo
r + Pro
panil
1415
Cyhalo
fop-bu
tyl32
19Me
tsulfu
ron-m
ethyl
2816
Oxadi
argyl
711
Butac
hlor
2514
Butac
hlor 27
.5% + P
ropani
l 27.5%
157
Pyribe
nzoxim
1213
Bispyr
ibac S
odium
116
Paraqu
at26
15Pyr
azosul
furon
711
Butac
hlor +
Propan
il22
13Qu
inclor
ac14
7MC
PA7
7Me
tamifo
p4
2Me
tsulfu
ron-m
ethyl 0
.7% + C
hlorim
uron-e
thyl
2514
Bispyr
ibac S
odium
46
Glyph
osate
Isopro
pylam
moniu
m16
92,4
-Dichl
oroph
enoxy
acetic
Acid
136
Thiob
encar
b + 2,4
-D IBE
77
Bensu
lfuron
36% +
Metol
achlor
4%2
1Clo
mazon
e 12%
+ Prop
anil 27
% & Gl
yphosa
te2
1Bu
tachlo
r4
6Pro
panil
95
Peno
xsulam
10% +
Cyhal
ofop-b
utyl 50
%13
6Cyh
alofop
-butyl
66
Butac
hlor
21
Triasu
lfuron
21
Bensu
lfuron
-meth
yl + Pr
eitich
lor 6%
GR4
6Bis
pyriba
c Sod
ium7
4Eth
oxysul
furon
20g/l
+ Fen
oxapro
p-P-et
hyl8
4Nic
losam
ide Eth
anolam
ine Sa
lt5
5Pyr
azosul
furon
-ethyl
11
Aceph
ate1
1Ma
ncozeb
12
Cloma
zone 1
2% + P
ropani
l 27% +
Glyph
osate
74
Pend
imeth
alin5
2Bis
pyriba
c Sod
ium3
3Dic
amba
Acid +
2,4-Di
chloro
phen
oxyace
tic Aci
d 1
1Mo
nocro
topho
s1
2Po
tassiu
m Salt
of Fa
tty Ac
ids7
4Bu
tachlo
r4
2Pre
tilachl
or1
1End
osulfa
n1
1Im
idaclo
prid
32
Pyrazo
sulfur
on-et
hyl 10
%4
2
III. Th
ird se
ason
Freq.
%Pre
tilachl
or95
48Gly
phosa
te25
13Pe
noxsu
lam 10
% + Cy
halofo
p-buty
l 50%
158
Bispyr
ibac S
odium
137
Butac
hlor 27
.5% + P
ropani
l 27.5%
116
Quinc
lorac
116
2,4-Di
chloro
phen
oxyace
tic Aci
d8
4Pe
ndim
ethalin
74
Butac
hlor
63
Ethoxy
sulfur
on 20
g/l + F
enoxa
prop-P
-ethyl
53
Vietna
m (Can
Tho)
Philip
pines
(Nueva
Ecija)
Ch
ina (Zh
ejiang
)Ind
onesi
a (West
Java)
India (
Tamil N
adu)
Thailan
d (Sup
hanBu
ri)
App
endi
x Ta
ble
6.1.
Top
10
com
mon
her
bici
de a
ctiv
e in
gred
ient
s us
ed b
y fa
rmer
s, b
y co
untry
and
by
seas
on, c
rop
year
201
3-20
14.
Pesticide Use and Practices

72 Competitiveness of Philippine Rice in Asia
Appendix Table 6.2. The WHO-recommended classification of pesticides, by hazard level, 2009.
Description used WHO classification
LD50 for the rat(mg/kg body weight)
Oral Dermal
Highly hazardous IExtremely hazardous (IA) <5 <50
Highly hazardous (IB) 5-50 50-200Moderately hazardous II Moderately hazardous 50-2000 200-2000
Slightly hazardous III Slightly hazardous Over 2000 Over 2000Unlikely hazardous IV/U Unlikely to present acute hazard 5000 or higher
Source: WHO (2009)

73
App
endi
x Ta
ble
6.3.
Top
10
com
mon
inse
ctic
ide
activ
e in
gred
ient
s us
ed b
y fa
rmer
s, b
y co
untry
and
by
seas
on, c
rop
year
201
3-20
14.
Activ
e Ing
redien
tFre
q.%
Activ
e Ing
redien
tFre
q.%
Activ
e Ing
redien
tFre
q.%
Activ
e Ing
redien
tFre
q.%
Activ
e Ing
redien
tFre
q.%
Activ
e Ing
redien
tFre
q.%
I. High
-yield
ing se
ason
Cype
rmeth
rin54
29Ch
loran
tranil
iprole
369
45Dim
ehyp
o24
122
Mono
crotop
hos
6858
Abam
ectin
126
36Qu
inalph
os47
18Ch
lorpy
rifos
+ BPM
C41
22Flu
bend
iamide
6.7%
+ Aba
mecti
n 3.3%
134
16Bu
profez
in19
318
Profen
ofos
1311
Chlor
pyrif
os58
17Ind
oxaca
rb45
17Be
ta-cyp
ermeth
rin24
13Im
idaclo
prid
134
16Eto
fenpro
x73
7Ca
rbofur
an4
3Flu
bend
iamide
257
Pyme
trozin
e39
15Ch
loran
tranil
iprole
+ Thia
metho
xam
2011
Chlor
pyrif
os33
4Ch
loran
tranil
iprole
696
Manc
ozeb
43
Cype
rmeth
rin20
6Ch
loran
tranil
iprole
+ Thia
metho
xam
2710
Beta-
cyflut
hrin
105
Emam
ectin
Benz
oate
+ Hex
aflum
uron
243
Acep
hate
666
Chlor
pyrif
os3
3Th
iameth
oxam
165
Fipron
il27
10Iso
procar
b10
5Dic
hlorvo
s19
2Ca
rbofur
an66
6Cy
perm
ethrin
4% + P
rofen
ofos 4
0%3
3No
n-ion
ic Surf
actan
t12
3Ab
amec
tin16
6Lam
bda-c
yhalo
thrin
74
Jiang
angm
ycin
182
Chlor
antra
nilipr
ole + T
hiame
thoxa
m48
4Dic
ofol
33
Chlor
antra
nilipr
ole10
3Ca
rbosu
lfan 2
0% + C
hlorfl
uazu
ron 5%
125
MIPC
(Isop
rocarb
)7
4Ca
rtap H
CL16
2BP
MC (F
enob
ucarb
)47
4En
dosu
lfan
33
Indox
acarb
82
Emam
ectin
Benz
oate
93
Carbo
furan
53
Flube
ndiam
ide16
2Im
idaclo
prid
464
Perm
ethrin
(36.8
%)3
3Ca
rbosu
lfan
72
Perm
ethrin
93
Chlor
antra
nilop
role
42
Pyme
trozin
e16
2Cy
perm
ethrin
424
Carbe
ndazi
m2
2Ch
lorpy
rifos
+ Cyp
ermeth
rin7
2Flu
bend
iamide
62
II. Lo
w-yie
lding
seaso
nFre
q.%
Activ
e Ing
redien
tFre
q.%
Activ
e Ing
redien
tFre
q.%
Activ
e Ing
redien
tFre
q.%
Activ
e Ing
redien
tFre
q.%
Activ
e Ing
redien
tFre
q.%
Cype
rmeth
rin66
29Ch
loran
tranil
iprole
116
46Dim
ehyp
o27
525
Mono
crotop
hos
5250
Abam
ectin
119
31Qu
inalph
os83
23Ch
lorpy
rifos
+ BPM
C55
24Flu
bend
iamide
6.7%
+ Aba
mecti
n 3.3%
5321
Bupro
fezin
163
15Pro
fenofo
s19
18Ch
lorpy
rifos
5314
Fipron
il40
11Be
ta-cyp
ermeth
rin23
10Im
idaclo
prid
3815
Chlor
antra
nilipr
ole82
7Ph
osph
amido
n5
5Cy
perm
ethrin
4111
Abam
ectin
267
Chlor
antra
nilipr
ole + T
hiame
thoxa
m14
6Ch
lorpy
rifos
135
Acep
hate
777
Carbo
furan
44
Flube
ndiam
ide37
10Ch
loran
tranil
iprole
+ Thia
metho
xam
267
Carbo
furan
104
Jiang
angm
ycin
94
Etofen
prox
696
Chlor
pyrif
os3
3Din
otefur
an23
6Ind
oxaca
rb17
5Iso
procar
b9
4Em
amec
tin Be
nzoa
te + H
exafl
umuro
n7
3Fip
ronil
575
Thiam
ethox
am3
3Th
iameth
oxam
226
Carbo
sulfa
n 20%
+ Chlo
rflua
zuron
5%11
3Lam
bda-c
yhalo
thrin
94
Abam
ectin
52
Chlor
antra
nilipr
ole + T
hiame
thoxa
m49
4Dic
hlorvo
s2
2Fip
ronil
144
Carta
p9
3Ch
loran
tranil
iprole
84
Flube
ndiam
ide3
1Ca
rbofur
an44
4En
dosu
lfan
22
Chlor
antra
nilipr
ole12
3Em
amec
tin Be
nzoa
te9
3Me
thomy
l6
3Tri
azoph
os3
1Im
idaclo
prid
353
Flube
ndiam
ide2
2Ch
lorpy
rifos
+ Cyp
ermeth
rin12
3Fe
nobu
carb
93
Beta-
cyflut
hrin
52
Isocar
boph
os2
1BP
MC (F
enob
ucarb
)34
3Ma
ncoz
eb2
2Ind
oxaca
rb10
3Pe
rmeth
rin8
2
III. Th
ird se
ason
Freq.
%Qu
inalph
os58
22Fip
ronil
4517
Chlor
antra
nilipr
ole + T
hiame
thoxa
m33
12Ab
amec
tin32
12Ind
oxaca
rb17
6Ca
rtap
156
Pyme
trozin
e15
6Cy
perm
ethrin
5.5%
+ Chlo
rpyrif
os-et
hyl
114
Emam
ectin
Benz
oate
93
Fipron
il 160
g/L +
Chlor
fluazu
ron 10
0 g6
2
Vietna
m (Ca
n Tho
)Ph
ilippin
es (N
ueva
Ecija
) Ch
ina (Z
hejia
ng)
Indon
esia
(Wes
t Java
)Ind
ia (Ta
mil N
adu)
Thail
and (
Suph
anBu
ri)
Pesticide Use and Practices

74 Competitiveness of Philippine Rice in Asia

LABOR AND MECHANIZATIONAlice B. Mataia, Ronell B. Malasa, Jesusa C. Beltran, Flordeliza H. Bordey, Cheryll C. Launio, Aileen C. Litonjua, Rowena G. Manalili, and Piedad F. Moya
Key messages:• Total labor use in rice production exceeds 65 man-days per hectare in the labor-
intensive countries (Philippines, Indonesia, India), but it is substantially less in the highly mechanized countries (China, Thailand, Vietnam) at roughly 10-20 man-days per hectare.
• Hired labor accounts for the bulk of labor use in labor-intensive countries, while own, family and exchange labor accounts for the bulk in highly mechanized countries.
• In the Philippines, the most labor-intensive crop operations are crop establishment and harvesting.
• Mechanization (use of combine-harvesters, four-wheel tractors, and possibly mechanical transplanters) can reduce total production cost and enhance competitiveness, as well as increase labor productivity for higher rural incomes.
Labor is one of the major inputs in rice cultivation and, as such, it accounts for a substantial proportion of total rice production cost (Launio et al., 2015). This could be attributed to either the high labor required to produce rice per hectare
or to high agricultural wages. As an economy develops, a general increase in wages ensues, particularly in the urban sector, resulting in rural-to-urban migration. Due to competition from urban and non-agricultural development, a growing scarcity of labor in the rice sector emerges, which drives up farm wages and labor cost. In Asian countries where this phenomenon is more pronounced, mechanization of rice production operations takes place, altering the structure of production cost and their competitiveness.
The burden to improve competitiveness becomes heavier as the Philippine rice market faces greater pressure to liberalize through the implementation of ASEAN integration in 2015 and the impending removal of quantitative restrictions in 2017 (see chapter on Can the Philippine rice compete globally?). Furthermore, a reduction in cost of production and an increase in productivity and efficiency of labor are essential to be competitive and to provide increased income for farmers and rural dwellers. The use of farm machinery increases labor productivity and efficiency through improved timeliness of operations. This further increases cropping intensity, reduces labor requirement and production costs, and improves the competitiveness of a country relative to other global market players.
7
75

76 Competitiveness of Philippine Rice in Asia
This chapter discusses the status of labor utilization and mechanization in Philippine rice production relative to other selected major rice-producing locations in Asia. Various labor arrangements are also described, and the implications for labor productivity are explained. The sample countries were classified into two groups: (1) labor-intensive countries and (2) highly mechanized countries. Labor-intensive countries are those with the highest labor utilization, namely Indonesia, India, and the Philippines. Highly mechanized countries are the least labor-using, which include China, Vietnam, and Thailand.
Labor use
The major farm activities in rice production consist of land preparation, crop establishment, crop care and maintenance, harvesting and threshing, and postharvest. Details of sub-activities involved in each are discussed in the chapter on The benchmark data: sources, concepts, and methods. Table 7.1 shows the total labor use in man-days (1 man-day=8 hours of work) per hectare in rice production by season, country, and major activity.
Table 7.1. Total labor use (md ha-1), by major activity and season, six Asian countries, crop year 2013-2014.
Activity Labor-intensive countries Highly mechanized countriesPhilippines Indonesia India China Thailand Vietnam
I. High-yielding season Total labor (md ha-1) 68.7 96.2* 78.3* 34.9* 9.7* 21.9* Land preparation 8.8 14.7* 5.5* 5.2* 1.8* 2.4* Crop establishment 20.7 21.7 32.7* 16.5* 0.9* 6.3* Crop care & maintenance 18.8 27.3* 37.5* 11.0* 6.3* 11.0* Harvesting and threshing 18.3 25.6* 2.0* 1.0* 0.7* 1.2* Postharvest 2.0 6.9* 0.6* 1.1* 0.0* 1.1*II. Low-yielding season Total labor (md ha-1) 70.5 93.6* 77.4 19.8* 11.1* 22.0* Land preparation 8.8 11.9* 4.9* 4.1* 1.8* 2.0* Crop establishment 24.2 25.8 37.1* 2.1* 1.2* 4.8* Crop care & maintenance 13.6 27.2* 32.7* 11.6 7.3* 12.4 Harvesting and threshing 22.2 25.5* 2.4* 1.0* 0.8* 1.7* Postharvest 1.6 3.3* 0.2* 1.1 0.0* 1.1III. Third season Total labor (md ha-1) 20.4ab
Land preparation 1.2ab
Crop establishment 5.4ab
Crop care & maintenance 10.8ab
Harvesting and threshing 1.8ab
Postharvest 1.2a
Note: Test of means is between specific country and the Philippines*Significantly different with Philippines at 95% confidence levela - Significantly different with HYS of Philippinesb - Significantly different with LYS of Philippines

77
Labor-intensive countries
The Philippines had significantly lower total labor use (69–71 md ha-1) than India (77–78 md ha-1) and Indonesia (94–96 md ha-1) in both seasons. Crop establishment in these three countries was quite laborious due to the prevalent practice of transplanting. Crop care and maintenance was high, particularly in India, due to the practice of manual weeding (Bordey et al., 2015). Meanwhile, harvesting and threshing were quite labor-intensive in the Philippines and Indonesia because of manual harvesting (Launio et al., 2015), unlike in India where the use of combine harvesters is popular (Bordey et al., 2015). In fact, quite a number of Indonesian farmers still employed manual threshing (Litonjua et al., 2015).
India’s labor use for land preparation (6 md) and harvesting and threshing (2 md) was significantly less than that in the Philippines, owing to the use of four-wheel tractors and combine harvesters. On the other hand, labor for almost all major activities in Indonesia was substantially greater than that in the Philippines. Litonjua et al. (2015) stated that all farmers in Indonesia used two-wheel tractors for land preparation and only 63–65% of them used axial threshers for threshing.
Highly mechanized countries
Labor use in highly mechanized countries such as China, Thailand, and Vietnam was significantly lower in both seasons than that in the Philippines. Thailand used the least labor in rice production, with only 10–11 md ha-1; followed by Vietnam, with 22 md ha-1; and China, with 20 and 35 md ha-1 during LYS and HYS, respectively. Some of the reasons for the relatively low labor use in these highly mechanized countries are the widespread use of machine (Table 7.2) such as four-wheel tractors and combine harvesters and the adoption of other labor-saving technologies such as direct seeding (Fig. 7.1). These lessened the labor requirement in rice production, consistent with the results of several farm-level studies (Cordova et al., 1981; Bautista, 1993; Estudillo and Otsuka, 2001; Jayasuriya et al., 1982 as cited in Moya et al., 2015).
The labor requirement for using a four-wheel tractor in land preparation was around 2 md ha-1 in Thailand and Vietnam. It was 4–5 md ha-1 in China since cleaning and repair of dikes and ditches were done manually, using about 3–4 md ha-1. For crop establishment, nearly all Thai farmers practiced direct seeding with some using engine-powered sprayers, thus employing only 0.9 md ha-1 (Manalili et al., 2015). Similarly, direct seeding requires only 2 md ha-1 in Vietnam. With the introduction of triple cropping, the transplanting method was changed to direct seeding in Vietnam. This is due to labor shortage arising from the overlap between harvest of the second crop and planting of the third crop (Beltran et al., 2015).
In China, direct seeding was used only during LYS when inbred rice was planted, while transplanting was used during HYS when they planted hybrid rice (Mataia et al., 2015). Manual transplanting required 17 md ha-1 compared to only 2 md ha-1 for direct seeding. This makes transplanting the most labor-intensive activity in China. Across
Labor and Mechanization

78 Competitiveness of Philippine Rice in Asia
Table 7.2. Percent adopters of machine, by season and country, crop year 2013-2014.
MachineLabor-intensive countries Highly mechanized countries
Philippines Indonesia India China Thailand VietnamI. High-yielding season Combine harvester 3 0 99 100 100 100 Axial thresher 97 63 1 0 0 0 Four-wheel tractor 0 0 53 74 55 76 Two-wheel tractor 98 96 71 27 84 24 Power sprayer 1 0 0 0 1 0 Mechanical transplanter 0 0 0 10 0 0II. Low-yielding season Combine harvester 5 0 99 100 100 100 Axial thresher 95 61 1 0 0 0 Four-wheel tractor 2 0 37 87 58 88 Two-wheel tractor 96 96 57 10 89 12 Power sprayer 1 0 1 0 3 0 Mechanical transplanter 0 0 0 0 0 0III. Third season Combine harvester 97 Axial thresher 3 Four-wheel tractor 84 Two-wheel tractor 16 Power sprayer 0 Mechanical transplanter 0
Fig. 7.1. Percent adopters of direct seeding, by country and season, crop year 2013-2014.
High-yielding season Low-yielding season Third season
Philippines Indonesia India China Thailand Vietnam
80
60
40
20
0
% u
sers
100

79
highly mechanized countries, the labor requirement for harvesting ranged from 0.7 to 1.8 md ha-1 with the smallest noted in Thailand and the biggest seen in Vietnam. Crop care and maintenance was observed to be the most labor-intensive activity in these countries.
Thailand had consistently the lowest labor use across countries in both seasons. Although there were three cropping seasons in Vietnam, their labor use per major activity in all seasons was almost similar. In China, labor requirement was higher in HYS due to adoption of hybrid rice technology.
Figures 7.2 and 7.3 show the share of major activities to total labor use across countries and seasons. The Philippines and Indonesia had similar structure of labor use: crop establishment, crop care and maintenance, and harvesting and threshing had the largest shares. This is similar to the setup in India, except that the share of harvesting and threshing became less important due to the use of combine harvesters. In China, crop establishment got the highest share during HYS because of transplanting of hybrid rice. Its crop care and maintenance got the biggest share during LYS, similar to those observed in Thailand and Vietnam.
Fig. 7.2. Percent distribution of labor, by major farm activity and by country in HYS, crop year 2013-2014.
Sources of labor
There are two types of labor source: (1) hired and (2) operator, family, and exchange (OFE) labor. Hired labor consists of farm workers who are hired either on a daily basis and paid with wages or on a contract basis and paid in cash or in kind. The in-kind payment is most common in the Philippines (Launio et al., 2015) and Indonesia (Litonjua et al., 2015) where complex labor arrangements are practiced. OFE labor is that provided by the farmer himself, his family members, and those who are “freely” provided by his neighbors with the promise of returning the favor when the need for farm hand arises. OFE labor is not paid for carrying out farm activities, but its cost is imputed based on the prevailing daily wage or contract rate per activity.
Labor and Mechanization
100
80
60
40
20
0
Phi
lippi
nes
Indo
nesi
a
Indi
a
Chi
na
Thai
land
Viet
nam
Land Preparation
Crop Establishment
Crop Care andMaintenance
Harvesting and Threshing
Postharvest
High-yielding season
% d
istri
butio
n

80 Competitiveness of Philippine Rice in Asia
Table 7.3 summarizes the sources of labor in selected major rice-producing countries in Asia, by season and by country group category. The data show that labor-intensive countries employed a higher proportion of hired labor than family labor in both seasons. Hired labor was usually used for transplanting, harvesting, and manual weeding as these are the more labor-intensive farm activities. The higher incidence of hiring labor can be explained by the relatively bigger farm size, large number of rural landless (Moya et al., 2004), aging farmers particularly in the Philippines (Moya et al., 2015), and peak of farm activities that can only be met by hired labor. In addition, the increasing opportunity of family labor outside the farm encourages them to focus on supervisory activities, which demand less time. Hence, farm workers are hired to do the time-consuming farm activities such as land preparation, transplanting, harvesting and threshing, and manual weeding (Bautista, 1993).
In contrast, OFE is the main source of labor in highly mechanized countries, except in Thailand in the LYS. The larger proportion of OFE labor in China (Mataia et al., 2015) and Vietnam (Beltran et al., 2015) can be explained by the small and equal distribution of landholdings. Further, China had relatively higher labor wages compared with other countries (see chapter on Costs of rice production). This can be attributed to high off-farm employment opportunities as a result of urbanization and rapid economic development.
Table 7.3. Percent distribution of labor source, by country and season, crop year 2013-2014.
CountryHigh-yielding season Low-yielding season Third season
Hired (%) OFE (%) Hired (%) OFE (%) Hired (%) OFE (%)Labor-intensivePhilippines 75.8 24.2 78.5 21.5India 86.0 14.0 90.7 9.3Indonesia 77.8 22.2 76.7 23.3Highly mechanizedChina 12.9 87.1 19.5 80.5Thailand 48.6 51.4 46.0 54.0Vietnam 33.6 66.4 31.8 68.2 33.7 66.3
Fig. 7.3. Percent distribution of labor, by major farm activity and by country in LYS, crop year 2013-2014.
100
80
60
40
20
0
Phi
lippi
nes
Indo
nesi
a
Indi
a
Chi
na
Thai
land
Viet
nam
Land Preparation
Crop Establishment
Crop Care andMaintenance
Harvesting and Threshing
Postharvest
low-yielding season
% d
istri
butio
n
81
Special labor arrangements
Some unique traditional labor arrangements were practiced in the Philippines (Launio et al., 2015) and Indonesia (Litonjua et al., 2015). Hiring of porsyentuhan and hunusan are common in the Philippines. Bawon, ceblokan, and tebasan are popular in Indonesia. The local labor demand and supply conditions influence the importance of these traditional labor-hiring practices as discussed below.
Porsyentuhan/Kasugpong
Porsyentuhan or kasugpong are farm workers who are hired permanently throughout the season and paid based on crop share (De la Cruz, 2007). They perform tasks such as seedbed preparation, cleaning and repair of dikes, and crop care and maintenance activities. They also assist the farmer operator in supervising crop establishment, harvesting and threshing, and hauling activities. According to Launio et al., (2015), they are usually paid in kind, amounting to 10% of the gross harvest. Bautista (1993) stated that porsyentuhan workers, compared with commonly hired laborers, had a more secure employment, they received other benefits such as food and interest-free loans. Farmer operators enter into this arrangement to motivate the worker to act as if he is a family member, thus lessening the encumbrance of supervision.
Hunusan
The hunusan refers to workers who harvest and thresh paddy and are paid in kind in terms of crop share. Payment for harvesters ranged from 7–14% of the gross harvest, which vary per season and location (Launio et al., 2015). In addition, a crop-share payment of 6–7% of the gross harvest is paid to the threshing service provider, including its machine operators. Farmer operators often enter into this agreement in order to minimize cash expenses during harvesting season.
Bawon
Bawon is a dominant crop-share labor arrangement for harvesting and threshing in the sample areas in Indonesia (Litonjua et al., 2015). Under this, harvesting is open to all groups of harvesters who carry out the task, regardless of number of workers. The standard share is between 10% and 20% of the total amount of harvest. In some cases, farmers contracted organized groups of laborers through their headman (Moya et al., 2004). According to Naylor (1990), the structure is basically the same throughout the Indonesian rice economy, although specific terms of arrangement may differ across locations.
Ceblokan
Ceblokan is another type of crop-share-based labor arrangement. Under this, laborers contracted for transplanting only receive payment after harvest. In return,
Labor and Mechanization

82 Competitiveness of Philippine Rice in Asia
they are assured of a job in harvesting and threshing activities. To encourage them to enter into this agreement, laborers often earn a bigger share of the harvest compared with the traditional open harvest system (Naylor, 1990). This system exists due to the limited off-farm job opportunities in rural areas.
Tebasan
Tebasan is an unusual marketing system in Indonesia where farmers sell their standing crop to traders or labor contractor (penebas), thereby shifting the cost of harvesting and threshing to them (Naylor, 1990). It was practiced by 14% and 21% of farmers in LYS and HYS, respectively (Litonjua et al., 2015). The trader or contractor employs his own group of laborers to harvest and thresh the paddy rice. During the bargaining process, the costs of harvesting and threshing are built into the price offered for the standing crop. Farmer operators enter into this arrangement to avoid the hassle of looking for harvesters and threshers and to have an assured market.
Mechanization
Labor use cannot be fully discussed without referring to mechanization as the two act as a substitute for each other. The level of mechanization differed across sample countries because of varying levels of economic development. Competition from urban and non-agricultural development has made rural labor scarce and costly in some Asian countries, particularly in China and Thailand. Most farmers in these countries outsourced the most power-intensive activities such as land preparation, and harvesting and threshing to custom mechanized service providers. Table 7.2 shows the percentage adoption of farm machinery in the six countries.
In the Philippines, only land preparation and threshing were mechanized, involving the use of two-wheel tractors and axial threshers, respectively (Launio et al., 2015). Very few farmers used four-wheel tractors for plowing and other land preparation activities. Adopters of combine harvesters were minimal, although it has become popular since its introduction in 2012. As of 2015, already 1,400 units of combine harvesters were dispersed nationwide (Engr. Badua, Head Agri-Infra Coordinating Unit of PhilMech, pers. commun., 2016). The increasing adoption of combine harvesters in the Philippines was attributed to economic benefits such as labor efficiency and reduction of postharvest losses (by around 2.2%).
Indonesia’s rice production system was the least mechanized among the six countries. Only land preparation was fully mechanized (two-wheel tractors were used). In addition, only about two-thirds of the farmers used power threshers; the other third used manual labor (Litonjua et al., 2015).
In India, nearly all farmers used combine harvesters for harvesting and threshing (Bordey et al., 2015). While the use of two-wheel tractors for land preparation was still popular in India, the use of four-wheel tractors is picking up. This could be attributed

83
to the bigger farm size in this country. This makes India the most mechanized among the labor-intensive countries.
Among the highly mechanized countries, Thailand had the most mechanized farm operations. Majority of farmers used a combination of two-wheel and four-wheel tractors for land preparation. All farmers also used combine harvesters for harvesting and threshing across seasons. They also had the most advanced model of combine harvester, which includes storage bins for the grains, thus eliminating the need for bagging and hauling. In addition, farmers also used engine-powered sprayers for direct seeding and pesticide application (Manalili et al., 2015).
Vietnam, the second lowest labor user, follows the practices in Thailand. Land preparation consisting of rotavating and leveling was performed using a combination of four-wheel and two-wheel tractors (Beltran et al., 2015). Similar to Thailand, all farmers used combine harvesters for harvesting and threshing, although the machine was not as advanced as that in Thailand. Some farmers in Vietnam also used engine-powered sprayers to apply pesticides
China’s land preparation, harvesting, and threshing were also completely mechanized. Majority of the farmers adopted four-wheel and two-wheel tractors and combine harvesters. In addition, some farmers (10%) used mechanical transplanters. To address the scarcity and increasing cost of manual labor, the Chinese government provided partial rebates on purchases of farm machinery to promote mechanization of the whole rice production farm operation (Mataia et al., 2015).
Labor productivity
Labor productivity is measured in terms of kg grain md-1 or the ratio of paddy yield (kg ha-1) to total man-days (md ha-1). Table 7.4 shows the differences in labor productivity across sample countries. Highly mechanized countries achieved significantly higher labor productivity than did labor-intensive countries. Thailand obtained the highest labor productivity with 533 kg md-1 in the HYS and 478 kg md-1 in the LYS. This was followed by Vietnam (391, 288, and 279 kg md-1), and China (214 and 307 kg md-1). The high labor productivity in these countries is primarily attributed to the lower labor use as a result of the adoption of direct seeding in crop establishment and mechanization of land preparation and harvesting and threshing. In addition, high yield also contributed to high labor productivity.
In contrast, the lower labor productivity in the Philippines, Indonesia, and India was attributed to the large labor input use, owing to the low level of mechanization and the relatively low yield, particularly in India. On average, respective HYS and LYS labor productivities were 83 kg md-1 in HYS and 55 kg md-1 in LYS in the Philippines; 64 kg md-1 and 58 kg md-1 in Indonesia; and 55 kg md-1 and 60 kg md-1 in India.
Labor and Mechanization

84 Competitiveness of Philippine Rice in Asia
Table 7.4. Labor productivity, by country and season, crop year 2013-2014.
Country Dry yield (14% MC in kg ha-1)
Total labor use (md ha-1)
Labor productivity (kg md-1)
I. High-yielding seasonPhilippines 5,680.2 68.7 82.7Indonesia 6,113.3 96.2 63.6India 4,323.1 78.3 55.2China 7,460.1 34.9 214.0Thailand 5,159.7 9.7 533.0Vietnam 8,560.2 21.9 391.4
II. Low-yielding season Philippines 3,839.9 70.5 54.5Indonesia 5,417.4 93.6 57.9India 4,603.4 77.4 59.5China 6,100.5 19.8 307.3Thailand 5,314.0 11.1 477.6Vietnam 6,333.4 22.0 287.8
III. Third seasonVietnam 5693.3 20.4 279.2
Summary and implications
Reducing labor cost is one of the main ways to improve competitiveness and increase labor productivity so that rural incomes can increase over the long run. It is possible to be highly competitive based on labor-intensive production that has low levels of labor productivity. But, in such a situation, people will not be wealthy. There are therefore two key problems with the low level of mechanization in the Philippines. First, it results in higher overall cost, which is what makes the Philippines less competitive. Second, and in many ways fundamentally different, low mechanization keeps labor productivity low and results in low rural incomes.
Thailand, Vietnam, and China are among the countries with high productivity of labor due to less use of labor input and highly mechanized farming operations. The use of combine harvesters requires only minimal labor input, thus saving time, labor, cost, and potentially reducing losses in harvesting and threshing activities. The common practice of direct seeding also reduces labor requirement in crop establishment. As a result, Thailand and Vietnam were able to produce rice more economically than did their counterparts because of their adoption of these labor-saving technologies. High level of labor productivity was observed to be one of the major sources of competitiveness in rice production in these countries.
In the Philippines, in spite of the mechanization program of the government, the level of mechanization was still low, possibly because farm labor or the rural landless are abundant in many areas of the country. Hence, the need for large machinery is rarely assessed. Although combine harvesters look promising in terms of adoption, the Philippines is still far behind Thailand, Vietnam, China, and India. One key reason for this is that rural population growth in the Philippines is much more rapid than in

85
neighboring countries—in fact, urbanization has stopped in the Philippines over the past two decades (Dawe, 2016).
Based on the experience of Thailand and Vietnam, mechanization has direct impacts on costs of production (see chapter on Costs of rice production) and labor productivity. Hence, the Philippines need to mechanize its labor-intensive operations to reduce labor input use, reduce costs, and thereby improve competitiveness and labor productivity. However, promoting the widespread adoption of combine harvesters must be supplemented with off-farm employment opportunities for displaced labor in areas where supply of labor is abundant.
Likewise, four-wheel tractors have limited use in the Philippines because of the high acquisition cost. Farmers’ organizations or cooperatives can be tapped to engage in providing custom land preparation services. By the use of contract services, farmers will improve their labor productivity without making any investment in acquiring big tractors. Moreover, the common practice of crop-share labor arrangement in the Philippines needs to be explored because this seems to have a large contribution to labor cost as this is based on the percentage of amount harvested. Vietnam, Thailand, China and India used fixed fees for their major operations.
Finally, the adoption of labor-saving technologies in the Philippines should be complemented by increasing land productivity in order to further increase labor productivity and competitiveness.
References
Bautista ED. 1993. The impact of technical change on rural labor markets in the Philippines. Journal of Philippine Development, No. 36, Vol. 20, No. 1.
Beltran JC, Relado RZ, San Valentin MRL, Tulay EV, Bordey FH, Moya PF, Truong TNC. 2015. A snapshot of Vietnam’s rice production systems in irrigated areas: The Mekong river delta experience. Science City of Muñoz, Nueva Ecija (Philippines): Philippine Rice Research Institute, and Los Baños (Philippines): International Rice Research Institute. 27 p.
Bordey FH, Marciano EB, Yusongco CG, Besenio JRH, Karunakaran KR, Moya PF. 2015. Revisiting intensive rice cultivation in irrigated areas: The case of Tamil Nadu, India. Science City of Muñoz, Nueva Ecija (Philippines): Philippine Rice Research Institute, and Los Baños (Philippines): International Rice Research Institute. 21 p.
Cordova V, Papag A, Sardido S, Yambao L. 1981. Changes in practices of rice farmers in Central Luzon, 1966-1979. Paper presented for the 12th Annual Scientific Meeting of the Crop Science Society of the Philippines, Bacnotan, La Union, 22-24 April 1981.
Dawe DC. 2016. Structural and agricultural transformation in Asia. Presentation at Forum on Food Security and Rural Development, Ateneo de Manila, April 26, 2016.
Dela Cruz AM. 2007. Contractual arrangements in agriculture (Northern and Central Luzon component). Discussion Paper Series No. 2007-21. Makati City (Philippines): Philippine Institute
Labor and Mechanization

86 Competitiveness of Philippine Rice in Asia
of Development Studies.
Estudillo J, Otsuka K. 2001. Has the Green Revolution ended? A review of long-term trends in MV adoption, rice yields, and rice income in Central Luzon, 1966-99. Japan Journal of Rural Economics.3:51-64.
Launio CC, Redondo GO, Tabalno RF, Bordey FH, Moya PF. 2015. Is the Philippines’ leading rice-producing province faring good enough? The case of rice farming in Nueva Ecija. Science City of Muñoz, Nueva Ecija (Philippines): Philippine Rice Research Institute, and Los Baños (Philippines): International Rice Research Institute. 24 p.
Litonjua AC, Wardana P, Paran SJC, Valencia MSD, Macalintal FM, Bordey FH, Moya PF. 2015. Socioeconomic and technological profile of a semi-mechanized rice production system: The case of West Java, Indonesia. Science City of Muñoz, Nueva Ecija (Philippines): Philippine Rice Research Institute, and Los Baños (Philippines): International Rice Research Institute. 25 p.
Manalili RG, Marciano EB, Viray CA, Tanzo IR, Bordey FH, Moya PF. 2015. The Thailand rice economy under the government rice-pledging scheme: The case of Suphanburi. Science City of Muñoz, Nueva Ecija (Philippines): Philippine Rice Research Institute, and Los Baños (Philippines): International Rice Research Institute. 26 p.
Mataia AB, Valencia MSD, Malasa RB, Milanes MBA, Bordey FH, Moya PF, Xianghai D, Xueping H. 2015. Rice production in the midst of economic development: The Case of Jinhua, Zhejiang, China. Science City of Muñoz, Nueva Ecija (Philippines): Philippine Rice Research Institute, and Los Baños (Philippines): International Rice Research Institute. 25 p.
Moya PF, Dawe D, Pabale D, Tiongco M, Chien NV, Devarajan S, Djatiharti A, lai NX, Niyomvit L, Ping HX, Redondo G, Wardana P. 2004. The economics of intensively irrigated rice in Asia. In: Dobermann A, Witt C, Dawe D, eds. Increasing productivity of intensive rice systems through site-specific nutrient management. Enfield, NH (USA): Science Publishers, Inc. and Los Baños (Philippines): International Rice Research Institute. p 29-58.
Moya P. Kajisa K. Barker R. Mohanty S, Gascon F, San Valentin MR. 2015. Changes in rice farming in the Philippines: Insights from five decades of a household-level survey. Los Baños (Philippines): International Rice Research Institute. 145 p.
Naylor R. 1990. The rural labor market in Indonesia. In: Pearson S. et al. Indonesian rice policy. Cornell Press. stanford.edu/group/FRI/indonesia/documents/ricebook/Output/chap5.html. February 17, 2016.

RICE YIELD AND ITS DETERMINANTSFlordeliza H. Bordey, Jesusa C. Beltran, Cheryll C. Launio, Aileen C. Litonjua, Alice B. Mataia, Rowena G. Manalili, and Piedad F. Moya
Key messages:• Yields per hectare varied substantially across countries. Other than India, the
Philippines has the lowest yields, especially in the wet season (low yielding season).
• Econometric analysis suggests that, holding other factors constant, the following factors lead to higher yields: use of hybrid seeds, more frequent splitting of fertilizer applications, increased training and education for farmers, (can be further updated once you have recalculated the impact of herbicides, insecticides and machine use using the one standard deviation (SD) approach). The econometric analysis also suggests the strong importance of site-specific factors that cannot be changed.
• The econometric analysis explains less than half of the variation in yields across farmers and seasons.
Yield or land productivity can be considered as one of the basic elements of competitiveness. Given the same cost per kilogram, it is important for a country to have many farmers with high yield to produce as much rice supply as possible to feed its growing population. The six countries considered in this study belong to the world’s 10 largest rice-producing countries. In spite of this fact, national average rice yield, at least in 2013, varied greatly (FAO, 2015). China has the highest yield at 6.72 t ha-1. Vietnam and Indonesia also have high yields, with 5.57 and 5.15 t ha-1, respectively. Interestingly, the two largest exporters have the lowest yields: Thailand has 3.13 t ha-1 and India has 3.66 t ha-1. Philippine average rice yield is somewhat in the middle, with 3.89 t ha-1.
Yield differences are attributed to a variety of factors. It could be environmental, technological, or even related to human capital (Bordey and Nelson, 2012). Environmental factors such as availability of irrigation water, soil fertility, and climate (e.g., rainfall, solar radiation, temperature) affect the growth of the rice plant (Centeno and Wassmann, 2010). These factors are commonly inherent in the location where the plant is grown. Technological factors such as seed quality, quantity of material inputs, and cultural management employed in raising the crop are mostly part of the production decisions of farmers. On the other hand, human capital such as education and training affect the management skills and efficiency of farmers.
This chapter aims to discuss the variation in rice yield across irrigated and intensively cultivated areas in Asia, with a view to providing recommendations on what can be done to improve rice yields in irrigated areas in the Philippines.
8
87
88 Competitiveness of Philippine Rice in Asia
Data and methods
To meet this objective, a production function was estimated to express yield as a function of various factors. The Cobb-Douglas functional form was used for its simplicity. Mathematically, the estimated model was written as
(1)
where y is yield (production per hectare); x’s are inputs used in production; z’s are variables representing environmental and human capital factors; e is the error term; a,b, and g are the coefficients to be estimated; i indicates the different sample farmers; j indicates the different inputs; n indicates different dummy variables; and t indicates different time periods. The inputs considered in the analysis were applied quantity of seed, nitrogen, phosphorus, potassium, and active ingredients of herbicide and insecticide. Aside from the material inputs, pre-harvest labor in terms of man-days (1 man-day=8 hours of work) was also included. Machine rental cost was added to account for mechanization. Size of area planted was also included to determine if farmers who have bigger areas also have higher yields.
The effects of environmental variables were approximated by adding dummy variables for season and location (i.e., country). Generally, crop seasons in each country were classified into high-yielding and low-yielding (see chapter on The benchmark data: sources, concepts, and methods). The location variable was added to capture the effects of unobserved inherent characteristics of the soil and prevailing climate in the area.
Seed technology was also captured using dummy variables on hybrid and tagged inbred seeds. Hybrid rice yield was claimed to be higher than inbred varieties because of the hybrid vigor phenomenon obtained from raising commercial crops from F1 seeds (Virmani and Sharma, 1993). The use of tagged inbred seeds or those that underwent formal quality certification is also supposed to improve yield due to more robust seedlings and higher germination rate compared with seeds from farmers’ harvest (see chapter on Variety, seeds, and crop establishment).
Although the quantity of applied fertilizer matters, its timing of application is equally important (see chapter on Fertilizer and nutrient management). The frequency of application was also included in the model to account for the timing of fertilizer application. We used a dummy variable that takes the value of 1 if the farmer has applied fertilizer in at least three splits and 0 otherwise.
To account for human capital, training and education variables were also included. The training variable takes the value of 1 if a farmer has attended any rice-production-related training from 2008 to 2012 and 0 if not. Similarly, the education variable takes the value of 1 if the farmer has reached at least secondary education and 0 otherwise. The details of the variables used in the estimation are described in Table 8.1.

89
Table 8.1. Variables used in the production function estimation.
Variable Description
Ln Yield Paddy production per unit area at 14% moisture content in kilogram per hectareLn Seed Natural log of the quantity of seed used in kilogram per hectare
Ln Nitrogen Natural log of the quantity of nitrogen fertilizer applied in kilogram per hectareLn Phosphorus Natural log of the quantity of phosphorus fertilizer applied in kilogram per hectareLn Potassium Natural log of the quantity of potassium fertilizer applied in kilogram per hectareLn Herbicide Natural log of the quantity of herbicide applied in kilogram of active ingredient per hectareLn Insecticide Natural log of the quantity of insecticide applied in kilogram of active ingredient per
hectareLn Pre-harvest Labor Natural log of pre-harvest labor used in man-days per hectare (1 md = 8 hours of work of
1 person)Ln Machine Rental Natural log of machine rental in US$ per hectare
Ln Area Natural log of area planted of the largest parcel in hectares
China Dummy variable (1 if country is China, 0 otherwise)
India Dummy variable (1 if country is India, 0 otherwise)
Indonesia Dummy variable (1 if country is Indonesia, 0 otherwise)
Thailand Dummy variable (1 if country is Thailand, 0 otherwise)
Vietnam Dummy variable (1 if country is Vietnam, 0 otherwise)
Season Dummy variable (1 if season is high-yielding season, 0 otherwise)
Hybrid Variety Dummy variable (1 if variety is hybrid, 0 otherwise)
Tagged Inbred Seed Dummy variable (1 if seed is tagged and inbred variety, 0 otherwise)
Frequency of Fertilizer Application
Dummy variable (1 if number of fertilizer is 3 or more, 0 otherwise)
Training Dummy variable (1 if farmer has attended rice-production-related training from 2008 to 2012, 0 otherwise)
Education Dummy variable (1 if farmer has reached secondary schooling, 0 otherwise)
According to Griliches and Mairesse (1998), the ordinary least square (OLS) estimation of a production function is generally confounded with an endogeneity problem. The quantity of input uses are farmers’ choice variables and are therefore correlated with their unobserved management abilities. However, due to lack of appropriate measure, the management skills of the farmer are commonly omitted from the analysis and captured only in the error term. This results in the correlation of some explanatory variables with the error term and in biased coefficient estimates. Hence, the next step is to find a consistent estimator that converges to the true value of the parameter as sample size increases (Wooldridge, 2002). The efficiency of the estimator also matters in getting the minimum variance, which is important in making inferences.
To obtain consistent and efficient estimates, the generalized instrumental variable approach was adopted following Im et al. (1999) and as used by Bordey and Nelson (2012). This uses the procedure on generalized method of moments to estimate the
Rice Yield and its Determinants

90 Competitiveness of Philippine Rice in Asia
heteroskedasticity robust standard errors of the coefficients. The demeaned time-varying explanatory variables were used as instruments in addition to price of paddy, price of seed, and costs of fertilizer, herbicide, and insecticide.
The average change in yield due to 1 standard deviation (SD) change in input use was estimated as
(2)
Since mean input use and yield differ in each country, the average effect of each input also varies by country.
The average yield effect of variables, which used dummy variables, is calculated as
(3)
The analysis used the input-output data generated from the survey of six countries (see chapter on The benchmark data: sources, concepts, and methods). To have a meaningful time-demeaning procedure, only respondents who were interviewed at least twice were included in the analysis. A total of 1,226 observations were used in the estimation.
Results and discussion
Figure 8.1 shows the average yield in irrigated areas, by site and season. At 14% moisture content (MC), Vietnam garnered the highest annual yield of 20.59 t ha-1. Not only did Vietnam have the highest yield in both high- (HYS) and low-yielding seasons (LYS), it also had the most intensive cropping system—three rice crops a year. This was made possible by continuous availability of water, use of early-maturing varieties, direct seeding, and synchronous planting (Beltran et al., 2015). Yield was highest during the winter-spring (HYS) at 8.56 t ha-1 when the field was just flooded and solar radiation was highest. The yield during summer-autumn (LYS) was 6.33 t ha-1. Its lowest average yield was recorded during the autumn-winter (third season [TS]) at 5.69 t ha-1 when the rice field was used for the third time within the crop year.

91
Fig. 8.1. Distribution of paddy yield at 14% MC, by country and season, for crop year 2013-2014.
China followed with an annual yield of 13.56 t ha-1. With an average of 7.46 t ha-1, yield was higher during HYS (late rice season) when hybrid rice was planted. The average yield during LYS (early rice season) was 6.10 t ha-1. Only inbred rice varieties were planted during the LYS (Mataia et al., 2015). The choice of variety was largely affected by the length of growing season. If Chinese farmers have a choice, they would plant hybrid rice varieties in the two seasons. However, hybrid varieties are longer maturing compared with inbred varieties. Because the area has a limited growing season (climate is subtropical), they have to plant a shorter maturing variety during LYS but only with much government support (see chapter on Variety, seeds, and crop establishment).
Indonesia also had high yield with an average of 6.11 t ha-1 during HYS and 5.42 t ha-1 during LYS. The legowo planting system was believed to have contributed to high yields in Indonesia (Hidayah 2013, Litonjua et al., 2015). Thailand also had relatively high yield, averaging at 5.16 and 5.31 t ha-1 during HYS and LYS. The lower yield during HYS was due to insufficient water supply as reported by farmers (Manalili et al., 2015).
India had the lowest annual yield among the six sites with 8.92 t ha-1. The yield during the HYS (kuruvai) was only 4.32 t ha-1, lower compared to LYS yield of 4.60 t ha-1. The lower yield during HYS could be attributed to water stress (Bordey et al., 2015). The primary water source of farmers during this season was pumped out groundwater and farmers indicated a problem of water scarcity because of shortage of electricity, which they use to power the water pumps or to bore wells.
The Philippines had the second to the least annual yield of 9.52 t ha-1. Although its yield during HYS at 5.68 t ha-1 was comparable with the average in the six countries, its LYS yield (3.84 t ha-1) was the least. This is generally due to greater cloudiness and lower solar radiation during LYS, which is aggravated by normal typhoon occurrence
Rice Yield and its Determinants
5.687.46 6.11
4.32 5.16
8.56

92 Competitiveness of Philippine Rice in Asia
in the survey area (Launio et al., 2015). On average, about 20 typhoons annually traverse the Philippine area of responsibility and about eight to nine of these make landfall and create damage (Bordey and Arida, 2015).
Yield and determinants
Table 8.2 shows the results of the production function estimation. The estimated Cobb-Douglas model was significant with an F statistic of 53.39. The adjusted coefficient of determination (R squared), however, indicates that only 39% of the variability in the yield was jointly explained by the independent variables. This could be due to low variation among the respondents, considering that sample selection was purposive and that farmers were selected according to predetermined standards. Despite this, the estimated function still gave some interesting insights.
Table 8.2. IV-GMM estimates of the Cobb-Douglas production function.
Variable Coefficient Standard errorLn Seed 0.059* 0.033Ln Nitrogen 0.028 0.028Ln Phosphorus -0.007 0.016Ln Potassium 0.010 0.013Ln Herbicide 0.060* 0.035Ln Insecticide -0.072* 0.026Ln Pre-harvest labor 0.009 0.025Ln Machine rental 0.081* 0.041Ln Area 0.045 0.075China 0.311* 0.081India 0.002 0.038Indonesia 0.489* 0.074Thailand 0.119* 0.060Vietnam 0.412* 0.050High-yielding season 0.145* 0.017Hybrid variety 0.257* 0.074Tagged inbred seed 0.008 0.019Frequency of fertilizer application 0.058* 0.020Training 0.037* 0.015Education 0.045* 0.015Constant 7.340* 0.291Observations 1,226R squared 0.40Adjusted R squared 0.39F statistics 53.39*Indicates significance in at least 90% confidence level.
Among the input variables, seed, herbicide, and machine rent were observed to be yield-increasing, whereas insecticide was yield-decreasing. The positive correlation between seed and yield could be explained by the prevalent use of direct seeding (leading to high seeding rate) and generally higher yield in Vietnam, Thailand, and

93
China, compared with the Philippines and India where seeding rate is low due to the popularity of transplanting.
The avoidance of competition for nutrients between the rice plant and the weeds could explain the yield-increasing effect of herbicide. In contrast, the use of insecticide, particularly for prophylaxis, could have affected the population of natural enemies that could result in higher population of harmful insects in the field and eventually higher crop damage (PhilRice, 2007). This can explain the negative correlation between insecticide and rice yield. The higher level of mechanization, as represented by higher machine cost, could positively affect yield through more efficient farm operations.
Table 8.3 shows the average yield effects of 1 standard deviation (SD) change in each significant input variable. The average effects varied by country because of differences in average input use and yield. For example, 1 SD increase in seed (86.8 kg ha-1 in all sites) would lead to an additional 1.61 t of paddy per hectare in Indonesia where seeding rate is very low. In contrast, the additional yield would only be about 150 and 177 kg ha-1 in Thailand and Vietnam, respectively, where seeding rate is already high (Table 8.4).
Table 8.3. Estimated average change in yield per 1 standard deviation change in significant input (in kg).
Input Philippines China Indonesia India Thailand VietnamSeed 362.46 600.87 1,609.97 304.88 150.30 176.50Herbicide 1,149.99 1,007.19 686.81 1,122.81 434.47 1,073.73Insecticide -2,451.09 -790.71 -329.91 -991.01 -2,018.90 -2,396.63Machine rent 384.23 181.95 1,391.94 327.03 387.83 747.69
Table 8.4. Average yield and input use in irrigated rice production in selected Asian countries.
Item Philippines China India Indonesia Thailand VietnamYield (kg ha-1) 5,413.60 7,305.19 4,734.71 6,836.11 5,825.57 7,420.90Seed (kg ha-1) 75.84 61.73 78.85 21.56 196.81 213.49Nitrogen (kg ha-1) 110.01 181.04 107.56 144.59 82.40 96.17Phosphorus (kg ha-1) 16.29 24.35 20.95 35.00 21.00 28.01Potassium (kg ha-1) 24.15 100.23 34.08 34.45 10.80 32.75Herbicide (kg ai ha-1) 0.30 0.47 0.27 0.64 0.86 0.44Insecticide (kg ai ha-1) 0.27 1.15 0.59 2.57 0.36 0.38Pre-harvest labor (md ha-1) 47.62 25.23 74.76 64.20 9.74 18.49Machine rent (PhP ha-1) 173.46 494.30 178.24 60.46 184.93 122.19Area planted (ha) 1.55 0.17 2.43 1.02 2.66 0.92
Interestingly, a 1-SD increase in herbicide active ingredients (1.07 kg ai ha-1 in all sites) could lead to more than a 1-ton increase in yield in the Philippines and India where the use of herbicide is still low (see chapter on Pesticide use and practices). In contrast, a 1-SD increase in insecticide ai (1.73 kg ai ha-1 in all sites) could lead to a 2.45-
Rice Yield and its Determinants

94 Competitiveness of Philippine Rice in Asia
ton yield decline in the Philippines. It is fortunate that farmers in the Philippines only use insecticides sparingly compared with farmers in other Asian countries. Though statistically significant, the yield effect of a 1-SD increase in machine rent (about US$151.43 ha-1 in all sites) was only economically significant in Indonesia (1.39 t ha-1 increase in yield) where rice farming is only semi-mechanized (Litonjua et al., 2015; see chapter on Labor and mechanization). Area was not found to significantly affect yield. This indicates that yield of farmers with small farms does not systematically differ from the yield of those who have large farms.
Table 8.5 shows the average effects of categorical explanatory variables. Holding other factors constant, rice farming in irrigated areas in Indonesia had 63% higher yield than the Philippines. Similarly, rice yield in Vietnam was 51% higher, China’s was 36%, and Thailand’s was13%. Only India had rice yield that is not significantly different from the Philippines.
Table 8.5. Average effects of categorical variables on yield (in %).
Categorical variable Percent increase in yieldChina 36.48*India 0.18Indonesia 63.07*Thailand 12.64*Vietnam 50.98*Season 15.60*Hybrid variety 29.30*Tagged inbred seed 0.82Frequency of fertilizer application 5.92*Training 3.78*Education 4.63*
Results also indicate that rice yield was higher by almost 16% during HYS than during LYS. Across countries, hybrid rice yield was higher by 29% compared with yield of inbred rice varieties. In particular, average yield of hybrid rice in the Philippines during the HYS was 7.20 t ha-1, whereas tagged and farmer’s seeds had only 5.28 and 4.13 t ha-1, respectively.
While quantities of nitrogen, phosphorus, and potassium were found to be not statistically significant, the frequency of fertilizer application was yield-enhancing. On average, farmers who applied fertilizer in three splits or more had nearly 6% higher yield than those who had two splits or less. This indicates that applying greater amounts of fertilizer may not improve yield, if these were not applied at the right growth stage of the rice plant (see chapter on Fertilizer and nutrient management). In the Philippines, average application was 2.76 splits per season. Hence, fertilizer use can be more efficient if farmers realize the added value of applying it at the right time.
The management skills of farmers are also important factors in explaining yield. Farmers who attended rice production-related training from 2008 to 2012 had a 4%

95
higher yield than those who did not. Farmers who have reached secondary education (but have not necessarily completed this) also had 5% higher yield than those who only finished elementary schooling. In the Philippines, about 64% of the farmers interviewed had attended training courses and 58% of them had reached secondary schooling (see chapter on Profile of an Asian rice farmer). Hence, improving the knowledge of farmers can be one important strategy in enhancing yield, particularly in the Philippines.
Summary and implications
The analysis of rice yield determinants in irrigated farms in Asia shows various yield-enhancing factors that can be explored, particularly in the Philippines. Among these, proper use of herbicide is one area with great potential. The use of hybrid rice particularly during HYS is another option to increase yield. However, the performance of hybrid rice is location-specific (Casiwan and Dawe, 2006; Gonzales and Bordey, 2006), hence, careful consideration should be made in its promotion. The efficiency of fertilizer use is another area for improvement. These should be coupled with enhancement of farmers’ knowledge through education and training.
While there are things that can be done to improve yield in the Philippines relative to its neighbors, it must be noted that a significant cause of the yield difference is inherent in the resources available in the countries. These are soil fertility, water availability, and general climate patterns that cannot be replicated. Hence, strategies for increasing yield should also be guided by the limitation in resources.
Finally, the models presented in this paper are only guides and may not be definitive. Less than half of the yield variation can be explained by the estimated model. More studies, both economic and agronomic, are needed to fully explain the causes of yield differences.
References
Beltran JC, Relado RZ, San Valentin MRL, Tulay EV, Bordey FH, Moya PF, Truong TNC. 2015. Snapshot of Vietnam’s rice production systems in irrigated areas: the Mekong River Delta experience. Science City of Muñoz (Philippines): Philippine Rice Research Institute, and Los Baños (Philippines): International Rice Research Institute. 27 p.
Bordey FH, Arida IA. 2015. Adoption of rice crop insurance in the Philippines: lessons from farmers’ experience. Philippine Journal of Crop Science. 40(1):21-31.
Bordey FH, Marciano EB, Yusongco CG, Besenio JRH, Karunakaran KR, Moya PF. 2015. Revisiting intensive rice cultivation in irrigated areas: the case of Tamil Nadu, India. Science City of Muñoz (Philippines): Philippine Rice Research Institute and Los Baños (Philippines): International Rice Research Institute. 21 p.
Bordey FH, Nelson CH 2012. Productivity of rice farming in the Philippines: patterns and sources. Philippine Journal of Crop Science 37(3):10-22.
Rice Yield and its Determinants

96 Competitiveness of Philippine Rice in Asia
Casiwan CB, Dawe D. 2006. Use of hybrid rice in suitable areas can improve farmer’s yield and income. In: Dawe DC, Moya PF, Casiwan CB, eds. Why does the Philippines import rice? Manila: International Rice Research Institute.
Centeno HGS, Wassmann R. 2010. Reviewing impacts of climate change and climate variability on rice production in the Philippines. In: Lansigan FP, ed. Adaptation to climate variability in rice production. p. 1-20. Give name of publisher and place of publication
[FAO-UN] Food and Agriculture Organization of the United Nations. 2015. FAOSTAT - Statistics Division. http://faostat3.fao.org/home/E. February 23, 2015.
Gonzales LA, Bordey FH. 2006. The hybrid rice commercialization program: midterm assessment. Science City of Muñoz (Philippines): Philippine Rice Research Institute, and where? Laguna (Philippines): STRIVE Foundation. 128 p.
Griliches Z, Mairesse J. 1998. Production function: search for identification. In: Strom S, ed. Econometrics and economic theory in the 20th century: The Ragnar Frisch centennial symposium. Cambridge: Cambridge University Press. p. 169-203.
Hidayah I. 2013. Farmers’ behavior in the implementation of component PPT (integrated plant and resource management) in irrigation paddy fields farming in Buru regency, Maluku province, Indonesia. International Journal of Humanities and Social Science. 3(12): 129-138.
Im KS, Ahn SC, Schmidt P, Wooldridge JM. 1999. Efficient estimation of panel data models with strictly exogenous, explanatory variables. Journal of Econometrics. 93(1): 177-201.
Launio CC, Redondo GO, Tabalno RF, Bordey FH, Moya PF. 2015. Is the Philippines’ leading rice-producing province faring good enough? The case of rice farming in Nueva Ecija. Science City of Muñoz (Philippines): Philippine Rice Research Institute, and Los Baños (Philippines): International Rice Research Institute. 24 p.
Litonjua AC, Wardana P, Paran SJC, Valencia MSD, Macalintal FM, Bordey FH, Moya PF. 2015. Socioeconomic and technological profile of a semi-mechanized rice production system: the case of West Java, Indonesia. Science City of Muñoz, Nueva Ecija (Philippines): Philippine Rice Research Institute, and Los Baños (Philippines): International Rice Research Institute. 24 p.
Manalili RG, Marciano EB, Viray CA, Tanzo IR, Bordey FH, Moya PF. 2015. The Thailand rice economy under the government rice-pledging scheme: the case of SuphanBuri. Science City of Muñoz (Philippines): Philippine Rice Research Institute and Los Baños (Philippines): International Rice Research Institute. 26 p.
Mataia AB, Valencia MSD, Malasa RB, Milanes MBA, Bordey FH, Moya PF, Xianghai D, Xueping H. 2015. Rice production in the midst of economic development: the case of Jinhua, Zhejiang, China. Science City of Muñoz (Philippines): Philippine Rice Research Institute and Los Baños (Philippines): International Rice Research Institute. 25 p.
[PhilRice] Philippine Rice Research Institute. 2007. PalayCheck system for irrigated lowland rice. Science City of Muñoz (Philippines): Philippine Rice Research Institute. 90 p.
Virmani SS, Sharma HL. 1993. Manual for hybrid rice seed production. Los Baños (Philippines): International Rice Research Institute. 57 p.
Wooldridge JM. 2002. Econometric analysis of cross section and panel data. Cambridge: The MIT Press. 753 p.


COSTS OF RICE PRODUCTIONPiedad F. Moya, Flordeliza H. Bordey, Jesusa C. Beltran, Rowena G. Manalili, Cheryll C. Launio, Alice B. Mataia, Aileen C. Litonjua, and David C. Dawe
Key messages:• Production costs per kilogram of paddy are much lower in exporting countries
than in importing ones.
• Labor and mechanization account for the bulk of the cost difference between the Philippines and the exporters.
The cost of producing rice varies by location, time, and specific circumstance. Some costs are location-specific and are greatly influenced by the dynamics of rice production systems. Costs are determined not only by prices of inputs and
wage rates but also by management practices of rice farmers and use of inputs such as fertilizer, pesticides, and labor, in the different major activities in the rice production cycle.
Many sectors in society are interested in knowing the costs of producing rice. These are primarily the farmers who grow rice, the fertilizer and pesticide industry who manufacture and distribute these inputs, the banking and other financing institutions that lend money for rice production, the policymakers and government officials who promulgate and implement policies that affect the rice industry, and lastly, researchers who are interested in the economic evaluation of newly developed and existing rice technologies.
Knowing the cost of production and comparing it with international competitors is also highly relevant now that the Philippines is on the verge of opening up its domestic rice market to international competition. Because of the country’s commitment to the ASEAN Economic Integration, the Philippines already lowered its tariff on rice from 40% to 35% in 2015. By 2017, the country’s waiver on honoring its commitment to the World Trade Organization will lapse, implying that it has to eliminate its quantitative restriction in rice (Serrano, DA Undersecretary for Policy and Planning, pers. commun., 2015). Hence, understanding the cost competitiveness of the Philippines relative to that of other countries, particularly in Asia, will be an important part of the country’s preparation.
However, data on comparative costs of rice production across major rice-producing countries are very scarce at best. One of the first systematic cross-country studies was done by the International Rice Research Institute (IRRI) and national
9
99
100 Competitiveness of Philippine Rice in Asia
agricultural research system (NARS) partner institutes from 1994 to 1999 in six countries in Asia (Moya et al., 2004). Since then, there have been a number of studies done on costs of rice production but these were conducted on an individual country basis and at different time periods, which made them not comparable (Arayaphong, 2012; Estudillo and Fujimura, 2015). A more recent study of costs that includes five countries (including Thailand and Vietnam) was released as a working paper by Agri Benchmark (Liese et al., 2014). However, it is based on a very small sample of farmers and does not provide many details of the cost components.
This paper aims to (a) estimate and compare the costs of producing rice in selected Asian rice bowls, (b) determine the important factors affecting the costs of producing rice, (c) identify factors affecting costs that can be influenced by rice farmers through changes in management practices, and (d) identify the key issues to lessen costs of production with a view to setting future research priorities.
Methods of estimation
Detailed farm-level data collected from at least 100 sample farm households in two cropping seasons of crop year 2013-2014 were used in the analysis of costs of producing rice in the various sites included in the study. The cost analysis covered the intensively cultivated irrigated areas in six locations in Asia: Nueva Ecija (NE), Philippines; West Java (WJ), Indonesia; Zhejiang (ZH), China; SuphanBuri (SB), Thailand; Can Tho (CT), Vietnam; and Tamil Nadu (TN), India (see chapter on The benchmark data: sources, concepts, and methods).
The major cost components are material inputs consisting of seeds, fertilizer, pesticides, labor, power, land, capital, irrigation, and other minor items. The cost of each individual item was estimated by multiplying quantity by its acquisition price:
Ci= Qi x Pi (1)
where C is cost, Q is quantity, and P is the price of input i.
Aside from the actual costs spent by the farmer, we also took into account the opportunity costs of inputs owned by the farmer and the opportunity costs of the farmer and family labor used in performing the various farm activities. We imputed values to their own inputs and labor using the prevailing prices or wage rates in the site.
Details of the procedures used in estimating the various cost items and the underlying assumptions are given in the project document “Guide in the Costs and Returns Analysis” (see Annex A).
To allow comparison across countries, all costs were expressed in United States dollar and then converted to Philippine peso using the exchange rates in Table 9.1.

101
To measure efficiency, the costs were presented in terms of expenses required to produce a kilogram of paddy. This is done by dividing cost per hectare by yield level. The lower the cost of production per unit of output, the more cost-efficient a rice production system is. We also calculated and presented the weighted average of costs using yield as weights. Seasonal comparison was also done to understand the variation of unit cost across seasons and locations.
Table 9.1. Exchange rates used in the conversion of local currency to US$, 2013.
Country US $Philippines (peso) 42.45China (yuan) 6.20Indonesia (rupiah) 10,461.00India (rupees) 58.60Thailand (baht) 30.73Vietnam (dong) 20,933.00
Source: IMF, 2013
As shown in Table 9.2, on the average, the price of urea was highest in the Philippines at PhP 23 kg-1 and lowest at India at PhP 4.3 kg-1. India and Indonesia had much lower prices relative to other sites because of their government’s fertilizer subsidy (Bordey et al., 2015; Litonjua et al., 2015). No subsidies were documented in Vietnam and Thailand where the price of urea was relatively higher. While the same was true in the Philippines, the higher transport cost could account for the more expensive fertilizer than these two exporting countries.
Table 9.2. Comparative mean prices of fertilizer, pesticides, and wage rates across country sites, crop year 2013-2014.
Item Philippine peso (PhP) Philippines China Indonesia India Thailand Vietnam
Urea (per kg) 23.23 14.87 7.92 4.29 20.76 19.7Herbicide (butachlor, per L) 562.51 117.99 naa 357.65 471.95 390.93Insecticide (chloropyrifos, per L) 467.37 816.27 534.08 294.82 432.02 490.57Wage rate (per md) 333.66 800.61 337.05 163.43 699.58 446.57
ana=price data not available
In terms of pesticides, China had the highest price for insecticide at PhP 816 L-1 annual average price, followed by Indonesia at PhP 534 L-1. The lowest was again India at about PhP 295 L-1. Herbicide was cheapest in China (PhP 118 L-1) and most expensive in the Philippines (PhP 563 L-1).
China and Thailand wage rates were more than double the rates for Philippines, Indonesia, and India, while Vietnam is in the midpoint. Noticeably, the wage rates in highly mechanized countries are higher than in the labor-intensive ones (see chapter on Labor and mechanization). However, India is an exception, where generally, wages were much lower compared with those in other countries.
Costs of Rice Production

102 Competitiveness of Philippine Rice in Asia
Which country produces the cheapest rice?
Figure 9.1 shows the annual average production cost per kilogram across countries. We observed one salient feature of the magnitudes of costs across sites. The cost of paddy production is cheaper in exporting countries than in importing ones. The cheapest of all was in Vietnam where it took only PhP 6.53 to produce 1 kg of paddy. Vietnam is followed by Thailand where producing paddy cost only PhP 8.85 kg-1. Among the exporting countries, the highest production cost was seen in India, though this value was not significantly different from Thailand’s PhP 8.87 kg-1. It is a known fact that most rice produced in Thailand is of better quality than that of Vietnam and India.
Fig. 9.1. Comparative cost of producing 1 kilogram of paddy in various project sites, crop year 2013-2014.
Among the importing countries, the Philippines had the lowest cost at PhP 12.41 kg-1. Indonesia had the highest cost, at PhP 15.70 kg-1, followed by China (PhP 14.07 kg-1). These results point out the cost efficiency of the exporting countries relative to that of the importing countries.
If we look at seasonal cost of production, we see that the Philippine performance was much better in the high-yielding season (HYS) at PhP 11.13 kg-1 (Tables 9.3a and 9.3b). During this season, its magnitude is somewhat closer to that of the exporting countries. But, as the low-yielding season (LYS) costs showed, the Philippines produced 1 kg of paddy at a much higher rate (PhP 14.31 kg-1), indicating that much work has to be done to improve the country’s cost competitiveness.

103
Table 9.3a. Breakdown of costs, by item of expenditures, high-yielding season, six country sites, crop year 2013-2014.
Item Philippines China Indonesia India Thailand Vietnam (PhP kg-1)Seed 0.54 0.93 0.14 0.51 1.13 0.39Fertilizer 1.73 1.93 0.96 0.93 1.54 0.96Chemicals 0.32 1.72 0.92 0.21 0.90 0.69Hired labor 3.39 0.52 4.23 2.75 0.68 0.35Operator, family, & exchange Labor 0.56 2.84 1.04 0.56 0.64 0.67Animal, machine, fuel, & oil 1.54 2.88 0.48 1.78 1.83 0.63Irrigation 0.45 0.00 0.14 0.12 0.13 0.08Food 0.19 0.00 0.29 0.12 0.05 0.00Transportation 0.05 0.11 0.10 0.04 0.16 0.03Tax 0.03 0.00 0.19 0.03 0.00 0.00Land rent 1.80 3.45 6.17 1.99 1.94 1.20Interest on capital 0.40 0.01 0.31 0.10 0.06 0.04Other inputs 0.10 0.02 0.12 0.13 0.00 0.09Total cost 11.13 14.39 15.08 9.27 9.07 5.14
One must realize that differences in cost per kilogram are not only due to differences in prices and quantity of inputs used but also to variations in geographical location, weather and climatic conditions, production practices, farm and farmer characteristics, government support, and infrastructure. All of these are explained in detail in the six monographs published by the project (Beltran et al., 2015; Bordey et al.,2015; Launio et al.,2015; Litonjua et al.,2015; Manalili et al.,2015; Mataia et al.,2015).
The succeeding sections discuss each cost item to determine the main contributory factors to overall cost differences.
Table 9.3b. Breakdown of costs, by item of expenditures, low-yielding season, six country sites, crop year 2013-2014.
Item Philippines China Indonesia India Thailand Vietnam PhP kg-1 Seed 0.63 0.57 0.16 0.40 1.11 0.45Fertilizer 2.24 1.87 1.14 0.89 1.59 1.62Chemicals 0.42 0.84 1.16 0.23 0.90 0.94Hired Labor 4.31 0.47 4.36 2.30 0.63 0.53Operator, family, & exchange labor 0.79 2.13 1.00 0.39 0.65 0.85Animal, machine, fuel, & oil 2.00 3.50 0.53 1.78 1.51 0.92Irrigation 0.45 0.00 0.07 0.12 0.15 0.11Food 0.18 0.00 0.19 0.17 0.05 0.00Transportation 0.07 0.04 0.03 0.05 0.13 0.05Tax 0.05 0.00 0.16 0.02 0.00 0.00Land rent 2.57 4.22 7.11 1.94 1.85 1.60Interest on capital 0.48 0.01 0.31 0.08 0.07 0.13Other inputs 0.11 0.02 0.19 0.13 0.00 0.09Total cost 14.31 13.67 16.40 8.50 8.64 7.29
Costs of Rice Production

104 Competitiveness of Philippine Rice in Asia
Seed costs
Indonesia posted the least seed cost at PhP 0.15 kg-1 of produced paddy because of its high seed efficiency (Table 9.4). Seeding rate in Indonesia is very low because of their system of transplanting: only one to two seedlings per hill and wider distance between hills (see chapter on Variety, seeds, and crop establishment). A sizable proportion of farmers also use farmers’ seeds, which are usually valued at the current price of paddy, making it cheaper than the tagged inbred and hybrid seeds (Appendix Table 9.1).
The Philippines and India also have smaller seed costs due to the relatively lower seeding rates and their transplanting practice compared with Thailand and Vietnam where direct seeding is practiced by practically 100% of the farmers. Thailand has the highest seed cost of around PhP 1.12 kg-1 of produced paddy because of high seeding rate and high usage of tagged inbred seeds.
On a per-season basis, China has the highest seed cost in the HYS because of the expensive hybrid rice seed being used during this season. Because of this China has the second highest seed cost. All other sites have more or less similar costs for both seasons, except for the Philippines where some farmers planted hybrid seeds during the HYS, thus increasing its seed cost during that season.
Table 9.4. Average costs of production, by item of expenditures for all seasons in six country sites, crop year 2013-2014.
Item Philippines China Indonesia India Thailand Vietnam PhP kg-1 Seed 0.58 0.77 0.15 0.45 1.12 0.44Fertilizer 1.94 1.90 1.05 0.91 1.56 1.36Pesticide 0.36 1.33 1.03 0.22 0.90 0.87Hired labor 3.76 0.49 4.29 2.52 0.66 0.46Operator, family, & exchange labor 0.66 2.52 1.02 0.47 0.65 0.81Animal, machine, fuel, & oil 1.73 3.16 0.50 1.78 1.66 0.81Irrigation 0.45 0.00 0.10 0.12 0.14 0.08Land rent 2.11 3.80 6.61 1.96 1.85 1.49Interest on capital 0.43 0.01 0.31 0.09 0.07 0.08Others 0.40 0.10 0.63 0.35 0.20 0.13Total cost 12.41 14.07 15.70 8.87 8.85 6.53
Fertilizer cost
The Philippines recorded the highest cost on fertilizer to produce 1 kg of paddy (Fig. 9.2). This is not because of higher fertilizer application but more of the high price of fertilizer as explained earlier. China closely followed the Philippines, at around PhP 1.90 kg-1 of paddy, which could be explained by its high rate of fertilizer application and moderately high fertilizer price (Appendix Table 9.2.).

105
Fig. 9.2 Comparative fertilizer cost to produce 1 kg of paddy, six Asian countries, crop year 2013-2014.
On the other hand, fertilizer costs in India (PhP 0.91) and Indonesia (PhP 1.05) were the lowest. As previously mentioned, farmers in both countries enjoy fertilizer subsidy. In India, urea is sold at a government-fixed selling price, while phosphate and potash fertilizers are sold at indicative maximum retail prices (Bordey et al., 2015). In Indonesia, the government subsidizes triple superphosphate, complete, and urea fertilizers (Litonjua et al., 2015). Fertilizers are not subsidized in other countries, resulting in higher fertilizer costs.
Pesticide cost
Generally, farmers in all sites bought several types of pesticides. These pesticides can be grouped into five categories—herbicides, insecticides, fungicides, molluscicides, and rodenticides. The bulk of the expenses were on insecticides, herbicides, and fungicides. Smaller amounts were spent on the remaining types of pesticides (Table 9.5).
Table 9.5. Pesticide cost per kilogram of paddy (PhP kg-1), six country sites, crop year 2013-2014.
Country Herbicide Insecticide Fungicide Molluscicide RodenticideOther
chemical TotalPhilippines 0.087 0.120 0.033 0.105 0.009 0.009 0.362China 0.244 0.870 0.210 0.000 0.000 0.002 1.326Indonesia 0.070 0.682 0.172 0.074 0.032 0.002 1.032India 0.081 0.109 0.024 0.001 0.002 0.006 0.223Thailand 0.329 0.313 0.190 0.003 0.007 0.060 0.901Vietnam 0.123 0.197 0.360 0.098 0.009 0.082 0.870
Costs of Rice Production

106 Competitiveness of Philippine Rice in Asia
As noted in Table 9.5, Indian and Filipino farmers spent the least in controlling pests and diseases in their rice farms. In total, they spent PhP 0.22 and PhP 0.36 kg-1 of paddy, respectively, to control weeds, insects, and other pests and diseases (Table 9.5). In contrast, Chinese farmers had the highest pesticide cost at PhP 1.33, followed by Indonesian farmers at PhP 1.05.
This high amount for China indicates the higher price paid by China for pesticides as shown in Table 9.2. In fact, when it comes to the average amount applied per season, Indonesia was the heaviest user of pesticides, at almost 4 kg ai (active ingredient) per hectare per season compared with China and Vietnam, which averages 2.5 and 2.70 kg ai per hectare per season, respectively (see chapter on Pesticide use and practices).
If we look closely at the proportion of costs spent for each type of pesticides, Table 9.5 shows that farmers in all sites, except Vietnam and Thailand, spent the most on insecticides. The Vietnamese spent more on fungicides, while Thai farmers spent slightly more on herbicides due to the high wage rates that encourage direct seeding (and thus weed growth) and discourage manual weeding.
Labor cost
Labor cost is composed of hired labor costs and imputed family and exchange labor costs for all activities from land preparation to postharvest. A comparison of the costs of labor per kilogram of paddy across sites is presented in Table 9.6.
Table 9.6. Average costs of labor to produce 1 kg of paddy, by source and across country sites, crop year 2013-2014.
Country Hired labor Operator, family and exchangePhp kg-1 of paddy
Total labor
Philippines 3.76 0.66 4.42China 0.49 2.52 3.02Indonesia 4.29 1.02 5.31India 2.52 0.47 2.99Thailand 0.66 0.65 1.30Vietnam 0.46 0.81 1.27
Indonesia had the largest cost of labor across all sites, spending around PhP 5.31 for labor to produce 1 kg of paddy. This is because of the labor-intensive management practices such as transplanting, manual harvesting, and threshing. As explained in Litonjua et al (2015), manual harvesting and threshing are still being practiced in Indonesia. As shown in Table 9.6, a major proportion of these costs (81%) went to hired labor.
The Philippines followed, with an average total labor costs of around PhP 4.42 kg-1 of paddy, the majority of which (85%) was also for hired labor. As in Indonesia, this high cost is attributed to labor-intensive activities such as transplanting and
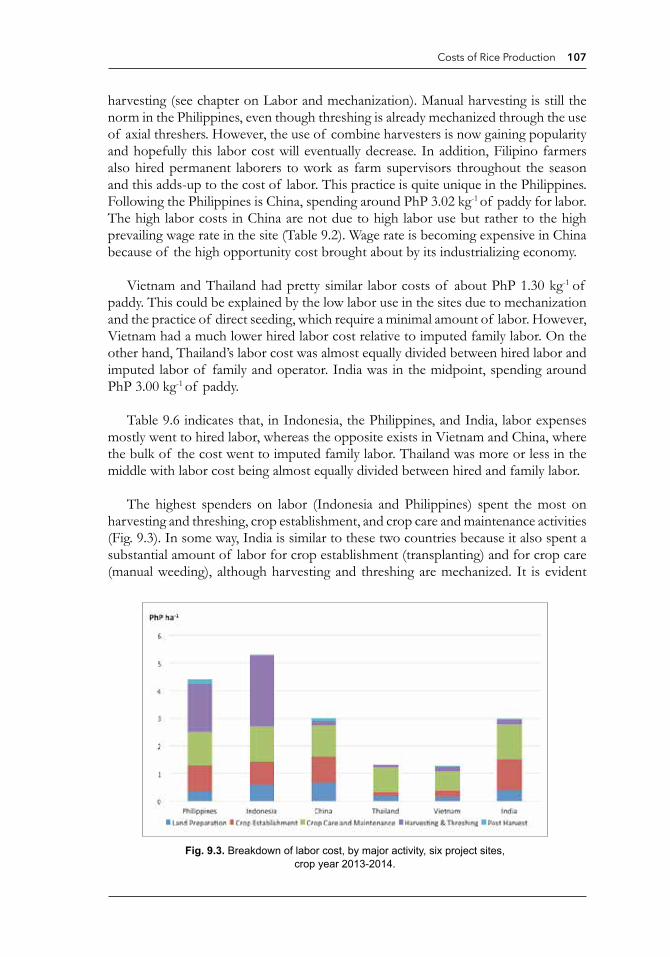
107
harvesting (see chapter on Labor and mechanization). Manual harvesting is still the norm in the Philippines, even though threshing is already mechanized through the use of axial threshers. However, the use of combine harvesters is now gaining popularity and hopefully this labor cost will eventually decrease. In addition, Filipino farmers also hired permanent laborers to work as farm supervisors throughout the season and this adds-up to the cost of labor. This practice is quite unique in the Philippines. Following the Philippines is China, spending around PhP 3.02 kg-1 of paddy for labor. The high labor costs in China are not due to high labor use but rather to the high prevailing wage rate in the site (Table 9.2). Wage rate is becoming expensive in China because of the high opportunity cost brought about by its industrializing economy.
Vietnam and Thailand had pretty similar labor costs of about PhP 1.30 kg-1 of paddy. This could be explained by the low labor use in the sites due to mechanization and the practice of direct seeding, which require a minimal amount of labor. However, Vietnam had a much lower hired labor cost relative to imputed family labor. On the other hand, Thailand’s labor cost was almost equally divided between hired labor and imputed labor of family and operator. India was in the midpoint, spending around PhP 3.00 kg-1 of paddy.
Table 9.6 indicates that, in Indonesia, the Philippines, and India, labor expenses mostly went to hired labor, whereas the opposite exists in Vietnam and China, where the bulk of the cost went to imputed family labor. Thailand was more or less in the middle with labor cost being almost equally divided between hired and family labor.
The highest spenders on labor (Indonesia and Philippines) spent the most on harvesting and threshing, crop establishment, and crop care and maintenance activities (Fig. 9.3). In some way, India is similar to these two countries because it also spent a substantial amount of labor for crop establishment (transplanting) and for crop care (manual weeding), although harvesting and threshing are mechanized. It is evident
Fig. 9.3. Breakdown of labor cost, by major activity, six project sites, crop year 2013-2014.
Costs of Rice Production

108 Competitiveness of Philippine Rice in Asia
that differences in the level of mechanization of harvesting and threshing activities and the practice of direct seeding mainly determine the magnitude of labor cost in all sites (see chapter on Labor and mechanization). Differences in wage rates are a contributing factor as well.
Power costs
Power costs consist of rental for animal and machinery, including cost of fuel and oil. A summary of the costs of power at all sites is shown in Figure 9.4. Farmers in China had the highest cost among the six country sites, amounting to around PhP 3.16 kg-1 of paddy. It is because mechanization substituted for manual labor for major farm activities. However, another reason is the high contract rates charged by machine operators in the area, where contract rates for tractors and combine harvesters are paid on a fixed rate basis, regardless of production quantity (Mataia et al., 2015). In contrast, in the least mechanized site, Indonesia spent the least on power, at only around PhP 0.50 kg-1. Most of its farm activities are still done manually. In addition, petroleum-derived fuel is relatively cheaper in Indonesia because of local production and the subsidy provided by the government.
Vietnam had the second lowest power costs at PhP 0.81 kg-1 of paddy. The remaining three sites have more or less spent the same amount for power costs at around PhP1.70 kg-1. However, it must be noted that power cost in the Philippines is almost in the same magnitude as Thailand despite the former having a much lower level of mechanization and higher labor use. This is primarily because of the high cost of thresher rental (which is considered as power cost) in the Philippines. Custom services for threshing in the Philippines charge a much higher rental rate relative to Thailand.
Fig. 9.4. Comparative cost spent on animal and machine power to produce 1 kg of paddy, six project sites, crop year 2013-2014.

109
Land rent
The cost of land consists of rent or opportunity cost of renting out the land (if owned). Land rent is one of the biggest components of rice production cost compared with other items of cost. Land rent in Indonesia was around PhP 6.61 kg-1 (Fig. 9.5), which is the most expensive, occupying 42% of the cost to produce a kilogram of paddy. This is due to the fact that most common land rental arrangements in Indonesia stipulate that the renter or farm operator and the landowner have a 50% sharing of net revenue after deducting the cost of material inputs, land tax, and village fees (Litonjua et al., 2015). China had the next highest cost of land and this was caused by the increasing opportunity cost of land due to rapid economic development in the site. Thailand and Vietnam were again similar in terms of magnitude of land rent, with India and the Philippines being slightly higher.
Fig. 9.5. Land rental costs across six project sites, crop year 2013-2014.
Summary and implications
Results show that producing a kilogram of paddy is more expensive in intensively cultivated and irrigated areas in importing countries such as the Philippines, Indonesia, and China than in exporting countries such as Thailand, Vietnam, and India. This indicates that exporting countries have an advantage in terms of cost competitiveness at the farm level compared with importing countries.
Substantial differences occur in major items of costs such as labor, not because of major differences in prices but because of varying levels of mechanization. Low-cost countries such as Thailand and Vietnam are highly mechanized, resulting in low labor costs compared with those in labor-intensive countries such as the Philippines and Indonesia. Deviations in other cost items also occur but at a smaller magnitude.
Costs of Rice Production

110 Competitiveness of Philippine Rice in Asia
Findings from this study could help a lot in looking for solutions to reduce the costs of producing rice not only in the Philippines but also in other high-cost rice-producing countries in Asia. As was clearly shown in Thailand and Vietnam, full mechanization of harvesting and threshing activities is one option to reduce cost. Other options, like method of crop establishment, should also be further investigated. Government support, in the form of reduced input prices, is discussed in more detail in Chapter 13.
References
Arayaphong S. 2012. Cost-benefit analysis of different rice cropping systems in Thailand. Uppsala, Sweden: Department of Earth Science, Uppsala University.
Beltran JC, Relado RZ, San Valentin ML, Tulay EV, Bordey FH, Moya PF, Chi TT. 2015. A snapshot of Vietnam’s rice production systems in irrigated areas: The Mekong River Delta experience. Science City of Muñoz, Nueva Ecija (Philippines): Philippine Rice Research Institute, and Los Baños (Philippines) International Rice Research Institute. 27 p.
Bordey FH, Marciano EV, Yusongco CG,Besenio JRH, Karunakaran KR,Moya PF.2015. Revisiting intensive rice cultivation in irrigated areas: the case of Tamil Nadu, India. Science City of Muñoz, Nueva Ecija (Philippines): Philippine Rice Research Institute, and Los Baños (Philippines) International Rice Research Institute. 21 p.
Estudillo JP, Fujimura M. 2015. Comparative advantage in rice production: Vietnam and Myanmar. Unpublished.
[IMF] International Monetary Fund. 2013. International financial statistics. http://elibrary-data.imf.org/DataExplorer.aspx. October 15, 2015.
Launio CC, Redondo GO, Tabalno RF, Bordey FH, Moya PF. 2015. Is the Philippines’ leading rice-producing province faring good enough? The case of rice farming in Nueva Ecija. Science City of Muñoz (Philippines): Philippine Rice Research Institute and Los Baños (Philippines): International Rice Research Institute. 24 p.
Liese B, Isvinilonda S, Tri KN, Ngoc LN, Pananurak P, Pech R, Shwe TM, Sombounkhanh K, Molliman T, Zimmer Y. 2014. Economics of Southeast Asian rice production. Agri benchmark report. Unpublished.
Litonjua AC, Wardana P, Paran SJC, Valencia MSD, Macalintal FM, Bordey FH, Moya PF. 2015. Socioeconomic and technological profile of a semi-mechanized rice production system: the case of West Java, Indonesia. Science City of Muñoz, Nueva Ecija (Philippines): Philippine Rice Research Institute, and Los Baños (Philippines): International Rice Research Institute. 25 p.
Manalili RG, Marciano EB, Viray CA, Tanzo IR, Bordey FH, Moya PF. 2015. The Thailand rice economy under the government rice-pledging scheme: the case of Suphan Buri. Science City of Muñoz (Philippines): Philippine Rice Research Institute and Los Baños (Philippines): International Rice Research Institute. 26 p.
Mataia AB, Valencia MSD, Malasa RB, Milanes MBA, Bordey FH, Moya PF, Xianghai D, Xueping H. 2015. Rice production in the midst of economic development: the case of Jinhua, Zhejiang, China. Science City of Muñoz (Philippines): Philippine Rice Research Institute and Los Baños (Philippines): International Rice Research Institute. 25 p.
Moya PF, Dawe D, Pabale D, Tiongco M, Chien NV, Devarajan S, Djatiharti A, Lai NX, Niyomvit L, Ping HX, Redondo G, Wardana P. 2004. The economics of intensively irrigated rice in Asia. In: Dobermann A, Witt C, Dawe D, eds. Increasing productivity of intensive rice systems through site-specific nutrient management. Enfield, N.H. (USA): Science Publishers, Inc., and Los Baños (Philippines): International Rice Research Institute. p 29-58.

111
Appendix Table 9.1. Average price of seed per season (US$ kg-1), by country, crop year 2013-2014.
High-yielding season Low-yielding season Annual Tagged
inbred seedHybrid seed
Farmer’s seed
Tagged inbred seed
Hybrid seed
Farmer’s seed
Tagged inbred seed
Hybrid seed
Farmer’s seed
Philippines 0.70 5.25 0.46 0.70 5.37 0.47 0.70 5.27 0.46China 11.87 0.75 0.73 0.75 11.87 0.73Indonesia 0.94 0.82 1.15 0.78 1.04 0.80India 0.63 0.51 0.58 0.47 0.61 0.48Thailand 0.73 0.64 0.73 0.60 0.73 0.63Vietnam* 0.54 0.29 0.50 0.26 0.46 0.27*Values in low-yielding season are the average of low-yielding and third seasons
Appendix Table 9.2. Fertilizer use (kg-1 ha-1), by country and by season, crop year 2013-2014.
High-yielding season Low-yielding season Annual N P K N P K N P KPhilippines 114 18 25 107 15 23 221 32 48China 198 29 110 162 20 90 360 49 200Indonesia 141 33 36 148 37 34 289 70 69India 105 21 33 109 21 38 214 42 70Thailand 79 21 10 88 22 10 167 42 21Vietnam* 93 26 29 98 29 35 290 85 98*Values in low-yielding season are the average of low-yielding and third seasons
Costs of Rice Production

112 Competitiveness of Philippine Rice in Asia
Annex A.BENCHMARKING THE PHILIPPINE RICE ECONOMY
RELATIVE TO MAJOR RICE-PRODUCING COUNTRIES IN ASIA
GUIDELINES IN COST AND RETURN ANALYSIS
I. COSTS
1) Seed Quantity, Price, and Cost
• Multiply the quantity of used seeds by the price of seed.
• Seed cost should be non-zero as quantity of seeds and price should also be non-zero. Check the raw data if seed quantity is missing. If quantity of data is missing, impute the value by using the mean seed use per hectare of the non-missing entries.
• If seed price data are missing, use the sample median of the price of seed with the same quality (i.e., same seed class and same variety). Take the sample median of non-zero, non-missing entries and use this to impute the price of seed.
• If the seed class is farmer’s previous harvest, use the price of dried paddy to impute the seed cost.
• Express the cost of seed on a per-hectare basis.
• In the cost-and-return table, take the average of the seed cost per hectare.
2) Fertilizer Cost
• Multiply the quantity of each type of fertilizer by its respective price.
• Fertilizer quantity could be zero; hence zero quantity should be distinguished from missing data. Check raw data if fertilizer quantity data are missing.
• Fertilizer price should be non-zero. If price data are missing, use the sample me-dian of the price of the same fertilizer type. Take the sample median of non-zero, non-missing entries and use this to impute the price of fertilizer.
• Express the cost of fertilizer in per hectare form.
• In the cost-and-return table, take the average of the fertilizer cost per hectare, includ-ing those with zero entries.
3) Chemical Cost (Herbicides, Insecticides, Fungicides, Molluscicides, Rodenti-cides, Other Chemicals)
• Multiply the quantity of each type of chemical pesticide used by its respective price.
• The quantity of chemical pesticide could be zero; hence zero quantity should be distinguished from missing data on quantity of chemical pesticide.
• Price should be non-zero. If price data are missing, use the sample median of price of the same chemical. Take the sample median of non-zero, non-missing entries and use this to impute the price of chemical pesticide.
• Express the cost of each type of chemical pesticide in per hectare form.
• In the cost-and-return table, take the average cost per hectare of each type of chem-ical pesticide, including those with zero entries.

113
4) Hired Labor Cost
a. Land Preparation – Separate the labor cost from the machine cost. Use value judg-ment in separating the costs if payments for labor and machine are combined in a single contract. Add the cost of each sub-activity (plowing, harrowing, levelling, side plowing, bund cleaning and repair, construction of small canals/ditches, etc.) to get the total land preparation cost. Express the cost in per hectare form. Hired land preparation cost should be non-zero unless done by OFE (operator, family, and exchanged labor). In the cost-and-return table, take the average cost per hectare of land preparation, including those with zero entries.
b. Crop Establishment – Separate labor cost from machine cost if mechanized. Use value judgment in separating the costs if payments for labor and machine are com-bined in a single contract. Add the cost of each sub-activity (seedling establishment, pulling of seedling, hauling of seedling, transplanting or direct seeding, replanting, etc.) to get the total crop establishment cost. Express the cost in per hectare form. Hired crop establishment cost should be non-zero unless done by OFE (operator, family, and exchanged labor). In the cost-and-return table, take the average cost per hectare of crop establishment, including those with zero entries.
c. Crop Care and Maintenance – Separate labor cost from machine cost if mech-anized. Use value judgment in separating the costs if payments for labor and ma-chine are combined in a single contract. Add the cost of each sub-activity (irrigation, drainage, application of fertilizer and chemical pesticides, non-chemical pest man-agement, weeding, etc.) to get the total crop care and maintenance cost. Express the cost in per hectare form. Hired crop care and maintenance cost should be non-zero unless done by OFE (operator, family, and exchanged labor). Do not include FIELD MONITORING. In the cost-and-return table, take the average cost per hectare of crop care and maintenance, including those with zero entries.
d. Harvesting and Threshing – Separate labor cost from machine cost if mecha-nized. Use value judgment in separating the costs if payments for labor and machine are combined in a single contract. Add the cost of each sub-activity (harvesting, threshing, bagging, etc.) to get the total harvesting and threshing cost. Express the cost in per hectare form. Hired harvesting and threshing cost should be non-zero unless done by OFE (operator, family, and exchanged labor). In the cost-and-return table, take the average cost per hectare of harvesting and threshing, including those with zero entries.
e. Postharvest – Separate labor cost from machine cost if mechanized. Use value judg-ment in separating the costs if payments for labor and machine are combined in a single contract. Except for DRYING, add the cost of each sub-activity (hauling, cleaning and blowing, bagging) to get the total postharvest cost. Drying cost should be excluded since the gross return will be computed from fresh weight of paddy us-ing the price of fresh paddy. Express the cost in per hectare form. Hired postharvest cost could be zero if the farmer did not do any of the sub-activities or if OFE did the work. In the cost-and-return table, take the average cost per hectare of posthar-vest, including those with zero entries.
f. Permanent Labor Cost – Indicate the cash payment or cash equivalent paid to the permanent worker for the whole season. Express the cost in per hectare form. This cost item could be zero if the farmer did not hire any permanent worker. In the cost-and-return table, take the average cost per hectare of permanent labor, including those with zero entries.
Costs of Rice Production

114 Competitiveness of Philippine Rice in Asia
5) OFE Labor Cost – Use the prevailing daily wage rate or contract rate to estimate the cost of OFE labor. If the basis is daily wage rate, this needs to be multiplied with the labor man-days to get the labor cost for the activity. If the basis is the prevailing contract rate (i.e., piece rate), it should be multiplied with the contract basis (i.e., number of sprays, bags, or hectares). Add the imputed cost of all activities performed by OFE, except field monitoring. Express the cost in per hectare form. OFE labor cost can be zero if all farm activities were done by hired workers. In the cost-and-return table, take the average cost per hectare of the imputed labor, including those with zero entries.
6) Supervision Cost/Field Monitoring – Impute the cost of field monitoring by multi-plying the number of hours, days, and workers by the prevailing wage rate. Include the supervision cost even if field monitoring was done by a hired worker. Express the cost in per hectare form. In the cost-and-return table, take the average cost per hectare of supervision, including those with zero entries. Although we will compute for the average field monitoring cost, this will only be maintained in the database for future purposes. However, we will NOT INCLUDE field monitoring as part of production cost.
7) Power Cost – This should be the total of animal/machine rental, and fuel and oil for ALL labor activities. Animal/machine rental and fuel and oil are presented in a single item since the cost of fuel and oil cannot be separated from the ma-chine rental under contract schemes. This cost item should not be zero unless all farm activities were done manually. Express the cost in per hectare form. In the cost-and-return table, take the average per hectare cost of animal/machine rental, and fuel and oil.
a. Animal/Machine Rental – Add the cost of all animal/machine rental fees that were separated from labor contracts, except that of irrigation (i.e., water pump rent). Use the market rental rate if the machine was owned by the farmer. Express the cost in per hectare form.
b. Fuel and Oil – Add the cost of all fuel and oil used in rice production in the whole season, except that of irrigation (i.e., fuel and oil for irrigation). Express the cost in per hectare form.
8) Food – Add the cost of food spent for farm workers. Express the cost in per hectare form. In the cost-and-return table, take the average of food cost per hectare, including those with zero entries.
9) Irrigation Cost
• Indicate the fees per hectare that the farmer paid for the use of water from govern-ment irrigation canals. This can be zero if fees are waived by the government.
• If the farmer used a water pump instead of government irrigation canals, use the cost of machine rent and fuel and oil from the irrigation section.
• Take the sum of irrigation fees, machine rent, fuel and oil cost for irrigation to create a single cost for irrigation. Express the cost in per hectare form.
• In the cost-and-return table, take the average of the irrigation cost per hectare, in-cluding those with zero entries.

115
10) Transportation Cost – Add the cost of transporting inputs from the market to the farm and of transporting output directly to the market. Express the cost in per hectare form. In the cost-and-return table, take the average per hectare cost of transportation, including those with zero entries.
11) Land Tax – the amount of tax paid by landowners to the government. Land tax could be zero if the government waived the payment. Express the cost in per hectare and per season bases. In the cost-and-return table, take the average of land tax per hectare, includ-ing those with zero entries.
12) Land Rent
• Land rent is the amount paid (in cash equivalent) by a share tenant or lessee to the landowner for the use of land in rice production. Express the cost in per-hectare and per-season basis. To convert land rent on a per-season basis, divide the payment by two or three, depending on the number of cropping seasons in that year if the basis of payment is annual.
• For landowners and mortgagers, impute the value of land rent by using the average land rent of share tenants and lessees. The intuition behind this is that land rent for landowners is not really zero but only unobserved. Hence, by taking the average land rent for share tenants and lessees, we would be able to impute the value of land rent in cases where it is unobserved.
13) Other Input Cost – This refers to the cost of other materials used in rice production such as, but not limited to, sack, twines, and plastic sheets. Express the cost in per-hectare basis. In the cost-and-return table, take the average per hectare cost of the other inputs, including those with zero entries.
• Impute sack cost by dividing the gross harvest (in kilogram) by the average weight (in kilogram) per bag. Multiply this by the average price of the sack. To get the seasonal cost, divide the resulting amount by the common number of seasons that a sack is used (depending on the country). This should be done even if farmers used old sacks or fertilizer sacks.
• Sack cost would only be zero in cases where farmers did not use sacks as output packaging (i.e., direct from the combine harvester to the truck to the trader).
14) Interest Cost of Capital
• The capital used in rice production consists of the cash expenditure spent by a farm-er. This is composed of
- Paid-out seed cost
- Paid-out cost of fertilizer, chemical pesticides, and other material inputs (biofer-tilizers). Sacks and twines are NOT included.
- Pre-harvest hired labor, EXCEPT those paid in-kind (pre-harvest means land preparation, crop establishment, and crop care EXCEPT field monitoring). OFE labor cost is not included.
- Pre-harvest power cost, except those paid in kind. This includes paid-out costs on animal and machine rent, and fuel and oil.
Costs of Rice Production

116 Competitiveness of Philippine Rice in Asia
- NOT INCLUDED IN THE CASH EXPENDITURE: permanent hired labor, food, transportation, irrigation fee, land tax, land rent, and other input cost
• We will assume a maximum of 4 months as loan duration. Any loan period longer than this suggests that the money is used for purposes other than rice production. If the actual loan duration is less than 4 months, use the actual loan duration. Otherwise, use 4 months.
• Ask for a savings rate in a couple of banks in your respective area. This sav-ings rate should apply for a small amount of deposit, say around US1000 (in local currency equivalent). Use of secondary data on savings rate can also suffice.
• Determine the amount borrowed for rice production, which is the total bor-rowing multiplied by the percent used in rice farming.
• The interest cost of capital can be computed as follows:
- Case A: Farmer is the owner of capital (amount borrowed = 0)
where Cashexp is the total cash expenditure of the farmer, d is the nominal monthly savings rate in the area (based on secondary literature or obtained by asking a bank in the location).
- Case B: Farmer is partial owner of capital (amount borrowed < cash expenditure)
where Borrow is the amount borrowed for rice production, Cashexp is the total cash expenditure of the farmer, r is the actual monthly borrowing rate faced by the farmer, and d is the nominal monthly savings rate in the area.
- Case C: Farmer has over-borrowed. (amount borrowed > cash expendi-ture)
where Cashexp is the total cash expenditure of the farmer and r is the actual monthly borrowing rate faced by the farmer.
117
- Case D: Farmer borrowed exactly the amount of cash expenditure (amount borrowed = cash expenditure)
where Borrow is the amount borrowed for rice production and r is the actual monthly borrowing rate faced by the farmer.
• Express the interest cost in per hectare form. In the cost-and-return table, take the average cost per hectare of interest cost on capital, including those with zero entries.
II. RETURNS
1) Yield – take fresh weight of production and convert it in terms of kilogram per hectare by dividing with area planted. If yield is given in dried form, convert it into fresh form:
2) Price per Kilogram – take the price per kilogram of fresh paddy. If the price given is on a per dried weight basis (based on prevailing dry moisture content [MC] in the country), assume a fresh MC (based on prevailing fresh MC in the country per season) and estimate the price of fresh paddy using
3) Gross Revenue - calculate gross revenue per hectare by multiplying the yield and price.
4) Net Profit from Rice Farming – subtract total production cost per hectare from gross revenue to get net profit from rice farming
5) Income of Rice Farmer Who Does Not Own Land and Capital – this is composed of net profit from rice farming and OFE labor
6) Income of Rice Farmer Who Own the Land but Not Capital – this is composed of net profit from rice farming, OFE labor, and land rent
7) Income of Rice Farmer who Own Land and Capital – this is composed of net profit from rice farming, OFE labor, land rent, and interest on capital
Costs of Rice Production

118 Competitiveness of Philippine Rice in Asia
PROFITABILITY OF RICE FARMINGPiedad F. Moya, Flordeliza H. Bordey, Jesusa C. Beltran, Samarendu Mohanty, and David C. Dawe
Key messages:• Paddy prices are highest in importing countries.
• In terms of net income from rice farming per household, Thailand ranks first among the six countries because of the large area cultivated. The Philippines ranks fifth.
• Farmers in all locations earn more than enough income from rice alone, exceeding the national poverty threshold.
In a competitive rice economy, knowing the profitability of rice production is essential to sustain rice production. High cost and low profitability discourage production; conversely, low cost and high returns boost production. To date, there exist no
comparable and comprehensive data on profitability of rice production at the farm level that is available in major rice-producing countries of Asia. The studies done are usually country-specific and refer to different time periods (e.g., Arayaphong, 2012; Estudillo and Fujimura, 2015).
Profitability is likely to vary across agroecological zones aside from the fact that farmers have cultural practices of their own. They also face different production constraints, are exposed to different weather conditions, and have different natural endowments, resources, and access to variable inputs.
This chapter provides the most recent comparative cross-country data on rice farming profitability that could be useful to farmers, businessmen, policymakers, and researchers. It also differentiates financial net profitability of rice farming from the income received by farmers after accounting for their own inputs (e.g., own labor, land, and capital). The report also describes rice farming income in relation to the poverty threshold of each country after adjusting for purchasing power parity.
Methods
A simple farm budget analysis was done considering all the costs of inputs used in rice production and revenues generated from its output. Data on costs are already discussed in detail in the chapter on Costs of rice production. On the revenue side, output refers to dry paddy yield (14% moisture content [MC]) per unit area cultivated.
10
119

120 Competitiveness of Philippine Rice in Asia
These data were used to estimate and compare the profitability of rice production among six major rice-producing countries in Asia: Thailand, Vietnam, Indonesia, Philippines, India, and China (see chapter on The benchmark data: sources, concepts, and methods).
A farm budget structure was constructed for paddy production in each target site using actual prices received by rice farmers. To assess the profitability of rice production, the following formula was used:
NR = GR- TC (1)
where gross revenue (GR) is the annual total output per hectare expressed in kilogram multiplied by the price of paddy. Total cost (TC) refers to the yearly cost of production per hectare, and net return (NR) is the difference between GR and TC.
The GR minus paid-out costs (POC) represents the net income (INC) that was actually received by farmers who own their land (in other words, their take-home pay). POC excludes the imputed values of OFE labor and the opportunity costs of own land and capital.
INC = GR – POC (2)
All values are expressed in US dollars (US$) using the exchange rate provided in the chapter on Costs of rice production (see Table 9.1). In addition, for an alternative comparison of income across countries, INC was converted into international dollars using the purchasing power parity (PPP) exchange rate. PPP is the rate of currency conversion that equalizes the purchasing power of different currencies by eliminating the difference in price levels between countries. In their simplest form, PPPs are simply price relatives that show the ratio of the prices in national currencies of the same goods or service in different countries (www.oecd.org/std/ppp/faq). (See Box 1 for simple examples and practical application of PPP). Considering this, instead of using the US$ rate, we estimated net income in terms of PPP exchange rate (Table 10.1).
Box 1: How the PPP rate worksThe use of exchange rate to convert per capita income of other countries into dollars
without regard for the purchasing power of money in those countries grossly exaggerates the difference between high-income and low-income countries. A classic text book example is the Big Mac hamburger. A Big Mac burger of McDonald’s is a relatively standard commodity across countries that includes input costs from a wide range of sectors in the local economy, such as agricultural commodities (beef, bread, lettuce, cheese), labor (blue and white collar), advertising, rent and real estate costs, transportation, etc. Yet, it is more expensive in a high-income country compared with a low-income one. For example, US$1,000 in the Philippines will buy more goods and services than in the USA. PPP exchange rates correct for this effect, so that PPP international $1,000 buys you the same amount of goods and services in both the USA and the Philippines.

121
Table 10.1. Purchasing power parity exchange rates in 2013.
Country PPP Exchange ratePhilippines 17.56China 3.55Indonesia 3,792.55India 16.72Thailand 12.34Vietnam 7,546.59
Source: World Bank, 2015.
Gross revenue
Paddy yield in dried form (14% MC) and its prices are summarized in Table 10.2. Vietnam had the highest annual paddy production at almost 20.6 t ha-1, partly because of high per-season yield but mainly because of triple cropping. China was a far second with an annual production of 13.6 t ha-1. Indonesia and Thailand had 11.5 and 10.5 t ha-1, respectively. The lowest was India at 8.9 t ha-1
, closely followed by the Philippines
at 9.5 t ha-1.
Table 10.2. Mean paddy yield and prices, six country sites, crop year 2013-2014.
Country High-yielding season Low-yielding season AnnualYield
(t ha-1)Price
(US$ t-1)Yield
(t ha-1)Price
(US$ t-1)Yield
(t ha-1)Price
(US$ t-1)Philippines 5.68 389 3.84 429 9.52 405China 7.46 437 6.10 524 13.56 476Indonesia 6.11 494 5.42 497 11.53 495India 4.32 266 4.60 242 8.93 254Thailand 5.16 331 5.31 333 10.47 332Vietnam 8.56 247 6.33 211 20.59 227Vietnam(3rd crop) 5.69 215
The highest annual average price per ton was seen in Indonesia and China, at US$495 and US$476, respectively. Among the importing countries, the Philippines had the lowest price at US$405 t-1. Nevertheless, this price is still high compared with those in exporting countries. The lowest prices were in Vietnam (US$227 t-1) and India (US$254 t-1). The price in Thailand, in the absence of the rice pledging scheme, was US$332 t-1.1 Price has a significant effect on the estimated gross revenue as explained in the next section.
1 We used the prevailing price of paddy in Thailand in the absence of the rice pledging scheme, given that the program was already removed in 2014 with a minuscule probability of being implemented again. It should be noted, however, that our survey was conducted in 2013 when the scheme was still in effect.
Profitability of Rice Farming

122 Competitiveness of Philippine Rice in Asia
Because of high yield and high paddy price, China got the highest GR per hectare, amounting to almost US$6,500 per hectare per year, followed by Indonesia at around US$5,700 (Fig. 10.1). As expected, the lowest GR per hectare was received by Indian farmers. It is evident in the data that, aside from the lowest yield, the price of paddy that Indian farmers received was only about 40% of the prices received by his fellow farmers in other sites, causing it to get the lowest GR. Vietnam, in spite of the highest output of more than 20 t ha-1, ranks third in GR because its paddy price is much cheaper; less than half those of China and Indonesia. The Philippines’ performance is better compared with India and Thailand; however, it is far behind Indonesia and China, its co-importing countries.
Fig. 10.1. Comparative annual gross revenue per hectare, selected Asian rice bowls, crop year 2013-2014.
Costs and returns
Table 10.3 summarizes the annual costs and returns to rice production across the six Asian countries. Because of its relatively high production and price, China got the highest NR (US$1,957) despite the highest production cost. In contrast, despite the lowest price, Vietnam got the second highest annual NR per hectare (US$1,504) due to its high yield. It must be noted that Vietnam has three crop seasons in a year with high land productivity per season. Indonesia ranked third in terms of NR (US$1,447) due to moderately high yield and highest paddy price.
Table 10.3. Annual costs and returns of rice production (US$ ha-1 yr-1), selected Asian countries, crop year 2013-2014.
Item Philippines China Indonesia India Thailand VietnamGross revenue (US$ ha-1 yr-1) 3,860 6,452 5,712 2,264 3,474 4,670 Yield (14% MC in t ha-1 yr-1 ) 9.52 13.56 11.53 8.93 10.47 20.59 Price per ton (US$ t-1) 405 476 495 254 332 227Total production costs (US$ ha-1 yr-1) 2,783 4,495 4,265 1,866 2,184 3,165Total paid-out costs (US$ ha-1 yr-1) 2,064 2,475 2,107 1,336 1,541 2,015Net returns (US$ ha-1 yr-1) 1,077 1,957 1,447 399 1,290 1,504Income from rice (GR-paid out costs)(US$ ha-1 yr-1) 1,796 3,977 3,605 928 1,933 2,655
123
Thailand’s annual net returns ranked fourth at US$1,290. This was much lower than the estimated NR in Thailand during the pledging scheme (Manalili et al., 2015). Despite the relatively high price of paddy, the Philippines was second to the last in annual NR at US$1,077 for every hectare. This is due to its low production, particularly in the low-yielding season (wet season) and relatively high cost of production. Again, India got the lowest NR at a meager amount of US$399 per hectare despite posting the lowest production cost.
On a per-season basis, a bigger proportion of the annual NR per hectare for the Philippines, Indonesia, India, and Vietnam came from the HYS (NR from one HYS in Vietnam are still substantially more than the sum of NR across two LYS). However, for China, the reverse is true and this is attributed to the higher price of inbred rice during LYS. This higher price was caused by the support price given by the government during that season. Meanwhile, for Thailand, the NR for HYS and LYS were almost equal. (see Appendix Tables 10.1a and 10.1b.)
In terms of income (gross returns minus paid-out costs) per hectare, China consistently ranked first. Surprisingly, Indonesia ranked a close second because of the high opportunity costs of land and OFE labor. Vietnam slid to third rank because of its low labor use and relatively lower value of land compared with China and Indonesia. Thailand and the Philippines remained at fourth and fifth rank, respectively, with almost similar values of income. India was still at the bottom, although the magnitude of income from rice had more than doubled relative to its NR.
Annual household income from rice farming
Earlier, we said that the gross return minus paid-out costs is what the farmer brings home to the family, the take-home pay; thus it will be considered net income for the household as discussed in this section. Table 10.4 shows the annual net income from rice farming in international dollars (I$, i.e., in PPP). Considering the PPP in each country, net income from rice farming significantly varied across countries. All estimated values were more than double the net income in US$, except for China. The annual net income ranged from I$3,252 to I$9,944 at PPP exchange rate, compared with US$928 to US$3,977 at nominal exchange rates. Since the incomes in I$ are now comparable across countries (e.g., the same I$ can buy the same amount of goods and services), it turns out that Indonesia had the highest net income from rice farming per hectare, while India had the lowest. Although the magnitude of net income has improved due to the conversion, the Philippines still was at the second to lowest level among the six countries.
Profitability of Rice Farming

124 Competitiveness of Philippine Rice in Asia
Table 10.4. Annual household income for rice farming at PPP, selected Asian countries, 2013 (I$).
Item Philippines China Indonesia India Thailand VietnamNet income (US$ ha-1 yr-1) 1,796 3,977 3,605 928 1,933 2,655Net income (l$ ha-1 yr-1)(PPP) 4,342 6,744 9,944 3,252 4,814 7,365Area cultivated (ha) 2.08 0.48 1.55 3.20 4.45 1.35Annual income from rice farming per household (l$ yr-1)
9,031 3,237 15,413 10,408 21,421 9,942
It must be noted that the discussion of net income above is on a per-hectare basis. However, Asian farmers have different cultivated areas hence, annual household income from rice varies a lot. The estimated annual household income (from rice) are shown in the last row of Table 10.4. Because Thailand had the biggest rice area cultivated (4.45 ha), it ranked first in annual household income with a staggering value relative to other countries at I$21,421. On the other hand, China, which had the smallest rice area cultivated (0.48 ha) had the lowest annual household income from rice, at around I$3,237. But rice farm income only accounted for 27% of their total household income (see chapter on Profile of an Asian rice farmer).
Indonesia is a distant second to Thailand in terms of household income, at around I$15,413. India’s annual household income from rice was also much better than in earlier comparisons due to the larger area under cultivation (3.21 ha), ranking third at I$10,408. The Philippines (I$9,031) was now at par with Vietnam (I$9,942) in terms of rice income per household because of the former’s bigger area cultivated.
Poverty threshold and rice income
It is a common belief that farmers do not earn enough from rice farming to sustain a decent living or at least provide for food and basic necessities for their family. To test if this holds true for the irrigated rice farm household, we compared per capita rice income to per capita poverty threshold (Table 10.5). A ratio of more than unity indicates that income from rice farming can support the basic needs of the family beyond the poverty threshold.
Table 10.5. Ratio of farm income to poverty threshold, irrigated farm households in selected countries in Asia, 2013.
Item Philippines China Indonesia India Thailand VietnamAnnual income from rice farming per household (l$ yr-1)
9,031 3,237 15,413 10,408 21,421 9,942
Household size (no.) 4.60 3.70 3.83 5.16 4.67 4.90Per capita rice income (l$) 1,963 875 4,024 2,017 4,587 2,029Per capita poverty threshold (‘l$) 1,161 842 873 631 2,356 906Ratio of per capita rice income to poverty threshold 1.69 1.04 4.61 3.20 1.95 2.24
Sources of data for per capita poverty threshold:Philippines: NSO, 2012 • Indonesia: BPS, 2013 • China: ILO, 2003 • Thailand: NSO, 2013 • Vietnam: GSO, 2014 • India: GIPP, 2013.
125
An initial evaluation of the per capita income per household revealed the same pattern as annual household income from rice farming, since household size did not differ that much, typically being between four and five family members. Thailand had the highest per capita income derived from rice at around I$4,587, closely followed by Indonesia. This value is more than twice that of the Philippines, India, and Vietnam. Again, China had the lowest value at less than I$1,000 per capita rice income.
Instead of using the global (international) poverty threshold, we used the country-specific poverty threshold2 and converted that threshold into I$ (PPP) for comparison purposes. As shown in the estimated ratio of per capita farm income to poverty threshold, all countries had per capita income from rice that is enough or more than enough to meet the poverty threshold. Indonesia and India had the highest ratios of about 4.6 and 3.2, respectively. This implies that farmers in these countries have incomes that are more than enough to meet their basic needs and thus have a better standard of living because of the income from rice farming.
In the case of China, where the ratio was lowest (1.04), the low rice farm income is not a big issue inasmuch as they depend more on non-farm income. In the Philippines, per capita income from rice alone (1.69) is more than enough to get the household out of poverty, even though other countries have higher income poverty ratio.
However, rice farming is not the only source of household income of the farm family as shown in the profile of rice farmers (Fig. 3.2). As indicated, all Asian farm households have other sources of income. In the case of the Philippines, a long-term study on the changes in rice farming showed a declining trend in the proportion of income coming from rice (Moya et al., 2015).
Summary and implications
This study demonstrates that rice production in intensively irrigated areas in the major rice-producing areas in Asia is profitable, considering the positive values of NR per hectare. It was also shown that the annual household income from rice farming is more than enough to meet the poverty threshold income for all locations.
It is clear from the analysis that profitability of rice farming is greatly influenced by first, the interplay of paddy prices and yield, and second, the magnitude of costs of production. Thailand production appears to be the most profitable because of its relatively low cost of production, moderate gross revenue, and bigger area cultivated.
The Philippines is consistently second to the last in all income aspects discussed above. This suggests that the Philippines must improve not only its yield but also reduce its production cost in order to generate more income for farmers.
2 The global poverty line is used primarily to track global extreme poverty and to measure progress on global goals. A country’s national poverty line is more appropriate for underpinning domestic policy dialogue or targeting programs to reach the poorest. FAQs: Global Poverty Line Update, Sept 30, 2015. (http://www.worldbank.org/)Poverty(/en/topic/poverty)
Profitability of Rice Farming

126 Competitiveness of Philippine Rice in Asia
References
Arayaphong S. 2012. Cost-benefit analysis of different rice cropping systems in Thailand. Uppsala, Sweden: Department of Earth Science, Uppsala University. Villavagen 16, SE-752 36 Uppsala, Sweden.
[BPS] Badan Pusik Statistik (of Indonesia). 2013. http://www.bps.go.id/Subjek/viewid/23#subjek ViewTab3|accordion-daftar-subjek1. February 5, 2015.
Estudillo JP, Fujimura M. 2015. Comparative advantage in rice production: Vietnam and Myanmar. Unpublished.
[GIPP] Government of India Planning commission. 2013. Press note on poverty estimates, 2011—2012. http://planningcommission.nic.in/news/pre_pov2307.pdf. February 5, 2015.
[GSO] General Statistics Office (of Vietnam). 2014. Monthly expenditure per capita sheets. http://www.gso. gov.vn/default_en.aspx?tabid=474&idmid=3&ItemID=15195. December 20, 2014
[ILO] International Labor Organization. 2003. Estimated poverty line. www.ilo.org/public/english/protection/ses/download/docs/china.pdf. February 5, 2015.
Manalili RG, Marciano EB, Viray CA, Tanzo IR, Bordey FH, Moya PF. 2015. The Thailand rice economy under the government rice-pledging scheme: the case of SuphanBuri. Science City of Muñoz (Philippines): Philippine Rice Research Institute and Los Baños (Philippines): International Rice Research Institute. 26 p.
Moya PF, Kajisa K, Barker R, Mohanty S, GasconF, San Valentin ML. 2015. Changes in rice farming in the Philippines: insights from five decades of a household-level survey. Los Baños (Philippines): International Rice Research Institute. 145 p.
[NSO] National Statistical Office. 2013. Statistical yearbook. http://web.nso.go.th/en/pub/e_book/ YEARBOOK_2013/#400_401. February 10, 2015.
[NSO] National Statistics Office. 2012. http://www.census.gov.ph. January 20, 2015.
The World Bank 2015. FAQs: global poverty line update http://www.worldbank.org/en/topic/poverty/brief/global-poverty-line-faq.print

127
Appendix Table 10.1a. Cost and returns by season, selected Asian countries, US$ ha-1, crop year 2013-2014.
High-yielding season
Item Philippines China Indonesia India Thailand VietnamReturns Dry yield (14% MC, kg ha-1) 5,680.16 7460.09* 6113.26* 4323.06* 5159.68* 8560.22*Dry paddy price (US$ kg-1) 0.39 0.44* 0.49* 0.27* 0.33* 0.25*Gross revenue (US$ ha-1) 2,212.25 3258.07* 3021.65* 1149.27* 1706.66 2112.54Costs (US$ ha-1) Seed 72.01 163.16* 20.11* 51.57* 137.88* 79.10Fertilizer 232.01 338.80* 138.58* 95.17* 186.74* 193.79*Chemicals 42.53 302.89* 132.03* 21.52 109.79* 140.11*Hired labor 453.96 90.83* 609.29* 279.92* 82.52* 70.43*Operator, family, & exchange labor 75.60 498.70* 150.26* 56.76 77.49 135.28*Animal, machine, fuel & oil 206.37 505.48* 68.89* 181.47 222.24 127.66*Irrigation 59.74 0.00* 19.92* 11.92* 15.32* 16.07*Food 25.63 0.00* 41.14* 12.45* 6.19* 0.20*Transportation 7.26 19.47* 14.11 3.83 19.95* 6.80Tax 4.48 0.00* 27.46* 2.78 0.29* 0.00*Land rent 241.37 606.46* 888.73* 202.40* 236.10* 241.85Interest on capital 53.92 1.30* 44.26 10.17* 7.73* 7.13*Other inputs 13.90 2.78* 16.61* 13.75 0.00* 17.84*Total Cost (US$ ha-1) 1488.79 2529.88* 2171.41* 943.74* 1102.24* 1036.27*Cost (US$ kg-1) 0.26 0.34* 0.36* 0.22* 0.21* 0.12*Net Returns (US$ ha-1) 723.46 728.20 850.24 205.54* 604.43* 1076.27*Net Returns Over Paid-out Costs (US$ ha-1) 1094.36 1834.66* 1933.50* 474.88* 925.74* 1460.53**Significantly different from Philippine values at 95% level of confidence
Profitability of Rice Farming

128 Competitiveness of Philippine Rice in Asia
Appendix Table 10.1b. Cost and returns in the low-yielding season, selected Asian countries, US$ ha-1, crop year 2013-2014.
Low-yielding seasonItem Philippines China Indonesia India Thailand Vietnam
Returns Dry yield (14% MC, kg ha-1) 3839.85 6100.49* 5417.41* 4603.36* 5313.96* 6333.36*Dry paddy price (US$ kg-1) 0.43 0.52* 0.50* 0.24* 0.33* 0.21*Gross revenue (US$ ha-1) 1648.10 3193.73* 2690.32* 1114.94* 1767.07* 1333.59*Costs (US$ ha-1) 0.00 0.00 0.00 0.00 0.00Seed 57.26 81.33* 20.00* 43.39* 138.41* 67.70*Fertilizer 202.91 269.34* 145.62* 96.12* 199.05 241.65*Chemicals 38.20 120.63* 148.31* 25.30 112.54* 140.87*Hired labor 389.59 67.20* 555.92* 249.72* 79.39* 78.72*Operator, family, & exchange labor 71.60 306.55* 127.94* 42.02* 81.78 127.11*Animal, machine, fuel & oil 180.71 503.30* 67.38* 193.24 188.47 136.88*Irrigation 40.33 0.00* 8.36* 12.71* 18.65* 15.97*Food 16.68 0.00* 24.11* 18.49 5.91* 0.74*Transportation 5.90 6.15 4.04 5.56 16.90* 6.91Tax 4.96 0.00* 19.92* 2.60* 0.34* 0.00*Land rent 232.55 606.46* 908.06* 209.87* 231.20* 238.06Interest on capital 43.44 0.88* 39.34 8.55* 8.67* 19.23*Other inputs 10.00 3.18* 24.73* 14.26* 0.00* 13.35*Total Cost (US$ ha-1) 1294.12 1965.02* 2093.73* 921.82* 1081.31* 1087.17*Cost (US$ kg-1) 0.34 0.32 0.39* 0.20* 0.20* 0.17*Net Returns (US$ ha-1) 353.98 1228.71* 596.59* 193.12* 685.76* 246.42Net Returns Over Paid-out Costs (US$ ha-1) 701.57 2142.59* 1671.93* 453.56* 1007.41* 630.82 *Significantly different from Philippine values at 95% level of confidence
RICE PRICES AND MARKETING MARGINSJesusa C. Beltran, Flordeliza H. Bordey, Piedad F. Moya, Cheryll C. Launio, Rowena G. Manalili, Esther B. Marciano, Mary Rose L. San Valentin, Ma. Shiela D. Valencia, and David C. Dawe
Key messages:• The gross marketing margin (difference between farm and wholesale prices) is
higher in the Philippines than in Indonesia, Thailand, and Vietnam.
• Costs for transportation, milling, packaging and working capital are the largest sources of higher costs in the Philippines (with drying and storage being less important).
• Marketing costs in the Philippines can be reduced through better road networks, mechanization of loading and unloading, higher capacity utilization of mills, lower paddy prices (which would lower the need for working capital) and increased marketing competition (possibly through more foreign direct investment to give farmers more sale options).
Competitiveness rests on the ability of a farmer to produce a good (paddy) at a cost lower than that of his local or international competitors (Yap, 2004). However, competitiveness does not end at the farm level. Processing and marketing costs
also matter.
Milled rice is the commodity that is bought from the market, cooked, and eaten by consumers. It is “produced” by the marketing system from paddy, the product grown by farmers. An efficient marketing system that incurs low costs in transporting, drying, storing, milling, and processing of rice will result in lower rice prices that will benefit rice consumers. However, rice prices have historically been much higher in the Philippines and its co-importer, Indonesia, compared with those in Thailand and Vietnam (Fig. 11.1).
Given this context, an analysis of rice processing and marketing costs can provide many insights into the reasons for the wide price differences across countries. In a competitive marketing system, there should be no substantial differences in prices and margins, assuming that they operate in a more or less similar technology level. Thus, this paper aims to a) compare rice prices and marketing margins across countries; b) determine and explain possible sources of differential marketing costs and returns; and c) suggest policy options and recommendations to reduce marketing margins for the benefit of both farmers and consumers.
11
129
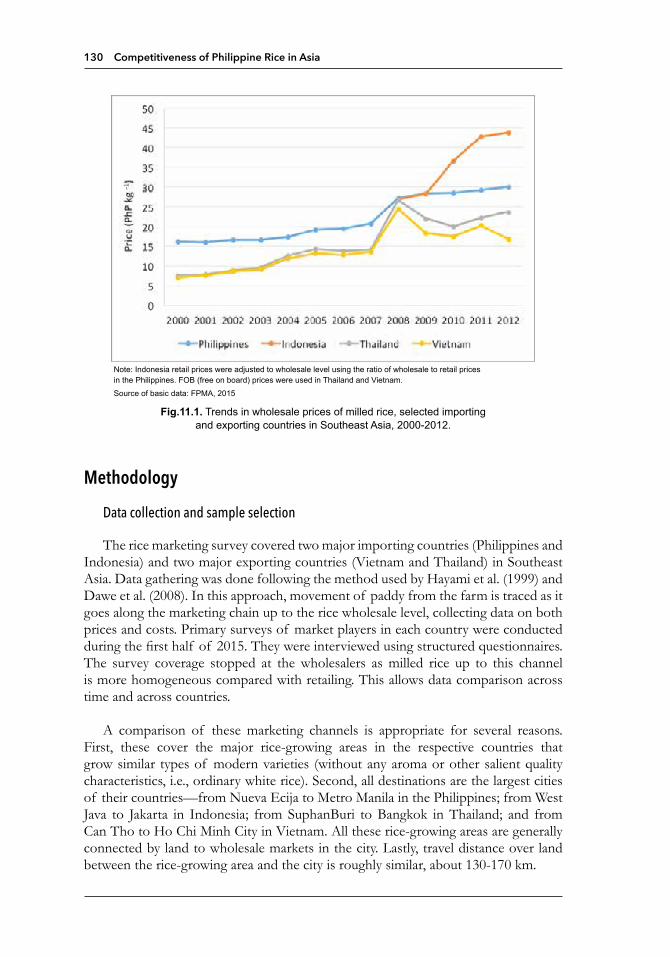
130 Competitiveness of Philippine Rice in Asia
Note: Indonesia retail prices were adjusted to wholesale level using the ratio of wholesale to retail prices in the Philippines. FOB (free on board) prices were used in Thailand and Vietnam.
Source of basic data: FPMA, 2015
Fig.11.1. Trends in wholesale prices of milled rice, selected importing and exporting countries in Southeast Asia, 2000-2012.
Methodology
Data collection and sample selection
The rice marketing survey covered two major importing countries (Philippines and Indonesia) and two major exporting countries (Vietnam and Thailand) in Southeast Asia. Data gathering was done following the method used by Hayami et al. (1999) and Dawe et al. (2008). In this approach, movement of paddy from the farm is traced as it goes along the marketing chain up to the rice wholesale level, collecting data on both prices and costs. Primary surveys of market players in each country were conducted during the first half of 2015. They were interviewed using structured questionnaires.The survey coverage stopped at the wholesalers as milled rice up to this channel is more homogeneous compared with retailing. This allows data comparison across time and across countries.
A comparison of these marketing channels is appropriate for several reasons. First, these cover the major rice-growing areas in the respective countries that grow similar types of modern varieties (without any aroma or other salient quality characteristics, i.e., ordinary white rice). Second, all destinations are the largest cities of their countries—from Nueva Ecija to Metro Manila in the Philippines; from West Java to Jakarta in Indonesia; from SuphanBuri to Bangkok in Thailand; and from Can Tho to Ho Chi Minh City in Vietnam. All these rice-growing areas are generally connected by land to wholesale markets in the city. Lastly, travel distance over land between the rice-growing area and the city is roughly similar, about 130-170 km.

131
A sample quota of 10 paddy traders, 10 millers, and 10 wholesalers was interviewed in each country. The common milling capacity of mills in the survey areas in the Philippines was 2-6 tons (t) of milled rice per hour (hr); the corresponding values were 1-12 t hr-1 in Indonesia, 8-38 t hr-1in Thailand, and 5-19 t hr-1 in Vietnam1.
Analytical methods
The study estimated gross marketing margins (GMM), costs, and returns above major costs per kilogram (kg) of milled rice at different stages of the marketing system based on data and information gathered from sample respondents for each of the different types of agents.
In this study, GMM is defined as the difference between wholesale price and farm price in milled rice equivalent:
(1)
The first term W represents the price of 1 kg of rice at the wholesale market. The second term is defined as the price of 1 kg of dry paddy in milled rice equivalent:
(2)
where fp is the farmgate price of wet paddy; MC is the moisture content of wet paddy as sold by the farmer, as a fraction of one; and MR is milling recovery, i.e., the yield of milled rice as a fraction of one. The second factor on the right hand side of equation (2) adjusts the wet paddy to a moisture content of 14%, the typical moisture content when paddy is milled. This adjustment to does not include the costs of drying2 but is just a physical adjustment factor to standardize moisture content. The adjusted is then divided by MR (the third factor in equation [2]) to generate and to ensure that the units of W and are identical.
The GMM is composed of marketing costs and returns to management. Our survey covered major marketing costs such as transportation, drying, storage, milling, packaging, and cost of working capital, which are incurred at all sites and indeed in all rice marketing levels. Since other components of marketing costs (e.g., government fees, management costs) were not included, we cannot strictly calculate returns to management or income of market players. Instead, we calculated returns above major costs—i.e., the difference between GMM and total major marketing costs. However, because we have estimates of major costs, we expect that cross-country patterns in returns above major costs would be similar to patterns in returns to management.
1 Note that the milling capacity of rice mills in the Philippine is small relative to that in other countries. Larger mills exist in the Philippines, but owners were unavailable for interview at the time of the survey. 2 The costs of drying are not included in the calculation of the GMM, nor are any other costs. However, the costs of drying are included in the subsequent analysis.
rp
fp
fp rprp
Rice Prices and Marketing Margins

132 Competitiveness of Philippine Rice in Asia
To facilitate comparison, all units of the local currency from other countries were initially converted into US dollar equivalents using exchange rates of 10,471 rupiah (Indonesia), 30.73 baht (Thailand), and 20,933 dong (Vietnam) to a dollar. Afterwards, US dollar equivalents were converted into Philippine pesos at an exchange rate of 42.50 pesos to the dollar (see Table 9.1 in chapter on Costs of rice production).
Limitations of the marketing survey
The marketing survey was more difficult to conduct than the farm household survey. It was difficult to make an appointment with many of the marketing agents, particularly the owners of the big rice mills and the big wholesale stores. Some of them were very helpful and offered lots of information, but many of them were very busy, cautious, and hesitant to give information on costs, prices, and volume of operation. Therefore, the conclusions here are perhaps somewhat tentative. Nevertheless, to ensure data quality, all collected information were cross-checked with those obtained from other levels of the marketing system and with those obtained from other players at the same level.
Differences in paddy prices
High paddy prices are one of the major factors that contribute to high rice prices in a country. As discussed in Chapter 9, the cost of paddy production in importing countries like the Philippines (Launio et al., 2015) and Indonesia (Litonjua et al., 2015) were higher than that of major exporters such as Thailand (Manalili et al., 2015) and Vietnam (Beltran et al., 2015). The higher costs of production (coupled with import restrictions) translate into higher farmgate prices in these importing countries relative to Thailand and Vietnam, where wet paddy prices are less than PhP 10 kg-1 (Fig. 11.2). Adjusting paddy’s initial moisture content (MC) that ranged from 22 to 25%, the price of dry paddy at 14% MC was around PhP 18 kg-1 in the Philippines and PhP 22 kg-1
in Indonesia. These values were almost double the prices in Thailand and Vietnam which were just around PhP 11 kg-1.
The prices of dry paddy were adjusted to its milled rice equivalent3 using the average milling ratio provided by market players during the survey. A milling ratio of 64.5% was used in the Philippines; it was 66.3% in Indonesia, 64.4% in Thailand, and 65.8% in Vietnam. Our estimates are that the price of dry paddy, in terms of milled rice equivalent, is PhP 28 kg-1 in the Philippines and PhP 33 kg-1 in Indonesia. This compares to only about PhP 17 kg-1 in Thailand and Vietnam (Fig.11.2), implying that the price of paddy, being the raw material for milled rice, is high and has made a large contribution to the higher rice prices in the Philippines and Indonesia.
3 Milled rice equivalent of dry paddy is calculated by dividing the price of dry paddy by the average milling recovery.

133
Fig. 11.2. Comparative farmgate and wholesale rice prices.
Differences in gross marketing margins
High GMM is another main factor that causes higher prices of milled rice. At the given wholesale price of rice (Fig.11.2), the estimated GMM in the Philippines (PhP 9.06 kg-1) was substantially higher than that in Indonesia (PhP 5.61 kg-1), Thailand (PhP 5.27 kg-1), and Vietnam (PhP 4.55 kg-1) (Table 11.1). The larger magnitude of the Philippines’ GMM is surprising because of the broad similarities in the marketing systems of these four countries. The two key factors responsible for the high GMM are the high costs of marketing and the enormous returns to management. Accordingly, it is important to look at the sources of differences in the marketing costs and returns in these four countries.
Table 11.1. Differential gross marketing margins (GMM) and marketing costs, by function, PhP kg-1 of milled rice.
Item Philippines (PH)
Indonesia (IND)
Thailand (TH)
Vietnam (VN)
Differential PH vs IND
Differential PH vs TH
Differential PH vs VN
Gross marketing margins (GMM) 9.06 5.61 5.27 4.55 3.45 3.79 4.51
Total marketing cost 4.63 4.97 2.73 3.78 -0.33 1.91 0.85
Drying cost 0.26 0.62 0.33 0.52 -0.36 -0.07 -0.26
Transport cost 2.09 2.22 1.08 1.76 -0.12 1.02 0.33
Milling cost 1.38 1.22 0.89 0.93 0.16 0.48 0.44
Storage cost 0.19 0.40 0.20 0.23 -0.21 -0.02 -0.04
Packaging cost 0.45 0.24 0.14 0.22 0.21 0.30 0.22
Cost of working capital 0.27 0.28 0.09 0.11 -0.01 0.18 0.16
Returns above major cost 4.43 0.65 2.54 0.77 3.78 1.89 3.66
Rice Prices and Marketing Margins

134 Competitiveness of Philippine Rice in Asia
Differences in marketing costs
As mentioned earlier, the costs of marketing only covered drying, transportation, milling, storage, packaging, and cost of working capital. The labor costs involved in each function were not included separately but were embedded in the cost of each function. Table 11.1 shows the total marketing costs across countries. On average, Indonesia posted the highest marketing cost at PhP 4.97 kg-1, followed closely by the Philippines at PhP 4.63 kg-1; the lowest values were seen in Vietnam (PhP 3.97 kg-1) and Thailand (PhP 2.73 kg-1). The cost advantage of Thailand (PhP 1.91 kg-1) and Vietnam (PhP 0.89 kg-1) relative to the Philippines is attributed to a number of fundamental factors.
Transport cost
Transportation costs include the expenses incurred in moving the paddy from the farm to the wholesale market, including the labor costs incurred for loading and unloading of grains from each point of destination. It accounted for the biggest share in total marketing cost, more than 40%, on average, across countries (Table 11.1). It also accounted for the first and second highest percentage share in total marketing cost differences of the Philippines relative to Thailand and Vietnam, respectively.
On average, traders in Indonesia and the Philippines spent more than PhP 2.00 kg-1
for transportation (Table 11.1). The cost advantage in Thailand (PhP 1.00 kg-1) and Vietnam (PhP 0.50 kg-1) is primarily due to each country’s improved transportation system, which allows their marketing players to haul more tons of grains per liter of fuel. Trucks in Thailand and Vietnam that shuttle between rice-growing areas and large cities typically have a bigger capacity of about 30 tons, double the capacity of those used in the Philippines and Indonesia. Larger trucks are impractical to use in the latter countries because road quality is considerably worse than that in Thailand and Vietnam. In general, roads in the Philippines and Indonesia have more potholes, tend to pass through urban areas instead of passing the outskirts, and have fewer lanes, causing longer travel time. All of these factors make it difficult to drive large trucks. Moreover, there is a substantial amount of manual loading and unloading of grains in the Philippines and Indonesia. This process has been mechanized in Thailand and Vietnam. Traders in these countries are now using conveyor belts and they pay for the use of mechanized loaders instead of manual labor. This cuts the cost of hired labor in transporting grains.
Milling cost
Milling is another main part of the marketing process, accounting for about 30% of total marketing cost. On average, rice millers in the Philippines had the highest milling cost of PhP 1.38 kg-1, followed by rice millers in Indonesia with PhP 1.22 kg-1; the lowest costs were in Thailand and Vietnam, both less than PhP 1.00 kg-1(Table 11.1). The cost advantage of slightly less than PhP 0.50 kg-1of Thai and Vietnamese millers could be attributed to several factors.

135
First, most of the rice mills in the Philippines and Indonesia do not operate at full capacity compared with those in Thailand and Vietnam that operate at this level most of the time. Rice mills in the Philippines operate only for about 8 h a day during ordinary seasons and 16 h at peak periods, while their counterparts in Thailand and Vietnam operate almost 24 h daily. The underutilization of rice mills appears to be caused by the lower volume of paddy supply in the Philippines and Indonesia. Part of this might be due to the fact that traders in Thailand and Vietnam can procure rice from neighboring countries—for example, Vietnam buying from Cambodia and Thailand buying from Laos. It was not uncommon during the survey for Vietnamese traders to claim they bought paddy from Cambodia.
Second, the relatively expensive cost of paddy in the Philippines and Indonesia constrained millers from acquiring a larger volume of paddy as they need more working capital to finance such purchases. In fact, some rice millers in the Philippines during the survey said that they opted to concentrate in custom milling services for lack of enough cash capital to purchase paddy. Finally, the milling capacities of rice mills in these countries are relatively lower than those in Thailand and Vietnam.
Packaging cost
Several other factors also explain the marketing cost differences across countries. One is the high packaging cost spent for paddy and milled rice. On average, the Philippines recorded the highest cost of packaging at PhP 0.40 kg-1, almost twice the cost spent in Indonesia and Vietnam, which was less than PhP 0.25 kg-1 (Table 11.1). Thailand had the lowest packaging cost of just PhP 0.14 kg-1. Based on the survey, traders in Thailand no longer use sacks in transporting paddy from the farm to the market. The harvested paddy from the grain tank of the combine harvester is directly loaded to a truck through a swinging unloading conveyor. This process causes a substantial reduction in packaging cost. Another possible reason is the quality of materials used in paddy sack. Traders in the Philippines reported that their paddy sacks can only be used twice, on average, while their Indonesian and Vietnamese counterparts use the sacks three times or more.
Capital cost
The high cost of working capital also contributed to marketing cost differences across countries. The cost of working capital is calculated by multiplying the price of dry paddy by the banks’ investment loan interest rates and by the average number of storage period. The price of dry paddy was used in the computation since paddy is stored longer than milled rice.
Interest rates of banks in the Philippines were about 6% per annum. This loan interest rate has already improved a lot relative to that reported in previous studies of about 15% per annum (Cabling 2002; Casiwan et al., 2003; Dawe et al., 2008). Data on interest rates proved difficult to obtain, so we use the interest rate in the Philippines as the basis for comparison. To the extent that interest rates are lower in the other
Rice Prices and Marketing Margins

136 Competitiveness of Philippine Rice in Asia
countries, we are underestimating the importance of the cost of capital as a source of differential costs between countries.
In terms of storage time, the following were used: 3 months for the Philippines, 2.5 months for Indonesia, 1.6 months for Thailand, and 2 months for Vietnam. On average, the cost of working capital in the Philippines and Indonesia was nearly PhP 0.30 kg-1 (Table 11.1). This value is more than twice the cost incurred in Thailand and Vietnam. The higher cost of working capital in the Philippines and Indonesia is largely due to the expensive cost of dry paddy and the longer period of storage.
Drying cost
Drying is another important function of marketing that can contribute to cost differences. Table 11.1 shows the cost of drying paddy across countries. Indonesia posted the highest drying cost of PhP 0.62 kg-1, followed by Vietnam and Thailand with PhP 0.52 kg-1 and PhP 0.33 kg-1, respectively. The Philippines had the lowest drying cost with just PhP 0.26 kg-1. The cost advantage in the Philippines could be attributed to the popularity of solar drying among traders; here, they used public pavements or cemented roads to dry their paddy. On the other hand mechanical dryers were commonly used by traders in Indonesia, Thailand, and Vietnam. Solar drying is generally cheaper than mechanical drying because of zero fuel cost. However, solar drying negatively affects the quality of milled rice. The low head rice recovery or the higher percentage of broken rice is one example. Based on the survey, the Philippines got the lowest average head rice recovery, only 43%. This is below the standard of premium milled rice of 48% and above (RTWG, 1997).
Storage cost
Storage cost is another important part of the marketing process. Only the physical storage rental was considered in the cost estimation due to the absence of reliable information on storage losses. The average storage rental cost in the Philippines (PhP 0.19 kg-1) was comparable with that in Thailand (PhP 0.20 kg-1) and Vietnam (PhP 0.23 kg-1) but lower than that in Indonesia (PhP 0.40 kg-1) (Table 11.1). The results are surprising because there are modern silos in Thailand and Vietnam, whereas this method of paddy storage is not used in the Philippines. The cost spent for storage in modern silos per ton per month is relatively higher than the expenses incurred in a conventional warehouse. However, rice in Thailand and Vietnam is stored for a shorter time, offsetting the higher per-month costs. The shorter storage period in Thailand and Vietnam is the combined effect of their reduced seasonality of production and greater openness to trade. On the other hand, market players in the Philippines and Indonesia stored the paddy for a longer period to ensure the supply of paddy during lean months. This requires them to rent storage space longer, which consequently translates into higher storage cost.
After accounting for all of the fundamental sources of marketing cost differences, it appears that differential marketing costs of the Philippines relative to those of

137
Vietnam and Thailand explain nearly 20% and 50% of the differential gross margins, respectively. With comparable marketing costs for Indonesia and the Philippines, the difference in their gross margins is attributed to returns above major cost.
Differences in returns above marketing costs
Returns above marketing cost, defined as the difference between the GMM and marketing costs, were substantially greater in the Philippines than in Indonesia, Thailand, and Vietnam (Table 11.1). For example, if these returns were equal to that in Vietnam (PhP 0.77 kg-1) (Table 11.1), then the wholesale price of milled rice in the Philippines would be lower by 10%, i.e., PhP 33.16 kg-1 instead of PhP 36.82 kg-1.
One possible reason for the high returns above marketing costs in the Philippines is because of the higher returns to management. The explanation is that market players must make a living from their returns to management (Harriss, 1981). If the quantity milled or traded per player were low, then margins will need to be high in order to properly reward people with management skills and access to capital. As noted earlier, mills in the Philippines have lower capacity utilization than mills in other countries.
This argument of “making a living” becomes stronger when one considers the larger number of market intermediaries in the Philippines compared with that in other countries (who all must earn enough for a living). Layers of marketing agents for the purchase of paddy are common in the Philippines before the paddy reaches the miller, while these are not common in other countries. For instance, in Vietnam, our paddy trader respondents directly contact the farmers to buy their paddy; it is common practice in the Philippines to look for an agent in the locality who will locate the farmers who will sell their paddy. Sometimes, these agents even have a sub-agent to cover a bigger area. Fewer links in the marketing chain could lower overall margins (Yorobe et al., 2004; Beltran et al., 2016).
High returns to management could be also be attributed to collusion, which allows them to control the market and get more profit. Clearly, more studies are needed in this area.
Summary and implications
Rice prices in the Philippines are high because of the high price of paddy and high GMM. The high price of paddy is due to both high costs of production (see chapter on Costs of rice production) and import restrictions that raise domestic prices. The high GMM is due to high marketing costs and high returns to management. Marketing costs in the Philippines are high because of a range of factors: lower economies of scale and underutilized rice mills, high costs of transport and packing, and high paddy prices that increase the cost of working capital.
Rice Prices and Marketing Margins

138 Competitiveness of Philippine Rice in Asia
Overall, marketing margins should be lowered. The following are the possible ways to do this:
Continue the R&D activities that seek to enhance yield level and reduce production cost (see chapter on Can Philippine rice compete globally?). Intensifying rice production will increase the volume of supply of paddy. Reducing production cost will lower the cost of paddy and consequently, reduce the costs and capital requirements of market players.
1. Improve the quality of paddy for higher milling recovery. This can be done by breeding varieties with similar grain shape and length and with high head rice recovery. Also, consider encouraging farmers to plant fewer varieties as most millers complain about having too many varieties that makes processing more costly. Mechanizing the drying of paddy can also minimize the high percentage of broken rice and improve the overall quality of milled rice.
2. Lower transport costs by improving the density and quality of roads. A longer term solution could be in building railways and train system.
3. Cut labor costs through mechanization of loading and unloading. Increasing economic opportunities available for the displaced hired labor may facilitate this transition.
4. Increase marketing competition. This can be done by establishing wholesale paddy markets similar to those existing in Thailand. The creation of these markets will eliminate assembly traders and agents and their margins as well, and consequently reduce overall returns to management. The National Food Authority (NFA) is in the best position to handle this function. The NFA does not necessarily have to procure the paddy, but they can provide the facilities to establish the wholesale paddy market. In addition, they can provide custom services such as weighing, drying, and temporary storage to both farmers and traders. They can make marketing information transparent to all players, thereby reducing opportunities for rent-seeking activities.
Another way to increase marketing competition is to open up the rice marketing system to foreign investors. Their entry could bring fresh capital into the market and give more options to farmers by increasing competition with the large domestic marketing players who have sizeable market shares. This is an option that can be studied further.
To sum up, this paper highlights the fact that differences in rice prices come not only from production cost but also from marketing factors. Hence, the Philippines cannot be competitive by enhancing the rice production system alone. Parallel efforts should be made to improve its marketing system to enable the country to compete globally.

139
References
Beltran JC, Mataia AB, Yorobe JM Jr, Elauria MM. 2016. Rice marketing chains and margins in the Philippines. Science City of Muñoz (Philippines): Philippine Rice Research Institute. (unpubl.)
Beltran JC, Relado RZ, San Valentin ML, Tulay EV, Bordey FH, Moya PF, Chi TT. 2015. A snapshot of Vietnam’s rice production systems in irrigated areas: The Mekong River Delta experience. Science City of Muñoz, Nueva Ecija (Philippines): Philippine Rice Research Institute, and Los Baños (Philippines) International Rice Research Institute. 27 p.
Cabling JC. 2002. Market structure, conduct and performance of the rice milling and trading industries in the Philippines. Unpublished MS thesis, University of the Philippines Los Baños, College, Laguna, Philippines.
Casiwan CB, Cabling JM, Hidalgo FC. 2003. Decomposition of rice production cost and marketing margins: the case of Nueva Ecija, Philippines. Philippine Journal of Crop Science (28): Supplement No.1.
Dawe DC, Moya PF, Casiwan CB, Cabling JM. 2008. Rice marketing systems in the Philippines and Thailand: do large numbers of competitive traders ensure good performance? Food Policy 33: 455-463.
[FPMA] Food Price Monitoring and Analysis Tool. 2015. Food and Agriculture Organization of the United Nations (FAO) GIEWS food price data and analysis tool. http://www.fao.org/giews/pricetool. December 2, 2015.
Harriss B. 1981. Transitional trade and rural development. New Delhi (India): Vikas Publishers.
Hayami Y, Kikuchi M, Marciano EB. 1999. Middlemen and peasants in rice marketing in the Philippines. Agricultural Economics 20(2): 79-93.
[IMF] International Monetary Fund. 2015. International Financial Statistics. http://elibrary-data.imf.org/DataExplorer.aspx. April15, 2015.
Launio CC, Redondo GO, Tabalno RF, Bordey FH, Moya PF. 2015. Is the Philippines’ leading rice-producing province faring good enough? The case of rice farming in Nueva Ecija. Science City of Muñoz (Philippines): Philippine Rice Research Institute and Los Baños (Philippines): International Rice Research Institute. 24 p.
Litonjua AC, Wardana P, Paran SJC, Valencia MSD, Macalintal FM, Bordey FH, Moya PF. 2015. Socioeconomic and technological profile of a semi-mechanized rice production system: the case of West Java, Indonesia. Science City of Muñoz, Nueva Ecija (Philippines): Philippine Rice Research Institute, and Los Baños (Philippines): International Rice Research Institute. 24 p.
Manalili RG, Marciano EB, Viray CA, Tanzo IR, Bordey FH, Moya PF. 2015. The Thailand rice economy under the government rice-pledging scheme: the case of SuphanBuri. Science City of Muñoz (Philippines): Philippine Rice Research Institute and Los Baños (Philippines): International Rice Research Institute. 26 p.
[RTWG] Rice Technical Working Group. 1997. National cooperative testing manual for rice: guidelines and policies. Science City of Muñoz, Nueva Ecija: Philippine Rice Research Institute.
Yap J. 2004. A Note on the competitiveness debate. Discussion paper series no. 2004-39. Makati City: Philippine Institute of Development Studies.
Yorobe JM Jr, Beltran JC, Mataia AB, Cataquiz GC, Elauria MM. 2004. Rice marketing in the Philippines: performance and policy implications. Final report submitted to the Philippine Rice Research Institute. (unpubl.)
Rice Prices and Marketing Margins

140 Competitiveness of Philippine Rice in Asia

CAN PHILIPPINE RICE COMPETE GLOBALLY?Flordeliza H. Bordey, Piedad F. Moya, Jesusa C. Beltran, Cheryll C. Launio, and David C. Dawe
Key messages:• Rice produced in Nueva Ecija irrigated systems cannot compete in Manila
wholesale markets with imported rice from Vietnam, Thailand, or India, even with a 35% tariff. A 75% tariff would be needed to ensure competitiveness.
• With 35% tariff and no quantitative restrictions, domestic farm prices in Nueva Ecija would fall to about PhP 11.77 kg-1. Farmers would need to reduce their cost of production from PhP 12.41 kg-1 to PhP 6.97 kg-1 to maintain current profit margins.
• Higher yields from use of hybrid rice, better seeds, or improved agronomic techniques, as well as reducing labor use through direct seeding or use of combine-harvesters, are key ways to improve competitiveness and farmer profits. Improved milling efficiency and capacity utilization are also important.
Achieving self-sufficiency in food staples, particularly in rice, is enshrined in the food security policy of the Philippine government from 2011 to 2016. To do this, the government has implemented the Food Staples Sufficiency Program, which aims to improve farm productivity and make Filipino farmers globally competitive (DA, 2012). Indeed, paddy production increased by 20% from about 16 million t in 2010 to its record high of nearly 19 million t in 2014. Rice imports went down from more than 2 million t to 1 million t at the same time. Consequently, self-sufficiency level has improved from a low of 81% in 2010 to its peak of almost 97% in 2013 before slightly going down to 92% in 2014 (PSA, 2015). Interestingly, the wholesale price of regular milled rice rose by 29% from PhP 28 kg-1 to about PhP 37 kg-1 during the same period. In spite of the improvement in self-sufficiency status, why does rice become more expensive and less affordable to Filipinos?
This is where Philippine rice trade policies become intricately related to its quest for self-sufficiency. Since the Philippines joined the World Trade Organization (WTO) in 1995, it has employed the tariff rate-quota system to protect the domestic rice industry from the influx of cheaper imported rice (Hoang and Meyers, 2015). Under this, the government can restrict the volume of rice to be imported (i.e., quantitative restriction or QR), provided it is not less than the minimum access volume (MAV). Imported rice within the MAV is levied with an in-quota tariff but is subject to an out-quota tariff if importation exceeds the MAV.
12
141

142 Competitiveness of Philippine Rice in Asia
According to Intal and Garcia (2005), the MAV was set originally to 59,000 t in 1995; it then increased to 119,460 t in 1999 and to 239,940 t in 2004. The MAV further increased to 350,000 t in 2005 after the Philippines successfully negotiated for an extension until 2015. The QR trade regime was supposed to end in June 2015, but the country obtained from the WTO a waiver on this commitment until 2017. In return, the Philippines agreed to a higher MAV (805,200 t) and concessions on the dairy industry (FAO, 2015). Beyond 2017, it may be difficult for the country to negotiate for an extended implementation of QR. However, the effect of QR expiration can only be felt after amending Republic Act 8178, which stipulates the replacement of quantitative restrictions on agricultural products, except rice, with tariffs (The Official Gazette, 2016).
The in- and out-quota tariffs also decreased over time. The in-quota tariff started at 50% from 1995 to 2004, then went down to 40% from 2005 to 2015. Similarly, the out-quota tariff declined from 100% in 1995-2004 to 50% in 2005-2015 (Hoang and Meyers, 2015). Upon approval of the waiver, the tariff rate was further reduced to 35% for the most favored nations (MFN).
Aside from its WTO commitments, the Philippines, as a country member of the Association of Southeast Asian Nations (ASEAN), is also a signatory to the ASEAN Free Trade Agreement (AFTA). Under this agreement, efforts were made to liberalize flow of rice trade within Southeast Asia. The Philippines though considered rice as highly sensitive to its food security and was thus subject to high tariff rates of 40% until 2014. To deepen economic integration, ASEAN country members agreed to join the ASEAN Economic Community by the end of 2015. As such, Philippine tariffs on imported rice from ASEAN members were further reduced to 35% (ASEAN, 2008).
If these trade barriers are removed, can Philippine rice compete? This chapter seeks to shed light on this question. Specifically, the paper aims to estimate the price of imported rice when sold at the domestic wholesale market under different trade scenarios, and also the hypothetical world price at which the current irrigated production system in Nueva Ecija is competitive in Manila wholesale markets, given current domestic marketing costs. Second, the paper also approximates the farmgate price that rice processors can offer to farmers given the equivalent wholesale price of imported rice and their current marketing costs and margins. Third, the paper determines the cost of production that farmers should achieve to maintain the same level of profit prior to trade liberalization. Finally, some recommendations on improving rice competitiveness at the farm and marketing levels are provided.
Data and methods
Competitiveness rests on the ability of a producer to produce goods that have superior quality at lower costs than its local or international competitors (Yap, 2004). It is affected by technological capacity, market conditions, and existing domestic and trade policies of participating countries in the world market. Given the wide variation

143
in geography, production ecosystem, and technological capability, some farmers can be more competitive than others. In this study, the average competitiveness of farmers in irrigated ecosystems of Nueva Ecija, Philippines, will be evaluated against their counterparts in exporting countries such as India, Thailand, and Vietnam.
A comparison of import parity price with the domestic wholesale price will be used in gauging the competitiveness of locally produced rice. Import parity price is defined as the “value of a unit of product bought from a foreign country, valued at a geographic location of interest in the importing country” (USAID, 2008). It is used in assessing incentives to trade and incentives to produce where local producers are competing with suppliers from outside the country.
The import parity price is calculated by adjusting the price of the good at the border of exporting country or port of entry in importing country for transport, marketing, and transaction costs that are incurred when the commodity is brought into the considered geographic location. For this paper, we used the January-September 2015 average of free on board (FOB) price of white rice with 25% broken from Vietnam, Thailand, and India. These were adjusted to import parity price and compared with domestic wholesale price of regular milled rice of ordinary variety in Metro Manila, Philippines. Effects of policies such as taxes, subsidies, and tariffs are also included in the adjustments. We considered a scenario with 35% tariff and no QR. Finally, currency conversion was made using an appropriate exchange rate to express the price in Philippine peso. This results in a parity price that reflects the cash or financial value of the good in the location being considered (USAID, 2008).
Sensitivity analysis was done to determine the level of world price that would make domestic rice competitive at 35% tariff and no QR. Since the reduction of trade protection is a concern with the elimination of QR, another sensitivity analysis was implemented to assess the tariff rate that will make the local rice competitive to the least cost producer when there is no QR.
Assuming that local processors will not adjust their operations after QR elimination and maintenance of 35% tariff, the best farmgate price that they can offer to their paddy suppliers was estimated using the gross marketing margins calculated by Beltran et al. (2015) (see chapter on Rice prices and marketing margins). Similarly, the farmer’s profit margin in Nueva Ecija, Philippines, calculated by Moya et al. (see chapter on Profitability of rice farming) was used in estimating the necessary cost of production that will maintain farmers’ profit.
Partial budget analysis was done to determine some options on reducing the local cost of production at the farm level. The cases of yield increment through use of hybrid rice variety, reduction of labor through mechanization of harvesting, and direct seeding were considered. This used the farm production data in Nueva Ecija, Philippines, generated by Launio et al. (2015).
Can Philippine Rice Compete Globally?

144 Competitiveness of Philippine Rice in Asia
Rice price and tariff
Table 12.1 shows the estimated import parity prices of white rice with 25% broken from Vietnam, Thailand, and India. Of the three sources, Vietnam has the lowest FOB price of US$331.94 t-1, followed by India (IRRI, 2015). The price of Thai rice is generally more expensive due to perceived higher quality. The proximity of Vietnam to the Philippines was considered in approximating freight cost. Freight cost from Bangkok (Thailand) to Manila was assumed to be 50% higher than in Vietnam. Similarly, freight cost from Chennai (India) was assumed to be double that of Vietnam.
Table 12.1. Estimated import parity price of 25% broken rice.
Item Vietnam Thailand India
FOB price of 25% broken (US$ t-1)1 331.94 377.70 344.49 + Freight Cost (US$-t-1)2 25.00 37.50 50.00 + Delivery Cost (US$-t-1)3 30.70 30.70 30.70 + Insurance Cost (US-t-1)4 1.99 2.27 2.07 + Other Charges and Costs (US$ t-1)5 38.13 38.13 38.13Cost of commodity, freight, and insurance (CIF) (US$ t-1) 427.76 486.29 465.38Peso-Dollar Official Exchange Rate (PhP US$-1)6 45.17 45.17 45.17Cost of commodity, freight, and insurance (PhP t-1) 19,321.87 21,965.76 21,021.14 +Tariff payment (PhP t-1)7 6,762.65 7,688.02 7,357.40CIF+tariff payment (PhP t-1) 26,084.52 29,653.77 28,378.54 + estimated local transport cost (PhP t-1) 1,232.00 1,232.00 1,232.00Import parity price (PhP kg-1) 27.32 30.89 29.61Philippine wholesale price, regular milled rice (PhP kg-1)8 34.47 34.47 34.47Price difference (%) -20.76 -10.40 -14.101The average price of 25% broken rice from January-September 2015. Source: http://ricestat.irri.org:8080/wrs2/entrypoint.htm 2Vinafoods II contract with vessel is $25 t-1; Thailand cost is assumed to be 50% higher than that in Vietnam, while India cost is assumed to be double that of Vietnam. Source: http://manilastandardtoday.com/mobile/2014/02/25/-nfa-execs-wined-dined-in-vietnam-/3Vinafoods II contract with DYA SeaAir International Corp is $30.70 t-1 for inclusive handling, delivery, and forwarding costs between the Philipine ports of arrival to NFA-designated warehouses. Assumed to be the same with Thailand and India. Source: http://manilastandardtoday.com/mobile/2014/02/25/-nfa-execs-wined-dined-in-vietnam-/4Insurance cost is US$0.60 $100-1. Source: http://www.priorityworldwide.com/resources/cargo_insurance_guidelines.aspx.5The Philippines levied a fee of US$ 915 on a 20-foot container in 2014. It was assumed that a 20-foot container can contain 24 t. These include costs for documents, administrative fees for custom clearance. Source: http://www.tradingeconomics.com/philippines/cost-to-import-us-dollar-per-container-wb-data.html6Average exchange rate from January-September 2015. Source: Reference Exchange Rate Bulletin, Treasury Department, Bangko Sentral ng Pilipinas.7Tariff rate is assumed at 35%8Average wholesale price of regular milled rice in the Philippines from January-December 2015. Source: http://countrystat.psa.gov.ph/?cont=10&pageid=1&ma=L00PRWPC
Results indicate that, without QR and with only 35% tariff as protection, Vietnam rice was the cheapest of the three. A kilogram of 25% broken rice from Vietnam could be sold in Manila wholesale market at PhP 27.32; Indian rice at PhP 29.62; and Thai rice at PhP 30.89. All of these were cheaper than the average wholesale price of regular milled rice at PhP 34.47 kg-1. At 35% tariff, the price of the cheapest imported rice from Vietnam is about 21% lower than that of domestic rice. This implies that the removal of QR will lead to a reduction in the domestic price of rice.

145
This result corroborates the conclusion of studies that analyzed the effects of trade liberalization on the price of rice. Litonjua and Bordey (2014) approximated a reduction in the wholesale price of rice to PhP 25.06 kg-1 from the 2013 base price of PhP 34.49 kg-1 should the QR be removed and only the 35% tariff maintained. Briones and dela Peña (2015) predicted that retail price of rice will decline to PhP 19.80 kg-1 from PhP 33.08 kg-1 in 2013 if imported rice is allowed to freely enter the country. Hoang and Meyers (2015) found that retail price will decline to PhP 31.4 kg-1 using a scenario of gradual phasing out of AFTA tariffs starting 2016 and complete elimination of trade barriers in 2020. Though there are differences in magnitude, all these studies point to price reduction should there be liberalization in rice trade.
Sensitivity analysis shows that at a 35% tariff rate and assumed costs of freight, delivery insurance, and other charges, locally produced regular milled rice will be competitive if the price of 25% broken rice from Vietnam is about US$450 t-1 or higher. At this FOB price, the estimated import parity price is PhP 34.52 kg-1 (Fig. 12.1).
Note: RMR - Regular milled rice
Fig. 12.1. Sensitivity of import parity price relative to variation in price of 25% broken rice and given 35% tariff.
Given the FOB price of Vietnam rice at US$331.94 t-1, domestic rice can be competitive at the Manila wholesale market if the tariff level imposed on imported rice is at least 75% (Fig. 12.2). This shows that the current tariff equivalent of the protection accorded by the combined QR and tariff is about 75%. At this tariff level, the import parity price is estimated at PhP 35.05 kg-1.
Can Philippine Rice Compete Globally?

146 Competitiveness of Philippine Rice in Asia
Note: RMR - Regular milled rice
Fig. 12.2. Import parity price of 25% broken rice from Vietnam at different tariff levels.
Effects on paddy price
Suppose the country imports from Vietnam at 35% tariff and assuming that wholesale prices are transmitted to farmgate prices, how will this affect the farmer? The gross marketing margin of Philippine market players is estimated at PhP 9.06 kg-1 (see Table 11.1 in chapter on Rice prices and marketing margins). Subtracting this from the import parity price of Vietnam rice at PhP 27.32 kg-1 will leave about PhP18.25 that can be used by processors to buy dry paddy to produce 1 kg of milled rice. At the milling recovery ratio of 64.5%, the best price that processors can offer to buy a kilogram of dry paddy is PhP 11.77. To maintain the profit margin1 of farmers, which is estimated at PhP 4.80 kg-1, their production cost must be reduced to PhP 6.97 kg-1. Boosting the productivity of farmers can help on this matter.
What can be done?
Hybrid rice
Increasing rice production per hectare at less cost can help farmers earn the same profit despite lower prices. Data from irrigated rice production in Nueva Ecija in 2013 dry season (DS) showed that hybrid rice achieved a yield of 7.20 t ha-1 (at 14% MC). This is 36% higher than the yield of farmers who used certified inbred seeds and 74% higher than the yield of farmers who planted their own seeds (Fig. 12.3). Based on this higher yield, it takes only PhP 9.85 for hybrid rice farmers to produce a kilogram of dry paddy. Users of tagged inbred and farmer’s seeds have to spend PhP 11.66 kg-1 and PhP 13.72 kg-1, respectively.
1 Estimated using the cost of production per kilogram in the Philippines at PhP 12.41 kg-1 and average price of paddy at PhP 17.21 kg-1.

147
Fig. 12.3. Comparative palay yield (t ha-1, 14% MC) and seed cost, by seed class, 2013 dry season, Nueva Ecija.
This shows that hybrid rice can be promoted to increase DS yield. However, because the yields of hybrid rice can vary considerably by location and ecosystem, it will be important to ensure that farmers use hybrid seeds that are appropriate for their specific conditions. Use of hybrid seeds should be complemented with appropriate crop management practices to maximize yield.
Since the removal of the hybrid seed subsidy in 2010, the private sector has intensified its production and marketing of hybrid seeds. The government can help promote hybrid rice by focusing on suitable areas that are not well-reached by the private sector and boost R&D and extension to optimize the yield potential of hybrid rice.
Save on labor to reduce cost
Rice farm labor is costly in the Philippines. In irrigated areas of Nueva Ecija alone, labor ate up 35% of total production cost where farmers spent PhP 3.76 on hired labor to produce a kilogram of paddy (Table 12.2). The most costly farm activities were crop establishment, harvesting, and threshing; cost reduction in these activities can enhance competitiveness.
Table 12.2. Cost of dry paddy production, Nueva Ecija, 2013.
Item Value (PhP kg -1)Seed 0.58Fertilizer 1.94Pesticide 0.36Hired labor 3.76Family labor 0.66Power* 1.73Land rent 2.11Irrigation 0.45Interest on capital 0.43Others 0.40Cost per unit 12.41
*Power cost consists of animal and machine rental, including fuel and oil.
Can Philippine Rice Compete Globally?
Yield (ton ha-1) Cost per kg (PhP kg-1)
Farmer’s seed Tagged inbred seed Hybrid

148 Competitiveness of Philippine Rice in Asia
Since 99% of farmers transplant during the WS, transplanting was compared with direct seeding only in the DS. Hybrid seed users mostly transplant, hence, they were not included in the analysis. While transplanting requires 25 md, direct-seeding utilizes only 2 md in a hectare. Direct seeding requires additional crop care, but nevertheless there is still a reduction in labor costs2, resulting in a savings of PhP 1.14 kg-1 if farmers adopt direct seeding (Table 12.3). Experiments show insignificant yield differences between direct seeded and transplanted rice, provided that the former was properly taken care of, particularly in weed management (Akkas Ali et al., 2006).
Table 12.3. Partial budget analysis of labor cost, by crop establishment method (PhP kg-1).
Item Transplanted Direct-seeded DifferenceHired labor 3.82 2.51 1.31Family labor 0.60 0.77 -0.17Net labor savings 1.14
Harvesting in the Philippines is mostly done manually while threshing is mechanized using an axial-flow thresher, needing a combined total of 21 md ha-1 (see chapter on Labor and mechanization). On the other hand, a combine harvester can mechanically harvest and thresh paddy in a single pass through the field, needing less than 2 md ha-1. Manual harvesting cost 10% of harvest, while axial-flow thresher was 7% of harvest. The cost of using combine harvester was about 8% of output, which is PhP 1.56 kg-1 lower (Table 12.4). This benefit from using combine harvester does not include the potential cost-saving implications on packaging/handling costs in rice marketing.
Table 12.4. Partial budget analysis of harvesting and threshing costs.
Item Value (PhP kg-1)
Harvesting and threshing 2.95Manual harvester 1.74Mechanical thresher (axial flow) 1.21Combine harvester 1.39Net cost savings 1.56
These data show that direct seeding and use of combine harvester can be promoted to reduce cost at the farm level. They could also help prevent seasonal labor shortages that occur during planting and harvesting when farm activities peak. Nevertheless, the use of labor-saving practices is opposed by some due to labor displacement. Displaced workers need alternative jobs to regain their lost income from planting and harvesting should these activities become mechanized. Job generation outside the agriculture sector such as in factories and construction could absorb these workers.
2 This only analyzed the change in labor cost resulting from use of different crop establishment methods. However, the resulting change in cost of other inputs such as seed and herbicide were not considered in the calculation.
149
Squeezing costs beyond the farm
Enhancing competitiveness falls on the shoulders of farmers and marketing players alike. Improving milling efficiency, for example, reduces the processing cost of rice. Recovering 66 kg instead of just 64.5 kg of rice from 100 kg of paddy can spell a cost advantage. Suppose that the buying price for dry paddy rice is PhP 11.77 kg-1, about PhP18.25 worth of dry paddy is needed to produce a kilogram of milled rice, if recovery were 64.5%. At 66% recovery, less paddy worth PhP 17.83 is needed to produce the same quantity of milled rice. Hence, improving milling recovery from 64.5% to 66% entails a cost saving of PhP 0.42 kg-1.
To do this, the quality of paddy being processed must be improved. Breeding institutions, which are mostly public, must release varieties that have similar grain length and shape, and with high head rice recovery to help improve the milling process. As an alternative, the National Seed Industry Council may limit the number of newly released varieties. In addition, mechanized drying of paddy can minimize the high percentage of broken rice.
To further improve milling efficiency, capacity utilization of rice mills can be increased through provision of custom services to other market players. For example, paddy traders can venture into rice wholesale/retail business without investing in large equipment and avail of the services of underutilized rice mills. Increasing the capacity utilization of existing rice mills could reduce milling cost.
Focused R&D
Increasing yield is the most certain way to reduce production cost per unit and increase competitiveness. But average yields in Nueva Ecija’s intensively cropped areas in 2013 were not significantly different from average yields in the past 10 years (Launio et al., 2015). The most commonly planted varieties are those with potential yields of more than 10 t ha-1 at release time, suggesting that potential yield is a major variety characteristic considered by farmers. The Philippines will benefit if rice R&D were focused on increasing potential yield.
Summary and implications
This study shows that the Philippines’ ordinary white rice (regular milled) is still more expensive than imported rice with similar quality (25% broken rice) even at 35% tariff rate when QR is eliminated. In this respect, Philippine rice can be said as less competitive. Only at FOB prices of about US$450 can Philippine rice start to become competitive given the 35% tariff. Hence, the removal of QR can lead to a decline in domestic price of milled rice and eventually to a lower price of paddy since the farmers are price takers. To maintain their farm income at pre-liberalization level, their cost of production must be reduced to about PhP 6.97 kg-1.
Can Philippine Rice Compete Globally?

150 Competitiveness of Philippine Rice in Asia
This could be done by promoting the use of hybrid rice in suitable areas, focusing R&D in producing breakthrough technologies, and considering improvements in management practices, which could increase yield and reduce production cost per kilogram. To further reduce cost, labor-saving technologies such as direct seeding and use of combine harvester can also help. Reducing production cost will also result in reduced overall marketing cost. Improving milling recovery through use of varieties with similar grain length and shape and better head rice recovery can contribute further in reducing processing cost.
These strategies are only some of the ways that could improve Philippine rice competitiveness in the medium term. These recommendations could result in immediate and significant reduction in production cost to prepare for the eventual lifting of QR. Beyond that, the Philippines needs to continue improving its rice competitiveness by intensifying long-term investment in R&D to look for future sources of yield growth and cost reduction.
This analysis was based on the competitiveness of Nueva Ecija, the largest rice-producing province of the Philippines. There are many provinces, especially those in Mindanao, that produce rice at a lower production cost per kilogram. There are also provinces that produce rice at a much higher production cost relative to Nueva Ecija. Hence, while the country continues to work on reducing production cost and increasing yield, it is also important to start sensitizing farmers in areas where ordinary white rice will have difficulty becoming competitive due to environmental constraints. They can be encouraged to take advantage of the ASEAN Economic Community and switch to other rices with niche markets such as specialty rice (e.g., pigmented, glutinous, and aromatic). They can be also persuaded to plant other suitable crops and engage in agribusiness ventures.
References
Akkas Ali M, Ladha JK, Rickman J, Laies JS. 2006. Comparison of different methods of rice establishment and nitrogen management strategies for lowland rice. Journal of Crop Improvement 16(1-2): 173-189.
[ASEAN] Association of Southeast Nations. 2008. ASEAN Economic Community blueprint. Jakarta: ASEAN. 56 p.
Beltran JC, Relado RZ, San Valentin MRL, Tulay EV, Bordey FH, Moya PF, Truong TNC. 2015. Snapshot of Vietnam’s rice production systems in irrigated areas: the Mekong River Delta experience. Science City of Muñoz (Philippines): Philippine Rice Research Institute, and Los Baños (Philippines): International Rice Research Institute. 27 p.
Briones R, dela Pena B. 2015. Competition reform in the Philippine rice sector. Discussion Paper Series No. 2015-04. Makati City: Philippine Institute of Development Studies.
[BSP] Bangko Sentral ng Pilipinas. Reference exchange rate bulletin. 2015. http://www.bsp.gov.ph/statistics/sdds/exchrate.htm. November 25, 2015.
[DA] Department of Agriculture. 2012. Food staples sufficiency program: enhancing agricultural productivity and global competitiveness 2011-2016.Quezon City: Department of Agriculture. 40 p.
151
[FAO-UN] Food and Agriculture Organization of the United Nations. 2015. FAO rice market monitor/July 2015 - international trade. p 13-19.
Herrera CF. 2014. NFA execs wined, dined in Vietnam. http://manilastandardtoday.com/mobile/2014/02/25/-nfa-execs-wined-dined-in-vietnam-/. November 24, 2015.
Hoang HK, Meyers WH. 2015. Price stabilization and impacts of trade liberalization in the Southeast Asian rice market. Food Policy 57(2015): 26-39.
Intal PS, Garcia MC. 2005. Rice and Philippine politics. Discussion Paper Series No. 2005-13. Makati City: Philippine Institute of Development Studies. 28 p.
[IRRI] International Rice Research Institute. 2015. The average price of 25% broken rice from January-September 2015. http://ricestat.irri.org:8080/wrs2/entrypoint.htm. November 24, 2015.
Launio CC, Redondo GO, Tabalno RF, Bordey FH, Moya PF. 2015. Is the Philippines’ leading rice-producing province faring good enough? The case of rice farming in Nueva Ecija. Science City of Muñoz (Philippines): Philippine Rice Research Institute and Los Baños (Philippines): International Rice Research Institute. 24 p.
Litonjua AC, Bordey FH. 2014. How can rice trade liberalization affect producers and consumers? Rice science for decision makers. September 2014. Science City of Muñoz (Philippines): Philippine Rice Research Institute. 4 p.
[PSA] Philippine Statistics Authority. 2015. CountrySTAT Philippines http://countrystat.psa.gov.ph/?cont=10&pageid=1&ma=L00PRWPC. November 25, 2015.
Priority Worldwide Services. 2015. Cargo insurance guidelines. http://www.priorityworldwide.com/resources/cargo_insurance_guidelines.aspx. November 25, 2015.
The Official Gazette. 2016. Republic Act No. 8178. http://www.gov.ph/1996/03/28/republic-act-no-8178-s-1996/. February 12, 2016.
Trading Economics. 2015. Cost to Import in Philippines. http://www.tradingeconomics.com/philippines/cost-to-import-us-dollar-per-container-wb-data.html. November 25, 2015.
Yap J. 2004. A note on the competitiveness debate. Discussion Paper Series No. 2004-39. Makati City: Philippine Institute of Development Studies.
[USAID] United States Agency for International Development – FEWS NET. 2008. Import/export parity price analysis. FEWS NET Market Guidance No. 1. Washington, D.C.: USAID. 28 p.
Can Philippine Rice Compete Globally?

152 Competitiveness of Philippine Rice in Asia

SHOULD THE PHILIPPINES USE PRICING POLICY TO IMPROVE COMPETITIVENESS IN RICE PRODUCTION?David Dawe
Key messages:• Farmers in India, Thailand, and Vietnam do not have lower costs of production
per hectare per crop than in the Philippines because of input subsidies. Rather, the main difference in costs between Nueva Ecija and the “rice bowl” locations in the exporting countries concern labor and machinery.
• The only realistic input subsidy that would have a potentially substantial impact on lowering costs of production in the Philippines is a subsidy on the purchase of machinery. Its design would need to be considered carefully so as to give the machine owners strong incentives to maintain the machines and aggressively promote their services.
• Subsidies of material inputs will not do much to increase competitiveness simply because labor and machinery costs are so much more important. At the same time, subsidies for material inputs, if implemented, are likely to have large adverse environmental effects by encouraging overuse of chemicals.
• Material input subsidies, such as the fertilizer subsidies in Indonesia and India, can have large budgetary implications, making it more difficult to finance investments in rural infrastructure (roads, schools, health clinics) that are essential for both competitiveness and welfare of rural citizens.
There is little dispute that public and private investment in agriculture will improve competitiveness. Agricultural research, irrigation, roads, education, and health care are all rightly viewed as necessary to create a dynamic, competitive economy.
The objective of this paper is to discuss the feasibility of a different approach to improving competitiveness, however: should the Philippines use pricing policy, in addition to or instead of the types of investment noted above, to improve the competitiveness of rice production?
To achieve this objective, the first section defines some terminology and provides some brief background to these concepts. The second and third sections are the main part of the paper. Section II discusses the effects of output price policy, while the third section discusses input price policies, both in general and on an input-specific basis. Comparisons with input use and policies in other Asian countries are discussed throughout. Section IV briefly discusses the importance of yields for competitiveness,
13
153

154 Competitiveness of Philippine Rice in Asia
section V briefly discusses a rudimentary “social profitability” analysis, and section VI concludes.
I. Some terminology and concepts
Before tackling the question posed in the title, however, it is necessary to clarify some concepts and terminology. In this paper, pricing policy means any policy that changes the price of an input or output from what it would otherwise be in a freely functioning market. There are many types of policies that can affect prices—e.g., import tariffs and quotas, domestic taxes and subsidies, export taxes and quotas. Competitiveness will be operationally defined here as inversely related to costs of production per unit weight (kilogram or ton): a lower cost of production per kilogram means more competitiveness.
Competitiveness defined in this manner is, strictly speaking, relevant only to individual farms or at least groups of farms that are relatively homogeneous, but not large diverse countries. Large countries tend to have a wide range of growing conditions that will have widely varying costs of production. For example, in the Philippines, irrigated rice production in the wet season in Eastern Visayas had a cost of production of just PhP 7.96 per kilogram in 2012, compared with a cost of production of PhP 13.07 per kilogram for rainfed rice production in the wet season in Ilocos (see Figure 13.1 for a supply curve of palay production in the Philippines by ecosystem by region; the three important combinations of ecosystem and season for Central Luzon are circled).1
7
8
9
10
11
12
13
14
15
16
0 2 4 6 8 10 12 14 16 18 20
Cost
of p
rodu
ctio
n (P
hP k
g-1)
Production (million tons palay)
Rainfed Sem 2
Irrigated Sem 1
Irrigated Sem 2
Note: Circled data represent Central Luzon.Source of raw data: Philippine Statistics Authority (2016).
Fig. 13.1. A supply curve for palay in the Philippines, disaggregated by region/ecosystem/season.
1 Rainfed palay production in the January to June semester is of very low magnitude.

155
Thus, this paper, strictly speaking, discusses the competitiveness of various rice bowls in large Asian countries, not the competitiveness of the countries themselves. Despite this important caveat, the results are arguably relevant at country-level, as will be discussed in the concluding section.
It is also important to distinguish between comparative advantage and competitiveness. Comparative advantage refers to a situation where a country can produce a commodity more cheaply than others in the absence of government intervention. Thus, it is generally not possible to use pricing policy, which is a government intervention, to create comparative advantage. There is an important exception to this generalization, namely the infant industry/learning-by-doing argument. This argument states that, by providing some protection to a particular industry for a fixed period of time, the infant will “learn by doing” and become more efficient, after which time it can compete on an international level. However, the Philippine rice sector has been more or less continually protected (in the sense that domestic prices are higher than world market prices) for more than a century (Dawe, 1991), making it rather old for an infant. Thus, this argument, while theoretically valid for some products in some countries at some times, will not be entertained further in this paper. For rice production in Southeast Asia, comparative advantage seems to rest with countries on the mainland that have dominant river deltas and therefore large areas of flat land where water flows can be managed relatively easily (Dawe, 2014).
II. Can higher output prices improve competitiveness?
The Philippines already has a pricing policy that affects the rice sector, namely, quantitative controls on imports. It is true that WTO agreements force the Philippines to import a certain quantity of rice every year (805,200 tons), but this quantity is below the amount that would be imported if traders were free to import rice as they pleased. The import controls lead to higher domestic prices than would exist if traders were free to import rice, and Philippine domestic prices are indeed higher at both farm (Fig. 13.2) and wholesale levels (Fig. 13.3) than in exporting countries.2 Relatively high farm prices for rice in importing countries lead to relatively high farm profits in those countries (Fig. 13.4).3
2 Note that in 2013, Thailand farm prices for many farmers were on a par with those in importing countries. This was due to the paddy pledging policy used by the Yingluck government, which is no longer operative. As a result, Thai farm prices are now similar to those in other exporting countries (India, Vietnam). The price for Thailand in the graph (and throughout this paper) is the price given to farmers who sold on the open market in 2013, not to the pledging scheme. However, even this price is high, as the pledging scheme affected open market prices as well. Indeed, farm prices for paddy declined in Thailand in 2014 and 2015.3 Again, Thailand is an exception, for the same reason as explained in footnote 2. A rough calculation of profits in Thailand, using current farm prices, shows much lower profits than in any of the importing countries.
Should the Philippines Use Pricing Policy to Improve Competitiveness in Rice Production?

156 Competitiveness of Philippine Rice in Asia
Note: Numbers at top of columns are prices in US dollars (US$) per kilogram, converted at the 2013 exchange rate of PhP 42.45/US$.Source of data: PhilRice/IRRI Benchmarking Project
Fig. 13.2. Farm prices for palay in key rice production areas, 2013.
Note: Indonesia retail prices were adjusted to wholesale level using the ratio of wholesale to retail prices in the Philippines in 2015 (equal to 1.085).Source of raw data: FAO, 2016.
Fig. 13.3. Wholesale prices for milled rice, 2015.

157
It is important to note that the import controls are not a direct subsidy to farmers, but they do lead to the same result—more income for farmers. Thus, in economic terms, the import controls are a subsidy, even if farmers do not receive a direct deposit from the government into their bank accounts. From the government’s point of view, import controls are preferable to direct subsidies, as they lead to higher prices and profits for farmers without the need for any budgetary expenditures. While these higher prices do not require budgetary outlays, they do have various costs, including reduced competitiveness of labor-intensive manufacturing; increased poverty; less money for consumers to spend on nutritious foods such as dairy, fish, meat and fruits and vegetables; less incentive for farmers to diversify cropping patterns even as dietary diversification is increasing; and greater wheat imports (Dawe, 2014).
Explicit subsidies to rice farmers, either through higher procurement prices or through direct income payments, are often discussed as a policy option. Note that such an option would not improve competitiveness, as it would not lower costs of production (see next paragraph). It would increase the income of farmers, but, as noted above, profits in Central Luzon are already higher than those in exporting countries on a per-hectare per-crop basis. Direct payments to farmers or higher procurement prices would also have impacts on the government budget, however, and are not likely to be sustainable if they reach a sizable percentage of farmers. Thailand, for example, recently tried to raise prices to rice farmers and spent billions of dollars in the process. That policy also led to official concerns from the International Monetary Fund about the government’s creditworthiness and many allegations of corruption (Poapongsakorn, 2014). Finally, it is not clear why direct payments should be targeted to rice farmers in particular. A more sensible option would be to target payments to people based on poverty, which would then include many maize farmers, coconut farmers, the rural landless, and the urban poor in addition to some rice farmers.
In addition to the problems of equity and fiscal sustainability noted above, higher
0
5,000
10,000
15,000
20,000
25,000
30,000
35,000
40,000
45,000
50,000
China India Indonesia Philippines Thailand Viet Nam
PhP
ha-1
crop
-1
$978
$200
$722
$538$501
$648
Note: Numbers at top of columns are prices in US dollars (US$) per kilogram, converted at the 2013 exchange rate of 42.45 PhP/US$. Source of raw data: PhilRice/IRRI Benchmarking Project
Fig. 13.4. Net income from rice farming (US$ ha-1 crop-1), 2013.
Should the Philippines Use Pricing Policy to Improve Competitiveness in Rice Production?

158 Competitiveness of Philippine Rice in Asia
procurement prices are likely to raise the price of inputs such as land, seed, and labor (none of which are internationally traded), thereby raising costs and reducing competitiveness.4 In other words, higher paddy prices will lead to higher costs of production and competitiveness will decline. Conversely, lower output prices would raise competitiveness, although the magnitude of this effect is uncertain.
III. Input price policy options
The case for lower input prices improving competitiveness seems straightforward, but before discussing individual inputs, several general points are important to note. First, a lower input price encourages the use of more of that input. The increased quantity of inputs will counterbalance a lower input price to some extent, meaning that input costs will not decline by as much as expected.5 Second, and more important for some inputs (fertilizer, pesticides, fuel), the greater quantity of inputs used in response to the (hypothetical) lower price will have adverse effects on the environment. This latter effect in particular means that input subsidies should be very carefully considered.
Third, input subsidies, if available to all farmers, can consume large amounts of scarce budgetary resources. If input subsidies lead to less investment in agricultural research, education, and health, then long-term competitiveness will be compromised. And if input subsidies are awarded to only a limited number of farmers to conserve on budgets, then the impact on overall competitiveness will be very limited, and probably zero.6
A counterargument is that input subsidies will do more than just lower short-term costs of production by the amount of the subsidy. Rather, they will promote learning by doing that will, over the long run, increase competitiveness and efficiency. The conditions for this argument to have a substantial effect are that (1) farmers are unfamiliar with the use of a particular input and need to be encouraged to experiment with it so that they ultimately use more; and/or (2) they are unable to use the input in optimal amounts due to imperfect credit markets. These arguments will be discussed below on an input-specific basis. But, in general, such arguments were much stronger in the 1960s than they are today. And, if imperfect credit markets are the problem, the best solution is to improve the functioning of those markets (e.g., SikatSaka), rather than lowering the price of inputs.
In the discussion below, input costs will be discussed in terms of quantities and
4 Higher output prices will lead to a greater marginal value product of the input, increasing demand for the input and therefore its market price.5 It seems unlikely that the price elasticity of demand will be high enough (i.e., greater than one) so that input costs actually rise.6 Competitiveness is determined by the costs of production of the marginal producers, the farms that will go into production as their costs of production become lower. If the input subsidy only reaches inframarginal (those below the margin) farmers, as seems likely, then the impact on competitiveness will not be just small, but zero. I can think of no practical way to target a subsidy to marginal producers.

159
costs per hectare, not per ton of output. This implicitly assumes that yields in all locations/countries are equal—if production per unit land (yield) is equal across countries, then costs per ton are directly proportional to costs per hectare, and it doesn’t matter which one is used. Of course, production per unit land is not in fact equal across countries, and yield is therefore an important part of competitiveness. The paper will return to this issue in the section after input costs, but for the moment, the paper’s focus is on input pricing policies, not yield.
Labor and machinery
The most important costs of production for nearly all Asian rice farmers are the sum of labor and machinery costs. These costs are considered together because of the substitutability between them—using less labor usually means more use of machinery.
Labor is the single most important cost of production for Filipino rice farmers. One option would be to lower wages, but this has several obvious problems: it lowers the income of the poorest of the poor, the rural landless laborers; it encourages more labor use; and there is probably no practical way to enforce lower wages in rural areas.
A more sensible approach would be to subsidize the use of machinery, although this has the drawback of reducing employment for landless laborers. If the overall economy can create sufficient jobs, these laborers should in theory be able to find employment working on other crops or in other sectors of the economy, but that theory will not comfort those who lose their jobs. This job loss is a serious issue; nevertheless, it will not be further addressed here, as the focus of the paper is on improving the competitiveness of rice farming. But it should be always kept in mind that improving the competitiveness of rice farming should not be the single overriding goal of Philippine economic policy. There are many other more important objectives worth achieving that will have much greater benefits for the poor and the economy as a whole.
Setting aside the potential impact on the incomes of landless laborers, reducing the use of labor through increased use of machinery will have potentially the biggest impact on improving competitiveness, simply because labor is the most important single cost, accounting for 37% of total costs in the Philippines. Total labor costs in the Philippines are also much higher than in the exporting countries (Fig. 13.5).7 Harvesting and crop establishment are the most labor-intensive operations, so machinery suited to those tasks will go the farthest toward improving competitiveness. However, mechanical transplanters are not in wide use in developing countries in Asia; thus, adoption of combine harvesters will have a much bigger impact initially.
7 Family labor is valued at the market wage rate.
Should the Philippines Use Pricing Policy to Improve Competitiveness in Rice Production?

160 Competitiveness of Philippine Rice in Asia
Note: Numbers at top of columns are prices in US dollars (US$) per kilogram, converted at the 2013 exchange rate of 42.45 PhP/US$.Source of raw data: PhilRice/IRRI Benchmarking Project
Fig. 13.5. Labor costs in key rice production areas, 2013.
China, for example, has encouraged mechanization by subsidizing the purchase of machinery—it provides a 30% discount on anything purchased from an approved list of equipment (Gale, 2013). There are two important things to note about the Chinese subsidy. First, it goes to only a very small percentage of farmers because most farmers do not buy combine harvesters or large tractors.8 Nevertheless, ordinary farmers who do not own these machines are still able to rent their services in a competitive market, thereby cutting labor costs. Second, it is important that the subsidy not be too large, so that the machine owners have strong incentives to maintain the machines and aggressively promote their services around the country. In China, the machinery service providers do not confine their business to just their own village, but rather travel far and wide, depending on the different harvest schedules in different provinces (Yang et al., 2013). In that regard, 30% might be a reasonable subsidy to provide, large enough to accelerate adoption but small enough to make machine owners work hard to pay off their outstanding loans.
In terms of crop establishment, farmers could be encouraged to adopt direct seeding, which uses much less labor than transplanting. Indeed, farmers in Thailand and Vietnam have abandoned transplanting and now use this method. Encouraging wider adoption in the Philippines could conceivably be done with a subsidy, but it would make more sense to accomplish this goal by working with farmers to refine the agronomic management practices that arise with direct seeding (e.g., increased weed growth) so that farmers earn more profits from direct seeding and therefore adopt it on their own.
8 Small tractors are already widely owned and used. Subsidizing them is unlikely to reduce labor use in Philippine rice production.

161
Land
After labor and machinery, land rent is the next most important cost of production in Nueva Ecija, slightly more important than fertilizer. For farmers who own their own land, land is not a direct cost of production that must be paid. Nevertheless, in an economic analysis, it must be accounted for as landowners could (and sometimes do) elect to rent out their land and earn income from it. This income does not come from rice farming per se—they would earn this income even if they rented out the land and the tenant decided to grow another crop. Thus, if they decide to grow their own rice, the foregone land rent is a cost of choosing to grow their own rice.
Compared with Thailand and Vietnam, land rent in the Philippines is lower (Fig. 13.6).This is not the source of competitiveness for those two exporters. Compared with India, Philippine land rent is higher, but not by much—the differential in land rent accounts for just 7% of the overall differential in costs of production.
Note: Numbers at top of columns are prices in US dollars (US$) per kilogram, converted at the 2013 exchange rate of 42.45 PhP/US$.Source of raw data: PhilRice/IRRI Benchmarking Project
Fig. 13.6. Land rent in key rice production areas, 2013.
In terms of policies, it is hard to imagine policies that lower land rent, as it is difficult to change the underlying supply and demand for land, especially in a land-scarce country such as the Philippines. One option would be to force farmers to grow rice, especially those who currently do not. If such a regulation were effectively enforced, it would lower the rental value of the land. But this would be a very ill-conceived policy that would not only hinder crop diversification and efficient resource allocation more generally but would also harm the farmers who own their land. This would be an extremely bad and unpopular policy that will thus not be discussed further.
Should the Philippines Use Pricing Policy to Improve Competitiveness in Rice Production?

162 Competitiveness of Philippine Rice in Asia
Fertilizer
Fertilizer is the most important material input into rice production, accounting for 16% of production costs in Nueva Ecija. Furthermore, fertilizer prices are heavily subsidized in two of the comparator countries, India and Indonesia, and these two countries do have lower fertilizer costs as a result (Fig. 13.7). But Indonesia, as an importer, is not a competitor to the Philippines. Further, the budgetary costs of the fertilizer subsidy to the Indonesian government are very high (Osorio et al., 2011), wealthier farmers get most of the benefits, and the subsidy has not been sufficient to make Indonesia competitive. India is an exporter, and its lower fertilizer costs do improve its competitiveness. Nevertheless, if the fertilizer costs of Nueva Ecija farmers were lowered to the same level as those in Tamil Nadu, the cost of production per kilogram of dry paddy in Nueva Ecija would still be US$0.27 kg-1, 28% higher than in Tamil Nadu. Thus, India’s fertilizer subsidy is not the source of its competitiveness, although it does help. It is important to note, however, that India’s subsidy is a large burden on the government (Narayanan and Gulati, 2003), and it likely harms India’s competitiveness through other channels, namely reduced funds available for investment in rural infrastructure and education.
Note: Numbers at top of columns are prices in US dollars (US$) per kilogram, converted at the 2013 exchange rate of 42.45 PhP/US$.Source of raw data: PhilRice/IRRI Benchmarking Project
Fig. 13.7. Fertilizer costs in key rice production areas, 2013.
China also has a “fertilizer subsidy,” but it is given as a lump sum to farmers’ bank accounts, and it is not necessary for farmers to even use fertilizer in order to receive the subsidy. The “fertilizer subsidy” is therefore, despite its name, actually a direct income transfer, which was discussed earlier in the paper (section II). Because of the manner in which the subsidy is given, the “fertilizer subsidy” in China does not affect market prices of fertilizer. As a result, farmer expenditures on fertilizer per crop in China are higher than in any of the comparator countries.

163
Vietnam has a different type of fertilizer subsidy—it subsidizes the production of urea. However, the price paid by farmers is not subsidized; it is no different than the price that would be paid if all of the country’s urea were imported and distributed by traders to farmers. In fact, about 55% of Vietnam’s nitrogen fertilizer is imported (along with 60% of its phosphate and 100% of its potash), making it difficult to implement a subsidy to farmers, as it would require large amounts of money from the government for subsidization of imports. The government could choose to subsidize all sales of domestic urea production to farmers, but if it did that, a black market would emerge as farmers would resell the fertilizer at the same price as the imported fertilizer that is brought in to meet total demand. The government of Vietnam does not do this, and, in fact, the prices paid for urea in the Mekong Delta are about the same as those paid in Central Luzon.
Thus, Thailand and Vietnam, the Philippines’ two key competitors, do not subsidize fertilizers to farmers. Thailand has lower fertilizer costs than the Philippines, but this is because of lower use, not lower prices. And Vietnam has slightly higher fertilizer costs than the Philippines—this is not the source of their competitiveness (Fig. 13. 7). Thus, to summarize, the Philippines’ high paddy production costs are not due to high fertilizer costs. Some of India’s lower costs of paddy production are in fact due to subsidized fertilizer prices, but this comes at a very significant cost to the government. India’s preferential subsidization of nitrogen fertilizers relative to phosphorus and potassium fertilizer also results in imbalanced applications that have deleterious effects on soil health.
Thus, the case for subsidizing fertilizer use in the Philippines is very weak. In addition to the fact that fertilizer subsidies are not the source of Thailand and Vietnam’s competitiveness, increased application of fertilizers will result in increased nutrient run-off into lakes, rivers, and oceans, clearly an undesirable outcome. Further, fertilizer use is subject to declining marginal returns: each additional unit of fertilizer applied leads to ever-decreasing increases in production, and eventually additional fertilizer actually leads to lower yields! Finally, past efforts at fertilizer subsidies in the Philippines have led to corruption (Javier, 2012).
All of this being said, there is one possible intervention that could be considered after more careful analysis. Applied quantities of nitrogen fertilizer in the dry season are still below the optimal levels calculated for Nueva Ecija by Dawe et al. (2006), which means that greater use of nitrogen fertilizer would increase both production and profits. At the same time, applied amounts in the wet season are excessive. This pattern suggests that a fertilizer subsidy will not be the best way to increase production, as it will encourage greater applications in both wet and dry seasons, and the heavier applications in the wet season will not be socially beneficial (even before taking into account the negative environmental impacts). More efforts at farmer education are likely to yield better results, in terms of (a) reducing costs in the wet season and (b) increasing fertilizer use (and thus rice production) in the dry season, which will lead to lower costs of production per kilogram of rice.
Should the Philippines Use Pricing Policy to Improve Competitiveness in Rice Production?
164 Competitiveness of Philippine Rice in Asia
Seeds
After fertilizer, seeds are the next most important material input in terms of share in the cost of production. But seed costs are decidedly secondary in importance in terms of magnitude; they account for just 5% of total costs of production in Nueva Ecija, compared with 16% for fertilizers. This means that, even if any subsidies existed in other countries, they would not have much of an overall impact on costs of production.
Compared with the big Southeast Asian exporters, Nueva Ecija farmers spend much less on seeds, just US$65 ha-1 crop-1 as opposed to US$138 and US$72 in Thailand and Vietnam, respectively. Again, seed subsidies in other countries are not the reason Nueva Ecija farmers are less competitive. It is true that farmers in India spend less on seeds (just US$47 ha-1 crop-1), but the cost difference with Nueva Ecija is small, accounting for less than 4% of the total cost differential with India.
What may be more important than the amount spent on seeds is the quality of seeds, but that topic is beyond the scope of this paper.
Irrigation
In terms of irrigation costs, the Philippines stands out. Costs for Nueva Ecija farmers are US$50 ha-1 crop-1, more than triple the costs in all other countries. But the high irrigation costs must be kept in perspective—irrigation accounts for less than 4% of total costs of production in Nueva Ecija. Giving farmers free irrigation water (as is the case in China) would reduce production costs per kilogram from US$0.29 to US$0.28, hardly a big change. And giving farmers free irrigation water would of course have major institutional implications for the National Irrigation Administration (NIA). The government would have to pick up those costs, leaving less money available for education, roads, and agricultural research. Free irrigation water would also benefit farmers who have access to higher quality land, without any benefits for the poorer rice farmers who rely on rainfed cultivation.
Pesticides
Pesticide costs in the Philippines are just US$41 ha-1 crop-1, which is lower than in all other countries, except India. The relatively low costs are not because of a subsidy but because numerous surveys have found that Philippine rice farmers use smaller amounts of pesticides than their counterparts in other large Asian countries. Lower pesticide use has obvious benefits for the environment and human health, and a subsidy to lower pesticide prices would be a terrible idea. It would encourage farmers to use more pesticides, damaging the environment, and might even raise total costs, depending on the elasticity of pesticide use.

165
Summary
Three key points emerged from the foregoing discussion on inputs. First, farmers in India, Thailand, and Vietnam do not have lower costs of production per hectare per crop because of input subsidies. The biggest source of lower costs per hectare per crop in all three comparisons (Philippines with each of the three exporters) is labor and machinery (Table 13.1). In fact, if labor and machinery costs are ignored, the Philippines has lower production costs than Thailand and Vietnam on a per-hectare per-crop basis; i.e., the cost advantage in labor and machinery fully accounts for all of the cost advantage in these two Southeast Asian exporters. The cost advantage in this category is due to greater use of machinery and less use of labor in Thailand and Vietnam. In India, the cost advantage is primarily due to lower wages (as India is much poorer than the Philippines), but surely the Philippines does not want to emulate India in that regard.
Table 13.1. Costs and cost differentials between Philippines and exporters, 2013 (PhP ha-1 crop-1).
Costs Difference in costPhilippines India Thailand Vietnam India Thailand Vietnam
Labor & machinery 29,242 21,290 15,533 14,226 7,952 13,709 15,016Land rent 10,058 8,750 9,898 10,214 1,308 161 -156Fertilizer 9,231 4,061 8,188 9,324 5,169 1,043 -93Seed 2,744 2,015 5,864 3,042 728 -3,120 -298Irrigation 2,124 523 721 577 1,601 1,403 1,546Chemicals 1,724 994 4,719 5,970 731 -2,994 -4,245Interest 2,066 372 307 532 1,694 1,760 1,534Other 1,885 1,565 1,052 902 320 832 983Total 59,073 932 46,280 44,787 19,504 12,793 14,286
Second, the profitability of rice growing is higher in importing countries than in exporting countries (due to artificially high output prices), but the competitiveness of rice growing is higher in the exporting countries, which have lower costs of production per ton. Philippine farmers obtain much higher output prices than farmers in exporting countries because of the (i) natural protection afforded by transport costs from ports in the exporting countries to Manila and (ii) the trade policy in the Philippines that restricts imports. These higher output prices make rice grown in the Philippines more profitable despite its lower competitiveness. In fact, relative to the exporters, profits per hectare per crop in the Philippines are higher than in India and slightly higher than in Vietnam (Fig. 13.4). It is true that, in 2013, profits per hectare per crop were lower in the Philippines than in Thailand, but this comparison is misleading in that output prices in Thailand in that year were artificially high due to the paddy pledging scheme. That policy was fiscally unsustainable (Poapongsakorn 2014) and, in fact, has been abandoned. At current levels of farmgate prices (i.e., those prevailing in 2014 and 2015), Thai rice production is less profitable than in the Philippines.
Should the Philippines Use Pricing Policy to Improve Competitiveness in Rice Production?
166 Competitiveness of Philippine Rice in Asia
Third, it appears that the only realistic input subsidy that would have a potentially substantial impact on lowering costs of production is a subsidy on the purchase of machinery. If such a subsidy were to be used, its design needs to be considered carefully, and the Chinese experience in this regard should be helpful. Based on past experience in many countries, simply giving away free machines is not likely to be particularly effective at encouraging efficient use (Schmidley, 2014).
IV. Yields
The input-by-input discussion above has been in terms of costs per hectare per crop. But low costs per ton are what ultimately make a farm competitive. Costs per hectare are converted to costs per ton by dividing by yield in tons per hectare. Thus, relative yields, which have not been discussed so far, are a key determinant of competitiveness—higher yields, other things being equal, lead to greater competitiveness.
In terms of yield per hectare, Nueva Ecija ranks relatively low among these rice bowls, ahead of only Tamil Nadu (see chapter on Rice Yield and its Determinants). Thus, increasing yields would raise the competitiveness of Philippine rice production. Holding all costs constant, the percentage increase in yield in Nueva Ecija that would be necessary to equalize the cost per hectare per crop with the exporting countries would be 40, 31 and 90% vis-à-vis India, Thailand, and Vietnam, respectively.
Increasing yields by such sizable amounts, without raising input costs, will of course not be easy to do. There is a range of possible options in this regard (see the chapter on Can Philippine rice compete globally?), but this paper will not discuss them as the focus here is on input pricing policies. But whatever options are pursued, it is certain that agricultural research and extension will have a key role to play.
V. Social profitability: a footnote for economists
Another way to measure competitiveness is to compare the social profitability of rice production at the six locations, using the techniques developed by Monke and Pearson (1989). To compare social profitability (as opposed to private profitability discussed above) across countries, one needs to use the social prices of outputs and inputs, which are the prices that would exist in the absence of government interventions.
However, the coupling of two facts shows that a detailed exercise of calculating social profitability and domestic resource costs (DRC) is not really necessary. First, subsidies are essentially not used in the exporting countries (with the exception of the fertilizer subsidy in India); thus, private prices equal social prices in the exporters. Second, the importing countries all use import restrictions that are binding—without those restrictions, the private sector would import larger quantities than are currently

167
being imported. This implies that the exporting countries are able to export with only minor subsidies at most, and that these exports are competitive upon arrival in the importing countries—the importing countries must use trade barriers to keep them out.9
VI. Conclusions
Analysis of the data collected under the Benchmarking Project shows clearly that the main difference in costs between Nueva Ecija and the “rice bowl” locations in the exporting countries concern labor and machinery. Subsidies of other inputs will not do much to increase competitiveness simply because labor and machinery costs are so much more important. At the same time, subsidies for these other inputs, if implemented, are likely to have large adverse environmental effects by encouraging overuse. Furthermore, input subsidies, such as the fertilizer subsidies in Indonesia and India, can also have large budgetary implications, making it more difficult to finance investments in rural infrastructure (roads, schools, health clinics) that are essential for both competitiveness and welfare of rural citizens.
Given that the data were collected in villages confined to a specific part of each country, will the results noted above still be applicable for the country in general? While we cannot know for sure without nationally representative data, it is highly likely that the same conclusions will still hold because labor markets are reasonably well-integrated in all of these countries. Since, for any given country, there are not massive differences in rural wages between one part of the country and another, the incentives to mechanize will be similar across different provinces or states. India and China will be partial exceptions because they are such large countries: indeed, some states in India have experienced rapid reductions in labor use in rice cultivation while others have not (Ramakumar, 2016), with the states producing a surplus tending to have mechanized more rapidly. Mechanization does take time to proceed and become more widely adopted, but it is not likely in any of these countries that one area will be highly mechanized for a long period of time while another area remains highly labor-intensive. Thus, the importance of reducing labor costs for achieving competitiveness is of national importance and not just confined to a few select locations.
Thus, if the Philippines is to use input subsidies to make its rice farms more competitive, the best option by far would be to subsidize the adoption of combine harvesters. If such a subsidy were to be used, its design needs to be considered carefully, and the Chinese experience in this regard should be helpful—the subsidy needs to be large enough to accelerate adoption but not so large that the machinery owners have no incentive to expand operations (China used a subsidy of 30%). Based on past experience in many countries, simply giving away free machines is not likely to be particularly effective at encouraging efficient use (Schmidley, 2014).
9 The subsidies (specifically fertilizer in India) are minor in terms of their impact on the cost of production; they are not minor in terms of their impact on the government budget.
Should the Philippines Use Pricing Policy to Improve Competitiveness in Rice Production?
168 Competitiveness of Philippine Rice in Asia
Since transplanting by hand, the current method of crop establishment in most of the Philippines, is very labor-intensive, subsidizing the adoption of mechanical transplanters would be another option. But, in the short term, further agronomic research to make direct seeding more profitable for farmers is more important because mechanical transplanters are not yet in wide use in Asia and may not be as cost-effective as direct seeding.
References
Dawe D. 1991. Inequality, protectionism and growth: Philippine rice policy in historical perspective. HIID Development Discussion Paper No. 390.
Dawe DC. 2014. Rice self-sufficiency: nature versus nurture. In: Dawe D, Jaffee S, Santos N (eds.). Rice in the shadow of skyscrapers: policy choices in a dynamic East and Southeast Asian setting. FAO, World Bank and IRRI. 136 p. Available at: http://irri.org/resources/publications/books/item/rice-in-the-shadow-of-skyscrapers.
Dawe DC, Moya PF, Casiwan CB (editors) 2006. Why does the Philippines import rice? Manila (Philippines): International Rice Research Institute (IRRI), and Science City of Muñoz (Philippines): Philippine Rice Research Institute (PhilRice). 166 p.
FAO. 2016. Food price monitoring and analysis tool. Available at http://www.fao.org/giews/pricetool/
Gale F. 2013. Growth and evolution in China’s agricultural support policies. Economic Research Report No. 153. United States Department of Agriculture. http://www.ers.usda.gov/media/1156829/err153.pdf. March 15, 2016.
Javier EQ. 2012. Comments. In: Report of a seminar on “Broad-based strategies on food security and the changing world food markets,” Department of Agriculture and International Fund for Agricultural Development. p. 55-57.
Monke E, Pearson S. 1989. The policy analysis matrix for agricultural development. Place of publication?: Cornell University Press. 279 p.
Narayanan S, Gulati A. 2003. The subsidy syndrome in Indian agriculture. Place of publication?: Oxford University Press.
Osorio CG, Abriningrum DE, Armas EB, Firdaus M. 2011. Who is benefiting from fertilizer subsidies in Indonesia? Policy Research Working Paper 5758. Place of publication?: World Bank.
[PSA] Philippine Statistics Authority. 2016. Countrystat. Available at http://countrystat.psa.gov.ph/
Poapongsakorn N. 2014. The benefits and costs of a paddy pledging policy: the experience of Thailand. In: Dawe D, Jaffee S, Santos N (eds.). Rice in the shadow of skyscrapers: policy choices in a dynamic East and Southeast Asian setting. FAO, World Bank and IRRI. 136 p. Available at: http://irri.org/resources/publications/books/item/rice-in-the-shadow-of-skyscrapers.
Ramakumar R. 2016. Agriculture and Youth in the Asia-Pacific Region: Status and Challenges with Special Reference to India. In Family Farming: Meeting the Zero Hunger Challenge. Food and Agriculture Organization of the United Nations and M.S. Swaminathan Research Foundation (MSSRF). Published by Academic Foundation. Available at http://www.fao.org/3/a-i5650e.pdf.
Schmidley A. 2014. Measures for reducing post-production losses in rice. In: Dawe D, Jaffee S, Santos N (eds.). Rice in the shadow of skyscrapers: policy choices in a dynamic East and Southeast Asian setting. FAO, World Bank and IRRI. 136 p. Available at: http://irri.org/resources/publications/books/item/rice-in-the-shadow-of-skyscrapers.
Yang J, Huang Z, Zhang X, Reardon T. 2013. The rapid rise of cross-regional agricultural mechanization services in China. American Journal of Agricultural Economics. 95(5): 1245–1251.

169
Appendix Table 13.1. Costs and cost differentials between Philippines and exporters, 2013 (US$ ha-1 crop-1).
Costs Difference in costPhilippines India Thailand Vietnam India Thailand Vietnam
Labor & machinery 689 502 366 335 187 323 354Land rent 237 206 233 241 31 4 -4Fertilizer 217 96 193 220 122 25 -2Seed 65 47 138 72 17 -74 -7Irrigation 50 12 17 14 38 33 36Chemicals 41 23 111 141 17 -71 -100Interest 49 9 7 13 40 41 36Other 44 37 25 21 8 20 23Total 1392 932 1090 1055 459 301 337
Should the Philippines Use Pricing Policy to Improve Competitiveness in Rice Production?

170 Competitiveness of Philippine Rice in Asia
CONTRIBUTORS
Jesusa C. Beltran is a Supervising Science Research Specialist of the Socioeconomics Division, Philippine Rice Research Institute, Maligaya, Science City of Muñoz, Nueva Ecija, Philippines. Contact at [email protected]
Flordeliza H. Bordey is a Chief Science Research Specialist and Acting Deputy Executive Director for Development of the Philippine Rice Research Institute, Maligaya, Science City of Muñoz, Nueva Ecija, Philippines. Contact at [email protected]
David C. Dawe is a Senior Food Security Economist of the Regional Office for Asia and the Pacific, Food and Agriculture Organization of the United Nations, Bangkok, Thailand. Contact at [email protected]
Cheryll C. Launio is a former Supervising Science Research Specialist, Philippine Rice Research Institute, Maligaya, Science City of Muñoz, Nueva Ecija; now, Senior Science Research Specialist, Benguet State University, La Trinidad, Benguet. Contact at [email protected]
Aileen C. Litonjua is a Senior Science Research Specialist of the Socioeconomics Division, Philippine Rice Research Institute, Maligaya, Science City of Muñoz, Nueva Ecija, Philippines. Contact at [email protected]
Ronell B. Malasa is a Science Research Specialist II of the Socioeconomics Division, Philippine Rice Research Institute, Maligaya, Science City of Muñoz, Nueva Ecija, Philippines. Contact at [email protected]

171
Rowena G. Manalili is a Senior Science Research Specialist of the Socioeconomics Division, Philippine Rice Research Institute, Maligaya, Science City of Muñoz, Nueva Ecija, Philippines. Contact at [email protected]
Esther B. Marciano is a former Assistant Scientist of the Social Sciences Division, International Rice Research Institute, Los Baños, Laguna, Philippines. Contact at [email protected]
Alice B. Mataia is a Senior Science Research Specialist of the Socioeconomics Division, Philippine Rice Research Institute, Maligaya, Science City of Muñoz, Nueva Ecija, Philippines. Contact at [email protected]
Samarendu Mohanty is a Principal Scientist and Head of the Social Sciences Division and Program Leader of Policy and Targeting of International Rice Research Institute, Los Baños, Laguna, Philippines. Contact at [email protected]
Piedad F. Moya is a former Senior Research Manager; now Research Consultant of the Social Sciences Division, International Rice Research Institute, Los Baños, Laguna, Philippines. Contact at [email protected]
Suennie Jane C. Paran is a former Science Research Specialist I of the Socioeconomics Division, Philippine Rice Research Institute, Maligaya, Science City of Muñoz, Nueva Ecija, Philippines. Contact at [email protected]
Rhemilyn Z. Relado is a Senior Science Research Specialist of the Socioeconomics Division, Philippine Rice Research Institute, Maligaya, Science City of Muñoz, Nueva Ecija, Philippines. Contact at [email protected]
Contributors

172 Competitiveness of Philippine Rice in Asia
Mary Rose L. San Valentin is a Researcher of the Social Sciences Division, International Rice Research Institute, Los Baños, Laguna, Philippines. Contact at [email protected]
Irene R. Tanzo is a Supervising Science Research Specialist of the Socioeconomics Division, Philippine Rice Research Institute, Maligaya, Science City of Muñoz, Nueva Ecija, Philippines. Contact at [email protected]
Ma. Sheila D. Valencia is an Assistant Scientist of the Social Sciences Division, International Rice Research Institute, Los Baños, Laguna, Philippines. Contact at [email protected]
Charmaine G. Yusongco is a Science Research Specialist I of the Socioeconomics Division, Philippine Rice Research Institute, Maligaya, Science City of Muñoz, Nueva Ecija, Philippines. Contact at [email protected]