cdm · eb executive board: the highest authority for the cdm under ... the second edition of this...
TRANSCRIPT
CDM Information and Guidebook
will give a comprehensive overview of the CDM, its
project cycle and related issues such as the linkage
with sustainable development goals, financing and
programmatic projects. The appendices contain a list of
existing types and sub-types of CDM projects and a list
of important and relevant web-sites.
The first two editions of this guidebook to the CDM
was produced to support the UNEP project “Capacity
Development for Clean Development Mechanism” im-
plemented by UNEP Risoe Centre on Energy, Climate
and Sustainable Development in Denmark and funded
by the Netherlands Ministry of Foreign Affairs. The
third edition is produced to support ACP-CD4CDM
project, which is part of the European Commission
Programme for Capacity Building related to Multilat-
eral Environmental Agreements (MEAs) in the African,
Caribbean and Pacific (ACP) Countries.
CDM Information and GuidebookThird edition
The ACP MEAs CDM Programme
Risø National LaboratoryRoskildeDenmark
CDM_omslag_03.indd 1 31/03/11 14.59

CDM Information and Guidebook
Third edition
Developed for the UNEP project ‘CD4CDM’
Updated for the EU ACP MEA/CDM Programme
Joergen Fenhann
Miriam Hinostroza
March 2011

cdm Information and Guidebook
Third edition
UNEP Risoe Centreon Energy, Climate and Sustainable DevelopmentNational Laboratory for Sustainable EnergyTechnical University of Denmark4000 Roskilde, Denmark
ISBN: 978-87-550-3897-4
Graphic design: Kowsky / www.kowsky.dk
541-339Printed matter
CO2 neutralized prints
Frederiksberg Bogtrykkeri A/S has neutralized the CO2 emissionsthrough the production of this publication.

Abbreviations ........................................................................................ 5
1. Introduction ...................................................................................... 7
2. Overview of the clean development mechanism .............................. 9
2.1 Background .................................................................................. 9
2.2 The Kyoto protocol and the clean development mechanism ......... 10
2.3 CDM overview ............................................................................ 12
2.4 National value and benefits.......................................................... 14
3. Synergies between CDM projects and national sustainable development priorities ................................................. 17
3.1 Assessing sustainable development impacts- criteria and indicators .................................................................. 18
3.2 Applying sustainability indicators to CDM projects – an illustration ............................................................................25
3.3 Major steps of an SD evaluation of CDM projects ........................ 27
3.4 Conclusion ..................................................................................28
4. The CDM project cycle .....................................................................29
4.1 Project design and formulation ......................................................30
4.2 National approval .........................................................................44
4.3 Validation/registration ..................................................................47
4.4 Project financing ...........................................................................53
4.5 Monitoring ...................................................................................54
4.6 Verification/certification .............................................................. 56
4.7 Issuance of CERs ...........................................................................57
5. The Project Design Document (PDD) .............................................. 59
5.1 General description of project activity ......................................... 59
5.2 Baseline methodology ................................................................. 60
5.3 Approved small-scale methodologies .......................................... 63
contents

5.4 Duration of the project activity/crediting period.......................... 69
5.5 Monitoring methodology and plan ...............................................70
5.6 Calculation of GHG emission by sources ...................................... 72
5.7 Environmental impacts ................................................................76
5.8 Stakeholder comments ................................................................76
5.9 Annex 1: Contact information on participants in the project activity ...................................................................77
5.10 Annex 2: Information regarding public funding .............................77
5.11 Annex 3: Baseline information and annex 4: monitoring information ................................................................77
6. Financing CDM projects ................................................................. 79
6.1 Financing requirements of CDM projects .................................... 80
6.2 Sources of project funds ............................................................. 83
6.3 CDM specific transaction costs.................................................... 86
6.4 Impact of CERs on project viability.............................................. 86
6.5 Types of finance available for a CDM project ................................87
6.6 Financing models for CDM projects ............................................ 88
6.7 Risk management ....................................................................... 98
7. CDM programme of activities ........................................................ 101
7.1 Definition and rationale ..............................................................101
7.2 Operation of a POA ....................................................................102
7.3 The CDM program activity (CPA) level ....................................... 106
7.4 Difference between poas and bundling ...................................... 109
7.5 Structuring a POA .......................................................................110
7.6 Identification of stakeholders relevant to the POA policy/goal ..... 114
7.7 Development of POA-DD, generic CPA-dd and real CPA-DD ......116
Appendix a: a list of existing CDM projects subtypes ...................... 119
Appendix b: essential CDM web-sites .............................................. 125

5
AAU Assigned Amount Unit (unit for emissions trading)
AE Applicant Entity (an entity applying to be a DOE)
AIJ Activities Implemented Jointly
Annex B The 39 developed countries in Annex B of the Kyoto Protocol that have GHG reduction commitments.
Annex I The 36 developed countries in Annex I of the UNFCCC that had non-binding GHG reduction commitments to 1990 levels by 2000
AP Accreditation Panel (a panel under the EB)
AT Assessment Team (made by the CDM Assessment Panel under the EB to evaluate each AE)
CDCF Community Development Carbon Fund (a WB activity)
CDM Clean Development Mechanism
CER Certified Emission Reduction (unit for the CDM)
CERUPT Certified Emission Reduction Unit Purchasing Procurement Tender
CO2 Carbon Dioxide
COP Conference of the Parties
COP/MOP Conference of the Parties and Meetings serving as the meeting of the Parties to the Kyoto Protocol when the Kyoto Protocol enters into force
CPA CDM Programme Activity
DOE Designated Operational Entity: an accredited organisation that validates and certifies CDM projects.
DNA Designated National Authority
EB Executive Board: the highest authority for the CDM under the COP/MOP
EIA Environmental Impact Assessment
EIT Economies in Transition (former Soviet Union, Central and Eastern European countries)
ERU Emission Reduction Unit (unit for JI)
EU ETS European Union Emissions Trading Scheme
FDI Foreign Direct Investment
GDP Gross Domestic Product
abbreviations
6
GHG Greenhouse gas
GWh Gigawatt hour (million kWh)
GWP Global Warming Potential
HFC Hydrofluorocarbon
IEA International Energy Agency
IPCC Intergovernmental Panel on Climate Change
IRR Internal Rate of Return
JI Joint Implementation
kt kilo tonnes (1000 tonnes)
kWh kilowatt hour
LULUCF Land Use, Land Use Change and Forestry
Mt Million tonnes
MW Megawatt
MMTC Million metric tonnes of carbon
MMTCO2e Million metric tonnes of CO2 equivalent
NGO Non-governmental Organization
NOx Nitrogen Oxide
O & M Operation and Maintenance
ODA Official Development Assistance
OECD Organisation for Economic Co-operation and Development
PCF Prototype Carbon Fund (a WB activity)
PFC Perfluorocarbon
PDD Project Design Document
PoA Program of Activities
PV Photovoltaic
SD Sustainable Development
SF6 Sulphur Hexafluoride
SHS Solar Home System
SO2 Sulphur Dioxide
TJ Tera Joule (1012 joule)
UNDP United Nations Development Programme
UNEP United Nations Environment Programme
UNFCCC United Nations Framework Convention on Climate Change
WHO World Health Organization
WMO World Meteorological Organization

7
1
Introduction
Since the CDM was defined at COP3 in Kyoto 1997, it took the internation-al community another 4 years to reach the Marrakech Accords in which the modalities and procedures to implement the CDM was elaborated. Since the second edition of this guidebook published in June 2004 the CDM has developed very rapidly. This third edition of the guidebook is featuring recent developments within the CDM.
This guidebook to the CDM is produced as part of UNEP/UNEP Risoe’s CDM Capacity Building Programme which is part of the Multilateral Environment Agreements (MEAs) Project in ACP Countries. A series of guidebooks and other print and electronic outputs will be produced cover-ing other important issues such as project finance, sustainability impacts, baseline methodologies, legal framework and institutional framework are being developed in a more focused way. These materials will help all stakeholders better understand the CDM and will eventually contribute to maximize the effect of the CDM in achieving the ultimate goal2 of UNFCCC and its Kyoto Protocol.
In chapter 2, an overview of the CDM is provided. This chapter draws upon a booklet titled “Introduction to the CDM” which was published in the early days of CDM by UNEP RISOE Centre3. It summarizes the national values and benefits of participation in the CDM with a brief background of the CDM.
Chapter 3 visits the issue of sustainable development from the perspec-tive of a CDM project. The Kyoto Protocol clearly states that one of the purposes of the CDM is to assist Non-Annex I parties in achieving sustain-able development. The selection of the SD criteria and the assessment of the SD impacts in the current operationalisation of the Kyoto Protocol are
2 It is well elaborated in Article 2 of UNFCCC 3 Different language versions of this booklet are available on the web www.cd4cdm.org in English,

8
subject to a sovereign decision by the host countries. This chapter presents an example of Sustainable Development (SD) Indicators and major steps of an SD evaluation of CDM projects.
Chapter 4 explains the project cycle of the CDM. Each step of the CDM project cycle is explained from project design & formulation to the is-suance of CERs. With informative tables and numbers, chapter 6 shows how to fill out the PDD (Project Design Document). These two chapters will help project developers who want to know how to make a PDD to develop CDM projects.
Chapter 5 describes the new possibility to make programmatic projects. This should make it possible to increase the number of small CDM projects4.
CDM projects generate both conventional project outputs and CERs. CERs, as a nascent commodity have important impact on project finance. Chapter 6 provides an overview of financing of CDM projects5 and the impact of CERs on project viability.
Lastly, one appendix show a list of the sub-types of CDM projects submit-ted until the present. A second appendix shows some important CDM web-sites.
This guidebook will give a comprehensive overview of the CDM, its project cycle and related issues. Each stakeholder is expected to take into account its own circumstances in utilizing this guidebook.
4 This chapter builds on the UNEP Risoe CD4CDM Guidebook “A Primer on CDM Programme of Activities.
5 The chapter builds on the UNEP Risoe “CD4CDM Guidebook to Financing CDM projects”.
9
2
Overview of the Clean Development Mechanism
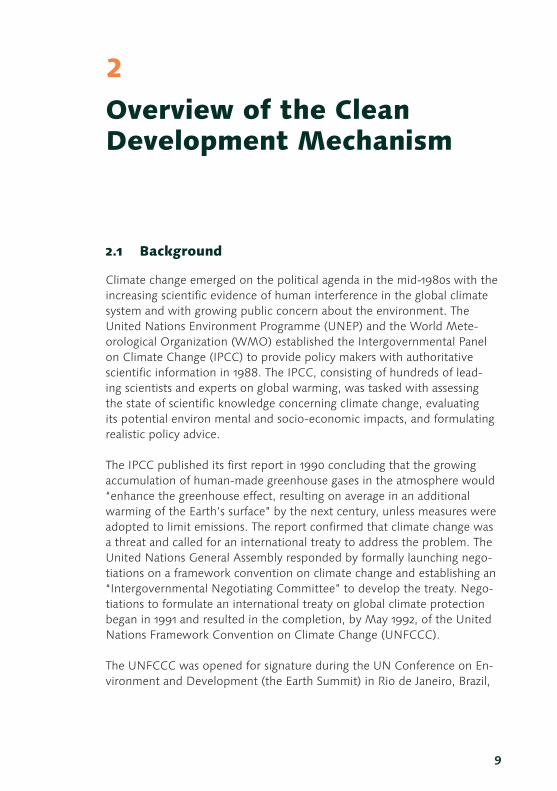
2.1 Background
Climate change emerged on the political agenda in the mid-1980s with the increasing scientific evidence of human interference in the global climate system and with growing public concern about the environment. The United Nations Environment Programme (UNEP) and the World Mete-orological Organization (WMO) established the Intergovernmental Panel on Climate Change (IPCC) to provide policy makers with authoritative scientific information in 1988. The IPCC, consisting of hundreds of lead-ing scientists and experts on global warming, was tasked with assessing the state of scientific knowledge concerning climate change, evaluating its potential environ mental and socio-economic impacts, and formulating realistic policy advice.
The IPCC published its first report in 1990 concluding that the growing accumulation of human-made greenhouse gases in the atmosphere would “enhance the greenhouse effect, resulting on average in an additional warming of the Earth’s surface” by the next century, unless measures were adopted to limit emissions. The report confirmed that climate change was a threat and called for an international treaty to address the problem. The United Nations General Assembly responded by formally launching nego-tiations on a framework convention on climate change and establishing an “Intergovernmental Negotiating Committee” to develop the treaty. Nego-tiations to formulate an international treaty on global climate protection began in 1991 and resulted in the completion, by May 1992, of the United Nations Framework Convention on Climate Change (UNFCCC).
The UNFCCC was opened for signature during the UN Conference on En-vironment and Development (the Earth Summit) in Rio de Janeiro, Brazil,
10
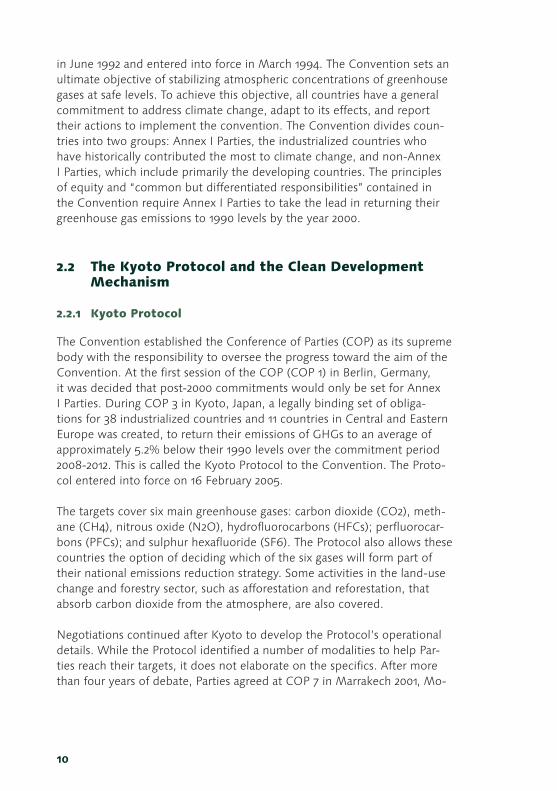
in June 1992 and entered into force in March 1994. The Convention sets an ultimate objective of stabilizing atmospheric concentrations of greenhouse gases at safe levels. To achieve this objective, all countries have a general commitment to address climate change, adapt to its effects, and report their actions to implement the convention. The Convention divides coun-tries into two groups: Annex I Parties, the industrialized countries who have historically contributed the most to climate change, and non-Annex I Parties, which include primarily the developing countries. The principles of equity and “common but differentiated responsibilities” contained in the Convention require Annex I Parties to take the lead in returning their greenhouse gas emissions to 1990 levels by the year 2000.
2.2 The Kyoto Protocol and the Clean Development Mechanism
2.2.1 Kyoto Protocol
The Convention established the Conference of Parties (COP) as its supreme body with the responsibility to oversee the progress toward the aim of the Convention. At the first session of the COP (COP 1) in Berlin, Germany, it was decided that post-2000 commitments would only be set for Annex I Parties. During COP 3 in Kyoto, Japan, a legally binding set of obliga-tions for 38 industrialized countries and 11 countries in Central and Eastern Europe was created, to return their emissions of GHGs to an average of approximately 5.2% below their 1990 levels over the commitment period 2008-2012. This is called the Kyoto Protocol to the Convention. The Proto-col entered into force on 16 February 2005.
The targets cover six main greenhouse gases: carbon dioxide (CO2), meth-ane (CH4), nitrous oxide (N2O), hydrofluorocarbons (HFCs); perfluorocar-bons (PFCs); and sulphur hexafluoride (SF6). The Protocol also allows these countries the option of deciding which of the six gases will form part of their national emissions reduction strategy. Some activities in the land-use change and forestry sector, such as afforestation and reforestation, that absorb carbon dioxide from the atmosphere, are also covered.
Negotiations continued after Kyoto to develop the Protocol’s operational details. While the Protocol identified a number of modalities to help Par-ties reach their targets, it does not elaborate on the specifics. After more than four years of debate, Parties agreed at COP 7 in Marrakech 2001, Mo-

11
rocco to a comprehensive rulebook – the Marrakech Accords – on how to implement the Kyoto Protocol. The Accords also intend to provide Parties with sufficient clarity to consider ratification.
2.2.2 CDM and Cooperative Mechanisms
The Protocol establishes three cooperative mechanisms designed to help Annex I Parties reduce the costs of meeting their emissions targets by achieving emission reductions at lower costs in other countries than they could domestically. These are the following:
• International Emissions Trading permits countries to transfer parts of their ‘allowed emissions’ (assigned amount units).
• Joint Implementation (JI) allows countries to claim credit for emis-sion reduction that arise from investment in other industrialized countries, which result in a transfer of ‘emission reduction units’ between countries.
• Clean Development Mechanism (CDM) allows emission reduction projects that assist developing countries in achieving sustainable development and that generate ‘certified emission reductions’ for use by the investing countries or companies.
The mechanisms give countries and private sector companies the oppor-tunity to reduce emissions anywhere in the world – wherever the cost is lowest – and they can then count these reductions towards their own tar-gets. Any such reduction, however, should be supplementary to domestic actions in the Annex I countries.
Through emission reduction projects, the mechanisms could stimulate international investment and provide the essential resources for cleaner economic growth in all parts of the world. The CDM, in particular, aims to assist developing countries in achieving sustainable development by promoting environmentally friendly investment from industrialized country governments and businesses.
“The funding channeled through the CDM should assist developing countries in reaching some of their economic, social, environmental and sustainable development objectives, such as cleaner air and water, im-proved landuse, accompanied by social benefits such as rural development, employment, and poverty alleviation and in many cases, reduced depend-ence on imported fossil fuels. In addition to catalyzing green investment

12
priorities in developing countries, the CDM offers an opportunity to make progress simultaneously on climate, development, and local environmen-tal issues. For developing countries that might otherwise be preoccupied with immediate economic and social needs, the prospect of such benefits should provide a strong incentive to participate in the CDM.”
2.3 CDM Overview6
The CDM allows an Annex I party to implement a project that reduces greenhouse gas emissions or, subject to constraints, removes greenhouse gases by carbon sequestration in the territory of a non-Annex I Party. The resulting certified emission reductions, known as Certified Emission reductions (CERs), can then be used by the Annex I Party to help meet its emission reduction target.
2.3.1 Administration
The CDM is supervised by the Executive Board, which itself operates under the authority of the Parties. The Executive Board is composed of 10 mem-bers, including one representative from each of the five official UN regions (Africa, Asia, Latin America and the Caribbean, Central Eastern Europe, and OECD), one from the small island developing states, and two each from Annex I and non-Annex I Parties.
The Executive Board (EB) accredits independent organizations – known as operational entities – that validate proposed CDM projects, verify the re-sulting emission reductions, and certify those emission reductions as CERs. The EB approves new CDM methodologies submitted by stakeholders. Another key task of the EB is the maintenance of a CDM registry, which will issue new CERs, manage an account for CERs levied for adaptation and administration expenses, and maintain a CER account for each non-Annex I Party hosting a CDM project.
2.3.2 Participation
In order to participate in CDM, all parties (Annex I and non-Annex I Par-ties) must meet three basic requirements: i) voluntary participation, ii) establishment of the National CDM Authority, iii) ratification of the Kyoto
6 The project cycle of the CDM will be reviewed in more detail in chapter 4. All official information on CDM can be found on the website CDM.unfccc.int
13
Protocol. Annex I Parties moreover must meet additional requirements such as the following: i) establishment of the assigned amount under Arti-cle 3 of the Protocol, ii) national system for the estimation of greenhouse gases, iii) national registry, iv) annual inventory, and v) accounting system for the sale and purchase of emission reductions.
2.3.3 Project Eligibility
The Kyoto Protocol stipulates several criteria that CDM projects must satisfy. Two critical criteria could be broadly classified as additionality and sustainable development.
Additionality: Article 12 of the Protocol states that projects must result in “reductions in emissions that are additional to any that would occur in the absence of the project activity”. The CDM projects must lead to real, meas-urable, and longterm benefits related to the mitigation of climate change. The additional greenhouse gas reductions are calculated with reference to a defined baseline.
Sustainable development: The protocol specifies that the purpose of the CDM is to assist non-Annex I Parties in achieving sustainable development. There is no common guideline for the sustainable development criterion and it is up to the developing host countries to determine their own crite-ria and assessment process. The criteria for Sustainable Development may be broadly categorized as:
• Social criteria. The project improves the quality of life, alleviates poverty, and improves equity.
• Economic criteria. The project provides financial returns to local entities, results in positive impact on balance of payments, and transfers new technology.
• Environmental criteria. The project reduces greenhouse gas emis-sions and the use of fossil fuels, conserves local resources, reduces pressure on the local environments, provides health and other envi-ronmental benefits, and meets energy and environmental policies.

14
2.4 National value and benefits
The basic principle of the CDM is simple: developed countries can invest in low-cost abatement opportunities in developing countries and receive credit for the resulting emissions reductions, thus reducing the cutbacks needed within their borders. While the CDM lowers the cost of compli-ance with the Protocol for developed countries, developing countries will benefit as well, not just from the increased investment flows, but also from the requirement that these investments advance sustainable development goals. The CDM encourages developing countries to participate by promis-ing that development priorities and initiatives will be addressed as part of the package. This recognizes that only through long-term development will all countries be able to play a role in protecting the climate.
From the developing country perspective, the CDM can:
• Attract capital for projects that assist in the shift to a more prosper-ous but less carbon-intensive economy;
• Encourage and permit the active participation of both private and public sectors;
• Provide a tool for technology transfer, if investment is channelled into projects that replace old and inefficient fossil fuel technology, or create new industries in environmentally sustainable technologies; and,
• Help define investment priorities in projects that meet sustainable development goals.
Specifically, the CDM can contribute to a developing country’s sustainable development objectives through:
• Transfer of technology and financial resources;• Sustainable ways of energy production;• Increasing energy efficiency & conservation;• Poverty alleviation through income and employment generation;
and,• Local environmental side benefits
The drive for economic growth presents both threats and opportunities for sustainable development. While environmental quality is an essential element of the development process, in practice, there is considerable tension between economic and environmental objectives. Increased access

15
to energy and provision of basic economic services, if developed along conventional paths, could cause long-lasting environmental degradation — both locally and globally. But by charting a different course and provid-ing the technological and financial assistance to follow it, many potential problems could be avoided.
In comparing potential CDM projects with what might otherwise take place, it is clear that the majority will entail not only carbon reduction ben-efits, but also produce a range of environmental and social benefits within developing countries. Sustainable development benefits could include reductions in air and water pollution through reduced fossil fuel use, espe-cially coal and oil, but also extend to improved water availability, reduced soil erosion and protected biodiversity. For social benefits, many projects would create employment opportunities in target regions or income groups and promote local energy self-sufficiency. Therefore carbon abate-ment and sustainable development goals can be simultaneously pursued.
Many options under the CDM could create significant co-benefits in devel-oping countries, addressing local and regional environmental problems and advancing social goals. For developing countries that might otherwise give priority to immediate economic and environmental needs, the prospect of significant ancillary benefits should provide a strong inducement to partici-pate in the CDM.

16
17
3
Synergies between CDM Projects and National Sustainable Development Priorities
As described in the previous chapter, the Kyoto Protocol stipulates that CDM projects must assist developing countries in achieving sustainable development (SD) in order to fulfill the eligibility criteria. However, the SD dimension should not merely be seen as a requirement of the CDM, it should be seen as a main driver for developing country interested in participating in the CDM.
This is so, since the selection of the SD criteria and the assessment of the SD impacts in the current operationalisation of the Kyoto Protocol are decided to be sovereign matters of the host countries. Apart from GHG emission reductions, CDM projects will have a number of impacts in the host countries including impacts on economic and social development, and on the local environment, i.e. impacts on all of the three dimensions of SD. National authorities can thus use the SD dimension to evaluate key linkages between national development goals and CDM projects, with the aim of selecting and designing CDM projects in a way, where they explore, create and maximize synergies with local development goals.
The potential for such synergies is well documented. In many countries, there are various examples of energy efficiency and renewable energy initiatives that are part of sound development programmes with significant side-benefits on climate change. Other examples include price reform, agricultural soil protection, sustainable forestry, and energy sector re-structuring, all of which have had substantial effects on the growth rates of greenhouse gas emissions, even though they have been undertaken

18
without any reference to climate change mitigation or adaptation. This observation suggests that it may often be possible to build environmental and climate policy on development priorities that are vitally important to host countries. By exploring the main linkages between CDM projects and their impacts in the three dimensions of SD, host countries can design and select CDM projects that are associated with the largest development benefits.
In this chapter, we address the main issues related to assessing SD impacts of CDM projects from this perspective. First, a short introduction to the concept of SD is given and it is discussed and exemplified how possible SD criteria and indicators for CDM projects may be chosen based on national development objectives. This is followed by a hypothetical example on the application of SD indicators to CDM project evaluation. Finally, sugges-tions on major steps for a SD evaluation of CDM projects are provided.
3.1 Assessing sustainable development impacts– criteria and indicators
3.1.1 Conceptualizing sustainable development and selecting sustainable development criteria
The first step in an effort to assess the SD impacts of CDM projects is for the host country to define and select specific aspects of and goals related to SD that are considered to be important. We call these aspects or goals the SD criteria. There is no universally accepted definition of sustainable development7. However, there is a common consensus to view the concept as encompassing three dimensions: the social, economic and environmental dimension. In the theoretical literature on sustainable development, the main focus of analysis has been environmental resources and the maintenance and composition of stocks of resources or ‘capitals’ (human, manmade, social and environmental) over time. This is not sur-prising given the origin of the concept, but in order to operationalise SD in the context of developing countries and CDM projects, there is a need for a more pragmatic approach to SD with a stronger emphasis on immediate development objectives such as poverty reduction, local environmental health benefits, employment generation and economic growth prospects,
7 An often cited definition is that of the World Commission on Environment and development (1987), whereby SD is defined as “development that meets the needs for the present without compromising the ability of future generations to meet their own needs”.
19
etc. In this way, synergies between CDM projects and national sustainable development goals are prioritized.
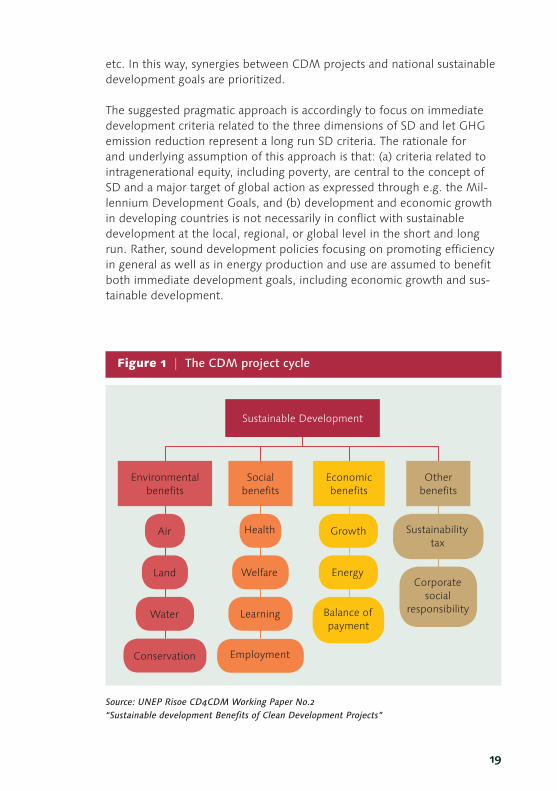
The suggested pragmatic approach is accordingly to focus on immediate development criteria related to the three dimensions of SD and let GHG emission reduction represent a long run SD criteria. The rationale for and underlying assumption of this approach is that: (a) criteria related to intragenerational equity, including poverty, are central to the concept of SD and a major target of global action as expressed through e.g. the Mil-lennium Development Goals, and (b) development and economic growth in developing countries is not necessarily in conflict with sustainable development at the local, regional, or global level in the short and long run. Rather, sound development policies focusing on promoting efficiency in general as well as in energy production and use are assumed to benefit both immediate development goals, including economic growth and sus-tainable development.
Figure 1 | The CDM project cycle
Source: UNEP Risoe CD4CDM Working Paper No.2 “Sustainable development Benefits of Clean Development Projects”
Environmental benefits
Social benefits
Economic benefits
Health
Welfare
Learning
Employment
Growth
Energy
Balance of payment
Sustainability tax
Corporate social
responsibility
Other benefits
Sustainable Development
Conservation
Water
Land
Air

20
In practice, this pragmatic approach seems to reflect what developing countries are already focusing on in their identification of sustainability criteria for CDM projects. Figure 1 below show a list of possible SD criteria for CDM project screening
The figure is of course not exhaustive, but it indicates that
• Most of the criteria are also major national development criteria• Host countries can exploit synergies between CDM projects and
national SD priorities• A relatively limited number of SD criteria can capture a broad variety
of the SD impacts that CDM projects may have
Well designed CDM projects can thus offer attractive opportunities for supporting development priorities of host countries as reflected in e.g. general national development plans, in sectoral or local environmental plans, and in social development strategies. By including relevant criteria from existing plans and strategies in the selection of SD criteria for CDM projects, the additional effort related to the SD assessment process is fur-thermore minimized and consistency between environmental and broader development considerations is enhanced. These aspects are important, as it is sometimes argued in the debate that the SD impact assessment of CDM projects merely adds to transaction costs and is a complication that developing countries cannot afford. Taken one step further, some argue that competition for investment may result in a low priority on assuring broader SD impacts of CDM. It should be stressed, however, that while the SD assessment does involve some costs, these costs will be smaller than the benefits in the form of betterdesigned projects with larger impacts on national development goals.
The next step in the assessment process is to define indicators that reflect the chosen SD criteria. In other words, we need to translate the criteria into something that can be used to give us information about the perform-ance of a given CDM project with respect to the chosen criteria. The issue of indicators is addressed in the following.
3.1.2 How to select SD indicators
One way of establishing a linkage between CDM projects and national sustainable development criteria is through the use of project evaluation indicators that reflect specific CDM project issues such as financial costs

21
and GHG emission reductions as well as development criteria including economic, social, and environmental sustainability dimensions.
The application of SD indicators to CDM project evaluation is therefore a tool for checking how the CDM potentially can be used to create synergies with host country development objectives. Based on the chosen SD crite-ria as exemplified above, the indicators for the SD assessment should be chosen so that they simultaneously reflect the SD criteria and are easy to use and understand. A few more detailed comments are presented below on how SD indicators can be selected in order to meet these objectives.
First of all, an SD indicator or set of indicators should be comprehensive and measurable in order to be useful to the decision maker. Comprehen-siveness should be understood in relation to the scope of the chosen SD criteria reflecting the economic, environmental, and social dimensions. Furthermore, comprehensiveness implies that knowledge of the level of a specific set of indicators enables the decision maker to assess the extent to which a given objective has been reached. Measurability means that the indicator can be defined and measured unambiguously and without exces-sive use of effort, time and costs.
In the case of CDM projects, the assessment of SD will involve a set of indicators and these should be selected so that they are:
• Complete: The set of indicators should be adequate to indicate the degree to which the overall objective of sustainability has been met. This implies that key SD issues are reflected in a local and global context, and that the economic, environmental, and social dimen-sions are covered.
• Operational: The set of indicators should be used in a meaningful way in the analysis. This in turn implies that the indicators should provide a balanced coverage of the area; that they are well defined and unambiguous; and that they should be policy-relevant, i.e.
• Relate to areas that will be affected by policy decisions • Can be understood and related to policy decisions • Can be interpreted
• Decomposable: A formal decision analysis requires both the decision maker’s preferences for consequences and his/her judgments about uncertain events are quantified. Because of the complexity involved,

22
this will be extremely difficult for decision problems involving even a relatively modest number of indicators. It is therefore recommended that the set of indicators is decomposable, i.e. that the decisions can be broken down into parts involving a smaller number of indicators.
• Non-redundant: The indicators should be defined to avoid double counting of consequences.
• Minimal: It follows from the above that it is desirable to keep the set of indicators as small as possible. For instance it may be possible to combine indicators to reduce the dimensionality of the decision problem. It may also be possible to minimise costs, time and effort by letting the set of indicators be partly based on available data that is of a high quality and is regularly updated.
3.1.3 Examples of potential SD indicators that can be applied to CDM project evaluation
While the previous section gave some guidance regarding the process of defining and selecting indicators for assessing the SD impacts of CDM projects, this section presents an overview in table format of indica-tors that may be used to evaluate general economic, environmental, and social sustainability dimensions of CDM projects, based on the SD criteria selected by CDM project host countries (see Table 1 ). The list of indicators presented in the table is not exhaustive and should only be seen as provid-ing examples of indicators that countries may decide to use.
A few comments on applying SD indicators to CDM project evaluation are appropriate. First of all, a large number of SD indicators are available in the literature and it is therefore suggested that existing statistical material and measurement standards for the indicators be used to the extent pos-sible. In this way economic SD indicators may, for example, be inspired by statistical standards from the United Nations (UN), energy can follow the International Energy Agency (IEA) format, and GHG emissions and carbon sequestration can follow Intergovernmental Panel on Climate Change (IPCC) guidelines. Welldefined international standards from e.g. the United Nations Development Programme, the World Bank (WB), and the World Health Organization (WHO) may cover a number of social dimensions like equity aspects, health, and education. Similarly, there are international standards for environmental impact data, used in e.g. environmental im-pact assessments.

23
Secondly, as the number of references given above indicates, a compre-hensive list of indicators covering all relevant project and SD aspects will almost inevitably be too long for any program to have as a core group of indicators to be evaluated. This is also the case for the indicators listed in Table 1. A suggestion is accordingly for a host country to select a core set of indicators, which all projects must look at and a secondary set, which may be used depending on project details and design. This corresponds to the desirable properties of a set of indicators addressed above that the set should be comprehensive and complete, but at the same time minimal and decomposable.
A third comment is that in most cases it will be necessary for the CDM process to consider a number of qualitative indicators in addition to the quantitative indicators. Qualitative indicators are needed to capture impacts that are important and cannot be quantified, such as impacts on institutions, networks, etc. resulting from the project. As these examples and Table 1 suggest, particularly the social dimension of sustainability is an area, where a combination of qualitative and quantitative information is usually required. The use of this combined information requires care-ful consideration with regard to comprehensiveness, consistency, and transparency in definition and presentation. Furthermore, the provision of information about social sustainability dimensions is complicated by the relatively premature state of the research and applications in this area compared with other aspects. In practice, it will subsequently be difficult to collect and interpret all the suggested information for individual policies and comparable policy assessments. ‘CDM and Sustainable Development’ provides a more detailed discussion about the qualitative information and how it can be used.
A fourth and final comment is that as usual the impacts of the project should be compared to a baseline case. In relation to the table above, this implies that we are interested in the changes in the measurement standard of the indicators between the baseline case and the CDM project case.

24
Table 1 | Examples of major sustainability indicators that can be used in relation to CDM projects (source UNEP Risoe CD4CDM Working Paper NO.2 “Sustainable development Benefits of Clean Development Projects”)
Envi
ronm
enta
l be
nefit
s
Air Improving air quality by reducing air pollutants such as SOx, NOx, suspended particulate matter (SPM), Non Methane Volatile Organic Compounds (NMVOCs), dust, fly ash and odour.
Land Avoid soil pollution including avoided waste disposal and improvement of the soil through the production and use of e.g. compost, manure nutrient and other fertilizers.
Water Improved water quality through e.g. wastewater management, water savings, safe and reliable water distribution, purification/sterilization and cleaning of water.
Conservation Protection and management of resources (such as minerals, plants, animals and biodiversity but excluding waste) and landscapes (such as forests and river basins).
Soci
al
bene
fits
Employment Creation of new jobs and employment opportunities including income generation.
Health Reduction of health risks such as diseases and accidents or improvement of health conditions through activities such as construction of a hospital, running a health care centre, preservation of food, reducing health damaging air pollutants and indoor smoke.
Learning Facilitation of education, dissemination of information, research and increased awareness related to e.g. waste management, renewable energy resources and climate change through consruction of a school, running of educational programs, site visits and tours.
Welfare Improvement of local living and working conditions including safety, sommunity or rural upliftment, reduced traffic congestion, poverty alleviation and income redistribution through e.g. increased municipal tax revenues.
Econ
omic
be
nefit
s
Growth Support for economic development and stability through initiation of e.g. new industrial activities, investments, establishment and maintenance of infrastructure, enhancing productivity, redution of costs, setting an example for other industries and creation of business opportunities.
Energy Improved access, availability and quality of electricity and heating services such as coverage and reliability.
Balance of Payments
Reduction in the use of foreign exchange through a reduction of imported fossil fuels in order to increase national economic independence.
Oth
er
bene
fits
Sustainability tax
Collection of a sustainability tax for support of sustainable development activities.
Corporate Social Responsibility
Support for ongoing corporate social responsibility activities that are indirect or drived benefits of the CDM project activity.

25
3.2 Applying sustainability indicators to CDM projects – An illustration
To illustrate how the SD impacts of a CDM project may be assessed in practice, the following hypothetical case example is constructed. The hypothetical CDM project considered is a rural biogas plant for household cooking, lighting, and electricity production. The project is assumed to replace the baseline activity, where cooking and heating is based on wood-fuel and kerosene is used for lighting.
Table 2 below gives an overview of the impacts of the case example CDM project compared to the baseline activity. No attempt has been made to quantify the indicators that have been chosen to assess the SD impacts of the project and in this sense Table 2 presents a qualitative overview of the SD impacts. Furthermore, it is emphasized that the specific indicators of SD impacts of the CDM project should merely be seen as examples of aspects that countries may decide to consider.
The qualitative assessment of SD impacts illustrated in Table 2 represents costs, energy access and affordability, employment, local and global environment, education and income generation. The assessment suggests that in most of these areas, the biogas project will have positive impacts compared with the baseline of woodfuel and kerosene consumption.
However, the project may imply that income generation and employment of people related to the woodfuel and kerosene consumption will experi-ence a decrease in activity. It is therefore important to consider how the people affected may benefit from being integrated in the establishing of the biogas plant or in business activities generated by the improved energy access. Another possibility for getting more local development benefits out of this particular CDM project is to try to supplement the specific CDM project with an additional CDM project that creates employment oppor-tunities for the people who are losing their job in relation to the reduced woodfuel and kerosene supply. Examples of CDM projects with positive employment impact are plantation or agricultural projects and various energy projects that include construction work.
Most CDM projects in the energy sector will create multiple positive side impacts on SD indicators as the ones listed in Table 2. As just shown, there may be examples of projects with a negative employment impact in cases where labourintensive fuel consumption is substituted, but most other SD

26
impacts are likely to be either insignificant or positive. For example, there are only a few examples of tradeoffs between GHG emission reduction and local air pollution improvements. Such a trade off can occur in the trans-portation sector if diesel is substituting gasoline, because diesel consump-tion can have lower GHG emissions per km than gasoline, but have higher local air emissions.
Project costs Energy access and affordability
Employ- ment
Environ-mental impacts
Education Income generation
Baseline case: Woodfuel for cooking and kerosene for lighting
Replacement costs of woodfuel cooking devices and kerosene lamps
High costs of woodfuel and kerosene
Employment related to woodfuel and kerosene provision
High local air pollution with associated health damages
Energy provision takes time from educational activities
Lighting quality poor for studying
No power supply for local industry
House holds spend time on energy provision that substitutes income generation activities
CDM project: Biogas plant for electricity production
Capital costs of biogas plant and cooking and lighting appliances
Low costs of gas and electricity
Employment related to construction phase and maintenance
Low local air pollution with associated health benefits
Better lighting for studying
Energy supply supports develop-ment of local industry
House holds get more time for income generation activities
Net impact of replacing baseline case with CDM project
Probably higher project costs
Lower energy supply costs
Higher employment in project startup but lower permanent employment
Lower air pollution with associated health benefits
More time for education and better lighting facilities
More income generated
Tabel 2 | Illustrative example of qualitative assessment of SD impacts on introducing a biogas plant to substitute woodfuel and kerosene consumption
Illustrative example of qualitative assessment of SD impacts on introducing a biogas plant to substitute woodfuel and kerosene consumption

27
3.3 Major Steps of an SD Evaluation of CDM Projects
This chapter has aimed at illustrating how national authorities can use SD assessment of CDM projects as a tool for evaluating key linkages between national development goals and CDM with the aim to promote and design projects so that they create local development synergies. On the basis of the previous sections, this section suggests a 7-step procedure for conducting a SD evaluation of CDM projects
3.3.1 Project Evaluation Steps
The following SD assessment steps for CDM projects are suggested8:
Step 1Selection of policy priorities that characterizes the broader development context, for example as reflected in national plans and sectoral strategies. The policy priorities may be suggested or evaluated in stakeholder sessions and/or related to political decisions or official plans that have been devel-oped in other policy contexts.
Step 2Selection of major SD policy areas that are to be addressed in the CDM project evaluation taking the starting point in a broad range of national development policy themes. This will include economic, social, human and environmental policy dimensions.
Step 3Initial screening of CDM project areas that are considered to be relevant and that should be included in the assessment of linkages to development policies.
Step 4General outline of a procedure for evaluating SD impacts of CDM projects including:
• Selection of SD indicators.• Design of an approach for assessing the indicators.• Definition of a reporting format for the SD impacts of the CDM
project with standards for representing economic, social, human, and environmental information in quantitative and/or qualitative terms.
8 See more detailed outline of the steps in relation to CDM examples in “CDM Sustainable Development Impacts”, URC, 2004.

28
Step 5Detailed assessment of CDM project impacts on SD policies as part of project development. This may involve redesign of projects in order to incorporate SD policy priorities.
Step 6Broader decision making on CDM project selection in the context of na-tional SD contribution as part of more general activities to develop CDM project portfolios. This includes the initial establishment of a dialogue between government, national stakeholders and project developers.
Step 7Broader evaluation of how the implemented CDM project has performed in relation to predetermined SD criteria as a supplement to monitoring, verification and certification procedures.
3.4 Conclusion
CDM projects offer opportunities for creating synergies between climate change policies and SD policies that encompass major national develop-ment priorities. These combined policy goals may be supported through a process in which potential CDM projects are screened against chosen SD criteria representing economic, social, and environmental aspects that host countries find important. Host countries can choose from a long list of potential indicators, including financial and technology transfer, income generation, employment creation, local environmental impacts, health, social development, and equity.
It may be advantageous to integrate SD evaluation into more general national development planning activities, for example through organization of broad stakeholder workshops, evaluation of linkages to development plans, and careful screening of CDM projects with regard to their ability to assist SD.
29
9 This can be downloaded in several languages from the project site www.cd4cdm.org/publications.htm
4
The CDM project cycle
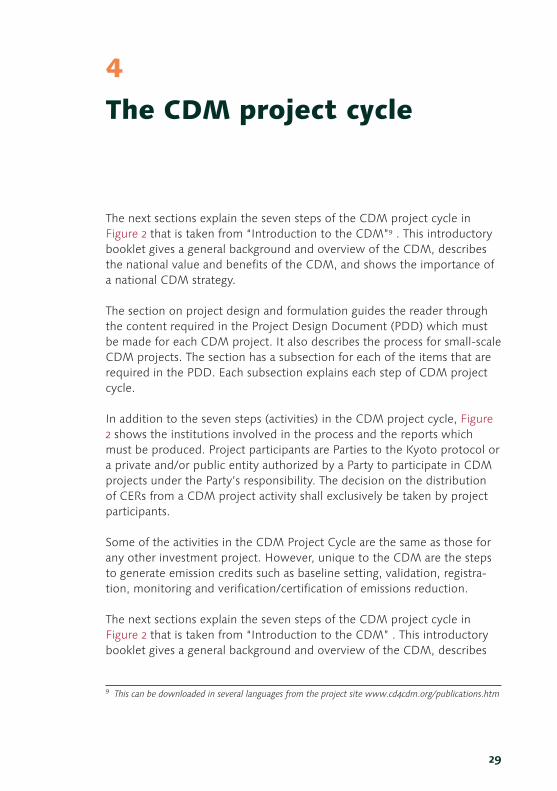
The next sections explain the seven steps of the CDM project cycle in Figure 2 that is taken from “Introduction to the CDM”9 . This introductory booklet gives a general background and overview of the CDM, describes the national value and benefits of the CDM, and shows the importance of a national CDM strategy.
The section on project design and formulation guides the reader through the content required in the Project Design Document (PDD) which must be made for each CDM project. It also describes the process for small-scale CDM projects. The section has a subsection for each of the items that are required in the PDD. Each subsection explains each step of CDM project cycle.
In addition to the seven steps (activities) in the CDM project cycle, Figure 2 shows the institutions involved in the process and the reports which must be produced. Project participants are Parties to the Kyoto protocol or a private and/or public entity authorized by a Party to participate in CDM projects under the Party’s responsibility. The decision on the distribution of CERs from a CDM project activity shall exclusively be taken by project participants.
Some of the activities in the CDM Project Cycle are the same as those for any other investment project. However, unique to the CDM are the steps to generate emission credits such as baseline setting, validation, registra-tion, monitoring and verification/certification of emissions reduction.
The next sections explain the seven steps of the CDM project cycle in Figure 2 that is taken from “Introduction to the CDM” . This introductory booklet gives a general background and overview of the CDM, describes
30
the national value and benefits of the CDM, and shows the importance of a national CDM strategy.
The section on project design and formulation guides the reader through the content required in the Project Design Document (PDD) which must be made for each CDM project. It also describes the process for small-scale CDM projects. The section has a subsection for each of the items that are required in the PDD. Each subsection explains each step of CDM project cycle.
In addition to the seven steps (activities) in the CDM project cycle, Figure 2 shows the institutions involved in the process and the reports which must be produced. Project participants are Parties to the Kyoto protocol or a private and/or public entity authorized by a Party to participate in CDM projects under the Party’s responsibility. The decision on the distribution of CERs from a CDM project activity shall exclusively be taken by project participants.
Some of the activities in the CDM Project Cycle are the same as those for any other investment project. However, unique to the CDM are the steps to generate emission credits such as baseline setting, validation, registra-tion, monitoring and verification/certification of emissions reduction.
4.1 Project design and formulation
Annex A of the Kyoto Protocol specifies six targeted gases and sectors/source categories where emissions reduction activities can take place. The CDM can include projects in the following sectors:
• Enduse energy efficiency improvement • Supply-side energy efficiency improvement • Renewable energy • Fuel switching • Agriculture • Industrial processes • Solvent and other product use • Waste management • Sinks (only afforestation and reforestation)

31
Source: Introduction to the CDM, UNEP RISOE Centre, 2002
Figure 2 | The CDM project cycle
Project design & formulation
National approval
Validation/ registration
Project financing & implementation
Monitoring
Verification/ certification
Issuance of CERs
Project design document
Monitoring report
Verification report/Certification report/
Request for CERs
Operational Entity B
EB/Registry
1
2
3
4
5
6
7
Project description:Baseline methodology; Monitoring methods/plan; GHG emissions; Statement of env. impact; Stakeholder comments
National CDM Authority:Government consent; Government confirma-tion that the project assist in sustainable development
LEGENDS:
Operational entity A
Investors
Project participants
Activity
Report
Institution

32
CDM projects must result in real and measurable climate change benefits and should be additional to any that would occur in the absence of the project activity. To establish additionality, the project emissions must be compared to the emissions of a reasonable reference case without the CDM, identified as the baseline. The baseline will be established on a project-specific basis by the project participants complying with approved method-ologies. These baseline methodologies are being developed on the basis of three approaches in the Marrakech Accord:
• Existing actual or historical emissions;
• Emissions from a technology that represents an economically attrac-tive investments; or,
• Average emissions of similar project activities undertaken in the pre-vious five years under similar circumstances and whose performance is among the top 20% of their category.
More detailed explanation of each chapter of PDD will be given in the next chapter.
A General description of project activity
B Application of a baseline and monitoring methodology methodology
C Duration of the project activity/crediting period
D Environmental impacts
E Stakeholder comments
Annex 1 Contact information on participants in the project activity
Annex 2 Information regarding public funding
Annex 3 Baseline information
Annex 4 Monitoring information
Table 3 | Required content of a Project Design Document (PDD)

33
10 Visit http://CDM.unfccc.int/Reference/PDDs_Forms/index.html to get the latest version of the PDD formats
CDM projects must also have a monitoring plan to collect accurate emis-sions data. The monitoring plan, which constitutes the basis of future verifi-cation, should provide confidence that the emission reductions and other project objectives are being achieved and should be able to moni-tor the risks inherent to baseline and project emissions. The monitoring plan can be established either by the project developer or by a specialized agent.
The baseline and monitoring plan must be devised according to the ap-proved methodology used in the CDM project. If no appropriate approved methodology exists, the project participants can develop and submit a new methodology, which then must be authorized and registered by the Execu-tive Board.
Project design and formulation is the first step in the CDM project cycle (see Figure 2) and will have a critical influence on all the following steps. A careful design and formulation of the project will give a higher chance of the eventual success of the whole project.
Prior consideration: At EB49 it was decided (see annex 22 to EB49) that the project participant must inform the Host Party DNA and the UNFCCC secretariat in writing of the commencement of the project activity and of their intention to seek CDM status. Such notification must be made within six months of the project activity start date and shall contain the precise geographical location and a brief description of the proposed project activ-ity, using the standardized form F-CDM-Prior Consideration.
In many cases the project design and formulation start with the formula-tion of a Project Idea Note (PIN), which is a simplified PDD. There exist no official PIN format but several different PIN templates exist; the World Bank has made one and the UNDP MDG Carbon Facility has also made one.
In order to get a CDM project approved and registered by the Executive Board (EB), the project participants must prepare a Project Design Docu-ment (PDD)10 following the detailed outline shown on the CDM website of the UNFCCC Secretariat. The present outline of the PDD is shown in Table 3. The PDD for the small-scale CDM has exactly the same content. However, there are some differences in the text between the two PDDs

34
Figure 3 | The Additionality Tool
Project is additional
Project is not additional
Investment analysis
Does sensitivity analysis conclude that the proposed
CDM project activity is unlikely
to be the most financially attractive
or is unlikely to be financially
attractive?
2Barrier analysis
1. Is there at least one barrier preventing the implementation of the proposed project activity
without the CDM; and 2. Is at least one alternative
scenario, other than proposed CDM
project activity, not prevented by any of the identified
barriers?
3
Common practice analysis
1. No similar activities can be
observed?
2. If similar activities are observed, are
they essential distinctions between the
proposed CDM project activity and
similar activities that can reasonably
be explained?
4
Identification of alernatives to the project activity consistent with mandatory laws and regulations
optional
1
Y
N
NY
N
Y
35
because of the simpler requirements for small-scale CDM project activities. Separate PDD formats exits for Afforestation/Reforestation Projects and for Programmatic CDM projects.
4.1.1 Eligibility
All projects that satisfy the additionality and sustainable development criteria are acceptable under the CDM. For the normal CDM, no positive list of project types has been made. However, limitations have been set on the following projects:
• Forestry. Sink projects allowed are only afforestation and reforesta-tion, and Annex I Parties can only add CERs generated from sink projects to their assigned amounts up to 1% of their baseline emis-sions for the first commitment period.
• Nuclear energy. Annex I Parties must refrain from using CERs gener-ated through nuclear energy to meet their targets.
• Hydro power project where a new dam is constructed with an area making the parameter (installed capacity/lake area) smaller than 4 W/m2.
Large projects are likely to become more attractive than small-scale projects since they will generate large quantities of CERs at lower trans-action costs per unit of emission credit. To facilitate the development of small-scale projects, simplified modalities and procedures were developed to reduce transaction costs.
The EB has decided that a project can have more than one host country. This is e.g. relevant for cross border transmission lines, or hydro projects where a hydro powered country exports the electricity to a neighboring country using fossil fuels for electricity production.
4.1.2 Additionality
The project activity is expected to result in GHG emission reduction, which is additional to any that would occur in the absence of the certified project activity, i.e. it should not be included in the baseline. The additionality should be shown by following the additionality part of the methodologies approved by the EB.

36
Most of the approved methodologies use the Additionality Tool approved by the EB.
The additionality tool (see figure 3) provides for a step-wise approach to demonstrate and assess additionality. These Steps include:
• Identification of alternatives to the project activity; • Investment analysis to determine that the proposed project activity
is either: 1) not the most economically or financially attractive, or 2) not economically or financially feasible; • Barriers analysis; and • Common practice analysis.
If a project shows that the project is not additional according to the invest-ment analysis the barrier analysis can be used also.
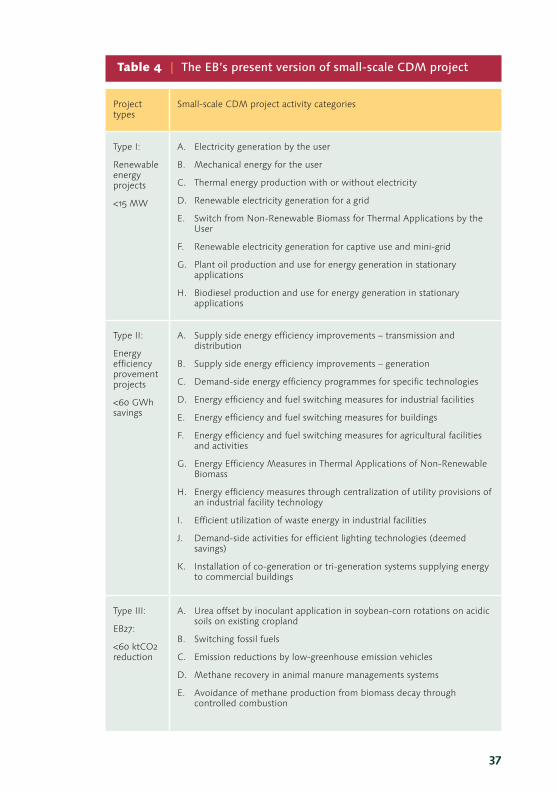
4.1.3 Small-Scale CDM projects categories
According to modalities and procedures for the CDM, three types of small-scale CDM projects are possible. For the first two, there is a maximum size of the activity that reduces emissions, but for the third type, there is a maximum on the total emission from the project at the end of the project activity. The three types of small-scale CDM projects are:
I) Renewable energy project activities with a maximum output capac-ity equivalent of up to 15 MW (or an appropriate equivalent);
II) Energy efficiency improvement project activities which reduce en-ergy consumption, on the supply and/or demand side, by up to the equivalent of 60 GWh per year; or
III) Other project activities limited to those that result in emission reductions of less than or equal to 60 thousand tones (kt) CO2 equivalent annually.
Table 4 shows a list of eligible small-scale CDM projects.
Unlike the proposal for full-scale CDM projects, the proposal for a new project activity category should be submitted directly to the EB without going through a DOE.
37
Project types
Small-scale CDM project activity categories
Type I:
Renewable energy projects
<15 MW
A. Electricity generation by the user
B. Mechanical energy for the user
C. Thermal energy production with or without electricity
D. Renewable electricity generation for a grid
E. Switch from Non-Renewable Biomass for Thermal Applications by the User
F. Renewable electricity generation for captive use and mini-grid
G. Plant oil production and use for energy generation in stationary applications
H. Biodiesel production and use for energy generation in stationary applications
Type II:
Energy efficiency provement projects
<60 GWh savings
A. Supply side energy efficiency improvements – transmission and distribution
B. Supply side energy efficiency improvements – generation
C. Demand-side energy efficiency programmes for specific technologies
D. Energy efficiency and fuel switching measures for industrial facilities
E. Energy efficiency and fuel switching measures for buildings
F. Energy efficiency and fuel switching measures for agricultural facilities and activities
G. Energy Efficiency Measures in Thermal Applications of Non-Renewable Biomass
H. Energy efficiency measures through centralization of utility provisions of an industrial facility technology
I. Efficient utilization of waste energy in industrial facilities
J. Demand-side activities for efficient lighting technologies (deemed savings)
K. Installation of co-generation or tri-generation systems supplying energy to commercial buildings
Type III:
EB27:
<60 ktCO2 reduction
A. Urea offset by inoculant application in soybean-corn rotations on acidic soils on existing cropland
B. Switching fossil fuels
C. Emission reductions by low-greenhouse emission vehicles
D. Methane recovery in animal manure managements systems
E. Avoidance of methane production from biomass decay through controlled combustion
Table 4 | The EB’s present version of small-scale CDM project

38
Type III:
Continued
AI. Emission reductions through recovery of spent sulphuric acid
AJ. Recovery and recycling of materials from solid wastes
AK. Biodiesel production and use for transport applications
AL. Conversion from single cycle to combined cycle power generation
AM. Fuel switch in a cogeneration/trigeneration system
AN. Fossil fuel switch in existing manufacturing industries
AO. Methane recovery through controlled anaerobic digestion
AP. Transport energy efficiency activities using post-fit Idling Stop device
AQ. Introduction of Bio-CNG in transportation applications
AR. Substituting fossil fuel based lighting with LED lighting systems
Project types
Small-scale Afforestation/reforestation CDM project activity categories <16 ktCO2 absoption
AR-AMS1 Afforestation and reforestation project activities under the clean development mechanism implemented on grasslands or croplands
AR-AMS2 Afforestation and reforestation project activities under the CDM implemented on settlements
AR-AMS3 Afforestation and reforestation project activities implemented on wetlands
AR-AMS4 Agroforestry – afforestation and reforestation on crop lands
AR-AMS5 Afforestation and reforestation project activities under the clean development mechanism on lands having low inherent potential to support living biomass
AR-AMS6 Silvopastoral afforestation and reforestation activities
AR-AMS7 Simplified baseline and monitoring methodology for small-scale A/R project activities on grasslands or croplands

39
If a new project belongs to none of the existing categories of small-scale projects, the project developer should propose a new category to the EB before submitting a project PDD. The proposal must include a description of how a simplified baseline and monitoring methodology would be ap-plied to the new category. Once the EB accepts a proposed new category, the EB will amend Table 4 and its appendix to the small-scale modalities and procedures to include the new category. The project developer may then submit the project PDD in this new category to the EB for consideration.
Another general condition for small-scale CDM projects is related to the combination of renewable and non-renewable components within the boundary of one project. If the project adds a unit that has both renewable and non-renewable components, the eligibility limit of 15 MW applies only to the renewable component.
4.1.4 Easy additionality for extra small projects (see EB54 Annex 15)
If a CDM projects employing Type I renewable energy <5 MW or aim to achieve energy savings <20 GWh with Type II technologies then the projects are additional if it is located in LDCs/SIDs or In a special underde-veloped zone of the host country identified by the Government before 28 May 2010.
In addition renewable energy projects <5MW are additional if one of the following conditions are satisfied:
1. The project activity is an off grid activity supplying energy to house-holds/communities (less than 12 hrs grid availability per 24 hrs day is also considered as off grid. for this assessment);
2. The project activity is for distributed energy generation with both conditions (i) and (ii) satisfied (see below);
(i) Each of the independent subsystem/measure in the project activity is smaller than or equal to 750 kW electrical installed capacity;
(ii) End users of the subsystem or measure are households/communities/SMEs.

40
3. The project activity employs specific renewable energy techno-logies/measures recommended by the host country DNA and ap-proved by the Board to be additional in the host country (conditions apply: The total installed capacity of technology/measure contributes less than or equal to 5% to national annual electricity generation).
In addition energy saving projects <20GWh are additional if the project activity is an energy efficiency activity with both conditions (i) and (ii) satis-fied (see below);
(i) Each of the independent subsystem/measure in the project activity achieves an estimated annual energy savings of equal to smaller than 600 megawatt hours; and
(ii) End users of the subsystem or measure are households/ communities/SME.
In the “Further guidance relating to the clean development mechanism” from CMP6 in Cancun the EB is requested to expand the additionality free area to include small-scale type III project that reduce emissions by <20ktCO2.
4.1.5 Bundling and debundling
Bundling will reduce the transaction cost because a large number of small projects can be combined in one PDD. Projects may be bundled as long as the total size is below the limits for a single project as listed for the three small scale project types above.
Debundling a large CDM project into consecutive small-scale parts is not eligible for a small-scale CDM project if the total is greater than the small-scale project eligibility. The EB has elaborated a procedure as an annex to the modalities and procedures for small-scale CDM, which shall be applied to a small-scale project to assess whether it is a debundled portion of a larger project. The procedure is defined as follows:
A proposed small-scale project activity shall be deemed to be a debund-led component of a large project activity if there is a registered small-scale CDM project activity or an application to register another small-scale CDM project activity:

41
• with the same project participants;• in the same project category and technology/measure; and• registered within the previous 2 years; and• whose project boundary is within 1 km of the project boundary of
the proposed small-scale activity at the closest point.
4.1.6 Sink projects
Only afforestation and reforestation (A&R) projects are eligible and the maximum use of CERs from A&R projects should be less than 1% of the 1990 emissions of the Party. Other sinks like avoided deforestation, reveg-etation, forest management, cropland management and grazing land man-agement are not allowed under the CDM but only as Joint Implementation projects in Annex-I countries.
The A&R terms are defined in the following way:
Afforestation is the direct human-induced conversion of land that has not been forested for a period of at least 50 years into forested land through planting/seeding.
Reforestation is in the first commitment period (2008-2012) limited to lands that did not contain forest on 31 December 1989. Therefore the majority of the A&R CDM projects chooses reforestation.
There are some restrictions on the definition of a forest. The DNA in the CDM host country should make an assessment and report the value in each of the following three categories, which will be used for all projects in the first commitment period in the country:
• A minimum tree cover of 10-30%• A minimum forest area of 0.05 – 1.00 ha• A minimum tree height of 2-5 metres
For small-scale A&R CDM projects there is the following rules:
• The greenhouse gas removal must be of less than 60 ktCO2/year.• The projects must be developed by low-income communities and
individuals as determined by the host Party.

42
The M&P also contains the following important rules:
Since the benefits from sink projects accrue over longer periods of time than benefits from other CDM projects the crediting period will be longer than for normal CDM projects. The crediting period begins at the start of the afforestation or reforestation project activity. Just like normal CDM projects, there are two options for the crediting period:
• A maximum of 20 years which may be renewed two times, provided a DOE confirms that the baseline is still valid or has been properly updated taking into account of new data.
• A maximum of 30 years.
All carbon stored must be accounted. The following carbon pools are defined:
• Above-ground biomass• Dead wood• Litter• Below-ground biomass• Soil organic carbon
A carbon pool can be excluded from the emission accounting in the project if that does not increase the net GHG removal.
The procedure for establishing baseline and monitoring methodologies is the same as that for normal full-scale CDM projects. There is no methodol-ogy at the beginning. Methodologies will be approved by the EB as project participants submit them for approval. The project participants must base these new methodologies on one of the following three approaches:
1. Existing or historical changes in carbon stocks in the carbon pools within the project boundary.
2. Changes in carbon stocks in the carbon pools within the project boundary from land use that represent an economically attractive course of action, taking into account barriers of investment.
3. Changes in carbon stocks within the project boundary from the most likely land use at the time the project starts.
43
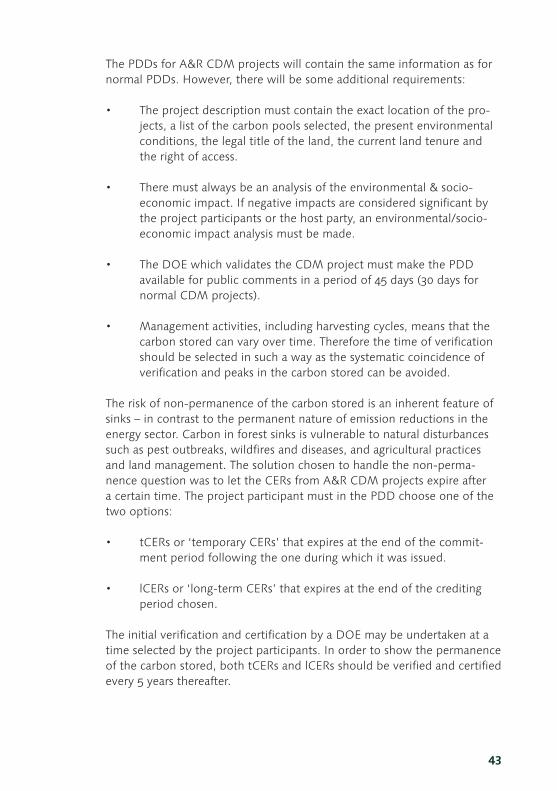
The PDDs for A&R CDM projects will contain the same information as for normal PDDs. However, there will be some additional requirements:
• The project description must contain the exact location of the pro-jects, a list of the carbon pools selected, the present environmental conditions, the legal title of the land, the current land tenure and the right of access.
• There must always be an analysis of the environmental & socio-economic impact. If negative impacts are considered significant by the project participants or the host party, an environmental/socio-economic impact analysis must be made.
• The DOE which validates the CDM project must make the PDD available for public comments in a period of 45 days (30 days for normal CDM projects).
• Management activities, including harvesting cycles, means that the carbon stored can vary over time. Therefore the time of verification should be selected in such a way as the systematic coincidence of verification and peaks in the carbon stored can be avoided.
The risk of non-permanence of the carbon stored is an inherent feature of sinks – in contrast to the permanent nature of emission reductions in the energy sector. Carbon in forest sinks is vulnerable to natural disturbances such as pest outbreaks, wildfires and diseases, and agricultural practices and land management. The solution chosen to handle the non-perma-nence question was to let the CERs from A&R CDM projects expire after a certain time. The project participant must in the PDD choose one of the two options:
• tCERs or ‘temporary CERs’ that expires at the end of the commit-ment period following the one during which it was issued.
• lCERs or ‘long-term CERs’ that expires at the end of the crediting period chosen.
The initial verification and certification by a DOE may be undertaken at a time selected by the project participants. In order to show the permanence of the carbon stored, both tCERs and lCERs should be verified and certified every 5 years thereafter.
44
Environmental NGOs had been very eager that large monoculture indus-trial plantations (including genetically modified trees) should be excluded because they threaten biological diversity, watershed protection, and local sustainable livelihoods. They urged parties to explicitly ask for multi-spe-cies cultures that increase or at least preserve biodiversity. However, the negotiation ended up with a text (the M&P) saying that it is up to the host country to evaluate the risks associated with the use of potentially invasive alien species and genetically modified organisms.
The COP had invited the Intergovernmental Panel on Climate Change (IPCC) to elaborate methods to estimate, measure, monitor and report changes in carbon stock and GHG emissions. This IPCC report called “Good Practice Guidance for LULUCF in the preparation of national greenhouse gas inventories under the Convention” was finally approved at COP9. The baseline and monitoring methodologies and the Project Design Document (PDD) should be consistent with this document.
4.2 National approval
One purpose of the CDM is to assist developing countries in achieving sustainable development. The developing country government is respon-sible for screening the projects and deciding whether a project meets that requirement. The host country should therefore develop national criteria and requirements to ensure a coherent, justifiable and transparent assess-ment. It is important that these criteria are in agreement with national development priorities11 .
All countries wishing to participate in the CDM must designate a National CDM Authority to evaluate and approve the projects, and serve as a point of contact. Although the international process has given the general guidelines on baselines and additionality, each developing country has the responsibility to determine the national criteria for project approval.
The national CDM Authority must issue the necessary statements that the project developers participate voluntarily in the project and must confirm that the project activity assists the host country in achieving sustainable development.
11 See chapter 3 for more details on sustainable development criteria.
45
4.2.1 Designated National Authority (DNA)
A host country must establish a Designated National Authority, which will have the responsibility to decide whether the project activity makes a contribution to achieving the country’s sustainable development goal and whether the country agrees to participate in the project.
One of the key elements for attracting CDM investments is the host country’s application of quick and transparent procedures for screening, evaluation and approving projects. To achieve this goal, the National CDM Authority should implement a standardized system for this activity. The key question is what the mandate of the DNA and its individual staffs should be?
The DNA must obtain an overview of the existing legal environment and establish an enabling regulatory framework for evaluation and approval of CDM projects. This includes:
i) development of national criteria and respective information require-ments to ensure a coherent, justifiable and transparent assessment of CDM projects in accordance with the CDM Executive Board’s decisions (additionality, sustainability);
ii) ensuring the compliance of CDM projects with relevant national policy and regulatory regimes;
iii) elaboration of guidelines and procedures for project approval.
One important factor in establishing a DNA is an institutional sustainability. This is dependent on the level of activity, revenue generated and hence ability to self-finance the institution and its legal status.
There is no single approach to developing DNA. A number of approaches are possible and they must take into account the needs and resources of each individual country. However, cross-sectoral coordination is indispen-sable since the very nature of CDM is multi-sectoral.
Five approaches to developing the DNA are briefly suggested: a single government department model, a two-unit model, an inter-departmental government model, FDI-piggyback model, outsourcing model:

46
Single government department modelOne department or ministry undertakes all the activities of the DNA. This would most likely be the environment department. The DNA is hence located within the climate change unit or directorate. Since CDM projects may involve different sectors and validation requires specific technical expertise, the department may invite technical experts from other gov-ernment agencies/ministries upon demand. This effectively means that the DNA acts as a secretariat. The experts can collaborate with the DNA secretary or focal point to evaluate/analyse and validate the project. The secretariat would thus be ultimately responsible for approval of the CDM projects.
The DNA secretariat may also be responsible for marketing and promotion of CDM. The DNA secretariat can design CDM promotion material and furnish it to the FDI office and other relevant stakeholders. However, con-flicts of interest are likely to arise if the DNA plays a role of CDM promo-tion office. To prevent the possibility of such conflicts of interest, the CDM promotion office may be established as a separate organization.
A two-unit modelIn some cases it could be appropriate to split the activities of the DNA into two parts: The first part could be located in the department responsible for climate change while the second part could be located elsewhere as an independent unit. This separation responds to the concern of avoid-ing possible conflicts of interest in the process of project formulation and approval.
Inter-departmental government modelThis entails establishing a structure which allows all relevant government departments to be integrated into the DNA as permanent members. The ministry of environment can act as the coordinator but all member depart-ments undertake approval of projects. A committee to operationalise this approval could be set up.
The coordinator acts as the registration office and thus receive project proposals on behalf of the DNA. The coordinator then communicates with other DNA members. The coordinator also communicate with the EB but upon agreement within the DNA.
47
FDI-piggyback modelMost countries have a Foreign Direct Investment (FDI) institutional frame-work, which promotes foreign investment. Typically this comprises a pro-motion office and an approval or implementation office. These institutions receive projects from foreign investors and evaluate and approve projects using pre-structured criteria which largely reflect the national development priorities and interests.
The FDI framework could thus be adapted for the CDM and be used as the DNA. The investment office would thus receive and approve projects. Typi-cally the investment office receives projects from various areas and hence has an established system of handling these. However, given the special nature of the CDM, involving GHG emission reductions, relevant technical experts could be sourced by the investment office when a CDM project is submitted in order to assist in validating the GHG emission reductions. In this case, the FDI office would promote the CDM along with its other investment promotion activities.
Outsourcing modelHost countries may choose to outsource the bulk of DNA services from a private agency. This agency can evaluate the projects and validate them. The agency would report to a government agency which plays the role of DNA and then the government would forward the project approval letter to the DOE.
4.3 Validation/Registration
4.3.1 Validation
A designated operational entity (DOE), chosen by the project participants, will then review the project design document, invite feedbacks from NGOs and local communities, and decide whether or not it should be validated. These operational entities will typically be private companies such as audit-ing and accounting firms, consulting companies and law firms capable of conducting credible and independent assessments of emission reductions. If validated, the operational entity will forward it to the Executive Board for formal registration.
The DOEs accredited by the EB will be listed on the UNFCCC CDM web-site. On this website there is also a separate list of the new applicant enti-
48
ties (AEs) which are under accreditation process, including a list of scopes (see below) for which they have applied.
Some of these new applicant entities can be used to forward proposals for new baseline and monitoring methodologies to the EB. A list of these AEs is also available at the UNFCCC CDM website and in the UNEP Risoe CDMPipeline12 . An applicant entity may submit a new methodology to the EB only if the following conditions are met:
• A CDM Assessment Team (CDM-AT), which will carry out the inves-tigations of whether the AE has the necessary qualifications to be-come a DOE, has been assigned to the AE by the CDM-Assessment Panel (CDM-AP) under the EB, and
• The AE maintains documentary evidence (e.g. a procedural report) for each new methodology submitted to the EB.
The DOEs can be accredited for 15 sectoral scopes. The project participants should therefore check under which of the scopes their project fits, and choose for validation a DOE that is accredited for that scope. The defini-tion of the scopes in Table 5 is based on the list of sectors/sources in An-nex A of the Kyoto Protocol. Some sectors are missing from the table, but the DOEs can propose new sectoral scopes.
The DOE selected shall review the PDD and any supporting documenta-tion to confirm if:
a) Parties in the project have ratified the Kyoto Protocol
b) The PDD has been publicly available, comments have been invited from local stakeholders for a period of 30 days, a summary of the comments provided with a report on how due account was taken of any comments (Annex E of the PDD, see Table 3).
c) Project participants have submitted to the DOE the analysis of the environmental impact of the project and, if the impacts are consid-ered significant, have undertaken an environmental impact assess-ment following the procedures of the host Party.
12 http://CDM.unfccc.int and also at www.cdmpipeline.org

49
More detailed explanation of each chapter of PDD will be given in the next chapter.
1 Energy industries (renewable – / non-renewable sources)
2 Energy distribution
3 Energy demand
4 Manufacturing industries
5 Chemical industry
6 Construction
7 Transport
8 Mining/Mineral production
9 Metal production
10 Fugitive emissions from fuels (solid, oil and gas)
11 Fugitive emissions from production and consumption of halocarbons and sulphur hexafluoride
12 Solvents use
13 Waste handling and disposal
14 Afforestation and reforestation
15 Agriculture
Table 5 | Sectoral scopes for which AEs can be accredited18

50
d) The project activity is expected to result in a GHG emission reduc-tion which is additional.
e) The baseline and monitoring methodologies are among those al-ready approved by the EB, or a new methodology that has followed the Modalities and Procedures for establishing a new methodology.
Six months subsequent to the end of the period for submitting public comments for each proposed CDM project activity the DOE shall provide an update of the status of its validation activity, unless the project activity has been submitted for registration. This update shall indicate one of the following statuses:
(a) The validation contract has been terminated – in which case a reason for this termination shall be provided to the Executive Board and UN-FCCC secretariat on a confidential basis;
(b) A negative validation opinion has been issued;
(c) The DOE has raised one or more corrective action requests or clarifica-tion requests for which no response has been received – in which case the DOE shall provide a summary of the issues raised and update or reconfirm the status of its validation activities on three monthly inter-vals thereafter;
(d) The DOE has finalized a positive validation opinion with the excep-tion of the receipt of a valid letter of approval from one or more Party/ies involved – in which case the DOE shall indicate which Party/ies involved;
(e) Validation activities are ongoing and no corrective action or clarifica-tion requests have yet been sent to the project participants; in which case the DOE shall provide an explanation length of time taken and update or reconfirm the status of its validation activities on three monthly intervals thereafter. Under “further status of validation” under “validation” at the UNFCCC CDM web-site the reported state of vali-dation is visible.

51
Procedure for new baseline methodologies:
The proposed new methodology must be forwarded to the EB with the draft PDD. The DOE shall check whether documents are complete and forward, without further analysis, this new methodology to the EB for its review and approval.
Procedure for existing baseline methodologies:
The DOE must make the validation report publicly available upon transmis-sion to the EB.
Prior to the submission of the validation report to the Executive Board, the DOE must have received from the Designated National Authority 1) a writ-ten approval of voluntary participation in the project and 2) confirmation that the project activity assists it in achieving sustainable development.
Procedure for new small-scale CDM categories:
As mentioned in section 3, small-scale CDM project participants can propose additional small-scale project categories directly to the EB without using a DOE.
How much will it cost to get a project through the CDM project cycle?
Table 6 shows that a minimum estimate of the transaction cost for valida-tion & certification of a CDM project is about US$53,000 and simplified procedures for small-scale CDM could reduce this to US$44,000.
At COP15 in Copenhagen it was decided that the EB allocate financial resources from the interest accrued on the principal of the Trust Fund for the Clean Development Mechanism, as well as any voluntary contributions from donors, in order to provide loans to support the following activities in countries with fewer than 10 registered clean development mechanism project activities:
(i) To cover the costs of the development of project design documents;
(ii) To cover the costs of validation and the first verification for these project activities.
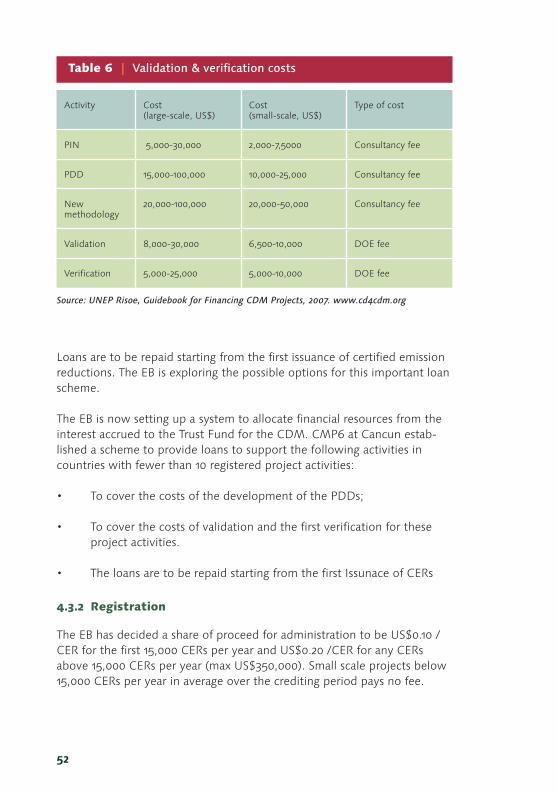
52
Loans are to be repaid starting from the first issuance of certified emission reductions. The EB is exploring the possible options for this important loan scheme.
The EB is now setting up a system to allocate financial resources from the interest accrued to the Trust Fund for the CDM. CMP6 at Cancun estab-lished a scheme to provide loans to support the following activities in countries with fewer than 10 registered project activities:
• To cover the costs of the development of the PDDs;
• To cover the costs of validation and the first verification for these project activities.
• The loans are to be repaid starting from the first Issunace of CERs
4.3.2 Registration
The EB has decided a share of proceed for administration to be US$0.10 /CER for the first 15,000 CERs per year and US$0.20 /CER for any CERs above 15,000 CERs per year (max US$350,000). Small scale projects below 15,000 CERs per year in average over the crediting period pays no fee.
Activity Cost (large-scale, US$)
Cost (small-scale, US$)
Type of cost
PIN 5,000-30,000 2,000-7,5000 Consultancy fee
PDD 15,000-100,000 10,000-25,000 Consultancy fee
New methodology
20,000-100,000 20,000-50,000 Consultancy fee
Validation 8,000-30,000 6,500-10,000 DOE fee
Verification 5,000-25,000 5,000-10,000 DOE fee
Table 6 | Validation & verification costs
Source: UNEP Risoe, Guidebook for Financing CDM Projects, 2007. www.cd4cdm.org
53
No share of proceed has to be paid for CDM project activities hosted in least developed countries. In other countries with fewer than 10 registered CDM project activities no registration fee must be paid until after the date of the first issuance of certified emission reductions.
At registration a registration fee must be paid which is equal to the expect-ed share of proceed calculated from the expected emission reduction in the PDD for the first crediting period. This administration fee for examining the CDM projects for registration will be paid up-front but the fee will be deducted from the share of proceeds at the issuance of CERs.
Until the 54th meeting of the EB the rule was the CDM project was auto-matically registered within 8 weeks (4 weeks for small-scale CDM projects) of the date of receipt of the request. After the 54th EB meeting it is 4 weeks for both types of projects. If a request for a review has been made by a Party involved in the project activity or at least three members of the EB, the registration can be delayed until the next EB meeting for a review. At this meeting a request for correction can be made or a review starting delaying the registration further. The average time for all registered projects from the start comment date at validation until registration is about 1.5 years.13
4.4 Project financing14
With the validation and registration of the project, project developers will take actions to implement the project which will generate an emission reduction credit as well as other conventional benefits to create financial income. Project financing is a common and crucial part of project imple-mentation in every project. There are multilateral and bilateral sources of funding to develop CDM projects. This project financing also involves risks from different sources and requires project developers to properly man-age any potential risks15 , including project risks, political risks, and market risks. Project risks include whether the project meets all the requirements of the CDM and whether the project will generate the emission reduction credits estimated in the PDD. Political risks include the entry into force of the Kyoto Protocol and ratification of the Protocol by participating govern-ments. Market risks include the price of CERs and transaction costs.
13 See www.cdmpipeline.org 14 This section will be further explained in chapter 6. 15 The list of risks in this section will not be exhaustive
54
Public funding for CDM projects from Parties in Annex I is not to result in the diversion of official development assistance (ODA) and is to be separate from and not counted towards the financial obligations of Parties included in Annex I (Decision 17/CP.7, the Marrakech Accords).
4.5 Monitoring
The carbon component of a mitigation project cannot acquire value in the international carbon market unless submitted to a verification process de-signed specifically to measure and audit the carbon component. Therefore, once the project is operational, participants prepare a monitoring report, including an estimate of CERs generated and submit it for verification to an operational entity.
Monitoring is a systematic surveillance of a project’s performance by measuring and recording target indicators relevant to the objective of the project. The project’s developers should prepare a monitoring plan which is transparent, reliable and relevant. Therefore, the monitoring plan needs to provide detailed information related to the collection and archiving of all relevant data necessary to
– estimate GHG emissions occurring within the project boundary;– determine the baseline GHG emissions;– determine the leakage.
As an example, the following information should be monitored:
• Fuel consumption• Activity levels• Emission factors• Heat produced and replaced• Electricity produced and replaced• Grid losses • Fuel prices/subsidies/taxes
If the project is a demand-side energy efficiency project consisting of many devices, it is costly to monitor all of them. For small-scale projects it is therefore suggested that it is enough to monitor an appropriate sample of the devices installed. For technologies with fixed loads while operat-ing, such as lamps, the sample can be small while for technologies that involve variable loads, such as air conditioners, the sample may need to

55
be relatively large. In either case, monitoring should include annual checks of a sample of non-metered devices to insure that they are still operat-ing. Monitoring should consist of monitoring the “power” and “operating hours” or the “energy use” of the device installed using an appropriate methodology.
The Marrakech Accords shows necessary information which a monitoring plan should provide as follows:
• The collection and archiving of all relevant data necessary for estimating or measuring anthropogenic emissions by sources of greenhouse gases occurring within the project boundary during the crediting period;
• The collection and archiving of all relevant data necessary for determining the baseline of anthropogenic emissions by sources of greenhouse gases within the project boundary during the crediting period;
• The identification of all potential sources of, and the collection and archiving of data on, increased anthropogenic emissions by sources of greenhouse gases outside the project boundary that are signifi-cant and reasonably attributable to the project activity during the crediting period;
• The collection and archiving of information relevant to assess the environmental impacts of the project, including trans-boundary impacts;
• Quality assurance and control procedures for the monitoring process;
• Procedures for the periodic calculation of the reduction of anthro-pogenic emissions by sources by the proposed CDM project activity, and for leakage effects;
• Documentation of all steps involved in the calculations of leakage and the procedures for the periodic calculation of the emission reductions during the lifetime of the project.
56
Monitoring shall be planned and implemented by project participants. Each approved CDM methodology contains a monitoring methodology that must be followed.
4.6 Verification/Certification
Verification is the periodic independent review and ex post determina-tion by the DOE of the monitored reductions in anthropogenic emissions by sources of GHGs that have occurred as a result of a registered CDM projects activity during the verification period. It will include the periodic auditing of monitoring results, the assessment of achieved emission reduc-tions and the assessment of the project’s continued conformance with monitoring plan. The operational entity must make sure that the CERs have resulted according to the guidelines and conditions agreed upon in the initial validation of the project. Following a detailed review, an operational entity will produce a verification report and then certify the amount of CERs generated by the CDM project.
The project participants decide how often they want to make a verification of their project. Projects with a high annual production of CERs do it often, since the verification cost is low compared to the issuance. Smaller project do it less often.
According to paragraph 27 (c) of the Modalities and Procedures, an Op-erational Entity cannot normally perform the verification/certification of a CDM project if it has validated the same project. This is only possible for Small-Scale CDM projects and for single projects where the EB gives permission.
Certification is a written assurance by the DOE that, during a specified time period, a project activity achieved the reductions in anthropogenic emissions by sources of GHGs as verified. The DOE shall inform the project participants, Parties involved and the EB of its certification decision in writ-ing immediately upon completion of the certification process and make the certification report publicly available. The certification report shall consti-tute a request to the EB for issuance of CERs equal to the verified amount of reductions of anthropogenic emissions of GHGs. Unless a project par-

57
ticipant or three Executive Board members request a review within 15 days, the Executive Board will instruct the CDM registry to issue the CERs.
4.7 Issuance of CERs
The EB must issue the CERs to the project partners within 15 days after the date of receipt of the request for issuance. As early as possible in the project design negotiations, contracts on carbon credit ownership must be made between the project participants. The rights and obligations of each participant should be clear. These rights could include the option to sell CERs to third parties. The contract should also specify the insurance coverage on the project and it should stipulate the rules for resolution of disputes between the parties.
In addition two percent of the CERs issued must be paid to assist in meet-ing the costs of adaptation. The least developed countries are exempted from this fee.
The CDM Registry being developed by the UNFCCC Secretariat will keep track of all issuances of CERs. When the EB has issued the CERs they are placed in a pending account in the CDM Registry. From here the CERs will move to the Party’s legal entity’s account according to a split specified in the request from project participant.
According to paragraph 27 (c) of the Modalities and Procedures, an Opera-tional Entity cannot normally perform the verification/certification of a CDM project if it has validated the same project. This is only possible for Small-Scale CDM projects and for single projects where the EB gives permission.
Certification is a written assurance by the DOE that, during a specified time period, a project activity achieved the reductions in anthropogenic emis-sions by sources of GHGs as verified. The DOE shall inform the project participants, Parties involved and the EB of its certification deci-sion in writing immediately upon completion of the certification process and make the certification report publicly available. The certification report shall constitute a request to the EB for issuance of CERs equal to the veri-fied amount of reductions of anthropogenic emissions of GHGs. Unless a project participant or three Executive Board members request a review

58
within 15 days, the Executive Board will instruct the CDM registry to issue the CERs.
4.7 Issuance of CERs
The EB must issue the CERs to the project partners within 15 days after the date of receipt of the request for issuance. As early as possible in the project design negotiations, contracts on carbon credit ownership must be made between the project participants. The rights and obligations of each partici-pant should be clear. These rights could include the option to sell CERs to third parties. The contract should also specify the insurance coverage on the project and it should stipulate the rules for resolution of disputes be-tween the parties.
In addition two percent of the CERs issued must be paid to assist in meet-ing the costs of adaptation. The least developed countries are exempted from this fee.
The CDM Registry being developed by the UNFCCC Secretariat will keep track of all issuances of CERs. When the EB has issued the CERs they are placed in a pending account in the CDM Registry. From here the CERs will move to the Party’s legal entity’s account according to a split specified in the request from project participant.

59
5
The Project Design Document (PDD)
In this chapter, we will describe each chapter of the present version of the PDD and provide information on how to fill it out (see Table 3). Footnote 10 shows the URL address of the PDD for normal CDM project activities and the PDD for small-scale CDM project activities. As the process evolves, the PDD will be changed. The CDM PDD Guidebook: Navigating the Pitfalls (2nd edition) gives an overview of the common mistakes and pitfalls the CDM project proponents fall into when preparing a PDD, during im-plementation and when reporting emission reductions.16
5.1 General description of project activity
This section of the PDDs (section A) should include the following information:
• Project title
• Short description of the project activity – the purpose of the project activity – the view of the project participants of the project activity’s contri-
bution to sustainable development (max. one page)
• List of Party(ies) and private and/or public entities involved in the project activity.
• Information allowing a unique identification of the project activity, including the location.
16 This guidebook can be downloaded from the publication section on www.cd4cdm.org
60
• Specification of project activity category(ies) using the list on the UNFCC CDM website.
• Description of transfer of environmentally safe and sound technol-ogy in the project.
• Brief explanation of how GHG emission is reduced.
• Information of public funding and affirmation that it does not result in a diversion of official development assistance.
• Confirmation that the project activity is not a debundled component of a larger project activity (only for the small-scale PDD).
5.2 Baseline methodology
This section of the PDDs (section B) should include the following information:
• Title and reference to the UNFCCC CDM website for the project category (for small-scale CDM) or methodology (for normal CDM) applicable to the project activity.
• Justification of the choice of methodology.
• Explanation of how and why the project is additional and therefore not the baseline scenario.
• Description of the project boundary.
• Details of the baseline and its development.
The EB has chosen a bottom-up approach for the definition of the base-lines and the monitoring methodologies – each new baseline methodology must be approved. Only a few small-scale baseline methodologies were available in the database on the UNFCCC CDM website at the beginning. It is built up by experience over time. When the EB receives a proposal for a new baseline methodology, it is forwarded to the Methodology Panel, who will (within 7 days) send it to 2 experts (from a roster of experts maintained by the EB) who will make a desk review (within 10 days) of the

61
methodology and report back to the Methodology Panel. This panel will then advise the EB as to whether this new methodology is acceptable. This procedure for the review of a new methodology shall be done expedi-tiously, if possible at the next meeting of the EB (for normal CDM not later than four months).
The basis for developing baselines for the normal CDM is described in Article 48 of the Modalities and Procedures for CDM of the Marrakech Ac-cords where 3 approaches are described. The acceptable baseline must be based on one of the following approaches:
“In choosing a baseline methodology for a project activity, project partici-pants shall select from among the following approaches the one deemed most appropriate for the project activity, taking into account any guidance by the executive board, and justify the appropriateness of their choice:
(a) Existing actual or historical emissions, as applicable; or
(b) Emissions from a technology that represents an economically attrac-tive course of action, taking into account barriers to investment; or
(c) The average emissions of similar project activities undertaken in the previous five years, in similar social, economic, environmental and technological circumstances, and whose performance is among the top 20% of their category.”
Paragraph 47 in the modalities and procedures for the CDM says, “the baseline shall be defined in a way that CERs cannot be earned for decreas-es in activity levels outside the project activity or due to force majeure”.
An output or product linked definition of baseline values (CO2-eq./unit of output) is recommended in all circumstances, unless the project par-ticipants can demonstrate why this is not applicable. If a project activity increases the output or the lifetime, a different baseline should be applied to this part.
As mentioned in section 3, small-scale CDM project participants can propose additional small-scale project categories directly to the EB without using a DOE .They are defined in Appendix B of “Simplified Modalities and Procedures for the small-scale CDM”: “Indicative simplified baseline and

62
Table 7 | Tools used in Approved CDM Methodologiest
Type Tools used in methodologies
Additionality Tool for the demonstration and assessment of additionality.
Additionality Combined tool to identify the baseline scenario and demonstrate additionality.
CO2 from fossil fuels Tool to calculate project or leakage CO2 emissions from fossil fuel combustion.
CH4 from waste Tool to determine methane emissions avoided from disposal of waste at a solid waste disposal site.
GHG from el. consumption
Tool to calculate baseline, project and or leakage emissions from electricity consumption.
CH4 from flaring Tool to determine project emissions from flaring gases containing methane.
GHG from el. system Tool to calculate the emission factor for an electricity system.
Flow of GHGs Tool to determine the mass flow of a greenhouse gas in a gaseous stream.
Efficiency of system Tool to determine the baseline efficiency of thermal or electric energy generation systems.
Equipment lifetime Tool to determine the remaining lifetime equipment.

63
monitoring methodologies for selected small-scale CDM project activity categories” and are described in the section below. A total list of the Ap-proved Small scale Methodologies (AMS) was shown in table 4.
If a number of methodologies have been approved for the same project type the EB often combine these methodologies in an Approved Consoli-dated Methodology (ACM).
Project developers have submitted 338 new full-scale methodologies (NM’s) to the Executive Board. Now the number of active approved meth-odologies are 167:
• 73 large-scale approved methodologies exist (AM’s)• 17 large-scale consolidated methodologies exist (ACM’s)• 59 small-scale approved methodologies exist (AMS’s)• 9 large-scale afforestation methodologies exist (AR-AM)• 2 large-scale consolidated methodologies exist (AR-ACM)• 7 small-scale afforestation methodologies exist (AR-AMS)
At www.cdmpipeline.org you can see a list of all new proposed method-ologies (NM’s) and all approved methodologies sorted after the project subtypes they cover.
The Executive Board has developed a series of tools that can make It easier to construct a new methodology. The existing tools are often used already in existing approved methodologies (see table 7)
5.3 Approved small-scale methodologies
A total list of the Approved Small scale Methodologies (AMS) was shown in table 4. For all small-scale projects it is suggested that the leakage calculation is not required, except if the project employs used equipment transferred from another site. In this subsection you will as examples find a short description of some of the approved small scale methodologies.
I. renewable energy projects
AMS-I.A. Electricity generation by the userIn this category it is assumed that the electricity generation is a stand-alone application, not connected to a distribution grid or a fossil fueled minigrid.

64
The energy baseline is the electricity consumption of the technology in use or what would have been used in the absence of the project activity. This may be
1) an estimate of the average annual individual consumption (in kWh) observed in closest grid electricity systems among rural grid-con-nected consumers belonging to the same category
or
2) the estimated annual output of the installed renewable energy tech-nology
The emission baseline is the energy baseline described above multiplied by 0.8kgCO2 /kWh (default value).
AMS-I.B. Mechanical energy for the userThis category comprises renewable energy generation units that sup-ply individual households or users or groups of households or users with mechanical energy who otherwise would have been supplied with fossil fuel based energy. These units include technologies such as hydropower, wind power, and other technologies that provide mechanical energy, all of which is used onsite by the individual household(s) or user(s), such as windpowered pumps, solar water pumps, water mills and wind mills.
The baseline is the estimated emissions due to serving the same load with a diesel generator i.e. fuel consumption saved times the emission coeffi-cient for diesel. The diesel displaced is calculated as:
1) the power requirement x hours of operation/year x diesel emission factor from Table 8
or
2) diesel fuel consumption/hour x hours of operation x 3.2 kgCO2 /kg diesel
AMS-I.C. Thermal energy for the userThis category comprises renewable energy technologies that supply us-ers1 with thermal energy that displaces fossil fuel use. These units include technologies such as solar thermal water heaters and dryers, solar cook-

65
17 See the “tool to calculate the emission factor for an electricity systems under “approved methodologies” at CDM.unfccc.Int
ers, energy derived from renewable biomass and other technologies that provide thermal energy that displaces fossil fuel.
Biomass-based co-generating systems that produce heat and electricity are included in this category. For the purpose of this methodology cogenera-tion means the simultaneous generation of thermal energy and electrical and/or mechanical energy in one process.
If fossil-fuelled technologies are replaced:
The baseline = the fuel consumption of the technologies that would have been used in the absence of the project activity x an emission coefficient (IPCC value) for the fossil fuel displaced.
For renewable technologies replacing electricity:
The baseline = the electricity consumption x the relevant emission factor in Table 8.
AMS-I.D. Grid connected renewable electricity generationThis methodology can be used for renewable energy generation units, such as photovoltaic, hydro, tidal, wave, wind, geothermal and renewable biomass that supply electricity to a national or a regional grid. The baseline is the kWh produced by the renewable generating unit multiplied by an emission coefficient (measured in kg CO2 /kWh) calculated in a transparent and conservative manner as “combined margin” which is the average of the “operating margin” and the “build margin”17 , where:
The “operating margin” is the weighted average emission (in kg CO2/kWh) of all generating sources serving the system, excluding hydro, geothermal, wind, low-cost biomass, nuclear and solar generation. The “build margin” is the weighted average (in kg CO2/kWh) of recent capacity additions, defined as the most recent 20% of plants built or the 5 most recent plants, whichever is greater. If the build margin data is not available, the weighted average emission (in kg CO2/kWh) of the current generation mix will be used.
This category also covers landfill gas and other CH4 gases from waste that is used for electricity generation.

66
AMS-I.E. Grid Switch from non-renewable biomass for thermal applications by the userThis category comprises activities to displace the use of non-renewable biomass by introducing renewable energy technologies. Examples of these technologies include but are not limited to biogas stoves, solar cookers, and passive solar homes.
Project participant must show that non-renewable biomass has been used since 31 December 1989, using survey methods. It is assumed that in the absence of the project activity, the baseline scenario would be the use of fossil fuels for meeting similar thermal energy needs.
It is also possible to make CDM projects where the fuel wood is used more efficient using the approved methodology “AMS-II.G. Energy efficiency measures in thermal applications of non-renewable biomass”.
AMS-I.F. Renewable electricity generation from a fossil fueled mini-gridThis methodology can be used for a system where the project will displace electricity from an electricity distribution system that is or would have been supplied by at least one fossil fuel fired generation unit.
Mini grid
kg CO2/kWh
24 h
Service
4-6 h
Service
With
Storage
Load factors 25% 50% 100%
<15 kW 2,4 1,4 1,2
15-35 kW 1,9 1,3 1,1
35-135 kW 1,3 1,0 1,0
135-200 kW 0,9 0,8 0,8
>200 kW 0,8 0,8 0,8
Table 8 | Emission coefficients for small diesels
Source: UNEP Risoe, Guidebook for Financing CDM Projects, 2007. www.cd4cdm.org
67
For a mini-grid system where all generators use exclusively fuel oil and/or diesel fuel, the baseline is equal to the annual kWh generated by the re-newable unit times an emission coefficient for a modern diesel generating unit of the relevant capacity operating at optimal load as given in Table 8.
For other systems the baseline emissions are the product of the amount of electricity displaced by the renewable lectricity and an emission factor as per the weighted average emissions for the current generation mix follow-ing the procedure provided in AMS-I.D.
II. Energy efficiency improvement projects
AMS-II.A. Supply side energy efficiency improvements – transmission and distributionNew technologies or measures may be applied to existing systems or may be part of an expansion of the systems.
For a retrofit of an existing system, the energy baseline is the technical losses of energy calculated as either the measured performance of the existing equipment or using a performance standard.
For a new system the energy baseline is the technical losses of energy calculated using a performance standard for the equipment that would otherwise have been installed.
The emission baseline is the energy baseline multiplied by an emission coefficient as for category I.D. For district heating systems use an IPCC default emission factor for the fossil fuel used by the system.
AMS-II.B. Supply side energy efficiency improvements – generationThe technologies or measures may be applied to existing systems or be part of a new facility.
For a retrofit of an existing system, the energy baseline is calculated as the monitored performance of the existing generating unit.
For a new facility, the energy baseline is the technical losses calculated us-ing a performance standard for the equipment that would otherwise have been installed.

68
The emission baseline is the energy baseline multiplied by an IPCC default emission coefficient for the fuel used by the generating unit.
AMS-II.C. Demand-side energy efficiency programmes for specific technologiesThe technologies may replace existing equipment or be installed at new sites.
If the energy displaced is a fossil fuel, the energy baseline is the existing fuel consumption or the amount of fuel that would be used by the tech-nology that would have been implemented otherwise. Here the emission baseline is the energy baseline x an IPCC default emission factor.
If the energy displaced is electricity, the energy baseline is calculated as the number of devices x the power in W of the device x the average annual operating hours of the device/the technical loss in the grid. This energy baseline is multiplied by an emission coefficient as for category I.D.
AMS-II.D. Energy efficiency and fuel switching measures for industrial facilitiesThis category covers project activities aiming primarily at energy efficiency. A project activity that involves primarily fuel switching falls into category III.B.
The technologies may replace existing equipment or be installed at a new facility.
The baseline calculation is the same as that in II.C.
AMS-II.E. Energy efficiency and fuel switching measures for buildingsThis category covers project activities aimed primarily at energy efficiency. A project activity that involves primarily fuel switching falls into category AMS-III.B.
The baseline calculation is like for AMS-II.C.
III. Other project activities
AMS-II. A. AgricultureThe Executive Board considers that more work is needed before proposing simplified baselines for this category.

69
AMS-III.B. Switching fossil fuelsThis category comprises fossil fuel switching in existing industrial, residen-tial, commercial, institutional or electricity generation applications.
The emission baseline is the current emission of the facility.
AMS-III.C. Emission reductions by low GHG emission vehiclesThe energy baseline is the energy use per unit of service for the vehicle that would otherwise have been used x the average annual units of service per vehicle x the number of vehicles affected x the emission coefficient for the fuel used by the vehicle that would otherwise have been used.
If electricity is used by the vehicles, the associated emissions shall be esti-mated in the same way as in category ID.
AMS-III.G. Landfill methane recoveryThis category covers landfill gas and other gases containing CH4 from waste that is only captured and flared. If CH4 is used for electricity or heat production, use the same way as in category IC or ID.
The emission baseline is the amount of methane that would be emitted to the atmosphere during the crediting period in the absence of the project activity.
5.4 Duration of the project activity/crediting period
This section of both PDDs (section C) should include the following information:
• Duration of the project activity including the starting date and operational lifetime.
• Choice of the crediting period.
According to the ‘Modalities and Procedures for the CDM’, there are two possibilities for the crediting period:
• A period of maximum 10 years• A period of maximum 7 years, with the potential for renewal for two
additional periods at most.

70
Certified emission reductions (CERs) obtained during the period from the year 2000 up to the beginning of the first commitment period can be used to assist in achieving compliance in the first commitment period.
The crediting period starts after project registration. In the ‘CDM glos-sary24‘ written by the EB, the starting date of a project activity has been defined as follows: “The starting date of a CDM project activity is the date at which the implementation or construction or real action of a project activity begins.
In many cases project participants would prefer a longer crediting period to the 10 year option without a renewal. However, there is a risk that the original baseline is not valid after the 7-year period. In this case it should be revalidated by a Designated Operational Entity (DOE). For revalidation, only an updating of the data used in setting the baseline is needed, since the baseline methodology should not be changed.
Section 4.1.6 mentions that the crediting period of sink CDM projects is either 30 years or 3x20 years.
5.5 Monitoring methodology and plan
This section of both PDDs (section D) should include the following information:
• Name and reference to the UNFCCC website of the approved meth-odology applied to the project activity.
• Justification of the choice of the methodology and why it is applicable to the project activity.
• Tables to be filled with information on to data to be monitored• Name and contact information of person/entity determining the
monitoring methodology.
The project participants must include a monitoring plan in the PDD. A detailed description of this plan must be included in this section of the PDD, including an identification of the data and its quality with regard to accuracy, comparability, completeness and validity.
The monitoring plan must include a justification of the choice of the meth-odology and why it is applicable to the project activity. The methodologies approved by the EB can be found in the database on the UNFCCC CDM

71
website. A new monitoring methodology can be suggested to the EB in the same way as for baseline methodologies.
The Procedures and Modalities being formulated by the EB for small-scale CDM projects also includes simplified monitoring methodologies.
According to “Modalities and Procedures for the CDM”, a monitoring plan must provide for:
• Collection and archiving of data necessary for calculating emissions within the project boundary
• Collection and archiving of data necessary for determining the base-line, as applicable
• Collection and archiving of data necessary for calculating leakages, where this needs to be considered
• Quality assurance and control procedures
Figure 4 | Illustration of direct, indirect, on-site and off-site emissions from landfill gas power plant project
Direct
Power Plant Indirect off-site emissions
Indirect
Off - site
CH4
On - site (landfill site)
Indirect on-site emissions: Emissions to construct infrastructure
Direct off-site emissions: Emissions from the existing power plant
Direct on-site emissions: Emissions from the operation of the project

72
Monitoring data required for verification and issuance are to be kept for two years after the end of the crediting period or the last issuance of CERs for this project activity, whichever occurs later.
5.6 Calculation of GHG emission by sources
This section of the PDD (section B) should include the information about calculation of GHG emission reductions by sources.
A way to proceed could be first to make a list of the GHG emission sources associated with the project and make a distinction among:
• Direct on-site emissions• Direct off-site emissions• Indirect on-site emissions• Indirect off-site emissions (the site is where the project activity is taking place)
Fuel tCO2/TJ
Natural gas
LPG
Gasoline
Jet Petroleum
Kerosene
Crude oil
Diesel
Fuel oil
Orimulsion
Coal
Petroleum coke
Lignite
Peat
Coke
56,1
63,1
69,3
71,5
71,9
73,3
74,1
77,4
80,7
94,6
100,8
101,2
106,0
108,2
Table 9 | IPCC CO2 emission factors
73
Direct on-site emissions could be emissions from fuel combustion in the project.
Direct off-site emissions could be baseline emissions from heat/electric-ity which used to be delivered from the grid but which is going to be produced by the project. These old power plants are inside of the project boundary. Another example could be CH4 emissions reduction from land-fills due to a project where CH4 is collected and used/burned.
Indirect on-site emissions from energy consumption, for example for the construction of a hydropower dam, power intake, tunnels, roads, pipe-lines, can be excluded since they are small compared to the emissions from the plant and difficult to measure.
Indirect off-site emissions from the production of the raw materials must be outside of the boundary, since they are not directly influenced by the project activity.
The next step is to conclude which of these emissions are inside the pro-ject boundary. The project boundary can include both on-site and off-site emissions. The project boundary encompasses all anthropogenic emissions under control of the project participants. The general rule is that emissions should not be taken into account unless they are directly controlled or influenced by the project.
It is a good idea to draw a graph showing the main components of the project, the flow of energy and its boundary and outside connections. Indicate which components will be added, removed, or refurbished by the project.
Leakage is a measurable emission increase or decrease that is attributable to the project, but which is outside of the CDM project boundary or time-frame. Leakage calculations are required for small-scale CDM project activi-ties except if renewable energy technology or energy-efficiency equipment is transferred from another activity. This exception was introduced in order to avoid cases in which an investor gained CERs just by exchanging old equipment with some new equipment at another site.
Upstream emissions should be placed within the project boundary in cases where the project developer can significantly influence these emissions.
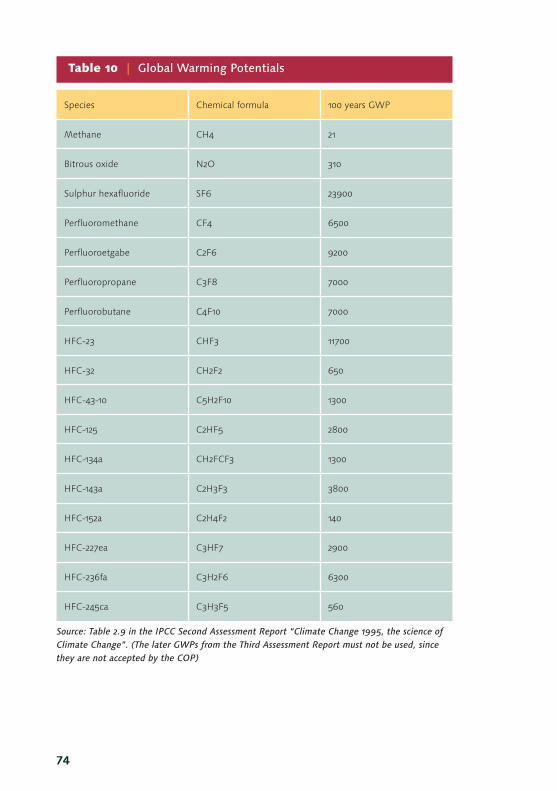
74
Species Chemical formula 100 years GWP
Methane CH4 21
Bitrous oxide N2O 310
Sulphur hexafluoride SF6 23900
Perfluoromethane CF4 6500
Perfluoroetgabe C2F6 9200
Perfluoropropane C3F8 7000
Perfluorobutane C4F10 7000
HFC-23 CHF3 11700
HFC-32 CH2F2 650
HFC-43-10 C5H2F10 1300
HFC-125 C2HF5 2800
HFC-134a CH2FCF3 1300
HFC-143a C2H3F3 3800
HFC-152a C2H4F2 140
HFC-227ea C3HF7 2900
HFC-236fa C3H2F6 6300
HFC-245ca C3H3F5 560
Source: Table 2.9 in the IPCC Second Assessment Report “Climate Change 1995, the science of Climate Change”. (The later GWPs from the Third Assessment Report must not be used, since they are not accepted by the COP)
Table 10 | Global Warming Potentials

75
This section of the PDD must be for each gas and source, including de-scriptions of the formulae used to calculate the emission within the project boundaries both for the project activity and the baseline. The formula used for leakage calculation must also be described. Finally a table must be included with the values of the size of the emissions using the formulae mentioned.
5.6.1 Emission factors
Unless better emission factors are available, the Revised 1996 IPCC Guide-lines for National GHG Inventories should be used to calculate emissions.
A CDM project needs to reduce the emissions of carbon dioxide or one of five GHGs in Table 10: CO2, methane (CH4), nitrous oxide (N2O), perfluor-ocarbons (PFCs), hydrofluorocarbons (HFCs) or sulphur hexafluoride (SF6).
The default IPCC CO2 emission factors for the most common fuels are shown in Table 9. In table I-I in the IPCC Guidelines mentioned above, these emission factors (plus some more rarely used fuels) are listed in the unit of tonnes of Carbon emitted per TJ fuel (t C/TJ). In order to convert them into t CO2 /TJ they are multiplied by 44/12 (the molecular weight of CO2 divided by the atomic weight of Carbon)
5.6.2 Global Warming Potentials
In the emission calculation all results must be converted into CO2–equiv-alents (CO2–eq.). This is done by multiplying the emissions by the Global Warming Potential (GWP) in Table 10. If, for example, the emissions were 10 tonnes of CH4, the CO2-equivalent is 210 tonnes CO2-eq., which is 10 multiplied by 21.
The GWPs are estimated by complex modelling of the chemical interac-tion in the atmosphere and will change over time as the knowledge about atmospheric chemistry improves. But new values must first be used after they have been published in an IPCC Assessment Report and a meeting of the Conference of the Parties (COP) under the UNFCCC has decided to use them.

76
5.7 Environmental impacts
The objective of any CDM project should be to provide environmental and social benefits as well as reduce GHG emissions. However, if the host country requires an Environmental Impact Assessment (EIA), or stakehold-er input shows that there are local environmental or social concerns about the initiative, a CDM project should be evaluated using the highest inter-national environmental and social assessment procedures and standards.
The conclusions from these assessments must be included in section F in the PDD and the assessments should be attached.
5.8 Stakeholder comments
The DOE doing the validation must make the project design document for the CDM project publicly available. NGOs and other stakeholders have a 30-day period to comment on the PDD and thereafter the DOE must describe how comments by stakeholders have been invited and compiled; a summary of the comments received; and a report on how due account was taken of any comments received.
These comments therefore form an official input as part of the prescribed validation and registration process, creating an unknown factor in the project development cycle that investors cannot ignore. In order to get a feeling of how the NGO community is mobilising in this area, it is recom-mended that readers view “CDM Watch”, created by a number of NGOs. Some stakeholders will have problems in making their comments. Often the PDDs will be posted on the Internet and stakeholders in rural projects often have no access to the Internet. Likewise there is no requirement that documents be made available in a language familiar to stakeholders.

77
5.9 Annex 1: Contact information on participants in the project activity
According to the CDM Glossary, project participants are Parties or private and/or public entities (authorized by a Party to participate) that take deci-sions on the allocation of CERs from the project activity under consideration.
5.10 Annex 2: Information regarding public funding
If public funding from Annex I Parties is involved, this annex should con-tain information on the sources of public funding for the project activity, including an affirmation that such funding does not result in a diversion of official development assistance and is separate from and is not counted towards the financial obligation of those Parties.
5.11 Annex 3: Baseline information and Annex 4: Monitoring information
Any further background information used in the application of the baseline and the monitoring methodology can be inserted here. Tables of key ele-ments used to determine the baseline (variables, parameters, data sources, etc.) and additional documentation of measuring equipment, procedures etc. can be presented here.

78

79
6
Financing CDM Projects
Most of the following text is taken from the UNEP Risoe “Guidebook to Financing CDM Projects”: http://cd4cdm.org/Publications/FinanceCDM-projectsGuidebook.pdf
A CDM project can be thought of as a conventional project with an ad-ditional CDM-specific component, producing both conventional project out-put and carbon benefits (CERs) respectively. The only substantial difference between CDM projects and conventional projects relates to the marginal costs of project development and additional revenues generated by creating and disbursing carbon credits.
Generally, a conventional project cycle consists of a planning phase; a construction phase and an operation phase while the CDM project will have to follow additional steps, all related to the carbon credits delivery and commercialization, known as the CDM project cycle. The figure below illustrates the difference between a conventional project and a CDM pro-ject.
The same broad types of finance are typically applicable to the three phases of a CDM project and a conventional project: grants, loans and equity18. The planning phase is very high risk and therefore only suitable for equity or grant funding. The risk associated with the construction phase is high to moderate, and remains so until technical and financial completion can be demonstrated, making this phase suitable for a combination of debt and equity. The costs associated with ongoing operation and maintenance are typically covered by the project’s revenues, and the risk associated with this phase is much lower.
18 In general there are three forms of finance that can be used to develop projects: grants, loans (debt) and equity. For detailed description of types of finance refer to the UNEP Risoe Guidebook to Financing CDM Projects, http://cd4cdm.org/Publications/FinanceCDMprojectsGuidebook.pdf

80
Though exposed to the same risks, A CDM component is considered an important source of financing, known nowadays as carbon finance. Among other possibilities, it may be possible to commercialise the CERs even before a PDD registration, as long as a buyer is willing to take on the as-sociated risks19 . Combining the Carbon and Project Finance may improve the visibility on the project’s cash flow generation while offering a higher return on investment to the Sponsor.
6.1 Financing requirements of CDM projects
The financing requirements of a CDM project depend on the project type. For example, the capital costs of renewable energy projects can vary from around US$1,000/MW for generation of electricity from landfill gas to US$8,000/kW for solar home systems using photovoltaic cells. In the “invest” sheet In the CDMPipeline from www.cdmpipeline.org you can see the size of the actual investment in all sub-types of CDMprojects.
Likewise, the costs during the planning of a CDM project can vary signifi-cantly depending on specific feasibility studies that may be required (e.g. at least 12 months of wind resource monitoring for a wind turbine project), as well as country-specific, technology-specific and location-specific re-quirements for permits and licenses, environmental impact assessment and stakeholder consultation. Finally, costs during operation can vary from very low levels for some renewable energy projects using free resources such as the sun and wind, to relatively high levels for projects dependent upon purchase of fuel or other inputs.
The diagram below illustrates a number of general points about the financ-ing requirements of a CDM project over the three project phases, and how these requirements are typically met.
19 Generally risks associate with passing the various hurdles of host country approval, validation and registration.
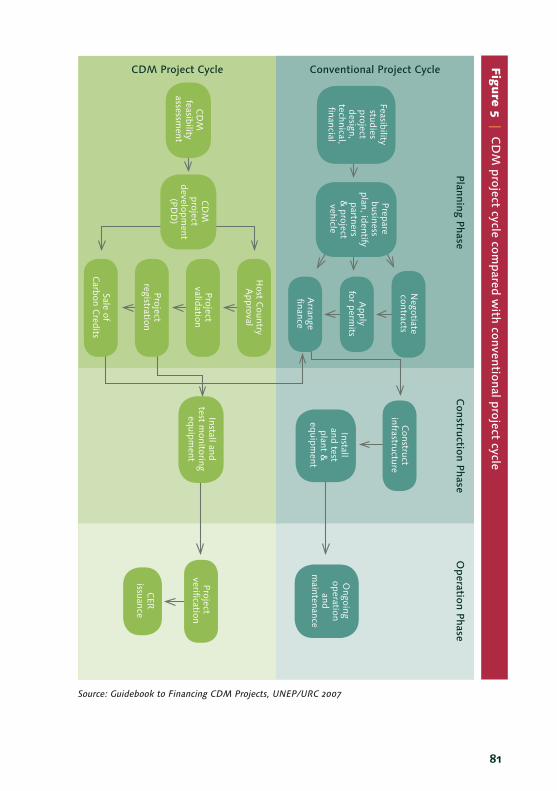
81
Source: Guidebook to Financing CDM Projects, UNEP/URC 2007
Fig
ure
5 | CD
M project cycle com
pared with conventional project cycle
CDM Project Cycle Conventional Project Cycle
Planning PhaseC
onstruction PhaseO
peration Phase
Feasibility studies project design,
technical, financial
CD
M
feasibility assessm
ent
Prepare business
plan, identify partners &
project vehicle
Install and test plant &
equipm
ent
Install and test m
onitoring equipm
ent
Project verification
CER
issuance
Ongoing
operation and
maintenance
Construct
infrastructure
Apply
for permits
Negotiate
contracts
Arrange
finance
Project validation
Host C
ountry A
pproval
Project registration
CD
M
project developm
ent (PD
D)
Sale of C
arbon Credits

82
The following general observations may be made (while recognising that the diversity of CDM projects means that there are exceptions to virtually any general rule):
• The CDM-specific project costs are usually smaller than the non-CDM specific project costs;
• The largest cost is incurred at construction (including purchase of plant and equipment, etc);
• Annual operation costs are usually low in relation to construction costs, although they may exceed construction costs over the lifetime of the project;
• Costs during the planning stage are usually financed by equity;
Figure 6 | Financing requirements of a CDM project
Planning Phase Construction Phase Operation Phase
Equity
Construction cost
Planning cost Operation cost Non CDM specific
CDM specific
Conventional revenue
CER revenue
Equity
Debt
Debt

83
• Costs during construction may be financed in a variety of ways – for example by various combinations of equity and debt, as shown here;
• CDM projects may have ‘conventional’ revenue streams (such as electricity sales, or sales of other outputs) in addition to CER revenues;
• Costs during operation are covered by the conventional revenue (if any) and CER revenue of the project;
• Remaining conventional and CER revenues are used first to repay debt (if any) and lastly to provide a return on equity.
6.2 Sources of Project Funds
CDM projects require upfront investments that are normally obtained from different sources such as loans, equity, grants, and upfront payments for emission reductions.
• Loans or debts refer to funds lent to CDM project owners by fin-anciers. Debt can be obtained through public markets (bonds) or private placements (bank loans and institutional debt).
• Equity refers to funds funnelled to the CDM project by company shareholders. Equity may be sourced from internal sources (spon-sors) or external investors (public or private markets). The return on equity is obtained either from dividends or from sale of shares.
• Grants are funds provided by institutions and governments to CDM project owners and developers who contribute to donors’ objec-tives. Grants need not be repaid and oftentimes, cover only a per-centage of project costs.
• Upfront payment for CER purchase. The carbon purchase agreement often stipulates payment on agreed price upon delivery of CERs but CER buyers sometimes provide upfront payment upon purchase. For example, the PCF provides upfront payment up to 25% of the total CER value. However, to compensate for increased risk, upfront pay-ments are discounted.

84
Like conventional projects, financing CDM projects can be arranged either through corporate or project financing. These are described as follows:
• In project financing, a project company is formed and investments are viewed as assets of the company. Investment funds are sourced either from equity or debt. Assets and cash flow secure debts. Credi-tors do not have recourse to the other resources of sponsors.
• Under corporate financing, new projects are undertaken as exten-sion of assets of the existing company. Capital investments and borrowing are not placed under the project account. Loans are con-sidered as company debts and lenders have full recourse to all the assets and revenues of the company over and above those gener-ated in the new project.
Additional project revenues (i.e. CER) could be used to service debts and leverage debt financing. Guest et al (2003) presents that the carbon cash flow can help increase debt carrying capacity: The carbon revenues could help increase debt leverage of project by increasing the debt service coverage ratio (DSCR) levels of the project. In addition to improving debt capacity, there are other options to debt service through the carbon cash flow. These include: prepaying debt based on Forward Emission Reduction Purchase Agreements (ERPAs); depositing carbon cash flow directly with banks for credit against debt service thereby lowering liability on electric-ity cash flow; and using ERPAs and/or forward carbon sales as collateral for loans (this is the case for Plantar project in Brazil where the CER purchase agreement with the PCF was used as collateral for commercial bank financing).
The existence of CER has important implications for stakeholders. For pro-ject sponsors and partners, it implies improved project profitability and in cases that upfront CER payment is obtained, less equity and debt require-ments. Those involved in the risk transfer process such as contractors and suppliers, will have to bear increased risks. While for agencies that provide risk mitigation, this offers an opportunity to expand services to emission reduction components. For project lenders, this entails additional analysis on the quality of the financial flow from CER value. For CER buyers, this
20 US$0.10/CER for the first 15,000 CERs per year and US$0.20/CER for any CERs above 15,000 CERs per year (max US$350,000). The minimum shown here has been calculated as 15,000 CERs/year over a single 7-year crediting period.
21 As for large scale, unless total annual average emission reductions over the crediting period are below 15,000 tCO2-e, in which case no fee is payable. Maximum calculated as 25,000 CERs/year over 7-year crediting period.
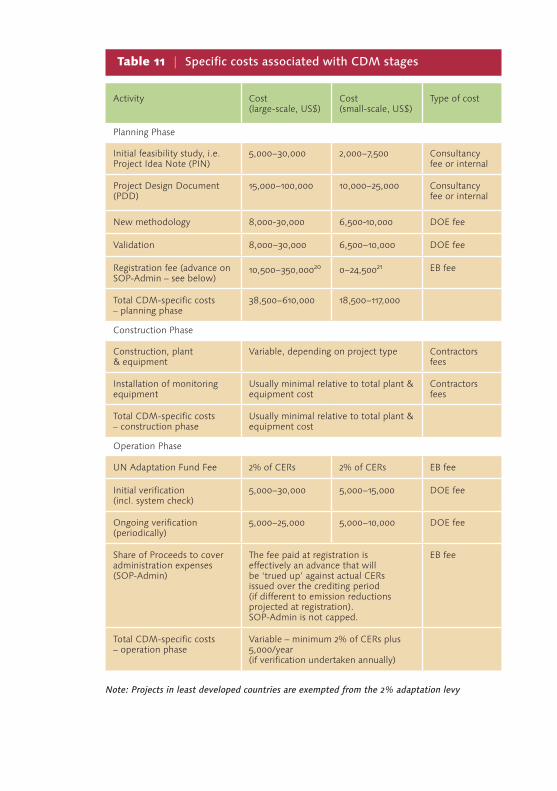
85
Activity Cost (large-scale, US$)
Cost (small-scale, US$)
Type of cost
Planning Phase
Initial feasibility study, i.e. Project Idea Note (PIN)
5,000−30,000 2,000−7,500 Consultancy fee or internal
Project Design Document (PDD)
15,000−100,000 10,000−25,000 Consultancy fee or internal
New methodology 8,000-30,000 6,500-10,000 DOE fee
Validation 8,000−30,000 6,500−10,000 DOE fee
Registration fee (advance on SOP-Admin – see below)
10,500−350,00020 0−24,50021 EB fee
Total CDM-specific costs – planning phase
38,500−610,000 18,500−117,000
Construction Phase
Construction, plant & equipment
Variable, depending on project type Contractors fees
Installation of monitoring equipment
Usually minimal relative to total plant & equipment cost
Contractors fees
Total CDM-specific costs – construction phase
Usually minimal relative to total plant & equipment cost
Operation Phase
UN Adaptation Fund Fee 2% of CERs 2% of CERs EB fee
Initial verification (incl. system check)
5,000−30,000 5,000−15,000 DOE fee
Ongoing verification (periodically)
5,000−25,000 5,000−10,000 DOE fee
Share of Proceeds to cover administration expenses (SOP-Admin)
The fee paid at registration is effectively an advance that will be ‘trued up’ against actual CERs issued over the crediting period (if different to emission reductions projected at registration). SOP-Admin is not capped.
EB fee
Total CDM-specific costs – operation phase
Variable – minimum 2% of CERs plus 5,000/year (if verification undertaken annually)
Table 11 | Specific costs associated with CDM stages
Note: Projects in least developed countries are exempted from the 2% adaptation levy

86
requires assessment of the overall project since project performance is cor-related with CER delivery.
6.3 CDM Specific Transaction Costs
In addition to the costs that would be incurred by a project regardless of whether or not it was registered as a CDM project, certain specific costs are associated with the various stages of the CDM project cycle, as set out in Table 11.
In addition to the costs shown above, a number of governments may charge a fee for the approval of a CDM project. For example, China charges 65% of CER revenue for HFC projects or 2% of CER revenue for energy efficiency projects.
While most of the costs listed above are one-off costs incurred during the planning phase of the project, the costs of ongoing verification and the SOP Admin fees are incurred whenever issuance of credits for a project is required.
It should be noted that the upper ends of the cost ranges, in particular for large-scale PDDs and new methodologies, represent a ‘worst case’ scenario where an extremely large, complex project is being developed. On the other hand, the upper end of the range for registration costs represents a project with annual emission reductions of 182,500 tCO2-e/year over a 10-year crediting period, which is not unusual and is far exceeded by some of the larger projects. Therefore, for large projects with emission reductions beyond this level, SOP-Admin fees will eventually exceed the up-front registration fee.
6.4 Impact of CERs on Project Viability
The net financial gain derived from the sale of CERs is the difference between the project CER value and the transaction costs. There are three elements that influence the net impact of CERs on project profitability: value of CERs (low CER value implies low net benefits), overall transaction costs (high transaction costs yield low net benefits), and up-front transac-tion costs (high upfront payments could also result in low benefits). Project developers generally expect up-front transaction costs within the range

87
of 5 to 7% of the net present value of the revenue or total transaction costs around 10 to 12% of the net present value of revenue. A positive net financial gain means that CER revenues improve the financial viability of the project.
The effect of CER cash flow on project IRRs vary by project type. The impact of CERs on wind power project IRR is relatively small (few percent-age points increase) while it is substantially important for fugitive methane capture projects. More CERs are generated by methane capture projects since the global warming potential of methane is 21 times higher than carbon dioxide. This makes methane capture projects relatively attractive to CDM project developers.
6.5 Types of Finance Available for a CDM Project
It has been observed that the majority of the CDM-specific project costs occur during the planning phase. They must therefore be regarded as high risk, since they will not be recovered if the project fails to be implemented. Such costs must therefore be covered by ‘risk capital’ – either equity or grants, which do not have to be repaid if the project does not eventuate.
The main sources of finance for these CDM-specific project costs during the planning phase are:
• Government tenders and carbon funds: which will often pay a pro-portion of these costs in return for a contract to purchase some or all of the resulting CERs
• Private sector CDM project developers: who may cover part or all of the CDM-specific costs in return for a contract to purchase some or all of the resulting CERs; and
• Project hosts: either public or private sector entities which provide their own internal funds to develop projects with which they have an association as, for example, landowner, fuel supply provider, or off-taker of the non-CER outputs of a project.
The situation is more complex with regard to the costs incurred during the construction phase. As noted elsewhere, these costs are generally much larger than the planning phase costs, yet CDM projects are still relatively

88
‘small’ (typically under US$20 million). Nevertheless, the potential sources of finance include:
• Lenders: who may provide limited recourse debt to relatively large projects with secure revenue streams and relatively low risks, or to other projects with recourse to a financially strong sponsor;
• Private sector CDM project developers: who may be able to finance (usually smaller) projects with their own equity;
• Project hosts: who may be able to finance (usually smaller) projects from their own internal funds;
• Equipment suppliers: who may provide assets on lease or credit; and
• CER buyers: who may provide up-front payments against future CER deliveries.
6.6 Financing Models for CDM Projects
This sections presents details on the financing models known to have been applied to actual CDM projects which have successfully obtained financing for both planning and construction phases. In section 5.8 we will discuss future financing models that might be applied in future.
At the time of writing, 2810 CDM projects had been registered with the CDM Executive Board. Clearly, all of these projects have obtained financ-ing of one kind or another to cover their CDM-specific planning phase costs, but it is not known what proportion of these have successfully ob-tained financing for construction. In addition, there is no general require-ment for CDM projects to make public any information on how they have obtained financing. The financing models described below are therefore based on the information available to the authors and may not necessarily cover all relevant examples in the market.
Project proponents will want to assess the various possible financing structures and sources of finance to find the best balance of risk and price. For example, if they wish to monetise (i.e. borrow against) the ERPA, they will want to be careful about how risks are shared in that contract, and especially whether they are required to offer any delivery guarantees.

89
Doing so may create uncovered contingent liabilities that financial institu-tions are unwilling to lend against, thus ruling out certain forms of finance. The advantages and disadvantages of the most common financing models used for CDM projects are set out in the following sections and case study boxes.
6.6.1 Conventional project financing
CDM projects face a number of structural challenges in obtaining any form of financing, and particularly bank debt. Projects are typically relatively small; climatefriendly technologies such as renewables are usually more capital intensive than fossil fuel alternatives; and lenders to developing country projects often require higher interest rates or repayment over shorter loan terms than the project’s revenues can support. In addition, the CDM-specific risks can be significant: it was not until the entry into force of the Kyoto Protocol in February 2005, for example, that one major source of CDM-specific uncertainty (i.e. the legal foundation of the entire market) was eliminated. All of this has led to a relative scarcity of bank debt in CDM projects to date. Nevertheless, there are some exceptions, for example those described in the case studies below.
The advantages of conventional project financing for a CDM project (from the point of view of the project sponsor) include:
• Ability to raise large amounts of capital: generally speaking, banks have access to far larger amounts of capital than equity providers;
• Improved rate of return on equity: by financing a proportion of the project with debt (which has a lower cost of capital than equity) the equity providers improve the rate of return on their contribution to the project; and
• Limited or no recourse to the assets of the project sponsors: should the project fail, the assets of the project sponsors would not be at risk.

90
The disadvantages include:
• Costs and time taken to obtain finance: lenders will need to under-take extensive due diligence before deciding whether or not to offer a loa to a project, which can be time-consuming and costly;
• Contracts must be with credit-worthy counterparties: since the lenders only have recourse to the cash flows of the project, they will want to be sure that the contracts for the major outputs of the project are with reliable counterparties; and
• Delayed returns on equity: lenders will require to be repaid first, before any return is made to equity providers. This may delay any return on equity for some years.
Registration as a CDM project can increase the financial attractiveness of a project in two ways: CER revenue can simply increase the project IRR, and also help to mitigate risks by virtue of providing a relatively long-term revenue stream denominated in hard currency (euro or US$), often backed by a highly rated counterparty. This can help a project to obtain bank debt through a conventional project financing structure.
6.6.2 100% equity investment by a private sector CDM project developer
A more common financing model involves specialised CDM project devel-opers investing directly in CDM projects in return for part or full ownership of the resulting CERs. The advantages of this form of financing include:
• Speed: a specialised CDM project developer has the expertise to as-sess a project rapidly and a strong incentive to maximise the secure CER output by implementing a project as rapidly as possible.
• Simplicity: there are typically fewer contracts to be negotiated. At one extreme, a private sector developer may offer a project host a single turnkey contract to deliver all aspects of a project, in ex-change for a fixed rental or revenue share. However, the project host may still wish to contract some elements of the project separately.

91
• Low risk to the project host: typically, the CDM project developer takes on all of the project risks, with the project host simply provid-ing land or other inputs to the project.
The disadvantages of this model are:
• ‘Loss of control’ over the project: from the project host’s point of view, they may ‘lose control’ over a project they could potentially have developed themselves. Project hosts need to assess their capa-bility to develop CDM projects realistically and balance the potential pay-offs against the costs and risks involved in developing a project. It is also important to realise that practical aspects of ‘control’ over a project are negotiable when a contract is being entered into with a third party CDM project developer. For example, the contract may provide for certain rights of access and entry (to either party’s facilities), or for a CDM project to be operated in a certain way to fit with the needs of the host facility, or for the entire facility to be transferred back to the ownership of the project host upon comple-tion of an agreed operating period.
• High cost of finance: using 100% equity is the most expensive way to finance a project, as equity providers require a high rate of return, which will be reflected in the terms offered to the project host (e.g. the value of lease payments, percentage of CER revenues, or fixed price per CER). The high cost of finance must be balanced against the advantages set out above.
6.6.3 Corporate financing by project host
In essence, corporate financing by the project host is much the same as 100% equity financing by a CDM project developer, the difference being that the project host assumes the role of the CDM project developer.
The advantages of this approach include:
• Project host retains all of the CER revenue from the project.
• Financing may be raised more rapidly (if the project host is credit-worthy or has sufficient cash reserves of its own).
92
The main disadvantage is:
• Lack of expertise: It is unlikely that the typical project host would have all elements of the highly specialised expertise required, and it would therefore be obliged to outsource elements of the project (e.g. CDM project documentation and installation of plant and equipment). This would increase project costs and development time.
6.6.4 Equipment lease financing
The supplier of equipment – often a large percentage of the total up-front capital expenditure of a CDM project – can be a potential source of finance for a project. Some suppliers of specialised equipment, particularly where the equipment has value to the supplier even after its use by the customer, may be willing to lease the equipment to a project host or developer, rather than selling it outright. This is effectively a loan from the equipment supplier, secured over the equipment itself (which remains in the owner-ship of the equipment supplier, until and unless sold to the project host or developer at an agreed stage in the contract).
The cost of this form of finance depends very much on the type of equip-ment involved, the credit-worthiness of the project host/developer, and whether any other products or services (such as maintenance) are included in the contract. For a highly credit-worthy project host leasing a long-lived asset (e.g. a hydro turbine) from a supplier familiar with leasing their equipment, the effective cost of capital under an equipment lease might be little more than the cost of a conventional bank loan taken out to pur-chase the equipment outright (after allowing for depreciation of the asset). However, for less credit-worthy project hosts leasing less durable assets, the cost of capital might be much higher.
The advantages of equipment lease financing include:
• Reduced up-front expenditure and closer match between lease pay-ments and project revenue: By definition, lease payments are made during the operation of the equipment (although some up-front deposit is almost invariably also required), and therefore are more likely to match the project’s revenue stream.

93
• Management of equipment performance risk: Usually, the terms of the lease would provide for the lessee to withhold payment in the event of an equipment failure (unless due to the actions of the les-see). The equipment supplier therefore has an incentive to provide reliable equipment.
The disadvantages include:
• Limited ability to make modifications to equipment: Since the pro-ject host/developer does not own the equipment, it will have lim-ited scope to make any modifications during the term of the lease.
• Relatively high cost of capital. The cost of capital is usually higher than an equivalent bank loan.
6.6.5 Supplier credit
Supplier (or vendor) credit is similar to equipment lease financing, inso-far as it involves financing provided by suppliers of goods and services to the project. In its simplest form, supplier credit can consist of the interval between submission of an invoice for the supply of a good or service and the time at which the invoice must be paid. However, some suppliers will offer more sophisticated credit facilities, which are essentially loans for part or all of the value of the goods or services provided. Such loans are gener-ally secured only by the equipment (not by the company’s other assets) and therefore generally have a higher cost of capital than conventionally secured debt. However, where the supplier is effectively subsidised by a bilateral export credit agency, the cost of capital may be lower. The avail-ability of credit is likely to depend on the credit rating of the project host/developer.
The advantages of supplier credit include:
• Widespread availability: Most suppliers offer some form of supplier credit, even if it consists only of payment in phased instalments, or a payment period (e.g. 14−30 days) for invoices.
• Deferred payment for up-front capital expenditure.
94
The disadvantages include:
• Relatively high cost of capital: Supplier credit is rarely the cheapest form of capital, unless subsidised by an export credit agency.
6.6.6 Up-front payments
The buyer of the CERs is another potential source of finance for a CDM project. Normally, there is a mismatch between the needs for up-front investment for construction and the periodic payments for emission reduc-tions, which usually occur only after completion of the project and peri-odic verification of the emission reductions. This mismatch can be reduced if a CER buyer is prepared to make an up-front payment for future delivery of CERs from a project.
This is effectively a loan provided by the CER buyer. If it is secured only against future delivery of CERs (as set out in an ERPA), it is high risk, as it is exposed to all of the same risks as any conventional loan at the same stage, but without the ability to seize the assets of the project (other than having legal title to the CERs) in the event of non-payment. Consequently, most CER buyers would apply a relatively high discount rate to the future value of the CERs when formulating offers for up-front payment. In financial terms, this would be equivalent to charging a high interest rate for the loan provided by the CER buyer. Alternatively, the CER buyer may require a guarantee or other security (for example, a letter of credit from an invest-ment-grade bank), in which case the cost of the guarantee must be taken into consideration.
As a method of financing, therefore, up-front payment typically comes at a relatively high cost. However, it has the advantage that CER buyers are generally very well informed about CDM-specific risks and are able to conduct the necessary due diligence and make decisions on a CDM project relatively quickly and at low cost (compared with a less well-informed lender). A CER buyer may take a less conservative view than a convention-al lender of the risks associated with a CDM project, which would reduce the difference between the interest rate a conventional lender would apply to a loan and the discount rate applicable to an up-front payment offer from a CER buyer.

95
With the growing maturity of the CDM market and increasing involvement of well-informed CER buyers, up-front payment for CERs is becoming more common. Up-front payment options offered by different CER buyers vary according to the stage in the project cycle when up-front payment(s) may be made (typically after registration), the percentage of projected CERs a buyer is willing to pay for up-front, the discount rate applicable and any other safeguards or guarantees required by the buyer.
Finally, it is worth noting that in practice, up-front payment rarely entirely solves the problem of obtaining finance for the most expensive stage of the project cycle (construction). This is because it is rare for any buyer to be willing to pay up front before a project is both registered and ready to commence generating CERs (i.e. after completion of construction). Howev-er, by bringing forward any proportion of a project’s cash flows to any ex-tent (for example by a year, if up-front payment is made at the project start date, rather than after verification a year later), up-front payment can assist the project host or developer with obtaining any other form of finance that rewards early repayment (such as a bank loan or supplier credit).
In summary, the advantages of this model include:
• Repayment of up-front capital expenditure can be brought forward: By receiving up-front payments based on a future flow of CERs some of the financial difficulty of covering the initial capital expenditure of the project may be alleviated.
• Relatively rapid and low cost due diligence by CER buyers: This source of finance may be obtained rapidly, relative to a conventional loan.
• (Possibly) less conservative view of CDM-specific risks: A CER buyer may take a less conservative view of the CDM-specific risks, due to having better information or being better able to mitigate these risks (for example through portfolio diversification). This reduces the cost of capital (which may nevertheless remain higher than a conven-tional loan, due to other factors such as the lack of collateral).

96
The disadvantages include:
• Risk allocation towards buyer: The buyer of CERs will bear all the risk associated with the performance, verification and issuance of any CERs which have been paid for up front.
• Lower net CER revenue for project host/developer: The project host/developer will receive a lower net CER revenue due to the dis-count rate that the buyer will apply to the future value of the CERs.
• May not solve problem of obtaining finance for construction: Up-front payment options vary between different CER buyers, but most will not pay before registration and completion of the project.
6.6.7 Low interest loans or debt
There are a number of development banks with lending programmes in the non-Annex I countries that can function as ‘lenders of last resort’ to projects which would otherwise have difficulty obtaining finance. Examples of such institutions include the World Bank, Asian Development Bank, African Development Bank, the Inter-American Development Bank, the European Bank for Reconstruction and Development and others. With the aim of supporting poverty reduction and economic growth in developing and transition economies, these institutions are sometimes able to provide loans at lower interest rates than are generally available in the host coun-tries. In many cases such funding is complementary to funding from other local or international sources of finance. A number of banks and bilateral funding bodies also offer support to develop the CDM components of eli-gible projects. This can include the provision of grants and direct assistance in developing CDM related documents.
The advantages of low interest loans include:
• Lender of last resort: Development banks focus their loans on coun-tries which have trouble attracting finance due to the fragile nature of their economy.
• Stable currency: The low interest loan is in a stable currency (e.g. euro or US dollars).

97
• Support with CDM component: In addition to offering low interest loans the institutions may also provide assistance for the develop-ment of the CDM component.
The disadvantages include:
• Loans must fit the objectives of the lending programme: In many cases a loan provided by such an institution needs to fit the wider context of the country’s development plan and the specific objec-tives of the lending programme. These plans usually focus on sup-porting and developing specific sectors of the economy. If a project proposal does not fit in this wider context of the overall develop-ment plan it may be more difficult for the project to receive the loan.
• Stringent due diligence: Projects selected for finance by the develop-ment bank are usually subject to stringent due diligence in order to assess their longterm viability, impact on economic development of the country or region, and environmental sustainability. In addition to the administrative effort and cost this entails, project lead times can therefore be rather lengthy.
6.6.8 Micro-credit
Micro-credit is similar to traditional bank debt finance, but aimed at pro-viding very small amounts of credit to lenders with limited ability to pay, particularly in rural areas of developing countries. Finance is provided by local institutions, referred to as micro finance institutions (MFIs) that have local presence and experience in rural areas. In terms of CDM projects, micro-credit is typically applicable to (very) small scale CDM projects, par-ticularly those that involve many individual end users purchasing specific items of equipment (e.g. solar water heaters, bio-digesters, more efficient cook stoves).
The advantages of micro-credit include:
• Access to finance: Micro-credit is often the only alternative to per-sonal capital expenditure (which is limited, for obvious reasons, in rural areas of most developing countries), for projects involving capi-tal expenditure of up to a few hundred dollars per item. Often no collateral is required, or collateral may be shared between a group of

98
borrowers. Micro-credit thus provides access to financing and aids in the development of CDM projects that would otherwise not have been developed.
The disadvantages include:
• Limited scale: One of the strong arguments in favour of micro-credit (access to financing for micro scale projects) is also a major constraint, as MFIs are usually not able to provide financing on a large scale. In many cases there may be a financing gap between the micro-credit scale and availability of conventional credit.
• High interest rate: Although many MFIs have found that micro-cred-it models such as peer group lending can reduce the risk of default, the risk remains relatively high and this, combined with high transac-tion costs, means that MFIs need to charge a relatively high interest rate on micro-credit loans.
6.7 Risk Management
CDM projects face two types of risks: conventional project risks and CDM-related risks. Conventional project risks relate to uncertainties in project performance and in the market of project output while CDM-specific risks refer to uncertainties in the Kyoto process and its implementation as well as the market performance of carbon assets.
Project risks may be broadly classified into i) construction risks (referring to time and cost overrun), and ii) operational risks (involving technology performance, fuel, or product supply, market, operation, political, legal, environmental, and financial factors). Though these risks are generic to projects, these relate to project performance, which affect its ability to deliver the expected quantity of CERs.
On the other hand, CDM-related risks contain following risk categories:
• policy risks – this includes risk that the Kyoto Protocol will not be ratified; risk that the host country will not comply with its obliga-tions; and risk that specific baselines and procedures used in the project will not be approved.

99
• market risk – CER pricing is highly speculative and that the develop-ment of the CER market and the evolution of CER prices are highly un-predictable.
Risk management principles apply to both categories of project risks, namely:
• allocation of risks to contracting parties who best understand the risks, and
• transfer of risks to a third party who uses financial tools.
There are several financial tools for risk management; these include hedg-ing, guarantees and insurance products. In financial hedging, the derivative markets are used to fix future prices of commodities, currencies and inter-est rates. Financial derivatives market can also be used for emission com-modities. These include: call and put options, collars, swaps and forward contracts. With insurance, a third party is paid to bear a particular risk. Insurance is often used to mitigate political risks and natural hazards.
A number of international agencies provide political risk insurance and guarantees. The European Investment Fund, for example, offers guarantees on debt financing to infrastructure projects including those in the energy sector. The International Bank for Reconstruction and Development (IBRD) likewise provides guarantees against interest rate conversions or swaps; interest rate caps and collars, currency conversions or swaps and commod-ity swaps.

100

101
7
CDM Programme of Activities
During the first meeting of the parties of the Kyoto Protocol (CMP1) a new CDM modality was introduced: “Programmes of Activities” (PoAs). The aim was to broaden the CDM field to replicable projects (i.e. CPAs) with low and physically spread GHG emissions reductions activities that would have been difficult and time-consuming to develop on a project-by-project basis.
By its thirty-fifth meeting, the CDM’s Executive Board agreed on the basic rules for programmatic CDM. It approved templates for project design documents suitable for Programmes of Activities (PoA-DD), its constitu-ent activities (CPA-DD), and issued procedures to register PoAs and issue CERs. It also amended Small-scale CDM methodologies to make them suitable for programmatic activities.
7.1 Definition and rationale
Therefore, a program is a deliberate effort implemented via an unlimited number of CPAs, which is a multitude of GHG reduction activities occur-ring over time in a single or multiple sites. The sites could be located with-
A CDM PoA is considered “a voluntary coordinated action by a private or public entity which coordinates and implements any policy/measure or stated goal (i.e. incentive schemes and voluntary programs), which leads to GHG emission reductions or increases net GHG removals by sinks that are additional to any that would occur in the absence of the PoA, via an unlimited number of CDM program activities (CPAs)” (Annex 38, EB32).

102
22 See chapter three for similar responsibilities for the validating DOE..23 Notice that some of the small-scale methodologies already include provisions and requirements
for sampling
in one or more city, region, or country, as long as each country involved submits a Letter of Approval (LoA).
7.2 Operation of a PoA
A PoA differs from the traditional CDM project mainly by its operation. A PoA operates on two levels: at the program level (PoA) and at the program activity level (CPA).
1. The Operation at Program (PoA) LevelThe purpose of a PoA at the program level is to provide the enabling envi-ronment for others to implement a policy/measure or stated goal. In other words, the program provides the organizational, financial and methodo-logical framework for the emission reductions at the level of the “CDM program activities” (CPAs), which should be managed or coordinating by a public or private entity.
Characteristics of a PoA
1. Managing Entity. The Managing Entity is the project participant which provides the frame-work and incentives for others to achieve the emission reductions. The Managing Entity, which can be a public or private company, communicates with the Executive Board on all matters, including submission of the PoA and making arrangements for the distribution of certified emission reduc-tions (CERs). The Managing Entity should ensure double counting does not occur by verifying that emission reduction activities in the program are not registered as a separate CDM project activity, or as part of another registered CDM program22.
The EB 47 decisions on P-CDM establishes that the Coordinating/Manag-ing Entity shall obtain letters of authorization of its coordination of the PoA from each Host Party’s DNA. However, it is not specified whether the entity should be located within the country, or can be any international company. From current practice it can be inferred that the entity can be lo-cated outside the host country (as is the case in the Chinese PoA “Hydrau-lic rams for irrigattion and domestic water supply in Zhejiang”).

103
2. Duration. The GHG-reducing activities do not necessarily occur at the same time. A program can have a duration of up to 28 years or 60 years for afforestation and reforestation programmes. Although all actions respond to the same program, they can occur either simultaneously, or throughout the dura-tion of the program. The Managing Entity can add a CPA to the program at any time throughout the duration of the PoA. The CPAs will have crediting periods of different duration (see section below on ‘The CDM Program Activity (CPA) Level’ for crediting periods of CPAs).
3. The starting date of a POAA POA starts with the beginning of the public comment period of valida-tion.
4. Monitoring and verification. The total volume of emission reductions to be achieved by a program may not be known at the time of registration. Each CPA shall be monitored according to the monitoring methodology that has been approved for that type of project activity. In cases where there are many small GHG reduc-tions23 , statistically, sound sampling may be proposed in the monitoring methodology submitted for approval. For purposes of verification, the DOE may also use sampling techniques as long as they ensure the accuracy of the emission reductions24 .
5. Boundary.The physical boundary of a PoA can extend beyond the boundary of a single host country, provided each participating country submits a letter of approval from the respective CDM Designated National Authority (DNA). Thus, programs can be national within the boundary of one host country, or regional, including various countries. The boundary of the program must also be defined in terms of which gases are included or excluded; a requirement no different from that of other CDM project activities.
6. Methodology.According to EB 47, Annex 31, the PoA can apply more than one approved baseline and monitoring methodology to all the CPAs under it. However, if more than one approved methodology is used, a case-by case decision is to be made by the EB before submitting a registration request for the PoA in question25 . At EB 58 (see Annex 23) it was decided that all combination used in registered small scale CDM projects are allowed for PoAs.
24 This is a relevant issue for DOEs as at the time of publication of the Primer the guidance for “statistically sound sampling” and “accuracy” was not yet available.
25 “Procedures for Approval of the Application of Multiple Methodologies to a PoA” (EB 47, Annex 31)
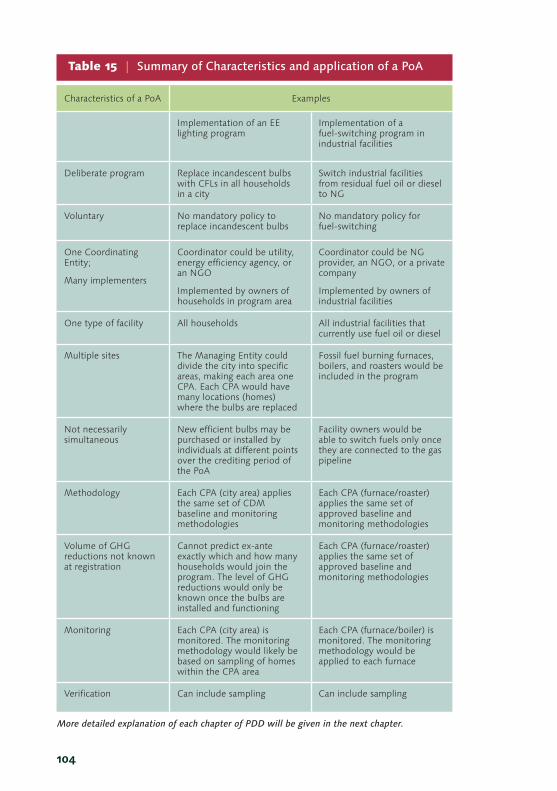
104
Table 15 | Summary of Characteristics and application of a PoA
Characteristics of a PoA Examples
Implementation of an EE lighting program
Implementation of a fuel-switching program in industrial facilities
Deliberate program Replace incandescent bulbs with CFLs in all households in a city
Switch industrial facilities from residual fuel oil or diesel to NG
Voluntary No mandatory policy to replace incandescent bulbs
No mandatory policy for fuel-switching
One Coordinating Entity;
Many implementers
Coordinator could be utility, energy efficiency agency, or an NGO
Implemented by owners of households in program area
Coordinator could be NG provider, an NGO, or a private company
Implemented by owners of industrial facilities
One type of facility All households All industrial facilities that currently use fuel oil or diesel
Multiple sites The Managing Entity could divide the city into specific areas, making each area one CPA. Each CPA would have many locations (homes) where the bulbs are replaced
Fossil fuel burning furnaces, boilers, and roasters would be included in the program
Not necessarily simultaneous
New efficient bulbs may be purchased or installed by individuals at different points over the crediting period of the PoA
Facility owners would be able to switch fuels only once they are connected to the gas pipeline
Methodology Each CPA (city area) applies the same set of CDM baseline and monitoring methodologies
Each CPA (furnace/roaster) applies the same set of approved baseline and monitoring methodologies
Volume of GHG reductions not known at registration
Cannot predict ex-ante exactly which and how many households would join the program. The level of GHG reductions would only be known once the bulbs are installed and functioning
Each CPA (furnace/roaster) applies the same set of approved baseline and monitoring methodologies
Monitoring Each CPA (city area) is monitored. The monitoring methodology would likely be based on sampling of homes within the CPA area
Each CPA (furnace/boiler) is monitored. The monitoring methodology would be applied to each furnace
Verification Can include sampling Can include sampling
More detailed explanation of each chapter of PDD will be given in the next chapter.

105
7. Additionality.According to EB 47, paragraph 73, “additionality is to be demonstrated either at the PoA level or at CPA level”. At the program level, the PoA is additional if it is shown that in the absence of the CDM, (1) the proposed voluntary measure would not be implemented, (2) the mandatory policy/regulation would not be enforced as envisaged but rather depends on the CDM to enforce it, or (3) that the PoA will lead to a greater level of enforcement of the existing mandatory policy/regulation. Furthermore, paragraph 4(g) of the PoA procedure states, “Definition of eligibility criteria for inclusion of a project activity as a CPA under the PoA, which shall include, as appropriate, criteria for demonstration of additionality of the CPA”. Hence, the assessment of the additionality of a CPA is rather based on criteria for inclusion pertaining to the additionality of a CPA, which are specifically developed for the PoA in question. The additionality of the individual CPAs can be shown using the approved tool for the demonstra-tion of additionality (see next section for CPAs additionality) and the CPA should also conform to the additionality arguments included in the PoA.
Typical examples for a PoAIn the CDMPipeline from UNEP Risoe you have a complete list of all PoAs and their CPA in the “PoA” and some analysis of PoAs In “PoAanalysis”
Programmatic project activities are most promising in areas of energy efficiency and fossil fuel switching, such as a city-wide efficient lighting program; a national incentive program to switch inefficient industrial boil-ers, furnaces, and roasters from fossil fuel to NG; an investment program to retrofit steam traps; or activities to enforce an energy efficiency standard that would otherwise not be enforceable. It also seems to be promising in increasing the use of renewable energies, particularly in private house-holds, small enterprises and transportation.
To illustrate the particularities of a CDM program with a few concrete examples, the following table presents the characteristics of a CDM Programme of Activities and how these apply to either a city-wide effi-cient lighting program, or a national program to switch industrial boilers, furnaces, and roasters from fossil fuel to NG.
106
7.3 The CDM Program Activity (CPA) Level
A CPA is the specific activity where the emission reductions are actually achieved by those that participate in the program. The CPA is identical to a traditional stand-alone CDM project in the sense that both must comply with all the procedures and modalities of the CDM and each must include activity that has a direct, real, and measurable impact on emission reduc-tions. It can be a single measure, or set of interrelated measures, designed to reduce GHG emissions within a predefined area. This area can include one or more locations, provided they are of the same type. All CPAs in a program must apply one or a combination of approved baseline and moni-toring methodologies. At registration, the program must define the type of information that is to be provided for each CPA, to ensure that the CPA is eligible under the program and that the resulting emission reductions are real and measurable.
This definition allows for four main types of CPAs, based on whether the CPA applies a single measure or several, at a single location or several:
1. Single measure, single location. These are CPAs constituted by a single measure to a single facility, for instance, improved insulation in buildings. In this example, each building is a CPA in which an EE measure is applied. Another example of this type is lighting efficiency programs in hotels, where the single location is each hotel and the single measure is to introduce more efficient lighting devices.
2. Several measures, single location.These are CPAs constituted by a set of measures to be applied to a single facility. Examples of this type are integral efficiency programs in hotels, where the single location is each individual hotel and the several measures are the introduction of more efficient lighting devices, better insulating windows and intelligent elevators. Another example is an energy efficiency program for boilers in industrial facilities. There, the single location is each facility, and the several measures are the energy efficiency measures ap-plied to the boilers of the facility.
A CPA is a “single, or a set of interrelated measure(s), to reduce GHG emissions applied in either a single or many locations of the same type, within an area that is defined in the baseline methodology.”

107
Figure 7 | Bundling Scheme
Iden
tific
atio
n &
de
velo
pmen
t
Source: F. Avendaño, Carbon Market Perspectives Series 2008 “A Reformed CDM – Including New Mechanisms for Sustainable Development”
Reg
ulat
ory
risk
Time
CD
M registry
Common features
Bundling PDD
Project 1
Project 2
Project N
Figure 8 | PoA Scheme
Prog
ram
Des
ign
&
deve
lopm
ent
Source: F. Avendaño, Carbon Market Perspectives Series 2008 “A Reformed CDM – Including New Mechanisms for Sustainable Development”
Reg
ulat
ory
risk
Time
CDM registry
Program concept (PoA - DD) + a real CPA DD
CPA-DDs

108
3. Single measure, many locations. These are activities that apply one measure, such as replacement of inef-ficient light bulbs, to many locations within a single CPA defined area. The single measure is the replacement of any/all incandescent light bulbs in each location. Each CPA will cover many locations (e.g. apartment build-ings or household blocks)
4. Several measures, many locations. These are activities that apply a set of interrelated measures (such as various energy efficiency measures in homes), to many locations within a single CPA defined area. The CPA could be a city, or a section of the city, in which a group of efficiency measures (such as efficient lamps, ballasts, air conditioners, fans) are applied to many homes within the area.
Characteristics of a CPA
1. Crediting Period of the CPAAs with all other CDM project activities, the crediting period of a CPA is either a maximum of seven years, which may at most be renewed twice, or a maximum of ten years, with no option of renewal26. The Managing Entity can add a CPA to the program at any time throughout the duration of the PoA. It is important to note that all CPAs’ crediting period should end upon expiration of the PoA. Although the EB regulation does not forbid choosing both 10-year fixed and 7-year renewable crediting period under a PoA, choosing only one type of crediting period will make issues much simpler as the CPAs are very similar to each other and have similar technol-ogy operation life.
2. Starting date of the CPA.The CPAs can start simultaneously or start at any time during the duration of the programme.
26 In preparation for renewing the crediting period of CPAs under a PoA, the Managing Entity needs to prepare (i) A new completed CDM-POA-DD; and (ii) A new version of the PoA specific CDM-CPA-DD. However, if both documents have already been updated due to methodology changes, they can be renewed 7 years after the approval of the latest revision (See Annex 29 to EB 47). To update the crediting period of a specific CPA, the coordinating entity should complete the latest version of the CDM-CPA-DD, and forward it to any DOE for scrutinization. The DOE carries out the CPA crediting period renewable through uploading the CPA DD through a dedi-cated interface of the UNFCCC CDM website.
109
3. AdditionalityThe additionality of each CPA has to be demonstrated through the eligibil-ity criteria for inclusion of CPAs and not on the CPA level itself. However, assessment of these criteria may still occur (and it should be expected that they often will) at the CPA level.
7.4 Difference between PoAs and Bundling
The CDM glossary defines bundling as “…bringing together of several small-scale CDM project activities, to form a single CDM project activity or portfolio without the loss of distinctive characteristics of each project activity’. It offers CDM project proponents the option of including multiple project activities in a single PDD and register them as a single project”.
Bundling requires every single project to be identified and qualified before registration, while a programme can be registered at the concept level without specifying beforehand all its constituent activities, but one CPA.
Bundling has had limited success in promoting the origination and group-ing of small and dispersed projects. One of the reasons for this is the fact that the regulatory risk is reduced only after the registration of the bundled projects which, as with standard CDM projects, happens only after money and effort have poured into the development of every single project and the drafting of the PDD.
Under the programmatic approach, regulatory risk is handled earlier in the process. Once a PoA is registered (presenting the concept and at least one real activity to the CDM Executive Board), enrolled PoA participants can embark on their individual activities with more certainty that their actions will be rewarded with CERs. Under PoAs, constituent projects are validated and verified by relevant UN-accredited Designated Operational Entities (DOE), while monitoring is performed by a PoA Managing Entity. In the event of an erroneous inclusion, i.e., if an individual activity (“CPA” in Pro-grammatic CDM jargon) fails to comply with the registered PoA terms, the DOE reports this and the non-compliant activity is put aside. In this case two things may happen: either the rest of the activities in the programme can continue or the whole POA can get frozen. The methodology revision can also end up in another validation process.
110
PoAs offer a simple way of diversifying risk within a single type of project or technology. In addition, much of the complex management is out-sourced to the Managing Entity, which is entitled to monitor the projects, trade CERs, distribute their benefits and represent all the programme members. From the buyers perspective a PoA may appear more risky be-cause of the higher organizational complexity and high uncertainty regard-ing CERs amount to be delivered. However, under a PoA risk becomes a portfolio and is heavily concentrated on the Managing Entity. Therefore, a good way of hedging risk should be by using a solid Managing Entity.
Finally, bundling poses practical limitations on its number of constituent projects since in a bundle “sampling” site visits are not allowed either for validation or verification.
7.5 Structuring a PoA
Structuring a PoA requires many steps, not necessarily sequential, through-out actions and time and not managed by only one actor. To ease the reader’s understanding of what it takes to structure a PoA, the following diagram sketches the main generic steps to accomplish the PoA cycle:
Among the steps included in the above diagram, the following issues are fundamental for the success of the PoA:
Defining a PoA pursued policy or goal
Whether starting from scratch or having previously existing experience developing CDM projects, the very first step is to identify the policy/meas-ure or goal that the program seeks to promote through a “replicable GHG mitigation activity” or CPA. Around this activity, clearly identified should be those stakeholders who are instrumental in its execution, such as fi-nancial institutions, project owners, government agencies and neighboring communities, to name a few.
One of the most important issues addressed by P-CDM is the relation-ship between policies and programs. Programs that stem from mandatory policies and regulations are permissible provided it is demonstrated that these policies and regulations are not systematically enforced. If they are enforced, the program must provide proof that it increases the enforce-ment beyond the mandatory level required (EB47).
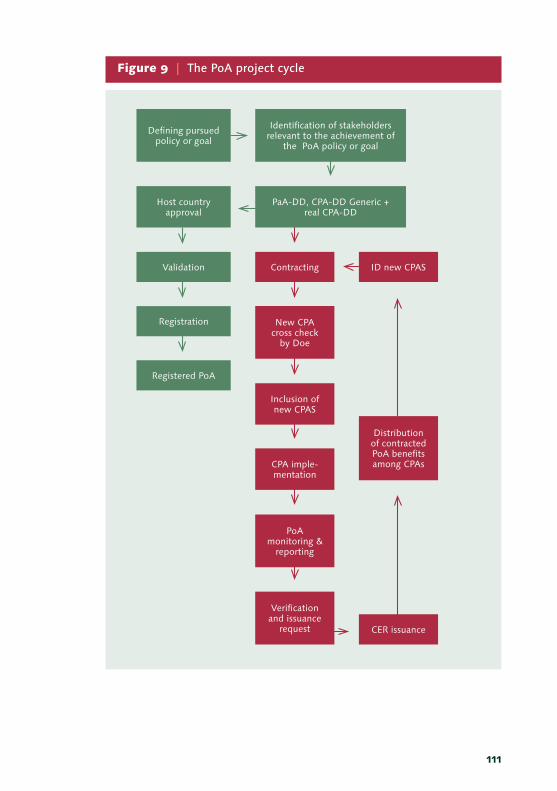
111
Figure 9 | The PoA project cycle
Defining pursued policy or goal
Host country approval
Validation Contracting
New CPA cross check
by Doe
Inclusion of new CPAS
CPA imple-mentation
PoA monitoring &
reporting
Verification and issuance
request
ID new CPAS
CER issuance
Distribution of contracted PoA benefits among CPAs
Registration
Registered PoA
Identification of stakeholders relevant to the achievement of
the PoA policy or goal
PaA-DD, CPA-DD Generic + real CPA-DD

112
A newcomer to the carbon market may have the desire to use P-CDM to implement broad policies or programs that promise to reduce GHG emis-sions. From the governmental point of view (e.g. an Energy Official) this might be perceived as an opportunity to promote policies for boosting, for example, hydroelectric or wind power. For an investor, this may repre-sent a long term business plan through which they may look for exposure to emerging technologies and renewable energy portfolios. For a boiler manufacturer, this may be seen as a way to boost sales of high efficiency boilers in a given customer base.
PoA rules require the Managing Entity to define, as precisely as possible, what the scope of the program is. For instance, saying that the program aims to increase the renewable energy share in the national energy matrix is not enough. It is not enough to choose well suited baseline and moni-toring methodologies, as this would sound ambiguous and prevent the specification of details about the technologies to be implemented and the level of the intervention. Additionally, it makes it difficult to quantify the level of associated GHG emissions reductions and the corresponding scale for the associated CPA.
Notice that the idea of promoting a measure or a policy goal may come from a range of actors. However, they may not necessarily be the im-plementer or be listed as the Managing Entity before the UNFCCC. For instance, efficient lighting programs are usually championed by energy ministries and/or finance ministries, but the final implementer will most likely be a local utility or a technology commercializing company that already has the framework to reach households, monitor power usage and enforce the program terms and conditions.
Important inputs for the definition of the PoA policy/goal are technology assessments, national, regional or sectoral GHG inventories, business as-sociation reports, technology sales plans for specific business sectors and public or private promotion programs for activities leading to GHG reduc-tions (e.g. energy efficiency, fuel switch, forestry, clean production, etc.). These inputs not only help to shape the PoA policy/goal but are also help-ful to sense the PoA potential boundaries and give an idea of the universe of potential interventions of the PoA.
Table 16 provides examples of the policy and/or goals targeted by real PoA cases.

113
Real POA case Targeted goal / policy
CUIDEMOS México (Campaña de uso Inteligente De Energia Mexico) – Smart Use of Energy Mexico – Programme of Activities
The goal: The PoA has been able to set a specific goal which is to transform the energy efficiency of Mexico’s residential lighting stock by distributing up to 30 million compact fluorescent lamps (CFLs) to households. This PoA will also include a significant public education component promoting the importance of energy efficiency in Mexico.
The policy: This PoA is developed under the national strategy of climate change and additionally strengthens efficiency campaigns developed by some major institutions in Mexico. Demand-side energy efficiency has been identified by the Mexican government as one of the key areas to address in order to reduce greenhouse gas emissions and energy consumption (National Energy Savings Commission).
Promotion of Energy-Efficient lighting using Compact Fluorescent Light Bulbs in rural areas in Senegal
The goal set by the Senegalese Rural Electrification Agency (ASER) is to promote energy efficient lighting in newly electrified households in rural areas of Senegal. This Demand-side Energy Efficiency Measures PoA is based on the installation of CFLs in newly electrified households and buildings instead of the commonly used and less costly ILBs.
The policy: This energy efficiency CDM PoA will be undertaken in connection with a nation-wide rural electrification plan implemented under the supervision of ASER. The objective of the plan is to increase electricity access in Senegal rural areas from 16% to 50% by 2012.
Installation of Solar Home Systems in Bangladesh
The goal: The PoA aims to provide access to electricity for households which are not connected to the power grid by implementing Solar Home Systems (SHS) with capacities ranging from 10Wp to 150Wp depending on the amount of electricity used by the household.
Uganda Municipal Waste Compost Programme
The goal: The PoA seeks to avoid methane emissions from municipal waste landfills by undertaking composting of the wastes and using the organic matter in the waste as humus for soil conditioning and plant growth.
The policy: The Government of Uganda has taken a loan from The World Bank under the “Environment Management and Capacity Building Project-II” and intends to use part of this loan to improve municipal solid waste management in cities and municipalities through the proposed municipal waste compost program.
Table 16 | Policies and goals targeted by some current PoAs

114
7.6 Identification of stakeholders relevant to the PoA policy/goal
Beyond the CDM rules that require that all relevant stakeholders have been consulted about the Project activity, stakeholders’ participation, directly and indirectly, are critical to the success of a PoA. The stakeholders of a PoA are those actors that are within the defined program boundary and whose participation are instrumental to the success of the PoA. The Managing Entity and the other project participants should clearly identify the stakeholders in the PoA, keeping all decisions and rules dealing with them properly documented. One of the ways to make this possible is by performing a value chain analysis for the Program around the desired PoA goal/policy. This will identify not only the actors directly involved in the CPA execution, but the suppliers and end clients as well.
Different types of stakeholders may intervene in the design and implemen-tation of a PoA. The most relevant stakeholders are:
• Managing Entity• DNA• DOE• EB• CER buyer• Project Owners• Investors• Lenders• Central and local governments• Consultants• Technology Providers• Projects Offtaker• Projects workers and employees
The following steps may assist PoA developers to identify the relevant stakeholders for their particular PoA:
1. Start with the desired PoA goal/policy/measure.
2. Disaggregate the PoA goal/policy/measure into smaller goals or tasks.

115
3. Identify the sector (electricity, agriculture, manufacturing, residen-tial, commercial, etc.) of each goal or task.
4. Identify project owners of potential CPAs and estimate their gross average GHG reductions. This will serve to quantify the number and scale of CPAs needed to reach your desired target as well as to get a sense of the PoA milestone calendar.
5. Ask the project owners to list their clients, project offtakers or consumers (those using the project outputs: electricity, heat, steam, lighting, etc). This is particularly relevant for CPAs producing electricity, heat or steam. Some contractual obligations (amount, time, quality) may already be in place and the CPA design should be compatible with it, otherwise the CPAs may be discarded.
6. Ask the project owners to list their consultants, if any. They are useful for gaining quick access to information helpful for shaping a common project template for all CPAs.
7. Classify the projects according to their financial status (raising equity, raising debt, raising both, fully financed). This is very important for being able to defend additionality on the grounds that the PoA opens new financial venues to raise equity or debt for the projects.
8. Identify the CPAs potential locations and identify relevant authorities for getting permits and authorizations. Sometimes processing times and requisites for permits and authorizations can be very heteroge-neous. This needs to be taken into account in order to reflect their impact on the PoA calendar and needed actions.
9. Identify the communities present in the CPAs locations. They should be contacted and their comments invited.
10. Ask CPA owners if they have identified a potential technology pro-vider. This may help to gather information on the technology base (and their cost, financing, etc.) of the CPAs and existing or ongoing arrangements to supply this technology to the project owners.

116
7.7 Development of PoA-DD, generic CPA-DD and real CPA-DD
The development and presentation of these documents, used for Host Country Approval, DOE Validation, EB Registration and Annex 1 DNA ap-proval, is the exclusive responsibility of the Managing Entity.
The first of these documents (PoA-DD) should clearly identify the Manag-ing Entity, the host countries in which it will operate, and PoA partici-pants. This document should also define among other things: boundaries of the PoA in terms of a geographical area within which all CPAs will be implemented; the policy/measure/goal that the PoA seeks to promote; demonstration of additionality of the PoA and conforming CPAs; criteria to include CPAs within the PoA; and a description of the management frame-work used to keep the PoA in good standing.
The Managing Entity is responsible for completing the PoA-DD and CPA-DD forms. According to the PoA rules, the Managing Entity should:
a) Identify the Host Party(ies) and other PoA participants. Note that only the Managing Entity is required to be a PoA participant. The CPA owners and other stakeholders are not required to be partici-pants. Furthermore, the Managing Entity should be listed as focal point for communications.
b) Define the PoA boundary in terms of a geographical area (e.g. mu-nicipality, region within a country, or several countries) within which all CPAs will be implemented.
c) Identify and describe the effect on the proposed PoA of applicable national and/or sectoral policies and regulations of each host coun-try; Add detail such as the level of enforcement of current rules and policies relevant to the PoA. This may vary within the PoA boundary.
d) Describe the policy/measure or stated goal sought by the PoA and how these policies/measures or actions go beyond current levels of policy/regulations application or compliance; and the desired PoA policy/goal/target. If possible, disaggregate it into smaller targets/tasks that can be further assessed. This is particularly important for being able to prove the additionality of the whole PoA.
117
e) Show confirmation that the proposed PoA is a voluntary action of the Managing Entity. In addition to a statement from the Managing Entity, this should also include a quick checklist of the laws applica-ble to the Managing Entity, showing that it is not obliged by law to implement the PoA measure or whether it has any previously exist-ing contractual obligations to do so.
f) Demonstrate additionality of the PoA proving that in the absence of the CDM any of the following conditions apply:
i. The proposed voluntary measure would not be implemented. Note here not to confuse the measure with the CPAs. For instance, setting a program that generates financial incentives to energy efficiency is different from the actual energy efficiency projects benefiting from the Program.
ii. The mandatory policy/regulation would not be systematically en-forced and that noncompliance with those requirements is wide-spread in the country/region. This applies if the PoA is seeking to enforce a policy or rule or promotes an early compliance of a future policy/rule.
iii. That the PoA will lead to a greater level of enforcement of the exist-ing mandatory policy/regulation. This requires having background information on the desired “beneficiary” base. For instance, waste management laws usually require that sending all the domestic waste to a landfill and dumpsites to be prohibited. However in most countries, that level of enforcement is usually limited to big cities.
The PoA-DD requires in section A.4.2 to demonstrate, with specific details, that the PoA complies with the following:
a) If the PoA is implementing a voluntary coordinated action, it would not be implemented in the absence of the PoA. Notice that for PoAs involving public funding or public programs, the involvement of public funds comes as a voluntary effort from the State (e.g. through public bureaus or state companies) to implement/promote/stimulate activities leading to GHG emission reductions;
b) If the PoA is implementing a mandatory policy/regulation, this would/is not enforced;

118
c) If mandatory policy/regulation is enforced, the PoA will lead to a greater level of enforcement of the existing mandatory policy/regu-lation.
A flowchart showing the possible steps to demonstrate PoA additionality is similar to the one shown in figure 3 for normal CDM projects.

119
appendix a
A list of existing CDM projects sub-types
The table shows the project types and sub-types, and the number of CDM projects that have been submitted for each sub-type (per 11 February 2011). You can find this table in the “Invest” sheet in the CDMPipeline. Here you can also see how many of these projects that have requested registration, are register, have issuance, the average issuance success per sub-type, MW installed and investments.
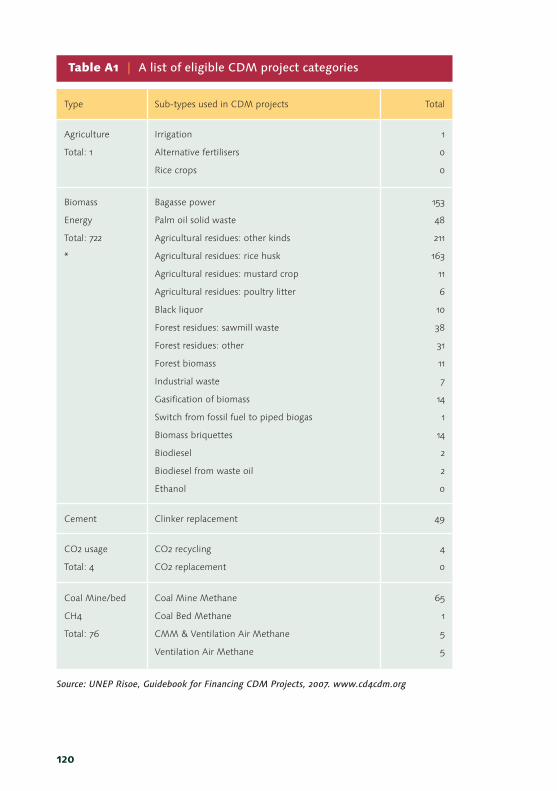
120
Type Sub-types used in CDM projects Total
Agriculture
Total: 1
Irrigation
Alternative fertilisers
Rice crops
1
0
0
Biomass
Energy
Total: 722
*
Bagasse power
Palm oil solid waste
Agricultural residues: other kinds
Agricultural residues: rice husk
Agricultural residues: mustard crop
Agricultural residues: poultry litter
Black liquor
Forest residues: sawmill waste
Forest residues: other
Forest biomass
Industrial waste
Gasification of biomass
Switch from fossil fuel to piped biogas
Biomass briquettes
Biodiesel
Biodiesel from waste oil
Ethanol
153
48
211
163
11
6
10
38
31
11
7
14
1
14
2
2
0
Cement Clinker replacement 49
CO2 usage
Total: 4
CO2 recycling
CO2 replacement
4
0
Coal Mine/bed
CH4
Total: 76
Coal Mine Methane
Coal Bed Methane
CMM & Ventilation Air Methane
Ventilation Air Methane
65
1
5
5
Table A1 | A list of eligible CDM project categories
Source: UNEP Risoe, Guidebook for Financing CDM Projects, 2007. www.cd4cdm.org

121
Energy
distribution
Total: 22
District heating
Replacement of district heating boilers
Connection of Isolated grid
Efficient electricity distribution
13
2
3
4
EE Households
Total: 69
Lighting
Stoves
Lighting & Insulation & Solar
Appliances
47
19
1
2
EE industry
Total: 135
Chemicals
Petrochemicals
Paper
Cement
Iron & steel
Machinery
Textiles
Electronics
Food
Building materials
Glass
Non-ferrous metals
Coke oven
Mining
Construction
Metal products
Wood
Recycling
24
26
13
13
11
7
7
3
4
17
2
4
2
2
0
0
0
0
EE Own
generation
Total: 467
Chemicals heat
Petrochemicals heat
Carbon black gas
Cement heat
Iron & steel heat
Building materials heat
Glass heat
Non-ferrous metals heat
Coke oven gas
29
17
10
178
150
2
6
11
64
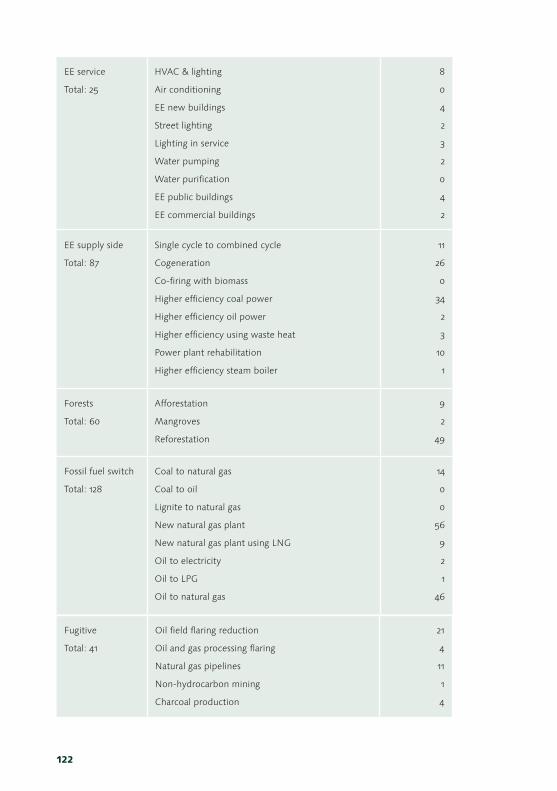
122
EE service
Total: 25
HVAC & lighting
Air conditioning
EE new buildings
Street lighting
Lighting in service
Water pumping
Water purification
EE public buildings
EE commercial buildings
8
0
4
2
3
2
0
4
2
EE supply side
Total: 87
Single cycle to combined cycle
Cogeneration
Co-firing with biomass
Higher efficiency coal power
Higher efficiency oil power
Higher efficiency using waste heat
Power plant rehabilitation
Higher efficiency steam boiler
11
26
0
34
2
3
10
1
Forests
Total: 60
Afforestation
Mangroves
Reforestation
9
2
49
Fossil fuel switch
Total: 128
Coal to natural gas
Coal to oil
Lignite to natural gas
New natural gas plant
New natural gas plant using LNG
Oil to electricity
Oil to LPG
Oil to natural gas
14
0
0
56
9
2
1
46
Fugitive
Total: 41
Oil field flaring reduction
Oil and gas processing flaring
Natural gas pipelines
Non-hydrocarbon mining
Charcoal production
21
4
11
1
4

123
Geothermal
Total: 15
Geothermal electricity
Geothermal heating
13
2
HFCs
Total: 23
HFC23
HFC134a
19
4
Hydro
Total: 1578
Run of river
Existing dam
Higher efficiency hydro power
New dam
1078
104
1
395
Landfill gas
Total: 323
Landfill flaring
Landfill power
Combustion of MSW
Gasification of MSW
Biogas from MSW
Landfill aeration
Integrated solid waste management
Switch from fossil fuel to piped landfill gas
Landfill composting
107
151
28
3
0
1
3
1
29
Methane
avoidance
Total: 627
Manure
Domestic manure
Waste water
Industrial solid waste
Palm oil waste
Aerobic treatment of waste water
Composting
266
27
262
2
11
1
58
N2O
Total: 73
Adipic acid
Nitric acid
Caprolactam
4
66
3
PFCs+SF6
Total: 19
PFCs
SF6
6
13

124
Solar
Total: 80
Solar PV
Solar lamps
Solar PV water disinfection
Solar thermal power
Solar thermal
Solar water heating
Solar cooking
55
0
2
2
1
10
10
Tidal Tidal 1
Transport
Total: 33
Bus Rapid Transit
Motorbikes
Mode shift: Road to rail
Rail: regenerative braking
Metro: efficient operation
Scrapping old vehicles
Biodiesel for transport
Cable cars
12
4
4
3
1
0
8
1
Wind Wind 1214
Total 5872
125
appendix b
Essential CDM web-sites
CDM.unfccc.Int
On this site all UNFCCC CDM documents and information can be found.
www.cdmrulebook.org
The CDM Rulebook is an online database of the CDM rules. It has been developed by Baker & McKenzie, with funding from eight donor organisations, and is now freely available to the public.
www.acp-cd4cdm.org
On this website you can download all CDM publication produced under the ACPMEA project, this includes the 2009 and 2010 version of the Perspectives series, CDM Guidebooks, CDM updates, flyers. The Website also provides information on recent and upcoming global and regional events in which UNEP Risoe participates.
www.cd4cdm.org
On this site you can download all the CDM guidebooks made by UNEP Ri-soe: The CDM PPD Guidebook, the Guidebook to Finance CDM projects, A Primer of CDM Programme Activities, Implementing CDM Projects etc.
On this site you can also download the UNEP Risoe Perspectives Series:
2007 – Determining a Fair Price of Carbon 2008 – A Reformed CDM 2009 – NAMAs and the Carbon Market 2010 – Pathways for Implementing REDD+.
A series of Working Papers are also available plus the UNEP Risoe CDM experiences in a series of countries

126
www.cdmpipeline.org
From this site you can download the CDMPipeline and the JIPipeline spreadsheet containing all CDM/JI projects and a lot of tables/graphs analyzing the market development. The main graphs/table are show at the web-site, which is updated every month.
www.CDM-meth.org
This site gives you a description of all the technologies that are used in CDM projects and help you to find the approved CDM Methodologies available for different sectors. A discussion forum that allows practitioners’ exchange of experience on the practical application of methodologies for specific technologies – go to forums in the banner above or go to the dedi-cated forums directly from the methodology search results.
www.cdmbazaar.net
A site where sellers and buyers of CDM projects announce their needs to-gether with CDM Service Providers. The site is financed by the UNFCCC Secretariat and maintained by UNEP Risoe.
www.pointcarbon.com
At this site you can download of the newsletters: CDM & JI Monitor, Car-bon Market Europe, Carbon Market North America, Carbon Market Australia – New Zealand.
www.carbon-financeonline.com
At this site you can find news about the carbon market and the journals: Environmental Finance, and Carbon Finance.
www.gtz.de/en/themen/umwelt-infrastruktur/umweltpolitik/14317.htm
At this site you can subscribe to the monthly newsletter from Deutsche Gesellschaft für International Zusammenarbeit (GIZ).
127
www.jiqweb.org
At this site you can download the quarterly newsletter: Joint Implementa-tion Quarterly with Interesting article on both CDM and JI.
www.iisd.ca/email/climate-L.htm
Here you can subscribe the excellent web-server for information on Climate.
www.iges.or.jp/en/CDM/report_CDM.html
The Institute for Global Environmental Strategies (IGES) In Japan maintain several CDM databases on this site.
www.CDM-watch.org
CDM Watch is an initiative of international NGOs and was re-established in April 2009 to provide an independent perspective on CDM projects, methodologies and the work of the CDM Executive Board. The ultimate goal is to help ensure that the current CDM as well as a reformed mechanism post-2012 are effectively verified, and contribute to sustainable development in CDM host countries. Before every EB meeting CDM-Watch issues a news-letter comment on the agenda for the EB meeting.
www.cdmgoldstandard.org
The Gold Standard Foundation is a non-profit organization under Swiss law that operates a certification scheme for premium quality carbon credits. Using the Gold Standard the validation and verification of CDM and JI projects can show their Sustainable Development benefits.
www.climate-standards.org/projects
The Climate, Community and Biodiversity Alliance (CCBA) is a partnership of international NGOs and research institutes that operates the CCB Standards, which is similar to Gold Standard but only for forestry projects.

CDM Information and Guidebook
will give a comprehensive overview of the CDM, its
project cycle and related issues such as the linkage
with sustainable development goals, financing and
programmatic projects. The appendices contain a list of
existing types and sub-types of CDM projects and a list
of important and relevant web-sites.
The first two editions of this guidebook to the CDM
was produced to support the UNEP project “Capacity
Development for Clean Development Mechanism” im-
plemented by UNEP Risoe Centre on Energy, Climate
and Sustainable Development in Denmark and funded
by the Netherlands Ministry of Foreign Affairs. The
third edition is produced to support ACP-CD4CDM
project, which is part of the European Commission
Programme for Capacity Building related to Multilat-
eral Environmental Agreements (MEAs) in the African,
Caribbean and Pacific (ACP) Countries.
CDM Information and GuidebookThird edition
The ACP MEAs CDM Programme
Risø National LaboratoryRoskildeDenmark
CDM_omslag_03.indd 1 31/03/11 14.59