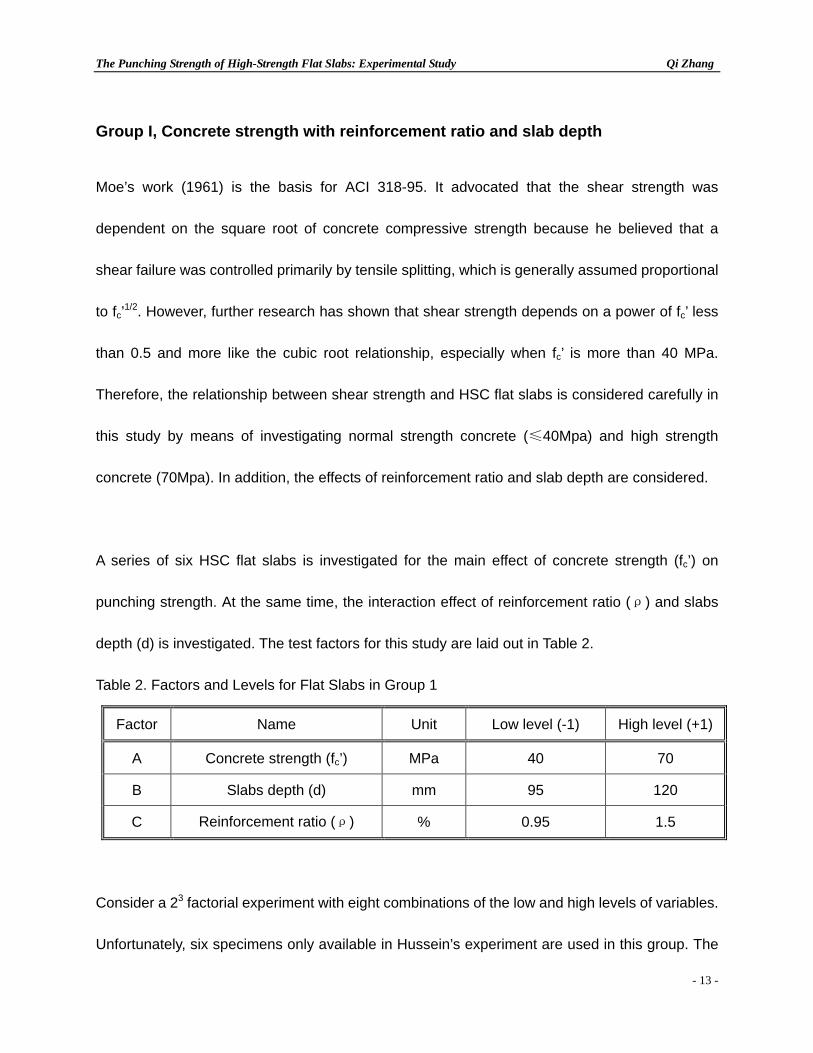
˘ˇˆ - engr.mun.caqzhang/papers/punching_strength.pdf · fcu cube strength of concrete fy yield...
TRANSCRIPT

�
������������� ������������� ����������������� �
���� � ������������
��� �!"#�
�
$���� �� �%��&�'(()�

The Punching Strength of High-Strength Flat Slabs: Experimental Study Qi Zhang
- 2 -
TABLE OF CONTENTS
Abstract 3
Notation 4
Introduction 5
Approaches of Prediction 7
Hussein’s Experimental Program and Rearrangement Consideration 10
Group I, Concrete strength with reinforcement ratio and slab depth 13
Group 2, Load area and slab depth 19
Group III, Reinforcement ratio and slab depth 23
Discussion and Recommendation 27
Conclusion 33
Reference 34

The Punching Strength of High-Strength Flat Slabs: Experimental Study Qi Zhang
- 3 -
The Punching Strength of High-Strength Flat Slabs: Experimental Study
Abstract
The paper reviews an experimental program consisting of 17 high-strength concrete slabs that
were conducted by Dr. A. Hussein and Dr. H. Marzouk. The test data from the experiment is
rearranged, analyzed by Design-Expert software, and divided into three groups. The three
groups are primarily concerned with the effects of four variables on the punching strength of
high-strength concrete slabs: the concrete strength, the reinforcement ratio, the slab depth and
the column size. The predictions of three approaches, ACI 318-95, BS8110 and Rankin’s
approach, are compared with the experimental results.
The experimental results indicated that shear strength depends on a power of the concrete
compressive strength, fc’, that is less than 0.5 and more like a cubic root relationship. The
assumption that the critical perimeter is at a distance 0.5d from the load area is reasonable, and
the reinforcement ratio has a considerable effect on the shear strength especially when the slab
depth is at a high level. A modified approach, modeled after the Rankin’s approach, is proposed
and verified by this experiment and another tests. A recommended experiment, a one-half
fraction of a 24 experiment combined with a face centered central composite response surface
design, would reveal the interaction among the variables and the punching strength. Therefore,
the proposed method should improve the understanding of the behavior of high-strength slabs.

The Punching Strength of High-Strength Flat Slabs: Experimental Study Qi Zhang
- 4 -
Notation
L slab span (= 2.5 a)
M moment per unit width
Mb bending moment of resistance
Mbal balanced moment of resistance
Pk characteristic punching resistance, calculated by different approaches
Pmod modified predicted punching capacity
Pu ultimate punching load
Pvf predicted flexural punching capacity
Pvs predicted shear punching capacity
a distance between supports of conventional slab specimen (=0.4L)
c length of column side
d average effective depth to tensile reinforcement
f'c cylinder strength of concrete
fcu cube strength of concrete
fy yield stress of reinforcement
h overall thickness of slab
kb ratio of applied load to internal bending moment at column periphery
kl ratio of applied load to ultimate moment of resistance at failure
kyl moment factor for overall tangential yield
rf reduction coefficient to allow for column shape
rs radius of conventional slab specimen
ry radius of yield zone
s side length of conventional slab specimens
p reinforcement ratio
u length of control perimeter used in punching calculations
vck basic characteristic shear stress

The Punching Strength of High-Strength Flat Slabs: Experimental Study Qi Zhang
- 5 -
Introduction
High-Strength concrete (HSC), concrete with the strength above 45 MPa, has been widely used
in the construction industry due to increasing requirements and economical consideration for
structures. Since HSC members not only have higher modulus of elasticity but also exhibit
different failure mechanism from the normal concrete, it is unsafe to directly extrapolate the
models and equations based on normal concrete to HSC members.
Punching in the vicinity of a column is a possible failure mode for reinforced concrete flat slabs.
The undesirable suddenness and catastrophic nature of punching failure are of concern to
structural engineers. In this respect, the use of high-strength concrete improves the punching
strength of HSC flat slabs and allows higher forces to be transferred.
However, there is no generally accepted rational treatment for the punching resistance of flat
slabs because of the complicated dependence of shear strength on their flexural behavior as well
as the fact that it is difficult to observe the internal inclined cracks in a slab. The design provisions
of punching strength in the two major building codes, the North American code and the European
code, are significantly different, since they are based on different empirical formulas. This
difference in design provisions leads to different predictions of the punching strength of the same
specimen. Thus, it is important to improve the understanding of the punching failure mechanisms

The Punching Strength of High-Strength Flat Slabs: Experimental Study Qi Zhang
- 6 -
and to establish a more reliable method for predicting the punching strength of HSC flat slabs.
This paper, based on the experimental program conducted by H. Marzouk and A. Hussein (1991),
discusses the effects on punching strength of HSC flat slabs by main variables including the
concrete strength, the reinforcement ratio, the slab thickness and the load area. It also presents
and compares three different approaches for predicting the punching strength. In addition, a
modified approach and a recommended experiment for the punching strength of HSC slab are
proposed. Concepts and methods of “Design of Experiment” are utilized in the whole paper.

The Punching Strength of High-Strength Flat Slabs: Experimental Study Qi Zhang
- 7 -
Approaches of Prediction
Many codes and researchers have presented different formulae for predicting punching shear
strength of slabs based on their understanding of punching behavior. Two typical approaches in
the building codes, ACI 318-95 and BS8110, are considered and compared to the approach
developed by Rankin and Long (1987).
Generally, punching strength is predicted by considering a nominal shear stress, a control
perimeter and an effective depth. The main differences of approaches depends on the assumed
location of the different the control perimeter, the concrete strength, the size effect and the
reinforcement ratio:
(1) Both the ACI code and the Rankin’s approach assume that the control perimeters is located
at a distance of 0.5 times the effective depth from the edge of load, while the BS8110 code
considers a larger control perimeter, 1.5d.
(2) In the ACI code and the Rankin’s approach, shear stress is expressed in term of square-root
relationship with concrete compressive strength, while the BS8110 code considers a cubic-root
proportion.
(3) Both the British code and the Rankin’s approach take reinforcement ratio and size effect into

The Punching Strength of High-Strength Flat Slabs: Experimental Study Qi Zhang
- 8 -
consideration by different modification factor, while the ACI code neglects these effects.
For the purpose of comparing different predictions of the available experimental test results,
safety factors have been removed from the equations of these three approaches, the limit of 40
MPa of the maximum useful cube strength has been ignored while applying BS8110 and the
cube strength in BS8110 has been assumed as fcu = fc’ / 0.8.
The equations of the three approaches are given below. The flexural strength is also considered
and calculated using the yield-line theory. The failure mode is determined by the Rankin’s
approach.
ACI 318-95
'332.0 cck fv =
)(4 dcu += for square loaded area
udvP ckk =
BS8110
433 /40025/10079.0 dfv cuck ⋅⋅⋅= ρ
)3(4 dcu += for square loaded area
udfudvP cuckk 2.1≤=
Rankin’s approach
This is a two-phase approach that classifies the punching failure as flexure and shear. First the

The Punching Strength of High-Strength Flat Slabs: Experimental Study Qi Zhang
- 9 -
shear punching strength and the flexural punching strength are calculated. Then, the results are
used to determine the failure mode. For example, the failure mode is the shear punching failure if
the punching shear strength is less than the flexural punching strength.
'4 100415.0 cck fv ⋅⋅= ρ
)(4 dcu += for square loaded area
udvP ckvs =
( )( ) bbalbfbylylvf MMMrKKKP ⋅⋅−−= //
Where,
( )172.0)/(8 −−⋅= casK yl
( ) 5.1/5.2ln/25 caKb ⋅=
( )( )'2 /59.01 cyyb ffdfM ⋅−= ρρ
2'333.0 dfM cbal =
If Pvs < Pvf, then the failure mode is punching shear failure and Pk = Pvs .
Otherwise, when Pvs > Pvf, then the failure mode is flexural punching failure and Pk = Pvf .

The Punching Strength of High-Strength Flat Slabs: Experimental Study Qi Zhang
- 10 -
Hussein’s Experimental Program and Rearrangement Consideration
The experimental program conducted by Marzouk and Hussein was based on a series of
practical configurations of a conventional slab-column system. Seventeen specimens were
subjected to concentric vertical loading. The specimens were simply supported along all four
edges to simulate the lines of contra flexure. Such specimen represented the region of negative
bending moment around an interior column. These specimens were divided into four groups in
order to investigate important parameters of flat slabs.
Full details of the test slabs are given in Table 1. Reinforcing bars consisted of Grade 400 steel
conforming to CSA standards with an actual yield strength of 490 MPa. The concrete mix was
designed to produce a 28-day strength of 70 Mpa.
The specimens were loaded monotonically through the center stub column. The load was
applied with a hydraulic actuator that has a maximum capacity of 670 KN. During the test, the
slabs were carefully inspected. Extensive measurements of the strains were used at key
locations on the flexural bar and surface of concrete slabs. Linear variable displacement
transducers (LVDT) were used to measure the deflection of the center of the slabs, and dial
gages were used to measure the vertical displacements at the slab corners.

The Punching Strength of High-Strength Flat Slabs: Experimental Study Qi Zhang
- 11 -
Table 1. Details of the tested specimens
Series
No.
Slab
No.
Compressive
strength, fc’
(MPa)
Bar Size
Bar
Spacing
(mm)
Column
size, c
(mm)
Slab
thickness
(mm)
Average
depth, d
(mm)
Steel ratio � %
NS1 42 M10 71.4 150 120 95 1.473
HS1 67 M10 214.3 150 120 95 0.491
HS2 70 M10 125.0 150 120 95 0.842
HS7 74 M10 88.2 150 120 95 1.193
HS3 69 M10 71.4 150 120 95 1.473
1
HS4 66 M15 93.7 150 120 90 2.370
NS2 30 M10 125.0 150 150 120 0.944
HS5 68 M10 125.0 150 150 95 0.640
HS6 70 M10 125.0 150 150 120 0.944
HS8 69 M15 150.0 150 150 120 1.111
HS9 74 M15 100.0 150 150 120 1.611
2
HS10 80 M15 71.4 150 150 120 2.333
HS11 70 M10 150.0 150 90 70 0.952
HS12 75 M10 93.8 150 90 70 1.524 3
HS13 68 M10 71.4 150 90 70 2.000
HS14 72 M10 71.4 220 120 95 1.473 4
HS15 71 M10 71.4 300 120 95 1.473
However, there are some difficulties when trying to utilize the arrangement for the specimens in
the Hussein’s experiment to investigate the punching strength of HSC flat slabs in a statistical
way. Hussein chose four series of specimens in his experiment with four variables, including the
concrete strength, the reinforcement ratio, the slab thickness and the load area. In the first two
series of 12 specimens, the trend of the punching strength of HSC flat slabs based on the main
variable, the reinforcement ratio, was found. The traditional approaches for predicting punching

The Punching Strength of High-Strength Flat Slabs: Experimental Study Qi Zhang
- 12 -
strength were compared based on this trend. In the last two series comprising only five
specimens, the variables of the slab depth and the load area were considered, respectively.
Depending on these series of specimens and the understanding of shear in HSC slabs, Hussein
analyzed the experimental data and investigated the behavior of HSC flat slabs, including
load-deflection characteristics, ductility and energy absorption characteristics, concrete strains,
steel strains, cracking and failure characteristics, and modes of failure. Unfortunately, the
interaction among the variables, the major concern in HSC flat slabs, was not demonstrated in
Hussein’s study due to the experimental arrangement. Furthermore, the problem that there were
no approaches to consistently predict the punching strength of HSC flat slabs was not solved.
Since a statistical experimental design, such as the 2-level factorial design and the general
factorial design, requires a consistent relationship among the variables, the arrangement in
Hussein’s experiment could not directly apply the statistical program to analyze the variables and
responses. Therefore, the previous experiment series are rearranged in the following sections, in
order to investigate the punching strength of HSC flat slabs and to consider the interaction
effects of variables.
The Punching Strength of High-Strength Flat Slabs: Experimental Study Qi Zhang
- 13 -
Group I, Concrete strength with reinforcement ratio and slab depth
Moe’s work (1961) is the basis for ACI 318-95. It advocated that the shear strength was
dependent on the square root of concrete compressive strength because he believed that a
shear failure was controlled primarily by tensile splitting, which is generally assumed proportional
to fc’1/2. However, further research has shown that shear strength depends on a power of fc’ less
than 0.5 and more like the cubic root relationship, especially when fc’ is more than 40 MPa.
Therefore, the relationship between shear strength and HSC flat slabs is considered carefully in
this study by means of investigating normal strength concrete (�40Mpa) and high strength
concrete (70Mpa). In addition, the effects of reinforcement ratio and slab depth are considered.
A series of six HSC flat slabs is investigated for the main effect of concrete strength (fc’) on
punching strength. At the same time, the interaction effect of reinforcement ratio (�) and slabs
depth (d) is investigated. The test factors for this study are laid out in Table 2.
Table 2. Factors and Levels for Flat Slabs in Group 1
Factor Name Unit Low level (-1) High level (+1)
A Concrete strength (fc’) MPa 40 70
B Slabs depth (d) mm 95 120
C Reinforcement ratio (�) % 0.95 1.5
Consider a 23 factorial experiment with eight combinations of the low and high levels of variables.
Unfortunately, six specimens only available in Hussein’s experiment are used in this group. The
The Punching Strength of High-Strength Flat Slabs: Experimental Study Qi Zhang
- 14 -
treatment combination in a form of sign table is shown with the experimental data in Table 3.
Table 3. Treatment combinations and Test results in Group 1
Pk / Pu Slab
No.
Combin-
ation
Factor A:
compressive
strength
(MPa)
Factor B:
Average
depth
(mm)
Factor C:
Steel
ratio � %
Ultimate
load Pu
(KN) ACI BS8110 Rankin
Failure
mode*
N/A (1) -1 -1 -1 N/A N/A N/A N/A N/A
HS2 a 1 -1 -1 249 1.04 1.08 1.15 Flexure
NS2 b -1 1 -1 396 0.60 0.74 0.73 Shear
HS6 ab 1 1 -1 489 0.74 080 0.91 Shear
NS1 c -1 -1 1 320 0.63 0.85 0.86 Shear
HS3 ac 1 -1 1 356 0.72 0.90 0.99 Shear
N/A bc -1 1 1 N/A N/A N/A N/A N/A
HS9 abc 1 1 1 543 0.68 0.87 0.96 Shear
*Failure mode is determined by Rankin approach
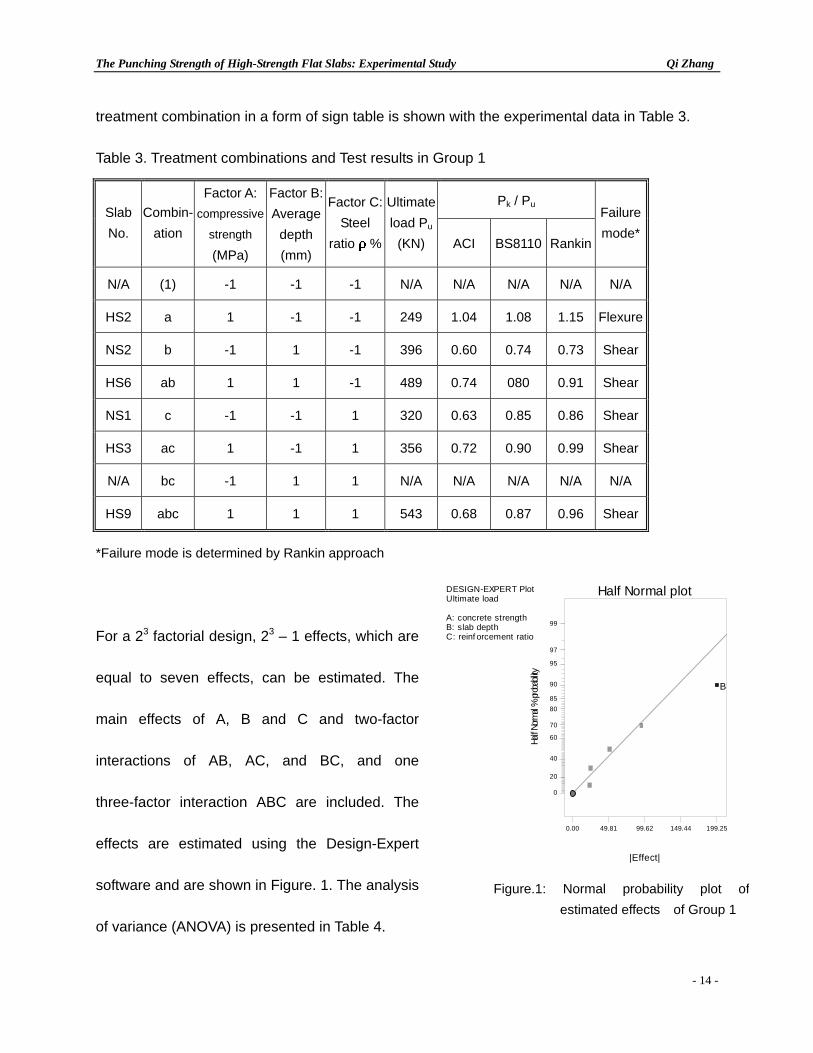
For a 23 factorial design, 23 – 1 effects, which are
equal to seven effects, can be estimated. The
main effects of A, B and C and two-factor
interactions of AB, AC, and BC, and one
three-factor interaction ABC are included. The
effects are estimated using the Design-Expert
software and are shown in Figure. 1. The analysis
of variance (ANOVA) is presented in Table 4.
DESIGN-EXPERT PlotUltimate load
A: concrete strengthB: slab depthC: reinf orcement ratio
Half Normal plot
Half
Norm
al %
prob
abilit
y
|Effect|
0.00 49.81 99.62 149.44 199.25
0
20
40
60
70
80
85
90
95
97
99
B
Figure.1: Normal probability plot of
estimated effects of Group 1
The Punching Strength of High-Strength Flat Slabs: Experimental Study Qi Zhang
- 15 -
Table 4: Analysis of variance table for Group 1
Source Sum of
Squares DF
Mean
Square
F
Value Prob > F Significant at 5%
Model 58452.58 4 14613.15 20.80904 0.1628 No
A 3502.083 1 3502.083 4.986947 0.2680 No
B 34225 1 34225 48.73621 0.0906 Yes
C 6480.25 1 6480.25 9.227839 0.2025 No
AB 812.25 1 812.25 1.156639 0.4769 No
Residual 702.25 1 702.25
Cor Total 59154.83 5
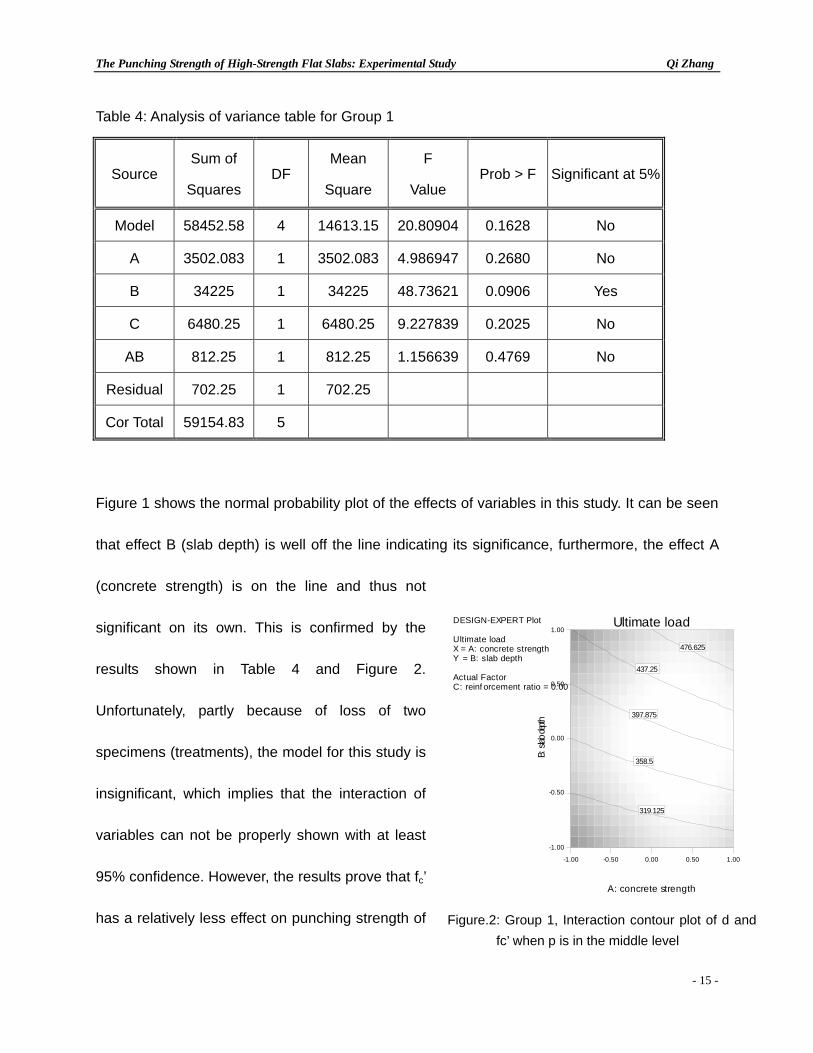
Figure 1 shows the normal probability plot of the effects of variables in this study. It can be seen
that effect B (slab depth) is well off the line indicating its significance, furthermore, the effect A
(concrete strength) is on the line and thus not
significant on its own. This is confirmed by the
results shown in Table 4 and Figure 2.
Unfortunately, partly because of loss of two
specimens (treatments), the model for this study is
insignificant, which implies that the interaction of
variables can not be properly shown with at least
95% confidence. However, the results prove that fc’
has a relatively less effect on punching strength of
DESIGN-EXPERT Plot
Ultimate loadX = A: concrete strengthY = B: slab depth
Actual FactorC: reinf orcement ratio = 0.00
Ultimate load
A: concrete strength
B: s
lab d
epth
-1.00 -0.50 0.00 0.50 1.00
-1.00
-0.50
0.00
0.50
1.00
319.125
358.5
397.875
437.25
476.625
Figure.2: Group 1, Interaction contour plot of d and
fc’ when p is in the middle level

The Punching Strength of High-Strength Flat Slabs: Experimental Study Qi Zhang
- 16 -
HSC flat slabs. In practice, since the punching strength of HSC flat slabs depends on a power of
fc’ less than 0.5, the significant effect of fc’ requires more difference of fc’ between low level and
high level. On the other hand, slab depth approximately has a square relationship with punching
strength of HSC flat slabs so that a small change of slab depth would have a considerable effect
on punching strength.
Other than analysis by the Design-Expert software, the comparison of the three approaches,
based on the relationship of punching strength and concrete strength, is also noteworthy and
shown in Figure3.1, Figure 3.2 and Figure 3.3. The principal variable was the concrete strength
in two series of slabs: NS2 and HS6, NS1 and HS3. All the specimens were punching shear
failure. The test data are summarized in Table 3. Figure 3 shows the graphs of ultimate loads
against concrete strength and sets the experimental results compared with the curves
determined by ACI 315-95, BS8110 and Rankin’s approach.
It is apparent from Figure 3 that the BS8110 assumption that punching strength is proportional to
the cube root of the concrete compressive strength can be seen to reasonable, especially when
the concrete strength is beyond the limit of 40 MPa of maximum useful cube strength in BS8110.
The ACI code, although overestimates the effect of concrete strength and neglects the effect of
reinforcement ratio, is safe for all concrete strength in this study, The Rankin’s approach could
not reflect the tendency of punching strength against concrete strength; however, it predicts the
punching resistance of slabs most close to the actual ultimate load.

The Punching Strength of High-Strength Flat Slabs: Experimental Study Qi Zhang
- 17 -
Figure 3.1: Group1 relationship of punching strength to concretecompression strength, determined by ACI 315-95
0
100
200
300
400
500
600
0 20 40 60 80 100
fc' (MPa)
Pu
(KN
)
Experiment data:NS2 and HS6ACI based on NS2and HS6Experiment data:NS1 and HS3ACI based on NS1and HS3
Figure 3.2: Group1 relationship of punching strength to concretecompression strength, determined by BS8110
0
100
200
300
400
500
600
0 20 40 60 80 100
fc' (MPa)
Pu
(KN
)
Experiment data:NS2 and HS6BS8110 based onNS2 and HS6Experiment data:NS1 and HS3BS8110 based onNS1 and HS3

The Punching Strength of High-Strength Flat Slabs: Experimental Study Qi Zhang
- 18 -
Figure 3.3: Group1 relationship of punching strength to concretecompression strength, determined by Rankin's approach
0
100
200
300
400
500
600
0 20 40 60 80 100
fc' (MPa)
Pu
(KN
)
Experiment data:NS2 and HS6Rankin based onNS2 and HS6Experiment data:NS1 and HS3Rankin based onNS1 and HS3

The Punching Strength of High-Strength Flat Slabs: Experimental Study Qi Zhang
- 19 -
Group 2, Load area and slab depth
Long and Bond (1967) have shown that the critical stress is on the neutral plane as there is no
beneficial influence of direct compression at this level. The vertical shear stress is also dispersed
before reaching the neutral plane and the critical section is therefore at some distance from the
column periphery. This dispersion is dependent on the ratios of the size of column to the slab
effective depth. Moe (1961) also recognized this dependence and assumed a linear change in
shear strength with c / d in his equation for predicting the shear strength of slabs. In the current
codes, this ratio has been taken into account by assuming a pseudo-critical section at one half
(ACI code) or one and a half (BS8110) of the slab effective depth from the column periphery. This
would seem reasonable because of the fact that the depth of the compression zone may well
approach one half of the slab effective depth in the shear mode of punching failure.
Since the inconsistencies expressing the critical section between ACI code and BS8110 code,
the actual relationship between punching strength and critical section is demonstrated in the
second group. In this group, consisting three series of eight specimens, the principal variable is
the critical section in terms of the variable of slab effective depth or column size. All the slabs
failed by punching and the detailed series are given in Table 5.

The Punching Strength of High-Strength Flat Slabs: Experimental Study Qi Zhang
- 20 -
Table 5. Group 2 test data
Pk / Pu Series
No.
Slab
No.
concrete
strength
(MPa)
column
size
(mm)
Slab
thickness
(mm)
Average
depth
(mm)
Critical
perimeter
4(c+d)
(mm)
Steel
ratio p%
Ultimate
load
Pu (KN) ACI BS8110 Rankin
Failure
mode
� HS3 69 150 120 95 980 1.473 356 0.72 0.90 0.99 shear
1 HS14 72 220 120 95 1260 1.473 498 0.68 0.76 0.93 shear
� HS15 71 300 120 95 1580 1.473 560 0.75 0.78 0.97 flexure
� HS12 75 150 90 70 880 1.524 258 0.69 0.85 0.95 shear
2 HS3 69 150 120 95 980 1.473 356 0.72 0.90 0.99 shear
� HS9 74 150 150 120 1080 1.611 543 0.68 0.87 0.96 shear
� HS13 68 150 90 70 880 2.000 267 0.63 0.87 0.94 shear
3 HS4 66 150 120 90 960 2.370 418 0.56 0.82 0.86 shear
� HS10 80 150 150 120 1080 2.333 645 0.60 0.85 0.92 shear
In the first series, the column size is changed from 150 mm to 300 mm while the effective depth
of slabs is fixed. The concrete compression strength is around 70 Mpa, and the level of
reinforcement ratio is the same as 1.473%. Figure 4.1 shows the test results as a graph of (Pu / d)
plotted against (c +d). If the relationship between the punching strength and critical perimeter
(c+d) is in accordance with the definition in ACI code, the experimental data should have similar
scatter along the curve determined by ACI code. On the other hand, they should have unequal
scatter along the curve determined by BS8110. Figure 4.1 proves this assumption. It could also
be seen that the line based on Rankin’s approach is closer to the test result, and the critical
section (c+d) is proportional to the corrected punching strength.

The Punching Strength of High-Strength Flat Slabs: Experimental Study Qi Zhang
- 21 -
Figure 4.1: Group2 relationship of punching strength tocritcial perimeter determined by different codes
0
1
2
3
4
5
6
7
8
9
10
700 1200 1700 2200
Critical perimeter (mm)
Pu/
d (K
N)
Rankin
Experiment data (HS3,HS14, HS15)
BS8110
ACI
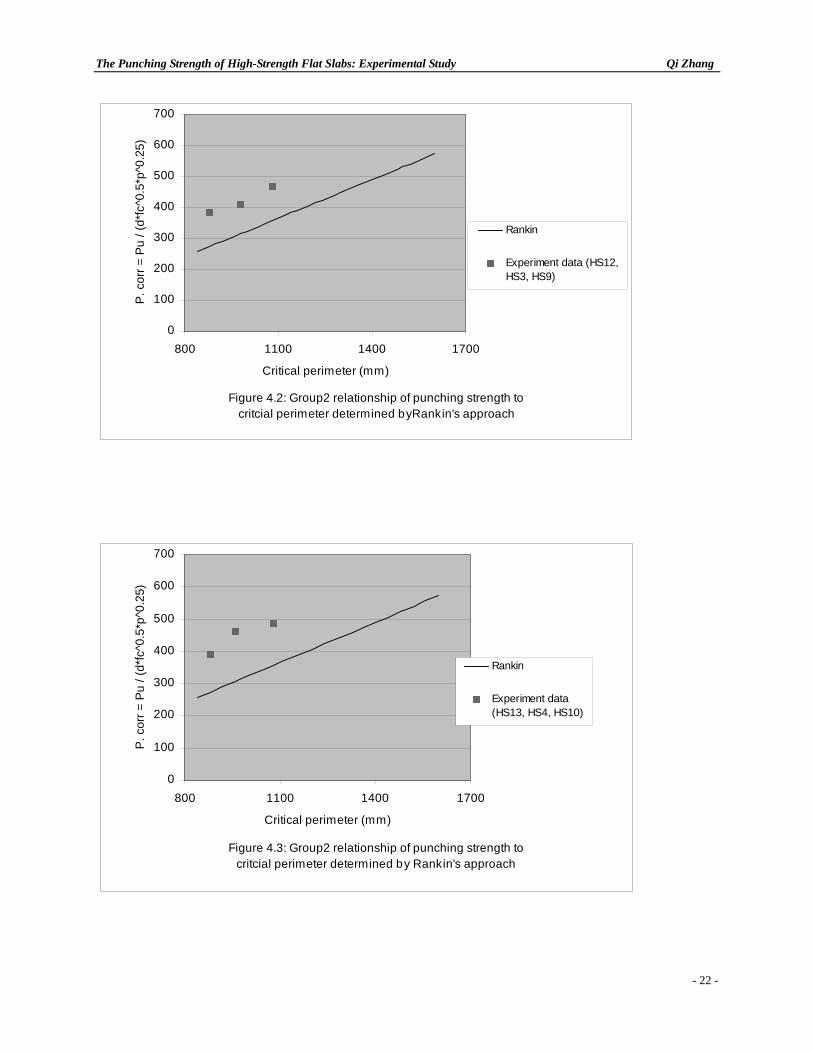
In order to verify the results of the first series of specimens, the second and third series are
investigated as the main variable is the slab effective depth. When compared with the prediction
of Rankin approach, Figure 4.2 and Figure 4.3 show the relationship between the critical section
(c+d) and punching loads, which are corrected for the small variations of the concrete
compression strength and the reinforcement ratio. The assumption is proved again.
The Punching Strength of High-Strength Flat Slabs: Experimental Study Qi Zhang
- 22 -
Figure 4.2: Group2 relationship of punching strength tocritcial perimeter determined byRankin's approach
0
100
200
300
400
500
600
700
800 1100 1400 1700
Critical perimeter (mm)
P. c
orr
= P
u / (
d*fc
^0.5
*p^0
.25)
Rankin
Experiment data (HS12,HS3, HS9)
Figure 4.3: Group2 relationship of punching strength tocritcial perimeter determined by Rankin's approach
0
100
200
300
400
500
600
700
800 1100 1400 1700
Critical perimeter (mm)
P. c
orr
= P
u / (
d*fc
^0.5
*p^0
.25)
Rankin
Experiment data(HS13, HS4, HS10)

The Punching Strength of High-Strength Flat Slabs: Experimental Study Qi Zhang
- 23 -
Group III, Reinforcement ratio and slab depth
Nine specimens with the main variables of the reinforcement ratio and the slab depth are
included in this group. The concrete compression strength is around 70 MPa, and the column
size is fixed at 150 mm. A two-numeric-factor factorial design is used in this group, and each
factor is set at three levels, which is shown in Table 6. The 3 X 3 experimental runs are given in
Table 7.
Table 6. Factors and Levels for Flat Slabs in Group 3
Factor Name Unit Low level Middle Level High level
A Slab effective depth (d) mm 70 95 120
B Reinforcement ratio (p) % 0.95 1.50 2.00
Table 7: Treatment combinations and test results in Group 3
Pk / Pu Slab No.
column size (mm)
Slab thickness
(mm)
Average depth (mm)
Steel ratio p%
Ultimate load Pu
(KN) ACI BS8110 Rankin
Failure mode
HS11 150 90 70 0.952 196 0.87 0.94 0.88 flexure
HS12 150 90 70 1.524 258 0.69 0.85 0.95 shear
HS13 150 90 70 2.000 267 0.63 0.87 0.94 shear
HS2 150 120 95 0.842 249 1.04 1.08 1.15 flexure
HS7 150 120 95 1.193 356 0.75 0.86 0.98 shear
HS4 150 120 90 2.370 418 0.56 0.82 0.86 shear
HS6 150 150 120 0.944 489 0.74 0.80 0.91 shear
HS9 150 150 120 1.611 543 0.68 0.87 0.96 shear
HS10 150 150 120 2.333 645 0.60 0.85 0.92 shear

The Punching Strength of High-Strength Flat Slabs: Experimental Study Qi Zhang
- 24 -
The procedure of ANOVA using the Design-Expert software is shown in the Table 8.
Table 8: Analysis of variance table for Group 3
Source Sum of
Squares DF
Mean
Square
F
Value Prob > F
Model 180281.16 3 60093.72 33.078 0.0010 significant
A (effect of d) 151633.78 1 151633.78 83.464 0.0003 significant
B (effect of p) 26221.05 1 26221.05 14.433 0.0126 significant
AB (interaction
effect of d and p 1737.44 1 1737.44 0.9563 0.3730
Residual 9083.73 5 1816.75
Cor Total 189364.89 8
The values of "Prob > F" less than 0.0500 indicate
that the model terms are significant. The effect of
the slab effective depth (d) and the effect of
reinforcement ratio (p) in this group are significant
for the punching strength of HSC flat slabs. Thus,
it is unacceptable to predict punching resistance
with ACI code in this group because the
reinforcement ratio is not taken into consideration
considered in the ACI code.
The interaction effect of d and is shown in Figure 5. In the first place, the punching strength is
DESIGN-EXPERT Plot
utimate load
X = A: slab thicknessY = B: reinf orcement ratio
Design Points
B- 0.950B+ 2.000
B: reinforcement ratioInteraction Graph
A: slab thickness
utim
ate
load
90.00 105.00 120.00 135.00 150.00
110.053
254.872
399.691
544.51
689.328
Figure.5: Group 3, Interaction graph of d and p

The Punching Strength of High-Strength Flat Slabs: Experimental Study Qi Zhang
- 25 -
higher with a larger depth. Furthermore, the increase of punching strength in the high level of is
slightly faster than that in the low level of as d increases. The punching strength in the high
level of is significantly higher than that in low level of as d is in the high level, although it has
no significant difference in the low level of d regardless of whether is at 0.95% or 2.0%.
Figure 6.1: Rank in punching strength against reinforcement ratio
0
50
100
150
200
250
300
0.0 0.5 1.0 1.5 2.0 2.5 3.0
Reinforcement ratio (%)
Pu
(KN
) Rankin punchingstrength
Experimentaldata (HS11,HS12 and HS13)
Figure 6.2 Rank in punching strength against reinforcement ratio
0
50
100
150
200
250
300
350
400
450
0.0 0.5 1.0 1.5 2.0 2.5 3.0
Reinforcement ratio (%)
Pu
(KN
)
Rankinpunchingstrength
Experimentaldata (HS2,HS7,HS4)

The Punching Strength of High-Strength Flat Slabs: Experimental Study Qi Zhang
- 26 -
Figure 6.3 Rank in punching strength against reinforcement ratio
0
100
200
300
400
500
600
700
0.0 0.5 1.0 1.5 2.0 2.5 3.0
Reinforcement ratio (%)
Pu
(KN
)
Rankinpunchingstrength
Experimentaldata (HS6, HS9and HS10)
This interaction effect is reasonable in practice. In this group, only HS2 and HS11 failed in the
mode of punching flexure with the relatively lower level of and d. Accompanied with the
increase of and d, the failure mode of slabs is transformed to punching shear failure. In addition,
dowel force, developed at the apex of the inclined crack crossing or extending along the slab
reinforcement, is significantly increased in this condition. Kinnunen (1963) concluded that dowel
forces carry about 30 percent of the total shear. Therefore, the reinforcement ratio would have a
considerable effect on the punching strength. Rankin approach shows the effect of as depicted
in Figure 6.1, Figure 6.2 and Figure 6.3 and predicts accurately the punching strength compared
with the ACI code and BS8110 code as shown in Table 7.
The Punching Strength of High-Strength Flat Slabs: Experimental Study Qi Zhang
- 27 -
Discussion and Recommendation
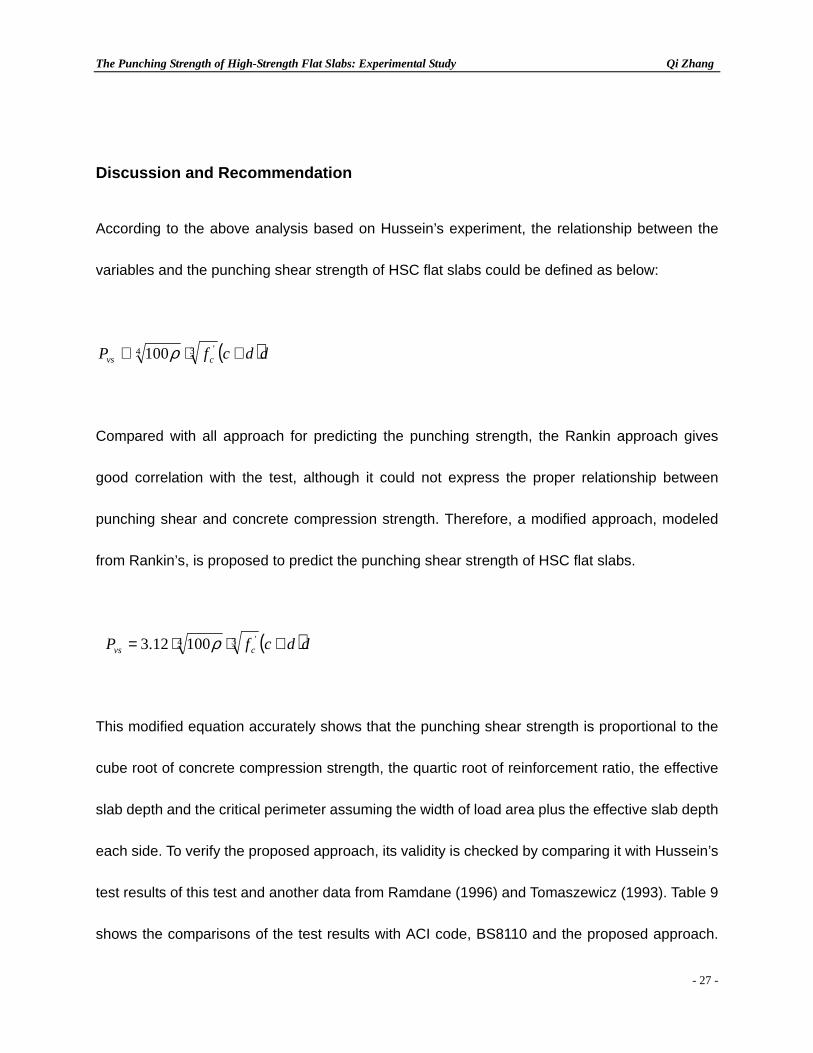
According to the above analysis based on Hussein’s experiment, the relationship between the
variables and the punching shear strength of HSC flat slabs could be defined as below:
( )ddcfP cvs +⋅∝ 3 '4 100ρ
Compared with all approach for predicting the punching strength, the Rankin approach gives
good correlation with the test, although it could not express the proper relationship between
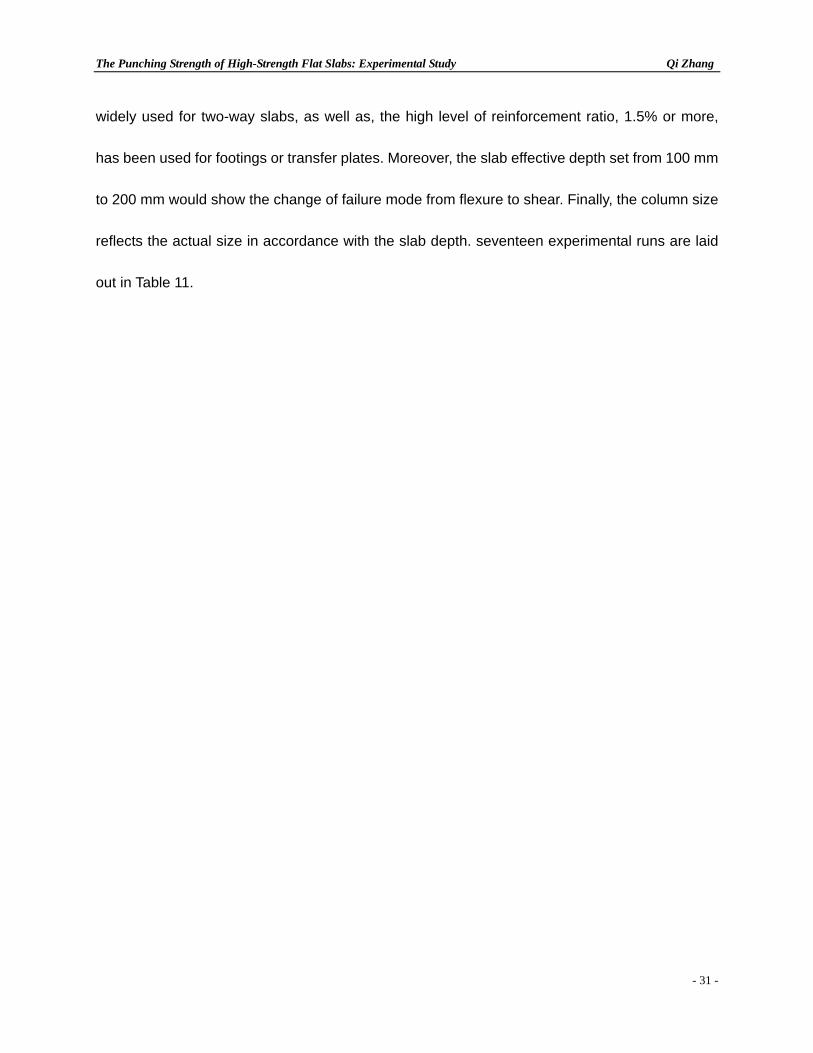
punching shear and concrete compression strength. Therefore, a modified approach, modeled
from Rankin’s, is proposed to predict the punching shear strength of HSC flat slabs.
( )ddcfP cvs +⋅⋅= 3 '4 10012.3 ρ
This modified equation accurately shows that the punching shear strength is proportional to the
cube root of concrete compression strength, the quartic root of reinforcement ratio, the effective
slab depth and the critical perimeter assuming the width of load area plus the effective slab depth
each side. To verify the proposed approach, its validity is checked by comparing it with Hussein’s
test results of this test and another data from Ramdane (1996) and Tomaszewicz (1993). Table 9
shows the comparisons of the test results with ACI code, BS8110 and the proposed approach.

The Punching Strength of High-Strength Flat Slabs: Experimental Study Qi Zhang
- 28 -
The mean values of (Pk / Pu) are 0.99 and the coefficient of variation is 9%. This coefficient of
variation corresponds to an improvement of approximately 37% over the next coefficient of
variation (14%) given by BS8110. Therefore, the adoption of this proposed approach for
predicting the punching strength of HSC flat slabs would provide a more accurate prediction.
Furthermore, it could efficiently use the reinforcement and the concrete.
Table 9: Comparison of experimental and predicted punching strength
Pk / Pu Series No. Slab No.
Compressive
strength
(MPa)
Slab
effective
length,a
(mm)
column
size
(mm)
Averag
e depth
(mm)
Steel
ratio �
%
Ultimate
load
(KN)
Pmod
Modify ACI BS8110
NS1 42 1500 150 95 1.473 320 286 0.89 0.63 0.85
HS1 67 1500 150 95 0.491 178 175 0.98 1.42 1.24
HS2 70 1500 150 95 0.842 249 286 1.15 1.04 1.08
HS7 74 1500 150 95 1.193 356 328 0.92 0.75 0.86
HS3 69 1500 150 95 1.473 356 338 0.95 0.72 0.90
HS4 66 1500 150 90 2.370 418 348 0.83 0.56 0.82
NS2 30 1500 150 120 0.944 396 319 0.80 0.60 0.74
HS5 68 1500 150 120 0.640 365 356 0.98 0.97 0.93
HS6 70 1500 150 120 0.944 489 422 0.86 0.74 0.80
HS8 69 1500 150 120 1.111 436 438 1.00 0.82 0.94
HS9 74 1500 150 120 1.611 543 492 0.91 0.68 0.87
HS10 80 1500 150 120 2.333 645 554 0.86 0.60 0.85
HA (1991)
HS11 70 1500 150 70 0.952 196 173 0.88 0.87 0.94

The Punching Strength of High-Strength Flat Slabs: Experimental Study Qi Zhang
- 29 -
HS12 75 1500 150 70 1.524 258 232 0.90 0.69 0.85
HS13 68 1500 150 70 2.000 267 240 0.90 0.63 0.87
HS14 72 1500 220 95 1.473 498 440 0.88 0.68 0.76
HS15 71 1500 300 95 1.473 560 544 0.97 0.75 0.78
slab5 54.4 1372 150 100 0.580 190 194 1.02 1.29 1.23
slab12 60.4 1372 150 100 1.280 319 335 1.05 0.81 0.99
slab15 68.4 1372 150 100 1.280 276 349 1.26 1.00 1.19
slab16 99.2 1372 150 100 1.280 362 395 1.09 0.91 1.03
slab22 84.2 1372 150 100 1.280 405 374 0.92 0.75 0.87
RK (1996)
slab23 56.4 1372 150 100 0.870 341 277 0.81 0.73 0.80
nd65-1-1 64.3 2500 200 290 1.420 2050 1995 0.97 0.74 0.86
nd95-1-1 83.7 2500 200 290 1.420 2250 2178 0.97 0.77 0.86
nd95-1-3 89.9 2500 200 290 2.430 2400 2551 1.06 0.75 0.98
nd115-1-1 112 2500 200 290 1.420 2450 2400 0.98 0.82 0.87
nd65-2-1 70.2 2200 150 210 1.660 1200 1136 0.95 0.70 0.91
nd95-2-1 88.2 2200 150 210 1.660 1100 1226 1.11 0.86 1.07
nd95-2-3 89.5 2200 150 210 2.490 1250 1364 1.09 0.76 1.09
nd115-2-1 119 2200 150 210 1.660 1400 1355 0.97 0.78 0.93
nd115-2-3 108.1 2200 150 210 2.490 1550 1452 0.94 0.67 0.93
TA (1993)
nd95-3-1 85.1 1100 100 95 1.720 330 300 0.91 0.69 0.97
Mean 0.992 0.794 0.93
Coefficient of variation 0.09 0.346 0.14
The interaction of reinforcement ratio and slab depth was revealed in the Group 3. It is
reasonably convincing that more interaction of variables could be discovered. Then, the

The Punching Strength of High-Strength Flat Slabs: Experimental Study Qi Zhang
- 30 -
punching behavior of slabs would be fully understood in the range of specified level, if this
experiment had been designed on the statistical basis and in accordance with the methods of
design of experiment. With the consideration of reducing the number of experimental runs and
possible quadratic or curvature effects, a one half fraction of a 24 experiment combined with a
face centered central composite response surface design could be used to investigate the
punching strength of HSC flat slabs. Half of a 24 factorial experiment requires only eight runs and
the central composite design requires another eight axial and one center points. Thus, 17
(2K+2K+1) runs, which is the same as the number of specimens in the Hussein’s experiment, are
required to fit a second order model without losing too much information; hence, it would
estimate the main effects and two-factor interaction effects efficiently. The factors and their
ranges of interest are shown in Table 10,
Table 10. Factors and Levels for the recommended experiment
Factor Name Unit Low level (-1) Mid level (0) High level (+1)
A Concrete strength (fc’) MPa 40 60 80
B Reinforcement ratio (p) % 0.5 1.0 1.5
C Slab effective depth (d) mm 100 150 200
D Column size (d) mm 150 200 250
Each factor would be set at three levels for a face centered response surface design. In the first
place, the range of the concrete strength is selected between 40 Mpa and 80 Mpa to investigate
the effect of the high-concrete strength. Secondly, reinforcement ratio equal to 0.5% has been
The Punching Strength of High-Strength Flat Slabs: Experimental Study Qi Zhang
- 31 -
widely used for two-way slabs, as well as, the high level of reinforcement ratio, 1.5% or more,
has been used for footings or transfer plates. Moreover, the slab effective depth set from 100 mm
to 200 mm would show the change of failure mode from flexure to shear. Finally, the column size
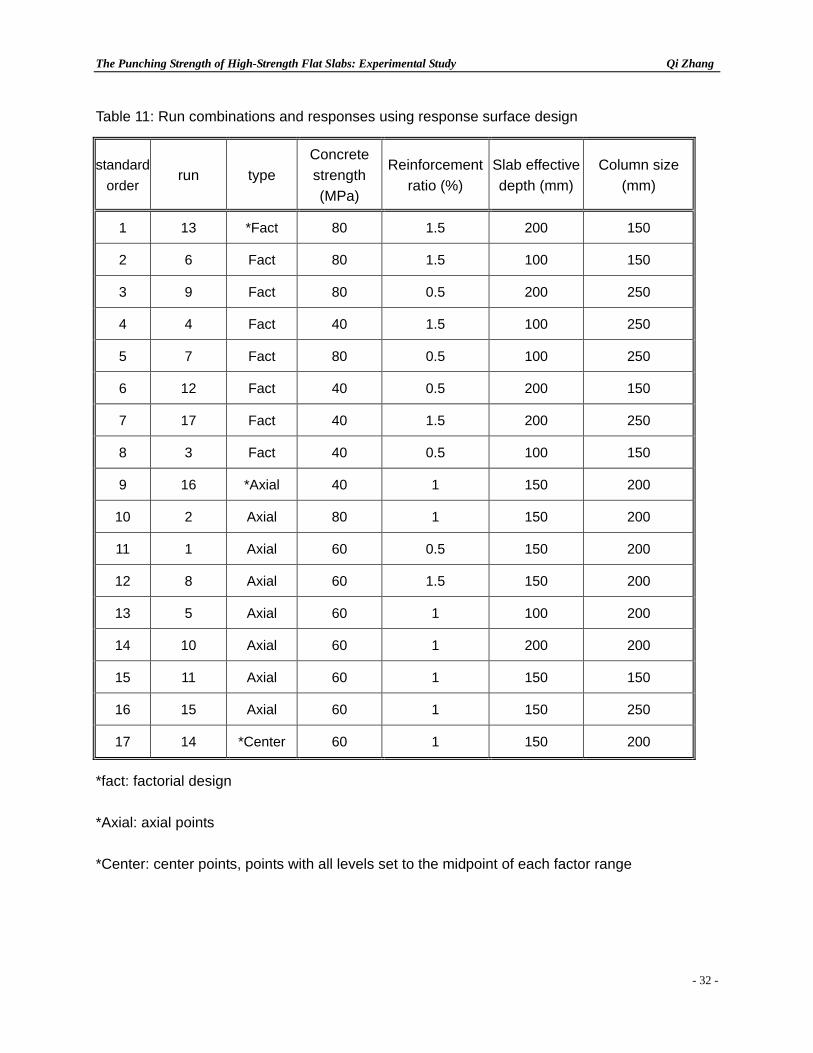
reflects the actual size in accordance with the slab depth. seventeen experimental runs are laid
out in Table 11.
The Punching Strength of High-Strength Flat Slabs: Experimental Study Qi Zhang
- 32 -
Table 11: Run combinations and responses using response surface design
standard
order run type
Concrete strength (MPa)
Reinforcement ratio (%)
Slab effective depth (mm)
Column size (mm)
1 13 *Fact 80 1.5 200 150
2 6 Fact 80 1.5 100 150
3 9 Fact 80 0.5 200 250
4 4 Fact 40 1.5 100 250
5 7 Fact 80 0.5 100 250
6 12 Fact 40 0.5 200 150
7 17 Fact 40 1.5 200 250
8 3 Fact 40 0.5 100 150
9 16 *Axial 40 1 150 200
10 2 Axial 80 1 150 200
11 1 Axial 60 0.5 150 200
12 8 Axial 60 1.5 150 200
13 5 Axial 60 1 100 200
14 10 Axial 60 1 200 200
15 11 Axial 60 1 150 150
16 15 Axial 60 1 150 250
17 14 *Center 60 1 150 200
*fact: factorial design
*Axial: axial points
*Center: center points, points with all levels set to the midpoint of each factor range

The Punching Strength of High-Strength Flat Slabs: Experimental Study Qi Zhang
- 33 -
Conclusion
1. The interaction among the variables, the major concern in HSC flat slabs, was not
demonstrated in Hussein’s study due to level choice of variables.
2. Shear strength depends on a power of fc’ less than 0.5 and more like the cube root
relationship. ACI code overestimates the effects of concrete compressive strength on the
punching resistance of HSC slabs.
3. The relationship between the punching strength and critical perimeter (c+d) is in accordance
with the definition in ACI code.
4. Dowel force developed along the slab reinforcement has a considerable influence on the
shear strength of HSC slab. ACI code is inconsistent with the ultimate punching load partly
because it neglects the effect of reinforcement.
5. The Rankin approach gives good correlation with the test. However, it overestimates the
effect of concrete compressive strength on the punching resistance of HSC slabs.
6. A proposed approach, based on the Rankin’s, is proposed
( )ddcfP cvs +⋅⋅= 3 '4 10012.3 ρ
7. A recommended experiment, a one half fraction of a 24 experiment combined with a face
centered central composite response surface design, could be used to investigate the
punching strength of HSC flat slabs.
The Punching Strength of High-Strength Flat Slabs: Experimental Study Qi Zhang
- 34 -
Reference
American Concrete Institute (ACI), (1995) “Building code requirements for reinforced concrete
and reinforced concrete and commentary.” ACI 318-95/ACI 318R-95, Detroit.
British Standards Institution (BS8110), (1985) “Code of practice for design and construction.”
British Standard Institution, Part 1, London.
Rankin, G. I. B. “Predicting the punching strength of conventional slab-column specimens.” Proc.
Instn Civ. Engrs, Part1, 82, April, 1987, 327-346.
Kinnunen, S., “Punching of concrete slabs with two-way reinforcement with special reference to
dowel effect and deviation of reinforcement from polar symmetry,” Transactions, No. 198, 1963,
Royal Institute of Technology, Stockholm, Sweden.
Long A. E. and Bond D. “Punching failure of reinforced concrete slabs.” Proc. Inst Civ. Engrs, 37,
1967, 109-135.
Lye L. M., “Some applications of statistical design of experiment methodology in civil
engineering,” Annual conference of the Canadian Society for Civil Engineering, Moncton, June
2003.
Marzouk. H and Hussein A., “Experimental Investigation on the Behavior of High-Strength
Concrete Slabs,” ACI Structural Journal, V.88, No. 6, Nov-Dec 1991, pp 701-713.
Moe, J., “Shearing strength of reinforced concrete slabs and footings under concentrated loads,”
Development Department Bulletin D47, Portland Cement Association, April, 1961, 130pp.
Ramdane, K. E., “Punching shear of high performance concrete slabs.” 4th International
Symposium on Utilization of High-strength / High-performance concrete. Paris, 1996,
pp1015-1026
Tomaszewicz, A. “High-strength concrete SP2 – plate and shells.” Report 2.3, Punching shear
Capacity of Reinforced Concrete Slabs. Report No. STF70A93082, SINTEF, Trondheim, 1993.