) enviado mz.docx) - braskem - relações com investidores accounts receivable 6 1,563,587 1,077,492...
TRANSCRIPT
Braskem S.A. Quarterly Information (ITR) at September 30, 2011 and Report on the Review of Quarterly Information

Auditors’ Report on the Review of Quarterly Information To the Board of Directors and Shareholders Braskem S.A. Introduction We have reviewed the accompanying parent company and consolidated interim accounting information of Braskem S.A., included in the Quarterly Information - ITR Form for the quarter ended September 30, 2011, comprising the balance sheet as of September 30, 2011 and the statements of operations and comprehensive income (loss) for the three and nine-month periods then ended, and the statements of changes in equity and cash flows for the nine-month period then ended, and a summary of significant accounting policies and other explanatory information. Management is responsible for the preparation of the parent company interim accounting information in accordance with the accounting standard CPC 21 - Interim Financial Reporting and of the consolidated interim accounting information in accordance with accounting standard CPC 21 and International Accounting Standard 34 - Interim Financial Reporting issued by the International Accounting Standards Board (IASB), as well as for the presentation of this information in accordance with the standards issued by the Brazilian Securities Commission , applicable to the preparation of the Quarterly Information. Our responsibility is to express a conclusion on this interim accounting information based on our review. Scope of review We conducted our review in accordance with Brazilian and International Standards on Reviews of Interim Financial Information (NBC TR 2410 – Review of Interim Financial Information Performed by the Independent Auditor of the Entity and ISRE 2410 – Review of Interim Financial Information Performed by the Independent Auditor of the Entity, respectively). A review of interim information consists of making inquiries, primarily of persons responsible for financial and accounting matters, and applying analytical and other review procedures. A review is substantially less in scope than an audit conducted in accordance with Brazilian and International Standards on Auditing and consequently did not enable us to obtain assurance that we would become aware of all significant matters that might be identified in an audit. Accordingly, we do not express an audit opinion.
Conclusion on the parent company interim information Based on our review, nothing has come to our attention that causes us to believe that the accompanying parent company interim accounting information included in the quarterly information referred to above has not been prepared, in all material respects, in accordance with CPC 21 applicable to the preparation of the Quarterly Information - ITR, and presented in accordance with the standards issued by the Brazilian Securities Commission. Conclusion on the consolidated interim information Based on our review, nothing has come to our attention that causes us to believe that the accompanying consolidated interim accounting information included in the quarterly information referred to above has not been prepared, in all material respects, in accordance with CPC 21 and IAS 34 applicable to the preparation of the Quarterly Information - ITR, and presented in accordance with the standards issued by the Brazilian Securities Commission. Other matters Interim statements of value added We have also reviewed the parent company and consolidated interim statements of value added for the nine-month period ended September 30, 2011, which are required to be presented in accordance with standards issued by the Brazilian Securities Commission applicable to the preparation of Quarterly Information - ITR and are considered supplementary information under IFRS, which does not require the presentation of the statement of value added. These statements have been submitted to the same review procedures described above and, based on our review, nothing has come to our attention that causes us to believe that they have not been properly prepared, in all material respects, in relation to the parent company and consolidated interim accounting information taken as a whole. Salvador, November 9, 2011. PricewaterhouseCoopers Auditores Independentes CRC 2SP000160/O-5 "F" BA Fábio Cajazeira Mendes Contador CRC 1SP196825/O-0 "S" BA

Braskem S.A. Balance sheet All amounts in R$ thousands
1
Assets Note September/2011 December/2010 September/2011 December/2010
Current assets
Cash and cash equivalents 4 1,512,425 2,339,060 3,253,959 2,624,270
Financial investments 5 185,392 236,319 186,645 236,319
Trade accounts receivable 6 1,563,587 1,077,492 2,544,199 1,894,648
Inventories 7 2,028,709 1,789,505 3,447,422 3,015,657
Taxes recoverable 9 833,336 400,969 1,184,384 698,879
Dividends and interest on capital 8,266 10,895 - -
Prepaid expenses 2,890 29,690 10,742 41,620
Other receivables 32 173,685 151,410 360,507 268,905
6,308,290 6,035,340 10,987,858 8,780,298
Non-current assets
Financial investments 5 30,793 28,706 30,793 28,706
Trade accounts receivable 6 51,278 59,026 53,606 62,303
Taxes recoverable 9 843,388 1,096,497 1,254,749 1,444,401
Deferred income tax and social contribution 19 (b) 346,212 361,299 1,112,131 1,136,685
Judicial deposits 10 173,584 227,888 201,402 250,195
Related parties 8 1,799,399 2,408,371 57,020 53,742
Other receivables 32 225,548 95,780 262,754 107,432
Investments in subsidiaries and jointly-controlled subsidiaries 11 7,896,947 6,549,402 - -
Investments in associates 11 28,415 157,910 28,415 160,790
Other investments 6,575 6,575 9,018 7,485
Property, plant and equipment 12 11,334,022 11,100,184 19,886,110 19,366,272
Intangible assets 13 2,255,761 2,280,111 3,033,806 3,079,182
24,991,922 24,371,749 25,929,804 25,697,193
Total assets 31,300,212 30,407,089 36,917,662 34,477,491
Parent company Consolidated

Braskem S.A. Balance sheet All amounts in R$ thousands Continued
2
Liabilities and equity Note September/2011 December/2010 September/2011 December/2010
Current liabilities
Trade payables 5,104,694 4,462,552 7,059,949 5,201,162
Borrowings 15 1,782,829 1,212,975 1,399,317 1,206,444
Debentures 16 - 517,741 - 517,741
Hedge operations 17 64,962 27,618 71,639 50,124
Salaries and social charges 166,702 252,694 289,549 360,368
Taxes payable 18 428,883 235,339 586,275 390,062
Dividends and interest on capital 1,614 416,648 4,868 419,981
Advances from customers 18,544 44,587 24,834 50,344
Sundry provisions 20 16,139 26,036 21,903 32,602
Other payables 14 53,179 125,935 139,324 233,322
Related parties 189,460 64,517 - -
7,827,006 7,386,642 9,597,658 8,462,150
Non-current liabilities
Borrowings 15 10,285,594 9,309,704 12,811,342 11,004,301
Debentures 16 - 18,518 -
Hedge operations 17 14,025 12,526 14,025 34,433
Taxes payable 18 1,521,892 1,449,704 1,600,501 1,583,569
Related parties 8 273,921 83,739 68,708 31,386
Long-term incentives 21 15,646 14,442 15,646 14,442
Deferred income tax and social contribution 19 (b) 799,745 1,238,340 1,800,953 2,200,538
Private pension plans 22 107,906 109,894 108,756 123,517
Provision for losses on subsidiaries 91,274 937 - -
Advances from customers 33 46,360 185,440
Sundry provisions 20 90,430 124,495 349,895 362,265
Other payables 14 240,409 237,567 270,971 252,604
13,487,202 12,581,348 17,244,755 15,607,055
Equity 24
Capital 8,043,222 8,043,222 8,043,222 8,043,222
Capital reserves 845,998 845,998 845,998 845,998
Revenue reserves 1,088,561 1,338,908 1,088,561 1,338,908
Other comprehensive income 326,731 221,350 326,731 221,350
Treasury shares (11,325) (10,379) (60,217) (59,271)
Accumulated deficit (307,183) - (307,183) -
Total attributable to the shareholders of the Company 9,986,004 10,439,099 9,937,112 10,390,207
Non-controlling interest - 138,137 18,079
9,986,004 10,439,099 10,075,249 10,408,286
Total liabilities and equity 31,300,212 30,407,089 36,917,662 34,477,491
Parent company Consolidated
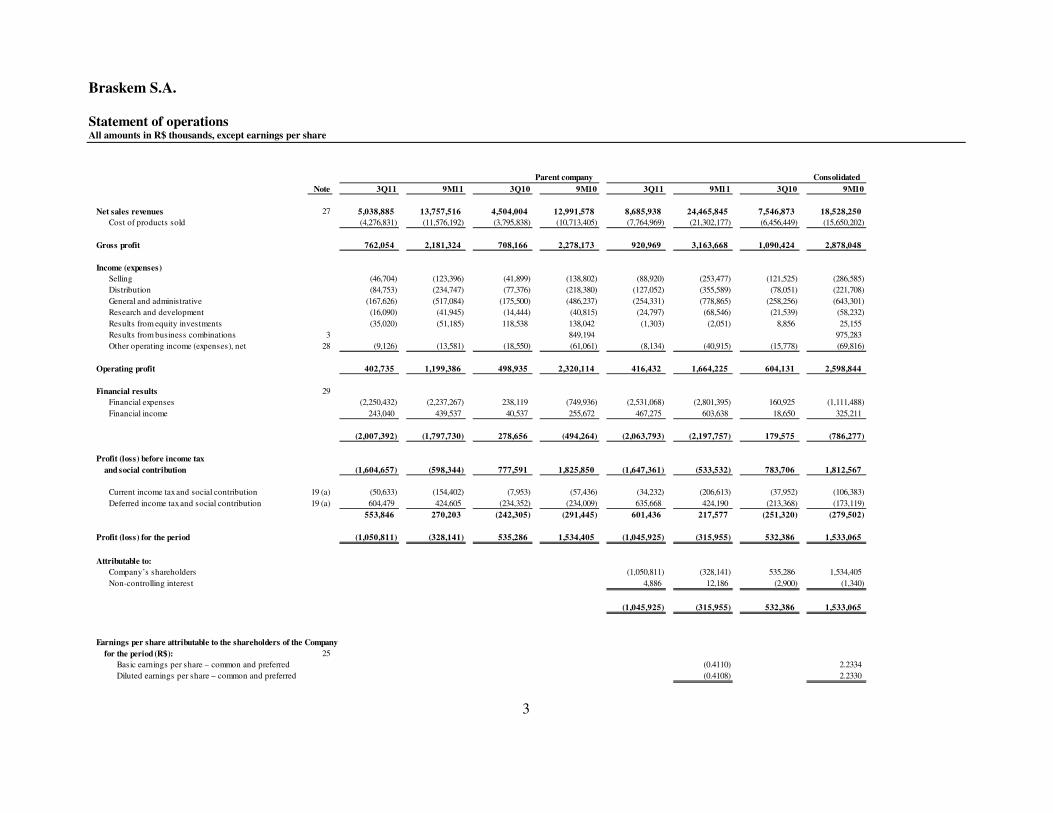
Braskem S.A. Statement of operations All amounts in R$ thousands, except earnings per share
3
Note 3Q11 9M11 3Q10 9M10 3Q11 9M11 3Q10 9M10
Net sales revenues 27 5,038,885 13,757,516 4,504,004 12,991,578 8,685,938 24,465,845 7,546,873 18,528,250
Cost of products sold (4,276,831) (11,576,192) (3,795,838) (10,713,405) (7,764,969) (21,302,177) (6,456,449) (15,650,202)
Gross profit 762,054 2,181,324 708,166 2,278,173 920,969 3,163,668 1,090,424 2,878,048
Income (expenses)
Selling (46,704) (123,396) (41,899) (138,802) (88,920) (253,477) (121,525) (286,585)
Distribution (84,753) (234,747) (77,376) (218,380) (127,052) (355,589) (78,051) (221,708)
General and administrative (167,626) (517,084) (175,500) (486,237) (254,331) (778,865) (258,256) (643,301)
Research and development (16,090) (41,945) (14,444) (40,815) (24,797) (68,546) (21,539) (58,232)
Results from equity investments (35,020) (51,185) 118,538 138,042 (1,303) (2,051) 8,856 25,155
Results from business combinations 3 - - 849,194 - - 975,283
Other operating income (expenses), net 28 (9,126) (13,581) (18,550) (61,061) (8,134) (40,915) (15,778) (69,816)
Operating profit 402,735 1,199,386 498,935 2,320,114 416,432 1,664,225 604,131 2,598,844
Financial results 29
Financial expenses (2,250,432) (2,237,267) 238,119 (749,936) (2,531,068) (2,801,395) 160,925 (1,111,488)
Financial income 243,040 439,537 40,537 255,672 467,275 603,638 18,650 325,211
(2,007,392) (1,797,730) 278,656 (494,264) (2,063,793) (2,197,757) 179,575 (786,277)
Profit (loss) before income tax
and social contribution (1,604,657) (598,344) 777,591 1,825,850 (1,647,361) (533,532) 783,706 1,812,567
Current income tax and social contribution 19 (a) (50,633) (154,402) (7,953) (57,436) (34,232) (206,613) (37,952) (106,383)
Deferred income tax and social contribution 19 (a) 604,479 424,605 (234,352) (234,009) 635,668 424,190 (213,368) (173,119)
553,846 270,203 (242,305) (291,445) 601,436 217,577 (251,320) (279,502)
Profit (loss) for the period (1,050,811) (328,141) 535,286 1,534,405 (1,045,925) (315,955) 532,386 1,533,065
Attributable to:
Company’s shareholders - (1,050,811) (328,141) 535,286 1,534,405
Non-controlling interest - - - 4,886 12,186 (2,900) (1,340)
(1,045,925) (315,955) 532,386 1,533,065
-
Earnings per share attributable to the shareholders of the Company
for the period (R$): 25
Basic earnings per share – common and preferred (0.4110) 2.2334
Diluted earnings per share – common and preferred (0.4108) 2.2330
Parent company Consolidated
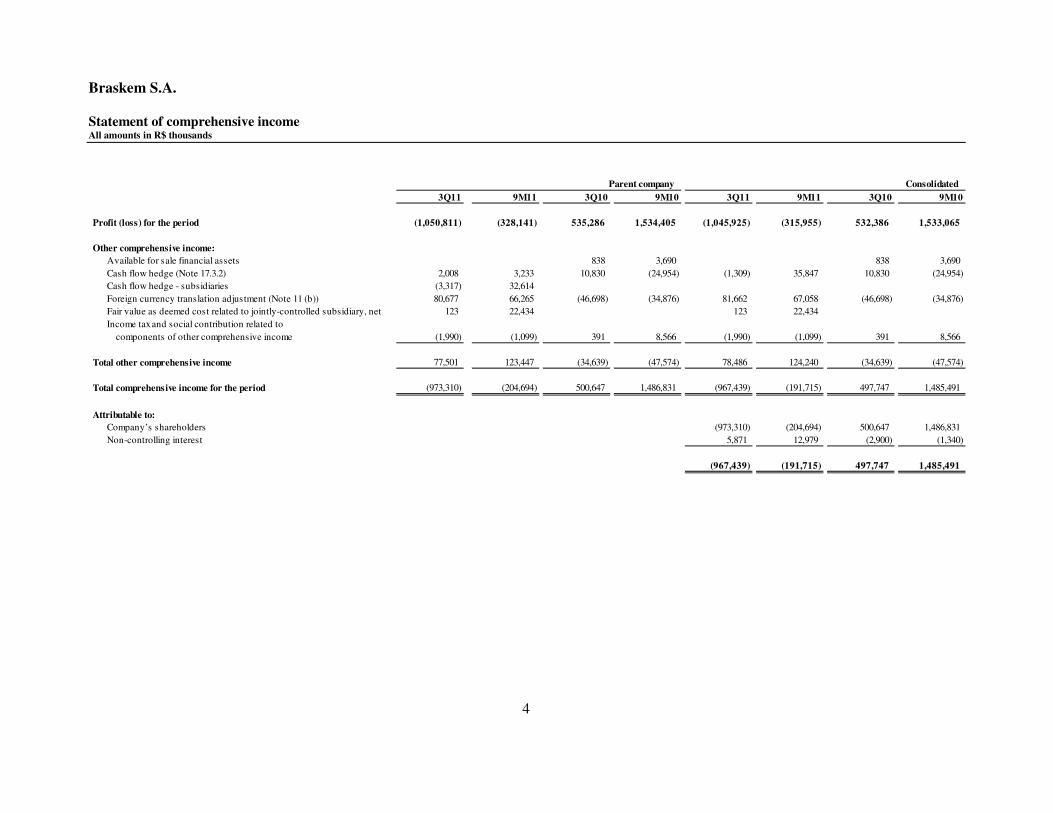
Braskem S.A. Statement of comprehensive income All amounts in R$ thousands
4
3Q11 9M11 3Q10 9M10 3Q11 9M11 3Q10 9M10
Profit (loss) for the period (1,050,811) (328,141) 535,286 1,534,405 (1,045,925) (315,955) 532,386 1,533,065
Other comprehensive income:
Available for sale financial assets 838 3,690 - - 838 3,690
Cash flow hedge (Note 17.3.2) 2,008 3,233 10,830 (24,954) (1,309) 35,847 10,830 (24,954)
Cash flow hedge - subsidiaries (3,317) 32,614
Foreign currency translation adjustment (Note 11 (b)) 80,677 66,265 (46,698) (34,876) 81,662 67,058 (46,698) (34,876)
Fair value as deemed cost related to jointly-controlled subsidiary, net 123 22,434 123 22,434
Income tax and social contribution related to -
components of other comprehensive income (1,990) (1,099) 391 8,566 (1,990) (1,099) 391 8,566
Total other comprehensive income 77,501 123,447 (34,639) (47,574) 78,486 124,240 (34,639) (47,574)
Total comprehensive income for the period (973,310) (204,694) 500,647 1,486,831 (967,439) (191,715) 497,747 1,485,491
Attributable to:
Company’s shareholders (973,310) (204,694) 500,647 1,486,831
Non-controlling interest 5,871 12,979 (2,900) (1,340)
(967,439) (191,715) 497,747 1,485,491
Parent company Consolidated
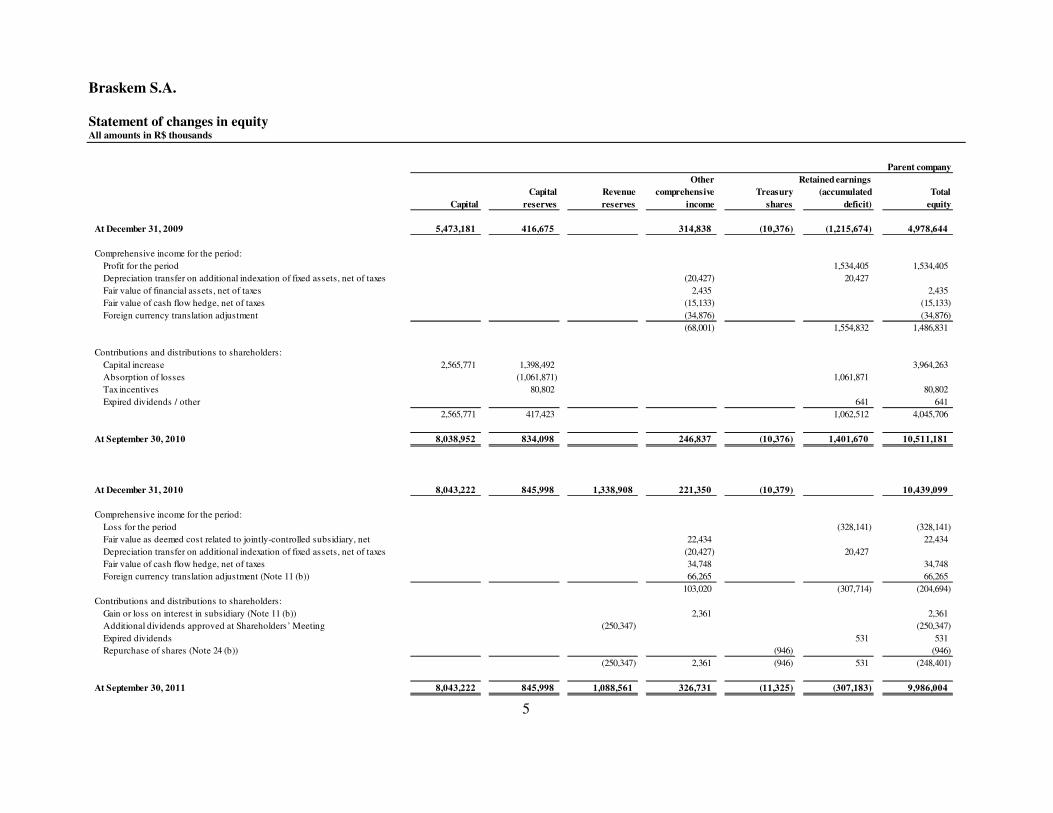
Braskem S.A. Statement of changes in equity All amounts in R$ thousands
5
Parent company
Other Retained earnings
Capital Revenue comprehensive Treasury (accumulated Total
Capital reserves reserves income shares deficit) equity
At December 31, 2009 5,473,181 416,675 - 314,838 (10,376) (1,215,674) 4,978,644
Comprehensive income for the period:
Profit for the period - 1,534,405 1,534,405
Depreciation transfer on additional indexation of fixed assets, net of taxes - (20,427) 20,427 -
Fair value of financial assets, net of taxes - 2,435 2,435
Fair value of cash flow hedge, net of taxes - (15,133) (15,133)
Foreign currency translation adjustment (34,876) (34,876)
- - - (68,001) - 1,554,832 1,486,831
Contributions and distributions to shareholders:
Capital increase 2,565,771 1,398,492 3,964,263
Absorption of losses (1,061,871) 1,061,871 -
Tax incentives 80,802 80,802
Expired dividends / other - - 641 641
2,565,771 417,423 - - - 1,062,512 4,045,706
At September 30, 2010 8,038,952 834,098 246,837 (10,376) 1,401,670 10,511,181
At December 31, 2010 8,043,222 845,998 1,338,908 221,350 (10,379) - 10,439,099
Comprehensive income for the period:
Loss for the period - (328,141) (328,141)
Fair value as deemed cost related to jointly-controlled subsidiary, net - 22,434 22,434
Depreciation transfer on additional indexation of fixed assets, net of taxes - (20,427) 20,427 -
Fair value of cash flow hedge, net of taxes - 34,748 34,748
Foreign currency translation adjustment (Note 11 (b)) - 66,265 66,265
- - - 103,020 - (307,714) (204,694)
Contributions and distributions to shareholders:
Gain or loss on interest in subsidiary (Note 11 (b)) 2,361 2,361
Additional dividends approved at Shareholders’ Meeting (250,347) (250,347)
Expired dividends 531 531
Repurchase of shares (Note 24 (b)) (946) (946)
- - (250,347) 2,361 (946) 531 (248,401)
At September 30, 2011 8,043,222 845,998 1,088,561 326,731 (11,325) (307,183) 9,986,004
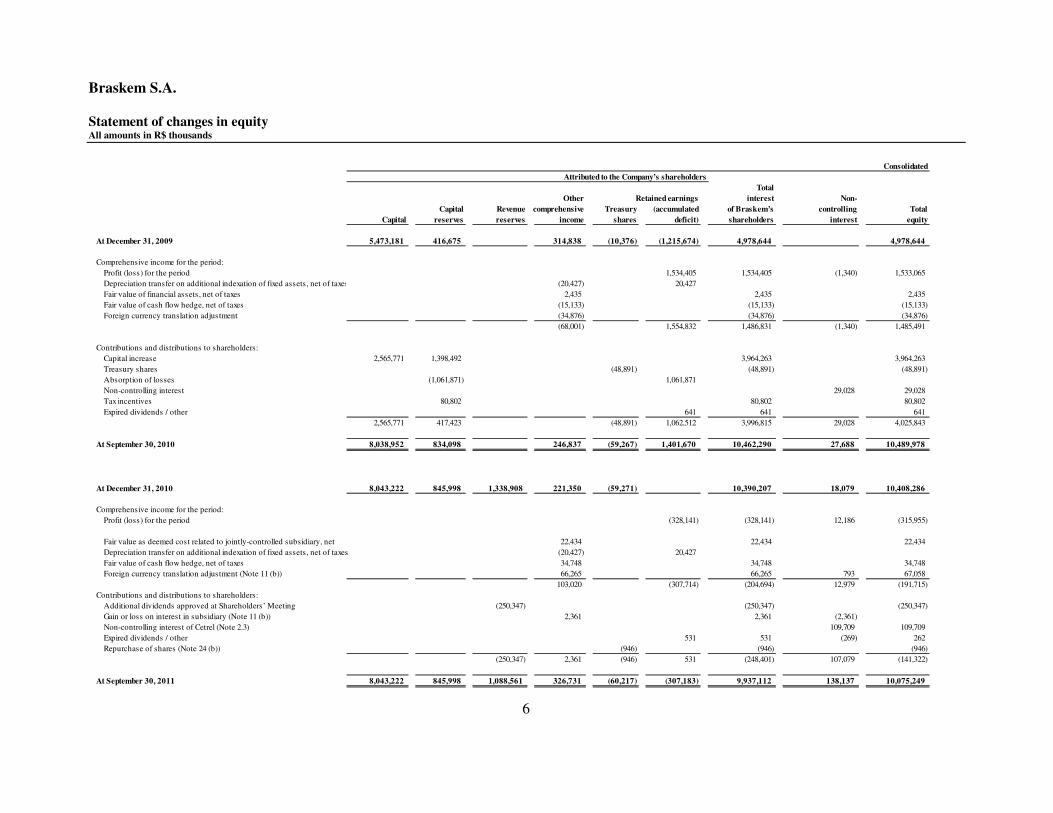
Braskem S.A. Statement of changes in equity All amounts in R$ thousands
6
Consolidated
Total
Other Retained earnings interest Non-
Capital Revenue comprehensive Treasury (accumulated of Braskem’s controlling Total
Capital reserves reserves income shares deficit) shareholders interest equity
At December 31, 2009 5,473,181 416,675 - 314,838 (10,376) (1,215,674) 4,978,644 - 4,978,644
Comprehensive income for the period:
Profit (loss) for the period - - - - - 1,534,405 1,534,405 (1,340) 1,533,065
Depreciation transfer on additional indexation of fixed assets, net of taxes - - - (20,427) - 20,427 - - -
Fair value of financial assets, net of taxes - - - 2,435 - - 2,435 - 2,435
Fair value of cash flow hedge, net of taxes - - - (15,133) - - (15,133) - (15,133)
Foreign currency translation adjustment (34,876) (34,876) (34,876)
- - - (68,001) - 1,554,832 1,486,831 (1,340) 1,485,491
Contributions and distributions to shareholders:
Capital increase 2,565,771 1,398,492 - - - - 3,964,263 - 3,964,263
Treasury shares (48,891) (48,891) (48,891)
Absorption of losses - (1,061,871) - - - 1,061,871 - - -
Non-controlling interest - - - - - - - 29,028 29,028
Tax incentives 80,802 80,802 80,802
Expired dividends / other - - - - - 641 641 - 641
2,565,771 417,423 - - (48,891) 1,062,512 3,996,815 29,028 4,025,843
At September 30, 2010 8,038,952 834,098 - 246,837 (59,267) 1,401,670 10,462,290 27,688 10,489,978
At December 31, 2010 8,043,222 845,998 1,338,908 221,350 (59,271) - 10,390,207 18,079 10,408,286
Comprehensive income for the period:
Profit (loss) for the period - (328,141) (328,141) 12,186 (315,955)
- -
Fair value as deemed cost related to jointly-controlled subsidiary, net 22,434 22,434 22,434
Depreciation transfer on additional indexation of fixed assets, net of taxes (20,427) 20,427 - -
Fair value of cash flow hedge, net of taxes - 34,748 34,748 34,748
Foreign currency translation adjustment (Note 11 (b)) - 66,265 66,265 793 67,058
- - - 103,020 - (307,714) (204,694) 12,979 (191,715)
Contributions and distributions to shareholders:
Additional dividends approved at Shareholders’ Meeting (250,347) (250,347) (250,347)
Gain or loss on interest in subsidiary (Note 11 (b)) 2,361 2,361 (2,361) -
Non-controlling interest of Cetrel (Note 2.3) 109,709 109,709
Expired dividends / other 531 531 (269) 262
Repurchase of shares (Note 24 (b)) - (946) (946) (946)
- - (250,347) 2,361 (946) 531 (248,401) 107,079 (141,322)
At September 30, 2011 8,043,222 845,998 1,088,561 326,731 (60,217) (307,183) 9,937,112 138,137 10,075,249
Attributed to the Company’s shareholders
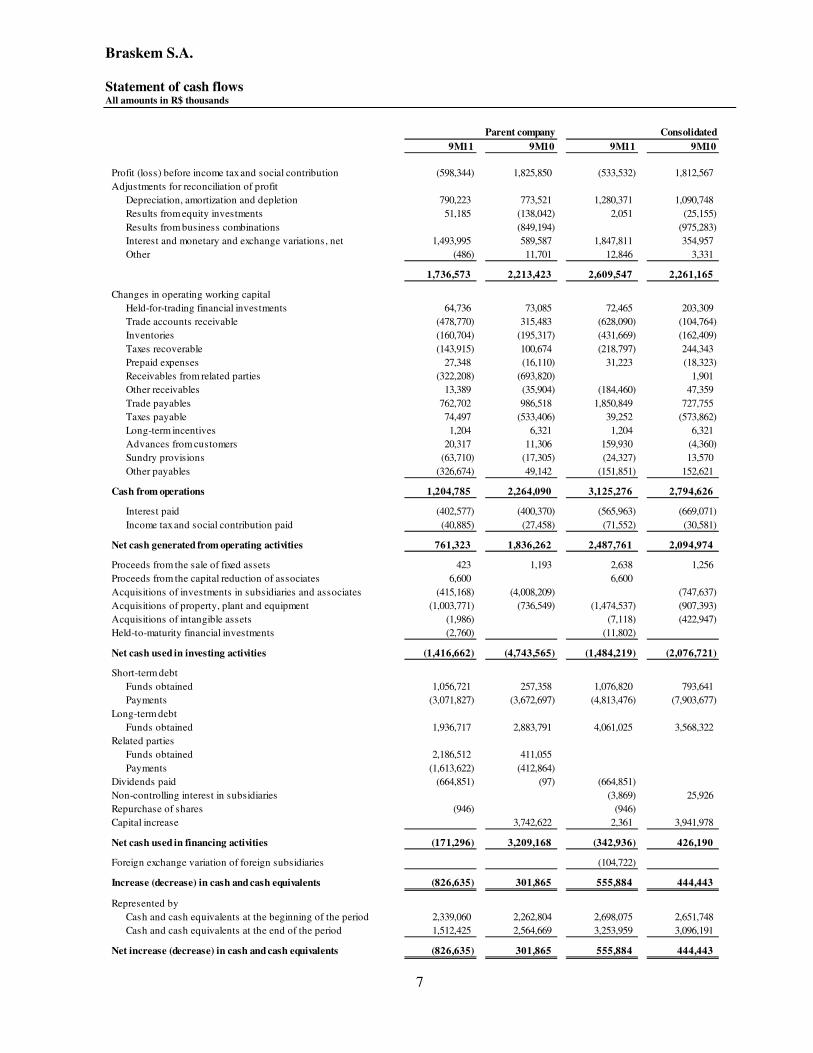
Braskem S.A. Statement of cash flows All amounts in R$ thousands
7
9M11 9M10 9M11 9M10
Profit (loss) before income tax and social contribution (598,344) 1,825,850 (533,532) 1,812,567
Adjustments for reconciliation of profit
Depreciation, amortization and depletion 790,223 773,521 1,280,371 1,090,748
Results from equity investments 51,185 (138,042) 2,051 (25,155)
Results from business combinations (849,194) (975,283)
Interest and monetary and exchange variations, net 1,493,995 589,587 1,847,811 354,957
Other (486) 11,701 12,846 3,331
1,736,573 2,213,423 2,609,547 2,261,165
Changes in operating working capital
Held-for-trading financial investments 64,736 73,085 72,465 203,309
Trade accounts receivable (478,770) 315,483 (628,090) (104,764)
Inventories (160,704) (195,317) (431,669) (162,409)
Taxes recoverable (143,915) 100,674 (218,797) 244,343
Prepaid expenses 27,348 (16,110) 31,223 (18,323)
Receivables from related parties (322,208) (693,820) - 1,901
Other receivables 13,389 (35,904) (184,460) 47,359
Trade payables 762,702 986,518 1,850,849 727,755
Taxes payable 74,497 (533,406) 39,252 (573,862)
Long-term incentives 1,204 6,321 1,204 6,321
Advances from customers 20,317 11,306 159,930 (4,360)
Sundry provisions (63,710) (17,305) (24,327) 13,570
Other payables (326,674) 49,142 (151,851) 152,621
Cash from operations 1,204,785 2,264,090 3,125,276 2,794,626
Interest paid (402,577) (400,370) (565,963) (669,071)
Income tax and social contribution paid (40,885) (27,458) (71,552) (30,581)
Net cash generated from operating activities 761,323 1,836,262 2,487,761 2,094,974
Proceeds from the sale of fixed assets 423 1,193 2,638 1,256
Proceeds from the capital reduction of associates 6,600 6,600
Acquisitions of investments in subsidiaries and associates (415,168) (4,008,209) - (747,637)
Acquisitions of property, plant and equipment (1,003,771) (736,549) (1,474,537) (907,393)
Acquisitions of intangible assets (1,986) - (7,118) (422,947)
Held-to-maturity financial investments (2,760) - (11,802)
Net cash used in investing activities (1,416,662) (4,743,565) (1,484,219) (2,076,721)
Short-term debt
Funds obtained 1,056,721 257,358 1,076,820 793,641
Payments (3,071,827) (3,672,697) (4,813,476) (7,903,677)
Long-term debt
Funds obtained 1,936,717 2,883,791 4,061,025 3,568,322
Related parties
Funds obtained 2,186,512 411,055 - -
Payments (1,613,622) (412,864) - -
Dividends paid (664,851) (97) (664,851)
Non-controlling interest in subsidiaries (3,869) 25,926
Repurchase of shares (946) - (946) -
Capital increase 3,742,622 2,361 3,941,978
Net cash used in financing activities (171,296) 3,209,168 (342,936) 426,190
Foreign exchange variation of foreign subsidiaries (104,722)
Increase (decrease) in cash and cash equivalents (826,635) 301,865 555,884 444,443
Represented by
Cash and cash equivalents at the beginning of the period 2,339,060 2,262,804 2,698,075 2,651,748
Cash and cash equivalents at the end of the period 1,512,425 2,564,669 3,253,959 3,096,191
Net increase (decrease) in cash and cash equivalents (826,635) 301,865 555,884 444,443
Parent company Consolidated
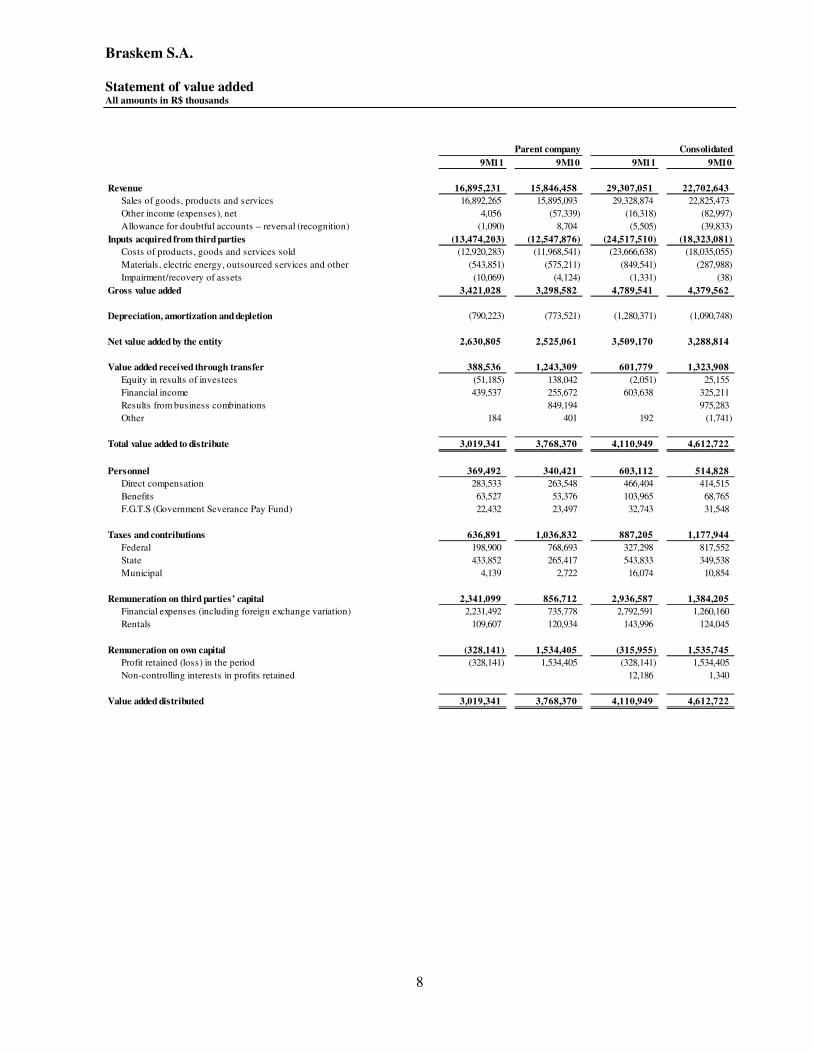
Braskem S.A. Statement of value added All amounts in R$ thousands
8
9M11 9M10 9M11 9M10
Revenue 16,895,231 15,846,458 29,307,051 22,702,643
Sales of goods, products and services 16,892,265 15,895,093 29,328,874 22,825,473
Other income (expenses), net 4,056 (57,339) (16,318) (82,997)
Allowance for doubtful accounts – reversal (recognition) (1,090) 8,704 (5,505) (39,833)
Inputs acquired from third parties (13,474,203) (12,547,876) (24,517,510) (18,323,081)
Costs of products, goods and services sold (12,920,283) (11,968,541) (23,666,638) (18,035,055)
Materials, electric energy, outsourced services and other (543,851) (575,211) (849,541) (287,988)
Impairment/recovery of assets (10,069) (4,124) (1,331) (38)
Gross value added 3,421,028 3,298,582 4,789,541 4,379,562
Depreciation, amortization and depletion (790,223) (773,521) (1,280,371) (1,090,748)
Net value added by the entity 2,630,805 2,525,061 3,509,170 3,288,814
Value added received through transfer 388,536 1,243,309 601,779 1,323,908
Equity in results of investees (51,185) 138,042 (2,051) 25,155
Financial income 439,537 255,672 603,638 325,211
Results from business combinations - 849,194 - 975,283
Other 184 401 192 (1,741)
Total value added to distribute 3,019,341 3,768,370 4,110,949 4,612,722
Personnel 369,492 340,421 603,112 514,828
Direct compensation 283,533 263,548 466,404 414,515
Benefits 63,527 53,376 103,965 68,765
F.G.T.S (Government Severance Pay Fund) 22,432 23,497 32,743 31,548
Taxes and contributions 636,891 1,036,832 887,205 1,177,944
Federal 198,900 768,693 327,298 817,552
State 433,852 265,417 543,833 349,538
Municipal 4,139 2,722 16,074 10,854
Remuneration on third parties’ capital 2,341,099 856,712 2,936,587 1,384,205
Financial expenses (including foreign exchange variation) 2,231,492 735,778 2,792,591 1,260,160
Rentals 109,607 120,934 143,996 124,045
Remuneration on own capital (328,141) 1,534,405 (315,955) 1,535,745
Profit retained (loss) in the period (328,141) 1,534,405 (328,141) 1,534,405
Non-controlling interests in profits retained - 12,186 1,340
Value added distributed 3,019,341 3,768,370 4,110,949 4,612,722
Parent company Consolidated
Braskem S.A. Notes to the quarterly information at September 30, 2011 All amounts in R$ thousands unless otherwise stated
9
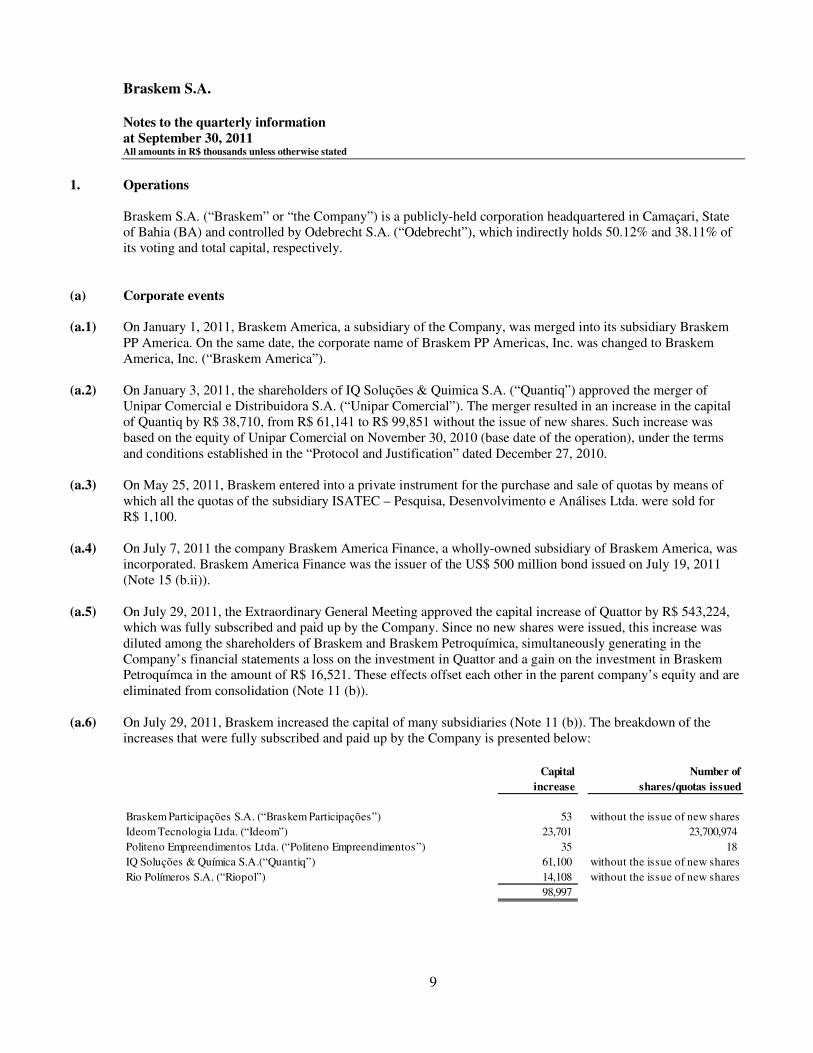
1. Operations
Braskem S.A. (“Braskem” or “the Company”) is a publicly-held corporation headquartered in Camaçari, State of Bahia (BA) and controlled by Odebrecht S.A. (“Odebrecht”), which indirectly holds 50.12% and 38.11% of its voting and total capital, respectively.
(a) Corporate events
(a.1) On January 1, 2011, Braskem America, a subsidiary of the Company, was merged into its subsidiary Braskem
PP America. On the same date, the corporate name of Braskem PP Americas, Inc. was changed to Braskem America, Inc. (“Braskem America”).
(a.2) On January 3, 2011, the shareholders of IQ Soluções & Quimica S.A. (“Quantiq”) approved the merger of Unipar Comercial e Distribuidora S.A. (“Unipar Comercial”). The merger resulted in an increase in the capital of Quantiq by R$ 38,710, from R$ 61,141 to R$ 99,851 without the issue of new shares. Such increase was based on the equity of Unipar Comercial on November 30, 2010 (base date of the operation), under the terms and conditions established in the “Protocol and Justification” dated December 27, 2010.
(a.3) On May 25, 2011, Braskem entered into a private instrument for the purchase and sale of quotas by means of
which all the quotas of the subsidiary ISATEC – Pesquisa, Desenvolvimento e Análises Ltda. were sold for R$ 1,100.
(a.4) On July 7, 2011 the company Braskem America Finance, a wholly-owned subsidiary of Braskem America, was
incorporated. Braskem America Finance was the issuer of the US$ 500 million bond issued on July 19, 2011 (Note 15 (b.ii)).
(a.5) On July 29, 2011, the Extraordinary General Meeting approved the capital increase of Quattor by R$ 543,224,
which was fully subscribed and paid up by the Company. Since no new shares were issued, this increase was diluted among the shareholders of Braskem and Braskem Petroquímica, simultaneously generating in the Company’s financial statements a loss on the investment in Quattor and a gain on the investment in Braskem Petroquímca in the amount of R$ 16,521. These effects offset each other in the parent company’s equity and are eliminated from consolidation (Note 11 (b)).
(a.6) On July 29, 2011, Braskem increased the capital of many subsidiaries (Note 11 (b)). The breakdown of the
increases that were fully subscribed and paid up by the Company is presented below:
Capital Number of
increase shares/quotas issued
Braskem Participações S.A. (“Braskem Participações”) 53 without the issue of new shares
Ideom Tecnologia Ltda. (“Ideom”) 23,701 23,700,974
Politeno Empreendimentos Ltda. (“Politeno Empreendimentos”) 35 18
IQ Soluções & Química S.A.(“Quantiq”) 61,100 without the issue of new shares
Rio Polímeros S.A. (“Riopol”) 14,108 without the issue of new shares
98,997
Braskem S.A. Notes to the quarterly information at September 30, 2011 All amounts in R$ thousands unless otherwise stated
10
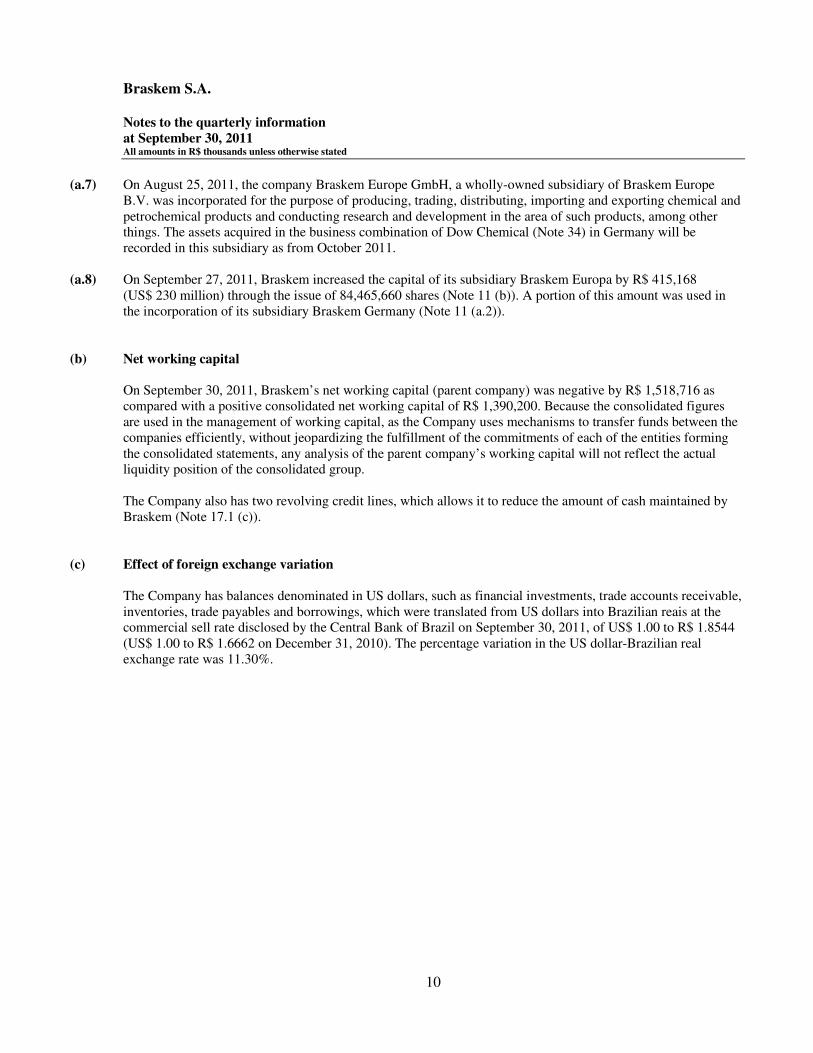
(a.7) On August 25, 2011, the company Braskem Europe GmbH, a wholly-owned subsidiary of Braskem Europe B.V. was incorporated for the purpose of producing, trading, distributing, importing and exporting chemical and petrochemical products and conducting research and development in the area of such products, among other things. The assets acquired in the business combination of Dow Chemical (Note 34) in Germany will be recorded in this subsidiary as from October 2011.
(a.8) On September 27, 2011, Braskem increased the capital of its subsidiary Braskem Europa by R$ 415,168
(US$ 230 million) through the issue of 84,465,660 shares (Note 11 (b)). A portion of this amount was used in the incorporation of its subsidiary Braskem Germany (Note 11 (a.2)).
(b) Net working capital
On September 30, 2011, Braskem’s net working capital (parent company) was negative by R$ 1,518,716 as compared with a positive consolidated net working capital of R$ 1,390,200. Because the consolidated figures are used in the management of working capital, as the Company uses mechanisms to transfer funds between the companies efficiently, without jeopardizing the fulfillment of the commitments of each of the entities forming the consolidated statements, any analysis of the parent company’s working capital will not reflect the actual liquidity position of the consolidated group. The Company also has two revolving credit lines, which allows it to reduce the amount of cash maintained by Braskem (Note 17.1 (c)).
(c) Effect of foreign exchange variation The Company has balances denominated in US dollars, such as financial investments, trade accounts receivable, inventories, trade payables and borrowings, which were translated from US dollars into Brazilian reais at the commercial sell rate disclosed by the Central Bank of Brazil on September 30, 2011, of US$ 1.00 to R$ 1.8544 (US$ 1.00 to R$ 1.6662 on December 31, 2010). The percentage variation in the US dollar-Brazilian real exchange rate was 11.30%.

Braskem S.A. Notes to the quarterly information at September 30, 2011 All amounts in R$ thousands unless otherwise stated
11
2. Summary of significant accounting policies
2.1. Basis of preparation This Quarterly Information should be read together with the financial statements of Braskem S.A. as of December 31, 2010 and for the year then ended, which were prepared and presented in accordance with accounting practices adopted in Brazil, including the pronouncements issued by the Brazilian Accounting Pronouncements Committee (CPC), and in accordance with the International Financial Reporting Standards (“IFRS”) issued by IASB. The preparation of the quarterly information requires the use of certain critical accounting estimates. It also requires the management of the Company to exercise its judgment in the process of applying its accounting policies. There were no changes in the assumptions and judgments made by the Company’s management in the use of estimates for the preparation of the Quarterly Information in relation to those used in the December 31, 2010 financial statements, except for the full consolidation of Cetrel S.A. (“Cetrel”) as from June 30, 2011, as mentioned in Note 2.3 (viii).
(a) Consolidated quarterly information The consolidated Quarterly Information was prepared and is being presented in accordance with the pronouncements CPC 21 and IAS 34 – Interim Financial Reporting, which aim to establish the minimum content for interim financial statements.
(b) Parent company quarterly information The parent company Quarterly Information was prepared and is being presented in accordance with pronouncement CPC 21.
2.2. Accounting practices There were no changes in the accounting practices used for the Quarterly Information in relation to those presented in the December 31, 2010 financial statements. Due to the consolidation of Cetrel as from 2011, the balance of cash and cash equivalents presented in the consolidated statement of cash flows for the beginning of the period (January 1, 2011) was increased by the amount of R$ 73,805, which corresponds to the amount of cash and cash equivalents of Cetrel on that date.
Braskem S.A. Notes to the quarterly information at September 30, 2011 All amounts in R$ thousands unless otherwise stated
12
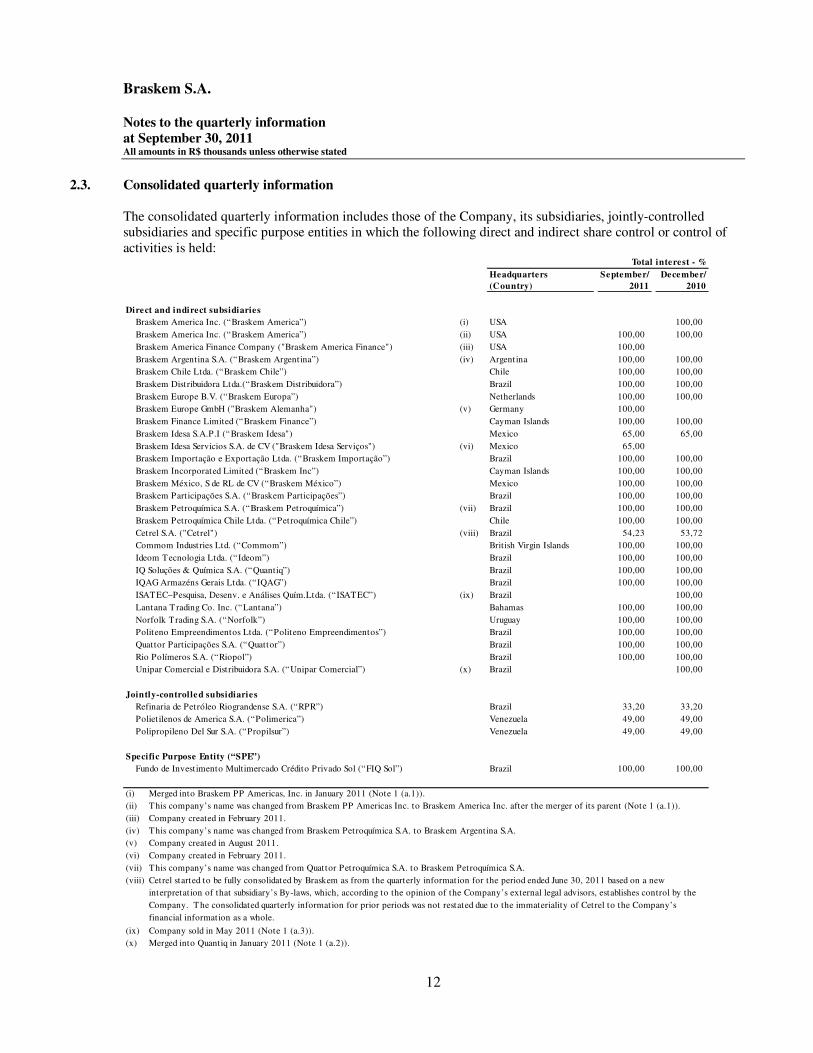
2.3. Consolidated quarterly information The consolidated quarterly information includes those of the Company, its subsidiaries, jointly-controlled subsidiaries and specific purpose entities in which the following direct and indirect share control or control of activities is held:
Headquarters
(Country)
September/
2011
December/
2010
Braskem America Inc. (“Braskem America”) (i) USA 100,00
Braskem America Inc. (“Braskem America”) (ii) USA 100,00 100,00
Braskem America Finance Company ("Braskem America Finance") (iii) USA 100,00
Braskem Argentina S.A. (“Braskem Argentina”) (iv) Argentina 100,00 100,00
Braskem Chile Ltda. (“Braskem Chile”) Chile 100,00 100,00
Braskem Distribuidora Ltda.(“Braskem Distribuidora”) Brazil 100,00 100,00
Braskem Europe B.V. (“Braskem Europa”) Netherlands 100,00 100,00
Braskem Europe GmbH ("Braskem Alemanha") (v) Germany 100,00
Braskem Finance Limited (“Braskem Finance”) Cayman Islands 100,00 100,00
Braskem Idesa S.A.P.I (“Braskem Idesa") Mexico 65,00 65,00
Braskem Idesa Servicios S.A. de CV ("Braskem Idesa Serviços") (vi) Mexico 65,00
Braskem Importação e Exportação Ltda. (“Braskem Importação”) Brazil 100,00 100,00
Braskem Incorporated Limited (“Braskem Inc”) Cayman Islands 100,00 100,00
Braskem México, S de RL de CV (“Braskem México”) Mexico 100,00 100,00
Braskem Participações S.A. (“Braskem Participações”) Brazil 100,00 100,00
Braskem Petroquímica S.A. (“Braskem Petroquímica”) (vii) Brazil 100,00 100,00
Braskem Petroquímica Chile Ltda. (“Petroquímica Chile”) Chile 100,00 100,00
Cetrel S.A. ("Cetrel") (viii) Brazil 54,23 53,72
Commom Industries Ltd. (“Commom”) British Virgin Islands 100,00 100,00
Ideom Tecnologia Ltda. (“Ideom”) Brazil 100,00 100,00
IQ Soluções & Química S.A. (“Quantiq”) Brazil 100,00 100,00
IQAG Armazéns Gerais Ltda. (“IQAG”) Brazil 100,00 100,00
ISATEC–Pesquisa, Desenv. e Análises Quím.Ltda. (“ISATEC”) (ix) Brazil 100,00
Lantana T rading Co. Inc. (“Lantana”) Bahamas 100,00 100,00
Norfolk Trading S.A. (“Norfolk”) Uruguay 100,00 100,00
Politeno Empreendimentos Ltda. (“Politeno Empreendimentos”) Brazil 100,00 100,00
Quattor Participações S.A. (“Quattor”) Brazil 100,00 100,00
Rio Polímeros S.A. (“Riopol”) Brazil 100,00 100,00
Unipar Comercial e Distribuidora S.A. (“Unipar Comercial”) (x) Brazil 100,00
Refinaria de Petróleo Riograndense S.A. (“RPR”) Brazil 33,20 33,20
Polietilenos de America S.A. (“Polimerica”) Venezuela 49,00 49,00
Polipropileno Del Sur S.A. (“Propilsur”) Venezuela 49,00 49,00
Fundo de Investimento Multimercado Crédito Privado Sol (“FIQ Sol”) Brazil 100,00 100,00
(i)
(ii)
(iii) Company created in February 2011.
(iv)
(v) Company created in August 2011.
(vi) Company created in February 2011.
(vii)
(viii)
(ix) Company sold in May 2011 (Note 1 (a.3)).
(x) Merged into Quantiq in January 2011 (Note 1 (a.2)).
Cetrel started to be fully consolidated by Braskem as from the quarterly information for the period ended June 30, 2011 based on a new
interpretation of that subsidiary’s By-laws, which, according to the opinion of the Company’s external legal advisors, establishes control by the
Company. T he consolidated quarterly information for prior periods was not restated due to the immateriality of Cetrel to the Company’s
financial information as a whole.
This company’s name was changed from Quattor Petroquímica S.A. to Braskem Petroquímica S.A.
Jointly-controlled subsidiaries
Specific Purpose Entity (“SPE”)
Total interest - %
Direct and indirect subsidiaries
This company’s name was changed from Braskem PP Americas Inc. to Braskem America Inc. after the merger of its parent (Note 1 (a.1)).
Merged into Braskem PP Americas, Inc. in January 2011 (Note 1 (a.1)).
This company’s name was changed from Braskem Petroquímica S.A. to Braskem Argentina S.A.
Braskem S.A. Notes to the quarterly information at September 30, 2011 All amounts in R$ thousands unless otherwise stated
13
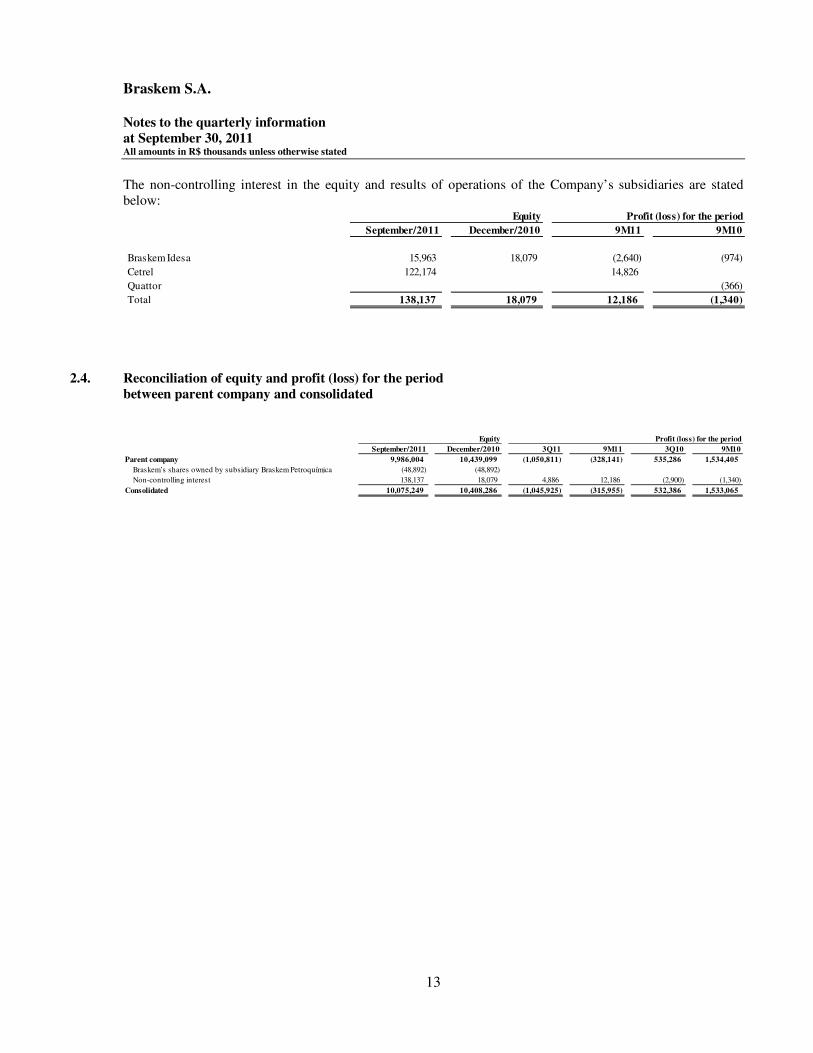
The non-controlling interest in the equity and results of operations of the Company’s subsidiaries are stated below:
2.4. Reconciliation of equity and profit (loss) for the period between parent company and consolidated
September/2011 December/2010 9M11 9M10
Braskem Idesa 15,963 18,079 (2,640) (974)
Cetrel 122,174 14,826
Quattor (366)
Total 138,137 18,079 12,186 (1,340)
Equity Profit (loss) for the period
September/2011 December/2010 3Q11 9M11 3Q10 9M10
Parent company 9,986,004 10,439,099 (1,050,811) (328,141) 535,286 1,534,405
Braskem’s shares owned by subsidiary Braskem Petroquímica (48,892) (48,892)
Non-controlling interest 138,137 18,079 4,886 12,186 (2,900) (1,340)
Consolidated 10,075,249 10,408,286 (1,045,925) (315,955) 532,386 1,533,065
Equity Profit (loss) for the period

Braskem S.A. Notes to the quarterly information at September 30, 2011 All amounts in R$ thousands unless otherwise stated
14
3. Business combinations The Company adopted the accounting pronouncement CPC 15 and the IFRS 3 for the acquisitions of companies in 2010. The results of such adoption are presented below:
(a) Quattor Participações S.A.
On April 27, 2010, Braskem acquired 60% of the total capital of Quattor held by União de Indústrias Brasileiras S.A. (“Unipar”) for R$ 659,454 and, subsequently, it acquired the remaining 40% held by Petróleo Brasileiro S.A. (“Petrobras”) by means of the barter for 18,000,097 shares issued by the Company. On April 30, 2010, the Company acquired the control of Quattor, and this date is the date of acquisition for the purposes of accounting for the business combination. As a result of the acquisition, a bargain purchase gain of R$ 841,459 was recorded within “results from business combinations” in the income statement.
(b) Sunoco Chemicals, Co.
On April 1, 2010, Braskem acquired 100% of Sunoco Chemicals’ shares for R$ 620,838 (US$ 351 million), date on which the control was acquired by the Company. In this operation, a bargain purchase gain of R$ 126,089 was recognized within “results from business combinations” in the income statement. Right after the purchase, the name of this subsidiary was changed to Braskem PP Americas. In January 2011, Braskem America was merged into its parent company Braskem PP Americas and its name was changed to Braskem America Inc. (Nota 1 (a.1)).
(c) Unipar Comercial
On May 10, 2010, the Company acquired 100% of the voting capital and control of Unipar Comercial. In this operation, the Company recognized a bargain purchase gain of R$ 7,735 within “results from business combinations” in the income statement. The information related to these business combinations was presented in the Company’s 2010 annual financial statements, in Note 5.
Braskem S.A. Notes to the quarterly information at September 30, 2011 All amounts in R$ thousands unless otherwise stated
15
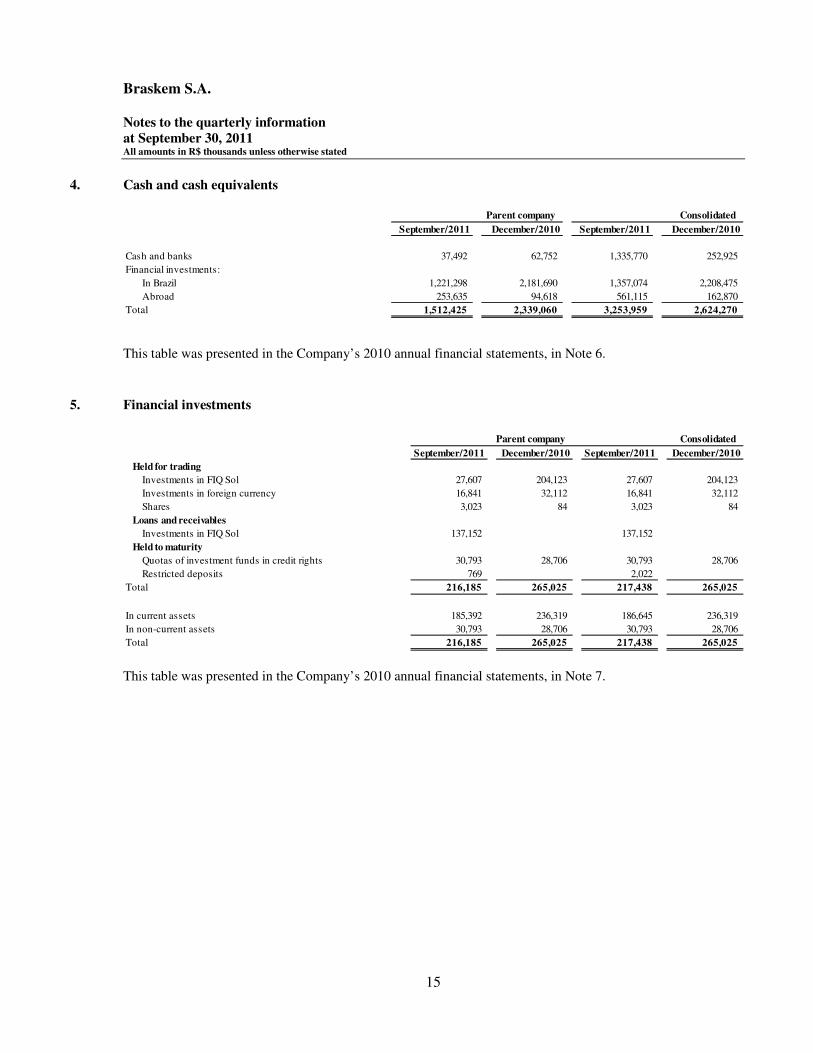
4. Cash and cash equivalents
This table was presented in the Company’s 2010 annual financial statements, in Note 6.
5. Financial investments
This table was presented in the Company’s 2010 annual financial statements, in Note 7.
September/2011 December/2010 September/2011 December/2010
Cash and banks 37,492 62,752 1,335,770 252,925
Financial investments:
In Brazil 1,221,298 2,181,690 1,357,074 2,208,475
Abroad 253,635 94,618 561,115 162,870
Total 1,512,425 2,339,060 3,253,959 2,624,270
Parent company Consolidated
September/2011 December/2010 September/2011 December/2010
Held for trading
Investments in FIQ Sol 27,607 204,123 27,607 204,123
Investments in foreign currency 16,841 32,112 16,841 32,112
Shares 3,023 84 3,023 84
Loans and receivables
Investments in FIQ Sol 137,152 137,152
Held to maturity
30,793 28,706 30,793 28,706
Restricted deposits 769 - 2,022 -
Total 216,185 265,025 217,438 265,025
In current assets 185,392 236,319 186,645 236,319
In non-current assets 30,793 28,706 30,793 28,706
Total 216,185 265,025 217,438 265,025
Quotas of investment funds in credit rights
Parent company Consolidated

Braskem S.A. Notes to the quarterly information at September 30, 2011 All amounts in R$ thousands unless otherwise stated
16
6. Trade accounts receivable
This table was presented in the Company’s 2010 annual financial statements, in Note 8.
7. Inventories
This table was presented in the Company’s 2010 annual financial statements, in Note 9.
September/2011 December/2010 September/2011 December/2010
Customers
Domestic market 858,756 910,636 1,237,859 1,638,449
Foreign market 969,333 438,245 1,633,279 587,661
Allowance for doubtful accounts (213,224) (212,363) (273,333) (269,159)
Total 1,614,865 1,136,518 2,597,805 1,956,951
In current assets 1,563,587 1,077,492 2,544,199 1,894,648
In non-current assets 51,278 59,026 53,606 62,303
Total 1,614,865 1,136,518 2,597,805 1,956,951
Parent company Consolidated
September/2011 December/2010 September/2011 December/2010
Finished goods and work in process 1,363,091 1,012,891 2,350,010 1,876,290
Raw materials, production inputs and packaging 493,280 621,158 697,504 781,594
Maintenance materials 136,586 132,510 257,746 240,442
Advances to suppliers 14,009 8,099 56,014 56,825
Imports in transit and other 21,743 14,847 86,148 60,506
Total 2,028,709 1,789,505 3,447,422 3,015,657
Parent company Consolidated

Braskem S.A. Notes to the quarterly information at September 30, 2011 All amounts in R$ thousands unless otherwise stated
17
8. Related parties
(a) Parent company
(i) Amounts in “trade accounts receivable” R$ 287,545 and in “other receivables”: R$ 26,260 (ii) Amounts in “other receivables”. (iii) Amount in “trade accounts receivable”: R$ 11,889 and in “dividends and interest on capital receivable”: R$ 8,266 (iv) Amounts in “cash and cash equivalents”: R$ 1,085,328 and in “financial investments": R$ 164,758 (v) Amount in “related parties” related to current accounts: R$ 257,661 and in “advance for future capital increase”: R$ 649,639 (vi) Amount in “related parties” related to “advance for future capital increase”. (vii) Amounts in “related parties” related to loan agreements subject to TJLP + interest of 2% per year. (viii) Amounts in “related parties” related to current accounts. (ix) Amounts in “trade payables”: R$ 1,707,323 and in “borrowings”, subject to exchange variation + interest between 7.00% and 11.0% per year:
R$ 737,198 (x) Amounts in “trade payables”. (xi) Amounts in “related parties” related to taxes payable, subject to exchange variation. (xii) Amounts in “borrowings”, subject to exchange variation + interest between 7.00% and 11.0% per year. (xiii) Amounts in “related parties” related to advances for export, subject to exchange variation + semiannual Libor + interest of 1.4% per year.
Current liabilities
Current
assets
Other
accounts
Related
parties
Other
accounts
Related
parties
Subsidiaries
Braskem America 3,581 (i)
Braskem Argentina 27,770 (i)
Braskem Chile 3,945 (i)
Braskem Distribuidora 5,500 (viii)
Braskem Europa 175,048 (i) 117,656 (xiii) 162,260 (xiii)
Braskem Idesa 71,331 (vi)
Braskem Importação 119 (viii)
Braskem Inc. 26,584 (i) 6,475 (vii) 2,444,521 (ix) 71,804 (xi) 3,085,169 (xii) 7,121 (xi)
Braskem México 1 (ii)
Cetrel 1,411 (x)
Ideom 186 (i) 4,182 (viii)
IQAG 520 (viii)
Lantana 53 (viii)
Politeno Empreendimentos 2 (viii)
Quantiq 20,155 (iii) 14,237 (viii) 433 (x)
Quattor 36,872 (i) 907,300 (v) 1,900 (x)
Riopol 6,570 (i) 738,799 (vi) 3,382 (x) 98,401 (viii)
300,712 - 1,742,379 2,451,647 189,460 3,085,169 273,921
Jointly-controlled subsidiaries - -
Propilsur 3 (ii) - -
Polimerica 5 (ii) - -
8 - - - - - -
Associate - - - -
Borealis 3,690 (i) - - - -
3,690 - - - - - -
Related companies - - -
Construtora Norberto Odebrecht ("CNO") 41 (x) - -
Petrobras 28,460 (i) 57,020 (vii) 1,509,702 (x)
Refinaria Alberto Pasqualini ("Refap") 33 (i) 98,238 (x) - -
Other 1,066 (i) - -
29,559 - 57,020 1,607,981 - - -
- -
Specific Purpose Entity - - - -
FIQ Sol 1,250,086 (iv) - - -
1,250,086 - - - - -
-
At September 30, 2011 1,584,055 - 1,799,399 4,059,628 189,460 3,085,169 273,921
At December 31, 2010 2,535,725 - 2,408,371 913,958 64,517 3,038,265 83,739
Assets Liabilities
Non-current liabilities
Non-current
assets

Braskem S.A. Notes to the quarterly information at September 30, 2011 All amounts in R$ thousands unless otherwise stated
18
Purchases of Cost of
raw materials, Financial production/general
Sales services and income and administrative
of products utilities (expenses) expenses
Subsidiaries Braskem America 3,603 420
Braskem Argentina 27,202 6,001
Braskem Chile 3,777 6,292
Braskem Distribuidora (47)
Braskem Europa 171,939 20,510
Braskem Idesa (1,822)
Braskem Importação (2)
Braskem Inc. 26,584 1,706,891 (642,046)
Braskem Participações 1
Cetrel 1,376
Ideom 156 166
IQAG (4)
ISATEC 55
Politeno 1
Quantiq 11,910 433 399
Quattor 36,518 1,754 15,005
Riopol 6,304 3,382 1,220
287,993 1,713,836 (593,851) -
- - - - Associates
Borealis 3,677 - - -
3,677 - - - Related companies
BRK Investimentos Petroquímicos S.A. ("BRK") (11)
CNO 41 -
Odebrecht 13
Petrobras 340 1,510,012 3,278 -
Refap 98,519 -
340 1,608,572 3,280 -
Post-employment benefit plan
Odebrecht Previdência Privada ("Odeprev") - - - 7,688
- - - 7,688
At September 30, 2011 292,010 3,322,408 (590,571) 7,688
At September 30, 2010 1,495,367 6,092,161 126,211 8,587
Income statement transactions from January 1 to September 30, 2011
Braskem S.A. Notes to the quarterly information at September 30, 2011 All amounts in R$ thousands unless otherwise stated
19
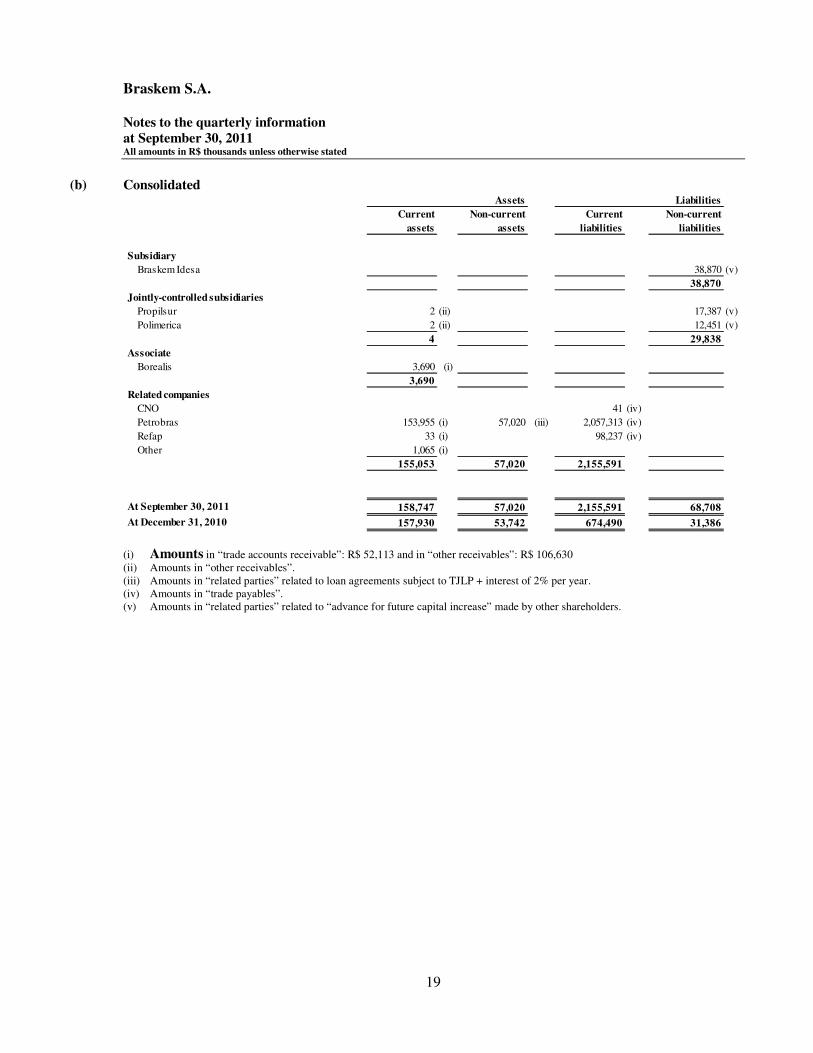
(b) Consolidated
(i) Amounts in “trade accounts receivable”: R$ 52,113 and in “other receivables”: R$ 106,630 (ii) Amounts in “other receivables”. (iii) Amounts in “related parties” related to loan agreements subject to TJLP + interest of 2% per year. (iv) Amounts in “trade payables”. (v) Amounts in “related parties” related to “advance for future capital increase” made by other shareholders.
Current
assets
Non-current
assets
Current
liabilities
Non-current
liabilities
Subsidiary
Braskem Idesa 0 0 0 0 0 38,870 (v)
- - - 38,870
Jointly-controlled subsidiaries
Propilsur 2 (ii) 17,387 (v)
Polimerica 2 (ii) 12,451 (v)
4 - - 29,838
Associate
Borealis 3,690 (i) - - 0 -
3,690 - - -
Related companies -
CNO - - - 41 (iv) -
Petrobras 153,955 (i) 57,020 (iii) 2,057,313 (iv)
Refap 33 (i) 98,237 (iv)
Other 1,065 (i)
155,053 57,020 2,155,591 -
At September 30, 2011 158,747 57,020 2,155,591 68,708
At December 31, 2010 157,930 53,742 674,490 31,386
Assets Liabilities

Braskem S.A. Notes to the quarterly information at September 30, 2011 All amounts in R$ thousands unless otherwise stated
20
(c) Key management personnel
The Company carries out transactions with related parties in the ordinary course of its operations and activities. The Company believes that all the conditions set forth in the contracts with related parties meet the Company’s interests. To ensure that these contracts present terms and conditions that are as favorable to the Company as those it would enter into with any other third parties is a permanent objective of Braskem’s management. This table was presented in the Company’s 2010 annual financial statements, in Note 10.
Cost of
Purchases of production/
raw materials, Financial general and
Sales of services and income administrative
products utilities (expenses) expenses
Jointly-controlled subsidiary
RPR 73 (56)
73 - (56) -
Associate
Borealis 3,677
3,677 - - -
Related companies
BRK (11)
CNO 41
Odebrecht 13
Petrobras 12,174 2,057,665 3,278
Refap 98,519
12,174 2,156,225 3,280 -
Post-employment benefit plan
Odeprev 10,321
- - - 10,321
At September 30, 2011 15,924 2,156,225 3,224 10,321
At September 30, 2010 1,069,616 6,538,468 (2,339) 8,587
Income statement transactions from January 1 to September 30, 2011
Non-current liabilities September/2011 December/2010
Long-term incentives 3,850 5,372
Total 3,850 5,372
Income statement transactions 9M11 9M10
Remuneration
Short-term benefits to employees and managers 28,030 23,844
Post-employment benefit 169 196
Benefits on contract termination - 36
Long-term incentives 1,111 964
Total 29,310 25,040

Braskem S.A. Notes to the quarterly information at September 30, 2011 All amounts in R$ thousands unless otherwise stated
21
9. Taxes recoverable
(a) ICMS One of the main actions aimed at speeding up the use of the ICMS credits is the Agreement entered into with the State of Bahia in November 2009 that ensures the effective implementation of State Decree No. 11,807 of October 27, 2009, which (i) gradually reduced the effective ICMS rate on domestic naphtha acquired in that same state from 17% to 5.5% and, subsequently, allowed for the use of the credits from April 2011; and (ii) established that the amount of R$ 9,100 per month can be deducted from the debt balance between April 2011 and March 2014, and the amount of R$ 5,907 per month between April 2014 and March 2018.
(b) PIS and COFINS This account includes PIS and COFINS credits on the acquisition of property, plant and equipment items, the changes in which in the period total R$ 89,103, particularly the project for the expansion of the PVC plant in the State of Alagoas and the scheduled stoppages for maintenance.
(c) PIS – Decree-Laws No. 2,445 and No. 2,449/88 In the quarter, the Company recognized credits in the amount of R$ 91,431 as a result of the final and unappealable decision on lawsuits filed by Braskem and its merged companies. This amount will be used to offset future payments of federal taxes.
(d) Tax on Net Income - ILL In May 2011, the Company offset the amount of R$ 48,299 with federal taxes due. This table was presented in the Company’s 2010 annual financial statements, in Note 11.
September/2011 December/2010 September/2011 December/2010
Excise tax (IPI) 28,655 26,008 30,639 29,128
Value-added tax on sales and services (ICMS) (a) 631,623 795,390 1,025,001 1,211,256
Social integration program (PIS) and social contribution on revenues (COFINS) (b) 339,091 206,829 518,419 326,005
PIS and COFINS – Law No. 9,718/98 134,620 115,362 134,620 115,362
PIS – Decree-Laws No. 2,445 and No. 2.449/88 (c) 161,317 55,194 161,439 55,317
Income tax and social contribution 219,592 125,151 351,274 220,525
Tax on Net Income (ILL) (d) 21,049 61,126 21,049 61,126
Other 140,777 112,406 196,692 124,561
Total 1,676,724 1,497,466 2,439,133 2,143,280
Current assets 833,336 400,969 1,184,384 698,879
Non-current assets 843,388 1,096,497 1,254,749 1,444,401
Total 1,676,724 1,497,466 2,439,133 2,143,280
Parent company Consolidated

Braskem S.A. Notes to the quarterly information at September 30, 2011 All amounts in R$ thousands unless otherwise stated
22
10. Judicial deposits – Non-current assets
This table was presented in the Company’s 2010 annual financial statements, in Note 12.
September/2011 December/2010 September/2011 December/2010
Judicial deposits
Tax contingencies 80,784 110,757 95,487 110,764
Labor contingencies and other 92,800 117,131 105,915 139,431
Total 173,584 227,888 201,402 250,195
Parent company Consolidated
Braskem S.A. Notes to the quarterly information at September 30, 2011 All amounts in R$ thousands unless otherwise stated
23
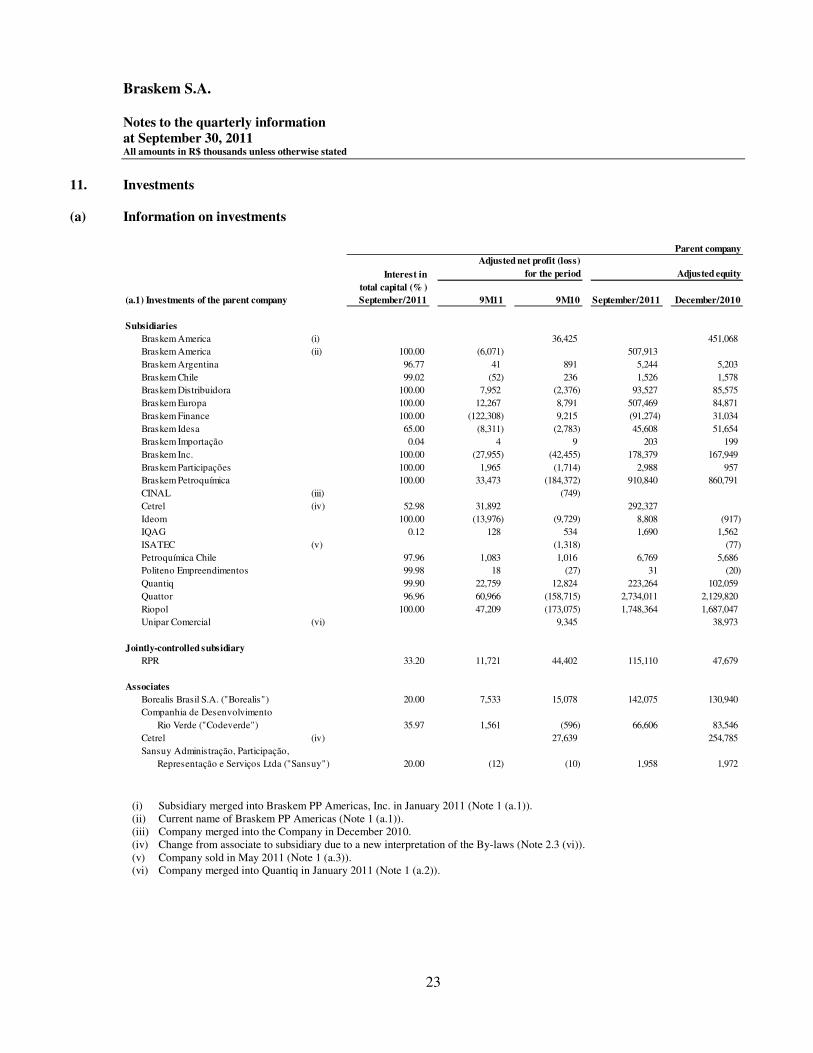
11. Investments
(a) Information on investments
(i) Subsidiary merged into Braskem PP Americas, Inc. in January 2011 (Note 1 (a.1)). (ii) Current name of Braskem PP Americas (Note 1 (a.1)). (iii) Company merged into the Company in December 2010. (iv) Change from associate to subsidiary due to a new interpretation of the By-laws (Note 2.3 (vi)). (v) Company sold in May 2011 (Note 1 (a.3)). (vi) Company merged into Quantiq in January 2011 (Note 1 (a.2)).
Interest in
total capital (% )
(a.1) Investments of the parent company September/2011 September/2011 December/2010
Subsidiaries
Braskem America (i) 36,425 451,068
Braskem America (ii) 100.00 (6,071) 507,913
Braskem Argentina 96.77 41 891 5,244 5,203
Braskem Chile 99.02 (52) 236 1,526 1,578
Braskem Distribuidora 100.00 7,952 (2,376) 93,527 85,575
Braskem Europa 100.00 12,267 8,791 507,469 84,871
Braskem Finance 100.00 (122,308) 9,215 (91,274) 31,034
Braskem Idesa 65.00 (8,311) (2,783) 45,608 51,654
Braskem Importação 0.04 4 9 203 199
Braskem Inc. 100.00 (27,955) (42,455) 178,379 167,949
Braskem Participações 100.00 1,965 (1,714) 2,988 957
Braskem Petroquímica 100.00 33,473 (184,372) 910,840 860,791
CINAL (iii) - (749)
Cetrel (iv) 52.98 31,892 292,327
Ideom 100.00 (13,976) (9,729) 8,808 (917)
IQAG 0.12 128 534 1,690 1,562
ISATEC (v) - (1,318) - (77)
Petroquímica Chile 97.96 1,083 1,016 6,769 5,686
Politeno Empreendimentos 99.98 18 (27) 31 (20)
Quantiq 99.90 22,759 12,824 223,264 102,059
Quattor 96.96 60,966 (158,715) 2,734,011 2,129,820
Riopol 100.00 47,209 (173,075) 1,748,364 1,687,047
Unipar Comercial (vi) - - 9,345 - 38,973
Jointly-controlled subsidiary -
RPR 33.20 11,721 44,402 115,110 47,679
-
Associates -
Borealis Brasil S.A. ("Borealis") 20.00 7,533 15,078 142,075 130,940
Companhia de Desenvolvimento
Rio Verde ("Codeverde") 35.97 1,561 (596) 66,606 83,546
Cetrel (iv) 27,639 254,785
Sansuy Administração, Participação,
Representação e Serviços Ltda ("Sansuy") 20.00 (12) (10) 1,958 1,972
Parent company
Adjusted net profit (loss)
for the period Adjusted equity
9M11 9M10

Braskem S.A. Notes to the quarterly information at September 30, 2011 All amounts in R$ thousands unless otherwise stated
24
(i) Change from associate to subsidiary due to a new interpretation of the By-laws (Note 2.3 (vi)).
Interest in
total capital (% )
September/2011 September/2011 December/2010
(a.2) Investments of subsidiaries
-
Braskem America -
Braskem America Finance 100.00 74 (2,846)
Braskem Chile
Braskem Argentina 3.17 41 891 5,244 5,203
Petroquímica Chile 2.03 1,083 1,016 6,769 5,686
Braskem Distribuidora
Braskem Importação 99.96 4 9 203 199
Braskem Argentina 0.06 41 891 5,244 5,203
Lantana 96.34 8,856 (2,213) 87,266 78,410
Braskem Europa -
Braskem Germany 100.00 (39) 206,285
Propilsur 49.00 (658) (3,566) 85,099 86,313
Polimerica 49.00 (130) (2,159) 59,663 57,067
Braskem Idesa
Braskem Idesa Serviços 100.00 253 1,931
Braskem Importação
Braskem Mexico 0.03 1,703 2,998 1,052
Braskem Inc. -
Braskem Chile 0.98 (52) 236 1,526 1,578
Lantana 3.66 8,856 (2,213) 87,266 78,410
Petroquímica Chile 0.01 1,083 1,016 6,769 5,686
Braskem Participações -
Braskem México 99.97 1,703 2,998 1,052
Politeno Empreendimentos 0.02 18 (27) 31 (20)
Quantiq 0.10 22,759 12,824 223,264 102,059
Braskem Petroquímica -
Quattor 3.04 60,966 (158,715) 2,734,011 2,129,820
Cetrel 1.25 31,892 - 292,327 -
Commom -
Norfolk 100.00 7,716 628 60,708 52,992
Quantiq -
IQAG 99.88 128 534 1,690 1,562
Quattor -
Commom 100.00 1,096 926 6,809 5,713
9M11 9M10
Adjusted net profit (loss)
for the period Adjusted equity
Parent company
Interest in
total capital (% )
September/2011 September/2011 December/2010
Associates
Borealis 20.00 7,533 15,078 142,075 130,940
Cetrel (i) 27,639 254,785
Codeverde 35.97 1,561 (596) 66,606 83,546
Sansuy 20.00 (12) (10) 1,958 1,972
9M11 9M10
Consolidated
Adjusted net profit (loss)
for the period Adjusted equity
Braskem S.A. Notes to the quarterly information at September 30, 2011 All amounts in R$ thousands unless otherwise stated
25
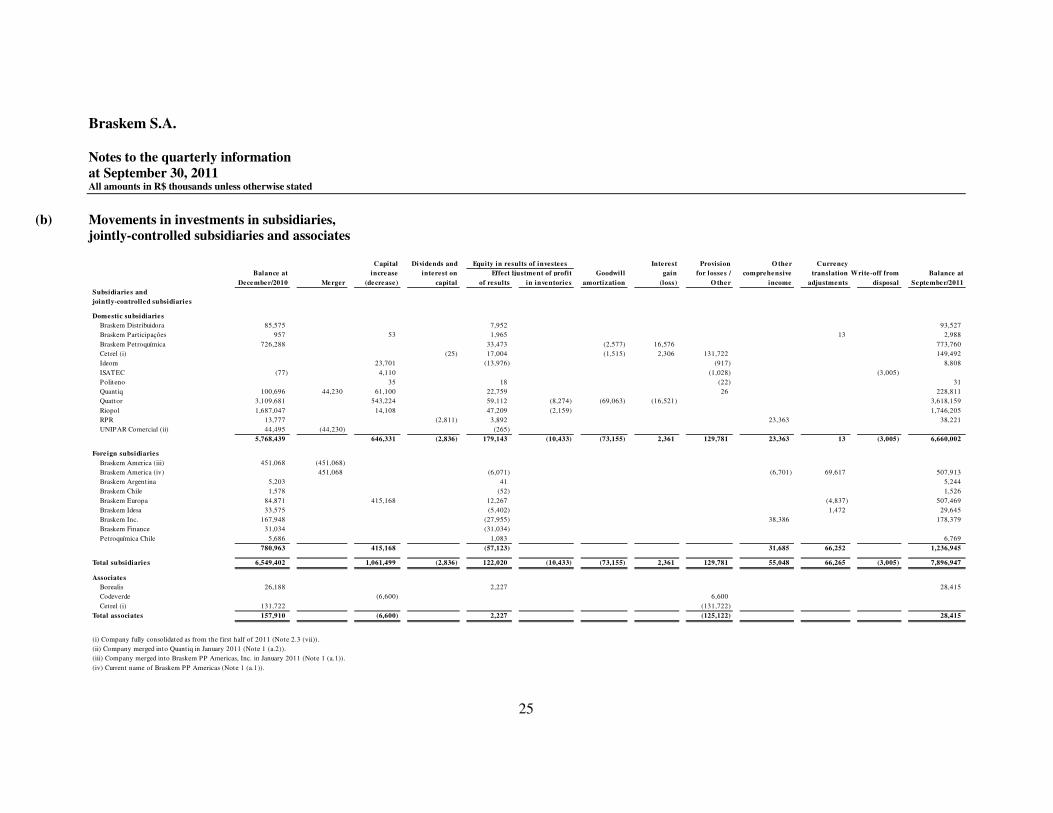
(b) Movements in investments in subsidiaries, jointly-controlled subsidiaries and associates
Capital Dividends and Interest Provision O ther Currency
Balance at increase interest on EffectAdjustment of profit Goodwill gain for losses / comprehensive translation Write-off from Balance at
December/2010 Merger (decrease) capital of results in inventories amortization (loss) O ther income adjustments disposal September/2011
Subsidiaries and
jointly-controlled subsidiaries
Domestic subsidiaries
Braskem Distribuidora 85,575 7,952 - 93,527
Braskem Participações 957 53 1,965 13 - 2,988
Braskem Petroquímica 726,288 - 33,473 (2,577) 16,576 - 773,760
Cetrel (i) (25) 17,004 (1,515) 2,306 131,722 - - - 149,492
Ideom 23,701 (13,976) (917) 8,808
ISATEC (77) 4,110 (1,028) (3,005) -
Politeno 35 18 (22) 31
Quantiq 100,696 44,230 61,100 22,759 - 26 - 228,811
Quattor 3,109,681 543,224 59,112 (8,274) (69,063) (16,521) 3,618,159
Riopol 1,687,047 14,108 47,209 (2,159) - 1,746,205
RPR 13,777 (2,811) 3,892 23,363 - 38,221
UNIPAR Comercial (ii) 44,495 (44,230) (265) - -
5,768,439 - 646,331 (2,836) 179,143 (10,433) (73,155) 2,361 129,781 23,363 13 (3,005) 6,660,002
Foreign subsidiaries
Braskem America (iii) 451,068 (451,068) - -
Braskem America (iv) - 451,068 (6,071) (6,701) 69,617 507,913
Braskem Argentina 5,203 41 5,244
Braskem Chile 1,578 (52) 1,526
Braskem Europa 84,871 415,168 12,267 (4,837) 507,469
Braskem Idesa 33,575 (5,402) 1,472 29,645
Braskem Inc. 167,948 (27,955) 38,386 178,379
Braskem Finance 31,034 (31,034) -
Petroquímica Chile 5,686 1,083 6,769
780,963 - 415,168 - (57,123) - - - - 31,685 66,252 - 1,236,945
Total subsidiaries 6,549,402 - 1,061,499 (2,836) 122,020 (10,433) (73,155) 2,361 129,781 55,048 66,265 (3,005) 7,896,947
Associates
Borealis 26,188 - 2,227 - - - - - 28,415
Codeverde - - (6,600) 6,600 -
Cetrel (i) 131,722 (131,722) -
Total associates 157,910 - (6,600) - 2,227 - - - (125,122) - - - 28,415
(i) Company fully consolidated as from the first half of 2011 (Note 2.3 (vii)).
(ii) Company merged into Quantiq in January 2011 (Note 1 (a.2)).
(iii) Company merged into Braskem PP Americas, Inc. in January 2011 (Note 1 (a.1)).
(iv) Current name of Braskem PP Americas (Note 1 (a.1)).
Equity in results of investees

Braskem S.A. Notes to the quarterly information at September 30, 2011 All amounts in R$ thousands unless otherwise stated
26
(c) Breakdown of equity results
(i) The amortization of the goodwill on the assets and liabilities from the business combinations of Quattor,
amounting to R$ 69,063, is distributed among the following accounts in the consolidated income statement: “net sales revenue”, amounting to R$ 13,250, “cost of products sold”, amounting to R$ 71,890, “general and administrative expenses”, amounting to R$ 68 and “financial results”, amounting to R$ 19,433. The effect of deferred income tax and social contribution was R$ 35,578. The amortization of goodwill on property, plant and equipment includes the amount of R$ 4,092 of the subsidiaries Braskem Petroquímica and Cetrel.
(ii) Includes a provision for loss of the subsidiary Braskem Finance in the amount of R$ 91,274.
The information related to investments was presented in the Company’s 2010 annual financial statements, in Note 13.
Parent company Consolidated
9M11 9M10 9M11 9M10
Equity in results of subsidiaries and jointly-controlled subsidiaries 111,587 128,375 (263) 7,130
Equity in results of associates 2,227 20,311 1,872 20,885
Amortization of goodwill (73,155) (i) (2,619) (4,092) (i) (2,860)
Provision for losses on investments (92,320) (ii) (8,025) (18)
Dividends received from other investments / other 476 450
(51,185) 138,042 (2,051) 25,155
Braskem S.A. Notes to the quarterly information at September 30, 2011 All amounts in R$ thousands unless otherwise stated
27
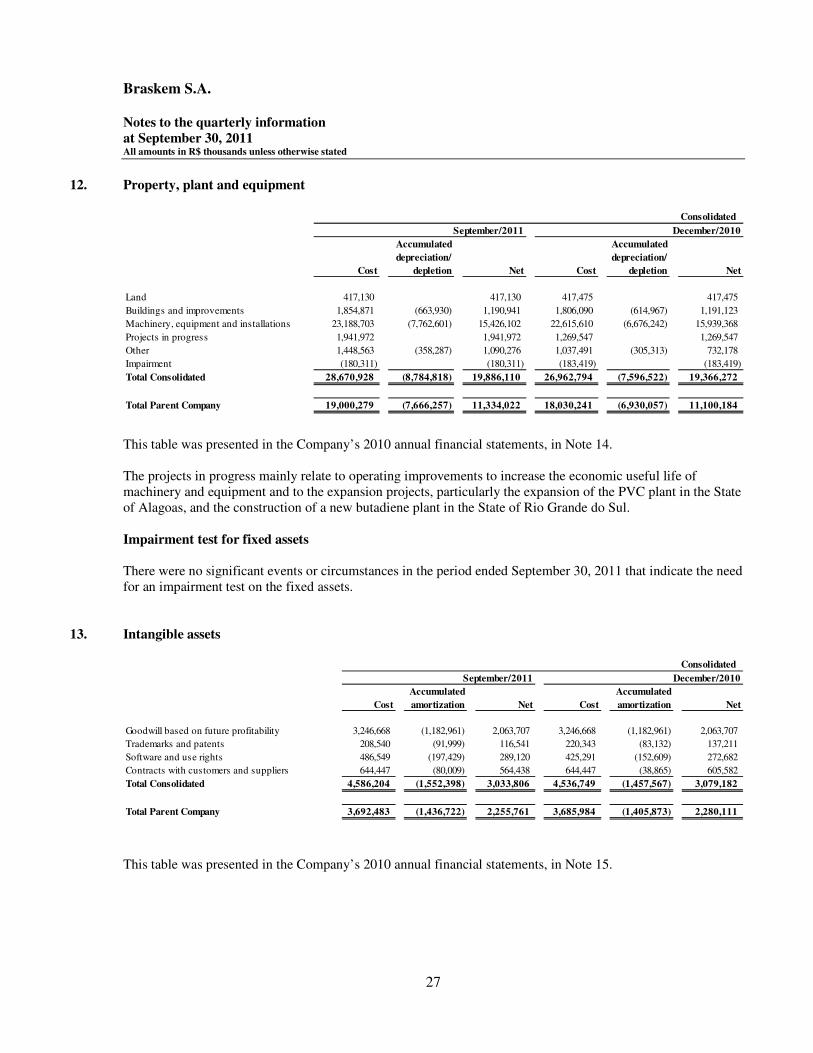
12. Property, plant and equipment
This table was presented in the Company’s 2010 annual financial statements, in Note 14. The projects in progress mainly relate to operating improvements to increase the economic useful life of machinery and equipment and to the expansion projects, particularly the expansion of the PVC plant in the State of Alagoas, and the construction of a new butadiene plant in the State of Rio Grande do Sul. Impairment test for fixed assets There were no significant events or circumstances in the period ended September 30, 2011 that indicate the need for an impairment test on the fixed assets.
13. Intangible assets
This table was presented in the Company’s 2010 annual financial statements, in Note 15.
September/2011 December/2010
Accumulated Accumulated
depreciation/ depreciation/
Cost depletion Net Cost depletion Net
Land 417,130 - 417,130 417,475 - 417,475
Buildings and improvements 1,854,871 (663,930) 1,190,941 1,806,090 (614,967) 1,191,123
Machinery, equipment and installations 23,188,703 (7,762,601) 15,426,102 22,615,610 (6,676,242) 15,939,368
Projects in progress 1,941,972 - 1,941,972 1,269,547 - 1,269,547
Other 1,448,563 (358,287) 1,090,276 1,037,491 (305,313) 732,178
Impairment (180,311) (180,311) (183,419) - (183,419)
Total Consolidated 28,670,928 (8,784,818) 19,886,110 26,962,794 (7,596,522) 19,366,272
Total Parent Company 19,000,279 (7,666,257) 11,334,022 18,030,241 (6,930,057) 11,100,184
Consolidated
September/2011
Accumulated Accumulated
Cost amortization Net Cost amortization Net
Goodwill based on future profitability 3,246,668 (1,182,961) 2,063,707 3,246,668 (1,182,961) 2,063,707
Trademarks and patents 208,540 (91,999) 116,541 220,343 (83,132) 137,211
Software and use rights 486,549 (197,429) 289,120 425,291 (152,609) 272,682
Contracts with customers and suppliers 644,447 (80,009) 564,438 644,447 (38,865) 605,582
Total Consolidated 4,586,204 (1,552,398) 3,033,806 4,536,749 (1,457,567) 3,079,182
Total Parent Company 3,692,483 (1,436,722) 2,255,761 3,685,984 (1,405,873) 2,280,111
December/2010
Consolidated
Braskem S.A. Notes to the quarterly information at September 30, 2011 All amounts in R$ thousands unless otherwise stated
28
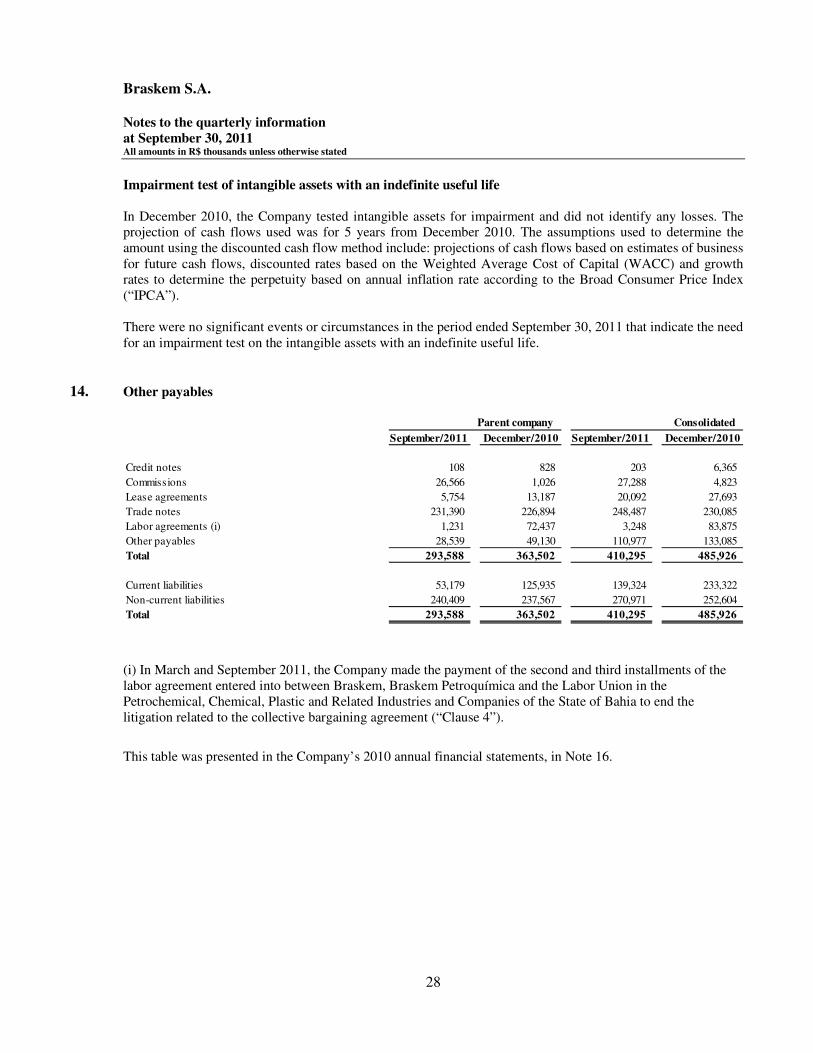
Impairment test of intangible assets with an indefinite useful life In December 2010, the Company tested intangible assets for impairment and did not identify any losses. The projection of cash flows used was for 5 years from December 2010. The assumptions used to determine the amount using the discounted cash flow method include: projections of cash flows based on estimates of business for future cash flows, discounted rates based on the Weighted Average Cost of Capital (WACC) and growth rates to determine the perpetuity based on annual inflation rate according to the Broad Consumer Price Index (“IPCA”). There were no significant events or circumstances in the period ended September 30, 2011 that indicate the need for an impairment test on the intangible assets with an indefinite useful life.
14. Other payables
(i) In March and September 2011, the Company made the payment of the second and third installments of the labor agreement entered into between Braskem, Braskem Petroquímica and the Labor Union in the Petrochemical, Chemical, Plastic and Related Industries and Companies of the State of Bahia to end the litigation related to the collective bargaining agreement (“Clause 4”).
This table was presented in the Company’s 2010 annual financial statements, in Note 16.
September/2011 December/2010 September/2011 December/2010
Credit notes 108 828 203 6,365
Commissions 26,566 1,026 27,288 4,823
Lease agreements 5,754 13,187 20,092 27,693
Trade notes 231,390 226,894 248,487 230,085
Labor agreements (i) 1,231 72,437 3,248 83,875
Other payables 28,539 49,130 110,977 133,085
Total 293,588 363,502 410,295 485,926
Current liabilities 53,179 125,935 139,324 233,322
Non-current liabilities 240,409 237,567 270,971 252,604
Total 293,588 363,502 410,295 485,926
Parent company Consolidated

Braskem S.A. Notes to the quarterly information at September 30, 2011 All amounts in R$ thousands unless otherwise stated
29
15. Borrowings
(i) UMBNDES = monetary unit of BNDES (National Bank for Economic and Social Development). (ii) In April 2011, the Company paid for part of this financing in advance. (iii) In July 2011, the subsidiary Braskem America settled this financing in advance.
Consolidated
Monetary adjustment September/2011 December/2010
Fore ign currency
Eurobonds Note 15 (a) Note 15 (a) 5,965,116 3,927,712
Advances on exchange contracts US dollar exchange variation 1.61% 148,378
Export prepayments Note 15 (b) Note 15 (b) 1,782,307 2,287,738
Medium-Term Notes (ii) US dollar exchange variation 11.75% 159,925 438,031
Raw material financing US dollar exchange variation 2.60% 10,537 15,142
Financing for the acquisition of investments (iii) US dollar exchange variation 4,45% 352,480
Financing for the acquisition of investments US dollar exchange variation 1.70% to 1.80% above Libor 185,463
BNDES Post-fixed monetary
adjustment (UMBNDES) (i)
6.04% 7,306 11,383
BNDES US dollar exchange variation 6.08% 370,467 296,318
Working capital US dollar exchange variation 7.67% 716,403 658,942
Working capital US dollar exchange variation 101.25% to 105.5% of CDI 1,301
Project financing (NEXI) Yen exchange variation 0.95% above T ibor 40,640 66,602
T ransaction costs, net (82,833) (29,195) -
Local currency -
Working capital 98.5% to 112.5% of CDI 1,557,481 867,570
Working capital 12.14% 289,956 266,145
Acquisit ion of machinery and equipment (FINAME) T JLP 1.36% 6,685 9,842
Acquisit ion of machinery and equipment (FINAME) T JLP 4.77% 1,718 1,024
BNDES T JLP 3.05% 2,419,504 2,419,712
BNDES T JLP 4.54% 18,292 -
Support to the production of goods for export
(BNDES EXIM)
7.00% 150,423 150,452
Banco do Nordeste do Brasil (BNB) 8.50% 182,411 213,686
Project financing (FINEP) T JLP 0.01% 41,561 61,975
Project financing (FINEP) T JLP 4.67% 37,523 10,004
Project financing (FUNDES) 6.00% 203,201 187,419
T ransaction costs, net (1,805) (3,538)
Total 14,210,659 12,210,745
Current liabilities 1,399,317 1,206,444
Non-current liabilities 12,811,342 11,004,301
Total 14,210,659 12,210,745
Annual financial charges
Average interest rates
(unless otherwise stated)
Braskem S.A. Notes to the quarterly information at September 30, 2011 All amounts in R$ thousands unless otherwise stated
30
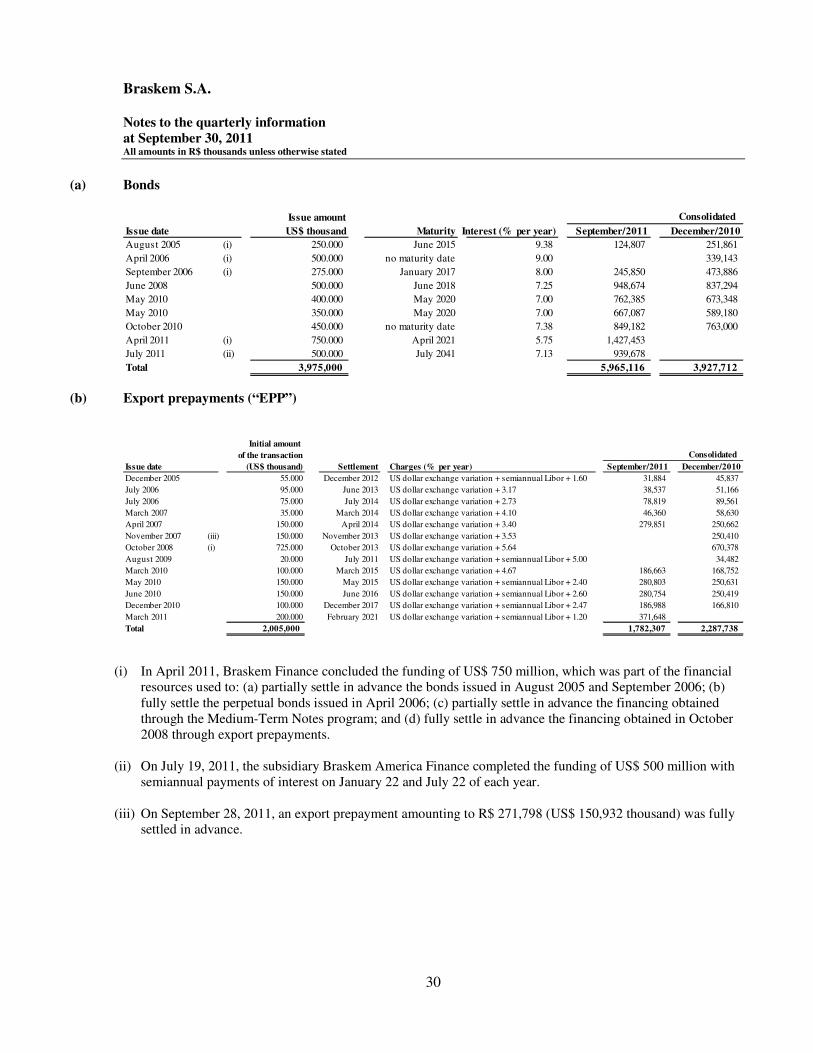
(a) Bonds
(b) Export prepayments (“EPP”)
(i) In April 2011, Braskem Finance concluded the funding of US$ 750 million, which was part of the financial resources used to: (a) partially settle in advance the bonds issued in August 2005 and September 2006; (b) fully settle the perpetual bonds issued in April 2006; (c) partially settle in advance the financing obtained through the Medium-Term Notes program; and (d) fully settle in advance the financing obtained in October 2008 through export prepayments.
(ii) On July 19, 2011, the subsidiary Braskem America Finance completed the funding of US$ 500 million with
semiannual payments of interest on January 22 and July 22 of each year.
(iii) On September 28, 2011, an export prepayment amounting to R$ 271,798 (US$ 150,932 thousand) was fully settled in advance.
Issue amount
Issue date US$ thousand Maturity Interest (% per year) September/2011 December/2010
August 2005 (i) 250.000 June 2015 9.38 124,807 251,861
April 2006 (i) 500.000 no maturity date 9.00 339,143
September 2006 (i) 275.000 January 2017 8.00 245,850 473,886
June 2008 500.000 June 2018 7.25 948,674 837,294
May 2010 400.000 May 2020 7.00 762,385 673,348
May 2010 350.000 May 2020 7.00 667,087 589,180
October 2010 450.000 no maturity date 7.38 849,182 763,000
April 2011 (i) 750.000 April 2021 5.75 1,427,453
July 2011 (ii) 500.000 July 2041 7.13 939,678
Total 3,975,000 5,965,116 3,927,712
Consolidated
Initial amount
of the transaction
Issue date (US$ thousand) Settlement Charges (% per year) September/2011 December/2010
December 2005 55.000 December 2012 US dollar exchange variation + semiannual Libor + 1.60 31,884 45,837
July 2006 95.000 June 2013 US dollar exchange variation + 3.17 38,537 51,166
July 2006 75.000 July 2014 US dollar exchange variation + 2.73 78,819 89,561
March 2007 35.000 March 2014 US dollar exchange variation + 4.10 46,360 58,630
April 2007 150.000 April 2014 US dollar exchange variation + 3.40 279,851 250,662
November 2007 (iii) 150.000 November 2013 US dollar exchange variation + 3.53 250,410
October 2008 (i) 725.000 October 2013 US dollar exchange variation + 5.64 670,378
August 2009 20.000 July 2011 US dollar exchange variation + semiannual Libor + 5.00 34,482
March 2010 100.000 March 2015 US dollar exchange variation + 4.67 186,663 168,752
May 2010 150.000 May 2015 US dollar exchange variation + semiannual Libor + 2.40 280,803 250,631
June 2010 150.000 June 2016 US dollar exchange variation + semiannual Libor + 2.60 280,754 250,419
December 2010 100.000 December 2017 US dollar exchange variation + semiannual Libor + 2.47 186,988 166,810
March 2011 200.000 February 2021 US dollar exchange variation + semiannual Libor + 1.20 371,648 -
Total 2,005,000 1,782,307 2,287,738
Consolidated
Braskem S.A. Notes to the quarterly information at September 30, 2011 All amounts in R$ thousands unless otherwise stated
31
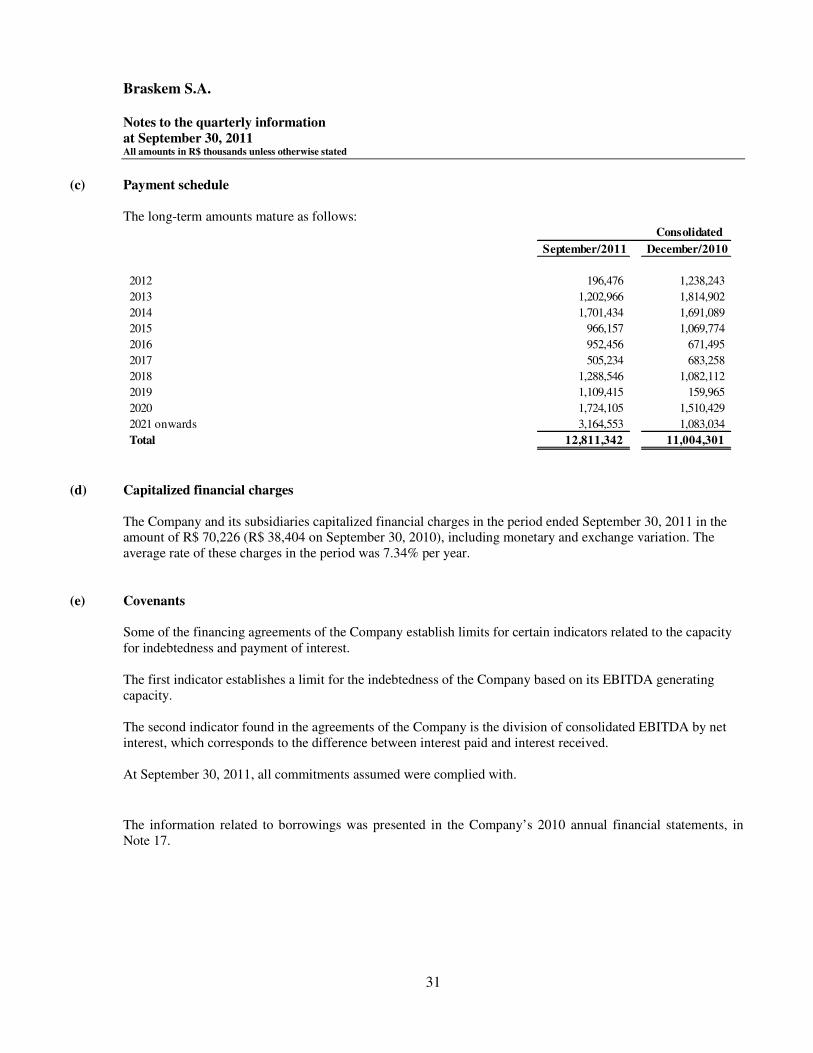
(c) Payment schedule
The long-term amounts mature as follows:
(d) Capitalized financial charges
The Company and its subsidiaries capitalized financial charges in the period ended September 30, 2011 in the amount of R$ 70,226 (R$ 38,404 on September 30, 2010), including monetary and exchange variation. The average rate of these charges in the period was 7.34% per year.
(e) Covenants
Some of the financing agreements of the Company establish limits for certain indicators related to the capacity for indebtedness and payment of interest. The first indicator establishes a limit for the indebtedness of the Company based on its EBITDA generating capacity. The second indicator found in the agreements of the Company is the division of consolidated EBITDA by net interest, which corresponds to the difference between interest paid and interest received. At September 30, 2011, all commitments assumed were complied with.
The information related to borrowings was presented in the Company’s 2010 annual financial statements, in Note 17.
September/2011 December/2010
2012 196,476 1,238,243
2013 1,202,966 1,814,902
2014 1,701,434 1,691,089
2015 966,157 1,069,774
2016 952,456 671,495
2017 505,234 683,258
2018 1,288,546 1,082,112
2019 1,109,415 159,965
2020 1,724,105 1,510,429
2021 onwards 3,164,553 1,083,034
Total 12,811,342 11,004,301
Consolidated

Braskem S.A. Notes to the quarterly information at September 30, 2011 All amounts in R$ thousands unless otherwise stated
32
16. Debentures (public issue of non-convertible debentures) On September 1, 2011, the Company paid the amount of R$ 530,424 for non-convertible debentures related to the 14th issue started in August 2006. On September 30, 2011, the balance of R$ 18,518 refers to the first issue of non-convertible debentures of the jointly-controlled subsidiary RPR presented in the consolidated non-current liability. The information on debentures was presented in the Company’s 2010 annual financial statements, in Note 18.
17. Financial instruments
17.1. Risk management The Company is exposed to market risks arising from variations in commodity prices, foreign exchange and interest rates; to credit risk arising from the possibility of default by its counterparties in cash equivalents, financial investments and trade accounts receivable; and to liquidity risk to meet its obligations related to financial liabilities. The Company adopts procedures for managing market and credit risks that are in conformity with the new Financial Policy approved by the Board of Directors on August 9, 2010. The purpose of risk management is to protect the cash flows of the Company and reduce the threats to the financing of its operating working capital and investment programs.
(a) Market risk The Company prepares a sensitivity analysis for each type of market risk to which it is exposed, which is presented in Note 17.5.
(b) Credit risk The maximum exposure to credit risks of non-derivative assets on the reporting date is their carrying amounts less any impairment loss. On September 30, 2011, the balance of trade accounts receivable is net of the allowance for doubtful accounts and amounts to R$ 273,333 (December 31, 2010 – R$ 269,159).
(c) Liquidity risk The analysis of the borrowings of the Company by maturity is presented in Note 15 (c) and of the derivative financial instruments is presented in Note 17.3.1. In addition, the Company has two revolving credit lines of (i) US$350 million, which may be used without restrictions for three years as of September, 2010 and (ii) as from August 2011, an additional US$ 250 million that may be used for five years, which allows for the reduction of the amount of cash maintained by Braskem. The information on risk management was presented in the Company’s 2010 annual financial statements, in Note 19.
Braskem S.A. Notes to the quarterly information at September 30, 2011 All amounts in R$ thousands unless otherwise stated
33
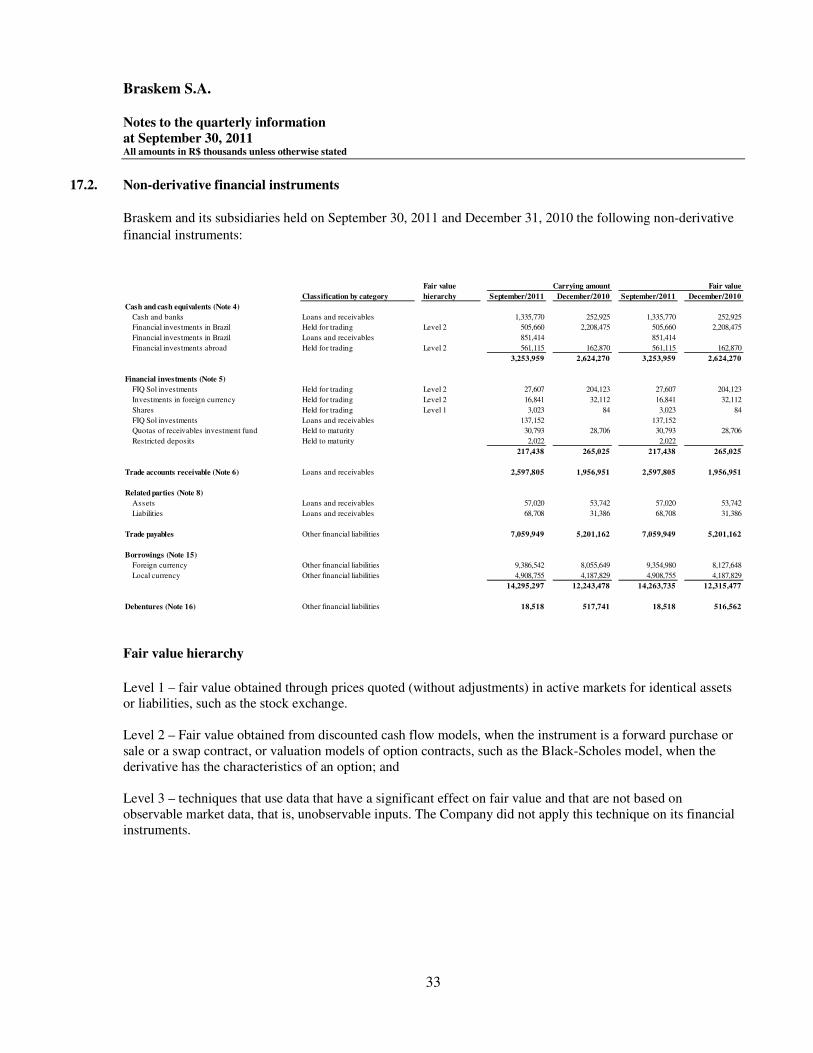
17.2. Non-derivative financial instruments
Braskem and its subsidiaries held on September 30, 2011 and December 31, 2010 the following non-derivative
financial instruments:
Fair value hierarchy
Level 1 – fair value obtained through prices quoted (without adjustments) in active markets for identical assets or liabilities, such as the stock exchange. Level 2 – Fair value obtained from discounted cash flow models, when the instrument is a forward purchase or sale or a swap contract, or valuation models of option contracts, such as the Black-Scholes model, when the derivative has the characteristics of an option; and Level 3 – techniques that use data that have a significant effect on fair value and that are not based on observable market data, that is, unobservable inputs. The Company did not apply this technique on its financial instruments.
Fair value
Classification by category hierarchy September/2011 December/2010 September/2011 December/2010
Cash and cash equivalents (Note 4)
Cash and banks Loans and receivables 1,335,770 252,925 1,335,770 252,925
Financial investments in Brazil Held for trading Level 2 505,660 2,208,475 505,660 2,208,475
Financial investments in Brazil Loans and receivables 851,414 - 851,414 -
Financial investments abroad Held for trading Level 2 561,115 162,870 561,115 162,870
3,253,959 2,624,270 3,253,959 2,624,270
Financial investments (Note 5)
FIQ Sol investments Held for trading Level 2 27,607 204,123 27,607 204,123
Investments in foreign currency Held for trading Level 2 16,841 32,112 16,841 32,112
Shares Held for trading Level 1 3,023 84 3,023 84
FIQ Sol investments Loans and receivables 137,152 - 137,152 -
Quotas of receivables investment fund Held to maturity 30,793 28,706 30,793 28,706
Restricted deposits Held to maturity 2,022 2,022
217,438 265,025 217,438 265,025
Trade accounts receivable (Note 6) Loans and receivables 2,597,805 1,956,951 2,597,805 1,956,951
Related parties (Note 8)
Assets Loans and receivables 57,020 53,742 57,020 53,742
Liabilities Loans and receivables 68,708 31,386 68,708 31,386
Trade payables Other financial liabilities 7,059,949 5,201,162 7,059,949 5,201,162
Borrowings (Note 15)
Foreign currency Other financial liabilities 9,386,542 8,055,649 9,354,980 8,127,648
Local currency Other financial liabilities 4,908,755 4,187,829 4,908,755 4,187,829
14,295,297 12,243,478 14,263,735 12,315,477
Debentures (Note 16) Other financial liabilities 18,518 517,741 18,518 516,562
Carrying amount Fair value

Braskem S.A. Notes to the quarterly information at September 30, 2011 All amounts in R$ thousands unless otherwise stated
34
17.3. Derivative financial instruments
The table below shows the transactions with derivative financial instruments of Braskem and its subsidiaries as of September 30, 2011 and December 31, 2010.
Change in
Nominal Financial fair value
Identification Hedge value December/2010 settlement Note (17.3.2) September/2011
Non-hedge accounting transactions
Foreign exchange swap Note 17.3.1 (a) Yen CDI R$ 279,495 13,700 (11,090) (4,343) (1,733)
Foreign exchange swap Note 17.3.1 (a) US dollar CDI R$ 400,000 54,882 54,882
Repurchase of shares swap (i) Note 17.3.1 (a) Shares CDI R$ 3,707 63 63
R$ 683,202 13,700 (11,090) 50,602 53,212
Hedge accounting transactions
Braskem Inc.
Interest rate swaps Note 17.3.1 (b) Libor Contractual fixed rate US$ 400,000 thousand 42,890 (34,950) (7,940) -
Braskem
Interest rate swaps Note 17.3.1 (b) Libor Contractual fixed rate US$ 526,146 thousand 25,988 (9,945) 7,999 24,042
Braskem
Interest rate swaps Note 17.3.1 (b) Pre-contractual rate CDI US$ 42,612 thousand 456 - (1,368) (912)
Braskem America
Interest rate swaps Note 17.3.1 (b) Libor Contractual fixed rate US$ 210,000 thousand 1,523 (4,405) 2,882 -
Braskem America
Sale swaps Note 17.3.1 (b) US$ 29,268 thousand (1,300) - 7,977 6,677
US$ 1,208,026 thousand 69,557 (49,300) 9,550 29,807
Current assets (other receivables) (1,300) - - (2,645)
Current liabilities (hedge transactions) 50,124 - - 71,639
Non-current liabilities (hedge transactions) 34,433 - - 14,025
83,257 83,019
(i) Braskem shares were repurchased by a financial institut ion and are the subject of a swap operation (Note 24 (d)).
Interest rate /Currency
Exposure of the
principal amount
Braskem S.A. Notes to the quarterly information at September 30, 2011 All amounts in R$ thousands unless otherwise stated
35
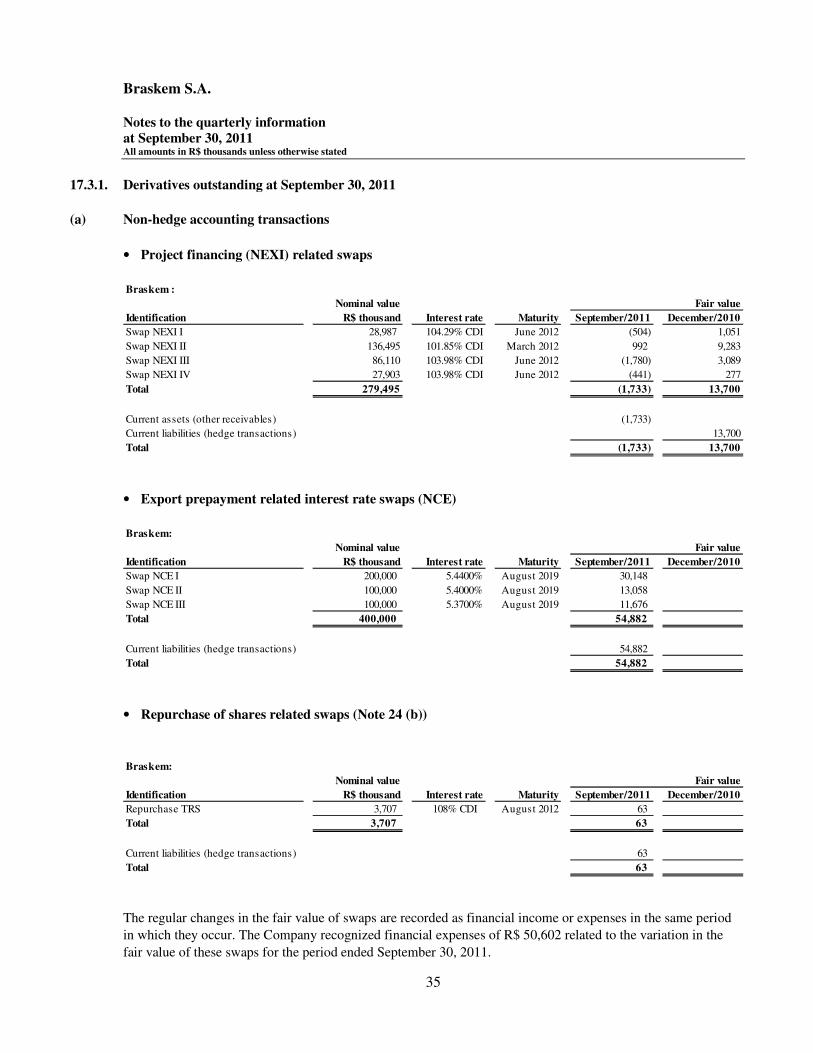
17.3.1. Derivatives outstanding at September 30, 2011
(a) Non-hedge accounting transactions
• Project financing (NEXI) related swaps
• Export prepayment related interest rate swaps (NCE)
• Repurchase of shares related swaps (Note 24 (b))
The regular changes in the fair value of swaps are recorded as financial income or expenses in the same period
in which they occur. The Company recognized financial expenses of R$ 50,602 related to the variation in the
fair value of these swaps for the period ended September 30, 2011.
Braskem :
Nominal value
R$ thousand September/2011 December/2010
Swap NEXI I 28,987 104.29% CDI June 2012 (504) 1,051
Swap NEXI II 136,495 101.85% CDI March 2012 992 9,283
Swap NEXI III 86,110 103.98% CDI June 2012 (1,780) 3,089
Swap NEXI IV 27,903 103.98% CDI June 2012 (441) 277
Total 279,495 (1,733) 13,700
Current assets (other receivables) (1,733)
Current liabilities (hedge transactions) 13,700
Total (1,733) 13,700
Identification Interest rate Maturity
Fair value
Nominal value
R$ thousand September/2011 December/2010
Swap NCE I 200,000 5.4400% August 2019 30,148
Swap NCE II 100,000 5.4000% August 2019 13,058
Swap NCE III 100,000 5.3700% August 2019 11,676
Total 400,000 54,882 -
Current liabilities (hedge transactions) 54,882
Total 54,882 -
Braskem:
Identification Interest rate Maturity
Fair value
Braskem:
Nominal value
R$ thousand September/2011 December/2010
Repurchase TRS 3,707 108% CDI August 2012 63
Total 3,707 63 -
Current liabilities (hedge transactions) 63
Total 63 -
Interest rate Maturity
Fair value
Identification

Braskem S.A. Notes to the quarterly information at September 30, 2011 All amounts in R$ thousands unless otherwise stated
36
(b) Hedge accounting transactions
As a consequence of the advanced payment of the (i) bond and export prepayment contracts mentioned in Note
15 (a) and (b), and (ii) financing for the acquisition of the investment mentioned in Note 15 (iii) the Company
settled in advance interest rate swap transactions that would mature in October 2013 and April 2015.
• Export prepayment related interest rate swaps
• Agribusiness credit notes (NCA) related swaps
Braskem:
Nominal value
US$ thousand September/2011 December/2010
Swap EPP X 35.000 2.5040% March 2014 1,289 1,786
Swap EPP XI 75.000 1.9450% July 2014 1,479 1,455
Swap EPP XII 100.000 2.1200% November 2013 - 4,061
Swap EPP XIII 50.000 2.1500% November 2013 - 2,082
Swap EPP XIV 50.000 2.6350% April 2014 4,722 3,734
Swap EPP XV 100.000 2.6200% April 2014 9,376 7,392
Swap EPP XVI 47.500 1.6650% June 2013 333 606
Swap EPP XVII 75.000 2.1975% March 2015 5,154 3,684
Swap EPP XIX 25.000 2.1700% March 2015 1,689 1,188
Total 557.500 24,042 25,988
Current liabilities (hedge transactions) 10,017 13,918
Non-current liabilities (hedge transactions) 14,025 12,070
Total 24,042 25,988
Identification Interest rate Maturity
Fair value
Braskem:
Nominal value
US$ thousand September/2011 December/2010
Swap NCA I 42.612 100.70% CDI September 2012 (912) 456
Total 42.612 (912) 456
Current assets (other receivables) (912) -
Non-current liabilities (hedge transactions) - 456
Total (912) 456
Fair value
Identification Interest rate Maturity
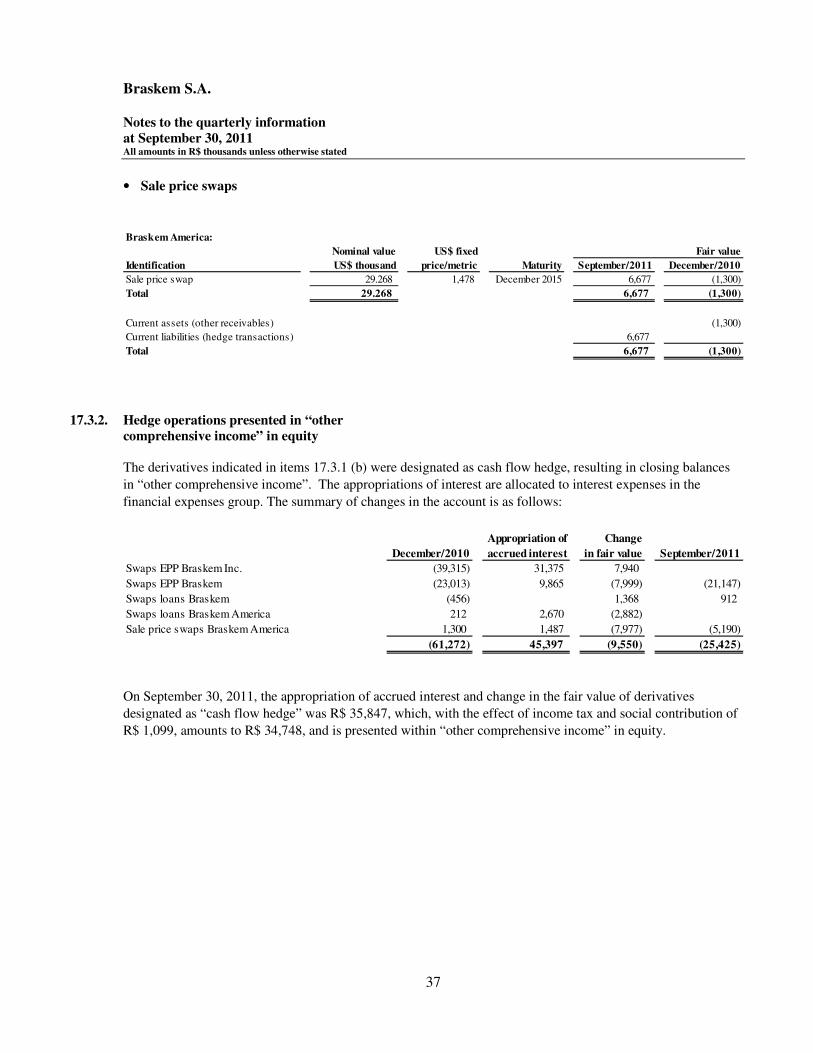
Braskem S.A. Notes to the quarterly information at September 30, 2011 All amounts in R$ thousands unless otherwise stated
37
• Sale price swaps
17.3.2. Hedge operations presented in “other comprehensive income” in equity The derivatives indicated in items 17.3.1 (b) were designated as cash flow hedge, resulting in closing balances
in “other comprehensive income”. The appropriations of interest are allocated to interest expenses in the
financial expenses group. The summary of changes in the account is as follows:
On September 30, 2011, the appropriation of accrued interest and change in the fair value of derivatives
designated as “cash flow hedge” was R$ 35,847, which, with the effect of income tax and social contribution of
R$ 1,099, amounts to R$ 34,748, and is presented within “other comprehensive income” in equity.
Braskem America:
Nominal value
US$ thousand September/2011 December/2010
Sale price swap 29.268 1,478 December 2015 6,677 (1,300)
Total 29.268 6,677 (1,300)
Current assets (other receivables) (1,300)
Current liabilities (hedge transactions) 6,677
Total 6,677 (1,300)
Fair value
Identification
US$ fixed
price/metric Maturity
Appropriation of Change
December/2010 accrued interest in fair value September/2011
Swaps EPP Braskem Inc. (39,315) 31,375 7,940 -
Swaps EPP Braskem (23,013) 9,865 (7,999) (21,147)
Swaps loans Braskem (456) - 1,368 912
Swaps loans Braskem America 212 2,670 (2,882) -
Sale price swaps Braskem America 1,300 1,487 (7,977) (5,190)
(61,272) 45,397 (9,550) (25,425)
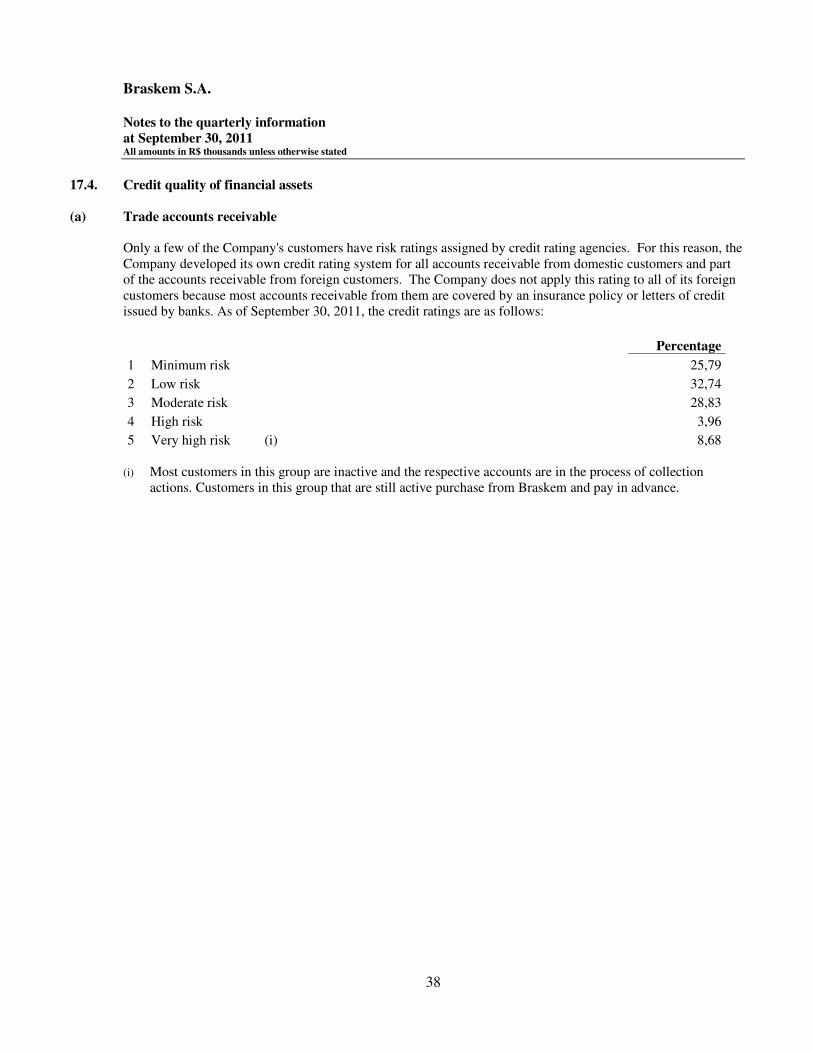
Braskem S.A. Notes to the quarterly information at September 30, 2011 All amounts in R$ thousands unless otherwise stated
38
17.4. Credit quality of financial assets
(a) Trade accounts receivable Only a few of the Company's customers have risk ratings assigned by credit rating agencies. For this reason, the Company developed its own credit rating system for all accounts receivable from domestic customers and part of the accounts receivable from foreign customers. The Company does not apply this rating to all of its foreign customers because most accounts receivable from them are covered by an insurance policy or letters of credit issued by banks. As of September 30, 2011, the credit ratings are as follows:
Percentage
1 Minimum risk 25,79
2 Low risk 32,74
3 Moderate risk 28,83
4 High risk 3,96
5 Very high risk (i) 8,68
(i) Most customers in this group are inactive and the respective accounts are in the process of collection actions. Customers in this group that are still active purchase from Braskem and pay in advance.
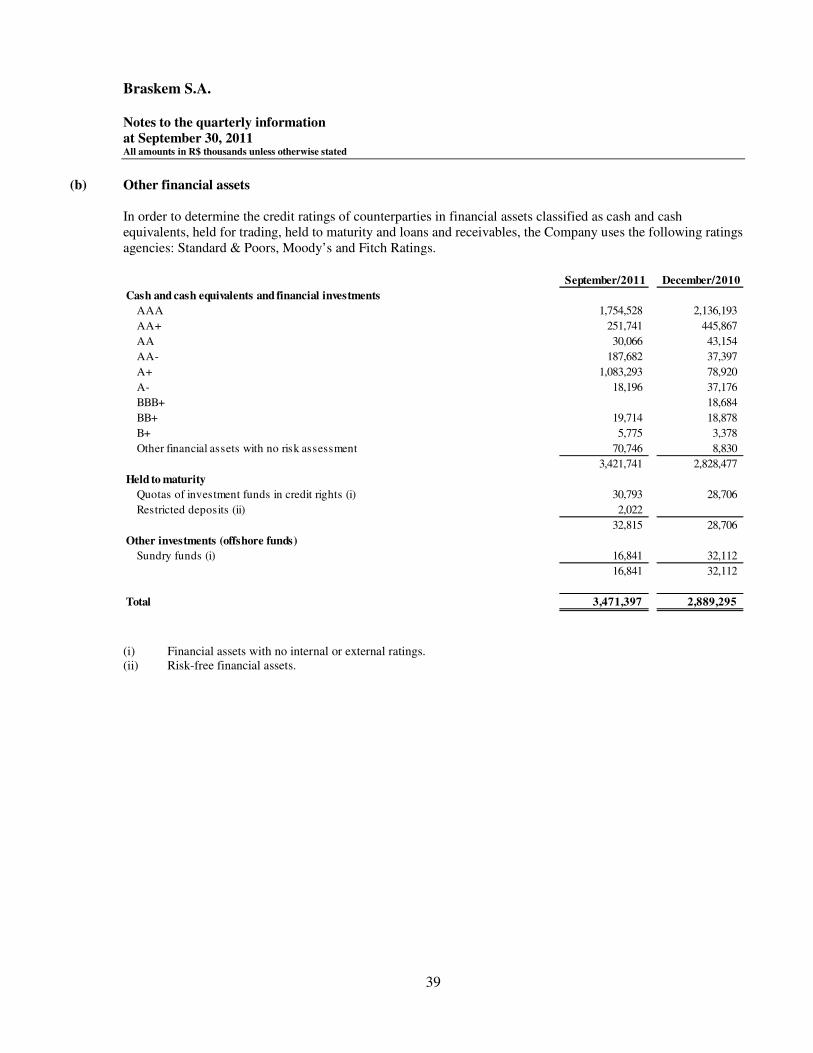
Braskem S.A. Notes to the quarterly information at September 30, 2011 All amounts in R$ thousands unless otherwise stated
39
(b) Other financial assets In order to determine the credit ratings of counterparties in financial assets classified as cash and cash equivalents, held for trading, held to maturity and loans and receivables, the Company uses the following ratings agencies: Standard & Poors, Moody’s and Fitch Ratings.
(i) Financial assets with no internal or external ratings. (ii) Risk-free financial assets.
September/2011 December/2010
Cash and cash equivalents and financial investments
AAA 1,754,528 2,136,193
AA+ 251,741 445,867
AA 30,066 43,154
AA- 187,682 37,397
A+ 1,083,293 78,920
A- 18,196 37,176
BBB+ - 18,684
BB+ 19,714 18,878
B+ 5,775 3,378
Other financial assets with no risk assessment 70,746 8,830
3,421,741 2,828,477
Held to maturity
Quotas of investment funds in credit rights (i) 30,793 28,706
Restricted deposits (ii) 2,022 -
32,815 28,706
Other investments (offshore funds)
Sundry funds (i) 16,841 32,112
16,841 32,112
Total 3,471,397 2,889,295
Braskem S.A. Notes to the quarterly information at September 30, 2011 All amounts in R$ thousands unless otherwise stated
40
17.5. Sensitivity analysis
The derivative financial instruments may be subject to changes in their fair value as a result of the variation in commodity prices, foreign exchange rates, interest rates, shares and share indexes, price indexes and other variables. The sensitivity of the derivative and non-derivative financial instruments to these variables are presented below:
(a) Selection of risks
The three main risks that may most affect the value of the Company’s financial instruments are: a) Brazilian real-U.S. dollar exchange rate; b) Brazilian real-yen exchange rate; c) Libor floating interest rate. For the purposes of the risk sensitivity analysis, the Company presents the exposures to currencies as if they were independent, that is, without reflecting in the exposure to a foreign exchange rate the risks of the variation in other foreign exchange rates that could be directly influenced by it.
(b) Selection of scenarios
In accordance with CVM Instruction No. 475/08, the Company included three scenarios in the sensitivity analysis, one of which is probable and the other two represent adverse effects to the Company. In the preparation of the adverse scenarios, only the impact of the variables on the financial instruments, including derivatives, and on the items covered by hedge transactions, was considered. The overall impacts on the Company’s operations, such as the one arising from the revaluation of inventories and revenue and future costs, were not considered. Since the Company manages its exposure to foreign exchange rate risk on a net basis, adverse effects from a depreciation of the Brazilian real in relation to the U.S. dollar can be offset by opposing effects on the Braskem’s operating results.
The FOCUS survey published by the Central Bank of Brazil on September 30, 2011 was considered for the probable scenario for the base date December 31, 2011. For the interest rate variables not considered in the FOCUS survey, the probable scenario considered was the Interbank Deposit Certificate (CDI) percentage variation. For the exchange rate variables not included in the FOCUS survey, the probable scenario considered was the U.S. dollar-real percentage variation.
For the Brazilian real-U.S. dollar exchange rate, an increase of 25% was considered for the possible adverse scenario and of 50% for the extreme scenario based on the exchange rate on September 30, 2011.
For the Brazilian real-yen exchange rate, an increase of 25% was considered for the possible adverse scenario and of 50% for the extreme scenario based on the exchange rate on September 30, 2011.
For the Libor interest rate, a decrease of 25% was considered for the possible adverse scenario and of 50% for the extreme scenario based on the Libor rate on September 30, 2011.
The sensitivity amounts in the table below are the changes in the value of the financial instruments in each scenario, except for table (e), which shows the changes in future cash flows.

Braskem S.A. Notes to the quarterly information at September 30, 2011 All amounts in R$ thousands unless otherwise stated
41
(c) Sensitivity to the Brazilian real-U.S. dollar exchange rate
The sensitivity of each financial instrument, including derivatives and items covered by them, to the variation in the Brazilian real-US dollar exchange rate is presented in the table below:
(d) Sensitivity to the Brazilian real-yen exchange rate
The sensitivity of each financial instrument, including derivatives and items covered by them, to the variation in the Brazilian real-yen exchange rate is presented in the table below:
(e) Sensitivity of future cash flows to the Libor floating interest rate The sensitivity of future interest income and expenses of each financial instrument, including derivatives and items covered by them, is presented in the table below: The figures represent the impact on financial income (expenses), taking into consideration the average term of the respective instrument.
The information related to financial instruments was presented in the 2010 annual financial statements, in Note 19.
Possible adverse Extreme adverse
Instrument Probable (25% ) (50% )
BNDES 25,342 (94,443) (188,886)
Bonds 398,739 (1,485,977) (2,971,954)
Working capital/structured operations 60,500 (225,466) (450,933)
Raw material financing 707 (2,634) (5,269)
Medium-Term Notes 10,728 (39,981) (79,963)
Export prepayments 77,482 (288,750) (577,499)
Financial investments abroad (67,123) 250,147 500,294
Export prepayment debt, plus hedge, of which:
Export prepayment debt 42,082 (156,827) (313,654)
Export prepayment swap 1,613 (6,011) (12,021)
Other swaps 29,726 (110,778) (221,557)
Possible adverse Extreme adverse
Instrument Probable (25% ) (50% )
Project finance (NEXI), plus swaps, of which:
Debt (NEXI) 2,579 (9,610) (19,219)
Swaps (NEXI) (2,708) 10,092 20,184
Possible adverse Extreme adverse
Instrument Probable (25% ) (50% )
Raw material financing 23 (68) (135)
Export prepayments 2,497 (7,426) (14,758)
Export prepayment debt, plus hedge, of which:
Export prepayment debt 1,356 (4,033) (8,015)
Export prepayment swap (1,356) 4,033 8,015
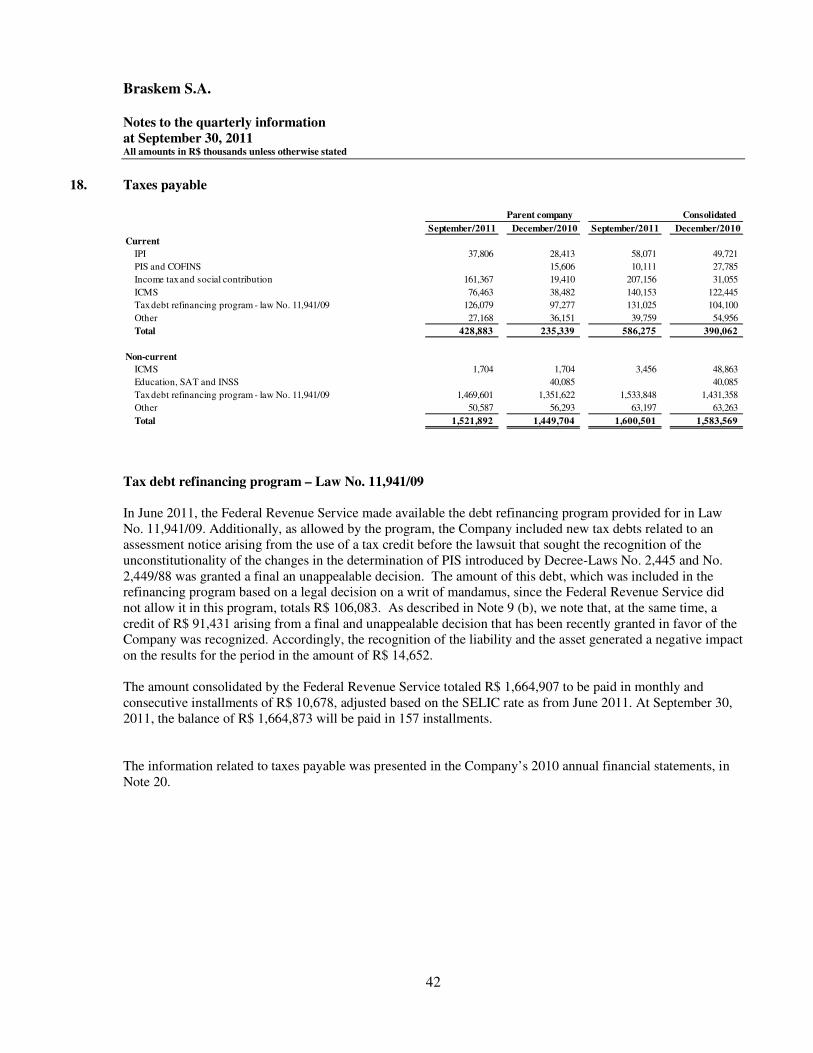
Braskem S.A. Notes to the quarterly information at September 30, 2011 All amounts in R$ thousands unless otherwise stated
42
18. Taxes payable
Tax debt refinancing program – Law No. 11,941/09
In June 2011, the Federal Revenue Service made available the debt refinancing program provided for in Law No. 11,941/09. Additionally, as allowed by the program, the Company included new tax debts related to an assessment notice arising from the use of a tax credit before the lawsuit that sought the recognition of the unconstitutionality of the changes in the determination of PIS introduced by Decree-Laws No. 2,445 and No. 2,449/88 was granted a final an unappealable decision. The amount of this debt, which was included in the refinancing program based on a legal decision on a writ of mandamus, since the Federal Revenue Service did not allow it in this program, totals R$ 106,083. As described in Note 9 (b), we note that, at the same time, a credit of R$ 91,431 arising from a final and unappealable decision that has been recently granted in favor of the Company was recognized. Accordingly, the recognition of the liability and the asset generated a negative impact on the results for the period in the amount of R$ 14,652. The amount consolidated by the Federal Revenue Service totaled R$ 1,664,907 to be paid in monthly and consecutive installments of R$ 10,678, adjusted based on the SELIC rate as from June 2011. At September 30, 2011, the balance of R$ 1,664,873 will be paid in 157 installments. The information related to taxes payable was presented in the Company’s 2010 annual financial statements, in Note 20.
September/2011 December/2010 September/2011 December/2010
Current
IPI 37,806 28,413 58,071 49,721
PIS and COFINS - 15,606 10,111 27,785
Income tax and social contribution 161,367 19,410 207,156 31,055
ICMS 76,463 38,482 140,153 122,445
Tax debt refinancing program - law No. 11,941/09 126,079 97,277 131,025 104,100
Other 27,168 36,151 39,759 54,956
Total 428,883 235,339 586,275 390,062
Non-current
ICMS 1,704 1,704 3,456 48,863
Education, SAT and INSS - 40,085 - 40,085
Tax debt refinancing program - law No. 11,941/09 1,469,601 1,351,622 1,533,848 1,431,358
Other 50,587 56,293 63,197 63,263
Total 1,521,892 1,449,704 1,600,501 1,583,569
Parent company Consolidated
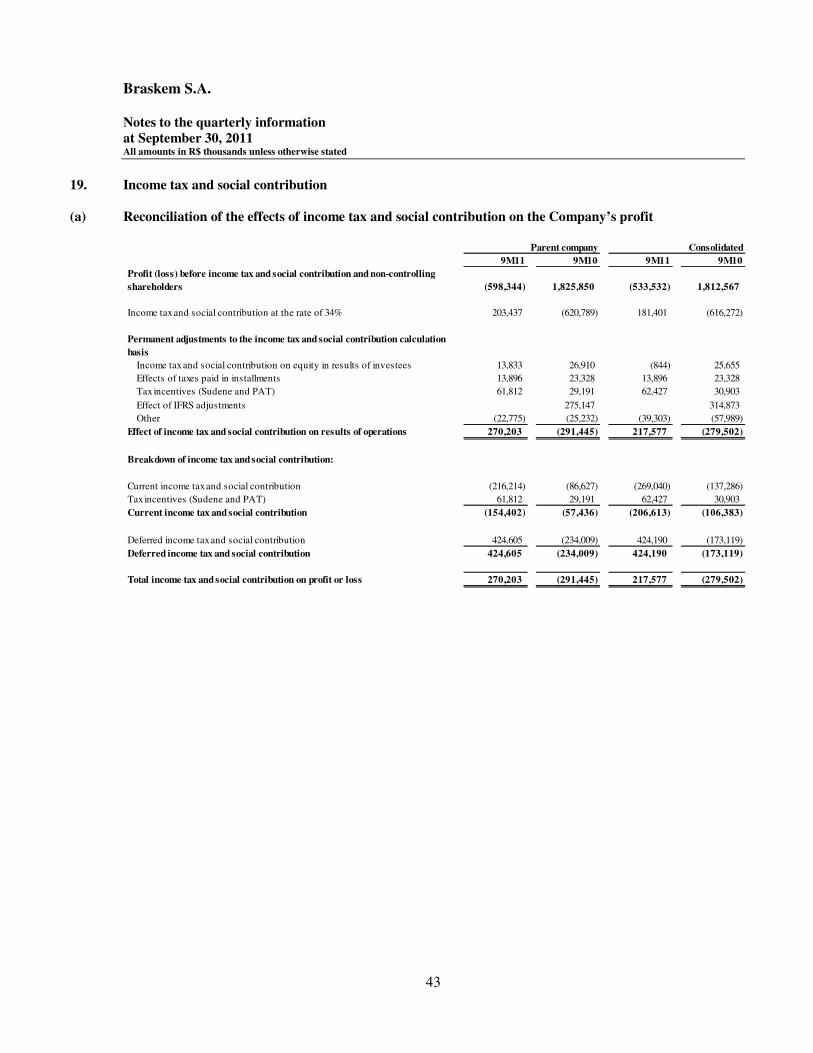
Braskem S.A. Notes to the quarterly information at September 30, 2011 All amounts in R$ thousands unless otherwise stated
43
19. Income tax and social contribution
(a) Reconciliation of the effects of income tax and social contribution on the Company’s profit
9M11 9M10 9M11 9M10
Profit (loss) before income tax and social contribution and non-controlling
shareholders (598,344) 1,825,850 (533,532) 1,812,567
Income tax and social contribution at the rate of 34% 203,437 (620,789) 181,401 (616,272)
Permanent adjustments to the income tax and social contribution calculation
basis
Income tax and social contribution on equity in results of investees 13,833 26,910 (844) 25,655
Effects of taxes paid in installments 13,896 23,328 13,896 23,328
Tax incentives (Sudene and PAT) 61,812 29,191 62,427 30,903
Effect of IFRS adjustments 275,147 314,873
Other (22,775) (25,232) (39,303) (57,989)
Effect of income tax and social contribution on results of operations 270,203 (291,445) 217,577 (279,502)
Breakdown of income tax and social contribution:
Current income tax and social contribution (216,214) (86,627) (269,040) (137,286)
Tax incentives (Sudene and PAT) 61,812 29,191 62,427 30,903
Current income tax and social contribution (154,402) (57,436) (206,613) (106,383)
Deferred income tax and social contribution 424,605 (234,009) 424,190 (173,119)
Deferred income tax and social contribution 424,605 (234,009) 424,190 (173,119)
Total income tax and social contribution on profit or loss 270,203 (291,445) 217,577 (279,502)
Parent company Consolidated
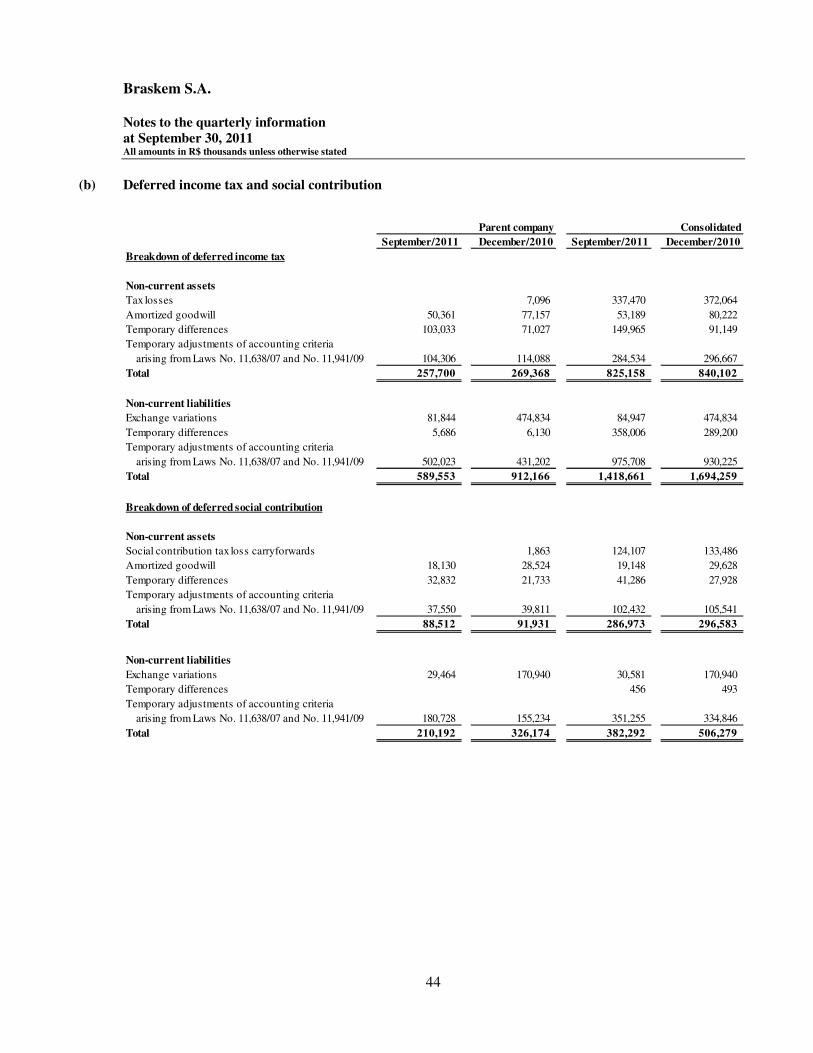
Braskem S.A. Notes to the quarterly information at September 30, 2011 All amounts in R$ thousands unless otherwise stated
44
(b) Deferred income tax and social contribution
Parent company Consolidated
September/2011 December/2010 September/2011 December/2010
Breakdown of deferred income tax
Non-current assets
Tax losses - 7,096 337,470 372,064
Amortized goodwill 50,361 77,157 53,189 80,222
Temporary differences 103,033 71,027 149,965 91,149
Temporary adjustments of accounting criteria - -
arising from Laws No. 11,638/07 and No. 11,941/09 104,306 114,088 284,534 296,667
Total 257,700 269,368 825,158 840,102
Non-current liabilities
Exchange variations 81,844 474,834 84,947 474,834
Temporary differences 5,686 6,130 358,006 289,200
Temporary adjustments of accounting criteria - -
arising from Laws No. 11,638/07 and No. 11,941/09 502,023 431,202 975,708 930,225
Total 589,553 912,166 1,418,661 1,694,259
Breakdown of deferred social contribution
Non-current assets
Social contribution tax loss carryforwards - 1,863 124,107 133,486
Amortized goodwill 18,130 28,524 19,148 29,628
Temporary differences 32,832 21,733 41,286 27,928
Temporary adjustments of accounting criteria - - - -
arising from Laws No. 11,638/07 and No. 11,941/09 37,550 39,811 102,432 105,541
Total 88,512 91,931 286,973 296,583
Non-current liabilities
Exchange variations 29,464 170,940 30,581 170,940
Temporary differences - - 456 493
Temporary adjustments of accounting criteria - -
arising from Laws No. 11,638/07 and No. 11,941/09 180,728 155,234 351,255 334,846
Total 210,192 326,174 382,292 506,279
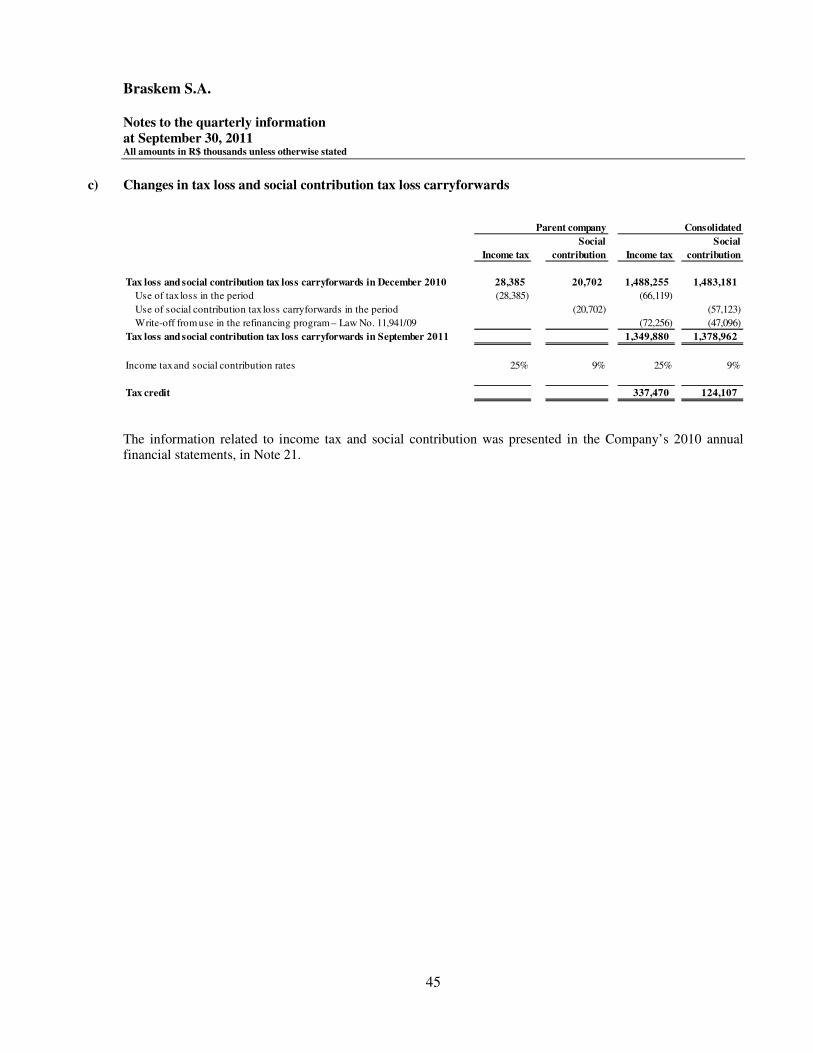
Braskem S.A. Notes to the quarterly information at September 30, 2011 All amounts in R$ thousands unless otherwise stated
45
c) Changes in tax loss and social contribution tax loss carryforwards
The information related to income tax and social contribution was presented in the Company’s 2010 annual financial statements, in Note 21.
Income tax
Social
contribution Income tax
Social
contribution
Tax loss and social contribution tax loss carryforwards in December 2010 28,385 20,702 1,488,255 1,483,181
Use of tax loss in the period (28,385) (66,119)
Use of social contribution tax loss carryforwards in the period (20,702) (57,123)
Write-off from use in the refinancing program – Law No. 11,941/09 (72,256) (47,096)
Tax loss and social contribution tax loss carryforwards in September 2011 - - 1,349,880 1,378,962
Income tax and social contribution rates 25% 9% 25% 9%
Tax credit - - 337,470 124,107
Parent company Consolidated
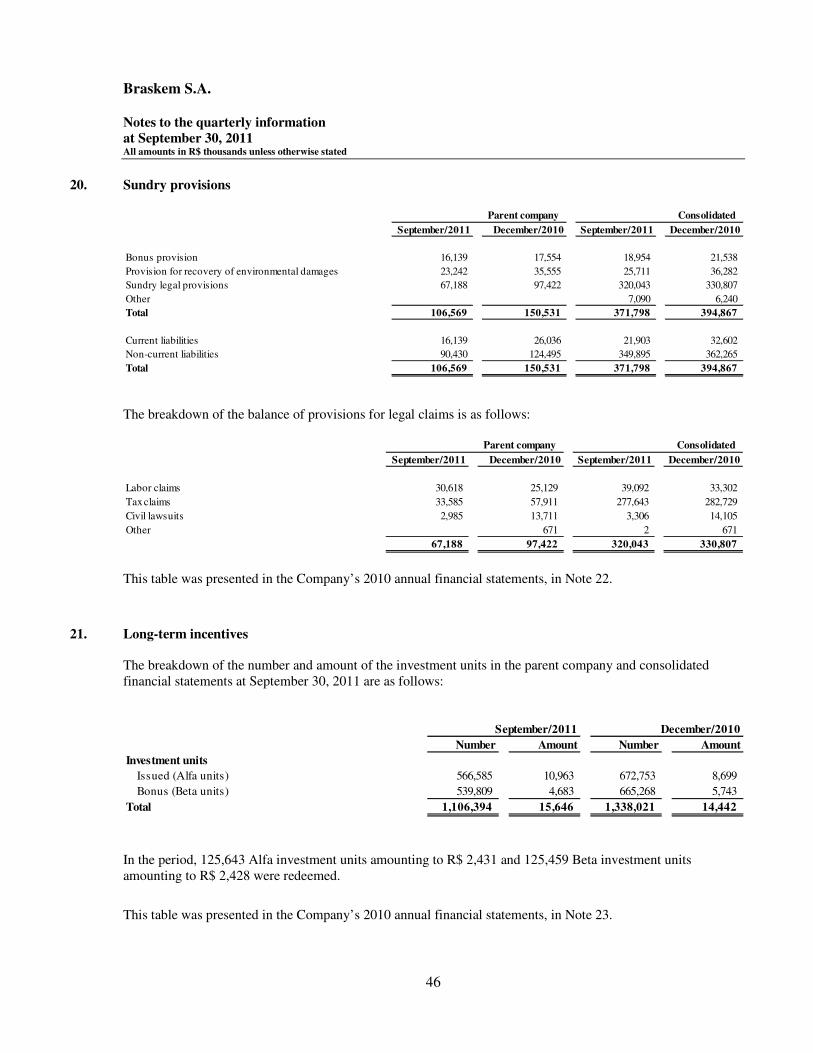
Braskem S.A. Notes to the quarterly information at September 30, 2011 All amounts in R$ thousands unless otherwise stated
46
20. Sundry provisions
The breakdown of the balance of provisions for legal claims is as follows:
This table was presented in the Company’s 2010 annual financial statements, in Note 22.
21. Long-term incentives
The breakdown of the number and amount of the investment units in the parent company and consolidated financial statements at September 30, 2011 are as follows:
In the period, 125,643 Alfa investment units amounting to R$ 2,431 and 125,459 Beta investment units amounting to R$ 2,428 were redeemed.
This table was presented in the Company’s 2010 annual financial statements, in Note 23.
September/2011 December/2010 September/2011 December/2010
Bonus provision 16,139 17,554 18,954 21,538
Provision for recovery of environmental damages 23,242 35,555 25,711 36,282
Sundry legal provisions 67,188 97,422 320,043 330,807
Other - 7,090 6,240
Total 106,569 150,531 371,798 394,867
Current liabilities 16,139 26,036 21,903 32,602
Non-current liabilities 90,430 124,495 349,895 362,265
Total 106,569 150,531 371,798 394,867
Parent company Consolidated
September/2011 December/2010 September/2011 December/2010
Labor claims 30,618 25,129 39,092 33,302
Tax claims 33,585 57,911 277,643 282,729
Civil lawsuits 2,985 13,711 3,306 14,105
Other - 671 2 671
67,188 97,422 320,043 330,807
Parent company Consolidated
Number Amount Number Amount
Investment units
Issued (Alfa units) 566,585 10,963 672,753 8,699
Bonus (Beta units) 539,809 4,683 665,268 5,743
Total 1,106,394 15,646 1,338,021 14,442
September/2011 December/2010
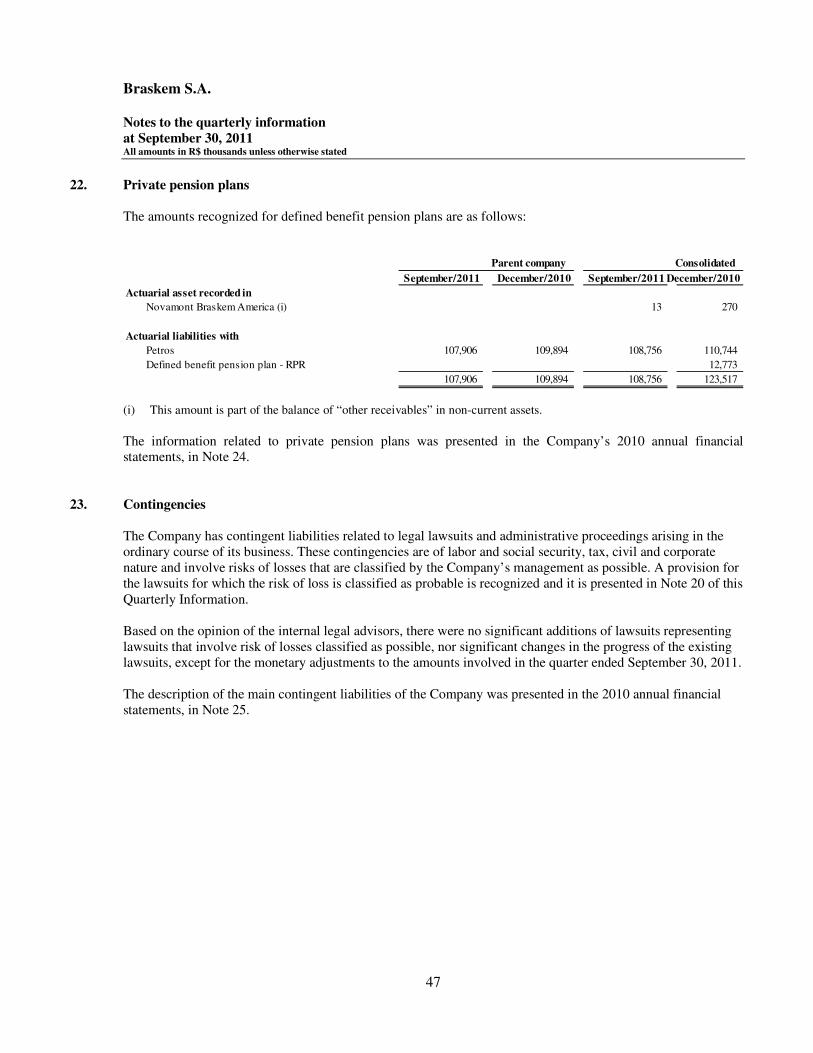
Braskem S.A. Notes to the quarterly information at September 30, 2011 All amounts in R$ thousands unless otherwise stated
47
22. Private pension plans The amounts recognized for defined benefit pension plans are as follows:
(i) This amount is part of the balance of “other receivables” in non-current assets.
The information related to private pension plans was presented in the Company’s 2010 annual financial statements, in Note 24.
23. Contingencies The Company has contingent liabilities related to legal lawsuits and administrative proceedings arising in the ordinary course of its business. These contingencies are of labor and social security, tax, civil and corporate nature and involve risks of losses that are classified by the Company’s management as possible. A provision for the lawsuits for which the risk of loss is classified as probable is recognized and it is presented in Note 20 of this Quarterly Information. Based on the opinion of the internal legal advisors, there were no significant additions of lawsuits representing lawsuits that involve risk of losses classified as possible, nor significant changes in the progress of the existing lawsuits, except for the monetary adjustments to the amounts involved in the quarter ended September 30, 2011. The description of the main contingent liabilities of the Company was presented in the 2010 annual financial statements, in Note 25.
September/2011 December/2010 September/2011 December/2010
Actuarial asset recorded in
Novamont Braskem America (i) 13 270
Actuarial liabilities with
Petros 107,906 109,894 108,756 110,744
Defined benefit pension plan - RPR - 12,773
107,906 109,894 108,756 123,517
Parent company Consolidated
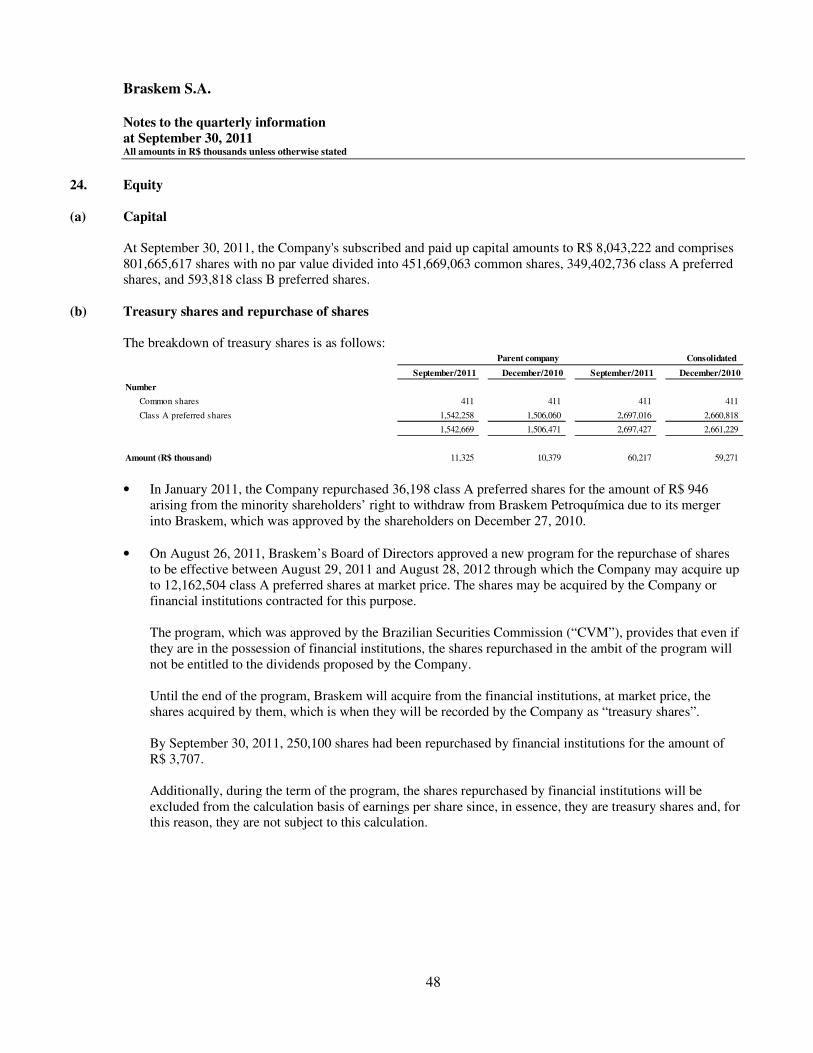
Braskem S.A. Notes to the quarterly information at September 30, 2011 All amounts in R$ thousands unless otherwise stated
48
24. Equity
(a) Capital At September 30, 2011, the Company's subscribed and paid up capital amounts to R$ 8,043,222 and comprises 801,665,617 shares with no par value divided into 451,669,063 common shares, 349,402,736 class A preferred shares, and 593,818 class B preferred shares.
(b) Treasury shares and repurchase of shares The breakdown of treasury shares is as follows:
• In January 2011, the Company repurchased 36,198 class A preferred shares for the amount of R$ 946 arising from the minority shareholders’ right to withdraw from Braskem Petroquímica due to its merger into Braskem, which was approved by the shareholders on December 27, 2010.
• On August 26, 2011, Braskem’s Board of Directors approved a new program for the repurchase of shares to be effective between August 29, 2011 and August 28, 2012 through which the Company may acquire up to 12,162,504 class A preferred shares at market price. The shares may be acquired by the Company or financial institutions contracted for this purpose.
The program, which was approved by the Brazilian Securities Commission (“CVM”), provides that even if they are in the possession of financial institutions, the shares repurchased in the ambit of the program will not be entitled to the dividends proposed by the Company. Until the end of the program, Braskem will acquire from the financial institutions, at market price, the shares acquired by them, which is when they will be recorded by the Company as “treasury shares”. By September 30, 2011, 250,100 shares had been repurchased by financial institutions for the amount of R$ 3,707. Additionally, during the term of the program, the shares repurchased by financial institutions will be excluded from the calculation basis of earnings per share since, in essence, they are treasury shares and, for this reason, they are not subject to this calculation.
September/2011 December/2010 September/2011 December/2010
Number
Common shares 411 411 411 411
Class A preferred shares 1,542,258 1,506,060 2,697,016 2,660,818
1,542,669 1,506,471 2,697,427 2,661,229
Amount (R$ thousand) 11,325 10,379 60,217 59,271
Parent company Consolidated

Braskem S.A. Notes to the quarterly information at September 30, 2011 All amounts in R$ thousands unless otherwise stated
49
(c) Dividends On April 29, 2011, The Ordinary General Meeting approved the payment of dividends in the amount of R$ 665,630 as from May 10, 2011, R$ 376,352 of which was made available to common shareholders and R$ 288,891 and R$ 357 to class A and B preferred shareholders, respectively. The remaining proposed and undistributed amount, of R$ 30, was reversed to retained earnings and refers to the 36,198 class A preferred shares acquired by Braskem in January 2011 as a result from the exercise of the right to withdraw by the shareholders of Braskem Petroquímica (Note 24 (b)). The information related to Company’s equity was presented in its 2010 annual financial statements, in Note 26.
25. Earnings per share The table below shows the reconciliation of profit (loss) for the period adjusted to the amounts used to calculate
basic and diluted earnings per share.
(i) In the calculation of the weighted average number of common and class A preferred shares, the Company’s
shares repurchased by a financial institution that are not yet recorded as “treasury shares” were excluded from its basis (Note 24 (d)).
The information related to the Company’s earnings per share was presented in its 2010 annual financial statements, in Note 27.
Basic Diluted Basic Diluted
Profit (loss) attributable to the Company’s shareholders (328,141) (328,141) 1,534,405 1,534,405
Profit (loss) attributable to class B preferred shareholders - - 358 -
Profit (loss) for the period attributable to other shareholders (328,141) (328,141) 1,534,047 1,534,405
Weighted average number of common and class A preferred shares (i) 798,392,873 798,688,188 686,855,086 687,151,995
Earnings (loss) per share (in R$) (0.4110) (0.4108) 2.2334 2.2330
9M11 9M10

Braskem S.A. Notes to the quarterly information at September 30, 2011 All amounts in R$ thousands unless otherwise stated
50
26. Segment information In February 2011, the Brazilian antitrust agency (“CADE”) approved the operation for the acquisition and integration of Quattor’s assets, which made possible the change in the Company’s organizational structure as from 2011. The change in relation to the previous structure, presented in the Company’s 2010 annual financial statements, in Note 28, is in the distribution of Quattor’s activities among the Basic Petrochemicals and Polyolefin units. The 2010 information below was reclassified to allow comparability. The Company does not disclose assets per segment since this information is not presented to its chief operating decision maker.
Total Braskem
Basic Foreign Chemical reportable Other Corporate consolidated Reclassifications/ Braskem
petrochemicals Polyolefins Vinyls businesses distribution segments segments unit before adjustments Eliminations consolidated
Net sales revenues 17,503,890 9,691,255 1,306,263 2,108,907 570,223 31,180,538 176,262 - 31,356,800 (6,890,955) 24,465,845
Cost of products sold (15,599,851) (8,802,846) (1,219,327) (1,960,727) (464,192) (28,046,943) (151,509) - (28,198,452) 6,896,275 (21,302,177)
Gross profit 1,904,039 888,409 86,936 148,180 106,031 3,133,595 24,753 - 3,158,348 5,320 3,163,668
Operating expenses
Selling, general and distribution expenses (414,424) (599,558) (109,514) (98,788) (72,838) (1,295,122) (39,398) (121,957) (1,456,477) - (1,456,477)
Results from equity investments - - - - - - - (2,051) (2,051) - (2,051)
Other operating income (expenses), net (8,294) (6,210) (21,372) (22,369) 3,236 (55,009) 20,597 (6,503) (40,915) - (40,915)
(422,718) (605,768) (130,886) (121,157) (69,602) (1,350,131) (18,801) (130,511) (1,499,443) - (1,499,443)
Operating profit (loss) 1,481,321 282,641 (43,950) 27,023 36,429 1,783,464 5,952 (130,511) 1,658,905 5,320 1,664,225
Total Braskem
Basic Foreign Chemical reportable Other Corporate consolidated Reclassifications/ Braskem
petrochemicals Polyolefins Vinyls businesses distribution segments segments unit before adjustments Eliminations consolidated
Net sales revenues 13,017,197 8,080,657 1,322,281 1,168,609 571,997 24,160,741 261,254 - 24,421,995 (5,893,745) 18,528,250
Cost of products sold (11,301,070) (7,123,154) (1,192,905) (1,052,758) (484,753) (21,154,640) (249,827) - (21,404,467) 5,754,265 (15,650,202)
Gross profit 1,716,127 957,503 129,376 115,851 87,244 3,006,101 11,427 - 3,017,528 (139,480) 2,878,048
Operating expenses
Selling, general and distribution expenses (400,627) (458,130) (100,955) (43,581) (57,421) (1,060,714) (23,248) (125,864) (1,209,826) - (1,209,826)
Results from equity investments - - - - - - - 25,155 25,155 - 25,155
Results from business combinations - - - - - - - 975,283 975,283 - 975,283
Other operating income (expenses), net (21,658) 4,323 1,717 (6,909) 1,142 (21,385) 2,965 (51,396) (69,816) - (69,816)
(422,285) (453,807) (99,238) (50,490) (56,279) (1,082,099) (20,283) 823,178 (279,204) - (279,204)
Operating profit (loss) 1,293,842 503,696 30,138 65,361 30,965 1,924,002 (8,856) 823,178 2,738,324 (139,480) 2,598,844
9M11
Reportable segments
Reportable segments
9M10
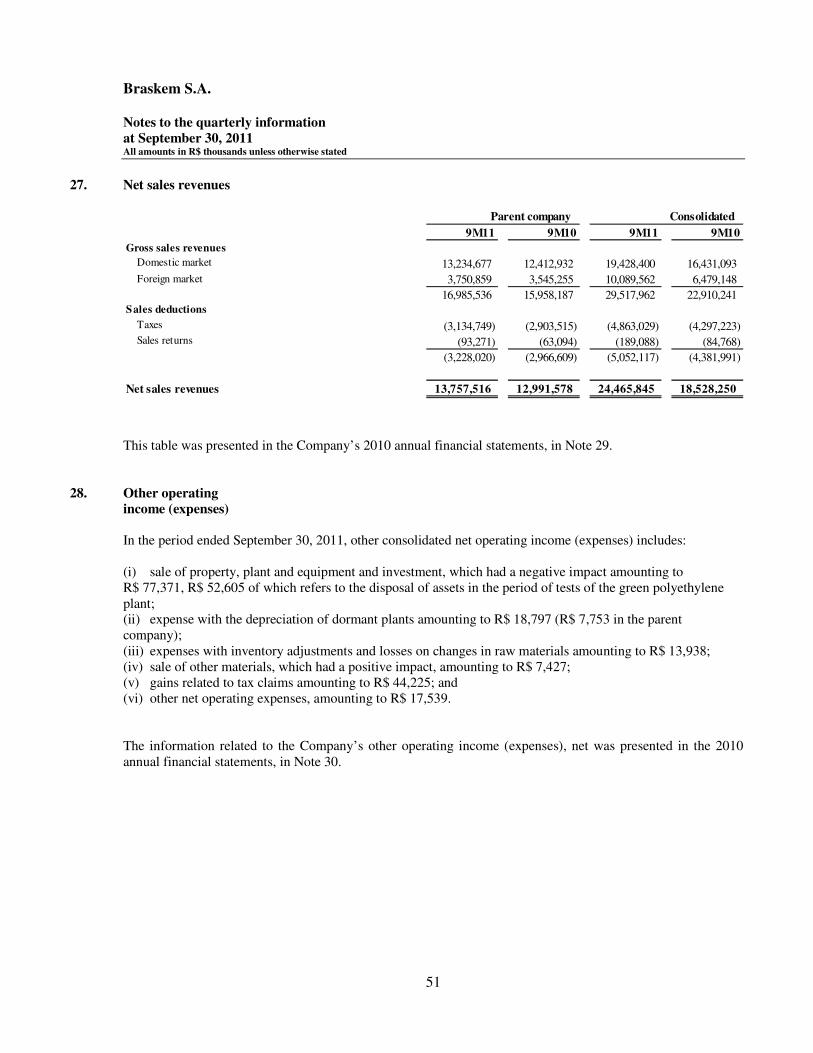
Braskem S.A. Notes to the quarterly information at September 30, 2011 All amounts in R$ thousands unless otherwise stated
51
27. Net sales revenues
This table was presented in the Company’s 2010 annual financial statements, in Note 29.
28. Other operating income (expenses) In the period ended September 30, 2011, other consolidated net operating income (expenses) includes: (i) sale of property, plant and equipment and investment, which had a negative impact amounting to R$ 77,371, R$ 52,605 of which refers to the disposal of assets in the period of tests of the green polyethylene plant; (ii) expense with the depreciation of dormant plants amounting to R$ 18,797 (R$ 7,753 in the parent company); (iii) expenses with inventory adjustments and losses on changes in raw materials amounting to R$ 13,938; (iv) sale of other materials, which had a positive impact, amounting to R$ 7,427; (v) gains related to tax claims amounting to R$ 44,225; and (vi) other net operating expenses, amounting to R$ 17,539. The information related to the Company’s other operating income (expenses), net was presented in the 2010 annual financial statements, in Note 30.
9M11 9M10 9M11 9M10
Gross sales revenues
Domestic market 13,234,677 12,412,932 19,428,400 16,431,093
Foreign market 3,750,859 3,545,255 10,089,562 6,479,148
16,985,536 15,958,187 29,517,962 22,910,241 Sales deductions
Taxes (3,134,749) (2,903,515) (4,863,029) (4,297,223) Sales returns (93,271) (63,094) (189,088) (84,768)
(3,228,020) (2,966,609) (5,052,117) (4,381,991)
Net sales revenues 13,757,516 12,991,578 24,465,845 18,528,250
Parent company Consolidated
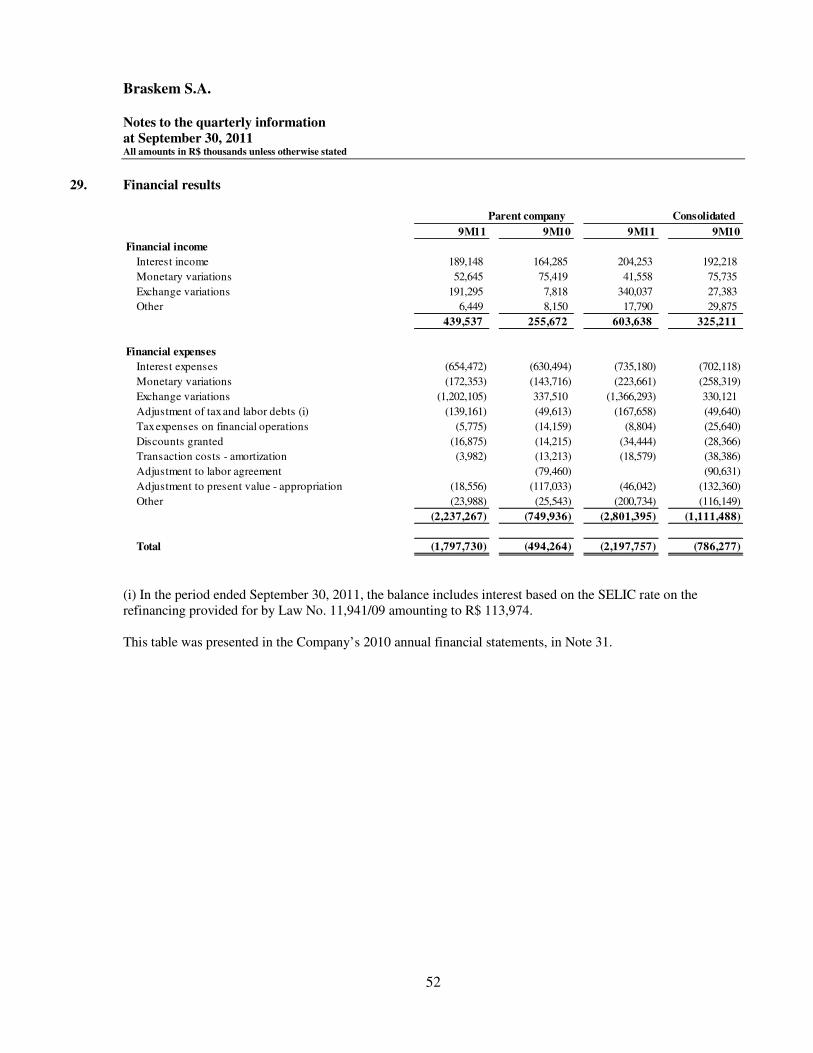
Braskem S.A. Notes to the quarterly information at September 30, 2011 All amounts in R$ thousands unless otherwise stated
52
29. Financial results
(i) In the period ended September 30, 2011, the balance includes interest based on the SELIC rate on the refinancing provided for by Law No. 11,941/09 amounting to R$ 113,974. This table was presented in the Company’s 2010 annual financial statements, in Note 31.
9M11 9M10 9M11 9M10
Financial income
Interest income 189,148 164,285 204,253 192,218
Monetary variations 52,645 75,419 41,558 75,735
Exchange variations 191,295 7,818 340,037 27,383
Other 6,449 8,150 17,790 29,875
439,537 255,672 603,638 325,211
Financial expenses
Interest expenses (654,472) (630,494) (735,180) (702,118)
Monetary variations (172,353) (143,716) (223,661) (258,319)
Exchange variations (1,202,105) 337,510 (1,366,293) 330,121
Adjustment of tax and labor debts (i) (139,161) (49,613) (167,658) (49,640)
Tax expenses on financial operations (5,775) (14,159) (8,804) (25,640)
Discounts granted (16,875) (14,215) (34,444) (28,366)
Transaction costs - amortization (3,982) (13,213) (18,579) (38,386)
Adjustment to labor agreement (79,460) (90,631)
Adjustment to present value - appropriation (18,556) (117,033) (46,042) (132,360)
Other (23,988) (25,543) (200,734) (116,149)
(2,237,267) (749,936) (2,801,395) (1,111,488)
Total (1,797,730) (494,264) (2,197,757) (786,277)
Parent company Consolidated
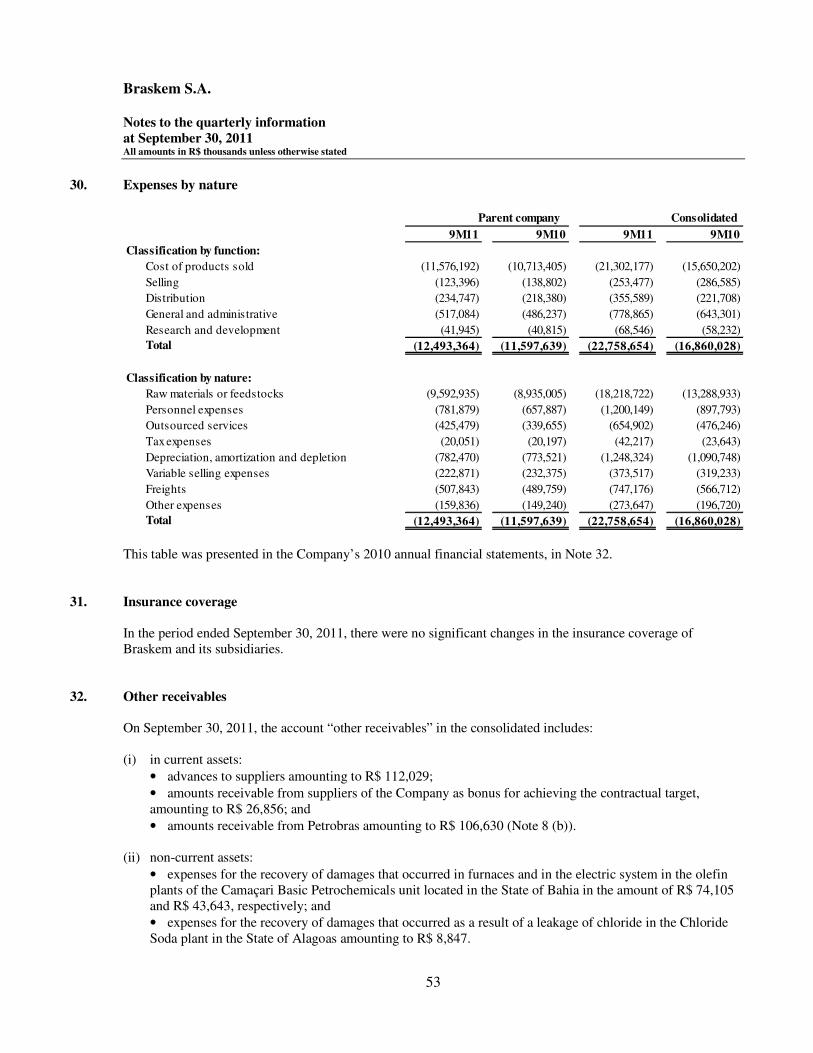
Braskem S.A. Notes to the quarterly information at September 30, 2011 All amounts in R$ thousands unless otherwise stated
53
30. Expenses by nature
This table was presented in the Company’s 2010 annual financial statements, in Note 32.
31. Insurance coverage In the period ended September 30, 2011, there were no significant changes in the insurance coverage of Braskem and its subsidiaries.
32. Other receivables On September 30, 2011, the account “other receivables” in the consolidated includes: (i) in current assets:
• advances to suppliers amounting to R$ 112,029;
• amounts receivable from suppliers of the Company as bonus for achieving the contractual target, amounting to R$ 26,856; and
• amounts receivable from Petrobras amounting to R$ 106,630 (Note 8 (b)). (ii) non-current assets:
• expenses for the recovery of damages that occurred in furnaces and in the electric system in the olefin plants of the Camaçari Basic Petrochemicals unit located in the State of Bahia in the amount of R$ 74,105 and R$ 43,643, respectively; and
• expenses for the recovery of damages that occurred as a result of a leakage of chloride in the Chloride Soda plant in the State of Alagoas amounting to R$ 8,847.
9M11 9M10 9M11 9M10
Classification by function:
Cost of products sold (11,576,192) (10,713,405) (21,302,177) (15,650,202)
Selling (123,396) (138,802) (253,477) (286,585)
Distribution (234,747) (218,380) (355,589) (221,708)
General and administrative (517,084) (486,237) (778,865) (643,301)
Research and development (41,945) (40,815) (68,546) (58,232)
Total (12,493,364) (11,597,639) (22,758,654) (16,860,028)
Classification by nature:
Raw materials or feedstocks (9,592,935) (8,935,005) (18,218,722) (13,288,933)
Personnel expenses (781,879) (657,887) (1,200,149) (897,793)
Outsourced services (425,479) (339,655) (654,902) (476,246)
Tax expenses (20,051) (20,197) (42,217) (23,643)
Depreciation, amortization and depletion (782,470) (773,521) (1,248,324) (1,090,748)
Variable selling expenses (222,871) (232,375) (373,517) (319,233)
Freights (507,843) (489,759) (747,176) (566,712)
Other expenses (159,836) (149,240) (273,647) (196,720)
Total (12,493,364) (11,597,639) (22,758,654) (16,860,028)
Parent company Consolidated

Braskem S.A. Notes to the quarterly information at September 30, 2011 All amounts in R$ thousands unless otherwise stated
54
33. Advances from customers – non-current On September 30, 2011, the balance of this account includes the advance of R$ 139,080 (US$ 75 million) made by a foreign customer for the acquisition of butadiene between February 2013 and December 2016.
34. Subsequent events
(a) On September 30, 2011 the Company completed the acquisition of the polypropylene (“PP”) business from The Dow Chemical Company (“Dow Chemical”) announced in July 2011. The negotiations included four industrial units, two in the United States and two in Germany, with an annual production capacity of 1,050 thousand metric tons of PP. In the United States, the plants acquired are located in Freeport and Seadrift in the State of Texas and add 505,000 metric tons to Braskem’s production capacity of PP in that country. These plants were incorporated into the assets of the subsidiary Braskem América. In Germany, the plants are located in Wesseling and Schkopau and have an annual production capacity of 545,000 metric tons. These plants were incorporated into the assets of the new subsidiary of Braskem in that country called Braskem Europe GmbH (Braskem Germany). This acquisition represents a “business combination”, as established in the Accounting Pronouncement CPC 15 and IFRS 3R, which is why the Company’s management will hire a specialized company to measure, at fair value, the assets acquired and liabilities assumed. Under the above mentioned standards, the acquisition date is October 3, 2011, date on which the requirements for the acquisition were met by the parties involved. However, as provided for in the purchase and sale agreement, the assets, liabilities and results of the new plants were assumed retroactively to October 1, 2011. For this reason, the results of the acquired units will be consolidated in the Company’s financial statements as of October 1, 2011. The information required for an operation of this nature will be disclosed in Braskem’s 2011 annual financial statements. The Purchase Price, as defined in the Sale and Purchase Agreement, amounting to US$ 323 million, was paid on October 3, 2011. In addition to the industrial plants, the business combination involved inventories, trade accounts receivable and trade payables. These amounts that will be realized in the short term are part of the working capital associated with the new investment.
(b) In October 2011, 902,600 shares of the Company were repurchased by a financial institution in accordance with the repurchase program mentioned in Note 24 (b) for the amount of R$ 12,634.