ed159529.tif - eric · the. results, documented irlthis report, form an absorb-ing chapter...
TRANSCRIPT
DOME!! RESUME'
Bp 159 529 CG 012 737
TITLE ,Staff Working Papers cf the Drug Lai EvalrationProject. A Companion Volume to the -Final' Report ofthe Joint Committe,e of New York Drug LawEvaluation., .-
SPONS AGENCY National last, of Law Enforcement. and CriminalJustice (Dept. of JUstice/LEAA), Washington, D.C.
PUB DATE -Mar 78GRANT 76-141-99-0115NOTE 328p.; For, related document -see CG 012 728 ; Not
available in lard copy due td small typeAVAILABLE FROM Superimten,dent of Doctments, 0 Government Printing
Office, Washington, C.C., 201402 (Stool; no.'027-000-00647-7)
EDRS PRICE MF-$0.83 Plus'Postage. HC Not Available from. EDRS.DESCRIPTORS *Court Litigation; *Crime; Criminal' Iair; *Drug- Abuse;
. . *Drug Legislation; Evaluation; *Law Enforcement;*Narcotics; Research Projects; Social Problems
IDENTIFIERS *Ne w York
ABSTRACTThe papers in this volume were prepared as part, of. an
evaluation of the effects of the strict,1973 New York State druglaws. The first paper explores the effects of the laws or heroin use. .It analyzes the trends of various indicators of heroin use in NewYork State over a period of several years. -In order_ to isolatemovements unique 'to New York, these- trends, are compared it those ofcomparable indicators for other East Coast states and ci-ties thatwere not directly affected by the new drug laws. The 'seccrd paper ison crime committed by narcotics users in Marhattan. 1t,presents thefindings of a study of changes in the magnitude of felony crimes .
committed by narcotics users in Manhattan tetween 197.1 and 1975. Thecrimes included are all felonies which directly affect victims. Thethird paper explores the effects of the 1973 drug laws on the NewYork State Courts. It is concerned primarily with implementation ofthe statutes dealing with possession or sale of dangeroi drugs. Thelast paper is on sentencing patterns under the 1973 New 'fork Statedrug laws. (Author/JEL)
******************************************°****************************** Reproductions supplied by EDRS are the best that can be Made *,31,
, from the original documert.**************************************************************'*********

-.Drug Low-giatoatioo:Projed
S
Staff Working Papers,,of the
. A Companion Volume to theFinal Report of.the Joint Cominittee.on New York,Drug Law Evaluation
U.S_. DEPARTMENT OF HEALTH,EDUCATION & WELFARENATIONAL INSTITUTE OF
EDUCATION
THIS DOCUMENT HAS BEEN REPROrDUC EXACTLY AS RECEIVED FROM
114: THE ERSON OR ORGANIZATION ORIGIN-
' letATIN IT POINTS OF VIEW OR OPINIONSST-AT D DO NOT NECESSARILY REPRE-
I
r NATIONAL
INSTITUTE 111EDUCTION POSITION OR POLICYCVrfti
National Institute of Law Enforcement and Criminal Justice'Law Enforcement Assistahee Administration
United States Department of Justice
Je 2

Staff-Wbrking Papersof the
Prug w valuation Projec
F.
A Companion Volume to the,.Final Report of the Joint Committeeon NQIN York Drug Law Evaluation
March 1978
'
National Institute of Law Enforcement anq Criminal JusticeLaw Enfoccement Assistance Administration
United States Department of.Justice
3

°
National Institute of. Law Enfdrcement",- and Criminal Justice,
Blair G. Ewing, Acting Director
Law Enforcement.Assista:nce-AdministrationJaniesAA. H. Gregg; Acting Administrator
,
This project was Sigfported by Grant Nriber 1-40115 awarded to The AsSo-'ation of the Bar of el? City of NeW Yo b e Law Enforcement Assistance
MiniStration, U.S. DePartmentof Justice, under the Omnibus Crime Control anotSafe. Streets Art of 1968, as amended. Points of view or opinions stated in this-N.document do not neceseariVjebreaffitthe, official position or policies ofthe U.S.Department of Justice. The reSearctifeported herein was also supported by a grantfrom the Drug Abuse Council, Inc.,.Washingten, D.C. , ' ,
s
, ., .
Copyrights 1977 by The Association of the Bar of ther,City of Nev, York.Library ,of Congress Catplog Card Nunitier 77-89054
.The Law fordement Assistance AdminiStration' reserves the right to reproducet,publish, tra late, or otherwise use, and to authorize others:to publish and use all orany part of the copyrighted material contained in this publication:
.
For sale tpj the Superintendent' of Documents, U.S. Government Printing OfficeWashington, D.C. 2040'2
Stock No. .174600-00647 -7

THE ASSOCIATION OF. THE BAR OF THE CITY OF NEW YORKand the
' DRUG ABUSE COUNCIL, INC.
JOINT COMMITTEE ON NEW YORK DRUG LAW EVALUATION.
Orville H. Schell, Jr.Co-Chairman
Bethuel M.. WebsterCo-Chairman
Bayless A., Manning-Nice7Chairman
Michaq. F.-ArmstrongThomas E. Bryant,:M.D.Manly Fleischmann
gulds' David.E. Kendll
Robert J. KutOk'*ephen May,
9
JOseph H-Mmrphy --Eleanor golmes No2tbnOscar M. IluebhausenEdwin F. RussellLeon Silverman.
.J. Henry Smith k
Herbert SturzJerry. V. Wilson
pru'Lata Evaluation Project
Anthony F. Japha. 5
Director
.Majda. 1.SajovicCoordinator of Drug UseStud''PhilipRichardsoCoordinator of' riminalJustice Studied
Laura Allen'E)iecUtive Secretar
Hope CormanR. Matthew GoldsmithRichard JurgesAndrea( PedolskJack Albert Shemtob
Barbaa SklarMargot Williams

roma,*
When the New YorkSate Legislature passedithe 1973drug law, the effects.of which are evaluated in this study,the legislators hoped to stem the tide of widespread drugabuse and related socioeconomic effects that had not beennotably checked by many years of prior national, state, orlocal control efforts,
The. results, documented irLthis report, form an absorb-ing chapter in'the continuing history of how societies have
'attempted to control crime by different Strategies. Onlyrecently, however, have societies tried consciously and sys-tematically to evaluate how well their strategies have worked,or how and why they'have failed' to work. Intensive. broad -based
.
evaluations of the impacts of publicpoli4 changes are stillrelatively rare, probably because they tend to be costly, comrplex, time-consuming (and thbrefore often untime11), difficult,and likely to produce resets that can be disquieting to allof the Segments of society. involved.
When the National Institute undertook, this evaluation werecognized tfiat any single study could not even hope to address,let alone resolve, all the research issues about legislativeimplementation processes and the impacts of this particular lawthat might be of interest for national, state,and local policyperspectives.
.
.
.The evidence of this studyand the daily newscasts indi.rcate that the drug abuse problems this law addressed are stillwith us. If the New York'drUg'law and the attendant efforts'bycriminal justice system administrators have not eliminatedthese problems, we know now, as a result of this evaluation,what it was that was dame, why it was done, what sffebts it had,and what results were achieved. In short, we have increased'the understanding which all of us have of a complex set of prob- _lems and of the difficulties which inhere in attempts to solvetheM. The continuing development of such knowledge and under-standing is the bestbaSi6;on which wecanbuild future policies'directed toward enlightened and effective control of drug abuse",-problems
iv
Blair G. Ewing.Acting Director.National Institute of Law'Enforcement and Criminal
JustiCe

PREFACE
This volume is being made available in conjunction
with the Final Report.of the Joint Committee on New York
Drug Law Evaluation. The Cbmmittee was established by The...;-
AssociatiOnof the.Barof the City Of'New York and the Drug
Abuse Council, Inc. to conduct an evacuation of the strict
drUg law dnacted in New York State during ],973., It is the
Committee's hope that the data and methodologies presentedY
in the four staff paffers\will contribute to research and.
analysis of the issues rela!ted both to controlling illicit
drug use and operating criminal'justice systems.
The Committee's Final Report,The Nation's Toughest
Drug Law: Evaluating. the New fork Experience, as well as-
an Executive Summary'presenting tie Committee's conclusions,
is also published by the Government Printing Office.
The papers included in'this volume were prepared during
the course of'theDrug LawEvaluation Project. In some Cases,
the Final Report of the Joint Committee on New York Drug Law1
Evaluation includes revisions dr refinements of the-materials
included,in this volume.,:-Information which became available
after the preparation of 'the staff papers is\also incorporated
into the Final Report.

Note:
TABLE pF CONTENTS
Each of the Stafft.Workinglo,apers cont4ins
a Table of Contents
iorew-ord.
Preface
1. The Effects of the 1973 Drug ,Laws on HeroinUse in New York State
2. Cr,ime Committed by Narcotics Users in AManhattan
3. 'The Effects of the 1973 Drug Laws on theNew York State Courts . . .
4. Sentencing Patternd Under the 1973' ew-YorkState Drug Laws
Appendix: mAjor Provisions of the 197.3 New YorkState Drug Law
Glossry.
iv
1
97
128 j
244
305
313

L
';1
THE EFFECTS OF THE,-.10. 'DRUG LAWS ON 'HEROIN USE i
)IN NEW YORK. CITY: . -,
,
k'Stafi Workingaper
,
Drug Law Eva*Mi,e, Project
This paper was prepared by Majda I. Sajovic and.
R. Matthew.GoldsMith,.with the iissistance of
Jack Albert Sheintob.,:,
January 1977

A ---c
gtIntrOdUCtign
1
4summary ..kf. - 1 4,Jt 4,
, - ,
1.....Summary of Ilechpd0]q4Y:.7 1
'4Hercafn pse\in yofa.:.c4.ty 14'
a
Heroin Use in ,Hew York State t 27.. c
Heroin Use in New Ydak State30' .0;,-. ,,,,f
Chart gecOtUjotnside. ..'4 34 1 S,' Appeodii A: De f tions of Indicators. and.1 6 y : 0
.......-Appendix/3:
of of ,Comparison Mreas. . 56.-,titIta Availabili,ty and Source . 62
IAppendix C: ,DesrriptiOn of Statistical
Techniques . . ).. '82
'tit,

INTRODUCTION
I .
)
The New York State drug and sentencing'laws enacted
in .1973 i.nereased thepenaltieS for many: crimes ,nvolving.
t
,
ithe sale or possession of drugs, The Laws ,sWere intendedv
/to reduce the extent of.illicit drug use and the numbeef-
street crimes users commit.
.4' This report focuses on the iimpact e law' havehad
on heroin use patterns by, analyzing the trend of variouss
-,,indinators of heteinuse in'New York State'ov r a period
of several years.: In order to isolate movements unique
to New York, these trends are cOmpared,withithose of
comparable indicators for'other East Coast Mates and cities.
that were not directlyaffected by the new drug laws.*
Reliance upon selected indicators:to measure changes in1 6
'heroin use is 'similar to the procedure followed by the
National Instituteon Drug Abuse in developingt. national data
L
for use in public poliCy analysis and'iomdlation'.**/4 -
None of the available indicators of heroin use can be
used to estiMate°the number oti-addicts/in 1 location because 4'
the quantitative 'relationship between indicator levels andlo
the number of;herein usersis Unknown Furthermore, no.one
indicator can stand alone in reflecting chgnges in heroin.
L *Drug laws'in the 'comparison states.'remained largely the same'from 1970 to 1975. In Connecticut, tighter penalties wereimposed in 1971 bUt were liberalized again in 74. 'A re-duction of penalties for.drug criffes in in 1972was the only other change.
.
**National Institute on Drug Abuse:- Heroin Indicators TrendReport. Washington, D.C.: United' Eaes Department of Oealth',Edudation and,Welfare, 1976. (P14b1. No. (ADM) 76-378 andPubl. Nd. (ADM) 76-315)

;On-4-
\use, ce each is influenced by fact6rs okierthad-her6in
However, when alyzed as a group for common trends,
and when used to depict trends in heroin use, the composite
picture that resdltSs-is the 1::est,that can preSently be ob-
tained. Throdghout thisreport,'most'emphasis is placed on
serum hepatitis and narcotics deathS'ns the best of the -
available Andicators. In nearly0eVery jUrisdiction,, these ,
have been examined, supplemented whenever poSsible.by other.
available data. However, it-is unusual for anycAty or
use.
state to have more than one or_two reliable indicators 4avail-
able over a period of Several years.
Th&-lindingsAescribed in this report must be inter-'
preted with some caution as a general reading.of the changes
in narcotics, use in New York compared to other areas. The
limitations of the accuracy of the major drug use indicators
nown.* While most of the indicator dataconsideredare
here are thought to be specifically heroin,_related, some also
involve the use of othernarcotics7 chiefly methadone. Thiss
is most clearly the cage' for narcotics deaths in New York
Use of illegal methadone is a problem largely confined to.
New York city, so that in other. areas the term narcotics/ is
generally. .synOnymous with heroin.:
' The indicators used iulthis stuay",and thitir.anti-
cApated\ 'relationship with heroin use are as follows:
Narcotics-RelateeDeaths: Deaths due to narcotics use-are.
a
*See Appendix A for a' detailed discussion of the indicators.
4,*The'sources of all the data collected and used in this re-port are listed in Appendix B.

-S-
rough meakte of the prevalence of narcotics use. They
also, are thought to.bc relatdd to the pUrity of street -
heroin. A decrease in narcotics ddathsoan,be-fn'terpreted
ag a deci-ease in use either because thq'number of active
. narootics users isdroPping.or becaue the PuJAtyof,e
street heroin is declining, or both.
'Serum Hepatitis Cases: Drug users may contract serum0
hepatitis if the needle they use to inject a drug is.not
sterile. This disease usually occurs within the first
year or two_ot drug u.: and is believed to be an indicator
of the number of people beginning to use heroin regularly.
A decrease in reported cases, of serum hepatitis would in-
dicate that fewer young people arebeginning to use heroin
regularly.
Emergency Room Mentions: Reports of narcotic drugs men-
tioned during visits to hospital emergency rooms are col-.
' lected as part of the Federal Drug Abuse Warning Network
'IDAWW)'System.. They are thought tb reflebt,the availability
of illegal narcotics, especially heroin.. A decline in nar-
cotic dru 'mentions would mean a decline in the amount of
narcotics available on the street, probably also 'would
AlOran a decline in the number of people who were using narcotics
on a regular
Treatment Program Admissions: Treatment program admissions
probably reflect funding levels for treatment programs more
than they reflect changes in narcotics use patterns: They
13

-6-
also can be influenced by the policies of treatment pro-
grams and, by the.reportingsystems that are used. Further-_
more, drug -free treatment programs often enroll clients whatare'
not narcotics users. Nevertheless, the mast reliable
treatment admissions data available are Pre'Sented on
the assumption that long-term increases in admissions may
,reflect increases in the number of drug users. Most often
the.se are data from methadone treatment Programs. Tho,,age
distribution of admissions to methadone Programs and the
proportion\of paAek-its'aCimitted- for"the first time
have been analyzed, when possible as a rough gauge of
incidence of heroin use.
Heroin Purity: Short-term changes in Purity of heroin
sold on the streets probably reflect shifts in supply
_conditions: a sharp rise''in purity can be associated with
art increase in supply and.viceyersa. Pronounced changes
in purity are also thought to be related to changes in
the number of narcotics deaths and narcotics-connected
emergency-room incidents.
6,
Interpretations of long-term movements of purity are
difficult because they are theyresult of changes in de-
mand as well as supply conditions.'
Property Crime Complaints: Property crime complaints appear:
to be only distantly related to narcotics use. The 1971
heroin epidemic, for instance, did not result in a dramatic
increase in the rate.of such Complaints in most states.
_7_
Nevertheless, if the drug laws were unusually effective',
they would probably have,a moderating influence on property
Crimes. For this reason, the.property crime complaint
rate is presented as background materi41.
f
-15

SUMMARY OF CONCLUSIONS
1., ccording to the most reliable indicators, nar-
cotics use in New York City had been declining for a.1
year or tWo before the 1973 drug laws were introduced.
Since the introduction of the new laws in early 1973,
narcotics use Whs been relatively stable at levels far
below the tpidemic levels reached in the edkly 1970s.
There has been neithtr a significant increase ncrdecrease
innarcotics use since the, introduction of the 1973 drug. .
laws in New York State.
2. The stability'of narcotics use since 1973 does
not represent a departure from long-term narcotics, use
patterns for .New York City.
3. Opinions of both law enforcement officials and
drug treatment program administrators confirm that nar-
cotics use in New York City appedrs to be no more or-.1ess
widespread now than it was when the 1973 laws.were first
introduced.
4. There is' substantial consistency among the movements
of the indicators of narcotics use in New York City over the
entire 1970 to 1975 period. This consistency lends confi-
dence to-the results.
5. When compared to patterns of heroin use in other
East Coast jurisdictions, the uniform stabilityof the
New York City indicatori since 1973 stands out:
4

79-
(a) A.'direct comparison with heroin use patterns
in Washington, D.C. suggests that heYoin use
in Washington has been inci-eaging slowly but
steadily since 1973. The comparisonhetween
New York and Washington is thought to be
reliable"because data for these two cities
are the most comprehensivd.
(1:)' Results for other jurisdicticnis are less con-
clusive, with some indicators' showing similari:
ties and others showing differences from the
stability in New York City.
, 6. The 'contrast between the-stability of narcotics
use in. New York and the Steady increase in use in Washing-
ton; D.C. might be attributable in part to the introduc--
tion of the 1973-laws in New York, ba there is no direct
evidence to support such a relationship. When compared with
Sother cities, Washington is as much a special case because
of its uniform increase in use as New Yolrk City is, -
because of its stability. Indeed, changes iA)the indi-
Cators of heroin use in Washington, D.C. resemble
closely changes in comparable indicators for Chicago, a
city thought to be subject to different market condi-
'tions:than eastern locations.
7. Very limited data suggest that areas of
New York State,outside New York City have not shown signi-
ficant changes in heroin use patterns that can be attributed
17

to the new,Arug laws.
"8. Statewide trends in.narcotics use showed no.
sj.gnilicant.chkiges associated with the 1973 drug laws.
°Patterns, of use in New York'State have.been similar to
patterns exhibited by other East Coast states.
13

/
a'
SUMMARY OF METHODOLOG
,Analyzing long-term narcotics use trends in NeW York
City (or other jurisdictions examined a n this report),
is.a.thTee-step process._,
The first step is to examine each individual-indi-
cator'in order to compare shifts that occurred atter
the new laws went into effect with patterns of movement
that occurred before the new laws became effective.
The second step is to combine the Tesults of
the indicators within a jurisdiction in order to see
if4a consensus exists with respect to the generalnature
of changes that occurred. Since indicaeors,are indirect
measures of trends and cannot be used to gauge.absolute
changes, the more similarity one finds among the inter-
p tatiOns of the movements of individual indicators, the
e Confidence-one can place in the overall result.
The thirestep is to.coMpare'New York State andf
New York City results with results obtained from an
analysis of indicators for other East Coast areas which
.2are demographically similar to New York but which were
14.
/'not dirgOtly affected by changes in the.New ork State
%drug laws. This is the point at which it is possible,
to learn whether changes that seemed unusualor unique
in New York Occurred in the comparison areas as Well,
or.whether some patterns did emerge that were unique to,
259 -2970 - 78 - 2

-12-
New York. The comparison areas thus serve as "controls"
for factors which may affect the extent of drug use over
a wide geographic region.
awhile long-term analysis is useful for identifying
trends that occur over a period of several years, it is
not sensitive to short-term changes that occur on a
month -to -month or quarter-to-qUarter basis.. Becaus
policy is sometimes made in response to such chang , an
analysis Of changes during the post-law period alo e in
New York City and its comparison cities has also been
undertaken. The main concern of this report, however,
with the longer-term movements.*
The principal statisticaltmethod used to detect long
term effects of the 1973 drug laws on the indicators of
narcotics use was Interrupted'Time Series Analysis (ITSA).
'This technique has been successfully applied to problems
of measuring effects of policy'changes.** ITSA is a
*The presence or absence of a long-term change was de-termined by a variety of techniques described in detailin Appendix C. A statistical test of some kind wasapplied whenever posSible, but some of the data were soincomplete that tests were not possible.
a.
' **Campbell, D.T. and Ross, H.L. "The Connecticut Crack-down on Speeding: Time 'Series Data in Quasi-Experimen-tal Analysis." Law and Society Review, Vol. 3, 1968, pp. 33-53;Box, G.E.P. and Tiao, G.C. "InterventiOn Analysis with.Applications' to Economic and Environmental Problems."Journal of the American Statistical. Association, Vol. 701,No. 349, March 1975, pp. 70-79; Cook, T.D. and Campbell,D.T."The Design and Conduct of Quasi-Experiments and'True Ex-periments in Field Settings." Handbook of Industrial andOrganizational 'Psychology. Marvin,D. Dunnette, ed. Chicago:Rand,.McN4olly College Publishing Co., 1976.
o
20 ,

:,-13-
echnique which can cittect changesin long-term trends
a time series;Aftvi theinterventfon'Of<some event.
n our case, the event is the effectiJe date of the 19 3_,
41p ; YorkState d4u4,1aws. The technique cannot, by''',
t
itself, he use to attribute changes in,the indicators'
to 'the adoption of'the 1973 laws, but can help'to
isolate such changes from the ranSlom ups apd downs which':
the indicators may Undergo.
ITSA is a conservative techni ue in the sense that
`)all bdt persistent deviations of the post-law'trend.from
the pre-law trend will go unnbticed. The most likdly
errqr.to occur -is for the tetchnique,to mistakenly repbrt
no effects of the laws. In this report, a finding of
"no change associated with the passage"of the lawh" means
post-law movements oy ends of the indicators were not
inconsistent with tWeir pre-law history.. '
_ Reliability of res is from ITSA depends on Waving
at leaqt 25. data points in both e "before" and 'after" time'6$
periods. Consequently, only indi ators reported on a
. monthly basis could be subjected to this type of analysis. 4i''
e-,
The statistical analysis has been supplemented by consul-
, tations with those most knowledgeable about changes in
heroin'use, particularly police Officials and admini-
strators, of drug treatment programs.

-14
HEROIN USE IN NEW YORK CITY
LONG-TERM TRENDS: INCIDENCE OF NEW USERS
Hepatitis
The number of serum hepatitis oases reported,per
month, the best available. indicator of new heroin use,
has a history resembling that of an epidemic. The num-
ber of cases rose rapidly to a peak in 1971 and fell
steeply for the next two years. The number of cases
remained stable ab a minimum leyel through 1974. .During
1975 and the first half of 1976', the first significant
increase since 1970 was recorded (Chart I).
Interrupted time series analysis (ITSA) failed
detect a significant departure in the post-1973 pattern
Of serum hepatitis from its previously established pat-,
tern. This finding suggests that, the 19,73 drug laws
had no signifiOant long-term impact on nevi heroin use. th
111'11 brief description of serum hepatitis trends from 1970
to the first half of 1976 will help clarify the statis=
tical result.
The contagibusip turf of hepatiis introduces a
high degree of dependence between the number of cases
reported in one month and the number reported in several
preceeding months. This dependence is even evident
betweensuccessive quarArly data, given On Chart I,
Where trends persist for some time. New cases declined
22

-15-
uniformly from early 1972 to about the time the drug laws
were implemqnted in September, 1973, at which time a stable,
or refractory, period of five quarters began. If the
bulk of the susceptible population had been exposed to
serum hepatitis by '1973,a newt outbreak of epidemic propor-
tions would not have been likely to occur for some years. In -0
that case, statistical analysis might have reported a
significant drop in thq level after September,. 1973.
In reality, the trend.. of new.cases since 1974 has been one
of increase with no indication of leveling off. Allowing ,
for an average lagof one year between the onset of regular ,
needle use and contraction otilepatiti, new heroin use
may have been increasing since.late 1973. Hence, the.
susceptible population apparently had not been exhausted
This recent upturn may not be due entirely to changingfi
\ patterns of hproin use. -Some doctots'sugge%4ncreased
° 'hometexual transmission as one contributing factor:
Treatment Admissions
Another way to measure the effect of the law.on the.,
number of new,users is with the aid of the age-distri-
joution of new admissions to eatment,yrograms and the
total of new admissions. Most users probably enter a
treatment facility at some time, tyPically%two or three
years) after they have begun xegular use of drugs. By looking
at a sequence of age distributions of new admissions, one
can see how the user population is chnging. I the'
23.

_ -16-
share of each age group rempins constant, then a plausible'
eicplanAtion is a constant influx of new users to match
the number who exit the drug using population. 4
Age distributions of new admissions to all metha-
done maintenance programs in the 'City were examined.
These programs treat regular users of heroin,_ and their
ilk.admissions therefore represent some portion of the heroin
. %
addicted sector of the drug using population. No rig rous. %
. ..'
statistical techniques could be applied to these data,
but careful examination suggests the following result
(Chart II).1-
Age, distributions from 1970 and 1971 ably do
not accurately re presentfhe addict popu on the
street. The pro grams were .just being esta lishe during
this time, and emphasis was placed on ecr ting older
rslOn the Eirog ams were in nor "al operatf6O,
the percentage of .addicts over- 30 dropped to a level of
about 255S'and has stayed there until the present time.
The most noticeable features on Chart II are the peaking in 1974
of the percentage of new clients in the 21 -25 age cate-
gory and the simultaneous start of a steady increase in ;
the 26-30.age,'4group.
One explanation, might be that the large numbers of
people who began regular use of heroin during fhe epi-
' demic of the late 1960s first entered treatment in large
numbers in 1972. past studies of drug useThave shown
.that new users are predominantly-,in their late teens or
24

-17-
early 20s.) By 1972, this group would Lie 21-25 years old
-and indeed this was-the largest group to'seek treatment for
the first Lme4,,e. T4e26-30 age group Starts increasing
in 1974, just when some of the cohort from the'epidemic
per.iod would haVe reached this age category.
The new dug laws were expected 'to drive large
numbers of addicts into treatment before the point in
their liVes at which they might have entereTtreatment.
in any case. It Was thought that the threat of heavier
penalties would provide'a strong stiMulus to terminate.
one's narcotiths habit. Initially:this would not neces-
sarily change the age distributior-eof clients entering
treatment. But if fewer and fewer young people begin to
use, druis, the expected effect would be a long-term'increase
in the'av&rage'age of 'those who enter treatment.
The upward drift in the ages of new admisdions to
treatment certainly had been in ptogress before September:
1973: and WaS:therefOre most likely caused by phenomena
other than%theneW drug laws.
"Nor is it apparent that the laws motivated largeft
numbers of new pdtapie to enter treatment. New admissiOns
to methadone treatment declined steadily from 1972 with
only a: brief interruption in 1974. The new laws may have
contributed to this temporary halt-''in,the descent. The
free substitution of legabut less prefetred) metha:-
done for heroin may have'been an incentive for addicts to

enter. programs during S'Snief period of low'average, ,
street purity of heroin',arid the possibility of an increased,
threat ofprosacution under thq,new drug laws.
Taken togeth'e,r yith tie Vlanges'in,.hepatitisicases,
these'"data, do no't sugg'eSt4either a rush te'.treatment
a lOng-term int!Ncruption of previous trend's aftei- the*1973i .
laws became'effective. `E' the past several years; in-.
cidence of.mew users has been'far;below the incidence recorded
during the heroin epidemid of the late 1960s and early 197.0s.
,
LONG -TERM TRENDS: PREVALENCE OF USE
Deaths.
- . .
Nardotics7deaths and treatment'admiSsions data'have
been used as measures of prevalence (magnitude)' ofpat.
catids use. The death data should be given more atten-.
tion.than the admissions figures, because the latter%
are Subject 'to manyjactors'not directly related tonar-
cotics use (funding revels, accuracy of records, program
build-upi admissions policies).
Analysis of narcotics deaths from 1970 to 1976 has
prciiduCed Ro statistically significantdeclinedating from
September, 1473. A reading of Chart I bears out this;,
finding. A decline-was in fact detected but it was n4
quite vivid enough to have met the criterion of/statis-
tical significance. .
s.
The AUMber of narcotics deaths had been decreasing

I
-19-
for nearly two years piior to the middle of 1973. Ato
this pOint the trend reversed itself and for three quarters
dant4 ligdres climbed as steeply as they had descended
in the past. The increase stopped,after the first quarter
of,1974; several months after implementation of the law.
From this point until 1976 there is general decline, but
too gradual to be clearly attributable to an effective
drug law. Indeed, deaths from narcotiOhuring the first
months of 1976 differ little in number from the months
immediately preceeding intervention of the.drug laws.
Total Admissions to Treatment
Total admissions to all methadone clinics in the City
were examined as a prevalence easure.* There was a slight
increase in admissiops to,methadone maintenance programs dur-
.ing 1974 which constituted a cnange from the previous de-.
cline. The increase might reflect A short -term incentive.to enter treatment produced byLthe new laws- HoWever,
the increases:Aid.not persist long enough to be statis-
tically significant, and no long7term changes originating
in late.1973 were detected.
Analysis of admissions ioaMbdlatory detoxificatiork
centers reveals a stable number of total admissions and a
'gradually declining number of new-Clients since the third
quarter 4;1973. The decline in new admissions is less a
*The age distribution of new admissions is describedabove as an indicator of incidence of new narcotics use.

-20-
sign of new law effectiveness than the result of the fact
e 4that t out - patient programs most often draw clients
from ir surrounding neighborhood, and the longer a
program is in operation, the more likely'it is that
particularindividuals in that neighborhood will already:
have entered treatment at leaSt once. There were no
large, short-run increases in either category imm ediately
after SePtember, 1973,
Neither this information from treatment Programs
nor the available data concerning narcotics deaths in-
.dicate a significant shift in the long-term Pattern of
Prevalenceof narcotics use in. New York City.
-4
SIMILARITY AM THEONG NEW YORK CITY INDICATORS
The findings of this report are strengthened by the
. fact that the movement of all of the narcotics use in-
dicators for New York City have similar interpretations.
The indicators, taken together, provide a picture of
narcotics use which Peaked before 1971 and fell rapidly
for twoyears afterward. Excluding serum hepatitis, the
indicator movements stability or slight Adeclines
since '1973. in the number 'ofSerum hepatitis
cases in 1975 and s-k
197.1..or earlier,
--e4firstchelf of 1976 represents rising
e it is the only indicator to' how an increase during
but it must be viewed.use in cautiously
period, and in--.any case the increase was not found
23

-21-
to be statistically significant.
For each of the indicators, statistical analysis
showed that post-law, long-term trends are not out of
context with Pre-law trends. 'Short-term trends are4 4
described below, and there is some evidence which sug-.
::gestsa temporarY effect of the drug laws on narcotics
use'trends.in 1974.
'COMPARISON WITH OTHER JURISDICTIONS: LONG-TERM CHANGES
,
Narcotics use patterns in New York City were compared ,
cities.' Baltimore,
were chosen because they
with those of other large,East
Philadelphia, and Washington
are alli t, gY+ York and because theya demOgraphj.a
are thought to be the Same,Oleroin distribution net
work as New York City. Hoph has also been included
in the New York City group'bTeOeuse-it is a vital East
Coast city. Of these citigi, Washington provided the
most complete and reliable data.
The indicators for each city were subjected to time
series analysis. The movements of the indicators in
Washington, Baltimore; and Boston since lite 1973 were
not found to be inconsistent with their respective his-
tories (Charts III-v). In Philadelphia, the level of
serum hepatitis was found to be significantly lower
after late 1973 than befOre (Chart VI). In Chicago, a
city which contrasts with New York because it is part
29

-22-
of a different heroin distribution system, hepatitis
cases showed a statistically significant'increase begin- ,
ning in March, 1974 -.(Char These results suggest,
that the absence of a.. 19ng-run change in New York was
not entirely unusual among East Coast cities. Further
search for unique effects of the 1973 drug laws in .
New York.City must focus on short -term comparisons.
COMPARISON WITH OTHER JURISDICTIONS: SHOT -TERM CHANGES
A direct.comparison between post. -1973 trends. in
New York City and those in Washington highlights the
stability in NewYork, This suggests that the drug laws
may have had a damping effect on narcotics use in
New York City. ,Prom the otherrEast Coast cities come
less complete and reliable data. Their movements=pvovide
conflicting, evidence for crediting tough drug laws for
the apparent stability in New York. Indeed, Washington
is as much an anomaly in its uniform increases as New York
since 1973, the historyCity is in its steady state, Furthe,re7
of the indicators in Washington appear more akinto that of the
indicators in Chicago (Charts I, III and VII).
The results from Washington provide a picture of
steadily increasing heroin use since 1973, a finding
donfirmed by law enforcement and treatment program officials
there (Chart III). The Pre-law histories of narcotics
deaths in New Yprk and Washington are much alike, but
-23-
'since September, 1973 these deaths .increased steadily in',
Washington. In New York City they declined gradually
(Chat Total admissions to all Modes of treat-
ment in Washington show a similar pre-law pattern to thob'
in New York City. After 1973, they.incteased in Washing-
ton, while in New York they declined.'
Emergency room Mentions.in Washington changed little
-during their recorded hietory,1973-1975,'while the serum
hepatitis case rate has been increasing since 1966 whehy
data for this indicator were first available. The serum
hepatitis level was stable in New York City dur-
ing:1974 (Chart IX). Unlike New York City, Washington
apparently experienced no epidemic outbreak. of the disease
before 1973. despite a narcotics death rate which was
comparable to'New'York City's. Narcotics deaths in Washing-
--ton between 1970, and 1973 were much higher"than cases of
hepatiiis, lending some suspicion to the adequacy of the
hepatitis data (Chart II).
The consistent directions Of the indicators in
Washiligton since 1973 present a picture of a growing
heroin use problem, a growth that is not found in New York
City.
Results from other East Coast cities vary in their
tf
contras to New York. Nar otics deaths in. Baltimore
decline rom a peak, in 1 11 as they do in New York (Chart VIII).
In fact,, Baltimore has regist4,red a...C(9111,, but statistically
31

-24-
significani decline in narcotics deaths since 19731 The
patterns of serum hepatitis in the two cities diverge
after 1973. Marked increases in 1974 occur in Baltimore.
that are not present in New York (Chart IX).
Unfortunately for the Purposes:of this report,
Philadelphia has available only one indicator, serum
hepatitis, that is directly comparable to any of the
indicators from New York City (Chart,IX). These data,
together with deaths from all drugs" (rather than, just
narcotics deaths) and consultations with treatment liro-
'gram officials there, suggest an epidemic of narcotics
use and subsequent rapid decline at about the same'time
they occurred in New York City. After 3, there was a,
rise to a moderate but steady level of heroin use.
Data from Boston 'are presented on Chart V. According
to these'data, Boston has experienced a considerably
different history of heroin use than New York, prevelitia
more than a superficial comparison.1-
The Drug-Enforcement "Administration (DEA) provided
a yearly breakdown of the sources of a sample of the
heroin;seized in EaSt Coast cities since 1972. This-
information was analyzed for evidence of the separate
interdiction effects of the,Turkish-opium ban and the
New York State drug laws. The data give some indication
that New York City. was among the last of these cities
to enter the market for Mexican heroin. This conclusiOn
32

A
-25-
cannot rest on these data alone for, as the DEA, hasN!'
pointed out,' rigorous sampling methods were not used
to extract the data. However, police officials in
New York confirm the late entry of Mexican heroin into
the City.'
Because information about heroin purity is- available
only since late 1973, it cannot be used to infer any
results of the 1973 drug laws, but it was utilized for
comparing inter-city suppla conditions since that time.0
In general, ,the series on heroin purity appear to move
in similar fashion to other indicators of heroin Use -
within each of the:jurisdictions.
These postwlaw comparisons between' East Coast cities
support -- but do not prove -- the following scenario:,
The gradual increase in the comparison cities'
indicators occurred because the Turkish opium ban, which
had played a major role in the downward trend of heroin
use during the pre-law period throughout the East COast,
had run its course by the end of 1973. Mexican heroin had
been introduced into some other cities on the East CoaA
by that time. The level of heroin use in New York City
remained relatively unchanged because the new, drug laws,
which were introduced at the time the impact of the
opium ban had diminished;' were. able to achieve a stabilizing ,
effect in 1974.
If this, interpretation is correct, the vigotous

-26-
advertising campaign which accompanied passage and im-
plementation Of the new drug laws had enough of an effect
on drug users to influence the course of narcotics use for
some months. Enforcement and treatment program officials
around the State are in broad agreement that heroin sel-
lers were very cautious in the fall of 1973. Transac-
tions were-more discrete than before, moving from street
corners to hallways arld rooms. Sellers were also reluc-
tant to deal with anyone other than well-established
customers. The slight increase in methadone program
admiOions occurred at'roughly this time as well. With
the passage of time, street level heroin users and dealers
realized that the threat of the new laws was more theo-
retical than real. The police were not making street arrests
on a large scale and the courts were having trouble with
implementation.*
This sequence of events cannot be ruled out, but the
long-term analyses, which we think are most appropriate
for determining effects of the laws, do not show a signifi-
cant interruption of pre-law trends associated with the
1973 drug laws.
*See "The Effects of the-1973.Drug Laws on the New York StateCourts" in this volume..
34

HEROIN USE IN NEW YORK STATE
New York City is the centef of the New York State
heroin trade, and one would expect that statewide drug
use patterns would show general similarity to the
New York City trends.
This proves to be the case when the indicators for
the entire State are examined.. The decline in narcotics
use that occurred in New York City between 1971 and 1973,. .
is also evident statewide, although the decline in serum
0hepatit's is not, as pronounced. The two available indi-
cato 0 trongly suggesi that heroin use had been declining
for at least a year prior to the introduction of thei
new laws (Chart X).
Long-term analysis of these indicators revealed no
evidence of significant change in the patterns of heroin
use during the post-law period compared with pre-law
(--R
atterns. New York State was not unusual,in its lack'
o:ng-term change. Each of the available indicators
from comparison states- has been analyzed, and none of them
showed &ends which were detectably interrupted in late
1973. Thus; on a statewide basis, these findings do not
iaiggest a significant impact of the new drug laws.
Cases of drug-related hepatitis in the comparison
states,closely followed the pattern found in New York State
as' a whole, Almost ever5, state considered in the-analysis,
as well as the entire United States, experienced declines
259-297 0 - 79 - 3

-28-
after 1971. None has since returned to these peak levels,
althoug Maryland and Connecticut have moved more in the .
direction Of these levels than Pennsylvania, Massachusetts
or New York (Chart XI). This evidence supports the con.-ej
clusion that despite some differences among the
post-law changes are consistent with changes which occurred
prior to 1973. This is true both for New X rk State and
its neighbors.
Deaths from narcotics in New York State have generally
declined since the 1971 peak. Analysis showed that this
trend cannot be associated with the intervention of the
laws, and in fact, deaths underwent a temporary increase
immediately after the third quarter Of 1973. Deaths in
Maryland exhibited a drop in the post-law period con-
pared'to the pre-law period, while Pennsylvania and
Massachusetts showed no significant changes. Compared
to these other states., then, New York does not show a
marked decrease i deaths (Chart XII).
Property crime co plaints in New York and, the com-
parison states also exhibit similar trends (Chart XIII).
All have shown similar movements since 1960, and since
1970 it is hard to.recognize any differences between
the states. A truly effective drug law might have pro-
duced some decline in property crimes relative to other
jurisdictionsr This would be particula,rly true if a
strong cause and effect relationship existed between
3.)
Pr

729
heroin use and non-drug crime, offghders sent to
prison under the drug laws otherwise would have been
responsible for many offenses. There is no evidence,
however, of a slower rate of growth. in New York PrePer-
ty crime complaints since the enactment of the 1973 laws;
n:".' Results of an earlier study of non-drug felonies
'attributable to narcotics users in Manhattan indicate
that narcotics users have not been responsible for 'the
.711.ilcreases in crime rates. since 1971.* The study con-
Cluded that a decreasing Proportion,of serioueJerMes
are attributable to users' since.1971. In the face of
widespread increases in crime duringthis'period,, these
results suggest.that crime and heroin Use May be more
independent than'Popularl Y thought.
EssMination of the post-law period alone reveals
some differences between New York State and other .states:;
Naicotics-related deaths in New York State have remained
stable since,1973,- as they have for the most part in tie
comparison areas. Drug - related hepatitis cases in-
creased in Nary]. end New York, decreased in Penns
and remained the same in Massachusetts during this Period
(Charts XI and XII). Thus the.New York rate increased
compared with the rates in two other states, a result which
is:not consistent with a'successful New York drug law.-
*Soe'"Crime Committed by NarCotics Users in mabhattan" inthis volume:

-30-
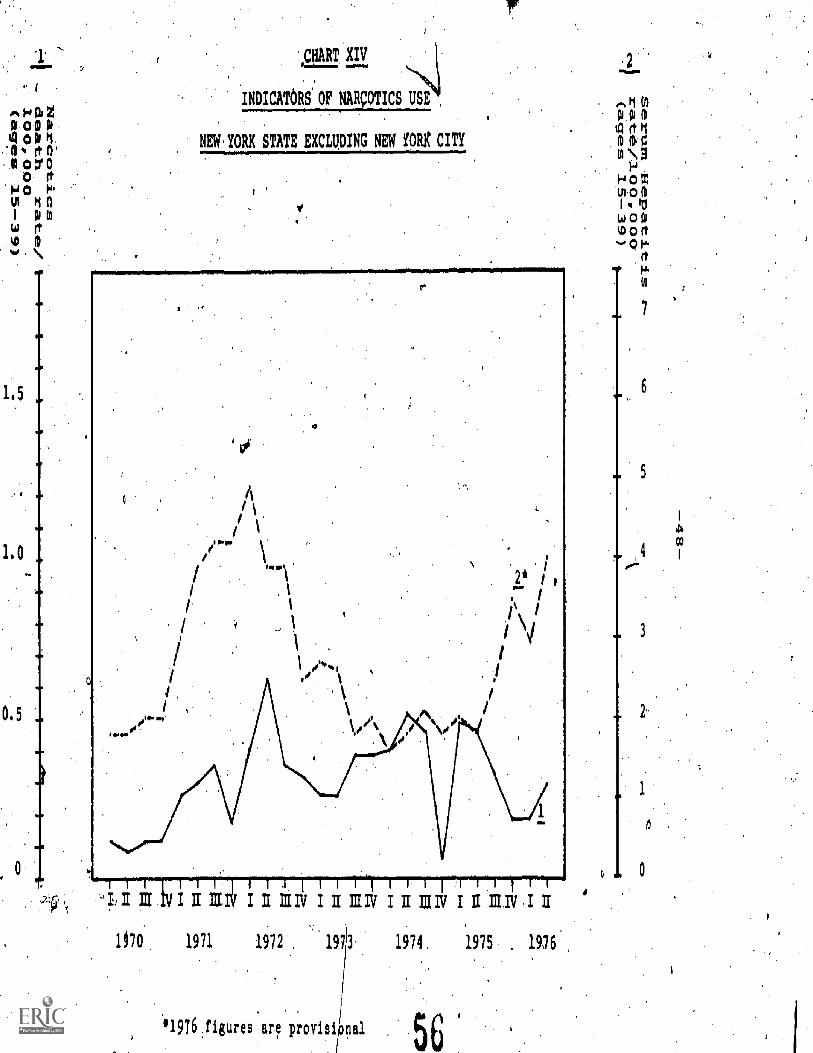
f. 1r' USE', IN AREAS OF
YORE( RTA SIDIO'i'E NEW YORk CITY
In order to determine if heroin use ttends.
-
outside
New York influenced by the laws, Aata from
-specific andcoUnties within the State Were needed.
An effort was made to collect data from,thesm-target
. areas and from sites picked -as out-of-state coMparisons,.
Infrequent observations and short time series from these
cities and counties precluded the application of-statis-
tical techniques. This also made a casual reading of
the data difficult; and we were unable'fb conduct picduc-
tive comparisons Of local data. In the.aggre.. ..
9ate,fhowever,
the. areas State Outside New,York City,
r'f'sertim'hepatitist.
%wed no
. that
changes in'narcotics death's o
can be associated.with the drug laws' (chart XIV).
These indicators,suggest that the pattern
isOonsia
of navdotics
deaths --'arably different. outside the,
city than
it is within it.. There..'-
was a gradpal_nlaWard drift' from
1970 through the middle of.1975, with no evident epidemic
level in the early 197bses there was iir New York City.
In contrast, cases of Serum hepatitis 'move in the same
fashion outside. the City as they do in the City
As is toy be expeote
--'1" (and in
the actualthe State as a whole) expected
rates for bdth indicators are considerably lowrfor
of the State outs.;
areas-'
-ile the !City than thel4ere in the City
itself.
33 ..

-31-
--'-The differences"betrieeh trends in New York city
and in the rest op the State .indicatf that trend
separatein states containing large cities should- -ate rdra/
and subutban-data. from urban area data!' nfo
,the comparison states do not Provide such'` .a..]FtreakdoWn.
.."prqi?entinglikMParatiUeanalysis.
'The,Meagerdata available for particular sites
liMit analysis to a cursory .examination4 fr_Which the
fo wing obseryatiOns-C4 be drawn: ,
Buffalo's narcotics death and Serum hepati tis. tates
continued pre-law declines is,the post-law period.,
These patterns do not differ greatly from-New York City's
patterns.. Serum hepatitis in Pittsburgh, the eine out-of-
State area for which' cthere was suffiCient c--mParable
data, demonstrated. Movements similar to, .
Buffalo.
Nassau County, s death.rate fluctuated too widelyto
display any trend, ./Wnile Serum hepatitis declined from '1971
tliVOugh..1A74 and then', increased
RochestVand Albany,, An which only serum hepatitis
cases are numeitili enough to.analyze, .show fewe r cases,
since 1972 than-be
the ones in
fore. Wide fluctuations in'both.series
make conclusions difficult.
*Recent studies by Leon Hunt and othersnarcotics epidemics
'havein small cities occur later
shown thatthan those
in large cities. .
e-

Treeitment prograM and law enforcement officials
from, the Buffalo and Rochester areas were consulted to
compensate for the lack'bf gUantitative information.s
The consensus in Erie County.is that the 19,73 laws have
not had a marked impact'on levels of narcotics use.
laws do appear to have had a short-term restrictive
impact on drug traffic in the fall of 1973,'muchat; they
did in New York City. However, both drug dealers and drug
users Wm became aware the likelihoOd4cI arrest
and PiOsecution was not much greateriunder the new laws
than before. Drug users and dealers have perhaps become
more circumspect in their transactions but, in general;
the level dt drug activity reportedly has not diminished.
Admissions to drug treatment programs did not apparently
increase after the laws came into effect.
In-the Rodhester area abwell.,.14w enforcement of
.ficials and treatment program directors agree-that the
1973 laws had little noticeable impact on levels of
narcotics use. According to thesclofficials, heroin
use did not become a serious problem in'.RO4hester until'
l967196R, and levels of heroin use "have remained`' roughly
donstaiit,since 1971..
In contrast to the BuffOio area, narcotics,ariests
and prosedutions in-Rochester do appear tb have increased
since theearly according to law enforcement
officials. Narcotics traffickers have become more secretive

-33-
in their operations but,,in general, the increased penal--//i
ties for narcotics offenses have not acted as an effective
deterrent either to narcotics use or distribution. Nor
have the new laws encouraged large numbers of drug users
to enter into treatment programs.
41

-34-
CHART SECTION
Chart I: Indicators of Narcotics Use -- New York CityJar
C hatt II: Age at First Admission to all MenMaintenance Clinics in New York k City
Chart III: Indicators of Narcotics Use Washington,
IV:. Indicators of Narcotics Use --- Baltimore
Chart V: Indicators
Chart
of Narcotics Use E aston
Chart VI: Indicators of Narcotics Use P hiladelphia
Chart VII: Indicators of Narcotres Use -- Chicago
Chart VIII: Narcotics Death Rates for New York City
krt R
and Comparison Cities
Cha IX: Serum Hepatitis Rate's for New York City
Indicatorsof
and Comparison Cities
Chart X: Narcotics Use.-- New York State
Chart XI: D4mg-Related Hepatitis Rates for N '( York Stateand Comparison States
Chart XII: Narcotics Death Rates for New York Stateand comparison States
Chart XIII: Property Crime Complaint Rates forand Comparison States
pew York State
.,
Chart XIV: Indicatdrsof Narcotics Use -- New York State
Excluding New Yoik City
D.C .
Data sources for the Above charts begin on Page 46%

1 2
tgri"HZ D
. .
V10114:10n
rHmoto NO P.0 v4
or .imwoo.
o t
won won0) 0)14
o
rt
18 900
16 800
CHART I
INDICATORS OF NARCOTICS USE
$
NEW YORE CITY
.4
wo0'ino0loriW 0ko orr
0
511)0
0 (1.(1)
1))
N, 14,
M
rtN
ri 0I
18- 9000 m
14 -700
12 X600
VI 500
4 2000
1970 071 1972 1973 1974 1975 1976
431976 figures are provisional.
0-0

1001
90
801
70
60
50
40
301
201
10%
0%
1970.
CHART /I
AGE AT FIRST ADNIMONIO ALL METHADONEMAINTENANCE
CLINICS IN NEW YORK CITY.
1971 1972
0
18-20
A g21-25
aaaNaaaUaaaUaaaa
1973
,14
26-30
31 & over
1.9751974
*Represents first nine months. ,

1
18 900
16 800
14 -700
12 - 600
10 - 500
400
300
4, 200rip
- 100,
CHART III
INDICATORS OF NARCOTICS.UiE
WASHINGTON, D.C..-------
PP4171 41 WAIL
18. 20001
16 1800
14-1600
t)
IlilinvIgtivinzivirmanrinialyinxIVI311970 1971 19721 19734r, 1974 1975 .1976
12 1400'
10 1200
1000
=O.
6 800
4 600
2 400.
4

1 2
-MZPOP) IVO lbit1 rt M t4 rt N
ol\ciMain MOg
orvo1.10
1.1 op.o'n o
IN to 14 tswo wow(Dom, wort
m 0 id.
o1 rt.
14
12-12
10-10
CHART IV
INDICATORS OF NARCOTICS USE
BALTIMORE
0-01
'ir-TT1111111.1MIVIumiv.ininvIninvinialv Itamv
1970 1971 1972 1973 1979 1975
A n..4 t)

1
5
CHART V
INDICATORS OF NARCOTICS USEt
BOSTON
;.M U) 0.-0,3
rPHp(IM
(004 0
(A\MOP
No@ 00al 00td Orr
wolD ID
o asrt 11
N (1)
rrI4
PM0 M
I
18360 o
320
280
12240
10 200
160
120'
8Q
40
Iv I II
1970 1971 1972 1973 1974 1975 1976
°*Broken line indicatepdata
11 I not available

1 2
-os (A000 @Pia
mW1 ,
atomrog atomtovo H.04
H 000000. (COO
tPC(40'DO
0rl
0 F" o
I. 5.0
CHART VI
INDICATORS OF NARCOTICS USE
PHILADELPHIA
.miiiIi1=111.1==1.
Ht toiN PWMr 4r Ow
16-800
I unv'I nittly 1niziv I 31'1970 1971 1972. 473 4174 1975: '1976
AO

In. 2
ediZ Oom000 MOOoon ommoon rrnn0\0 :k1:11
HO`00014014 111400°0 m00It to mi<
wot 0
0
fr
18 900
16 800
14 no
12 600
,10-` 500
8 400
6 300
4° 200
1fti
CHART VII
INDICATORS OF NARCOTICS USE
CHICAGO
IT)
16t 1,600
14 1 400
//
//
1
1
I
1 1. \ C/t I % %
1 p1. \I /t ,
k1
I I1%
, /I it
/ .
Iso +.1 /%.,..0
141112100
10 1,800 /
800
6 600
.4 400
2 200
inxivintliavvinaniilizivinnivin1910 1971 1972 1973 1974 1975 1976
49*Broken line indioates data
not' available**pictures for Cook Coanty

CHART VIII
NARCOTICS DEATH RATES FOR NEW YORK CITY
AND COMPARISON CITIES
0 plri
ro
01
0
'OwNo
z.
:11'./ 1 , .
:1 I.
I.
1 \ .. NINew York Cityi 4 1
/\\ I 1 WashingtoneD.C.0,1 , /VI 1\
11
, .fe,\/ \, V--%s ,/\ I P. t i ,: .. .,:
// .;
. I 1 .:/Baltimore
.\ ..'
.. r
v
it
I L< la IV, I II la
1970. 1971
V u El E in iv I I( la iv I rt
1972 1973, 1974 1975

ti
U
0H
ra40ra4
0000
0
ra4
F
F#
F10
(14
-43-
'CHART IX
SERUM HEPATITIS RATES FOR NEW YORK CITY AND COMPARiSbN CITIES
30
25
20
15
°
1970
I It III /
1971'I I( III I
1972
II III iv I II$ iv I it m IV1973 .1974 1975
1 Washington D.C.; 2 Baltimore; 3 Philadelphia; 1 New _York City
259-297 0 - 51

CH
AR
T_X
IND
ICA
TO
RS
OF
NA
RC
OT
ICS
USE
NE
W Y
OR
K S
TA
TE
0 C
Dr-r
o o o ct
0 P
. fi IA-
EA
18 14 12 10
Z*
16 I
I, I
3:1
11;1
17IV
III
in iv
II in
ivII
,
1970
1971
1972
1973
1974
.19
75'1
976
1119
76 f
igur
es a
re p
rovi
sion
\:

-45 -.
CHART 'XI
DRUG-RELATER HEPATITIS RATES
FOR NEW YORK STATE AND
COMPApISON'STATEs
1 Maryland; 2- Pennsylvania; 3 New York State, 4 Massachusetts
53

A00
0000 as0 I0 as
110)
04
A
cu
Cl)
0F-1
4.0
3.0
2.0
CHART XII
NARCOTICS PEATH'HATES FOR NEW YORX.STATE
SID COMPARISON STATES
I\ ki % 4
e'
't %
's;
/ t t /I
1r N \ A,1 \ i
VI r,
\\ ;
II1970 1971 , 1972
1.1 III I II III I II Et
1973 1974 1975
.1 New York State ; 2 Maryland ; 3 Pennsylvania ; 4 Massachusetts
54

6000 -
' 5000)
ao
4000 -
00
4
00
30e0
0
0
r00 1000
2000
a
. o
-47-
CHART XIII
PROPERTY CRIME COMPLA1INT RATES
FORNEW YORK STATE AND COMPARISON STATES
1111,1,1- LT:0 1951. 1952 1Sta l L%5 as 1967 1933 1559 191339711%'2-1973 3974 1975
1 Maisachusetts; 2 Maryland; 3 New York. State; 4 Pennsylvania
55
Q W.OW ti
rt
tovio
Ho fr
rtanto
W rt
W
1.5
1,0
0.5
',CHART XIV
INDICATORSi OF NARCOTICS USE
NEW. YORK STATE EXCLUDING NEW YORK CITY
yrnimppmnon..11Mnimmillopimi10moim:rwrimommimrMNImagnirmirliMMININMIIMMIIMIIMIN111M111111
A1.
1
1070 1971
III INV I II III IV I II INV I II. BI IV I 11
1972 197)3 1974 1975 . 1976,
,figures are provisi nal
56
2
01, 1:11 M
11 IC«
tIA
1Z
nnmd
WOW'.Dort
1.6
(11
7
3

-49-?.
SOURCES FOR DATA SHOWN ON CHARTS*'.
Chart I Indicators of Narcotics Use --New York City
1) Narcotics,Deaths: New York City Departmentof Health. Narcotics deaths consist ofall recorded deaths Classified by thefollowing I.C.D.A. codes: 304.0, 304.1,and 304.9. I.C.D.A. code E854.8 is notused by the New York City Department ofHealth. Data on deaths classified intoI.C.D.A. code E853.0 (one death in 1970and one death in 1973) were not utilizedbecause the month in which the deathsoccurred was not obtainable.Narcotics deaths for 1976 are provisional,and do not include cases where narcoticshave not been confirmed as the cause ofdeath..
2) Emergency Room Narcotics Mentions: DrugAbuse Warning Network, Drug EnforcementAdministration. Narcotics. Mentions includeheroin,, methadone, and all other TC 40narcotics. The data are for the New York City SMSA.
3) Serum Hepatitis Cases: Center for DiSeaseControl, United States Department ofHealth, Education and Welfare. Serumhepatitis figures for'1976 are provisional:the quarterly figures were based on weeklyreports and may not agree with annualreports of-quarterly totals.
4) Treatment Admissions:Methadone.InformationCenter, Community Treatment Foundation, Inc.Treatment Admissions consist of total admissionsto all methadonemaintenance clinics withinNew York City.
S) Heroin Purity:.Drug Enforcement Administra-tion, United States. Department of Justice.
*All rates for serum hepatitis cases and narcotics deathswere computed with United States Census figures from 1970,for populatiOn aged 15-39. Rates fOr drug-relatedhepatitis for selected states, were computed differentlyand are discussed under sources for Chart XI.
57

.
Chart II-so-
Age at-First Admission to All Methadone Main-tenance Clinics in New York City
Methadone Information Center, Community TreatmentFoundation, inc.
Chart III Indicators of Narcotics Use -- Washington, D.10%.
1) Narcotics Deaths: Washington; D.C. MedicalExaminer's Office. Narcotics deaths consis4of all deaths attributable to narcotism.'
.2) Emergency Room Narcotics Mentions: Drug
Abuse Warning Network, Drug EnforcementAdministration. Narcotics Mentions includeheroin, methadone, and all other TC-40 nar-cotics. Data are for the Washington, D.C. SMSA.
3) Serum Hepatitis Cases: Center.for DiseaseControl, United States Department of Health,Education and Welfare.
4) Treatment Admissions: Narcotics TreatmentAdministration, Washington, D.C.
0
5) Heroin Purity: Drug Enforcement Administra-tion, United States Departinent of Justice.
Chart IV Indicators of Narcptics Use -- Baltimore
1) Narcotics Deaths: Baltimore Medical Examiner'sOffice. These figures include all positivelyscreened narcotics deaths which were "signedout" as narcotics deaths. Monthly deathsclassified by I.C.D.A. codes were not available.
2) Serum Hepatitis Cases: Baltimore HealthDepartment. Bhltimore'S average quarterlyserum hepatitis rates were computed by
/ taking the annual rate and dividing by four.
Chart V Indicators of Narcotics Use -- Boston
1) Np.rcotics Deaths: Department of PublicHealth, The Commonwealth of Massachusetts.Narcotics deaths consist of all deathsclassified according to the followingI.C.D.A. codes: 304.0, 304.1, 304.9, E853.0,and E854.8 (when applicable).
58

-51 -.
2) Emergency Room Narcotics Mentions: DrugAbuse Warning Network, Drug EnforcementAdministration. Narcotics Mentions in-clude heroin, methadone, and all otherTC 40 narcotics. Data are for the Boston SMSA,
3) Serum Hepatitis Cases: Department of PublicHealth, The. Commonwealth of Massachusetts.
4) Treatment' Admissions: Drug Treatment Pro-.gram, City of Boston. Treatment Admissions'consist of total admissions to all city-operated methadone maintenance clinics.These clinics comptise a majority of allmethadone maintenance clinics in the cityof Boston.
5) Heroin Purity: Drug Enforcement Administration,United States Department of Justice.
Chart VI Indicators of Narcotics Use -- Philadelphia
1) Serum. Hepatitis Cases: Pennsylvania Depart-ment of Health.
2) Emergency RClom Narcotics Mentions: DrugAbuse Warning Network, Drug EnforcementAdministration. Narcotics Mentions includeheroin,-methadone, and all other TC 40narcotics. Data are for the Philadelphia SMSA.
3) Heroin Purity: Drug Enforcement Administration,United States Department of Justice.
Chart VII Indicators of Narcotics Use -- Chicago
1) Narcotics Deaths: Illinois Department ofPublic Health. Narcotics deaths consistof all deaths classified according to thefollowing I.C.D.A. codes: 304.0, 304.1,304.9,and E853.0. No-deaths were recordedin the E854.8 category. Cook County'saverage quarterly narcotics death rateswere computed by taking the annual rate anddividing by four. For 1973, the narcoticsdeath rate for Cook County was estimatedfrom State data.
2) Emergency Room Nardotics Mentions:. DrugAbuse Warning Network, Drug EnforpementAdministration. Narcotics mentions in-clude heroin, methadone, and all otherTC 40 narcotics. Data are for the Chicago SMSA.
3) Serum Hepatitis Cases: Illinois Depart-ment 6f Public Health. Cook County wasused in place of the city of Chicano.
4) °Treatment Admissions: State-of.IllinoisDangerous Drugs Commission. TreatmentAdmissions consist of tptal admissions
It to all methadone maintenance clinics in thecity of Chicago which receive financial .
support from the Illinois Dangerous DrugsCommission. These clinics include Vir-!tually all of the methadone maintenanceclinics in the city of Chicago.
5) HeiOin Purity: Drug Enforcement Administra-tion, United States Department of Justice.
*Chart VIII Narcotics Death Rates for New York City andComparison Cities
1) New York City: New York City Departmentof Health. Narcotics deaths consist ofall recorded deaths classified by thefollowing I.C.D.A. codes: 304.0, 304.1,sand 304.9. I.C.D.A. code E854.8 is notused by the New York City Department ofHealth. Data on deaths classified intoI.C.D.A. code E853.0 (one death in 1970and one death in 1973) were not utilizedbecause the month in which the deaths oc-curred was not obtainable.
2) Baltimore: Baltimore Medical Examiner's.Office. These figures inclUde all positive-ly screened narcotics deaths which were"signed out" as narcotics deaths. Monthlydeaths classified by I.C.D.A. codes werenot available.
3) Washington, D.C.: Washington,pD.C. MedicalExaminer's Office. Narcotics deaths con-sist of all deaths attributable to narco-tism.
60

*part IX Serum Hepatitis Rates. for New York City andComparison Cities
1) Washington, D.C.1'Center for. Disease Con-trial, United States Department of Health,
- Education and Welfare.
2) Baltimore: Baltimore Health Department.4,Baltimore's average quarterly serum hepatitisrates were computed by taking the annualrate and dividing by four.
3) Philadelphia: Pennsylvania Department ofHealth.
4) New York City: Center for Disease Control,United States Department of Health, Educationand Welfare.
1*
Chart X Indicators of Narcotics Ube -- New York State
1) Narcotics Deaths: Narcotics' deaths forNew York State were obtained by adding,narcotics deaths for.New,York City andnarcotics deaths for the remainder ofthe State. New York City narcotics deaths,which were obtained frOm the New York CityDepartmentof Health, incltde all recordeddeaths which are classified according tothe following I.C.D.A. codes: 304.0, 304.1,and 304.9. Narcotics-deaths for the remain-der of New York State were obtained from theOffide of Biostatistics, New York StateDepartment of Health, and include all recordeddeaths which are classified according to thefollowing I.C.D.A. code8: 304.0,.304.1r304.9, E853.0, and E8(54.8 (when-applicable).I.C.D.A. code E854.8 is not used by theNew York City Department of Health. Dataon deaths in New York City that are clas-sified into I.C.D.A. code E853.0 (one deathin 1970 and one death in 1973) were notutilized because the month in which thedeaths occurred was not obtainable.
Two sources have been used for state-wide narcotics deaths-because the Office ofBiostatistics, New York State. Department ofHealth, does not update itsfiles to in-elude narcotics death's cases which arepending in New York City; the New York CityDepartment of Health annually updates.its
el
r

-54-
data to'include all pending cases. (Pendingcases include all cases where narcoticshave not been confirmed as.the,cause ofdeath until considerably after-the timeofdeath.) Pending,narcotics death. cases .for the remainder of New York State areincluded in. the data acquired from theOffice of BiostatistiCs, New York State'Department of Health. Thus', by combiningdata from the two sour0s, a complete ac-coUnt of recorded narcoticd deaths for theState has been obtained,
Narcotics deaths for 1976 are provi-sional bedause New i'ork Ckty does not'update pending cases until early.1977.
2) Serum Hepatitis Case: Center for DiseaseControl, United States Department of Heatlh,Education and Welfare. New York Stateserum hepatitis figures for 1976 are provi-sional. The quarterly.figuces were based onweekly reports and may not\agree with annualreports of quarterly totals.
Chart XI Drug-Related Hepatitis Rates for New York Stareand Comparison States
Center for Disease Control, United StatesDepartment of Health, Education and Welfare.Rates were computed with United States Censuspopulation figures, ages 18 to 44, for 1966,1968, 197,0 and 1974. Calculations were based ,
on methods.devefoped by Lee Minichiello atthe Institute for Defense Analyses. SeeAppendix A for details.
Chart XII Narcotics Death Rates for New York Stateand Comparison States
1) New York State: (See Chart X, NarcoticsDeaths. The only difference is that 197Gfigures for New York State are not includedhere.)
2) Maryland: Baltimore Medical Examiner'sOffice. These figures include all positive-ly screened narcotics deaths which were"signed out" as narcotics deaths. Monthly
4 deaths classified by I.C.D.A. codes werenot available.
2

-55-
3) Pennsylvania: Pennsylvania Department ofHealth. Narcotics deaths consist of-alldeaths classified according. to the followingI.C.D.A. codes: 304.0;304.1, 304.9, E853.0';andE854.8 (when applicable). Pennsylvania'saverage quarterly narcotic death. rates werecomputed by taking the annual rate anddividing by four.
4) Massachusetts: Department-of Public Health,,.The Commonwealth .of Massachusetts. Narcotics
. deaths consist of all deaths classifiedaccording to-the following I.C.D.A. codes:304.0, 304.1, 304.9, -E853.0, and E854.8(when applicable).
Chart XIII Property Crime Complaint Rates for New York Stateand Comparison States
Federal Bureau of Investigation, Uniform CrimeReports. Total state populations were'used Lu ,compute crime rates per 100,000 population.Population figures were obtained annually fromthe Uniform Crime Reports Index of'Crime.Property crimes include- the following categories:auto theft, larceny (all dollar amounts), to.111-41ary,and robbery.
Chart XIV Indicators of Narcotics Use -- New York State.Excluding New York City
1) Narcotics Deaths: Office of Biostatistics,New York State Department of Health. Allrecorded deaths classified according to thefollowing I.C.D.A. codes: 304.0, 304.1,304.9, E853.0,. and E854.8 (when applicable).
2) Serum Hepatitis Cases: Center for DiseaseControl, United States Department ofHealth,lEducation and Welfare. New YorkState serum hepatitis figures for 1976are provisional. The quarterly figures werebased on weekly reports and may not agreewith annual reports of quarterly totals.
63
;756-
Appendix A
'Definitions of Indicators, and
Choice of Comparison Areas
1. Narcotics'Deaths:
Deaths attribut e directly to narcotics use arean indicator of preva nce, although numbers of deathsmay also be related to-supply and price. That is, if '.
the quality of street heroin goes up per bag (e.g. pricein effect declines)iit is possible that more addicts willoverdose', and a greater portion of these will die as aresult of the unaccustomed higher purity per dose., How-.ever, it 11; expected that such reactions would be of shortduration, since information about heroin quality travelsArickly_on the street, whereas the effects of changes in`prevalence would persist over the long term.
There' has been some dispute in the .past about thecauses of narcotics. overdose deaths.* However, recent
.research indicates that the questionable aspects of '
narcotics deaths were due in part to insufficientlysensitive techniques in coroners' laboratories.** Im-proved analytic techniques contribute some variabilityto death.figures over time, but this is probably minorcompared to the variation introduced-bydifferent defi-
Abnitions of-Oat constitutes a drug death.It is most useful to consider only deaths directly.
duo to narcotics intake. because -'these are most widely andconsistently reported., Furthermore, within the category
'ofearcotics deaths, some jvrisdictions include accidentaldeaths and homicides when dieqs are found in the body, butmost do not. Because of multiple prsblems of definition andbecause the figures are not always available, these deaths(often referred tb as "narcotics related" deaths) have beenexcluded wheneVer possible. * **
To measure narcotics overdose deaths, we utilized the-following five codes from the International Classificationof Diseases,**** which we believe provide a valid and reli-able, yet conservative, estimate of narcotics deaths: 304.0;304.1; 304.9; E853.0; and E854.8 when applicable.
*Brecher, Edward M. Licit and Illicit Drugs. Boston:Little, Brown and Co:, 1972, pp. 101-114.
**Garriott, James C. and Sturner, William Q. "MorphineConcentrations and Survival' Periods in Acute HeroinFatalities." The New England Journal of Medicine,December,13, 973.
***Barton, William I. "Narcotic-Related Deaths Decreasein 1972 from the Number of Narcotic-Related Deaths in1971." The International Journal of the Addictions,Vol-. 9, Quarter (4), 1974, pp. 513-529.
****Eighth Revision, International Classification of Diseases,Adapted for the United States; Volume I and II: U.S. Department. of Health, Education, and Welfare, Public Health gervice,.Nation-al Center for.Health-Statistics.
64
-57-.
(E854.8, acute intravenous narcotism, was first introducedin 1973, but was sometimes,not used mntil 1974 or later.)In some areas, data were only available from medical examiners,:often without code designations. In these cases accidentalnarcotics overdoses were selected wherever possible.
Death, rates were computed to the populatiqVaged-15739 in 1970:
2. Incidence of Serum Hepatitis (Hepatitis B):
At least some proportion of serum hepatitis 'cases isspread through the use of contaminated needles, and when it is,the disease is usually contracted within the first year or twoof regular intravenous use.' Heroin is.the drug most commonlyinjected by addicts. There are many prcblems with hepati:tis B as an indicator of heroin use, however, and in anattempt to gather professional opinion on the question,we sent a memorandum, to eight'researchers with experiencein the area soliciting their, comments. In every case,their response indicated caution in relying on serumhepatitis as an indicator of pirenteral drug use,although some felt that it can be used if analysis isrestricted to incidence among 15-39 year olds.* Otherdoctors felt that' incidence of serum hepatitis does notprovide an accurate reflection of incidence of parecteraldrug use.
Nevertheless, it appears that the number of new cases ofhepatitis B in New York State and-comparison areas bearswatching in conjuction with other incidence indicatorsof narcotics use. The New.York City figures in particu-lar present a special problem because they have been atwhat appears to be an artificially'low level sincethe fourth quarter of 1973. The New York City Departmentof Health could not explain the reasons for the lowreported rate, although several explanations are possible,most having to do with irregular reporting practices onthe part of hospitals and private practitioners.. However,since the numbers reported from areas, of the State outsidethe City also declined during the period, it is reasonableto conclude that the decline is probably real.
The age-specific analysis developed at the Instituteof Defense Analyses and slightly,modified for our analysisis described below. This method could only he utilizedfor the states, for New York City, Washington, D.C., andthe United States as a whole, because age-specific dataare not available for cities. Serum hepatitis rates for
. the states were based on the population aged 18-44 becausethe 15-39 grouping was not available. For the cities weused the total serum hepatitis cases as a rate based onthe 1970 city populations..aged 15-39.-
*Minichiello, Lee P. Indicators of. Intravenous DrugUse in the United States 1966-1973:, An Examination ofTrends in Intravenous Drug Use Reflected by Hepatitisand DAWN Reporting. Systems, Washington, D.C.: Institutefor Defense Analypes, March 1975.
1

Computing Drug-Related Cases of Hepatitis
"This method Is an attempt to decompose infectiousand unspecified types of hepatitire:. intO drug and non-drug-related categories.' The, age distributia ofcases for a given year are examined and the'number of ,
. cases WhichcAre in excess of the,"historical;y" expectednumber are .deemed drug-related. Thie,nuMber of drug7related cases is added to the humber of seruM.hepatitiscases, fOr all ages, to get an estimate for the totalnumber of drug related cases.
The "historical" age-;distribution was calcUlated bylooking at the cases in states covered in this report forthe. years 1958, 1960, 1962, 1965:' This period wasbefore the_so-oalled-"heroin epidemic",, and'hence thesecases reported will be assumed to be alm t entirely hon.drug'-related. The distributions for all he years andall, localities are very similar. The nu er of-Casespeaks in the 10-14 age bracket and then creases. somewhat linearly with increasing age. From 1966 to the present,however, many more cases than would be expected fromprevious years' occur in the 15-39 years'llge group. Areport cited by_Minichiello* shows that the age-at-first-use of heroin is Nalmost entirely within tne
:15.-39 group. As hepatitis is typicallycontracted with-in the first year pr two of 'intravenous use of drugs, thesudden rise in number of cases in this age group isthought to be related to a rise in drug use.
The method proceeds by approximating the number of:non-drug cases in the 15-39 age group by a straight linb.Its slope is determined by the numbers in the 10-14 and40-49 age groups. The actual number of cases which is inexcess of this line are called drug-related. All casesoutside,the 15-39 group are Also regarded as non-drug-related-cases. Since the linear-approximation,gives anoverstatement of the. "historical" numbers, the estimatesfor the drug-related category are probably conservative.To decompose the cases into.the two categories, the fol-loWing formula is used.:
(b-a)nk= a +- )(' 737
where nk expected number of non-drug related cases
' in the kla age group among (15-19),.
(20-24),. (25 -29) , and (30 -39)a = observed number in the (10714)' groupb one-half of observed number in-the (40-49) group
For this report, this method was modified by. weighting thefour intervals proportionately to their, sin/ in years.,The formula then becomes .
k(b-a).
for k=1,2,3
e) and nk = 2 (a + 'k.61)-a) ), for k=4
*Ibid.
6

Isince the fourth group, (30-39), includestwice as many years as the others.
.
-.This modification provides, a still more ponservatiyeestimate of drugrelated cases..
`.DAWN Narcotics Mentions in. iospital Emergency Rooms:
Projet DAWN is a'jlationwide data system jointly'funded by the Drug.Enforqement Administration anti theNational Instiute On DrugAbuSe. Reports are collectedfrom several Opes of institutions which encounter drugusers in 29 StandardMetroPolitan Statistical Areas.The system as h.whole is not a random sample of theentire-U.S., but it doed-includea significant portionof, the areas in the country which'hsve serious drug useproblem:4, and the system as a whole is representative ofthe country.
. The following SMSAs in the system contain cities studied.in this report: Bbston, Buffalo, Chicago, New YorkCity, Philadelphia and Washington, D.C. Per this groupand fOr the system as a whole, data were Obtainedfor total drug'episodes- and drug mentions*.by selected drugs, for.'contfnuousll.reporting facilities from the third quarterof 1973 through' the:first quarter of 1976, the only'period for which data ':ere available.
We focussed on narcotic drug mentions from emergencyrooms-an our analysis, and regard these as bne rough'gauge:of the relative'availability of.illegal,narcotics.'Narcotic drugs include heroin, Methadone,'and other drugs .
in the therapeutic class 40 (TC 40). It should be noted-that our reports area sub-group'of,total DAWN reports'_from a given SMSA because we eocluded facilities whichdid not repoit continuously. Nevertheless, we havelabout'7584of the total drug mentions in the system.
Our data were obtained through the Drug Enforcement '
Administration from:the IMS which operates the databank.4
Treatment Admissions:
Sudpessul implementation of the drug laws should'have exerted sufficient pressure on drug users to relinguish or diminish their habits to' increase the num-bers of users entering treatment in the short run.. Thisshould have been especially evident in those programsdealing with herdin addicts, namely methadone maintenanceand detoxification programs- Hd4ever, this increase intreatment enrollments would be of relatively shortduration,. because the pool of existing addictsentering treatment under pressure should' eventually Lcdepletnd, resulting -in a decline in treatment enrollments.
1,1
41* Drug episodeslare visits-to a DAWN center. Drumentions consist of the sum of all substances, in theaggregate, whiqh payed a partin causing an abuser toseek treatment or other help"- (I.M.S. America, Ltd.Drug Abuse Warning Network, Phase III Report, April 19747.:Apr 1'1975. Ambler4.Pa.: I.M.S. America. for Drug Enforce-ment Administration and National Institutescmliiimgp: B-2.)
. ,
259-297 0 -78 - 5

-60-: ,
Furthermore, the average age'of treatment admissionsshould increase in New York State relative to other ,
states:, if the:ldws successfully deterred.,youngTeoplefrom regular drug use. Likewise, the propbrtion.pf read-lmissions to programs should-increase in. New York Statecompared to elsewhere', also because new users are expectedito haves been.deterred.' J
. ,
The age structure of admissions and the proportioncif readmissions are available only for some programs inNew York City. Even total admissions are often una..-ail-able, and.indeed are the weakest indicator employedinthis study. ?any systems, including tae Pederal.CODAP re-'porting System, underwent extensive revision during the'period studied. and therefore do not yield reliable timeseries. 411 available data were nonetheless examLned, andsome useZ01 il,formationwao extracted.
Property Crime Complaint Rates:
2'Property crime complaints reflect the volume of
prOpbrty crimes committed each year,'although they are'distorted by the fact that citizens fail to report manycrimes to the'police.' We computed property crime complaintrates to the total estimated population base for eachyear, and included the follOwing'crimes: robbery, burglary,larceny-theft, and motoi Vehicle theft.
Choosing Cogiarison Areas
Changes in 'the available indicators for areaswithin, New -York State have been compared to changesin indicators for areas outside the State which are not
n.,subject to the same drug laws but which are demographicallysimilar to the in-State areas- Thus, out -of- state com-parison areas serve as quasi-controls for the New .YorkState areas, allowing Us to isolate, as far as possible;the effects of the' rug laws from those of other variablesaffecting drug and crime patterns.
In selecting upstate areas for study, the strategy'was to choose a variety of locales, including the State'sthree largest cities, New York, Buffalo (and Erie County).,and'Rochester (andMonroe County).; one densely populatedsuburb, Nassau County; Sand two smaller landlocked citieswith their counties; Albany and'Binghamton (in Albany-and Broome counties),* This group of areas adequatelyrepresents the major population centers in the State.
*Limited data availability has`precluded specific dis-cussions of many of the areas outside New York City.For narcotics deaths and serum hepatitis, the regionoutside New York City Can best be analyzed as, a whole,because the smaller numbers for individual smallercities fluctuate widely. Both types of analysis hpvebeen performed.
63

-61-
New York State target areas were matched with demo-graphically similar out-of-state areas in which it wasreasonable to expect drug and crime patterns t6 be influ-enced by the same factors. Eastern corridor areas werechosen because the drug distribuEion patterns in. otherparts of the country are thought to differ markedly fromthose in eastern cities, and because we expected thatregional similarities for cities of a particular size arequite strong.* The following demographic variables wereused to match the New York StatexcitieS to out-of-statecities: total population, population density, percent blackpopulation, percent of families below the national low in-come level, serious crimes per 1,000 population, and medianincome. In matching counties, percent change in total,population and in black population froM 1960 to 1970, toindicate relative stability of the area, were included.**The out-of-state areas were ranked by the degree of similar-ity to the comparable New York State area for each variable.
As a result of composite rankings based on thesevariables, we selected at least two out-of-state areas ascomparisons for each New York State target city or county.They are as follows:
New York City f Baltimore, Md.Boston, Mass.Chicago, Ill.Newark, N.J.Philadelphia, Pa.Washington, D.C.
Buffalo Boston, Mass.sPittsburgh, Pa.
Rochester Erie, Pa.Springfield, Mass.
Albany
Binghamton Allentown, Pa.Altoona, Pa.Pittsfield, Mass.
Allentown, Pa.Springfield, Mass.
NasSau County Delaware County, Pa.Fairfield County, Conn.Middlesex County, Mass.
*Pidot, George B., Jr. and Sommer, Jown W. Modal Cities.Washington, D.C.: U.S. Environmental Protection Agency,October 1974. This study grouped 224 U.S. cities on thebasis of Socio-economic similarities and found that theregional character of the groupings was markee.
**Data were obtained from the Social and Economic Administrationof the Bureau of the Census County and City Data Book, 1972:
"A Sta)tistical Abstract Supplement, Washington, D.C.: U.S.Department of Commerce, 1973 .
69
-62-
None of.these matches is ideal', especially. for New York City,which is a unique center of drug use activity and much more denselypopulated than most urban areas. Data for each indicator of drugusewere not available for each of the comparison cities and counties,but several indicators of. prevalence,and'incidence were analyzed todetermine if changes in the type or level of drug use in New YorkState were associated with the introduction of the 1973 drug law.
Appendix B
The following Tables summarize the availability and sourcesfor all data collected and analyzed as part of this study.
Tables 1) New York State and its Comparison States
2) New York City and its Comparison Cities\
3). Buffalo and its Comparison Cities
4) Rochester and its Comparison Cities
5) Albany and _its Comparison Cities
6) Binghamton and its Comparison Cities'
7) Nassau County'and its Comparison Counties

4.
TABLE 1
NEW YORK STATE AND ITS COMPARISON STATES
Number of Treatment
Property .Admissions Public
Narcotics Serum Treatment Narcotics Offenses Known S M S A Research
State Deaths Hepatitis Admissions Arrests To Police DAWN CODAP DEA Institute
HEROIN PRICE
AND PURITY
New York Monthly
1/70-6/76
Monthly
1/70-6/76
Yearly
Minichiello
1966-1975
1)Monthly
1/71.12/75
All modalities
ODAS operated,
2)Monthly
1/71.12/75
All modalities
ODAS funded
Yearly Yearly
1970-1973 1960-1975
New Drug Deaths Monthly Yearly Yearly
Jersey Yearly 1970 1/70-12/75 1970-1973 .1960-1975
. 1975 yearly
Minichiello
1966-1975,
Connec- Yearly Monthly
ticut 1970 -1975 ' 1/70-12/75
Yearly
Minichiello
1966-1975
Massa- Monthly Monthly
chusetts 1/70-12/71 1/70-12/75
Yearly
Minichiello
1966-1975
Yearly Yearly
1970-1973 1960-1975
Yearly Yearly
1970-1973 1960-1975
71
IPMMoi mom..
From. ow..
esnm M.O.= Wow,
(continued)

Narcotics
State Deaths
Permsyl- Yearly
vaRia 1970 -1975
Mary- 1) Monthly
land1/71-12/75
2) Yearly
1970-1975
Illinoit Yearly
1970 -1975
Ohio
United' Yearly
States 1970 -1975
Serum
Aepatitis
NEW YORK STATE AND ITS COMPARISON STATES
Treatment
Admissions
Monthly
1/70 -12/75
Yearly
Minichiello
1966-1975
Monthly1)Methadone
1/70-12/75
Yearly
Minichiello
1966-1975
.Monthly
1/70-12/75
Yearly
Minichiello
1966 -1975
Yearly
Minichiello,
1966.1975
Monthly
1/10-12/75
Narcbtics
Arrests
Maintenance
plus Detox-
ification
Monthly.1/72-
12/75,
2)Drug-free
Monthly
1/72-12/75
Yearly
Minichiello
1966 -1975
Number of
Property
Offenses Known
To Police
Yearly Yearly
1970-1973 1960-1975
Yearly
1970-1973
Yearly
1960-1975
Yearly Yearly
1970-1973 1960-1975
Yearly
1900-1975
Yearly
1960-1975
Treatment
Admissions
SMSADAWN CO6AP
San
as
N,Y,C.
HEROIN PRICE
AND PURITY
Public
Research
DEA Institute
1.4

-65-
Sources
New York State
Narcotics Deaths - New York State Department of Health,Office of Biostatistics; New York City Department ofHealth
Serum Hepatitis - Center for Disease Control, UnitedStates Department of. Health, Education and Welfare
Treatment Admissions -(ALL)- State of New York Officeof Drug Abuse Services
Narcotics Arrests - Federal Bureau of Investigation(Special Request)
Property Crime Complaints - Federal. Bureau of Investigation(Uniform Crime Reports)
New Jersey
Drug Deaths - New Jersey State Department of HealthSerum Hepatitis - Center for Disease Control, United
States Department of Health, Education and WelfareNarcotics Arrests - Federal Bureau of Investigation
(Special Request)Property Crime Complaints - Federal Bureau of Investigation
(Uniform Crime Reports)
Connecticut,
Narcotics !deaths - Connecticut Department of HealthSerum Hepatitis - Center for Disease Control, UnitedStates Department of Health, Education and Welfare
Narcotics Arrests - Federal Bureau of Investigation(Special Request)
Property Crime Complaints - Federal Bureau of Investigation(Uniform Crime Reports)
Massachusetts
Narcotics Deaths - Department of Public Health, TheCommonwealth of Massachusetts
Serum Hepatitis - Center for Disease Control, UnitedStates Department of Heald, Education and Welfare
Narcotics Arrests - Federal Bureau of Investigation(Special Request)
Property Crime Complaints - Federal Bureau of Investigation(Uniform Crime Reports)

-66-
Pennsylvania
Narcotics Deaths - Pennsylvania Department of HealthSerum Hepatitis - Center for Disease Control, UnitedStates Department of Health, Educiltion and Welfare
Narcotics Arrests - Federal Bureau of Investigation(Spdciai Request)
Property Crime Complaints - Federal Bureau of Investigation(Uniform Crime Reports)
Maryland
Narcotics Deaths - #1. Baltimore Medical Examiner's Office12: Marylarid Department of Health Statistics
Serum Hepatitis - Center for Disease Control, UnitedStates Department of Health, Education and Welfare
Treatment Admissions -(ALL)- State'of MaryldDepartment of Health and Mental Hygiene, rug AbuseAdministration
Narcotics Arrests - Federal Bureau of Investigation(Special Request)
Property Crime Complaints - Federal. Bureau of Investigation(Uniform Crime Reports)
Illinois
Narcotics Deaths - Illinois Department of Public HealthSerum Hepatitis - Center for Disease Control, UnitedStates Department of Health, Education and Welfare
Narcotics Arrests - Federal Bureau of, Investigation(Special Request)
Property Crime Complaints - Federal Bureau of Investigation(Uniform Crime Reports)
Ohio
Serum Hepatitis - Center for Disease Control, UnitedStates Department of Health, Education and WelfareProperty Crime Complaints - Federal Bureau of Investigation(Uniform Crime Reports)
U.S.A.
Narcotics Deaths - United States Department of Health,Education and Welfare, National Center for HealthStatistics
Serum Hepatitis - Center for Disease Control, UnitedStates Department of Health, Education and Welfare
Property Crime Complaints - Federal bureau of Investigation(Uniform Crime Reports)
D.A.,W.N.*- Drug Abuse Warning Network, established byThe Drug EnforCement Administration and The NationalInstitute on Drug Abuse
74

TABLE 2
NEW YORK CITY AND ITS COMPARISON CITIES
Number of
Property
Offenses
Narcotics Serum Treatment Narcotics. Known to
City , Deaths Huatilis Admissions Arrests Police
New York, Monthly Monthly 1) Methadone Yearly
New York 1/70- 1/70-, Maintenance, 1970-
6/16 6/76 monthly 1975
1/70.9/76
2)Ambulatory
Detoxifica-
tionimonthly
8/71-12/75
3) Drug-free
monthly
4/73-12/75
HEROIN PRICE
AND PURITY
Treatment
Admissions public
S M S A Research
DAWN =AP DEA Institute
Yearly 1)EMergency Admis- Quarter- Quarterly
1960- Rooms, sions, ly 111070-
1975 monthly monthly,III073- IIQ71'
7/73.5/76 '1/73- 1076
6/76
2) Drug deaths,
monthly
7/73-5/76
'Chicago, Yearly' Monthly 1)Methadone Yearly Yearly
Illinois 1910 -1975 1/70- Maintenance, 1970- 1960*
(Cook Co.) 12/75 quarterly 1975 1975
(Cook 1070-11076
Co.)
2)Drug free,
quarterly
1070.11076
3)Ambulatory
Detoxification,
quarterly
101-11076
3) Inpatient
centers,
monthly
7/73-1/75
4)Crisis
centers,
monthly
7/73-5/76
Same as
N.Y.C.
Same as Quarterly Same as
N.Y.C. 111073- N.Y.C.
1Q76
,/ incom-
plete
(Pmntinv,!(1)

NEW YORK CITY AND ITS COMPARISON CITIES
HEROIN PRICE
Number of AND PURMY
Property, Treatment
Offenses=" 'AdmissionsPublic
NarcotiCs Serum Treatment Narcotics Known to' S M S A, Research
City Deaths Hepatitis Admissions Arrests Police DAWN-----CODAP DEA Institute
Baltimmr, Monthly Yearly
Maryland 1/71.1970 -
12/75: 1975
Yearly Yearly
1970- 1960-
1973 1975
Same as
N,Y.C.
'Philadel- Drug Monthly Yearly Yearly Same as Same as Same as Same as
phia, Penn- deaths, 1/71'-1'2/75 1970- 1960- N,Y.C. N.Y.C. N.Y.C, N.Y.C.
sylvan,ia quarterly 1973 1975
. 100-11075
o
,1
,iWashington, Monthly Monthly All modal- Yearly Yearly Same as She as Same as Same as
D.C. 1/70- 1/70- ities com- 1970- 1960- N,Y.C, N.Y.C. N.Y.C. N,Y,C,
12/75 12/75 bined, month- 1975 1975
ly 10/71 -
12/75
'Newark, Drug Yearly 1)Methadone Yearly Yearly
New Jersey deaths, 1970- maintenance,. 1970- 1960,
yearly 1975 monthly 1973 1975
1970-1975 2/71-12/75
2)Ambulatory
Detoxification,'
monthly
1/70.12/75
3)Drug-free,
monthly
2/71-12/75

-69-
Sources
New York City, New York
Narcotics Deaths - New'York City Department of HealthSerum Hepatitis - Center for Disease Control, United
States Department of Health, Education and WelfareTreatment. Admissions - #1. Methadone Maintenance Treatment:Methadone Information Center, Community Treatment Foundation,Inc. and New York City Department of Health, MethadoneMaintenance Treatment Program.
#2. Ambulatory DetoxificationProgram: New York City Department of Health.
#3. Drug-Free Treatment. New YorkCity Addiction Services Agency.
Narcotics Arrests Federal Bureau of Investigation(Special Request)
Property Crime Complaints - Federal Bureau of Investigation(Uniform Crime Reports)
D.A.W.N. - Drug Abuse Warning Network, established byThe Drug Enforcement Administration and The NationalInstitute on Drug Abuse
- Client Oriented Data Acquisition Process,National. Institute on Drug Abuse
D.E.A. -'Drug Enforcement Administration, United StatesDepartment of Justice
Public Research Institute of the Center for Naval Analyses,Arlington, Virginia (Special Request)
Chicago, Illinois
Narcotics Deaths'-Illinois Department of Public Health
Serum Hepatitis - Illinois Department of Public HealthTreatment Admissions -(A1,14'- State of Illinois
Dangerous Drugs CommissionNarcotics Arrests - Federal Bureau of Investigation
(Special Request)Property Crime Complaints - Federal Bureau of Investigation
(Uniform Crime Reports)D.A.W.N. - Drug Abuse Warning Network, established byThe Drug. Enforcement Administration and The NationalInstitute on Drug Abuse
C.D.D.A.P. - Client Oriented Data Acquisition Process,National Institute on Drug Abuse
D.E.A. - Drug Enforcement Administration, United StatesDepAtment of Justice
Public Research Institute of the Center for Naval Analyses,Arlington, Virginia (Special Request)

-70-
Baltimore, Maryland
Nard6tics Deaths - Baltimore Medical Examiner's OfficeSerum Hepatitis - Baltimore Health DepartmentNarcotics Arrests - Federal Bureau of Investigation
(Special Request)Property Crime Complaints - Federal Bureau of Investigation
(Uniform Crime Reports)C.O.D.A.P. - Client Oriented Data Acquisition Process,National Institute on Drug Abuse
Philadelphia, Pennsylvania
Drug Deaths - Philadelphia Medical EXaminer's OfficeSerum Hepatitis - Pennsylvania Department of HealthNarcotics Arrests - Federal Bureau of Investigation
(Special Request)Property Crime Complaints - Federal Bureau of Investigation
(Uniform Crime Reports)D.A.W.N. - Drug Abuse Warning Network, established by
The Drug Enforcement Administration and The NationalInstitute on Drug Abuse
C.O.D.A.P. - Client Oriented Data Acquisition Process,National Institute on Drug Abuse
D.E.A. - Drug Enforcement Administration, United StatesSepartmentof Justice
Public Research Institute of the Center for Naval Analyses,Arlington, Virginia (Special Request)
Washington, 'D.C.
Narcotics. Deaths - Washington Medical Examiner's OfficeSerum Hepatitis - Center for Disease Control, United
States Department of Health, Education and WelfareTreatment Admissions - Narcotics Treatment AdministrationNarcotics Arrests - Federal Bureau of Investigation
(Special Request)Property Crime Compliiiits - Federal Bureau of Investigation
(Uniform Crime Reports)D.A.W.N..- Drug Abuse Warning Network, established by
The Drug Enforcement Administration and The NationalInstitute on Drug Abuse
C.O.D.A.P. - Client Oriented Data Acquisition Process,National Institute on Drug Abuse
D.E.A. - Drug Enforcement Administration, United StatesDepartment of Justice
Public Research Institute of the Center for Naval Analyses,Arlington, Virginia (Special Request)
78

-71-
Newark, New Jersey
Drug Deaths - New Jersey State Department of HealthSerum Hepatitis - Newark Department of HealthTreatment Admissions -(ALL)- New Jersey Medical College,-Department of Preventive Medicine and Community Health
Narcotics Arrests - Federal Bureau of Investigation'.(Special Request)
Preperty Crime Complaints - Federal Bureau of Investigation- (Uniform Crime Reports)
g.
79

Narcotics
cily_ Deaths
Buffalo, Monthly
I:0d York 1/70-
12/75
,(Erie Co.)
Pitts- Yearly
burgh,, 1970-
PennsYla 1975
O#ia
Boston, Monthly
Massa-1/70"
chusetts 12/75
c,
Serum
He atitis
Monthly
1/71.12/75
Monthly
1/71-12/75
Monthly
1/70-12/75
TABLE 3
BUPFALD AND ITS COMPARISON CITIES'
Treatment
Admissions
1) Methadone
Maintenance,
monthly
.9/70-12/75
Number of
Property
Narcotics. Offenses Known
Arrests To Police
HEROIN PRICE.
AND
Treatment
Admissions Public
SMSA Research.
DAWN-7MAF DEA Institute
Yearly_ __Yearly Same Same Quarter- Same as
1970-1975 1960-1975 as as ly 1110173-N.Y.C.
N.Y.C. N.Y.C. 1Q76 in-
1 complete
Yearly Yearly ° Same
1970-1973 1960-1975 as
N.Y.C.
2)mbulatory
Detoxification,
(new and total,
admissions)
7/70-12/75
Yearly Yearly 'same
1970.105 1960-1975 as as ly' as
N.Y.C. N.Y.C. 111073- N.Y.C.
1Q76
incomplete
Same Qu'arter- Same
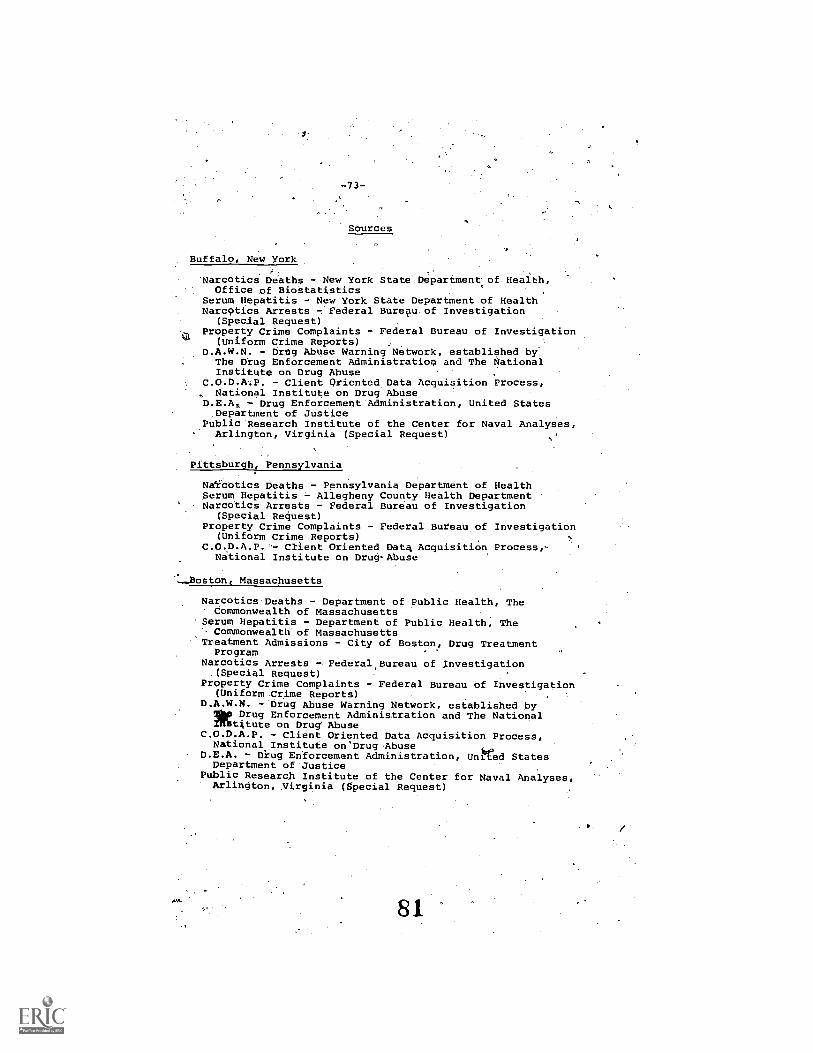
-73-
Sources
Buffalo,' New York
'Narcotics Deaths - New York State Department of Health,Office of Biostatistics
Serum Hepatitis - New York State Department of HealthNarcptics Arrests Federal Bureau.of Investigation
(Special Request)Property Crime Complaints - Federal Bureau of Investigation
(Uniform Crime Reports)D.A.W.N. - Drug Abuse Warning Network, established by
The Drug Enforcement Administration and The NationalInstitute on Drug Abuse
- Client Oriented Data Acquisition Process,, National Institute on Drug Abuse.D.E.A& - Drug Enforcement Administration, United StatesDepartment of Justice
Public Research Institute of the Center for Naval Analyses,Arlington, Virginia (Special Request)
Pittsburgh, Pennsylvania
Naicotics Deaths - Penhsylvania Department of HealthSerum Hepatitis - Allegheny County Health Department
' Narcotics Arrests - Federal Bureau of Investigation(Special Request)
Property Crime Complaints - Federal Bureauof Investigation(Uniform Crime Reports)
Client Oriented Data Acquisition Process,National Institute on Drug-Abuse
---Boston, Massachusetts
Narcotics Deaths - Department of Public Health, TheCommonwealth of Massachusetts
Serum Hepatitis - Department of Public Health, TheCommonwealth' of Massachusetts
'Treatment Admissions - City of Boston, Drug TreatmentPrOgram
Narcotics Arrests - Federal Bureau of ,Investigation(Special Request)
Property Crime Complaints - Federal Bureau of Investigation(Uniform Crime Reports)
D.A.W.N. - Drug Abuse Warning Network, established bylie Drug Enforcement Administration and The NationalIffit4tute on Drug' Abuse
C.O.D,A.P. - Client Oriented Data Acquisition Process,National Institute onDrugAbuse
D.E.A. - Drug Enforcement Administration, United StatesDepartment of Justice
Public Research Institute of the Center for Naval Analyses,Arlington, Virginia (Special Request)
81

Narcotics
Lq, Deaths
4
Roches- Monthly
ter, New 1/70 -
York 12/75
(Monroe
-Co.)
Spring- Monthly
field, 1/70 -
Massa- 12/75
chusetts
Erie, Yearly
Pennsyl- 1970-
vania 1975
Serum
Hepatitis
IMonthly
1/11-12/15
Monthly
1/70-12/75
Monthly
1/71-12/75
(Erie Co.)
ROCHESTER AND ITS COMPARISON CITIES,
Treatment
Admissions
a
A
HEROIN PRICE'
AND PURITY
Number of TREATMENT
property ADMISSIONS Public .v
Narcotics, Offenses Known S M S A Research
Arrests To Police DAWN CODAP 'DEA fnotitute
Yearly Yearly
1971.1974 1960 -1975 N.Y.C. N.Y.C.
"Same as .- - -Same as
Yeirly
1960-1975
A
'YearlyYearly
1971 A;''' 1960 -1975
E2
j
z

.ARochester, hew tic
Sources
. Narcotics beaths - New,York State Department of Health,Office of Biostatistics
,
Serum Hepatitis -, New, York State Department of Health.Nardotics Arrests - Federal Bureau of Investigation
(Special Request)6 '""Property Crime Complaints, = Federal Bureau of Investigation'1 (Uniform Crime Reports) - ,
..C.O.D.A.P. 4Client Oriented Data AcauisitionErocess,
.National Institute on Drug,fAbusePublic Research Institute tIrthe Center'for'llaval Analyses,Arlington, Virginia.(Special Request . -..
,Springfield, Massachusetts. ,
\ilk Narbotids /604 - Department of public Eeal1400 TheComMonweaith of Massachusetts
.,SerUM Hepatitis - DqpartMent.pf Public Health, TheCommonwealth of Massachusetts '
,
Propprty,Crine Complaints - Federal. Bureau of InvestigatiOn.(Uniform Crime Reports)'
C.O.D.A.O. - Client, Oriented Data Acquisition. Process,.National- Institute on Drug Abuse
:,
--: -Erie, Pennsyivanial,.4
Narcotica Deaths.- Pennsylva is Department of.HhalthSernm Hepatitisf- #ennsylvan Department of Haalth
.'Narcotics Arresti - Federal B reau of Investigation.
. (speoial Request) ', t
'Pr eaopettY Crime Complaints - Fe ral Buru of /nyestigation(Unfform Crime Reports) & -
4
259-267 o - 78 - 6
,:
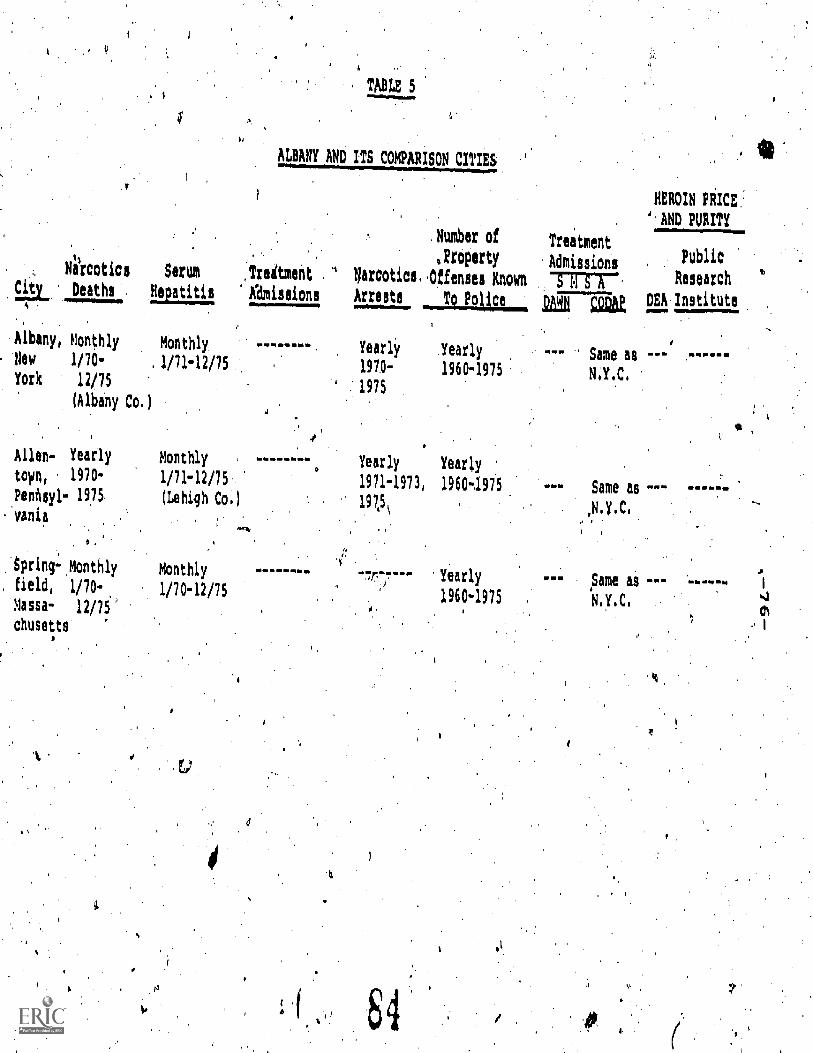
Narcotics Serum
Cites Deaths
Albany, monthly
New 1/70-
York 12/75
(Albany Co.
Allen- Yearly
town, 197 0-
Pennsyl- 1975
vania
Spring- Monthly
field, 1/70 -
Massa- 12/75'
Ch4SOttS
TABLE 5
ALBANY AND ITS COMPARISON CITIES
Treatment 4
Hepatitis Aamissions
Monthly
, 1/71-12/75
Monthly
1/71-12/75
(Lehigh Co.)
Monthly
1/70-12/75
Number of
Property
Narcotics.,offonsol Known
Arrests 19 Police
Yearly Yearly
197.0- 1960-1975
1975
Yearly Yearly
1911-19730 1960-.1975
1915\
Yearly
1960-1975
Treatment
Admissions
SMSAcaga
Same as
N.Y.C.
Same as
,N.Y.C.
I ,
Same as
Na.C.
HEROIN PRICE
' AND PURITY
Public
Research
DEA Institute
CA

t
-77-
Sources'
Albany, New York
Narcotic Deaths - New York State Department of Health,.Offic of Biostatistics
Serum H atitis - New York State Department of HealthNarcotic Arrests - Federal Bureau of. Investigation.(Specia Request)
Property Crime Complaints.- Federal Bureau.of Investigation(Uniform Crime Reports)
C.O.D.A.P. - Client Oriented Data Acquisition Process,National Institute on Drug. Abuse
Allentown, Pennsylvania
Narcotics Deaths - Pennsylvania Department of HealthSerum Hepatitid - Pennsylvania Department of-HealthNarcotics Arrests - Federal 'Bureau of Investigation
(Special Request)Property Crime.Complaints - Federal-Bureau of Investigation.(Uniform Crime Reports)I
C.O.D.A.P. 7 Client.Orien ed Data Acquisition Process,National Institute on. Drug Abuse'
Springfield, Maissachusetts,
Narootics Deaths - Department of Public Health, TheCOMmonwealth of Massachusetts .
Serum Hepatitis Department of Public Health, TheCommonwealth of Mas'eachusetts
Property Crime Complaints - Federal Bureau of Investigation(Uniform Crime Reports)
- Client Oriented Data,,Acquisition Process,ational Institute on Drug Abuse
85
'

Narcoticsall. Deaths
Bing- g Monthly .
Won, 1/70.New 12/75
York
Altoona, Year 1y
Pennsyl- 1970-
vania 1975
Allen- Yearly
town;, '1970-
.: Pennsyl- 1975
vania
$ABLE
BINGHAMTON AND ITS COMPARISON CITIES'
Serum
Hepatitis.
Monthly
1/71-
12/75
Monthly
1/71-
12/75 (Blair
Co.)
Monthly
1/71-1205
(Lehigh Co.)
Pitts- Monthly Monthlyfield, 1/70- .1/70 -12/75Massa- 12/75
chusetts
Number of
,2ropertyTreatment Narcotics Offenses KnownAdmilsloni Xrfelte
Yearly Yearly
1971 1960-1975,,
Treatment
Itdmissions
SMSAball--1100
HEROIN PRICE
AND PURITY
Public
Research
'0EA InitituteINWNmlndsle1..M/116 Immo= 1114
Yearly Y9rly.1971- 1960-19751972
Yearly Yearly
1971-1973, 1960.1975,
1975
Yearly
1960-1975
Same as
N.Y.C.

-79-
Sources
Binghamton, New York
. Narcotics Deaths - New York State Department of Health,Office-of Biostatistics
Serum Hepatitis - New York State Departmdnt of Health'Narcotics Arrests - Federal Bureau of Investigation
(Special RequeSt)Property'Crime Complaints - Federal Bureau of Investigation
(Uniform Crime Reports)
Altoona, Pennsylvania
NarcoticS Deaths - Pennsylvania.Department of HealthSerum Hepatitis - Pennsylvania Department of HealthNarcotics Arrests - Federal Bureau of Investigation
(Special Request).Property Crime Complaints - Federal Bureau of Investigation
(Uniform Crime Reports)
Allentown, Pennsylvania
Narcotics Deaths - Pennsylvania Department of HealthSerum Hepatitis - Pennsylvania Department of HealthNarcotics Arrests - Federal Bureau of Investigation
(Special Request)Property Crime Complaints - Federal Bureau of Investigation
(Uniform Crime Reports)C.O.D.A.P. - client Oriented Data Acquisition Pi'ocess,National Institute on Drug Abuse
Pittsfield, Massachusetts
Narcotics Deaths - Department of Public Health, The'.Commonwealth of Massachusetts
Serum Hepatitis.- Dpfartment of Public Health, TheCommonwealth of Massachusetts
Property Crime Complaints - Federal Bureau of Inveg.tigation(Uniform Crime Reports)
if

TABLE 7
'NASSAU COUN Y AND ITS COMPARISON ()UNTIES
Narcotic! Serum Treatment )arcotits Of
,Deaths , Admissions. Arrests
Nassau Monthly Monthly
County, 1/70- 1/71-12/75
New York 12/75'
Middle- Monthly Monthly
sex 1/70- 1/70-12/75
County, .12/75
Massa-
chusetts'chusetts
Dela- Yearly Monthly
are 1970- 1/71712/75
County, ,1975
Pennsyl-
vania
Fair-.
Field
Countyl
.Connec-
tint
Monthly
1/72 -12/75
er of Trea
erty Admi
es boo S M S
o Police DA
HEROIN PRICE
AND PURITY
ent
sions. Public
ResearCh
DAP DEA institute
it
Yr
'411
ai

-81 -.
Sources
Nassau County, New York
Narcotics Deaths - New York State department of Health,Office of Biostatistics
Serum Hepatitis - New York State. Department of Health
Middlesex County, Massachusetts .
Narcotics. Deaths Department of Public Health, TheCommonwealth of Massachusetts
Serum Hepatitis - Department of Public Health', ThgCommonwealth of MassachuSetts
0
Delaware County, Pennsylvania
Narcotics Deaths - Pennsylvania Department of HealthSerum Hepatitis - Pennsylvania Department of Health
-Fairfield County, Connecticut
Serum Hepatitis - Connecticut Department of Health
7

-B2-
Appendix C
Interrupted Time ,Series Analysis
Interrupted time series analysis (ITSA) is theprincipal,technique that was applied to data used inthis repop.t. The method involves examination of aset Of data that have been recorded at regular timeintervals called a time series, for any effects ofsome policy change. A mathematical model for thetime series is proposed to facilitate further analysis,and the adequacy of the model is checked as a final,step.
Mathematical methOds in'themselves will notInterpret data. That task is left tuthe investigator,who might use mathematical results in conjUnction withother findings to arrive at a conclusion. A mathe-Aaical technique used in this way may be evaluatedboth On its descriptive powef and on the applicabilityof its underlying assumptions: Both aspects of ITSAare.discussed.inthe description which follows.
AAime series model supposes that each observationis influenced to some degree by previounobservations,
. previous random perturbations in the system; and a newrandom perturbation: Thus, no observation i,"memory---less", or independent °rite past. For example, thenumber of hepatitis cases occurring in July may very
.well be dependent on the number of cases in June plusrandom new:July conditions: 'The magnitude of theseinfluences completely determines the mathematiCal modelto be used.
' An intervention effect in a time series that ITSAwill recognize is a deviation from the established trendwhose origin coincides with a chosen intervention date.If the policy of interest is not expected to have alasting effect, ITSA also'looks for the time series'eventual return to the pre-intervention ,trend. To mea7sure such an effect, one picks that leyel of the effectwhich will prOduce the best overall fit, between thehypOthesized model.and the observed data. Note that ifinitially the model is inadequate, then the best fit willbe chosen from a poor lot. More than-orie model mightseem,plausible. at:first, but most are subsequently rejected.in the final etageef the analysis, discussed later.For each model proposed-, the estimated intervention effectis now examined as though,itmere.a somewhat fuzzy, orrandom guantity. How much randomness one allows theestimate will reflectthe amount of confidence one hasin it. The questidn still arises whether or not the .
AU'

A83-
best estimate of an effect appears different from zeroeffect by the random chance inherent in,a114eal situations.The test used to answer this question ds-a conservativeone which-favors no intervention effect at all. For thetest to accept an effect as real, there must have beena marked and persistent change in the pattern of the timeseries after the intervention date, a suitable, criterionfor judging effects of a social policy change. .Short-term movements, while in themselves interesting, are 'considered by the test to be ephemeral and insignificantin the context of the entire time series.'
Deciding among several models is done by lookingat the quality of their is to the data. The lack offit or "residual" time ser es, formed by subtracting thepredicted from the ob rve ime series, is tested forits resemblance to "white n se". "White noise" is acompletely random time series that fluctpates about azero level with no diicernible pattern and with smallfluctuations more'frequent than large ones. If the .residuals series has a strong resemblance to white noise,then, the model is.deemed adequate. The statisticaltests used to help discriminate between good andbad fits are the chi-Square and the autocorrelationresults. The autocorrelations of residuals aremeasures of relatedness of one residual to another'.If they are not related, in other words independentof the time of their occurrence, then the first
.:
.criterion for. resemblande to white noise has beenmet. The c i-square test assumes an affirmative resultfrom the. ocorrelations. The.residuals.are arranged inascendin der of magnitude and their distributionexamined. If most are clustered about zero, and fewer andfeWei occur as one moves from zero in either direction,.,then the chi-square test will report similarity to whitenoise.
Data Specifications for ITSA
One must be judicious in application of ITSA totime series. A minimum of fifty observations, with theintervention date as close to the middle as possible,w are necessary to have a good chance of isolating an in-tervention effect. For this report, only, indicatorswhich were available on .a monthly basis for at least
'..11rfour years were used,For convenience,-however, onlyquarterly data are presented on the charts.
-°"-.411/P

-84-
Adjustments of Data
Some phenomona.are of a seasonal nature, making Itmore difficult to distingUish a policy effect from seasonalfluctuations. In 'this case the time series may be_ t4"deseasonalized" before further analysis is undertaken.A surprising finding is that very few series presented inthis report showed any seasonal nature at all.
Another set of phenomena to be dealt with are thesmall, short-term increases or decreases in the levelof a time series that contribute little' information aboutan intervention effect. One 'might choose to reduce therandom variability.by "smoothing" the data by assigningthe averages of every succession of three observationsto the middle time point of the three; July's datumwould be the average of the actual observations fromJune, July, and August. August's datum would be theaverage of July, August, and September actual observa-tions, and so on. Successive observations in the con-structed "three-point moving average" series will havemore correlation than they did in the raw data series,but Imall peaks and valleys' Of the raw series will havebeen clipped off and filled in to depict overall trendsmore-clearly.
Assignment of Intervention Dates
Another issue that must be decided is where to,assign the intervention date, as .the impact of a policyon a time series may very well not coincide,with the.enactment of the policy. For example, it has been pro-posed that, in, general, persons who contract serum hepa-titis as a result of intravenous drug use began theirhabit a year or two before contracting the disease. Thus,if serum hepatitis cases are used as an indicator ofincidence of prolonged heroin use, then the'number ofcases reported in September of 1973, say, will actuallyreflect the number of new heroin users in early 1972.Unfortunately, if a September,.1974, intervention date isused toltest the effects of the September, 1973, drug lawon new heroin users, then the small number'Of post-intervention observations may compromise any results. Onefactor acting in an investigator's favor, however, isthat an.impact.of the drug law on hepatitis case ratesin New York State is most likely to be gradual. In thisinstance ITSA results will.not be significantly altered,but their reliability increased, if a May or June, 1974,intervention date were to be pickecf..
92

The next problem is to decide upon before and agterperiods for time series that are related to. the seriesof interest but come from sources not'directly affectedby the intervention. .Specifically, for areas outsideNew York, it is -desired to assign an "intervention" dateso that effects.in these areas and effects in New York Amay be compar . With a measure of relatedness calledthe lagcorr 1 tion coefficient, one can determinethe time de between movements of a series in New YOrkand similar m vements of its.cOunterpart in agiven outside area. Th 'computed delay was then applied to theintervention da e in New York to get a comparable timein the given. outside locality. The intervention dateused for each indicator is presented in the tables ofresults on pages 91 and 92.
93

-86- '
Technical Description of Interrupted Time Series Analysis (ITSA).
The long time series data available on the drug useindicatora were subjected to a detailed time series analytio.The time series were examined to seeAf after an interve9-tion (the passage of thesdrug.laws, 1973), the processgenerating the time series was changed. The basiC premisewas that the law would alter the level. of the drug abuseindicator, which is used as.a proxy for the variable of interest,.namely level 0t drug uge. 1.
There are threrffteges to the analysis. At the firststage; a model is identified which describes the observedtime series. The models usedin this study belong to theclass of mixed autoregressi:*moVing: average models. Thesemodels embrace a wide claps, 7ated have been used most exten-sively in statistical time series analysis (see BOXand Jen-kins (1) for awide variety of applications).
The idea is to represent each value of the time seriesby a weighted sum of the previous p values of the series(the autoregressive Component),. plus a weighted aumof theprevious q randoM disturbances (the moving average component),Rlus a current disturbance.
In addition, before p and q'can be determined; the ob-served series must. be transformed p) a weakly stationary one,that is, one that has an expected value and variance that isconstant over time. This can be achieved by choosing anappropriate order of differencing, d. Let v be the differ7-ence operator, where 'Yt Yt -.
v2yt a p(pyt)
v "t Yt-1)
vizt -V Yt -1
Yt -2 Yt-1 - Yt-2
ddy
t = ( -1)k dlYt-k-K=0 KlAd-101.
.
94
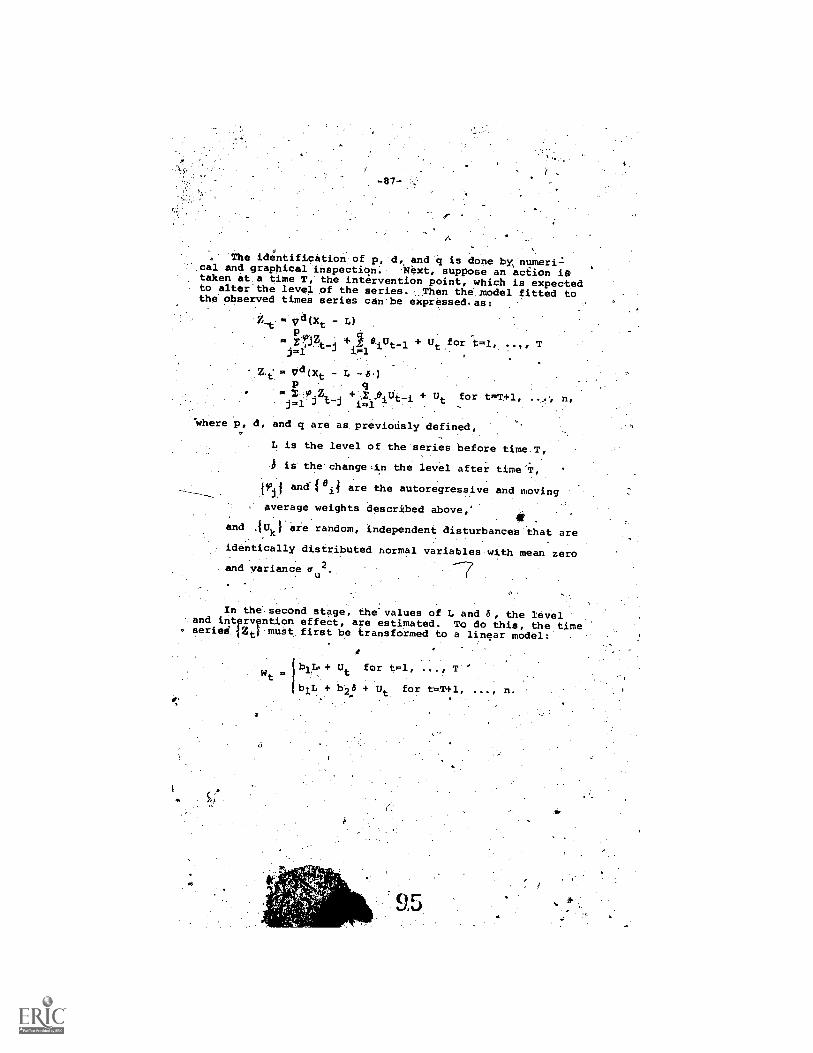
-87-
. The identificationof p, d, and q is done by,numeri-:cal and graphical inspection. Next, suppose an action ifetaken at.a time T,' the intervention point, which is expectedto alter"the level of the series. Then the xodel fitted tothe observed times series cAnbe expressecLas:
=vd(Xt - L)
P4PiZ+ 1-2 ut-1 U
t for t=1, .. Tj=1 i=1
z = Od (xt - L -a)P q
..j!!jZt_j + Ut for.t=T+1, n,
where p, d, and q are as, previously defined,
L is the level of the series before time. T,
4 is the-change,in the level after time -T,
tip f and'illif are the autoregressive and moving
Average weights described above,'
and AUk Fere random, independent disturbances that are
identically distributed normal variables with mean zero
and variance out. 2
In the. second stage, the-values of L and b, the leveland intervention effect, are estimated. To do this, the timeseried 1:41 must, first be transformed to a linear model:
A
1
bile+ Ut for t=1, ..., T
b.'', + b.2.5 + Ut for t=T+1, ..., n.4

41
AV The terms bLund b2 are constants determined by a"Particular Choice of values for (.91,...,"00,...,0,).-Theutandard lea* squares estimates of ITand'5can7nowbe obtained. The'criterion for the "best" choibe of(01,...,V ,,01,,,O,) is the one that minimizes the mean
;;square erfor of the'fitted linear model. Fortunately, the °--..
stationarity condition puts constraints on theik-setofadmissible values so that a'search for the "best" choice,while time consuming, does eventually terminate._
_..,
. ..
in the third and last stage of the. analysis, theadequacy of the model is checked. The distribution ofthe residuals NI are tested .for similarity. to the nor-mai distribution. If the model is adequate, then theresiduals should have no disdernible pattern of variation.'The, pre and post-intervention residuals should be checkedseparately. If rk is the kth lag autocorrelatiqn of the
' -- T/2'e residuals, then cr/2) z" ru' is diStributed approximately
k =l
45, chi-square with (T/2)-p-q:degree&pffreedom, and can beused as a test for the resemblance of the pre-intervention,residuals to white noise. The same computation method forthe post-interve tion r siduals.produces a chi=squarestatistic with (n-T)/2 -p-q degrees of freedom. For moredetails of all three st ges in the analysks, see references11),(2), qand (3).
.
The ITSA stages are summarized below: -
(i) Identify the model for a lipicator,,byIketermining(p,dig,).
(ii) Fit the model to-the data, by estimating theparameters which describe the process.
(iii) Check whether the fitted model is adequate, by,testing whether the residuals from.the fitted modelcan beregarded as "White noise", i.e. the residuals are distribu-..
ted normally.(iv) If the residuals cannot be regarded as "white
noise", there are"two possible causes. The model, may have,been incorrectly identifled,,in which case one should re-peat stepsAi)to (iii). On .the other hand,-it may.be that
" separate models for t<Ti and t>1). are required. This laseoccurs much less frequently than the first, and detectingan intervention effect is less rigorous.
:96

-89-
It 'should be noted here, that the intervention effectpostulated is a long term one,.a permanent shift in. thelevel of the process. The intervention effect can bemOdeled-in several ways (see (4); and (3} and particularly(4) for a very readable account of the methodology). Itis assumed that the intention of the legislature was to
. reduce the'level of drug use on a long term basis, and nota short term, one - period effect.
References
[1] Box., G.E.P. and Jenkins, G.M. Time Series Analysis,'Forecasting; and Control. San Francisco: Holden Day, 1970.
[2] Box, G.E.p.,and Tiao, Q.C. "Intervention Analysis-WithApplications :t0 EconoMic and Environmental ProbleMs
Journal of American Statistical Association, Vol. 70, No. 349,
March, 1'975, pp. 70 -79.
[3] Glass, G.V.,.Wilson, V.L, Cottman, J.M. Design and
Analysis of Time'Series Experiments. Boulder: ColoradoAssociated. University Press, Boulder, 1975.
[4] Cappbell.,.°D.T. "Measuring the Effects of Social Innova-
tions by Meansof Time Series." Statistics: A Guide to theUnknown. Tanur, J.M., et al, eds. Sap Francisco:Holden Day, 1972, pp. 120-129.6

. ,-90-
;The Poission P413ility Model-s..
... .
to fit a Poisson probibility distribution to the frel./mother method' used to detect /eve1 changes, is
gooney spectrum of the pre- and.,post-inteiVentiO4. data. 4 , -
Then .sevesal hypothesis tests for differenoe in the' twos...,Poisson parameters may be cOnducted , .. -.. - Specifically, let Xi. , ....mr And Ixri-1 : o.x, be .
itodependent observations ,,v ithlet Pii,P2,.PIKt-.. and P. p22,..P2K...':. be
teststheir Sample frequency aistributi8110 ilk`ere'performed on each to see if they fi a Ptientn xdistribution, ,i.e. that . k- ...?\i
._ .
.
Pik = prop. (ge%), A_.!'lIcr---
with% j...1.,2 and k-Q,,,i,2,...'and 14t4N ,
with Ai and X2 estimated by the two eaniPle,mertIT both, fits ate good, two tests 1st 1.1.',- tan be
7 performed. One involves a Chir-square teat for fit of thefrequandy spectrum for the post-rote rveniOn gart4 ' X/41: , . s ocsto 'a Poisson distribution with, parameter Aq...., A Second
'is to test the probability of obsez'vind ,x,P+l' xNgiven that Al is, the true parameter toe the Process.
J. -
Explanation of Tables. . 7'Tables I and
..Ipresent the results Of the tests
pe'iformed on all indicators amenable to statieticalanalysis.:-.The date abqve each result is Y.,be one at .which one might expect to see th'e fiist obsergable
,.effects of .the,law. Since a real effect in more likely'to be gradual than dramatic, the reaul,te quoted in the.table .will still hold it. the dates are thanqed by two orthree .months: If two datea0are mentioned, the, firstaxises-from the.prerliglethat.,,there was -A ealkI,Y inniediate .
effect of the law, and the second suppeseSi delayed effect.., Dates used for out-of-state areas were derived, from i
analysis 'of their pre-intertention tile ehift with NewYork. this was done by first choosing - several Inter--vention de/gels, in increments of three menthe, for a New
, Yxpfk..indiZator series...For each date, th6 laltor-elation' coefficient for New York end eetoll Of its
comparison areas was computed for the Pteviuter...vention dati.. The lag which produced the .
highest coefficient wasdeemed the beet time. Shift., Thek different choices of dates did not affect the choice\
of tag, but the intervention. date Which elhOw%1: the cleatestresuite. wasp then chosen for use in the "Isle sleatsiatin
salyses.i,Vor-axahple 'before september 1973 mornenct pe
data was fdund to lag behind New Yotic'e.131 fool; months.If a Septembef 1973 impact date ie chosen fer New Yorkhepatitis ,,oasas, then, a January 19)4 adte vaill be chosen.for Maryland hepatitis.
Y4.1
, .

A.: . Thereaulthelow include the- chosen ,interyentien date,f4the,-. el usedi''t,he/estiMated. ParaMeter valtes, and,sighiW'
.7-7aaric .igatistidsc./-The:Mode%Will be specified in the-fore! .
:../(,'.(ip, q.Y.:4011010e4.bY-'thg.value of V' or 0,O0r wh,W1 the square:erY'r is'aiinimized:- ?,
i
!::- The,t-statistics for estimates the4evel of the/, Series, ,.
d change in level 'following intervention', 4 , are gkveh,re'the chi,square statistics of the:fit:of,he pre-. and,7ihtervantion residuals t6 white noise.' The degreek.efon for the chi7sciare statistics are given, and fOr -the'
tatistici the degreeivof freedem,are theinumber of Obierva-ns,,Minus the-number.of parameters estimated:
- In several cadei, to imPrOVe the adequacy'ofi.theypodel,parameters were included in iddition'tolL: and,! They arethe "deterministic drift' pf.::the series,jmnd.li.:the 'changethe Aeterministic drift follow ng -knterVehtion. tThey.vrerebecatnA0 the diSturbancaelU; hadik'noh-zero meats 14, ., .
sing the series'tO'drift0 if per unitiot time: The modelti gvitproved if i:trarceform9d:set Of disturbances4i,1,0as used,.;.
th at..Ut- i4' before intervention and ai=bt!.A-- A' after4interven-.t on Now tail satisfy thiaiecMptiohs made aboutithe'disturbanceed scribed' in e,Orevious pagei.H, ' ' '
259 -297.0 - 78 -.7

,4.1
RESULTS' OF STATISTICAL, TESTSINDICATON FOR NN YORK , STATE
MD COMPA:RISO.N. STATES,.
!r ircotics.:deattis
Tieatlie?nt ROILS.
findid:p;ogroul
*tie:tient
lions 9/73'.,
Oititcoierated prO4r4ms)pl
L.;;.
tAl
1/73 (1,0,0)44.49.
9/73
fla .141
60 6;64
La,
4* 1.79
r6;77 9,16 A. 17'
11.319' ,18.18 '23
6017. 16.36 22
0.0858 18.75 19
La 59,6 2.47 15.58
dr 8,,82 3.37 10.66
C5135,,,\ 0.420
41, -1.18
%La .61.4 14.3 13.030
Om -5,72 -1,09.17.96
Serum' hepatitis
e
(11110,40020' La2500 5,40
3 231 0,490
0 0,056,82 la 2816a 5,00
1/73
9/73.,
1./730
9173
(0,1/1)6310#65 L° 21,6
4! '1-1.57
(0 41404 66 1181 '21.6
1, 2.69
(1,0,0)c0,25 1,11 3.07
is 0,779
(100,0),a0025 3,07
0 0,749
14.95
'2,94
7,28 5,31
2.83,
2;41 8.49
-.176, 16.45 2;
42.47 9;04 11
IL 310 L15 12
5 97 , 22(
1.16 10,88' 19'
5.89 .9.38 18
,1.09 13,E
18
24
22
4
0, C

.
...1271to 'Int. date MOM
A.
Ma land
lilrooties deaths 11/73
Jinn hiPatitis
(0,41)04-
Vases T X2, d.f.4 %
0 Li 4.'90 10.1 I' ;6.11 16
61 -1.01 -1.44 1,81 11
.1.69 4.43 '1,3
5u 0'.440 *0.060. 2,98 :12-1/74 (0,191)(140,70 La 12.1
PAmiasions to detox,
and math, maint. 12/73
Admissions to drug-free. programs 12/73
du -LBO-.
0
(111)11v4,20 L1142 6.017
11.93 10
0$0.60 5 -6.99 -.170 1.87 11
(10010)P4.68 Lx446
I
101
4
V
o
9.69 1.55 10
-.640 3,84 11
40
I I

.1"
RESULTS Of STATISTICJWTEST ON INDICATOWOR.NEW YORK CITY
AND CONPARISON,C,IfIES
.
IndioatOr.
NeWor I Cit
Int. date Model Values \ T-statt. X2' d.f.
'Serum hepatitis
r.. ,
4,1/73 (1i1:0)0:-,51 I?: 126IN. 0.109
9/73 (1,110)01-,50 LI 121.2
Om -9.00
8/74 (111,0) LI 121.
Om. 4,00
Narcotics deaths 1/73
Admissions tometh. maint. 9/73 (1,i110) ;o:0,08 160.3
34,7
(1,0,0)410110,51 La 59.1
6: 6.04
04 3.91
An -13.5
9/73 (1,0,0)1D: :62 L: 63.919.5
-.916
Admissions .to ad.*,
datox,'.krog.
Baltimore
9/73 (0,1,1)1m7.12 t= 90.04: -7.50
9/73 /(010 1)0:-,52 L=1340
"Narcotics deaths 11/73 (010,1)0:-,22
2/74 (010,1)10*-.18 L:
102
in 353
3,75-1.00
3,82
-1,00
7.02 8.11 13
"0,174 7,42 13 9,
6.63 7,73
-.490 13.38 12
6.62
0,220
2:63
0.49
10.30 27
5,99 7
14,31 18
10.46 . 24 . I
-1.16
3.39 35 22
1,03 10 19tO
-,122-1,69
1;47 4.84 16
0.320 7,.25 14
0.270 8.31
-2.29 3,45 14.
11.6 ° 9.51, 12
2.18 3.07 12
8.33 3.39 is-1.43 1.33 11 °°'
13.5 '10.00 '24
-1.9'4 2.27 10'
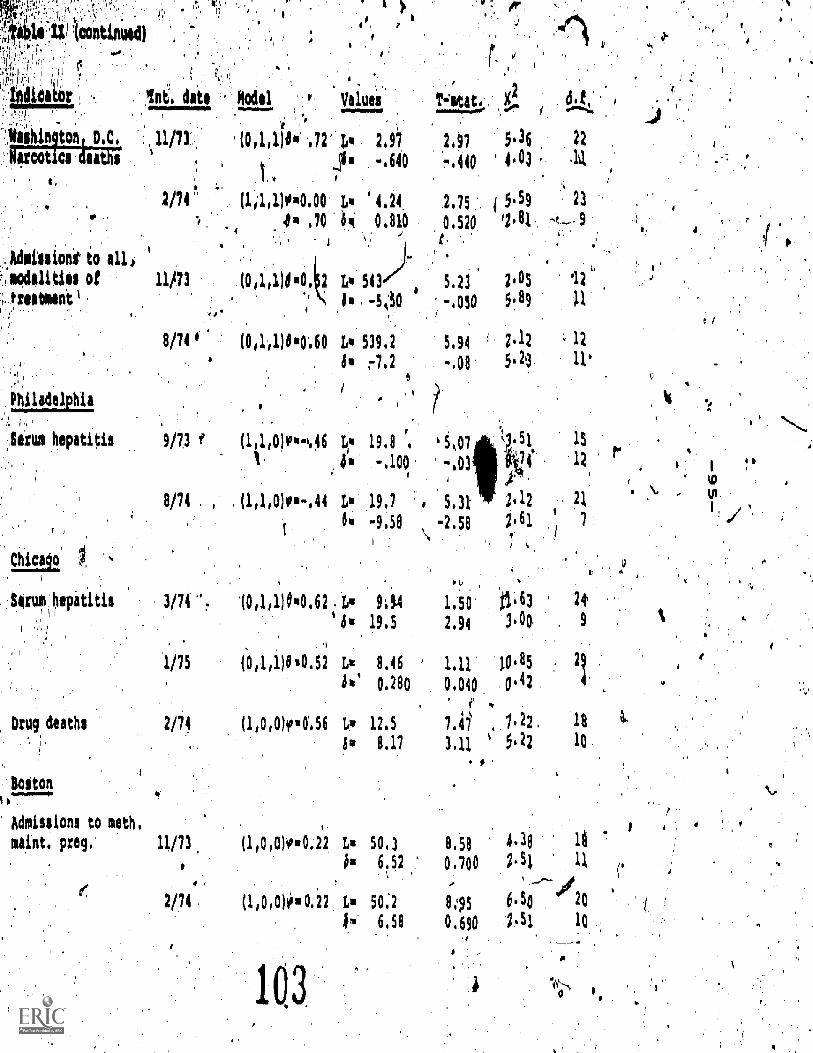
Arco
ton D.C.
cs,72'
2/74 (1311)00.00
4411 .70
.Admissionit to all)r.; odrlitios of 11/73
'
(0,111)do0A2
8/74 ' (0,1,1)8.0.60
Values
PI 2,0 2.97 5.36-.640 -.440 443
4.24, 2.75 5.596 0.810 0.520 '2.4
LA 543/ 5.23I' -00 -.050
1. 539.2 5.943' r7.1 .,08
5
Philadelphia
9/7.31
,
(1,110) P%-.46 Li% 19,8 .
4°Serum hepatitis
8/74 (1,110)'1.-,44 Li 19,7
80 -9,58
NeiI
10ruMhepitiiis 3/74 ". (0,1,1)8.62 . Ls 934' 19.5
1/75 (0114)8 10.52 Lig 8.46
hki 0.280
Drug deaths 2/74 (1010)f10.56 LIP 12.5
So 8.17
'Bogor'
Admission' to meth.saint. prep, 11/73
,
2/74
'5,07
5.31-2,58
23
9
4
2.05 12'5.89 it
2.12 12
5.21 11
15
12,
ry
1.50 00632.94 3.00 9
1.11 10.8,5
0.040 0.12
7 1.22
3.11 ' 5.22 10
24,
18
#
(110,0)oe0.22 Ls 50,3 8.58
&Su 6,52 0.700
(110,0)0.0.22 Li 50;2 8,15
It. 6,58 0,690
103
4.38
1.51 13.
Af
6.50 '` 201.51 10

Tab NtOntii1014)
IndiCatOrl ini,date r Model
144
, a
Abitslons ;to illmodel4lei,ot treat-
, &intle,
AdMilliOnS to nth
1411i4liOns to artib,
cletok. ptog:
r
Values' d.f.
rt
9113 (1,110)08.24 Ls 17,6..ki k320
1
9/73 11404010,10,24 148 6,26ill -4,22
9/13 (Ito ;0102:04 86 idu 131.48 -.610
11
3,11 1.12. 16$44 5106, 12
12.13 r.,13,04 21-00713 41 4.319 X12 i'
4or
r 'a
1-
'1
1
4
4 40,
41r '10 1
,1
.1
r
I
,
4

24
E-.
CRIME4 ITTED BY NARCOTICS USERS IN MANHATTAN'
a .
A Sgaff.Working Paper,
4.of the
biug LaW Evaluation PrOject
`41
r
'':41111a paper iris Trepared by Majda,I. SajoviO and Sandra.
Earpia, Withrthe;mpaistance of David.Cummilli, Andrea', .
4.
Ped61sXe, and Peter.POiyeep.-
rt
. :.far';.,;115.1
,
, .41 :4.
t.,.c111.13c dotimi.T;ED-..BY NARCOTICS .3 1SERS IN' MANHATTAN
-` ).ti i'' ''-' -" ,...i... ). t ." TABLE.OF CONTENTS 5,. ,,,
. . ,
'''''. -... .: ,,,....
Thtroducrybn .i: . .,. . -. . .4 ...
: : . ...' Fin,din. gi abou,t Crime' Committed by. Nar;oticsAleers
-4 : ' .. Non-Drug Fel y Crime ..... - .'1. ''. .qRobbery and urglary .....Serious Crimes Againsi the Peison.. . . .
Other 'Findings
DetentionUsers
'parcotiqgii of
Metebdollogy:
a ... .C-. . a , t . : ,p ' . a as,
ytateh: for NarCotis13ers, and Nan-,;,t,, ... ,..;. ..,
h tril 1 P 1 .i.;:diu*,.;A10 g e Rou n .' *a' i'. . 'Youthful Offenders 7: ::I .....!-:'.. . . . . ... .. . -:
( A

tiTTED BY NARCOTICS USERS IN MANHATTAN ,
Ortii e of the 1973 drug laW was to reduce
rime coMmitt,e0hy heroin users.' This,paPer presents
the. findings pf a study of changes in'themagnitude of.
felonif4iiies.:cOmmitted by narcotics) users in Manhettan.
betweep71971 P.41975.- The crimes include&are all fel-
antes Nplehdirectly affect-a ActimApossession of sto-,
Len prOpeity and drug offenses, for example, are excluded
WhiltettxObbery and-burglary arejncl ded). These crimes4,
consditute.i0% of the felonies rep rtea to the police. in
a
Manh106an ea61 year.
If the 1973 drug law had been..effective, there,would" :
probably have been:a reductiOn inYthe propoition,.i& not .
the total number, of-flori-drug felonies committed by nar-
cotics Aserg. Even if total (non-dxugt crime increased
Auriikg.the,Oellod, and even if the totalnumber of, non-
drUg felonies committed by users increased,.the rb or
Lion of non -drug felonies dormigtted by users should have
decreased. If -users hstrgeen deterred from narcotics use;
the( shopld'also have been deterred from committing at
least some money-generating-crimes previously committed in-
older to support their-habits. Even if .ehe same individuals
°omitted crimes under the new law,, some of them would no
4

-100=
-.3oh4erberugerS ofolarcoticS, and so.the Crimes .thej, committed .
would hot be classified as user crimes.
I. Fipdingss about Crirge Committed by Narcotics Users
Non-Drug Fe ny, Crime
N4rcot s users were responsible for a. steadily de-
creasing proportion of tge non-drug felony crime,-committed.1_
. in Manhattan between 1971 and 1975.. The total number of-
non -drug felgnies comMittedby JserdAropped between 1971
and 103, and remained stable between 1973 an1975.
charts'iNand II document these ,changes. Chart I
shows that in 1971,some 52% of the non-drug felonies,"oc-. 4
curtins in Manhattan 'were attributable to:nartotacs users,.
and 48% were, attributable tp non-ugers. By 1975, users were_.
:committing 28% of these crimes while non-user§ 'were committing
72%.*
-Changes' 'n the Voliame of nOnndrug..felOnies, as'Well
as changei in the teta39number attributable to users` ad-
---'1"diCts, and nbn.-users** are, shown on Chart II. On thiS.Chart,. s
the crimes attributable.toiusers and tonon--uwspdd to
total climes cltted.. Crimes attributable to addicts:
are included in crimes attributable to users.,
,/
*Note that Manhattan is not typical of New York City as awhole, off'Of.other cities. The high proportion of crime
-: 'attributable to users might be matched in Brooklyn or the- :Bronx (althougti-there is no data available for those boroughs) '
but almost certainly are matt matched in any` county inthe 'State.
**Addicta are pragmatically defined here as those' perspns re-qtririntj detoxificationvfrom narcotics drugg. Non-addicted
N.
,- users are individuals with recen4vidence.in their re rdof narcotics use but'who did notfequire'detoxification in .
jail. Use i,snOIdde' beta addicts and non-addicted ..of'rfarcptic d . ',MA otherd, including non-narcotic dt g uSersiwere classifik as non-users for this study (see Methodologysection below).

PROPORTION OF NON-DRUG EELONIES IN MANHATTAN ATTRIBUPABLE
TO ADDICTS USETWIM11§75/71157-w--
e
4
.0
o 40
.0
20
USERS
ADDICTS
1972 1973. 1974 1975
NOTE: To obtain estimates, of the proportion of. total
non -drug felonies attributable to narcotics, users, crimes
against the person,1"robbery'adbUtglary and grand lar .
cony were combined,' Together, these offenses' account for
More'than 901 of the felonies repftted to the Nanhatt'an
polici! each year. Crimes involviq weapons, drugs And
To*srdonof'stblon puopqty could-not be incitid0
hecdik, there are no rolial0 complaint,figm,s1Or these
0110.11,0.'0.
Source: Drug Law Evaluation project Survey
109
I!
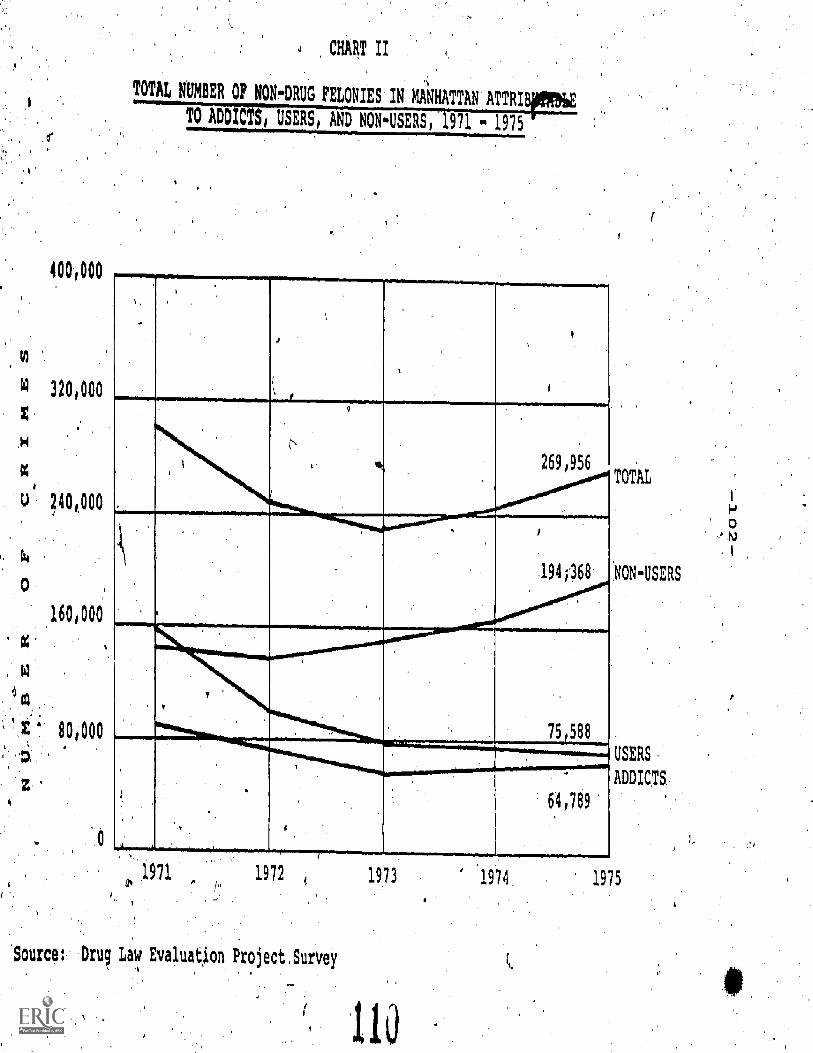
400,000
51 320,000
H
u ;40,000
160,000
80000
CHART II
TOTAL NUMBER OP NON-DRUG FELONIES IN MANHATTAN ATTRI
TO ADDIC SI USERS, AND NON-USERS, 971 - 1975
64,789
TOTAL
NON-USERS
USERS
ADDICTS
1971 1972, 1973 1914 1975
Source, Drucl Law Evaluatjon Project Survey
110
' 0N

-103-
Chart shows.that:
-- The total :limber of non-drug felonies committed
in Manhattan decreased betWeen'1971 and 1973, and
increased between 1973 and 1975.
The: total number of non-drug felonies attributable
to narcotics users (including addicts) declined
markedly between 1971 and 1973 and then remained
stable.
- - The total number of crimes attributable to addicts
/ declined from 1971 through 1973; and then:increased
slightly during the last two years.,
-- After falling slightly between 1971 And 1972, total
nondrug felonies attributable to nont-users increased
each year between 1972 and 1975.
The decline-in user crime, which would be expected-to
GCCUX As a result of adecline.'in'narcotio, use, corresponds
roughly ta.the movement of other indicators of narcotics use
...Jor the same period. Narcotics deaths, cases of serum_hepa-
titis andreports to the New York City Narcotics .Rgister,
all indicated that narcotics use peaked in New York City
between 1970 and 1972 and then declined to a relatively
atable4evel during the next.three years (CharrIII).
Data,,oDuser crime reflect the. same pattprn. User,crime
declined. during 1972.and 1973; and remained at roughly the
_same level through 1974 and 1975.

$120-27,000
110 25,000
100 23;000
90 211000
80 19,000
70 7 17,060
60 15000
A
SO 13,000
40, 1140004
30 9,000
c44Rie
INDICATORS OF. NARCOTIC ADOSt NityDRE 'CITY t,
q
A
,A
maT
.1
kH
HHcIl
H,H,4H'HHHHH
H H
1970 1971
40
, 2
' 275
MAN
},1 Li H'1 1."41
1(11.1 17&
4:41W
HHHH'H H
H
1974
HHHtlH H
H
1975
1 - Adjusted. Price Per Pure Gram Heroin: Public RePeilrGhInOt.lbite ,
),2.- First Reports to Narcotics Register: The City pf tie &It, bePartment of Health3 -: Number, of Narcotics Deaths: The city of 101. yofIcr,Vehrtrmght 0 Health4 - Caps .of Non.Tranifusion &Brim Hepatitis; rle ei'Yf ° NC Yorke DePartmill of Health
11 fit0
56u.
.250 (50
aA
225' 400
200 350
'175 300 I
150 X150
125
100 150
75 100
SO ..... 50
0 0
ts

r
Crime attributable to addicts ,(which are inc udea in
the user category) ?alSo declined betweeA 1971 and \973,
but, fell less than crime attributable to the larger user
, group.. /
(-Though the tlataseem to be an indication that nary
cotics use wa igher 'in' 197/ than it was in 1975Jin Manhattan,1 1
-
one can no t be certain thdtthe 1973 law was responsible for the'
reduction in the proportion of non-drug felonies attri.-,
butable to narcotics users since'.1973. Comparisons of the
narcotics/ indicators for New 'York City with those for out-
of-state/ areas is crucial. .1for'example, if large cities'
in ot ser states without stringen%drUg laws also .exhibit
.down ard' trends in narcotics use` /levels, then the importancer.
of e laws to the New York' State situation is likely to bee
ne 1igible. Hewever,,if trends in nearby metropolitan'areas
s ow.an increase ,in narcotics use .white'New York State indi-,
ators continued;their'decline, then i'twould be reasonable
o point to the laws' role in the New YOrk,' trends. Out-of-
.state comparisons are the next task of the Project. Never-
: 1
theless, the present, data do indiCate that some factor or
factors are damping the criminal activities of narcotics
users: The 1973 law may be one of these fabtors.
Robbdry and Bur;lary.
When.robeery and burglary are isoiated,Ithe dat,/look
very'similar to the findings just described for ali'crimeS:
113

'a decline in both the proportion and the total number of
robberies and burglaries attributable to narcotics users
ill Manhattan between 1971 and 1975.
As can be seen from Chart. IV, the share of robberies
and bbtglarieb attributable to users drepped frpM 638 in
1971 td 298'im 1975, while the, roportion attributable to
non-users increased from 478 in 1 71 to 71% in 1975.
The lower panel of Chart IV t
tions to numbers of priMea by applyi
nslates these proPor-
g the shares for
users and non-users to the number of robberies and bur-
glaries actually committed (compla
panded td reflect the rates at whic
to the pollicei. Robbery anti bur
nts to the police .ex-
cri are reported
are the two revenue-
producing felonies that narcoti users (and other offen-.
,
ders as well)
'robberies and
from slightly
commit most often.
burglaries-committed
more than,-'140i000 in
in 1973 and theMrIvraduallY increased to aCrate'of abbtit
120,000 a yearIii 1975. The Chart shows, the consistent
decline. in the'total number rooberies,,and burglaries,/.
attributable to users.
-- The total number.Oittrkhatabletojarcotic users
fell by'half, froM 76;000 in'1`"9kto 34,000 n 1975.
The total number,attributable Co addicts remained
stable at, about-30-40,000 lor,trie entire pe4od.
The total number attributablel.o non7users decreased
from 67,006 in 1971 to56,000 inj9i2and then in-
The,' total number of
in Manhattan dropped
1971 to- -about 100,040
creased to 84;000 by 1975. \

ROBBERIES AND BURGLARIES IN MANHATTAN. ATTRIBYTABLE'TO ADOICTS4 USERS,.AND NON-USERS, 1971 1975 .
1008
80
60
40
20
71%Not4 -USE
29%USERSADDICTS.
'25%
1971 1972
180,000
140,000
X 100,000
O60,000
0
2.20,00T
1973. 1974 1975
11'8 6
%
TOTAL
84,213NON-USERS
S
Source:
1971 1972 1973 1974 1975
Drug Law Evaluation Projeot'Survq
t
289-297 0 - 78 - 8

It is noteworthy that crimes committed by the Mar---r
totics user group declined 6yenOthe five year
until, in the last two years, the usetz were responsible'
for only a slightly larger volume df robberies and b4r-...
glhries than the addict group. However; thiS trend ap-
pearsto have _begun before'19t3, and--ias not .,inteniri.fid1-
since.* It is reason-able to expect that the law ?s greatest
deterrent effect would be.on theppart-time narcoti .users...'
because they may, not yet be so .immersed in use that theyi . .
cannot Voluntarily cut own their participation. Even it they.had
k stopped using na its they might Itave continued'com- . "..
i.. ,
l
mittipg crime, ut they would. now-appear in the analysis
as Sri- users.' fie addicts -- the regUlar Users of nar-i
.cotics Who require detoxi!fiCation treatment:services --
did not signifiCantly r1 -criminal activities
froM 1973 to 1975, alth gh-in.t e faCe of rising crime in
general; they apparently did not increase these activities -"<".
eithat
The'fact that the. number of rObberies and burglaries. ,
'-,attributable to addicts remained the same for the five year
..-
4- ' ; .
*It is difficult to classify 1.973 itself as either a ,"p e-law"
.or "post-law"'year because, while-the laws were.'in eef ct,for only four months, a good deal oft:the first eight-monthsof the year were,marked 'by an'aggressive publicity campaign
,warning about the effects of the new laws to come. To ac-count fov this, a.weighted averag6 of pre-law and,popt-law.'correction factors applied t lwto 1973 to aount for the fact ..tht the old laws applied for.the first eight months hnd
the new laws for the last four months of the year. Anyshifts in actiVity,caused by publicity. about the laws Would
.be evident in the d1s.trivutions. of prison population chargeand user'-status. However; the differences in,results ob-tained.using the pre-law and post-law correction factors are
'great. '
f
j161

pe i \'seems to;indicate that the hard-core narcotics
used s the person ,east 'affected since 1971 by factors'
inf uen'ing the use of nur"boties.
; pos,sibIe to:make estimates of the actual.
numb r, of revenue-raisinq,crimes other than robbery,bui-4
.gla *0-granelarcen H ever., an examination of :the
freq nay of charges f4 other property crimes facing drug
.UserS. tn jailshiled a depinWard trend in chargesOvery'simi-h
lar t the trend txhIbitedtfor robbery and burglary.I1 related intereSt'is the finding that users aniiAon-
U sers n lail were -equsall, likery to be facing weapons-,I %
rge . Tlhere were no significant changes over the five
Ye in the; frequency with which users were charged
ns offenseS.6
S mes A ainst the PersOn
Se io s crimes against the person include the major
violent rimes. This groups-excludes robbery;41lich,
though =ving attributes'of violent crimes, is, grduped
with bu' lary'for the purpose of tt444 analysis, The nUm=
ber of S rious crimes- against the person reported td tIsT
police $ Manhattan,. increased by 20% between 1971 and
973, ate was stable from 1973 through'1975,
The bindings (Chart VI indicate that there,is no
definite rend in theproportien.of serious crimes against
trie perscl) attributable to users, as there, is for robbery

1
-1Ib-CHAitT V.
SERIOUS CRIMES AGAINST THE PERSON IN MANHATTAN AltRIBUTABLETO ADDICTS, USERS, AND NON-USERS, 1971 - 1975
1008
ao
60
40
20
0
20,000
16,000.
12,000
N0
8,000
4,000
rj
741NON -USERS
USERS
ADDACTS
.1971 1972 1973 1974 1975
f
17,94.9
r.
TO
' 13,31?
NON-USERS
4,677 USERS
3,598ADDICTS,
1971 1972 1973 1974 1975\
Source: Drug Law Evaluation Project Survey
118

v
:"andburgl.ary. Despite large year-to-year variation* the
'proportion of these crimes accounted for by users has re-
.mainedat roughly one-third. This proportion is no fonger
significantly below. the share of robberies and burglaries
committed by users (because, 'as noted above, those, offenses
have deqlined:through the years)_.
When.translated to actual crime, this evidence im-
plies that the increase in serious crimes'against the per-
son since 1972 is largely-attributable.to non-users. The
'addicts' share of these crimes fluctuated somewhat, but `,..
it remained at a roughly stable level;-similar tO that of
the user group as a whole. As. Chart V shows: the total
number of:serious crimes against the'person in Manhattan
increased from about 15,000 in 1971 to about.18,00b in 1975.
Crimes attributable tonon-users rose froM just under 10,000
in 1971 to a peak of 14,000 in 1974*and then dropped slight-
l.y in 1975.
The nUMber attributable to users was the same in 1975
as, it had been in 1971, about smo, _Crimes against the
person*ttributable to addicts( a subset of the User gioup
WmtObighest in 1972And then7returnedtothe1971,
levelin 1974 01975.
119
.-

NII. Other Findings
-112,
As byproductgivilif the_Project's examination of uLera...1.
.erime','several interesting analyses.were possible: These
...
.
are .summarized in the remaining Sections.
Detention ates for 241?rcottcs Users a d'Non-users.
Interviews with judges and,defen e attorneys re aled
. . .:,-
that they felt narcotics users wer nt to det n at,.. .
higher rates thasirnonusers, either because users could not
.") efeet bail conditidns aseasily las non-userscpribecause
judges regarded them, as poor risks and therefore set hight .
bail. As Table I illustrates, 74% of users facing any
felony charge wes:.A sent 40 detention'in 1972-73 while only
j
. .
50% of non-users racing felony'charges.were sent to deNtbn-:
tion dtring the, s e period. In.1974-75, a total of 79% of
..the users facing all felony charges were sent to. detention
compared to 51% of. the bon-users.`were
not only have
-higher ntion rates than non-users, but their detention
nCreased slightly over time.
ndings indicate hat under the 1973 drug law,
de nti n rates.in drug cases increased only for non-users.
The tention rates for users facing drug charges remaild
the same in bbth periods, althOUgh at A much higher level
than the non-user rate.
.4?

TARLD I
Detention-Pates Following Criminal Court Ar.x.aigAment iAManhattan /-
..
74-75
50%
fria%
t.S7%
47%
'56%
.Cr*mesAgainstPersons
RObbery.and
Bug a ry
paugFerdnies
PsA; otherFel hies
_
TOtal
72-1'3USER , NON -USER. . ",TOTAL
72-73 ';
53%7
64%-
53%
54%
56%
74-75 72 -73. 7.4 r75
50%
89%
72%
751.
741
7 674*'
90%
71%
80%
79%
54%,
"52%
'33%
50%
50%
48%
63%
48%
42i,-,
.51%
r.
'ewer than 10 observations _.
..
Notes: Twenty-fivk'cases where detention statue was unknown
`'''''.........
were excluded.For 72-73, n=273 ..
r,. Fdr 74-75, n742,8, .
ioutoe:' Drug. Law Evaluation project Survey, ,
121
11,

Narcotics Use Among the Jall Population,
The data: showed that n rc'oicsuse among detainee
declined through time, but the:decline was.opt nearly
as rapid as the fall in the estimates of Crime ettr'l-'
butable to users.
-
!a Proportron,1of heroin
and.meth4done users'in detention '
/'
CriMe attriVutkleto-pserS (Chart I)
-r
1973 1974 1975.
53% .484 : 448 42% 43%
52% 43% 35%
Thii difference in the of decrease is*a
fleCtion Of the fact, eonfirmec by the.analysiSAbf.de--;, .
tention rates, that users fincitheir way to,prisen more
2846
'fequently than non-users.
In most cases, medical records of: the detained popu-,
latign made it possible to distinguish heroin users fkom
methadone: users. (Personsaddicted to either drug.are
'included 'in,the'uSer groups; as they are throughout the
study.)
When heroinvisers are isplated from sethadone users,
the data reflect both the decline between 197,1 and 1973 and
the recent stability.
Heroin users indeteptios
1971 1972 ° 17973 ..1974.
25% 22% 16% . 17%
122.
1975
18%
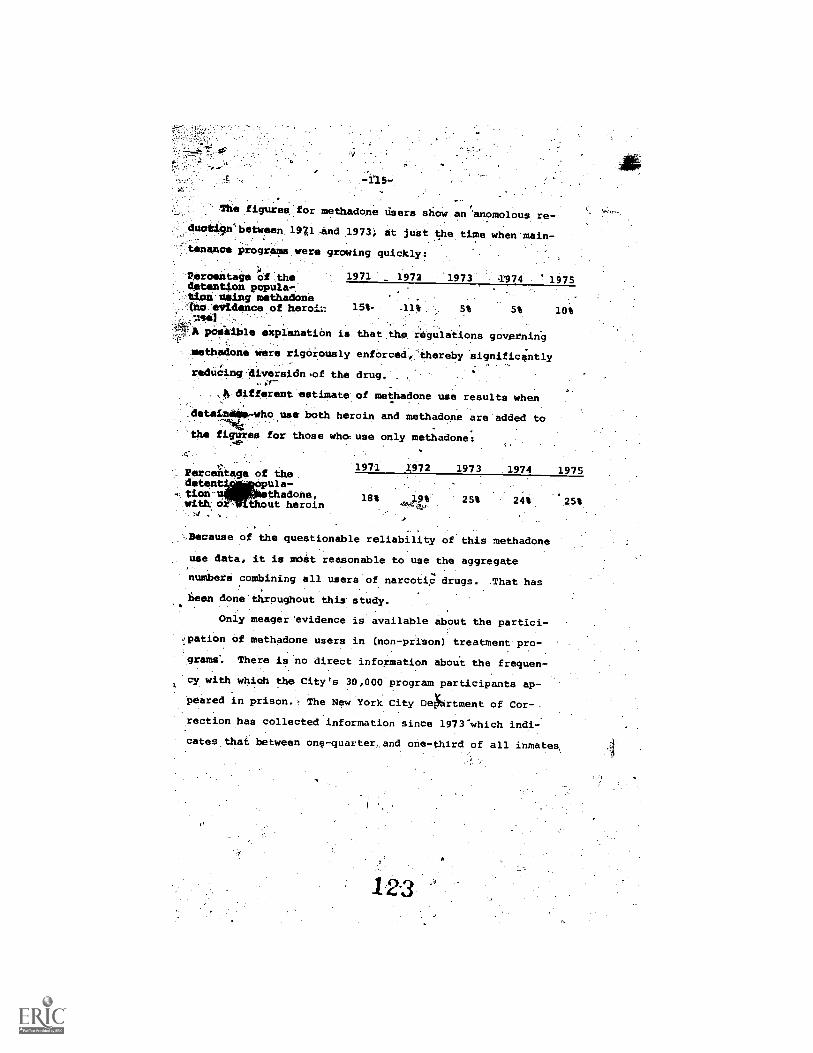
-115-
The figurealfor methadone Users show an anomolous
n'between:19/1:and 1973'; at just the time when'main-
tenence programs were growing quickly:
Percentage olthe 1971 _ 1972 1973 .1974 ! 1975detention popula-.tIon'Oling.methadoneAirceVidanceof heroir. 15% 5% 5% 10%
A poMilble explanation is that the. regulations governing
%,..methadone were rigorously enforced,'` bereby significantly
radUcingAiversidn.of the drug,
. ,kdifferentestimate of methadone use results when. .
detalcM4a-wh6 use both heroin and methadone are added to
:the figures for those who use only methadone:
1971 1472 1973 1974 1975Percentage of the.
tiOn- thadone, let 19% 25% ' 24% .25%with. Cr, ihout heroin
,Because of the questionable reliability of'thia methadone
use data, it is albeit reasonable to use the aggregate
numbers combining all users of narcotic drugs. That has
been donethroughout this study.
Only meager'evidence is available about the partici-
,,,pation Of methadone users in (non - prison) treatment pro-
grams. There is no direct information about the frequen-
cy with which the City's 30,000'program participants ap-
peared in prison. The New York City DeXhrtment of Cor-_
rection has collected information since 1973°which indi-
cates that between ona-quarterand one-third of all inmates,
12-3

(City-1ide) who went through detoxification,i.e., the
.'addict" group in this study, were''participating in a
methadone maintence program at the time of their arrest.
These date.suggest that throughout the course of a year,
between'fifteen \d twenty percent of males in the metha-
done maintenance tkeatment.population are detained (al-
though some-of.th se might be repeat offenders
arrested More thinon"de in a year).
20 compare,theicinds of crime methadone users are
.
likely to'commit with crime committed byheroin users,
Chart VI shows the distribution of, criminal charges facing these
two groups. (Users of heroin and ipthadone simultaneously are not
included in the distributions.) The relatively large sample
,sizes over the five year period lend credibility to these
distributions, even'though the relative size of the groups
may not be accurate'. As shown on the Chart, methadone users
are more likely than herOin users to be charged with serious
crimesagainit the persOn, and and somewhat leSs likely to
be charged with drug offehses. Both heroin and methadone
who are
users are about equally likely to be charged with crimes
in.the other categories.
Number, of Youthful Drug'Users
Any effective restrictions on the spread of drug use
should be accompanied by a decrease in the number of young
people using drugs, and this :should result in fewer youth-,
ga drug users in prison. The dats'show that the propor-
tion
Il
of users among detained persons 21 ars of age or
ryounger decreased steadily froM 1971 to 975. This'down-
ward trend was in effect before the laws were proposed, -
124

TYPES OF CHARGESFACING HEROIN ANDMETHADONE USERS IN DETENTION
9
If, METHADONE USERS
n 686
1 - Serious Crimes Against tht Person2 - Robbery and Burglary
3 - Weapons
4 Other Property Crimes
5 OthekPelonieS
6 DrugFelonies
Source. Drug Liw Evaluation Project Survey
125
313

-118-
and has continued in the post -law period. The proportion
of addicts .in this age group did not change'during the
five year period. Here again, it appdars that only the
non-addicted narcotic users decreased their, criminal
activities.,e
For the youthful detainees as a whole, including
users and non- users; the distribution Of.Criminal:charges
shews.they are charged with robberies and burglaries
at a higher rate; and serious crimes against the person
and drug felonies at aiower rate,.than older defendants.
I. Methodology
Arrest records-, in New lock State rarely contain
information about a'person's drug taking behavior. When
theydo, the Information is of questionable reliability.
'There is owpoint in the New York City criminal justice
system, however, where `reliable information of.this.type
is available. Since 1971, doctors in the City's Depart -
ment of Correction have'examined adult males sent to the
Manhattan pre-trial detention facility to learn ifthey
axe physically,dependent,on narcotics. .Those who are
physically dependent on narcotics spend up'to threeweeks ,
in a detoxification program operated by the Department.posl
By using data from this and other. sources, it wasFr
poSsible to estimate indirectly the changes in non-drug
crime committed by narcotics users J.T New Yok City be
1971 and 1975.
126
-119-
.Nargotics users were defined to include both addicts
and non - addicted users.. Addicts were defined as those
individuals wha, when they were jailed in Manhattan, re -.
quired detOxificAtion from heroin or methadone. :Non-\
addicted users were defined as prisoners whose record 1117,
diCitedthey,had used heroin or methadone withinthe three
month Lieriod.preneding detention but who did not require
40tOxification. All others, inclUding those who used non-
-narcotic drugS, were defined as non-users.
Limitations of the data restricted estimates of the
volume Of crimp committed by users to two categ6ries:
serious crimes against the person) and robbey, burglary,
.end,grand larceny. These offenses constitute more than.
90tof;the felonies reported to the police in Manhattan
eechlear.
No attempt was made to establish a cause and effect,
relationship betWeen narcotics use and crime. It is quite
possible, for emamOle, that many narcotics users would
commit crime eVenAf they did not use drugs. It is not
necessary, however, to establish causality. in order t9
evaluate the impact of the 1973 drug law on non-drug felony
crimes committed by narcotics users.
The more significant liMitationsAof the study should
be noted. The defendants studied were adult males in Man-
batten. and the results may not be applicable to other
12'7

-120-
gri)UPs of defendants in other locations. Juvenile crime
is excluded entirely because courtrecords for offenders
.below the age of 16 aresealea. .Defendants under 16 ac-
pounted for .approximately:18% of non-drug felony arrests,
in-Manhattan during 1975. Furthef, the total amount of
crime attributable to users has been underestiAated be-
--,cause the study 'focused' only on the more serious offenses,
and excluded al1.misdemeanor offenses, e.g. shoplifting.
The 'apportionment of detainees in each of. the Major
, felony categories* between addicts,-users, and non-users
was the first, step in estimating the proportion of.serious
.crime attributable to each group. This was done by
sampling 3,500 cases from the Manhattan House of Detention
for Men (RDM); also.known ea. therTombs, from.1971 through
197Aw
The proportion of users in detention could not be--
directly generalized to the proportion of users among those
'who. mmit crimes on the street. Narcotics users, for..
A.e , might not beariested.or sent to detention at theli)
:same.rate as'they commit felonies on thestrpet. Moreover,
various.stages of4tAe criminal justice system might respond
differently to users and non-users.
*There were six major felonycatefories;. as follows: (1) serious
crimes against persons (including homicide, rape, assault, kid-
napping) and,robbery; (2) burglary; (3) weapons charges;
(4) other propertycharges(including grand larceny, forgery,
arson, fraud, possession of stolen property); ,(5) drug charges;
.(6) other'telonies (including bribery, baiLjumping,and gambling).
If an individual had more,than one felony charge. lodged against.
him, he was categorized:bythe felony that ranked. highest in the
New York Statedienal Code: When a person was charged with two
felonies of the same penal code rank, he was classified by, the
'felony that ranked highest according to the above ordering:
e.g. if 4wdetainee was charged with a felony in category (2)
.
and anotfer in category (4), he would be clasiified under
category (2). ,
128

;.The data from-the HEM.were adjusted to account fors
different ttilatment of narcotics:users and non-users
?ittseveral stages in the criminal justice system. These
";'adjustments-aredjustmentsare outlinebelow.* The ad)ustments are listed
is an order which generalizes the sample (from HDM) to
'pxlmes on the stree:The'criMinal justice process itself
works in the opposite'directiono i.e. from the actual crime,
thrOUgh a.-report of that crime to the police, arrest, arraign-.
ment'in court, and, final/y, detentiOn.
1. Users and%Non-Users after Arraignment. .
The distributions of felOny charges facing detainees
'were-first adjuated for.variations between detention fates
for addicts, users, and non-users,** because it was expected
that.there were differences in this rate between the
,groups. Thedetention rate is defined as the ratio. of.
* A fully detailed research methodolOgy for this study is.
on file with the National Criminal Justice information andStatistical'Service of the Law Enforcement Assistance Ad-
.`ministration in Washington, D.C.
**The only stage.in the analysis where'a distinction'couldbe drawn between addicts and non- addicted users was in
. the HEW. _After that point, the charge distributions for',addicts andnon-addicted users were treated identidally;that it, the tame AdjustTent factors were applied to bOth:groups ateaah stage. The differences between addictsand,non-addicted users thus derive from their charge dis-tributionsln jail.

-122-
4
defendants detained to defendants arraigned in court
(usually expressed ms- a per cent or a decimal). The rate
is under 100 bease many.arraigned-defendants are released
. nn bail.
DetentiOn.rates. for users. and non -users were deter -
. mined by analyzing two samples of felony cases in Manhat-
tan Criminal and Supreme Court records, one covering a.
14,month period before the 1973 law Wes enacted, and one
covering a 14 month period after the law was'in,effect.
User and non -user detention rates were determined from
court records, Whichcontain'information about user
:status and aboutWhether defendants are detained, re-
leased onball,', or released on their own recognizance
.(parole. As shown on Table, / above, users were generally
. sent to detention at.a higher rate than now-users. Further-
more,. this was true both before and after implementation of
the new law.
When the detention rates for each user group were ap-
plied to the respective distributions of fel6ny charges
facing those groups, the result wad'a distipution of
felony charges facing users and non-users following ar-
raignmeni.
2. Users and Non-Users Chard with Felonies before Arraignment
The next step was to convert users and-non-users facing
felony charges after arraignment to users and non -users en-
tering arraignment with felony charges. The,formerxwere
known'from step one.-

To obtain th roportions of users an non-users en-
Iering arraignment ith felony charges, the rate at which
felonies survive a aignmept in Criminal Court hail:to be
determined. -This' ii-aopel by collecting two samples from
the:henhittSn Cr 1 Court records, one from the period
:124/1eri.the drug law as enecte&;\and one from theperiod
Afterearda.:Theier ords we ned for evidence o
reduction or dieMissi of felony charg during arraign-
eent; and from them a "i4ivail rate".for felony charges,
at arraignment was ute . When this rat was divided. \
\
AStO'the number-of fel nies surviving arraigneSnt, the ,
reaulting.figure was th number of felonies entering
arraignment.
The proportions of users and non-users who did,not
WAS their chargis reduced below a felony at arraignment
were known from thOwepli\of Criminal. Court records de-,
Hscrilmiki in stepone. In oiderto distribute this number
of felonies entering arraignmen ween users4ind hon-
esers4nOther pair of samplei be collected in the
Criminal CoUrt: pre- And pOst-1 amples.of those persons
who were known to haVe had their charges reduced at arraign-
.vent. These.recercisWerel'analYzed for User stdtus informs-
-tiOn, so that the proportions of users and non-users having
their charges reduced at arraignment could be determined.
359-297 0 - 79 - 9
1 3

-124-
'Together, these samples permitted computation of the
oproportionS of users. and non-users who facea felony"
chargei upon entering arraignment.
Results of this adjustment showed that a higher pro-
portion of users than of non-users had felony charges.re-
Zuced or dismiased before the law went into effect; but,
under the new law, the proportion of'users having felonies
reduced at arraignment was lower than the proportion of
non-users Who had charges reduced.
'-3. Usensam on-Users Arrested
The only in the court system between criminal
court raignment and arrest at which felony charges can'
be reduced or dismissed is the complaint room. The-com
plaint room is the place where the prosecutor first eh,counters a defendant and first evaluates the case.
From a recent study*, it is known that about, two per
kCent of all felony arrests are dropped in thhcomplaint
room. Therefore; in order to obtain estimates of users
-and non7users,arrested for felonies, the figures obtained
. -for felony charges entering,arrignment.(step 2 'above).
were divided by 0.98. The result represents,thhnumber of
felony arrests for each user group.
It was not possible to obtain data about the criminal
charges or thhuser status of defendants whose charges are
reduced or dropped in the complaint room. Therefore'the
same 0.98 factor was applied to the charges. facing addicts,
*Felony Arrests: Their Prosecution and Disposition in NewYork City's Courts, A Vera Institute of Justice monograph,The Vera Institute of Justice, New York, 1977.
1. :12

Shd-nOn-users, and the distribution of.charges for
thaithree groUps wamunctianged:by.this adjustment.
Converting Individuals Arrested to Crithinal Incidents
:Up to this point, all. calcupitions have involVed in
diVIduakdefendantS rather than criminal. incidentS. The
',number. of individuals, arrested does not necessarily cor-
respondto,Crimes committed, because one person hight be
responsible for. several crimes, Or several arrestsmight
result from one crime. The. primary interest of this study
4. the number and proportiondf-ciminal incidents attri-.
,.butable- to narcotics users.::'..WharefOrs,-it was necessary.
.to estimate the number of Criminal. incidents represented
by the arreSi4igures obtained in stati0;_
,To obtain the number of incidents represented by our
saMple of irrestd7it was. necessary to determine the num-.:
..ber of arrests that corresponds to one crime cleared (solved).
Utiliting'pelice.department figures for the number of crimes_
cleared and'duMber of arrests by crime category, the adjust-
.Ment is deriVed by dividing total arrests by total crimes
cleared for each'type ofjelOny. The:number of arrests.
Per crime cleared by user status was compited by weighting
the adjustment ratios bythe diStribUtion of crimes that
UsersiAlon-users and addicts wereerrested for Like all
the other.adjustmentsi this was done:separately for each
year from 1971 throug4'1975.c

Typically, the numbecof'arrestOper crime cleared
Was close, to one. Wheit1he higher, in 1972, it was
shigher for users, iwinr I era, and addicts alike.
k r . ,.. - ,;-..
-- )S. :Correction for tifferences ihiClearance Rates for Users
n.
. and Non-Users
Further adjustment . was reguired'io translate the number
of incidents represented by arrests (step 4) into estimates`
Of crimes known to the police. If was hecessary'to. arry9
out this adjustment kcroddiets, users, and non-users .sepa-..,
ratelyloalluse clearance rates might vary1letween'groups...
This-was done by diyiding the number of incidenti (step ii
. by the respective.clearance rate for each crime Category.'7 ,
-,..,
This adjustment results in an estimate of the nuMber,
of orioles kAeari to the police which the sample represents. ,
.. :.-. .
The nOn,ius -clearance rate was slightly higher than the
rates'ior users and Iddidts, but the'differencewas.'noi
'Significant.
6. Users and Non -Users Who Commit Crimes on the Street. .
To obtain estimates of crimes actually committed on
the street, the climes known to the policeistep 5) were
)-adjusted(for addicts; Users, and no users separateey),... . .
by-the rates at which each type of felony is reported to

the poXice4h New ink City:* This adjustment was neces-'
01;y-because users and non-uiers,commit somewhat different
lindeof crimes and thlremighi have been a'pi4nificant
4fiekeace between the rates at which user and non-users
oriole' are reportedto%he police.
,the rates at wh4ob user Crimes were re-
pOrieerto't11040114,5WItere lower than the rates at which
non-twit crimes wire-reported because users (and addicts)
tenliodc'gpAskite.sfightly higher proportion of property'.
crimes whicbitend to have relatively lower report rates.:
*Criminal Victimization Surveys.. in the Natiori4s Five Largest'Cities U.S. Department of Justice, Law Enforcement.Assis-tame Administration, National Criminal Justice Informationand,Statiatics Services, April 1975.

' 3:
THE EFFECTS OF THE 1973 DRUG LAWS ON THE NEW YORK-
STATE COURTS'.'
A,Staff*rkingi>aber'-'
of .the.
Drug Law Svaluation",Project
This paper waS,grepared by Anthony F. Japha
andZopaph P.Aanman,LWIth the assistance of
Eiizabe* Stanko and Richard Mctihey.

-129-
TABLE OF CONTENTS
Section,
1, IntroduOtiOn
PAGE
130
2. Summary of Findings 133
3. Credibility of the Deterrent, 142
r 4. Speed of Justice 160
5. Enforcement Policies 165
6. The Effects of the New 1.1.4s on the New York CitySupreme Courts 186
7. The. Effects of the New Laws on the Superior Courtsin Six.Dpstate-Counties 216
B. A Cross-County Comparison of Court Resources 230
Appendices:
I Gaps in the Measurement of the Probability ofPunishment
II
III
234
Measuring Changes in the Pending Caseload in theNew York City Supreme Courts 137
Methodology for New York,City Supreme Court Pro-ductivity Calculations
"L

The Effects of the 1973 Drug Lawson the New York State Courts
INTRODUCTION
Comprehensive revisions of NeW York State's drug laws
became effective on.September 10974. The new statutes
reclassified many drug crimeS'ae:high degree felonies,
made priSon sentences mandatory upon conviction for many
drug crimes, restricted plea bargaining by defendants
indicted for drug crimes, and reinstituted recidivist sen-
tencing provisions in.New York State. Under these latter
provisions, prior felons newly indicted for a felony face
new restrictions in plea bargaining, and prison terms must
be imposed upon conviction.
The Association of the Bar-of the City of New York
and the Drug Abuse Council, Inc. formed'the Committee on
New York Drug Law Evaluation. late in 1973 to evaluate the
effects of these revisions. The Committee's staff is
addressing a variety of issues raised by the new provisions.
This is a Report of the staff and not of the Committee.,
The degree to which the 1973 drug and sentencing laws. .
can be judged successful will depend ultimately on.their
_ -effects on street crime and drug abuse, effects which can6°
*The recidivist sentencing provisions are referred to as"predicate felony" provisions in this Report.
4,

ccur in two ways. The laws,mightwork,to deter would-be
Mug abusers and other offenders by increasing the risks
of Committing crimes, an effect sometimes called "general
Mterrence." The. laws could also be effeCtive in, reducing
Mug abuse and other crimes if they resulted in the imprison -
ient of offenders who would commit additional crimes if
dlowed to remain a large, a result known as the "incarcer-
tion"ormincapacitation" effect,, or as "specific deterrence:"
Neither deterrence nor incarceration can be expected to
operate automatically after a law is enacted. The new laws'
my or may not prove to be an effective deterrent, but deter-
mmce.is not likely to be enhanced unless the likelihood of
mnishment can be increased. Similarly, incarceration effects
annot be'significant until/substantial numbers of offenders
ire actually sendtenced to prison.
This'report assesses the success achieved by the courts
.n creating a credible deterrent over the two year period
Cr which data are available, It is concernedi61marily
rith implementation of the statutes dealing with drug offen-
ces -- possession or sale Of dangerous drugs. Many of the
ame issues are relevant to the predicate felony 'sentencing
tctions of the 1973 laws. However, sufficient Anformation
s not yet available to permit a thorough examination of
:hose provisions.
,It is important to stress that whatever the courts are
ble to do in carrying out the objectives of the laws, they
an only pkovide a limited role in the complicated process
1 deterrence and incarceration. They cannot, for example,
239

-132-. ,
,directly change'the would-be drug abuser's perceptiOn of'
hoe'likely he is to.be arrested and go to prison, a factor
which is crucial to establishing deterrence: To repeat, a
final judgement on the effectivepess of these laws must
await an evaluation of their effect on drug abuse and drug-
related crime. Future reports of the Project will cover
both these subjects.
The State's court system is dominated by. the concentra-
tion of resources in New York City. The 117 criminal term
judges operipng within the City account for roughly 60% of
the State's total superior court resources for criminal cases.
The remaining judges are divided among 57 counties, with the
heaviest concentrations in Nassau County, adjacent to New
York City,.and Erie County, which includes the city of Buffalo.
The problems faced by judicial administrators in New York City
are ,unique in the State, and a large part of this Report deals
with the New'York City situation.
Developmen'ts in six other counties are summarized to pro-
vide a range of experiences which together/are probably repre-
sentative of most court systems in the State.
The findings reported here are based on several sources
of information. The Project staff conducted interviews with
officials responsible for the administration of the criminal
justice system in each county for which data were gathered.
Discussions were held with the district attorney or the
assistant district attorney responsible for the prosecution
of drug cases, with administrative judges, with personnel
in public defender offices, and with police officials.
140
-133-
SUMMARY OFFINDINGS.
SS4
Implementation of the 1973 drug and sentencing Maws would
be judged successful if: (a) the risk of punishment facing often-,
ders increased to make the deterrent potential of law more power-
ful; (b) the number of offenders sentenced to prison increased
to remove potentially dangerous criminals from society; and
(C) the speed with which cases. -are processed improved so that
swiftness of punishment accompanies certainty of punishment.
During the'firse two years the new drug and sentencing laws
were in effect, none of these key indicators of successful imple-
mentation have been evident: (a) the risk of punishment facing
offenders did not increase noticeably; (b) the number of drug offen-
ders sentenced to prison declined; and (c) the speed with which
cases were t3rocessed did not improve. Both in 1974'and 1975, there
were fewer dispositions, conyictions, and prison sentences for drug
offenses in New YgrkState superior courts than there were in 1973.'
However, 1975 was in several respects a more "normal" year than 1974 --
particularly with respect to processing drug cases in Neel York City -
so that "some of the implementation problems may finally have been,
overcome.
'In spite of the slow pace of implementation, over 1000 offenders
have been sentenced to indetermlnate "lifetime" prison terms fOr drugti
felonies in the two years the laws have been in effect, so that a
significant number'of individual offenders have been affected by the
new laws (see Table 271).
A'total of roughly $55 million had been spent on court-related
resources to implement the, laws by the end of 1975.
Credibility of the Deterrent (Section 3)
Increasing the risk of,punishment facing offenders
144

4
-134--
TABLE 2 -I®
Drug Cases in New York State Superior Courts Before and
After Implementation of .the 1973 Drug Laws.
1975***1972 1973 1974
Indictments 7,528 5,969 6,208 5,340
Dispositions 6,991 5,580* '4,368 4,587
Convictions 6,03, 4,739* 3,251 3,095
Prison Sentences 2,039 1,561* 1,074** 1,433
(As a percentage of 33.8% 32.9% 33.0% 46.3%Convictions)
Mandatory "Lifetime"%
N.A. 0 315 817
Sentences
N.A. Not applicable
*Estimates by the Drug Law Evaluation Project.
**Of these, an estimated 529 came in new law cases, and545 in old law cases.
** *Full rear estimated on the basis ofdata kor the first nine months.
Source: New York State Division cfCriminal Justice Services

-135-
depends on actions of the courts, on the'effectiveness
of the police, and on the willingness of the public to
report crimes. This Report foduses primarily, on the role
of the courts. A discussion of, police polipiee is con-
tained.in Section 5.
Mandatory prison sentences as presoribed in the
1973 drug laws can be imposed only after a conviction
..\in a superior (felony) court. But only about one of
every five arrests for drug felonles results in a con:.
viction for .a felony in superior court. The role of
the courts in sentencing is limited to that small'pro-
portion of arrests. And the arrests themselves represent
small share of the .drug crimes which are actually '
ommi ted.
The contribution of the courts in creating a credible
`deterrent improved sharply in.1975 after-laving declined
during 1974, the first year the new laws were in effect.
During 1974, the likelihood of a prison sentence following
.conviction for a drug crime didnot.increase above old
law levels because it took very long to process the most
serious new law drug cases. Last year, however, nearly half
the convicted drug offenders Were sentenced, to prison cam--
pared to a tkird-in previous yeats. There were an estimated
1,433 prison sentences in 1975 compared to less than 1,100
in 1974.
But because it took so long to dispose of new law
cases, there were still far fewer dispositions of drug
-cases in 1975 than in 1973, and the rise in the frequency
of prison sentences in 1975 still left the total number
of prison sentences below the number of sentences imqbsed
143,

-136-
in 1973, when an estimated 1,560 defendants Went to prison
following conviction on old law drug charges. The backlog. .
of drug, cases increased during 1975 despite a reduction in
the number of new indictments.
The rise in the frequency of prison sentences in 1975
was not enough to make a significant difference in the'.risk
of prison facing offenders committing drug crimes. That;
risk is still less than one chance in'a hundred of receiv-
ing a prison sentence from a superio'court.
Because of the absolute decline in the number of prison
sentences in2drug cases during 1974 and 1975 compared to
1973, any beneficial effects the laws might have in terms
. of trine prevention (through the incarceration of dangerous
offenders) have probably not been realized. ,Sentences im--.
.
posed on drug offenders have increased in severity. Whilef
in'1973 and 1974 old law cases, minimum sentences of over
one year were\re -- they applied to between five and ten
Percent of the cases Statewide -- a third of the new law
'offenders in 1974 received sentences with minimums of over one
year. These sentences'are for indeterminate periods, and no
reliable inforihation is currentlfavailable regarding the
.length of time those sentenced to prison will actually serve..
Indications are that court systems outside New York City
adjusted to the new laws after about one year, and that the
New York City courts achieved a balance between indictments
and dispositions about two yearS'after the laWs became effective.
It is estimated that when the difficulties of implementing'
the new laws are fully overcome; the laws will be. responsible
for between 500 and 1,000 new prison sentences a year through-
out the State.
14 "1

1 .
The Speed of Justice (Section 4)
Outside New.York City, the courts have generally been.. 4
able to mannge new law drug eases without an increase in
the average time ittakes_ito process a case. By contrast,
there appears to have been a significant increase in court
delays in. New York City.
.A recurrent theme in this Report involves the effect
of class A.felony drug cases upon the ability of'a court
system to cope,with the new drug laws. Class A cases are
those which face the greatest restrictions in plea bargain-,
Ang. Most offenders convicted of class A felonies must be
sentenced to prison for indeterminate periods ranging from
one year to life. In addition, lifetime parole follows
release from prison in all class A cases. The plea bar
gaining And sentencing Festrictions increase the time re-
quisSa.to process these cases.
In New York City, class A cases predominate, with 75%
of the drug indictments falling into this serious category.
Elsewhere in the State, class'A cases account for only 25%
of drug indictments. It is this difference which explains
"the relative ease with.which counties outside New York City
have managed:the drug law workload.
Enforcement Policies (Section 5)
The 1973 drug laws recategorized drug offenses by low-
ering the quantity of drugs required to classify a crime as
a'serious felony, At the same time, penalties which could
be imposed for drug felonies were also increased drastically
Police might well have reacted to these changes by concen-
trating enforcement efforts on relatively low level_drug
crimes, crimes which had been given increased importance
by the Legislature.
145

-138 -
We have found no evidence of the reordering of
police priorities in the counties we examined.
In New York City, where the possibility for street-
leVel enforcement is greatest because of the large volume
of highly visible drug traffic, the ;Police Department
deCided to maintain its policy of concentrating resources
againdt "middle and upper" levels of the drug distribution
system. The adverse effects that the new laws'have had
on the New York City courts; even in the absence of
increased arrest activity, suggest, that largtnumbers of
Additional arrests would have led to a crisis in the
courts.'
Two other aspecti of enforcement'have been examined.
It is the consensus among the State's police officials
and prosecutors thathe new laws have helped them to
develop informants in drug cases. .Fears to. the contrary1
had been expressed by,some police officials when the laws
were first proposed. Despite tough restrictions, there
is apparently enoUgh'flexibility left in pleading and
sentencing to induce some Offenders to cooperate with
law enforcement agencies.
Finally, an examination-of indictment activity by'
,prosecutors indicates no noticeable Changes in the'.
'frequency with which indictments have been sought in
drug cases. This possible loophole for avoiding post-
indictment plea restrictions has apparently not been used.
However, a recent movement toward a lenient indictment
policy for some drug cases by the Special Narcotics Pro-
secutor in New York City may change this result markedly.
1 4 L.)

The Effects of the New Laws On the New York City Courts*(Section 6)
NeW York City, which faces the greatest narcotics
problem in the State, has had the most difficult time
:managing the new law caseload. Backlogs of new law
cases-havebuilb,upmore quickly in New York City than
elsewhere in the State. ''It was not until the last quarter.
of 1975 that the backlog stopped growing, and the size,
of the backlog was then equivalent to.ten months.worth
of drug indictMent*.,
Backlogs have grown this large in spite of the
addition of 31 new judges assigned to deal with new law
cases, furnished 'at an annual cost of $23 milliOn.
The failure, of the New York City courts to'deal
effectively wl.th,the new law drUg cases can be'traced.
to several. faciors. The great predominance of class A
cases has caused a sustained, increase in the demand for
trials unmatched elsewhere in the StateCompared to
218 drug trials and a trial rate of 6.5% in drug cases
in 197'3, 13.5% of drug cas s resulted in. trials during,
1975.(.370 trials), ..Among lass A case's; 19,5% resulted
in trials during 1975.
Trials are extremely SxPensive tb conduCt. In New
York City, it takes an average of six days or more of court
*The superior criminal court in New York City is the Supremecourt. Elsewhere in the State, it is uSuallythe CountyCourt, although in some instances it may also be the Supreme
Court.
259-297 0- 78 - 10
14

.4140-
time to dispose of a case by trial.' Dispositions by plea
are possible in a fraction of that time. The average non-
- trial disposition takes between half%a'day.and four - fifths
of a day to accomplish. Because trials are so costly in terms
og court ediourcas:it is vital that the scarce trial resources
that'are available ated to4tha most serious cases.
fil.ren after allowing f' the, rise tn drugtrials; hoW-
aver, the naW'courts did not tch the productivity -- measured
in terms of the number of_cases disposed of per working day --
'of the existing City courts. If they had, te additional courts.
.wodldhave been nearly sufficient to avoid a buildup of the
backlog. But becysacasesappeared on court calendars many
,apre'times hafora they were disposed of in-the new courts cOM
pared to the existing court, even cases which did not ulti-)
mately result in a trial' took significantly more court time
than cases processed in the existing courts. . ,
In addition to the increased demand for.trials and lag-'',
ging productivity, there were several hundred cases assigned
to the new courts during 1974 which aggravated the pressure
on those courts. The Assigntent of "potential. predicate
.felony" cases gb these 'courts -- cases inn which a defendant
had a prior felonyarrest but not necessarily a prior felony,,
conviction -- increased-the workload of the new courts and
contributed to the growth of the.drug case backlog.
The.Effects of the New Laws oil the Superior Courts in Six,Upstate Counties (Section 7), .
. .. .. .
Incontrast,to the New York City situation/, the courts f.
elsewhere in the State have been generally successful in
1 4

Managing new drug cases. .The,sUccess is due in large.
measure to differences in the nature of. the drug- abuse
problem, atleaSt as it affects the criminal justice
system.
Outside the City, nearly half the cohvictiona,for
drug offenses involved marijuana in 1973. In 974, partly
be6Sose of 4ag in!procesSing.,claSs A, cases ,.1tatei mari-
juana accounted for nearly 601 ofdrug convictions -in
i'superier courts. (In the City, marijuana accounted for
only 15% of convictions in both 1973'and 1974.) In 1973,
only 35% of drug convictions upstate involved heroin or
cocaine, compared to 75% of all City convictions.
' con'sequently, the prevalence of class\A cases, most
..of which involve heroin (and to a smaller extent also. cocaine),
is Moch les-S.4state. While the class A cases in the City0
serve toinc;ease the demandor trials substantially as
described above, those pressures are ndt as great upstate.
The relative scarcity of class A cases has,-in general,
permitted the upstate counties to manage the new law drug
workload without significant increases either in their '
.backlegs;dr in the time-it takes to 'dispose of a drug case:
A Cross - County Comparison bf Court Resources (Section 8)
The fact that the City .has done-so much worse than
other counti s in coping with the new laws suggests that a
higher propo tion of the new resources could have Veen pro-.
ducfively employed in. the City.
1434

'On the other hand, when the total workload -- drug
and non-diOS Case's -- facing the'Citicourta iscom-,,
to thgtotalworkload in other counties, there
to no indication tbaethe City.has'beed short-cha ed.
This ConclUsionigi b4nedon acompariscuvof the volume. 7
of indietOebidpstea:rot-the, size bf the coPt'sys-. ,
.
tem Lid:iamb county. The finding holds even after-dif-7
ferences have been accounted for between counties in
trial rate; and in misdemeanor dispositions,taken inn
superior leoUrts. ,
Thegieet.diffiCulties which the New York City:courts
. have faced 9Ver'the years is due in part to the sheer
'size and complexity oethe City system -- there are
currently 117 Supreme courtjudgeseitting in 20,000
criminei,easeit Per Year. Solution of these basic prob-
',1ems will rageird that the development and application`"
of modern Panagement techniques, which have been started
and are suPPorted by the admiiiihtrative.judger_he sup -.
-.tP9Fted by the appropriation of suitabie,funds over a
period Of Yalu*
150

-143-
3
THE CREDIBILITY OF PHE DETElit NT(
For laws 'to become-effective detergents, they must
,..have an effect on the behaVior of would-hill offenders.
The discussion in this section deals with the potential,
deterrent power of the laWs rather than the rest nSof the
behavioral process. Changee in potential deterrence are
measured here as changes in-the objective probability of
"-punishment, that is-the arithmetical ratio of prispn sen-
tences to crimes actually committed. The first part of
this section presents estimates of the likelihood of aA
. 'prison sentence (in superior court) lollowing a felony
arrest. A subsequent part of the section discusses the
.likelihood of punishment in terms of actual. crimes on the
street.
This section does nOt.establish the, odds as perceived
by the individual criminal but the odds as measured by the
'aggregate experience of offenders in, the judicial, system:
The effect on behavior will depend on the extent to which
aggrege experience influences individual perception. It
should be kept in mind throughout the following discussion
that the objective of risk of imprisonment is not the same
as the perceived risk and may or may not have an independent
effect on criminal behavior.* Future work of the Project
will attempt to gaUge the perception of drug abuse toward
*On all this see the comprehensive work by Franklin Zimringand Gordon J._flawkins, Deterrence, The Legal Threat in CrimeControl. The University of Chicago Press, 1973.
151

risk of punishment.*
- ,
The Result{ **
-144-
Implementation of the 1973 drug laws had not resulted
in a measurableincrease in the likelihood of puniShment
for either drug or non -drug offenses by mid-1975. This result
is not surprising because even if implementation had been more
.successful, the potential for increased deterrence may be
small because the laws focus on the sentencing stage of the
criminal justice process, and few crimes reach this very last
stage in the adjudication process.
*Even the connection between perceptions of risk and behavior isnot direct. For a single individual, changes in perception do'not necessarily imply changes in behavior. For a large groupOf individuals,'changes in"behavior'are more likely to follow.changes in perceptions. It is possible that perceptions ofrisk might change without any change in the objective.likeli-hood of punishment. A successful advertising campaign maybring about this result.
7**Se 1 additional qualifications apply to this formulation.F rst, these remarks refer only to the "general deterreht"ffecti that might be expected to affdct the population andould-be offenders. The "specific deterrent" effects, result-ing-from the incarceration of individual offenders, must beexamined separately to determine how many crimes may be avoidedby incarcerating offenders. Second, this discpssion of thelikelihood of punishment does not refer to the results of thedeterrent process on the prevalence of drug abuse and crime.
`Rather, changes in the objective probability of punishmentmeasure changes in one input to the deterrent process. Trendsin drug abuse and non-drug crimes are being evaluated separate-'ly. Third, limitations in the available data restrict theMeasurement of.the true probability of punishment 'to less-than-perfect approximations (see Appendix I for a description of '
the information gaps). The most serious piece pf missing datais the frequency with which felony arrests lead to a prisonsentence in a lower court. Rates of imprisonment in the lowercourts may be affected by the new laWs if pleas are induced -inthemcourts.becaus& the defense doesn't want to risk longerprison terms which would resurt after conviction in a superiorcourt.; The fact that indictment rates in drug cases have notfallen recently suggests that this effect has not been substan-tial (see Section 5).

-145!-
The 34kelihood that a defendant arrested tor:a drug
OF 1100=4rd#.pfelony world ultimately be convicted and sen.,
teScSdtC4tison in a superior court declined during 1974
after hAv*hrincreased between 1970 and 1973.."There are
'ihdications)thSi the likelihood of a prison sentence'had
ihcreased,agaih during 1975.L',16
The finding that the risk of Punishment .(following
a 'felony arrest) was not increased holds both'in New York
City and, generally, in upstate jurisdictions. Failure
to increase the.frequency of prison sentences in drug cases
durifig 1974 can be traced to the lack of success in pro-
cessing Class A felony cases, the cases which are subject
to the most stringent restrictions on plea bargaining and
mandatory sentencing. These difficulties can, in turn,
.be attributed in large, part to arising demand for trials,
which is discussed in Sections 6 and 7. As the following
table shows, class A cases were completed in-greater number
in 1975, and contributed to the increase in the frequency.
of prison sentences.
Statewide Disposition of Class A Indictments
All Class A All Class A Number ofIndictments Dispositions Prison Sentences
1974 3,007 620 325
1975* 2,934 1,694 859
*Full year estimated on the basis of data for firstnine months.
Source: Felony Processing Report, New York StateDivision of Criminal Justice Services.
153

-146-
In New York City,. where there are a great many class
A 'easel,' these cases coSltributed moat to the buildup in
the backlog of drug cases in:the Supreme Court. Upstate,'
where there are relatively few class A cases, the few
that do occur are not sufficient to significantly raise
the overall rate at which offenders are sent to prison.
But, upstate, the disposition of.mlass A cases lagged
il.
bell b e disposition of other drug cases in the superior
courts.
Estimates of the Likelihood of Punishment*
The.likellhood that a defendant arrested for a drug
felony would. ultimately be sentenced to prison in the'
superior, courts varies between jurisdictions, but most
counties experienced increases over the 1970-1973 period
,(see Table 3 -I).
" Among the largei.jurisdictions (New York City and
*rie, Monroe, and Nassau counties); the likelihood of
receiving a prison sentence varied widely, betvieen two
percent and 16%, but patterns within jurisdictions were
fairly cleir. Erie County has consistently had the lowest
*The probability of punishment eited'here is calculated asthe composite of three intermediate probabilities: (1).thelikelihood of indictment following a felony arrest; (2) thelikelihciod of conviction following indictment (convictionto either a felony or a misdemeanor); and (3) the likelihoodthat a prison sentence will be imposed following conviction(for either a misdemeanor or a felony). These intermediate
. probabilities were examined to determine how frequently theycontributed to changes in the probability of punishment.Each of'the three intermediate probabilities contributed tof,changes in the probability of punishment in about the samenumber of cases so that in general no one of them was moretmnortant thin any other,
15

-147-
TABLE 3-I
Retie of Prison Sentences to Arrests:The Likelihood of Receiving a Prison Sentencein Superior Court After a Felony Drug Arrest
Jan.-JuneCOUNTY 1970 1971 1972 1973 1974 1975
ALBANY 0.76 3.1% 4.7% 4.4% 8.0% N.A.BROOME 0 . 4.0 8.9 16.7 7.1DOTCHESS 1.1 5.9 16.9 8.2 5.3 18.1ERIE 3.8 2.2 2.0 2.6 3.1 N.A.
NOME 8.7- 10.6 5.5 6.4 6.4 N.A.NASSAU 8.3 16:0 14.4 10.1 6.1 12.0NEW ToRx CITY 8.6 7.6 12%4 12.9 9.6 12.5
TABLE 3-II
Ratio of Prison Sentences to Arrests:The Likelihood of Receiving
in Superior Court Aftera Prison
a Non -Drug FelonySentence
Arrest
i
COUNTY 1970 1971 1972 1973 1974Jan.-June
1975
ALBANYOROOMEDUTCHESSERIE .
MONROE '
,NASSAU'NEW. YORE CITY1
4.7%7.67.77.1
12.811.38.3
'5.6%10.47.35.7
11.312.0 ,
6.9
7.4%11.511.76.411.618.48.4 .
11.1%16.113.29.4
10.323.09.3
B.O%14.39.68.3
11.216.67.7
N.A.20.9%12.5N.A,N.A.20.09.9
N.A.,m Not available
Source: New York State Division ofCriminal Justice Services
155

probAbility of punishmentHbetweentwo and four percent);
Monroe County is generally in the middle with prison7probr-
bilities of between six and eleien-percent) Nassau County
and NeW York City exhibit generally higher probabilities
of punishment. The three counties in our study with the
'smallest populations (Albany, Broome, and.Dutchess) had
too few felony drug arrests to establish a patterh. Many
of the extremes in the probability of punishment occurred
In these three counties.
Several officials from non-New York City areas remarKad
to us that they felt the 1973 drug laws were aimed at
Ourbini,the.lenient judicial policies thought to be prevalent
in-NeW York City. Our results show that for drug felony
arrests, the likelihood Of°prison sentence is just as great
2 in New York City as in the other jurisdictions. In 1974,
New York City's likelihood of.punishment was higher than
in any of the other six jurisdictions. In no year for
which We have data did New Ydrk City rank below third inV
the likelihood of prison sentence for drug. offenses.
Four of the seven jurisdictions (including New. York
City) showed decreases in the probability of punishment
for a drug felony during 1974; in a fifth (Monroe County)
there was no change; and two counties (Albany and Erie)
experienced increases (See Table:3-I). All four of the
jurisdictions for which we-have data covering the first
half of 1975 showed increases above.1974 in the likelihoOd
of a prison sentence after a felony drug arrest. It 'now
Appears tha'1974 was a year of transition to the new.,
1 5 3

laws, With a major interruption in the flow of cases
:.traceable to diffibulties in-processing class A 'cases,'
A return to more normal patterns of disposition and
'sentencing was evident in 1975.
Bbween 1970 and 1973 there was a definitetrend
toward an increase in the probability of punishment for
.nondrulifelonies. Only Monroe,County did not exhibit
this upward trend, and there the risk of a prison sentence
was virtually constant (see Table 3711).
,Since 197., Nas u County has shown the highest
probability f punishment for non-drug felonies.* Broome
COunty had'the steadiest increase in 'the probability of
puniShme t with increases from 8% in 1970 to 21% in the
first lf of 1975.
ew York'City's ranking has not been as high for
n-drug offenses as it has been for drug crimes, with
the likelihood of'punishment falling generally in the
lower tier among the counties. In contrast to its higha
ranking daring 1974 for drug 'crimes, the probability of a
prison term following a.non-drug arrest in New York City
was the lowest of any of the seven jurisdictions (about
eight. percent), but only imperceptibly lower than in1
Albany and Erie counties. Albany and Erie counties showed.
?
*But Nassau also had a .high proportion of misdemeanor convic-tions in superior court.'...See "A Cross-County Comparison ofCourt Resources,":below:
157.
-150-7
,lower. probabilities than New York City between 1970 and
1,72; but caught up with the City's rate of Punishment in
both 1973 and 1974.. .
In New York City since. 1970, drug offendersreceived:
prison sentences.more frequently than non-drug:offenders.
.
Mist the opposite is true in ch of the six counties
'outside the City. We can s 1.te that the contrast' is
due to the relatively serious nature of drug offenses
which come to the attention of the courts in the City,
offenses involving heroin where the likelihood of
non-drug criminal, activity of the defendant is.thoUght'to
be high.
.Six of the seven jurisdictions experienced a break
in the upward trend toward imprisonment in 1974, as the
likelihood of punishment for non-drug felonies declined
(MonroeCounty was again steble), However, all four
jurisdictions for which data are available for.the first
half of:1975 (New York City and three other counties)
experienced a resumption of the earlier trend, with the
City and Broome County reaching new highs.
Each of the upturns in the first half of 1975 was
accompanied by increases in the frequency with which con-
victed defendants were sentenced to prison.
15J
715l-
The'Poteniial in the New Laws for Raising the Risk to
Offenders is Limited
..Even if the new lies could have been implemented
`Apickly. without delays and higher backlogs (both of these
trends are documented do following sections), the chance
of increasing the deterrent power already present in
Mating law would be limited because of the very small.
-risk presentlyfacing' those engaged in crime.
In contrast to-the estimates of punishment probabilities'.
cited above, which use felony arrests as a base, the
discuaeion in this sub- section deals with the likelihood
of punishment following an-actual
HTypically, the number-of offenders convicted, (either
by trial or plea) in superior courts account for only 1520*.;4
of defendants arrests for felonies. The reduction. occurs
because most arrests donot'result in indictments, and a
significant' proportion of those that do lead to indictments
result-'in acquittals or dismissals 4see Chart 3-A)...
Compound this dilution in the courts with the facts
that (1) only 20* of all complaints to the police lead to'
an arrest fa typical arrest rate both in New York City and
elsewhere in the county), and that (2) citizens only report
'bale the crimes (with victims) I.liatreally occur,* andit is striking what a small number of felonies eventually
lead, to a conviction in superior court.** The .final tally
*U.S: Department" of JustiC Law Enforcement Assistance Ad-ministration, Criminal iii t ization Surveys. in the Nation's
- Five Largest Cities. (Wash ngton,D.C.: 1975),pp. 61,62.
**These figures are for non -drug felonies in New York City,where data exists fOr complaints and for criminal victimi-zations. The values might vary from place to place, butprobably not enough to change the conclusion that the riskfacing an offender is low.
15d

onliku5 Felonies
1 non-drug felonies 100%
onies reported to the police .501
Aireite for known felonies
OhdictlIents following arrest
*victims in superior, ,court:
jrison sentences after conviction
Chart /4
afigligaclgotiol.....tekaki of int ris6nment
50%
201 ;0%
251 at 2.5%
60% 2 1.5%
x
60%
4
0.9%
1.
vA1 drug felonies
Felonies reported to the Fdlic!
4 . .
rests-for known drug felonies
'dictments following. arrest
feonvictions in superior court
Prison sentences after conviction
100% 41
X "
ill 1%
X
40% n 0,4%
35% 2 CMX
60% 0.08%
x
601 2 0.05%
'' t1
Source! Estimates by the Drug. Law Evaluation Project based on 1975 data
for !Ow York City,' I IL A. 13

. .
-453-.....
comes to 1.5-2% of non-drug felonied actually committed.'
(Some felony afrests lead. td eprison term in a lower court
after the charge has been reduced to a misdemeanor, i.e. ,prior
to indictMent.! We estimate that thede prison sentences add
.roughly 0.5% to the 1.5-2% range cited here.) A comparable
figure for drufgfelonies would be much lower because so few
drug crimes are reported to the police. Use fficial
statistics on complaints to'the police of drug offenses would
Severely understate the true prevalence of drug crimes.* Laws
dealing with mandtory sentencing in the superior courts can
only operate on this two percent of crimes.
Nothing in this study addresdes the question of the deter-
rent effect of the old drug l'ew, or, for that matter, of any
other Section of the Penal Law which did not change. A very .
low risk of pdnishment may be sufficient to deter most woUld-be
offenders. The question at issue is whether the change in
risk is effective in deterring additional would-be offenders.
Changes in the risk of engaging in crime depend on changes
in what,is now a two percent likelihood of being sent to prison,
as a result of committing a crime.L
Approximately one-third of those convicted in the superior
courts of the State in 1972, 1973 and 1974 were sentenced to
prison under the old drug laws. These prison terms represent
far less than one percent of drug crimes'which are actually
committed.
* A subsequent report of the Project will examine changes inthe prevalence of heroin abuse, which with some caution, can
'1 be used as a proxy for movements in the most serious drug,crimes.
1c1

-154-*
Eliminating alltdiscretion frem the sentencing prOC6s0,
and imposing prison tetms after every.convic"tiont would
the coet.Of Conviction sUbstantially (fkom leae than a SO% .
change
chance of priaion to 1000, biit.the rialeinVolyed in com-
mitting-alcrime.would, only be,chenged frog* the one percentA ,
.ii-ia today.to two percent.,
We project that.when backlogs have Stabilized, i.e- when
Clean A disPeaitions'oCcur with ihe_same regularity as class
A indictments, approximately'.60% saperiOr court-drug
convictions will:result in prison terms. 'Under the old lame,
roughly tithird of convictions resulted in pri8on sentences.
(The Project's survey ofeentences.showed.that because class
A cases lagged during 1974, the rate of prison sentences did
not increase during the first year. the new laws were
effect.)
Oricei stability has been achieved, we expect the new drug
provis4s to have resulted in an'increaab' in the likelihood-
of punishment (the ratio of prison sentences to crimes actu-
ally committed) of one percent or less.
It is possible that even this small Change in rink will
have some effect on deterrence. For example, the change
in risk might be perceived as large because it is concen-
trated at one point in the judicial process, i.e. after
conviction. The-odds of punishment facing the relatively'
few who get that far through the system have gone up sub-
stantially. On the other hand, conviction is the point
in the process furtheSt removed from commission of the
crime. From this point of view, a given increase in the
risk of Punishment might be most effective if Concentrated
at the arrest stage rathr- than theconVicti
12
on stage.

:7-
Several.police officials, bothWithin and outside NeW .
York City,'informed us that they noted a retrenchffient of
.:street level drug dealing just before and soon after the
new laws leckmenffeCtiVe The oftkpialsattributed thisXX
caution to uncertainty among dealers over the .police response
eaMe offiCials belieVe that the re-'÷ .
trenOhment was only temporary. When dealers noticed no
Change in police behiVior). they say, 1A:sines:is picked up once
, again, althOugh it is felt that, in general, more caution-
is:exercised in street. level dealing than before the new
laws became effectiVe. (The data presented .in Chart 5-A,
which shows auniform downturn kit arrests during 1973, are
consistent with this view. SecS Section 5,)
We do not have enough.information yet to project the,
comparable changin the probability of punishment for. non-
drug crimes. Some increase is.expected'to result from
implementation of_the predicate felony provisions, but it
is not likely'to.be greater than the change we expect to
see for drug offenses.
To repeat, these conclusions refer only to the potential
in the laws for general deterrence, and not for crime pre-
vention as a result of incarceration. If their potential
as an enhanced deterrent.is as limited as suggested here,
the benefits they can have as crime control measures must
depend on incarceration effects.*
*Late in 1975, staff of the Drug Law Evaluation. Projectconducted a survey of convictions and sentences in 1974new law drug cases. Results regarding prior criminalhistory and age of defendants were compared to offendersconvictaland sentenced under the old drug laws in 1972and 1973'. The results of the survey are fully describedin Convictions and Sentences Under the 1973 New York StateDru and Sentencing Laws: Drug Offenses, A Staff memoraffarun.of the Drug Law Evaluation ProjeCET-6JCember, 1975.
1S9 -297 0 - 79 -
163

Potential: Nulaber..cf. NeW rison-Sentencs/ I
.Thsdefend
in cases which reach the uatagebetenbingle.
account tar a greater It/lough unknown) prOpor ion of the crimes
actually committed than the two percent-fige.discussed above
Thed a policy of) carceration Shouldha somewhat.N. /
greater erilfect-oeCriMe on.*etreets. .,. , 7
, 7 . -1'The two percent risk ofAmorisonment mar,be thought of
as the potentipl cost facing aVould-be offender-in committing'. 14: . ,/
7,..a girlie crime. For an -offender who commits many crimes; thec.. .
..!two percent figure is the riek hejfaces in 'committing his next
cries,: HoWever,if he were to q4mmit ten crimes he would.fade
a two percent risk of imprisonment foryeach crime, and his risk
of imprisonment is much higher than,the objective odds facing
one -time offendersr'
The relatively highYrisk of risonmentfor Multipleof-
fenders is the basis for the conteiftion that many recidivists
eventually find theMielves before the bepch. A policy of. impri-
sonment,then, haii potentially significant: effects on the inci-
dence of.crimecn-the streets simply because recidivists are
isolated froM society.
The extent of the effects of incarceration depends on
the fregilency of crimes commited by criminals and the length
of the criminal "career" in additioe:to the ,likelihood of pun
imiligent.,* These factors are being exploredby Project staff.
is.
7 .
*Sep, for example, shlomo Shinnar and Reuel Shinnar "The Effects7 of the Criminal Justice SysteMon the Control of Crime: A.7
OISintitative Approach," in Law and Society, Summer, 1975.
1 C4,
6

-157,
It is clear, though, that in the absence of reliable predictions of
.future:behaviorly offenders, there will be no increase in the
effectiveness of prison as a preventer of crime unless there is
an increase in the number of offenders in prison (or a rise in
the length of time offenders spend in prison).
We estimate that even with full4implemehtation -- once
there are proportionately as many dispositions of class A cases
an -thpreare-Ladiatments the_number of newly imposed prison -'
sentences will be surprisingly small. Based on the frequency
of prison sentences in 1974 and 1975; and on the distribution
0of case-between class A felonies and other drug cases, it is
likely that only 600 new drug felony offenders a year will face
prison sentences as a result of the new laws, once full implemen-.
tation has been achieved,.
This estimate is based on the projection that 60 of every
100drug convictions will, eventually result in a prison term.*
(In 1974, the comparable figure was 33% and in 1975 it was 46%.)
In New. York City,' because of a much higher proportion of class A. . . _
cases,,the prison rate is likely to reach 75% of all drug con-
vict-ions.
Table 3-III summarizes recent hi4tory and presents three
alternate projections for the future.
I
*Statewide in 1974 and 1975, roughly 50% of drug indictments werefor class A felonies. Fully 908 of convictions for class Afelonies resulted in a prison sentence. Only 20% of non-class
'A convictions resulted in prison terms. Therefore (.5)(.9) +(.5)(.2) = .55. The table in the text conservatively roundsupward to .60.

-158-
Table 3F111
Number of Prison Sentences Likely to Result from Full Imple-mentation of the 1973 Drug Laws
. _
Superior CourtDrug Convictions
YEAR r N.Y.S. N.Y.C.
1973 4,739 2,703
1974 -3,251 1,673
1975 3,095 1,652
Future I 3,000 1,500
Future II 3,500 1,750
Futurp III 4,000 2,000
Frequency of PrisonSentence AfterConviction
Number of PrisonSentences
N.Y.S. N.Y.C. N.Y.S N.Y.0
32.9% 41.4% 1,561 1,118
33.0% 45.6% 1,074 762
46.3% 59.0% 1,433 . 974
60.0% 75.0% 1,800 1,125
....,.....6.1,0% 75.0% 2,100 1,312
60.0% 75.0%. 2,400 1,500
---'-----Sources-:-.New-York-State,-Divi-skon-of-Crimknal-Jus-tice----------SerVices; and estimates by the Drug.LawEvaluation Projept.
1Cd

-159-
Recently, statewide drug indictments have been r'unn'ing
between 5,000. and 6,000 per year, and convictions between 3,000
and 5,000 per year. In New York City, drug indictments have
been about 3,000 a year for the last three years, and they
have led to between 1,500 and 2,000 convictions. The larger
number of convictions in 1973 is the result of cases which ori-
ginated under the City's mass arrest policy and which were still
beThqdii0osed- of
If we assume that recent indictment and conviction
rates will prevail in the near future, and that the fre-
quency
and Vof convictions in75
quency of prison sentences ri o expected levels (60%
of convictions across the St
New York City), be'tween 1,80(0 and 2,400 prison terms will
result from drug convictions statewide. Taking the midpoint
(Future II in Table 3-III) as the most likely estimate, the
2,0100 prison sentences in statewide drug cases represents an
increase of only 600 sentences above the 1,561 sentences under
the old laws in 1973.
Direct costs of the new courts and associated personnel
furnished to implement the 1973 laws are currently running
at $40 million a year.- Since mid-,1975 those courts have handled
both new law and other cases*, and their value must be put in
terms broader than the number of prison sentences they produce.
*See Section 6.
1

-160-
But as a crude gauge of theirvue, assume their existence
411/
results another 400 prison sentences a year statewide, above
the 600 sentences they might produce in drug cases. The
$40 million expenditure* would then,result in 1,000 new prison
sentences (which would not have occurred under the old laws),
or an extraordinary cost of $40,000 for each new prison sentence.
Tothe extent that offenders are likely to be responsible for
numerous crimes, the cost per crime avoid or postponed by
incarceration is reduced. The higher the recidivism rate, and
the more crimes committed by offenders, the greater are the
benefits of incarceration, for a given cost.
This reference to the cost of additional prison sentences is
not meant to imply that prisonsentences are the only product
of the courts. If the new courts furnished to implement the
1973 laws also produced dispositions in non-new law cases which
would not have been produced in their absence, they would be
contributing to a reduction in the overall backlog of the courts,
and generate another benefit to be weighed against the costs of
implementation. The courts furnished to deal with the new laws
do produce some dispositi ns in non-new law cases. However,
the 1973 laws are not in thems ves expected to have an impact
on total dispositions while they we intended to result in
additional prison terms.
*The estimate is crude because the $40 million includes the costof that portion of the newly furnished resources which aredevoted to non-new law cases.
I c

-1617
4
SPEED OF JUSTICE
The speed with which i dictments are processed is
an issue of central import nce in evaluating the impact
of the new drug laws on the administration of justice.
Changes in the age of cases in the criminal justice
system serve as one measurement of the ability of the
courts to efficiently handle the change in workload
caused by new law Cases. In addition, while there ;s
no empirical evidence we know of that correlates the
speed of.disposition with effective and credible deterrence,
that relationship is intuitively attractive and is
*
often mentioned in the literature.
.Although the present data are not conclusive, they
do suggest thab the length of time required to'process
a drug indictment in upstate counties has not been ser-
iously affected by the new drug and sentencing laws.
However, drug cases in New York City do seemdto be facing
considerably longer delays than was the rule prior to
the implementation of the new laws. These judgments are
based on an analysis of the change in backlog in the
*See, for example, Herbert L. Packer, The Limits of the
Criminal. Sanction. Stanford University Press, 1973, p. 159;and The President's Commission on Law Enforcement and Admin-istration of Justice, Task'Force on the Administration of
Justice, Task Force Report: The Courts. U.S. GovernmentPrinting Office, 1967, pp. 80-91.
a
169

-162-
superior courts of the State, and the length of time
between indictment and disposition for cases which were
actually disposed of.
The New York City Supreme Courts experienced a steady
increase in the backlog of new law drug indictments froM
the time;:the laws were passed through the fall of 1975.
By the ehd of December, 1975, 2,500 newlaw drug'cases
were pending in the New York City Supreme Courts. %his
backlog amounted to the equivalent of ten months worth of
drug indictments.
An increase in'the backlog would not in itself be a
cause for alarm if resources could be expanded enough
to hold delays constant. ''For example, if the, pending
caseload rose by 1,000 cases, but new court personnel
were available to process those cases in a reasonable
amount of time, the delay between indictment and dispositi011
might not change at all.
There is ho indication, howevef, that the additional
resources furnished in New York City were sufficient to
avoid a rise in court delays. During the first two years
under the new drug laws, the time it took to dispose of
*The length of time that disposed cases had been pendingin the superior courts does not give a true indication ofthe actual court delay. For example, if only cases thatare easy to process are disposed of, the time to disposit041for those cases might be quite low. However, the age ofthe cases awaiting disposition might be going up at thesame time. In order to judge the true direction of chang0in the speed of justice, we Would need to know the age ofpending cases as well as of disposed cases. Unfortunately/only data on the latter are available.

new law drug cases increased steadily, from an average
of roughly six month in the third quarter of 1974 to
eight months in the third quarter of 1975.
The combination of increasing backlogs and increasing
age of cases which did complete the process is evidence0
that the age of the pending caseload had increased as
well in New York City-. No accurate estimate can be made
of the extent of the increase, but an increase of about
45 days in the median age of the pending caselbad would
not be inconsistent with the available data.
In upstate counties, there was an,unavoidable increase
in the pending new law drug caseload during 1974. There
isnalways some minimum time required to process a case,
and as there were virtually no new law cases pending before
1974, some growth of the pending caseload was inevitable.
However, in contrast to the New York City experience,
the backlog of new law indictments upstate stabilized
during 1975. In these counties, the median time to dia,-
poiitfon is betiWea-9Trand r70-dayS7CtMpared-to-the-City!-
.240 days, and has not changed since the last quarter of
1974. It appears, therefore, that upstate areas have been
able to stabilize the disposition process for drug cases
at half the time it takes to dispose of new-jaw cases in
The calculation assumes a first-in,first-out processingsystem and an even flow of.indictments. In 1973"iithe ,median age of disposed cases was 150 days, fromwhich weassume that the median age of pending cases was 75 days.Corresponding figures for the first three quarters of1975 were 245 days for disposed cases, and 122 days forpending cases. The difference is 122 minus 75, or 47 days.
171

-164-
the City. The stability in both the size of the backlog
and in the time it has taken to process cases in the
past implies that there has also been stability in the
age of the pending caseload.
We think that a large part of the increase in court0
delays in the City can be attributed to the plea bargain-
ing and sentencing restrictions imposed by the new drug
laws. The causality is somewhat ambiguous becadse there
is,no pre-law non-drug information available to compare
to non-drug data for 1974 and 1975. Without such infor-
mation, we Ao not know for certain that the rise in
drug case delays are not matched by greater delays in
non-drug cases.
The best evidence for attributing the rising ,delays to
new drug cases is that it is the prevalence of class A
felony cases which seems to make the difference between
success and failure in coping with the new laws. The
high proportion of class A felony indictments Pending
is'evidence-that class-A cases - have
been much more difficult to process than other drug cases.
Class A cases comprise over 90% of the pending new law
caseload in New York City, a higher percentage than their
share of indictments (75%).
Latest available data show that half the class A
felonies are ever eight months old at time of disposition,
but other new, law drug cases are only about five months
old. Since the backlog of drug cases in New York City
1

-1657
is dominated by .A felonies and these cases have already
been awaiting disposition longer than other cases, the
processing time of the new drug cases is likely to increase
for some time to come.
The relative speed with which new law cases are pro-
cessed in upstate counties is partly attributable to a
lower percentage of class A felonies than is evident in
the City. As the data for the City indicated, disposition
data for upstate show That class A-TaLbEies tend-fa-have
been in the courts about two months longer than less
serious drug indictments. However, both class A felonies
and other new drug cases appear to be processed more
quickly in upstate counties, with times to disposition
running between two and three months'less than in the City.
Unless there is an increase in the frequehcy of class A
cases outside the City, processing times'should remain
in the three to four month range.
1 d

-166-
5
ENFORCEMENT POLICIES
The reclassification of most narcotic drug crimes
to high degree-felonies gave police departments across
the State the opportunity to reassess their drug enforce-
ment policies. From the point of view of imposing
punishment on drug offenders, the new laws were potentially
signifiSant. In particular, successful prosecution oft
narcotic drug felonies promised a high,likelihood of 'a
prison sentence for the offender. The reclas4fication
of low level narcotic offenses into a class which contains
the State's most serious crimes (the class A felony) suggests
that the Governor and Legislature regarded these offenses
with special concern, and that they expected police officials
"t0 make control.of these crimes a high priority.
However, our discussions' with law enforcement officials
ughout New York State have. failed to identify policy
changes that took place In response to the new drug laws.
The only explicit decisions were to maintain the enforcement
strategies in effect pridr to ,the.pnssage of the laws.
New York City
In 1968, the New York City Police Department imple-
mented a 'policy very similar to the one implied by the
new drug laws,. Large numbers of low level drug arrests
were encouraged, and the number of felony drug arrests
increased more than three-fold, from 7,199 in 1967 to

26,799 in 1970. About three quarters of the arrests
involvecilheroin. -
After two years of very high numbers of arrests--
drug feloniesaccOunted for 29% of the City's felony
arrests in 1970 compared to 12% in 1968-- a re-evaluation
offiliuti enforcement policy was undertaken by Police
Commissioner Patrick,.Murphy. The re-evalution concluded
that only a small proportion of arrests resulted in a
prison sentence, and that the harassment value of.the
/-arrests was not great enough to have a visible effect oril
the size of the drug market. In early 1971, explicit
revisions to enforcement policy were made, changing the
emphasis from large numbers of low level arrests. to
"quality" arrests, i.e. arrests which, it was hoped, would.
lead to the prosecution of largescale drug dealers. Signif-
icant, too, was the centralization of drug enforcement in
a citywide Narcotics Division. In the three years following
adoption of this new policy, drug arrests declined to 'a
level equal to the one observed in 1968. Almost all of
the decline can be accounted -for Jay_a-decreasg, injlerqiP --
arrests.
The emphapis on drug distribution, rather than on
street-level activity, was silk,in effect when the new
*drug laws were enacted. According to Donald Cawley, Police
Commissioner at the time that the new laws became effective,
:a decision was made not to change the established enforce-
ment strategies. The roughly equal division of enforcement
173144

-168
resources between low, middle and igh leVels Of the
market, which was a rule of thumb under the Murphy
policy, was to be maintained.
This decision was based on two overriding concerns:
First, the belief remained that the arrest of large
numbers of low level violators could not have ahy,reel
impact on drug trafficking, even if those now arrested
faced long prison terms. Second, it was feared that
increasing the number of drug arrests under the new laws
------would--create--into-lezable' delays in procesairig-,castes__O---
the courts.
The reluctance of the New YorkCity Polies DepartMent
to return to a policy of sweeping the streets of low level
narcotics violators is evident from arrest statistics.
During 1974, there was virtually no charige in the number
of individuals arrested for felony drug ctl.Me6 beyond the
1973 level. It is widely recognized by Departmental per
sonnel that, in terms of raw numbers, the arrest a
could be increased substantially at any time.
Similarly, the proportion of drug felony arrests involving
heroin remained constant at about half of all drug arrests, ,
indicating that enforcement activity did not change from
other drug activity to narcotic crimes. In ad4.i.tioo,
the proportion of class A felony arrests accounted for
by low level sales of narcotics (class A-II/ felonies)
has not increased since implementation of the laws. An
increase in this proportion would have indicated a possible
ity
4 0

-169-
movement toward lower level narcotic arrests.!vs,
,In retrospect, it appears that the Department's
judgement, at least as far as .the courts are concernede
was correct. The analysis in Section 6 suggests that
largescale arrests of street level drug, abusers would
undoubtedly have led to even more delays than have
already been experienced. On the other hand, the value LT.
of street level enforcement on an intensive shale is
still an open question. One argument against upper
level narcotics enforcement is thait if it is successful
in reducing the supply of drugs, the price of drugs
increase. If there is a direct causal relationship'1.
between price and crime -- the addict who must have his
fix no matter what thee -- then street crime will
rise as a result, as the addict plunders to raise more
cash. The other side of the same argument is equdllY
valid but seldom heard: if a direct relationship between
price of'drugs and crime is observed, then one way to
lower price is.to reduce demand by removing many users --
from the market through street level enforcement. Of
course, these arguments are simplifications. No credible
argument can be made that the demand for drugs'is totally
inelastic, n'r are the choices between "high" and "low"
level enforcement very clear. Research currently underway
by others into the elasticity of demand for heroin should
I

-170-
eventually provide some clues to the likely outcomefof
narcotic enforcement policies on non-drug crime.*.
One powerful argument for street level enforcetent
should not be overlooked. Failure of the police to
respond to obvious street level drug' dealing -- and;it-
is obvious and widespread in Harlem, for exampqe-)74y
lead to high levelsof cynicism abou
the affected, community, where po ce ns are
tenuous.**f",
-But effective eLreet-leVel enforceme of the drug
laws'is extremely expensive. In Ne ork City, several;
police precincts operate narcotics sq(jiads, madeup43t.a
group 'ofuniformed officers, to observe street-level'grug
activity and to make arrests whlrillatand Up PQiirt.
That is, theevidence against the-buyer andeeller
drugs must be obtained in 'a legal -MemnerSand shoAds u
up to the scrutiny,of, the. court:, Typically, .a Accp
squad operates with four men at a. time, including a ser-a.
geant or other officer.
°Because 'of the_. care tit444e btaining evideppe7 (for'1)
example by photographing the exchange of drugs. for cash),
it might take a four man squad as lopg as a f44,tour of
duty to make one or two street level arrests'. That amounts
to nearly a full man-week of effort, and this despite the
*Levine, Daniel; Silverman, Lester; Spruill, Nancy. UrbanCrime and Heroin Availability. Public Research InstituteReport PR/75-1. April 1975.: -
**James Q. Wilson presents another sensible argument inThinking About Crime, Basic Book, Inc., NTY., 1875, p. 148.Wilson points out that high. level dealers are easily re-plmced in m dIbtribotIon organization.
ease-of finding an open, active drug market.
Additionfilly, officerpend a deal,of time in
court. Inithe Central Harlem Precinct, which produces more
drug arrests khan any other precinct in the City, the
officers assigned to the narcotics squad spent more man-.
days(in.coUrt during a four Month period in mid-1974 than they4)
spent:onpatr61.
A'jdgement onlihether or not such a commitpent of
resource 'to street-level enfoicement:is justitkedois
;
i' -,well bey nd the scopq, of this Project. An assessment of
1.,
that kind, would have'to be based on an evaluatiion of the-, ..
r
alternative upes of police resources, and would lead
quickly irlto'an examination of Ciime control strategies
4 general. But the extreme cost pf drug law enforcement
. -is often'not:realized, and only when the full'costii are
considered'can,reasonable-d:oisions be Made on the alloca-.
tion of enforcement to narcotics crime.'
A Widesptead concern within-the Department with avoiding
Police corruption may lsn have been 'a factor inhibiting
an'aggresive feurn to low level narcotics enforcement;
Drug law enfOrcement.is knowm as one of the seedier police
Activities, ancrone which"has often been associated with
:extensive corruption. According tOltone report, more than ,
half of the 90 detectives Mssigned to "'now disbandqd
.Special .Investigations Unit have been indicted by Federal4 -
or 'Stilts grand loaries.*:
Yorig Tlmei, September 19, 1975..
17U
r.
a.

-172-
Outside the Narcotics Divisiee!nereos 14w enforce-.
ment appears to be an undesiiable'asi,911MO° t°t police
officers. Even in precincts wheye qr09 c0-111e& 4re a vlsy
serious problem, the narcotics seqs described above
are operated only when a superioy iS OIrdiaable to
.,accompany the other members of the hq0eq jn a s1.1Pervis°rY
capacity. If a sergeant or othey c'tO'c%r is 00t available
on 'a given date, the squadembeye qo't patrol that day.
Narcotics arrests by uniformed cifO'Se nOt eOsignedsPeci.L
fiCally to.narcotics squads are 080Oreged, tven members
ofthe precinct anti -crime teams, Pla3.°OlOthe0 Officers
. who work as de ys to catch peilOrqta,r%, ete'stronglY
....disc raged fro making narcotiey arrests, TPe anti-crime
squ s are the most productive Qa the force Ao Ear as
fel ny arreAs and convictions ae ooPevfied. in 1975,
precinct anti - crime squads compri0e1 Aercent
of the patrol force, but were reof°11s11er 14% of the
felony arrests in the city, merilpOz'sOf the anti -crime
squad's, however, are forbidden to 1114k° harotj..°S arrests
in the absence-of a superior ear that they
will he accused of-aorruption.
Thus there were three factoW laP3o1Y ieered at the
time the laws were enacted, whifh Qherete4(egaiest Changes
in drug enforcement patterns by tine New York City police
'Department. They weilieU 1) the 1964,-;10 eXpeyieeee with
183

-173-
vry large numbers of arrests, which the department found
'did not produce an adequate number of convictions and
sentences; 2) the very high cost in terms of manpower of
'enforcing thedrug laws at the. street level; and'3 the
undesirability of involvement by the police officers
themselves in narcotics law enforcement.
WhateVer the optimum mix of enforcement activities
might be, the Department's emphasis on middle and upper
level traffickers has led to many arrests.of offenders
involVed at levels of the drug market above the street
level. Buys made by undercover agents generally increased
in value during 1914, with about ten percent of the heroin
buys involving one:ounce ormore. Each of these operations
resulted in an arrest for a class A-I felony. These
investigations have also led to many indictments. More
than half the class A felony drug arrests and indictments
are for class A-I and A-II offenses. There have been as
-many indictments for A:-IAcrimes as there have been for
A-III crimes (the lowest class' whiCh carries mandatory
"lifetime" sentences), Most of the defendants indicted for
class A-I and A =II offenses, however, have been allowed.:
to plead to lower charges within the class A category and
haVe not, as agroup, been more likely to receive long
sentences than defendants-indicted on class AIII charges.*
Narcotics prosecutors in the Bronx, Brosoklyn, and
Mahhattanall'stressed tlAp when lower level pleas are
allowed torclass A-Land A-II indictments, they would
*See,page 54, second paragraph.
1s1

-174- -
insist upon sentences longer than_the,minimum. The data .
does not iupport this contention. _
Judge Michael Pontzin, who recently assumed responsi-
bility.for the administration of theManhattan drug courts,*
was not surprised at the high proportion of short minimum
sentences in these cases. He feels it iS attributable in
large measure to the low quality of the A-I cases. That is.,
prosecutors who are reluctant to bring an A-I cape to
trial because of a high riskqcf acquittal will often
accept a lower plea even with low minimum sentence.0
second factor accounting for the 16w minimum sentences
in some cases is that the offender has provided.agetWr-----7
information to*the prosecutor in return for a rec9ipenda-
tion of a light sentence.
e
Counties Outsids_New York .City-
Large-scale increases in enforcement effort at the
street level outside New York City were unlikely to occur.
There are no open drug markets in upstate counties similar
to those thriving in several New York City communities.
Police officials have pointed to the closed nature,of the
hard drug market, and the need to infiltrate these markets
with undercover agents if enforcement is to be successful:
In addition, the nature of the drug problem is entirely
different in areas where heroin markets are not widespread.
In most counties, more than half the felony drug arrests
involve marijuana, penalties for which were net changed
by-the 1973 laws. Arrests for abuse of other drugs are
-175-
rare, and'normIlly,-result fr.= complaints received by
the police.
A category.
Very few of these arrests are in the class
It is not surprising, then, that there was no
notable reallocation of police resources within drug
enforcement activities. Neither have we discovered any
increase in personnel assigned to drug enforcement, either
in-local police departments or by the State Police.
The absence of policy changes did not prevent 1974
from becoming a year of widespread increases in the
number. of felony drug arrests. Chart 5-A exhibits both
drug and non-drug arrest data for the six upstate counties
examined in this Report., ,Tea'r7to-year changes are
sUrpriiingly similar between counties. Five of the six
Counties saw declines in drug arrests during 1973, and
all six Showed'Ancreased activities in drag arrests during
1974. .
Note that patterns of non-drug arrests were Much the
same as the pattern for drug arrests. All six counties
saw reductions in non-drug arrests during 1973, and increases
during 1974. Last yaar, non-drug arrests continued to rise
in all six counties, while drug arrests fell in five of
the six.
Suchaimilarity in changes from year to year suggest
some common causality. -If one'exists,,um do not yet know
what it is. The possibility that patterns of drug arrests
are good. indicators of actual drug abuse will be examined
4
183

0
z
1,000
750
500
Chart 5-A
reAr s
ALBANY
-----
rnOn-drIAg
800
600
400
200
2,500
1,500
1,000
500
'71
DUTCHES5
.12 '74
...,..4%,.
\ /
50
40
20
10
'
"'4,00
3,00
2,00
1,00
4111011011111'7 1
MONROE
.1 7 '74
/ /.i ., \.-. %... t/..,. .
-- ,..--7
*
9,00
3,00
2,00
"1,00
BROONZ
'71 '72 '7 3 '7 4
ERIE
,7 1 '7.2 '73 '74
*Full year c5tiMated °11 thebqsis of NIt'tial (iota.
Source: New York State Divisionof Criminal Justice-Ser.

-177-
as tart of the Project's analysis of recent trends in drug
Abuse.
One effect that the high level of 1974 arrest activity
did have was to increase the number of drug indictments'
in the superior courts. These changes are described in''
Section 7:
. Informants
The consensus among law enforcement officials ac?oss
the State is that the new drug laws have enhanced their'
.ability to develop. informants.
Drug enforcement relies heavily on informants for
information about traffic movements; for identification
of local sellers and' users,.and for the introduction o
undercover agents into the drug market.
When the new laws were first under discussion the
fear was expressed by police officials that.restrictions
on the ability of prosecutors to offer pleas and "acceptable"
Sentences would hinder their ability to entice offenders
into cooperation.. 'Our disClussions with police and district
attorney personnel suggest that the offenders' fear of long
'prison sentences has outweighed the restrictions placed-
of bargaining. The net result has been an increase in
the activity of informants. A
The 1973 drug laws contain one exception to otherwise
mandatory prison sentences required after conviction.for
4 class A drug crime. Offenders who have provided useful
information to the prosecution may, be sentenced to terms
183

7178-
of lifetime probation (no prison) if such a sentence is
recommended by the prodecutor. (All such sentences must
be reviewed by an administrative jUdge.) This provisicin
together with the latitude which still.exists'in
minimum prison term set by the court in "lifetime" sen-
tence, provides some measure of-sentencing discretion.*
In addition, defendants indicted for class A-I and A%I
offenses are still allowed to plead. down to A-III crimes.
Frank Rogers, who was the Special Narcotics Prosecutor
in New York City when the 1973 laws were enacted, told us
that several high level informants had come forward, who,
Rogers felt, would not have cooperated had they not faced
such long prison.terms. Rogers believed these dealers
reasoned that only Zpoperation with the prosecutor would
get them legs than the maximum prison sentence when even
the lowest level street dealers were being sent to pri7son
for "life".
Lower level offenders have also been anxious to inform,
officials say, because they hope prosecutors will recommend
short minimum sentences -- which is common practice among
district attorneys -- and because they hope to take advan-
. tage of the lifetime probation.sehtences.
*The minimum prison term in A-III cases is between 1 and 81/3years;.in A-II cases between 6 and 81/3 years; and in A-Icases between 15 to 25 years. Defendants must serve the
.minimum term set by the court. Aftet serving the minimum,the Board of Parole determines when:the offender is to bereleased frOm prison. But even after release, the offenderwill remain on parole for the rest of his life.
fa
1

We examined length of the
class A-III-cases during 104
prison sentences, 170, or 601
pinimum of one year. Another
mplmam pilann term given in
(9.29::110 5-1) Of the 260
ilitried the lowest allowable
154i carried minimums of over
three years. In order to see it there Was any advantage
&r a guilty defendant pleading 14stedd ?f going to trial,
we compared minimum terms ie ecolqctleil0 which resulted
from trial and convictions Which ewe 110 a result of a plea.
We found that outside New yolk city defendants pleading
guilty to an A-III felony (in 1974) geuerelly received
sentences with lower minimum teens Oath defendants convicted
after trial. Almost 750 of these def,eUdeats pleading to
an A-Ill felony and sentenced to Dtiaeh fe.ceived the lowest
permissable minimum term (ova Wr) and Oct one defendant
in the Project's sample was eehteneed to a minimum longer
than three years. In contrast, Only about 308 of the defen-
dants convicted after trial CeeePied °ne year minimum
term, and over half were sentenced to rtlitlifiume of longer
than three years. However,A41 NeW yorlt City
rcedsignificant difference between tile. length cf. ser154
by defendants pleading gUilti 4nd those CCnvicte
trial. About 65% of the defOnqatIts in both grouPsreCeived
the minimum tart of one.year4 dnd 150 received minimum terms
-of"three year or more.
*Drug Law Evaluation Project kalaOrvey of drug convictionsand sentences throurpoWthe Statfl,
.1

TABLE 5.1
Prison Sentences Issued to Defendants Convicted
o C ass AII Drug eon es in
.Newlork C4y Rest cf_State t
Minimum Length DfipoSed of Dispose of Disposed of ,Disposed of Dispose o
ofiTrison -Sentence by Plea* by Trial* 1 by Plea ** by Trial** by Plea by rial..........
a
'tne'lriat 69% ' 61% 73%
More 'than one yeari
up to three' years 19% 22% 271 16% 21% 19%ti
More than three years, 121 17% 0% " 52%., 8% 33%
H
32% 71149%
J
CO
a
Total 1601 100% 100%. 100% 100% 1001
Number of Defendants
Sentenced to Prison 126 39 61 . 31 187 70
V
Differences in length of sentence between plead and tried cases are not statistically significant'
**Differences in length of sentence are statistically significant
Source; Drug Law Evaluation Project Survey

Offenders upstate therefore seem to have a grdater incen-
tiVe to plead guilty than offenders in New York City. Con-
Versely, in the City it makes sense for a defendant to demand
atrial because he has nothing to lose in terms of probable
prigon sentdbce. .
Evidence is that the probation alt ative has been
used extensively in some counties. In suburban New York.
City counties, 25% of all class A-III offenders were sen-
tenced to probation in the first nine months of 1975. This
might well account for the flood of informants in Nassau
County. According to officials in the District Attorney's
li
office, who keep a count of informants,: twice the n er
of drug Offenders chose.to cooperate in 1974 than i - 973.
In the City, 15% of A-III offenders were sentenced to life-
time probation, butup to half of these were sentenced
under the Youthful Offender prov4sions of New York Sate
Law.* There is no requirement that a defendant provide
information to the prosecution to be eligible for Youthful
Offender treatment, as is required for lifetime probation.
Upstate, only ten pe4pent of,A-III offenders escaped a
prison sentence.
1
*Until August, 1975, tRe treatment of class A drug offendersas youthful offenders.wdS only available in the First Judi-cial Department (Manhattan and Bronx counties). At that,time, an amendment to State law made class A-III felonseligible for-youthful offender treatment throughout the State.
o
189

-182-
There is'some evidence that the lifetime probation
sentences are favoring younger offenders. In 1974, 13
of the 25 probation sentences in class,A-III cases went
to offenders 21 years old'and under. This was about
twice -the youths' share of all class A-III convictions.
At least One prosecutor does not agree that the pro-
bation alternative has been helpful. The Chief of the
Narcotics Bureau for the Bronx District Attorney believes
that a lifetimeof probation is not a realistic option
for many offenderg because they, don't Ilave legitimate
alternatives to further flevolvement in crime. Thus.,'
these offenders would constantly be in violation'of pro-
bation and subject to: prison. on that score. This official
thinks that on balance, the new laws have restrained him
from being able to make fruitful deals with informants.
FinallYgdefendants and district attorneys are taking
advantage of the limited plea bargaining which is stillf
allowable, and this undoubtedly helps in developing inforr,
malts. Theoretically, so one indicted for a class A-M
felopy, which carries a'min um prison term of between
'15 and 25 years, could plead to a class'A-III crime, and
receive the lowest 'minimum of one year. He might even
be recommended for the probation sentencAecussed above.
Such latitude; though not as'great as thht which existed
under the old laws, has apparently enabled prosecutors
to offer "acceptable" pleas gl exchange for 'information.GO
1 9 0'7

-183-
According-to statewide data for 1974 and 1975, only
201 of the conViCtione,resulting from cIass1A-I and A-II
indictments were to the highest Chaige covered by the,
indictment. All the other convictions came to lower
:.charges, about half of which were class A-III felonies.
These, convictions came as the result of pleas.
We were-surprised' to find that in 1974'(no later.data
is yet available) defendants who plead 'guilty to a class
A-/II offense after having beep indicted for a class A-I'
Or A-II crime were just as likely to receive the minimum
prison term of one year as defendants originally indicted
for'a Claps A-III crime., Two-thirds of all sentences in
class A-/II cases carried the minimum penalty.
Indictment Policies
We have not found a general tendency to reduce the
frequepcyof,indictments in felony:,drug cases, either in
New York City or elliewhere(see Charts 5-B and 5-C)
All the procedural restrictions imposed by the 1973
laws are placed on st7indictment adjudication pro-
cess. There is noting in the laws which prohibits bar-
gaining with a defendant before his caseis presented to
a grand julT If- the post-indictment restrictions were
viewed as particularly burdensome by prosecutors, one
response might be to choose against seeking indictments
in cases for which indictments were previously requested
routinely. On the other hand, one expects a natural reluc-
tance of pFoscutors to use this "loophole", particularly
191

se.
-184-
Ibecause the restrict#ms were imposed with, great fan
The data presented in Tables 5-B and 5-C suggest
stronglythat indiCtment policies have not changed.* In
New York City, the most serious cases (class A cases)
are indicted at a higher rate than other new law cases.
A significant change in indictment policy has
occurred in New York City during the past months, however.
The.Special NarcoticsProsecutor is suggesting that mis-
,demeanorpleas be offered in certain class A-III cases'pro-
vided prison sentences of six months-ir more are given. In
addition, discretion is being advised in seeking indictments
in some class C cases involving possession of heroin and
cocaine. This change toward a lenient indictment policy
indicateS that a downturn in the indictment rates should.
be expected in the near fut,pr4k
*The steady'decline in the rate of indictment in Nassau County
began before the new laws became effective. Even with a
five year decline, Nassau still indicts alarger proportion
of, felony drIdg cases than anyof the other counties. This
fact may be'related to the very high rate of misdefflea
convictioAs in the Nassau superior courts (Sed Sectibn10.

"PERCENT OF
FELONY ARRESTS
75%
en 4th. C Fel n Arrests Result in
....... (class A, drug cases)....411
I.4
(all drug, cases)
1970 1971 1,972 1973 1974 Jan.-Zune1975
Sources; New York,State Div. sign of Criminal Justice Services;New York City Police Department Monthly_ Statistical Reorr;'
,
193

4.)
ay+
O'=2.>1
0
a.11.4
.
or.
Chart 5 =C
Drug ,Indictments 'Z# a Percent of Felony brug Arresta
Albany"
3/ \
204.. / \
10/
40
i
20
70 :71 72.4 . 73 74 75, .
5'
butchess
'A
'//
60
15
-/^/ .\,\ Broom?
/-,1.--/,.. .. -, ....'N
4Q
3Q
2,0
'70 71 72 73 74.*, 75
Erie
70 a 71 72 _73 71 75 72 .174
70 .71
Sourcak-New Yokk
4
73 74 75
sateTliivision'of Criminal Jpstice Services
I t".)
1.1 . 5X
i H6
iiTHE)EIPPECTS OP THE NEW I,AWSDN. THE taw YORK CITY SUPREME COURTS
':'Before describing the.recent:perfotmance of the Nei4 Ydrk
'"City superior cOurts;e few words ebOUt-tbeforganiietion and0.this remarkable growth of i,he:City!s Court eystgm are in order:
Rapid expension has added.to the difficnit job -'of managing
this very large and coMplex'institution.
The City's:Superior-criminal :Court the Criminal/
Term of the'Supreme COprt is centralli.administeedj, but
is divided jurisdictionally into five eeparate,counties
prosecution in S'abh of bhe county branches:of the Stipreme_ .
Court' is, the reapohaibility of the' District,Attornay, who
is separately,elected ineach coitinty.
The system itaelf his grown enOrmodsli since'19121h the
beginningof that year there'were 50 cpurtroomsAknovin
"parts") operating fit:the' CitY'.as the regular operation of
the Court. The first Siieableexpansion: occurred during 1972
wittylthe inCeptipn of the federalWiunded SpeCial Nitrcotics
Court Prbgram (SNCP). The SNCP added 12 new parts:to the
system duringi1972. and all 12 are still inopera-
tion t7An Manhattan, 2 in Brooklyn.;,,2 in the Bronx andLl
in Queens). %nder the SNCP a Special.AssOtarit Milistrict.
Attosikey, for Narcotics prOsecutidn'is appointed by,agreement
f the City's five distrlct attorneys and is responsible for'
rosecution of about, half of the City's drut cases. 7Iin 1972, the/City and State combined to Lihance
-§,
the ition of 13 new' parts under the Emergency Felony Case
... ' /
. 259-287 0 - 78 13
/
*O.

ProceisingfrOgraM (EFCP). :Theseliarts became a, portion of
the-syStarei-Iregular organizatfon, aneWereintended fOr
geSerai,pUrpose ofredUCking:backlogs. which had grown
substantially between,1910 and I974($eelable
An additional tr.:parts were :furniShed.Uader EFCP in 1973.
Finaily in late1973,nd 197.4,as a direct result of
the 1973 :drug and sentencing laWS, 31.additiOnal parts were
added.to the City's.Supreme dburt:system. The formal name-.,
for these.parts is the Emergency Dangeroug Drug Control-Pro-
gram,(BETICP). Nine of the parts.Were established in Man7.
hattan and were combined organI2itionally with the seven'
parts created earlier under the,SNCP. Brooklyn received 11
;of thelew'partsw the Bronx received eight,' ead.three...of.
/ the new parts were assigned -to Queens..
,Thus, by a'seried of steps, thealready large criminal'
term if the New York. City SuPreme &Arts more than doubled
in size over the short peri -d of three. years,. Currently,
_file -system operates with a complement of 117. full -time
criminal term parts.,.
',.
-\. For the purpose of processing cases, the Supreme Court
is organized into a three tier system which distinguishes.
.t.it from the "individual calendar" (or IC) system prevalent
in ahy.:Upstatecounti4. Under an IC system ofoourt organr-
.1 AatiA, orie.34-dge follows a case from beginnihg to end. In.J
. , ..
,5rIthe New York, City Scheme, howeyer; arrai nmetts'are handled
J .t '
a4speciallzedpart or parts,in each county, and cases' K.
n assigned, to pre-trial.conference parta 1- all-purpose
parts =.-- where they remain until Uhey,are ready for.trial.

The Changing Backlog'in the New.YorACity SupremeClots (Drug and Other Cases Combined)
YEAR
1970.:
197.1x
1972
1973
1974
1975
Source:
. Indictments
20,001 -
,308
114*
22,458 *
20,686
19,720 ".
Dis sit onaChange inBacklog
17,463 +2,538
21,281 +6,027. .
21,873 +5,241.
24,630' -2,172.-
19,685 +1,081
_ 21,938 -2,218
*Data on indictments not available. Numberof arraignments used here.
Management Planning Unit, Office'of CourtAdministration, New.York State.' Derived.front JC-153 forms.

-190-
Trials generally take place in specialiied trial parts.
. Each ofithe four large. coirkes contains one411,
or two.arraign -
ment parts* and varying numbers of confetence and trial- arts.
Individual'cases and justices are assigned to partalar parts.
In an IC systemicaseS are assigned to individual justices.
lAssignmeAs of justices to spe fic parts may be Changed.
monthly, b4t. th;y often-remain the.same for months at 'A.
time.
There is sonlspeCializ.4ion amogiparts with respecA t
to the kind4 of cases which are assigned to them. The 12.
parts created and federally funded under
CourtProgram handle drug cases exclusivel
Special'Marcotics
The parts
elated through the Emergency Dangerous Drug Control Program)
handleld drug and predicate felony cages, almost exclusively until
recently wheiiithey began to take on other cases.;***'Some
_counties have established parts tp specialize in homicide
cases, or other major felony offenses.e
The Court's expansion between 1972 and 1975 took place
at a time when indictments had been declining from a peak
;Peached in 1971, and has contributed to the success of the
criminal terM in'achieving a balance between dispositioris
and indictments in non.-drug cases, so that the tremendous
growth cf backleig'experenced.in the 1970-1972 period has
stopped and has begun to be ,feversed (See Table 6 -I). The.
reversal has been noteworthy because the trial rate'had
* Manhattan and Bronx counties have two arraignment parts' each,while Kings and Queens Counties have one arraignment part each.
** See p. 80 for some additional detail.

. -.191-
...almost doubled between1973.and..1975. Zlials absorhmuch
' more court time than othei,,dispoeitio "anNhus"are
ticularly expensive ,to "the systeM. O r estimates indicat
that every time the cityWide trial ret :increases byone
,percentage point llor drug and Other cases combined); nine
:additional fulle.time curt parts would be required annually
to keep the number of dispositions- constant, Although th
backlog of-non-drug cases. in New York City stdpped growie
in 1973 -the pendipg drug caseload grew for two full years":4(
',.foiloWing the effective date of the new drug laws despitek
'theL31 additional court parts added under thd Emergency
,Dangerous, Drug Control Program.
The prime reason for the continuing growth of the drug'
case backlog has been the slowness with whichclass A felonS,.cases generated:by the 1973 drug law have moved through the
system.' As a substantial number of these cases finally
reached disposition late, in 1975, the backlog growth deceler-
ated. By the foUpth quarter of 1971, the drug case backlog
had, hew: to decline slightly. IV
The Importance of Class A Cases in the;SUpreme CourtWorkload, Sept. 1, 1973 - Dec. 31, 1975
Disposi- Rise in Contribution,Indictments tions Backlog to Backlog
4,197 ' 2,002 2,064,
Case Type
Class ADrug .Felonies-
Other NeWLawDrug Felonies
4s.
Total New Law,slug Felonies
1,325 1,004. 352 :18%
5,522 3,006 -2,516 100%
Source: Estimate based on data frdm the Management Planning1 Unit, Office of Court Administration and New York
State Division of CrimiRal Justice Se'rvices, Form D.See Table 6-11 for computation method. -
;"
1.9

-192- v
Grxngth of, the Drug Case Backlog
...
l'aikle 6-Igives'an indication of the 4rowth of the-....
.
backlogs (both drug and other) which led-to the expansion-.
. rc
,
.s.
of the Supreme copit.-* Indictments -- the input t the ? C ''..
Supreme Courts -- jqmped 35% (from 20,'000 to 27, 0) in b4e
year betWeen 1970 and 1931, an increase whlop uldnh,t potsi-,
401y be matched by dispositions. Indictments remainedstakile 0, . .
during-1972i and decgined sharply in 1973.4 -; 7 ',.4. -, 0 , 4
.:According to this set of.esimIles, backlogs rose .byN t
20,9 of.indictmeLs in both 1971 dild 1972 and had glown by2
liearli, 14,000 cases betWeen.1470,an4 1922. Tit is u4eful to'C
...1v' flOok ei pending caseloadi in'.terms of the=number of.4ontht
ttley represent for the -w rklOad of the courts. '19ithis1 :
measure;.the. backlog g w by in equivalent of nearly:eight, y..';' e)
months' worth,of-dispos tions between 1970 and 1972.4,*Thia.\ , -,
.,- .
was an emergency by anyone's Zefinitiont ;,--, -
Drug cases made a heavy contrii?ution to the backipg int,:...;
1970, which was the peak year -for felony drug arrests, under
the Police Department's mass arrest policy:- The 26'000
*There is a confusing array of figures available to measure thecourt's' workload, all produced by official sources. Appendix
. /I presents .a discuhsion k.f the various estimates. The onesused hereTroduce conservative ttimates of increases in thebacklog for 1970, 1971, 1972 co ared to the figures from other4sources.' Estimates of reductions in backlogs during 1973,1974and'1975 are greater than those from other.sources. In eachyear, then, these estimates provide the most,faVOrable viewof the courts' activities.
**14,000 (,growth of backlog) = 22,000 dispositions in 1972 X 12(months per year).\.1,)
20 0

-193-. .
'.felony dr9g arrests resulted in-over 7000 indictments, o
Which over 2,500 remained pending at.the pnd.of the year.,
(See Table 6-11. The qualifications to the estimates in
Table 6-/also apply'to Table 6-11.)
Old. law drug casesalso contributed in a small way to
the 1971 growth in the City's'pendingcaseload (500 out'of
...6,000 case increase 1$;were drug casesr. By 72, the back-
of drug cases seems ;to have stabilized,.and 1972 and 1973
very small Aer5.ines. Changes-Of this magnitude. (200 to
the
log
saw
300 cases pet yea') are negligible enough in terms of the
total workloaqtobeignored. The measUaes themeelves are,. ,..-
w -,.:' ' : . ... . ,5 -,
notaccurate.endugh'"to.refaec changes Of'-theksM911.:amounts.. '.
In.'1974, when the new law, drug cases be n :.to epPVaivirk-...
--kA.! 'C,
! .. c I, .
glar2ganumper, Most of these cases remained eding at year's':,.,. ... .
. .
f 1
and: ,Only -about 150 new 1 w drug cases were lisOosed'.pf
i.;1974 compared to abput 2,6 0 total diug di4poSitiona.
, , i : .1 24 ' o41.,- In the normal course of dvents,.some"buildup iobec o4
Would be expected oOdur. Cases.
C-aktoite disposed gf la-.
. .
stlentameOusly.4, ri takes a W.niMud of; 'say, three months
to complstn1y process:a.case, then a pending caseload of three
M6h .!, Worth of:indirtmiehs would be normal. aqt.by the end,
of..29j4,:the ,2,000 penning new law.. cases alreaON dy amounted to
L
.k
;.eightaionthsf:wOrth of indictments. There can be no. doubt
tWat'arpending Ceseided of that size exceeds the MagnitUdes.-(
e250f4inable by what should be the minimum processiqg time.,
More serious is the, fact that 'the site of the pending
caseload 4zew steadily, thOugh more slowly, dbri,ng le first
I'nine months of 1975. other countiet in:the State aleg saw ,
..
=
'j ,',1
C!411.

.-..c 1
4'.-f
, -F ,...-.., ..cr./ .....4.i ..:. --19.4- i r
1 (r \
c..%
or" -,
TABLE (11rIZ--
'Clianges'*.n"-the Backlog of Drugi Ca es in'-thenew'Yorlt.,Cty Supreme C u s
-tATARII
-. 0701971.
1912
)..°r.
3 f iN . 1
Irkik:ctinents
7,,3fii",
6,618 6,1,31.
4,086 . w 4,3003;312 '. 3,338',2,- 46,..
,..
278 ,,,,-34 .. -4 9121975 2,855 2,739' '.1.16. \ :
New Law Only"4
1973 . /--199 '6 4 , 46' ).\
1974 "kg-2 ,154 ". ' `1975'.,, * 1.2,669' N,2331 '," \-ii 438
e , 4
' t ' , " 11 .,I.
SoUr9.33e:. ManOement Piannincr-Unit , .0f f ice IN C'durtt,.dmini stra,-tionNeW York State., J,C-153 forrnS; 'and New York State" '13ivision,of Criminal juqtipe S'ervices, 'orrn T3 . . -
.Data from form 2,h.Diy,,iskon of CriMinal Justiae Ser-vices, are usedvfb diEiterming the.pi-opprtion bf in-
. dictment's .and dispositions1.ccounted .for by.drug, 4charge,s in each "yeart These proport,ions were applied' to the total numbQrtof indictments et nd dispOs/tions '"reported by the, .04 Ce 'of' COurt nietratignr whicb .ilstfes a more accur_ e coun,t of to court actions, '"bbt 4does not isq,late.drug, cilarges. ,,
Disp sitions.5,761 .
'4.

r er" .-195-.
.
ir.7":.AeW.-law drug caseload during 197A, but '
197.
Woe:backlogs wene already being reduced.
as- lacy akion iitifeOtioh 7.) It .wasn't until the fourth
quiliter of'1975.tn t the New ;York City backlog' was reduced./ ..
then thia4 -ion was iessthan 100 capes from what/-j
.come haO 4' of over 2,500 cases.
The 19. ap0975 gipwth ofthe new:law case backlog
came at a timd whsh the courts were reducing the pending1,
.crideloads doh, non-aktiti indictmenis. .Thelackiog of.indictments
oiher,thannew law drug cases fell by 900 in 1974, and by an
S0ditiOha11,709 in 1975... .
Thesewlaw backlog would have grown eyen'More hadit ..
: .- L
not'been'tOr ia sharp rise n the frequency of dismissals in
drug Cados:(See Chart1/46-A). MeAuestioned several prOsecu-
-tors abouOthe reasons for the subsiantiarinckease in dis-1+
. missals in.1974..-They believe that the rise coUld'be'explain-
ed try the'consolidation of indictments (and superCeding indict-
,lents)sfating individualdefendanta. Typically, if a defen-'
.daat has, more than.Oneindictmenio.pendind, prosecutors might
settle for,a plea to one of the indictments in'exchange for
dIsmtasing the others. This is itself a kind of plea-bargaining.
,-,There ilk no evidence avallab1/6 on the number of dis-,
mlssals W4ich occurred as a,1eult of consolidation' under the
old laws, bUt we doubt the prosecutor's explanation. There
is no"reason to believe that,the freguenCy ot pon'solidations
should increase so strikingly between 1973 and 1974. The news
laws dpnotPermit the chi:missal claesA drug cases,in
satisfaction'of other indictments. Rather an eRsplaining,
7'4

a
New YOk pity: cases Disposd, by Drain!). As A percent of Total Dispositions in the
Supreme,4',
I.
,10
to
Iyl
r,.f
51
o
o
C 0 6 if
,
11 ;AP../
emr,2
6a
ffff I
a
o
t
.
new law drug cases
told law drUg cases
te)
non-drug cases
1970 I% 1971 1972 103 1 074, 105
spun: New York tate Diyision1. I 1111
11.41, Justice Services
.4
4
4

">+
:the, rise in disMissals.as a'result of coSsolidationathe
.increase appears to be a, natural response to the pressurns
of an ever-increasing-backlog.
Ohlq do not yet know whether the increase in dismissals
of non-drug cases during'197:4 and 1975 support this sugges-
. tion (See Chart 6-A)... If the increase in dismissals in non-
`drug cas*Lwas concentrated among predicate felbny cases
(which were processed in the same courts as the new drug
cases),. that would support the hypothesis that dismissals
have.increased6in response to1:4ckilog growth. More evidence,
.on this. paint forthcoming when the Project examines
di4OsitIon process for predicate4feldnr cases later
thisyear.
7the Role.of the Cemand for Trials,
The State;-financed,addi-401 of court resources was fur-
nished in response to-predictiona by judges and others that
the plea bargaining. restrictions and mandatory sentencing 4k,
:provisions in the new laWs would leave vary little. incentive.
,:lordefendantsto.plead guilty. Insteadidefendants were1.
expected to carry their cases to trial in largenumbers,*
Thaylhave. There were 335 trials Of-,ilew law cases
during 1975; compared to 218 trials of old law drug. cases
during 1973, the last (nearly) full year of dispositions.c
Under the'old laws. There were '20% fewer dispoSitions of
drug cases in 1975 compared to 1973 (2,750 compared to
1,356),. Thus the trials accounted for a much larger share
, .
*The.following subsection presents some estimates of the effect-
of increasing trials on the productivity of the courts.
,2

-198-
of the courts.' drug case workload ih 1975 than it did in
1923, The trial rates are shown in Chart 6-B, whichindi-
cates that the rate climbed from 6.5% of dispositions in
1973 to 15.0% of new law dispositions in 1974 and 1975.
A tendency toward increasing trial activity predated,
-the. effective date of the new laws, so some of the increase ,
during the past two years might have occurred'even under the
_- old laws. But there is an unmistakable acceleration evident
in 1974, wll.ch seems clearly related to the effects of the
1973 laws.
,--This conclusion is strengthened by the fact that in
class A cases -- those cases which face the most.severe
restrictions in plea bargaining and sentencing the trial
rate waS higher than in other new law cases (See Chart 6-B).
The1'reguency of trials in non-drug cases also increased
faster in,1974 and"1975 than would have been expected on the
.basis of past experience. In these cases, trials grew from
6.6% of Z3sspositions in 1973, to 8.7% int1974, and further
to 10.1% in 1975. While these increases are smaller than
the increases seen in drug cases, they do suggest an acceler-
ated inclination toward trials beginning in 1974.
Some part of this growth may be attributable to the
plea bargaining restrictions and mandatory prison sentences
which the 1973 laws placed on second felony offenders -- the
so-calledpredicate felony provisions. Judge David Ross,
the City's Administrative Judge, believes that these restric-
tions have had much the same effect on'non-drug trials as
the class A drug provisions have had on drug trials. Faced
2 C 6
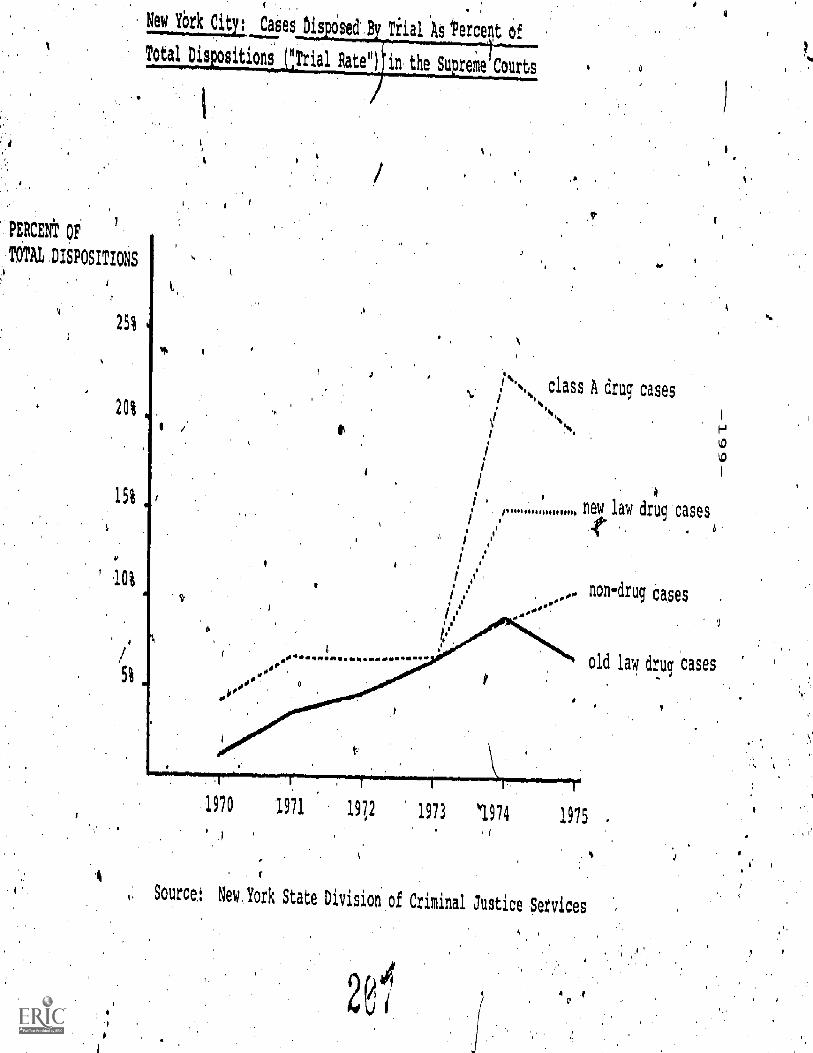
New York Cit : CasesDisloOsed,By Tiial As' ercent Of
Total Dis ositions("Trial Rate") fin. the Su rein Courts
PERCENT OF
TOTAL DISPOSITIONS
' 10%
1
class A drug cases
1 ,
iNN I
,
ll0
i0
iis
ie
i,,,,, new law drug cases
,$
b.
I !1 1
v44.'
i ''or non-drug cases0
if 1,
I/
1970 197,2 1973 '1974
old law drug cases
1975
Source', New. York State Division of Criminal Justice Setvices
1,

S. -200-,
' with certain imprisonment upon any plea to a felony, def-.
dants, it Can be argued, will choose to go to trial. This'
viewhas been supported by staff,ef, the Legal Aid Society, .
which Jepresents most inligent defendants in New York City.
The'incentive to go to trial in these cases is not
universal,. however. A defendant facing a class C charge',
for exatplei might be faced with the following optiOns:
(1) go to trial on the class_C charge; if found guilty,- .
receive a minimum sentence as a prior felon of three years
(but the minimum sentence could be as high as 71/2 years); or
(2) .plead guilty to a class E felony and receive a minimum
sentence of 11/2'years, Some defendants will take-a chance
on a trial, while otheis will take the sure, thing, by plead-.
ing, even thotAh they must go to prison. Some,95fficia s
outside the citelieve that, on balance, most of their
defendants prefer the sure thing.* A firm answer on the
choices defendants make between trials and pleas will have
to await;the PrOject's analysis of the disposition'prOcess
for predicate, felony cases.
The following section presents some additional explana-
tions for the failure of the City system to keep up with the
demands the 1973 laws have placed upon it.
a.
*Even the results of a plea are not always certain. It is onlyafter the minimum term has been served that.the Parole Boardconsiders release of the defendant. The offender could serveas long as twice the minimum term set by the court.

r
Other ReasonS for the Rising, Backlog' of New Law Cases*'
The rapid addition of new laW eases to the backlogs,0
of'the NeWLY.ork City Supreme COurt raises several questions
about the productivity of the courts' Were the'resources
provided to deal with the new laWs sufficient on the basi-E\-
of past performance of the system? Have the'new drug parts
.
been significantly less produqive,than other parts within
;the Supreme Court? What Tessonsan. be learned to guide
;future planning efforts?
In additioa to the rise in the demantl for trialg dis-
cussed earlier, thtee other factors have contributed to
rapid growth of the'backlog of new chses in the City.
First, thq productivity of the new courts, in terms of
their ability to dispose of large numbei's of vases,'did not
match the productivity of the established courts in the City.*
°.Bven 'after allowing for differences in the frequency of trial's;
the.;new courts lagged. Second, given the productivity the .
new courts did achieve._there were not enough new courtrooms
furnished to deal with the demand for'tials that resulted
from thA newly imposed restrictions on plea bargaining. Third,
therevg0, for budgetaryreasons, distortion in the workload
assigned to the new courts.
Many parameters of, court performance vary greatly from
month to month, so analysis over short periods of time is
*Productivity is defined here as the average -number of disposi-tions achieved in one day of a court pant's operation (refer-
red to.as a part-day). Dispositidns may come as a result oftrials, pleas, dismissals, and 'other' final court actions.
a .4
209
-202-
not very informative. Performance measures, for,two six month y
periods are analyzed here. Data for periods prior to 1974
are not available, nor is comparable information for other
parts of the State.
Productivity,
.Manhattart (New-York County) is the only county with.
enough courtrooms specializing in' ug cases to provide a
sound basis fob comparison with non7d ug courts. Currently
there are 18 parts,del>Tdin whole,or in part to drug .cases
in Manhattan. They are housed in one b il4ng, and they are
under the administrative direction of on judge (Michael.
Dontzin recently reidace4Norman Fitze ). he City's Sp;ecial
Narcotics Frosecutor, Sterling aohnson (this poet, was forMer-f
ly held by FrankRogerS),.is,resgons le' for all drug prose-'
cution in these courtparts: (Non-drug cases are prosecuted
by the Manhattan District Attorney.)
During the first half of 1974, when the' backlog of ne*
law cases was increasing at its fastest pace., an equivalent'.
of 15 fulltime court rooms (parts) were deveted.in wilole ort
'in part to processing drug cases.* Some of the parts had:been
established under the 5pecial.Marcotick'Courts program, the
rest under the Emergency Dangerous Drug Prograd. During that
same six month period, an. equivalent of 17 gull-time non-,drug.
*The number of parts actually operating fuokday to day' may vary.To smooth over day-to-day.fluetyations in part activity, the num-ber parts will be described as 'full time equivalent parts." Thisis determined by dividing the number of part-days of activity bythe number of work days in the. time period.
21

courtrooms were ope,
-103-
ating in 11anhattlh.
'The 15 drug pit's disposed of 1,249 indictments;* th9,
,i7 non,diug parts'disposed of 2,423 indictments. On a per
pa;-t basis, the non,drug parts;disposed of 1.2 cases every
day a part Was open; the drug and predicate felony parts.
disposed of only 0.7 Cases per part day (See TagT06-III).rTo exam ne'how m of the difference in productivity,was--
due to the higher, to of trial in the drug parts, we esti-!
mated what the output per day woled have been in the non-
druej parts if they had experienced the higher trial rate
actually experienced in the drug parts. We estimate that
productivity in the' non-drug'parts would have fallen from
1.2 cases a day,to,1:.0 case per day', Thus the higher trial
rate explains about half the difference ih productivity
between drug and non-drug parts.**
'Translating the pro4UctavitY per at into estimates of
resources required to dispose bf the actual Caseload results.
-An/the folioWing estimates: 'The° 15 drug parts disposed of
14249 cases during the six month period, We estimate that
/ie.those same parts had operated with the prodUctivity of
pthe ncin-drug yarts, Xbut,.had labored under the higher trial,
rates evident indrug and,predicate feleny cases), they
'would have disposed of over 1,700 cases in the first half of
*The New York City Supreme Courts count. indictments and disposi-tions in terms. of "defendant-indjctments." Under this scheme-,one defendant indicted on:'two separate indictments is countedas twoodefeupant-indictmentSr two defendants indict-ed under on indictment ate counted as twbAefendantindictments.In this Report the terms Indictments,and,dispositiohs'reflectdefendant-incl. blents.
**See Appendix I± for method of calculation.
259-297 0 78 14'
r
211

-204 -
Table 6-III
Productivity in the.Mailhatean,SUpreme Courts
January-June, 1974
Trial rate#
Time required for trialdisposition
Time requited for non-trial disposition
Dispositions per part-day
New cases (input)per partdity
Average number of appear-. ances per disposi-
tion*
January -June 1975
.Trit;? ra'te.
Time required for trialdisposition
ManhattanPrediCate
Time required'for non-trial disposition
Dispbsitions per part-day
New cases (input) per partday
Average number of appear-ances pei disposi7
stion,
Drug AndyFelony. Parts
9.9%
7.1 days
Other ManhattanParts
.
6\4 days
0;75 days90.3; days
0.72 dispositions :1.24 dis-positiona5.-
1.08 cases 0.78 cases
21 s' 4 11
13.5%
57 days
0.78 days
,0.69 dispositions
0:59 cases
21
10.3% it
6.1 days
0:52 days
0.92 dis -positions
0.91 cases
14
Source: Monthly statistical reports of the New York CityAdministrative Judge. (unpublished)
*NewsYork State Office of COurt Administration, CourtInformation Service, "Statistical Summaries.4nd Com-parisons for New York City' (monthly).'
212,

ro
1914, compared to the J.249 cases actually disposed'of: Pro-,
duction at the 1,700 case levees would have been nearly suffi-
cient to keep backlod4`froAtgtowing since there were 1,859
arraignments in the drug courts during the period.
Thy time it took to.4ispose of a case by'trial was about
the same in the drug par s '(7. days) and the non-dr)Jg parts-
` (6.5 days). But;,during th first half of'1974, it took
twice)as Auch court tiM to dispose of a non -trial case in
the drug parts (1/4c,S a 'parb-day, compared to 3/E3 of,.a day
in non-drug parts). Thia difference is probably explained
rargely,by the number of coll-rt,appearanCes it took t9 ais--.
I pose of a case. Duringlahe first half of 1974, the average
appeared on the caIehdr° 11 times in a non-drdg part
bef re dibposition. /n drug:parts,"cases'appeared an intredi-,
ble 21 times before dispositdon.* One of the greatest needs
in the vD.urt,slstem is to determine' the reasons for such
frequent adjournments so,that remedlial action car; be. taken:
'Differehces in productivity b Ween the drtj and nondrug
parts in Manhattan narrowed during the firdt ha f of 19'75.
The drug and predicate felony paits actually disposed of trials,
in slightly less time than'the nor -drug parts (about 6 days
:`\
\The raw number of appearances may be misleading because it .
.S.' "(
c uld be reduced simply.by Increasing the time between aPpear-a ces, e.g. until a case was clearly ready for disposition. In
this-respect forcing cases to appear -on aoalendar might be
.'viewed as apressura'tacticQ'hIainst the prodecdtor and defense
'counsel. Neve theless, this is 4 lot like spinning wheels, and
it does take a of of effort to produce def ndants and witnesses
over and over ain. Although we have not.d ne' statistical
analysis of t relationship between number appearances and-the time it takes to dispose of a case, that relationship is
likely to be a positive one.

-206-
per trial diksition in each Case). But overall' roduetivity'
.n-both courts declined below )/974 levele as it took somewhat
''' longer to dispose of npn-triad cases. Tfleaverage number of
appearanced pei case incrApd from 11 to 14 between 197.4 and
1975 in nonedrug-parts, while the average number of 4)pear-y
ances remained,t 21 per case in drug parts.
An equivaleneNpf 17full.-tima.drug and predicate Yelony
,parts were in,operation during the tirst six months of 1975,
and they disposed of 1,450 cases during that period. We
estimate that non-drug parts o erating.for the same number
of days would have diSposeckef 6, 50 cases, 14% more than the.
- -
drlig parts, if the non-drug-Parts d beem subject to theP .
higher trial rates actually witne ed in drug cases: Again,
the high demand for trials, in the drug parts can expiain only
'about half the difference in productivity between drug and
non-drug courts. The very large number of adjournments in
drug'case suggests that the rest of the difference i,s'prob-
ablyattributable tothe failure ofthe drug parts to move14
tases.on to dIsPositi9n. The discussion in Section 7. gives.
some reasons for frequent adjournments in drug cases.
The finding that produc6.vi4 in the ne drug courtsi'
has been lower than the productivity.of.the existing courts
is'not surprising. When to court system is viewed.as a
large and intricate production process, the addition of a
substantial number of judge0.(and associated personnel) is
analagous to adding a new branch to a factory:- If the tech-
used Th the new branch was just.the same as the tech-
nolog common in the basic plant, then the new additions

-207-,
would be expected to exhibit lower productiVity,thah the
basic plant, 'In the jargon of econWists, .the additional
.resources' exhibit "diminishing marginal productivity:"
The'one way to avoid lower, productivity is to improVe
the technology of the production process, i.e. to do things
differently (and better). In industry, machines are often,
substituted for manpower in order to improve productivity.
Alternatively, a change In the organization of the process,
or even superior know-how on the part of the n9y employees,
' could be used to improve productivity.
This newly furnished. courts, however, were organized along
the lines of the existing Manhattan courts and the judges
balled upon to preside over the new courts were, in general,
less experienced In the New York City coUrt. system.
Thus, it would have been normal to expect some lag in
the productivity. of courts.- We know of no way, un-
.fortunately,. to gauge'the extent which the actualyro-
ductivity achieved by the new courts was above or below
7,reascgnable"
, ..
Total'Itesourke4 , ,
We estim te that at the productivity actually achieved
by the Manhattan drOg4arts, it would have taken eight addi-
tional full'-tIme parts during the'first half Of 1974 to avoid
the rapid buildup of backlogged cases, From the point of
view of the demand'for trials, the 17 parts which were in
I.

v.
a. .
operation could have absorbed a 'trial ;4te of only 2,8 % .and,
still ket current. The actual trial rate was 9,9%.
Extrapolation of these *resource' necdsto the rest of
othe Cit},'"is difficult beCause the organization of the new
courts varies from borough to borough. In rough, terms,
though, if the Manha.ttan calculations a e. typical, an addi--p
tional 15 parts could have been producti ely used citywide.
We have also estimated the resou s which would'be
required over the Ixt year to a) keep up with the current
. inflow of drug indictments and b) reduceethe backl/og to some
predetermined level.' The backlog of drug cases now repre-
-208- J '
sents about ten months work. If the court wanted to reduce
the backlog over the:'next year to the point where repre-, -
sented six months' work, the equivalent of approximately
35 full-time .court'payts working on nothing but drug cases
Would be necessary.*
/t its pos'sible that the resourcesIlevoted to thing cases
will apPro ate this level. 'There are still 1) Special
Narcotics CcIur parts operating citywide. Thus an equivalent
Of 23, par s out of the existing 31 EmergencY Dangerous Drug
ContrOl, pa js for some combination of these parts and
regula:-*Preme cout, parts -- would have to be devoted to
drug ,gases to reach the 'goal of reducing the backlog to six
4
months' worth of dispositidns. Such an allocation of courte
resources is not unreasonable to expeCt.
*This estimate is based on currentindictments,and trial ratesand court productivity between the extremes of productivity
-;recently experienced-.
-1/4-- ea

.The reduction in the citYwFle drug backlog during the
last quarter of 1975, though quite 'small,. is enceuratiinq,
A lower volume, of'indirnts in the second half Of 1975 COM* 4
- pared-to a yeer earlier, and recent stability in the trial.
rate after a huge initi,a1 increase (chart.6-13), suggest that
the outlook for \processing drug'cftes in the City courts is 4\-
far brighten thgn thepast. I
To achieve steady progress, however, the Pressure to.das7,
pose of dryis. indictments must be maintained. poVernOr Carey
last year relaxed a reqUireMent.whiCh controlle'd.the ase.ign- _
:Mont:of cases to the courts fine ced by the State under the
Xmergency'DangerousiDrUg Program. Ader the old...requirement,
80% of the Gases assigned to the newly furnished pprts were to
be drug and'predicate felony cases. Since the relaxation of
that requirement, several counties outside the City have
'already assimilated the drug parts into their regular Court
Operation, Judge :Ross recently began to assign non-new law
cases to the CitY's -.drug'parts in greater number, and has
informed us that the distinctionbetween those ,parts .'and
the other components, of the Supreme Court will slowlk.be
abandoned.Ar
Distortion of the Workload
All, through 1974, the new drug parts estabfishbd under, .
the Emergenc4' Dangerous Drug Program were responsible fel-
both drug cases and cases in which a defendant had. a'prior
felony arrest. The latter cases are those which arepoten-
tially subject. to the predicate felony provisions of the

new lame (Whi:Oh W0141d have applied if:the offender-had a. _
priCr felony conviction),. Early in 105,'after- the -pending:
paseload.in the new parts had increased.fOr.a full year,
.4ssigament'Of these 'pOtential predicate felony" casesirgvert
ted to the regular (non-drtig).1 par,schf thg court!,'
In Manhattan, the 1,450.,.-" potential predicate 'falo4"
cases afisOned to-the newsy Oreted,parts accounted tor 45%
of the:AppuCto those parts:during"1974. Out of these cases,
it is.rikely that approximately 50Q actually invOlved edefen-
dint with a prior difelony*.conviction.* These would be the trim'
predicate felony cases Ar.theAcemaihing 950 cases had been
assigned fpatead,to the!regular parts- of the court, it is
likely that!;othe new parts would have come muoh,clOser to
balancing their, i./orklOe'd,', TheimpioVement in the pictUre.
would not, hOwever, have been as greatas the rairi numberstg-,
gest beca4sethe cases which did not prove tO be subject to
the predicate felony provisions were probably the','O'nes most
-easily,disposed of The rate at which these non - predicate.
felOny:oAgesWebt tp trial was probably lower tha&the rate
for-trhe predicate felony cases.
There is aIso..he possibility that the newqourts woul
'have remained idle a-geod deal of-the time during their earlY'.
months. in the absence of some pon-new law caseqtO.work
The issue' would then have boiled down to a tradeLbff.between 0
*A sample of felony arrests in New York City in January; 1975-':- indicated that the 'average .number of felony. arrests amongdefendants having at least one prior arrest was three, ,Roughly
out of every R felony arrests. results in a felogy,_convictidn,-resulting in an 'overgli likelihood.Of'convictiOn-of 2166ut 35t ,
,;210
.-211-
1),..using the ney courts in part to alleviate the.normal
preSsures.onthe Supreme:Court or 2)-prosecuting the new.
Oases exclusively: The.second choice maY have.caused-
some ilack time in the new cotitts, but it would probably
have speeded the processing of new law cases somewhat by.:
::**Sping4ressures on proseTitors and-defense attorneys to/
.,prepSse taSes so that the courts could be kept busy.
From the point'of,view of court management -- and there
_was little if any dissent from this view at the time v the
more the new courts were integrated into the regiilar opera-
tiOn'',of the Supreme Courts, the more flexibility there would
assigning cases to the various components of the court,
. and the more the .priorities of court management couldte
puisued....rrom this perspective, the assignment of'the "po-
tenVinr pred felony-cases to the new courts was reason-
able.'
On the other hand, from the point of vieveof the Emer-
gencY'Dangerous 'Drug Control Program, for which the Legisla-
ture was willing to spend up to $40 million a year., it appears
thatthe potential !!predicate" felony capes should not have
been assigned to the newly cFeated parts. There was a reduc-.
tion in the backlog 'of cases in non-drug parts during the
first half of 1974, just at the time the backlog was growing
to large proportions in the drug parts. Better balance could
have been maintained if, cases had been screened prior to in-
dictment so that only those cases. in which the defendants1With
: 'Prior .convictions would have been assigned to the new parts.
Pre-indictment screening Would have been relatively; inexpensive.
219'

-212-
The experience of researchers indicates that the commitment
of several clerks to complete the criminal histories of defen-,
dants in the gpotentialns category would have made the job
feasible. It is likely that the clerks would have been
. financed by.:the State as part of the'drug program.
There was, however, one strategic reason .for 'overloading
the new,parts relative to therregular portion of the Supreme
Court.' The regular parts of the Supreme Court in New York
City are financed primarily from funds appropriated by the
City so-called Tax Levy funds. The parts furnished under
the Emergeney Dangerous Drug Program, are financed solely by
the State of New York. Early in 1974, when State appropria-
6.ons_for the drug program had not been fully committed, and
when: the City was begihning to feel the fiscal pressures of
the 1974-75 budget cycle, the likelihood of receiving addition-
al funding from the City seemed slim Compared'to the pros-
pects of additional. State funds. If the need for more drug
parts could have been established, the State would have finan-
ced these rpsources. However', the need for additional resources
,could not be established in time for the Staters 1974-75 bud-
get (the laws had been in operation for only a few months;'
when the 1974-75 budget was being prepared). Additionally,
the Governor's authority to appoint new judges to sit in
new law cases expired on June 30, 1974.
Distortion or the workload might not-have occurred if
the incentives to seek funds from alternative sources had not
existed. Future distortions of this type might be avoided

-213-
if- A singlelunding source for'the Supreme Courts were estab..
lished. .Thisr .
is. only oneof several issues concerning the
financial and management organization of the State courts.
But it'wOuld sypportthe argument that, because the adminis-;
trative 'responsibility of the courts runs :ugh a statewide,
114mInistrator and a statewide AdAinistra e Board composed
senior lodge!, thW Siate.should be the single funding
Immediate.State assumption of the costa of,Abe
Shperior Courts estimated to be about $100 miklion state-.
Nide for the current fiscal year -- may not. be feasible. "How-
everi- it:may be possible to newitiate a. gradual State assump-
tion:of costa over a five7year transition period. Such an
.Srrangement would.have to recognize'joint budget-making authority%- .
.during thotranaition so that neither the State nor the City could
impose obligations unilaterally'upon the other.
Other Problems of the Planning Process
At the time new resources were being allocated in.mid-1973,
'it was imposeible to accurately ',reject the effects of the
radically new provisions of laW on the workload of the courts.
During. the legislative process, there'were only guesses about'
%actions that the,.police might take in enforcing the new laws.
Mnpertainty about police policy, particularly with respect to
street level enforcement activities, was resolved to some ex -.,
tent in May, 1973. Former Police Commissioner Donald Cawley
informed.us that the New York City Police Department decided
at that time to.maintain its priority .i1 favoroof,case6 aimed
at middle and upper level drug dealers, and rejected the
option of returning to the policy of dragnet arrests it had
followed between 1969 and 1971.
221

-214 -
Tao other iMportant pieces of information remained Al-
,
-though there was universal agreement that the lawstlA
centivee for defendants:to chomm to go to tr (rather than bp...
plead guilty), there was no experience from which to draw estates of
the. degree to which trials would be demanded. The best attempt at an
analysis of these questions was carried out by the New York City Cri;-
idhal Justice CoOrdihating Caunoil (WOC):in response to the clovimnOr's'
original proposal which would have banned-plea bargaining altogether for
soMe.crinsand wbuld also have imposed mandatory definite lifetime sen-
tame*, (with no parole possible). The CUC6 analysis was based 4.the as-
sugOon that Pd of new indictment-5 for class A felonies would result in
a trial, and concluded that the minimum of 162 new court' parts would be
required in theCity to successfully manage.theworklead:brought by the
new laws. The 848 trial rate was an unheard-of figure at the time,. but
9
there were no challenges to the assumption because no one planning for
aystemexapneion had any,cOncrete reason to believe that figure or any
other,wes,the correct one. As it turned out, abolot 20%16f new'clasa A drug
indictirenta have resulted in trials, :hit tile plea bargaining restrictions
in the final bill Were less severe than those proposed in the original.*.
The experience of the last two years with the increasing number of
trials Under the drug laws has provided experience which,. though. limited,
is sufficient t6allow estimates of the effects that future proposed changes.
in laW May have on the demand for trials. FOr example, the Project staff
was able to make fairly detailed predictions of the demand for trials that
mould resultwfrom implementation of changes made to the drug and sentencing
laws during the 1975 cgislative session (amendments which were eventuallyr
tabled in-,
vetoed by: the Governor) .
*The State Administrator of the Courts projectedA need for 133 new parts in
New York City on the basis of the final bill.7 (
r

-215-
Another problem Of, the early planning process was that
only 'a crude estimate could'be made of .what a particular
demand for trials would. mean in terms of the need for new
judges, C.ICC4s Tjection that a minimum of-162 new judges
could betegutred in New York City alone made an attempt at
'precision somewhat academic. There were only 100 AwA.udges
menable statewide, and several'Of these were to be judges
Icor the familY courts who would not be, available to preside
over new law cases.. Although the estimate of 162 new judges
was crude, it was consistent with the assumed 85% trial fate.
In,fact; it assumed doubling the average number of trials
which could. be conducted in a court'part per year. Number of
trials per, year. was the only specific measure of ,6oduchivity
used in the estimating procedUre..
'Somewhat more precision would be possible today, thanks
. to the develdiment of comprehensive regular information regard
ing input and output of cases, both for the. Statewide Court
system, and for the City's Supreme Courts. The recent.improve-
ments in information, for the City courts include details about.
the time courts are in session, and the proportion of time
spent-on trials and other matters. Information of this kind'
allows-for the first time the estimation of the costs of con-
ducting trials. For example, by comparing the time it takes
to dispose-of a case by trial with the time it takes to pro-d
mess a non-trial case, the cost of trials in terms of other
dispositions can be estimated. For New York City, the ratio
Of trial time to non-trial time varies greatly depending on
the group of court parts and the time period under study, but
it is clear that trials are very expensive. The system gives
223

-216-
up between six and eighgeen non-trial dispositions for
every trial it conducts.*
.A second kind of Analysis made available by th new
management infOiMationsysterl is the determination of the
marginal cost of a general increase in the demand for trialt.
As noted earlier, estimates based on the productivity of
the first six months of 1974 indicate that for every one_ -
percentage .point increase in the citywide trial rate, an
additional nine full-time court.partsCwould be required.
.The annual cost of each additional part (including support
staff) utidsr'tbe Emergency Dangerous Drug Program is
toughly $750,000. Thut the financial implications of a'
ohange in the trial rate can be enormous, with a meager
one perCe4 change'costing over ,$6 million per/year.
The 1973 laws ther4elved provided the seeds for
improved statewide information.by giving the/-New York Statei
Division Criminal eattice Services (pc.* the respon-
sibility for data collection and regular reporting of
information'relevant to felony case procetsing. The.
resulting reports and background-materials made available.'
by DCJS henie made much of the Project't analysis possible.
They also provide useful management information on a/ 6
regular basis.
*This estimate is based on current indictment and trial rates
and-court prodbctivity between the extremes of productivity
recently experienced. 4
24.
THE EFFECTS OF°THE NEW LAWS ON THE SUPERIOR COURTS IN SIX'UPSTATE COUNTIES,.
.Developments in felony case,processing nsix counties
outiide.New York City w examined. 1.1'1pr-der` to analyze the
apparent ability of upstate.jurisdictichS to coPa' with the
Procedural'restrictionS)lbodied dn.the new laws. The follow-
ing counties were included in the analysis.:.' Albany, Broome,
Dutchess,'Eria, Monroe, and Nassau. Erie and Monroe counties
contain the'State's second and third larOst i ies, Buffalo.
and Rochester, respectively. With A population f 1,350,000,
the Buffa/o'metropolitan area was the-24th-largest in the
country in 1970. The Rochester metropolitan area had a popu-.
/.( 1ation of .960,000 in 1970. Nassau County is the largest sub-
urban county in the New York City metropolitan area, with a
population of 1,A00,090.... Albany COunty, which includes the'
city of,Albany,:the State's capital, has a population of
290,000. Broome and Dutchess counties each with a population
of 220,000, are the counties with the smallest populations
covered in this Report.
. The relative sCales bi the superior court, systems in
these counties can be seen from Table 7-I. Nassau County,
with a. total of 12 criminal term judges,- had the largest
superior court complement of any county outside New York, .
City. Even so, it supports barely ten percent of the num-.ber of, judges in the City's Supreme Court (Criminal Term).
2'

The Site of the. Su erlor, Court Systems
bet Of "Regular'''.
O'imii* Term ,Judges' 1
*.
Al 91 Broome Dutchesi Erie Monroe .Nassau New York City
goaded Under
Imergency Dangerous
g Control Program
Ipta Number of
ndictmants, 1974
Number of Drug
Indictments, .1974
(Percent of Total)
Percent of prug Law
Convictions, 1972-74
(old law),Which Involved:ft*
Heroin
7 Marijuana
231 432 306 1,146 1,429 2,858
32 . 78 67
(13.9%) (18.11), (21.91)
531 201 ,921
131 601ISM
* Opp judge who normally pits in civil proceedings was:
between ,September, 1974 and June, 1975; .
** Includes "special' courts furnished, under the Federal
EMergency Felony .Case Program.
PO'Source: 'Drug Law Evaluation Pro jest Sur*
e (d) 1
fr 44u
86**
31
9 988
271 281 709 3,081
(23,61).' (19.71) (24.81) (15.81)
34% 23% 301 681
28% 59% 481 12%
transferred to handle criminal cases
Special Narcotics Prograi and the

-219-
Upstate courts have'encountered some of the same pres-
sures that theCity courts have faced in trying to. implement
the 1973 drug laws, but they have in general; fared better
ihan'the4City;court* in dealing"with the problems. The.
favorable outcome is traceable to the relatively low fre-
quency of class A indictments. This, in turn, has meant
that the demand for trials in drug cases has not been as
burden:3mile as it has become in the City.
Only Albany County managed to escape the buildup in the
drug case backlog during' 1974. Each of -the other counties'
SAW its pending,caseload ,groW, and while the increases were
Very small compared to the rise in the New York city ircklog,
they were not negligible in terms of the number of drug
indictments in these counties.
Change in the Pending Caseload of New Law Drug IndictmentsDuring.1974
Number of percent of phew LawCOUNTY Cases :Drug Indictments
ALBANY --BROOME +33 42.98DUTCHESS +21 % 33.9%ERIE +150 66.7%MONROE
,+150 58.1%
NASSAU +549 80.38
New York City 1,885 64.0s%
SouFce: .New-York State Division of Criminal JusticeServices
'In retrospect, it is not surprising to see some growth
in the pending caseload during the first year the new laws
were in operation. All jurisdictions began the year with
virtually no backlog of new law cases -- the laws had been
259 -297 0 - 78 2 15
227
.r-
rr

in effect for only months and .W.takes some minimum .
amount of time to Process even simple cases through the.court
system. The caseload that can normally be handled 4.n this, 4 ''----,---
minimum proceiain4 time represents the-iiimallest:!backlog"
one would:expeCt to find pending in the courts at any tittle.
Nonetheless,,the growth of theepending-caseload in these
counties was not of enormously different prOportions from
the growth experienced in New York City, where t!le situation,
has always beenviewed with considerable gloom. We wondered
why officials in these other counties remained so calm.
Part of the exp &nation came from examining;developments
in each of the counties in turn. There are a few general
points, bOwev First, when we began asking questions early
in 1975, backlogs had already begun to decline. The only data
for. 1975-we have available-is for Broome, Dutchesq, and
Nassau counties, and each showed a decline in its drug case
.backlog during the first half of the year. By contrast4-the
NeW York City backlog was s111growing substantially in the
first half of 1975. Second, 1975 also saw a decline in the
2 number (and proportion.) of drug indictments in most of'the
counties. Third, the counties which-f6ed thelargeetin-
creases in their'pending caseloads, Erie, Monroe, and gassau,
each had received a relatively large injection of.new judicial
resources. Erie.grew from seven to ten judges; Monroe from
four to seven; and Nassau from eight to twelve. it is likely,
although we do not have data on the point, that these counties
were able to manage an increase in their batklogs without
4.0

-221-
attendant,increases'in the'time cases m*t spend in the. sys-._
_em. Im:othet words, ,the resources newly furnished In these
Counties were sufficient to handle the increased workload,1,
Evidence for this conclulion is that for all 0.counties ou6-
side. the New York City metropolitan area, the age:of cases6
a. dispOsed of did not increase during 1974, and the five counties
Amamined here (Nassau s within the metropolitan:area) account
for US'erthe Workload. f all those counties.
Another similarity between the counties examined her4'
is that class A felony drug cases accounted for a large part.
the initial growth inbactclogs., In.Erie.and Monroe
counties, there was actual1Y,SdeOline'in the backlog of non-..
class A cases. (This was also true inAew York City.) Class
A cases amOUnted:t6 two-thirdi of the,Macklog growth in Nassau
Coynty and nearly half of the growth:in Dutchesxs County. In
All these Counties, themproportions are far'higher than the
.share of class Acases in indictments (See Chart 7-A)i
The'deMand,for trials in drug cases bas increased in
Several of'tbe counties, as well as in New York City' .(see.
.Chart .7-B). The data are not., extensive enough for reliable
statistical analysis, but A914 and 1975 variations in trial
rates between counties seem to be related'to the prevalence
of class A cases. (By comparison, Chart 7-C indicates that
there has not been a general increase in the frequency of
trials in non -drug cases in these 'counties since 1973,)
'once again, it appears that when the effects of the new
laws are being .examined, "new laws" is nearly synonyfficks ,
with "class A cases." This, in turn, reinforces the finding
229

f4
100%.
SOL
't ri
401,
201,
The importanee of Class A
Felony IndictmentsI.
I
4
WQ0,,''a'44U 'Q
H.Z."0WH
Z ZO
-June 4
!'' '11 .1
1973 197q
d!dSource: New York State vision of.
Criminal Justice' Services;1.

C H A 11' T 7B
U
0
0
to
0d
Trials in Drug Cases as a Percent ofAll Dispositions in Drug. Cases
ALBANY 22*
/
//
/ -
/
/
/
- ,,,,....'...1.../,
.0**..... ..0 ,:'
110 70 .7 ,, -. '73 74 75
40
30
20
10
TO "71- 72 73 74 75`
MONROE
v
: .,
.
...T.
.
,.11 ..
':
/J
,
/
//
4
31.*
I
/
//
/
a..
16
12
8
`4
a.
.._T
es....."4.... 71 72 73 74 75
BROOME
I
1 \/
.
./ 1
//
/'... / ".
//..
' ' .,.. 1911
...Z.'?
____.4
70 71' 72 73...
74' 75
16
12
4
ERIE
4\. 1*
70. 71 72 73 74' 75
a
1.5,
NASSAU , .
.......
/7-
12*_-7---,
'...4.,
,
// .
e ,
.5/
70 71 72 It'i3 74 75
*Number of TrIalst,.
Source: New York. State Division of CriMipal Justice SeryicesNote: Large number of trials in Albany and Dutchess:reselted from
one-tiMe,State Police operations.'

C H A R Ti
Trials in. Non -Drug Cases di a Percent ofAll Dispositions in these Cases,
03
8
6
4.
1
DUTCHESb'
11\
A
\.1
9; ".k /f I
,..
, ,/ N.,..../
./// ...."-.... .'
\\\8*
N..__
,
_ ...
70. 31. 72 73'....
74 75
3
2
1.
BROOME..
/ ,
.'
12.*
A\
\ ,. ,.\ ,\ /\
,//
V.
70 71. 72. 73 74,',7 75
40
30
20
10
ERIE.
\127*
.p 71 72 73
87*'.
71 72
Source:-*Number-,of Trials
New York State Division of Criminal Justice Services

-225-
that the new laws are having an effect on the court system,
because it is the class A cases which most clearly face the
plea bargaining restrictions and mandatory sentencing pro-
visions of the 1973 laws.,
There, are a variety of reasons for the slowness with
which class A drug cases have been disposed. A high trial
rate itself is, of course, of primary importance. But pleas
in class A cases have also come slowly and, despite the high
trial rate, most class A cases are resolved by a plea (within
the new limitations on pleading). The, reason may be the dyna--
mics which applylto the class A plea process. Bargaining in
these cases dqps not include the possibility of a non-jail
sentence so that any plea will certainly involve incarceration
for a minimum of one year and a lifetime maximum. If the
defendant is free on bail, he will be reluctant to enter a
plea until forced to a decision on whether to go to trial.
This decision can be postponed by interposing motions, request-
ing adjournments, and finally insisting upon a trial and then.
.entering a plea once the trial is ready to begin.
Some evidence to support this scenario is available. In
Manhattan, for example, the number of appearances requirpd
on average to dispose of a drug case is 50% higher than average
for non-drug case. In New York City as a whole, the dismissal
rate in drug cases has increased, which in turn suggests in-
creased pre-trial hearing activity. (But dismissals have not
increased markedly in the six upstate-counties. See Chart 7-D).
The assistant district attorney in Erie County in charge of
drug prosecution has indicated that the decision to plead in
A cases is usually not made by the defendant until a judge
2():3

0.
4ipl
WI 00 111
U)
p.*uo m
ro
CHART 7DDismissals in Drug Cases as a Percent
of all Drug Dispositions
o
/\/ %
/ %/
ALBANY4,----
\
/
. /
\\
-"%\
/ \..."'"
/ Ve i %
70 71 72 73 74 75
16
8
4
//
DUTCHEgS
\
%
%
72
%
%`
%
/
/
% /
%
V/
73
/
/
/
/
e.
74
.
75
/i/
//
I/
/
/
70 71
MCZROE
41
31 ^.../ .-\
//
/ I21 /
lo)(1
70 71 72 73 74 75
20
15
10
5
/I
I
I
i
/
i
,
/
/.
/ .I .%
.
BROOME
\\
4''.",-
%\-/V
/
//
.\\
%......."
...-%
%
0.41,-..,.)
70 71 72 73 74 75
40
30
20
10
ERIE
//
,n
%%\\\%
//
//
//
/-----./
70 .71 72 73 74 75
NASSAU
40
30
,--
20// ',,
*./
//..
/ /
0 /--J70 71 72 73 75
Source: New York Statb Division of Criminal Justice Servides
12

is ready to begin his trial.
These possibilities add t the difficulties experienced
by the courts in processing ca es facing restrictions in plea
bargaining and mandatory prison sentences. In most counties
these restrictions do Zt\ffect'a large enough number of cases
(or portion of the courts' work) to be of major consequence.
kbrief review of the most relevant points for each county
follows:
Albany County had,the'highest proportion of class Afelony indictments among the non-New York City counties inour study. Although most'of the indictments in 1973 grewout of a single State Polibe undercover operation which .
resulted in 23 arrests for A felonies late in the year, asteady flow of A felonies into the County court continues.
The 1973 arrests had a substantial impact on the courtsduring 1974. All but one of the defendants went to trial(about half were acquitted). This single operation raised thenumber of trials in drug cases from three in 1973 to 22 in1974.
DesPite the large increase in trials (the trial rate also'increased in non-drug cases), there was no increase in Albany'spending drug caseload. The addition of a second County Courtjudge under the Drug PrograM was sdfficient to cope with theVolume of indictments, although because the new judge had justfinished a term as District .Attorney he did not sit in cases.involving defendants he had indicted. Prior to the creationof the second judgeship, Albany's County Court Judge had beencalled upon to handle an extremely high workload (290 dispodi-.tious in 1973).
Broome County's only County Court Judge also had to dealwith an exceptionally large number of indictments. The workloadin Broome shows the steadiest increase among the counties weexamined, with indictments growing from 208 in 1970 to an annualrate:of over 500)Tiuring the first half of 1975. This workloadis the highest per judge workload of the' counties in our study.
Indictments for drug cases increased substantially in1974, and the pending caseload increased as well. The trialrate in drug cases did not. Broome has historically had avery low trial rate, probably in large part because of a uniquepre-trial conference procedure. The Probation Department pre-pares a pre-sentence report on defendants in time for an extensive
235

pre-triarconferende. The conference takes place in thejudge's chambers,.and is attended by the defense and prose-cution.. Extensive information exchange occurs, so that theoutcome of a trial is reportedly more certain than undernormal pre-trial procedures'.'-In other circumstances, little..Verified information about the defendant is available, and
exchange of information is seldom the rule.
.In 1974, there was only one trial in a drug felony case
out of 53 drug dispositions. Broome has also had the loWestproportion of class A indictments among the six counties.,,
The increased backlog of 25 cases in 1974 was not of.anunusual magnitude compared to past fluctuations in the County's.Caseload. During 1973, the pending caseload (of both drug andnon-drug cases) had declined by about 50 cases. During'1972,the pending caseload had increased by that same.amount.- Ayear earlicr, the pending caseload had deCreased.
In terms of the Alkmal fluctuations of workload in a busyone'judge county, then, the 1974 activity was considered normal.In any case, by early 1975, the pending drUg caseload had it-self begun to decline.
L,
Dutchess County is also characterized by a very low num-ber of class A drug cases. There were only 13 class A indict -ments between September, 1973 and June, 1975: The increasein the drug case backlog amounted to only a dozen cases in1974. Even that small increase was reduced in half early in1975.
During, 1974, the backlog of non-drug cases increased sub=stantiallybeeause of a very large rise.in arrests and indict-ments. Between September, 1974 and June, 1975, a County CourtJudge who had been presiding in civil matters was pressed intocriminal term service to manage this high level of activity.Of the class A cases which,did result in trial, most were dis-
- posed of during the period when the second judge was available.'
Erie County, despite its large size, does not generatemore Erailis A indictments than is typical for non-New York Citycounties across the State (about 25% of all drug indictments).
. ConSequently, the.trial rate in drug cases is not particular-ly high.
During'1974, however, there was a substantial increasein the number of drug indictments, and the drug backlog grewdespite sn increase in the number of drug dispositions andthe addition of two court parts. (There was no change in thepending non-drug caseload.) Consistent with. the pattern foundin other counties, the entire drug backlog growth consisted ofclass A cases. During 1974, less than 10% of the class A in-dictments'filed were disposed of.
There was a substantial increase in the number of drugtrials during 1975, as the pending class 'A caseload-matured.The assistant district attorney in charge of drug prosecutionbelieves that the class A backlog continued to grow in 1975

-229-
&spite the increased number of'trials,:the addition of a,cthird new court part, and a reduction \in the,number of drug
indictments. Reductions in the 'pending caseload of nqh-classA cases, however; has offset the increase in class A cases.
Monroe County has experienced the most serious rise.inbacklOTZT7the six counties we examined, In 1974, there wassignificant backlog growth in both drug and non-drug casesdue to a large increase in the number of indictments. Class A.indictments accounted for about 34% of all-drug indictmentsfiled dUring.1974, and accounted for the entire growth in drugcase backlog. Only about 30% of the class A drug cases filedthrough 1974 had been disposed by the end'of that year., Mostwere trial dispositions, as class A cases went totrial at two'and one-half to three times the rate experienced in the other'counties (except Albany).
The addition of three court parts under the Emergency..Dangerous Drug Control PrograM (to supplement the county'sfour regular judges) 'enabled the county to dispoSe of twice.as many cases and to hold twice as many trials in 1974 as in1973, and to"keep the backlog from overwhelming the system..
The number of drug trials in the county increased from3 in 1973 to 31'in 1974 and the number increased again.in1975, although the district attorney's office had indiCatedthat a higher percentage of class .A cases were disposed byplea in 1975. The county continued to experience classbacklog growth during 1975 despite a decreage in drug indice-1.:1',ments.
Nassau County also suffered an increase 'in its pendingcaseload of drug felonies during 1974. While less than 20%of drug indictments were for class A felonies, these casesaccounted for 2/3 of the.backlog increase. Again, this patternis consistent with developments in other counties.
' In the first six months of 1975, backlogs of class Acases have continued to grow while the pending caseload f
less herious.drup cases (and of non-drug cases),have dec ined._
The rise in Nassau's class A backlog seems to be du totwo peculiarities of the county's caseload rather than to an .
increase in the demand for trials which has been characteristicof other counties. One is the frequency with which the proba-tion alternative for informants has been used. Fully 25% of allsentences in"class A-III cases have come under this provision.The evaluation of information provided by informants has addedtime to the processing of class A cases generally, even yiereit does not result in a.probation sentence.
Second, many A-III cases involving young offendersheld open until the Legislature resolved a question ofcdbility of the State's Youthful Offender (Y0),provisi
2 '

-230-
class A felons. The'se statutes provide'non-prison sentencesfor youths between the ages of 16 and 18, 'Before an amend-ment-to the law in 1975, most judges belieVed the YO provi-sions did not apply in any class A'cash. Last year's amend-ment made the provisions applicable,to class ANTI offenders(but not to class A-I or A-II offenders) Nassau County officialshave indicated that a substantial number of class A defendantsare youhg, and that many of these cases were cleared in thesecond half of 1975 after the amendment became law.
Finally, Nassau has developed an extensive diversionprogram, Operation Midway, for defendants in both drug andnon-drug felony cases. Under this program, a large number ofcases are adjourned for p6iiods of a year or more while defen-dants are under probationary supervision. Defendants in drugcases below the class A level are eligible for participationin Operattph Midway. These cases show up in the data as pend-.ing, but: they do not represent a burdeh for the court. .

- 2- 3 1 -
s8
A CROSS- COUNTY COMPARISON OF COURT:RESOURCES
To investigate whether or not the-general congestion
, in New York City,can 'be traeld to an underallocation of
court resources', we Compered'the workloads'in the City courts
"with the workloads in the six other counties we examined. The
comparison in this section deals with the entire wnrkload. of
the courts -- both drug and other '-- and with all resources
avail ble to the courts.
he general conclusion is thtthe City is not deprived
of resources compared to other areas of the State.
With workload measured by the number of indictments for
each judge there was a wide iienge of workloads in New York
City and the upstate. counties between 1972 and 1975 (see
Tible 8-I). Workloads varied by a factor of more than four
to one, with a high of over 500-indictments per judge
Broome County to a low of just over 100 indictments per judge
in Albany County.' Broome County's workload has been consis-
tently among, the highest. The workload of the New York City
Courts has, by this crude measure, been somewhere in the
middle since 1973. Judges madeeavailable under the Emergency'
Felony Case Program and the Special Narcotics Program in 1972, =
and 1973 served to significantly reduce the burden.
About half of the wide variation in workload can be ex-
plained statistically by differences in rates of trial between
the counties. Broome County, a single judge county which has
the highest workload, also has the lowest trial rate (consis-
tently below four percent); Erie, with the lowest workload

TABLE 8 -I
rhe, Average Number of Indictments for Each Judge'Varies Overa Wide Range.
Jan-JuneCOUNTY 1972 1973 1974 1975
ALBANY 276 298 115 110BROOME 352 371 432 532DUTCHESS 260 153 230 169ERIE 117' 143 129 122MONROE' 186 174 204 . 263NASSAU 378 345 238 274NEW YORK CITY 370'. 245. 179 192
TABLE 8-11
Diaposition by Trial As A Percent of Total Dispositions7
COUNTY 1970 1971 1972 1973 1974 1975
ALBANY 7.1% 2.2% 7.7% 10.0% 23.3% N.A.BROOME 3.1 2.1 3.6 3.8 3.5 2.8%DUTCHESS 8.0 3.7 5.6 8.6 , 3.8 10.1ERIE 14.9 9.4 19.1 23.3 12.3 N.A.MONROE 10.5 8.4 7.0 6.9 7.5 N.A.NASSAU 2.1 2.2 3.2 3.9 4.6 3.7NEW YORK CITY 3.0 5.6 6.0 6.6 9.0 11.1
TABLE
Misdemeanor Convictions As A Percent of All Superior CourtConvictions
Jan-JuneCOUNTY 1970 1971 1972 1973 1974 1975
ALBANY 20,3% 13.9% 32,2% 25,1% 11.1% N.A.BROOME 14.1 8.7 22.1 16.0. 17.2 15.0%DUTCHESS 22.5 30.4 36.2 8.8 13.2 10ERIE 20.1 26.3 24.1 22,7 32.2MONROE 19.2 22.0 38.7 30.5 3 N.A.NASSAU 28.4 39.1 51.4 41.0 40.6 36.5NEW YORK CITY 44.2 35.9 29.4 25.6 21.9 18.7
N.A. = Not available
Source for all Tables: New York State Division of Criminal justicServices.
14 .

F
-233 -
per part, has the highest 'trial rate (consistentlyabove ten
percent). It is reasonable that a county which cOpinuously
conducts a large number of trials should require relatively
more resources than a county in which the demand for trials
is low. New York City's trial rates tend to be higher than
average but not greatly (See Table 8-II).
We also examined the possibility that the wide range..
among the counties in the number ofindictments handled pei
judge is due to differences in the pattern of pre-indictment
screening. In counties where. screening is not well done, manyf
of the convictions in superior court will be for misdemeanors
rather than felonies. These counties could cope with a higher
workload because the misdemeanor convictions are likely to be
among the easier cases to dispose of.
We found no systematic relationship between misdemeanor
convictions and per judge workload. Some interesting results
were obtained, however, which might begi on other questions
of performance. New York City has shown a steady and signi-
ficant improvement in screening. In 1972, nearly 30% of
Supreme Court convictions were for misdemeanor's. Improve-
ments in each year brought misdemeanors down below 20% of
convictions in the first half of 1975 (See Table 8-III).
Dutchess County has consistently done well since 1973, and
Broome County has also done well in this respect. Nassau
has done badly, but there is a definite trend toward improve-
.ment. Still, over a third of the county's convictions are
for misdemeanors. The rates for Erie and Monroe counties
fall between those for Nassau County and New York City.
24

-234-
The problems in the New York City courts are apparentl,
.not 'due to a shortage of resources in an absolute sense.
Rather, the City's immense Supreme Court system presents
management problems the dimensions of which are not ap-
proached in any other.part of the State. The City's Supreme\
Courts (including the'civil as well as the criminal branch
both are-under the same management) have an annual budget of
$47 million and employ 1,800 people in ten different facili-
ties in all five boroughs..
The development of a modern management apparatus, using
toolS'APRAicable to the management of large and complex
institutiOns, should be a high priority. Some of.the prob-
lems faced by managers in the court system suggest a similar-
ity to the problems of managing an airline: a high volime
..calendering system for a large number of courtrooms, analagOus
in some ways to an airlines reservation system; the manage-
ment of extensive calendars in crowded courtrooms with the,
need to minimize waiting times, analagous to a traffic sys-S.
tem at an airport; and the scheduling and physical movement
of lawyers, witnesses, and documentation, analgous to assign--
ment of 'flight crews:and perhaps aircraft. A system of such
complexity must be supported by techniques. such as simulation
apd 'other operation's research-methods, which will require a
significant investment.
The appointment of strong and knowledgeable administra-
tive judges has put the City system in a position to be a
responsive client for the.initiatives of a bold management
group.

Appendix I
Gaps in the Measurement of theProbability of Punishment,
The'probability of piihishment (P) is- the likelihoodthat Aperson coMmitting a crime will be apprehended,
: convicted, and sentenced'to,prisonfor commission of thespecific crime.
Let:'*"
PR Probability Of a crime being reported to 'the police
PA Probability that arrest will result from a reportell%crime
PCA' Probability that ,a person will be convicted inthecourts after'Arrest
Probability that a person convicted of the crimebe sentenced to prison
-7t.\
The overalrrobability of punishment (P) is the productof these Sour,prebabilities:
P ) (Pc) (Pp)A
Similarly, interim probabilities can be obtained by,
multiplying'together any sequential 'combination of theSeprobabilities. For example, the probability of a defendantreceiving a prison sentence after arrest (Pp/A) is:
= (Pc) (Pp)PP/A--
This Report focuses on the p bability of prison sentenceafter arrest for drug and non-dru felonies separately, andisolales,only those convictions d prison Sentences that:oCcurreplh.the superior court'o the State, i.e. After an'1*lictMent has been returned. The limitation'is necessarybecause of limitations, in the ave4abilitY;of!data.,-a
First, data on processing felony arrests in the lowercourts, i.e. prison to indictment, are presently unavailablefor many areas of the State, including New York City.Although the likelihood of a defendant receiving a, prisonterm, conviction in the lower courts is prob &bly lessthan after conviction inthe superior courts,'the number ofprison, sentences issued in the lower courts may. change thetotal number of prison.. sentences significantly, and therebyaffect the probability of punishment.
259-2970 - 713 - 16
243

-236-
The information that, is required for_calculating PRis also generally unavailable. The,Law EnforcementAssistance Administration began conducting surveyS in 1973which perMit estimation of the rate at which-all seriouscrimes that are reported to the police, but these data arenow only available for New York City, and Buffalo and only
. for one year. From the cross-jurisdictional data that is,:available, it ap rs.'that only about half,of,the.seriouscrimes are'reported to the police.
The data used in the calculation of Pp/A were madeavailablehy the. New York State Division of Criminal JusticeServices (DCJS). The Prgoject was given access to unp647lished material collected by the Statistical Control Unitof DCJS for the years 1970 through 1974, and for 1975
.,. where. available.*:The,StatiSticl Control Unit receivesmonthly activity reports from each criminal justice agencyin,the State'(police, district attorneys, lower courts, andsuperior courts). The ports consist of a cross-tabu-lat,ion-ef the number o cases acted upon at a specificstage of the criminal-justice process and the most serious.charge facing the defendants at that time. Althoughyearly summaries of these data have been*presented invarious.state and.court pUblications, the data have notbeen used for analysis of activities in specific countiesor of particular crimes.
A brief description of the data included in the calcu-lation of the probability of punishment follOws. In eachcase, the data were obtained for NeW York City and for sixcounties outside of New York City that were analyzed inthis Report.
,-- Arrests. The number of.adults arrested in each ofthe counties for drug and non-drug felonies.Included are arrests made both by local and Statepolice.
4 . .
-- Indictments. They number of individuals indictedfor drug.and-non2drug offenses, as reported by thedistrict. attorney in each of the counties. Eachof the five'New York City district attorneys reportsseparately to DCJS. The number of indictments'servesas an indicator of the proportion of'felbny arreststhat reach the superior ,courts, and 'conversely theproportion of felony arrests that are disposed of inthe lower criminal courts.
*The Statistical Control Unit was made part of DCJS onJanuary 1, 1975. 'Before that date the unit was a divisionof the New York State Department of Correctional Services.

-- 4UPSrtor Court Convictiont. TThe number of individuals ,.._;
' convicted of drug and non-drug offenses in'each countywas obtained from the report on dispositions-sub,.
. mitted to DCJS by the 'chief' superior court clerk ofeach. county: Because thess,reports include the numberof'dispositions reached as a result of.trials, pleas,and dismissals, they were also utilized in the sec- -.
.tions,of the report analyzikg resources and workload.of the superior.court.
.
-- Prison Sentences. The number of prison se tences both.to local and State prisons was obtained fro the re-,ports.J.of:Naentencesissuedio defendants cOn ictedin tne-superior courts.: These repdets are4iSo sub-'mitted to DCJS by the chief superior court clerk.:.
;,:, of each county.
A perfectly accurate'formulation of the probabilityofpunishment would require the follow-up of individual crimesor arrests to see if an arrest was made for a specific knowncrime, and whether a conviction and prisOn sentence resulted.Given the present recOrdr-keeping systems in'the",counties,this is not a,feasible approach. Instead, weliave compared'aggregate .data.from different stages of the'process coveringthii 'same time periods. Most arrests occur a shokt time 'after a crime is committed, and a majority of the arrests'are disposed whll within a.year of the time that the crimeOccurred. Onlr in circumstances in which the total numberof arrests is small (as .with the number of.drug arrests in`the'smaller upstate counties) might the probAbillty ofpunishment be seriously biased because the dispositions inone year might bear little relationship to crimes committedduring that year.
245

Appendix, II ,
Measuring Changes in the Pending Caseload,of theNew York City System Courts
.
C nflicting data -from-several public sources On 4ndict-!{Went and dispositions in the City's courts make the measure-"merit of workload -end productivity difficult.
, !
A brief de$Oription of the sources and.t es of datathat are coIredia. follows:
Neii.;YOirk State TrIvision'or'Criminal stice ServicesFelony IndictMent and Prosecution Report (Felony '
Processin).
Data covering indictments and diSpositions ar*Ipb-tain from individual indictment and dispositionfo submitted by' each of the City's five.4491tri t attorneys to DCJS.- Half th'e form ig°Jebtnitted
r a the ti .of indictment, and .half at completion-.o the c se (sentence, acquittal, dismissal, etc.). 7 .`
S' is es-tAe reports quarterly, beginning in. e emte .i;1973, and 'the only full year of data thati avai able is for 1974. Data on specific offensesa e re kted,
-- New York State Division Of Criminal Justice Services:District. Attorney- Report 'on Grand Jury (Form C).
These reports consist of tabulations of actions taken'by grand, juries. The reporting form cross-referencesthe type of offenee:with which the defendant ischarged with the action taken by the grand'ufy-'(in-:dictment, dismissal, retUrned.t.o..:lower courts). Eachdistrict attorney.submits'the form:each month to'DCJS.
-- New York State Division of Criminal Justice Services:Outcome of Procedures in Supreme Court (Form D).
Thislteport is identical in format to the "Form C."but substitutes the method of disposition (e.g. dls-positions obtained as'a result of trials,, pleas, anddismissals) for the action of the grand jury. As inthe Felony- Processing Reports, dispositions arecounted at the time of sentencing'or 'Other final,action. The types of sentencing issued to convicteddefendbhtS (e.g.- state and local prison terms, pro-bation, aneldischarge) appear oh an accompanyingform (Form E). Theseforms are submitted each monthto DCJS'by. the chief supreme coutt.olerk in each
'`borough.' The disposition method is cross-referenced..by the type of crime charged on the disposed indict-ment.'

-239-
New York State °thee of. Court Administration, CourtInformation Service: Supreme Court,(Criminal Branch)Statistical Summaries for New York City.
These-monthly repots cover indictments and disposi-tions occurringiWiach borough of New York City.Data are obtained from forme filed weekly by theclerk of eich.Supreme Court part with the New YorkState Office of Court Administration. Nuinformatiohon.specific charges are available from these reports.
As indicafdd-on-Table are-significant differences between the activity represented in the three'reports. The number of reported indictments and disposi-tions and.the resulting change id backlog differ by asmuch as 5,000 cases for.the same year. ThUs, resolutionof these differences was required before analysis could
'progress.
We found. it' impossible to reconcile the exact countof indictments and dispositions between sources. However,we were able to explain the direction of the differences,'and in. consultation with the New York State Office ofCourt Administration settle on a procedure that yields'what we believe to be the best estimates of the number of
drug itiqctments and dispositions.
We found-that the Statistical Summaries issued by theNew-York State Office of Court Administration contained about15% more dispositions than were. reported on. the Form D re-ports during the six-year period. of 1970 through 1975, butonly three percent more indictments than the district attor-
-neys reported on Form C. As a result, the StatisticalSummaries show considerably less of a-backlog increase thanihe data on Form C and D (an increase of 10,417 cases overthe six year period compared to 23,210 respectively). Thechange reported in the Statistical Summaries is considerably'closer to the 'current backlog level than that derived from.FOrmst and D. The New York State Office of Court Adminis--tration reported that 12,038 cases were awaiting dispositionin theSupreme Courts on January 4, 1976.
In large measure, thezdifference in reported disposi-tions can be accounted for by the varied reporting-practicesfollowed by the county clerks in the filing of the Form D. report. The Statistical Summaries have maintained a con-sistent definition of the-unit of count (the defendant-indict-
2 4 .

,went), which maximizes-the pagibt of dispositions.* On theother hand, the definition ofrthe unit of count varies fromborough to borough, and may have changed,over time. Someboroughs count only defendants (as is instructed on the .-form) while other boroughs count-defendant-indictments.
.AnalyeiS of the'data fdr 1975 revealed that about halfthe difference in reported dispositions during that yearcould be accounted for'by the fact that one borough countedthe number of defendants having their cases disposed of in-stead of the number of defendant-indictments.
The indictments and dispositions reported in the Statis-tical Summaries originate with the same source (the indi-vidual part clerks), while Form C is submitted by the countydistrict attorney 'and Form D by the chief county court clerk.A major effort of the New York State Office of.Court Admin-istration and of the Office of the New York. City Administra-tive Judgejkas been the establishment of.clear reportingprocedures for the production of the' Statistical Summaries.Thus, we are confident in using data froM the StatisticalSummaries to represent the Supreme Court workload.
Unfortunately, neither the Statistical Summaries northe raw data forms from which the summaries are.createdrecord the charge facing the defendant: To estimate thenumber of drug and non-drug indictments' and dispOsitions,the proportion of actions accounted for by drug chargeswas calculated from the data on Forms C and 0,...and appliedto the total number of indictments and dispOsitions reportedin the Statistical Summaries. This procedure was adoptedafter discussions with analysts at the Office of Court Ad-ministration confirmed that while the absolute number ofactions reported -in Forms C and D may be far from,accurate,'there was no reason to expect that one type of case wouldbe any more likely to be reported than another.
*Under the definition of a dpfendant-indictment, one defendantlisted in two different indictments and two defendants listedon one indictment both count as two defendant-indictments. Ifdefendants were counted, then the first example would resultin a count of one defendant, but the second would count as twodefendants.
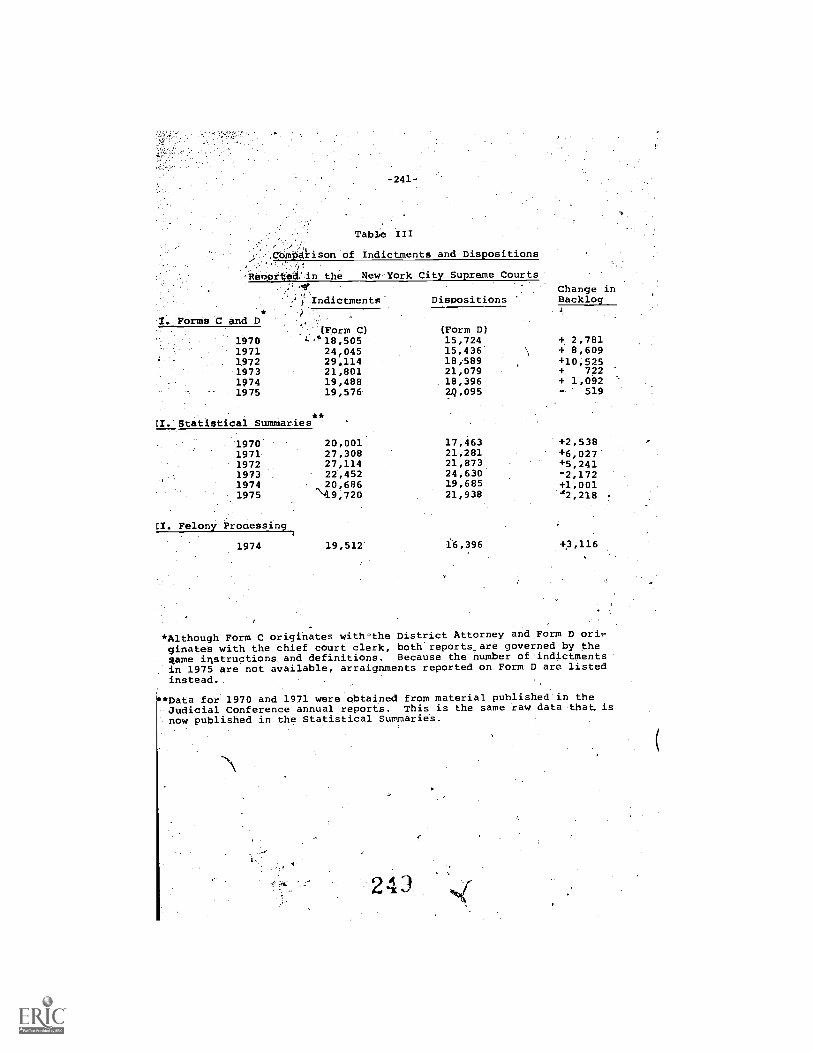
-2417
Table III
:ChMiti4ison of Indictments and Dispositions
'RegOited%in the New York City Supreme Courts
*I. ForMs C and D
Indictments Dispositions
"(Form C)I. '-''18,505
24,04529,11421,80119,48819,576
(Form D)15,72415,436 1
18,58921,07918,39624,095
197019711972197319741975
**
:I.'Statistica1 Summaries. .
1970' 20,001 17,4631971 27,308 21,2811972 27,114 21,8731973 22,452 24,6301974 20,686 19,6851975 \49,720 21,938
CI. Felony Processing
19,512' 36,3961974
Change inBacklog
+ 2,781+ 8,609+10,525+ 722+ 1,092- 519
+2,538+6,027+5,241-2,172+1,001'2,218
+3,116
*Although Form C originates with-the District Attorney and Form D ori7ginates with the chief court clerk, both reports, are governed by theqame instructions and definitions. Because the number of indictmentsin 1975 are not available, arraignments reported on Form D are listedinstead.
**Data for 1970 and 1971 were obtained from material published in theJudicial Conference annual reports. This is the same raw data that, isnow published in the Statistical Summaries.
243

Methodology for New York City Supreme CourtProduct vity Calculations
T1, .T2 = percent ofldisposiiions accounted for by trialsin tl and t2, etc. °Subscripts can stand foreither time periods or for groups of courts (parts).
Pli P2 '
pl
percent'of dispositions.accounted for by non-triardispositions in tl and-t2, or for court.groups 1 and 2.
= 1.00-T1, etc.
ST12 length of time in days it takes to dispose of acase by trial in tl, t2.
STN _ Total days on trialTotal trial dispositions
Spl'S P2 = length of time in days it takes to dispose of anon-trial case in tl,. t2.
qp - Total court days not on triawm" Total non-trial dispositions
S1, S2 = length of time in days it takes-to dispose of anycase in tl, t2.
S1 T1ST1 + P1Sp1
S2 a T2ST2 P2SP2
Yl, Y2 .= proportion of the year covered by tl, t2.
e.g. Yl = 0,5 if tl is 6 months
Then X1 = output per court day = 1/S1
X2 1 /S2
X can #ange because the mix of trials and otherdispds1 ons changes, or because the time it takesto dispose of a trial or other method changes, orboth
Assume no excess capacity in 1974
210 days/year/part
Several analyses can.be performed with the data:
25_

-243--
Calculate the change in the number Of parts required to dispose'Of all indictments handed up during t2.
ASsume T1, Pi, ST1, Spl, i.e. trial mix and productivityaaTort change.
C2 - number of 'courtrooms (parts) required in £2
511 - number of dispositions in tl
12 - numberof indictments in t2
Cwt number of parts required to dispose of the indictmentsin time t2, given the trial rate and productivity of tl
ilCw - change in parts required because of workload changesalone, k:6-. parts required to leave backlog whichexists at the beginning of t2 unchanged
C1. actual number of parts-in tl = D1S1/210/Y1
a. Cwt = (I2S1/210)/Y2
b. ACw 7 Cw2-C1ll
Calculate ACT, the change in the number of parts required becauseof changes in the trial:non-trial mix alone.
Ass um e ST1, SPl, D 1
a. 82.1 = T 2 S T1 + P2SP1 (the new trial:non-trial mix and the
old times required to dispose of cases)
S2.1 - length of time in days it would take to dispose ofa case given productivity of tl but trial mix of t2
b. CT2 = D1S2.1/213/Y2
c. AcT = eT2
Calculate AN C , the change in the number of parts required becauseOf changes inxthe time'i es to dispose of cases alone.
Assume T1, P1, D1, 1, 1J.
a. 51.2 = T1ST2 + P1Sp2 (the new times required to dispose ofcases and the old trial:non-trial mix)
51.2 = length of time in days it would take to dispose of acase given the trial mix of tl but the productivityof t2.
251
0'

b. Cx2 D1S1.2/210/Y2
c. A cx Cx2-C1
-244-
Calculate C2, the number of parts required in t2-as aresult ofall - changes combined: workload, trial:non-trial mix, Snd-time.required to dispose of cases.
C2' = Ci + Cw + CT + Cx
This calculation assumes independence between the time it takesto dispose of a case, case volume, and trial:non-trial mix.
o
2
Source of basic data: Ofof New York City AdministJudge

4
SENTENCING PATTERNS UNDER THE 1973 NEW YORK STATE
DRUG LAWS _s
t
A Siarff Working Paper
of the
Drug Law Evaluation Project
This paper was prepared by Philip Richardson
and Martin Heilweil.
October 1976
253

TABLE OF CONTENTS
INTRODUCTION '246, .
.SUMMARY OF FINDINGS
I. 'PATTERNS OFCONV-CTIONS TENCES FOR DRUG OFFENSES . 252
,A. Statewide Trends Druonvictions and Sentences . 252'.
Disposing of Clas Felony Cases 256=
Non-Prison-Sentences in',Class.A Cases
Projections of Old Law Patterns to New Law Cases
New York City and the Rest of the tate COmpared
B.' Severity of Sentences
C. Impact of the Plea Bargaining Restrictions: ....
Sentences in Cases Disposed by Plea and Trial
Cases Below the Class A Level
\%, Pleas and Non4rison Sentences
II. CHARACTERISTICS OF OFFENDERS SENTENCED TO PRISON
A. Arrest History of Offenders 240
B. The.Quantity of Heroin Involved in Cases .. . 293
C. Age of Offenders i 296
D. Type of Drug Involved in Cases ( 299
Appendix: Sample Design and Method 302
260;
.; 262
. 267
271
282
284
286.
290
25.1

INTRODUCTION
Comprehensive revisions of New York State's drug laws
loecame effective on September 1, 1973. The new'statutes
reclassified many drug offenses as serious felonies, made
:prison terms mandatory-upon'conviction of many drug crimes,
'restricted plea bargaining by defendants indicted for cer-
tain drug felonies, and reinstituted recidiviSt sentencing
provisions in Nee York State.*
The first section of this Staff Report presents data
concerning statewide sentencing patterns for drug offenses
between 1972 and mid-1976. Among the questions to be addres-
sed in Section I are the following: Has there been a notice-
able increase in the percentage of persons sentenced to
prison following conviction of a drug offense?' How many
persons are being.convicted and sentenced to prison for class,
A felonies? What has been the impact of the new plea bargain- '
ing restrictions on conviction and sentencing patterns in drug
cases? -Finally,-has there been a significant increase in.the
length of prison terms imposed on drug offenders since the
enactment df the new legislation?
Section II focuses on a description of persons who have
actually been convicted and sentenced to prison under the new
laws.**
*Specific provisions of the 1973 legislation are listed in theAppendix to this volume.
*This Report supercedes the results reported, previously in"Convictions and Sentences under the 197.3 New York State Drugand Sentencing Laws: Drug Offenses," a Staff memorandum of theDrug Law Evaluation Project, December 1975
255

-248-
When the 1973 legislation was initially introduced,
- -concern was expressed that the pled bargaining limitations
and mandatory sentencing provisions.wQuld bear)ildst heavily
on younger offenders and onoffenders with no prior criminal
history. Under the old laws, judges and prosecutors frequent-
ly exercised discretion in favor of such offenders by pro -
viding non- prison sentences. The new laws, however, have
curtailed the discretion of judges and district attorneyd.:
Many drug defendants are no longer able to plead to a charge
that will allow a non-prison sentence, Prison sentences have
been made mandatory for many types of drug offenses, regard-
less of the age or prior record of,,the defendant. In order
to throw, light on these questions, this report examines data
on the age distribution and prior arrest histories of persons
sentenced to prison under the new laws.
Information regarding the types of drugs involved in
cases which led to convictions and prison sentences is also
presented. Under the new laws, mandatory prison terms and
plea bargaining restrictions are prescribed not only for
certain kinds of narcotic offenses, but also for many types
of offenses which involve non-narcotic drugs such as hallucino-
gens and stimulants. Under the old laws, prison sentences'
were generally less likely to be imposed in cases involving
non-narcotic drugs than in cases involving heroin or methadone.
Critics of the new legislation have argued'that the stricter \
penalties for drug offenses would probably have their great-
est impact in cases involving drugs other than heroin.
25G
Data ana Me hod,
Two types of data have been collected for this Report.
Wherdver possible, the Report relies upon official statis-
tics .for aggregate data regarding drug offenses and diapos1-
:tiormin New York State. Host ofthis data is made available
3a,..he New York State Division of.Criminai Justice Services
:411sOugh'itsguarterly publication, New York State F
.Processing.
The Report also relies upon data collected independently
::by the Drug Law Evaluation PrOject. In order to answer many
it became necessaryof the guestiOns
obtain
and drUg
official
-Asample
Convictions in superior courts between 1972 and 1975 through^:
out Nevi, York State. This sample represented about 10% of all'7%
the drug felonyindictments which resulted in convictions
during this period,. Detailed information about each of the
addreesed by the
far more
Report,
specific information'about drug offenses
offenders in New York State than was available from
statiatics.. Acdbrdingly, the Project staff assembled
of approximately 1,6000diug' datles whidh resulted in
sample cases was obtained from pre-sentence reports and other
relevant doadments.*
*An outline of the sample desigh is contained in the Appendixto this paper.
25
-250-,
SUMMARY OF FINDINGS
Substantial improvement was made during the first half
of.1976 in processing cases under the 1973 drug law. Back-
logs of new law cases in-superior courts stabilized early
in 1976 after increasing dUring1974'and 1975.. The number
of StateWide prison sentences uring 1974 and 1975 fell
below sentences under the. Col .drug laws, but early 1976 saw
-a significant increase inthe number of prison sentences,
Improved performance by.the courts in processing ciassA`..,,
felonr!cases was responsible for the increases.
-- The risk of imprisonment following a drug conviction.' rose from about 33% under the old law to44% in 1975,
and to 55%.iri,early.1976.o
rise in the mportance of class 1 convictiks inNew York City is primarily responsible for the risein the risk of a prison term.
In 197'5, nearly 20% of those convicted of class Afelonies received non-prison sentences.
t
The recent'amendment to the 1973 drug laws, whichrelaxes plea bargaining restrictions, promises tolead to a reduction in the existing backlog of classA cases. While the rate of imprisonment may not de-cline under the recent change, length of time servedis certain to be reduced.
If performance of the court system under the new laws
had-matched old law standards, up to 4,200 prison sentences
could have resulted compared to the 2,551 sentences actually
imposed.
-- The increase in the likelihood of a prison sentencefollowing conviction was more than offset by declines
253

in the success with which convictions were'bobtanedand in the ability of the courts to.keep pace with-new indictment&
1.
Offenders convicted of class A felonies faced a higher.
risk of impriarmmOnt than those conPleted.of eimilar7offen-.
low under tWOld law. Thosp convicted of less serious drug
cross, however, found their risk of imprisonMent reduced. .
Thus, there has been an apparent:reallocation of prison
'resources' in fayor of the more seriOukcases.0
. Offenders sentenced tb pnison,under the 1973 laws are
likely to spend more time Institutionalized than offenders
sentenced under. the old laws.
-- Available evident, wstro ly suggests that thosesentenced for claMp A cr s will spend some moretime in prison under O. new laws. There is notlikely to be a &Wee in time served by thosesentenced for non -Class A'offenses.
The plea bargaining restrictions imposed by the 1973
laws haver been responsible for increasing the risk of a
prison.teiM:in class },cases. However, the restrictions
have not had a large 4ffect in restricting bargaining where
statute does not specifically appiy.
Between 75% and 80% of all indictments to A-I andfelonies are disposed of.below the original
indictment charge.
Among class A-III convictions, there were substantiallymore long sentences imposed in cases which began asA-I indictments than as class A-II or A-III indictments%But the chances of receiving the lowest permissablesentence was the same for all three groups.
There was no change' -from the old law in plea bargain-ing patterns for cases below the class A felony level.
The benefits of accepting a plea in class A-III casesinstead of going to trial were evident outsideNewYork. City, where chances of receiving the lowest
159497 0 - 7B - l7 259
7.

iA-252-
' 1
permissable sentence were twice as high for.thowho plead as fo those who were convicted by.trial,Thete was, no.00 rable. "cost" of going' to trial fordefendan n Ne York City. . 4
Surtorisingl ttie difference in Offender characteris
tics was discovered between old law and new law cases.
-- Well over one half, offenders sentenced underboth Sets of laws he previmisfelony arrest E.,
Tfi likelihood of reci4IYing a prison,term-increasedfor all offenders, regardleSs of agei prior arrestrecord, or type ofdrUg_involved in the Case-. Aswould.be expected, thd;risk of. prisoninCreased Mostfor fist offenders (particularly in New York City),,but it did not increeseIfor the'young,' Apparently,the. extension of the,YOnkhful Offender. provisionsto clnewA-III offendere in 1975 blunted whatevertendency there may have been to sentence 16-18 yearolds to prison.
rs,h.
- - There was wile differencCbetween the old and new lawin the quantity of heroin involved in cases which ledto prison sentences. Roughly:60% of both old and-newlaw cases involved less thah 1/8 ounce of heroin, butthe share of oases involving over 1 ounce of heroinnearly doubled under the new Taws (from 13% to 22%).
2 E3
-253-
PATTERNS OF CONVICTIONS-AND SENTENCES FOR DRUG OFFENSES
A. STATEWIDE TRENDS IN DRUG CONVICTIONS AND'SENTENCES .
During 1974 and 1975, the first complete years in which
the new laws were in operation, the number of prison senten-
ces imposed following conviction of a drug offense in New
York State superior courts fell below the 1972 and 1973 levels
(see Table I)..* In 1974,the number of'prison sentences for
drug offenses fell 30% from 1973 levels. In 1975, the number
of prison sentences rose substantially, but stilf remained
belowIthe 1973 levels. Further increases were recorded dur-
ing the first half of 1976.
The reasons for the decline in prison sentences for drug
offenses since 1972 have been reported on elsewhere and are
the subject of continuing analysis, by the Project.** Briefly,
the decline.in the number of prison sentences appears to be
the result of a sharp decline,inthe number of drug convic-
tions (a 35% drop between 1973 and 1974). The decline in
the number of drug convictions, in turn; seems to be the
;---,eutoome of the following factors: a decline in the number
of fe, ny drug arrests and indictments (because the courts
were still tking on 1972 cases during 1973), the failure0
*In this report, "prison sentences" include sentences to bothState correctional institutions and to local jails, unlessotherwise indicated.
**"The Effects of the 1973 Drug Laws on the New York StateCourts," Staff Working Papers, No. 3. ,
-7-
261

-254-
TABLE I
ALL !MOO CASES IN NEW YORK STATE, 1972-1976* -
19761.
"ir1972 1973 1974
c,Jan-June1975
Felony Arrests 19,269 15,514 17,654 15,523 8,166
Indictments 7,528 5,969 5,581 4,276' 2,073
DisPositiOns 6,991 5,580 3,815 3,957 2,173
Coryictions 6,033 4,739 3,085 3,147 1,724
Prison 2,039 1,555 1,074 1,369 945Sentences ,
(As a percentageof convictions)
33.8% --3-2-134 34-8% 43.5% 54.8%
*Notes and definitions for this table are presented on the
following page.
--

-255-
NOTES AND DEFINITIONS FOR TABLE I
Felony arrests refer to the number of persons arrest-ed who faced a drug charge as the most serious charge.
Indictments, dispositions, convictions, and prisonsentences prior to 9/1/73 refer to defendants. Figuresafter 9/1/73 refer to defendant-indictments. Whendefendant-indictment is used as the unit of count, adefendant who is indicted in two separate indictmentsis counted as two indicted defendants. Figures fordrug dispositions and convictions during 1973_are notavailable from the Felony Processing. Reports. Thesefigpres.are estimates by the Project.
Indictments and dispositions refer only to cases dis-posed of on merit. They do not include indictmentsdisposed of by consolidation or on other non-meritgrounds. Those disposed of by consolidation, were esti-mated by the Project for 1974, 1975, and 1976.4
Convictions refer to convictions on drug charges only.They do not include convictions on non-drug chargesfollowing a drug felony indictment.
Prison sentences refer to sentences imposed after con-viction on drug charges. They include both State andlocal prison sentences.
2E)

-256--
:414wof the courts to dispose of new law drug cases at a rats
comparable to old law dispositions, and a decline in the risk
of conviction, llowing indictments for drug crimes, a decline
due principally to an increase in dismissed cases. These
factors have been offset to some extent by a substantial
rise in the risk of going to P rison once a conviction is
obtained.
The proportion of persons sent to prison following con-
viction for a drug offense in 1974 (34.8%) remained roughly
consistent with 1972 and 1973 levels. In 1975, this propor-
tion rose to 43.5%. During the first six months of 1976, the
risk of imprisonment rose further to 54.8% so that in mid-
1976 the likelihood of going to prison after being convicted
of a drag offense was 50% greater than it was under the old
drug laws.
Because of the recent amendment to the 1973 drug laws,
the half -year data for 1976 do not provide a reliable basis
for estimating the full year's results. In July,,1976, some
of the plea bargaining,restrictions of the 1973 legislation.
were abandoned and defendants indicted on class A -Ill felonies
n w plead to a chargebelow_the_cla,ss_AJevel.--This
amen ent can be expected to have a significant effect on
the length of prison terms, .though perhaps not on the propor-
tion of convicted drpg defendants sentenced to prison.
2 0 AI

-257-,
Disposing of Class A Felony Cases
The figures in Table I reveal that there was no
appreciable increase in the percentage of persons
sentenced to prison for drug offenses during 1974.
'.The slowness to respond to the mandatory prison pro-
visions can be traced primarily to the courts' lack
of success in disposing of new law class A indictments --
cases which, with a few exceptions, result in automatic
prison terms on conviction. Table II, for example,
indicates that while class A cases 'accounted for ap-
proximately one-half of all new law drug indictments
during 1974 (3,007), they comprised fewer than one-third
(620) of all new law dispositions and less than one
quarter (322) of all new law convictions.
Class A felony cases were disposed of at a much
improved rate during 1975: new law'class A dispositions
rose from 620 in 1974 to 1,735 and accounted for 44% of
all new law drug dispositions last year. In 1975, ap-
-proximately 37% of all new law convictions were con-
victions for class A felonies.
The increase in the number, of class A drug disposi-
tions was the primary factor in the overall increase in
the prison rate* for drug offenders in 1975. In 1974,
about 92% of persons convicted of class A felonies were
sentenced to prison (see Table III). -But, because of
* The "prison rate" is defined as the percentage of convicteddrug defendants sentenced to prison.
265

TABLE II
THE FLOW, OF NEW LP1 DRUG CASES IN SUPERIOR COURTS, B CLASS OF FELONY
Class A Felony Cases Other Neer Law Cases'
Total New Law Cases
Jan-Jun Jan'-Jun Jan-Jun.
. 1974 1975 1976 1974 1975 1976 1974 1975' , 1976
Indictments 3,007, 2,682 1,333 2,955 2,201 1,011 5,962 4,883 2,344
Dispositions 620 1,735 1,320 1'1373 2,184 1,033 1,993 3,919 2,353
C6nvictions* 322 1,005 803 1,098 1,736, 838 1,920' 2,741 1,641
Prison Senten- 296 798 683 206*** 6*** 202*** 502 1,164 885
ces
1
Note: YilferenteslaWeen Table I and Table II are accounted for by. old law (ore-1973 law)
drug cases, which are included in Table I but not here,
*Conviction charge
**InCludes sentences to both State and local prisons.
***The figtires for prison sentences in none, cases' are based on a) known prison
sentences for BAD, and E felony convictions, plus b) an estimate based upon
the sample ata of the, number of prison sentencesimposed for A misdemeanor
convictions.
Source: New York State Division of Criminal Justice
1-1 seivices.0)
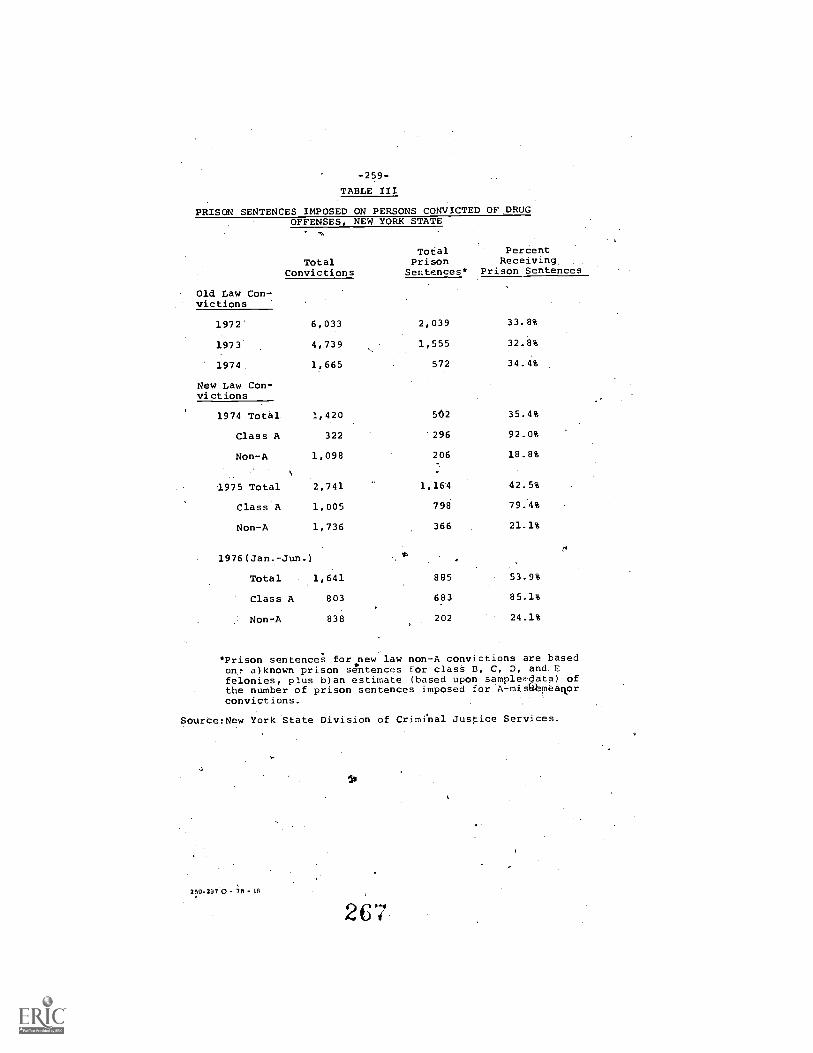
-259 -
TABLE III
PRISON SENTENCES IMPOSED ON PERSONS CONVICTED OF DRUGOFFENSES, NEW YORK STATE
TotalConvictions
Old Law Con-victions
Total PercentPrison Receiving.Sentences* Prison Sentences
1972'
1973
1974
6,033
4,739
1,665
2,039
1,555
572
33.8%
32.8%
34.4%
New Law Con-victions
1,420 542 35.4%1974 Total
Class A 322 296 92.0%
Non-A 1,098 206 18.8%
1975 Total 2,741 1,164 42.5%
Class A 1,005 798 79.4%
Non-A 1,736 366 21.1%
I4
1976(Jan.-Jun.) w.
Total 1,641 885 53.9%
Class A 803 683 85.1%
Non-A 838 202 24.1%
*Prison sentences for new law non-A convictions are basedon, a)known prison sentences for class B, C, D, and. Efelonies, plus b)an estimate (based upon sample,,data) ofthe number of prison sentences imposed for A-misqbmeagorconvictions.
Source:New York State Division of Criminal Justice Services.
350 -2970 - - In
114
267

-260 -
the small number of class A cases disposed of, the number
of prison. sentences for class A convictions remained small
(296) and had little effect on the overall number of prison
sentences imposed. In 1974, in fact, prison sentences for. ...... ,.
class A convictions accounted for only 28% of all prison
J//
Q. terms imposed on drug offenders.
The increase in the number of prisonlisentehces from
'1,074 in 1974 to 1,369 in 1975 was accounted for solely by
the increase in the number of prison terms imposed in class
A cases (from 296 in 1974 to 798 in 1975).- In 1975, prison
sentences for class A convictions accounted for almost, 80%
of all new law prison sentences. Even with this increase,
it was not unjil 1976 that class A cases were disposed of
in numbers large enough to match class A indictments.
Through 1974 and 1975, therefore, the courts' backlog of
class A cases rose.
The lag in the disposition of class A cases during 1974
and 1975 appears to be the result of an increased demand
for trials among class A felony defendants, a situation
which seems to be a direct result of the new plea bargain-
ing restrictions. In the'first six months of 1976, however,
substantial progress was made in stabilizingthe-b-acklog
class A cases. Table II indicates that the number of class
A indictments disposed of in the first.half'of 1976 (1,320)
almost matched the number-)of new class A indictments (1,333).
The backlog of new law cases below the class A level was
See discussion in "The Effects of the 1973 Drug Laws on theNew York State Courts," Staff Working Papers, No. 3.

-261-
also significantly reduced. As a result of these changes,
there were proportionally almost as many dispositions of
class A cases in the first six months of 1976 as there were
indictments.
Indications.from judges and prosecutors are that back-
logs of class A cases are currently being reduced quickly
by resorting to the more lenient plea bargaining provisions
of the 1976 amendment. Under this. recent change, defendants
indicted for class A-III felonies can plead to class C
felonies and nay be sentenced to local jails for definite
_periods not exceeding one year.
Non-Prison Sentences in class A Cases
The fact that the chances of being sentenced to prison
for drug .offenses rose to only 43.5% in 1975 oan be account-
ed for partly.by the continued backlog of class A cases. At
least .two other factors account for the relatively slight
increase in the prison rate in 1975. One is that some of
the class A indictments which were disposed of were dis-
posed of below the class A level -- and so were not subject
to mandatory prison terms -- or resulted in dismissals. Only
58% of all class A indictmentsdisposed-b-rdlitirig-1-478-----'--.
resulted in...actual class A convictions.
Another reason for the relatively small increase in the
1975 prison rate during 1975 was the low imprisonment rate
for class A offenses, only 79% compared to 92% in 1974.
Table IV presents data on the types of sentences imposed on
defendants convicted of class A felonies in 1975. About 19%
of defendants convicted of class A felonies were placed on
2C

-262 -
probation (17.7% in New York City and 21.5% in the rest
of the State). In 1974, in contrast, only 7.5% of con-
victed class A defendants received probationary terms (5.4%
in. New York City and 12% in the rest of the State).
TABLE IV
SENTENCES FOR CLASS A CONVICTIONS, 1975
Total Prison ProbationConvictions Sehtences Sentences Other
New York City 694 (100%) 554 (79.88 123 (17.7%) 17 (2.4%)Rest of State 311 (100 ) 244 (78.5,) 67 (21.5 ) 0 (0.0 )
Total 1,005 (100%) 798 (79.4%) 190 (18.9%)'17 (1.7%)
Source: New York State Division of Criminal Justice.Services.
Under the 1973 legislation, lifetime probation terms can
be granted to defendants convicted of class A felonies if
they provide information considered useful to the prosecutor.
In dition, an amendment to the laws made in 1975 extended
Youthful Offender treatment to 16-18 year old defendants con-
victed of class A-III offenses.* This,amendment means that
convicted class A-III defendants within the 16-18 year age'
group can now be granted probation, regardless of the infor-
mant requirements. Since A-III convictions aocounted for
041 (843) of all class A convictions in 1975, the extension
of Youthful Offender treatment to convicted A-III defendants ,
*Youthful Offender, status permits a sentence to probation for16-18 year olds, and does not result,in an official "record ofcriminal conviction." It is not available for 16-18 year oldsindicted for class A-I or A-II felonies.

-263-
was an important factor in the decline in the prison rate
for class A offenses.I
Granting.Youthful Offender probation sentences also
appears to have had an impact on the overall age distribu-
tion of defendants sentenced to prison under-the new laws.
Of a1,1 16-48 year old defendants convicted of class A drug
felOnies'in 1975, for example, only about one quarter received
prison terms. In 1974, the comparable figure was almost 70%
(see Section II).
In the first half of 1976, the imprisonment rate in class
A cases increased to 85%, but still remained below the 1974)
level. Probation sentences were imposed on about 14% of all
persons convicted of class A'offenses. In New York City, about
11% of all defendants convicted of class A felonies received
probation. In the rest of the State, about 14% of defendants'
convicted of class A offense's were granted probation terms.
Projection of Old Law Patterns to New Law Cases
Sentencing patterns under the new laws have been influenced
by three factors -- disposition rates, conviction rates, and
imprisonment rates. One way of roughly gauging the separate
impact of each of these factors is to estimate the number of
prison sentences that would have resulted if the old law rates
had prevailed under the new legislation. The appropriate
factors are listed in Table V.
For example, if all three 1972 rates had been maintained
under the new laws, a total of 3,233 prison sentences would
have resulted from the 11,930 new law indictments disposed of
on their merits, compared to the 2,551 prison sentences whiCh
actually occurred.
The role of changes in each of the factors can also be
2 1.

-264-
TABLE V
DISPOSITION RATES, CONVICTION RATES, AND IMPRISONMENT RATESUNDER THE OLD AND NEW LAWS
Old Law New Law1972 1974-June 1976
Ratio of Dispositions toIndictments: "Disposition Rate"* 92.9%
Ratio of Convictions toDispositions: "Conviction Rate"** 86.3%
RatiO of Prison Sentences toConvictions: "Imprisonment Rate"
Number of Indictments
Number of Prison Sentences
33.8%
7,528
2,039
62.7%
80.2%
44.0%
11,930
2,551
* Refers to the number of dispositions in a given yeardivided by the number of indictments.
** The conviction rates are derived from the figures fordispositions and convictions in Table I. The figuresfor dispositions in Table I refer only to indictmentswhich were disposed of on merit and.do not includeindictments disposed of by consolidation or by pleato another indictment.
Other estimates .of the conviction rate are possible_If indictments disposed of by consolidation are countedas dismissals, for example, a much lower conviction ratewill result. .Prosecutors, however, do not usually countconsolidations as dismissals when estimating the convictionrate. We believe; therefOre,that our use of the term "con-viction rate" conforms most closely to common practice.
Available figures for dispositions ddring 1972 do notinclude indictments disposed of by consolidation. Figuresfor 1974, 1975 and 1976, however, refer tC,.....,total dispositions,11n-c1Uaingdid not permit a direct comparison between. total dispositionsin old and new law years. In Table I, the figures for dis-positions in 1974, 1975 and 1976 are estimates calculated toexclude indictments disposedof by conal5-14 dation.
The conviction rate in Table V refers only to con-victions on drug charges. In a small number of cases, a def-endant may be indicted on a drug and non -drug, charge but con-
k victed only of the norf=drug charpe. These are counted as drugdispositions but not as convictions in calculating the con-viction rate.

-265-
estimated. For example, the effect of the lower disposition
° rate can be gauged by applying the old law disposition rate
(92.98) to actual new laid indictments. A total of 3,911
prisOn sentences would have resulted, or 1,360 more than 's
the actual number of prison sentences under the'new laws.
The effect of the lower conviction rate can be measured
by applying the old law conviction rate (86.3%) to actual
new law dispositions. A total of 2,840 prison sentences
would have resulted, or 289 more than. the actual number
under the new laws. (-
The effect of both the lower disposition rate and the
lower conviction rate can be assessed by applying both these
rates to actual new law indictments. A total of 4,208
prison sentences would have resulted, or 2,102 more than
the actual number imposed.
Finally, the impact of the increased imprisonment rate
can be gauged by applying the old law imprisonment rate to
the actual number of new law convictions. Only 2,038 prison
terms would have resulted, or 513 fewer than the actual num-
ber. Thus, the increase in the imprisonment rate was not
great enough to offset the combined declines in the convic-
tion rate and disposition rate.
Another means of assessing impact of the new laws on
sentencing Patterns is to reclassify old law drug cases
according to the charges that would apply under the new
legislation. Sentence outcomes in these cases can then be
compared to actual sentence outcomes in equivalent anew law
cases. In order to accomplish this reclassification, infor-
to
-- /-)J I

-266-
mation was recorded on the conviction charge and on the
type and weight of drug involved in each of the
old law cases. On the basis of this information, all
the old law cases were recategorized into two groups: cedes
which would constitute class A felonies under the new ,laws:
and cases which would constitute non-A felonies under-the 4
new laws.
1Chart I comparei the percentage of defendants'cpceiving
prison termS An these two groups of cases with the'peicen:
.tage r prison terms on conviction of class A and
'non-cl ss A offenSes,under the new laws. Of all old law
defendants cOnvidted of offenses which would constitute
class A felonies under the new laws, about two-thirdsj06%)
were sentenced th prison. In contrast; approximately B3%.
of defendants'cOnvicted,of class 4 felonies under, .
laws daring 1974, 1975 and the fir half pf,1976 ,re ed
terms of imprisonment.
The figures for::.ne4,-;Aw non-A convictions ardor.
.
law offenses eguivalen£ to new law non-A cases,;,however,-
a..
reveal a contrasting trend. About,one-third (32%) of I/persons convicted of old laWOikeIs which would nowcon- 7
stitute non -class A felonies weie sentenced.to prison, but
under the new laws only 20% of the defendants convicted of
non-A felonies received prison terms.
These findings suggest that the 1973 amendments to the
drug laws have had two distinct results, which depend on
thespecific categorization of drug Crimes in the statute.. ,
Fir.pt, the imprisonment rate foi the offenSesieol.assifiedA.
_upWards as'A felonies has increased over old law leyels,

CEA2T,I
ARCENT,OF DEFENDANTS SENTENCED TO PRISON FOLLOWINGCONVICTION OF DRUG OFFENStS NEW YORK STATE
PiOent.'0
..Defendants Sentenced
to Prison
e I ,
.11 321
OLD. LAW
CASES'
'11972-
1974)
Equivalent
to. New ClassA's
NEW LAW
CLASS A's
(1/1/74m
6-30-76)
1!
4.f OLD LAW '
CASES
(1972-, 1974)
Equivalent
to New
Non -A'sJ
iSource; Drug Law Evaluation Project Survey')
,275
4
NEW LAW
Non-A's
(1/i/74-
S-30-76),
-268 -
because of the new mandatory sentencing provisions. Second-.
ly, the impiisonment rate for offenses not reclassified as
A felonies has declined from the old. law
This finding suggests that, the allocation of prison
resources can be changed to some extent from less serious 40
to more serious crimes through specific provisions of the
law.
New York City and the Rest of'the State Compared
Table VI presents figurei on new law drug convictions
and prison sentences in New York.City and the rest of the
Stafte: The majority of new law class A convictions (66:5%)
occur in New York City.. The.figures also. reveal that, in
New York City', class Acases accountedfor 61% of allAgew law
convictions./ In the rest of the State., however, 'ClassA
cases constituted only 21%.of all new law convictions dux.--
in these years.
Differences in the importance of class A cases have
resulted in a large difference in the proportion of offen-
ders sentenced to prison in New York City and other areas.
In New York City, about 59% of all defendants convicted
of new law drug .offimpes during 1974, 1975and the first
half of 1976, were,sentenced to prison, compared to only
33% in'the rest of the State;--If-the-1973-laws had 7
AOremained intact long enough to have-reduced the packlog,of
class A cases, it As likely that the prisop rate forNew
York Cit.", would eventually have increased'to almost 70%,
while the prison rate for the rest of the Skate would have
1
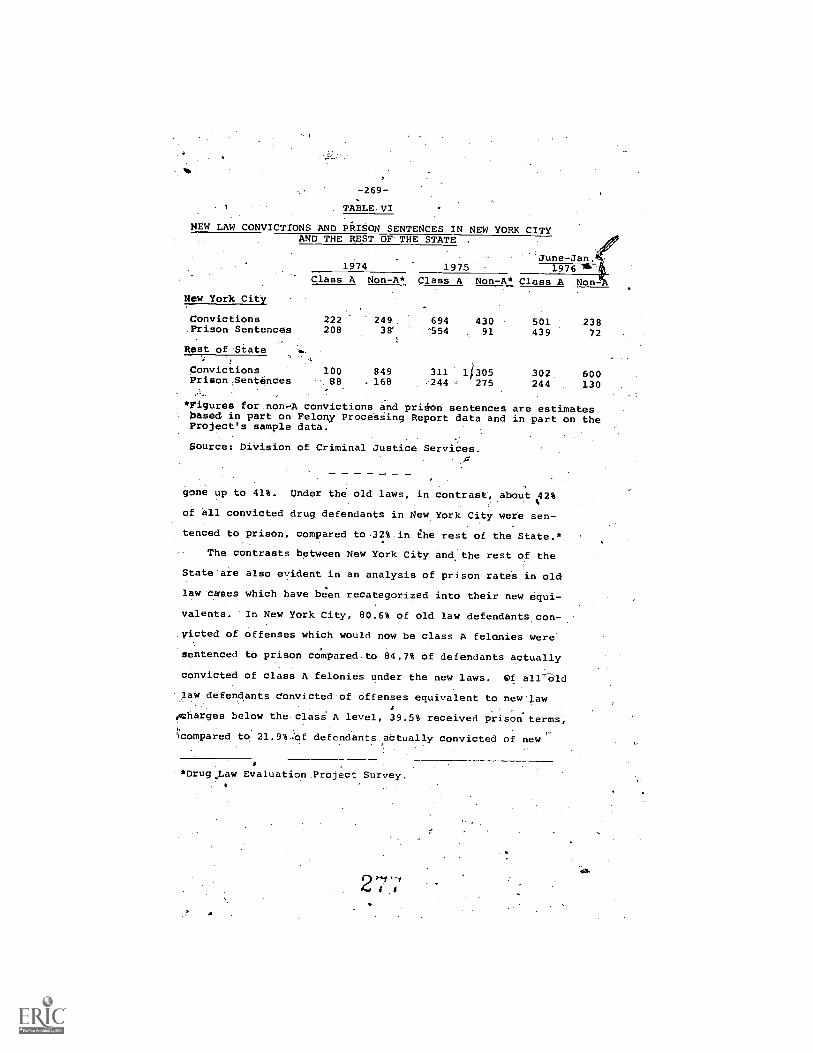
-269-
TABLE VI
NEW LAW CONVICTIONS AND PRISON SENTENCES IN NEWAND THE REST OF THE STATE .
YORK CITY
June-Jan.1974 1975 1976 1116
Class A Non-A* Class A Non-A* Class A
New Yolk City
Convictions 222 249'. 694 430 501 238.Prison SentencCa 208 38' ':554 91 .439 72
Rest of State
Convictions 100 849PrisonSentOnces 88 168
311 4305 302. 600244 . 275 244 130
*Figures for non.-,A convictions and priion sentences are estimatesbased in part on Felony Processing Report data and in part on theProject's sample data.
Source: Division of Criminal Justice Services.0
gone up to 41%. Under the old laws, in contrast, about 42%
of all convicted drug defendants in New York City were sen-
tenced to prison, compared to.32% in the rest of the State.*
The contrasts between New York City and. the rest of the
State are also evident in an analysis of prison rates in old
law Cases which have been recategorized into their new equi-
valents. In New York City, 80.6% of old law defendants con-
victed of offenses which would now be class A felonies were
sentenced to prison compared to 84.7% of defendants actually
convicted of class A felonies under the new laws. elf all -ald
law defendants Convicted of offenses equivalent to new jaw
OCharges below the class A level, 39.5% received prisonterms,
'compared to 21.9%Cf defendants. actually convicted of new'
*Drug.Law Evaluation Project Survey.4

-270-
law non-A offenses. In the rest of the State, the prison
rate in old law cases which would now be class A felonies
was S3N.1%, while under the new laws,_80.p% of defendants
convicted of class A felonies were sentenced to prison.
In New York City, therefore, there has beenvmnly a
slight incrpase in the prison rate for new law class A
offedders compared to the prison rate for old law defen-
dants convicted of equivalent offenses. '
These results apparently conflict wink he findingthat
there has been algreater rise in the likelihood of rison
in New York City than elsewhere. The fact that clas A cases
have increased their relative importance in New Yori City
plains the apparent'difference./eUn4er the old laws, offenSes
equivalent to new law class A feloniee comprised fewer to
one-sixth of all drug convictions, while under the new s,
class A felonies accoUnt,for 67% of all convictions. The
increase in the proportion of class A convictions appears in
part to be the result of the plea bargaining restrictions
imposed by the 1973 laws and perhaps also in part the result
of changes in e polio'
to a greater concentration on up
arrests.
New York City which have led
r and middle level drug
O "-f ri
4 I Lj

TABLE VII
PERCENT OF OFFENDERS SENTENCED TO PRISON FOLLOWINGCONVICTIONS ON DRUG CHARGES, BY CONVICTION CHARGE
A
NEW YORK CITY
Crbss A Felony* ,Non-ClasS A Felony**
1972-74 -
Old Law(Equivalent to 1974-75
New Law) New Law
Prison 80.6% 85.3%Non-Prison 19.4 14.7
Total- 100.0%. 100.0%
Number ofSentences (539) . (916)
.1. 1972-74Old Law
(Equivalent toNew Law)
39.5%60.5
REST OF STATE
1974-75New Law
21.4%78.6
100.0%
(679)
Class A Felony** Non-Class &Felony**
1972-74 1972-74Old Law Old Law
(Eqivalent to 1974-75 (Eqivalent to 1974-75New Law) New Law New Law) New Law
Prison 53.1% 79.3% 26.2% 19.2%Non-Prison 46.9 20.7 73.8 80.0
Total 100.0% 100.0% 100.0% 100.0%
Number ofSentences (390) (411) (1,521) (2,154)
Notes: Text includes 1976 data. Table goes through 1975.
* Indicates differences between old and new 16W notstatistically significant.
**Indicates differences between old and new law arestatistically significant, p less than .05.
4SoUrces:Drug Law Evaluation Project Survey for Old Law
,
Re'Classification: New York State Division of Criminal ,
Ju'stices Services for New Law:
279.6

B. SEVERITY 'OF SENTENCES
-272-
It is highly likely that offenders sentenced to State
Prison under the.new drug laws will spend longer periods
of time incarcerated than did offenders sentenced under the
old laws. However, because such a short time has elapsed
since thOfirst offender was sentenced, and because of the
long period of iniFterminacy governing New York State sen-
tences -- as long as one }dear to life for those sentenced
under class A-III felony provisions -- it will be some time
before accurate estimates of actual time served can be
developed.
Under the old drug laws, when there were very few class
A prosecutions -- class A felonies under the old laws requir-
ed sale or possession of'one.pound of heroin -- minimum terms
of imprisonment were typically set by the New York State Board
of Parole. At the time of sentencing, judges in non-class A
cases set maximum terms of imprisonment only. We know of no
data regarding actual time spent in prison under the old laws
except for the annual information published by the New York
State Department of Correctional Services. That data ,shows
that'the median time spent'in prison by those released on
parole varied bdtween eighteen and twenty-one months between
1970 and '1974. Officials knowledgeable about the parole sys-
tem have informed us that on the averate inmates spend one
third of the maximum term 'determined originally by the judge.
Under the new laws, sentencing practices differ signifi-'
cantly becpuse now there are many class A cases. For class
2bu

-273 -
'A felons-the.judge must specify a minimum term of., incarcer-
ation. A lifetime maximum obtains for all class'A felons.*
Clearly, the maximum term is no longer relevant as a gauge
Of EiMe spent in prison. The Parole Board currently reviews'
class A cases'as their minimums approach to determine whether
the offender shbuld be released, or, if not, how long the
offender should spend in prison. Data made available to,
us by the New York State Department of Correctional Services
indicate, for example, that of all those offenders sentenced
to one year-to life terms under th4 A-III provisions and who
were eligible for parole during 1974 or 1975, approximately
one-third were actually released a,f_ er their minimum terms
had been served. Not enough time has e d ince 'other
offenders have gone to prison to determine how long they Will
actually.spend incarcerated.
In order to make some estimates of the effect of the new
laws on time served, Table VIII compares maximum terms of im-
prisonment for class A equivalent cases. under the-old law
with minimum terms of imprisonment in class A new law cases.
Under the old law, prisoners could expect to spend one -third
of their maximum terms in prison. The Table.showsthat 648
- of old law offenders could expect to serve terms of two years
or les?. There is a distribution around the two-year mark
Which i unknown to. us. Under the new laws an almost,identi-
cal 58% of sentences carried a minimum period of two years
or less.
It is hazardous to prbject actual time spent in prison by
these 58% of new law class A offenders. As noted, approximately
4

TABLE VIII'
LENGTH OF PRISON TERMS FOLLOWING CLASS A FELONY DRUG CONVICTIONS,STATEWIDE
Old Law(1972-1974) New LawEquivalent (1974-1975)To New Law Actual1/3 Maximum Minimum
Local Jail
Up to 1 year, actual term 10.0% N.A.
StateL Prison 7..,
1 year 14.1 46.1
1 year to 2 years 40.3 ,11.6
Greater then 2 years 35.6 42.3
(Total 100.0% 100.0%*.,''''
Number of Sentences (929) (1,094)
*Differences between old law and new law distributions arestatistically significant (X2=114, p less than .05).
N.A. Local jail sentence is not permissible under the 1973 law.
Source: Drug Law Evaluation Project Survey.
Er
2 ''

-275 -
one -third of all those offenders sentenced for terms of
one year to life and eligible for parole during 1974 and
1975 were actually released on parole. Thus two-thirds of
.
those offenders sentenced for one year. to life will, spend
more than their minimum. terms in,Prison. It is a fair
assumption,, then, that on average offenders sentenced to
prisod under the new class A provisions will spend more4
time incarcerated than did their codnterparts under the old
law.
Table IX compares maximum periods of imprisonment for
those sentenced. under the non-claps A provisions of the new
law with their equivalent numberP under the old law. The
distributions are very similar. Aslightly higher proPor-.
tion of sentences are now to State prison for indeterminate
f. periOds.
For most State prison sentences', minimum terms of imprison-
ment are not established by the court for cases below.tthe class
A level, so that comparison of the maximum terms" (or one-third
of the maximum terms) for both:old and new law, cases is ap-
propriate. The similarity in sentence lengths under the old
and new laws for non-A cases is striking. 'Under both laws
between 45% and 50% of all State prison terms carri 'a
mum of three years. Thus, in non-A cases,' where oe
of imprisonment has not increased under the new lawsiAleither
is the length of time served likely to increase substantially.
The net result of these Comparisons seems to be that the
offenders' sentenced under the new law who would not also.have
been sentenced previously were generally senteneed.to short , --
periods of imprisonmentThus, giVen the number of convic-
.259-297 0 - 79 - 19
2E3

-276-
'TABLE IX
NON-CLASS A DRUG CONVICTIONS: LENGTH OF PRISON SENTENCES(LOCAL JAIL AND STATE PRISON), STATEWIDE PERCENT DISTRIBUTION
Local Jail
1972-1974 '
Old Law (Non Class A(Equivalents)
197471975New "Law
Non-Class A
(up to 1 year, -actual term)
54.2% 46.8%
State Prison,Maximum term* .
3 yeaks 22.0 24.54-5 years 18.8 19.5over 5 years ' 5.0 9.2
Total 100.0%**" 100. 0 % **
Number of prisonsentences
(3,237) (572)
* There are no permissible sentences carrying maximums ofless than 3 years.
**Differences between old and new law are statisticallysignificant (x2=6.93, p leSs than .05).
Source: Drug Law Evaluation Project Survey.
a
4 "'
2 c-) 1

-277-
tions'actually obtained under the new laws, the number Of,
offenders sentenced to prison has gone:up somewhat.and the
terms of imprisonment cluster around the minimum terms
lowed by the new laws.
C. IMPACT OF THE PLEA BARGAINING RESTRICTIONS
The primary objective of the plea gaining provisions
of the-1973 laws was to ensure that defendants indicted for
class A drug felonies cold not plea bargain to a charge
below the class A level and Viefeby avoid a sentence to
prison. This section examines two aspects of the new plea
bargaining limitations: fiist, their impact on the scope
of charge reduction and on the length of prison sentences
imposed under the new laws; second, their impact on
prison rate:
Table X presents figures on indictments, dispositions
and convictions in class A drug cases during 1974, 1975 and
the first half of 1976. Among class A cases, extensive charge
reduction. occurred during the process from indictment to con-
viction. While class A-I and A-II indictments, for example,
accounted for over 53% of all class A indictments during
this period, class A-I and A-II convictions comprised fewer,
than 16% of all class A convictions.
The backlog in class A-I and A-II cases had been sub-
stantially eliminated by Vle middle of 1976. Statistics on
acquittal and disMissql rates reveal no significant differ-
ence between class A-I, A-II and A-III dispositions (19%,
20% and 16% respectively). This pattern suggests that while
the new laws have prohibited plea bargaining from the class
285.

LADLE X
NUMIER OF I ICTMENTS DISPOSITIONS AND CONVICTIONS 'IN CLASS A-I
A-II AND A-III E 'NI'S J E 6 NEW YORK STATE
A-I A-II , A-III
77fan -June Jan- Jan-June
1974 1975 1976 1974, 1975 1 6 1974 1975 1976 i
,
Indictments 'illi7311 263,
Dispositions 153 1116 '335
Convictions* 10 42 36
4,
*Conviction charge
774 768 334 1,375 1,173 .736
139 447 324 3281 819' 661
41 120 85 271 843 682
Source; New York State Division of Criminal Justice Services,
Or I

0-279-
40Yelto the,:non-A level, considerable charge reduction
still occurS from-one level .of clads A felony to another
a fact which may be expected to havea significant impact
on'the average length'of'sentence imposed in class A con-
victions under the-new. laws.
Tables XI and XII, present figures on class A in-.
dictments which resulted in convictions during 1974 and
1975. Table XII shows that of all class A-I indictment/
which resulted in class A convict ons during these years,
only 9.6% resultedin actuSlA-Iconvictions whit /.
almost three-fifths led to convictions on A-III charges.
Of'all clads A indictments which resulted in gla/ss A
convictions in 1974 and 1975, about 74% were disposed of
by guilty plea and about 268'by trial. Table XII presents'
data on class A indictments which led to convictions as
the result of guilty pleas. This Table suggests that
extensive charge redUction took place during 1974 and
1975. Over three-fifths of all class A-I indictMents
disposed of by guilty plea were disposed of as class A-III
felonies. Over 86* of claSs A-II indictmentg disposed-
- of by guilty plea were disposed of as A-III felonies,
287

/-4
TABLE XI
INDICTMENT CHARGE COMPARED TO CONVICTION CHARGES FORCLASS.-jA INDICTMENTS 'LEADING TO CLASS A CONVICTIONS BY .1
BOTH TRIAL AND PLEA, (1974-1975)
Conviction ChargeIndictment
Charge A-I A-II' A-III Total
A-I 19.68' 24.2% 56.2% 100.0%
A-II 29.0 :. 71.0 100.0
A-Ill 100.0. 100.0
Number ofConvictions 52 161 1,114 1,327
TABLE XII.
.
) .
INDICTMENT CHARGES COMPARED TO-%NVICTION CHARGES FOR'CLASS A INDICTMENTS LEADING TO SS A CONVICTIONS'BY
PLEA, (1974-1975)
.,'
Conviction Charge .
.IndictmentCharge A-I A-II A-III Total
°
A-I 3.1% 31.8% 65.1%' 100.0%-
A-II - 13.5 86.5 100.0,
A-III - 100.0 100.-0
urce: Drug Law Evaluation Project Survey.
I

-281-
In all, 85% of all. Class A convictions during 1974' and.
1975 were convictions on class A-III felonies. This pattern
can be expected to have an important impact on the average,
length-of prison terms imposed under the new laws. .Defen-
dants convicted of. class A-III felonies must serve a mini-
mum prison 'term of between 1 and 8 1/3 years. Persons' con -
vidted of class A-II felonies must serve erminiMuni term of
between 6*and 8 1/3 years, while defendanta convicted of
class A-I offenses must serve a.minimum of between 15 and 25..
years. Data from the New York. State.Department of Correc-
tional Seivices reveal'that, of all defendants convicted and
sentenced to prison tor ClEiSs A-III drug felonies in 1974
And 1975, 63% received the minimum prison terms of one year.
By comparison, the Project's sample sukvey:shows thAt, of
al/ defendants convicted and sentenced to prison for A-III
felonies itS,tile. resUlt of a plea bargain, a similar 59%.
received'theMinimum term of one year.* Thus there was no
real difference in the likelihood of receiving the minimum
term between cases disposed of by plea and by trial.
The data also reveal, that, of all defendants convicted and
sentenced to prison for class A-III felonies as the result of
.a guilty plea, those who were originally indicted on an A-I
or an A-II felony were just as likely to receive the minimum
one year term as those who were originally indicted on an
A7III felony. Table XIII presents figures en!the minimum
*The sample showed that-58% of all defendants sentenced to prisonunder the A-III provisions received terms of 1 year-life. Thiscompares to the New York State Department of Correctional Ser7vices! 63%. ,
289
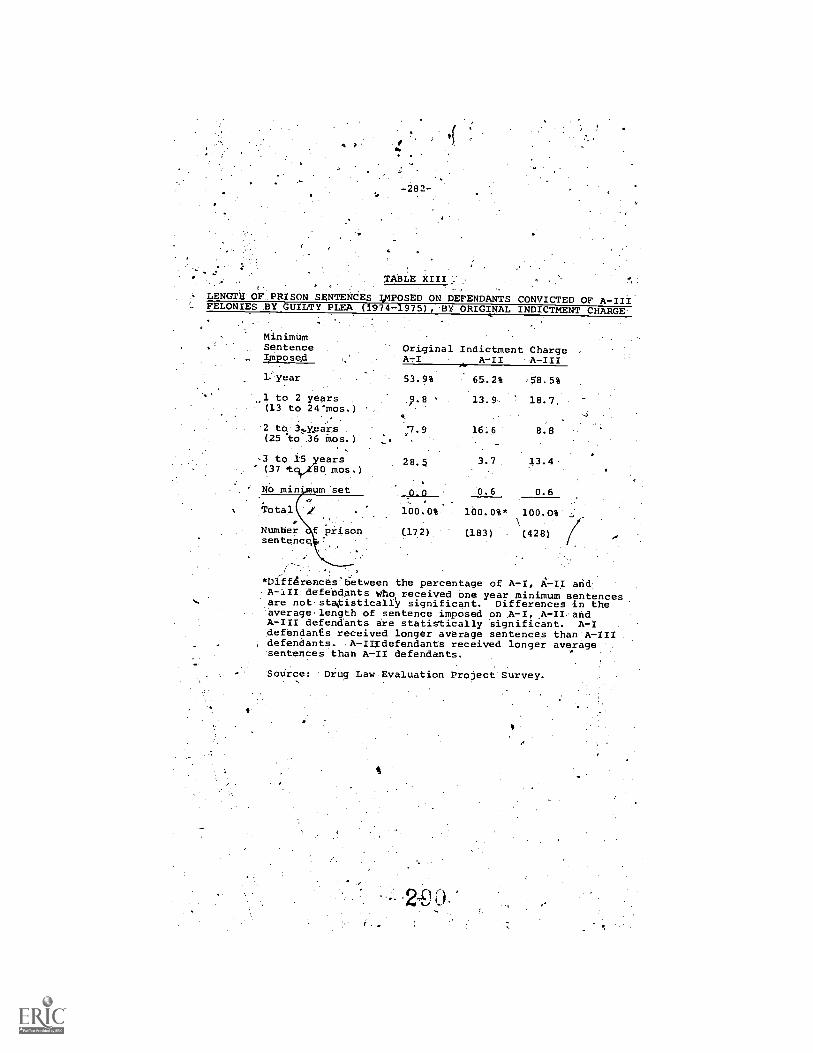
ti D' I
-282-
TABLE XIII
LENGTH OF PRISON SENTENCES IJIPOSED ON DEFENDANTS CONVICTED OF A-IIIFELONIES BY GUILTY PLEA (1974-1975), BY ORIGINAL INDICTMENT CHARGE-.
MinimumSentenceImposed
year
1 to 2 years(13 to 24-mos.)
2 to 30/gars.
(25 to 36 Mos.)
N3 to 15 ears(37 t 80 mos.)
NO min um Set
Total /
NUmber pri.son.sentence
Original Indictment ChargeA-I A-II A-III
53.9% 65.2% 58.5%
p.13 13.9 18.7,
:7.9 16.6 8.8
28.5
o_n
100.0%
(172)
3.7 13.4
0.6 0.6
100.0%* 100.0%
(183) (428)
*DiifArences'tietween the percentage of.A-I, A-II andA-III. defendants who received one year minimum sentences'.are not staisticaliY significant. Differences in theaverage length of sentence imposed on A-I, A-II.andA-III defendants are statistically significant. A-Idefendants received longer average sentences than A-IIIdefendants. A- Illdefendants received longer averagesentences than A-II defendants. P
Source: Drug Law Evaluation Project Survey.

length .of prison terms imposed ch.defendeh'ts Cc:Ipic.ted and
/.'sentenced to prison eor.A-III felonies folIowing'a guilty
plea. The. Table shows that,.while defendents:,originallyj
9dicted on A =I felt:Shies were generally more/Iikely, to. "
receive longer sentences than defendants indicted on A.-II
and felonies, they received theminithumone year'.!
prison term; in 53.98' of the cases. pf,those defendants!
do
originally indictedon' A-Irfelonies.65,.2% r;eceived:the one''Pyear minim& sentence. . Of,those defendants originally .'-
ed on A-III felonies, .58,5%:were sentenCecl to the one yearJ.
minimum term.' Since the majority of defendants indictedon,
Class A-I and A-II felonies are allowed 0. plead to an A-Ill
felony; these Digirres-coSfirmthet Pleebargainill in class A
cases has had a significaht'impact on the average length of. .
. prisOn sentences, imposed under the new laws.'
Sentences in Cases Disposed by Plea and Trial
. Under the 1973 faws', pleaJsbargaining of the charge is
prohibSted1 for defeheants'indicted on class A-III felonies'.
In order to determine'Whethei- a dn'endant indicted on MI
A-III felony can gain a 'significant advantage in sentence
length by accepting a plea rather than insisting upon a trial,
we, Ompared.the.minimum term imposed' in convictions result-.
ing from trials with the minimum prison teeri,,s'iMposed in con-
Victlons resulting from pleas (see TableXIv). We found that
in counties outside New York City/ Ofendanfs yho wereindicted, N
. and convicted of A-III felonies folldwing a: guilty plea were
generally more likely to receive lower- minimum priaon terms
0

TABLE XrIV
i.ENGTHOF SENTENCES IMPOSED ON DEPENDANTS CONVICTED OF .A -IIIFELONIES FOLLOWING INDICTMENTS DN A-III FELONIES (1974-11975)
° BY METHOD OF eVPOSITION*
. NEW YORM CITY. REST OP 'STATE
Flea Trial' Plea TrialSenhehte'ImpOsed
'On4 Year
Plea, Trial
55.6$. 50.2% 4148% -6.0% fib, 28 3.04.
One 'to Twv 19:2 16.7 !, 23...9 17.1 16.9Years (13.24 months)
,Two to Three 10.5 16.4. 4.2 18p1' 17.4Year$ (25-36 months)
Three:to 14.1teen Years137718.0 rtionttis),
,
NtimImum 0.7, 0.0ySe
1 100.0%.100.08 100.0% 100.0%
1N Total ,Number(
(428) (342) :(219) (2k9)"' of Prison
Sentehces
(189) (132)
16.7 23.4 4.8,E 8.0 34.8
1.2 0.0 0.0 0.0
'100.04 100.04
*Differences between Plea and Trial distributions Statewide aren t statistically significant. However, differences withinNq YOrk'City,and within the Rest of State,. are statisticallysi nificant.
:
11 a
tSource; Drug. Law EyaluatioiZroject Suryey.

than defendants convicted after trial. Almo7st 70% of
Plefendantq convicted-as the resul%'ef a plea.rceived the
.minimum term of one'yesr, while only 36% of those wtio were
Convicted after a trial,received the'one year minimum ;en-,
tence. In New Yosk-City, however, there was no signifidant
difference, between the length of sentence,faced by defendants
pleading guilty and the'length of sentence imposed on those
convicted after trial. These findings show, therefore, that
atleast in counties outside New York City, plea bargaining
has a significant impact qn the length of p.r3Son terms im7,
posed under the .new laws,even.among defendants indicted onI .
class A-III feloniesd,
Cases Below the Class'A Level
While the'logislalion did not specifically restrict the
scppeOf.plea bargaining in casesbelow the class.A level,
manyobservers,anticipated that Piesecutors wmad,respond
65Che new laws by limiting plea bargaining in less serious
drug cases as' well 64 in new law claesA cases. In order to
address. this qUestitin, we examined the extent of charge
.seduction in old law cases which werethe equivalent of new
lAw-hon-A indictMents. We compared only those cases which,-reSulfed in convictions as the result:of a guilty plea The
figures inTale.XV show that there was no sighificant dif-
'ference'in the extent of charge. reduction among old law and. J s
.newilaw cases. We alSo examined patterns of charge redue-,
tion in new law'class B"and class C felony case's. The 1973
legislation made prison sentences mandatory for all defen-
dants,conVictee'dt class B :and class C.'drug felonies, with
2(V)

-286-
TABLE XV
CHARGE REDUCTION IN CASES BELOW THE .CLASS A LEVEL DIS OSE OF BYGUILTY PLEA*
Number of Stepsin the Reduction Old Law Casesfrom Indictment Equivalent to -
Charge to Can- Nett Law Non -Aviction Charge** Indictments:
0 14.1%
22.6
Totalt
Total Convictions (5,030).by,Plea
30.9
29.7
2.7
100.0%
*Differences in old law and new law distatistically significant.
**A reduction froth a class B indictment, is counted as a one step reduction; a
B indictment to a class D 'convictionreduction, etc.
Source: Drug Law Evaluation Project
294
New LIndictBelow
Class A
enttheLeV 1
'
12.6% TI
25.
25.
.34.
2
100. %
(2,7
stributions are of4
to a class C c v ctionreduction from
is counted as'a wol:Np
Survey.

- 287 -
the eXception of offenses *evolving marijuana. We.fOund.that
of all class B and class-C indictments which. reedlted,in.con-.
victions.dUring 1974, 1975 and the first, half of 1976, about
87%. resulted in convictions below the clhss C level. Thus
the mandatory sentencing provisions had'little meaning in
the absence of plea bargaining restrictions.
,Pleas? and Non-Prison Sentences
A final aspect of the new plea bargaining provisions
which reguires.consideration is their impact on the imprison-.,
ment rate Por drug 'offenses. The new provisions were speci-
fically designed to minimize the possibility that a person
indicted on a class A felony could avoid a ptison sentence 4
on conviction. Table XVI presents figures on the percentage
of defendants who were sentenced to pkison after being-indic->
ted on a .class A felony and convicted. The Table compares
the. percentage of defendants sentenced to prisbn following
a guilty plea with the percentage of defendants sentenced to
prison after conviction by tidal.
TABLE XVI
SENTENCES IMPOSED ON DEFENDANTS INDICTED ON CLASS A FELIIESSENTENCESAND CONVICTED (1/1/74 -16/30/76),
Method of TotalDisposition Prison Probation* Convictions
Plea 70.7% 29.3%Trial 89.7 10.3
Total 75.1% 24.9%
*Includes 1.71 other non-prison.sentences
Source: New York State Division of CriminalJuStice Services1
1,719512
.,231
2D5

V
-288-"
.` 4\ The Table iddieates.that, of all defendants'ndlcied
on class A felOnies and convicted after pleading guilty,f,
only about4708 were sentenced to prlson. -Almosl..90%.of
persons indicted en class A4elonies and convicted after Sa
-trial, however, wete sentenced tO'prison'-.
The lifetime probation provision fot.
Youthful Offender statute,
for the probation sentenc
1
intolinantes.s.ftflthe
th described above,JaceoUnt"''
. 0
The figuresjn Table'XV gu.: ,..
gest that,,.in, Orh ice,i
p obhtion terms might e'Aihed, ).
means of-`inducing hss A defendants top pad uilty..
this is:trUe, class A defendaets are:still sble, in effect,-"4
to plea bargain to a charge which will carry a nop.4pri
disposition. Together with the discretion which still eiciets...-
.- --
in settling the minimum prigon term in class A cases, therefve,
.the lifetime probation picivision. (
and possibly the Youthful
AOffender treatment as well) may ct as a source of sentencing
permitsdisctetion which e plea ba g.aining to continue inclass.. \A
4 A dispositions.. Whatever the case defendants convicted of
c2as A felonies as the result Of a guilty plea are still, . .
able to avoida prison sentence.
Chart aI araWs a contrast betweee the imprisonment. rate
in new law cases disposed of.by guilty plea with the imprison-
ment rate in old law cases:disposed of by guilty plea! All
old law cases'in the Project's sample were recategorized
according to Nihether they would constitute cldss A indictments
or non-class fi indictments under the new laws. The Chart,
slloWs that, in old law 'cases which were the equivalent of
new law clasp, A indictments, 46% of the defendants who were

MEM' OF D RUNTS SENTENCED TO PRIM'OLLO......1.20GNZELMOF RUG OFFENSES BY GUILTY FLEA ACCORDING
TO THE .OR INDICTMENT CHARGE - NEF YORK 'STATE (1972. 1976)
Percent of ,
Defendants Sentenceto Prison
loot'
75% ""
I N
*e
.46%
I.
..
A
22%
ti
OLD LA , , aE ,kAW
CASES CLAgSP A
1";(197-1,9/4),
to New Ciap""A
',Indictmentsvi.4
4..
o
INDICTMENTS
(11/3)14-
..6/30/76)
OLD LAW NEW LA'
CASES NON-A
4197 971) INDICTgEN3S
E 'varent (1/1/7i-4VNew Non 6/30/7kInIctments ,
TYPE tF INDICTMENT e
p,
Source: Drug Law tEv luatOn Project Atirvey,
297
b.
4
to
4,

nvid4.ediasitheq.
pris.ontand-, '54%
above
-29V-c, ,
r pule, I7a, guilty plea ,Were sentenced tgeelyed none -pris AenCes. At noted
-' 1
theAnte6Il'of the ne*plea bargaining provisions was.min rnize thikiest 'figure: . Th 'Ch rt show,a,. however.,
-. of 'all 'the defendants indicted=on n w awclassA fOloniesadd torivicted ills the result of a g
.
plea, aumosif 30%
receiyed npn-prison sari' ences. ',,, ° :The CharT also shows that the p/Acin rate for indict= °
. . . .
_ ments below he class A leliel.--
was not affectsgir by the newLI iAlawsi in t spite, of the fact that prison terms were mile' rsan-.., -
tali 7.4' datory for defendants convicted of class-,B arid.- cla'ss C :-,
...felt:, ''. --) .4'. '1-",, 4. . .,
)[ies (;acceRiptap inarijudna)4- As , noted'abov*e, mowever,; nearlyt *t K, z.,4.. :. 96% f the rIffendants. who were ,kri;Xict.ed pn clkssif and class*t
1.' '
Vc(-- .
C and on-felonies. victed nder\.the riew 1 's Were con&iicted
Of chards.,.beltha:the ol ss C"leveg

)*
IIi I.
CHAAA0ERISTICS OF OFFENDERS
C
2
SENTEACED TO PRISON*
A. ARREST:HISTORY.OF OFFENDERS.,
; Comparisons between prior. hrrest records of offen-.
s0/
dens sentenged to prison kinder the new law and the-old reveal
that.undgr both sets of.1;44-S,the..gre6t major4ty of offenders
had previously keen arrested lor a.felonY. .Approximately,
s of all those sentenced to prison under"the new
taws had prior felony arrests, compareeto 75% under the old.0
laws (see Table XVII). Furthermdre, 521 of offenders sem-. '
tenced under the. new laws also had prior:felony arreSts
'.non-drug crime's.
Thq likelihood of prison following convdction-IISS
increhsedfor virtually all offenders,,regardleils:of prior
record (see Table XVIII),.F.i,,rst offenders 'defined:here as
thOse defendants having no prior felony Arrests on thei rap
,sheets the brunt'.of the mandatory prison_, provisions
in New York City,-bit not elsewhere.** As would be expected
from-the leniency traditionalflyadcorded to first offenders,. '
they have found 'their chances of going.
_to priisoo increased,.
. most .RecidiVists found their chances of going to prison
'increased as well but not as much as first offenders. As
1 . .. .=.. .
, *In ormation regarding race of offenders is not presented becauseof he unreliability of classification of jlispanics in New York'Cit ..'
**Information b sed on rap sheets understateSlhe number .of priorarrests, and also th pitoportion'of defendants - having. priorarrests. '
.4-
. ".
t.
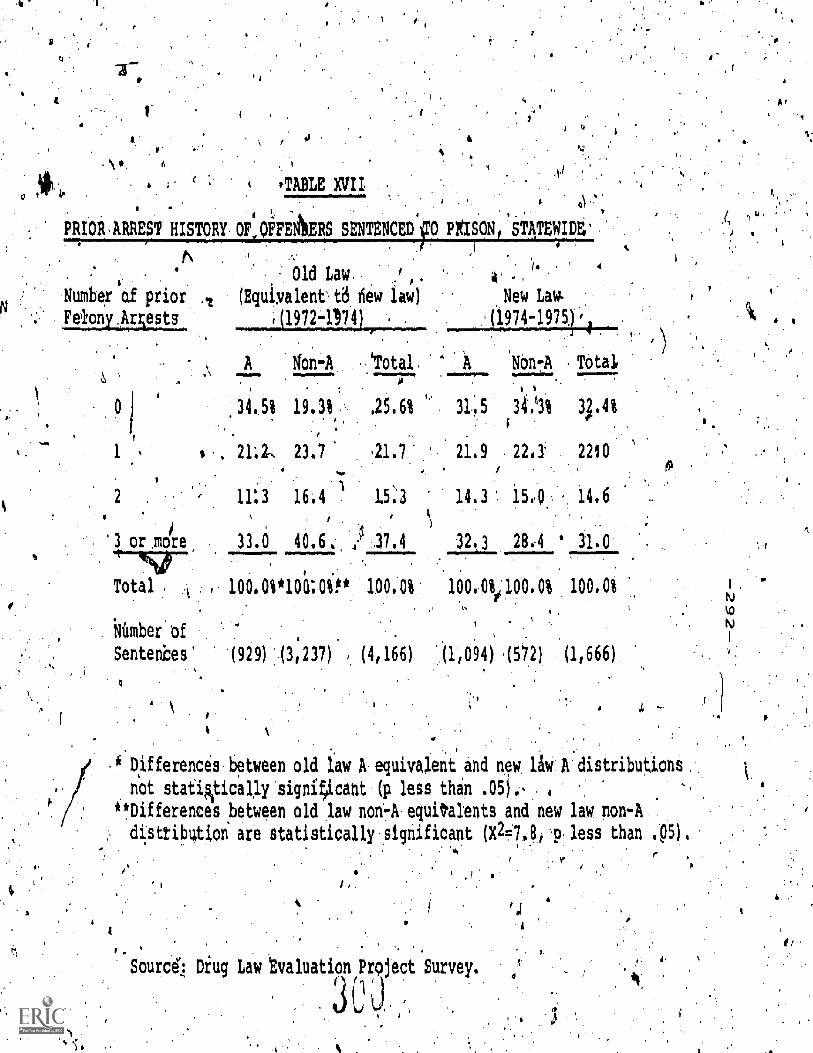
PRIORARRE ST HISTORY
Number of priorFelony.Arvsts
si
'TABLE XVII
'4 -.I_OFD OFFENIERS SENTENCED 0 PRISON
,
STATEWIDE,'
.\ Old Law. A' -.
.
(Equivalent.t tio ew laW). New Lav
_:___i_(1972±11)'14):_._,.. .A.974-1975.1 t;
V
A son-A 'Total,, .
34.5% 19.3%
7-,25.6%
-11
1 23.7 ,21.7
2 11:3 16.4 15,1
'3 or more 33.0 40.6,, i 17.4
Total , t 100 0%*100:0iP* 100.0%I
Number' of
Sentences' '(929) (3;237) (4,166)
A 'Non-A Total
31.5 34.'3% 33.4%
21.9 22.1 22i0
14.3 15,9.. 14.6
x.3 28,4 " 31.0
100,0 ;100.0% 100.0%
41094H572) (1,666)
.* Dyferences between old law A equivalent and new. law A distributionsnot statigitically 'significant (p less thin .05) ., ,
**Differences between old law non-A equitalents and new law non-Adistribqtioli are statistically significant (X27.8, p, less than .05).
I' oI. "
Sourc6,; Diuq Law Evaluation Project Survey.
3 1
,of
'1
e.

-293-
"°TABLE "III
THE LIKELIHOOD &-PRISON'SENTENCEE,FOLLOilING CONVICTION ONNDRUG CHARGE, BY PRIOR ARREST HISTORY
STATEWIDE
Number of. Prior Old law New LawFelony Arrests (1972-1974) ilp4-1975)
'i 4.
0----
''].7..8%. -,423.5%',.1 '44:4 43.7
..;2 53.5 ,67.03 or more 64.9 83.9
Total. t'1/4.-'33.5% 40.0%
Number of Seltences (4,166)
NEW YORK CITY
(1,666)
Number of PriorFelony Arrests
Old Law(1972-1974)
New Law'(1974-1975)
0 14.9% 41.0%1 44.9 42.82 48.2 86.23 or more 65.3 80.5
Total 41.8% 55.7%
Number of Sentences (,2,255) (886)
REST OF STATE.
Number of Prior Old Law New LawFelony Arrests (1972-1974) (1974-1975)
..
0 18.7% 16.4%.1 44.1 37:6'2 57.6 50.63 or more
. 64.2 90.6
Total 31.6% 34.3% 1
Number of Sentences (1,911) (780) 2tiSource: Drug Law Evaluation Project Survey.
301

-294-
°.noted earlier, whatever increase occurred in the prison
rate' wasgconcentrated on class,A offenders.
Table XVII indicates the impact of the increase.in the
likelihood of prison on distyibutiOn of prisonsentences..
There is trirtuplly no difference in the prior arrest histories of
class A offenders sentenced to prison and their equivalents under
. the old la*. In non-class A cases, there has been a large
increase in the share of prison sentences goihg to first
'offenders, an increase concentrated in New York City. Ap-,
proximately half of these sentences were to local jails and
hali to State prisons.
B. THE QUANTITY OF HEROIN INVOLVED IN CASES
As a second veasure of the "quality" of offenders sen-
tenced to prison under the new laws, and-as a measure of the
seriousness of cases under the old and new°1aWs, a comparison
was made between the quantity of heroin involved in class A
cases which resulted in prison terms under the new laws with
the quantity of heroin involved in'old law cases which would
currently be classified as class A cases. There was virtually
no difference between the quantity of.drugs involved under
the old and new laws (see Table XIX)._The data does suggest
however, that there has been a shift in emphasis toward
quantities exceeding one ounce. This would beconsistent
-"with police practice in New York City.',
The quantity of drugs involved in a case is the only
measure we have of the status of an offend r in the drug
distribution system. It is a far from per ect measure
in individual 'cases, because; for example, a high level
distributdr might on occasion deal in very all amounts
of drugs. However, there arc a large number o
3 iJ
cases

-295,
TABLE XIX
QUANTITY OF HEROIN* IN-CASES RESUITING.IN A PRISON SENTENCE,STATEWIDE
Old law(1972-1974).
New Law(1974-1975)
Up to 1/8 oz. 61.2% 62.3%1/8 - 1 oz 26.2 16.2
'1 oz. - 1 lb. 10.8 19.4Over 1 lb. 1.8 2.1
Total 100.08 100.0% ,
Total Sentences (2,488) (745)**
*Aggregate weight of a substance including heroin.**Differences between bid Law and new Law not statisticallysignificant.
Source: Drug Law Evaluation Project. Survey.
the sample and a comparison of the distribution of heroin
weights may be some indication of the fact that the Mix of
offenders sentenced to prison under the new laws is roughly
the same mix of offenders sentenced to prison under the old
laws with respect to-their position in the drldistribution-
syatem. Under both sets of laws, the largest proportion of
cases involvedless than one-eighth ounce of heroin.
Offenders involved with small amounts of heroin (less
than one-eighth of an ounce) found their chances of ejoing
to prison substantially increased under the new laws (see
Table XX). Offenders in canes involving higher quantities.
of drugs also faCed greater risk of prison under the new
laws, but the increase in these cases was not as substantial
as for the cases involving smaller amounts of heroin.

-296=
:TABLE XX
THE. LIKELIHOOD OF A PRISON SENTENCE FOLLOWING A. DRUG CON-VICTION INVOLVING HEROIN BY QUANTITY OF HEROIN,
STATEWIDE
Old Law(1972-1974).
New Law(1974-1975)
Up to 1/8 oz. '41.0% 87.5%1/8 - 1 oz. 48.0 66.11 oz - 1-1b. 44.0 85.0Over 1 lb. 75.0 '80.0
0
Total 47.6% 76.8%
Total Sentences (2,488) (745)*
*Differences between old law and new law are statisticallysignificant (X2= 6.9,p less than .051.Source: Drug Law Evaluation Project Survey
As another measure of the seriousness of drug cases
under the old and new laws, the relative frequency of
sale.and'possession cases among old and new law heroin
Cases was examined. It is commonly assumed that defendants'
,indicted and convicted of sale offehses are the more
serious drug offenders, but the relativeproportion of
sale and possession cases is only a rough indicator of the
seriousness of drug cases as a whole. Many of the indict-
ments for sales of heroin, for example, involve relatively
small amounts of the drug. Further, there is no assurance
that defendants convicted of drug possession are not engaged
in marketing the product as well.
It was found that about 76% of old law heroin indict-
ments were sale casesand 24% were, possession cases. Among
new law heroin 'indictments, about 70% were sale cases and
36% were possessio6;cases.
304

-297-
Among actual .convictions for heroin offenses, however,
the proportion of cases involving sale offenses has in-.
Creaed significantly since the new laws took effect:: Only
.22of old law heroin convictiOns.ihvplved sale offenses.
Under the new law, this proportion rose to 618. These data
suggest that under the old law a large proportion of defen- op
'aants indicted for sale offenses pled guilty to possession
offenses.
C., AGE'OF OFFENDERS
Since the intention of the new laws was to increase the
likelihood of imPrisonment.followihg conviction, and reduce
judicial sentencing discretion, those who werethe beneficiar-
ies of such disCretion,;including the young, were expected to
be imprisoned more often now than under the old laws. For this
reason, age distribution apd prism\ likelihood following
convictions fo separate age groups were examined.
Fear for the youngest age group ofoffenders -- 16
through 18 -- proved unfounded (see Tables XXI and XXII).
Increases in the likelihood of going to prison were
experienced by all those over 18 years old in New York CityC.1
and among those over 26 years of age elsewhere in the State.
'Neither New York City nor the non-City areas show much ,
change in age distribution among the imprisoned (Table XXI).
However, New York City's imprisoned offenders are generally
older than those in the out-of-City areas, both for old and
heW cases.
3
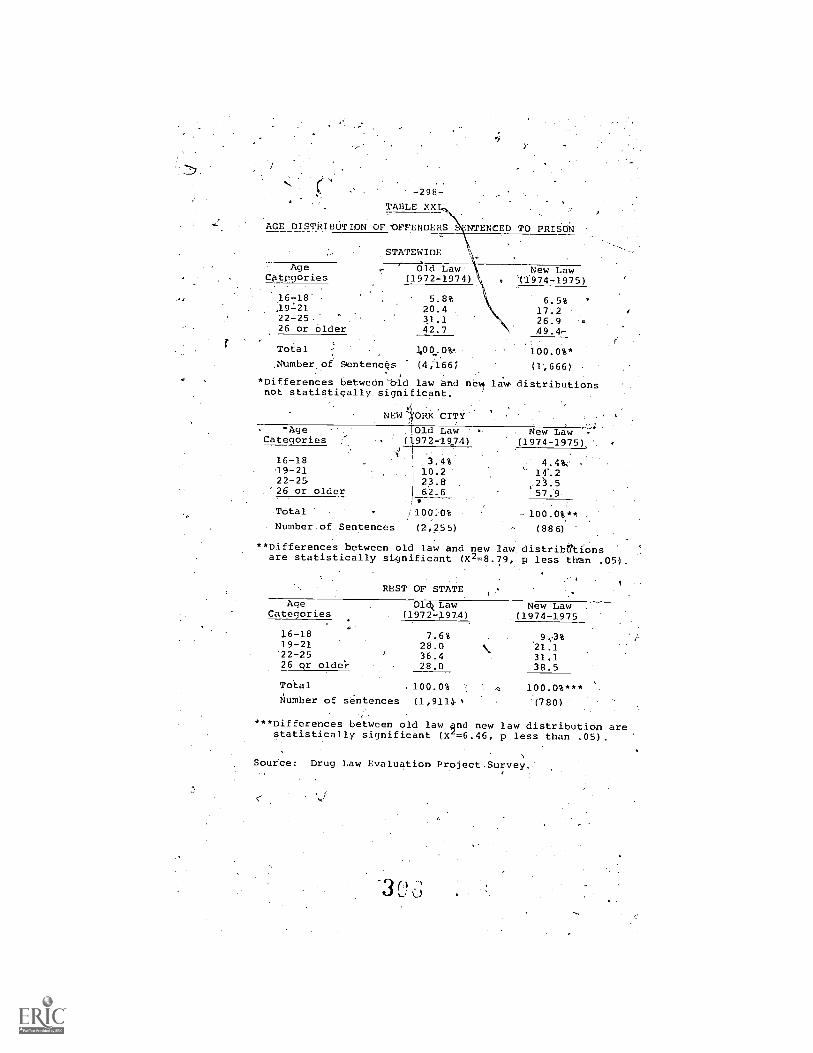
-298 -
TABLE XX
AGE DISTRIBUTION OF 'OFFENDERS NTENCED TO PRISON
AgeCategories
16-18'
22-2526 or
Total
older
STATEWIDE
Old Law New Law(1972-1974) , (1974-1975)
5.8%20.4
42.7
6.5%17.226.949.4,
100.0%*,Number of Sentenc4s (4;166, (1',666)
*Differences between-Od law and new law distributionsnot statistically significant..
NEW4ORICCITY- 'Age 1-01d Law -Categories (1972-1974)
0A
3. -4%16-1819-2122-2526 or older
New Law -
(1974-1975),'
4.4%.:10.2 14223.8 .562.6 57.9
-100.0%**Total 1100:0%
Number of Sentences (2,255) (886)
**Differences between old law and new law distribeti:onsare statistically significant (X2=8.79, p less than .05).
REST OF STATE
AgeCategories
Oldt. Law(1972-197.4)
New Law .
(1974-1975
16-18 7.6% 9.,.3819-21 28.0 21.1'22-25 36.4 31.126 or older 28.0 38.5
,Total 100.0% .c. 100.0%***Number of sentences (1,9114-s A780)
***Differences between old law qnd new law distribution arestatistically significant (X'=6.46, p less than .05).
Source: Drug Law Evaluation Project Survey.
o
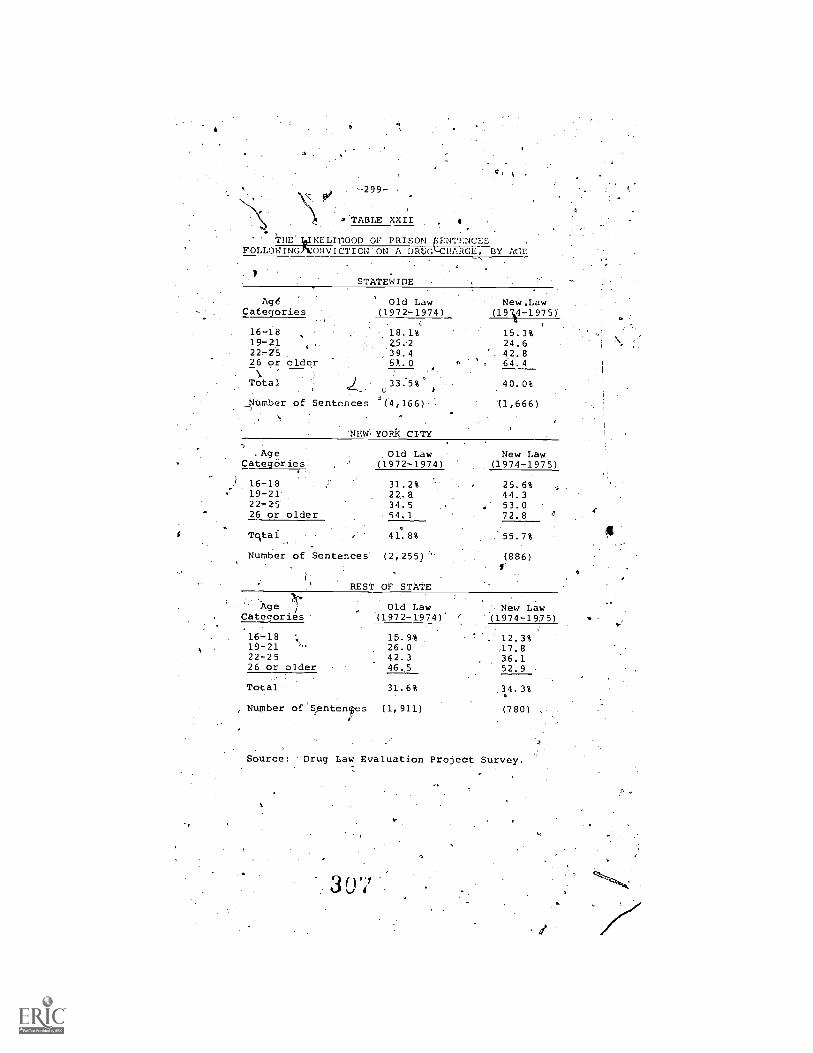
-299- ,
.TABLE XXII , a
.THEklIKELITIOOD OF PRISON pENTENCESFOLLOWINGNONVICTION'ON A DRUGLCHARGE, BY AGE
1 '
STATEWIDE
AO ' Old Law New,,LawCategories (1972-1974) (193e-1975)
16-18 18.1% 15.3%19-21 25.2 24.622-75 39.4 . 42.826 or older 51.0 6:4.4\
Total 33.5% 40.0%u
Number of Sentences °(4,166). (1,666)
. AgeCategories
1 16-1819-2122-2526 or older
NEW YORK CITY
Old Law
Tqtai
Number of Sentences
New Law(1972-1974) (1974-1975)
31.2% 25.6%22.8 44.334.5 53.054,1 72.8
41.8% 55.7%
(2,255) (886)f.
REST OF STATE
Age i
Categories
16 -1819-2122-2526 or older
Total
Nupber of Sentenfes
Old Law New Law(1972-1974) (1974-1975)
15.9% 12.3%26.0 J7.842.3 36.146.5 52.9 ,
31.6% 34.3%
(1,911) (780)
Source: Drug Law Evaluation Project Survey.
3 07

4
-300=
le,.Theie was oniy.a negligible6harige in,thei 1
ha c of. ..-
.prison terms absorbed by the youngest grou uripcv1974,I
the first.Year of the new laws, , very few c A-gases
were processed, and.the percentage of'yOut s sjntenced was.....-
high because they were cone ntrated among he ies seriou
offenses.. By 1975, owever, there was a w d use o
YO probItion sent cing provisions for per ons 16 through
18, and their-Sha of prison sentences fe- te the
rise in clas's A dispositions. .
D. TYPE.OF" DRUG INVOLVED IN CASES
There Were no exceptions, St.Newide, t ease
in the likelihood of prison following'convic All dru s.^
shared,in the increase (see Table Th ne in the
likelihood of prison in methadone cases inNe rk City and
in cocaine cases elsewhere represent only a's al scare Of
all 'drug cases in these jurisdictions. (see TaT\ )
'A surprising finding is-that heroin cases dec
importance under the new laws relative to,other d ug
(Table XXIVr. In New York City, the relatimf impor1an e of
cocaine has grown, while upstate,-7"cannabis has ihc -axed in
\.\importance. The laws classify'all cannabis cases\ b lY. the
class A level.
'Modt cannabid cases result, however, in'sent_ncey o local
jail rather than to State prison (between 60% and '40% der
both old'and new laws). When State prison senten
are considered, the importance of, heroin has not d li ed.from
tiy '
old law levels.,

oiBE LIKELIHO D OF PRISON SENTENCESFOLLOWING CONVICT/ON 0 A DRUG CHARGE, .BY TYPE OF DRUG
STATEWIDE
Old LaWDrug ' ..(1972-1974)
HeroinII.
-4-7.7-erMeth done 36.0,Cocdi e 51.8Marij an a/
Ha hish,Other
Total LikelihoodTotal Sentences,
16.1
A.0 .
33,5%(4,166);
'NEW YORK CITY
New Law(1974-1975)
43.672:0.16.5
3.4
40.0%(1,66) '
Old Law, .New4lawDrug (1972-1974) 1104- 975)
v.)
HeroinMethadoneCocaineMarijuana/
..HashishOther*
To al LikelihoodTota Sentences
t .
44.9%.49.847.68.7
'15.0
41.8%(2,255).
REST OB.STATE
74.4%
78%113. 5
3.0
55.7%(889)
_Drug
HeroinMet ha eCocai
do
Marijuana/Hashish.
-Other*
Total LikelihoodTotal Sentences
Old Law New Law.(1972-1974) (1974-1975) Lr
50.6%21.665.4
'-)5.
31.6%(1,911)'
60. 6%91.950.116.9
4.8
34.3%(780)
*Other includes! Stimulants; Depressants; Hallucinogens.
-'' 'Source: Drug Law Evaluation, prQ..ject Surxiey.
3O

L302r
TABLEXXIV
TYPE OF DRUG IN CASES RESULTING IN A PRISON SENTENCE
STATEWIDE*
DrugOld Law New Law
(1972-197 ) (1974 -1975)
Heroin 56.4% 45.4%Me.thadone 2.4 5.8Cocaine 14.9 23.7Marijuana/ 14.2 19.0
HashishOther** 12.1 6.1
Total 100.0% 100.0%Number of Sentences (4,166) (1,666)
*Differences between old law and new law dIdtributions areStatistically significant P(x2,.F19.9, p less than .05).
NEW YORK CITY*
Old Law New LawtDrug (1972-1974) (1974-1975)
Heroin 65. 2% 50,0%Methadone 4.0 6...6
Cocaine 24.5 / 3 9Marijuana/ 2.2 .
HashishOther** 4.1 3.9
Total 100.0% 100.0%Number of Sentences (2,255) X886)
*Differences between old law and new law heroin and cocaineare statistically significant (x2=8.79, p less than .05).
REST OF STATE*
ps_uaOld Law
(1972-1974)
Hereih 49.7%Methadone 1.3,CoCaine 7.6Marijuana/ ' 23.3
HashishOther**. 18.1
New Law(1974-1975)
39:4%4.88.2
38.6
,9.0
Total 100.0% 100.0%Number of Sentences (1,911) (780)
*Difference between old law and new law for heroin and Mari-juana are statistically significant (X2=6.46, p' less than .05).
**Includes; Stimulants; Depressants; Hallucinogens.
Source: Di-u9 Law Evaluation Project Survey., 1,,
310

1 -4037
AppendixI
'Sample Design and Method
The data. collected by the Drug Law Evaluation'Project,forethis Repott included a randomlyaampled survey of 1,625cases with a drug indictment as the most serious. charge whichresulted in a drug, conviction and a sentence in New YorkState Superior Courts between January 1, 1972 and' December31, 1975. Seven distinct groups of convictions were sampled.Table'BI shows the number of defendants in each group who-
, were convicted and sentenced and the sample size for eachof these groups.
TABLE B -I
NUMBER OF-DEFENDANTS CONVICTED AND SENTENCED AND SURVEY SAMPLESIZES
Total Number of Defendants SampleConvicted and Sentenced Size
A
'Old Maw-Convictions
1972 .
1923 s.
'1974
New Law,Convictions
1974Class ANon-Class A
1975Class ANon-Class A
4;7621,614
3241,098
1,005. 1,736
69257249'
227202.
189,232
16,444 Total 1,625'
Source: New York State Division of Criminal Justice Services.
SOurcesofData
For new law cases,'the New York State Division of Criminal.Justice'Services supplied the Project with e-list,:arranged bycounty, of'indictments in which a defendant was conui9ted of anydrug offense.during 1914'and 1975. From this list; the appro-priate number of cases were randomly selected within each county.The actual data gathered for the survey were collected field

workers, from the individual case files ntained by each.
county, by either the county clerk or court clerk5,, districtattorney, or probatiOn department: Because not all of-thedata could be obtairild from a single source,records weresearched in the offices of judicial adminCstrators, districtattorneys, and probation directors in eah of the'2.8 counties.surveyed. In five of'the counties, allthree officed werevisited, and .in la others two of the three sources of data
'were utilized.
Old law cases were, selected differently.because no,
Statewide_list of indictments resulting in drug" convictionscould be-obtained for: 972 and 1973. A list was availablefor old law cases carr ed over into 1974; Project staffdeveloped the sample i each county using random selectionprocedures adapted to fit the different record-keeping sys-tem of each county.
.
- /
Scope And.LimitatiOns- of the Sample A
While wide a base of cases,As potaible As desired,the time r ui ed to sample Oases from all 62 counties ofthe State, as the cost of such an undertaking, pre-vented a u11 S atewide sample. As an alternative, 24.of the26 countie in ich,defendants,had'been convicted of a classA felony,d ring 74 and 1975 were selected. Four additionalcounties th t coh be easily reached geographically in thecourse,- f c netting the data were also selected. Tn. each 9fthe 28 c ties, including the five New York City counties;),Arandom.s ple of 'coivictions was drawn for all seven groups(oree'many of the'groUps in which there were convictions).
The inclusion of only 28 of the State's 62 counties dbes.not present'a serious bias to the results! The 28 counties-accounted fer appe6kimately 90% of the State's drug convic-,tions under the old laws, and 85% of the new law convictions.Further, aggregate data were made available by the Division.of Criminal Justice Services on the'likelihoodof prison sen-.
..tenses issued to defendants convicted of. drug offenses ineach county during 1972. These showed no differeUce between
ton-New York City counties and the 34 upstate Countiesnot.he proportion of defendants sent -to prison. in the 23 sampledi.,,.
sampled.,:iThus', the selection of only Some counties was con-sidered representative of All countiesv.,
One actual source of-bias was confronted inqhe selection.of `cases. This concerned the sealing of court rscords irychiehdefendants were adjudiCated as Youthful Offenders (Y.0.). Abouttwo-thirds of these eligible were so'adjudicated. Where courtdpcketing material Was relied upon to deriVe the caseYsample,Youthful Offender cases could not be obtained: 'However, whensources other thin 'court records were used to generate thesample, it was possible to include Youthful Offenders in thesurvey. The impact of this bias on the Statewide data.is
-31 4.)
''t
. , 2/statisticaLly:smdll. to mostdbf the larger counties of theStateinformation about defendants found to be Youthful,Offenders was available, accounting for the magnitude ofY.0.!s. In addition, not all defendants eli§iblafor Youth' - -4ful Offender treatment are adjudicated as touthful,:Offenderp.Records for thesd'offenders wereavailatle on the'Semetrasi...sp:Oult.offenders.' l*o efamine,the size of the bilis, the '''
,,ager:Idistribution of all the sample cases was compared to the, ag'i'stribution of cases from thOse counties in which Youth-
fir,V,.Offender records were available. Only small and statisr_ticallY insignificant changes in the age distribution were
Statistical Presentation. a.1
,
The number of cases selected for each of the seven samplinggroups. (abort 200) was determined as the minimum needed to) statisticallytest for Statewide differences between the charac-teristicaof defendants. In addition, limited comparisons onothei'dimensions were possible. Por'example, New York Citycounties were compared,to upstate counties. BecauseOf thiS sampling design, it was not possible to perform sta- .
tistical tests for.all conceivable differences betWeen thecharacteristics of -defendants, Whenever appropriate, EhOugh,the chi-square (X') and student t -test techniques were employed,using a,..05 level of significance to identify differences in thedata, All tests were two - tailed.
The numbers presented in this report are either estimatesof the Statewide population ped on the sample ilercentages oractual figures based on' infomation from the-New-york StateDivision of Criminal Justice Services.
Reclassification of Old,.Lara Offenses
In order to. draw comparisons between old and new law drugcases, all'oIcl law cases in the sample were reclassified as"new law equivalents" to determine whether they would consti-tute.class A or non-A cases? both for indictments and convic-.tions,- uhder the new laws. In Many cases, a simple mappingwas - possible from an old law indictment or conviction penal
--,.
law article to th new law A or non-A equivalent.* . Inethercases, infOrMation en the type and weight of drUg involved, 4,,and qffense (sale r posseSsion) in addition to the:indictment7,4N,or conviction' article had to be taken into account in accom-,.; '''':-
plishing,a reclassification. Missirig data, primarily weightaf drug, prevented reclassification of 8% of old law cases.
.
tr
*See Rosenblatt, Albert M., New York's New Drug Laws andSentencing Statutes, (Law Journal Press: New Yor, 1973),pp. 17 -39..
(
313

APPENDIX
259-297 0 - '79 - 2L314

APPENDIX
The 1973 New York State Drug LawThe 1973 drug law was enacted as Chapters 276, 277, 278, 676, and 1051
of the 1973 Laws of New York State, Significant subsequent amendments '-are contained in Chapters 785 and 832 of the 1975 Laws and Chapter 480 ofthe 1976 Laws
The 1973 Drug Law and Its ContextNew York State law divides crimes into seven classifications, five felony
and two misdemeanor, ranging from class A felony, the most serious, toclass B misdemeanor, the least serious. The 1973 law divided the class Afelony category into three subclassifications, A-I, A-1I, and A-III. ClassesA- II and A-III were created especially and exclusively for drug crimes.
TABLE A-1CRIME CLASSIFICATION AND SELECTED EXAMPLES
UNDER NEW YORK STATE PENAL LAW
Classification Drug Crime Example Non-Drug CriMe Example.,
A-I Felony Sale of I or. of heroin Murder -I° and 2°
A-II Felony Sale of between I 8 07. and None.I or. of heroin
A -Ill Felony Sale of less than I 8 07. Noneof heroin ,,t
B Felony Second offender. class C Rape I°. RobberL I°drug crime
C Felony Ppssession of I 2 07. of Assault I°. Burglary 2°'methamphetamine
D Felony Sale of any amount of any Grand I.nceny 2°, Forgery 2°controlled substance
E Felony None Perjury 2°,Criminal Contempt 1°
A Misdemeanor Possession of any amount of Unauthorized use of a Vehicleany controllid substance
B Misdemeanor None Menacing
Sentencing possibilities are provided for ,each classification of crime.Under the 1973 law, indeterminate sentences to State prison were mademajulaeory for convicted class A 'and B felons. Certain class C and Dcrimes also carried mandatory indeterminate sentences. An indeterminate

-310-
TABLE
FIRST OFFENDER PENALTIES FOR CLASSES OF CRIME UNDERNEW YORK STATE PENAL LAW
(as fpf June 1977)
INDETERMINATE SENTENCE,TO STATE PRISON
Alternatives to aClassification Minimum Maximum State Prison Sente.ncea
A-Ifelony 15-25 yrs-. Life NonebA-II Felony 68.1/3 yrs. Life None
A-fl Felony 1-8 1/3 yrs. Life NoneB Felony 1-8 1/3 yrs. 3-25 yrs. . NoneC Felony . 1-5 yrs. 3-15 yrs. Probation (5 yrs.), conditional dis-
charge, unconditional dischargede4D Felony 1-2 1/3 yrs. 3-7 yrs. Probation. (5 yrs.), local jail (I yr.),
intermittent imprisonment (1 yr.),conditional discharge, unconditionaldischargee.f/3
%.'-' E Felony 1-1 1/3 -yrs. 3-4 yrs. Probation (5 yrs.), local jail (1 yr.),intermittent imprisonment, condi-tional discharge, unconditionaldischargeef 43 ..
A Misdemeanor None None Local jail (I yr.), intermittent im-prisonment, probation (3 yrs.). con-ditional discharge, unconditionaldischarger11
B Misdemeanor' None None Local jail (3 months), intermittentimprisonment, probation (I yr.), con-.ditional discharge, unconditionaldischargef,
aExcluding fines.b
Murder in the first degree (of a police officer under, particular circumstances) is a class A-I felony thatcarries a mandatory death sentence.
`Hut informants who aid in the investigation or prosecution of a drug. felony may be sentenced to lifetimeprobation,
"'Defendants indicted for class A-III felonies who plead guilty to a class C felony. as authorized by the 1976amendment to the law. may receive a local jail sentence of up to one year instead ofan indeterminate sen-.tence to State imprisonment.
`Noalternative is available for defendants convicted of certain specified class C and class D felonies. Con-ditional discharge and unconditional discharge. are not available to defendants convicted.of drug felonies.(Offenders
who are adjudicated Youthful Offenders may not receive a State prison sentence with a Taxi-mum of more than four years.
goffenders who have been found to he narcotics addicts under the-procedures set forth in the New YorkState Mental Hygiene law must receive either a probation sentence requiring treatment for their addictionor a sentence to either State prison or local jail.
"hOffenders who are adjudicated Youthful Offenders in a Ipcal criminal court and who have. not previouslybeen so adjudicated nr convicted of a crime may not receive a definite sentence of more than six months.
31d
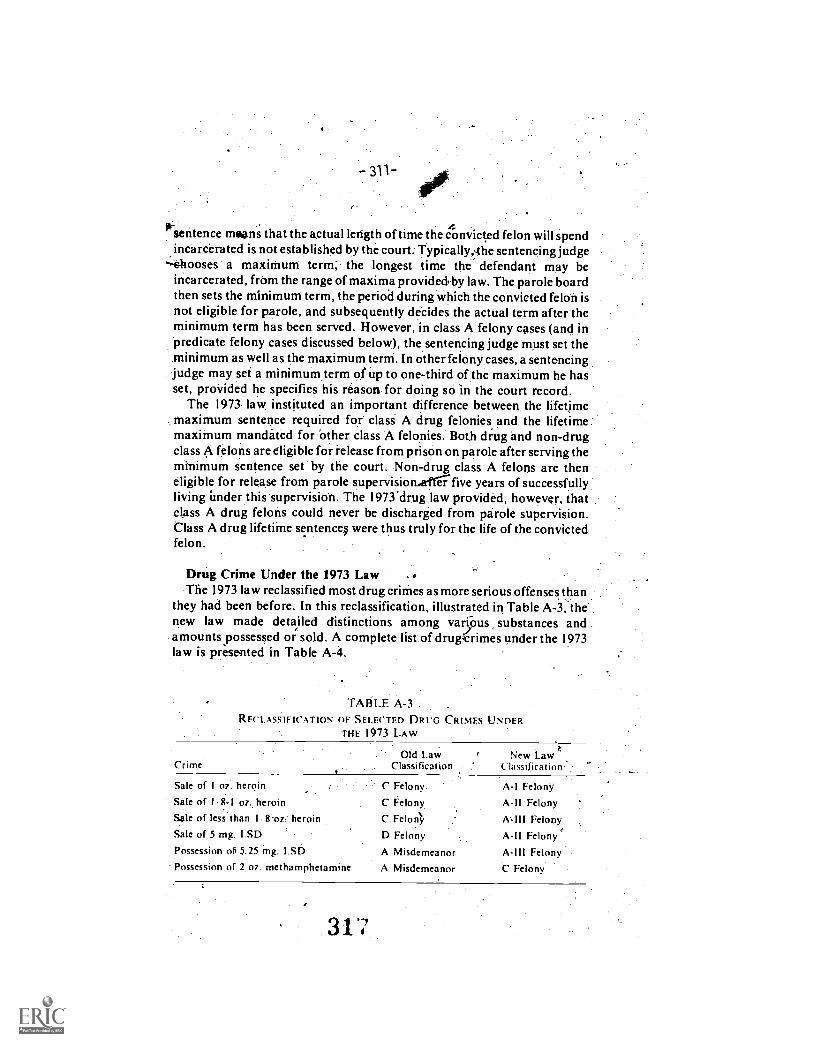
- 311-
r
sentence means that the actual length of time the convicted felon will spendincarcerated is not established by the court. Typically,,the sentencing judge
"hooses a maximum term; the longest time the defendant may beincarcerated, from the range of maxima provided by law. The parole boardthen sets the minimum term, the period during which the convicted felon isnot eligible for parole, and subsequently decides the actual term after theminimum term has been served. However, in class A felony cases (and inpredicate felony cases discussed below), the sentencing judge must set theminimum as well as the maximum term. In other felony cases, a sentencingjudge may set a minimum term of up to one-third of the maximum he hasset, provided he specifies his reason for doing so in the court record.
The 1973 law instituted an important difference between the lifetimemaximum sentence required for clasi A drug felonies and the lifetimemaximum mandated for other class A felonies. Both drug and non-drugclass A felons are eligible for releasefrom prison on parole after serving theminimum sentence set by the court. Non-drug class A felons are theneligible for release from parole supervision five years of successfullyliving under this 'supervision. The 1973.drug law provided, however, thatclass A drug felons could never be discharged from parole supervision.Class A drug lifetime sentence were thus truly for the life of the convictedfelon.
Drug Crime Under the 1973 LawThe 1973 law reclassified most drug crimes as more serious offenses than
they had been before. In this reclassification, illustrated in Table A -3, thenew law made detailed distinctions among various substances andamounts possessed or sold. A complete list of drutcrimes under the 1973law is presented in Table A-4.
TABLE A-3 .
RECLASSIFICATION OF SELECTED DRUG CRIMES UNDERTHE 1973 LAW .
Old Law New LaWCrime Classification Classifications
Sale of 107. herein
Sale of I 8-1 oz. heroin
Sale olless than I, 8-07, heroin
Sale of 5 mg. I.SD
Possession of 5.25 mg. LSD
Possession of 2 07. methamphetamine
C Felony.
C Felony
C Felon},
D Felony
A Misdemeanor
A Misdemeanor
A-I Felony
A-II Felony
A-Ill FelonyA 11 Felony.6
A-111 Felony
C Felony
317

TAKE A4,
CONTROI.LED SUBSTANCE (DRUG) CRIMES UNDER 1973 NEW YORK Sail) DRUG LAWIYIIMP.M==....,
Unlawful sale of Amount
Narcotic drug
Methadone
1 oz, or more
2880 mg. or more
1
INDETERMINATE SENTENCE
TO STATE PRISON
Unlawful possession of Amount Minimum Maximum
Narcotic drug
Methadonea
2 oz. or more 15-25 years Lifeb
,J5760 mg. or mope
Narcotic drug
Methadonea
Methamphetamine
Stimulant
LSD
Hallucinogen
H,allucinogenic substance
118 oz. up to I oz.
,360 mg. up to 2880 m,
1/2 oz, or more
5 gm, or more
5 mg, or more
125 mg, or more
5 gm, or more
Narcotic drug
Methadane
Methamphetamine,
Stimulant
LSD
Hallucinogen
Hallucinogenic substance
I oz. up to 2.oz..
2880 tip to 5760 mg:
oz. or more
10 gm. ormort 6.8113 years Lifcb'
25 mg. or more
625 mg. or more
25 gm, or more
Narcotic.drug
Methamphetamine
Stimulant)
LSD
Hallucinogen
Up to 1/8 oz.
1/8 oz, up to 112 oz.
1 gm. up to 5 gm.
I mg. up to 5 mg.
25 mg. up to 125 mg,
Hallucinogenic substance .1,gm, up to 5 gm. .
Any amount of a stimulant, hallucinogen, 'hallucinogenic
substance; or LSD after a previousIconiriction for a drugoffense ,
Narcotic drug with intent to sell
MethamphetaminC with
intent to sell .
Stimulant with intent to sell.
LSD with iritent to sell
Hallucinogen with intent
to sell
Hallucinogenic substance
StiMulant
LSD
Hallucinogen
Hallucinogenic subst
Any amount
118 oz, or morn
1 gm, or more
I mg. or more
25 mg, or more
1 gm. or more
5 gm. up to 10 gm,:
S mg, up to, 25 mg.
125 mg. up to625.mg,
5gm. up to 25. mgt
r.
14 113 years. Life
L.

Clua Onlawiul sale of
TABLE A-4 (continued)
CONTROLLED SUBSTANCE (DRUG) CRIMES UNDER 1973 NEW YORK STATE DRUG LAW
Amount Unlawful possession of j Amo nt
1NOMRMINATE SENTENCE
TO STATE PRISON11.1Minimum Maximum
A111
Felony
(cont.)
B Felony
C,Felony
A
Any amount of a stimulant, ha lucinorgen, hallucinogenic
substance or Bp with intent to sell after a previous
conviction for a drug offense
Narcotic preparation to a
person under 21
A class C felony sale crime
charted below (with the
exception of marijuana
and methadone) after a
prior convection for a class
C felony sale.crime charted
below (with the exception
of marijuana and meth.
donea)
Narcotic preparation
Dangerous depressant
Depressant
Marijuana
Methadonea
Any amount
Any amount
10 oz, or more
2 1bl, or more
Any amount ,
Up to 360 mg,
A class ,C felony possession
ain't charted below (with
the exception of marijuana
and methadoneatafter a
prior conviction for a class.
C felony posseniontrime
charted below (with the
exception of marijuana
and Methadonel)
Narcotic drug
Narcotic preparation
Methadone&
Methamphetamine
Stinfulant
LSD
Hallucinogen
Hallucinogenic substance
Dangerqus depressant
Depressant
Marijuana
118 oz, up to 1 or,
2 oz. or more
360 ,mg. up to 2880 mg.
112 oz. up to 2 oz.
1 gm, up to 5 gm.
1 mg, up to S mg.
,,25 mg, up to 125 mg.
1 gm, up to gm,
10 01. or more
2 lbs, 'or more
I oz,,or more, or 100
Or more cigarettes
14 I/3 years Life I
4 111 11 111 9,25Y
years years
1.5 years 3.15 yearse

TABLE A-4 Acontinued)
CONTROLLED SUBSTANCE (DRUG) CRIMES UNDER 1973 NEW YORK STATE DRUG LAW .
Class Unlawful sale of .
.
Amount
i
.
Unlawful possession of
.
Amount
INDETERMINATE SENTENCE
TO STATE PRISON
Minimum Miximum
D Felony Any drug Any amount ' ,,, ' Any drug with intent to sell
kNarcotic preparation
Marijuana
,
Any amount
I i 2 o.s. or morem'ore
114 or, or more, or 25
or more cigarettes .
1-2 113 years 3-7 years f
E Felony No drug offenses in this
category.
.
,
.
. .
A misde
meanor
No drug offenses in this,
category,
.
.
Any drug
.
Any amount
. ,
.
Up to I year local jailg#.
B misde..
meanor
No drug offenses in this
category. i,
aClassification of methadone effective August 9, 1975. Prior to that date methadone was classified as a narcotic drug.
bAn indeterminate sentence to. State prison is mandatory. Defendants indicted .for thse crimes may not plead guilty to less than a class, A-111 felony.,.' .
I '1,, . .
cAn indeterminate sentence to Stale prison is mandatory with two exceptions:11) informants may receive a sentence of lifetime probation, (2) defendants 16
Illetthrough HI years of age treated as Youthful Offenders, leftective August 9, 1975). Since, July I, 1976 defendants indicted for these crimes may plead
guilty to a class C felony a ive a local jail sentence of up to one year instead Of an indeterminate sentence to State prison. ,
. , .
dAn indeter'minatesentence to State prison is mandatory. 'However, plea bargaining is unreorictd for defendants indicted for classa felonies, unless the defendant has2
. .
predicate felony record.. /,,,
.
dAn indeterminate sentence to State prison is maridaiory, except for marijuana and methadone crime (see footnote a) and except for defendants who are originally indicted
for class A111 felonies and who plead guilty to this class of felony (see footnote e). However, plea bargaining is unrestricted fordefendantsindicted for class Cfelonies unless
the defendant has a predicate felony record, ,,,, r
fAn indeterminate sentence to State prison is out mandatory. Plea bargaining is unrestricted for defendants indicted tor class I) felonies unless the defendant has a predicate
felony record.
gA jail sentence is not mandatory.
4

-315-
Mandatory indeterminate State prison sentences were provided for classA and B drug felonies, and for class C drug felonies except those involvingmarijuana:To assure that the mandated sentences would be imposed onclass A-offenders, plea bargaining was limited for defendants indicted forclass A crimes. They were not permitted to plead guilty to a crime for'whicha State prison sentence was not mandated. In 1976, the law was amendedto permit defendants indicted. for class A-III felonies to plead down to aslow a charge as a class C felony. Those defendants who pleaded down fromclass A-III crime to a class C crime faced mandatory incarceration, but analternative town indeterminate State prison sentence was provided by theamendment: up to one year in a local jail.
TABLE A-5
PLEA BARGAINING POSSIBILITIES FOR INDICTED DRUG DEFENDANTSUNDER THE 1973 LAW
Lowest Permissible Least RestrictiveIndictment Guilty Plea For Sentence with Lowest
Charge First Offender Permissible Plea
A-I Felony A-Ill Felony State imprisonment. I yr. to lifeA-II Felony A-III Felony State imprisonment! I yr. to lifeA-Ill Felony A- III,Felony. prior to 7 1 77 State imprisonment! 1 yr. to life
C Felony, after 6!30 77 Local jail, I day \. .
B Felony Unrestricted Unconditional discharge.CE.clony_ Unrestricted Unconditional dischargeD Felony - Unrestricted -_ Unconditional discharge
. ,Recidivism Under the 1973 LawThe 1973 law contained two types of provision governing recidivism:
Certain drug crimes were reclassified as more serious felonies if they were ,
second or subsequent offenses: For example, possession of one milligram_oaf LSD was made a class C felony, but if the defendant ,charged withpossessing this amount of LSD had previously been convicted of a drugoffense, the charge became a class A-III felony. .
., .
The second type of reciriivism provision, the second felony,offender orpredicate felony provision, was much wider in scope. A defendant indictedfor any felony crime (drug or non-drug) who had a prior felony convictionwas not permitted to plead down to a misdemeanor charge, and ifdonvictedbecame a second felony offender. (A predicate felony convictionis one for which sentence was passed within ten years of the allegedcommission of the new felOny. Any period of incarceration served byttiedefendant for the predicate felony conviction is not counted when
321

calculating this ten year period.) -
A second felony offender fated a mandatory State imprisonmentsentence with specified minimum and Makimum periods greater thanthose for first offenders. Since class A felony convictions required theimposition of a lifetime indeterminate sentence, the second felony offenderprovision of the 1973 law was not made applicable to class A cases.
TABLE.A-6PREDICATE FELONY PLEA BARGAINING AND SENTENCING
UNDER THE 1973 LAW.
MANDATORY INDETERMINATE SENTENCE. LowestIndi tment PermissibleCh rge Minimum Maximum Plea
Felony 4 1/2-12 1.2 yrs. 9-25 yrs. E Felony
Felony 3-7 I 2 yrs. 6-15 yrs. F FelonyD Felony 2-3 1.2 yrs. 4-7 yrs. .E Felony
E Felony I I 2-2 yrs. 3-4 yrs. E l .e)ony/

\
-317-
, GLOSSARY
AcQuarrAt... A verdict by a judge or jury, after a trial, finding that thedefendant has not been proven guilty of the crime with which hehas been charged.
ADDICTION, DRUG. In this study, a physiological dependence on a drug,produced by regular use of that drug, such that the userundergoes withdrawal symptoms if he stops using it
ARRAIGNMENT. The occasion on which a defendant in a criminal case firstappears before a judge: the defendant is informed of the chargeagainst him, bait is set, and future proceedings are scheduled. Ina felony casethere may be two arraignments: one in the lower
3 criminal court, and one in th erior court after indictment.BAG. The common package of heroin f on the street ("retail" level).
A bag generally contains 0.1 of a substance containingsome. heroin. The amount o heroin in a bag can varyconsiderably.
BAIL. The financial security given by a defendant to guarantee that he willappear in court when required. There are two types, cash bailand bail bond, and the judge may direct the amount and type tobe posted.
CERTIFICATION, CIVIL (of narcotic addicts). A procedure by which indi-viduals who are found to be narcotic addicts, upder the New .
York State Mental Hygiene Law are committed to the care and_custody of the New York State Office of Drug Abuse Servicesfor treatment.
CONTROLLED SUBSTANCE. See DRUG.CONVICTION. The entry of a plea of iuilty by a defendant, or a verdict of
guilty by a judge or jury against a defendant..CONVICTION RATE. The proportion of indictments which are disposed of by
conviction, as opposed to- acquittal or dismissal, in a specifiedtime period.
COURT, LOWER CRIMINi. One of the two types of criminal court in NewYork State (die other is superior court): the'New York CityCriminal Court, or a district, city, town or village court injurisdictions outside New. York City. A local criminal court hasjurisdiction to try misdemeanor cases, and to process felonycases up to the point of indictment.
'COURT, SUPERIOR. One of the two types of criminal court in New YorkState (the other is lower criminal court): the Supreme Court inNew York City, and usually the county court in jurisdictions
323

-318-
outside New. York City. A superior court has jurisdiction to tryfelony cases.
CRIME. An offense against the law. The two categories of crime in NewYork State are FELONY and MISDEMEANOR.
CRIME, DRUG. Theikgal sale of, possession of, or possession with intent tosell any di'irg.
CRIME, DRUG-RELATED. In this Report, the non-drug felonies committedbIlldrug users. The most numerous felonies in this group arerobbery,- burglary, and grand larceny.
CRIME, NON -DRUG. All crimes except drug crimes.DEFENDANT-INDICTMENT. A unit of count Used to measure the inflow of
cases into a superior court. 4t is a summation of all defendants,indicted and all indictments processed as follows: (I) Whenseveral defendants are named in one proceeding or indictment,each defendant is counted separately. (2) When one defendant isnamedin multiple proceedings or indictments, each indictmentis counted Separately. \
DISMISSAL. A decision by a judge toe discontinue a case without adetermination of .guilt or innocence. Dismissals may be of twotypes: a."merit dismissal" is a decision to disContinue a case onsuch grounds as insufficient evidence against the defendant; a"non-merit" dismissal is a decision to discontinue a case for suchreasons as the consolidation of an indictment with anotherindictment pending against the same defendant.
DISMISSAL RATE. The proportion of indictments (or lower court filings)disposed of by dismissal, as opposed to conviction or acquittal,in a specified time, period.
DISPOSITION. Any final action of the superior cqtrt on an indictment,including conviction, acquittal, or dismissal. As used in thisReport, disposition does not include consolidation or abatementof actions atain§t defendants.
,DISPOSITION RATE. The ratio of court dispositions to new indictmentsduring a specified time period, ususally expressed in percentageterms. The ratio may be less than or greater than 100%,according to whether the pending caseload is gro,wing orshrinking.
DRUG. A controlled substance, that is, any substance listed in Schedules I. through V of Section 3306 of the New York State Public Health
Law. The 1973 drug law uses several terms for particular groupsof drugs:
(I) Narcotic drug: inclugles heroin, morphine', opium, andcocaine. Included methadone until August 9, 1975.
'3 2

-319 -
(2) Narcotic preparation: includes codeine, Moriihine, andopium mixtures that have therapeutic uses.
(3) Hallucinogen: includes psilocypin; and tefrahyclro-eanriabinols other than marijuana. _
(4) Hallueinogenic,,substance:, includes mescaline and cer-tain forms of amphetatrime:, . ; . .
.
.(5) Stimulant: includes nicist amphetaMines.(6) Dangerous depressant:-' includes barbiturates and
thethaqualont:(7) Depressant: includes diazepin (Valium), chlordiazep-
oxide (Librium), and meprobamate (Miltownc, Equanil).DRUG ADDICTION. See ADDICTION, DRUG..DRUG-FREE TREATMENT. Treatment of drug users relying on counseling,
group+therapy, and work.b RUG USE. In this study, any regular or frequent use of drugs without
medical supervision; drug users include both addicted and non -addicted users. POLY-DRUG is the regular or frequent use of twoor more drugs, often including alcohol. 4,
DRUG, ILLICIT. Any drug used in violation of ,a statute.DRUGS, NARCOTIC. Opium and opium alkaloids and their derivatives such
as heroin, morphine, and codeine; and synthetic analgesics suchas demerol and methatiOne. These drugs produce physiologicaland psychological dePendence in the regular user. The 1973 druglaw defined narcotic drugs to include cocaine but not (sinceAugust 9, 1975) methadRne.
DituGs, NON-NARCOTIC. A wide range of drug's, including barbiturates andhallucinogens. As used in this Report, the term "non-narcoticdrugs" does not include marijuana or hashish.
FELONY. The niOre serious of the two categories of crime under New York,law (the less serious is misderneanor). After initial proces`Sing inlower criminal court, a felony is prosecuted by indictthent in asuperior court.,
GRAND JURY. A body of between 16 and 23i people which hears andexamines evidence concerning criminal offenses. Only a grandjury may return an indictment.
HEPATITIS, DRUG- RELATED. .Types of hepatitis associated with intravenous''drug use. Any of the three types.(infectioustype A, serum or&ypeB, and "type unspecified may be associated with intravenousdrug use.
HEPATITIS, SERUM, A form of hepatitis often transmitted !.through.contaminated hypodermic needleS, and thus associated withintravenous drtig (usually heroin) use. Also known as "hepatitistype B."
325

IMPRISONMENT. Incarceration in a State prison; as opposed to local jailiIMPRISONMENT, INTERMITTENT. A sentence of incarceraticrnup to one year
in length. Typically, the offender spends weekday's at his regularemployment and-weekends in jail. Intermittent imprisonment isa 'discretionary sentence for first offenders convicted 'of manyclas&D feloniei and all class E felonies, as well as for all offenderscon feted of misdemeanors.
IMPRISONMENT 'RATE. The proportion of convictions resulting in sentences,to State prisbn or local jail.
INDICTMENT. A written accusation by a Grand Jury charging a persouwa crime. Indictments are used generally only in felony cases46indictment forms the basis for orosecutionin a superior,coura
INDICTMENT RATE. The proportion of felony arrests that 'results Orindictment. ,
JAIL. As distinguished from a .State prison; a local institution to which'Offend,ers are committed for a sentence that is both of definitelength and of a duration of one year or less. -
METHADONE MAINTENANCE. A form of treatment for chronic heroin userswhich involves daily administration otmethadone to clients inclinics licensed by State and/ or Federal governments.
MISDEMEANOR. The less serious of the two categories of crime under Neik--York law (the more- serious is feloty) Misdemeanors are:punishable by a definite sentence to jail of up to one year.
NARCOTIC. See DRUGS, NARCOTIC. fi, NARCOTICS-RELATED DEATHS. Deaths attributable to an overdose of
narcotic drugs, usually .as determined by a coroner or medicalexaminer. Does not include suicides, homicides, or accidentaldeaths in which narcotics are found.
OFFENDER. An individual convicted of a crime (as opposed to a defendant,who has been accused but not convicted).
OPIATE. A group of narcotic drugs derived from opium. See DRUGS,NARCOTIC.
PAROLE. (I )Release of an institutionalized inmate serving a,State prisonsentence after he has served his minimum sentence (after whichthe parolee ivies in the community under the supervision of aparole offic r); or (2),, release .on, recognizance during thependancy f a criminal proceeding in a court. SeeRECOGRIZ A CE.
z
PLEA BARGAINING. he exchange of prosecutorial and/ or judicialconcessions (commonly a lesser charge, the dismissal of otherpending cha es, a recommendation by the prosecutor for arsduced sente e, or a combination thereof) for a plea of guiltyIy the defends t.
IL) I-4 0

. .
'PLEAD DOWN. To plead guilty to a lesser chargé. See PLEA IIARGAININO.' POLY-DRUG USE See DRUG USE
PREDICATE FELONY, A prior:felony conviction for an indiVidual offenderfor 'which' ,Sentence was passed within ten, years of thecommission or alleged commission of a new felony. Time spentincarcerated because of the prior felony is not counted: WhencalcUlating this ten;year period. Under the 1973 .law;indicteddefend is witha predicate felony record cotild not Plead d9wnto a millpktneanOr. If a defendarlt with a predicatefelony recordwere convicted of a felony,.he was a "second felony offender,"and subject to Mandatory State imptisonMent.
PRISON, STATE. A correctiOal facility. operated by the New York StateDepartment of 'torreetionarServices for the confinement ofpersons under sentence of imprisonment. PersonS receiving an ,
indeterminate sentence after conviction for . a felony are'committed to State prisons. State prison is distinguished fromJAIL. -
PROBATION. A sentence of a court imposed'on a convicted defendant, inheti of incarceration, requiring him to comply with conditionsspecified by the court. Such conditions may be any thesentencing judge deems reasonably necessary to insure that thedefendant will lead a law-abiding life or to assist him in doing so.:i'itshation'seliteticei fora convicted narcotic addict may include'a requirement that he undergo up to one year of treatment andrehabilitation in an inpatient treatment program: Compliancewith conditions set is supervised' by the offender's probationofficer.
RECOGNIZANCE, RELEASE ON. Release of a defen4dAnt during the pendancyof 'a. iriminal proceeding without requirement of, any form ofguarantee (bail) other than the defendant's agreement that hewilreturn to court when required.
SENTENCE, DEFINITE. A sentence tdjail. Definite sentences may be up toone year in length. Defendants convicted of certain class C, D,and E felonies or of misdemeanors may receive a 'definite.
' se_ntence.:SENTENCE; INDETERMINATE. A sentence:tb State prison for a felony. The
kenteneing judge sets the maximum length of time the offendercan spend in prison, and in some cases also sets. the minimumterm, i.e., a period of parole ineligibility. In other cases, theparole board sets the minimum term. In all cases where. anindeterminate sentence is imposed, the actual term ofimprisonmentis decided.by 'the parole boayi. That term must lieb6tween the minimum and maximum terms.,
32-7

SUBSTANCE, CONTROLLED. See DRUG. s
TRIAL. The examination of issues of fact and law in a case following a pleaof not guilty by a defendant. .A trial is completed hen a verdictof guilty or of acquittal is re'aChed, either by a .iny (jury trial),,Orby a judge (bench trial).
TRIAL RATE. The proportion of indiqtinents (orlower, courtfilings) whichare disposed of by trial, railier than hy gUilty''pIea or dismissal.
YOUTHFUL OFFENDER. .A legai category that irtay assigned ta'a personcharged with a crime alleged to have been committed when hewas')at least 16 years old, but yOunger than .19. During theprosecution of a defendant who is eligible to be designated aYouthful Offender, court records are held confidential from thePublic and the public may be excluded from.attendance at court.proceedings against him. After conviction, a Youthful Offender
:finding may be substituted for the full-fledged conviction,and, ifso, the Offender may not receive an indeterminate sentence'offour years or more'. In addition, all official records relating to the".case (police and ;;Court records) are sealed and becoliie'confidential. Under State laW prior to August 9, 1975, persons
?' charged with class A felonies were not eligible for YouthfulOffender treatment. After August 8, 1915, persons charged withclass A -ill felohies were made eligible., In the First JudicialDepartment (Neu/ York. and Bronx,kounties in New York City);',.persons charged with any class A felony became eligible for this:treafrnent,as a result of a court iedgion in 1974.
GOVERNMENT PRINTING OFFICE :.197B-0-259-297