ofr20181038.pdf - factors affecting long-term … · any use of trade, firm, or product names is...
TRANSCRIPT

Prepared in cooperation with Blue Water Baltimore
Factors Affecting Long-Term Trends in Surface-Water Quality in the Gwynns Falls Watershed, Baltimore City and County, Maryland, 1998–2016
Open-File Report 2018–1038
U.S. Department of the InteriorU.S. Geological Survey

Cover. Blue Water Baltimore monitoring station in the main stem of the Gwynns Falls near the corner of Owings Mills Blvd. and Crondall Lane. (Photograph by Alice Volpitta, Blue Water Baltimore)

Factors Affecting Long-Term Trends in Surface-Water Quality in the Gwynns Falls Watershed, Baltimore City and County, Maryland, 1998–2016
By Emily H. Majcher, Ellen L. Woytowitz, Alexander J. Reisinger, and Peter M. Groffman
Prepared in cooperation with Blue Water Baltimore
Open-File Report 2018–1038
U.S. Department of the InteriorU.S. Geological Survey
U.S. Department of the InteriorRYAN K. ZINKE, Secretary
U.S. Geological SurveyWilliam H. Werkheiser, Deputy Director exercising the authority of the Director
U.S. Geological Survey, Reston, Virginia: 2018
For more information on the USGS—the Federal source for science about the Earth, its natural and living resources, natural hazards, and the environment—visit https://www.usgs.gov or call 1–888–ASK–USGS.
For an overview of USGS information products, including maps, imagery, and publications, visit https://store.usgs.gov.
Any use of trade, firm, or product names is for descriptive purposes only and does not imply endorsement by the U.S. Government.
Although this information product, for the most part, is in the public domain, it also may contain copyrighted materials as noted in the text. Permission to reproduce copyrighted items must be secured from the copyright owner.
Suggested citation:Majcher, E.H., Woytowitz, E.L., Reisinger, A.J., and Groffman, P.M., 2018, Factors affecting long-term trends in surface-water quality in the Gwynns Falls watershed, Baltimore City and County, Maryland, 1998–2016: U.S. Geological Survey Open-File Report 2018–1038, 27 p., https://doi.org/10.3133/ofr20181038.
ISSN 2331-1258 (online)

iii
Acknowledgments
The authors wish to thank Lynn Heller of the Abell Foundation, as well as the Chesapeake Bay Trust Chesapeake Conservation Corps program and the leadership of the Baltimore Ecosystem Study for project funding and in-kind project support. The authors thank David Flores (Center for Progressive Reform, formerly of Blue Water Baltimore) for insights and project development assistance, and Alice Volpitta and Angela Haren of Blue Water Baltimore for their assistance. Thanks to the members of the Baltimore Urban Waters Partnership, Actionable Science work-group, for input on prioritization, data sharing, and project feedback.

v
ContentsAcknowledgments ........................................................................................................................................iiiAbstract ...........................................................................................................................................................1Introduction.....................................................................................................................................................1
Urbanization Impacts ...........................................................................................................................2Climate Impacts.....................................................................................................................................2Impetus for the Study ...........................................................................................................................3Purpose and Scope ..............................................................................................................................3
Why the Gwynns Falls Watershed? ............................................................................................................3Description of the Study Area ............................................................................................................3Land-Cover Change ..............................................................................................................................5Change in Precipitation .......................................................................................................................5
Is the Water Quality of the Gwynns Falls Watershed Changing? ..........................................................6Compilation of Data and Estimates of Water-Quality Trends ......................................................11Summary of Streamflow and Water-Quality Trends .....................................................................12
What Factors are Affecting Water-Quality Trends in the Gwynns Falls? ...........................................17Evaluating Relations between Water Quality and Potential Factors of Influence ...................17Aging Gray Infrastructure and the Influence of Sanitary Sewer Overflows ............................18Implementation of Green Infrastructure and Effects of Best Management Practices ...........23
Conclusions...................................................................................................................................................25References Cited..........................................................................................................................................25
Figures
1. Map showing location of Gwynns Falls watershed and subwatersheds, and Baltimore Ecosystem Study Sites, Baltimore County and Baltimore City, Maryland ........4
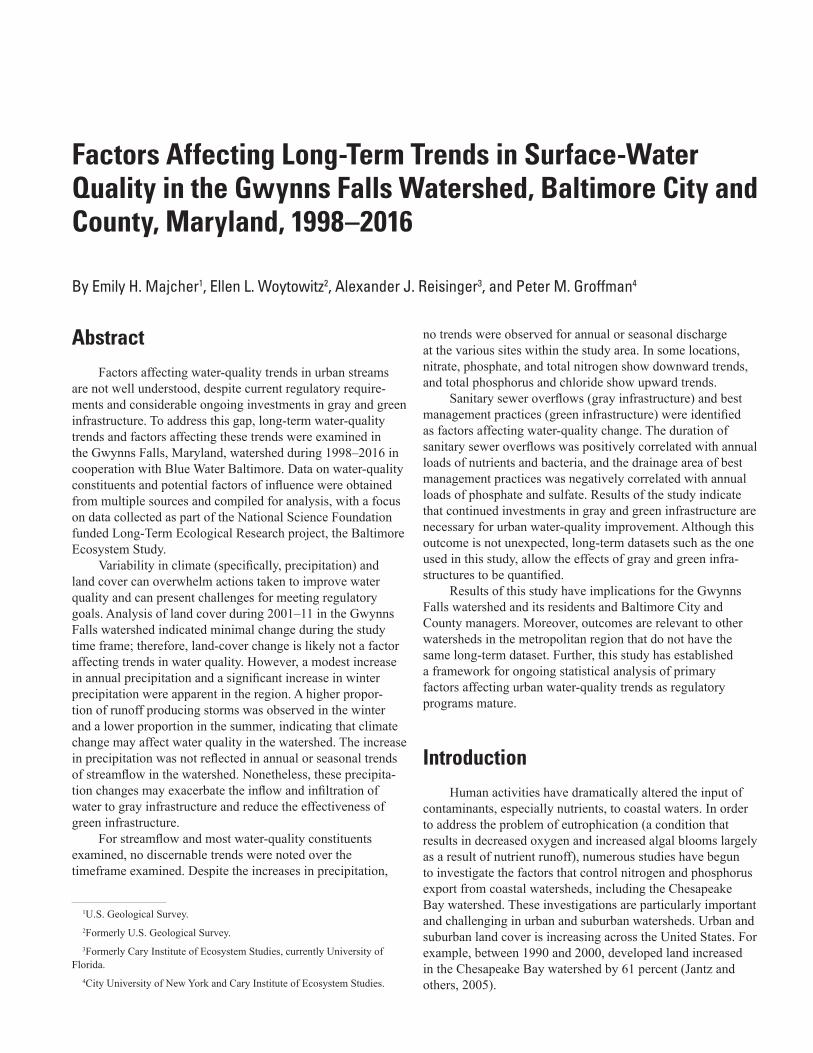
2. Graph showing developed land cover and change in land cover, Gwynns Falls subwatersheds, Baltimore County and Baltimore City, Maryland, 2001–11 .......................6
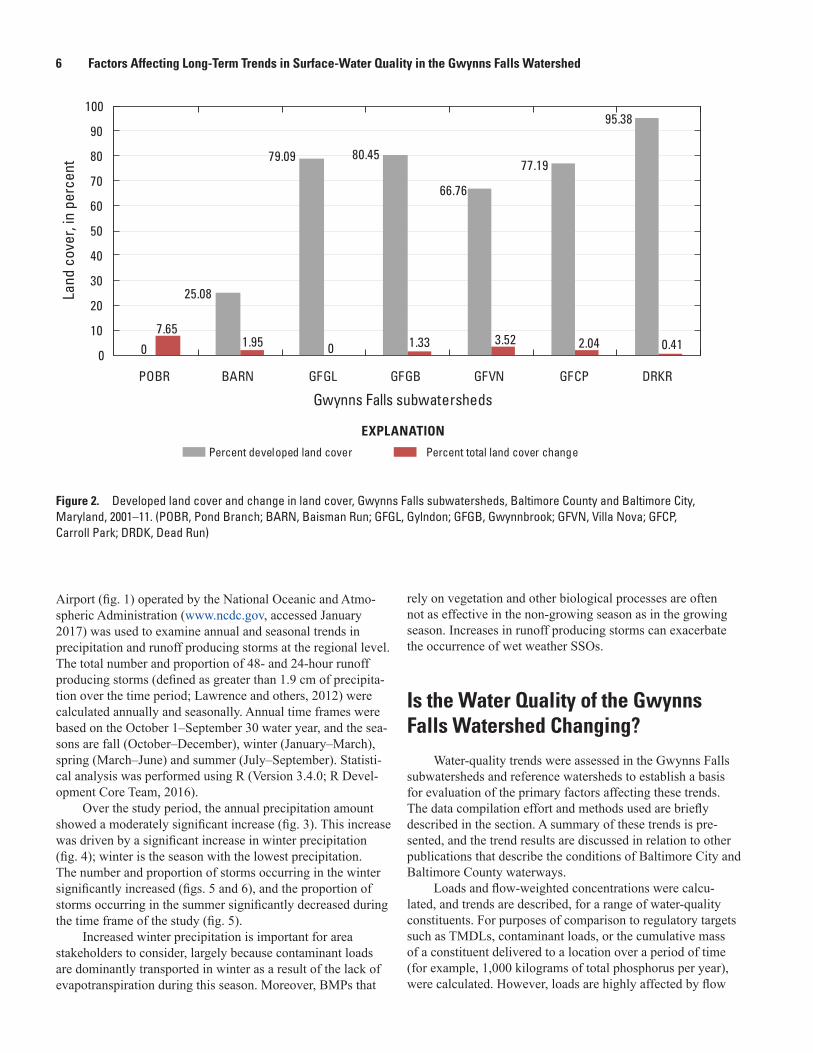
3. Graph showing annual precipitation and annual count of runoff producing storms, Baltimore Washington International Airport meteorological station, Maryland, water years 1999–2016 .................................................................................................................7
4. Graphs showing trends in seasonal precipitation, water years 1999–2016, Baltimore Washington International Airport meteorological station, Maryland: A, spring, B, summer, C, autumn, and D, winter ......................................................................8
5. Graphs showing trends in seasonal runoff producing storms, water years 1999–2016, Baltimore Washington International Airport meteorological station, Maryland: A, spring, B, summer, C, autumn, and D, winter ...................................................9
6. Graphs showing trends in contribution of seasonal runoff producing storms compared to total annual storms, water years 1999–2016, Baltimore Washington International Airport meteorological station, Maryland: A, spring, B, summer, C, autumn, and D, winter ...........................................................................................................10
7. Graph showing annual mean surface-water discharge, Baltimore Ecosystem Study sites, Baltimore County and Baltimore City, Maryland, water years 1999–2013 .....................................................................................................................................13
vi
8. Graphs showing trends in A and C, loads and B and D, flow-weighted concentrations of nitrate (as nitrogen) and total nitrogen, Gwynns Falls Carroll Park subwatershed, Maryland, water years 1999–2013 ..............................................................................................15
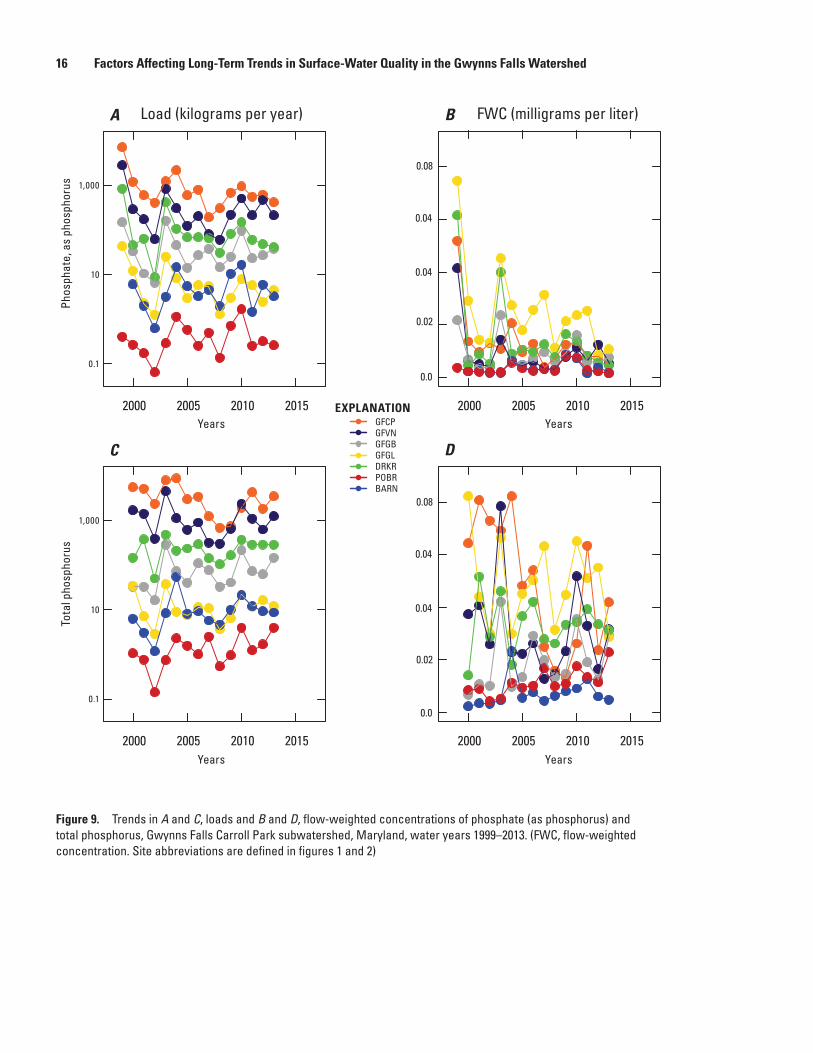
9. Graphs showing trends in A and C, loads and B and D, flow-weighted concentrations of phosphate (as phosphorus) and total phosphorus, Gwynns Falls Carroll Park subwatershed, Maryland, water years 1999–2013 ....................................................................16
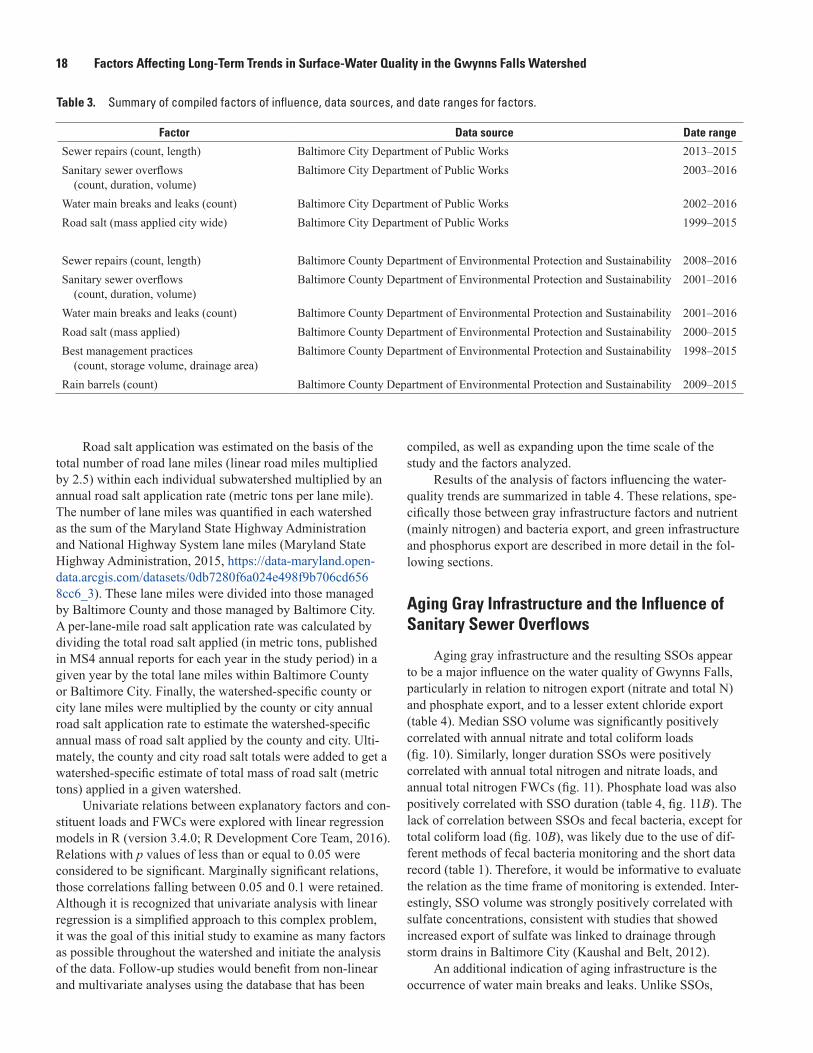
10. Graphs showing significant relation of median sanitary sewer overflow volume to A, annual nitrate (as nitrogen) load, and B, annual total coliform bacteria load, Gwynns Falls Carroll Park subwatershed, Maryland, water years 1999–2013 .......................21
11. Graphs showing relations of mean total sanitary sewer overflow duration (mean) to A, annual nitrate (as nitrogen) load, B, annual phosphate (as phosphorus) load, C, total nitrogen load, and D, total phosphorus load, Gwynns Falls Carroll Park subwatershed, water years 1999–2013 ......................................................................................22
12. Graphs showing significant and moderately significant relations of cumulative best management practices (drainage area) to A, annual phosphate (as phosphorus) load, B, total phosphorus load, C, annual phosphate (as phosphorus) flow-weighted concentration, and D, annual total phosphorus flow-weighted concentration, Gwynns Falls Carroll Park subwatershed, Maryland, water years 1999–2013 .......................24
Tables
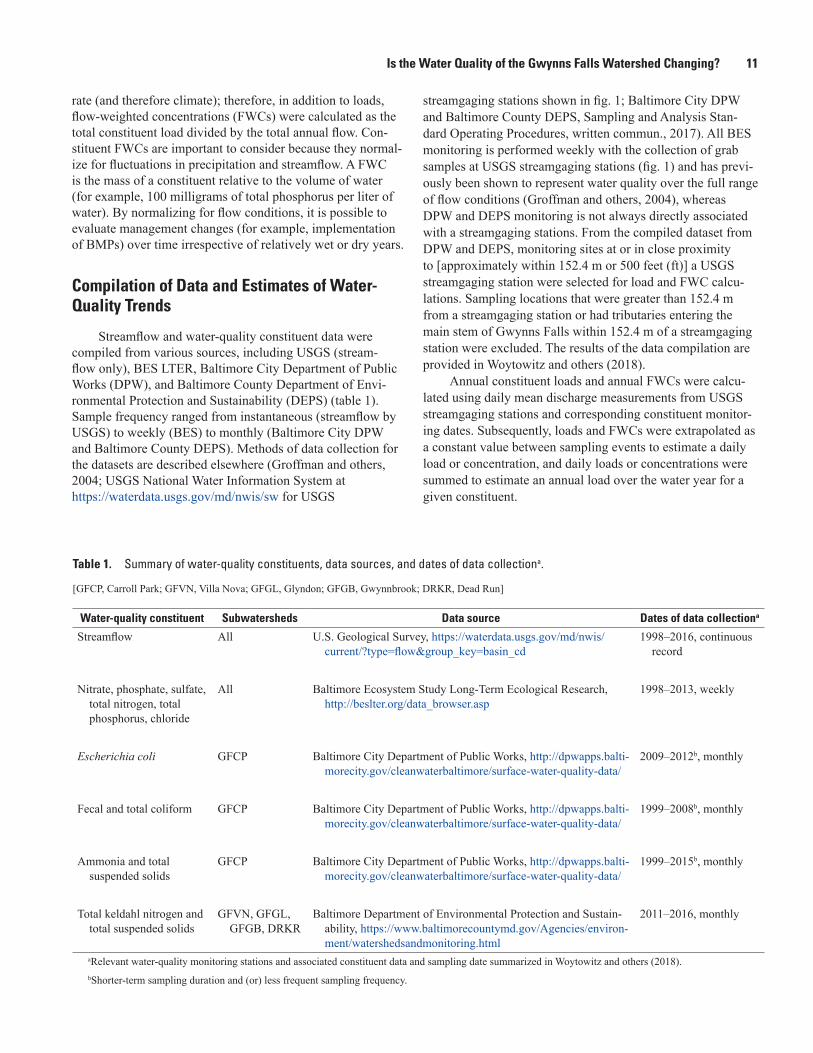
1. Summary of water-quality constituents, data sources, and dates of data collection ......................................................................................................................................11
2. Summary of water-quality constituent trends in Gwynns Falls subwatersheds, Maryland, water years 1999–2013 ...........................................................................................14
3. Summary of compiled factors of influence, data sources, and date ranges for factors ...........................................................................................................................................18
4. Summary of relations between water-quality constituents and factors of influence .......................................................................................................................................19

vii
Conversion Factors
International System of Units to U.S. customary units
Multiply By To obtain
Length
centimeter (cm) 0.3937 inch (in.)millimeter (mm) 0.03937 inch (in.)meter (m) 3.281 foot (ft)kilometer (km) 0.6214 mile (mi)meter (m) 1.094 yard (yd)
Area
square meter (m2) 0.0002471 acrehectare (ha) 2.471 acresquare kilometer (km2) 247.1 acresquare centimeter (cm2) 0.001076 square foot (ft2)square meter (m2) 10.76 square foot (ft2)square centimeter (cm2) 0.1550 square inch (ft2)square kilometer (km2) 0.3861 square mile (mi2)
Volume
liter (L) 0.2642 gallon (gal)cubic meter (m3) 264.2 gallon (gal)cubic meter (m3) 35.31 cubic foot (ft3)cubic meter (m3) 1.308 cubic yard (yd3)cubic meter (m3) 0.0008107 acre-foot (acre-ft)liter (L) 61.02 cubic inch (in3)
Flow rate
liter per second (L/s) 15.85 gallon per minute (gal/min)Mass
gram (g) 0.03527 ounce, avoirdupois (oz)kilogram (kg) 2.205 pound avoirdupois (lb)metric ton 2,204.6 pound avoirdupois (lb)
Temperature in degrees Celsius (°C) may be converted to degrees Fahrenheit (°F) as °F = (1.8 × °C) + 32.
Temperature in degrees Fahrenheit (°F) may be converted to degrees Celsius (°C) as °C = (°F – 32) / 1.8.
Vertical coordinate information is referenced to the National Geodetic Vertical Datum of 1929 (NGVD 29).
Concentrations of chemical constituents in water are given in either milligrams per liter (mg/L) or kilograms per liter (kg/L). Concentrations of bacteria in water are given in most probable number per liter (MPN/L).
viii
AbbreviationsBARN Baisman Run
BES Baltimore Ecosystem Study
BMP Best Management Practice
DEPS Department of Environmental Protection and Sustainability
DPW Department of Public Works
EPA U.S. Environmental Protection Agency
FWC Flow-weighted concentration
GFCP Gwynns Falls Carroll Park
GFGB Gwynns Falls Gwynnbrook
GFGL Gwynns Falls Glyndon
GFVN Gwynns Falls Villa Nova
LTER Long Term Ecological Research
MDE Maryland Department of Environment
MS4 Municipal separate storm sewer system
POBR Pond Branch
SSO Sanitary Sewer Overflow
TMDL Total Maximum Daily Load
USGS U.S. Geological Survey
Factors Affecting Long-Term Trends in Surface-Water Quality in the Gwynns Falls Watershed, Baltimore City and County, Maryland, 1998–2016
By Emily H. Majcher1, Ellen L. Woytowitz2, Alexander J. Reisinger3, and Peter M. Groffman4
AbstractFactors affecting water-quality trends in urban streams
are not well understood, despite current regulatory require-ments and considerable ongoing investments in gray and green infrastructure. To address this gap, long-term water-quality trends and factors affecting these trends were examined in the Gwynns Falls, Maryland, watershed during 1998–2016 in cooperation with Blue Water Baltimore. Data on water-quality constituents and potential factors of influence were obtained from multiple sources and compiled for analysis, with a focus on data collected as part of the National Science Foundation funded Long-Term Ecological Research project, the Baltimore Ecosystem Study.
Variability in climate (specifically, precipitation) and land cover can overwhelm actions taken to improve water quality and can present challenges for meeting regulatory goals. Analysis of land cover during 2001–11 in the Gwynns Falls watershed indicated minimal change during the study time frame; therefore, land-cover change is likely not a factor affecting trends in water quality. However, a modest increase in annual precipitation and a significant increase in winter precipitation were apparent in the region. A higher propor-tion of runoff producing storms was observed in the winter and a lower proportion in the summer, indicating that climate change may affect water quality in the watershed. The increase in precipitation was not reflected in annual or seasonal trends of streamflow in the watershed. Nonetheless, these precipita-tion changes may exacerbate the inflow and infiltration of water to gray infrastructure and reduce the effectiveness of green infrastructure.
For streamflow and most water-quality constituents examined, no discernable trends were noted over the timeframe examined. Despite the increases in precipitation,
no trends were observed for annual or seasonal discharge at the various sites within the study area. In some locations, nitrate, phosphate, and total nitrogen show downward trends, and total phosphorus and chloride show upward trends.
Sanitary sewer overflows (gray infrastructure) and best management practices (green infrastructure) were identified as factors affecting water-quality change. The duration of sanitary sewer overflows was positively correlated with annual loads of nutrients and bacteria, and the drainage area of best management practices was negatively correlated with annual loads of phosphate and sulfate. Results of the study indicate that continued investments in gray and green infrastructure are necessary for urban water-quality improvement. Although this outcome is not unexpected, long-term datasets such as the one used in this study, allow the effects of gray and green infra-structures to be quantified.
Results of this study have implications for the Gwynns Falls watershed and its residents and Baltimore City and County managers. Moreover, outcomes are relevant to other watersheds in the metropolitan region that do not have the same long-term dataset. Further, this study has established a framework for ongoing statistical analysis of primary factors affecting urban water-quality trends as regulatory programs mature.
IntroductionHuman activities have dramatically altered the input of
contaminants, especially nutrients, to coastal waters. In order to address the problem of eutrophication (a condition that results in decreased oxygen and increased algal blooms largely as a result of nutrient runoff), numerous studies have begun to investigate the factors that control nitrogen and phosphorus export from coastal watersheds, including the Chesapeake Bay watershed. These investigations are particularly important and challenging in urban and suburban watersheds. Urban and suburban land cover is increasing across the United States. For example, between 1990 and 2000, developed land increased in the Chesapeake Bay watershed by 61 percent (Jantz and others, 2005).
1U.S. Geological Survey.2Formerly U.S. Geological Survey.3Formerly Cary Institute of Ecosystem Studies, currently University of
Florida.4City University of New York and Cary Institute of Ecosystem Studies.

2 Factors Affecting Long-Term Trends in Surface-Water Quality in the Gwynns Falls Watershed
Urbanization Impacts
Urbanization has complex effects on the behavior and overall impacts of nutrients in the landscape, resulting in loads of these nutrients entering waterways (Kaye and others, 2006; Wollheim and others, 2013). In addition to increasing inputs of contaminants from air pollution (Bettez and Groffman, 2013; Rao and others, 2014), fertilizers (Law and others, 2004), and sewage (Valiela and others, 1997), urbanization also affects the amount of nitrogen and phosphorus retained in the land-scape by increasing runoff that results from increased impervi-ous surfaces. Increasing impervious surface decreases the area in which runoff can naturally move into the soil and sub-surface, which can prevent nitrogen from being cycled back into the environment or retained in the landscape. Further, increased runoff degrades streams and riparian areas, reducing the ability of these areas to function as retention “sinks” for nutrients in the watershed (Walsh and others, 2005). Stormwa-ter control structures, including green infrastructure, temporar-ily hold, divert, and treat stormwater, resulting in more infiltra-tion and thus retention of the nutrients in the soil (Bettez and Groffman, 2012).
Baltimore, Maryland, may be unique because, following a large fire in 1904, the stormwater sewer system was sepa-rated from the sanitary sewer system. Although this reduces problems with “combined sewer overflows,” it results in direct discharge of stormwater runoff to streams and receiving waters that increases with urban and suburban development and impervious surface. As a result, the only contamination source that is considered to be increasing in the Chesapeake Bay region is stormwater runoff (Chesapeake Bay Founda-tion, 2014). In Maryland, all large municipalities are required to obtain and comply with municipal separate storm sewer system (MS4) permits from Maryland Department of the Environment (MDE) to control stormwater contamination in the form of runoff to the “maximum extent practicable.” Jurisdictions are required by their permits to mitigate storm-water contamination by implementing best management practices (BMPs) and watershed restoration. Further, goals have been set to reduce the input of different contaminants, including nutrients, to waterways through the establishment of total maximum daily loads (TMDL)s, which were established to help communities comply with Maryland water-quality standards for waterways by using BMPs. BMPs are applied broadly (in the case of the Chesapeake Bay TMDL for nutri-ents and sediment) and locally to individual impaired water-ways, such as the Gwynns Falls, which is considered impaired because of the presence of fecal bacteria and chlordane (a pesticide), in addition to sediment and nutrients. Examples of BMPs for TMDL compliance include bioretention facili-ties, constructed wetlands, green roofs, infiltration basins, rain gardens, and rain barrels. These measures, implemented by jurisdictions with the help of non-governmental organizations and other community groups, are variable in their effective-ness and cost. In Maryland, BMPs tend to be less cost effec-tive in urban areas than in non-urban areas (Greg Busch,
Maryland Department of Environment, written commun., November 2013). An assessment of the cost effectiveness of BMPs in the James River Basin (Virginia) indicates that detection and elimination of illegal connections to the storm-water discharge network (commonly called Illicit Discharge Detection and Elimination), and use of pet waste manage-ment and stream restoration practices, resulted in the greatest reductions in nutrients and sediment (Center for Watershed Protection, 2013).
The aging infrastructure of the Baltimore City and County sanitary sewer system has resulted in numerous unregulated discharges of untreated sewage to waterways (also called sanitary sewer overflows, or SSOs). Aging infrastruc-ture is not unique to Baltimore. It is a common problem in the United States as a whole and can be considered a public health concern (American Society of Civil Engineers, 2017). SSOs occur when the capacity of the pipes is exceeded because of infiltration and inflow as a result of cracks and leaks, or when a blockage occurs as a result of the presence of foreign objects in the piping system (for example, fats, oils, grease, and wipes). In order to improve the aging infrastructure and reduce SSOs, Baltimore City (U.S. Department of Justice and others, 2002, 2017) and Baltimore County (U.S. Department of Jus-tice and others, 2005) entered into agreements with the U.S. Environmental Protection Agency and Maryland Department of Environment. These Consent Decree agreements require large capital investments estimated to be about $2 billion once completed (Baltimore City Department of Public Works, presentation from public meeting to discuss sewer Consent Decree, written commun., June 2016) to meet mandated goals.
Climate Impacts
Along with urbanization, climate is expected to change for large parts of the United States over the 21st century. Although the changes are predicted to vary by region with high uncertainty in the long term, it is expected that the vari-ability and incidence of climatic extremes, such as heavy precipitation [greater than 5 centimeters (cm) in less than 48 hours], will increase (Walsh and others, 2014). Northern areas, especially the Northeastern United States, are expected to experience increases in precipitation, as well as warmer conditions during the winter months, resulting in more pre-cipitation falling as rain and less as snow, which will decrease the magnitude of snowmelt events but increase the frequency of moderate runoff events (Hayhoe and others, 2007). Even modest increases in rain events can have substantial effects on urban streams because scouring floods can occur in response to small rain events (<0.75 cm; Murdock and others, 2004; Vietz and others, 2016) and subsequently alter ecosystem functions within urban streams (Reisinger and others, 2017). Numerous studies have shown that increased precipita-tion results in higher input of nitrogen to receiving waters and less natural uptake of nitrogen in the watershed (Morse and Wollheim, 2014; Kaushal and others, 2008; Chiwa and others, 2010).

Why the Gwynns Falls Watershed? 3
Impetus for the Study
Given the changing land use and precipitation, coupled with the rapid implementation of BMPs and ongoing sewer repairs, there is a critical need to determine whether the investments have produced the desired improvements in water quality. It is also important to have an understanding of the primary factors affecting water-quality trends. For example, it is important to understand whether water quality has improved not as a result of management interventions alone, but because dry weather has reduced the runoff of pollutants from land to water. Alternatively, long-term water-quality improvements may go undetected, not because interventions are ineffective, but because other factors such as continuing land-use change or increases in precipitation have overwhelmed the positive effects of these interventions. A wide variety of stakeholders, such as the general public, neighborhood groups, munici-pal authorities, and regulatory agencies, are interested and invested in the results of these analyses, which are complex and require a long-term record. This project, initiated in 2016 in cooperation with Blue Water Baltimore, started to investi-gate these questions.
Purpose and Scope
The purpose of this report is to provide the preliminary results of a retrospective analysis of water quality and the factors affecting water quality in the Gwynns Falls watershed of Baltimore County and Baltimore City, Maryland, between 1998 and 2016. Methods are presented for compilation of water-quality data constituents, as well as computation of loads from constituent concentration and streamflow (data presented elsewhere, Woytowitz and others, 2018). Methods for and results of analysis of relations between loads [and flow-weighted concentrations (FWC)] and factors affecting water quality are presented. Results of this study have implica-tions for the Gwynns Falls watershed and receiving waters, the residents, and city and county managers. Outcomes are relevant to other watersheds in the metropolitan region that do not have the same long-term dataset. In summary, the purpose of this report is to improve the understanding of the following questions.1. How have concentrations and loads of various constitu-
ents in the Gwynns Falls watershed changed over the past 15 years?
2. What are the dominant factors that have contributed to these changes, regionally and locally?
Why the Gwynns Falls Watershed?A 2014 monitoring-focused workshop with stakeholders
in the Greater Baltimore region identified the need to further understand factors affecting water-quality change,
particularly at the watershed scale (Majcher, 2014). One reason this knowledge gap exists is that these investigations require a long-term dataset with monitoring performed at a high frequency, which is rather uncommon. The Gwynns Falls watershed was selected largely because it is the main study watershed of the U.S. National Science Foundation funded Baltimore Ecosystem Study (BES) urban Long-Term Ecological Research (LTER) project, which has conducted weekly sampling coupled with continuous streamflow measurement [in collaboration with the U.S. Geological Survey (USGS)] at several sites since 1998. The BES project is designed to answer basic science questions; however, the long-term data provide an opportunity to broaden the use of the basic scientific research by performing additional studies to inform local managers and residents.
The data collected by BES LTER and other organiza-tions in the Gwynns Falls watershed, including Baltimore City Department of Public Works, Baltimore County Department of Environmental Protection and Sustainability, and the USGS, provide the long-term record to make these analyses possible. Further, Gwynns Falls provides a unique, intermediate size drainage area, in which factors that affect water-quality change can be examined. Typically, monitoring is required and con-ducted at a local scale (for example, BMP level evaluation per MS4 permit requirements) and at a broader Chesapeake Bay watershed scale (Moyer and Bloomquist, 2016). The interme-diate scale represented by the Gwynns Falls study area allows us to focus on a larger drainage area than an individual BMP, while still being able to isolate specific management actions within the watershed.
The watershed is further described in this section, and its associated land use and climate variation over time are described. The effects of land cover and climate change in relation to the improvement or decline of water quality in the Gwynns Falls stream is presented.
Description of the Study Area
The Gwynns Falls watershed encompasses 24 percent of the Baltimore City and 7 percent of Baltimore County, and contributes 21 percent of the total water input and 25 percent of the contaminant load to the Baltimore Inner Harbor (MDE, 2010). The 170.67 square kilometer (65.9-square mile) watershed extends from rural/suburban Baltimore County to the center of Baltimore City (fig. 1) and drains into the Middle Branch of the Patapsco River. The network of BES long-term monitoring sites in and around the Gwynns Falls ranges from completely forested “reference” sites to sites in suburban and urban subwatersheds in which impervious cover varies from 0–40 percent, based on 30-meter (m) resolution Digital Elevation Models (DEMs) and the 2011 USGS National Land Cover Dataset (updated 2014, https://landcover.usgs.gov/glc/).
The five BES Gwynns Falls monitoring sites included in this study are Glyndon in the suburban headwaters, Gwynnbrook farther downstream in a suburban area, Villa

4 Factors Affecting Long-Term Trends in Surface-Water Quality in the Gwynns Falls Watershed
75°0'0"W78°0'0"W81°0'0"W
39°0'0"N
38°0'0"N
#
#
#
#
#
#
#
Carroll Park(GFCP)0158932
Baisman Run(BARN)
01583580
Villa Nova(GFVN)
01589300
Dead Run(DRKR)
01589330
Pond Branch(POBR)
01583570Gwynnbrook(GFGB)
01589197
Glyndon(GFGL)
01589180
76°40'0"W76°50'0"W
39°30'0"N
39°20'0"N
39°10'0"N
p
0 100 150 20050 KILOMETERS
0 100 150 20050 MILES
0 5 10 KILOMETERS
0 5 10 MILES
Middle Branch Patapsco River
EXPLANATION
Baltimore County
Baltimore City
Baltimore Washington International (BWI) Airport meterological station
Gwynns Falls stream
Baltimore Ecosystem Study (BES) sites (Abbreviation)— numbers are USGS streamgaging station numbers
#
Patapsco River
Dead Run(DRKR)
01589330
Base modified from Esri, 1:250,000-scale, digital data, 2018
Base modified from Esri, 1:500,000,000-scale, digital data, 2017
Figure 1. Location of Gwynns Falls watershed and subwatersheds, and Baltimore Ecosystem Study Sites, Baltimore County and Balti-more City, Maryland. (BWI, Baltimore Washington International Airport; USGS, U.S. Geological Survey; BES, Baltimore Ecosystem Study)

Why the Gwynns Falls Watershed? 5
Nova at the suburban/urban boundary, and Dead Run and Carroll Park in urban areas (fig. 1). Glyndon, Gwynbrook, Villa Nova, and Carroll Park sites are on the main stem of the Gwynns Falls, whereas the Dead Run site is on a tributary to Gwynns Falls (fig. 1). Two more sites, Pond Branch in a forested area and Baisman Run in a suburban unsewered area, are used as reference sites and are within the Gunpowder Falls watershed (fig. 1). The watershed and subwatershed boundaries were delineated using a 30-m resolution USGS DEM (2011, updated 2014, https://landcover.usgs.gov/glc/).
Annual assessments conducted by MDE to fulfill require-ments of the Clean Water Act (sections 305(b) and 303(d); MDE, 2014) show that the Gwynns Falls stream is impaired to varying degrees by several constituents, including fecal coliform bacteria, total phosphorus, total suspended solids, chloride, and polychlorinated biphenyls. In addition, specific goals for total nitrogen, total phosphorus, and total sediment are mandated by Maryland as a partner in the Chesapeake Bay Restoration Agreement (EPA, 2010). Impaired streams that do not meet the water-quality criteria designated by the State of Maryland are typically required to implement a management strategy and actions to bring streams into compliance.
Land-Cover Change
The spatial and temporal variation of land cover is an important factor to consider when studying water quality. To assess the amount of land-cover change that occurred within the Gwynns Falls subwatersheds during the study period, percent land-cover change from 2001 to 2011 was calculated for each subwatershed using National Land Cover Database 30-m resolution raster datasets (Homer and others, 2007, 2015). The change in land cover (∆LC) was assessed by reclassifying raster values (RV) from 2001 and 2011 to one of eight general land-cover categories, including water, developed, barren, forest, shrubland, herbaceous, agriculture, and wetlands. The land-cover values were compared using the following equation:
(RV2001 * 10) + RV2011 = ∆LC (1)
Change in land cover was assessed by examining the two digit number generated (∆LC) where the first digit represents the 2001 value, and a second digit represents the 2011 value. Land-cover change was identified by differences in the two digits of the land-cover number (for example, 42 = forest to developed land-cover change). For each category, the number of raster cells was summed to get a ∆LC raster count, then the number of cells for each category (∆LC) was multiplied by the area of an individual raster cell [900 square meters (m2)] to calculate land-cover change area by using
Land-Cover Change Area = ∆LC Raster Count * 900 m2 (2)
Subsequently, the percent land-cover change for each category was calculated by using
Percent LC Change = (Land-Cover Change Area/ Subwatershed Area) * 100 (3)
where the subwatershed area was estimated using the sum of all areas for the eight categories.
Minimal land-cover change occurred in the watersheds of interest over the period analyzed (fig. 2), despite estimates of increasing urbanization across the Chesapeake Bay watershed, likely as a result of the already high percentage of impervi-ous surface of the watershed at the start of the study. This is consistent with previous studies that estimated impervious surface change over roughly the same time frame, which indicated that older, established cities have relatively stable impervious surface over time (Sexton and others, 2013). The greatest percent change in land cover (7.65 percent) occurred in the Pond Branch forested reference subwatershed, and all of this change was from forested to herbaceous land cover, likely associated with natural gas line maintenance, which should have minimal effect on the hydrology and water quality of the subwatershed. Change in all other subwatersheds, except Villa Nova, was estimated to be about 2 percent; change was predominantly from forest and agricultural to developed land cover. Land-cover change within the Villa Nova subwatershed was estimated to be about 3.5 percent; change was predomi-nantly from forest and agriculture to developed (fig. 2).
The minimal land-cover change of about 2 percent across the entire watershed (represented by the Carroll Park subwa-tershed) indicates that land-cover change is unlikely to be a major factor affecting water-quality trends across the water-shed during the period of interest. If the subwatersheds were not as urbanized as they are, smaller changes in land cover could be more significant. However, nearly all subwatersheds in Gwynns Falls watershed were already dominated by devel-oped land cover (fig. 2). There is, however, considerable varia-tion in land cover and water quality between subwatersheds.
Change in Precipitation
Assessing changes in water quality over time in a chang-ing climate can be difficult and can complicate evaluation of the effects of BMPs. Variability in climate and the incidence of climate extremes, such as increased heavy precipitation (greater than 1.9 centimeter (cm) in less than 48 hours), are increasing (Walsh and others, 2014). Increased precipitation has been shown to result in greater delivery of contaminants to receiving waters as a result of declines in residence time and uptake in the watershed (Morse and Wollheim, 2014; Kaushal and others, 2008; Chiwa and others, 2010; Bettez and others, 2015).
Owing to the lack of reliable meteorological stations within the watershed, data from a nearby regional meteoro-logical station at Baltimore-Washington International (BWI)
6 Factors Affecting Long-Term Trends in Surface-Water Quality in the Gwynns Falls Watershed
0
25.08
79.09 80.45
66.76
77.19
95.38
7.651.95 0 1.33 3.52 2.04 0.41
0
10
20
30
40
50
60
70
80
90
100
POBR BARN GFGL GFGB GFVN GFCP DRKR
Land
cov
er, i
n pe
rcen
t
Gwynns Falls subwatersheds
Percent developed land cover Percent total land cover change
EXPLANATION
Figure 2. Developed land cover and change in land cover, Gwynns Falls subwatersheds, Baltimore County and Baltimore City, Maryland, 2001–11. (POBR, Pond Branch; BARN, Baisman Run; GFGL, Gylndon; GFGB, Gwynnbrook; GFVN, Villa Nova; GFCP, Carroll Park; DRDK, Dead Run)
Is the Water Quality of the Gwynns Falls Watershed Changing?
Water-quality trends were assessed in the Gwynns Falls subwatersheds and reference watersheds to establish a basis for evaluation of the primary factors affecting these trends. The data compilation effort and methods used are briefly described in the section. A summary of these trends is pre-sented, and the trend results are discussed in relation to other publications that describe the conditions of Baltimore City and Baltimore County waterways.
Loads and flow-weighted concentrations were calcu-lated, and trends are described, for a range of water-quality constituents. For purposes of comparison to regulatory targets such as TMDLs, contaminant loads, or the cumulative mass of a constituent delivered to a location over a period of time (for example, 1,000 kilograms of total phosphorus per year), were calculated. However, loads are highly affected by flow
rely on vegetation and other biological processes are often not as effective in the non-growing season as in the growing season. Increases in runoff producing storms can exacerbate the occurrence of wet weather SSOs.
opment Core Team, 2016).Over the study period, the annual precipitation amount
showed a moderately significant increase (fig. 3). This increase was driven by a significant increase in winter precipitation (fig. 4); winter is the season with the lowest precipitation. The number and proportion of storms occurring in the winter significantly increased (figs. 5 and 6), and the proportion of storms occurring in the summer significantly decreased during the time frame of the study (fig. 5).
Increased winter precipitation is important for area stakeholders to consider, largely because contaminant loads are dominantly transported in winter as a result of the lack of evapotranspiration during this season. Moreover, BMPs that
Airport (fig. 1) operated by the National Oceanic and Atmo-spheric Administration (www.ncdc.gov, accessed January 2017) was used to examine annual and seasonal trends in precipitation and runoff producing storms at the regional level. The total number and proportion of 48- and 24-hour runoff producing storms (defined as greater than 1.9 cm of precipita-tion over the time period; Lawrence and others, 2012) were calculated annually and seasonally. Annual time frames were based on the October 1–September 30 water year, and the sea-sons are fall (October–December), winter (January–March), spring (March–June) and summer (July–September). Statisti-cal analysis was performed using R (Version 3.4.0; R Devel-
Is the Water Quality of the Gwynns Falls Watershed Changing? 7
EXPLANATION
Runoff producing storms
Trend line, annual precipitation
Annual precipitation
0
10
20
30
40
Annu
al p
reci
pita
tion,
in c
entim
eter
s
2000 2005 2010 2015
0
50
100
150
200
Annu
al n
umbe
r of s
torm
s
Years
r2=0.17p=0.093
Figure 3. Annual precipitation and annual count of runoff producing storms, Baltimore Washington International Airport meteorological station, Maryland, water years 1999–2016. (Dashed line, 0.05<p<0.1).

8 Factors Affecting Long-Term Trends in Surface-Water Quality in the Gwynns Falls Watershed
0
20
40
60
80
A. Spring
p > 0.1
B. Summer
p > 0.1
2000 2005 2010 2015
0
20
40
60
80C. Autumn
p > 0.1
2000 2005 2010 2015
D. Winter
r 2 = 0.27
p = 0.026Seas
onal
pre
cipi
tatio
n, in
cen
timet
ers
Years
EXPLANATION
Trend line
Figure 4. Trends in seasonal precipitation, water years 1999–2016, Baltimore Washington International Airport meteorological station, Maryland: A, spring, B, summer, C, autumn, and D, winter.

Is the Water Quality of the Gwynns Falls Watershed Changing? 9
A. Spring B. Summer
C. Autumn D. Winter
0
5
10
15
p > 0.1 p > 0.1
2000 2005 2010 2015
p > 0.1
0
5
10
15
2000 2005 2010 2015
r2 = 0.38
p = 0.006
Num
ber o
f sea
sona
l sto
rms
EXPLANATION
Trend line
Years
Figure 5. Trends in seasonal runoff producing storms, water years 1999–2016, Baltimore Washington International Airport meteorological station, Maryland: A, spring, B, summer, C, autumn, and D, winter.

10 Factors Affecting Long-Term Trends in Surface-Water Quality in the Gwynns Falls Watershed
0
20
40
60
p > 0.1
r2 = 0.27
p = 0.029
2000 2005 2010 2015
0
20
40
60
p > 0.1
2005 2010 2015
r2 = 0.26
p = 0.030
A. Spring B. Summer
C. Autumn D. Winter
2000
EXPLANATION
Trend line
Years
Seas
onal
sto
rm c
ount
/ an
nual
sto
rm c
ount
, in
perc
ent
Figure 6. Trends in contribution of seasonal runoff producing storms compared to total annual storms, water years 1999–2016, Baltimore Washington International Airport meteorological station, Maryland: A, spring, B, summer, C, autumn, and D, winter.
Is the Water Quality of the Gwynns Falls Watershed Changing? 11
rate (and therefore climate); therefore, in addition to loads, flow-weighted concentrations (FWCs) were calculated as the total constituent load divided by the total annual flow. Con-stituent FWCs are important to consider because they normal-ize for fluctuations in precipitation and streamflow. A FWC is the mass of a constituent relative to the volume of water (for example, 100 milligrams of total phosphorus per liter of water). By normalizing for flow conditions, it is possible to evaluate management changes (for example, implementation of BMPs) over time irrespective of relatively wet or dry years.
Compilation of Data and Estimates of Water-Quality Trends
Streamflow and water-quality constituent data were compiled from various sources, including USGS (stream-flow only), BES LTER, Baltimore City Department of Public Works (DPW), and Baltimore County Department of Envi-ronmental Protection and Sustainability (DEPS) (table 1). Sample frequency ranged from instantaneous (streamflow by USGS) to weekly (BES) to monthly (Baltimore City DPW and Baltimore County DEPS). Methods of data collection for the datasets are described elsewhere (Groffman and others, 2004; USGS National Water Information System at https://waterdata.usgs.gov/md/nwis/sw for USGS
streamgaging stations shown in fig. 1; Baltimore City DPW and Baltimore County DEPS, Sampling and Analysis Stan-dard Operating Procedures, written commun., 2017). All BES monitoring is performed weekly with the collection of grab samples at USGS streamgaging stations (fig. 1) and has previ-ously been shown to represent water quality over the full range of flow conditions (Groffman and others, 2004), whereas DPW and DEPS monitoring is not always directly associated with a streamgaging stations. From the compiled dataset from DPW and DEPS, monitoring sites at or in close proximity to [approximately within 152.4 m or 500 feet (ft)] a USGS streamgaging station were selected for load and FWC calcu-lations. Sampling locations that were greater than 152.4 m from a streamgaging station or had tributaries entering the main stem of Gwynns Falls within 152.4 m of a streamgaging station were excluded. The results of the data compilation are provided in Woytowitz and others (2018).
Annual constituent loads and annual FWCs were calcu-lated using daily mean discharge measurements from USGS streamgaging stations and corresponding constituent monitor-ing dates. Subsequently, loads and FWCs were extrapolated as a constant value between sampling events to estimate a daily load or concentration, and daily loads or concentrations were summed to estimate an annual load over the water year for a given constituent.
Table 1. Summary of water-quality constituents, data sources, and dates of data collectiona.
[GFCP, Carroll Park; GFVN, Villa Nova; GFGL, Glyndon; GFGB, Gwynnbrook; DRKR, Dead Run]
Water-quality constituent Subwatersheds Data source Dates of data collectiona
Streamflow All U.S. Geological Survey, https://waterdata.usgs.gov/md/nwis/current/?type=flow&group_key=basin_cd
1998–2016, continuous record
Nitrate, phosphate, sulfate, total nitrogen, total phosphorus, chloride
All Baltimore Ecosystem Study Long-Term Ecological Research, http://beslter.org/data_browser.asp
1998–2013, weekly
Escherichia coli GFCP Baltimore City Department of Public Works, http://dpwapps.balti-morecity.gov/cleanwaterbaltimore/surface-water-quality-data/
2009–2012b, monthly
Fecal and total coliform GFCP Baltimore City Department of Public Works, http://dpwapps.balti-morecity.gov/cleanwaterbaltimore/surface-water-quality-data/
1999–2008b, monthly
Ammonia and total suspended solids
GFCP Baltimore City Department of Public Works, http://dpwapps.balti-morecity.gov/cleanwaterbaltimore/surface-water-quality-data/
1999–2015b, monthly
Total keldahl nitrogen and total suspended solids
GFVN, GFGL, GFGB, DRKR
Baltimore Department of Environmental Protection and Sustain-ability, https://www.baltimorecountymd.gov/Agencies/environ-ment/watershedsandmonitoring.html
2011–2016, monthly
aRelevant water-quality monitoring stations and associated constituent data and sampling date summarized in Woytowitz and others (2018).bShorter-term sampling duration and (or) less frequent sampling frequency.

12 Factors Affecting Long-Term Trends in Surface-Water Quality in the Gwynns Falls Watershed
Instantaneous load was calculated by using
Instantaneous Loadi (kilogram/second) = Ci (kilogram/liter) × Qi (liter/second) (4)
where Ci = Constituent concentration at time step i, and Qi = mean daily discharge, time step i.
We assumed a constant instantaneous load between monitor-ing events, which allowed us to calculate a between-event load estimate by using
Between-event load (kilogram) = Instantaneous Loadi (kilogram/second) x [Ti+1 – Ti] (second) (5)
where [Ti+1 – Ti] = Time between sampling dates.
After calculating loads between each sampling event, annual loads were calculated by using
LoadA (kilogram) = Σ [Ci x Qi x [Ti+1 – Ti]] (6)
Annual FWCs were calculated by using
FWC (milligram/liter) = [Annual load (milligram/year)]/ [Annual Q (liter/year)]. (7)
Trends were quantified using a linear regression model with the different constituents of interest as dependent variables and water year as the independent variable. Statistical analy-sis was performed in R (version 3.4.0; R Development Core Team, 2016). Regressions were assessed visually and using Q–Q plots to establish any issues with non-normality of residuals. No major issues with non-normality were found. It was expected that the simplicity of interpretation using non-transformed values outweighed any potential minor deviations from normality.
Although monthly data for Escherichia coli (E. coli), total suspended solids (TSS), ammonia, and fecal and total coliform were compiled (table 1, Woytowitz and others, 2018), these data collection time frames ranged from 3 to 9 years, whereas weekly data for the other constituents were compiled for 15 years. Owing to the shortened timeframe and frequency of sampling, empirical trends for the five constituents are not reported, but fecal and total coliform datasets were retained for consideration in the factors analysis.
Summary of Streamflow and Water-Quality Trends
Despite the increases in precipitation described above, no trends were observed for annual or seasonal discharge at the seven sites within the study area (fig. 7). However, vari-ability across sites was observed, with the discharge reflecting
subwatershed size and high precipitation years. The greatest magnitude of discharge was measured at the Carroll Park streamgaging station, at the outlet of the watershed to the Middle Branch of the Patapsco River (fig. 7). The lack of any significant change in discharge is surprising, based on the observed increases in precipitation and storm events in this study period. It is uncertain what is causing this lack of response. It may be due to the installation of green infrastruc-ture, which may alter precipitation–discharge relations, buffer-ing these urban and suburban watersheds against increases in precipitation (Burgess, 2017). Although winter storms tend to be regional in nature, spring and summer storms can be spotty and vary widely with respect to duration, intensity, and amount of rainfall. Analysis of the data from meteorological station at BWI may affect consideration of this variability.
A summary of all water-quality trends in the seven subwatersheds in the study is provided in table 2. Most of the constituents and subwatersheds show no significant trends over time (greater than 90% of those considered). In some locations, nitrate, phosphate, and total nitrogen show downward trends and total phosphorus and chloride show upward trends (table 2, figs. 8 and 9). Results are consistent with previously published results examining nitrogen species (Kaushal and others, 2008, 2014; Bettez and others, 2015), and phosphate and total phosphorus (https://cbrim.er.usgs.gov/trends_query.html? at USGS station Gwynns Falls at Villa Nova) for the same years.
Nitrate and total nitrogen loads follow patterns reflective of watershed size and appear to be largely affected by high precipitation and storm event years, including 2003 (Hur-ricane Isabel) and 2010 (multiple snow events and Tropical Storm Nicole) (fig. 3, figs. 8A, C). This is consistent with observations by Bettez and others (2015) and Kaushal and others (2008, 2014), where increased precipitation and storms were associated with increased export of constituents. Perhaps because of this strong correlation to precipitation variability, there were no significant trends in nitrate or total nitrogen loads in any subwatershed. When normalizing for the variabil-ity in streamflow using FWCs (figs. 8B, D), different patterns emerge, and the variability between years is dampened. A sig-nificant increase in nitrate FWC was observed for Dead Run (the most urban subwatershed) but not for the other subwater-sheds. Total nitrogen showed a significant decline at the Glyn-don headwaters site only (fig. 8D). The variability and mag-nitude of nitrate and total nitrogen FWCs do not follow the same patterns with urbanization and watershed size observed for loads (figs. 8A, C), likely owing to the effect of streamflow on loads. Variability in FWCs is likely driven by variation in nitrogen and nitrate sources (sanitary sewer overflows, septic systems, pet waste, fertilizers) in the seven watersheds.
Phosphate loads remained unchanged or declined at all sites (fig. 9A) with significant declines noted in the headwa-ters of Gwynns Falls stream at Glyndon, as well as at the urban Dead Run and Carroll Park sites. Total phosphorus significantly increased in the suburban Gwynn Brook site and significantly decreased at Carroll Park, with no significant

Is the Water Quality of the Gwynns Falls Watershed Changing? 13
2000 2005 2010 2015
Annu
al m
ean
disc
harg
e, in
cub
ic m
eter
s
GFCPGFVNGFGBGFGLDRKRPOBRBARN
EXPLANATION
Years
10,000
100,000
1,000,000
10,000,000
100,000,000
Figure 7. Annual mean surface-water discharge, Baltimore Ecosystem Study sites, Baltimore County and Baltimore City, Maryland, water years 1999–2013. (Site abbreviations are defined in figures 1 and 2)

14 Factors Affecting Long-Term Trends in Surface-Water Quality in the Gwynns Falls WatershedTa
ble
2.
Sum
mar
y of
wat
er-q
ualit
y co
nstit
uent
tren
ds in
Gw
ynns
Fal
ls s
ubw
ater
shed
s, M
aryl
and,
wat
er y
ears
199
9–20
13.
[PO
BR
, Pon
d B
ranc
h; B
AR
N, B
aism
an R
un; G
FGL,
Gly
ndon
; GFG
B, G
wyn
nbro
ok; G
FCP,
Car
roll
Park
; GFV
N, V
illa
Nov
a; D
RK
R, D
ead
Run
; FW
C, fl
ow-w
eigh
ted
conc
entra
tion;
‘-’,
no si
gnifi
cant
tren
d;
‘X’,
trend
cou
ld n
ot b
e as
sess
ed w
ith d
ata
set a
vaila
ble;
(+),
upw
ard
trend
; (-)
, dow
nwar
d tre
nd; p
val
ue, l
evel
of m
argi
nal s
igni
fican
ce; r
2, fi
tnes
s to
linea
r reg
ress
ion
mod
el; B
OL
D p
val
ue le
ss th
an, e
qual
to
0.05
or s
igni
fican
t; p
valu
e be
twee
n 0.
05 a
nd 0
.1, m
argi
nally
sign
ifica
nt; k
g/yr
, kilo
gram
s per
yea
r; m
g/L,
mill
igra
ms p
er li
ter;
trend
s for
feca
l and
tota
l col
iform
, am
mon
ia, t
otal
susp
ende
d so
lids,
tota
l Kel
dahl
ni
troge
n ca
lcul
ated
but
not
pre
sent
ed b
ecau
se o
f mon
thly
sam
plin
g ov
er sh
orte
ned
timef
ram
e]
Nitr
ate
Am
mon
iaTo
tal
nitr
ogen
Phos
phat
eTo
tal p
hosp
horu
sCh
lori
deSu
lfate
Feca
l co
lifor
ma
Tota
l col
iform
a
POB
RLo
ad (k
g/yr
)-
X-
-(+
) p<0
.01,
r2=
0.31
--
XX
FWC
(mg/
L)-
X-
-(+
) p<0
.01,
r2=
0.54
(+) p
=0.0
14, r
2=0.
38-
XX
BA
RN
Load
(kg/
yr)
-X
--
--
-X
X
FWC
(mg/
L)-
X-
--
(+) p
<0.0
1, r
2=0.
46-
XX
GFG
LLo
ad (k
g/yr
)-
X-
(-) p
=0.0
49, r
2=0.
27-
--
XX
FWC
(mg/
L)(-
) p=0
.087
, r2=
0.21
X(-
) p=0
.041
, r2=
0.3
(-) p
=0.0
38, r
2=0.
29-
--
XX
GFG
BLo
ad (k
g/yr
)-
X-
--
(+) p
=0.0
18, r
2=0.
36-
XX
FWC
(mg/
L)-
X-
-(+
) p=0
.018
, r=0
.36
(+) p
=0.0
02, r
2=0.
52-
XX
GFV
NLo
ad (k
g/yr
)-
--
--
--
X(+
) p=0
.038
, r2=
0.63
FWC
(mg/
L)-
--
--
--
X-
GFC
PLo
ad (k
g/yr
)-
(-) p
=0.0
7, r2
=0.2
1-
(-) p
=0.0
54, r
2=0.
26(-
) p=0
.08,
r2=0
.23
--
--
FWC
(mg/
L)-
(-) p
=0.0
8, r2
=0.2
0-
(-) p
=0.0
32, r
2=0.
31(-
) p=0
.05,
r2=
0.28
--
--
DR
KR
Load
(kg/
yr)
-X
-(-
) p=0
.088
, r2=
0.21
(+) p
=0.0
2, r
=0.3
8-
-X
X
FWC
(mg/
L)(+
) p=0
.049
, r2=
0.27
X-
-(+
) p=0
.03,
r2=
0.33
--
XX
a Loa
d ex
pres
sed
as M
PN/y
r, m
ost p
roba
ble
num
ber p
er y
ear;
FWC
exp
ress
ed a
s MPN
/L, m
ost p
roba
ble
num
ber p
er li
ter.

Is the Water Quality of the Gwynns Falls Watershed Changing? 15
2000 2005 2010 2015
Load (kilograms per year) FWC (milligrams per liter) A
GFCPGFVNGFGBGFGLDRKRPOBRBARN
2000 2005 2010 2015
Tota
l nitr
ogen
C
2000 2005 2010 2015
B
2000 2005 2010 2015
D
EXPLANATION
YearsYears
YearsYears
Nitr
ate,
as
nitr
ogen
3.0
2.5
2.0
1.5
1.0
0.5
0.0
3.0
2.5
2.0
1.5
1.0
0.5
0.0
1,000,000
10,000
1
1,000
1,000,000
10,000
1
1,000
Figure 8. Trends in A and C, loads and B and D, flow-weighted concentrations of nitrate (as nitrogen) and total nitrogen, Gwynns Falls Carroll Park subwatershed, Maryland, water years 1999–2013. (FWC, flow-weighted concentration. Site abbreviations are defined in figures 1 and 2).
16 Factors Affecting Long-Term Trends in Surface-Water Quality in the Gwynns Falls Watershed
2000 2005 2010 2015
A
GFCPGFVNGFGBGFGLDRKRPOBRBARN
2000 2005 2010 2015
C
2000 2005 2010 2015
B
2000 2005 2010 2015
D
EXPLANATION
YearsYears
YearsYears
Phos
phat
e, a
s ph
osph
orus
Tota
l pho
spho
rus
0.08
0.04
0.04
0.02
0.0
0.08
0.04
0.04
0.02
0.0
1,000
10
0.1
1,000
10
0.1
Load (kilograms per year) FWC (milligrams per liter)
Figure 9. Trends in A and C, loads and B and D, flow-weighted concentrations of phosphate (as phosphorus) and total phosphorus, Gwynns Falls Carroll Park subwatershed, Maryland, water years 1999–2013. (FWC, flow-weighted concentration. Site abbreviations are defined in figures 1 and 2)

What Factors are Affecting Water-Quality Trends in the Gwynns Falls? 17
trends at other sites (figs. 9C, D). This may indicate that while variable inputs occur across the watershed, export from the overall watershed to receiving waters is declining for total phosphorus (table 2). Unlike nitrogen, these trends were consistent between loads and FWCs, indicating that phosphate and total phosphorus are not as dependent on the streamflow and climate variability as nitrogen.
The variability and maximum load and FWCs of chloride differ from patterns observed for nitrogen and phosphorus (figs. 8, 9), indicating differing sources. There were no signifi-cant trends for sulfate at any location (table 2).
In 2011, non-governmental and governmental organi-zations in Baltimore City worked together to develop the Healthy Harbor Plan with the goal of working toward mak-ing the Inner Harbor fishable and swimmable by 2020. One outcome of this effort is the Healthy Harbor Report Card, which was first released in 2012. Although the basis for the report card is rooted in ecological and human health indicator thresholds, based on water-quality constituent concentrations (EcoCheck, 2011), rather than individual constituent loads, it is worthwhile to consider the results of the long-term trends at Carroll Park, the most downstream site in relation to these goals. From 2012 to 2014, the report cards indicated slightly improved annual scores for the Gwynns Falls watershed, with improvements mainly noted for total phosphorus (Waterfront Partnership, 2012, 2013, 2014), which are similar to the trends observed in this study. Despite investments in both gray (piped stormwater and sanitary sewer systems) and green (structural best management practices) infrastructure to improve water quality, total phosphorus is the only constituent identified as an impairment to the Gwynns Falls watershed. Chesapeake Bay showed improving water quality over the study time frame at Carroll Park. Other constituents of concern for impairment of the watershed either increased or decreased at Glyndon at the headwaters of the watershed but showed no change at the urban watershed outlet at Carroll Park. Given the limited datasets for TSS, ammonia, E. coli, and fecal coliform, no apparent trends could be determined for these constituents. Although the lack of improvement at Carroll Park may appear discouraging, there are no constituent values that indicate a degradation of water quality at Carroll Park (table 2), which is encouraging given the increases in precipitation that have occurred. Note that while the original gray infrastructure repairs were initiated during 2002–05, there are considerable improvements planned for the next 10 years (U.S. Department of Justice, 2017). Similarly, while jurisdictions have been monitoring and working under MS4 permits throughout the entire study time frame, the bulk of the watershed restoration (for example, reduction of impervious surface) occurred or is planned for post-2013 (Baltimore City Department of Public Works, 2015). This underscores the need for continued assess-ment during these ongoing efforts.
What Factors are Affecting Water-Quality Trends in the Gwynns Falls?
Following the empirical estimation of constituent loads and FWCs, statistical assessment was conducted to further explore the factors affecting water-quality trends in Gwynns Falls watershed. The data compilation effort, references to methods, and a summary of the primary factors determined to affect water quality are summarized in relation to regulatory requirements and economic investments. Of the various fac-tors examined, aging gray infrastructure and the resulting SSO occurrences, as well as the implementation of green infra-structure BMPs, appeared to have the greatest effect on water quality at the watershed scale and are the focus of the sections that follow.
Evaluating Relations between Water Quality and Potential Factors of Influence
A summary of the compiled factors of influence along with the data sources and date ranges is provided in table 3 and was published in Woytowitz and others (2018). Most fac-tors can be categorized as either gray infrastructure (related to the piped stormwater and sanitary sewer systems) or green infrastructure (related to BMPs). There were several factors that were unavailable and were not included in the analyses. These include fertilizer use, sewer repairs corresponding to the Baltimore City Consent Decree prior to 2013, and BMPs in Baltimore City; these factors were few in number during the time frame of interest.
Most information compiled from the city and county governments was georeferenced, and therefore Baltimore County BMPs, Baltimore City and County SSOs, water main breaks and leaks, and repairs were extracted to each subwater-shed by using ArcMap (Version 10.5.0; ESRI, 2016) and then exported to Excel to assign data points to particular subwa-tersheds. Because of the minimal data density in many of the smaller subwatersheds and a desire to understand the possible influence of these factors on the entire watershed, analysis was focused on the largest, and farthest downstream subwa-tershed, Carroll Park. The data from Carroll Park encompass all upstream subwatershed actions and may be a good repre-sentation of the export of constituents in surface water from the watershed as a whole to the receiving waters of the Middle Branch Patapsco River.
Relations between water-quality trends in Carroll Park subwatershed and SSOs or BMPs as factors were examined through multiple data fields, including count, mean, median, and total duration of SSO, and SSO volume, as well as count, mean, median, and total cumulative storage volume and drainage area for BMPs. It was assumed that once BMPs were implemented they would function as intended over time and therefore were considered cumulative over the period of interest.
18 Factors Affecting Long-Term Trends in Surface-Water Quality in the Gwynns Falls Watershed
Table 3. Summary of compiled factors of influence, data sources, and date ranges for factors.
Factor Data source Date range
Sewer repairs (count, length) Baltimore City Department of Public Works 2013–2015Sanitary sewer overflows
(count, duration, volume)Baltimore City Department of Public Works 2003–2016
Water main breaks and leaks (count) Baltimore City Department of Public Works 2002–2016Road salt (mass applied city wide) Baltimore City Department of Public Works 1999–2015
Sewer repairs (count, length) Baltimore County Department of Environmental Protection and Sustainability 2008–2016Sanitary sewer overflows
(count, duration, volume)Baltimore County Department of Environmental Protection and Sustainability 2001–2016
Water main breaks and leaks (count) Baltimore County Department of Environmental Protection and Sustainability 2001–2016Road salt (mass applied) Baltimore County Department of Environmental Protection and Sustainability 2000–2015Best management practices
(count, storage volume, drainage area)Baltimore County Department of Environmental Protection and Sustainability 1998–2015
Rain barrels (count) Baltimore County Department of Environmental Protection and Sustainability 2009–2015
Road salt application was estimated on the basis of the total number of road lane miles (linear road miles multiplied by 2.5) within each individual subwatershed multiplied by an annual road salt application rate (metric tons per lane mile). The number of lane miles was quantified in each watershed as the sum of the Maryland State Highway Administration and National Highway System lane miles (Maryland State Highway Administration, 2015, https://data-maryland.open-data.arcgis.com/datasets/0db7280f6a024e498f9b706cd6568cc6_3). These lane miles were divided into those managed by Baltimore County and those managed by Baltimore City. A per-lane-mile road salt application rate was calculated by dividing the total road salt applied (in metric tons, published in MS4 annual reports for each year in the study period) in a given year by the total lane miles within Baltimore County or Baltimore City. Finally, the watershed-specific county or city lane miles were multiplied by the county or city annual road salt application rate to estimate the watershed-specific annual mass of road salt applied by the county and city. Ulti-mately, the county and city road salt totals were added to get a watershed-specific estimate of total mass of road salt (metric tons) applied in a given watershed.
Univariate relations between explanatory factors and con-stituent loads and FWCs were explored with linear regression models in R (version 3.4.0; R Development Core Team, 2016). Relations with p values of less than or equal to 0.05 were considered to be significant. Marginally significant relations, those correlations falling between 0.05 and 0.1 were retained. Although it is recognized that univariate analysis with linear regression is a simplified approach to this complex problem, it was the goal of this initial study to examine as many factors as possible throughout the watershed and initiate the analysis of the data. Follow-up studies would benefit from non-linear and multivariate analyses using the database that has been
compiled, as well as expanding upon the time scale of the study and the factors analyzed.
Results of the analysis of factors influencing the water-quality trends are summarized in table 4. These relations, spe-cifically those between gray infrastructure factors and nutrient (mainly nitrogen) and bacteria export, and green infrastructure and phosphorus export are described in more detail in the fol-lowing sections.
Aging Gray Infrastructure and the Influence of Sanitary Sewer Overflows
Aging gray infrastructure and the resulting SSOs appear to be a major influence on the water quality of Gwynns Falls, particularly in relation to nitrogen export (nitrate and total N) and phosphate export, and to a lesser extent chloride export (table 4). Median SSO volume was significantly positively correlated with annual nitrate and total coliform loads (fig. 10). Similarly, longer duration SSOs were positively correlated with annual total nitrogen and nitrate loads, and annual total nitrogen FWCs (fig. 11). Phosphate load was also positively correlated with SSO duration (table 4, fig. 11B). The lack of correlation between SSOs and fecal bacteria, except for total coliform load (fig. 10B), was likely due to the use of dif-ferent methods of fecal bacteria monitoring and the short data record (table 1). Therefore, it would be informative to evaluate the relation as the time frame of monitoring is extended. Inter-estingly, SSO volume was strongly positively correlated with sulfate concentrations, consistent with studies that showed increased export of sulfate was linked to drainage through storm drains in Baltimore City (Kaushal and Belt, 2012).
An additional indication of aging infrastructure is the occurrence of water main breaks and leaks. Unlike SSOs,

What Factors are Affecting Water-Quality Trends in the Gwynns Falls? 19
Tabl
e 4.
Sum
mar
y of
rela
tions
bet
wee
n w
ater
-qua
lity
cons
titue
nts
and
fact
ors
of in
fluen
ce.
[SSO
, san
itary
sew
er o
verfl
ow; B
MP,
bes
t man
agem
ent p
ract
ice;
FW
C, fl
ow-w
eigh
ted
conc
entra
tion;
cum
ul.,
cum
ulat
ive;
‘-’,
no si
gnifi
cant
rela
tions
hip;
(+),
incr
ease
in c
onst
ituen
t with
an
incr
ease
in
fact
or; (
-) d
ecre
ase
in c
onst
ituen
t with
incr
ease
in fa
ctor
; gi
nal s
igni
fican
ce; r
2, fi
tnes
s to
linea
r reg
ress
ion
mod
el; B
OL
D p
p va
lue,
leve
l of m
arp
val
ue le
ss th
an, e
qual
to 0
.05
or si
gnifi
cant
; v
alue
gre
ater
gi
nally
sign
ifica
nt; k
g/yr
than
0.0
5 an
d le
ss th
an 0
.1, m
ar, m
ost p
roba
ble
num
ber p
er y
ear;
MPN
/L, m
ost p
roba
ble
num
ber p
er li
ter;
h, h
ours
; , k
ilogr
ams p
er y
ear;
mg/
L, m
illig
ram
s per
lite
r; M
PN/y
rm
3 ,
, squ
are
kilo
met
ers;
yr,
year
]cu
bic
met
ers;
km
2
Tota
l nitr
ogen
To
tal p
hosp
horu
s Fe
cal c
olifo
rm
Tota
l col
iform
N
itrat
e lo
ad
Am
mon
ia lo
ad
Phos
phat
e lo
ad
Chlo
ride
load
Su
lfate
load
lo
ad
load
lo
ad
load
(k
g/yr
)(k
g/yr
)(k
g/yr
)(k
g/yr
)(k
g/yr
)(k
g/yr
)(k
g/yr
)(M
PN/y
r)(M
PN/y
r)
SSO
dur
atio
n (h
)M
ean
(+) p
=0.0
38,
-(+
) p=0
.015
, (+
) p=0
.008
, -
--
-(+
) p=0
.067
, r2
=0.3
4r2
=0.4
3r2
=0.4
9r2
=0.4
5
Med
ian
--
--
--
--
-
Tota
l(+
) p=0
.016
, -
(+) p
=0.0
37,
--
-p=
0.07
7,
--
r2=0
.42
r2=0
.34
r2=0
.26
SSO
vol
ume
(m3 )
Mea
n-
--
--
(+) p
=0.0
55,
--
-r2
=0.3
0
Med
ian
(+) p
=0.0
51,
(+) p
=0.0
26,
(+) p
=0.0
57,
(+) p
=0.0
39,
(+) p
=0.0
78,
-(+
) p<0
.001
, -
(+) p
=0.0
48,
r2=0
.30
r2=0
.33
r2=0
.29
r2=0
.33
r2=0
.26
r2=0
.70
r2=0
.51
Tota
l-
--
--
(+) p
=0.0
98,
(+) p
=0.0
47,
--
r2=0
.23
r2=0
.31
BM
P dr
aina
ge a
rea
(km
2 )M
ean
--
--
--
--
-
Med
ian
--
--
--
--
-
Tota
l-
--
--
--
--
Cum
ul.
-(-
) p=0
.052
, -
(-) p
=0.0
5,
(-) p
=0.0
38,
(+) p
=0.0
79,
--
-r2
=0.2
3r2
=0.2
6r2
=0.3
1r2
=0.2
1
BM
P st
orag
e vo
lum
e (m
3 )M
ean
--
--
-(+
) p=0
.004
, -
--
r2=0
.48
Med
ian
--
--
--
--
-
Tota
l-
--
--
(+) p
=0.0
10,
--
-r2
=0.4
1
Cum
ul.
-(-
) p=0
.067
4,
--
--
--
r2=0
.21
BM
P co
unt
Cum
ul.
--
--
--
--
-
Wat
er m
ain
brea
ks/le
aks
Cou
nt-
--
(+) p
=0.0
938
-(+
) p=0
.069
, -
--
r2=0
.25
Bre
aks
--
--
-(+
) p=0
.093
, -
--
r2=0
.22
Leak
s-
--
--
(+) p
=0.0
85,
--
-r2
=0.2
3
Roa
d sa
lt ap
plie
d (m
etric
tons
/yr)
--
(+) p
=0.0
44,
--
--
-(+
) p=0
.062
, r2
=0.2
8r2
=0.3
7

20 Factors Affecting Long-Term Trends in Surface-Water Quality in the Gwynns Falls WatershedTa
ble
4.
Sum
mar
y of
rela
tions
bet
wee
n w
ater
-qua
lity
cons
titue
nts
and
fact
ors
of in
fluen
ce.—
Cont
inue
d
[SSO
, san
itary
sew
er o
verfl
ow; B
MP,
bes
t man
agem
ent p
ract
ice;
FW
C, fl
ow-w
eigh
ted
conc
entra
tion;
cum
ul.,
cum
ulat
ive;
‘-’,
no si
gnifi
cant
rela
tions
hip;
(+),
incr
ease
in c
onst
ituen
t with
an
incr
ease
in
fact
or; (
-) d
ecre
ase
in c
onst
ituen
t with
incr
ease
in fa
ctor
; p v
alue
, lev
el o
f mar
gina
l sig
nific
ance
; r2,
fitn
ess t
o lin
ear r
egre
ssio
n m
odel
; BO
LD
p v
alue
less
than
, equ
al to
0.0
5 or
sign
ifica
nt; p
val
ue g
reat
er
than
0.0
5 an
d le
ss th
an 0
.1, m
argi
nally
sign
ifica
nt; k
g/yr
, kilo
gram
s per
yea
r; m
g/L,
mill
igra
ms p
er li
ter;
MPN
/yr,
mos
t pro
babl
e nu
mbe
r per
yea
r; M
PN/L
, mos
t pro
babl
e nu
mbe
r per
lite
r; h,
hou
rs;
m3 ,
cubi
c m
eter
s; k
m2 ,
squa
re k
ilom
eter
s; y
r, ye
ar]
Tota
l nitr
ogen
Ph
osph
ate
Tota
l pho
spho
rus
Feca
l col
iform
To
tal c
olifo
rm
Nitr
ate
FWC
A
mm
onia
FW
C
Chlo
ride
FW
C
Sulfa
te F
WC
FW
C
FWC
FW
C
FWC
FW
C
(mg/
L)(m
g/L)
(mg/
L)(m
g/L)
(mg/
L)(m
g/L)
(mg/
L)(M
PN/L
)(M
PN/L
)
SSO
dur
atio
n (h
)M
ean
(+) p
=0.0
13,
-(+
) p=0
.002
(+
) p=0
.005
, -
--
--
r2=0
.44
r2=0
.58
r2=0
.43
Med
ian
--
--
--
--
-
Tota
l(+
) p=0
.013
, -
--
--
--
-r2
=0.4
4
SSO
vol
ume
(m3 )
Mea
n-
--
--
--
--
Med
ian
-(+
) p=0
.087
, -
--
-(+
) p=0
.017
, -
-r2
=0.2
1r2
=0.4
2
Tota
l-
--
--
-(+
) p=0
.062
, -
-r2
=0.2
8
BM
P dr
aina
ge a
rea
(km
2 )M
ean
--
--
--
--
-
Med
ian
--
--
--
--
-
Tota
l-
--
--
--
--
Cum
ul.
--
-(-
) p=0
.003
, (-
) p=0
.003
, -
--
-r2
=0.5
0r2
=0.5
3
BM
P st
orag
e vo
lum
e (m
3 )M
ean
--
--
--
--
-
Med
ian
--
--
--
--
-
Tota
l-
--
--
--
--
Cum
ul.
-()
p=0
.077
, -
(-) p
=0.0
08,
--
(-) p
=0.0
04,
--
r2=0
.19
r2=0
.42
r2=0
.49
BM
P co
unt
Cum
ul.
-(-
) p=0
.072
-(-
) p=0
.003
37-
--
--
Wat
er m
ain
brea
ks/le
aks
Cou
nt-
--
-(+
) p=0
.082
, (+
) p=0
.028
, -
--
r2=0
.23
r2=0
.34
Bre
aks
--
--
(+) p
=0.0
76,
(+) p
=0.0
31,
--
-r2
=0.2
4r2
=0.3
3
Leak
s-
--
--
--
--
Roa
d sa
lt ap
plie
d (m
etric
tons
/yr)
(+) p
=0.0
13,
--
--
0.07
8, r2
=0.2
2(+
) p=0
.010
, -
-r2
=0.3
9r2
=0.4
4
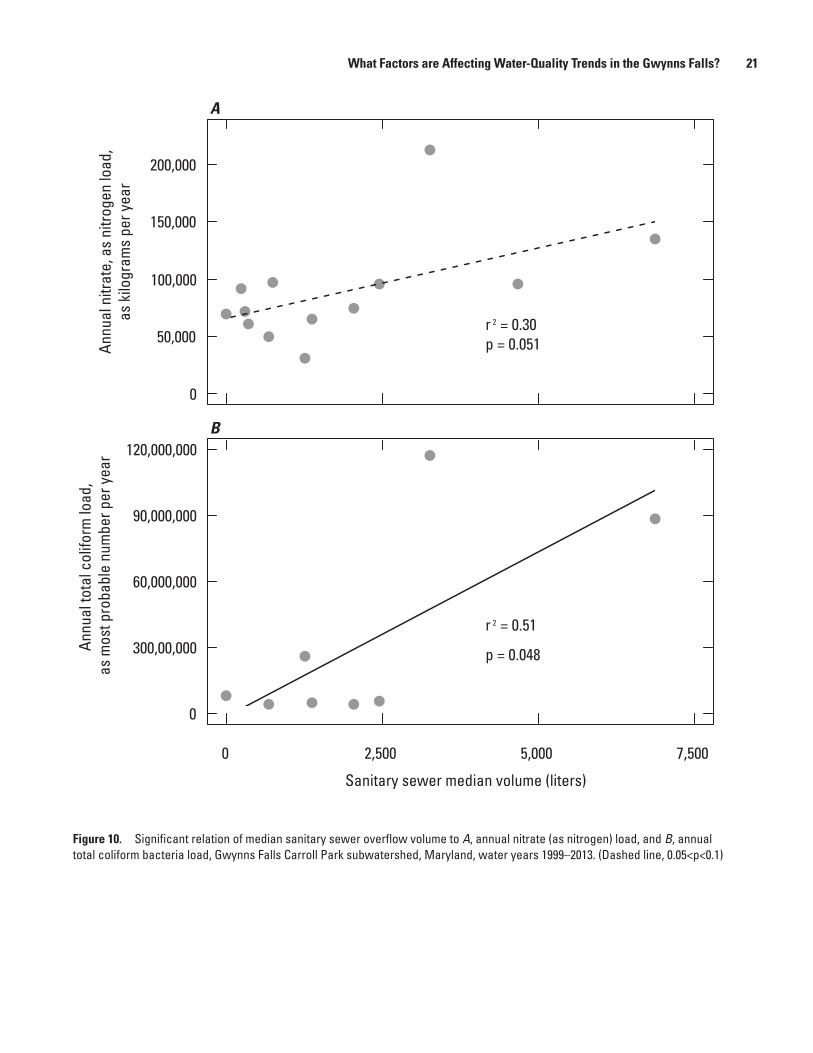
What Factors are Affecting Water-Quality Trends in the Gwynns Falls? 21
0
50,000
100,000
150,000
200,000
r 2 = 0.30p = 0.051
A
0 2,500 5,000 7,500
0
300,00,000
60,000,000
90,000,000
120,000,000
r 2 = 0.51
p = 0.048
B
Sanitary sewer median volume (liters)
Annu
al to
tal c
olifo
rm lo
ad,
as m
ost p
roba
ble
num
ber p
er y
ear
Annu
al n
itrat
e, a
s ni
troge
n lo
ad,
as k
ilogr
ams
per y
ear
Figure 10. Significant relation of median sanitary sewer overflow volume to A, annual nitrate (as nitrogen) load, and B, annual total coliform bacteria load, Gwynns Falls Carroll Park subwatershed, Maryland, water years 1999–2013. (Dashed line, 0.05<p<0.1)
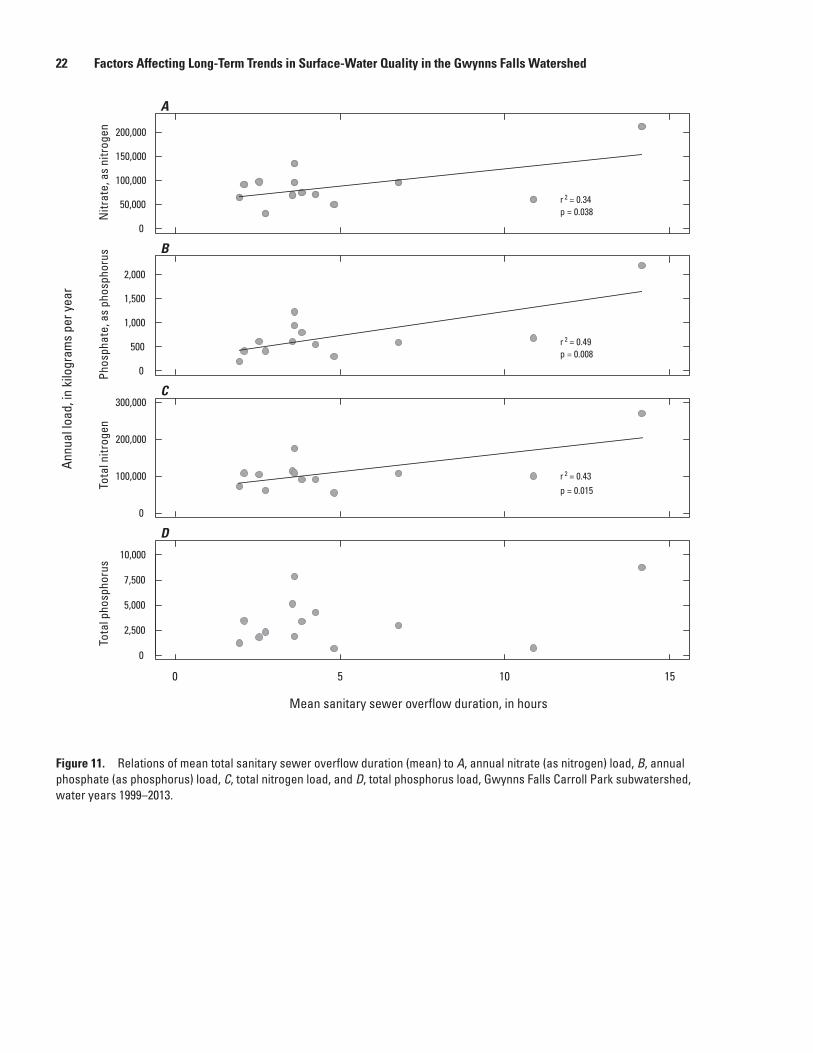
22 Factors Affecting Long-Term Trends in Surface-Water Quality in the Gwynns Falls Watershed
0
50,000
100,000
150,000
200,000
r 2 = 0.34p = 0.038
A
0
500
1,000
1,500
2,000
B
r 2 = 0.49p = 0.008
0
100,000
200,000
300,000C
r 2 = 0.43p = 0.015
1510
0
2,500
5,000
7,500
10,000
D
Mean sanitary sewer overflow duration, in hours
Annu
al lo
ad, i
n ki
logr
ams
per y
ear
50
Tota
l pho
spho
rus
Tota
l nitr
ogen
Phos
phat
e, a
s ph
osph
orus
Nitr
ate,
as
nitr
ogen
Figure 11. Relations of mean total sanitary sewer overflow duration (mean) to A, annual nitrate (as nitrogen) load, B, annual phosphate (as phosphorus) load, C, total nitrogen load, and D, total phosphorus load, Gwynns Falls Carroll Park subwatershed, water years 1999–2013.

What Factors are Affecting Water-Quality Trends in the Gwynns Falls? 23
volume is not estimated for these events, rather the number of breaks and leaks are tracked by count. FWCs of chloride are positively related to the total count of water main breaks and leaks, and breaks alone, but not leaks alone (table 4).
SSO reduction and elimination is a primary goal of the Consent Decree recently (2017) refiled for Baltimore City (U.S. Department of Justice and others, 2017; Pelton and oth-ers, 2015) and ongoing with Baltimore County (U.S. Depart-ment of Justice and others, 2005). Specifically, the city plans to reduce more than 99 percent of SSOs in a phased approach, to be completed by 2030, with 83-percent reduction by 2021 (Baltimore City DPW, presentation from public meeting to discuss sewer Consent Decree, written commun., June 2016). Additional work will assess remaining inflow and infiltration in the sanitary sewer system and address sanitary discharges of unknown origin (Baltimore City DPW, presentation from public meeting to discuss sewer Consent Decree, written com-mun., June 2016) by the end of 2030. The gray infrastructure investment in Baltimore City through 2019 was estimated to be approximately $2 billion.
The correlation of SSOs with nutrient export from the Gwynns Falls presents a challenge for city and county manag-ers tasked with various regulatory requirements related to water quality under different programs with differing compli-ance time lines. The regulatory targets for nutrient loads are related to the TMDLs for total nitrogen and phosphorus, as specified in the city and county MS4 permits (Baltimore City Department of Public Works, 2015) and the Maryland Water-shed Improvement Plan for compliance with the Chesapeake Bay TMDL, which are targeted for 2025. Specific reduc-tions in these nutrient loads are expected to be addressed by reducing the impervious surface by 20 percent, as specified in the MS4 permits. These TMDLs are not explicitly tied to gray infrastructure repairs. Although Illicit Discharge Detec-tion and Elimination is included as a major component of the MS4 permit program, the repairs to gray infrastructure and elimination of SSOs fall predominantly under the regulatory requirements of the Consent Decrees (U.S. Department of Justice and others, 2002, 2005, 2017), which are not expected to be completed until 2030. Many stakeholders, as part of the Healthy Harbor initiative, also have the goal of a fishable and swimmable harbor by 2020. The link between SSOs and nutrients indicates that improvement and repair of the gray infrastructure systems is critical for improvement of urban water quality. Continuing trends analysis could be a valuable tool for evaluating the effectiveness of the ongoing sewer repairs and SSO reductions.
Implementation of Green Infrastructure and Effects of Best Management Practices
In recent years, there has been an increased focus on rerouting stormwater from the piped, built environment using practices that focus on infiltration to enhance the natural filtering of stormwater, or green infrastructure (EPA, 2017). Baltimore City and County, as well as numerous non-govern-mental organizations in the region, have implemented green infrastructure to encourage infiltration and reduce stormwater runoff. Various green infrastructure practices are considered to be structural BMPs for water quality (for example, wetlands, bioretention, stream restoration) and can provide impervi-ous surface “credits” for compliance with MS4 permit goals, which are based on assumed pollutant removal efficiencies (MDE, 2014). The presence of these structural BMPs within the county portion of the watershed appears to be a major factor affecting water quality in the Gwynns Falls watershed, particularly phosphorus export (table 4). BMP drainage area is significantly negatively correlated with phosphate and total phosphorus loads and FWC (fig. 12). The same relations were not observed for nitrogen however (table 4). These relations indicate that the county structural BMPs have had a positive downstream effect on phosphorus export from the watershed as a whole (as examined at Carroll Park). Mechanistically, this effect would be driven by the ability of green infrastructure features to retain sediment-bound phosphate. However, analy-sis does not rule out the possibility that another factor may be driving the relation between BMPs and phosphorus.
Although investments in the MS4 program have been relatively steady (estimated from MS4 annual fiscal reports to be approximately $10 million to $15 million since 2005), investment has increased to more than $20 million in the current permit cycle in Baltimore City, possibly owing to the passage of the stormwater remediation fee in 2013. The annual investment since 2005 in Baltimore County is slightly greater, averaging about $20 million per year (based on MS4 annual fiscal reports). This investment is expected to increase in the next several years as part of watershed restoration efforts outlined in the Watershed Implementation Plans for Baltimore City and County (for example, Baltimore City Department of Public Works, 2015). Nonetheless, approximately $100 mil-lion was estimated for MS4 investment, which is considerably less than the investment required for the gray infrastructure capital repairs.

24 Factors Affecting Long-Term Trends in Surface-Water Quality in the Gwynns Falls Watershed
0
500
1,000
1,500
2,000
2,500
A
r 2 = 0.26p = 0.050
Phos
phat
e, a
s ph
osph
orus
0.00
0.02
0.04
0.06
0.08
C
r 2 = 0.30
p = 0.034
0 5 10 15 20
0
2,500
5,000
7,500
10,000
B
r 2 = 0.31p = 0.038
Best management practice drainage area (square kilometers)
Tota
l pho
spho
rus
0 5 10 15 20
0.000
0.025
0.050
0.075
0.100
D
r 2 = 0.53
p = 0.003
Load (kilograms per year) FWC (milligrams per liter)
Figure 12. Significant and moderately significant relations of cumulative best management practices (drainage area) to A, annual phosphate (as phosphorus) load, B, total phosphorus load, C, annual phosphate (as phosphorus) flow-weighted concentration, and D, annual total phosphorus flow-weighted concentration, Gwynns Falls Carroll Park subwatershed, Maryland, water years 1999–2013. (Dashed line, 0.05<p<0.1; FWC, flow-weighted concentration)

References Cited 25
in accordance with the Baltimore City and Baltimore County municipal separate storm sewer system permits and watershed restoration plans.
References Cited
American Society of Civil Engineers, 2017, 2017 Infrastruc-ture Report Card: American Society of Civil Engineering 112, 6 p.
Baltimore City Department of Public Works, 2015, MS4 Restoration and TMDL Watershed Implementation Plan, August 19, 2015: Baltimore, Md., Baltimore City Depart-ment of Public Works, variously paged.
Bettez, N.D., and Groffman, P.M., 2013, Nitrogen deposition in and near an urban ecosystem: Environmental Science & Technology, v. 47, p. 6047–6051.
Bettez, N.D., Duncan, J.M., Groffman, P.M., Band, L.E., O’Neil-Dunne, J., Kaushal, S.S., Belt, K.T., and Law, N., 2015, Climate variation overwhelms efforts to reduce nitrogen delivery to coastal waters: Ecosystems, v. 18, p. 1319–1331.
Burgess, K., 2017, Harvesting the value of water: stormwa-ter, green infrastructure, and real estate: Washington, D.C., Urban Land Institute, 72 p.
Center for Watershed Protection, 2013, Cost-effectiveness study of urban stormwater BMPs in the James River basin, March 2013: Ellicott City, Md., Center for Watershed Pro-tection, 39 p.
Chesapeake Bay Foundation, 2014, Polluted runoff: How investing in pollution control systems improves the Chesa-peake Bay region ecology, economy, and health: Annapolis, Md., Chesapeake Bay Foundation, 36 p.
Chiwa, M., Maruno, R., Ide, J., Miyano, T., Higashi, N., and Otsuki, K., 2010, Role of stormflow in reducing N retention in a suburban forested watershed, western Japan: Journal of Geophysical Research-Biogeosciences, v. 115, no. 11, G02004, 11 p.
EcoCheck, 2011, Sampling and data analysis protocols for Mid-Atlantic tidal tributary indicators, in Wicks E.C., Andreychek, M.L., Kelsey, R.H., Powell, S.L., eds.: Cam-bridge, Md., IAN Press, 46 p.
ESRI, 2016, ArcGIS Desktop ArcMap: Release 10.5.0: Red-lands, Calif., Environmental Systems Research Institute.
Groffman, P.M., Law, N.L., Belt, K.T., Band, L.E., and Fisher, G.T., 2004, Nitrogen fluxes and retention in urban water-shed ecosystems: Ecosystems, v. 7, p. 393–403.
ConclusionsLong-term records of water quality are rare in urban
environments, particularly for intermediate size drainage areas like the Gwynns Falls watershed (170.67 square kilometers) in Maryland. Considerable investments are being made in gray and green infrastructures with the expectation of water-quality benefits. There is a critical need for long-term assessment of the effects of these investments. This study, done in cooperation with Blue Water Baltimore, and other studies like it are important steps in understanding the complexity of these changes and can help stakeholders determine whether their investments are resulting in water-quality improvements. Changes in land use and climate, and the multiple sources of data (water-quality constituents and factors affecting these constituents), make these evaluations challenging.
As with other urban areas, the land-cover change was limited in the study subwatersheds as a result of the high proportion of developed land at the start of the study period (1998–2016). Therefore, land-cover change was not consid-ered a factor of influence for water-quality change within the watershed. Precipitation and frequency of runoff produc-ing storms did increase over the study period, particularly in the winter. Increased winter precipitation is an important consideration for area stakeholders because it can exacerbate limitations in gray (for example, wet weather sanitary sewer overflows) and green (for example, reliance on growing sea-son) infrastructure.
In this study, despite the long data record, temporal trends were not apparent for the vast majority of the constituents examined. Despite a high percentage of impervious surface and increasing precipitation, degradation of water quality is not apparent for the most downstream and largest subwater-shed (Carroll Park). In fact, improving water quality, deter-mined on the basis of declining phosphate and total phospho-rus flow-weighted concentrations, was noted at Carroll Park. The variability in trends throughout the Gwynns Falls water-shed highlights the complexity of these systems. Similarly, many of the driving factors that were examined did not have statistically significant relations to the water-quality trends. However, sanitary sewer overflows and best management practices, are factors that appear to affect the water quality at Carroll Park, the most downstream location monitored in the Gwynns Falls watershed. The increasing duration of sanitary sewer overflows was related to increasing loads and concentra-tions of nutrients; sanitary sewer overflow volume was related to total coliform levels. In contrast, installation of structural best management practices appears to be related to declines in phosphorus. These outcomes, while preliminary, indicate that current efforts and investments in gray and green infrastruc-ture improvements likely positively affect the water quality of the Gwynns Falls watershed. Further, this study has estab-lished a framework to evaluate the effect of future gray infra-structure repairs in accordance with the Baltimore City and County Consent Decrees and green infrastructure installation

26 Factors Affecting Long-Term Trends in Surface-Water Quality in the Gwynns Falls Watershed
Hayhoe, K., Wake, C.P., Huntington, T.G., Luo, L.F., Schwartz, M.D., Sheffield, J., Wood, E., Anderson, B., Bradbury, J., DeGaetano, A., Troy, T.J., and Wolfe, D., 2007, Past and future changes in climate and hydrological indicators in the U.S. Northeast: Climate Dynamics, v. 28, p. 381–407.
Homer, C., Dewitz, J., Fry, J., Coan, M., Hossain, N., Lar-son, C., Herold, N., McKerrow, A., VanDriel, J.N., and Wickham, J., 2007, Completion of the 2001 National Land Cover Database for the conterminous United States: Photo-grammetric Engineering and Remote Sensing, v. 73, no. 4, p. 337–341.
Homer, C.G., Dewitz, J.A., Yang, L., Jin, S., Danielson, P., Xian, G., Coulston, J., Herold, N.D., Wickham, J.D., and Megown, K., 2015, Completion of the 2011 National Land Cover Database for the conterminous United States—Rep-resenting a decade of land cover change information: Photo-grammetric Engineering and Remote Sensing, v. 81, no. 5, p. 345–354.
Jantz, P., Goetz, S., and Jantz, C., 2005, Urbanization and the loss of resource land in the Chesapeake Bay Watershed: Environmental Management, v. 36, no. 6, p. 808–825.
Kaushal, S.S., Groffman, P., Band, E.L., Shields, C.A., Mor-gan, P.R., Palmer, M.A., Belt, K.T., Swan, C.M., Findlay, S., and Fisher, G.T., 2008, Interaction between urbanization and climate variability amplifies watershed nitrate export in Maryland: Environmental Science & Technology, v. 42, p. 5872–5878.
Kaushal, S.S., Groffman, P.M., Band, L.E., Elliott, E.M., Shields, C.A., and Kendall, C., 2011, Tracking nonpoint source nitrogen pollution in human-impacted watersheds: Environmental Science & Technology, v. 45, p. 8225–8232.
Kaushal, S.S., and Belt, K.T., 2012, The urban watershed con-tinuum: Evolving spatial and temporal dimensions: Urban Ecosystems, v. 15, p. 409–435.
Kaushal, S.S., Mayer, P.M., Vidon, P.G., Smith, R.M., Pen-nino, M.J., Newcomer, T.A., Duan, Shuiwang, Welty, C., and Belt, K.T., 2014, Land use and climate variability amplify carbon, nutrient and contaminant pulses: A review with management implications: Journal of the American Water Resources Association, v. 50, no. 3, p. 585–614.
Kaye, J.P., Groffman, P.M., Grimm, N.B., Baker, L.A., and Pouyat, R.V., 2006, A distinct urban biogeochemistry?: Trends in Ecology & Evolution, v. 21, p. 192–199.
Law, L.N., Band, E.L., and Grove, J.M., 2004, Nitrogen input from residential lawn care practices in suburban watersheds in Baltimore County, MD: Journal of Environmental Plan-ning and Management, v. 4, p. 737–755.
Lawrence, S.J., 2012, Escherichia coli bacteria density in relation to turbidity, streamflow characteristics, and season in the Chattahoochee River near Atlanta, Georgia, October 2000 through September 2008—Description, statistical analysis, and predictive modeling: U.S. Geological Survey Scientific Investigations Report 2012–5037, 81 p. [Also available at http://pubs.usgs.gov/sir/2012/5037/.]
Majcher, E., 2014, Summary report of the urban waters monitoring workshop, 18 June 2014, Draft: Baltimore, Md., Baltimore Urban Waters Partnership, 47 p., accessed January 17, 2018, at https://www.epa.gov/sites/produc-tion/files/2015-07/documents/urban-water-monitoring-assets_091014.pdf.
Maryland Department of the Environment (MDE), 2010, Patapsco/Back River Watershed SWMM model report: Baltimore, Md., Maryland Department of the Environment [not paged].
Maryland Department of Environment (MDE), 2014, Account-ing for stormwater waste load allocations and impervious acres treated—Guidance for NPDES stormwater permits, August 2014: Maryland Department of Environment, 53 p.
Morse, N., and Wollheim, W., 2014, Climate variability masks the impacts of land use change on nutrient export in a sub-urbanizing watershed: Biogeochemistry, v. 121, p. 45–59.
Moyer, D.L., and Bloomquist, J., 2016, Summary of nitro-gen, phosphorus, and suspended-sediment loads and trends measured at the Chesapeake Bay nontidal network sta-tions: Water Year 2014 Update, February 3, 2016, accessed March 1, 2018, at https://cbrim.er.usgs.gov/summary.html, 15 p.
Murdock, J., Roelk, D., and Gelwick, F., 2004, Interac-tions between flow, periphyton, and nutrients in a heavily impacted urban stream: implications for stream restoration effectiveness: Ecological Engineering, v. 22, p. 197–207.
Pelton, T., Bernhardt, C., Burkhart, K., and Lam, S., 2015, Stopping the flood beneath Baltimore’s streets: Washington, D.C., Environmental Integrity Project, December 2015, 29 p.
R Development Core Team, 2016, R: A Language and Environment for Statistical Computing: Vienna, Austria, R Foundation for Statistical Computing.
Rao, P., Hutyra, L.R., Raciti, S.M., and Templer, P.H., 2014, Atmospheric nitrogen inputs and losses along an urbaniza-tion gradient from Boston to Harvard Forest, MA: Biogeo-chemistry, v. 121, p. 229–245.
Reisinger, A.J., Rosi, E.J., Bechtold, H.A., Doody, T.R., Kaushal, S.S., and Groffman, P.M., 2017, Recovery and resilience of urban stream metabolism following Super-storm Sandy and other floods: Ecosphere, v. 8, p. e01776.
References Cited 27
Sexton, J.O., Song, X-P., Huang, C., Channan, S., Baker, M.E., and Townshend, J.R., 2013, Urban growth of the Washington, D.C.—Baltimore, MD metropolitan region from 1984 to 2010 by annual, Landsat-based estimates of impervious cover: Remote Sensing of Environment, v. 129, p. 42–53.
U.S. Department of Justice and Environmental Protection Agency and Maryland Department of Environment v. City of Baltimore, 2017, Modified Consent Decree, August 2017, 82 p., accessed March 1, 2018, at https://publicworks.balti-morecity.gov/sites/default/files/Modified%20Consent%20Decree.pdf.
U.S. Department of Justice and Environmental Protection Agency and Maryland Department of Environment v. City of Baltimore, 2002, Consent Decree, September 2002, 78 p., accessed March 1, 2018, at https://www.epa.gov/sites/pro-duction/files/2013-09/documents/baltimore-cd.pdf.
U.S. Department of Justice and Environmental Protec-tion Agency and Maryland Department of Environment v. Baltimore County, 2005, Consent Decree, September 2005, 115 p., accessed March 1, 2018, at https://www.epa.gov/sites/production/files/2013-09/documents/balti-moreco072605-cd.pdf.
U.S. Environmental Protection Agency (EPA), 2010, Chesa-peake Bay total maximum daily load for nitrogen, phos-phorus, and sediment, December 2010: U.S. Environmental Protection Agency, Region 3, 93 p.
U.S. Environmental Protection Agency (EPA), 2017, What is green infrastructure?: U.S. Environmental Protection Agency, accessed March 1, 2018, at https://www.epa.gov/green-infrastructure/what-green-infrastructure.
Valiela, I., Collins, G., Kremer, J., Lajtha, K., Geist, M., Seely, B., Brawley, J., and Sham, C.H., 1997, Nitrogen loading from coastal watersheds to receiving estuaries: New method and application: Ecological Applications, v. 7, p. 358–380.
Vietz, G.J., Walsh, C.J., and Fletcher, T.D., 2016, Urban hydrogeomorphology and the urban stream syndrome: treating the symptoms and causes of geomorphic change: Progress in Physical Geography, v. 40, p. 480–492.
Walsh, C.J., Roy, A.H., Feminella, J.W., Cottingham, P.D., Groffman, P.M., and Morgan, R.P., 2005, The urban stream syndrome: current knowledge and the search for a cure: Journal of the North American Benthological Society, v. 24, p. 706–723.
Walsh, J., Wuebbles, D., Hayhoe, K., Kossin, J., Kunkel, K., Stephens, G., Thorne, P., Vose, R., Wehner, M., Willis, J., Anderson, D., Doney, S., Feely, R., Hennon, P., Kharin, V., Knutson, T., Landerer, F., Lenton, T., Kennedy, J., and Somervill, R., 2014, Ch. 2, Our changing climate, in Melillo, J.M., Terese, T.C., and Yohe, G.W., eds. Climate change impacts in the United States: The Third National Climate Assessment: Washington, D.C., U.S. Global Change Research Program, p. 19–67.
Waterfront Partnership, 2014, Healthy Harbor Report Card: Waterfront Partnership, accessed January 27, 2018, at http://baltimorewaterfront.com/healthy-harbor/report-card/.
Waterfront Partnership, 2013, Healthy Harbor Report Card: Baltimore, Md., Waterfront Partnership.
Waterfront Partnership, 2012, Healthy Harbor Report Card: Baltimore, Md., Waterfront Partnership.
Wollheim, W.M., Green, M.B., Pellerin, B.A., Morse, N.B., and Hopkinson, C.S., 2013, Causes and consequences of ecosystem service regionalization in a coastal suburban watershed: Estuaries and Coasts, v. 38, p. 19–34.
Woytowitz, E.L., Majcher, E.H., and Reisinger, A.J., 2018, Nutrient, bacteria, ammonia, total Kjeldahl nitrogen, total suspended solids annual loads; green and gray infrastruc-ture; land cover change; and climate data in the Gwynns Falls subwatersheds, Baltimore, Maryland, 1998–2016: U.S. Geological Survey data release, https://doi.org/10.5066/F76T0KTJ.


For more information, contact:Director, MD-DE-DC Water Science CenterU.S. Geological Survey5522 Research Park DriveBaltimore, MD 21228
or visit our website at:http://md.water.usgs.gov/
Publishing support provided by the West Trenton and Pembroke Publishing Service Centers
Majcher and others—
Factors Affecting Long-Term
Trends in the Gw
ynns Falls, Baltim
ore City and County, Maryland, 1998–2016—
Open-File Report 2018–1038
ISSN 2331-1258 (online)https://doi.org/10.3133/ofr20181038
Printed on recycled paper