ه ارا ه ت˚ ˜ˇ ˝ˆ˙ ˘ˇ -...
TRANSCRIPT

:ارائه شده توسط
ه فا �� سايت ��
� مرجع �� ه شده جديد�� �� مقا�ت ��
ت معت � �# از ن%$
Author's Accepted Manuscript
The guidelines of improvement: Relationsamong organizational culture, TQM and per-formance
Changiz Valmohammadi, Shervin Roshanzamir
PII: S0925-5273(14)00422-8DOI: http://dx.doi.org/10.1016/j.ijpe.2014.12.028Reference: PROECO5958
To appear in: Int. J. Production Economics
Received date: 27 December 2013Accepted date: 17 September 2014
Cite this article as: Changiz Valmohammadi, Shervin Roshanzamir, Theguidelines of improvement: Relations among organizational culture, TQMand performance, Int. J. Production Economics, http://dx.doi.org/10.1016/j.ijpe.2014.12.028
This is a PDF file of an unedited manuscript that has been accepted forpublication. As a service to our customers we are providing this early version ofthe manuscript. The manuscript will undergo copyediting, typesetting, andreview of the resulting galley proof before it is published in its final citable form.Please note that during the production process errors may be discovered whichcould affect the content, and all legal disclaimers that apply to the journalpertain.
www.elsevier.com/locate/ijpe

1
The guidelines of improvement: Relations among organizational culture,
TQM and performance
Changiz Valmohammadi a, Shervin Roshanzamir b,*
a Department of Industrial Management, Faculty of Management and Accounting, Islamic Azad
University-South Tehran Branch, Shariati Ave., Tehran, Iran - Email:
[email protected] b Faculty of Industrial Engineering, Islamic Azad University-South Tehran Branch, Entezari-Oskuyi
Alley, Gerami St., Enghelab Ave., Tehran, Iran * Corresponding author. Tel: +98 936 576 9986 - Email: [email protected]
Abstract
This study has four main goals: (1) diagnosing the organizational culture of Tehran’s
pharmaceutical companies; (2) investigating the implementation of different categories of TQM in
these companies; (3) comparing two models explaining the relationships among culture, TQM and
performance; (4) determining the effect of culture and TQM on performance, according to the
preferential structural equation model.
A total of 209 valid responses were obtained from CEOs and senior managers of quality,
operations, R&D and sales departments in the surveyed industry. The results specify the hierarchy
and market cultures as the dominant types of culture and the leadership category as the most
developed aspect of TQM. The findings of this study suggest that Tehran’s pharmaceutical
companies emphasize on stability more than flexibility. The analysis shows the positive direct
effects of culture and TQM on performance and also the positive indirect effect of culture through
its positive effect on TQM. By analyzing the culture profile, development degrees of TQM
categories and performance indicators, some appropriate theories of effectiveness and quality
strategies are suggested.
While the relationships among culture, TQM and overall performance has been examined
separately just one to one in prior studies, this is the first look at all of them in one unique model.
Keywords:
Organizational culture, Total quality management (TQM), Organizational performance,
Pharmaceutical industry, Structural equation modeling (SEM)
1. Introduction
Total quality management (TQM) is described as a collective, interlinked system of quality
practices that is associated with organizational performance (Choi and Eboch, 1998). TQM has
been widely adopted by firms in the last 50 years and yet firms report less than optimal results
(Jayaram et al., 2010). However, three-quarters of TQM have failed entirely or have created

2
problems serious enough that the survival of the organization was threatened. Several studies
reported that the most frequently cited reason given for failure was a neglect of the organization’s
culture (Cameron and Quinn, 2005). Many approaches to quality management, including TQM
hardly give long-term success to organizations. This is mainly because of the problematic nature of
organizational culture (OC) within which managers find it difficult to practice their TQM activities
(Kaluarachchi, 2010). Cultural change is essential for the successful implementation of TQM (Rad,
2006). The important role of OC in TQM success is frequently referred to in the literature (Chung et
al., 2010; Gimenez-Espin et al., 2013; Green, 2012; Haffar et al., 2013; Kaluarachchi, 2010;
Prajogo and McDermott, 2005; Rad, 2006; Roldán et al., 2012; Zu et al., 2010). Organizational
culture might create an environment (Mathew, 2007) that would impact on both business and
operational firm performance (Cadden et al., 2013).
Therefore both OC and TQM can individually and effectively promote overall performance.
However, no previous empirical studies have investigated how OC and TQM jointly affect
organization’s performance. In this research we compare two structural equation models explaining
the relationships among these three extensive variables, the preferential model is used to determine
the relationship between OC and TQM and their effects on organizational performance.
In this study, we adopt the instrument developed by Cameron and Quinn (2005) to diagnose
organizational culture and the 2011-2012 criteria for performance excellence of the Malcolm
Baldrige National Quality Award (MBNQA) to measure the six TQM categories and organizational
performance. We use the structural equation modeling (SEM) technique to examine the data
collected from the pharmaceutical companies of Tehran. The main objectives of this study are as
follows; (1) diagnosing the organizational culture of the survey industry; (2) investigating the
implementation of different categories of TQM in its companies; (3) comparing two models
explaining the relationships among culture, TQM and performance; (4) determining the effect of
culture and TQM on organizational performance, according to the preferential structural equation
model. Several reports outside of the pharmaceutical industry have addressed the critical factors for
success by implementing TQM (Inoue and Yamada, 2013). In the pharmaceutical industry because
of the priority attached to quality and regulation and the environment of ever increasing competition
(McAdam and Barron, 2002; Sneyd and Rowley, 2004), the TQM practices can help the companies
to achieve superior performance.
2. Literature review, research questions and hypotheses
2.1. Organizational Culture
Culture is a set of shared meanings that make it possible for members of a group to interpret and
act upon their environment (Schein, 1984). These shared assumptions and understandings lie
beneath the conscious level for individuals. They generally are identified through stories, special
language, artifacts and norms that emerge from individual and organizational behavior (Cameron
and Freeman, 1991; Deal and Kennedy, 1982). Organizational culture depends for its existence on a
definable organization, in the sense of a number of people interacting with each other for the
purpose of accomplishing some goal in their defined environment (Schein, 1983). OC is a set of
structures, routines, rules, and norms that guide and constrain behavior (Schein, 2004). It is the
collective programming of the mind which distinguishes the members of one organization from

3
another (Hofstede, 1998). Culture defines the core values, assumptions, interpretations, and
approaches that characterize an organization (Cameron and Quinn, 2005).
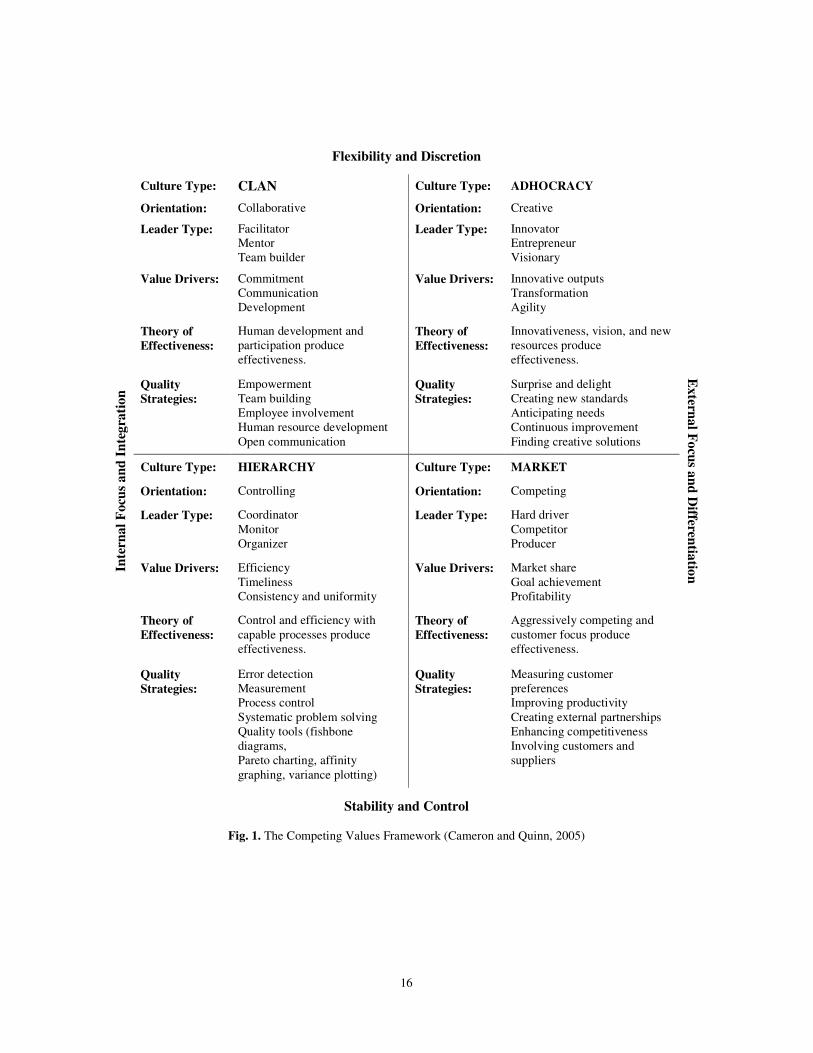
In the current research, we adopt the Competing Values Framework (CVF) proposed by
Cameron and Quinn (2005). The CVF is based on two major dimensions that organized the
effectiveness indicators into four main clusters. One dimension emphasizes the organizational focus
(internal versus external), whereas the second one differentiates the flexibility, discretion and
dynamism from the stability, order and control. These two dimensions form four quadrants, each
representing a major type of organizational culture: clan, adhocracy, market and hierarchy (shown
in Fig. 1). Cameron and Quinn assert that not any of these cultural models are superior over the
others (Giritli et al., 2013).
The Competing Values Framework explores the deep structures of organizational culture relating
to compliance, motives, leadership, decision making, effectiveness, and organizational forms in the
organization (Zu et al., 2010). It is also helpful in organizing the various aspects of TQM and
highlighting its comprehensive nature (Cameron and Quinn, 2005). The CVF have been adopted by
prior studies to examine the effect of organizational culture on various issues such as TQM
practices (Chung et al., 2010; Gimenez-Espin et al., 2013; Haffar et al., 2013; Prajogo and
McDermott, 2005; Zu et al., 2010), supply chain management (Liu et al., 2010), organizational
performance (Jacobs et al., 2013; Tseng, 2010).
In this study, we plot the organizational culture profile of Tehran’s pharmaceutical industry to
answer the following research question:
RQ1. What is the emphasis degree of Tehran’s pharmaceutical companies on each of the four
organizational culture types?
2.2. TQM
TQM literature is based largely upon case studies, anecdotal evidence and the personal
prescriptions of the recognized gurus of the discipline, including Deming, Juran, Crosby,
Feigenbaum and Ishikawa (Black and Porter, 1996). The generic term “total quality management”
is used to mean the vast collection of philosophies, concepts, methods, and tools now being used
throughout the world to manage quality (Juran and Godfrey, 1998). Quality management (QM) is
defined as an approach to achieving and sustaining high quality output (Flynn et al., 1994). It is
made up of a set of mutually reinforcing principles, each of which is supported by a set of practices
and techniques. At the empirical level, the assessment of whether such a thing as QM exists and
what constitutes QM should be made at the level of practices: practices are the observable facet of
QM, and it is through them that managers work to realize organizational improvements. Principles
are too general for empirical research and techniques are too detailed to obtain reliable results (e.g.
one practice may be implemented via many optional techniques). For example, the QM principle
continuous improvement can be supported by the practice “process management”, which in turn can
resort to several techniques such as statistical process control and Pareto analysis (Sousa and Voss,
2002).
Fig. 1. The Competing Values Framework (Cameron and Quinn, 2005)

4
Several studies have tried to synthesize the vast QM literature and identify the key QM practice
dimensions (e.g., Ahire et al., 1996; Anderson et al., 1995; Flynn et al., 1995; Powell, 1995; Saraph
et al., 1989; Sila and Ebrahimpour, 2002; Tummala and Tang, 1996) . Some scholars have
demonstrated that in these studies, there is substantial agreement as to what are the key TQM
practices (e.g., Bou-Llusar et al., 2009; Kaynak, 2003; Nair, 2006; Sousa and Voss, 2002). These
practices are all present in the frameworks used for the national quality awards, such as the
MBNQA and the European Quality Award (Sousa and Voss, 2002). The inception of the MBNQA
in 1987 led to an strong interest among US organizations from all sectors in holistic quality
management (Ahire et al., 1996). Nowadays, quality award models, such as MBNQA and the
European Foundation for Quality Management (EFQM) Excellence Model, are used as a guide to
TQM implementation by a large number of organizations (Bou-Llusar et al., 2009).
In the current study, we examine six TQM practices according to the 2011-2012 criteria for
performance excellence of the MBNQA to investigate the implementation of different categories of
TQM in the Tehran’s pharmaceutical industry (leadership/ strategic planning/ customer focus/
measurement, analysis and knowledge management/ workforce focus/ operations focus). So, the
following research question is posited:
RQ2. What is the development degree of Tehran’s pharmaceutical companies on each of the six
TQM categories?
2.3. Organizational Culture and TQM
Literature has noted numerous stories on the problematic issues relating to TQM implementation
process and how they affect its outcomes. Among several factors, which have been attributed as key
determinants of its success, organizational culture is often among those listed at the top (Prajogo
and McDermott, 2005). Some scholars always place OC as the antecedent of TQM practices.
Prajogo and McDermott (2005) believe that organizational culture determines the results of TQM
implementation rather than the TQM implementation bringing about cultural change. The
significant relationships of different types of cultures with TQM have found in prior studies (e.g.,
Gimenez-Espin et al., 2013; Haffar et al., 2013; Prajogo and McDermott, 2005; Zu et al., 2010).
Moreover, some studies have shown the same relations between different dimensions of
organizational culture and TQM (e.g., Kaluarachchi, 2010; Rad, 2006).
In this study, we determine the strength of overall organizational culture and its effect on TQM.
It means the set of cultures including all types and dimensions of OC are considered in this
investigation. The reason behind this is the confirmation of the need to incorporate and balance all
cultural types (Denison and Spreitzer, 1991). And not any of them are superior over the others
(Giritli et al., 2013). In addition, few organizations are featured by only one culture type, rather they
have a culture profile consisting of different culture types (Zu et al., 2010). Based on the above
discussion, following hypothesis is raised:
H1. The strength of overall organizational culture is positively associated with the level of TQM
implementation.
2.4. Organizational Performance (OP)
Organizational performance is an indicator which measures how well an organization
accomplishes its objectives (Valmohammadi, 2012). In the 1950s, the view was rather simple and

5
mainly concerned the effectiveness of an organization, meaning that the optimal performance was
achieved when the actual result exactly corresponded to the aimed result. As the complexity of the
business environment increased for each decade, more criteria were included into the performance
term (Tangen, 2004). Senior executives understand that traditional financial accounting measures
like return-on-investment and earnings-per-share can give misleading signals for continuous
improvement and innovation (Kaplan and Norton, 1992). The need to adopt a balanced range of
financial and non-financial performance measures is now widely accepted (Sneyd and Rowley,
2004).
In this study, we measure organizational performance by the results category of the 2011-2012
criteria for performance excellence of the MBNQA. It examines the organization’s performance and
improvement in all key areas: product and process outcomes, customer-focused outcomes,
workforce-focused outcomes, leadership and governance outcomes, and financial and market
outcomes.
2.5. TQM and Organizational Performance
TQM can be defined as a holistic management philosophy that strives for continuous
improvement in all functions of an organization, and it can be achieved only if the total quality
concept is utilized from the acquisition of resources to customer service after the sale (Kaynak,
2003). Both manufacturing and service firms can successfully adopt TQM (Claver-Cortés et al.,
2008). TQM-adopting firms obtain a competitive advantage over firms that do not adopt TQM.
Firms that focus on continuous improvement, involve and motivate employees to achieve quality
output and focus on satisfying customers’ needs, are more likely to outperform firms that do not
have this focus (Joiner, 2007).
Many authors have suggested that TQM practices can have a positive impact on a firm’s results
including customer satisfaction (Choi and Eboch, 1998), innovation (Hung et al., 2011; Prajogo and
Sohal, 2004), manufacturing (Cua et al., 2001; Konecny and Thun, 2011), financial results
(Hendricks and Singhal, 2001; York and Miree, 2004), operations (Yunis et al., 2013),quality
(Arumugam et al., 2008; Prajogo, 2005; Prajogo and Sohal, 2006a). Also, some studies have
adopted a mix of firm’s outcomes as organizational performance in their investigations of TQM’s
positive effects (e.g., Brah and Lim, 2006; Kannan and Tan, 2005; Kumar et al., 2009; Martínez-
Costa et al., 2008; Pinho, 2008; Rahman and Bullock, 2005; Samson and Terziovski, 1999;
Valmohammdi, 2011; Wang et al., 2012) . Based on the above discussion, the following hypothesis
is suggested:
H2. The high degree of TQM implementation is positively associated with organizational
performance.
2.6. Organizational Culture and Organizational Performance
Most scholars and observers now recognize that organizational culture has a powerful effect on
the performance and long-term effectiveness of organizations. Strong cultures are associated with
homogeneity of effort, clear focus, and higher performance in environments where unity and
common vision are required (Cameron and Quinn, 2005). Many authors argue that OC is the key to
organizational excellence (Schein, 1984). Organizations strive for improving firm performance and
OC has been recognized as one of the important drivers of better firm performance (Uzkurt et al.,
6
2013). Organizational culture has more effect than national culture on performance (Naor et al.,
2010).
A number of studies on the culture-performance link showed that certain culture orientations and
culture types are conducive to performance. Some of these studies considered the performance of
the organization as a multidimensional factor (e.g., Jacobs et al., 2013; Tseng, 2010) and the others
investigated the effect of OC on some aspects of performance like financial indices (Xenikou and
Simosi, 2006), productivity and quality (Mathew, 2007), responsiveness (Asree et al., 2010),
manufacturing (Naor et al., 2010), supply chain relationships (Cadden et al., 2013), profitability and
marketing (Uzkurt et al., 2013). It is thus proposed that:
H3. The strength of overall organizational culture is positively associated with organizational
performance.
3. Methodology
3.1. Conceptual framework
Based on the literature review, the relationships among these variables can be suggested with
two primary models (shown in Fig. 2). According to the one model, OC just has indirect effect on
performance through TQM, and the other model proposes both direct and indirect effects of OC on
performance in presence of TQM. We compared two structural equation models explaining the
relationships among these three extensive variables, the preferential model was used to determine
the relationship between OC and TQM and their effects on organizational performance.
3.2. Sample and data collection
According to the data base of IRI FDO (Food and Drug Organization of Islamic Republic of
Iran), we identified 47 pharmaceutical manufacturing companies in Tehran. Most of the
pharmaceutical manufacturers of country are existed in the capital city of Iran. This industry
includes the companies which produce the medicines according to IRI FDO standardized rules and
their quality management systems. They work completely separate from each other. So, the survey
industry can provide an appropriate case to evaluate multiple different organizational culture types
along various levels of TQM implementation and organizational performance. We considered a
group of five managers (including CEOs and senior managers of quality, operations, R&D and sales
departments) from each company to answer the questionnaires. The questionnaire was distributed
via email and postal mail for organizations requesting them to response within one month. After the
end of the deadline as Baruch and Holtom (2008) argue in order to increase the response rate via the
aforementioned communications channels, a reminder letter was sent to those firms who had not
responded, asking them to response the questionnaire and send it back within one week. Finally
after about two months of 235 distributed questionnaires 212 were returned. 3 out of 212 returned
questionnaires were disregarded due to incomplete answers. In total 209 statistically useful
questionnaires were returned, resulting in a response rate of about 89 percent. The variety of
respondents was as follows:
Fig. 2. Conceptual framework
7
CEOs (21%), senior managers of quality (29%), operations (21%), R&D (18%) and sales
departments (11%).
We conducted several techniques for controlling Common Method variance (CMV) as suggested
by Podsakoff et al. (2003) including Procedural Remedies: psychological separation of
measurement (by using the cover story), protecting respondent anonymity and reducing evaluation
apprehension, improving scale items (by defining ambiguous or unfamiliar terms/ avoiding vague
concepts/ keeping questions simple, specific, and concise/ avoiding double-barreled questions/
decomposing questions relating to more than one possibility into simpler, more focused questions/
avoiding complicated syntax); and Statistical Control: Harman’s single-factor test (by using
confirmatory factor analysis). The results indicated that response process bias did not appear to be
problem in this study.
3.3. Measures
In this study, the instrument developed by Cameron and Quinn (2005) was adopted to diagnose
organizational culture. It contains 24 items, six for each culture type as per Appendix. Items were
measured on seven-point Likert scales with end points of “strongly disagree (=1)” and “strongly
agree (=7)”. This culture instrument was designed to evaluate the degree to which an organization
emphasizes each of the four culture types in the CVF. Cameron and Quinn’s instrument have been
adopted by many scholars in their OC studies (e.g., Dadgar et al., 2013; Gardner et al., 2012; Twati
and Gammack, 2006; Wiewiora et al., 2013).
The six TQM categories were measured using the 2011-2012 criteria for performance excellence
of the MBNQA. The 36 measurement items of TQM were evaluated by the seven-point Likert scale
with one for “strongly disagree”, four for “neither agree nor disagree”, and seven for “strongly
agree”, to assess the development degree of an organization on each of the six TQM categories. The
MBNQA has previously been widely used in most studies for measuring TQM implementation
(e.g., Haffar et al., 2013; Kumar et al., 2009; Miyagawa and Yoshida, 2010; Prajogo and Hong,
2008).
We measured organizational performance by the results category of the 2011-2012 criteria for
performance excellence of MBNQA. All respondents were asked to rate their organizations'
performance by 6 items on seven-point Likert scales. In this scoring system, for each of the seven
response categories (from strongly agree to strongly disagree) a score of 1–7 was assigned, with the
highest score of 7 being assigned to “strongly agree” and 1 to “strongly disagree”. The 66
measurement items of this research’s variables are presented in Appendix.
3.4. Types of variables
According to the OC assessment instrument of Cameron and Quinn, the six items’ average score
of each type of culture (clan/ adhocracy/ market/ hierarchy) measured organizational culture. The
six MBNQA criteria (leadership/ strategic planning/ customer focus/ measurement, analysis and
knowledge management/ workforce focus/ operations focus) constituted TQM manifest variables.
Their mean values used as indicators to measure TQM latent variable. The average scores of Likert-
scale items have been adopted for measuring TQM practices in prior studies (e.g., Bou-Llusar et al.,
2009; Prajogo and Sohal, 2006b; Sila and Ebrahimpour, 2005; Zu et al., 2010). The mean value was
used to measure the manifest variables of OC and TQM that it is simple, yet accurate (Feng et al.,

8
2006). However the six scores of performance variable were used in analysis without averaging.
Thus the manifest variables of OC and TQM were described as interval, and the indicators of
performance were ordinal data types. LISREL as a SEM software can analyze the mixture models
which have different types of data (Schumacker and Lomax, 2004).
The normal distributions of manifest variables were detected by Kolmogorov-Smirnov Test in
SPSS 19. The ordinal data of performance showed skewness and kurtosis between -1 and +1, so we
adopted normality assumption in SEM analyses as suggested by Schumacker and Lomax (2004).
Based on the above discussion, the Maximum Likelihood (ML) was used to estimate the parameters
of model. The ML is default estimation method of LISREL (Byrne, 2001) which classified as full-
information and scale-free methods based on normal assumption (Schumacker and Lomax, 2004).
3.5. Reliability and validity
Before testing for a significant relationship in the structural model, one must demonstrate that the
measurement model has a satisfactory level of validity and reliability (Fornell and Larcker, 1981).
Construct reliability was estimated with the internal consistency method using Cronbach’s alpha.
As shown in Table 1, the Cronbach’s alpha values of each scale in this study were above the
suggested cut-off value of 0.70 (Nunnally and Bernstein, 1994).
As mentioned before, both instruments of Cameron and Quinn and MBNQA have been used in
many previous studies. After translating them to native language (Persian), the measurement scales
were reviewed by respective experts to ensure that the questionnaire was comprehensive,
understandable and valid. This judgment of a carefully selected sample of content domain experts is
used to assess face and content validity (DeVellis, 2003; Trochim, 2000).
Confirmatory factor analysis (CFA) which is a powerful method for addressing construct validity
(Bagozzi and Phillips, 1991), was employed by LISREL 8.80 in this study. All the indicators had
significant factor loadings, i.e., t-values were greater than 1.96 at the significance level of 0.05 (P <
0.05). Using several fit indices provides adequate evidence of model fit. Hence the researcher
should report at least one incremental index and one absolute index, in addition to the χ2 value and
the associated degrees of freedom (Hair et al., 2009). The multiple model fit indices, including
Absolute Fit Indices: Normed Chi-square (the ratio of χ2 to degrees of freedom), Root Mean Square
Error of Approximation (RMSEA), Standardized Root Mean Square Residual (SRMR), Goodness
of Fit Index (GFI); Incremental Fit Indices: Comparative Fit Index (CFI) and Non-Normed Fit
Index (NNFI, also known as TLI) were evaluated as presented in Table 2. According to the
suggested characteristics of different fit indices which demonstrate goodness of fit, the construct
validity of both SEM models was established. It should be noted that, as suggested by Hair et al.
(2009), If N < 250 and 12< m <30 (N: number of observations, m: number of observed variables)
like the situation of our analysis (N=209, m=16), then the chi-square’s p-value is significant even in
the goodness of fit status. The chi-square difference test and other indices were used to examine the
proposed model against the alternative model, so the discriminant validity was proved (Anderson
and Gerbing, 1988).
Table 1. Descriptive statistics and test of reliability
9
4. Analysis and results
4.1. Test of models
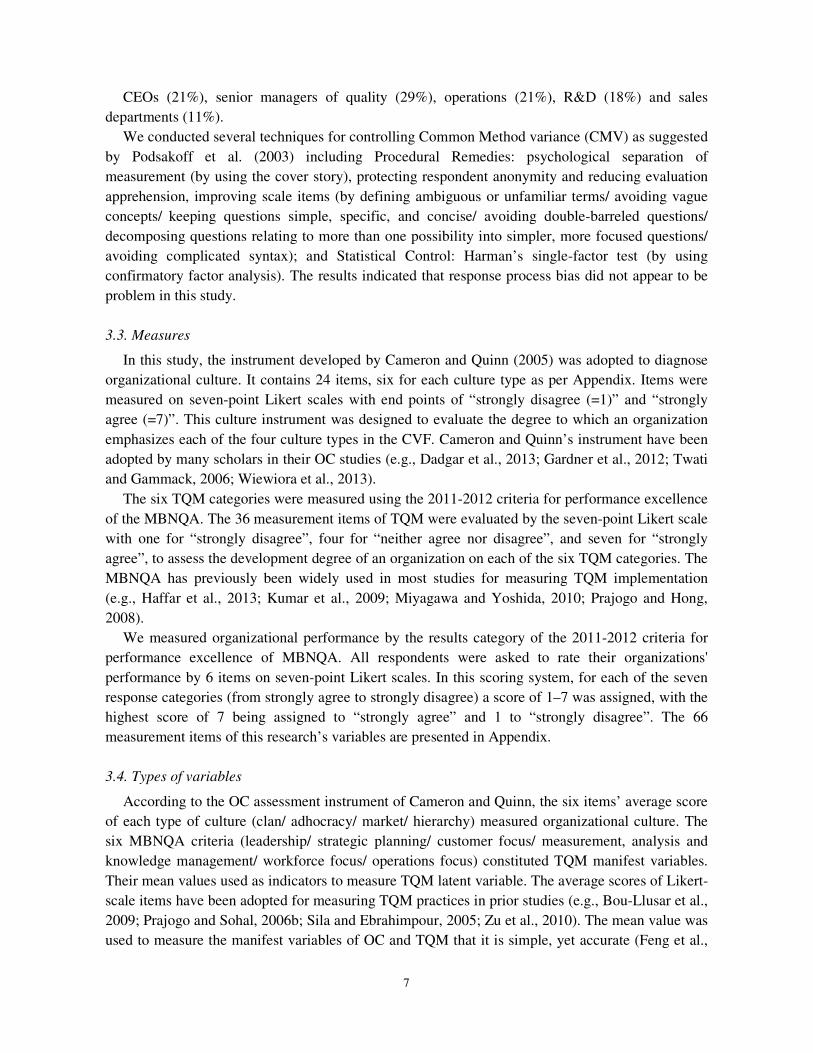
A model is nested within another model if it contains the same number of variables and can be
formed from the other model by altering the relationships, such as either adding or deleting paths
(Hair et al., 2009). Through competing nested SEM models, the one with less values of χ2 (Hair et
al., 2009), Expected Cross-Validation Index (ECVI) and Akaike’s Information Criterion (AIC)
should be preferred to the other (Schumacker and Lomax, 2004).
In the current study, we tested the proposed model against an alternative model where TQM was
treated as a mediate variable between organizational culture and performance, and the direct
relationship between OC and performance was omitted.
As presented in Table 3, the proposed model showed the less values of χ2, ECVI and AIC than
the alternative model. The addition of a structural path from the OC construct directly to the OP
construct reduced the degree of freedom by one (∆df: 102 - 101 = 1). The ∆χ2 (145.428 - 141.025 =
4.403), was larger than 3.841, so, we can conclude that the proposed model is a significantly better
fit at the 0.05 level (P < 0.05), thus it should be used to determine the relationships among the
variables.
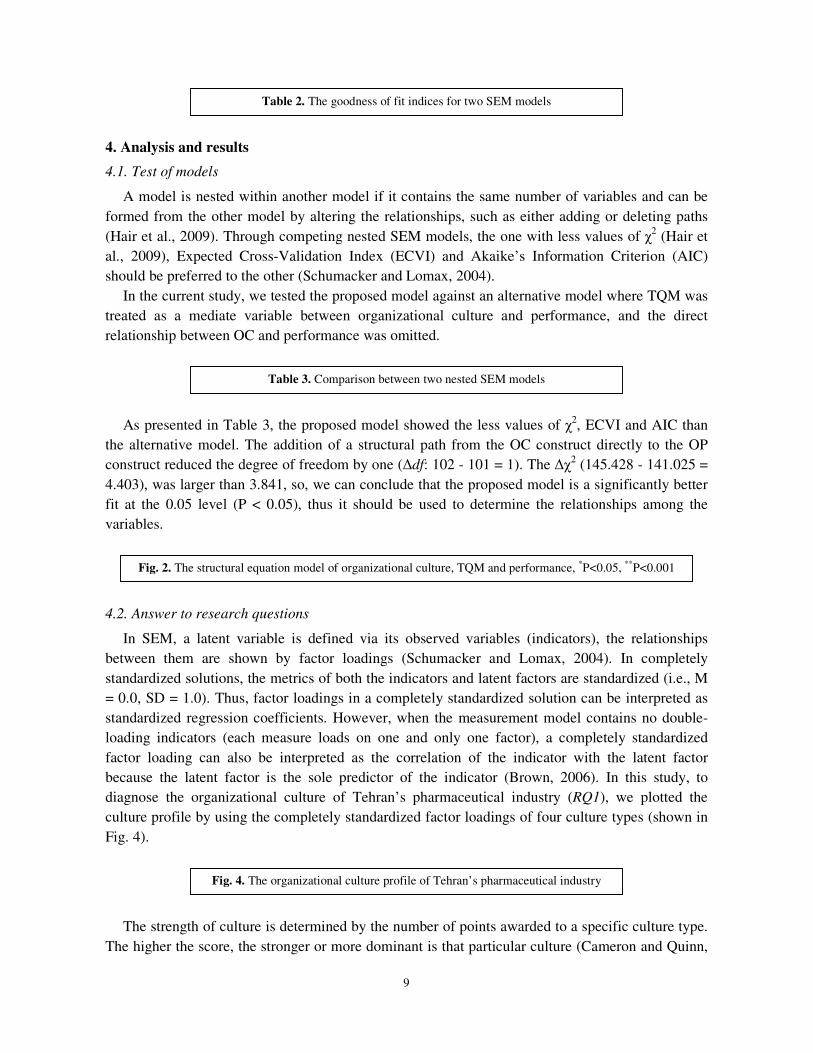
4.2. Answer to research questions
In SEM, a latent variable is defined via its observed variables (indicators), the relationships
between them are shown by factor loadings (Schumacker and Lomax, 2004). In completely
standardized solutions, the metrics of both the indicators and latent factors are standardized (i.e., M
= 0.0, SD = 1.0). Thus, factor loadings in a completely standardized solution can be interpreted as
standardized regression coefficients. However, when the measurement model contains no double-
loading indicators (each measure loads on one and only one factor), a completely standardized
factor loading can also be interpreted as the correlation of the indicator with the latent factor
because the latent factor is the sole predictor of the indicator (Brown, 2006). In this study, to
diagnose the organizational culture of Tehran’s pharmaceutical industry (RQ1), we plotted the
culture profile by using the completely standardized factor loadings of four culture types (shown in
Fig. 4).
The strength of culture is determined by the number of points awarded to a specific culture type.
The higher the score, the stronger or more dominant is that particular culture (Cameron and Quinn,
Fig. 4. The organizational culture profile of Tehran’s pharmaceutical industry
Fig. 2. The structural equation model of organizational culture, TQM and performance, *P<0.05, **P<0.001
Table 3. Comparison between two nested SEM models
Table 2. The goodness of fit indices for two SEM models

10
2005).As described earlier, factor loadings reflect the degree to which each item is linked to a
factor. The maximum factor loading on “Hierarchy culture” indicated that organizational culture
best explained by this dimension. It specified the hierarchy and market cultures as the dominant
types of organizational culture. “Hierarchy culture” (0.626) and “Market culture” (0.612) had
highest values. According to the culture profile (Fig. 4), it showed Tehran’s pharmaceutical
companies emphasize on stability and control more than flexibility. Sometimes no ideal culture plot
exists. Each organization must determine for itself the degree of cultural strength required to be
successful in its environment. Having drawn a picture of the overall culture profile of an industry
can be used to compare with each organization’s profile which exists in this industry (Cameron and
Quinn, 2005).
As presented in Fig. 5, the completely standardized factor loadings of six TQM categories helped
us to investigate the development degree of Tehran’s pharmaceutical companies on each of these
TQM categories (RQ2). The maximum factor loading on “Leadership” (0.711) showed the most
relevant of this indicator in defining the TQM’s dimensionality. It represented the leadership
category as the most developed aspect of TQM in the Tehran’s pharmaceutical companies. Also, the
minimum of (0.443) on “Customer focus” showed the least.
4.3. Test of research hypotheses
The research hypotheses and proposed structural model were tested by using the structural
equation modeling technique via LISREL 8.80. As the model fit indices presented in Table 2, the
goodness of fit of proposed SEM model was established. The completely standardized estimated
parameters of the proposed model were used to test the research hypotheses (Fig. 3). It showed the
significant positive effects of organizational culture on TQM (γ1 = 0.224) and performance (γ2 =
0.212). So it supported the hypotheses 1 and 3 that suggested the high strength of overall
organizational culture is positively associated with TQM (H1) and performance (H3). Also the
hypothesis 2 (H2) was accepted by significant factor loading linked between TQM and performance
(β1 = 0.321).
So, all proposed hypotheses of this research are supported by the significant factor loadings of
them. The total positive effect of culture on performance, 0.284, can be evaluated by adding its
direct (γ2 = 0.212) and indirect effect (γ1β1 = 0.072) together.
5. Discussion
According to the culture profile shown in Fig. 4, the hierarchy and market cultures are the
dominant types of organizational culture in Tehran’s pharmaceutical companies. These companies
emphasize on stability and control more than flexibility. They are viewed as effective if they are
stable, predictable, and mechanistic (Cameron and Quinn, 2005).
In many organizations, this profile becomes the norm, with the clan and adhocracy cultures
being minimized and the hierarchy and market cultures being emphasized. As shown in Fig. 1, the
hierarchy culture is characterized by a formalized and structured place to work. Procedures govern
Fig. 5. The development degrees of TQM categories in Tehran’s pharmaceutical industry

11
what people do. Effective leaders are good coordinators and organizers. Maintaining a smooth-
running organization is important. The long-term concerns of the organization are stability,
predictability, and efficiency. Formal rules and policies hold the organization together. However, a
market culture is a results-oriented workplace. Leaders are hard-driving producers and competitors.
They are tough and demanding. The glue that holds the organization together is an emphasis on
winning. The long-term concern is on competitive actions and achieving stretch goals and targets.
Success is defined in terms of market share and penetration. Outpacing the competition and market
leadership are important (Cameron and Quinn, 2005).
The emphasis of the survey industry on stability and control that found by results, shows the
companies’ environment is not turbulent and without rapidly changing. It doesn’t make difficult for
managers to plan far in advance when decision making is almost certain. These results are
consistent with the fact. Most of companies in the surveyed industry try to be stable by large
numbers of standardized rules and procedures, multiple hierarchical levels, centralized decisions,
conducting transactions, profitability and competitiveness. Most of these companies have long life
cycle higher than 10 years. The supports offered by Iran government to the survey industry have
made the environment stable and certain for the companies. So they just compete with each other to
earn more pharmaceutical market share of Iran without much customers focus, because the users
have no power to select the producer of their prescribed drugs. Also some medicines are just
produced by one or few specified companies. This low customer focus is also demonstrated by its
minimum value among the others TQM categories, as shown in Fig. 5. Also it can be found by the
low indicator value which measured the customer-focused outcomes (“Performance 2”) as a part of
overall organizational performance (presented in Fig.3 and Appendix).
“Leadership” is found as the most developed aspect of TQM in the Tehran’s pharmaceutical
companies (Fig. 5). According to the MBNQA, the Leadership category examines how the
organization’s senior leaders’ personal actions guide and sustain the organization. Also examined
are the organization’s governance system and how the organization fulfills its legal, ethical, and
societal responsibilities and supports its key communities (NIST, 2011). The senior leaders of
Tehran’s pharmaceutical companies appropriately set and deploy the vision and values throughout
organization. They create an environment for organizational performance improvement, the
accomplishment of the mission and strategic objectives, organizational and workforce learning.
The high degree of “Workforce focus” shown in Fig. 5, is supported by the maximum indicator
value which measured the workforce-focused outcomes (“Performance 4”) as a part of overall
performance. It is important to note that the minimum factor loading belongs to “Performance 6”
that measured the financial and market outcomes.
Our results show that the high strength of organizational culture is positively associated with the
level of TQM implementation and organizational performance. In addition, the significant positive
effect of TQM on performance is revealed, so it concludes that organizational culture has both
direct and indirect positive effects on performance.
According to the literature review and above discussion, we can advise the senior managers of
the survey industry to fortify and deploy the vision and values (i.e., culture) through more focus on
customers in their organizations. It can improve “Customer focus” as a category of TQM and a part
of overall performance and finally will increase the financial and market outcomes. As suggested by
Cameron and Quinn (2005) shown in Fig. 1, the customer focus is noticed to the market-type
organizations as a theory of effectiveness and quality strategy. In Tehran’s pharmaceutical

12
companies, the other dominant culture type is hierarchy that characterized by formal rules and
procedures. Thus the customer-oriented culture can be deployed by setting appropriate rules and
policies in these firms.
6. Conclusion
6.1. Contribution and implication
While organizational culture is recognized as critical for TQM and performance, to the best of
the knowledge of the authors, no empirical study has investigated how OC and TQM jointly affect
organizational performance. In this research we compared two structural equation models to
investigate the best model that explains the relationships among these three extensive variables
(Table 3). The results show the positive direct effects of culture and TQM on organizational
performance and also the positive indirect effect of culture through its positive effect on TQM (Fig.
3).
Managers should be aware of the cultural values emphasized in their organization because of
their influences on the TQM practices and performance. This study provides the necessary
instrument for the managers to diagnose the culture and evaluate the TQM development and overall
performance of their organizations (see Appendix). They can use the guidelines proposed by the
findings of this study in order to improve their performance. This would be obtained by adopting
the theories of effectiveness and quality strategies which are suggested to each of the culture type
for improving the quality management and performance (Fig. 1).
6.2. Directions for further research
The valid model which developed in this study can help future researchers to simultaneously
measure OC, TQM and performance for examining the relationships between these variables in
their case studies. An avenue for further investigations is to examine the model in the other
industries and specifically in service companies. It is also recommended to compare the
improvement guidelines suggested by analyzing the culture profiles, development degrees of TQM
categories and performance indicators of different industries which are inside a country or various
regions of the world. The other direction for further research would be to investigate the direct and
indirect effects of OC on performance in presence of the other variable instead of TQM, for
example, Human Resource Management (HRM). In addition, it is needed to longitudinally evaluate
how organization’s culture profile influences the TQM implementation as well as the resulting
effect on organizational performance during the life cycle of companies.

13
Table 1. Descriptive statistics and test of reliability
Criteria Number of
items Mean S.D.
Cronbach’s alpha
Org
an
izati
on
al
Cu
ltu
re
Clan 6 5.230 1.133 0.732
Adhocracy 6 4.577 1.192 0.710
Market 6 5.051 1.167 0.711
Hierarchy 6 4.732 1.009 0.737
Tota
l Q
uali
ty
Ma
na
gem
ent
(TQ
M)
Leadership 5 4.904 1.052 0.733
Strategic planning 5 4.686 1.030 0.747
Customer focus 5 5.284 0.851 0.745
Measurement, analysis and knowledge management
6 4.501 1.102 0.758
Workforce focus 8 4.237 1.090 0.762
Operations focus 7 4.823 1.098 0.756
Organizational Performance 6 4.720 1.124 0.727

14
Table 2. The goodness of fit indices for two SEM models
Index Evidence of good fit Proposed model Alternative model
NC (χ2:df) between 1 to 5a 1.396 1.426
RMSEA Less than 0.08 with CFI
of 0.95 or higherbc 0.042 0.043
SRMR 0.08 or less (with CFI of 0.95 or higher)bc 0.061 0.065
GFI Higher than 0.90b 0.923 0.921
CFI 0.95 or higherbc 0.954 0.950
NNFI (TLI) Higher than 0.90b 0.946 0.942
a Schumacker and Lomax (2004) b Hair et al. (2009) c If N < 250 and 12< m <30 (N: number of observations, m: number of observed variables)
OC TQM OP OC TQM OP

15
Table 3. Comparison between two nested SEM models
Model χ2df ECVI AIC Should be selected
Proposed model 141.025 101 1.001 208.303 Yes*
Alternative model 145.428 102 1.010 210.028 No
* Significantly better fit at the level of 0.05 (∆df = 1, ∆χ2 = 4.403 > 3.841)
16
Flexibility and Discretion
Inte
rnal
Focu
s an
d I
nte
gra
tion
Culture Type: CLAN Culture Type: ADHOCRACY
Extern
al F
ocu
s an
d D
ifferentia
tion
Orientation: Collaborative Orientation: Creative
Leader Type: Facilitator Mentor Team builder
Leader Type: Innovator Entrepreneur Visionary
Value Drivers: Commitment Communication Development
Value Drivers: Innovative outputs Transformation Agility
Theory of
Effectiveness:
Human development and participation produce effectiveness.
Theory of
Effectiveness:
Innovativeness, vision, and new resources produce effectiveness.
Quality
Strategies:
Empowerment Team building Employee involvement Human resource development Open communication
Quality
Strategies:
Surprise and delight Creating new standards Anticipating needs Continuous improvement Finding creative solutions
Culture Type: HIERARCHY Culture Type: MARKET
Orientation: Controlling Orientation: Competing
Leader Type: Coordinator Monitor Organizer
Leader Type: Hard driver Competitor Producer
Value Drivers: Efficiency Timeliness Consistency and uniformity
Value Drivers: Market share Goal achievement Profitability
Theory of
Effectiveness:
Control and efficiency with capable processes produce effectiveness.
Theory of
Effectiveness:
Aggressively competing and customer focus produce effectiveness.
Quality
Strategies:
Error detection Measurement Process control Systematic problem solving Quality tools (fishbone diagrams, Pareto charting, affinity graphing, variance plotting)
Quality
Strategies:
Measuring customer preferences Improving productivity Creating external partnerships Enhancing competitiveness Involving customers and suppliers
Stability and Control
Fig. 1. The Competing Values Framework (Cameron and Quinn, 2005)

17
Fig. 2. Conceptual framework
Organizational
Culture
Total Quality
Management
Organizational
Performance H1
H3
H2

18
Fig. 3. The structural equation model of organizational culture, TQM and performance, *P<0.05, **P<0.001
Organizational
performance
Organizational
culture
Total quality
management
Strategic
planning Leadership
Measurement,
analysis & KM
Customer
focus
Operations
focus
Workforce
focus
Hierarchy
Market
Adhocracy
Clan
Performance 6
Performance 5
Performance 4
Performance 3
Performance 2
Performance 1
0.626**
0.612**
0.490**
0.411** 0.723**
0.309**
0.663**
0.744**
0.603**
0.267**
0.212*
0.224* 0.321**
0.711** 0.555**0.443** 0.515** 0.567** 0.479**

19
Fig. 4. The organizational culture profile of Tehran’s pharmaceutical industry
Stability and Control
Inte
rna
l F
ocu
s a
nd
In
teg
rati
on
E
xtern
al F
ocu
s an
d D
ifferentia
tion
Flexibility and Discretion
Clan Adhocracy
Hierarchy Market

20
Fig. 5. The development degrees of TQM categories in Tehran’s pharmaceutical industry
0.479
0.567
0.515
0.443
0.555
0.711
00.10.20.30.40.50.60.70.8
Operations focus
Workforce focus
Measurement, analysis and KM
Customer focus
Strategic planning
Leadership

21
Appendix. Description of the variables constructs and their measurement items
Variable Criteria Measurement scale O
rgan
izat
iona
l C
ultu
re
Cla
n C
ultu
re
1. Our organization is a very personal place. It is like an extended family. People seem toshare a lot of themselves.
2. The leadership in our organization is generally considered to exemplify mentoring,facilitating, or nurturing.
3. The management style in our organization is characterized by teamwork, consensus,and participation.
4. The glue that holds our organization together is loyalty and mutual trust. Commitmentto this organization runs high.
5. Our organization emphasizes human development. High trust, openness, andparticipation persist.
6. Our organization defines success on the basis of the development of human resources,teamwork, employee commitment, and concern for people.
Adh
ocra
cy C
ultu
re
1. Our organization is a very dynamic and entrepreneurial place. People are willing tostick their necks out and take risks.
2. The leadership in our organization is generally considered to exemplifyentrepreneurship, innovation, or risk taking.
3. The management style in our organization is characterized by individual risk taking,innovation, freedom, and uniqueness.
4. The glue that holds our organization together is commitment to innovation anddevelopment. There is an emphasis on being on the cutting edge.
5. Our organization emphasizes acquiring new resources and creating new challenges.Trying new things and prospecting for opportunities are valued.
6. Our organization defines success on the basis of having the most unique or newestproducts. It is a product leader and innovator.
Mar
ket C
ultu
re
1. Our organization is very results-oriented. A major concern is with getting the job done.People are very competitive and achievement-oriented.
2. The leadership in our organization is generally considered to exemplify a no-nonsense,aggressive, results-oriented focus.
3. The management style in our organization is characterized by hard-drivingcompetitiveness, high demands, and achievement.
4. The glue that holds our organization together is the emphasis on achievement and goalaccomplishment.
5. Our organization emphasizes competitive actions and achievement. Hitting stretchtargets and winning in the marketplace are dominant.
6. Our organization defines success on the basis of winning in the marketplace andoutpacing the competition. Competitive market leadership is key.
Hie
rarc
hy C
ultu
re
1. Our organization is a very controlled and structured place. Formal procedures generallygovern what people do.
2. The leadership in our organization is generally considered to exemplify coordinating,organizing, or smooth-running efficiency
3. The management style in our organization is characterized by security of employment,conformity, predictability, and stability in relationships.
4. The glue that holds our organization together is formal rules and policies. Maintaining asmooth-running organization is important.
5. Our organization emphasizes permanence and stability. Efficiency, control, and smoothoperations are important.
6. Our organization defines success on the basis of efficiency. Dependable delivery,smooth scheduling, and low-cost production are critical.

22
Tot
al Q
uali
ty M
anag
emen
t (T
QM
)
Lea
ders
hip
1. The senior leaders appropriately set and deploy our organization’s vision and valuesthroughout organization.
2. Our senior leaders create an environment for organizational performance improvement,the accomplishment of our mission and strategic objectives, innovation, organizational and workforce learning.
3. Our senior leaders encourage frank, two-way communication with the entire workforce.4. The management and fiscal’s actions are accountable, and the performance of our
senior leaders is being evaluated, as appropriate. 5. Our organization contributes to the well-being of our environmental, social, legal, and
ethical activities.
Str
ateg
ic P
lann
ing
1. Our organization conducts its strategic planning according to our organization’sstrengths, weaknesses, opportunities, threats, early indications of major shifts intechnology, markets, and long-term organizational sustainability.
2. We define the key strategic objectives and our timetable for accomplishing themaccording to our ability and the needs of all key stakeholders.
3. We develop and deploy our action plans and their key performance measures orindicators throughout the organization, as appropriate, to achieve our key strategic objectives.
4. We allocate the financial, human, and other resources to support the accomplishment ofour action plans.
5. We compare our projected performance on the key performance measures or indicatorswith the projected performance of our competitors or comparable organizations. If there are current or projected gaps, we adopt the necessary adjustment activities.
Cus
tom
er F
ocus
1. We appropriately listen to former customers, potential customers, and customers ofcompetitors to obtain actionable information and to obtain feedback.
2. We determine the satisfaction of our customers and the competitors’ customers. Weseriously consider the customers’ requirements and exceeding their expectations in the future.
3. We identify and innovate product offerings and services to meet the requirements andexceed the expectations of our customer groups and market segments.
4. We enable customers to conduct their business with us and provide feedback on ourproducts and our customer support, as appropriate, to use their offering information to improve marketing, build a more customer-focused culture, and identify opportunities for innovation.
5. Our customer complaint management process ensures that complaints are resolvedpromptly and effectively. It enables us to recover our customers’ confidence and enhance their satisfaction and engagement.
Mea
sure
men
t, A
naly
sis
and
Kno
wle
dge
Man
agem
ent
1. We select, collect, align, and integrate data and information for tracking dailyoperations and overall organizational performance.
2. We ensure that our performance measurement system is able to respond to rapid orunexpected organizational or external changes.
3. We use organizational performance review findings to develop priorities for continuousimprovement and opportunities for innovation. These priorities and opportunities are deployed to work group and functional-level operations throughout our organization.
4. We manage our organizational data, information, and knowledge to ensure accuracy,integrity and reliability, timeliness, security and confidentiality.
5. We appropriately make needed data and information available to our workforce,suppliers, partners, collaborators, and customers.
6. The hardware and software systems of our information resources and technology arereliable, secure, and user-friendly. In the event of an emergency, we ensure the continued availability of them.

23
Wor
kfor
ce F
ocus
1. We assess our workforce capability and capacity needs, including skills, competencies,and staffing levels.
2. We recruit, hire, place, and retain new members of our workforce, as appropriate, toensure that this workforce represents the diverse ideas, cultures, and thinking of our hiring and customer community.
3. We organize and manage our workforce, as appropriate, to accomplish the work of theorganization, reinforce a customer and business focus, and address our strategic challenges and action plans.
4. We address workplace environmental factors, including accessibility, to ensure andimprove workforce health, safety, and security. We support our workforce via policies, services, and benefit.
5. We determine the key elements that affect workforce engagement and workforcesatisfaction.
6. We foster an organizational culture that is characterized by open communication, high-performance work, and an engaged workforce.
7. Our workforce performance management system considers workforce compensation,reward, recognition, and incentive practices.
8. According to the needs of organizational performance improvement and innovation, theworkforce members and leaders are developed by our learning and development system to achieve higher performance. We evaluate the effectiveness and efficiency of this system.
Ope
rati
ons
Foc
us
1. We design and innovate our overall work systems. We determine their keyrequirements, incorporating input from customers, suppliers, partners, andcollaborators, as appropriate.
2. We manage and improve our work systems to deliver customer value, achieveorganizational success and sustainability, and control the overall costs.
3. Our disaster and emergency preparedness system consider prevention, management,continuity of operations, and recovery.
4. We incorporate new technology, cycle time, productivity, cost control, and otherefficiency and effectiveness factors into our work processes. We also determine thekey requirements for these work processes.
5. We have the key performance measures or indicators and in-process measures for thecontrol and improvement of the work processes.
6. We select the suppliers which are qualified and positioned to enhance our performanceand customer satisfaction. We also evaluate their performance.
7. We improve our work processes to achieve better performance, reduce variability, andimprove products.
Org
aniz
atio
nal
Per
form
ance
1. The key measures or indicators of the operational performance of our key work systemsand processes, including productivity, cycle time, and other appropriate measures of process effectiveness, efficiency, and innovation, have positive trends.
2. The key measures or indicators of our customer satisfaction and engagement, havepositive trends.
3. The key measures of our workforce capability and capacity, including staffing levelsand appropriate skills, have positive trends.
4. The key measures or indicators of our workforce climate, including workforce health,safety, security, services and benefit, engagement and satisfaction, and workforce and leader development, have positive trends.
5. The key measures or indicators of our senior leaders and governance including fiscalaccountability, legal compliance, ethical behavior, and societal responsibility, have positive trends.
6. The key measures or indicators of our financial and marketplace performance includingaggregate measures of financial return, financial viability, budgetary performance, market share or position, market and market share growth, and new markets entered, have positive trends.

24
References
Ahire, S.L., Golhar, D.Y., Waller, M.A., 1996. Development and validation of TQM implementation constructs. Decision Sciences 27 (1), 23-53.
Anderson, J.C., Gerbing, D., W., 1988. Structural equation modeling in practice: A review and recommended two-step approach. Psychological Bulletin 103 (3), 411-423.
Anderson, J.C., Rungtusanatham, M., Schroeder, R.G., Devaraj, S., 1995. A Path Analytic Model of a Theory of Quality Management Underlying the Deming Management Method: Preliminary Empirical Findings. Decision Sciences 26 (5), 637-658.
Arumugam, V., Ooi, K.B., Fong, T.C., 2008. TQM practices and quality management performance: An investigation of their relationship using data from ISO 9001:2000 firms in Malaysia. TQM Journal 20 (6), 636-650.
Asree, S., Zain, M., Razalli, M.R., 2010. Influence of leadership competency and organizational culture on responsiveness and performance of firms. International Journal of Contemporary Hospitality Management 22 (4), 500-516.
Bagozzi, R.P., Phillips, L.W., 1991. Assessing construct validity in organizational research. Administrative Science Quarterly 36 (3), 421-458.
Baruch, Y., Holtom, B.C., 2008. Survey response rate levels and trends in organizational research. Human Relations 61 (8), 1139-1160.
Black, S.A., Porter, L.J., 1996. Identification of the critical factors of TQM. Decision Sciences 27 (1), 1-17. Bou-Llusar, J.C., Escrig-Tena, A.B., Roca-Puig, V., Beltrán-Martín, I., 2009. An empirical assessment of the
EFQM Excellence Model: Evaluation as a TQM framework relative to the MBNQA Model. Journal of Operations Management 27 (1), 1-22.
Brah, S.A., Lim, H.Y., 2006. The effects of technology and TQM on the performance of logistics companies. International Journal of Physical Distribution and Logistics Management 36 (3), 192-209.
Brown, T.A., 2006. Confirmatory Factor Analysis for Applied Research, 1th ed. The Guilford Press, New York, US.
Byrne, B.M., 2001. Structural equation modeling with AMOS, EQS, and LISREL: Comparative approaches to testing for the factorial validity of a measuring instrument. International Journal of Testing 1 (1), 55-86.
Cadden, T., Marshall, D., Cao, G., 2013. Opposites attract: Organisational culture and supply chain performance. Supply Chain Management 18 (1), 86-103.
Cameron, K.S., Freeman, S.J., 1991. Cultural congruence, strength and type: relationships to effectiveness. Research in Organizational Change and Development 5, 23-58.
Cameron, K.S., Quinn, R.E., 2005. Diagnosing and Changing Organizational Culture: Based on the Competing Values Framework, Revised ed. Jossey-Bass, USA.
Choi, T.Y., Eboch, K., 1998. The TQM Paradox: Relations among TQM practices, plant performance, and customer satisfaction. Journal of Operations Management 17 (1), 59-75.
Chung, Y.C., Hsu, Y.W., Tsai, C.H., 2010. Research on the correlation between implementation strategies of TQM, organizational culture, TQM activities and operational performance in high-tech firms. Information Technology Journal 9 (8), 1696-1705.
Claver-Cortés, E., Pereira-Moliner, J., Tarí, J.J., Molina-Azorín, J.F., 2008. TQM, managerial factors and performance in the Spanish hotel industry. Industrial Management and Data Systems 108 (2), 228-244.
Cua, K.O., McKone, K.E., Schroeder, R.G., 2001. Relationships between implementation of TQM, JIT, and TPM and manufacturing performance. Journal of Operations Management 19 (6), 675-694.
Dadgar, H., Marzooghi, R., Torkzadeh, J., Mohammadi, M., Barahouei, F., 2013. A comparative evaluation of the perception of lecturers employees and students about the organizational culture of Shiraz University. Life Science Journal 10 (1), 441-448.
Deal, T.E., Kennedy, A.A., 1982. Corporate Cultures: The Rites and Rituals of Corporate Life. Addison-Wesley.
Denison, D.R., Spreitzer, G.M., 1991. Organizational culture and organizational development: a competing values approach. Research in Organizational Change and Development 5, 1-21.
DeVellis, R.F., 2003. Scale development: Theory and applications, 2nd ed. Sage Publications, Thousand Oaks, CA.

25
Feng, J., Prajogo, D.I., Tan, K.C., Sohal, A.S., 2006. The impact of TQM practices on performance: A comparative study between Australian and Singaporean organizations. European Journal of Innovation Management 9 (3), 269-278.
Flynn, B.B., Schroeder, R.G., Sakakibara, S., 1994. A framework for quality management research and an associated measurement instrument. Journal of Operations Management 11 (4), 339-366.
Flynn, B.B., Schroeder, R.G., Sakakibara, S., 1995. The Impact of Quality Management Practices on Performance and Competitive Advantage. Decision Sciences 26 (5), 659-691.
Fornell, C., Larcker, D.F., 1981. Evaluating structural equation models with unobservable variables and measurement error. Journal of Marketing Research 18 (1), 39-50.
Gardner, W.L., Reithel, B.J., Cogliser, C.C., Walumbwa, F.O., Foley, R.T., 2012. Matching Personality and Organizational Culture: Effects of Recruitment Strategy and the Five-Factor Model on Subjective Person-Organization Fit. Management Communication Quarterly 26 (4), 585-622.
Gimenez-Espin, J.A., Jiménez-Jiménez, D., Martínez-Costa, M., 2013. Organizational culture for total quality management. Total Quality Management and Business Excellence 24 (5-6), 678-692.
Giritli, H., Öney-Yazici, E., Topçu-Oraz, G., Acar, E., 2013. The interplay between leadership and organizational culture in the Turkish construction sector. International Journal of Project Management 31 (2), 228-238.
Green, T.J., 2012. TQM and organisational culture: How do they link? Total Quality Management and Business Excellence 23 (2), 141-157.
Haffar, M., Al-Karaghouli, W., Ghoneim, A., 2013. The mediating effect of individual readiness for change in the relationship between organisational culture and TQM implementation. Total Quality Management and Business Excellence 24 (5-6), 693-706.
Hair, J.F., Black, W.C., Babin, B.J., Anderson, R.E., 2009. Multivariate Data Analysis, 7th ed. Prentice Hall. Hendricks, K.B., Singhal, V.R., 2001. Firm characteristics, total quality management, and financial
performance. Journal of Operations Management 19 (3), 269-285. Hofstede, G., 1998. Attitudes, values and organizational culture: Disentangling the concepts. Organization
Studies 19 (3), 477-492. Hung, R.Y.Y., Lien, B.Y.H., Yang, B., Wu, C.M., Kuo, Y.M., 2011. Impact of TQM and organizational
learning on innovation performance in the high-tech industry. International Business Review 20 (2), 213-225.
Inoue, H., Yamada, S., 2013. Critical factors for process improvement in pharmaceutical research. TQM Journal 25 (2), 141-152.
Jacobs, R., Mannion, R., Davies, H.T.O., Harrison, S., Konteh, F., Walshe, K., 2013. The relationship between organizational culture and performance in acute hospitals. Social Science and Medicine 76 (1), 115-125.
Jayaram, J., Ahire, S.L., Dreyfus, P., 2010. Contingency relationships of firm size, TQM duration, unionization, and industry context on TQM implementation - A focus on total effects. Journal of Operations Management 28 (4), 345-356.
Joiner, T.A., 2007. Total quality management and performance: The role of organization support and co-worker support. International Journal of Quality and Reliability Management 24 (6), 617-627.
Juran, J.M., Godfrey, A.B., 1998. Juran's Quality Handbook, 5th ed. McGraw-Hill Professional. Kaluarachchi, K.A.S.P., 2010. Organizational culture and total quality management practices: A Sri Lankan
case. TQM Journal 22 (1), 41-55. Kannan, V.R., Tan, K.C., 2005. Just in time, total quality management, and supply chain management:
Understanding their linkages and impact on business performance. Omega 33 (2), 153-162. Kaplan, R.S., Norton, D.P., 1992. The balanced scorecard--measures that drive performance. Harvard
Business Review 70 (1), 71-79. Kaynak, H., 2003. The relationship between total quality management practices and their effects on firm
performance. Journal of Operations Management 21 (4), 405-435. Konecny, P.A., Thun, J.-H., 2011. Do it separately or simultaneously—An empirical analysis of a conjoint
implementation of TQM and TPM on plant performance. International Journal of Production Economics 133 (2), 496-507.
Kumar, V., Choisne, F., De Grosbois, D., Kumar, U., 2009. Impact of TQM on company's performance. International Journal of Quality and Reliability Management 26 (1), 23-37.

26
Liu, H., Ke, W., Wei, K.K., Gu, J., Chen, H., 2010. The role of institutional pressures and organizational culture in the firm's intention to adopt internet-enabled supply chain management systems. Journal of Operations Management 28 (5), 372-384.
Martínez-Costa, M., Martínez-Lorente, A.R., Choi, T.Y., 2008. Simultaneous consideration of TQM and ISO 9000 on performance and motivation: An empirical study of Spanish companies. International Journal of Production Economics 113 (1), 23-39.
Mathew, J., 2007. The relationship of organisational culture with productivity and quality: A study of Indian software organisations. Employee Relations 29 (6), 677-695.
McAdam, R., Barron, N., 2002. The role of quality management in pharmaceutical development: clinical trials analysis. International Journal of Health Care Quality Assurance 15 (3), 106-123.
Miyagawa, M., Yoshida, K., 2010. TQM practices of Japanese-owned manufacturers in the USA and China. International Journal of Quality and Reliability Management 27 (7), 736-755.
Nair, A., 2006. Meta-analysis of the relationship between quality management practices and firm performance—implications for quality management theory development. Journal of Operations Management 24 (6), 948-975.
Naor, M., Linderman, K., Schroeder, R., 2010. The globalization of operations in Eastern and Western countries: Unpacking the relationship between national and organizational culture and its impact on manufacturing performance. Journal of Operations Management 28 (3), 194-205.
NIST, 2011. 2011-2012 Criteria for Performance Exellence. American Society for Quality (ASQ), Milwaukee, USA.
Nunnally, J.C., Bernstein, I.H., 1994. Psychometric Theory, 3rd ed. McGraw-Hill, New York. Pinho, J.C., 2008. TQM and performance in small medium enterprises: The mediating effect of customer
orientation and innovation. International Journal of Quality and Reliability Management 25 (3), 256-275.
Podsakoff, P.M., MacKenzie, S.B., Lee, J.-Y., Podsakoff, N.P., 2003. Common method biases in behavioral research: a critical review of the literature and recommended remedies. Journal of applied psychology 88 (5), 879.
Powell, T.C., 1995. Total quality management as competitive advantage: A review and empirical study. Strategic Management Journal 16 (1), 15-37.
Prajogo, D.I., 2005. The comparative analysis of TQM practices and quality performance between manufacturing and service firms. International Journal of Service Industry Management 16 (3), 217-228.
Prajogo, D.I., Hong, S.W., 2008. The effect of TQM on performance in R&D environments: A perspective from South Korean firms. Technovation 28 (12), 855-863.
Prajogo, D.I., McDermott, C.M., 2005. The relationship between total quality management practices and organizational culture. International Journal of Operations and Production Management 25 (11), 1101-1122.
Prajogo, D.I., Sohal, A.S., 2004. The multidimensionality of TQM practices in determining quality and innovation performance - An empirical examination. Technovation 24 (6), 443-453.
Prajogo, D.I., Sohal, A.S., 2006a. The integration of TQM and technology/R&D management in determining quality and innovation performance. Omega 34 (3), 296-312.
Prajogo, D.I., Sohal, A.S., 2006b. The relationship between organization strategy, total quality management (TQM), and organization performance - The mediating role of TQM. European Journal of Operational Research 168 (1), 35-50.
Rad, A.M.M., 2006. The impact of organizational culture on the successful implementation of total quality management. TQM Magazine 18 (6), 606-625.
Rahman, S.U., Bullock, P., 2005. Soft TQM, hard TQM, and organisational performance relationships: An empirical investigation. Omega 33 (1), 73-83.
Roldán, J.L., Leal-Rodríguez, A.L., Leal, A.G., 2012. The influence of organisational culture on the total quality management programme performance. Investigaciones Europeas de Direccion y Economia de la Empresa 18 (3), 183-189.
Samson, D., Terziovski, M., 1999. Relationship between total quality management practices and operational performance. Journal of Operations Management 17 (4), 393-409.
Saraph, J.V., Benson, P.G., Schroeder, R.G., 1989. An Instrument for Measuring the Critical Factors of Quality Management. Decision Sciences 20 (4), 810-829.

27
Schein, E.H., 1983. The role o f the founder in creating organizational culture. Organizational Dynamics 12 (1), 13-28.
Schein, E.H., 1984. Coming to a New Awareness of Organizational Culture. Sloan management review 25 (2), 3-16.
Schein, E.H., 2004. Organizational Culture and Leadership 3rd ed. Jossey-Bass. Schumacker, R.E., Lomax, R.G., 2004. A Beginner's Guide to Structural Equation Modeling, 2nd ed.
Lawrence Erlbaum Associates, Mahwah, NJ. Sila, I., Ebrahimpour, M., 2002. An investigation of the total quality management survey based research
published between 1989 and 2000. A literature review. International Journal of Quality and Reliability Management 19 (7), 902-970.
Sila, I., Ebrahimpour, M., 2005. Critical linkages among TQM factors and business results. International Journal of Operations and Production Management 25 (11), 1123-1155.
Sneyd, K.P., Rowley, J., 2004. Linking strategic objectives and operational performance: an action research-based exploration. Measuring Business Excellence 8 (3), 42-51.
Sousa, R., Voss, C.A., 2002. Quality management re-visited: a reflective review and agenda for future research. Journal of Operations Management 20 (1), 91-109.
Tangen, S., 2004. Evaluation and revision of performance measurement systems, Department of Production Engineering. KTH, Royal Institute of Technology, Stockholm, Sweden, p. 213.
Trochim, W.M., 2000. The Research Methods Knowledge Base, 2nd ed. Atomic Dog Publishing, Cincinnati, OH.
Tseng, S.M., 2010. The correlation between organizational culture and knowledge conversion on corporate performance. Journal of Knowledge Management 14 (2), 269-284.
Tummala, V.M., Tang, C.L., 1996. Strategic Quality Management, Malcolm Baldrige and European Quality Awards and ISO 9000 Certification. International Journal of Quality and Reliability Management 13 (4), 8-38.
Twati, J.M., Gammack, J.G., 2006. The impact of organisational culture innovation on the adoption of IS/IT: The case of Libya. Journal of Enterprise Information Management 19 (2), 175-191.
Uzkurt, C., Kumar, R., Kimzan, H.S., Eminoǧlu, G., 2013. Role of innovation in the relationship between organizational culture and firm performance: A study of the banking sector in Turkey. European Journal of Innovation Management 16 (1), 92-117.
Valmohammadi, C., 2011. The impact of TQM implementation on the organizational performance of Iranian manufacturing SMEs. The TQM Journal 23 (5), 496-509.
Valmohammadi, C., 2012. Investigating innovation management practices in Iranian organizations. Journal of Innovation: Management, Policy and Practice 14 (2), 247-255.
Wang, C.H., Chen, K.Y., Chen, S.C., 2012. Total quality management, market orientation and hotel performance: The moderating effects of external environmental factors. International Journal of Hospitality Management 31 (1), 119-129.
Wiewiora, A., Trigunarsyah, B., Murphy, G., Coffey, V., 2013. Organizational culture and willingness to share knowledge: A competing values perspective in Australian context. International Journal of Project Management 31 (8), 1163-1174.
Xenikou, A., Simosi, M., 2006. Organizational culture and transformational leadership as predictors of business unit performance. Journal of Managerial Psychology 21 (6), 566-579.
York, K.M., Miree, C.E., 2004. Causation or covariation: An empirical re-examination of the link between TQM and financial performance. Journal of Operations Management 22 (3), 291-311.
Yunis, M., Jung, J., Chen, S., 2013. TQM, strategy, and performance: A firm-level analysis. International Journal of Quality and Reliability Management 30 (6), 690-714.
Zu, X., Robbins, T.L., Fredendall, L.D., 2010. Mapping the critical links between organizational culture and TQM/Six Sigma practices. International Journal of Production Economics 123 (1), 86-106.

� مقا�، از �ی � ه مقا�ت ا �� ن سايت شده �� ��ه فاراي �� در PDFكه #� فرمت ميباشد ��
ان قرار � ايل ميتوانيد #� 6يک �� روی د3ه های ز�� گرفته است. اختيار -, عز�� از در صورت :�
اييد:سا�� مقا�ت � استفاده :� ن<�
ه شده از �� � مقا�ت �� � ه فا ؛ مرجع جديد�� �� ت معت<� خار�B سايت �� �# ,Dن