| global research | commodity roadmap · pdf filecommodity roadmap – a long road to ......
TRANSCRIPT
Important disclosures can be found in the Disclosures Appendix
All rights reserved. Standard Chartered Bank 2015 research.standardchartered.com
Nicholas Snowdon +44 20 7885 2276
FICC Research
Standard Chartered Bank
Serene Shang Yi Lim +65 6596 6064
FICC Research
Standard Chartered Bank, Singapore Branch
Paul Horsnell+44 20 7885 6913
FICC Research
Standard Chartered Bank
| Global Research | 27 April 2015
Commodity Roadmap – A long road to recovery for the US oil industry
Focus: No V-shaped recovery is likely for US oil output
Turn in macro trends triggers short-covering rally across base metals but fundamentals remain soft
Brent crude oil prices have pushed above USD 65/bbl for the first time in 2015 as sentiment brightens
Focus: A long road to recovery for the US oil industry
The weekly Energy Information Administration (EIA) data provides further evidence
that US oil production has begun to fall. The data has shown a decline in three of the
past four weeks, leaving US crude output at 9.366 million barrels per day (mb/d), 56
thousand barrels per day (kb/d) lower than the peak reached on 20 March. The rig
count in the four main US shale oil regions has fallen for 21 weeks, and at 501 it is
583 rigs lower y/y. State data points to an earlier, faster onset of the decline: e.g.,
North Dakota indicates that the fall began in January, and its latest estimate of output
is lower than it was in September 2014. In our view there is no doubt that US output
is falling, and that the pace of decline is likely to accelerate in coming months.
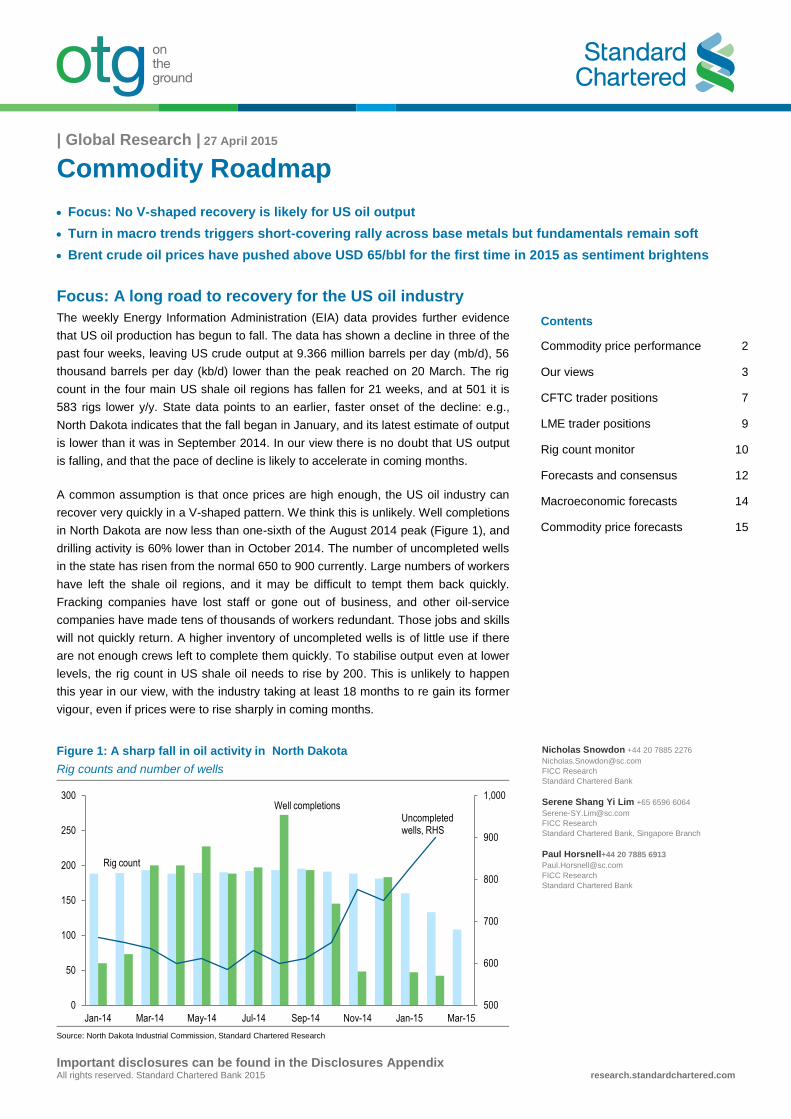
A common assumption is that once prices are high enough, the US oil industry can
recover very quickly in a V-shaped pattern. We think this is unlikely. Well completions
in North Dakota are now less than one-sixth of the August 2014 peak (Figure 1), and
drilling activity is 60% lower than in October 2014. The number of uncompleted wells
in the state has risen from the normal 650 to 900 currently. Large numbers of workers
have left the shale oil regions, and it may be difficult to tempt them back quickly.
Fracking companies have lost staff or gone out of business, and other oil-service
companies have made tens of thousands of workers redundant. Those jobs and skills
will not quickly return. A higher inventory of uncompleted wells is of little use if there
are not enough crews left to complete them quickly. To stabilise output even at lower
levels, the rig count in US shale oil needs to rise by 200. This is unlikely to happen
this year in our view, with the industry taking at least 18 months to re gain its former
vigour, even if prices were to rise sharply in coming months.
Figure 1: A sharp fall in oil activity in North Dakota
Rig counts and number of wells
Source: North Dakota Industrial Commission, Standard Chartered Research
500
600
700
800
900
1,000
0
50
100
150
200
250
300
Jan-14 Mar-14 May-14 Jul-14 Sep-14 Nov-14 Jan-15 Mar-15
Rig count
Well completions Uncompleted wells, RHS
Contents
Commodity price performance 2
Our views 3
CFTC trader positions 7
LME trader positions 9
Rig count monitor 10
Forecasts and consensus 12
Macroeconomic forecasts 14
Commodity price forecasts 15

On the Ground
27 April 2015 2
Commodity price performance
Figure 2: Changes in commodity prices in latest week and previous week
%
Source: Standard Chartered Research
Aluminium
Copper
Nickel
Tin
Zinc
Lead
Gold
Palladium
Silver
Iron ore
Brent
API2 coal
Platinum
Corn
Palm oil
Wheat
Soybeans
Sugar
Cotton
Robusta coffee
Cocoa
API4 coal
Newcastle coal
Base metals Precious metals Energy and bulks Agriculture and softs
WTI
Dubai
Natural gas
Heating oil Gasoline
-12
-10
-8
-6
-4
-2
0
2
4
6
8
10
12
-5 -4 -3 -2 -1 0 1 2 3 4 5 6 7
KEY
lower in previous week
higher in previous week
higher in latest week
lower in latest week
Figure 3: Changes in commodity prices in 2015 to date and 2014
%
Source: Standard Chartered Research
Aluminium
Copper
Nickel
Tin
Zinc
Lead
Gold
Palladium
Silver
Iron ore
Brent
API2 coal
Platinum
Corn
Palm oil
Wheat
Soybeans
Sugar
Cotton
Robusta coffee
Cocoa
API4 coal
Newcastle coal
Base metals Precious metals Energy and bulks Agriculture and softs
WTI
Dubai
Natural gas Heating oil
-60
-50
-40
-30
-20
-10
0
10
20
-30 -25 -20 -15 -10 -5 0 5 10 15 20
KEY
lower in 2014
higher in 2014
higher in 2015
lower in 2015
lnverse of change in dollar index in 2015

On the Ground
27 April 2015 3
Our views
Base metals
Following weakening price trends in Q1-2015, the base metals complex has found a
firmer footing so far in Q2. While there has been no obvious significant tightening in
supply-demand conditions, the more alarmist scenarios posited about China’s
demand at the beginning of the year have not transpired; this has tempered
bearishness towards the complex. The case for calling a bottom to the price cycle
has gained credence given a reversal in macro-level momentum, not least from more
aggressive China policy action, a rebound in oil prices and a more contained US
dollar (USD) strengthening trend. The problem remains, however, that at current
price levels many refined metals markets remain in surplus and until better demand
conditions transpire, supply-rationing pressures are likely to be insufficient to
rebalance fundamentals in the current quarter. Short-covering dynamics may support
prices higher in the near term; however, we ultimately see a constrained environment
for sustained price upside over the rest of Q2 before greater convergence of micro
and macro trends generates clearer upside support in the second half of 2015.
Nickel has had the shortest net investor positioning of all the base metals, as
reflected in net money manager positioning on the LME (see Figure 15).
Unsurprisingly then, nickel prices have rallied by close to 10% from their mid-April
lows as this broad short covering rally has played out. News that a combination of
equipment failure and a labour strike has cut production at the 45 thousand tonnes
per annum (ktpa) Cerro Matoso ferronickel facility in Colombia has also had some
tightening effect on fundamental expectations. It was, however, reported over the
weekend that a strike at the 60ktpa Ambatovy refined nickel facility has now ended.
In the context of current nickel market dynamics, the potential maximum loss of 4kt of
nickel per month from the disruption at Cerro Matoso cannot be viewed as a
significant disruption volume. The International Nickel Study Group reported earlier
this month that the global nickel market was in a 25kt surplus in January-February
this year. LME stock levels have risen modestly since then (+6kt) and China’s net
refined imports in March were the lowest since December last year.
Conditions in China’s stainless steel sector remain soft, with domestic prices at their
lowest level since 2007. China’s stainless steel exports have weakened so far in
2015, down 6% y/y in Q1. This reflects the impact of anti-dumping duties imposed on
China’s stainless steel exports in a number of destination markets. Stainless export
volumes have expanded over recent years to now represent close to 15% of
domestic stainless steel production. Therefore the weakening trend in export flows
represents a clear headwind to the degree to which China’s stainless steel
production levels rebound, even if domestic demand conditions eventually improve.
The LME announced this morning that it is planning to increase the decay factor
applied to calculate the additional load-out requirements for warehouses with queues
exceeding 50 days. The decay factor will increase to 1.0 from 0.5 from August 2015.
Under the linked load-in/load-out (LILO) rules, impacted warehouses will have to
load-out a minimum of 3kt per day of metal and then a proportion of any metal
loaded-in (determined by the decay factor). The increase in the decay factor means
that a load-in of 3kt would result in the warehouse having to load out 6kt (3kt
mandated plus 1 x 3kt) in the subsequent application quarterly period. Delivery
queues will subsequently decline at a faster pace than would otherwise be the case if
impacted warehouses choose to accept deliveries of metal and not balance those
deliveries in with counterbalancing deliveries out in that calculation period.
Positive macro developments
trigger a short-covering burst but
soft fundamentals are likely to
temper the sustainability of price
moves in Q2
Adjustment to LME LILO decay
factor will accelerate queue decline
if impacted warehouses choose to
take in metal deliveries
Pressure on China’s stainless steel
export channel from anti-dumping
duties in key destination markets is
a headwind to a revival of domestic
stainless production in 2015
Nickel benefits most from the short-
covering move but fundamental
conditions do not yet justify a
sustained move higher

On the Ground
27 April 2015 4
What does the LME’s announcement mean for the aluminium market? We believe
the announcement was expected by the market given there was a brief consultation
period with stakeholders. Ultimately, if the impacted LME warehouses (Detroit,
Vlissingen) do not choose to take load-ins of aluminium then the increase in decay
factor will not impact the time it takes for metal in the queue to be released, as the
minimum 3kt per day load-out level remains in place. It is likely to make impacted
warehouses less inclined to accept metal deliveries. Either way, current trends in the
aluminium physical market are already generating a trend of re-warranting and
reinforcing the removal of metal from delivery queues. This trend is most obvious in
Vlissingen, where cancelled warrant levels have fallen close to 320kt year-to-date but
only 240kt has been loaded-out. This suggests that the environment of tight LME
aluminium front-end time spreads and continued sharp falls in physical premiums has
generated an economic disincentive to release aluminium from LME warehouses to
sell into the spot market. There is also the eventual possibility of deliveries of
aluminium into LME warehouses if current dynamics remain in place.
Energy
Brent settled above USD 65/bbl on 24 April, for the first time since 9 December 2014.
Prices are now more than USD 20/bbl higher than the low reached in mid-January,
but are still USD 14/bbl lower than at the time of the last OPEC meeting in November
2014. Market sentiment has, in our view, turned noticeably more bullish over the past
two weeks, and our money-manager positioning indicator (Figure 6) has just become
very slightly positive. We believe that the shift in sentiment has hinged on both a
more optimistic view of demand, and also a far more downbeat view of non-OPEC
supply in general, with the totemic event being the start of oil output falls in the US.
The speed with which the market returns to pre-OPEC meeting oil price levels is
likely to hinge on Saudi Arabia and the outcome of the next OPEC meeting (set for 5
June). Statements from oil industry and government officials in Saudi Arabia have
been accentuating the positive over the past two weeks. It now appears that Saudi
Arabia did not have any difficulty in passing on extra oil to its customers when its
output increased last month to above 10mb/d. In particular, most customers did not
receive their full nominations, with the actual volumes lifted being constrained under
the tolerance clauses of the term contracts. In other words, not only was there a
market for the additional supply, but Saudi Arabia would have produced even more
had it fully met all nominated volumes.
With demand seemingly very strong (with the value of the OPEC basket above USD
60/bbl for the first time this year) and US oil output going into reverse faster than
consensus had expected, in our view Saudi Arabia’s policy makers are likely to be
pleased with the extent of oil-market rebalancing so far this year. We believe that Saudi
Arabia would be open to discussions of a multilateral output-cut deal over the next six
weeks, particularly if it involved Russia. However, Saudi Arabia also appears content to
allow the current market situation to continue for the rest of the year if no acceptable
deal is available. Our concern would be that a lack of agreement might exacerbate the
damage currently experienced by non-OPEC producers, should it lead to prices stalling
close to current levels and not making a further push towards USD 80/bbl. Given that
we do not expect US oil supply to make a V-shaped recovery (see Focus), we believe
there is now a significant risk of an over-tightening of the market.
Oil-market sentiment continues to
become more positive
Saudi Arabia’s policy makers are
likely to be content with the current
market dynamic
Falling premiums and tight LME
time spreads are driving re-
warrantings and supporting the
impact of LILO rules in reducing
LME delivery queue levels

On the Ground
27 April 2015 5
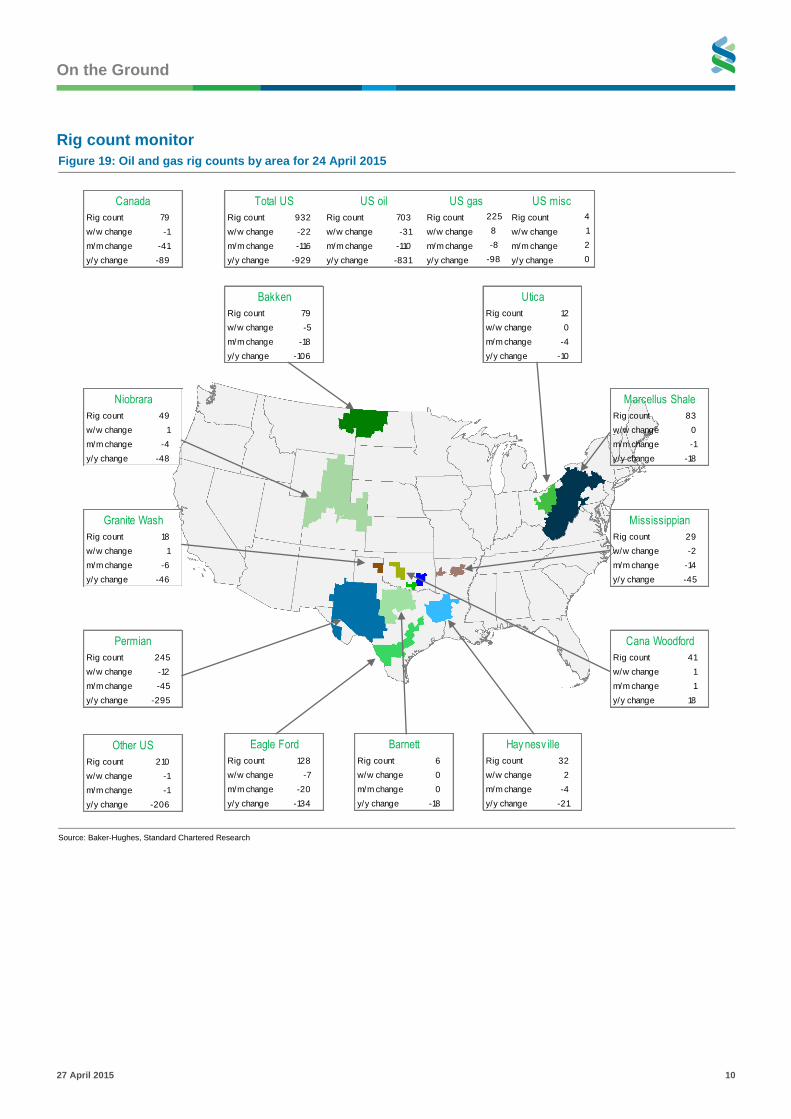
The long run of falls in US drilling activity continued in the latest Baker-Hughes
weekly data. The total US rig count has fallen by almost 50% y/y, a rate of decline
that has only been exceeded in two market slumps over the past 70 years. The
current rig count is 932 rigs, a y/y reduction of 929 rigs. The US oil rig count fell 31 to
703, taking the cumulative number of rigs idled since October 2014 to 906, and the
y/y reduction for oil drilling alone to 54%. The Texas oil rig count shed 22 to 348, and
is now 58% lower than its 2014 peak. Horizontal oil drilling (the mainstay of shale oil
operations) fell 25 to 541 rigs. As noted in the Focus article, we calculate that it would
take an increase of 200 rigs in shale-oil regions to stabilise output. With the path of
least resistance for drilling activity likely to be downwards for a while yet, the lengthy
decline in drilling has laid the ground for a long period of US output declines.
The natural gas rig count fell by eight to 217 in the week of 17 April. However, with
decline rates in shale gas being substantially less than in shale oil, lower drilling is
not feeding through into lower output. As a result, inventory levels are still rising
faster than market expectations. The latest net injection was 90Bcf, up from 63Bcf
the previous week. Over the past three weeks since the beginning of the injection
season, net storage injections have totalled 168Bcf, versus 59Bcf over the same
period last year. This implies that, unless summer weather is unusually hot, US
natural gas inventories are likely to exceed last year’s peak level of 3,611Bcf by the
end of this year’s injection period.
Precious metals and ETF flows
After a couple of weeks of gentle sideways trading, gold prices fell back below USD
1,200/oz last week. Gold settled at USD 1,179/oz, just USD 30 above the 2015 low
set in March. This week sees a heavy concentration of central bank meetings,
including the Fed; this is likely to keep Fed rate hikes and additional USD strength in
focus as the key market drivers. So far, the latest escalation of concern over
Greece’s debt has not provided much support to gold. We would, however, expect
some safe-haven demand to re-emerge in the build-up to the next set of deadlines in
the last week in May. Despite the continuing headwinds of USD and rate-hike
expectations, we see the short-term downside below USD 1,150 as relatively limited.
We expect the prospects of a June Fed hike to recede further. We further expect
physical demand to support the market if prices move towards USD 1,100.
Figure 4: Daily commodity ETF flows over the past two
weeks (USD mn)
Figure 5: 5-day rolling average for energy flows
USD mn
Source: Bloomberg, Standard Chartered Research Source: Bloomberg, Standard Chartered Research
-250
-200
-150
-100
-50
0
50
100
150
200
24-Apr 23-Apr 22-Apr 21-Apr 20-Apr 17-Apr 16-Apr 15-Apr 14-Apr 13-Apr
Gold Base Energy
Agriculture Non-energy Broad
Combined
5-day rolling total (RHS)
Energy flows
-1,000
-500
0
500
1,000
1,500
2,000
-3,000
-2,000
-1,000
0
1,000
2,000
3,000
4,000
5,000
6,000
May-13 Aug-13 Nov-13 Feb-14 May-14 Aug-14 Nov-14 Feb-15
Gold has weakened, but we see the
short-term downside as relatively
limited
US natural gas inventories are
rising faster than last year
The y/y decline in total US oil and
gas drilling is set to exceed 50%
On the Ground
27 April 2015 6
Early indications are that Indian physical demand for gold has improved in the lead-
up to key festivals; however, the import tariff is still weighing on demand. We expect
a muted demand recovery in India until the tariff is reduced to 5% or lower. Central
bank gold buying remains strong, with the latest IMF figures showing that the large-
scale buying by Russia that characterised 2014 has continued in 2015.
Flows in gold ETFs amounted to USD 140mn, compared with US 187mn the
previous week. Energy ETF holdings, on the other hand, saw outflows for the fifth
straight week, totalling USD 292mn for the latest week. Oil outflows amounted to
USD 272mn, or 3% of AUM.

On the Ground
27 April 2015 7
CFTC trader positions
Figure 6: Money-manager positioning in commodities: What’s hot and what’s not
Money manager net length as % of OI relative to 2Y highs and lows
Source: Standard Chartered Research
Figure 7: CFTC positions for futures markets and weekly changes as of 21 April
Managed money positions All positions
Commodity Exchange Net Spec % of OI Change % of OI
2Y low %
of OI
2Y high %
of OI Open int % chg Price %chg
WTI NYMEX 259286 15.0 20730 1.2 8.1 20.5 1723025 -2.9 55.26 3.7
WTI ICE 13360 3.0 5140 1.2 -2.0 11.3 440752 -5.0 55.26 3.7
Brent NYMEX 1140 0.8 365 0.2 -10.7 12.6 149271 -6.1 62.08 6.2
Crude (combined) 273786 11.8 26235 1.1 2313048
Heating oil NYMEX -20407 -5.7 2844 0.8 -8.8 15.2 360816 -1.2 185.32 2.9
Gasoline blendstock NYMEX 24166 6.4 7619 2.0 2.8 26.7 378444 -1.9 188.81 2.8
US natural gas NYMEX -131043 -12.9 102 0.0 -12.9 14.1 1018282 -1.1 2.575 1.8
US natural gas ICE 113389 2.8 17700 0.4 1.3 20.1 4007199 0.1 2.575 1.8
Copper COMEX 13578 8.6 -701 -0.4 -18.2 27.3 157721 -4.8 5945 0.0
Gold COMEX 48125 12.1 76 0.0 2.6 35.4 397379 0.6 1202.34 0.8
Palladium NYMEX 15758 49.1 -365 -1.1 36.3 64.9 32073 1.3 769.85 0.6
Platinum NYMEX 14194 20.7 -1841 -2.7 14.7 59.4 68668 0.0 1149.4 -0.3
Silv er COMEX 10154 5.6 -11796 -6.5 -4.7 28.3 182633 2.7 16.031 -0.9 Note: Positions shown are for futures only. Due to the calculation of delta neutral hedges implicit in the futures and options data, we find the futures only data a more reliable measure.
Source: CFTC, Bloomberg, Standard Chartered Research
Heating oil
Crude oil
Natural gas
Gasoline
Copper
Palladium
Platinum
SilverGold
-100
-80
-60
-40
-20
0
20
40
60
80
100 ENERGY METALSA score of 100 on the scale would represent a commodity
where net speculative length
as a % of open interest is at its
highest over the past two years.
A score of 0 is neutral, with net
speculative length as a % of
open interest right in the middle
of its highest and lowest over the past two years.
A score of -100 indicates that
net speculative length as a % of open interest is at its lowest
over the past two years.

On the Ground
27 April 2015 8
Figure 8: NYMEX WTI prices and net positioning as % of
open interest (LHS: %, RHS: USD/bbl)
Figure 9: Heating oil prices and net positioning as % of
open interest (LHS: %, RHS: US cents/gallon)
Price
40
50
60
70
80
90
100
110
-15
-10
-5
0
5
10
15
20
25
Jan-13 Jul-13 Jan-14 Jul-14 Jan-15
Money managers as % of OI
Producers/consumers as % of OI
Price
150
200
250
300
350
-40
-30
-20
-10
0
10
20
Jan-13 Jul-13 Jan-14 Jul-14 Jan-15
Money managers as % of OI
Producers/consumers as % of OI
Source: CFTC, Standard Chartered Research Source: CFTC, Standard Chartered Research
Figure 10: Gold prices and net positioning as % of open
interest (LHS: %, RHS: USD/oz)
Figure 11: Copper prices and net positioning as % of
open interest (LHS: %, RHS: USD/t)
Price1,100
1,200
1,300
1,400
1,500
1,600
1,700
-40
-30
-20
-10
0
10
20
30
40
Jan-13 Jul-13 Jan-14 Jul-14 Jan-15
Money managers as % of OI
Producers/consumers as % of OI
Price
5,000
5,500
6,000
6,500
7,000
7,500
8,000
8,500
-50
-40
-30
-20
-10
0
10
20
30
40
Jan-13 Jul-13 Jan-14 Jul-14 Jan-15
Money managers as % of OI
Producers/consumers as % of OI
Source: CFTC, Standard Chartered Research Source: CFTC, Standard Chartered Research
Figure 12: Platinum prices and net positioning as % of
open interest (LHS: %, RHS: USD/oz)
Figure 13: Palladium prices and net positioning as % of
open interest (LHS: %, RHS: USD/oz)
Price
1,100
1,200
1,300
1,400
1,500
1,600
1,700
1,800
-80
-60
-40
-20
0
20
40
60
80
Jan-13 Jul-13 Jan-14 Jul-14 Jan-15
Money managers as % of OI
Producers/consumers as % of OI
Price
650
700
750
800
850
900
-80
-60
-40
-20
0
20
40
60
80
Jan-13 Jul-13 Jan-14 Jul-14 Jan-15
Money managers as % of OI
Producers/consumers as % of OI
Source: CFTC, Standard Chartered Research Source: CFTC, Standard Chartered Research
On the Ground
27 April 2015 9
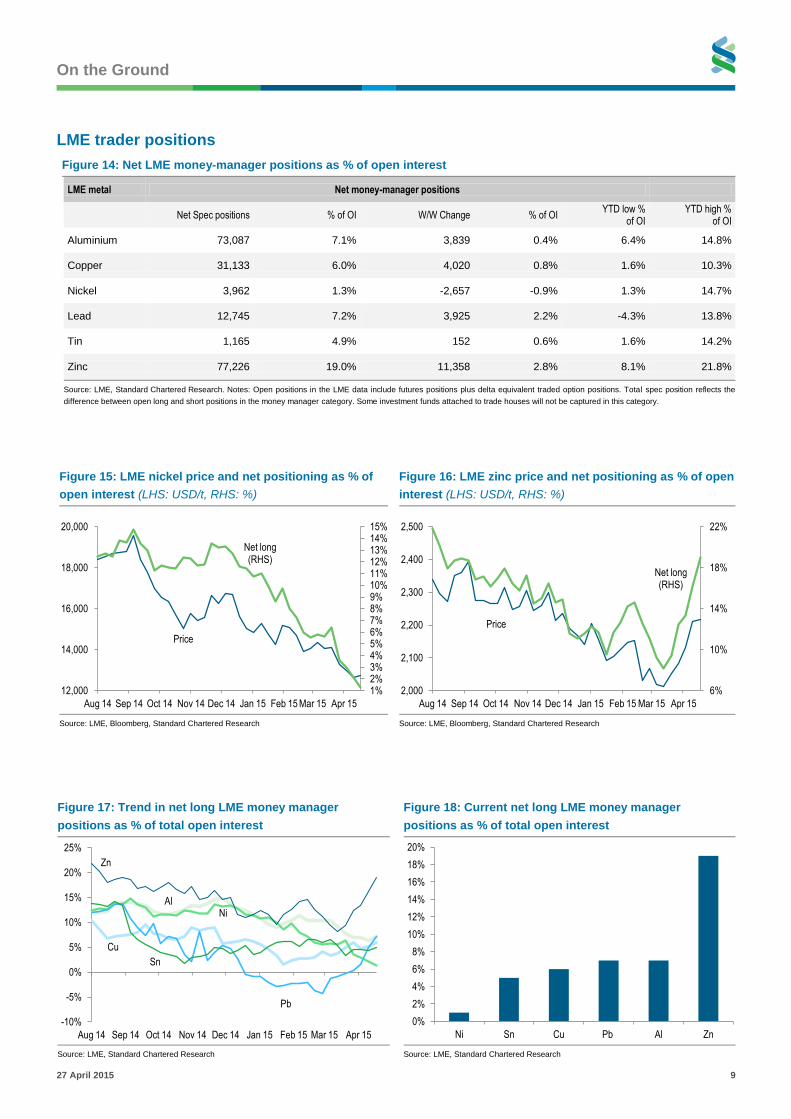
LME trader positions
Figure 14: Net LME money-manager positions as % of open interest
LME metal Net money-manager positions
Net Spec positions % of OI W/W Change % of OI YTD low %
of OI YTD high %
of OI
Aluminium 73,087 7.1% 3,839 0.4% 6.4% 14.8%
Copper 31,133 6.0% 4,020 0.8% 1.6% 10.3%
Nickel 3,962 1.3% -2,657 -0.9% 1.3% 14.7%
Lead 12,745 7.2% 3,925 2.2% -4.3% 13.8%
Tin 1,165 4.9% 152 0.6% 1.6% 14.2%
Zinc 77,226 19.0% 11,358 2.8% 8.1% 21.8%
Source: LME, Standard Chartered Research. Notes: Open positions in the LME data include futures positions plus delta equivalent traded option positions. Total spec position reflects the
difference between open long and short positions in the money manager category. Some investment funds attached to trade houses will not be captured in this category.
Figure 15: LME nickel price and net positioning as % of
open interest (LHS: USD/t, RHS: %)
Figure 16: LME zinc price and net positioning as % of open
interest (LHS: USD/t, RHS: %)
Source: LME, Bloomberg, Standard Chartered Research Source: LME, Bloomberg, Standard Chartered Research
Price
Net long (RHS)
1% 2% 3% 4% 5% 6% 7% 8% 9% 10% 11% 12% 13% 14% 15%
12,000
14,000
16,000
18,000
20,000
Aug 14 Sep 14 Oct 14 Nov 14 Dec 14 Jan 15 Feb 15 Mar 15 Apr 15
Price
Net long (RHS)
6%
10%
14%
18%
22%
2,000
2,100
2,200
2,300
2,400
2,500
Aug 14 Sep 14 Oct 14 Nov 14 Dec 14 Jan 15 Feb 15 Mar 15 Apr 15
Figure 17: Trend in net long LME money manager
positions as % of total open interest
Figure 18: Current net long LME money manager
positions as % of total open interest
Source: LME, Standard Chartered Research Source: LME, Standard Chartered Research
Al
Cu
Ni
Pb
Sn
Zn
-10%
-5%
0%
5%
10%
15%
20%
25%
Aug 14 Sep 14 Oct 14 Nov 14 Dec 14 Jan 15 Feb 15 Mar 15 Apr 15
0%
2%
4%
6%
8%
10%
12%
14%
16%
18%
20%
Ni Sn Cu Pb Al Zn
On the Ground
27 April 2015 10
Rig count monitor
Figure 19: Oil and gas rig counts by area for 24 April 2015
Source: Baker-Hughes, Standard Chartered Research
Rig count 32
w/w change 2
m/m change -4
y/y change -21
Hay nesv ille
Rig count 6
w/w change 0
m/m change 0
y/y change -18
Barnett
Rig count 128
w/w change -7
m/m change -20
y/y change -134
Eagle Ford
Rig count 245
w/w change -12
m/m change -45
y/y change -295
Permian
Rig count 41
w/w change 1
m/m change 1
y/y change 18
Cana Woodford
Rig count 18
w/w change 1
m/m change -6
y/y change -46
Granite Wash
Rig count 29
w/w change -2
m/m change -14
y/y change -45
Mississippian
Rig count 49
w/w change 1
m/m change -4
y/y change -48
Niobrara
Rig count 83
w/w change 0
m/m change -1
y/y change -18
Marcellus Shale
Rig count 12
w/w change 0
m/m change -4
y/y change -10
Utica
Rig count 79
w/w change -5
m/m change -18
y/y change -106
Bakken
Rig count 210
w/w change -1
m/m change -1
y/y change -206
Other US
Rig count 79
w/w change -1
m/m change -41
y/y change -89
Canada
Rig count 932 Rig count 703 Rig count 225 Rig count 4
w/w change -22 w/w change -31 w/w change 8 w/w change 1
m/m change -116 m/m change -110 m/m change -8 m/m change 2
y/y change -929 y/y change -831 y/y change -98 y/y change 0
US oil US miscUS gasTotal US

On the Ground
27 April 2015 11
Figure 20: US shale oil rig count (main four regions)
Rigs
Figure 21: Bakken shale region rig count
Rigs
400
500
600
700
800
900
1,000
1,100
1,200
Jan 13 Jul 13 Jan 14 Jul 14 Jan 15
60
80
100
120
140
160
180
200
Jan 13 Jul 13 Jan 14 Jul 14 Jan 15 Source: Baker-Hughes, Standard Chartered Research Source: Baker-Hughes, Standard Chartered Research
Figure 22: US oil rig count
Rigs
Figure 23: US gas rig count
Rigs
600
800
1,000
1,200
1,400
1,600
1,800
Jan 13 Jul 13 Jan 14 Jul 14 Jan 15
200
250
300
350
400
450
Jan 13 Jul 13 Jan 14 Jul 14 Jan 15 Source: Baker-Hughes, Standard Chartered Research Source: Baker-Hughes, Standard Chartered Research
Figure 24: Texas oil rig count
Rigs
Figure 25: Horizontal oil drilling rig count
Rigs
300
400
500
600
700
800
900
Jan 13 Jul 13 Jan 14 Jul 14 Jan 15
500
600
700
800
900
1,000
1,100
1,200
Jan 13 Jul 13 Jan 14 Jul 14 Jan 15 Source: Baker-Hughes, Standard Chartered Research Source: Baker-Hughes, Standard Chartered Research

On the Ground
27 April 2015 12
Forecasts and consensus
Figure 26: Brent crude oil
USD/bbl
Figure 27: Copper
USD/t
History
Market curve
Our forecast
ConsensusHist qtr avg
40
50
60
70
80
90
100
110
120
Jan-13 Jul-13 Jan-14 Jul-14 Jan-15 Jul-15 Jan-16
Curr qtr avg
History
Market curve
Our forecast
Consensus
Hist qtr avg
5,000
5,500
6,000
6,500
7,000
7,500
8,000
8,500
Jan-13 Jul-13 Jan-14 Jul-14 Jan-15 Jul-15 Jan-16
Curr qtr avg
Source: Bloomberg, Standard Chartered Research Source: Bloomberg, Standard Chartered Research
Figure 28: Gold
USD/oz
Figure 29: Aluminium
USD/t
History
Market curve
Our forecast
Consensus
Hist qtr avg
1,100
1,200
1,300
1,400
1,500
1,600
1,700
Jan-13 Jul-13 Jan-14 Jul-14 Jan-15 Jul-15 Jan-16
Curr qtr avg
History
Market curve
Our forecast
Consensus
Hist qtr avg
1,600
1,700
1,800
1,900
2,000
2,100
2,200
2,300
2,400
Jan-13 Jul-13 Jan-14 Jul-14 Jan-15 Jul-15 Jan-16
Curr qtr avg
Source: Bloomberg, Standard Chartered Research Source: Bloomberg, Standard Chartered Research
Figure 30: Platinum
USD/oz
Figure 31: Palladium
USD/oz
History
Market curve
Our forecast
Consensus
Hist qtr avg
1,000
1,100
1,200
1,300
1,400
1,500
1,600
1,700
Jan-13 Jul-13 Jan-14 Jul-14 Jan-15 Jul-15 Jan-16
Curr qtr avg
History Market curve
Our forecast
Consensus
Hist qtr avg
650
700
750
800
850
900
Jan-13 Jul-13 Jan-14 Jul-14 Jan-15 Jul-15 Jan-16
Curr qtr avg
Source: Bloomberg, Standard Chartered Research Source: Bloomberg, Standard Chartered Research

On the Ground
27 April 2015 13
Figure 32: WTI crude oil
USD/bbl
Figure 33: Nickel
USD/t
History
Market curve
Our forecast
Consensus
Hist qtr avg
40
50
60
70
80
90
100
110
Jan-13 Jul-13 Jan-14 Jul-14 Jan-15 Jul-15 Jan-16
Curr qtr avg
History
Market curve
Our forecast
ConsensusHist qtr avg
12,000
14,000
16,000
18,000
20,000
22,000
24,000
26,000
Jan-13 Jul-13 Jan-14 Jul-14 Jan-15 Jul-15 Jan-16
Curr qtr avg
Source: Bloomberg, Standard Chartered Research Source: Bloomberg, Standard Chartered Research
Figure 34: Lead
USD/t
Figure 35: Zinc
USD/t
History
Market curve
Our forecast
Consensus
Hist qtr avg
1,700
1,800
1,900
2,000
2,100
2,200
2,300
2,400
2,500
Jan-13 Jul-13 Jan-14 Jul-14 Jan-15 Jul-15 Jan-16
Curr qtr avg
HistoryMarket curve
Our forecast
ConsensusHist qtr avg
1,800
1,900
2,000
2,100
2,200
2,300
2,400
2,500
2,600
2,700
Jan-13 Jul-13 Jan-14 Jul-14 Jan-15 Jul-15 Jan-16
Curr qtr avg
Source: Bloomberg, Standard Chartered Research Source: Bloomberg, Standard Chartered Research
Figure 36: Brent forward curves
USD/bbl
Figure 37: Brent trading range, last ten days
USD/bbl
24-Apr
2 years ago
4 years ago
One year ago 3 years ago
60
70
80
90
100
110
120
1 2 3 4 5 6years to expiry
57
58
59
60
61
62
63
64
65
66
13-Feb 14-Apr 15-Apr 16-Apr 17-Apr 20-Apr 21-Apr 22-Apr 23-Apr 24-Apr Source: ICE, Standard Chartered Research Source: ICE, Standard Chartered Research

On the Ground
27 April 2015 14
Macroeconomic forecasts
Figure 38: Standard Chartered macroeconomic forecasts
* Fiscal year starts in April in India and Kuwait, July in Bangladesh, Pakistan, and Egypt
Source: Standard Chartered Research
Country
2013 2014 2015 2016 2017 2013 2014 2015 2016 2017 2013 2014 2015 2016 2017
Asia-Pacific 6.5 6.3 6.3 6.5 - 3.6 2.8 2.5 3.0 - 1.9 2.2 2.6 2.9 -
Australia 2.1 2.7 2.6 3.2 3.1 2.5 2.5 1.2 2.1 2.0 -3.0 -1.4 -1.3 -1.2 -
Bangladesh* 6.1 6.3 6.6 6.8 6.8 7.4 6.6 7.3 7.5 7.5 0.9 0.3 0.2 0.2 -
China 7.7 7.4 7.1 7.0 6.8 2.6 2.0 2.0 2.5 3.0 2.1 2.3 2.8 2.9 2.5
Hong Kong 2.9 2.3 2.6 3.0 3.5 4.3 4.4 3.5 3.5 3.5 1.5 1.8 2.3 2.8 3.3
India* 6.9 7.4 7.7 8.0 8.0 9.5 6.6 5.4 5.0 5.0 -1.7 -0.9 -1.1 -1.5 -1.5
Indonesia 5.6 5.0 5.2 5.5 5.8 7.0 6.4 6.0 5.0 5.0 -3.2 -3.0 -2.8 -2.5 -
Japan 1.5 0.0 1.0 1.2 0.4 0.4 2.7 0.5 1.4 3.2 0.7 0.5 0.8 1.2 1.0
Malay sia 4.7 6.0 5.0 5.3 5.2 2.1 3.1 2.2 3.6 3.0 4.0 4.6 2.5 4.5 6.0
New Zealand 2.5 3.4 3.1 2.5 2.5 1.2 1.2 0.0 2.2 2.0 -3.4 -4.3 -5.0 -5.2 -
Pakistan* 3.6 3.5 4.5 4.5 5.0 7.5 8.6 7.5 8.0 8.0 -1.0 -1.2 -1.2 -2.2 -3.0
Philippines 7.2 6.1 6.0 5.7 5.8 2.9 4.2 2.2 3.5 3.3 4.2 4.4 4.2 3.6 3.0
Singapore 3.9 2.9 3.0 4.0 4.0 2.4 1.0 0.1 2.3 2.5 18.4 19.1 19.5 19.0 18.5
South Korea 3.0 3.3 3.2 3.4 3.3 1.3 1.3 1.3 2.2 2.5 6.1 6.4 7.2 5.8 5.0
Sri Lanka 7.3 7.4 7.8 8.0 7.8 6.9 3.4 1.8 4.5 5.0 -3.9 -3.7 -4.1 -4.1 -
Taiw an 2.2 3.7 4.3 4.0 4.0 0.8 1.2 0.8 1.4 1.6 10.5 11.8 10.0 8.0 7.0
Thailand 2.9 0.7 5.1 5.9 5.5 2.2 1.9 0.5 2.5 3.1 -0.4 3.8 2.1 0.5 -0.1
Vietnam 5.4 5.8 6.0 6.2 6.4 6.6 4.1 3.4 4.5 5.0 3.0 4.5 5.0 5.5 6.0
Africa 5.3 4.7 4.0 5.1 - 7.3 7.3 7.5 8.1 - -0.8 -0.7 -1.6 -3.7 -
Angola 6.0 4.0 3.0 6.5 6.3 8.5 8.0 9.5 8.5 7.0 8.0 3.0 -4.0 -2.0 -
Botsw ana 5.8 4.4 5.1 4.8 - 5.3 4.4 3.0 4.8 - -1.8 5.7 4.1 2.1 -
Cameroon 4.7 5.0 5.0 5.0 5.3 3.0 2.5 2.7 2.5 2.5 -3.8 -4.2 -4.5 -4.0 -
Côte d’lv oire 8.0 8.0 8.0 7.0 7.0 3.2 2.5 2.5 2.5 2.0 -2.5 -3.0 -3.2 -3.0 -
The Gambia 6.3 -1.4 3.0 5.5 6.0 5.2 5.7 6.0 6.0 6.0 -9.3 -15.6 -15.2 -15.3 -14.0
Ghana 7.3 4.2 3.9 5.8 6.5 11.7 15.5 15.0 11.7 13.0 -11.9 -9.2 -9.5 -9.0 -
Keny a 5.6 5.4 6.0 6.3 - 5.7 6.9 5.3 6.8 - -8.9 -8.6 -7.3 -7.1 -
Nigeria 6.7 6.2 4.5 5.5 5.8 8.5 8.1 9.4 9.7 7.6 4.0 1.8 -1.5 -2.0 -
Sierra Leone 20.1 4.0 -2.0 5.2 11.0 9.8 7.2 7.0 8.0 8.5 -10.4 -11.1 -9.4 -8.7 -
South Africa 1.9 1.5 2.0 2.7 3.0 5.8 6.1 4.3 5.7 5.4 -6.3 -5.4 -5.0 -4.8 -
Tanzania 6.8 7.2 6.9 7.1 - 8.0 6.1 4.4 7.2 - -13.5 -14.5 -12.9 -11.8 -
Uganda 5.7 6.0 6.2 6.5 - 5.4 4.3 3.5 7.8 - -12.0 -9.7 -10.5 -11.0 -
Zambia 6.0 6.0 5.5 6.2 - 7.0 7.8 7.5 8.1 - -3.7 -1.7 -2.2 -2.5 -
Middle East 3.8 3.7 3.2 3.9 - 4.5 5.8 5.1 5.5 - 11.3 9.1 9.0 4.4 -
Bahrain 5.3 4.5 3.0 4.0 4.5 3.3 2.5 2.5 2.6 3.0 7.8 7.0 1.0 2.0 -
Egy pt* 2.1 3.5 4.5 4.0 4.0 7.0 9.0 9.0 10.0 11.0 -2.7 -0.5 -2.0 -2.0 -1.5
Iraq 4.5 3.5 4.5 6.0 7.0 1.9 2.5 4.0 5.5 5.5 5.0 8.0 5.0 7.0 -
Jordan 2.9 3.5 4.0 4.2 4.5 5.6 3.5 3.5 4.0 4.0 -9.7 -8.0 -6.0 -5.5 -5.0
Kuw ait* -0.5 3.5 4.0 3.8 3.5 2.7 3.7 3.6 3.5 2.5 40.5 30.0 10.0 15.0 12.0
Lebanon 1.5 1.8 2.2 3.5 4.0 3.2 2.1 2.7 3.0 3.0 -12.8 -12.5 -11.0 -10.0 -
Oman 4.8 4.0 3.5 4.0 4.0 1.2 3.5 2.6 3.0 2.5 11.9 7.0 3.5 5.5 6.0
Qatar 6.1 5.5 5.4 5.5 4.5 3.1 3.5 4.2 4.5 3.5 29.2 25.0 26.0 27.0 28.0
Saudi Arabia 3.8 4.5 1.8 2.3 3.1 3.5 4.0 3.5 4.1 3.5 17.4 18.7 7.5 8.2 8.8
Turkey 4.1 2.8 3.5 4.5 4.5 7.5 8.9 6.8 7.0 7.0 -8.0 -5.8 -5.2 -6.5 -
UAE 4.8 4.5 3.8 3.9 4.2 1.1 4.2 4.1 4.0 3.8 14.9 15.0 12.0 13.5 14.0
Latin America 1.4 0.6 1.7 2.4 - 7.5 10.1 9.4 7.2 - -1.8 -2.9 -3.1 -3.2 -
Argentina 2.5 -2.0 -1.5 1.8 4.0 28.0 50.0 40.0 30.0 30.0 -0.8 -1.0 -1.2 -1.5 -
Brazil 2.5 0.0 -0.8 1.3 2.5 5.9 6.5 8.2 5.6 5.5 -3.7 -4.2 -4.0 -3.7 -2.6
Chile 4.2 1.8 2.7 3.2 4.5 3.0 4.9 3.0 3.0 3.5 -3.4 -1.8 -2.2 -2.0 -
Colombia 4.3 4.8 3.5 3.2 4.0 1.9 3.7 3.6 3.7 3.6 -3.5 -4.0 -5.5 -5.2 -
Mex ico 1.1 2.1 2.5 3.2 4.0 4.0 4.0 3.6 3.8 3.0 -1.8 -1.8 -2.1 -2.0 -2.4
Peru 5.5 2.4 4.0 5.0 5.5 2.9 3.1 2.9 2.7 3.1 -4.4 -4.1 -3.9 -4.6 -
Europe/N. America
Euro area -0.4 0.9 1.5 2.1 1.9 1.3 0.4 0.2 1.7 1.3 2.3 2.8 3.1 2.9 -
Sw itzerland 2.0 2.0 0.6 1.7 2.0 0.1 0.0 -1.0 0.3 1.0 13.5 11.5 9.0 10.0 -
UK 1.8 2.8 2.8 2.2 2.0 2.6 1.5 0.7 1.9 2.0 -4.4 -5.0 -4.7 -4.0 -3.7
Canada 2.0 2.5 0.8 0.8 2.0 0.9 1.9 0.4 1.2 1.8 -3.0 -2.2 -1.8 -1.8 -2.0
US 2.2 2.4 2.6 2.3 2.1 1.3 1.4 1.4 1.7 1.9 -2.4 -2.4 -2.4 -2.3 -2.3
Global 2.7 3.0 3.2 3.4 - 2.6 2.6 2.2 2.7 -
Real GDP growth (%) Inflation (yearly average %) Current account (% of GDP)
On the Ground
27 April 2015 15
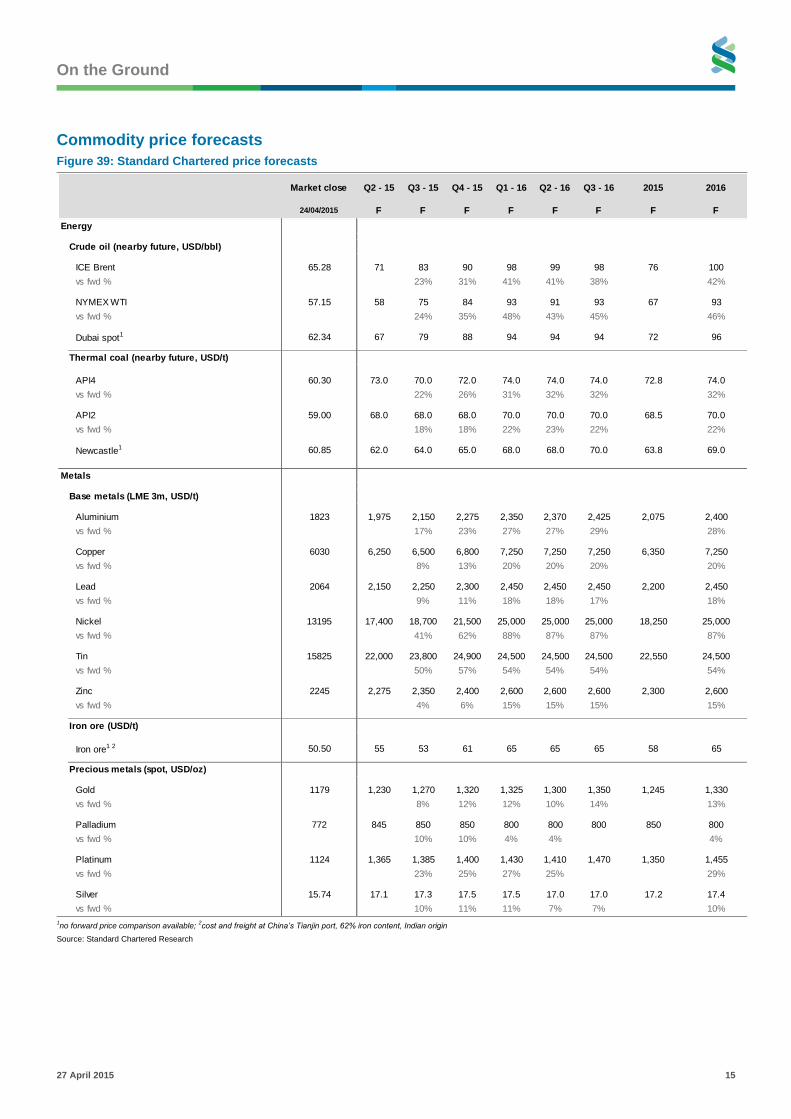
Commodity price forecasts
Figure 39: Standard Chartered price forecasts
1no forward price comparison available;
2cost and freight at China’s Tianjin port, 62% iron content, Indian origin
Source: Standard Chartered Research
Market close Q2 - 15 Q3 - 15 Q4 - 15 Q1 - 16 Q2 - 16 Q3 - 16 2015 2016
24/04/2015 F F F F F F F F
Crude oil (nearby future, USD/bbl)
ICE Brent 65.28 71 83 90 98 99 98 76 100
vs fwd % 23% 31% 41% 41% 38% 42%
NYMEX WTI 57.15 58 75 84 93 91 93 67 93
vs fwd % 24% 35% 48% 43% 45% 46%
Dubai spot1 62.34 67 79 88 94 94 94 72 96
Thermal coal (nearby future, USD/t)
API4 60.30 73.0 70.0 72.0 74.0 74.0 74.0 72.8 74.0
vs fwd % 22% 26% 31% 32% 32% 32%
API2 59.00 68.0 68.0 68.0 70.0 70.0 70.0 68.5 70.0
vs fwd % 18% 18% 22% 23% 22% 22%
Newcastle1 60.85 62.0 64.0 65.0 68.0 68.0 70.0 63.8 69.0
Base metals (LME 3m, USD/t)
Aluminium 1823 1,975 2,150 2,275 2,350 2,370 2,425 2,075 2,400
vs fwd % 17% 23% 27% 27% 29% 28%
Copper 6030 6,250 6,500 6,800 7,250 7,250 7,250 6,350 7,250
vs fwd % 8% 13% 20% 20% 20% 20%
Lead 2064 2,150 2,250 2,300 2,450 2,450 2,450 2,200 2,450
vs fwd % 9% 11% 18% 18% 17% 18%
Nickel 13195 17,400 18,700 21,500 25,000 25,000 25,000 18,250 25,000
vs fwd % 41% 62% 88% 87% 87% 87%
Tin 15825 22,000 23,800 24,900 24,500 24,500 24,500 22,550 24,500
vs fwd % 50% 57% 54% 54% 54% 54%
Zinc 2245 2,275 2,350 2,400 2,600 2,600 2,600 2,300 2,600
vs fwd % 4% 6% 15% 15% 15% 15%
Iron ore (USD/t)
Iron ore1 2 50.50 55 53 61 65 65 65 58 65
Precious metals (spot, USD/oz)
Gold 1179 1,230 1,270 1,320 1,325 1,300 1,350 1,245 1,330
vs fwd % 8% 12% 12% 10% 14% 13%
Palladium 772 845 850 850 800 800 800 850 800
vs fwd % 10% 10% 4% 4% 4%
Platinum 1124 1,365 1,385 1,400 1,430 1,410 1,470 1,350 1,455
vs fwd % 23% 25% 27% 25% 29%
Silver 15.74 17.1 17.3 17.5 17.5 17.0 17.0 17.2 17.4
vs fwd % 10% 11% 11% 7% 7% 10%
Energy
Metals

On the Ground
27 April 2015 16
Disclosures appendix
Analyst Certification Disclosure: The research analyst or analysts responsible for the content of this research report certify that: (1) the views expressed and attributed to the research analyst or analysts in the research report accurately reflect their personal opinion(s) about the subject securities and issuers and/or other subject matter as appropriate; and, (2) no part of his or her compensation was, is or will be directly or indirectly related to the specific recommendations or views contained in this research report. On a general basis, the efficacy of recommendations is a factor in the performance appraisals of analysts. Global Disclaimer: Standard Chartered Bank and/or its affiliates (“SCB”) makes no representation or warranty of any kind, express, implied or statutory regarding this document or any information contained or referred to in the document. The information in this document is provided for information purposes only. It does not constitute any offer, recommendation or solicitation to any person to enter into any transaction or adopt any hedging, trading or investment strategy, nor does it constitute any prediction of likely future movements in rates or prices, or represent that any such future movements will not exceed those shown in any illustration. The stated price of the securities mentioned herein, if any, is as of the date indicated and is not any representation that any transaction can be effected at this price. While reasonable care has been taken in preparing this document, no responsibility or liability is accepted for errors of fact or for any opinion expressed herein. The contents of this document may not be suitable for all investors as it has not been prepared with regard to the specific investment objectives or financial situation of any particular person. Any investments discussed may not be suitable for all investors. Users of this document should seek professional advice regarding the appropriateness of investing in any securities, financial instruments or investment strategies referred to in this document and should understand that statements regarding future prospects may not be realised. Opinions, forecasts, assumptions, estimates, derived valuations, projections and price target(s), if any, contained in this document are as of the date indicated and are subject to change at any time without prior notice. Our recommendations are under constant review. The value and income of any of the securities or financial instruments mentioned in this document can fall as well as rise and an investor may get back less than invested. Future returns are not guaranteed, and a loss of original capital may be incurred. Foreign-currency denominated securities and financial instruments are subject to fluctuation in exchange rates that could have a positive or adverse effect on the value, price or income of such securities and financial instruments. Past performance is not indicative of comparable future results and no representation or warranty is made regarding future performance. While we endeavour to update on a reasonable basis the information and opinions contained herein, there may be regulatory, compliance or other reasons that prevent us from doing so. Accordingly, information may be available to us which is not reflected in this material, and we may have acted upon or used the information prior to or immediately following its publication. SCB is not a legal or tax adviser, and is not purporting to provide legal or tax advice. Independent legal and/or tax advice should be sought for any queries relating to the legal or tax implications of any investment. SCB and/or its affiliates may have a position in any of the securities, instruments or currencies mentioned in this document. SCB and/or its affiliates or its respective officers, directors, employee benefit programmes or employees, including persons involved in the preparation or issuance of this document may at any time, to the extent permitted by applicable law and/or regulation, be long or short any securities or financial instruments referred to in this document and on the SCB Research website or have a material interest in any such securities or related investments, or may be the only market maker in relation to such investments, or provide, or have provided advice, investment banking or other services, to issuers of such investments. SCB has in place policies and procedures and physical information walls between its Research Department and differing public and private business functions to help ensure confidential information, including ‘inside’ information is not disclosed unless in line with its policies and procedures and the rules of its regulators. Data, opinions and other information appearing herein may have been obtained from public sources. SCB makes no representation or warranty as to the accuracy or completeness of such information obtained from public sources. SCB also makes no representation or warranty as to the accuracy nor responsible for any information or data contains on any third party’s website. You are advised to make your own independent judgment (with the advice of your professional advisers as necessary) with respect to any matter contained herein and not rely on this document as the basis for making any trading, hedging or investment decision. SCB accepts no liability and will not be liable for any loss or damage arising directly or indirectly (including special, incidental, consequential, punitive or exemplary damages) from the use of this document, howsoever arising, and including any loss, damage or expense arising from, but not limited to, any defect, error, imperfection, fault, mistake or inaccuracy with this document, its contents or associated services, or due to any unavailability of the document or any part thereof or any contents or associated services. This material is for the use of intended recipients only and, in any jurisdiction in which distribution to private/retail customers would require registration or licensing of the distributor which the distributor does not currently have, this document is intended solely for distribution to professional and institutional investors. Country-Specific Disclosures – If you are receiving this document in any of the countries listed below, please note the following: United Kingdom and European Economic Area: SCB is authorised in the United Kingdom by the Prudential Regulation Authority and regulated by the Financial Conduct Authority and the Prudential Regulation Authority. This communication is not directed at Retail Clients in the European Economic Area as defined by Directive 2004/39/EC. Nothing in this document constitutes a personal recommendation or investment advice as defined by Directive 2004/39/EC. Australia: The Australian Financial Services Licence for Standard Chartered Bank is Licence No: 246833 with the following Australian Registered Business Number (ARBN: 097571778). Australian investors should note that this communication was prepared for “wholesale clients” only and is not directed at persons who are “retail clients” as those terms are defined in sections 761G and 761GA of the Corporations Act 2001 (Cth). Bangladesh: This research has not been produced in Bangladesh. The report has been prepared by the research analyst(s) in an autonomous and independent way, including in relation to SCB. THE SECURITIES MENTIONED IN THIS REPORT HAVE NOT BEEN AND WILL NOT BE REGISTERED IN BANGLADESH AND MAY NOT BE OFFERED OR SOLD IN BANGLADESH WITHOUT PRIOR APPROVAL OF THE REGULATORY AUTHORITIES IN BANGLADESH. Botswana: This document is being distributed in Botswana by, and is attributable to, Standard Chartered Bank Botswana Limited which is a financial institution licensed under the Section 6 of the Banking Act CAP 46.04 and is listed in the Botswana Stock Exchange. Brazil: SCB disclosures pursuant to the Securities Exchange Commission of Brazil (“CVM”) Instruction 483/10: This research has not been produced in Brazil. The report has been prepared by the research analyst(s) in an autonomous and independent way, including in relation to SCB. THE SECURITIES MENTIONED IN THIS REPORT HAVE NOT BEEN AND WILL NOT BE REGISTERED PURSUANT TO THE REQUIREMENTS OF THE SECURITIES AND EXCHANGE COMMISSION OF BRAZIL AND MAY NOT BE OFFERED OR SOLD IN BRAZIL EXCEPT PURSUANT TO AN APPLICABLE EXEMPTION FROM THE REGISTRATION REQUIREMENTS AND IN COMPLIANCE WITH THE SECURITIES LAWS OF BRAZIL. China: This document is being distributed in China by, and is attributable to, Standard Chartered Bank (China) Limited which is mainly regulated by China Banking Regulatory Commission (CBRC), State Administration of Foreign Exchange (SAFE), and People’s Bank of China (PBoC). Germany: In Germany, this document is being distributed by Standard Chartered Bank Germany Branch which is also regulated by the Bundesanstalt für Finanzdienstleistungsaufsicht (BaFin). Hong Kong: This document, except for any portion advising on or facilitating any decision on futures contracts trading, is being distributed in Hong Kong by, and is attributable to, Standard Chartered Bank (Hong Kong) Limited 渣打銀行(香港)有限公司 which is regulated by the Hong Kong Monetary Authority. India: This document is being distributed in India by Standard Chartered Bank, India Branch (“SCB India”). The particulars contained in this document are for information purposes only. This document does not constitute an offer, recommendation or solicitation to any person to execute any transaction with SCB India. Certain information or trade ideas in this document may not be specifically permissible under Indian regulations; hence, users of this document should seek professional legal advice before acting on any information. Indonesia: The information in this document is provided for information purposes only. It does not constitute any offer, recommendation or solicitation to any person to enter into any transaction or adopt any hedging, trading or investment strategy, nor does it constitute any prediction of likely future movements in rates or prices or represent that any such future movements will not exceed those shown in any illustration. Japan: This document is being distributed to Specified Investors, as defined by the Financial Instruments and Exchange Law of Japan (FIEL), for information only and not for the purpose of soliciting any Financial Instruments Transactions as defined by the FIEL or any Specified Deposits, etc. as defined by the Banking Law of Japan. Kenya: Standard Chartered Bank Kenya Limited is regulated by the Central Bank of Kenya. This document is intended for use only by Professional Clients and should not be relied upon by or be distributed to Retail Clients. Macau: This document is being distributed in Macau Special Administrative Region of the Peoples' Republic of China, and is attributable to, Standard Chartered Bank (Macau Branch) which is regulated by Macau Monetary Authority. Malaysia: This document is being distributed in Malaysia by Standard Chartered Bank Malaysia Berhad only to institutional investors or corporate customers. Recipients in Malaysia should contact Standard Chartered Bank Malaysia Berhad in relation to any matters arising from, or in connection with, this document. New Zealand: New Zealand Investors should note that this document was prepared for “wholesale clients” only within the meaning of section 5C of the Financial Advisers Act 2008. This document is not directed at persons who are “retail clients” as defined in the Financial Advisers Act 2008. This document does not form part of any offer to the public in New Zealand. NOTE THAT SCB IS NOT A “REGISTERED BANK” IN NEW ZEALAND UNDER THE RESERVE BANK OF NEW ZEALAND ACT 1989. Philippines: This document may be distributed in the Philippines by, and is attributable to, Standard Chartered Bank (Philippines) which is regulated by the Bangko Sentral ng Pilipinas. This document is for information purposes only and does not offer, sell, offer to sell or distribute securities in the Philippines that are not registered with the Securities and Exchange Commission unless such offer or sale qualifies as an exempt transaction under Section 10 of the Securities Regulation Code. Singapore: This document is being distributed in Singapore by SCB Singapore branch, only to accredited investors, expert investors or institutional investors, as defined in the Securities and Futures Act, Chapter 289 of Singapore. Recipients in Singapore should contact SCB Singapore branch in relation to any matters arising from, or in connection with, this document. South Africa: SCB is licensed as a Financial Services Provider in terms of Section 8 of the Financial Advisory and Intermediary Services Act 37 of 2002. SCB is a Registered Credit Provider in terms of the National Credit Act 34 of 2005 under registration number NCRCP4. Thailand: This document is intended to circulate only general information and prepare exclusively for the benefit of Institutional Investors with the conditions and as defined in the Notifications of the Office of the Securities and Exchange Commission relating to the exemption of investment advisory service, as amended and supplemented from time to time. It is not intended to provide for the public. UAE (DIFC): SCB is regulated in the Dubai International Financial Centre by the Dubai Financial Services Authority. This document is intended for use only by Professional Clients and should not be relied upon by or be distributed to Retail Clients. United States: Except for any documents relating to foreign exchange, FX or global FX, Rates or Commodities, distribution of this document in the United States or to US persons is intended to be solely to major institutional investors as defined in Rule 15a-6(a)(2) under the US Securities Exchange Act of 1934. All US persons that receive this document by their acceptance thereof represent and agree that they are a major institutional investor and understand the risks involved in executing transactions in securities. Any US recipient of this document wanting additional information or to effect any transaction in any security or financial instrument mentioned herein, must do so by contacting a registered representative of Standard Chartered Securities (North America) Inc., 1095 Avenue of the Americas, New York, N.Y. 10036, US, tel + 1 212 667 0700. WE DO NOT OFFER OR SELL SECURITIES TO U.S. PERSONS UNLESS EITHER (A) THOSE SECURITIES ARE REGISTERED FOR SALE WITH THE U.S. SECURITIES AND EXCHANGE COMMISSION AND WITH ALL APPROPRIATE U.S. STATE AUTHORITIES; OR (B) THE SECURITIES OR THE SPECIFIC TRANSACTION QUALIFY FOR AN EXEMPTION UNDER THE U.S. FEDERAL AND STATE SECURITIES LAWS NOR DO WE OFFER OR SELL SECURITIES TO U.S. PERSONS UNLESS (i) WE, OUR AFFILIATED COMPANY AND THE APPROPRIATE PERSONNEL ARE PROPERLY REGISTERED OR LICENSED TO CONDUCT BUSINESS; OR (ii) WE, OUR AFFILIATED COMPANY AND THE APPROPRIATE PERSONNEL QUALIFY FOR EXEMPTIONS UNDER APPLICABLE U.S. FEDERAL AND STATE LAWS. © Copyright 2015 Standard Chartered Bank and its affiliates. All rights reserved. All copyrights subsisting and arising out of all materials, text, articles and information contained herein is the property of Standard Chartered Bank and/or its affiliates, and may not be reproduced, redistributed, amended, modified, adapted, transmitted in any form, or translated in any way without the prior written permission of Standard Chartered Bank.
Document approved by
Paul Horsnell Head, Commodities Research
Document is released at
15:46 GMT 27 April 2015