+ healthcare presented by: kristen w., michelle q., ronald b., diana m.,& vanessa c. +
TRANSCRIPT

+
HEALTHCARE
Presented By: Kristen W., Michelle Q., Ronald B., Diana M.,& Vanessa C.
+
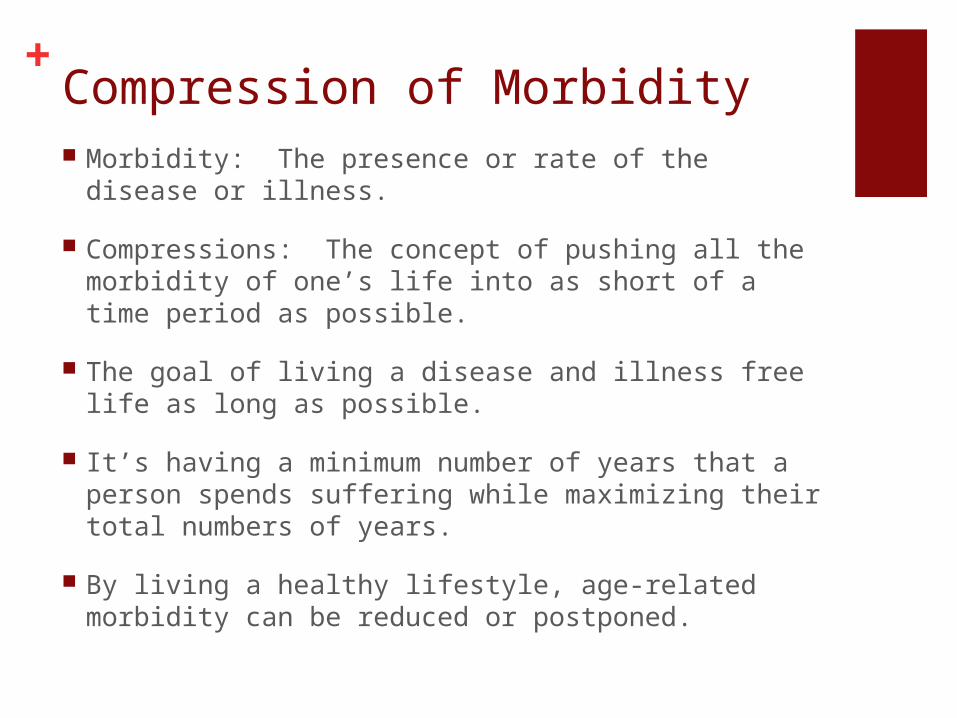
+Compression of Morbidity Morbidity: The presence or rate of the disease or
illness.
Compressions: The concept of pushing all the morbidity of one’s life into as short of a time period as possible.
The goal of living a disease and illness free life as long as possible.
It’s having a minimum number of years that a person spends suffering while maximizing their total numbers of years.
By living a healthy lifestyle, age-related morbidity can be reduced or postponed.
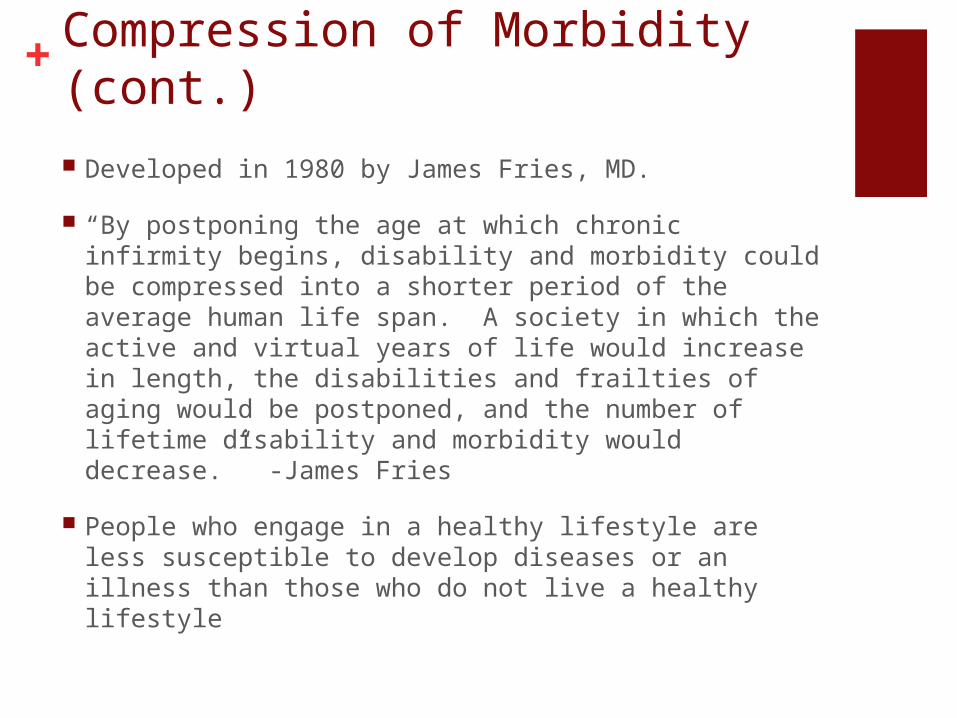
+Compression of Morbidity (cont.) Developed in 1980 by James Fries, MD.
“By postponing the age at which chronic infirmity begins, disability and morbidity could be compressed into a shorter period of the average human life span. A society in which the active and virtual years of life would increase in length, the disabilities and frailties of aging would be postponed, and the number of lifetime disability and morbidity would decrease.” -James Fries
People who engage in a healthy lifestyle are less susceptible to develop diseases or an illness than those who do not live a healthy lifestyle

+ How does healthcare impact compression of morbidity?
*Healthcare allows access to medical services that help prolong life.*

+How does healthcare impact compression of morbidity? (cont.)
Medical Services – For acute and chronic illnesses (to cure, slow progression, and/or relieve symptoms) Rx Drugs Surgery Therapy Specialized Care
Those without access to healthcare (not government-funded or cannot afford it) are at risk of developing illness and diseases that may have been prevented or treated easily/quickly. This leads to more costly ER trips that can force a person into bankruptcy or even more costly, death.

+Overview of the Canadian
health care system
National Health insurance program offered as “Medicare” prepaid basis.
Canada Health Act- values of equity and solidarity.
Roles and Responsibilities are shared between the federal and provincial-territorial governments.
Fund Services in the form of fiscal transfers.
Health Care includes services such as physicians and other health professionals, and care in hospitals.
All necessary drug therapy administered within the Canadian hospital setting is insured and publicly funded.

+
Provincial/Territorial Health Insurance Card areasThe Canada Health Act separates health coverage by provinces and territories they provide some groups with supplemental health benefits not covered by the Act. The level and scope of coverage for supplemental benefits varies between jurisdictions.

+Provinces and territories
The provinces and territories of Canada combine to make up the world's second largest country. The major difference between a Canadian province and a territory is that provinces are jurisdictions that receive their power and authority directly from the Constitution Act, 1867, whereas territories derive their mandates and powers from the federal government.
Currently, the ten provinces are: Alberta, British Columbia, Manitoba, New Brunswick, Newfoundland and Labrador, Nova Scotia, Ontario, Prince Edward Island, Quebec, and Saskatchewan, while the three territories are Northwest Territories, Nunavut, and Yukon.
+Statistics Canada
10 Leading Causes of Death
Cause of death 2005 2004
2004–2005
Rank Number % Rank Number % % change
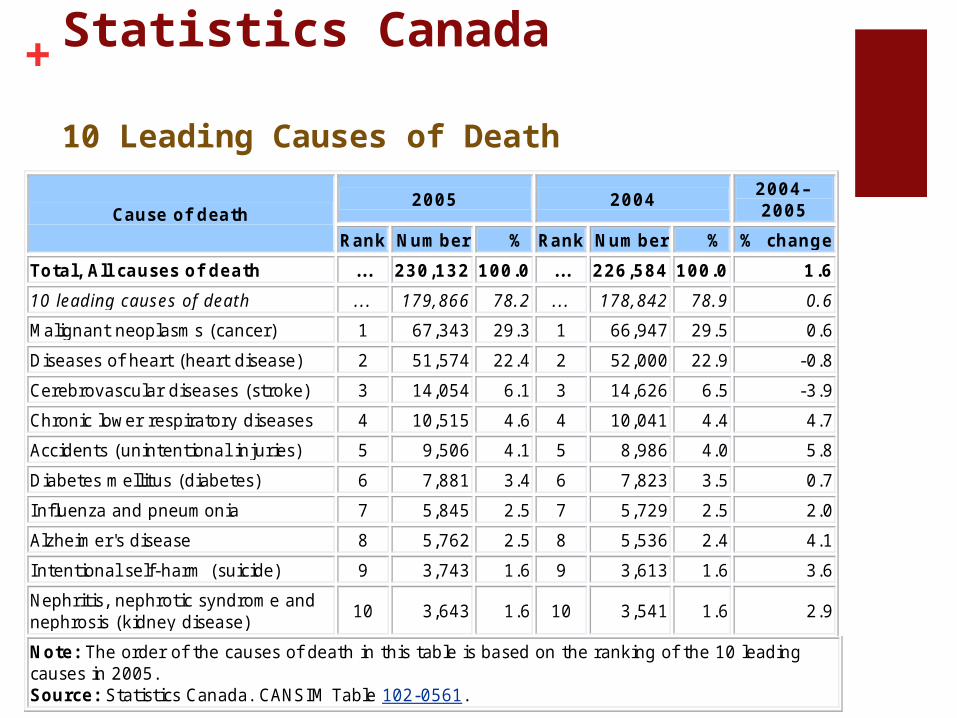
Total, All causes of death ... 230,132 100.0 ... 226,584 100.0 1.6
10 leading causes of death ... 179,866 78.2 ... 178,842 78.9 0.6
Malignant neoplasms (cancer) 1 67,343 29.3 1 66,947 29.5 0.6
Diseases of heart (heart disease) 2 51,574 22.4 2 52,000 22.9 -0.8
Cerebrovascular diseases (stroke) 3 14,054 6.1 3 14,626 6.5 -3.9
Chronic lower respiratory diseases 4 10,515 4.6 4 10,041 4.4 4.7
Accidents (unintentional injuries) 5 9,506 4.1 5 8,986 4.0 5.8
Diabetes mellitus (diabetes) 6 7,881 3.4 6 7,823 3.5 0.7
Influenza and pneumonia 7 5,845 2.5 7 5,729 2.5 2.0
Alzheimer's disease 8 5,762 2.5 8 5,536 2.4 4.1
Intentional self-harm (suicide) 9 3,743 1.6 9 3,613 1.6 3.6
Nephritis, nephrotic syndrome and nephrosis (kidney disease)
10 3,643 1.6 10 3,541 1.6 2.9
Note: The order of the causes of death in this table is based on the ranking of the 10 leading causes in 2005. Source: Statistics Canada. CANSIM Table 102-0561.
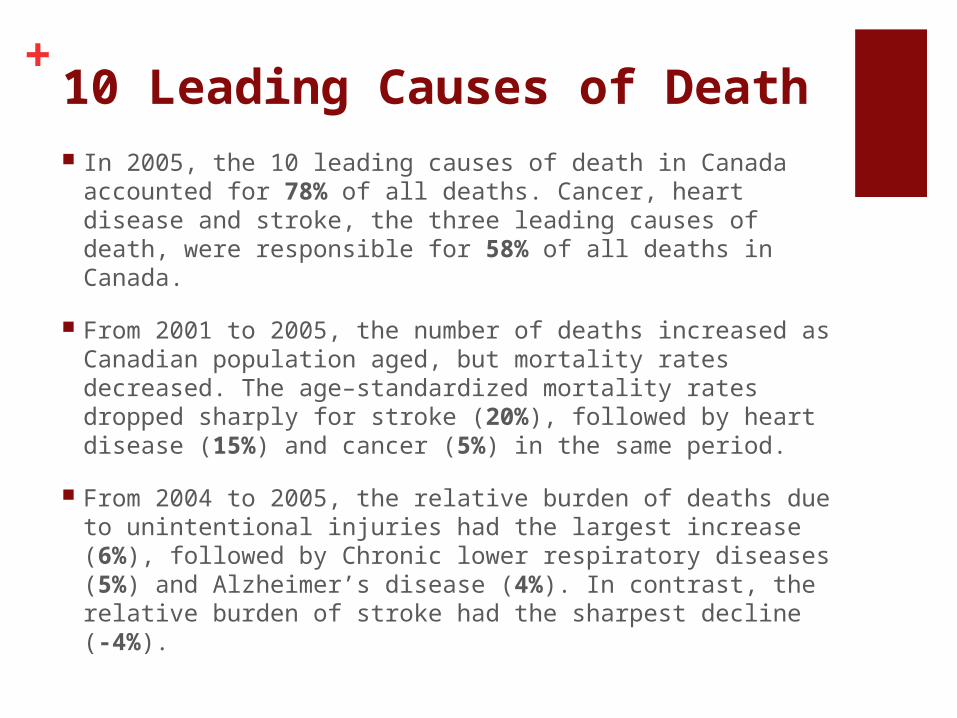
+10 Leading Causes of Death In 2005, the 10 leading causes of death in Canada
accounted for 78% of all deaths. Cancer, heart disease and stroke, the three leading causes of death, were responsible for 58% of all deaths in Canada.
From 2001 to 2005, the number of deaths increased as Canadian population aged, but mortality rates decreased. The age–standardized mortality rates
dropped sharply for stroke (20%), followed by heart disease (15%) and cancer (5%) in the same period.
From 2004 to 2005, the relative burden of deaths due to unintentional injuries had the largest increase (6%), followed by Chronic lower respiratory diseases (5%) and Alzheimer’s disease (4%). In contrast, the relative burden of stroke had the sharpest decline (-4%).
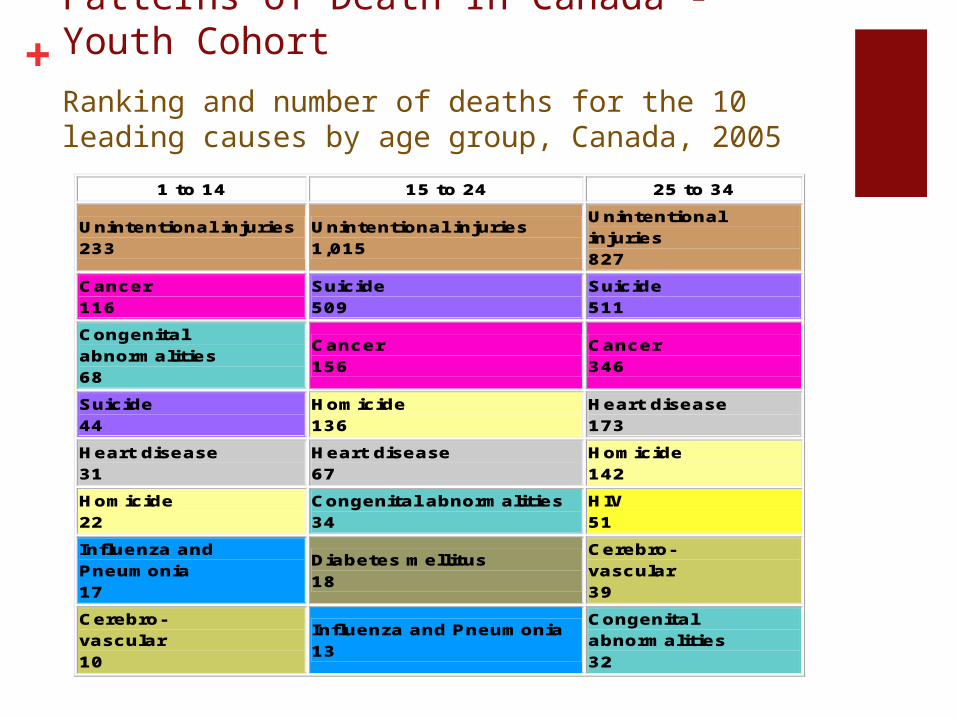
+Patterns of Death In Canada - Youth Cohort
Ranking and number of deaths for the 10 leading causes by age group, Canada, 2005
1 to 14 15 to 24 25 to 34
Unintentional injuries 233
Unintentional injuries 1,015
Unintentional injuries 827
Cancer 116
Suicide 509
Suicide 511
Congenital abnormalities 68
Cancer 156
Cancer 346
Suicide 44
Homicide 136
Heart disease 173
Heart disease 31
Heart disease 67
Homicide 142
Homicide 22
Congenital abnormalities 34
HIV 51
Influenza and Pneumonia 17
Diabetes mellitus 18
Cerebro- vascular 39
Cerebro- vascular 10
Influenza and Pneumonia 13
Congenital abnormalities 32

+Patterns of Death In Canada - Middle CohortRanking and number of deaths for the 10 leading causes by age group, Canada, 2005
35 to 44 45 to 54 55 to 64
Cancer 1,490
Cancer 5,418
Cancer 11,440
Unintentional injuries 971
Heart disease 2,154
Heart disease 4,491
Suicide 876
Unintentional injuries 1,117
Unintentional injuries 821
Heart disease 639
Suicide 883
Diabetes mellitus 816
HIV 181
Liver disease 440
Cerebro- vascular 781
Liver disease 148
Cerebro-vascular 388
Chronic lower respiratory 628
Cerebro- vascular 143
Diabetes mellitus 363
Liver disease 603
Diabetes mellitus 127
HIV 146
Suicide 460
Homicide 103
Viral Hepatitis 144
Influenza and Pneumonia 266
Influenza and Pneumonia
Influenza and Pneumonia2
Nephritis 172

+Patterns of Death In Canada - Senior Cohort Ranking and number of deaths for the 10 leading causes by age group, Canada, 2005
65 to74 75 to 84 85 and over
Cancer 17,373
Cancer 20,973
Heart disease 19,616
Heart disease 7,914
Heart disease 16,479
Cancer 10,026
Chronic lower respiratory 1,973
Cerebro- vascular 4,850
Cerebro- vascular 6,018
Cerebro- vascular 1,811
Chronic lower respiratory 4,314
Chronic lower respiratory 3,405
Diabetes mellitus 1,539
Diabetes mellitus 2,800
Alzheimer's disease 3,360
Unintentional injuries 815
Alzheimer's disease 1,992
Influenza and Pneumonia 3,106
Liver disease 610
Influenza and Pneumonia 1,688
Diabetes mellitus 2,187
Influenza and Pneumonia 526
Unintentional injuries 1,601
Unintentional injuries 2,076
Nephritis 492
Nephritis 1,312
Nephritis 1,551
Aortic aneurysm 406
Parkinson's disease 888
Hypertention 735

+
Place of residence All
deaths Deaths of 10 leading
causes % of 10 leading
causes
Canada 230,132 179,866 78.2
Newfoundland and Labrador
4,486 3,589 80.0
Prince Edward I sland 1,118 898 80.3
Nova Scotia 8,273 6,640 80.3
New Brunswick 6,175 4,903 79.4
Quebec 55,787 43,959 78.8
Ontario 85,591 67,059 78.3
Manitoba 9,856 7,613 77.2
Saskatchewan 8,850 6,870 77.6
Alberta 19,288 14,862 77.1
British Columbia 30,227 23,136 76.5
Yukon 164 140 85.4
Northwest Territories 148 102 68.9
Nunavut 115 104 90.4
Source: Statistics Canada. CANSIM Table 102-0563.
Geographic differences
Provinces and territories
+Gail’s thoughts on the Canadian Health Care system on how it affect’s older adults: It is an equitable system, providing basic health care
for all who need it through tax dollars.
Universal care with no user fees; allows access to good preventative care.
Fees for long-term residential care are calibrated to person’s income
Does not exceed 70% of their monthly income
Fees are based on income, not on assets.

+Gail’s thoughts continued…
“For older adults and anyone without extended health benefits, there is some coverage for drugs (for example, seniors without extra benefits pay for their drugs up to a limit 30% of their income, and then the government covers the rest of the costs each year).”

+How does Canada’s system contribute to the compression of morbidity?
“It is preventative health care and health promotion that makes all the difference!”
“The Canadian and the provincial governments have large scale, country-wide health promotion projects and educational campaigns about increasing exercise, healthy eating, diabetes management, aboriginal health needs, stopping smoking, etc. with the aim of helping people live longer in a healthy state. This is paying off, because the up-and-coming Baby Boomer generation is much healthier and more active in our country.”

+Challenge in Canada’s Health Care SystemNot many alternatives
As care becomes more costly, there are more and more limits on what the government will cover
Having to wait for appointments, diagnostic tests, surgeries, etc.
Limits on the numbers of acute care beds funded, which leads to premature discharge of patients
Doctors preferring private practice (more money) in other countries rather than government-funded practice (less money) in Canada
+What are the future concerns of the Canadian population due to the Compression of Morbidity?
Having enough resources (ie. acute beds, specialists, caregiver support, etc.) to care for elders in the last 6-12 months of life.
Nurses and physicians properly trained to care for older adults with co-morbidities and complexities.
“Many of these professionals prefer to work in the ‘sexier’ health care fields, eg. critical care, maternity and pediatrics, etc., rather than with old people”