sales · in part iii of this form 10-k or any amendment to this form 10-k. indicate by check mark...
TRANSCRIPT

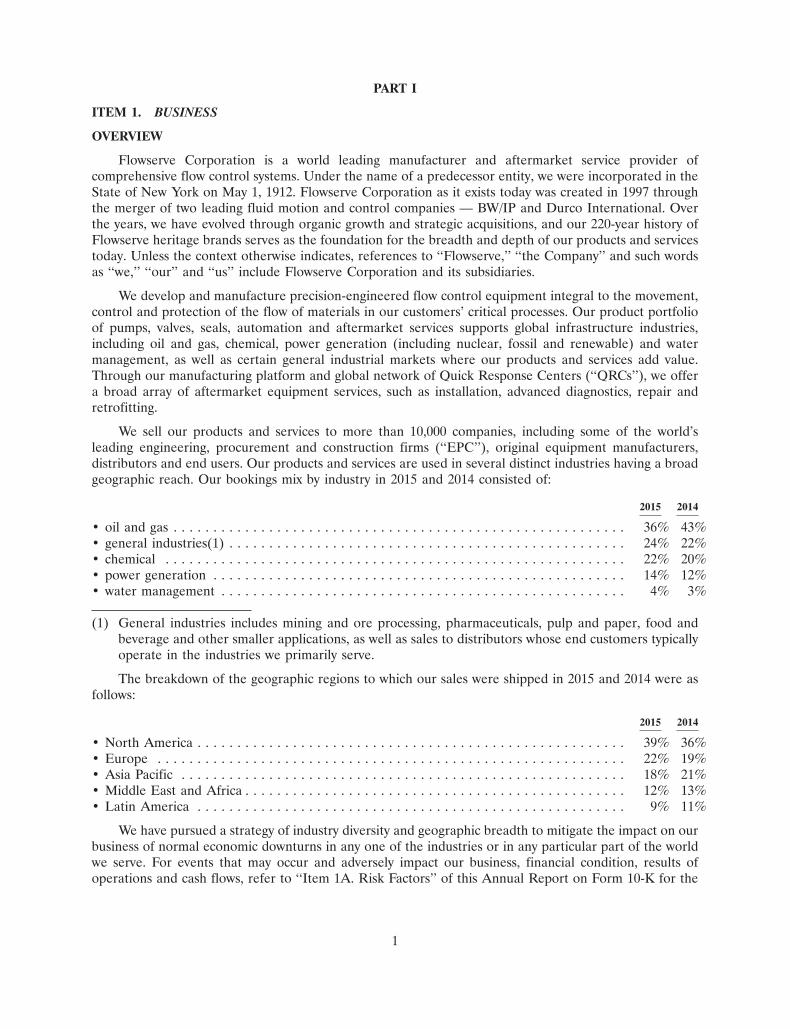
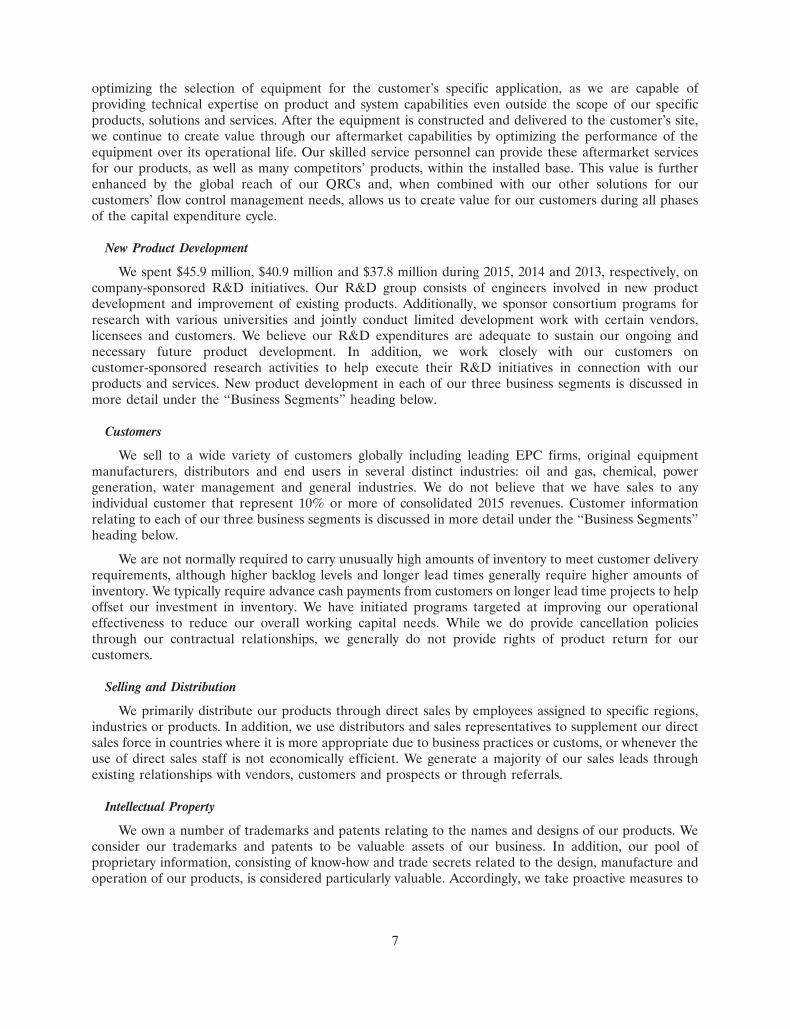
SALES in Millions
47514955 4878
4510 4561
1411 12 13 15
EARNINGS PER SHARE(a, b)
in US Dollars
2.00
2.843.41
3.76
2.55
1511 12 13 14
GROSS PROFIT in Millions
14871514
1511
15811688 1715
12 13 14
BOOKINGS in Millions
41774714 4881 5161
4662
1511 12 13 14
OPERATING INCOME in Millions
526
676760 790
619
1511 12 13 14
NET DEBT TO NET CAPITAL RATIO Percentage
24.830.8
42.9
26.6
6.9
11 12 13 14 15
UNITED STATESSECURITIES AND EXCHANGE COMMISSION
Washington, D.C. 20549
Form 10-K� ANNUAL REPORT PURSUANT TO SECTION 13 OR 15(d) OF THE
SECURITIES EXCHANGE ACT OF 1934 FOR THE FISCAL YEAR ENDEDDECEMBER 31, 2015
OR
� TRANSITION REPORT PURSUANT TO SECTION 13 OR 15(d) OF THESECURITIES EXCHANGE ACT OF 1934
Commission file number 1-13179
FLOWSERVE CORPORATION(Exact name of registrant as specified in its charter)
New York 31-0267900(State or other jurisdiction of (I.R.S. Employerincorporation or organization) Identification No.)
5215 N. O’Connor Boulevard 75039Suite 2300, Irving, Texas (Zip Code)
(Address of principal executive offices)
Registrant’s telephone number, including area code:(972) 443-6500
Securities registered pursuant to Section 12(b) of the Act:
Title of Each Class Name of Each Exchange on Which Registered
Common Stock, $1.25 Par Value New York Stock Exchange
Securities registered pursuant to Section 12(g) of the Act:None
Indicate by check mark if the registrant is a well-known seasoned issuer, as defined in Rule 405 of the SecuritiesAct. Yes � No �
Indicate by check mark if the registrant is not required to file reports pursuant to Section 13 or Section 15(d) of theAct. Yes � No �
Indicate by check mark whether the registrant (1) has filed all reports required to be filed by Section 13 or 15(d) of theSecurities Exchange Act of 1934 during the preceding 12 months (or for such shorter period that the registrant was required to filesuch reports), and (2) has been subject to such filing requirements for the past 90 days. Yes � No �
Indicate by check mark whether the registrant has submitted electronically and posted on its corporate Web site, if any, everyInteractive Data File required to be submitted and posted pursuant to Rule 405 of Regulation S-T (§ 232.405 of this chapter) duringthe preceding 12 months (or for such shorter period that the registrant was required to submit and post such files). Yes � No �
Indicate by check mark if disclosure of delinquent filers pursuant to Item 405 of Regulation S-K is not contained herein, andwill not be contained, to the best of registrant’s knowledge, in definitive proxy or information statements incorporated by referencein Part III of this Form 10-K or any amendment to this Form 10-K. �
Indicate by check mark whether the registrant is a large accelerated filer, an accelerated filer, a non-accelerated filer, or asmaller reporting company. See the definitions of ‘‘large accelerated filer,’’ ‘‘accelerated filer’’ and ‘‘smaller reporting company’’ inRule 12b-2 of the Exchange Act. (Check one):
Large accelerated filer � Accelerated filer � Non-accelerated filer � Smaller Reporting company �(Do not check if a
smaller reporting company)
Indicate by check mark whether the registrant is a shell company. Yes � No �
The aggregate market value of the common stock held by non-affiliates of the registrant, computed by reference to the closingprice of the registrant’s common stock as reported on June 30, 2015 (the last business day of the registrant’s most recently completedsecond fiscal quarter), was approximately $5,197,000,000. For purposes of the foregoing calculation only, all directors, executiveofficers and known 5% beneficial owners have been deemed affiliates.
Number of the registrant’s common shares outstanding as of February 10, 2016 was 130,069,598.
DOCUMENTS INCORPORATED BY REFERENCE
Certain information contained in the definitive proxy statement for the registrant’s 2016 Annual Meeting of Shareholdersscheduled to be held on May 19, 2016 is incorporated by reference into Part III hereof.

FLOWSERVE CORPORATIONFORM 10-K
TABLE OF CONTENTS
Page
PART IItem 1. Business . . . . . . . . . . . . . . . . . . . . . . . . . . . . . . . . . . . . . . . . . . . . . . . . . . . . . . . 1Item 1A. Risk Factors . . . . . . . . . . . . . . . . . . . . . . . . . . . . . . . . . . . . . . . . . . . . . . . . . . . . 17Item 1B. Unresolved Staff Comments . . . . . . . . . . . . . . . . . . . . . . . . . . . . . . . . . . . . . . . . 26Item 2. Properties . . . . . . . . . . . . . . . . . . . . . . . . . . . . . . . . . . . . . . . . . . . . . . . . . . . . . . 27Item 3. Legal Proceedings . . . . . . . . . . . . . . . . . . . . . . . . . . . . . . . . . . . . . . . . . . . . . . . . 27Item 4. Mine Safety Disclosures . . . . . . . . . . . . . . . . . . . . . . . . . . . . . . . . . . . . . . . . . . . 27
PART IIItem 5. Market for the Registrant’s Common Equity, Related Stockholder Matters and
Issuer Purchases of Equity Securities . . . . . . . . . . . . . . . . . . . . . . . . . . . . . . . . 28Item 6. Selected Financial Data . . . . . . . . . . . . . . . . . . . . . . . . . . . . . . . . . . . . . . . . . . . . 31Item 7. Management’s Discussion and Analysis of Financial Condition and Results of
Operations . . . . . . . . . . . . . . . . . . . . . . . . . . . . . . . . . . . . . . . . . . . . . . . . . . . 32Item 7A. Quantitative and Qualitative Disclosures About Market Risk . . . . . . . . . . . . . . . . . 60Item 8. Financial Statements and Supplementary Data . . . . . . . . . . . . . . . . . . . . . . . . . . . 62Item 9. Changes in and Disagreements with Accountants on Accounting and Financial
Disclosure . . . . . . . . . . . . . . . . . . . . . . . . . . . . . . . . . . . . . . . . . . . . . . . . . . . . 119Item 9A. Controls and Procedures . . . . . . . . . . . . . . . . . . . . . . . . . . . . . . . . . . . . . . . . . . . 119
PART IIIItem 10. Directors, Executive Officers and Corporate Governance . . . . . . . . . . . . . . . . . . . . 120Item 11. Executive Compensation . . . . . . . . . . . . . . . . . . . . . . . . . . . . . . . . . . . . . . . . . . . 120Item 12. Security Ownership of Certain Beneficial Owners and Management and Related
Stockholder Matters . . . . . . . . . . . . . . . . . . . . . . . . . . . . . . . . . . . . . . . . . . . . 120Item 13. Certain Relationships and Related Transactions, and Director Independence . . . . . 120Item 14. Principal Accounting Fees and Services . . . . . . . . . . . . . . . . . . . . . . . . . . . . . . . . 120
PART IVItem 15. Exhibits, Financial Statement Schedules . . . . . . . . . . . . . . . . . . . . . . . . . . . . . . . . 121Signatures . . . . . . . . . . . . . . . . . . . . . . . . . . . . . . . . . . . . . . . . . . . . . . . . . . . . . . . . . . . . . . . . 122EX-31.1EX-31.2EX-32.1EX-32.2EX-101 INSTANCE DOCUMENTEX-101 SCHEMA DOCUMENTEX-101 CALCULATION LINKBASE DOCUMENTEX-101 LABELS LINKBASE DOCUMENTEX-101 PRESENTATION LINKBASE DOCUMENTEX-101 DEFINITION LINKBASE DOCUMENT
i
PART I
ITEM 1. BUSINESS
OVERVIEW
Flowserve Corporation is a world leading manufacturer and aftermarket service provider ofcomprehensive flow control systems. Under the name of a predecessor entity, we were incorporated in theState of New York on May 1, 1912. Flowserve Corporation as it exists today was created in 1997 throughthe merger of two leading fluid motion and control companies — BW/IP and Durco International. Overthe years, we have evolved through organic growth and strategic acquisitions, and our 220-year history ofFlowserve heritage brands serves as the foundation for the breadth and depth of our products and servicestoday. Unless the context otherwise indicates, references to ‘‘Flowserve,’’ ‘‘the Company’’ and such wordsas ‘‘we,’’ ‘‘our’’ and ‘‘us’’ include Flowserve Corporation and its subsidiaries.
We develop and manufacture precision-engineered flow control equipment integral to the movement,control and protection of the flow of materials in our customers’ critical processes. Our product portfolioof pumps, valves, seals, automation and aftermarket services supports global infrastructure industries,including oil and gas, chemical, power generation (including nuclear, fossil and renewable) and watermanagement, as well as certain general industrial markets where our products and services add value.Through our manufacturing platform and global network of Quick Response Centers (‘‘QRCs’’), we offera broad array of aftermarket equipment services, such as installation, advanced diagnostics, repair andretrofitting.
We sell our products and services to more than 10,000 companies, including some of the world’sleading engineering, procurement and construction firms (‘‘EPC’’), original equipment manufacturers,distributors and end users. Our products and services are used in several distinct industries having a broadgeographic reach. Our bookings mix by industry in 2015 and 2014 consisted of:
2015 2014
• oil and gas . . . . . . . . . . . . . . . . . . . . . . . . . . . . . . . . . . . . . . . . . . . . . . . . . . . . . . . . . 36% 43%• general industries(1) . . . . . . . . . . . . . . . . . . . . . . . . . . . . . . . . . . . . . . . . . . . . . . . . . . 24% 22%• chemical . . . . . . . . . . . . . . . . . . . . . . . . . . . . . . . . . . . . . . . . . . . . . . . . . . . . . . . . . . 22% 20%• power generation . . . . . . . . . . . . . . . . . . . . . . . . . . . . . . . . . . . . . . . . . . . . . . . . . . . . 14% 12%• water management . . . . . . . . . . . . . . . . . . . . . . . . . . . . . . . . . . . . . . . . . . . . . . . . . . . 4% 3%
(1) General industries includes mining and ore processing, pharmaceuticals, pulp and paper, food andbeverage and other smaller applications, as well as sales to distributors whose end customers typicallyoperate in the industries we primarily serve.
The breakdown of the geographic regions to which our sales were shipped in 2015 and 2014 were asfollows:
2015 2014
• North America . . . . . . . . . . . . . . . . . . . . . . . . . . . . . . . . . . . . . . . . . . . . . . . . . . . . . . 39% 36%• Europe . . . . . . . . . . . . . . . . . . . . . . . . . . . . . . . . . . . . . . . . . . . . . . . . . . . . . . . . . . . 22% 19%• Asia Pacific . . . . . . . . . . . . . . . . . . . . . . . . . . . . . . . . . . . . . . . . . . . . . . . . . . . . . . . . 18% 21%• Middle East and Africa . . . . . . . . . . . . . . . . . . . . . . . . . . . . . . . . . . . . . . . . . . . . . . . . 12% 13%• Latin America . . . . . . . . . . . . . . . . . . . . . . . . . . . . . . . . . . . . . . . . . . . . . . . . . . . . . . 9% 11%
We have pursued a strategy of industry diversity and geographic breadth to mitigate the impact on ourbusiness of normal economic downturns in any one of the industries or in any particular part of the worldwe serve. For events that may occur and adversely impact our business, financial condition, results ofoperations and cash flows, refer to ‘‘Item 1A. Risk Factors’’ of this Annual Report on Form 10-K for the
1
year ended December 31, 2015 (‘‘Annual Report’’). For information on our sales and long-lived assets bygeographic areas, see Note 16 to our consolidated financial statements included in ‘‘Item 8. FinancialStatements and Supplementary Data’’ (‘‘Item 8’’) of this Annual Report.
We conduct our operations through three business segments based on type of product and how wemanage the business:
• Engineered Product Division (‘‘EPD’’) for long lead time, custom and other highly-engineeredpumps and pump systems, mechanical seals, auxiliary systems and replacement parts and relatedservices;
• Industrial Product Division (‘‘IPD’’) for pre-configured engineered pumps and pump systems andrelated products and services; and
• Flow Control Division (‘‘FCD’’) for engineered and industrial valves, control valves, actuators andcontrols and related services.
Our business segments share a focus on industrial flow control technology and benefit from our globalfootprint and our economies of scale in reducing administrative and overhead costs to serve customersmore cost effectively. EPD and IPD have a high number of common customers and complementaryproduct offerings and technologies that are often combined in applications that provide us a netcompetitive advantage. All segments share certain resources and functions, including elements of researchand development (‘‘R&D’’), supply chain, safety, quality assurance and administrative functions thatprovide efficiencies and an overall lower cost structure.
Our operations leadership reports to our Chief Operating Officer, and the segments share leadershipfor operational support functions such as R&D, marketing and supply chain. We believe this leadershipstructure positions the Company to leverage operational excellence, cost reduction initiatives and internalsynergies across our entire operating platform to drive further growth and increase shareholders’ value.
Strategies
Our overarching objective is to grow our position as a product and integrated solutions provider in theflow control industry. This objective includes continuing to sell products by building on existing salesrelationships and leveraging the power of our portfolio of products and services. It also includes deliveringspecific end-user solutions that help customers attain their business goals by ensuring maximum reliabilityat a decreased cost of ownership. This objective is pursued by cultivating a corporate culture based onworkplace safety for our employees, ethical and transparent business practices and a dedicated focus onserving our customers. These three pillars support a collaborative, ‘One Flowserve’ approach thatleverages a diverse and inclusive work environment worldwide. We seek to drive increasing enterprisevalue by using the following strategies: disciplined profitable growth, customer intimacy, innovation andportfolio management, strategic localization, operational excellence, employee focus and sustainablebusiness model. The key elements of these strategies are outlined below.
Disciplined Profitable Growth
Disciplined profitable growth is focused on growing revenues profitably from our existing portfolio ofproducts and services, as well as through the development or acquisition of new customer-driven productsand services. Its overarching goals are to focus on opportunities that can maximize the organic growth fromexisting customers and to evaluate potential new customer-partnering initiatives that maximize the captureof products’ total life cycle. We believe we are the largest major pump, valve and seal company that canoffer customers a differentiated option of flow management products and services across a broad portfolio,as well as offer additional options that include any combination of products and solution support packages.
2
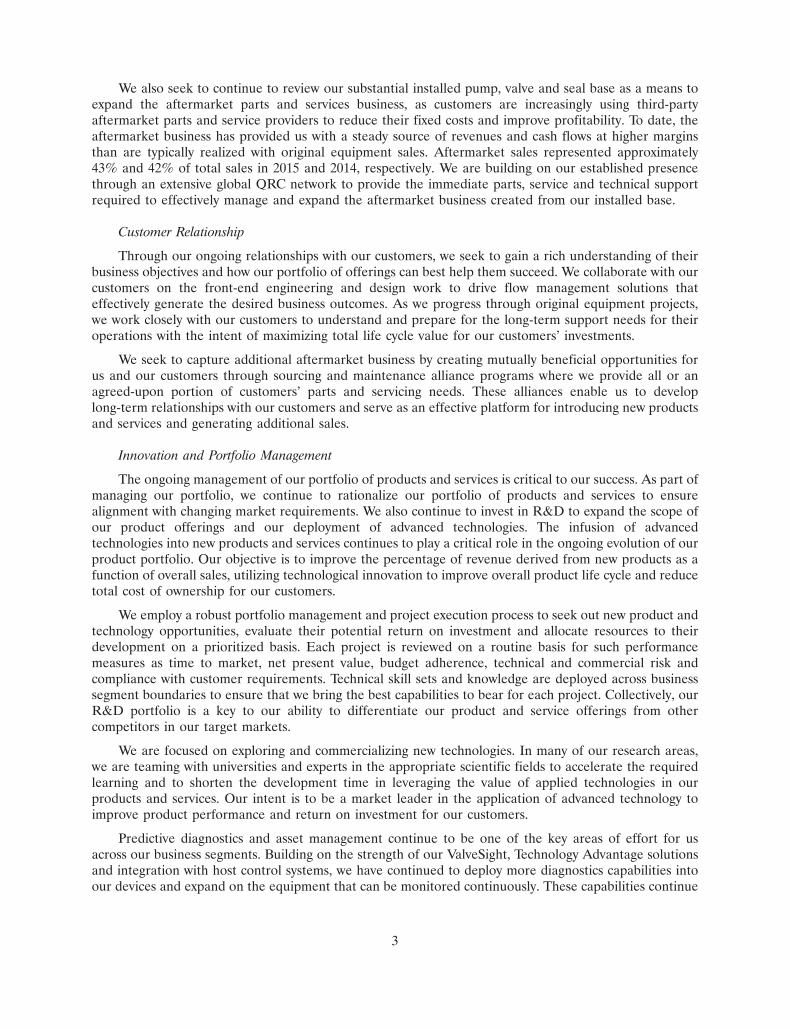
We also seek to continue to review our substantial installed pump, valve and seal base as a means toexpand the aftermarket parts and services business, as customers are increasingly using third-partyaftermarket parts and service providers to reduce their fixed costs and improve profitability. To date, theaftermarket business has provided us with a steady source of revenues and cash flows at higher marginsthan are typically realized with original equipment sales. Aftermarket sales represented approximately43% and 42% of total sales in 2015 and 2014, respectively. We are building on our established presencethrough an extensive global QRC network to provide the immediate parts, service and technical supportrequired to effectively manage and expand the aftermarket business created from our installed base.
Customer Relationship
Through our ongoing relationships with our customers, we seek to gain a rich understanding of theirbusiness objectives and how our portfolio of offerings can best help them succeed. We collaborate with ourcustomers on the front-end engineering and design work to drive flow management solutions thateffectively generate the desired business outcomes. As we progress through original equipment projects,we work closely with our customers to understand and prepare for the long-term support needs for theiroperations with the intent of maximizing total life cycle value for our customers’ investments.
We seek to capture additional aftermarket business by creating mutually beneficial opportunities forus and our customers through sourcing and maintenance alliance programs where we provide all or anagreed-upon portion of customers’ parts and servicing needs. These alliances enable us to developlong-term relationships with our customers and serve as an effective platform for introducing new productsand services and generating additional sales.
Innovation and Portfolio Management
The ongoing management of our portfolio of products and services is critical to our success. As part ofmanaging our portfolio, we continue to rationalize our portfolio of products and services to ensurealignment with changing market requirements. We also continue to invest in R&D to expand the scope ofour product offerings and our deployment of advanced technologies. The infusion of advancedtechnologies into new products and services continues to play a critical role in the ongoing evolution of ourproduct portfolio. Our objective is to improve the percentage of revenue derived from new products as afunction of overall sales, utilizing technological innovation to improve overall product life cycle and reducetotal cost of ownership for our customers.
We employ a robust portfolio management and project execution process to seek out new product andtechnology opportunities, evaluate their potential return on investment and allocate resources to theirdevelopment on a prioritized basis. Each project is reviewed on a routine basis for such performancemeasures as time to market, net present value, budget adherence, technical and commercial risk andcompliance with customer requirements. Technical skill sets and knowledge are deployed across businesssegment boundaries to ensure that we bring the best capabilities to bear for each project. Collectively, ourR&D portfolio is a key to our ability to differentiate our product and service offerings from othercompetitors in our target markets.
We are focused on exploring and commercializing new technologies. In many of our research areas,we are teaming with universities and experts in the appropriate scientific fields to accelerate the requiredlearning and to shorten the development time in leveraging the value of applied technologies in ourproducts and services. Our intent is to be a market leader in the application of advanced technology toimprove product performance and return on investment for our customers.
Predictive diagnostics and asset management continue to be one of the key areas of effort for usacross our business segments. Building on the strength of our ValveSight, Technology Advantage solutionsand integration with host control systems, we have continued to deploy more diagnostics capabilities intoour devices and expand on the equipment that can be monitored continuously. These capabilities continue
3
to provide a key source of competitive advantage in the marketplace and are saving our customers timeand money in keeping their operations running.
We continually evaluate acquisitions, joint ventures and other strategic investment opportunities tobroaden our product portfolio, service capabilities, geographic presence and operational capabilities tomeet the growing needs of our customers. We evaluate all investment opportunities through a decisionfiltering process to ensure a good strategic, financial and cultural fit.
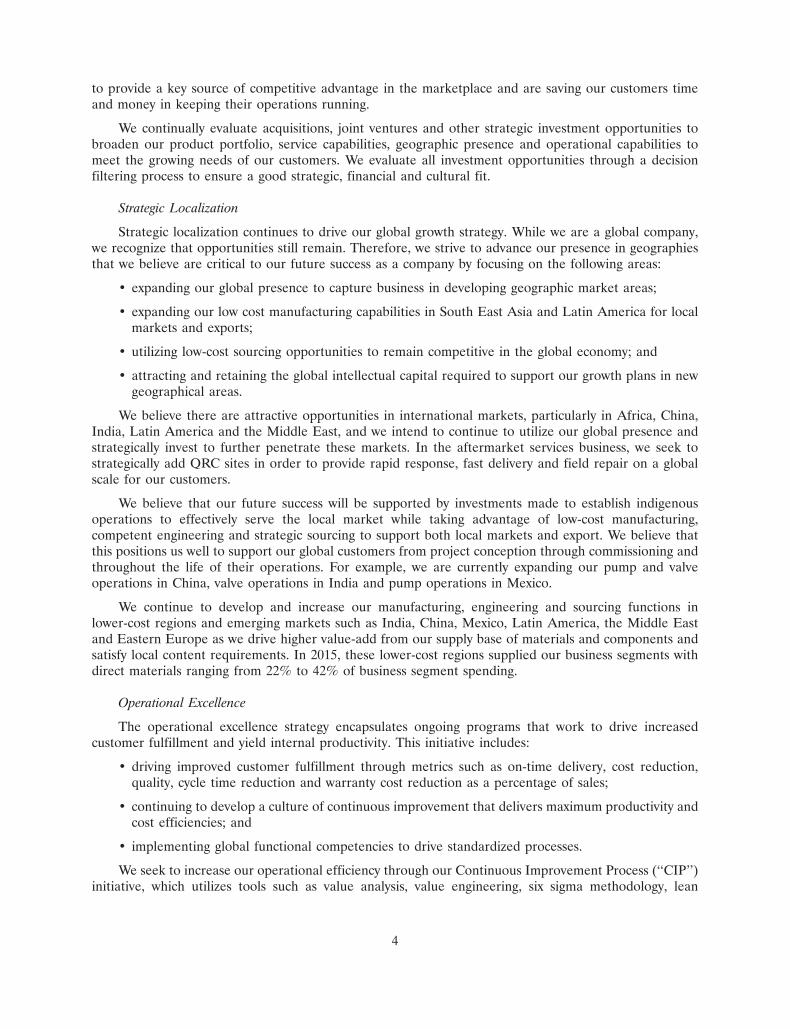
Strategic Localization
Strategic localization continues to drive our global growth strategy. While we are a global company,we recognize that opportunities still remain. Therefore, we strive to advance our presence in geographiesthat we believe are critical to our future success as a company by focusing on the following areas:
• expanding our global presence to capture business in developing geographic market areas;
• expanding our low cost manufacturing capabilities in South East Asia and Latin America for localmarkets and exports;
• utilizing low-cost sourcing opportunities to remain competitive in the global economy; and
• attracting and retaining the global intellectual capital required to support our growth plans in newgeographical areas.
We believe there are attractive opportunities in international markets, particularly in Africa, China,India, Latin America and the Middle East, and we intend to continue to utilize our global presence andstrategically invest to further penetrate these markets. In the aftermarket services business, we seek tostrategically add QRC sites in order to provide rapid response, fast delivery and field repair on a globalscale for our customers.
We believe that our future success will be supported by investments made to establish indigenousoperations to effectively serve the local market while taking advantage of low-cost manufacturing,competent engineering and strategic sourcing to support both local markets and export. We believe thatthis positions us well to support our global customers from project conception through commissioning andthroughout the life of their operations. For example, we are currently expanding our pump and valveoperations in China, valve operations in India and pump operations in Mexico.
We continue to develop and increase our manufacturing, engineering and sourcing functions inlower-cost regions and emerging markets such as India, China, Mexico, Latin America, the Middle Eastand Eastern Europe as we drive higher value-add from our supply base of materials and components andsatisfy local content requirements. In 2015, these lower-cost regions supplied our business segments withdirect materials ranging from 22% to 42% of business segment spending.
Operational Excellence
The operational excellence strategy encapsulates ongoing programs that work to drive increasedcustomer fulfillment and yield internal productivity. This initiative includes:
• driving improved customer fulfillment through metrics such as on-time delivery, cost reduction,quality, cycle time reduction and warranty cost reduction as a percentage of sales;
• continuing to develop a culture of continuous improvement that delivers maximum productivity andcost efficiencies; and
• implementing global functional competencies to drive standardized processes.
We seek to increase our operational efficiency through our Continuous Improvement Process (‘‘CIP’’)initiative, which utilizes tools such as value analysis, value engineering, six sigma methodology, lean
4
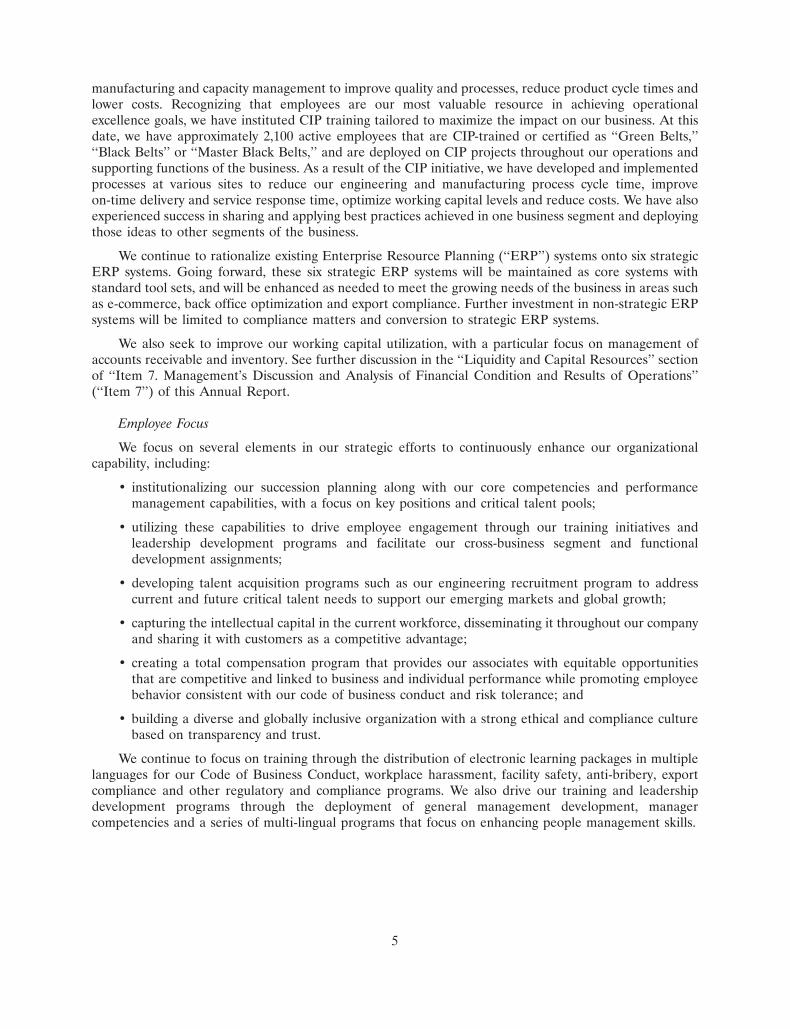
manufacturing and capacity management to improve quality and processes, reduce product cycle times andlower costs. Recognizing that employees are our most valuable resource in achieving operationalexcellence goals, we have instituted CIP training tailored to maximize the impact on our business. At thisdate, we have approximately 2,100 active employees that are CIP-trained or certified as ‘‘Green Belts,’’‘‘Black Belts’’ or ‘‘Master Black Belts,’’ and are deployed on CIP projects throughout our operations andsupporting functions of the business. As a result of the CIP initiative, we have developed and implementedprocesses at various sites to reduce our engineering and manufacturing process cycle time, improveon-time delivery and service response time, optimize working capital levels and reduce costs. We have alsoexperienced success in sharing and applying best practices achieved in one business segment and deployingthose ideas to other segments of the business.
We continue to rationalize existing Enterprise Resource Planning (‘‘ERP’’) systems onto six strategicERP systems. Going forward, these six strategic ERP systems will be maintained as core systems withstandard tool sets, and will be enhanced as needed to meet the growing needs of the business in areas suchas e-commerce, back office optimization and export compliance. Further investment in non-strategic ERPsystems will be limited to compliance matters and conversion to strategic ERP systems.
We also seek to improve our working capital utilization, with a particular focus on management ofaccounts receivable and inventory. See further discussion in the ‘‘Liquidity and Capital Resources’’ sectionof ‘‘Item 7. Management’s Discussion and Analysis of Financial Condition and Results of Operations’’(‘‘Item 7’’) of this Annual Report.
Employee Focus
We focus on several elements in our strategic efforts to continuously enhance our organizationalcapability, including:
• institutionalizing our succession planning along with our core competencies and performancemanagement capabilities, with a focus on key positions and critical talent pools;
• utilizing these capabilities to drive employee engagement through our training initiatives andleadership development programs and facilitate our cross-business segment and functionaldevelopment assignments;
• developing talent acquisition programs such as our engineering recruitment program to addresscurrent and future critical talent needs to support our emerging markets and global growth;
• capturing the intellectual capital in the current workforce, disseminating it throughout our companyand sharing it with customers as a competitive advantage;
• creating a total compensation program that provides our associates with equitable opportunitiesthat are competitive and linked to business and individual performance while promoting employeebehavior consistent with our code of business conduct and risk tolerance; and
• building a diverse and globally inclusive organization with a strong ethical and compliance culturebased on transparency and trust.
We continue to focus on training through the distribution of electronic learning packages in multiplelanguages for our Code of Business Conduct, workplace harassment, facility safety, anti-bribery, exportcompliance and other regulatory and compliance programs. We also drive our training and leadershipdevelopment programs through the deployment of general management development, managercompetencies and a series of multi-lingual programs that focus on enhancing people management skills.
5
Sustainable Business Model
The sustainable business model initiative is focused on areas that have the potential of adverselyaffecting our reputation, limiting our financial flexibility or creating unnecessary risk for any of ourstakeholders. We proactively administer an enterprise risk management program with regular reviews ofhigh-level matters with our Board of Directors. We work with our capital sourcing partners to ensure thatthe terms of our credit facilities and long-term debt are appropriately aligned with our business strategy.We also train our associates on and monitor matters of a legal or ethical nature to support understandingand compliance on a global basis.
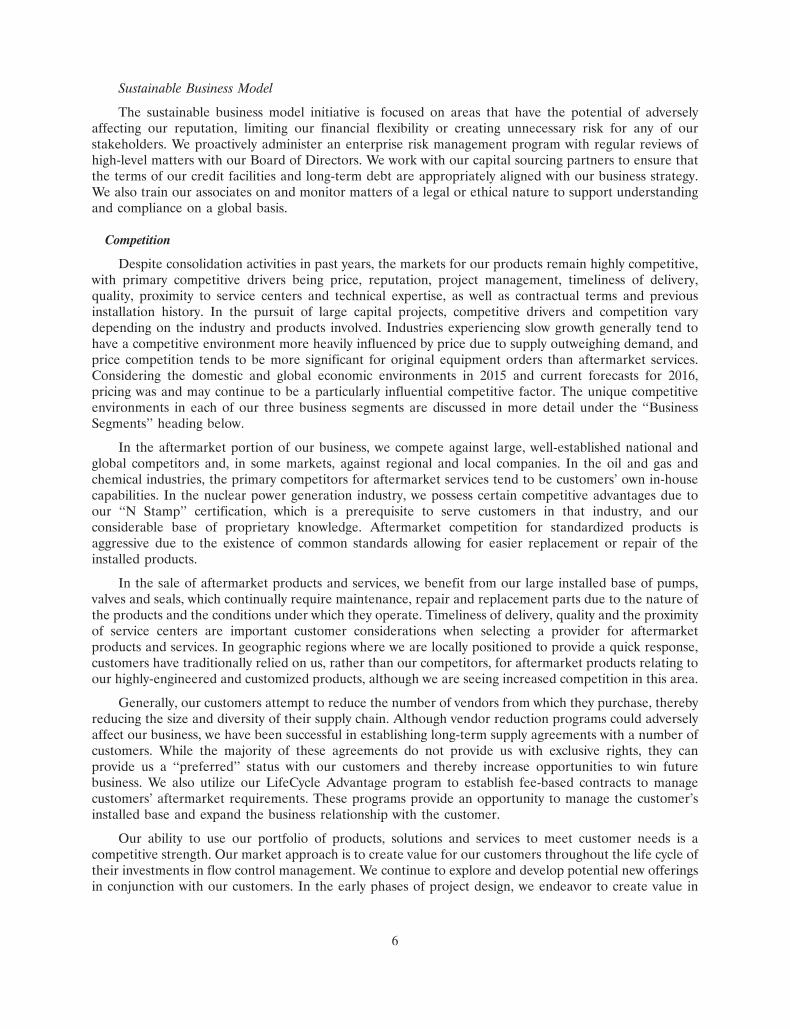
Competition
Despite consolidation activities in past years, the markets for our products remain highly competitive,with primary competitive drivers being price, reputation, project management, timeliness of delivery,quality, proximity to service centers and technical expertise, as well as contractual terms and previousinstallation history. In the pursuit of large capital projects, competitive drivers and competition varydepending on the industry and products involved. Industries experiencing slow growth generally tend tohave a competitive environment more heavily influenced by price due to supply outweighing demand, andprice competition tends to be more significant for original equipment orders than aftermarket services.Considering the domestic and global economic environments in 2015 and current forecasts for 2016,pricing was and may continue to be a particularly influential competitive factor. The unique competitiveenvironments in each of our three business segments are discussed in more detail under the ‘‘BusinessSegments’’ heading below.
In the aftermarket portion of our business, we compete against large, well-established national andglobal competitors and, in some markets, against regional and local companies. In the oil and gas andchemical industries, the primary competitors for aftermarket services tend to be customers’ own in-housecapabilities. In the nuclear power generation industry, we possess certain competitive advantages due toour ‘‘N Stamp’’ certification, which is a prerequisite to serve customers in that industry, and ourconsiderable base of proprietary knowledge. Aftermarket competition for standardized products isaggressive due to the existence of common standards allowing for easier replacement or repair of theinstalled products.
In the sale of aftermarket products and services, we benefit from our large installed base of pumps,valves and seals, which continually require maintenance, repair and replacement parts due to the nature ofthe products and the conditions under which they operate. Timeliness of delivery, quality and the proximityof service centers are important customer considerations when selecting a provider for aftermarketproducts and services. In geographic regions where we are locally positioned to provide a quick response,customers have traditionally relied on us, rather than our competitors, for aftermarket products relating toour highly-engineered and customized products, although we are seeing increased competition in this area.
Generally, our customers attempt to reduce the number of vendors from which they purchase, therebyreducing the size and diversity of their supply chain. Although vendor reduction programs could adverselyaffect our business, we have been successful in establishing long-term supply agreements with a number ofcustomers. While the majority of these agreements do not provide us with exclusive rights, they canprovide us a ‘‘preferred’’ status with our customers and thereby increase opportunities to win futurebusiness. We also utilize our LifeCycle Advantage program to establish fee-based contracts to managecustomers’ aftermarket requirements. These programs provide an opportunity to manage the customer’sinstalled base and expand the business relationship with the customer.
Our ability to use our portfolio of products, solutions and services to meet customer needs is acompetitive strength. Our market approach is to create value for our customers throughout the life cycle oftheir investments in flow control management. We continue to explore and develop potential new offeringsin conjunction with our customers. In the early phases of project design, we endeavor to create value in
6
optimizing the selection of equipment for the customer’s specific application, as we are capable ofproviding technical expertise on product and system capabilities even outside the scope of our specificproducts, solutions and services. After the equipment is constructed and delivered to the customer’s site,we continue to create value through our aftermarket capabilities by optimizing the performance of theequipment over its operational life. Our skilled service personnel can provide these aftermarket servicesfor our products, as well as many competitors’ products, within the installed base. This value is furtherenhanced by the global reach of our QRCs and, when combined with our other solutions for ourcustomers’ flow control management needs, allows us to create value for our customers during all phasesof the capital expenditure cycle.
New Product Development
We spent $45.9 million, $40.9 million and $37.8 million during 2015, 2014 and 2013, respectively, oncompany-sponsored R&D initiatives. Our R&D group consists of engineers involved in new productdevelopment and improvement of existing products. Additionally, we sponsor consortium programs forresearch with various universities and jointly conduct limited development work with certain vendors,licensees and customers. We believe our R&D expenditures are adequate to sustain our ongoing andnecessary future product development. In addition, we work closely with our customers oncustomer-sponsored research activities to help execute their R&D initiatives in connection with ourproducts and services. New product development in each of our three business segments is discussed inmore detail under the ‘‘Business Segments’’ heading below.
Customers
We sell to a wide variety of customers globally including leading EPC firms, original equipmentmanufacturers, distributors and end users in several distinct industries: oil and gas, chemical, powergeneration, water management and general industries. We do not believe that we have sales to anyindividual customer that represent 10% or more of consolidated 2015 revenues. Customer informationrelating to each of our three business segments is discussed in more detail under the ‘‘Business Segments’’heading below.
We are not normally required to carry unusually high amounts of inventory to meet customer deliveryrequirements, although higher backlog levels and longer lead times generally require higher amounts ofinventory. We typically require advance cash payments from customers on longer lead time projects to helpoffset our investment in inventory. We have initiated programs targeted at improving our operationaleffectiveness to reduce our overall working capital needs. While we do provide cancellation policiesthrough our contractual relationships, we generally do not provide rights of product return for ourcustomers.
Selling and Distribution
We primarily distribute our products through direct sales by employees assigned to specific regions,industries or products. In addition, we use distributors and sales representatives to supplement our directsales force in countries where it is more appropriate due to business practices or customs, or whenever theuse of direct sales staff is not economically efficient. We generate a majority of our sales leads throughexisting relationships with vendors, customers and prospects or through referrals.
Intellectual Property
We own a number of trademarks and patents relating to the names and designs of our products. Weconsider our trademarks and patents to be valuable assets of our business. In addition, our pool ofproprietary information, consisting of know-how and trade secrets related to the design, manufacture andoperation of our products, is considered particularly valuable. Accordingly, we take proactive measures to
7
protect such proprietary information. We generally own the rights to the products that we manufacture andsell and are unencumbered by licensing or franchise agreements. Our trademarks can typically be renewedindefinitely as long as they remain in use, whereas our existing patents generally expire 10 to 20 years fromthe dates they were filed, which has occurred at various times in the past. We do not believe that theexpiration of any individual patent will have a material adverse impact on our business, financial conditionor results of operations.
Raw Materials
The principal raw materials used in manufacturing our products are readily available and includeferrous and non-ferrous metals in the form of bar stock, machined castings, fasteners, forgings and motors,as well as silicon, carbon faces, gaskets and fluoropolymer components. A substantial volume of our rawmaterials is purchased from outside sources, and we have been able to develop a robust supply chain andanticipate no significant shortages of such materials in the future. We continually monitor the businessconditions of our suppliers to manage competitive market conditions and to avoid potential supplydisruptions. We continue to expand global sourcing to capitalize on localization in emerging markets andlow-cost sources of purchased goods balanced with efficient consolidated and compliant logistics.
We are a vertically-integrated manufacturer of certain pump and valve products. Certaincorrosion-resistant castings for our pumps and valves are manufactured at our foundries. Other metalcastings are either manufactured at our foundries or purchased from qualified and approved foundrysources.
Concerning the products we supply to customers in the nuclear power generation industry, suppliersof raw materials for nuclear power generation markets must be qualified to meet the requirements ofnuclear industry standards and governmental regulations. Supply channels for these materials are currentlyadequate, and we do not anticipate difficulty in obtaining such materials in the future.
Employees and Labor Relations
We have approximately 19,000 employees globally as of December 31, 2015. In the United States(‘‘U.S.’’), a portion of the hourly employees at our pump manufacturing plant located in Vernon,California, our pump service center located in Cleveland, Ohio, our valve manufacturing plant located inLynchburg, Virginia and our foundry located in Dayton, Ohio, are represented by unions. Additionally,some employees at select facilities in the following countries are unionized or have employee workscouncils: Argentina, Australia, Austria, Brazil, Canada, Finland, France, Germany, Italy, Japan, Mexico,The Netherlands, Spain, South Africa, Sweden and the United Kingdom (U.K.). We believe relations withour employees throughout our operations are generally satisfactory, including those employeesrepresented by unions and employee works councils. No unionized facility accounted for more than 10% ofour consolidated 2015 revenues.
Environmental Regulations and Proceedings
We are subject to environmental laws and regulations in all jurisdictions in which we have operatingfacilities. These requirements primarily relate to the generation and disposal of waste, air emissions andwaste water discharges. We periodically make capital expenditures to enhance our compliance withenvironmental requirements, as well as to abate and control pollution. At present, we have no plans for anymaterial capital expenditures for environmental control equipment at any of our facilities. However, wehave incurred and continue to incur operating costs relating to ongoing environmental compliance matters.Based on existing and proposed environmental requirements and our anticipated production schedule, webelieve that future environmental compliance expenditures will not have a material adverse effect on ourfinancial condition, results of operations or cash flows.
8
We use hazardous substances and generate hazardous wastes in many of our manufacturing andfoundry operations. Most of our current and former properties are or have been used for industrialpurposes and some may require clean-up of historical contamination. During the due diligence phase ofour acquisitions, we conduct environmental site assessments to identify potential environmental liabilitiesand required clean-up measures. We are currently conducting follow-up investigation and/or remediationactivities at those locations where we have known environmental concerns. We have cleaned up a majorityof the sites with known historical contamination and are addressing the remaining identified issues.
Over the years, we have been involved as one of many potentially responsible parties (‘‘PRP’’) atformer public waste disposal sites that are or were subject to investigation and remediation. We arecurrently involved as a PRP at five Superfund sites. The sites are in various stages of evaluation bygovernment authorities. Our total projected ‘‘fair share’’ cost allocation at these five sites is expected to beimmaterial. See ‘‘Item 3. Legal Proceedings’’ included in this Annual Report for more information.
We have established reserves that we currently believe to be adequate to cover our currently identifiedon-site and off-site environmental liabilities.
Exports
Our export sales from the U.S. to foreign unaffiliated customers were $295.6 million in 2015,$338.5 million in 2014 and $355.7 million in 2013.
Licenses are required from U.S. and other government agencies to export certain products. Inparticular, products with nuclear power generation and/or military applications are restricted, as arecertain other pump, valve and seal products.
BUSINESS SEGMENTS
In addition to the business segment information presented below, Note 16 to our consolidatedfinancial statements in Item 8 of this Annual Report contains additional financial information about ourbusiness segments and geographic areas in which we have conducted business in 2015, 2014 and 2013.
ENGINEERED PRODUCT DIVISION
Our largest business segment is EPD, through which we design, manufacture, distribute and servicecustom and other highly-engineered pumps and pump systems, mechanical seals, auxiliary systems,replacement parts and related equipment. The business consists of long lead time, highly-engineered,custom-configured products, which require extensive test requirements and superior project managementskills, as well as aftermarket services supporting global infrastructure industries. EPD products and servicesare primarily used by companies that operate in the oil and gas, power generation, chemical, watermanagement and general industries. We market our pump and mechanical seal products through ourglobal sales force and our regional QRCs and service and repair centers or through independentdistributors and sales representatives. A portion of our mechanical seal products are sold directly tooriginal equipment manufacturers for incorporation into rotating equipment requiring mechanical seals.
Our pump products are manufactured in a wide range of metal alloys and with a variety ofconfigurations to meet the critical operating demands of our customers. Mechanical seals are critical to thereliable operation of rotating equipment in that they prevent leakage and emissions of hazardoussubstances from the rotating equipment and reduce shaft wear on the equipment caused by the use ofnon-mechanical seals. We also manufacture a gas-lubricated mechanical seal that is used in high-speedcompressors for gas pipelines and in the oil and gas production and process markets. Our products arecurrently manufactured at 33 plants worldwide, 10 of which are located in Europe, 11 in North America,seven in Asia Pacific and five in Latin America.
9
We also conduct business through strategic foreign joint ventures. We have six unconsolidated jointventures that are located in China, India, Japan, Saudi Arabia, South Korea and the United ArabEmirates, where a portion of our products are manufactured, assembled or serviced in these territories.These relationships provide numerous strategic opportunities, including increased access to our currentand new markets, access to additional manufacturing capacity and expansion of our operational platformto support low-cost sourcing initiatives and capacity demands for other markets.
EPD Products
We manufacture more than 40 different active types of pumps and approximately 185 different modelsof mechanical seals and sealing systems. The following is a summary list of our EPD products and globallyrecognized brands:
EPD Product Types
Between Bearings Pumps Overhung Pumps• Single Case — Axially Split • API Process• Single Case — Radially Split• Double Case
Positive Displacement Pumps Mechanical Seals and Seal Support Systems• Multiphase • Gas Barrier Seals• Reciprocating • Dry-Running Seals• Screw
Specialty Products• Nuclear Pumps • Power Recovery — DWEER• Nuclear Seals • Power Recovery — Hydroturbine• Cryogenic Pumps • Energy Recovery Devices• Cryogenic Liquid Expander • CVP Concrete Volute Pumps• Hydraulic Decoking Systems • Wireless Transmitters• API Slurry Pumps
EPD Brand Names
• BW Seals • LifeCycle Advantage• Byron Jackson • Niigata Worthington• Calder Energy Recovery Devices • QRC�• Cameron • Pacific• Durametallic • Pacific Weitz• FEDD Wireless • Pac-Seal• Five Star Seal • ReadySeal• Flowserve • United Centrifugal• GASPAC� • Western Land Roller• IDP • Wilson-Snyder• Interseal • Worthington• Lawrence • Worthington-Simpson
EPD Services
We provide engineered aftermarket services through our global network of 129 QRCs, some of whichare co-located in manufacturing facilities, in 47 countries. Our EPD service personnel provide acomprehensive set of equipment services for flow management control systems, including installation,commissioning, repair, advanced diagnostics, re-rate and retrofit programs, machining and comprehensive
10
asset management solutions. We provide asset management services and condition monitoring for rotatingequipment through special contracts with many of our customers that reduce maintenance costs. A largeportion of EPD’s service work is performed on a quick response basis, and we offer 24-hour service in allof our major markets.
EPD New Product Development
Our investments in new product R&D continue to focus on increasing the capability of our productsas customer applications become more advanced, demanding greater levels of production (i.e., flow, powerand pressure) and under more extreme conditions beyond the level of traditional technology. We continueto develop innovations that improve product performance and our competitive position in the engineeredequipment industry, specifically targeting pipeline, offshore and downstream applications for the oil andgas market. The emergence of extreme pressure applications prompted the development of an advancedstage design and construction of high pressure test capability necessary to validate the technology prior tointroduction into the market.
As new sources of energy generation are explored, we have been developing new product designs tosupport the most critical applications in the power generation market. New designs and qualification testprograms continue to support the critical services found in the modern nuclear power generation plant. Inaddition to nuclear pump product development, we have focused development efforts on an advanced sealdesign required to accommodate upset conditions recently identified by the nuclear industry. Continuedengagement with our end users is exemplified through completion of advancements in coke cuttingtechnology, nozzle design and auxiliary equipment improvements, as well as creation of an automatedcutting system to improve operator safety.
We continue to address our core products with design enhancements to improve performance and thespeed at which we can deliver our products. Application of advanced computational fluid dynamicsmethods utilizing unsteady flow analysis led to the development of an advanced inlet chamber and impellervane design for high energy injection water pumps. Our engineering teams continue to apply and developsophisticated design technology and methods supporting continuous improvement of our proventechnology. Additionally, we are incentivizing our operations and tracking the R&D projects more closely,which is leading to broader engagement in developing new products.
In 2015, EPD continued to advance our Technology Advantage platform through the IntegratedSolutions Organization (‘‘ISO’’). This platform utilizes a combination of our developed technologies andleading edge technology partners to increase our asset management and service capabilities for ourend-user customers. These technologies include intelligent devices, advanced communication and securityprotocols, wireless and satellite communications and web-enabled data convergence. Additionally, we havebeen exploring the ‘‘additive manufacturing’’ opportunities in our products and auxiliary systems.
None of these newly developed products or services required the investment of a material amount ofour assets or was otherwise material.
EPD Customers
Our customer mix is diversified and includes leading EPC firms, original equipment manufacturers,distributors and end users. Our sales mix of original equipment products and aftermarket products andservices diversifies our business and helps mitigate the impact of normal economic cycles on our business.Our sales are diversified among several industries, including oil and gas, power generation, chemical, watermanagement and general industries.
11
EPD Competition
The pump and mechanical seal industry is highly fragmented, with hundreds of competitors. Wecompete, however, primarily with a limited number of large companies operating on a global scale.Competition among our closest competitors is generally driven by delivery times, expertise, price, breadthof product offerings, contractual terms, previous installation history and reputation for quality. Some ofour largest industry competitors include: Sulzer Pumps; Ebara Corp.; SPX FLOW, Inc.; Eagle Burgmann,which is a joint venture of two traditional global seal manufacturers, A. W. Chesterton Co. and AES Corp.;John Crane Inc., a unit of Smiths Group Plc; and Weir Group Plc.
The pump and mechanical seal industry continues to undergo considerable consolidation, which isprimarily driven by (i) the need to lower costs through reduction of excess capacity and (ii) customers’preference to align with global full service suppliers to simplify their supplier base. Despite theconsolidation activity, the market remains highly competitive.
We believe that our strongest sources of competitive advantage rest with our extensive range of pumpsfor the oil and gas, chemical and power generation industries, our large installed base of products, ourstrong customer relationships, our more than 200 years of legacy experience in manufacturing andservicing pumping equipment, our reputation for providing quality engineering solutions and our ability todeliver engineered new seal product orders within 72 hours from the customer’s request.
EPD Backlog
EPD’s backlog of orders as of December 31, 2015 was $1,157.3 million (including $10.5 million ofinterdivision backlog, which is eliminated and not included in consolidated backlog), compared with$1,573.3 million (including $16.3 million of interdivision backlog) as of December 31, 2014. We expect toship approximately 92% of December 31, 2015 backlog during 2016.
INDUSTRIAL PRODUCT DIVISION
Through IPD we design, manufacture, distribute and service pre-configured engineered pumps andpump systems, including submersible motors, for industrial markets. Our globalized operating platform,low-cost sourcing and continuous improvement initiatives are essential aspects of this business. IPD’sstandardized, general purpose pump products are primarily utilized by the oil and gas, chemical, watermanagement, power generation and general industries. Our products are currently manufactured in 22manufacturing facilities, five of which are located in the U.S. and 12 in Europe. IPD operates 34 QRCsworldwide, including 21 sites in Europe, six in the U.S., four in Asia Pacific and three in Latin America.
12

IPD Products
We manufacture approximately 40 different active types of pumps available in a wide range of metalalloys and non-metallics with a variety of configurations to meet the critical operating demands of ourcustomers. The following is a summary list of our IPD products and globally recognized brands:
IPD Pump Product Types
Overhung Between Bearings• Chemical Process ASME and ISO • Side Channel Multistage• Industrial Process • Segmental Channel Multistage• Slurry and Solids Handling • Single Case — Axially Split
• Single Case — Radially Split
Specialty Products Vertical• Ag Chem • Wet Pit and Suction Case API• Molten Salt VTP Pump • Deep Well Submersible Motor• Submersible Pump • Slurry and Solids Handling• Thruster • Sump• Geothermal Deepwell • Vacuum Systems• Barge Pump• Sewage Submersible Vacuum Systems
• Liquid RingPositive Displacement • LR Systems• Gear • Dry Systems
IPD Brand Names
• Aldrich • Sier Bath• Durco • SIHI• Halberg • TKL• IDP • Western Land Roller• Innomag • Worthington• Labour • Worthington-Simpson• Meregalli• Pacific• Pleuger & Byron Jackson• Scienco
IPD Services
We market our pump products through our worldwide sales force and our regional service and repaircenters or through independent distributors and sales representatives. We provide an array of aftermarketservices including product installation and commissioning services, spare parts, repairs, re-rate andupgrade solutions, advanced diagnostics and maintenance solutions through our global network of QRCs.
IPD New Product Development
Our IPD development projects target product feature enhancements, design improvements andsourcing opportunities that we believe will improve the competitive position of our industrial pumpproduct lines. We will invest in our chemical product platform to expand and enhance our products offeredto the global chemical industry.
13
We continue to address our core products with design enhancements to improve performance and thespeed at which we can deliver our products. Successful new product release of permanent magnet motortechnology in our submersible motor products demonstrated improved product efficiency. We will furtherour energy efficiency initiatives in response to various global governmental directives. Cost reductionprojects incorporating product rationalization, value engineering, lean manufacturing and overheadreduction continue to be key drivers for IPD.
None of these newly developed products or services required the investment of a material amount ofour assets or was otherwise material.
IPD Customers
Our customer mix is diversified and includes leading EPC firms, original equipment manufacturers,distributors and end users. Our sales mix of original equipment products and aftermarket products andservices diversifies our business and helps mitigate the impact of normal economic cycles on our business.Our sales are diversified among several industries, including oil and gas, chemical, water management,power generation and general industries.
IPD Competition
The industrial pump industry is highly fragmented, with many competitors. We compete, however,primarily with a limited number of large companies operating on a global scale. Competition among ourclosest competitors is generally driven by delivery times, expertise, price, breadth of product offerings,contractual terms, previous installation history and reputation for quality. Some of our largest industrycompetitors include ITT Industries, KSB Inc. and Sulzer Pumps.
We believe that our strongest sources of competitive advantage rest with our extensive range of pumpsfor the chemical industry, our large installed base, our strong customer relationships, our more than200 years of legacy experience in manufacturing and servicing pumping equipment and our reputation forproviding quality engineering solutions.
IPD Backlog
IPD’s backlog of orders as of December 31, 2015 was $424.6 million (including $15.7 million ofinterdivision backlog, which is eliminated and not included in consolidated backlog), compared with$393.9 million (including $18.0 million of interdivision backlog) as of December 31, 2014. We expect toship approximately 94% of December 31, 2015 backlog during 2016.
FLOW CONTROL DIVISION
FCD designs, manufactures, distributes and services a broad portfolio of industrial valve andautomation solutions, including isolation and control valves, actuation, controls and related equipment. Inaddition, FCD offers energy management products such as steam traps, boiler controls and condensateand energy recovery systems. FCD leverages its experience and application know-how by offering acomplete menu of engineering and project management services to complement its expansive productportfolio. FCD products are used to control, direct and manage the flow of liquids and gases and are anintegral part of any flow control system. Our valve products are most often customized and engineered toperform specific functions within each customer’s unique flow control environment.
Our flow control products are primarily used by companies operating in the chemical, powergeneration, oil and gas, water management and general industries. Our products are currentlymanufactured in 26 principal manufacturing facilities, five of which are located in the U.S., 13 of which arelocated in Europe, seven of which are located in Asia Pacific and one of which is located in Latin America.FCD operates 32 QRCs worldwide.
14

FCD Products
Our valve, automation and controls product and solutions portfolio represents one of the mostcomprehensive in the flow control industry. Our products are used in a wide variety of applications, fromgeneral service to the most severe and demanding services, including those involving high levels ofcorrosion, extreme temperatures and/or pressures, zero fugitive emissions and emergency shutdown.
Our ‘‘smart’’ valve and diagnostic technologies integrate sensors, microprocessor controls andsoftware into high performance integrated control valves, digital positioners and switchboxes forautomated on/off valve assemblies and electric actuators. These technologies permit real-time systemanalysis, system warnings and remote indication of asset health. These technologies have been developedin response to the growing demand for reduced maintenance, improved process control efficiency anddigital communications at the plant level. We are committed to further enhancing the quality of ourproduct portfolio by continuing to upgrade our existing offerings with cutting-edge technologies.
Our valve automation products encompass a broad range of pneumatic, electric, hydraulic and storedenergy actuation designs to take advantage of whatever power source the customer has available. FCD’sactuation products can utilize the process fluid flowing through the pipeline as a source of power to actuatethe valve. Our actuation products also cover one of the widest ranges of output torques in the industry,providing the ability to automate anything from the smallest linear globe valve to the largest multi-turngate valve. Most importantly, FCD combines best-in-class mechanical designs with the latest in digitalcontrols in order to provide complete integrated automation solutions that optimize the combined valve-actuator-controls package.
The following is a summary list of our generally available valve and automation products and globallyrecognized brands:
FCD Product Types
• Valve Automation Systems • Digital Positioners• Control Valves • Pneumatic Positioners• Ball Valves • Intelligent Positioners• Gate Valves • Electric/Electronic Actuators• Globe Valves • Pneumatic Actuators• Check Valves • Hydraulic Actuators• Butterfly Valves • Diaphragm Actuators• Lined Plug Valves • Direct Gas and Gas-over-Oil Actuators• Lined Ball Valves • Limit Switches• Lubricated Plug Valves • Steam Traps• Non-Lubricated Plug Valves • Condensate and Energy Recovery Systems• Integrated Valve Controllers • Boiler Controls• Diagnostic Software • Digital Communications• Electro Pneumatic Positioners • Valve and Automation Repair Services
15
FCD Brand Names
• Accord • NAF• Anchor/Darling • Noble Alloy• Argus • Norbro• Atomac • Nordstrom• Automax • PMV• Durco • Serck Audco• Edward • Schmidt Armaturen• Flowserve • Valbart• Gestra • Valtek• Kammer • Vogt• Limitorque • Worcester Controls• McCANNA/MARPAC
FCD Services
Our service personnel provide comprehensive equipment maintenance services for flow controlsystems, including advanced diagnostics, repair, installation, commissioning, retrofit programs and fieldmachining capabilities. A large portion of our service work is performed on a quick response basis, whichincludes 24-hour service in all of our major markets. We also provide in-house repair and returnmanufacturing services worldwide through our manufacturing facilities. We believe our ability to offercomprehensive, quick turnaround services provides us with a unique competitive advantage andunparalleled access to our customers’ installed base of flow control products.
FCD New Product Development
Our R&D investment is focused on areas that will advance our technological leadership and furtherdifferentiate our competitive advantage from a product perspective. Investment has been focused onsignificantly enhancing the digital integration and interoperability of valve top works (e.g., positioners,actuators, limit switches and associated accessories) with Distributed Control Systems (‘‘DCS’’). Wecontinue to pursue the development and deployment of next-generation hardware and software for valvediagnostics and the integration of the resulting device intelligence through the DCS to provide a practicaland effective asset management capability for the end user. In addition to developing these newcapabilities and value-added services, our investments also include product portfolio expansion andfundamental research in material sciences in order to increase the temperature, pressure and corrosion/erosion-resistance limits of existing products, as well as noise and cavitation reduction. These investmentsare made by adding new resources and talent to the organization, as well as leveraging the experience ofEPD and IPD and increasing our collaboration with third parties. We expect to continue our R&Dinvestments in the areas discussed above.
None of these newly developed valve products or services required the investment of a materialamount of our assets or was otherwise material.
FCD Customers
Our customer mix spans several markets, including the chemical, power generation, oil and gas, watermanagement, pulp and paper, mining and other general industries. Our product mix includes originalequipment and aftermarket parts and services. FCD contracts with a variety of customers, ranging fromEPC firms, to distributors, end users and other original equipment manufacturers.
16
FCD Competition
While in recent years the valve market has undergone a significant amount of consolidation, themarket remains highly fragmented. Some of the largest valve industry competitors include Pentair Ltd.,Cameron International Corp., Emerson Electric Co., General Electric Co. and Crane Co.
Our market research and assessments indicate that the top 10 global valve manufacturers collectivelycomprise less than 25% of the total valve market. Based on independent industry sources, we believe thatwe are the fourth largest industrial valve supplier in the world. We believe that our strongest sources ofcompetitive advantage rest with our comprehensive portfolio of valve products and services, our focus onexecution and our expertise in severe corrosion and erosion applications.
FCD Backlog
FCD’s backlog of orders as of December 31, 2015 was $622.0 million, compared with $774.8 million asof December 31, 2014. We expect to ship approximately 86% of December 31, 2015 backlog during 2016.
AVAILABLE INFORMATION
We maintain an Internet web site at www.flowserve.com. Our Annual Reports on Form 10-K,Quarterly Reports on Form 10-Q, Current Reports on Form 8-K and any amendments to those reportsfiled or furnished pursuant to Section 13(a) of the Securities Exchange Act of 1934 are made available freeof charge through the ‘‘Investor Relations’’ section of our Internet web site as soon as reasonablypracticable after we electronically file the reports with, or furnish the reports to, the U.S. Securities andExchange Commission (‘‘SEC’’).
Also available on our Internet web site are our Corporate Governance Guidelines for our Board ofDirectors and Code of Ethics and Business Conduct, as well as the charters of the Audit, Finance,Organization and Compensation and Corporate Governance and Nominating Committees of our Board ofDirectors and other important governance documents. All of the foregoing documents may be obtainedthrough our Internet web site as noted above and are available in print without charge to shareholders whorequest them. Information contained on or available through our Internet web site is not incorporated intothis Annual Report or any other document we file with, or furnish to, the SEC.
ITEM 1A. RISK FACTORS
Any of the events discussed as risk factors below may occur. If they do, our business, financialcondition, results of operations and cash flows could be materially adversely affected. While we believe allknown material risks are disclosed, additional risks and uncertainties not presently known to us, or that wecurrently deem immaterial, may also impair our business operations. Because of these risk factors, as wellas other variables affecting our operating results, past financial performance may not be a reliableindicator of future performance, and historical trends should not be used to anticipate results or trends infuture periods.
Our business depends on the levels of capital investment and maintenance expenditures by our customers, whichin turn are affected by numerous factors, including the state of domestic and global economies, global energydemand, the cyclical nature of their markets, their liquidity and the condition of global credit and capitalmarkets.
Demand for most of our products and services depends on the level of new capital investment andplanned maintenance expenditures by our customers. The level of capital expenditures by our customersdepends, in turn, on general economic conditions, availability of credit, economic conditions within theirrespective industries and expectations of future market behavior. Additionally, volatility in commodityprices can negatively affect the level of these activities and can result in postponement of capital spendingdecisions or the delay or cancellation of existing orders. The ability of our customers to finance capitalinvestment and maintenance may also be affected by factors independent of the conditions in theirindustry, such as the condition of global credit and capital markets.
17
The businesses of many of our customers, particularly oil and gas companies, chemical companies andgeneral industrial companies, are to varying degrees cyclical and have experienced periodic downturns.Our customers in these industries, particularly those whose demand for our products and services isprimarily profit-driven, historically have tended to delay large capital projects, including expensivemaintenance and upgrades, during economic downturns. For example, our chemical customers generallytend to reduce their spending on capital investments and operate their facilities at lower levels in a softeconomic environment, which reduces demand for our products and services. Additionally, fluctuatingenergy demand forecasts and lingering uncertainty concerning commodity pricing, specifically the price ofoil, can cause our customers to be more conservative in their capital planning, which may reduce demandfor our products and services. Reduced demand for our products and services could result in the delay orcancellation of existing orders or lead to excess manufacturing capacity, which unfavorably impacts ourabsorption of fixed manufacturing costs. This reduced demand may also erode average selling prices in ourindustry. Any of these results could adversely affect our business, financial condition, results of operationsand cash flows.
Additionally, some of our customers may delay capital investment and maintenance even duringfavorable conditions in their industries or markets. Despite these favorable conditions, the general healthof global credit and capital markets and our customers’ ability to access such markets may impactinvestments in large capital projects, including necessary maintenance and upgrades. In addition, theliquidity and financial position of our customers could impact capital investment decisions and their abilityto pay in full and/or on a timely basis. Any of these factors, whether individually or in the aggregate, couldhave a material adverse effect on our customers and, in turn, our business, financial condition, results ofoperations and cash flows.
Volatility in commodity prices, effects from credit and capital market conditions and global economic growthforecasts could prompt customers to delay or cancel existing orders, which could adversely affect the viability ofour backlog and could impede our ability to realize revenues on our backlog.
Our backlog represents the value of uncompleted customer orders. While we cannot be certain thatreported backlog will be indicative of future results, our ability to accurately value our backlog can beadversely affected by numerous factors, including the health of our customers’ businesses and their accessto capital, volatility in commodity prices (e.g., copper, nickel, stainless steel) and economic uncertainty.While we attempt to mitigate the financial consequences of order delays and cancellations throughcontractual provisions and other means, if we were to experience a significant increase in order delays orcancellations that can result from the aforementioned economic conditions or other factors beyond ourcontrol, it could impede or delay our ability to realize anticipated revenues on our backlog. Such a loss ofanticipated revenues could have a material adverse effect on our business, financial condition, results ofoperations and cash flows.
We may be unable to deliver our sizeable backlog on time, which could affect our revenues, future sales andprofitability and our relationships with customers.
At December 31, 2015, backlog was $2.2 billion. In 2016, our ability to meet customer deliveryschedules for backlog is dependent on a number of factors including, but not limited to, sufficientmanufacturing plant capacity, adequate supply channel access to the raw materials and other inventoryrequired for production, an adequately trained and capable workforce, project engineering expertise forcertain large projects and appropriate planning and scheduling of manufacturing resources. Many of thecontracts we enter into with our customers require long manufacturing lead times and contain penaltyclauses related to on-time delivery. Failure to deliver in accordance with customer expectations couldsubject us to financial penalties, may result in damage to existing customer relationships and could have amaterial adverse effect on our business, financial condition, results of operations and cash flows.
18
We sell our products in highly competitive markets, which results in pressure on our profit margins and limits ourability to maintain or increase the market share of our products.
The markets for our products and services are geographically diverse and highly competitive. Wecompete against large and well-established national and global companies, as well as regional and localcompanies, low-cost replicators of spare parts and in-house maintenance departments of our end-usercustomers. We compete based on price, technical expertise, timeliness of delivery, contractual terms,previous installation history and reputation for quality and reliability. Competitive environments inslow-growth industries and for original equipment orders have been inherently more influenced by pricingand domestic and global economic conditions and current economic forecasts suggest that the competitiveinfluence of pricing has broadened. Additionally, some of our customers have been attempting to reducethe number of vendors from which they purchase in order to reduce the size and diversity of their supplychain. To remain competitive, we must invest in manufacturing, marketing, customer service and supportand our distribution networks. No assurances can be made that we will have sufficient resources tocontinue to make the investment required to maintain or increase our market share or that ourinvestments will be successful. If we do not compete successfully, our business, financial condition, resultsof operations and cash flows could be materially adversely affected.
If we are unable to obtain raw materials at favorable prices, our operating margins and results of operations maybe adversely affected.
We purchase substantially all electric power and other raw materials we use in the manufacturing ofour products from outside sources. The costs of these raw materials have been volatile historically and areinfluenced by factors that are outside our control. In recent years, the prices for energy, metal alloys, nickeland certain other of our raw materials have been volatile. While we strive to offset our increased coststhrough supply chain management, contractual provisions and our CIP initiative, where gains are achievedin operational efficiencies, our operating margins and results of operations and cash flows may beadversely affected if we are unable to pass increases in the costs of our raw materials on to our customersor operational efficiencies are not achieved.
Economic, political and other risks associated with international operations could adversely affect our business.
A substantial portion of our operations is conducted and located outside the U.S. We havemanufacturing, sales or service facilities in more than 50 countries and sell to customers in over 90countries, in addition to the U.S. Moreover, we primarily outsource certain of our manufacturing andengineering functions to, and source our raw materials and components from, China, Eastern Europe,India, Latin America and Mexico. Accordingly, our business and results of operations are subject to risksassociated with doing business internationally, including:
• instability in a specific country’s or region’s political or economic conditions, particularly economicconditions in Europe, and political conditions in Russia, the Middle East, North Africa, LatinAmerica and other emerging markets;
• trade protection measures, such as tariff increases, and import and export licensing and controlrequirements;
• potentially negative consequences from changes in tax laws or tax examinations;
• difficulty in staffing and managing widespread operations;
• increased aging and slower collection of receivables, particularly in Latin America and otheremerging markets;
• difficulty of enforcing agreements and collecting receivables through some foreign legal systems;
• differing and, in some cases, more stringent labor regulations;
19

• potentially negative consequences from fluctuations in foreign currency exchange rates;
• partial or total expropriation;
• differing protection of intellectual property;
• inability to repatriate income or capital; and
• difficulty in administering and enforcing corporate policies, which may be different than thecustomary business practices of local cultures.
For example, political unrest or work stoppages could negatively impact the demand for our productsfrom customers in affected countries and other customers, such as U.S. oil refineries, that could beaffected by the resulting disruption in the supply of crude oil. Similarly, military conflicts in Russia, theMiddle East and North Africa could soften the level of capital investment and demand for our productsand services.
Some of the risks outlined above are particularly prevalent in Venezuela. The operating environmentin Venezuela is challenging, with high inflation, increased risk of political and economic instability andincreased government restrictions. As a result of these factors, we have experienced delays in paymentsfrom the national oil company in Venezuela, our primary Venezuelan customer, though these amounts arenot disputed and we have not historically had write-offs relating to this customer. Going forward,additional government actions, political and labor unrest, or other economic headwinds, including theVenezuelan government’s inability to fulfill its fiscal obligations, could have further adverse impacts on ourability to fully collect our receivable and our business in Venezuela.
In order to manage our day-to-day operations, we must overcome cultural and language barriers andassimilate different business practices. In addition, we are required to create compensation programs,employment policies and other administrative programs that comply with laws of multiple countries. Wealso must communicate and monitor standards and directives across our global network. Our failure tosuccessfully manage our geographically diverse operations could impair our ability to react quickly tochanging business and market conditions and to enforce compliance with standards and procedures.
Our future success will depend, in large part, on our ability to anticipate and effectively manage theseand other risks associated with our international operations. Any of these factors could, however,materially adversely affect our international operations and, consequently, our financial condition, resultsof operations and cash flows.
Our international operations and foreign subsidiaries are subject to a variety of complex and continuallychanging laws and regulations.
Due to the international scope of our operations, the system of laws and regulations to which we aresubject is complex and includes, without limitation, regulations issued by the U.S. Customs and BorderProtection, the U.S. Department of Commerce’s Bureau of Industry and Security, the U.S. TreasuryDepartment’s Office of Foreign Assets Control and various foreign governmental agencies, includingapplicable export controls, customs, currency exchange control and transfer pricing regulations, asapplicable. No assurances can be made that we will continue to be found to be operating in compliancewith, or be able to detect violations of, any such laws or regulations. In addition, we cannot predict thenature, scope or effect of future regulatory requirements to which our international operations might besubject or the manner in which existing laws might be administered or interpreted.
Our international operations expose us to fluctuations in foreign currency exchange rates.
A significant portion of our revenue and certain of our costs, assets and liabilities, are denominated incurrencies other than the U.S. dollar. The primary currencies to which we have exposure are the Euro,British pound, Mexican peso, Brazilian real, Indian rupee, Japanese yen, Singapore dollar, Argentine peso,
20
Canadian dollar, Australian dollar, Chinese yuan, Colombian peso, Chilean peso and South African rand.Certain of the foreign currencies to which we have exposure, such as the Venezuelan bolivar and Argentinepeso, have undergone significant devaluation in the past, which can reduce the value of our local monetaryassets, reduce the U.S. dollar value of our local cash flow, generate local currency losses that may impactour ability to pay future dividends from our subsidiary to the parent company and potentially reduce theU.S. dollar value of future local net income. Although we enter into forward exchange contracts toeconomically hedge some of our risks associated with transactions denominated in certain foreigncurrencies, no assurances can be made that exchange rate fluctuations will not adversely affect ourfinancial condition, results of operations and cash flows.
We could be adversely affected by violations of the U.S. Foreign Corrupt Practices Act and similar worldwideanti-bribery laws and regulations.
The U.S. Foreign Corrupt Practices Act (‘‘FCPA’’) and similar anti-bribery laws and regulations inother jurisdictions, such as the UK Bribery Act, generally prohibit companies and their intermediariesfrom making improper payments to government officials for the purpose of obtaining or retaining businessor securing an improper advantage. Because we operate in many parts of the world and sell to industriesthat have experienced corruption to some degree, our policies mandate compliance with applicableanti-bribery laws worldwide. If we are found to be in violation of the FCPA or other similar anti-briberylaws or regulations, whether due to our or others’ actions or inadvertence, we could be subject to civil andcriminal penalties or other sanctions that could have a material adverse impact on our business, financialcondition, results of operations and cash flows. In addition, actual or alleged violations could damage ourreputation or ability to do business.
Terrorist acts, conflicts and wars may materially adversely affect our business, financial condition and results ofoperations and may adversely affect the market for our common stock.
As a global company with a large international footprint, we are subject to increased risk of damage ordisruption to us, our employees, facilities, partners, suppliers, distributors, resellers or customers due toterrorist acts, conflicts and wars, wherever located around the world. The potential for future attacks, thenational and international responses to attacks or perceived threats to national security, and other actualor potential conflicts or wars, such as the Israeli-Hamas conflict and ongoing instability in Syria and Egypt,have created many economic and political uncertainties. In addition, as a global company withheadquarters and significant operations located in the U.S., actions against or by the U.S. may impact ourbusiness or employees. Although it is impossible to predict the occurrences or consequences of any suchevents, they could result in a decrease in demand for our products, make it difficult or impossible to deliverproducts to our customers or to receive components from our suppliers, create delays and inefficiencies inour supply chain and pose risks to our employees, resulting in the need to impose travel restrictions, any ofwhich could adversely affect our business, financial condition, results of operations and cash flows.
Environmental compliance costs and liabilities could adversely affect our financial condition, results ofoperations and cash flows.
Our operations and properties are subject to regulation under environmental laws, which can imposesubstantial sanctions for violations. We must conform our operations to applicable regulatory requirementsand adapt to changes in such requirements in all countries in which we operate.
We use hazardous substances and generate hazardous wastes in many of our manufacturing andfoundry operations. Most of our current and former properties are or have been used for industrialpurposes, and some may require clean-up of historical contamination. We are currently conductinginvestigation and/or remediation activities at a number of locations where we have known environmentalconcerns. In addition, we have been identified as one of many PRPs at five Superfund sites. The projectedcost of remediation at these sites, as well as our alleged ‘‘fair share’’ allocation, while not anticipated to be
21
material, has been reserved. However, until all studies have been completed and the parties have eithernegotiated an amicable resolution or the matter has been judicially resolved, some degree of uncertaintyremains.
We have incurred, and expect to continue to incur, operating and capital costs to comply withenvironmental requirements. In addition, new laws and regulations, stricter enforcement of existingrequirements, the discovery of previously unknown contamination or the imposition of new clean-uprequirements could require us to incur costs or become the basis for new or increased liabilities. Moreover,environmental and sustainability initiatives, practices, rules and regulations are under increasing scrutinyof both governmental and non-governmental bodies, which can cause rapid change in operationalpractices, standards and expectations and, in turn, increase our compliance costs. Any of these factorscould have a material adverse effect on our financial condition, results of operations and cash flows.
We are party to asbestos-containing product litigation that could adversely affect our financial condition, resultsof operations and cash flows.
We are a defendant in a substantial number of lawsuits that seek to recover damages for personalinjury allegedly resulting from exposure to asbestos-containing products formerly manufactured and/ordistributed by us. Such products were used as internal components of process equipment, and we do notbelieve that there was any significant emission of asbestos-containing fibers during the use of thisequipment. Although we are defending these allegations vigorously and believe that a high percentage ofthese lawsuits are covered by insurance or indemnities from other companies, there can be no assurancethat we will prevail or that payments made by insurance or such other companies would be adequate.Unfavorable rulings, judgments or settlement terms could have a material adverse impact on our business,financial condition, results of operations and cash flows.
Our business may be adversely impacted by work stoppages and other labor matters.
As of December 31, 2015, we had approximately 19,000 employees, of which approximately 5,300 werelocated in the U.S. Approximately 6% of our U.S. employees are represented by unions. We also haveunionized employees or employee work councils in Argentina, Australia, Austria, Brazil, Canada, Finland,France, Germany, Italy, Japan, Mexico, The Netherlands, Spain, South Africa, Sweden and the U.K. Noindividual unionized facility produces more than 10% of our revenues. Although we believe that ourrelations with our employees are generally satisfactory and we have not experienced any material strikes orwork stoppages recently, no assurances can be made that we will not in the future experience these andother types of conflicts with labor unions, works councils, other groups representing employees or ouremployees generally, or that any future negotiations with our labor unions will not result in significantincreases in our cost of labor.
Our ability to implement our business strategy and serve our customers is dependent upon thecontinuing ability to employ talented professionals and attract, train, develop and retain a skilledworkforce. We are subject to the risk that we will not be able to effectively replace the knowledge andexpertise of an aging workforce as workers retire. Without a properly skilled and experienced workforce,our costs, including productivity costs and costs to replace employees may increase, and this couldnegatively impact our earnings.
Inability to protect our intellectual property could negatively affect our competitive position.
We rely on a combination of patents, copyrights, trademarks, trade secrets, confidentiality provisionsand licensing arrangements to establish and protect our proprietary rights. We cannot guarantee, however,that the steps we have taken to protect our intellectual property will be adequate to prevent infringementof our rights or misappropriation of our technology. For example, effective patent, trademark, copyrightand trade secret protection may be unavailable or limited in some of the foreign countries in which weoperate. In addition, while we generally enter into confidentiality agreements with our employees and third
22
parties to protect our intellectual property, such confidentiality agreements could be breached or otherwisemay not provide meaningful protection for our trade secrets and know-how related to the design,manufacture or operation of our products. If it became necessary for us to resort to litigation to protectour intellectual property rights, any proceedings could be burdensome and costly, and we may not prevail.Further, adequate remedies may not be available in the event of an unauthorized use or disclosure of ourtrade secrets and manufacturing expertise. If we fail to successfully enforce our intellectual property rights,our competitive position could suffer, which could harm our business, financial condition, results ofoperations and cash flows.
Significant changes in pension fund investment performance or assumptions changes may have a material effecton the valuation of our obligations under our defined benefit pension plans, the funded status of these plans andour pension expense.
We maintain defined benefit pension plans that are required to be funded in the U.S., Canada, India,Mexico, The Netherlands, Switzerland and the U.K., and defined benefit plans that are not required to befunded in Austria, France, Germany, Japan and Sweden. Our pension liability is materially affected by thediscount rate used to measure our pension obligations and, in the case of the plans that are required to befunded, the level of plan assets available to fund those obligations and the expected long-term rate ofreturn on plan assets. A change in the discount rate can result in a significant increase or decrease in thevaluation of pension obligations, affecting the reported status of our pension plans and our pensionexpense. Significant changes in investment performance or a change in the portfolio mix of invested assetscan result in increases and decreases in the valuation of plan assets or in a change of the expected rate ofreturn on plan assets. This impact may be particularly prevalent where we maintain significantconcentrations of specified investments, such as the U.K. equity and fixed income securities in ournon-U.S. defined benefit plans. Changes in the expected return on plan assets assumption can result insignificant changes in our pension expense and future funding requirements.
We continually review our funding policy related to our U.S. pension plan in accordance withapplicable laws and regulations. U.S. regulations have increased the minimum level of funding for U.Spension plans in prior years, which has at times required significant contributions to our pension plans.Contributions to our pension plans reduce the availability of our cash flows to fund working capital, capitalexpenditures, R&D efforts and other general corporate purposes.
We may incur material costs as a result of product liability and warranty claims, which could adversely affect ourfinancial condition, results of operations and cash flows.
We may be exposed to product liability and warranty claims in the event that the use of one of ourproducts results in, or is alleged to result in, bodily injury and/or property damage or our products actuallyor allegedly fail to perform as expected. While we maintain insurance coverage with respect to certainproduct liability claims, we may not be able to obtain such insurance on acceptable terms in the future, andany such insurance may not provide adequate coverage against product liability claims. In addition,product liability claims can be expensive to defend and can divert the attention of management and otherpersonnel for significant periods of time, regardless of the ultimate outcome. An unsuccessful defense of aproduct liability claim could have an adverse effect on our business, financial condition, results ofoperations and cash flows. Even if we are successful in defending against a claim relating to our products,claims of this nature could cause our customers to lose confidence in our products and our company.Warranty claims are not generally covered by insurance, and we may incur significant warranty costs in thefuture for which we would not be reimbursed.
23
The recording of increased deferred tax asset valuation allowances in the future or the impact of tax law changeson such deferred tax assets could affect our operating results.
We currently have significant net deferred tax assets resulting from tax credit carryforwards, netoperating losses and other deductible temporary differences that are available to reduce taxable income infuture periods. Based on our assessment of our deferred tax assets, we determined, based on projectedfuture income and certain available tax planning strategies, that approximately $250 million of ourdeferred tax assets will more likely than not be realized in the future, and no valuation allowance iscurrently required for this portion of our deferred tax assets. Should we determine in the future that theseassets will not be realized we will be required to record an additional valuation allowance in connectionwith these deferred tax assets and our operating results would be adversely affected in the period suchdetermination is made. In addition, tax law changes could negatively impact our deferred tax assets.
Our outstanding indebtedness and the restrictive covenants in the agreements governing our indebtedness limitour operating and financial flexibility.
We are required to make scheduled repayments and, under certain events of default, mandatoryrepayments on our outstanding indebtedness, which may require us to dedicate a substantial portion of ourcash flows from operations to payments on our indebtedness, thereby reducing the availability of our cashflows to fund working capital, capital expenditures, R&D efforts and other general corporate purposes,such as dividend payments and share repurchases, and could generally limit our flexibility in planning for,or reacting to, changes in our business and industry.
In addition, the agreements governing our indebtedness impose certain operating and financialrestrictions on us and somewhat limit management’s discretion in operating our businesses. Theseagreements limit or restrict our ability, among other things, to: incur additional debt; pay dividends andmake other distributions; prepay subordinated debt; make investments and other restricted payments;create liens; sell assets; and enter into transactions with affiliates.
We are also required to maintain certain debt ratings, comply with leverage and interest coveragefinancial covenants and deliver to our lenders audited annual and unaudited quarterly financial statements.Our ability to comply with these covenants may be affected by events beyond our control. Failure tocomply with these covenants could result in an event of default which, if not cured or waived, may have amaterial adverse effect on our business, financial condition, results of operations and cash flows.
We may not be able to continue to expand our market presence through acquisitions, and any future acquisitionsmay present unforeseen integration difficulties or costs.
Since 1997, we have expanded through a number of acquisitions, and we may pursue strategicacquisitions of businesses in the future. Our ability to implement this growth strategy will be limited by ourability to identify appropriate acquisition candidates, covenants in our credit agreement and other debtagreements and our financial resources, including available cash and borrowing capacity. Acquisitions mayrequire additional debt financing, resulting in higher leverage and an increase in interest expense. Inaddition, acquisitions may require large one-time charges and can result in the incurrence of contingentliabilities, adverse tax consequences, substantial depreciation or deferred compensation charges, theamortization of identifiable purchased intangible assets or impairment of goodwill, any of which couldhave a material adverse effect on our business, financial condition, results of operations and cash flows.
Should we acquire another business, the process of integrating acquired operations into our existingoperations may create operating difficulties and may require significant financial and managerial resourcesthat would otherwise be available for the ongoing development or expansion of existing operations. Someof the more common challenges associated with acquisitions that we may experience include:
• loss of key employees or customers of the acquired company;
24
• conforming the acquired company’s standards, processes, procedures and controls, includingaccounting systems and controls, with our operations, which could cause deficiencies related to ourinternal control over financial reporting;
• coordinating operations that are increased in scope, geographic diversity and complexity;
• retooling and reprogramming of equipment;
• hiring additional management and other critical personnel; and
• the diversion of management’s attention from our day-to-day operations.
Further, no guarantees can be made that we would realize the cost savings, synergies or revenueenhancements that we may anticipate from any acquisition, or that we will realize such benefits within thetime frame that we expect. If we are not able to timely address the challenges associated with acquisitionsand successfully integrate acquired businesses, or if our integrated product and service offerings fail toachieve market acceptance, our business could be adversely affected.
Goodwill impairment could negatively impact our net income and stockholders’ equity.
Goodwill is not amortized, but is tested for impairment at the reporting unit level, which is anoperating segment or one level below an operating segment. Goodwill is required to be tested forimpairment annually and between annual tests if events or circumstances indicate that it is more likely thannot that the fair value of a reporting unit is less than its carrying value. There are numerous risks that maycause the fair value of a reporting unit to fall below its carrying amount, which could lead to themeasurement and recognition of goodwill impairment. These risks include, but are not limited to, loweredexpectations of future financial results, adverse changes in the business climate, an adverse action orassessment by a regulator, the loss of key personnel, a more-likely-than-not expectation that all or asignificant portion of a reporting unit may be disposed of, failure to realize anticipated synergies fromacquisitions, a sustained decline in the Company’s market capitalization, and significant, prolongednegative variances between actual and expected financial results.
Cybersecurity threats could disrupt our business and result in the loss of critical and confidential information.
Our information technology networks and related systems and devices are critical to the operation ofour business and essential to our ability to successfully perform day-to-day operations. Cybersecuritybreaches could expose us to a risk of loss, misuse, or interruption of sensitive and critical information andfunctions, including our proprietary information and information related to our customers, suppliers andemployees. While we devote substantial resources to maintaining adequate levels of cybersecurity, therecan be no assurance that we will be able to prevent all of the rapidly evolving forms of increasinglysophisticated and frequent cyberattacks. The potential consequences of a material cybersecurity incidentinclude reputational damage, litigation with third parties, regulatory actions, theft of intellectual property,and increased cybersecurity protection and remediation costs. If we are unable to prevent, detect oradequately respond to security breaches, our operations could be disrupted and our business could bematerially and adversely affected.
If we are not able to successfully execute and realize the expected financial benefits from our strategic realignmentand other cost-saving initiatives, our business could be adversely affected.
In April 2015, we announced cost saving actions and a strategic manufacturing optimization initiativeintended to reduce our cost structure and drive an optimized, low-cost manufacturing footprint. Thisinitiative was expanded in the latter half of 2015 and the beginning of 2016 to include additionalrealignment activities. This initiative will involve reducing our workforce, accelerating structural changes inour global manufacturing footprint through leveraging investments in low-cost regions, additionalconsolidation of product manufacturing and further selling, general and administrative expense (‘‘SG&A’’)reductions.
25
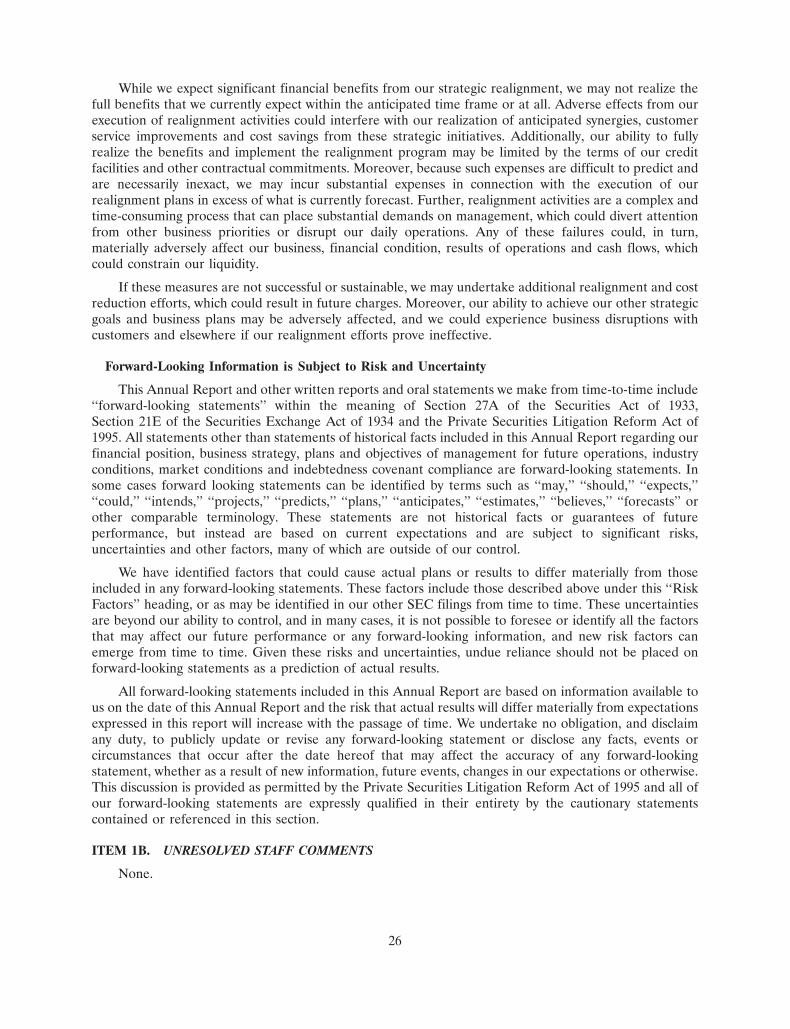
While we expect significant financial benefits from our strategic realignment, we may not realize thefull benefits that we currently expect within the anticipated time frame or at all. Adverse effects from ourexecution of realignment activities could interfere with our realization of anticipated synergies, customerservice improvements and cost savings from these strategic initiatives. Additionally, our ability to fullyrealize the benefits and implement the realignment program may be limited by the terms of our creditfacilities and other contractual commitments. Moreover, because such expenses are difficult to predict andare necessarily inexact, we may incur substantial expenses in connection with the execution of ourrealignment plans in excess of what is currently forecast. Further, realignment activities are a complex andtime-consuming process that can place substantial demands on management, which could divert attentionfrom other business priorities or disrupt our daily operations. Any of these failures could, in turn,materially adversely affect our business, financial condition, results of operations and cash flows, whichcould constrain our liquidity.
If these measures are not successful or sustainable, we may undertake additional realignment and costreduction efforts, which could result in future charges. Moreover, our ability to achieve our other strategicgoals and business plans may be adversely affected, and we could experience business disruptions withcustomers and elsewhere if our realignment efforts prove ineffective.
Forward-Looking Information is Subject to Risk and Uncertainty
This Annual Report and other written reports and oral statements we make from time-to-time include‘‘forward-looking statements’’ within the meaning of Section 27A of the Securities Act of 1933,Section 21E of the Securities Exchange Act of 1934 and the Private Securities Litigation Reform Act of1995. All statements other than statements of historical facts included in this Annual Report regarding ourfinancial position, business strategy, plans and objectives of management for future operations, industryconditions, market conditions and indebtedness covenant compliance are forward-looking statements. Insome cases forward looking statements can be identified by terms such as ‘‘may,’’ ‘‘should,’’ ‘‘expects,’’‘‘could,’’ ‘‘intends,’’ ‘‘projects,’’ ‘‘predicts,’’ ‘‘plans,’’ ‘‘anticipates,’’ ‘‘estimates,’’ ‘‘believes,’’ ‘‘forecasts’’ orother comparable terminology. These statements are not historical facts or guarantees of futureperformance, but instead are based on current expectations and are subject to significant risks,uncertainties and other factors, many of which are outside of our control.
We have identified factors that could cause actual plans or results to differ materially from thoseincluded in any forward-looking statements. These factors include those described above under this ‘‘RiskFactors’’ heading, or as may be identified in our other SEC filings from time to time. These uncertaintiesare beyond our ability to control, and in many cases, it is not possible to foresee or identify all the factorsthat may affect our future performance or any forward-looking information, and new risk factors canemerge from time to time. Given these risks and uncertainties, undue reliance should not be placed onforward-looking statements as a prediction of actual results.
All forward-looking statements included in this Annual Report are based on information available tous on the date of this Annual Report and the risk that actual results will differ materially from expectationsexpressed in this report will increase with the passage of time. We undertake no obligation, and disclaimany duty, to publicly update or revise any forward-looking statement or disclose any facts, events orcircumstances that occur after the date hereof that may affect the accuracy of any forward-lookingstatement, whether as a result of new information, future events, changes in our expectations or otherwise.This discussion is provided as permitted by the Private Securities Litigation Reform Act of 1995 and all ofour forward-looking statements are expressly qualified in their entirety by the cautionary statementscontained or referenced in this section.
ITEM 1B. UNRESOLVED STAFF COMMENTS
None.
26
ITEM 2. PROPERTIES
Our principal executive offices, including our global headquarters, are located at 5215 N. O’ConnorBoulevard, Suite 2300, Irving, Texas 75039. Our global headquarters is a leased facility, which we began tooccupy on January 1, 2004. In September 2011, we extended our original lease term an additional 10 yearsto December 31, 2023. We have the option to renew the current lease for two additional five-year periods.We currently occupy 125,000 square feet at this facility.
Our major manufacturing facilities (those with 50,000 or more square feet of manufacturing capacity)operating at December 31, 2015 are presented in the table below. See ‘‘Item 1. Business’’ in this AnnualReport for further information with respect to all of our manufacturing and operational facilities, includingQRCs.
Number of ApproximateFacilities Square Footage
EPDU.S. . . . . . . . . . . . . . . . . . . . . . . . . . . . . . . . . . . . . . . . . . . . . . . . . . . . 4 725,000Non-U.S. . . . . . . . . . . . . . . . . . . . . . . . . . . . . . . . . . . . . . . . . . . . . . . . . 16 2,874,000
IPDU.S. . . . . . . . . . . . . . . . . . . . . . . . . . . . . . . . . . . . . . . . . . . . . . . . . . . . 4 593,000Non-U.S. . . . . . . . . . . . . . . . . . . . . . . . . . . . . . . . . . . . . . . . . . . . . . . . . 12 3,097,103
FCDU.S. . . . . . . . . . . . . . . . . . . . . . . . . . . . . . . . . . . . . . . . . . . . . . . . . . . . 5 1,027,000Non-U.S. . . . . . . . . . . . . . . . . . . . . . . . . . . . . . . . . . . . . . . . . . . . . . . . . 12 1,764,000
We own the majority of our manufacturing facilities, and those manufacturing facilities we do not ownare leased. We also maintain a substantial network of U.S. and foreign service centers and sales offices,most of which are leased. The majority of our manufacturing leased facilities are covered by leaseagreements with terms ranging from two to seven years, with individual lease terms generally varying basedon the facilities’ primary usage. We believe we will be able to extend leases on our various facilities asnecessary, as they expire.
We believe that our current facilities are adequate to meet the requirements of our present andforeseeable future operations. We continue to review our capacity requirements as part of our strategy tooptimize our global manufacturing efficiency. See Note 10 to our consolidated financial statementsincluded in Item 8 of this Annual Report for additional information regarding our operating leaseobligations.
ITEM 3. LEGAL PROCEEDINGS
We are party to the legal proceedings that are described in Note 12 to our consolidated financialstatements included in Item 8 of this Annual Report, and such disclosure is incorporated by reference intothis Item 3. In addition to the foregoing, we and our subsidiaries are named defendants in certain otherroutine lawsuits incidental to our business and are involved from time to time as parties to governmentalproceedings, all arising in the ordinary course of business. Although the outcome of lawsuits or otherproceedings involving us and our subsidiaries cannot be predicted with certainty, and the amount of anyliability that could arise with respect to such lawsuits or other proceedings cannot be predicted accurately,management does not currently expect these matters, either individually or in the aggregate, to have amaterial effect on our financial position, results of operations or cash flows. We have established reservescovering exposures relating to contingencies to the extent believed to be reasonably estimable andprobable based on past experience and available facts.
ITEM 4. MINE SAFETY DISCLOSURES
Not applicable.
27

ITEM 5. MARKET FOR THE REGISTRANT’S COMMON EQUITY, RELATED STOCHKHOLDERMATTERS AND ISSUER PURCHASES OF EQUITY SECURITIES
Market Information and Dividends
Our common stock is traded on the New York Stock Exchange (‘‘NYSE’’) under the symbol ‘‘FLS.’’On February 11, 2016, our records showed 1,468 shareholders of record. The following table sets forth therange of high and low prices per share of our common stock as reported by the NYSE for the periodsindicated.
PRICE RANGE OF FLOWSERVE COMMON STOCK(Intraday High/Low Prices)
2015 2014
First Quarter . . . . . . . . . . . . . . . . . . . . . . . . . . . . . . . . . . . . . . . . . . . $64.41/$52.75 $82.24/$69.35Second Quarter . . . . . . . . . . . . . . . . . . . . . . . . . . . . . . . . . . . . . . . . . 59.99/51.14 79.98/71.18Third Quarter . . . . . . . . . . . . . . . . . . . . . . . . . . . . . . . . . . . . . . . . . . 53.01/39.47 78.48/70.23Fourth Quarter . . . . . . . . . . . . . . . . . . . . . . . . . . . . . . . . . . . . . . . . . 48.64/39.72 71.06/53.93
The table below presents declaration, record and payment dates, as well as the per share amounts, ofdividends on our common stock during 2015 and 2014:
Declaration Date Record Date Payment Date Dividend Per Share
December 8, 2015 . . . . . . . . . . . . . . . . . . December 23, 2015 January 6, 2016 $0.18September 14, 2015 . . . . . . . . . . . . . . . . . September 25, 2015 October 9, 2015 0.18May 21, 2015 . . . . . . . . . . . . . . . . . . . . . . June 26, 2015 July 10, 2015 0.18February 17, 2015 . . . . . . . . . . . . . . . . . . . March 27, 2015 April 10, 2015 0.18
Declaration Date Record Date Payment Date Dividend Per Share
November 17, 2014 . . . . . . . . . . . . . . . . . December 26, 2014 January 9, 2015 $0.16August 19, 2014 . . . . . . . . . . . . . . . . . . . . September 26, 2014 October 10, 2014 0.16May 22, 2014 . . . . . . . . . . . . . . . . . . . . . . June 27, 2014 July 11, 2014 0.16February 18, 2014 . . . . . . . . . . . . . . . . . . . March 28, 2014 April 11, 2014 0.16
On May 23, 2013, our certificate of incorporation was amended to increase the number of authorizedshares of common stock from 120.0 million to 305.0 million and enable a three-for-one stock splitapproved by the Board of Directors on February 7, 2013 in the form of a 200% common stock dividend.The record date for the stock split was June 7, 2013, and additional shares were distributed on June 21,2013. Shareholders’ equity and all share data, including treasury shares and stock-based compensationaward shares, and per share data presented herein have been retrospectively adjusted to reflect the impactof the increase in authorized shares and the stock split, as appropriate.
On February 17, 2015, our Board of Directors authorized an increase in the payment of quarterlydividends on our common stock from $0.16 per share to $0.18 per share payable beginning on April 10,2015. On February 17, 2014, our Board of Directors authorized an increase in the payment of quarterlydividends on our common stock from $0.14 per share to $0.16 per share payable beginning on April 11,2014. Any subsequent dividends will be reviewed by our Board of Directors on a quarterly basis anddeclared at its discretion dependent on its assessment of our financial situation and business outlook at theapplicable time. Our credit facilities contain covenants that could restrict our ability to declare and paydividends on our common stock. See the discussion of our credit facilities under Item 7 of this AnnualReport and in Note 10 to our consolidated financial statements included in Item 8 of this Annual Report.
28
Issuer Purchases of Equity Securities
Note 14 to our consolidated financial statements included in Item 8 of this Annual Report includes adiscussion of our share repurchase activity and payment of quarterly dividends on our common stock.
During the quarter ended December 31, 2015, we repurchased a total of 1,214,693 shares of ourcommon stock for $54.0 million (representing $44.43 per share) under our current share repurchaseprogram. The following table sets forth the repurchase data for each of the three months during thequarter ended December 31, 2015:
Maximum Number ofShares (or
Total Number of Approximate DollarShares Purchased as Value) That May Yet
Total Number Average Price Paid Part of Publicly Be Purchased UnderPeriod of Shares Purchased per Share Announced Plan the Plan
(In millions)
October 1 - 31 . . . . . . . . . 607,877(1) $42.92 605,403 $188.7November 1 - 30 . . . . . . . . 444,362(2) 45.98 440,490 168.4December 1 - 31 . . . . . . . . 168,800 45.83 168,800 160.7
Total . . . . . . . . . . . . . . . . 1,221,039 $44.43 1,214,693(3)
(1) Includes 2,474 shares that were tendered by employees to satisfy minimum tax withholding amountsfor restricted stock awards at an average price per share of $43.01.
(2) Includes 2,967 shares of common stock purchased at a price of $46.50 per share by a rabbi trust thatwe maintain for non-employee directors who elect to defer their quarterly compensation for paymentat a later date in the form of common stock. Also, includes a total of 905 shares that were tendered byemployees to satisfy minimum tax withholding amounts for restricted stock awards at an average priceper share of $44.95.
(3) For additional information concerning our share repurchase program, please see the discussion inNote 14 to our consolidated financial statements included in Item 8 of this Annual Report.
29
15MAR201615125395
Stock Performance Graph
The following graph depicts the most recent five-year performance of our common stock with theS&P 500 Index and S&P 500 Industrial Machinery. The graph assumes an investment of $100 onDecember 31, 2010, and assumes the reinvestment of any dividends over the following five years. The stockprice performance shown in the graph is not necessarily indicative of future price performance.
$300
$0
2010 2011 2012 2013 2014 2015
$50
$100
$150
$200
$250
S&P 500 Industrial Machinery
S&P 500 IndexFlowserve Corporation
Base Period December 31,
Company/Index 2010 2011 2012 2013 2014 2015
Flowserve Corporation $100.00 $ 84.39 $126.20 $205.18 $157.15 $112.23
S&P 500 Index 100.00 102.11 118.43 156.77 178.22 180.67
S&P 500 Industrial Machinery 100.00 90.71 115.65 168.62 177.13 170.13
30
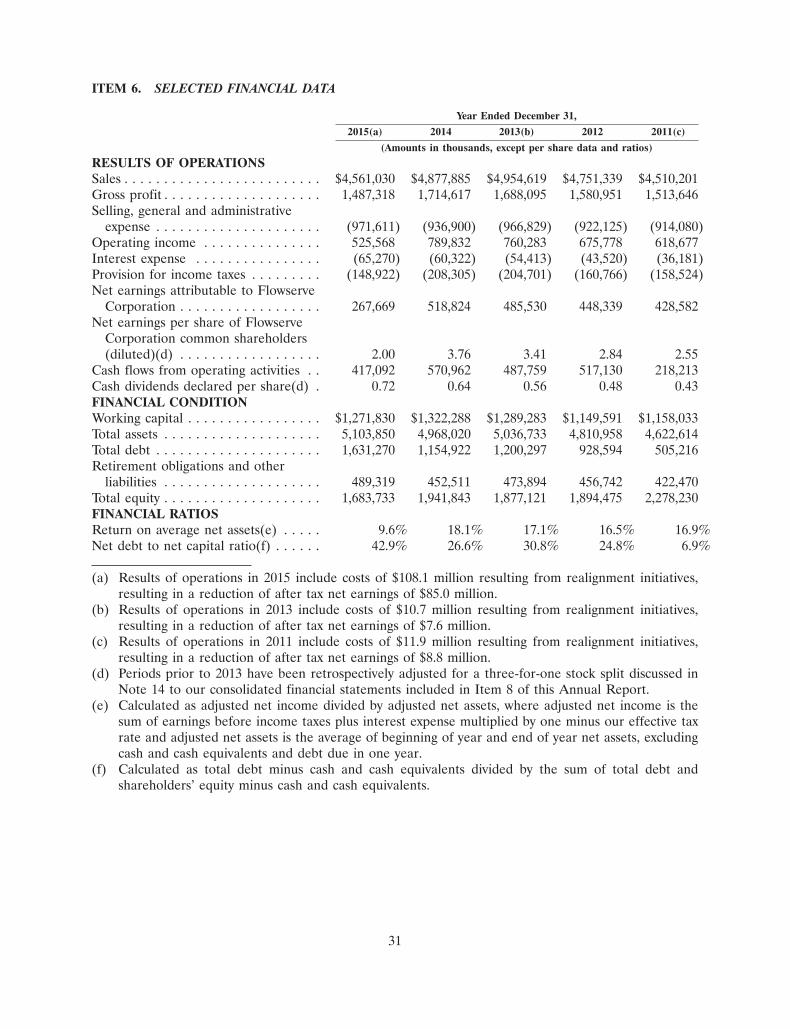
ITEM 6. SELECTED FINANCIAL DATA
Year Ended December 31,
2015(a) 2014 2013(b) 2012 2011(c)
(Amounts in thousands, except per share data and ratios)
RESULTS OF OPERATIONSSales . . . . . . . . . . . . . . . . . . . . . . . . . $4,561,030 $4,877,885 $4,954,619 $4,751,339 $4,510,201Gross profit . . . . . . . . . . . . . . . . . . . . 1,487,318 1,714,617 1,688,095 1,580,951 1,513,646Selling, general and administrative
expense . . . . . . . . . . . . . . . . . . . . . (971,611) (936,900) (966,829) (922,125) (914,080)Operating income . . . . . . . . . . . . . . . 525,568 789,832 760,283 675,778 618,677Interest expense . . . . . . . . . . . . . . . . (65,270) (60,322) (54,413) (43,520) (36,181)Provision for income taxes . . . . . . . . . (148,922) (208,305) (204,701) (160,766) (158,524)Net earnings attributable to Flowserve
Corporation . . . . . . . . . . . . . . . . . . 267,669 518,824 485,530 448,339 428,582Net earnings per share of Flowserve
Corporation common shareholders(diluted)(d) . . . . . . . . . . . . . . . . . . 2.00 3.76 3.41 2.84 2.55
Cash flows from operating activities . . 417,092 570,962 487,759 517,130 218,213Cash dividends declared per share(d) . 0.72 0.64 0.56 0.48 0.43FINANCIAL CONDITIONWorking capital . . . . . . . . . . . . . . . . . $1,271,830 $1,322,288 $1,289,283 $1,149,591 $1,158,033Total assets . . . . . . . . . . . . . . . . . . . . 5,103,850 4,968,020 5,036,733 4,810,958 4,622,614Total debt . . . . . . . . . . . . . . . . . . . . . 1,631,270 1,154,922 1,200,297 928,594 505,216Retirement obligations and other
liabilities . . . . . . . . . . . . . . . . . . . . 489,319 452,511 473,894 456,742 422,470Total equity . . . . . . . . . . . . . . . . . . . . 1,683,733 1,941,843 1,877,121 1,894,475 2,278,230FINANCIAL RATIOSReturn on average net assets(e) . . . . . 9.6% 18.1% 17.1% 16.5% 16.9%Net debt to net capital ratio(f) . . . . . . 42.9% 26.6% 30.8% 24.8% 6.9%
(a) Results of operations in 2015 include costs of $108.1 million resulting from realignment initiatives,resulting in a reduction of after tax net earnings of $85.0 million.
(b) Results of operations in 2013 include costs of $10.7 million resulting from realignment initiatives,resulting in a reduction of after tax net earnings of $7.6 million.
(c) Results of operations in 2011 include costs of $11.9 million resulting from realignment initiatives,resulting in a reduction of after tax net earnings of $8.8 million.
(d) Periods prior to 2013 have been retrospectively adjusted for a three-for-one stock split discussed inNote 14 to our consolidated financial statements included in Item 8 of this Annual Report.
(e) Calculated as adjusted net income divided by adjusted net assets, where adjusted net income is thesum of earnings before income taxes plus interest expense multiplied by one minus our effective taxrate and adjusted net assets is the average of beginning of year and end of year net assets, excludingcash and cash equivalents and debt due in one year.
(f) Calculated as total debt minus cash and cash equivalents divided by the sum of total debt andshareholders’ equity minus cash and cash equivalents.
31
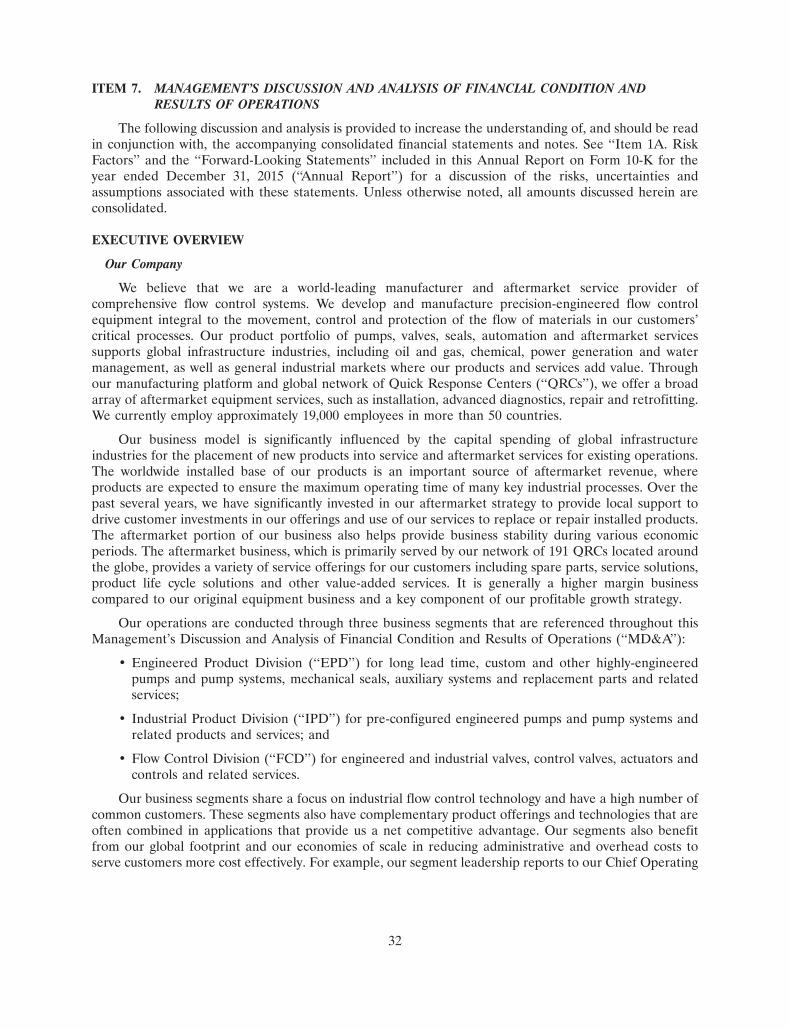
ITEM 7. MANAGEMENT’S DISCUSSION AND ANALYSIS OF FINANCIAL CONDITION ANDRESULTS OF OPERATIONS
The following discussion and analysis is provided to increase the understanding of, and should be readin conjunction with, the accompanying consolidated financial statements and notes. See ‘‘Item 1A. RiskFactors’’ and the ‘‘Forward-Looking Statements’’ included in this Annual Report on Form 10-K for theyear ended December 31, 2015 (‘‘Annual Report’’) for a discussion of the risks, uncertainties andassumptions associated with these statements. Unless otherwise noted, all amounts discussed herein areconsolidated.
EXECUTIVE OVERVIEW
Our Company
We believe that we are a world-leading manufacturer and aftermarket service provider ofcomprehensive flow control systems. We develop and manufacture precision-engineered flow controlequipment integral to the movement, control and protection of the flow of materials in our customers’critical processes. Our product portfolio of pumps, valves, seals, automation and aftermarket servicessupports global infrastructure industries, including oil and gas, chemical, power generation and watermanagement, as well as general industrial markets where our products and services add value. Throughour manufacturing platform and global network of Quick Response Centers (‘‘QRCs’’), we offer a broadarray of aftermarket equipment services, such as installation, advanced diagnostics, repair and retrofitting.We currently employ approximately 19,000 employees in more than 50 countries.
Our business model is significantly influenced by the capital spending of global infrastructureindustries for the placement of new products into service and aftermarket services for existing operations.The worldwide installed base of our products is an important source of aftermarket revenue, whereproducts are expected to ensure the maximum operating time of many key industrial processes. Over thepast several years, we have significantly invested in our aftermarket strategy to provide local support todrive customer investments in our offerings and use of our services to replace or repair installed products.The aftermarket portion of our business also helps provide business stability during various economicperiods. The aftermarket business, which is primarily served by our network of 191 QRCs located aroundthe globe, provides a variety of service offerings for our customers including spare parts, service solutions,product life cycle solutions and other value-added services. It is generally a higher margin businesscompared to our original equipment business and a key component of our profitable growth strategy.
Our operations are conducted through three business segments that are referenced throughout thisManagement’s Discussion and Analysis of Financial Condition and Results of Operations (‘‘MD&A’’):
• Engineered Product Division (‘‘EPD’’) for long lead time, custom and other highly-engineeredpumps and pump systems, mechanical seals, auxiliary systems and replacement parts and relatedservices;
• Industrial Product Division (‘‘IPD’’) for pre-configured engineered pumps and pump systems andrelated products and services; and
• Flow Control Division (‘‘FCD’’) for engineered and industrial valves, control valves, actuators andcontrols and related services.
Our business segments share a focus on industrial flow control technology and have a high number ofcommon customers. These segments also have complementary product offerings and technologies that areoften combined in applications that provide us a net competitive advantage. Our segments also benefitfrom our global footprint and our economies of scale in reducing administrative and overhead costs toserve customers more cost effectively. For example, our segment leadership reports to our Chief Operating
32
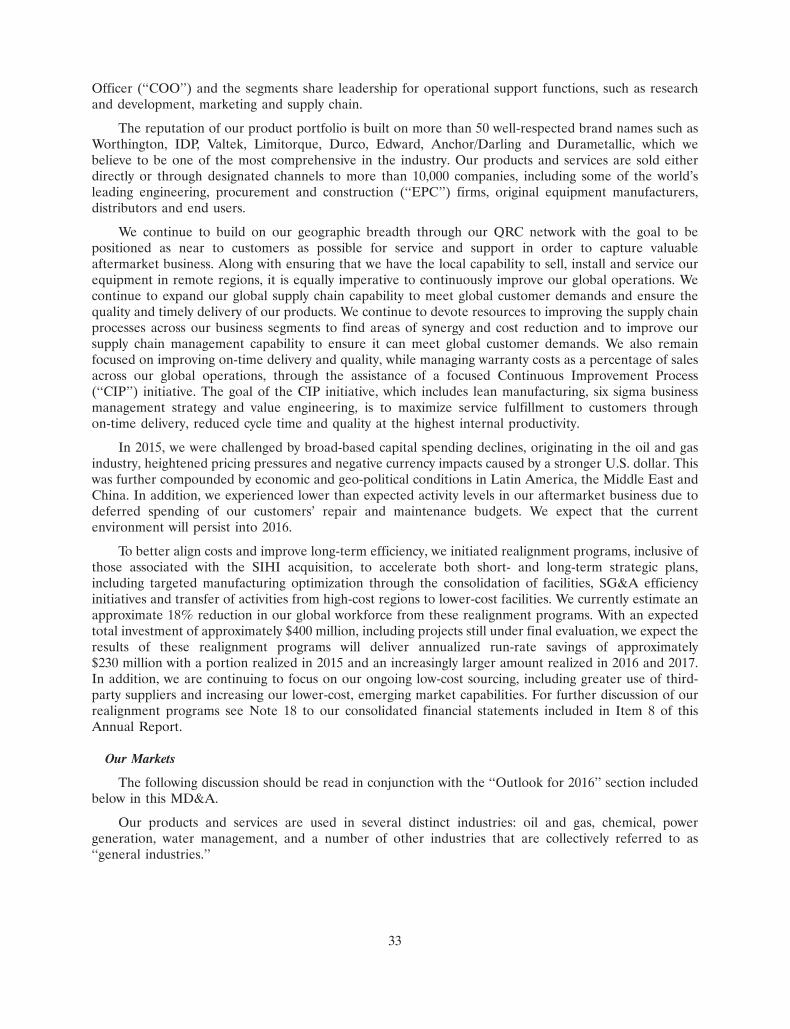
Officer (‘‘COO’’) and the segments share leadership for operational support functions, such as researchand development, marketing and supply chain.
The reputation of our product portfolio is built on more than 50 well-respected brand names such asWorthington, IDP, Valtek, Limitorque, Durco, Edward, Anchor/Darling and Durametallic, which webelieve to be one of the most comprehensive in the industry. Our products and services are sold eitherdirectly or through designated channels to more than 10,000 companies, including some of the world’sleading engineering, procurement and construction (‘‘EPC’’) firms, original equipment manufacturers,distributors and end users.
We continue to build on our geographic breadth through our QRC network with the goal to bepositioned as near to customers as possible for service and support in order to capture valuableaftermarket business. Along with ensuring that we have the local capability to sell, install and service ourequipment in remote regions, it is equally imperative to continuously improve our global operations. Wecontinue to expand our global supply chain capability to meet global customer demands and ensure thequality and timely delivery of our products. We continue to devote resources to improving the supply chainprocesses across our business segments to find areas of synergy and cost reduction and to improve oursupply chain management capability to ensure it can meet global customer demands. We also remainfocused on improving on-time delivery and quality, while managing warranty costs as a percentage of salesacross our global operations, through the assistance of a focused Continuous Improvement Process(‘‘CIP’’) initiative. The goal of the CIP initiative, which includes lean manufacturing, six sigma businessmanagement strategy and value engineering, is to maximize service fulfillment to customers throughon-time delivery, reduced cycle time and quality at the highest internal productivity.
In 2015, we were challenged by broad-based capital spending declines, originating in the oil and gasindustry, heightened pricing pressures and negative currency impacts caused by a stronger U.S. dollar. Thiswas further compounded by economic and geo-political conditions in Latin America, the Middle East andChina. In addition, we experienced lower than expected activity levels in our aftermarket business due todeferred spending of our customers’ repair and maintenance budgets. We expect that the currentenvironment will persist into 2016.
To better align costs and improve long-term efficiency, we initiated realignment programs, inclusive ofthose associated with the SIHI acquisition, to accelerate both short- and long-term strategic plans,including targeted manufacturing optimization through the consolidation of facilities, SG&A efficiencyinitiatives and transfer of activities from high-cost regions to lower-cost facilities. We currently estimate anapproximate 18% reduction in our global workforce from these realignment programs. With an expectedtotal investment of approximately $400 million, including projects still under final evaluation, we expect theresults of these realignment programs will deliver annualized run-rate savings of approximately$230 million with a portion realized in 2015 and an increasingly larger amount realized in 2016 and 2017.In addition, we are continuing to focus on our ongoing low-cost sourcing, including greater use of third-party suppliers and increasing our lower-cost, emerging market capabilities. For further discussion of ourrealignment programs see Note 18 to our consolidated financial statements included in Item 8 of thisAnnual Report.
Our Markets
The following discussion should be read in conjunction with the ‘‘Outlook for 2016’’ section includedbelow in this MD&A.
Our products and services are used in several distinct industries: oil and gas, chemical, powergeneration, water management, and a number of other industries that are collectively referred to as‘‘general industries.’’
33
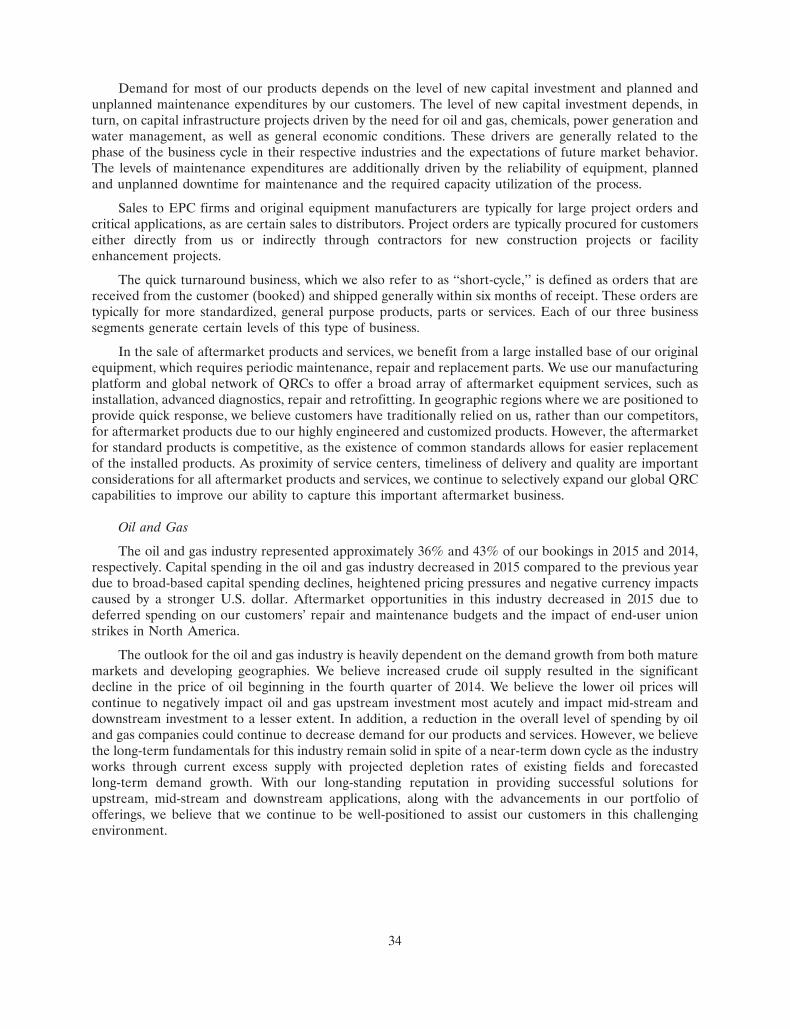
Demand for most of our products depends on the level of new capital investment and planned andunplanned maintenance expenditures by our customers. The level of new capital investment depends, inturn, on capital infrastructure projects driven by the need for oil and gas, chemicals, power generation andwater management, as well as general economic conditions. These drivers are generally related to thephase of the business cycle in their respective industries and the expectations of future market behavior.The levels of maintenance expenditures are additionally driven by the reliability of equipment, plannedand unplanned downtime for maintenance and the required capacity utilization of the process.
Sales to EPC firms and original equipment manufacturers are typically for large project orders andcritical applications, as are certain sales to distributors. Project orders are typically procured for customerseither directly from us or indirectly through contractors for new construction projects or facilityenhancement projects.
The quick turnaround business, which we also refer to as ‘‘short-cycle,’’ is defined as orders that arereceived from the customer (booked) and shipped generally within six months of receipt. These orders aretypically for more standardized, general purpose products, parts or services. Each of our three businesssegments generate certain levels of this type of business.
In the sale of aftermarket products and services, we benefit from a large installed base of our originalequipment, which requires periodic maintenance, repair and replacement parts. We use our manufacturingplatform and global network of QRCs to offer a broad array of aftermarket equipment services, such asinstallation, advanced diagnostics, repair and retrofitting. In geographic regions where we are positioned toprovide quick response, we believe customers have traditionally relied on us, rather than our competitors,for aftermarket products due to our highly engineered and customized products. However, the aftermarketfor standard products is competitive, as the existence of common standards allows for easier replacementof the installed products. As proximity of service centers, timeliness of delivery and quality are importantconsiderations for all aftermarket products and services, we continue to selectively expand our global QRCcapabilities to improve our ability to capture this important aftermarket business.
Oil and Gas
The oil and gas industry represented approximately 36% and 43% of our bookings in 2015 and 2014,respectively. Capital spending in the oil and gas industry decreased in 2015 compared to the previous yeardue to broad-based capital spending declines, heightened pricing pressures and negative currency impactscaused by a stronger U.S. dollar. Aftermarket opportunities in this industry decreased in 2015 due todeferred spending on our customers’ repair and maintenance budgets and the impact of end-user unionstrikes in North America.
The outlook for the oil and gas industry is heavily dependent on the demand growth from both maturemarkets and developing geographies. We believe increased crude oil supply resulted in the significantdecline in the price of oil beginning in the fourth quarter of 2014. We believe the lower oil prices willcontinue to negatively impact oil and gas upstream investment most acutely and impact mid-stream anddownstream investment to a lesser extent. In addition, a reduction in the overall level of spending by oiland gas companies could continue to decrease demand for our products and services. However, we believethe long-term fundamentals for this industry remain solid in spite of a near-term down cycle as the industryworks through current excess supply with projected depletion rates of existing fields and forecastedlong-term demand growth. With our long-standing reputation in providing successful solutions forupstream, mid-stream and downstream applications, along with the advancements in our portfolio ofofferings, we believe that we continue to be well-positioned to assist our customers in this challengingenvironment.
34
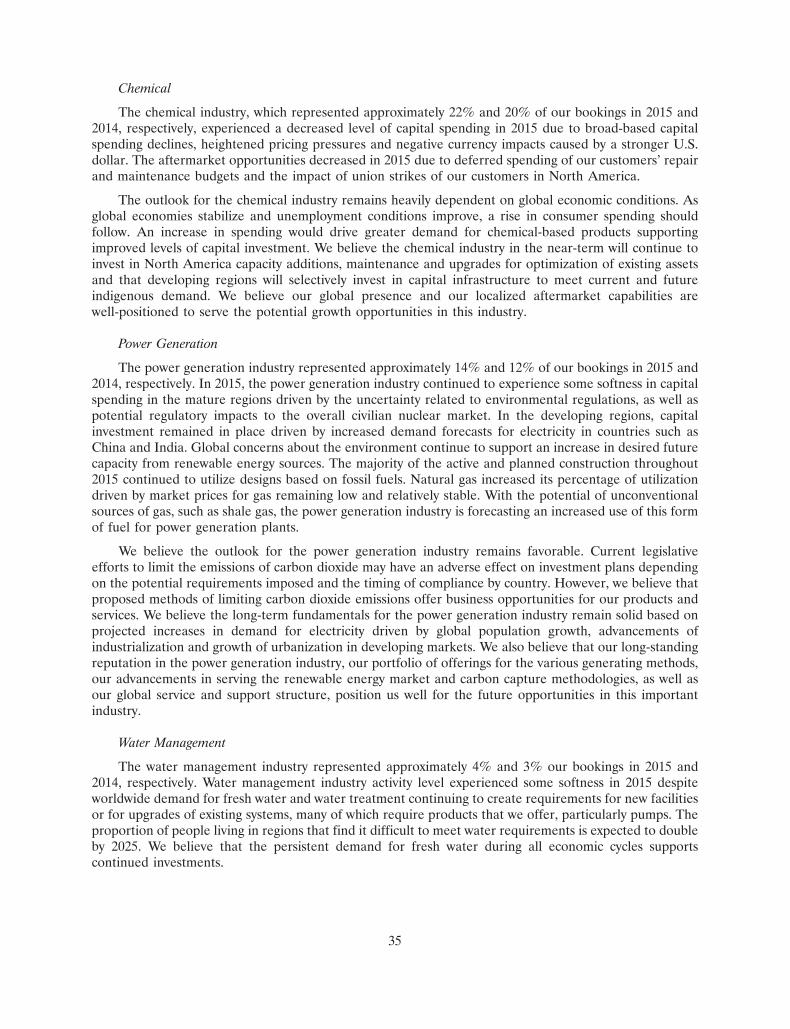
Chemical
The chemical industry, which represented approximately 22% and 20% of our bookings in 2015 and2014, respectively, experienced a decreased level of capital spending in 2015 due to broad-based capitalspending declines, heightened pricing pressures and negative currency impacts caused by a stronger U.S.dollar. The aftermarket opportunities decreased in 2015 due to deferred spending of our customers’ repairand maintenance budgets and the impact of union strikes of our customers in North America.
The outlook for the chemical industry remains heavily dependent on global economic conditions. Asglobal economies stabilize and unemployment conditions improve, a rise in consumer spending shouldfollow. An increase in spending would drive greater demand for chemical-based products supportingimproved levels of capital investment. We believe the chemical industry in the near-term will continue toinvest in North America capacity additions, maintenance and upgrades for optimization of existing assetsand that developing regions will selectively invest in capital infrastructure to meet current and futureindigenous demand. We believe our global presence and our localized aftermarket capabilities arewell-positioned to serve the potential growth opportunities in this industry.
Power Generation
The power generation industry represented approximately 14% and 12% of our bookings in 2015 and2014, respectively. In 2015, the power generation industry continued to experience some softness in capitalspending in the mature regions driven by the uncertainty related to environmental regulations, as well aspotential regulatory impacts to the overall civilian nuclear market. In the developing regions, capitalinvestment remained in place driven by increased demand forecasts for electricity in countries such asChina and India. Global concerns about the environment continue to support an increase in desired futurecapacity from renewable energy sources. The majority of the active and planned construction throughout2015 continued to utilize designs based on fossil fuels. Natural gas increased its percentage of utilizationdriven by market prices for gas remaining low and relatively stable. With the potential of unconventionalsources of gas, such as shale gas, the power generation industry is forecasting an increased use of this formof fuel for power generation plants.
We believe the outlook for the power generation industry remains favorable. Current legislativeefforts to limit the emissions of carbon dioxide may have an adverse effect on investment plans dependingon the potential requirements imposed and the timing of compliance by country. However, we believe thatproposed methods of limiting carbon dioxide emissions offer business opportunities for our products andservices. We believe the long-term fundamentals for the power generation industry remain solid based onprojected increases in demand for electricity driven by global population growth, advancements ofindustrialization and growth of urbanization in developing markets. We also believe that our long-standingreputation in the power generation industry, our portfolio of offerings for the various generating methods,our advancements in serving the renewable energy market and carbon capture methodologies, as well asour global service and support structure, position us well for the future opportunities in this importantindustry.
Water Management
The water management industry represented approximately 4% and 3% our bookings in 2015 and2014, respectively. Water management industry activity level experienced some softness in 2015 despiteworldwide demand for fresh water and water treatment continuing to create requirements for new facilitiesor for upgrades of existing systems, many of which require products that we offer, particularly pumps. Theproportion of people living in regions that find it difficult to meet water requirements is expected to doubleby 2025. We believe that the persistent demand for fresh water during all economic cycles supportscontinued investments.
35
General Industries
General industries represented, in the aggregate, approximately 24% and 22% of our bookings in2015 and 2014, respectively. General industries comprises a variety of different businesses, includingmining and ore processing, pharmaceuticals, pulp and paper, food and beverage and other smallerapplications, none of which individually represented more than 5% of total bookings in 2015 and 2014.General industries also includes sales to distributors, whose end customers operate in the industries weprimarily serve.
The outlook for this group of industries is heavily dependent upon the condition of global economiesand consumer confidence levels. The long-term fundamentals of many of these industries remain sound, asmany of the products produced by these industries are common staples of industrialized and urbanizedeconomies. We believe that our specialty product offerings designed for these industries and ouraftermarket service capabilities will provide continued business opportunities.
OUR RESULTS OF OPERATIONS
Throughout this discussion of our results of operations, we discuss the impact of fluctuations inforeign currency exchange rates. We have calculated currency effects by translating current year results ona monthly basis at prior year exchange rates for the same periods.
Effective March 28, 2013, we and our joint venture partner agreed to exit our joint venture, AudcoIndia, Limited (‘‘AIL’’), which manufactures integrated industrial valves in India. To effect the exit, in twoseparate transactions, we acquired 100% ownership of AIL’s plug valve manufacturing business in an assetpurchase and sold our 50% equity interest in AIL to the joint venture partner. Effective December 10,2013, we acquired for inclusion in IPD, Innovative Mag-Drive, LLC (‘‘Innomag’’), a privately-owned,United States (‘‘U.S.’’) based company specializing in advanced sealless magnetic drive centrifugal pumpsin the chemical and general industries. The results of operations of Innomag and AIL have beenconsolidated since the applicable acquisition dates. No pro forma information has been provided for theseacquisitions due to immateriality.
Effective March 31, 2014, we sold our FCD Naval OY (‘‘Naval’’) business to a Finnish valvemanufacturer. The sale included Naval’s manufacturing facility located in Laitila, Finland and a serviceand support center located in St. Petersburg, Russia.
Effective January 7, 2015, we acquired for inclusion in IPD, 100% of SIHI Group B.V. (‘‘SIHI’’), aglobal provider of engineered vacuum and fluid pumps and related services. The impact of the acquisitionof SIHI for the the year ended December 31, 2015 included bookings of $270.1 million, sales of$294.2 million, gross profit of $53.8 million, operating loss of $47.6 million (including realignment costs of$29.9 million, purchase accounting adjustments of $23.0 million and acquisition-related costs of$11.6 million) and period end backlog of $94.2 million. No pro forma information has been provided forthis acquisition due to immateriality.
Note 2 to our consolidated financial statements included in Item 8. ‘‘Financial Statements andSupplementary Data’’ (‘‘Item 8’’) of this Annual Report discusses the details of the above acquisitions,disposition and the exit of the joint venture.
In the first quarter of 2015, we initiated the R1 Realignment Program to reduce and optimize certainnon-strategic QRCs and manufacturing facilities from the SIHI acquisition. We anticipate a totalinvestment in this program of approximately $50 million.
In the second quarter of 2015, we initiated the R2 Realignment Program to better align costs andimprove long-term efficiency, including further manufacturing optimization through the consolidation offacilities, a reduction in our workforce and the transfer of activities from high-cost regions to lower-costfacilities. In the fourth quarter of 2015, we expanded the scope of our previously announced R2Realignment Program to accelerate our long-term plans by implementing key strategic and structuralchanges to our operating platform and cost structure. Subject to final evaluation, we anticipate a totalinvestment in this program of approximately $350 million, including amounts recorded to income taxexpense.
36

The total charges for realignment programs by segment are detailed below for the year endedDecember 31, 2015:
Engineered Industrial Flow Subtotal — EliminationsProduct Product Control Reportable and All Consolidated
(Amounts in thousands) Division Division Division Segments Other Total
Cost of sales . . . . . . . . . . . . . . . $20,261 $28,760 $17,878 $ 66,899 $— $ 66,899SG&A . . . . . . . . . . . . . . . . . . . 13,448 16,700 11,027 41,175 — 41,175
$33,709 $45,460 $28,905 $108,074 $— $108,074
In addition to the charges above, $8.9 million related to the realignment programs was reported inincome tax expense in our consolidated statement of income for the year ended December 31, 2015. Weanticipate that the majority of the remaining charges related to our realignment programs will be incurredin 2016.
Upon completion of the realignment programs, we expect annual run-rate cost savings ofapproximately $230 million, with a portion realized in 2015 and an increasingly larger amount realized in2016 and 2017. Actual savings realized could vary from expected savings, which represent management’sbest estimate to date.
The following discussion should be read in conjunction with the ‘‘Outlook for 2016’’ section includedin this MD&A.
Bookings and Backlog
2015 2014 2013
(Amounts in millions)
Bookings . . . . . . . . . . . . . . . . . . . . . . . . . . . . . . . . . . . . . . . . . . . . . . $4,176.8 $5,161.0 $4,881.4Backlog (at period end) . . . . . . . . . . . . . . . . . . . . . . . . . . . . . . . . . . . 2,173.2 2,704.2 2,556.9
We define a booking as the receipt of a customer order that contractually engages us to performactivities on behalf of our customer in regards to the manufacture, delivery, and/or support of products orthe delivery of service. Bookings recorded and subsequently canceled within the same fiscal period areexcluded from bookings. Bookings in 2015 decreased by $984.2 million, or 19.1%, as compared with 2014.The decrease included negative currency effects of approximately $377 million. The decrease was primarilydriven by the oil and gas industry, and to a lesser extent, the general and chemical industries. The decreasewas more heavily weighted toward customer original equipment bookings.
Bookings in 2014 increased by $279.6 million, or 5.7%, as compared with 2013. The increase includednegative currency effects of approximately $113 million. The increase was driven by the oil and gas,chemical and general industries, partially offset by the water management industry. The increase was moreheavily weighted toward customer original equipment bookings.
Backlog represents the aggregate value of booked but uncompleted customer orders and is influencedprimarily by bookings, sales, cancellations and currency effects. Backlog of $2.2 billion at December 31,2015 decreased by $531.0 million, or 19.6%, as compared with December 31, 2014. The decrease includednegative currency effects of approximately $145 million (currency effects on backlog are calculated usingthe change in period end exchange rates). The decrease includes the impact of cancellations of$118.4 million of orders booked during prior years. Order cancellations do not typically result in materialnegative impacts to our financial results due to the cancellation provisions of our long lead time contracts.Backlog related to aftermarket orders was approximately 26% and 25% of the backlog at December 31,2015 and 2014, respectively. Backlog of $2.7 billion at December 31, 2014 increased by $147.3 million, or5.8%, as compared with December 31, 2013. The increase included negative currency effects ofapproximately $154 million.
37
Sales
2015 2014 2013
(Amounts in millions)
Sales . . . . . . . . . . . . . . . . . . . . . . . . . . . . . . . . . . . . . . . . . . . . . . . . . $4,561.0 $4,877.9 $4,954.6
Sales in 2015 decreased by $316.9 million, or 6.5%, as compared with 2014. The decrease includednegative currency effects of approximately $433 million. The decrease was more heavily weighted towardsoriginal equipment sales. Sales decreased into every region except for sales into Europe, primarily due tothe favorable impact of SIHI sales into the region. Sales in 2015 include $294.2 million sales from SIHIwhich do not compare to 2014.
Sales in 2014 decreased by $76.7 million, or 1.5%, as compared with 2013. The decrease includednegative currency effects of approximately $112 million. The decrease was due to decreased originalequipment sales, partially offset by increased aftermarket sales, and was driven by decreased sales intoEurope, the Middle East and Asia Pacific, partially offset by increased sales into North America. The saleof the Naval business in the first quarter of 2014 also resulted in a negative impact to the 2013 comparison.
Sales to international customers, including export sales from the U.S., were approximately 66% oftotal sales in 2015, 68% in 2014 and 71% in 2013. Sales into Europe, the Middle East and Africa (‘‘EMA’’)were approximately 34%, 32% and 35% of total sales in 2015, 2014 and 2013, respectively. Sales into AsiaPacific were approximately 18% of total sales in 2015 and 20% for both 2014 and 2013. Sales into LatinAmerica were approximately 9% of total sales in 2015 and 11% for both 2014 and 2013.
Gross Profit and Gross Profit Margin
2015 2014 2013
(Amounts in millions,except percentages)
Gross profit . . . . . . . . . . . . . . . . . . . . . . . . . . . . . . . . . . . . . . . . . . . . $1,487.3 $1,714.6 $1,688.1Gross profit margin . . . . . . . . . . . . . . . . . . . . . . . . . . . . . . . . . . . . . . 32.6% 35.2% 34.1%
Gross profit in 2015 decreased by $227.3 million, or 13.3%, as compared with 2014. Gross profitmargin in 2015 of 32.6% decreased from 35.2% in 2014. The decrease in gross profit margin was primarilyattributed to the negative impact of margins resulting from purchase accounting adjustments on acquiredSIHI backlog and inventory of $18.1 million, charges related to our realignment programs of $66.9 million,and to a lesser extent, certain lower margin projects that shipped from backlog and the negative impact ofdecreased sales on our absorption of fixed manufacturing costs, as compared with the same period in 2014.The decrease was partially offset by a decrease in compensation, which included a decrease in broad-basedannual incentive program compensation, and a mix shift to higher margin aftermarket sales. Aftermarketsales increased to approximately 43% of total sales, as compared with approximately 42% of total sales forthe same period in 2014.
Gross profit in 2014 increased by $26.5 million, or 1.6%, as compared with 2013. Gross profit marginin 2014 of 35.2% increased from 34.1% in 2013. The increase in gross profit margin was primarilyattributed to a mix shift to higher margin aftermarket sales, the effects of lower costs as a result ofoperational improvements and disciplined selectivity of customer bookings, as compared with the sameperiod in 2013. Aftermarket sales increased to approximately 42% of total sales, as compared withapproximately 40% of total sales for the same period in 2013.
38
SG&A
2015 2014 2013
(Amounts in millions,except percentages)
SG&A . . . . . . . . . . . . . . . . . . . . . . . . . . . . . . . . . . . . . . . . . . . . . . . . . . . $971.6 $936.9 $966.8SG&A as a percentage of sales . . . . . . . . . . . . . . . . . . . . . . . . . . . . . . . . . 21.3% 19.2% 19.5%
SG&A in 2015 increased by $34.7 million, or 3.7%, as compared with 2014. Currency effects yielded adecrease of approximately $81 million. SG&A as a percentage of sales in 2015 increased 210 basis points ascompared with the same period in 2014 due in part to $41.2 million of charges related to our realignmentprograms, $11.6 million of SIHI acquisition-related costs, lower sales leverage, a $11.9 million increase inbad debt expense and the $13.4 million gain from the sale of the Naval business in the first quarter of 2014,partially offset by a decrease in compensation, which included a decrease in broad-based annual incentiveprogram compensation, and a $6.8 million gain from the reversal of contingent consideration on ourpurchase of Innovative Mag-Drive, LLC (‘‘Innomag’’).
SG&A in 2014 decreased by $29.9 million, or 3.1%, as compared with 2013. Currency effects yielded adecrease of approximately $15 million. The decrease was primarily attributable to the 2014 gains notedbelow and decreased selling-related expenses. SG&A as a percentage of sales in 2014 decreased 30 basispoints as compared with the same period in 2013 due primarily to a $13.4 million gain from the sale of theNaval business in the first quarter of 2014 and a gain from certain legal matters in the fourth quarter of2014.
Net Earnings from Affiliates
2015 2014 2013
(Amounts in millions)
Net earnings from affiliates . . . . . . . . . . . . . . . . . . . . . . . . . . . . . . . . . . . . . . . $9.9 $12.1 $39.0
Net earnings from affiliates represents our net income from investments in eight joint ventures (onelocated in each of Chile, Japan, Saudi Arabia, South Korea, the United Arab Emirates, and India and twoin China) that are accounted for using the equity method of accounting. Net earnings from affiliates in2015 decreased by $2.2 million primarily as a result of decreased earnings of our EPD joint venture inSouth Korea. Net earnings from affiliates in 2014 decreased by $26.9 million as compared with 2013primarily as a result of the AIL transactions, which resulted in total pre-tax gains of $28.3 million recordedin net earnings from affiliates in 2013.
Operating Income
2015 2014 2013
(Amounts in millions,except percentages)
Operating income . . . . . . . . . . . . . . . . . . . . . . . . . . . . . . . . . . . . . . . . . . . $525.6 $789.8 $760.3Operating income as a percentage of sales . . . . . . . . . . . . . . . . . . . . . . . . . 11.5% 16.2% 15.3%
Operating income in 2015 decreased by $264.2 million, or 33.5%, as compared with 2014. Thedecrease was primarily a result of the $227.3 million decrease in gross profit and the $34.7 million increasein SG&A discussed above. The decrease included negative currency effects of approximately $46 millionand $108.1 million of realignment expense.
Operating income in 2014 increased by $29.5 million, or 3.9%, as compared with 2013. The increaseincluded negative currency effects of approximately $23 million. The increase was primarily a result of the$26.5 million increase in gross profit and the $29.9 million decrease in SG&A discussed above, partiallyoffset by the $28.3 million in pre-tax gains in 2013 from the AIL transactions that did not recur in 2014.
39
Interest Expense and Interest Income
2015 2014 2013
(Amounts in millions)
Interest expense . . . . . . . . . . . . . . . . . . . . . . . . . . . . . . . . . . . . . . . . . . . . . $(65.3) $(60.3) $(54.4)Interest income . . . . . . . . . . . . . . . . . . . . . . . . . . . . . . . . . . . . . . . . . . . . . 2.1 1.7 1.4
Interest expense in 2015 increased by $5.0 million as compared with 2014. The increase was primarilyattributable to interest expense associated with increased borrowings in 2015 related to our public offeringof A500.0 million of Euro senior notes in aggregate principal amount due March 17, 2022 (the ‘‘2022 EURSenior Notes’’) issued on March 17, 2015. Interest expense in 2014 increased by $5.9 million as comparedwith 2013. The increase was attributable to interest expense associated with the senior notes issued in thefourth quarter of 2013. See Note 10 to our consolidated financial statements included in Item 8 of thisAnnual Report for definition and discussion of our various credit resources.
Interest income in 2015 increased by $0.4 million as compared with 2014. The increase was primarilyattributable to higher average cash balances in 2015 as compared with 2014. Interest income in 2014increased by $0.3 million compared to 2013. The increase was primarily attributable to higher average cashbalances in 2014 as compared with 2013.
Other (Expense) Income, net
2015 2014 2013
(Amounts in millions)
Other (expense) income, net . . . . . . . . . . . . . . . . . . . . . . . . . . . . . . . . . . . . . $(40.2) $2.0 $(14.3)
Other expense, net increased $42.2 million from income of $2.0 million in 2014 to a loss of$40.2 million in 2015. The increase was primarily due to a $57.0 million increase in losses arising fromtransactions in currencies other than our sites’ functional currencies, including the impact of the$18.5 million loss as a result of the first quarter of 2015 remeasurement of our bolivar-denominatedVenezuelan net monetary assets, partially offset by a $15.4 million increase in gains from foreign exchangecontracts. The changes are primarily due to the foreign currency exchange rate movements of the Brazilianreal, Mexican peso and Euro in relation to the U.S. dollar as compared with the same period in 2014.
Other income, net increased $16.3 million from a loss of $14.3 million in 2013 to a gain of $2.0 millionin 2014. The increase was primarily due to a $12.8 million increase in gains from foreign exchangecontracts and a $2.7 million decrease in losses arising from transactions in currencies other than our sites’functional currencies. The change is primarily due to the foreign currency exchange rate movements of theMexican peso, Japanese yen and Euro in relation to the U.S. dollar.
Tax Expense and Tax Rate
2015 2014 2013
(Amounts in millions,except percentages)
Provision for income taxes . . . . . . . . . . . . . . . . . . . . . . . . . . . . . . . . . . . . . $148.9 $208.3 $204.7Effective tax rate . . . . . . . . . . . . . . . . . . . . . . . . . . . . . . . . . . . . . . . . . . . . 35.3% 28.4% 29.5%
The 2015 tax rate differed from the federal statutory rate of 35% primarily due to tax impacts of therealignment programs, the non-deductible Venezuelan exchange rate remeasurement loss and theestablishment of a valuation allowance against our deferred tax assets in Brazil in the amount of$12.6 million (due to deteriorating economic conditions in Brazil), substantially offset by the net impact offoreign operations, which included the impacts of lower foreign tax rates and changes in our reservesestablished for uncertain tax positions. Our effective tax rate of 35.3% for the year ended December 31,
40
2015 increased from 28.4% in 2014 due primarily to the unfavorable tax impacts described above. The 2014and 2013 effective tax rates differed from the federal statutory rate of 35% primarily due to the net impactof foreign operations, which included the impacts of lower foreign tax rates and changes in our reservesestablished for uncertain tax positions.
On May 17, 2006, the Tax Increase Prevention and Reconciliation Act of 2005 was signed into law,creating an exclusion from U.S. taxable income for certain types of foreign related party payments ofdividends, interest, rents and royalties that, prior to 2006, had been subject to U.S. taxation. OnDecember 18, 2015, this exclusion was further extended for five additional years. This exclusion is effectivefor the years 2006 through 2019, and applies to certain of our related party payments.
Our effective tax rate is based upon current earnings and estimates of future taxable earnings for eachdomestic and international location. Changes in any of these and other factors, including our ability toutilize foreign tax credits and net operating losses or results from tax audits, could impact the tax rate infuture periods. As of December 31, 2015, we have foreign tax credits of $46.5 million, expiring in 2021through 2024 against which we recorded a valuation allowance of $0.6 million. Additionally, we haverecorded other net deferred tax assets of $42.2 million, which relate to net operating losses, tax credits andother deductible temporary differences that are available to reduce taxable income in future periods, mostof which do not have a definite expiration. Should we not be able to utilize all or a portion of these creditsand losses, our effective tax rate would increase.
Net Earnings and Earnings Per Share
2015 2014 2013
(Amounts in millions,except per share amounts)
Net earnings attributable to Flowserve Corporation . . . . . . . . . . . . . . . . . . . $267.7 $518.8 $485.5Net earnings per share — diluted . . . . . . . . . . . . . . . . . . . . . . . . . . . . . . . . $ 2.00 $ 3.76 $ 3.41Average diluted shares . . . . . . . . . . . . . . . . . . . . . . . . . . . . . . . . . . . . . . . 133.8 137.8 142.4
Net earnings in 2015 decreased by $251.1 million to $267.7 million, or to $2.00 per diluted share, ascompared with 2014. The decrease was primarily attributable to a $264.2 million decrease in operatingincome, a $42.2 million increase in other expense, net and a $5.0 million increase in interest expense,partially offset by a $59.4 million decrease in tax expense.
Net earnings in 2014 increased by $33.3 million to $518.8 million, or to $3.76 per diluted share, ascompared with 2013. The increase was primarily attributable to a $29.5 million increase in operatingincome and a $16.3 million increase in other income, net, partially offset by a $5.9 million increase ininterest expense and a $3.6 million increase in tax expense.
Other Comprehensive (Loss) Income
2015 2014 2013
(Amounts in millions)
Other comprehensive (loss) income . . . . . . . . . . . . . . . . . . . . . . . . . . . . . . . $(158.2) $(158.8) $2.8
Other comprehensive loss in 2015 decreased by $0.6 million to $158.2 million as compared to$158.8 million in 2014. The loss was primarily due to the foreign currency exchange rate movements of theEuro, Brazilian real and Argentine peso versus the U.S. dollar at December 31, 2015 as compared with2014.
Other comprehensive loss in 2014 increased to $158.8 million as compared to income of $2.8 millionin 2013. The increase was almost entirely due to foreign currency translation impacts resulting from theweakening of the Euro versus the U.S. dollar and, to a lesser extent, all other major currencies that wehave exposure to at December 31, 2014 as compared with December 31, 2013.
41
Business Segments
We conduct our operations through three business segments based on type of product and how wemanage the business. We evaluate segment performance and allocate resources based on each segment’soperating income. See Note 16 to our consolidated financial statements included in Item 8 of this AnnualReport for further discussion of our segments. The key operating results for our three business segments,EPD, IPD and FCD, are discussed below.
Engineered Product Division Segment Results
Our largest business segment is EPD, through which we design, manufacture, distribute and servicecustom and other highly-engineered pumps and pump systems, mechanical seals and auxiliary systems(collectively referred to as ‘‘original equipment’’). EPD includes longer lead time, highly-engineered pumpproducts, and shorter cycle engineered pumps and mechanical seals that are generally manufactured withinshorter lead times. EPD also manufactures replacement parts and related equipment and provides a fullarray of replacement parts, repair and support services (collectively referred to as ‘‘aftermarket’’). EPDprimarily operates in the oil and gas, power generation, chemical, water management and generalindustries. EPD operates in 47 countries with 33 manufacturing facilities worldwide, 10 of which arelocated in Europe, 11 in North America, seven in Asia and five in Latin America, and it has 129 QRCs,including those co-located in manufacturing facilities and/or shared with FCD.
EPD
2015 2014 2013
(Amounts in millions,except percentages)
Bookings . . . . . . . . . . . . . . . . . . . . . . . . . . . . . . . . . . . . . . . . . . . . . . $2,065.6 $2,832.8 $2,581.7Sales . . . . . . . . . . . . . . . . . . . . . . . . . . . . . . . . . . . . . . . . . . . . . . . . . 2,260.0 2,564.6 2,650.4Gross profit . . . . . . . . . . . . . . . . . . . . . . . . . . . . . . . . . . . . . . . . . . . . 746.4 892.5 903.6Gross profit margin . . . . . . . . . . . . . . . . . . . . . . . . . . . . . . . . . . . . . . 33.0% 34.8% 34.1%Segment operating income . . . . . . . . . . . . . . . . . . . . . . . . . . . . . . . . . 329.0 447.2 445.2Segment operating income as a percentage of sales . . . . . . . . . . . . . . . 14.6% 17.4% 16.8%Backlog (at period end) . . . . . . . . . . . . . . . . . . . . . . . . . . . . . . . . . . . 1,157.3 1,573.3 1,379.8
Bookings in 2015 decreased by $767.2 million, or 27.1%, as compared with 2014. The decreaseincluded negative currency effects of approximately $228 million. The decrease in customer bookings wasprimarily driven by the oil and gas industry, and to a lesser extent, the chemical and general industries.Customer bookings decreased $267.5 million into North America, $226.0 million into Latin America,$149.1 million into Europe, and $92.4 million into Asia Pacific. The decrease was more heavily weightedtoward customer original equipment bookings. Of the $2.1 billion of bookings in 2015, approximately 47%were from oil and gas, 19% from general industries, 17% from chemical, 15% from power generation and2% from water management. Interdivision bookings (which are eliminated and are not included inconsolidated bookings as disclosed above) decreased $18.9 million.
Bookings in 2014 increased by $251.1 million, or 9.7%, as compared with 2013. The increase includednegative currency effects of approximately $103 million. The increase in customer bookings was primarilydriven by the oil and gas and chemical industries, partially offset by the power generation industry.Customer bookings increased $208.6 million into North America, $60.8 million into Europe, $46.8 millioninto Latin America and $41.5 million into the Middle East, partially offset by a decrease of $115.8 millioninto Asia Pacific. The increase was more heavily weighted toward customer aftermarket bookings. Of the$2.8 billion of bookings in 2014, approximately 55% were from oil and gas, 16% from chemical, 15% fromgeneral industries, 13% from power generation and 1% from water management. Interdivision bookings(which are eliminated and are not included in consolidated bookings as disclosed above) increased$9.7 million.
42
Sales in 2015 decreased $304.6 million, or 11.9%, as compared with 2014. The decrease includednegative currency effects of approximately $258 million. The decrease was primarily driven by decreasedoriginal equipment sales, resulting from decreased customer sales of $127.4 million into Asia Pacific,$71.4 million into Latin America, $39.9 million into the Middle East, $27.8 million into Europe and$11.3 million into North America. Interdivision sales (which are eliminated and are not included inconsolidated sales as disclosed above) decreased $10.0 million.
Sales in 2014 decreased $85.8 million, or 3.2%, as compared with 2013. The decrease includednegative currency effects of approximately $101 million. The decrease was primarily driven by decreasedoriginal equipment sales, primarily resulting from decreased customer sales of $63.0 million into AsiaPacific, $41.4 million into the Middle East, $38.7 million into Europe, $27.0 million into Latin America and$19.9 million into Africa, partially offset by increased sales of $96.7 million into North America.Interdivision sales (which are eliminated and are not included in consolidated sales as disclosed above)increased $1.3 million.
Gross profit in 2015 decreased by $146.1 million, or 16.4%, as compared with 2014. Gross profitmargin in 2015 of 33.0% decreased from 34.8% in 2014. The decrease in gross profit margin was primarilyattributable to the charges related to our realignment programs and the negative impact of decreased saleson our absorption of fixed manufacturing costs, partially offset by a decrease in broad-based annualincentive program compensation.
Gross profit in 2014 decreased by $11.1 million, or 1.2%, as compared with 2013. Gross profit marginin 2014 of 34.8% increased from 34.1% in 2013. The increase in gross profit margin was primarilyattributable to a mix shift to higher margin aftermarket sales, disciplined selectivity of customer bookingsand the effects of lower costs associated with operational execution improvements, partially offset by thenegative impact of decreased sales on the absorption of fixed manufacturing costs.
Operating income in 2015 decreased by $118.2 million, or 26.4%, as compared with 2014. Thedecrease included negative currency effects of approximately $28 million. The decrease was due to a$146.1 million decrease in gross profit, partially offset by a $31.0 million decrease in SG&A (including adecrease due to currency effects of approximately $49 million). The decrease in SG&A was due primarilyto decreased selling and marketing-related expenses resulting from lower sales, savings associated withstrategic cost reduction programs and a decrease in broad-based annual incentive program compensation,partially offset by charges related to our realignment programs and increased bad debt expense.
Operating income in 2014 increased by $2.0 million, or 0.4%, as compared with 2013. The increaseincluded negative currency effects of approximately $20 million. The increase was due to a $10.9 milliondecrease in SG&A (including a decrease due to currency effects of approximately $14 million)substantially offset by a $11.1 million decrease in gross profit. The decrease in SG&A was due primarily todecreased selling-related expenses.
Backlog of $1.2 billion at December 31, 2015 decreased by $416.0 million, or 26.4%, as compared withDecember 31, 2014. Currency effects provided a decrease of approximately $80 million. The decreaseincludes the impact of cancellations of $104.0 million of orders booked during prior years. Ordercancellations do not typically result in material negative impacts to our financial results due to thecancellation provisions of our long lead time contracts. Backlog at December 31, 2015 included$10.5 million of interdivision backlog (which is eliminated and not included in consolidated backlog asdisclosed above). Backlog of $1.6 billion at December 31, 2014 increased by $193.5 million, or 14.0%, ascompared with December 31, 2013. Currency effects provided a decrease of approximately $72 million.Backlog at December 31, 2014 included $16.3 million of interdivision backlog (which is eliminated and notincluded in consolidated backlog as disclosed above).
43
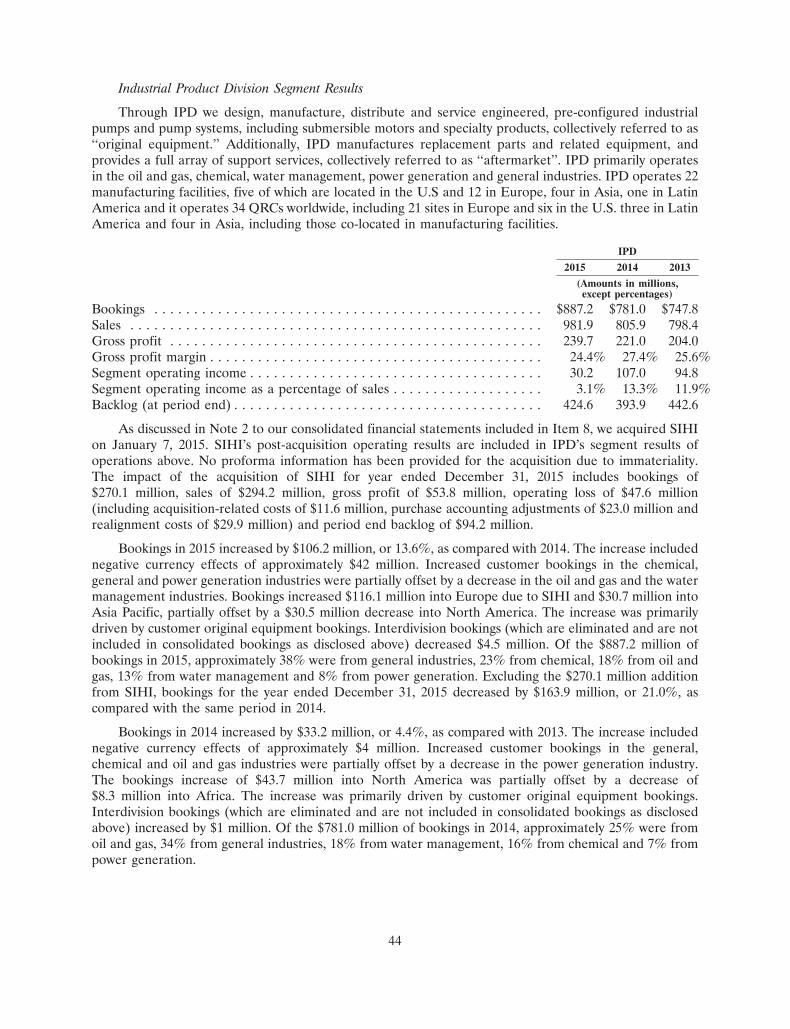
Industrial Product Division Segment Results
Through IPD we design, manufacture, distribute and service engineered, pre-configured industrialpumps and pump systems, including submersible motors and specialty products, collectively referred to as‘‘original equipment.’’ Additionally, IPD manufactures replacement parts and related equipment, andprovides a full array of support services, collectively referred to as ‘‘aftermarket’’. IPD primarily operatesin the oil and gas, chemical, water management, power generation and general industries. IPD operates 22manufacturing facilities, five of which are located in the U.S and 12 in Europe, four in Asia, one in LatinAmerica and it operates 34 QRCs worldwide, including 21 sites in Europe and six in the U.S. three in LatinAmerica and four in Asia, including those co-located in manufacturing facilities.
IPD
2015 2014 2013
(Amounts in millions,except percentages)
Bookings . . . . . . . . . . . . . . . . . . . . . . . . . . . . . . . . . . . . . . . . . . . . . . . . . $887.2 $781.0 $747.8Sales . . . . . . . . . . . . . . . . . . . . . . . . . . . . . . . . . . . . . . . . . . . . . . . . . . . . 981.9 805.9 798.4Gross profit . . . . . . . . . . . . . . . . . . . . . . . . . . . . . . . . . . . . . . . . . . . . . . . 239.7 221.0 204.0Gross profit margin . . . . . . . . . . . . . . . . . . . . . . . . . . . . . . . . . . . . . . . . . . 24.4% 27.4% 25.6%Segment operating income . . . . . . . . . . . . . . . . . . . . . . . . . . . . . . . . . . . . . 30.2 107.0 94.8Segment operating income as a percentage of sales . . . . . . . . . . . . . . . . . . . 3.1% 13.3% 11.9%Backlog (at period end) . . . . . . . . . . . . . . . . . . . . . . . . . . . . . . . . . . . . . . . 424.6 393.9 442.6
As discussed in Note 2 to our consolidated financial statements included in Item 8, we acquired SIHIon January 7, 2015. SIHI’s post-acquisition operating results are included in IPD’s segment results ofoperations above. No proforma information has been provided for the acquisition due to immateriality.The impact of the acquisition of SIHI for year ended December 31, 2015 includes bookings of$270.1 million, sales of $294.2 million, gross profit of $53.8 million, operating loss of $47.6 million(including acquisition-related costs of $11.6 million, purchase accounting adjustments of $23.0 million andrealignment costs of $29.9 million) and period end backlog of $94.2 million.
Bookings in 2015 increased by $106.2 million, or 13.6%, as compared with 2014. The increase includednegative currency effects of approximately $42 million. Increased customer bookings in the chemical,general and power generation industries were partially offset by a decrease in the oil and gas and the watermanagement industries. Bookings increased $116.1 million into Europe due to SIHI and $30.7 million intoAsia Pacific, partially offset by a $30.5 million decrease into North America. The increase was primarilydriven by customer original equipment bookings. Interdivision bookings (which are eliminated and are notincluded in consolidated bookings as disclosed above) decreased $4.5 million. Of the $887.2 million ofbookings in 2015, approximately 38% were from general industries, 23% from chemical, 18% from oil andgas, 13% from water management and 8% from power generation. Excluding the $270.1 million additionfrom SIHI, bookings for the year ended December 31, 2015 decreased by $163.9 million, or 21.0%, ascompared with the same period in 2014.
Bookings in 2014 increased by $33.2 million, or 4.4%, as compared with 2013. The increase includednegative currency effects of approximately $4 million. Increased customer bookings in the general,chemical and oil and gas industries were partially offset by a decrease in the power generation industry.The bookings increase of $43.7 million into North America was partially offset by a decrease of$8.3 million into Africa. The increase was primarily driven by customer original equipment bookings.Interdivision bookings (which are eliminated and are not included in consolidated bookings as disclosedabove) increased by $1 million. Of the $781.0 million of bookings in 2014, approximately 25% were fromoil and gas, 34% from general industries, 18% from water management, 16% from chemical and 7% frompower generation.
44
Sales in 2015 increased by $176.0 million, or 21.8%, as compared with 2014. The increase includednegative currency effects of approximately $50 million and was primarily driven by customer originalequipment sales. Customer sales increased $151.7 million into Europe, $39.8 million into North Americaand $36.6 million into Asia Pacific due to SIHI, partially offset by decreased sales of $29.6 million intoLatin America and $22.1 million into Africa. Interdivision sales (which are eliminated and are not includedin consolidated sales as disclosed above) decreased $0.8 million. Excluding the $294.2 million additionfrom SIHI, sales for the year ended December 31, 2015 decreased by $118.2 million, or 14.7%, ascompared with the same period in 2014.
Sales in 2014 increased by $7.5 million, or 0.9%, as compared with 2013. The decrease includednegative currency effects of approximately $4 million. Decreased customer sales of $24.2 million into theMiddle East, were partially offset by increased customer sales of $31.4 million into Asia Pacific.Interdivision sales (which are eliminated and are not included in consolidated sales as disclosed above)decreased $1.1 million.
Gross profit in 2015 increased by $18.7 million, or 8.5%, as compared with 2014. Gross profit marginin 2015 of 24.4% decreased from 27.4% in 2014. The decrease in gross profit margin was primarilyattributable to charges related to our realignment programs and the negative impact of SIHI’s PurchaseAccounting Adjustments, partially offset by a decrease in broad-based annual incentive programcompensation.
Gross profit in 2014 increased by $17.0 million, or 8.3%, as compared with 2013. Gross profit marginin 2014 of 27.4% increased from 25.6% in 2013. The increase was primarily attributable to a sales mix shiftto higher margin aftermarket sales, lower manufacturing costs resulting from our execution of operationalimprovements and disciplined selectivity of customer bookings.
Operating income for 2015 decreased by $76.8 million, or 71.8%, as compared with 2014. Thedecrease included negative currency effects of approximately $5 million. The decrease was primarily due toa $96.6 million increase in SG&A, due primarily to the inclusion of SIHI’s SG&A, which included chargesrelated to our realignment programs and acquisition-related costs, and increased bad debt expense,partially offset by a decrease in broad-based annual incentive compensation.
Operating income for 2014 increased by $12.2 million, or 12.9%, as compared with 2013. The increaseincluded negative currency effects of approximately $2 million. The increase was due to the $17.0 millionincrease in gross profit, partially offset by a $4.8 million increase in SG&A due in part to increasedspending on research and development.
Backlog of $424.6 million at December 31, 2015 increased by $30.7 million, or 7.8%, as compared withDecember 31, 2014. Currency effects provided a decrease of approximately $16 million. Backlog atDecember 31, 2015 included $15.7 million of interdivision backlog (which is eliminated and not included inconsolidated backlog as disclosed above). Backlog of $393.9 million at December 31, 2014 decreased by$48.7 million, or 11.0%, as compared to December 31, 2013. Currency effects provided an decrease ofapproximately $41 million. Backlog at December 31, 2014 included $18.0 million of interdivision backlog(which is eliminated and not included in consolidated backlog as disclosed above). Excluding the$94.2 million impact of SIHI, backlog decreased by $63.5 million, or 16.1%, as compared withDecember 31, 2014.
Flow Control Division Segment Results
Our second largest business segment is FCD, which designs, manufactures and distributes a broadportfolio of engineered-to-order and configured-to-order isolation valves, control valves, valve automationproducts, boiler controls and related services. FCD leverages its experience and application know-how byoffering a complete menu of engineered services to complement its expansive product portfolio. FCD hasa total of 58 manufacturing facilities and QRCs in 25 countries around the world, with five of its
45
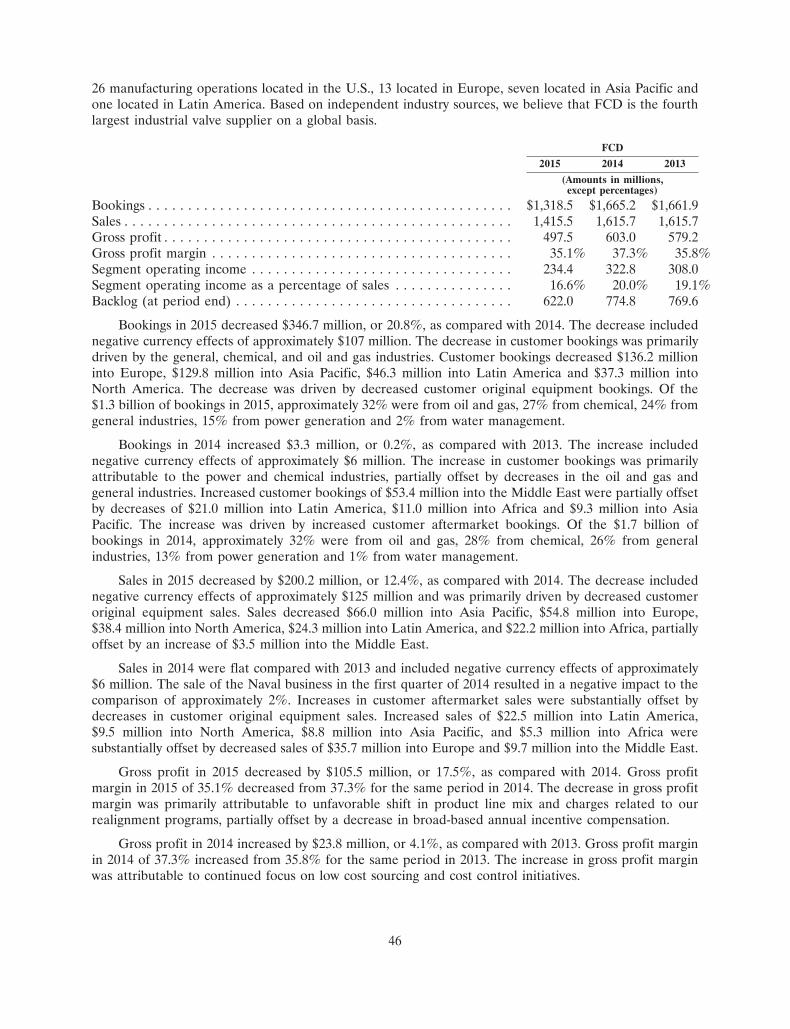
26 manufacturing operations located in the U.S., 13 located in Europe, seven located in Asia Pacific andone located in Latin America. Based on independent industry sources, we believe that FCD is the fourthlargest industrial valve supplier on a global basis.
FCD
2015 2014 2013
(Amounts in millions,except percentages)
Bookings . . . . . . . . . . . . . . . . . . . . . . . . . . . . . . . . . . . . . . . . . . . . . . $1,318.5 $1,665.2 $1,661.9Sales . . . . . . . . . . . . . . . . . . . . . . . . . . . . . . . . . . . . . . . . . . . . . . . . . 1,415.5 1,615.7 1,615.7Gross profit . . . . . . . . . . . . . . . . . . . . . . . . . . . . . . . . . . . . . . . . . . . . 497.5 603.0 579.2Gross profit margin . . . . . . . . . . . . . . . . . . . . . . . . . . . . . . . . . . . . . . 35.1% 37.3% 35.8%Segment operating income . . . . . . . . . . . . . . . . . . . . . . . . . . . . . . . . . 234.4 322.8 308.0Segment operating income as a percentage of sales . . . . . . . . . . . . . . . 16.6% 20.0% 19.1%Backlog (at period end) . . . . . . . . . . . . . . . . . . . . . . . . . . . . . . . . . . . 622.0 774.8 769.6
Bookings in 2015 decreased $346.7 million, or 20.8%, as compared with 2014. The decrease includednegative currency effects of approximately $107 million. The decrease in customer bookings was primarilydriven by the general, chemical, and oil and gas industries. Customer bookings decreased $136.2 millioninto Europe, $129.8 million into Asia Pacific, $46.3 million into Latin America and $37.3 million intoNorth America. The decrease was driven by decreased customer original equipment bookings. Of the$1.3 billion of bookings in 2015, approximately 32% were from oil and gas, 27% from chemical, 24% fromgeneral industries, 15% from power generation and 2% from water management.
Bookings in 2014 increased $3.3 million, or 0.2%, as compared with 2013. The increase includednegative currency effects of approximately $6 million. The increase in customer bookings was primarilyattributable to the power and chemical industries, partially offset by decreases in the oil and gas andgeneral industries. Increased customer bookings of $53.4 million into the Middle East were partially offsetby decreases of $21.0 million into Latin America, $11.0 million into Africa and $9.3 million into AsiaPacific. The increase was driven by increased customer aftermarket bookings. Of the $1.7 billion ofbookings in 2014, approximately 32% were from oil and gas, 28% from chemical, 26% from generalindustries, 13% from power generation and 1% from water management.
Sales in 2015 decreased by $200.2 million, or 12.4%, as compared with 2014. The decrease includednegative currency effects of approximately $125 million and was primarily driven by decreased customeroriginal equipment sales. Sales decreased $66.0 million into Asia Pacific, $54.8 million into Europe,$38.4 million into North America, $24.3 million into Latin America, and $22.2 million into Africa, partiallyoffset by an increase of $3.5 million into the Middle East.
Sales in 2014 were flat compared with 2013 and included negative currency effects of approximately$6 million. The sale of the Naval business in the first quarter of 2014 resulted in a negative impact to thecomparison of approximately 2%. Increases in customer aftermarket sales were substantially offset bydecreases in customer original equipment sales. Increased sales of $22.5 million into Latin America,$9.5 million into North America, $8.8 million into Asia Pacific, and $5.3 million into Africa weresubstantially offset by decreased sales of $35.7 million into Europe and $9.7 million into the Middle East.
Gross profit in 2015 decreased by $105.5 million, or 17.5%, as compared with 2014. Gross profitmargin in 2015 of 35.1% decreased from 37.3% for the same period in 2014. The decrease in gross profitmargin was primarily attributable to unfavorable shift in product line mix and charges related to ourrealignment programs, partially offset by a decrease in broad-based annual incentive compensation.
Gross profit in 2014 increased by $23.8 million, or 4.1%, as compared with 2013. Gross profit marginin 2014 of 37.3% increased from 35.8% for the same period in 2013. The increase in gross profit marginwas attributable to continued focus on low cost sourcing and cost control initiatives.
46
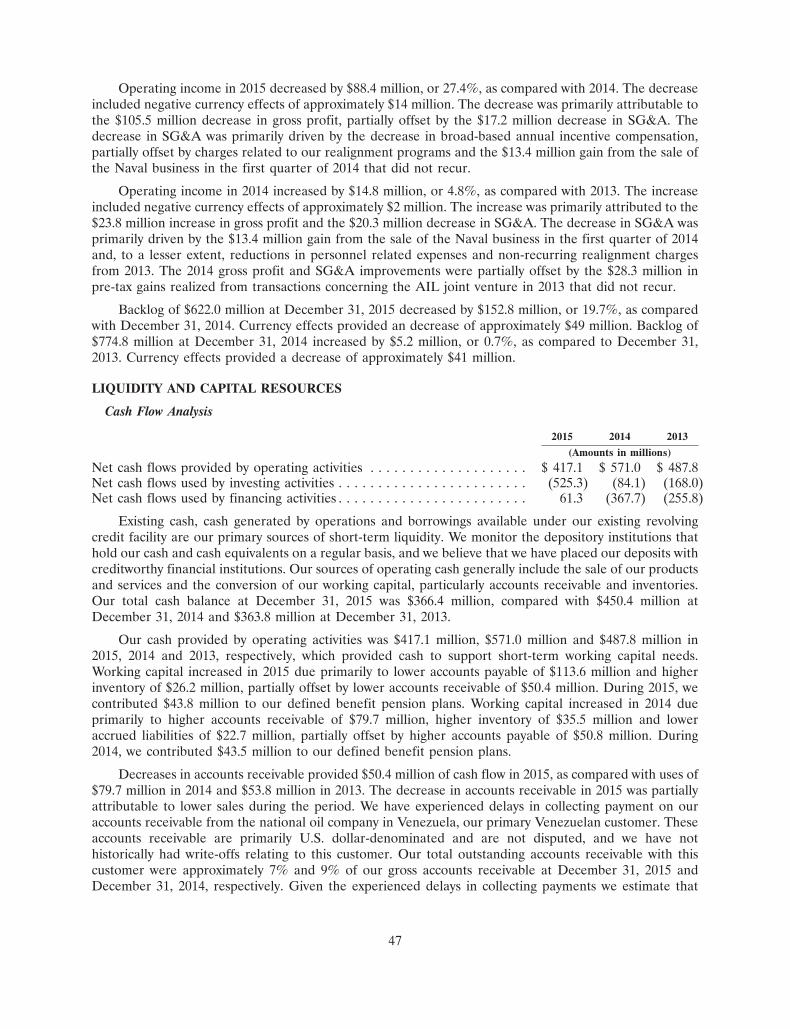
Operating income in 2015 decreased by $88.4 million, or 27.4%, as compared with 2014. The decreaseincluded negative currency effects of approximately $14 million. The decrease was primarily attributable tothe $105.5 million decrease in gross profit, partially offset by the $17.2 million decrease in SG&A. Thedecrease in SG&A was primarily driven by the decrease in broad-based annual incentive compensation,partially offset by charges related to our realignment programs and the $13.4 million gain from the sale ofthe Naval business in the first quarter of 2014 that did not recur.
Operating income in 2014 increased by $14.8 million, or 4.8%, as compared with 2013. The increaseincluded negative currency effects of approximately $2 million. The increase was primarily attributed to the$23.8 million increase in gross profit and the $20.3 million decrease in SG&A. The decrease in SG&A wasprimarily driven by the $13.4 million gain from the sale of the Naval business in the first quarter of 2014and, to a lesser extent, reductions in personnel related expenses and non-recurring realignment chargesfrom 2013. The 2014 gross profit and SG&A improvements were partially offset by the $28.3 million inpre-tax gains realized from transactions concerning the AIL joint venture in 2013 that did not recur.
Backlog of $622.0 million at December 31, 2015 decreased by $152.8 million, or 19.7%, as comparedwith December 31, 2014. Currency effects provided an decrease of approximately $49 million. Backlog of$774.8 million at December 31, 2014 increased by $5.2 million, or 0.7%, as compared to December 31,2013. Currency effects provided a decrease of approximately $41 million.
LIQUIDITY AND CAPITAL RESOURCES
Cash Flow Analysis
2015 2014 2013
(Amounts in millions)
Net cash flows provided by operating activities . . . . . . . . . . . . . . . . . . . . $ 417.1 $ 571.0 $ 487.8Net cash flows used by investing activities . . . . . . . . . . . . . . . . . . . . . . . . (525.3) (84.1) (168.0)Net cash flows used by financing activities . . . . . . . . . . . . . . . . . . . . . . . . 61.3 (367.7) (255.8)
Existing cash, cash generated by operations and borrowings available under our existing revolvingcredit facility are our primary sources of short-term liquidity. We monitor the depository institutions thathold our cash and cash equivalents on a regular basis, and we believe that we have placed our deposits withcreditworthy financial institutions. Our sources of operating cash generally include the sale of our productsand services and the conversion of our working capital, particularly accounts receivable and inventories.Our total cash balance at December 31, 2015 was $366.4 million, compared with $450.4 million atDecember 31, 2014 and $363.8 million at December 31, 2013.
Our cash provided by operating activities was $417.1 million, $571.0 million and $487.8 million in2015, 2014 and 2013, respectively, which provided cash to support short-term working capital needs.Working capital increased in 2015 due primarily to lower accounts payable of $113.6 million and higherinventory of $26.2 million, partially offset by lower accounts receivable of $50.4 million. During 2015, wecontributed $43.8 million to our defined benefit pension plans. Working capital increased in 2014 dueprimarily to higher accounts receivable of $79.7 million, higher inventory of $35.5 million and loweraccrued liabilities of $22.7 million, partially offset by higher accounts payable of $50.8 million. During2014, we contributed $43.5 million to our defined benefit pension plans.
Decreases in accounts receivable provided $50.4 million of cash flow in 2015, as compared with uses of$79.7 million in 2014 and $53.8 million in 2013. The decrease in accounts receivable in 2015 was partiallyattributable to lower sales during the period. We have experienced delays in collecting payment on ouraccounts receivable from the national oil company in Venezuela, our primary Venezuelan customer. Theseaccounts receivable are primarily U.S. dollar-denominated and are not disputed, and we have nothistorically had write-offs relating to this customer. Our total outstanding accounts receivable with thiscustomer were approximately 7% and 9% of our gross accounts receivable at December 31, 2015 andDecember 31, 2014, respectively. Given the experienced delays in collecting payments we estimate that
47
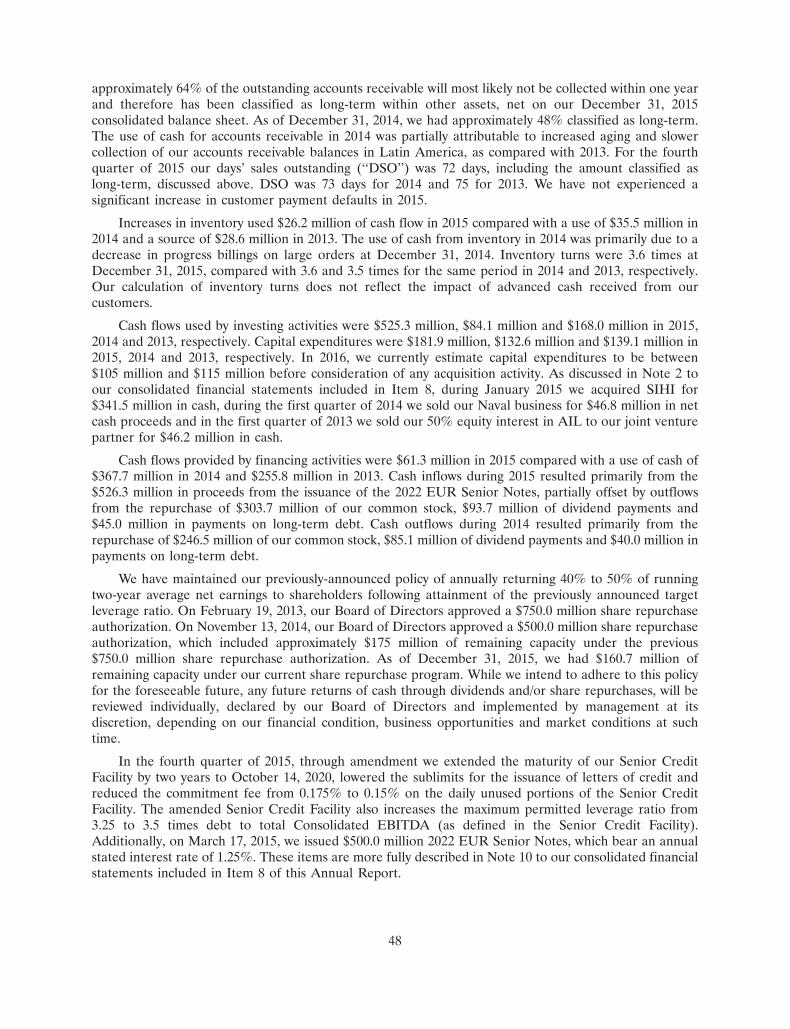
approximately 64% of the outstanding accounts receivable will most likely not be collected within one yearand therefore has been classified as long-term within other assets, net on our December 31, 2015consolidated balance sheet. As of December 31, 2014, we had approximately 48% classified as long-term.The use of cash for accounts receivable in 2014 was partially attributable to increased aging and slowercollection of our accounts receivable balances in Latin America, as compared with 2013. For the fourthquarter of 2015 our days’ sales outstanding (‘‘DSO’’) was 72 days, including the amount classified aslong-term, discussed above. DSO was 73 days for 2014 and 75 for 2013. We have not experienced asignificant increase in customer payment defaults in 2015.
Increases in inventory used $26.2 million of cash flow in 2015 compared with a use of $35.5 million in2014 and a source of $28.6 million in 2013. The use of cash from inventory in 2014 was primarily due to adecrease in progress billings on large orders at December 31, 2014. Inventory turns were 3.6 times atDecember 31, 2015, compared with 3.6 and 3.5 times for the same period in 2014 and 2013, respectively.Our calculation of inventory turns does not reflect the impact of advanced cash received from ourcustomers.
Cash flows used by investing activities were $525.3 million, $84.1 million and $168.0 million in 2015,2014 and 2013, respectively. Capital expenditures were $181.9 million, $132.6 million and $139.1 million in2015, 2014 and 2013, respectively. In 2016, we currently estimate capital expenditures to be between$105 million and $115 million before consideration of any acquisition activity. As discussed in Note 2 toour consolidated financial statements included in Item 8, during January 2015 we acquired SIHI for$341.5 million in cash, during the first quarter of 2014 we sold our Naval business for $46.8 million in netcash proceeds and in the first quarter of 2013 we sold our 50% equity interest in AIL to our joint venturepartner for $46.2 million in cash.
Cash flows provided by financing activities were $61.3 million in 2015 compared with a use of cash of$367.7 million in 2014 and $255.8 million in 2013. Cash inflows during 2015 resulted primarily from the$526.3 million in proceeds from the issuance of the 2022 EUR Senior Notes, partially offset by outflowsfrom the repurchase of $303.7 million of our common stock, $93.7 million of dividend payments and$45.0 million in payments on long-term debt. Cash outflows during 2014 resulted primarily from therepurchase of $246.5 million of our common stock, $85.1 million of dividend payments and $40.0 million inpayments on long-term debt.
We have maintained our previously-announced policy of annually returning 40% to 50% of runningtwo-year average net earnings to shareholders following attainment of the previously announced targetleverage ratio. On February 19, 2013, our Board of Directors approved a $750.0 million share repurchaseauthorization. On November 13, 2014, our Board of Directors approved a $500.0 million share repurchaseauthorization, which included approximately $175 million of remaining capacity under the previous$750.0 million share repurchase authorization. As of December 31, 2015, we had $160.7 million ofremaining capacity under our current share repurchase program. While we intend to adhere to this policyfor the foreseeable future, any future returns of cash through dividends and/or share repurchases, will bereviewed individually, declared by our Board of Directors and implemented by management at itsdiscretion, depending on our financial condition, business opportunities and market conditions at suchtime.
In the fourth quarter of 2015, through amendment we extended the maturity of our Senior CreditFacility by two years to October 14, 2020, lowered the sublimits for the issuance of letters of credit andreduced the commitment fee from 0.175% to 0.15% on the daily unused portions of the Senior CreditFacility. The amended Senior Credit Facility also increases the maximum permitted leverage ratio from3.25 to 3.5 times debt to total Consolidated EBITDA (as defined in the Senior Credit Facility).Additionally, on March 17, 2015, we issued $500.0 million 2022 EUR Senior Notes, which bear an annualstated interest rate of 1.25%. These items are more fully described in Note 10 to our consolidated financialstatements included in Item 8 of this Annual Report.
48
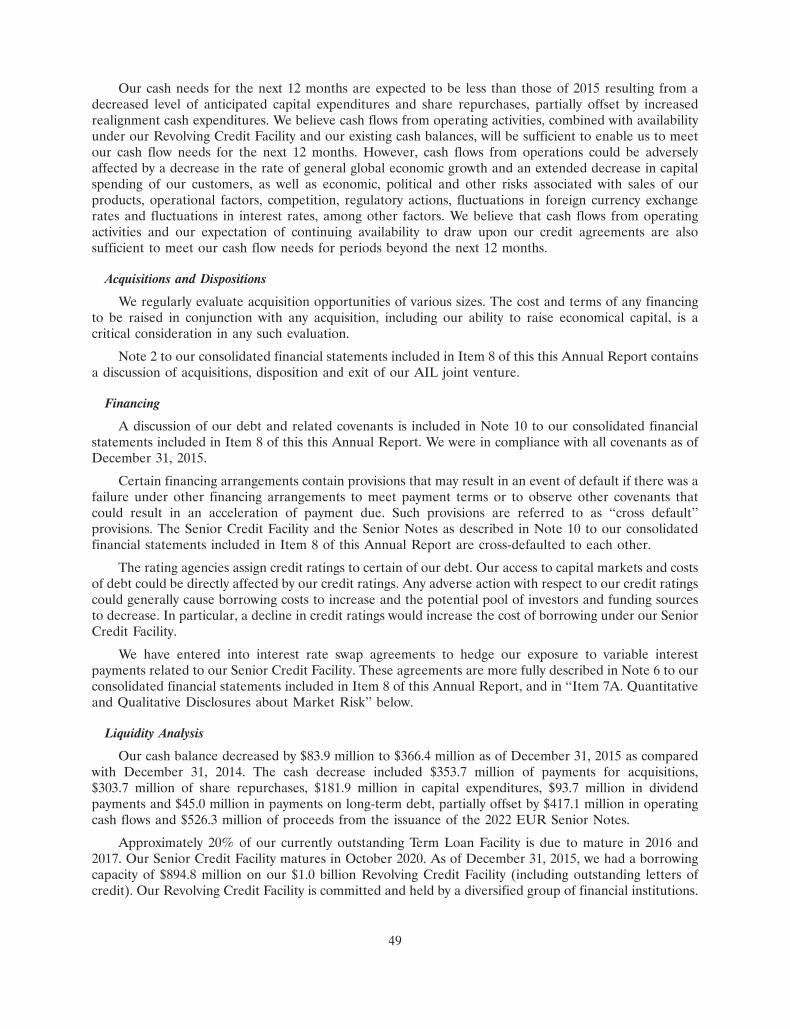
Our cash needs for the next 12 months are expected to be less than those of 2015 resulting from adecreased level of anticipated capital expenditures and share repurchases, partially offset by increasedrealignment cash expenditures. We believe cash flows from operating activities, combined with availabilityunder our Revolving Credit Facility and our existing cash balances, will be sufficient to enable us to meetour cash flow needs for the next 12 months. However, cash flows from operations could be adverselyaffected by a decrease in the rate of general global economic growth and an extended decrease in capitalspending of our customers, as well as economic, political and other risks associated with sales of ourproducts, operational factors, competition, regulatory actions, fluctuations in foreign currency exchangerates and fluctuations in interest rates, among other factors. We believe that cash flows from operatingactivities and our expectation of continuing availability to draw upon our credit agreements are alsosufficient to meet our cash flow needs for periods beyond the next 12 months.
Acquisitions and Dispositions
We regularly evaluate acquisition opportunities of various sizes. The cost and terms of any financingto be raised in conjunction with any acquisition, including our ability to raise economical capital, is acritical consideration in any such evaluation.
Note 2 to our consolidated financial statements included in Item 8 of this this Annual Report containsa discussion of acquisitions, disposition and exit of our AIL joint venture.
Financing
A discussion of our debt and related covenants is included in Note 10 to our consolidated financialstatements included in Item 8 of this this Annual Report. We were in compliance with all covenants as ofDecember 31, 2015.
Certain financing arrangements contain provisions that may result in an event of default if there was afailure under other financing arrangements to meet payment terms or to observe other covenants thatcould result in an acceleration of payment due. Such provisions are referred to as ‘‘cross default’’provisions. The Senior Credit Facility and the Senior Notes as described in Note 10 to our consolidatedfinancial statements included in Item 8 of this Annual Report are cross-defaulted to each other.
The rating agencies assign credit ratings to certain of our debt. Our access to capital markets and costsof debt could be directly affected by our credit ratings. Any adverse action with respect to our credit ratingscould generally cause borrowing costs to increase and the potential pool of investors and funding sourcesto decrease. In particular, a decline in credit ratings would increase the cost of borrowing under our SeniorCredit Facility.
We have entered into interest rate swap agreements to hedge our exposure to variable interestpayments related to our Senior Credit Facility. These agreements are more fully described in Note 6 to ourconsolidated financial statements included in Item 8 of this Annual Report, and in ‘‘Item 7A. Quantitativeand Qualitative Disclosures about Market Risk’’ below.
Liquidity Analysis
Our cash balance decreased by $83.9 million to $366.4 million as of December 31, 2015 as comparedwith December 31, 2014. The cash decrease included $353.7 million of payments for acquisitions,$303.7 million of share repurchases, $181.9 million in capital expenditures, $93.7 million in dividendpayments and $45.0 million in payments on long-term debt, partially offset by $417.1 million in operatingcash flows and $526.3 million of proceeds from the issuance of the 2022 EUR Senior Notes.
Approximately 20% of our currently outstanding Term Loan Facility is due to mature in 2016 and2017. Our Senior Credit Facility matures in October 2020. As of December 31, 2015, we had a borrowingcapacity of $894.8 million on our $1.0 billion Revolving Credit Facility (including outstanding letters ofcredit). Our Revolving Credit Facility is committed and held by a diversified group of financial institutions.
49
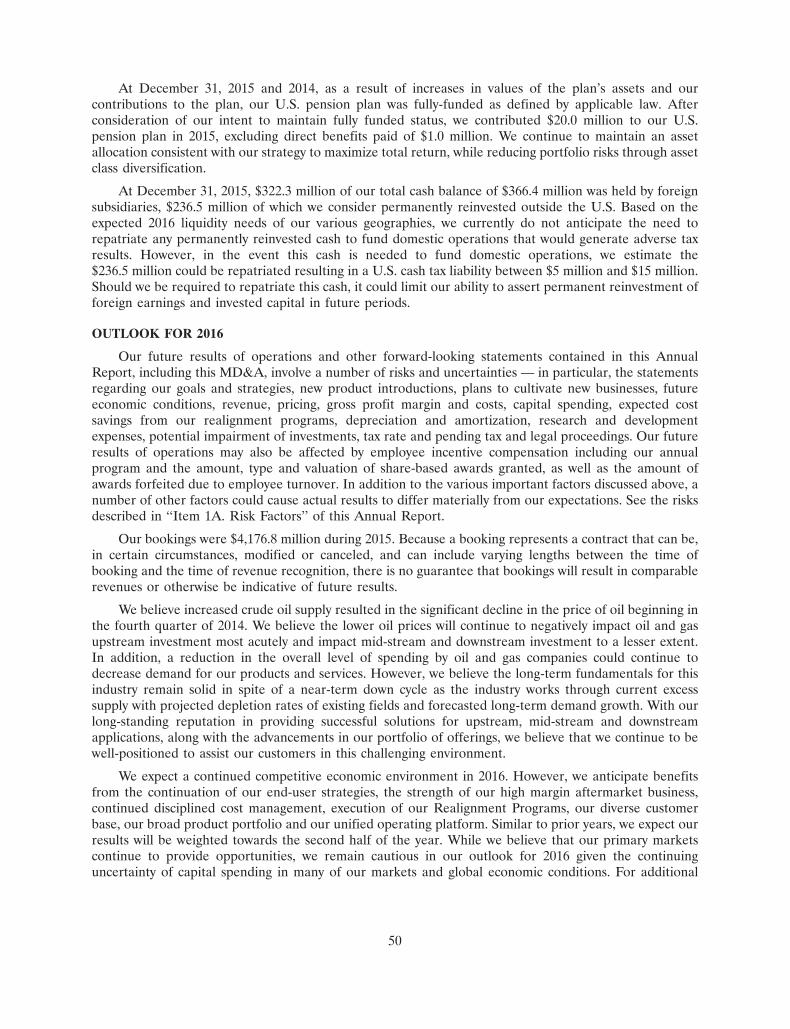
At December 31, 2015 and 2014, as a result of increases in values of the plan’s assets and ourcontributions to the plan, our U.S. pension plan was fully-funded as defined by applicable law. Afterconsideration of our intent to maintain fully funded status, we contributed $20.0 million to our U.S.pension plan in 2015, excluding direct benefits paid of $1.0 million. We continue to maintain an assetallocation consistent with our strategy to maximize total return, while reducing portfolio risks through assetclass diversification.
At December 31, 2015, $322.3 million of our total cash balance of $366.4 million was held by foreignsubsidiaries, $236.5 million of which we consider permanently reinvested outside the U.S. Based on theexpected 2016 liquidity needs of our various geographies, we currently do not anticipate the need torepatriate any permanently reinvested cash to fund domestic operations that would generate adverse taxresults. However, in the event this cash is needed to fund domestic operations, we estimate the$236.5 million could be repatriated resulting in a U.S. cash tax liability between $5 million and $15 million.Should we be required to repatriate this cash, it could limit our ability to assert permanent reinvestment offoreign earnings and invested capital in future periods.
OUTLOOK FOR 2016
Our future results of operations and other forward-looking statements contained in this AnnualReport, including this MD&A, involve a number of risks and uncertainties — in particular, the statementsregarding our goals and strategies, new product introductions, plans to cultivate new businesses, futureeconomic conditions, revenue, pricing, gross profit margin and costs, capital spending, expected costsavings from our realignment programs, depreciation and amortization, research and developmentexpenses, potential impairment of investments, tax rate and pending tax and legal proceedings. Our futureresults of operations may also be affected by employee incentive compensation including our annualprogram and the amount, type and valuation of share-based awards granted, as well as the amount ofawards forfeited due to employee turnover. In addition to the various important factors discussed above, anumber of other factors could cause actual results to differ materially from our expectations. See the risksdescribed in ‘‘Item 1A. Risk Factors’’ of this Annual Report.
Our bookings were $4,176.8 million during 2015. Because a booking represents a contract that can be,in certain circumstances, modified or canceled, and can include varying lengths between the time ofbooking and the time of revenue recognition, there is no guarantee that bookings will result in comparablerevenues or otherwise be indicative of future results.
We believe increased crude oil supply resulted in the significant decline in the price of oil beginning inthe fourth quarter of 2014. We believe the lower oil prices will continue to negatively impact oil and gasupstream investment most acutely and impact mid-stream and downstream investment to a lesser extent.In addition, a reduction in the overall level of spending by oil and gas companies could continue todecrease demand for our products and services. However, we believe the long-term fundamentals for thisindustry remain solid in spite of a near-term down cycle as the industry works through current excesssupply with projected depletion rates of existing fields and forecasted long-term demand growth. With ourlong-standing reputation in providing successful solutions for upstream, mid-stream and downstreamapplications, along with the advancements in our portfolio of offerings, we believe that we continue to bewell-positioned to assist our customers in this challenging environment.
We expect a continued competitive economic environment in 2016. However, we anticipate benefitsfrom the continuation of our end-user strategies, the strength of our high margin aftermarket business,continued disciplined cost management, execution of our Realignment Programs, our diverse customerbase, our broad product portfolio and our unified operating platform. Similar to prior years, we expect ourresults will be weighted towards the second half of the year. While we believe that our primary marketscontinue to provide opportunities, we remain cautious in our outlook for 2016 given the continuinguncertainty of capital spending in many of our markets and global economic conditions. For additional
50
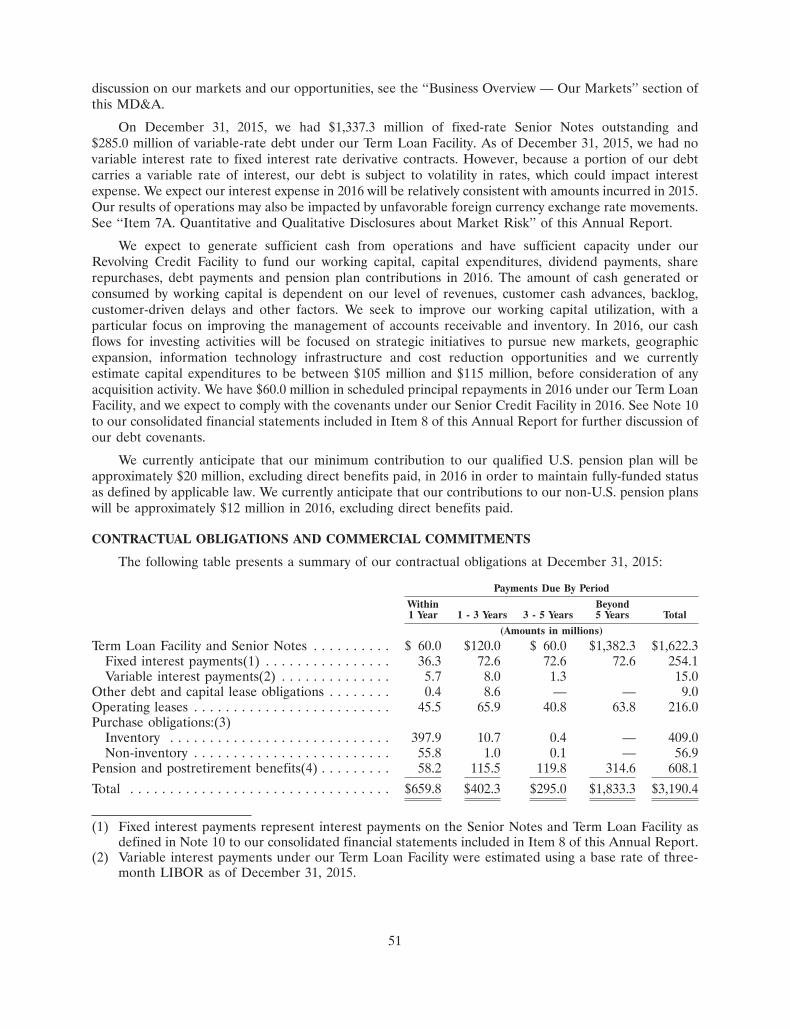
discussion on our markets and our opportunities, see the ‘‘Business Overview — Our Markets’’ section ofthis MD&A.
On December 31, 2015, we had $1,337.3 million of fixed-rate Senior Notes outstanding and$285.0 million of variable-rate debt under our Term Loan Facility. As of December 31, 2015, we had novariable interest rate to fixed interest rate derivative contracts. However, because a portion of our debtcarries a variable rate of interest, our debt is subject to volatility in rates, which could impact interestexpense. We expect our interest expense in 2016 will be relatively consistent with amounts incurred in 2015.Our results of operations may also be impacted by unfavorable foreign currency exchange rate movements.See ‘‘Item 7A. Quantitative and Qualitative Disclosures about Market Risk’’ of this Annual Report.
We expect to generate sufficient cash from operations and have sufficient capacity under ourRevolving Credit Facility to fund our working capital, capital expenditures, dividend payments, sharerepurchases, debt payments and pension plan contributions in 2016. The amount of cash generated orconsumed by working capital is dependent on our level of revenues, customer cash advances, backlog,customer-driven delays and other factors. We seek to improve our working capital utilization, with aparticular focus on improving the management of accounts receivable and inventory. In 2016, our cashflows for investing activities will be focused on strategic initiatives to pursue new markets, geographicexpansion, information technology infrastructure and cost reduction opportunities and we currentlyestimate capital expenditures to be between $105 million and $115 million, before consideration of anyacquisition activity. We have $60.0 million in scheduled principal repayments in 2016 under our Term LoanFacility, and we expect to comply with the covenants under our Senior Credit Facility in 2016. See Note 10to our consolidated financial statements included in Item 8 of this Annual Report for further discussion ofour debt covenants.
We currently anticipate that our minimum contribution to our qualified U.S. pension plan will beapproximately $20 million, excluding direct benefits paid, in 2016 in order to maintain fully-funded statusas defined by applicable law. We currently anticipate that our contributions to our non-U.S. pension planswill be approximately $12 million in 2016, excluding direct benefits paid.
CONTRACTUAL OBLIGATIONS AND COMMERCIAL COMMITMENTS
The following table presents a summary of our contractual obligations at December 31, 2015:
Payments Due By Period
Within Beyond1 Year 1 - 3 Years 3 - 5 Years 5 Years Total
(Amounts in millions)
Term Loan Facility and Senior Notes . . . . . . . . . . $ 60.0 $120.0 $ 60.0 $1,382.3 $1,622.3Fixed interest payments(1) . . . . . . . . . . . . . . . . 36.3 72.6 72.6 72.6 254.1Variable interest payments(2) . . . . . . . . . . . . . . 5.7 8.0 1.3 15.0
Other debt and capital lease obligations . . . . . . . . 0.4 8.6 — — 9.0Operating leases . . . . . . . . . . . . . . . . . . . . . . . . . 45.5 65.9 40.8 63.8 216.0Purchase obligations:(3)
Inventory . . . . . . . . . . . . . . . . . . . . . . . . . . . . 397.9 10.7 0.4 — 409.0Non-inventory . . . . . . . . . . . . . . . . . . . . . . . . . 55.8 1.0 0.1 — 56.9
Pension and postretirement benefits(4) . . . . . . . . . 58.2 115.5 119.8 314.6 608.1
Total . . . . . . . . . . . . . . . . . . . . . . . . . . . . . . . . . $659.8 $402.3 $295.0 $1,833.3 $3,190.4
(1) Fixed interest payments represent interest payments on the Senior Notes and Term Loan Facility asdefined in Note 10 to our consolidated financial statements included in Item 8 of this Annual Report.
(2) Variable interest payments under our Term Loan Facility were estimated using a base rate of three-month LIBOR as of December 31, 2015.
51
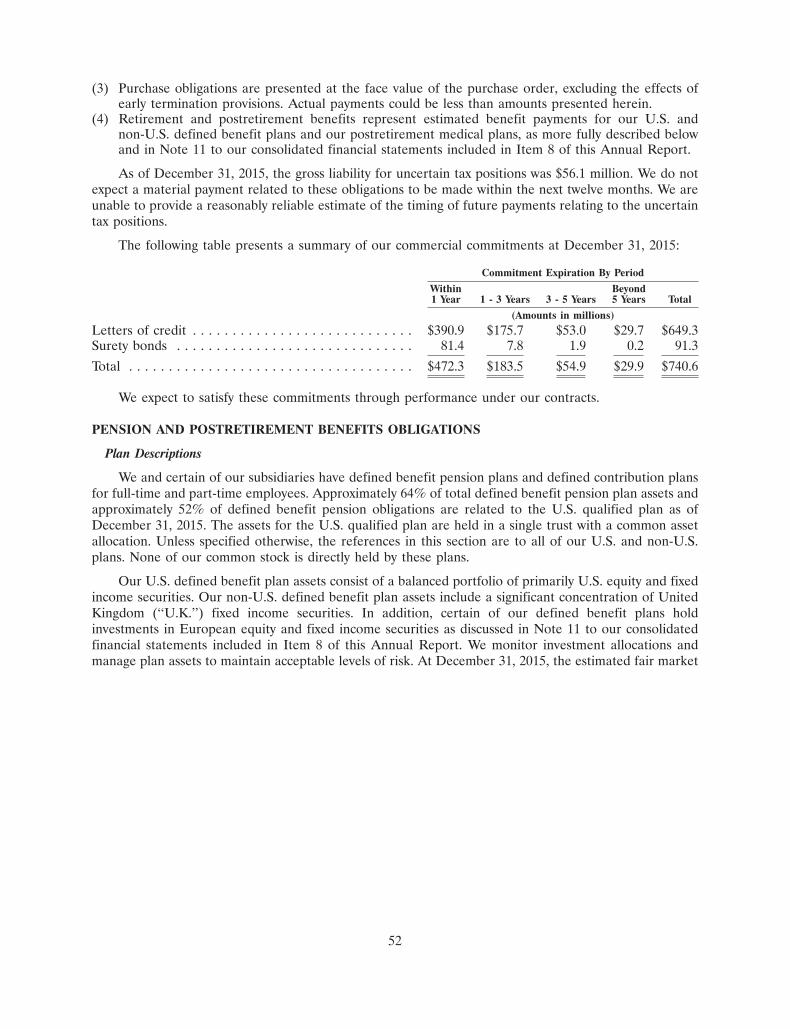
(3) Purchase obligations are presented at the face value of the purchase order, excluding the effects ofearly termination provisions. Actual payments could be less than amounts presented herein.
(4) Retirement and postretirement benefits represent estimated benefit payments for our U.S. andnon-U.S. defined benefit plans and our postretirement medical plans, as more fully described belowand in Note 11 to our consolidated financial statements included in Item 8 of this Annual Report.
As of December 31, 2015, the gross liability for uncertain tax positions was $56.1 million. We do notexpect a material payment related to these obligations to be made within the next twelve months. We areunable to provide a reasonably reliable estimate of the timing of future payments relating to the uncertaintax positions.
The following table presents a summary of our commercial commitments at December 31, 2015:
Commitment Expiration By Period
Within Beyond1 Year 1 - 3 Years 3 - 5 Years 5 Years Total
(Amounts in millions)
Letters of credit . . . . . . . . . . . . . . . . . . . . . . . . . . . . $390.9 $175.7 $53.0 $29.7 $649.3Surety bonds . . . . . . . . . . . . . . . . . . . . . . . . . . . . . . 81.4 7.8 1.9 0.2 91.3
Total . . . . . . . . . . . . . . . . . . . . . . . . . . . . . . . . . . . . $472.3 $183.5 $54.9 $29.9 $740.6
We expect to satisfy these commitments through performance under our contracts.
PENSION AND POSTRETIREMENT BENEFITS OBLIGATIONS
Plan Descriptions
We and certain of our subsidiaries have defined benefit pension plans and defined contribution plansfor full-time and part-time employees. Approximately 64% of total defined benefit pension plan assets andapproximately 52% of defined benefit pension obligations are related to the U.S. qualified plan as ofDecember 31, 2015. The assets for the U.S. qualified plan are held in a single trust with a common assetallocation. Unless specified otherwise, the references in this section are to all of our U.S. and non-U.S.plans. None of our common stock is directly held by these plans.
Our U.S. defined benefit plan assets consist of a balanced portfolio of primarily U.S. equity and fixedincome securities. Our non-U.S. defined benefit plan assets include a significant concentration of UnitedKingdom (‘‘U.K.’’) fixed income securities. In addition, certain of our defined benefit plans holdinvestments in European equity and fixed income securities as discussed in Note 11 to our consolidatedfinancial statements included in Item 8 of this Annual Report. We monitor investment allocations andmanage plan assets to maintain acceptable levels of risk. At December 31, 2015, the estimated fair market
52
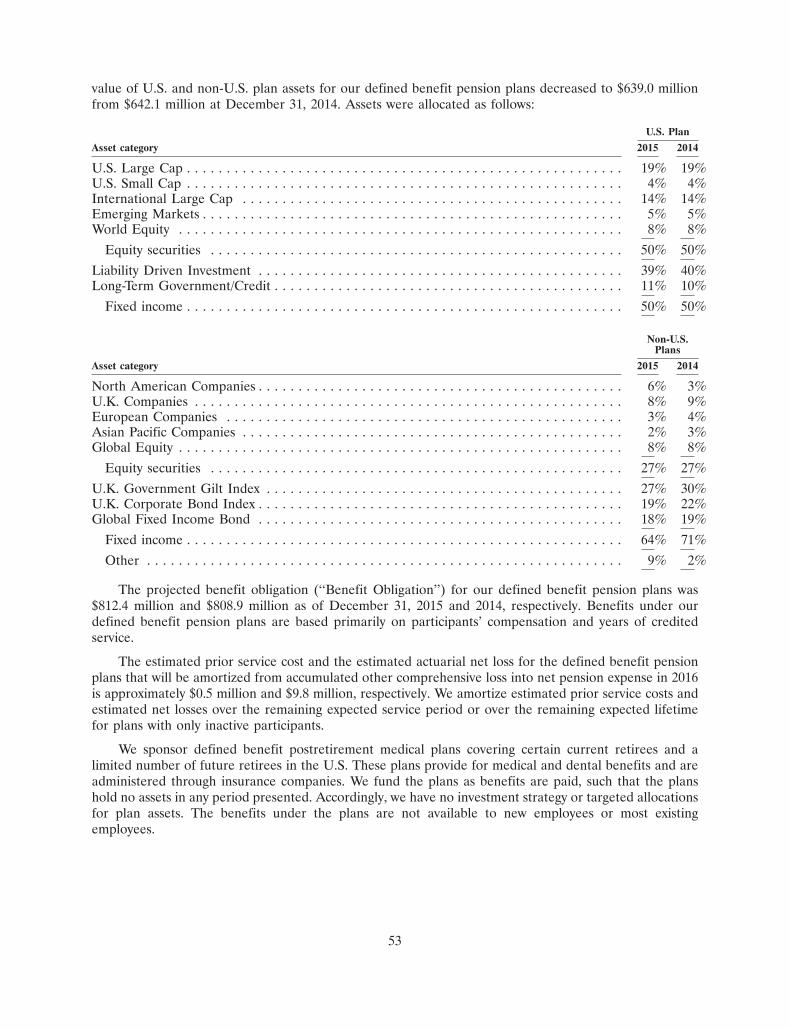
value of U.S. and non-U.S. plan assets for our defined benefit pension plans decreased to $639.0 millionfrom $642.1 million at December 31, 2014. Assets were allocated as follows:
U.S. Plan
Asset category 2015 2014
U.S. Large Cap . . . . . . . . . . . . . . . . . . . . . . . . . . . . . . . . . . . . . . . . . . . . . . . . . . . . . . . 19% 19%U.S. Small Cap . . . . . . . . . . . . . . . . . . . . . . . . . . . . . . . . . . . . . . . . . . . . . . . . . . . . . . . 4% 4%International Large Cap . . . . . . . . . . . . . . . . . . . . . . . . . . . . . . . . . . . . . . . . . . . . . . . . 14% 14%Emerging Markets . . . . . . . . . . . . . . . . . . . . . . . . . . . . . . . . . . . . . . . . . . . . . . . . . . . . . 5% 5%World Equity . . . . . . . . . . . . . . . . . . . . . . . . . . . . . . . . . . . . . . . . . . . . . . . . . . . . . . . . 8% 8%
Equity securities . . . . . . . . . . . . . . . . . . . . . . . . . . . . . . . . . . . . . . . . . . . . . . . . . . . . 50% 50%
Liability Driven Investment . . . . . . . . . . . . . . . . . . . . . . . . . . . . . . . . . . . . . . . . . . . . . . 39% 40%Long-Term Government/Credit . . . . . . . . . . . . . . . . . . . . . . . . . . . . . . . . . . . . . . . . . . . . 11% 10%
Fixed income . . . . . . . . . . . . . . . . . . . . . . . . . . . . . . . . . . . . . . . . . . . . . . . . . . . . . . . 50% 50%
Non-U.S.Plans
Asset category 2015 2014
North American Companies . . . . . . . . . . . . . . . . . . . . . . . . . . . . . . . . . . . . . . . . . . . . . . 6% 3%U.K. Companies . . . . . . . . . . . . . . . . . . . . . . . . . . . . . . . . . . . . . . . . . . . . . . . . . . . . . . 8% 9%European Companies . . . . . . . . . . . . . . . . . . . . . . . . . . . . . . . . . . . . . . . . . . . . . . . . . . 3% 4%Asian Pacific Companies . . . . . . . . . . . . . . . . . . . . . . . . . . . . . . . . . . . . . . . . . . . . . . . . 2% 3%Global Equity . . . . . . . . . . . . . . . . . . . . . . . . . . . . . . . . . . . . . . . . . . . . . . . . . . . . . . . . 8% 8%
Equity securities . . . . . . . . . . . . . . . . . . . . . . . . . . . . . . . . . . . . . . . . . . . . . . . . . . . . 27% 27%
U.K. Government Gilt Index . . . . . . . . . . . . . . . . . . . . . . . . . . . . . . . . . . . . . . . . . . . . . 27% 30%U.K. Corporate Bond Index . . . . . . . . . . . . . . . . . . . . . . . . . . . . . . . . . . . . . . . . . . . . . . 19% 22%Global Fixed Income Bond . . . . . . . . . . . . . . . . . . . . . . . . . . . . . . . . . . . . . . . . . . . . . . 18% 19%
Fixed income . . . . . . . . . . . . . . . . . . . . . . . . . . . . . . . . . . . . . . . . . . . . . . . . . . . . . . . 64% 71%
Other . . . . . . . . . . . . . . . . . . . . . . . . . . . . . . . . . . . . . . . . . . . . . . . . . . . . . . . . . . . . 9% 2%
The projected benefit obligation (‘‘Benefit Obligation’’) for our defined benefit pension plans was$812.4 million and $808.9 million as of December 31, 2015 and 2014, respectively. Benefits under ourdefined benefit pension plans are based primarily on participants’ compensation and years of creditedservice.
The estimated prior service cost and the estimated actuarial net loss for the defined benefit pensionplans that will be amortized from accumulated other comprehensive loss into net pension expense in 2016is approximately $0.5 million and $9.8 million, respectively. We amortize estimated prior service costs andestimated net losses over the remaining expected service period or over the remaining expected lifetimefor plans with only inactive participants.
We sponsor defined benefit postretirement medical plans covering certain current retirees and alimited number of future retirees in the U.S. These plans provide for medical and dental benefits and areadministered through insurance companies. We fund the plans as benefits are paid, such that the planshold no assets in any period presented. Accordingly, we have no investment strategy or targeted allocationsfor plan assets. The benefits under the plans are not available to new employees or most existingemployees.
53
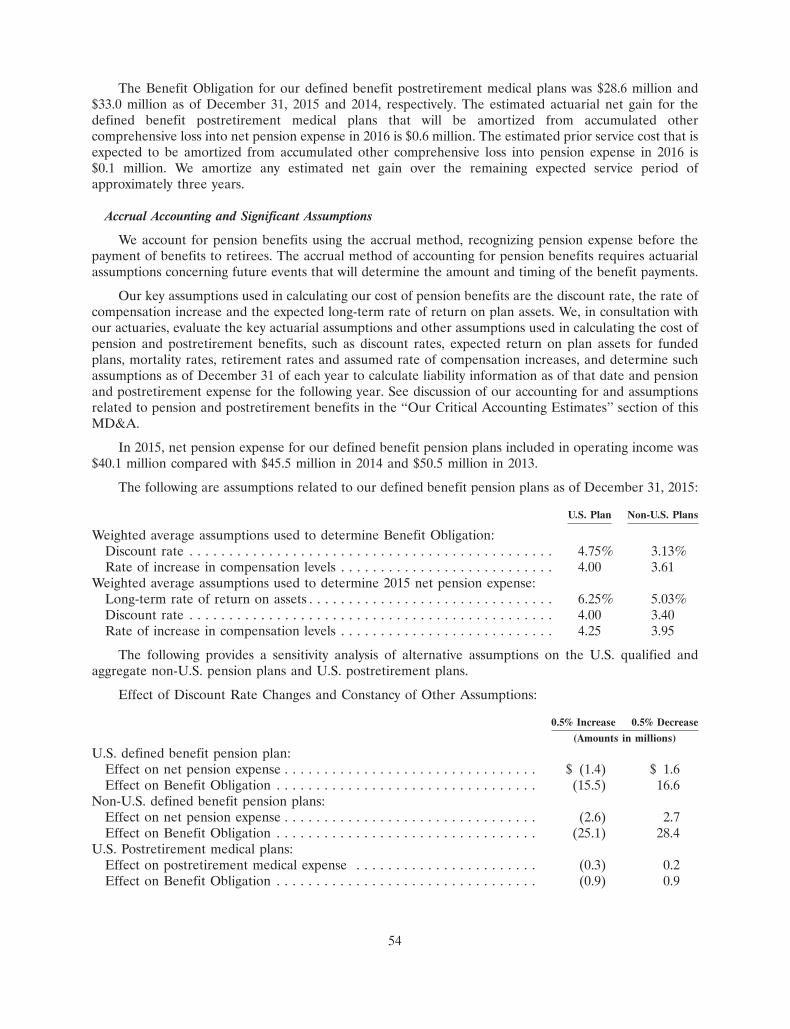
The Benefit Obligation for our defined benefit postretirement medical plans was $28.6 million and$33.0 million as of December 31, 2015 and 2014, respectively. The estimated actuarial net gain for thedefined benefit postretirement medical plans that will be amortized from accumulated othercomprehensive loss into net pension expense in 2016 is $0.6 million. The estimated prior service cost that isexpected to be amortized from accumulated other comprehensive loss into pension expense in 2016 is$0.1 million. We amortize any estimated net gain over the remaining expected service period ofapproximately three years.
Accrual Accounting and Significant Assumptions
We account for pension benefits using the accrual method, recognizing pension expense before thepayment of benefits to retirees. The accrual method of accounting for pension benefits requires actuarialassumptions concerning future events that will determine the amount and timing of the benefit payments.
Our key assumptions used in calculating our cost of pension benefits are the discount rate, the rate ofcompensation increase and the expected long-term rate of return on plan assets. We, in consultation withour actuaries, evaluate the key actuarial assumptions and other assumptions used in calculating the cost ofpension and postretirement benefits, such as discount rates, expected return on plan assets for fundedplans, mortality rates, retirement rates and assumed rate of compensation increases, and determine suchassumptions as of December 31 of each year to calculate liability information as of that date and pensionand postretirement expense for the following year. See discussion of our accounting for and assumptionsrelated to pension and postretirement benefits in the ‘‘Our Critical Accounting Estimates’’ section of thisMD&A.
In 2015, net pension expense for our defined benefit pension plans included in operating income was$40.1 million compared with $45.5 million in 2014 and $50.5 million in 2013.
The following are assumptions related to our defined benefit pension plans as of December 31, 2015:
U.S. Plan Non-U.S. Plans
Weighted average assumptions used to determine Benefit Obligation:Discount rate . . . . . . . . . . . . . . . . . . . . . . . . . . . . . . . . . . . . . . . . . . . . . . 4.75% 3.13%Rate of increase in compensation levels . . . . . . . . . . . . . . . . . . . . . . . . . . . 4.00 3.61
Weighted average assumptions used to determine 2015 net pension expense:Long-term rate of return on assets . . . . . . . . . . . . . . . . . . . . . . . . . . . . . . . 6.25% 5.03%Discount rate . . . . . . . . . . . . . . . . . . . . . . . . . . . . . . . . . . . . . . . . . . . . . . 4.00 3.40Rate of increase in compensation levels . . . . . . . . . . . . . . . . . . . . . . . . . . . 4.25 3.95
The following provides a sensitivity analysis of alternative assumptions on the U.S. qualified andaggregate non-U.S. pension plans and U.S. postretirement plans.
Effect of Discount Rate Changes and Constancy of Other Assumptions:
0.5% Increase 0.5% Decrease
(Amounts in millions)
U.S. defined benefit pension plan:Effect on net pension expense . . . . . . . . . . . . . . . . . . . . . . . . . . . . . . . . $ (1.4) $ 1.6Effect on Benefit Obligation . . . . . . . . . . . . . . . . . . . . . . . . . . . . . . . . . (15.5) 16.6
Non-U.S. defined benefit pension plans:Effect on net pension expense . . . . . . . . . . . . . . . . . . . . . . . . . . . . . . . . (2.6) 2.7Effect on Benefit Obligation . . . . . . . . . . . . . . . . . . . . . . . . . . . . . . . . . (25.1) 28.4
U.S. Postretirement medical plans:Effect on postretirement medical expense . . . . . . . . . . . . . . . . . . . . . . . (0.3) 0.2Effect on Benefit Obligation . . . . . . . . . . . . . . . . . . . . . . . . . . . . . . . . . (0.9) 0.9
54
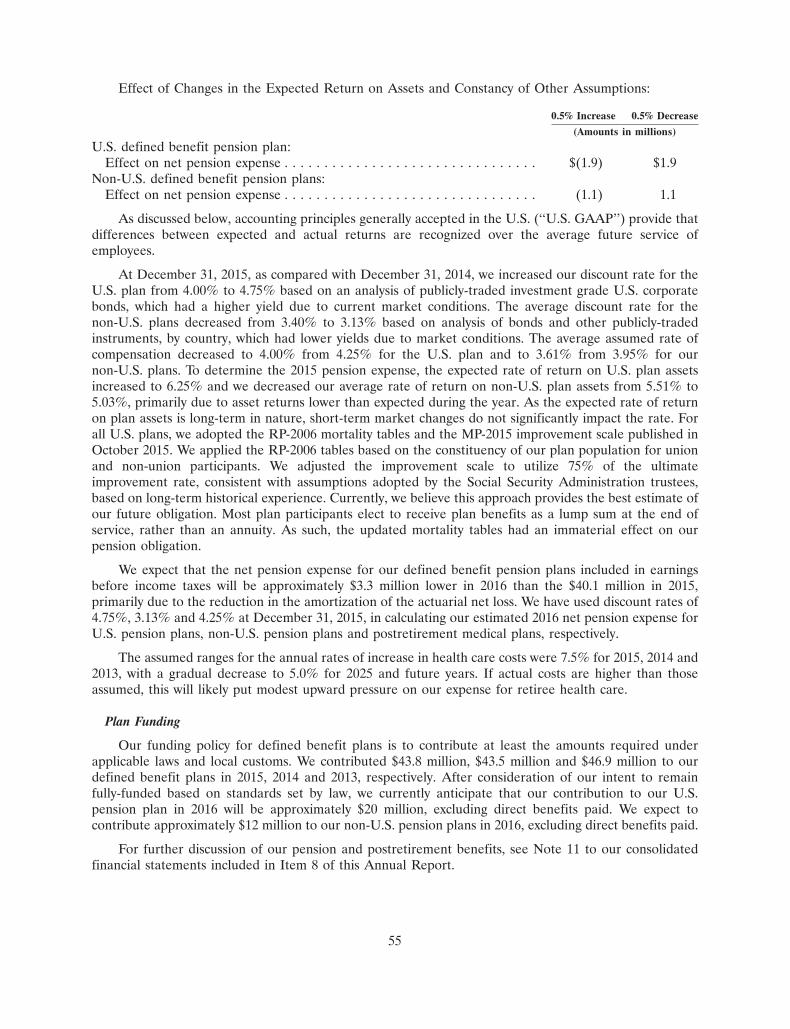
Effect of Changes in the Expected Return on Assets and Constancy of Other Assumptions:
0.5% Increase 0.5% Decrease
(Amounts in millions)
U.S. defined benefit pension plan:Effect on net pension expense . . . . . . . . . . . . . . . . . . . . . . . . . . . . . . . . $(1.9) $1.9
Non-U.S. defined benefit pension plans:Effect on net pension expense . . . . . . . . . . . . . . . . . . . . . . . . . . . . . . . . (1.1) 1.1
As discussed below, accounting principles generally accepted in the U.S. (‘‘U.S. GAAP’’) provide thatdifferences between expected and actual returns are recognized over the average future service ofemployees.
At December 31, 2015, as compared with December 31, 2014, we increased our discount rate for theU.S. plan from 4.00% to 4.75% based on an analysis of publicly-traded investment grade U.S. corporatebonds, which had a higher yield due to current market conditions. The average discount rate for thenon-U.S. plans decreased from 3.40% to 3.13% based on analysis of bonds and other publicly-tradedinstruments, by country, which had lower yields due to market conditions. The average assumed rate ofcompensation decreased to 4.00% from 4.25% for the U.S. plan and to 3.61% from 3.95% for ournon-U.S. plans. To determine the 2015 pension expense, the expected rate of return on U.S. plan assetsincreased to 6.25% and we decreased our average rate of return on non-U.S. plan assets from 5.51% to5.03%, primarily due to asset returns lower than expected during the year. As the expected rate of returnon plan assets is long-term in nature, short-term market changes do not significantly impact the rate. Forall U.S. plans, we adopted the RP-2006 mortality tables and the MP-2015 improvement scale published inOctober 2015. We applied the RP-2006 tables based on the constituency of our plan population for unionand non-union participants. We adjusted the improvement scale to utilize 75% of the ultimateimprovement rate, consistent with assumptions adopted by the Social Security Administration trustees,based on long-term historical experience. Currently, we believe this approach provides the best estimate ofour future obligation. Most plan participants elect to receive plan benefits as a lump sum at the end ofservice, rather than an annuity. As such, the updated mortality tables had an immaterial effect on ourpension obligation.
We expect that the net pension expense for our defined benefit pension plans included in earningsbefore income taxes will be approximately $3.3 million lower in 2016 than the $40.1 million in 2015,primarily due to the reduction in the amortization of the actuarial net loss. We have used discount rates of4.75%, 3.13% and 4.25% at December 31, 2015, in calculating our estimated 2016 net pension expense forU.S. pension plans, non-U.S. pension plans and postretirement medical plans, respectively.
The assumed ranges for the annual rates of increase in health care costs were 7.5% for 2015, 2014 and2013, with a gradual decrease to 5.0% for 2025 and future years. If actual costs are higher than thoseassumed, this will likely put modest upward pressure on our expense for retiree health care.
Plan Funding
Our funding policy for defined benefit plans is to contribute at least the amounts required underapplicable laws and local customs. We contributed $43.8 million, $43.5 million and $46.9 million to ourdefined benefit plans in 2015, 2014 and 2013, respectively. After consideration of our intent to remainfully-funded based on standards set by law, we currently anticipate that our contribution to our U.S.pension plan in 2016 will be approximately $20 million, excluding direct benefits paid. We expect tocontribute approximately $12 million to our non-U.S. pension plans in 2016, excluding direct benefits paid.
For further discussion of our pension and postretirement benefits, see Note 11 to our consolidatedfinancial statements included in Item 8 of this Annual Report.
55
OUR CRITICAL ACCOUNTING ESTIMATES
The process of preparing financial statements in conformity with U.S. GAAP requires the use ofestimates and assumptions to determine reported amounts of certain assets, liabilities, revenues andexpenses and the disclosure of related contingent assets and liabilities. These estimates and assumptionsare based upon information available at the time of the estimates or assumptions, including our historicalexperience, where relevant. The most significant estimates made by management include: timing andamount of revenue recognition; deferred taxes, tax valuation allowances and tax reserves; reserves forcontingent loss; pension and postretirement benefits; and valuation of goodwill, indefinite-lived intangibleassets and other long-lived assets. The significant estimates are reviewed at least annually if not quarterlyby management. Because of the uncertainty of factors surrounding the estimates, assumptions andjudgments used in the preparation of our financial statements, actual results may differ from the estimates,and the difference may be material.
Our critical accounting policies are those policies that are both most important to our financialcondition and results of operations and require the most difficult, subjective or complex judgments on thepart of management in their application, often as a result of the need to make estimates about the effect ofmatters that are inherently uncertain. We believe that the following represent our critical accountingpolicies. For a summary of all of our significant accounting policies, see Note 1 to our consolidatedfinancial statements included in Item 8 of this Annual Report. Management and our external auditors havediscussed our critical accounting estimates and policies with the Audit Committee of our Board ofDirectors.
Revenue Recognition
Revenues for product sales are recognized when the risks and rewards of ownership are transferred tothe customers, which is typically based on the contractual delivery terms agreed to with the customer andfulfillment of all but inconsequential or perfunctory actions. In addition, our policy requires persuasiveevidence of an arrangement, a fixed or determinable sales price and reasonable assurance of collectibility.We defer the recognition of revenue when advance payments are received from customers beforeperformance obligations have been completed and/or services have been performed. Freight charges billedto customers are included in sales and the related shipping costs are included in cost of sales in ourconsolidated statements of income. Our contracts typically include cancellation provisions that requirecustomers to reimburse us for costs incurred up to the date of cancellation, as well as any contractualcancellation penalties.
We enter into certain agreements with multiple deliverables that may include any combination ofdesigning, developing, manufacturing, modifying, installing and commissioning of flow managementequipment and providing services related to the performance of such products. Delivery of these productsand services typically occurs within a one to two-year period, although many arrangements, such as ‘‘short-cycle’’ type orders, have a shorter timeframe for delivery. We separate deliverables into units of accountingbased on whether the deliverable(s) have standalone value to the customer (impact of general rights ofreturn is immaterial). Contract value is allocated ratably to the units of accounting in the arrangementbased on their relative selling prices determined as if the deliverables were sold separately.
Revenues for long-term contracts that exceed certain internal thresholds regarding the size andduration of the project and provide for the receipt of progress billings from the customer are recorded onthe percentage of completion method with progress measured on a cost-to-cost basis. Percentage ofcompletion revenue represents less than 7% of our consolidated sales for each year presented.
Revenue on service and repair contracts is recognized after services have been agreed to by thecustomer and rendered. Revenues generated under fixed fee service and repair contracts are recognized ona ratable basis over the term of the contract. These contracts can range in duration, but generally extend
56
for up to five years. Fixed fee service contracts represent approximately 1% of consolidated sales for eachyear presented.
In certain instances, we provide guaranteed completion dates under the terms of our contracts. Failureto meet contractual delivery dates can result in late delivery penalties or non-recoverable costs. Ininstances where the payment of such costs are deemed to be probable, we perform a project profitabilityanalysis, accounting for such costs as a reduction of realizable revenues, which could potentially causeestimated total project costs to exceed projected total revenues realized from the project. In such instances,we would record reserves to cover such excesses in the period they are determined. In circumstances wherethe total projected revenues still exceed total projected costs, the incurrence of penalties ornon-recoverable costs generally reduces profitability of the project at the time of subsequent revenuerecognition. Our reported results would change if different estimates were used for contract costs or ifdifferent estimates were used for contractual contingencies.
Deferred Taxes, Tax Valuation Allowances and Tax Reserves
We recognize valuation allowances to reduce the carrying value of deferred tax assets to amounts thatwe expect are more likely than not to be realized. Our valuation allowances primarily relate to the deferredtax assets established for certain tax credit carryforwards and net operating loss carryforwards for non-U.S.subsidiaries, and we evaluate the realizability of our deferred tax assets by assessing the related valuationallowance and by adjusting the amount of these allowances, if necessary. We assess such factors as ourforecast of future taxable income and available tax planning strategies that could be implemented torealize the net deferred tax assets in determining the sufficiency of our valuation allowances. Failure toachieve forecasted taxable income in the applicable tax jurisdictions could affect the ultimate realization ofdeferred tax assets and could result in an increase in our effective tax rate on future earnings.Implementation of different tax structures in certain jurisdictions could, if successful, result in futurereductions of certain valuation allowances.
The amount of income taxes we pay is subject to ongoing audits by federal, state and foreign taxauthorities, which often result in proposed assessments. Significant judgment is required in determiningincome tax provisions and evaluating tax positions. We establish reserves for open tax years for uncertaintax positions that may be subject to challenge by various tax authorities. The consolidated tax provision andrelated accruals include the impact of such reasonably estimable losses and related interest and penaltiesas deemed appropriate. Tax benefits recognized in the financial statements from uncertain tax positions aremeasured based on the largest benefit that has a greater than fifty percent likelihood of being realizedupon ultimate settlement.
While we believe we have adequately provided for any reasonably foreseeable outcome related tothese matters, our future results may include favorable or unfavorable adjustments to our estimated taxliabilities. To the extent that the expected tax outcome of these matters changes, such changes in estimatewill impact the income tax provision in the period in which such determination is made.
Reserves for Contingent Loss
Liabilities are recorded for various contingencies arising in the normal course of business when it isboth probable that a loss has been incurred and such loss is estimable. Assessments of reserves are basedon information obtained from our independent and in-house experts, including recent legal decisions andloss experience in similar situations. The recorded legal reserves are susceptible to changes due to newdevelopments regarding the facts and circumstances of each matter, changes in political environments,legal venue and other factors. Recorded environmental reserves could change based on further analysis ofour properties, technological innovation and regulatory environment changes.
Estimates of liabilities for unsettled asbestos-related claims are based on known claims and on ourexperience during the preceding two years for claims filed, settled and dismissed, with adjustments for
57
events deemed unusual and unlikely to recur. A substantial majority of our asbestos-related claims arecovered by insurance or indemnities. Estimated indemnities and receivables from insurance carriers forunsettled claims and receivables for settlements and legal fees paid by us for asbestos-related claims areestimated using our historical experience with insurance recovery rates and estimates of future recoveries,which include estimates of coverage and financial viability of our insurance carriers. We have claimspending against certain insurers that, if resolved more favorably than estimated future recoveries, wouldresult in discrete gains in the applicable quarter. We are currently unable to estimate the impact, if any, ofunasserted asbestos-related claims, although future claims would also be subject to existing indemnitiesand insurance coverage. Changes in claims filed, settled and dismissed and differences between actual andestimated settlement costs and insurance or indemnity recoveries could impact future expense.
Pension and Postretirement Benefits
We provide pension and postretirement benefits to certain of our employees, including formeremployees, and their beneficiaries. The assets, liabilities and expenses we recognize and disclosures wemake about plan actuarial and financial information are dependent on the assumptions and estimates usedin calculating such amounts. The assumptions include factors such as discount rates, health care cost trendrates, inflation, expected rates of return on plan assets, retirement rates, mortality rates, turnover, rates ofcompensation increases and other factors.
The assumptions utilized to compute expense and benefit obligations are shown in Note 11 to ourconsolidated financial statements included in Item 8 of this Annual Report. These assumptions areassessed annually in consultation with independent actuaries and investment advisors as of December 31and adjustments are made as needed. We evaluate prevailing market conditions and local laws andrequirements in countries where plans are maintained, including appropriate rates of return, interest ratesand medical inflation (health care cost trend) rates. We ensure that our significant assumptions are withinthe reasonable range relative to market data. The methodology to set our significant assumptions includes:
• Discount rates are estimated using high quality debt securities based on corporate or governmentbond yields with a duration matching the expected benefit payments. For the U.S. the discount rateis obtained from an analysis of publicly-traded investment-grade corporate bonds to establish aweighted average discount rate. For plans in the United Kingdom and the Eurozone we use thediscount rate obtained from an analysis of AA-graded corporate bonds used to generate a yieldcurve. For other countries or regions without a corporate AA bond market, government bond ratesare used. Our discount rate assumptions are impacted by changes in general economic and marketconditions that affect interest rates on long-term high-quality debt securities, as well as the durationof our plans’ liabilities.
• The expected rates of return on plan assets are derived from reviews of asset allocation strategies,expected long-term performance of asset classes, risks and other factors adjusted for our specificinvestment strategy. These rates are impacted by changes in general market conditions, but becausethey are long-term in nature, short-term market changes do not significantly impact the rates.Changes to our target asset allocation also impact these rates.
• The expected rates of compensation increase reflect estimates of the change in future compensationlevels due to general price levels, seniority, age and other factors.
Depending on the assumptions used, the pension and postretirement expense could vary within arange of outcomes and have a material effect on reported earnings. In addition, the assumptions canmaterially affect benefit obligations and future cash funding. Actual results in any given year may differfrom those estimated because of economic and other factors.
We evaluate the funded status of each retirement plan using current assumptions and determine theappropriate funding level considering applicable regulatory requirements, tax deductibility, reporting
58
considerations, cash flow requirements and other factors. We discuss our funding assumptions with theFinance Committee of our Board of Directors.
Valuation of Goodwill, Indefinite-Lived Intangible Assets and Other Long-Lived Assets
The initial recording of goodwill and intangible assets requires subjective judgments concerningestimates of the fair value of the acquired assets. We test the value of goodwill and indefinite-livedintangible assets for impairment as of December 31 each year or whenever events or circumstancesindicate such assets may be impaired.
The test for goodwill impairment involves significant judgment in estimating projections of fair valuegenerated through future performance of each of the reporting units. The identification of our reportingunits began at the operating segment level and considered whether components one level below theoperating segment levels should be identified as reporting units for purpose of testing goodwill forimpairment based on certain conditions. These conditions included, among other factors, (i) the extent towhich a component represents a business and (ii) the aggregation of economically similar componentswithin the operating segments and resulted in seven reporting units. Other factors that were considered indetermining whether the aggregation of components was appropriate included the similarity of the natureof the products and services, the nature of the production processes, the methods of distribution and thetypes of industries served.
An impairment loss for goodwill is recognized if the implied fair value of goodwill is less than thecarrying value. We estimate the fair value of our reporting units based on an income approach, whereby wecalculate the fair value of a reporting unit based on the present value of estimated future cash flows. Adiscounted cash flow analysis requires us to make various judgmental assumptions about future sales,operating margins, growth rates and discount rates, which are based on our budgets, business plans,economic projections, anticipated future cash flows and market participants. Assumptions are also madefor varying perpetual growth rates for periods beyond the long-term business plan period.
We did not record an impairment of goodwill in 2015, 2014 or 2013; however the estimated fair valueof our Engineered Product Operations (‘‘EPO’’) reporting unit reduced significantly in 2015 due to broad-based capital spending declines and heightened pricing pressure experienced in the oil and gas marketswhich are anticipated to continue in the near to mid-term. The EPO reporting unit is a component of ourEPD reporting segment and is primarily focused on long lead time, custom and other highly-engineeredpumps and pump systems. As of December 31, 2015 our EPO reporting unit had approximately$157 million of goodwill and its estimated fair value exceeded its carrying value by approximately 70%. Keyassumptions used in determining the estimated fair value of our EPO reporting unit included the annualoperating plan and forecasted operating results, successful execution of our current realignment programsand identified strategic initiatives, a constant cost of capital, a short-term stabilization and mid tolong-term improvement of the macro-economic conditions of the oil and gas market, and a relatively stableworld gross domestic product. A 100 basis point increase in our cost of capital would reduce the estimatedfair value of our EPO reporting unit by approximately 40%, which coupled with a prolonged down cycle ofthe oil and gas markets, could potentially put our EPO reporting unit’s goodwill at risk of a futureimpairment. Although we have concluded that there is no impairment on the goodwill associated with ourEPO reporting unit as of December 31, 2015, we will continue to closely monitor its performance andrelated market conditions for future indicators of potential impairment and reassess accordingly.
We also consider our market capitalization in our evaluation of the fair value of our goodwill. Ourmarket capitalization decreased as compared with 2014; however, it did not indicate a potentialimpairment of our goodwill as of December 31, 2015.
Impairment losses for indefinite-lived intangible assets are recognized whenever the estimated fairvalue is less than the carrying value. Fair values are calculated for trademarks using a ‘‘relief from royalty’’method, which estimates the fair value of a trademark by determining the present value of estimated
59
royalty payments that are avoided as a result of owning the trademark. This method includes judgmentalassumptions about sales growth and discount rates that have a significant impact on the fair value and aresubstantially consistent with the assumptions used to determine the fair value of our reporting unitsdiscussed above. We did not record a material impairment of our trademarks in 2015, 2014 or 2013.
The recoverable value of other long-lived assets, including property, plant and equipment and finite-lived intangible assets, is reviewed when indicators of potential impairments are present. The recoverablevalue is based upon an assessment of the estimated future cash flows related to those assets, utilizingassumptions similar to those for goodwill. Additional considerations related to our long-lived assetsinclude expected maintenance and improvements, changes in expected uses and ongoing operatingperformance and utilization.
Due to uncertain market conditions and potential changes in strategy and product portfolio, it ispossible that forecasts used to support asset carrying values may change in the future, which could result innon-cash charges that would adversely affect our financial condition and results of operations.
ACCOUNTING DEVELOPMENTS
We have presented the information about accounting pronouncements not yet implemented in Note 1to our consolidated financial statements included in Item 8 of this Annual Report.
ITEM 7A. QUANTITATIVE AND QUALITATIVE DISCLOSURES ABOUT MARKET RISK
We have market risk exposure arising from changes in interest rates and foreign currency exchangerate movements. We are exposed to credit-related losses in the event of non-performance bycounterparties to financial instruments, including interest rate swaps and forward exchange contracts, butwe currently expect all counterparties will continue to meet their obligations given their currentcreditworthiness.
Interest Rate Risk
Our earnings are impacted by changes in short-term interest rates as a result of borrowings under ourSenior Credit Facility, which bear interest based on floating rates. At December 31, 2015, we had$285.0 million of variable rate debt obligations outstanding under our Senior Credit Facility with aweighted average interest rate of 1.86%. A hypothetical change of 100 basis points in the interest rate forthese borrowings, assuming constant variable rate debt levels, would have changed interest expense by$2.9 million for the year ended December 31, 2015. At December 31, 2015 we had no notional amount inoutstanding interest rate swaps with third parties, compared to $40.0 million in December 31, 2014.
Foreign Currency Exchange Rate Risk
A substantial portion of our operations are conducted by our subsidiaries outside of the U.S. incurrencies other than the U.S. dollar. The primary currencies in which we operate, in addition to the U.S.dollar, are the Argentine peso, Australian dollar, Brazilian real, British pound, Canadian dollar, Chineseyuan, Colombian peso, Euro, Indian rupee, Japanese yen, Mexican peso, Singapore dollar, Swedish kronaand Venezuelan bolivar. Almost all of our non-U.S. subsidiaries conduct their business primarily in theirlocal currencies, which are also their functional currencies. Foreign currency exposures arise fromtranslation of foreign-denominated assets and liabilities into U.S. dollars and from transactions, includingfirm commitments and anticipated transactions, denominated in a currency other than a non-U.S.subsidiary’s functional currency. In March 2015, we designated A255.7 million of our A500.0 million 2022EUR Senior Notes as a net investment hedge of our investments in certain of our international subsidiariesthat use the Euro as their functional currency. Generally, we view our investments in foreign subsidiariesfrom a long-term perspective and use capital structuring techniques to manage our investment in foreignsubsidiaries as deemed necessary. We realized net losses associated with foreign currency translation of
60
$174.9 million, $148.6 million and $28.9 million for the years ended December 31, 2015, 2014 and 2013,respectively, which are included in other comprehensive (loss) income. The net loss in 2015 was primarilydriven by the weakening of the Euro, Brazilian real and Argentine peso versus the U.S. dollar atDecember 31, 2015 as compared with the December 31, 2014.
We employ a foreign currency risk management strategy to minimize potential changes in cash flowsfrom unfavorable foreign currency exchange rate movements. Where available, the use of forwardexchange contracts allows us to mitigate transactional exposure to exchange rate fluctuations as the gainsor losses incurred on the forward exchange contracts will offset, in whole or in part, losses or gains on theunderlying foreign currency exposure. Our policy allows foreign currency coverage only for identifiableforeign currency exposures, and beginning in the fourth quarter of 2013 instruments that meet certaincriteria are designated for hedge accounting. As of December 31, 2015, we had a U.S. dollar equivalent of$397.3 million in aggregate notional amount outstanding in foreign exchange contracts with third parties,compared with $547.0 million at December 31, 2014. Transactional currency gains and losses arising fromtransactions outside of our sites’ functional currencies and changes in fair value of non-designated foreignexchange contracts are included in our consolidated results of operations. We recognized foreign currencynet (losses) gains of $(38.7) million, $2.8 million and $(12.6) million for the years ended December 31,2015, 2014 and 2013, respectively, which are included in other (expense) income, net in the accompanyingconsolidated statements of income. See discussion of the impact in 2015 and 2013 of the devaluation of theVenezuelan bolivar in Note 1 to our consolidated financial statements included in Item 8 of this AnnualReport.
Based on a sensitivity analysis at December 31, 2015, a 10% change in the foreign currency exchangerates for the year ended December 31, 2015 would have impacted our net earnings by approximately$13 million. This calculation assumes that all currencies change in the same direction and proportionrelative to the U.S. dollar and that there are no indirect effects, such as changes in non-U.S. dollar salesvolumes or prices. This calculation does not take into account the impact of the foreign currency forwardexchange contracts discussed above.
Hedging related transactions for interest rate swaps and designated foreign exchange contractsrecorded to other comprehensive (loss) income, net of deferred taxes, are summarized in Note 17 to ourconsolidated financial statements included in Item 8 of this Annual Report.
We expect to recognize losses of $2.3 million, net of deferred taxes, into earnings in the next twelvemonths related to designated cash flow hedges based on their fair values at December 31, 2015.
61
ITEM 8. FINANCIAL STATEMENTS AND SUPPLEMENTARY DATA
REPORT OF INDEPENDENT REGISTERED PUBLIC ACCOUNTING FIRM
To The Board of Directors and Shareholders of Flowserve Corporation:
In our opinion, the consolidated financial statements listed in the index appearing underItem 15(a)(1) present fairly, in all material respects, the financial position of Flowserve Corporation and itssubsidiaries at December 31, 2015 and 2014, and the results of their operations and their cash flows foreach of the three years in the period ended December 31, 2015 in conformity with accounting principlesgenerally accepted in the United States of America. In addition, in our opinion, the financial statementschedule listed in the index appearing under Item 15(a)(2) presents fairly, in all material respects, theinformation set forth therein when read in conjunction with the related consolidated financial statements.Also in our opinion, the Company maintained, in all material respects, effective internal control overfinancial reporting as of December 31, 2015, based on criteria established in Internal Control — IntegratedFramework (2013) issued by the Committee of Sponsoring Organizations of the Treadway Commission(COSO). The Company’s management is responsible for these financial statements and financial statementschedule, for maintaining effective internal control over financial reporting and for its assessment of theeffectiveness of internal control over financial reporting, included in Management’s Report on InternalControl over Financial Reporting. Our responsibility is to express opinions on these financial statements,on the financial statement schedule, and on the Company’s internal control over financial reporting basedon our integrated audits. We conducted our audits in accordance with the standards of the Public CompanyAccounting Oversight Board (United States). Those standards require that we plan and perform the auditsto obtain reasonable assurance about whether the financial statements are free of material misstatementand whether effective internal control over financial reporting was maintained in all material respects. Ouraudits of the financial statements included examining, on a test basis, evidence supporting the amounts anddisclosures in the financial statements, assessing the accounting principles used and significant estimatesmade by management, and evaluating the overall financial statement presentation. Our audit of internalcontrol over financial reporting included obtaining an understanding of internal control over financialreporting, assessing the risk that a material weakness exists, and testing and evaluating the design andoperating effectiveness of internal control based on the assessed risk. Our audits also included performingsuch other procedures as we considered necessary in the circumstances. We believe that our audits providea reasonable basis for our opinions.
A company’s internal control over financial reporting is a process designed to provide reasonableassurance regarding the reliability of financial reporting and the preparation of financial statements forexternal purposes in accordance with generally accepted accounting principles. A company’s internalcontrol over financial reporting includes those policies and procedures that (i) pertain to the maintenanceof records that, in reasonable detail, accurately and fairly reflect the transactions and dispositions of theassets of the company; (ii) provide reasonable assurance that transactions are recorded as necessary topermit preparation of financial statements in accordance with generally accepted accounting principles,and that receipts and expenditures of the company are being made only in accordance with authorizationsof management and directors of the company; and (iii) provide reasonable assurance regarding preventionor timely detection of unauthorized acquisition, use, or disposition of the company’s assets that could havea material effect on the financial statements.
Because of its inherent limitations, internal control over financial reporting may not prevent or detectmisstatements. Also, projections of any evaluation of effectiveness to future periods are subject to the riskthat controls may become inadequate because of changes in conditions, or that the degree of compliancewith the policies or procedures may deteriorate.
As described in Management’s Report on Internal Control over Financial Reporting, managementhas excluded SIHI Group B.V. (‘‘SIHI’’) from its assessment of internal control over financial reporting asof December 31, 2015 because it was acquired by the Company on January 7, 2015. We have also excluded
62

SIHI from our audit of internal control over financial reporting. SIHI is a wholly owned subsidiary whosetotal assets and sales represent approximately 10% and 6%, respectively, of the related consolidatedfinancial statement amounts as of and for the year ended December 31, 2015.
/s/ PricewaterhouseCoopers LLP
PricewaterhouseCoopers LLPDallas, TexasFebruary 18, 2016
63
FLOWSERVE CORPORATION
CONSOLIDATED BALANCE SHEETS
December 31,
2015 2014
(Amounts in thousands, exceptper share data)
ASSETSCurrent assets:
Cash and cash equivalents . . . . . . . . . . . . . . . . . . . . . . . . . . . . . . . . . . . $ 366,444 $ 450,350Accounts receivable, net . . . . . . . . . . . . . . . . . . . . . . . . . . . . . . . . . . . . 988,391 1,082,447Inventories, net . . . . . . . . . . . . . . . . . . . . . . . . . . . . . . . . . . . . . . . . . . . 995,565 995,564Deferred taxes . . . . . . . . . . . . . . . . . . . . . . . . . . . . . . . . . . . . . . . . . . . 155,982 158,912Prepaid expenses and other . . . . . . . . . . . . . . . . . . . . . . . . . . . . . . . . . . 125,410 106,890
Total current assets . . . . . . . . . . . . . . . . . . . . . . . . . . . . . . . . . . . . 2,631,792 2,794,163Property, plant and equipment, net . . . . . . . . . . . . . . . . . . . . . . . . . . . . . . 758,427 693,881Goodwill . . . . . . . . . . . . . . . . . . . . . . . . . . . . . . . . . . . . . . . . . . . . . . . . . 1,223,986 1,067,255Deferred taxes . . . . . . . . . . . . . . . . . . . . . . . . . . . . . . . . . . . . . . . . . . . . . 26,264 31,419Other intangible assets, net . . . . . . . . . . . . . . . . . . . . . . . . . . . . . . . . . . . . 228,777 146,337Other assets, net . . . . . . . . . . . . . . . . . . . . . . . . . . . . . . . . . . . . . . . . . . . 234,604 234,965
Total assets . . . . . . . . . . . . . . . . . . . . . . . . . . . . . . . . . . . . . . . . . . . . . . . $ 5,103,850 $ 4,968,020
LIABILITIES AND EQUITYCurrent liabilities:
Accounts payable . . . . . . . . . . . . . . . . . . . . . . . . . . . . . . . . . . . . . . . . . $ 491,378 $ 611,715Accrued liabilities . . . . . . . . . . . . . . . . . . . . . . . . . . . . . . . . . . . . . . . . . 796,764 794,072Debt due within one year . . . . . . . . . . . . . . . . . . . . . . . . . . . . . . . . . . . 60,434 53,131Deferred taxes . . . . . . . . . . . . . . . . . . . . . . . . . . . . . . . . . . . . . . . . . . . 11,386 12,957
Total current liabilities . . . . . . . . . . . . . . . . . . . . . . . . . . . . . . . . . . 1,359,962 1,471,875Long-term debt due after one year . . . . . . . . . . . . . . . . . . . . . . . . . . . . . . 1,570,836 1,101,791Retirement obligations and other liabilities . . . . . . . . . . . . . . . . . . . . . . . . 489,319 452,511Commitments and contingencies (See Note 12)Shareholders’ equity:
Common shares, $1.25 par value . . . . . . . . . . . . . . . . . . . . . . . . . . . . . . 220,991 220,991Shares authorized — 305,000Shares issued — 176,793 and 176,793, respectively
Capital in excess of par value . . . . . . . . . . . . . . . . . . . . . . . . . . . . . . . . 494,961 495,600Retained earnings . . . . . . . . . . . . . . . . . . . . . . . . . . . . . . . . . . . . . . . . . 3,587,120 3,415,738Treasury shares, at cost — 47,703 and 42,444 shares, respectively . . . . . . . (2,106,785) (1,830,919)Deferred compensation obligation . . . . . . . . . . . . . . . . . . . . . . . . . . . . . 10,233 10,558Accumulated other comprehensive loss . . . . . . . . . . . . . . . . . . . . . . . . . (540,043) (380,406)
Total Flowserve Corporation shareholders’ equity . . . . . . . . . . . . . . . . . . . . 1,666,477 1,931,562Noncontrolling interests . . . . . . . . . . . . . . . . . . . . . . . . . . . . . . . . . . . . . . 17,256 10,281
Total equity . . . . . . . . . . . . . . . . . . . . . . . . . . . . . . . . . . . . . . . . . . . . 1,683,733 1,941,843
Total liabilities and equity . . . . . . . . . . . . . . . . . . . . . . . . . . . . . . . . . . . . . $ 5,103,850 $ 4,968,020
See accompanying notes to consolidated financial statements.
64
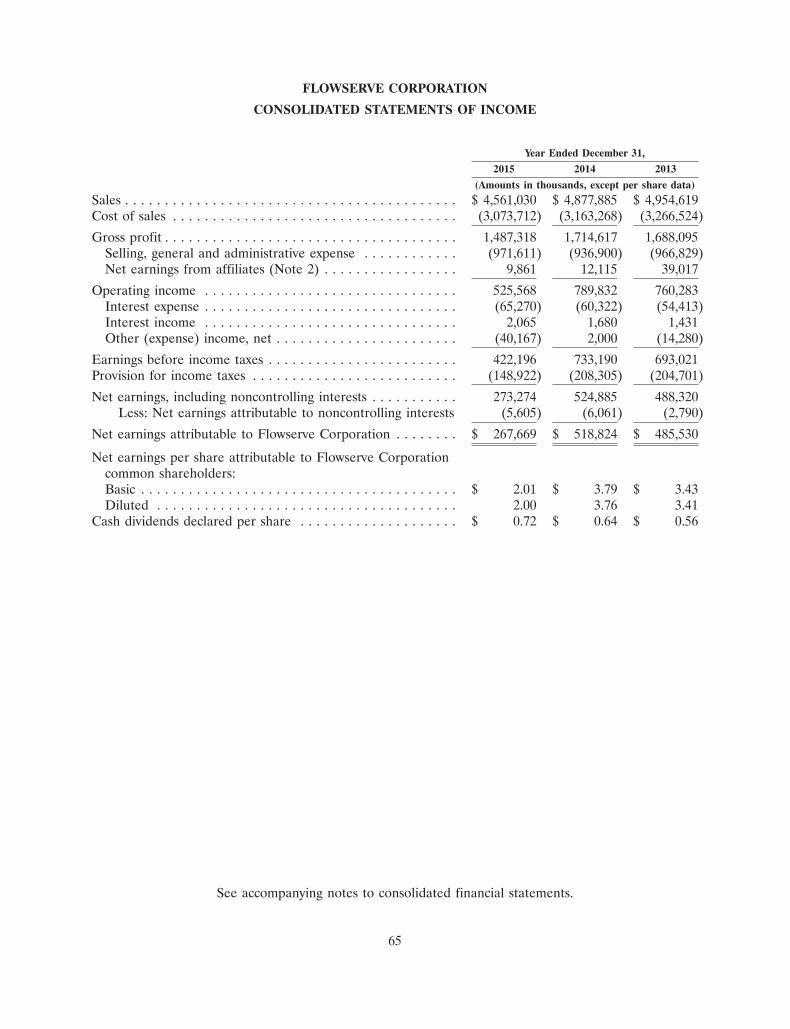
FLOWSERVE CORPORATION
CONSOLIDATED STATEMENTS OF INCOME
Year Ended December 31,
2015 2014 2013
(Amounts in thousands, except per share data)
Sales . . . . . . . . . . . . . . . . . . . . . . . . . . . . . . . . . . . . . . . . . . $ 4,561,030 $ 4,877,885 $ 4,954,619Cost of sales . . . . . . . . . . . . . . . . . . . . . . . . . . . . . . . . . . . . (3,073,712) (3,163,268) (3,266,524)
Gross profit . . . . . . . . . . . . . . . . . . . . . . . . . . . . . . . . . . . . . 1,487,318 1,714,617 1,688,095Selling, general and administrative expense . . . . . . . . . . . . (971,611) (936,900) (966,829)Net earnings from affiliates (Note 2) . . . . . . . . . . . . . . . . . 9,861 12,115 39,017
Operating income . . . . . . . . . . . . . . . . . . . . . . . . . . . . . . . . 525,568 789,832 760,283Interest expense . . . . . . . . . . . . . . . . . . . . . . . . . . . . . . . . (65,270) (60,322) (54,413)Interest income . . . . . . . . . . . . . . . . . . . . . . . . . . . . . . . . 2,065 1,680 1,431Other (expense) income, net . . . . . . . . . . . . . . . . . . . . . . . (40,167) 2,000 (14,280)
Earnings before income taxes . . . . . . . . . . . . . . . . . . . . . . . . 422,196 733,190 693,021Provision for income taxes . . . . . . . . . . . . . . . . . . . . . . . . . . (148,922) (208,305) (204,701)
Net earnings, including noncontrolling interests . . . . . . . . . . . 273,274 524,885 488,320Less: Net earnings attributable to noncontrolling interests (5,605) (6,061) (2,790)
Net earnings attributable to Flowserve Corporation . . . . . . . . $ 267,669 $ 518,824 $ 485,530
Net earnings per share attributable to Flowserve Corporationcommon shareholders:Basic . . . . . . . . . . . . . . . . . . . . . . . . . . . . . . . . . . . . . . . . $ 2.01 $ 3.79 $ 3.43Diluted . . . . . . . . . . . . . . . . . . . . . . . . . . . . . . . . . . . . . . 2.00 3.76 3.41
Cash dividends declared per share . . . . . . . . . . . . . . . . . . . . $ 0.72 $ 0.64 $ 0.56
See accompanying notes to consolidated financial statements.
65
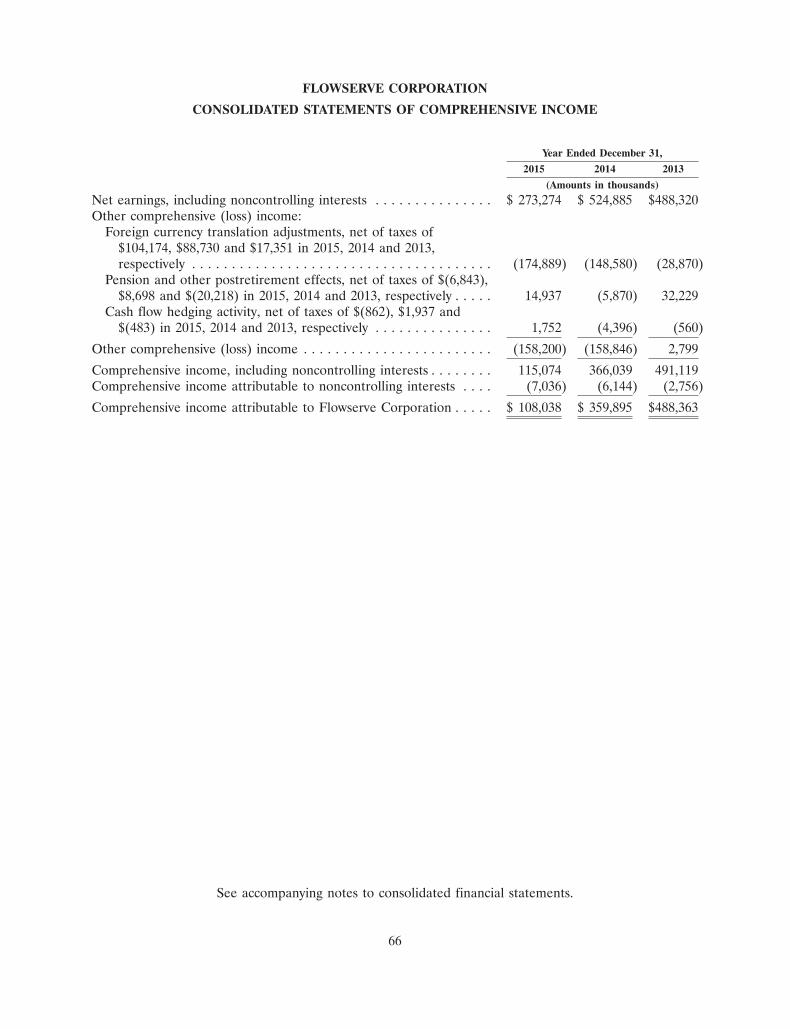
FLOWSERVE CORPORATION
CONSOLIDATED STATEMENTS OF COMPREHENSIVE INCOME
Year Ended December 31,
2015 2014 2013
(Amounts in thousands)
Net earnings, including noncontrolling interests . . . . . . . . . . . . . . . $ 273,274 $ 524,885 $488,320Other comprehensive (loss) income:
Foreign currency translation adjustments, net of taxes of$104,174, $88,730 and $17,351 in 2015, 2014 and 2013,respectively . . . . . . . . . . . . . . . . . . . . . . . . . . . . . . . . . . . . . . (174,889) (148,580) (28,870)
Pension and other postretirement effects, net of taxes of $(6,843),$8,698 and $(20,218) in 2015, 2014 and 2013, respectively . . . . . 14,937 (5,870) 32,229
Cash flow hedging activity, net of taxes of $(862), $1,937 and$(483) in 2015, 2014 and 2013, respectively . . . . . . . . . . . . . . . 1,752 (4,396) (560)
Other comprehensive (loss) income . . . . . . . . . . . . . . . . . . . . . . . . (158,200) (158,846) 2,799
Comprehensive income, including noncontrolling interests . . . . . . . . 115,074 366,039 491,119Comprehensive income attributable to noncontrolling interests . . . . (7,036) (6,144) (2,756)
Comprehensive income attributable to Flowserve Corporation . . . . . $ 108,038 $ 359,895 $488,363
See accompanying notes to consolidated financial statements.
66
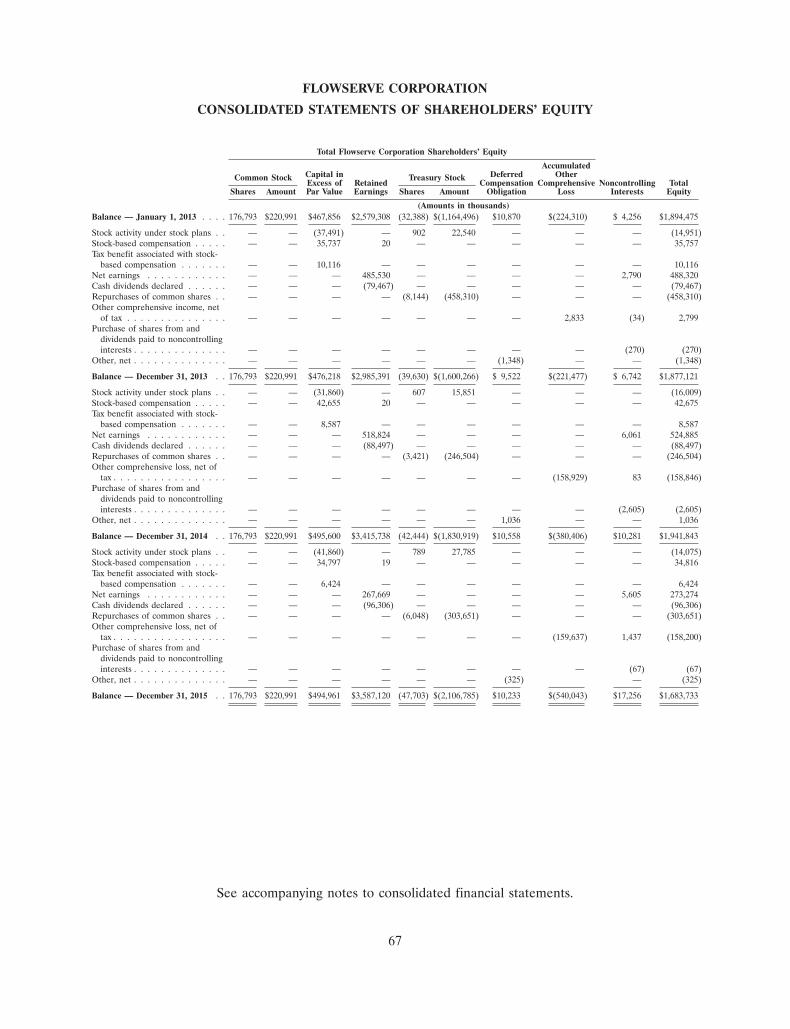
FLOWSERVE CORPORATION
CONSOLIDATED STATEMENTS OF SHAREHOLDERS’ EQUITY
Total Flowserve Corporation Shareholders’ Equity
AccumulatedCapital in Deferred OtherCommon Stock Treasury StockExcess of Retained Compensation Comprehensive Noncontrolling Total
Shares Amount Par Value Earnings Shares Amount Obligation Loss Interests Equity
(Amounts in thousands)Balance — January 1, 2013 . . . . 176,793 $220,991 $467,856 $2,579,308 (32,388) $(1,164,496) $10,870 $(224,310) $ 4,256 $1,894,475
Stock activity under stock plans . . — — (37,491) — 902 22,540 — — — (14,951)Stock-based compensation . . . . . — — 35,737 20 — — — — — 35,757Tax benefit associated with stock-
based compensation . . . . . . . — — 10,116 — — — — — — 10,116Net earnings . . . . . . . . . . . . — — — 485,530 — — — — 2,790 488,320Cash dividends declared . . . . . . — — — (79,467) — — — — — (79,467)Repurchases of common shares . . — — — — (8,144) (458,310) — — — (458,310)Other comprehensive income, net
of tax . . . . . . . . . . . . . . . — — — — — — — 2,833 (34) 2,799Purchase of shares from and
dividends paid to noncontrollinginterests . . . . . . . . . . . . . . — — — — — — — — (270) (270)
Other, net . . . . . . . . . . . . . . — — — — — — (1,348) — — (1,348)
Balance — December 31, 2013 . . 176,793 $220,991 $476,218 $2,985,391 (39,630) $(1,600,266) $ 9,522 $(221,477) $ 6,742 $1,877,121
Stock activity under stock plans . . — — (31,860) — 607 15,851 — — — (16,009)Stock-based compensation . . . . . — — 42,655 20 — — — — — 42,675Tax benefit associated with stock-
based compensation . . . . . . . — — 8,587 — — — — — — 8,587Net earnings . . . . . . . . . . . . — — — 518,824 — — — — 6,061 524,885Cash dividends declared . . . . . . — — — (88,497) — — — — — (88,497)Repurchases of common shares . . — — — — (3,421) (246,504) — — — (246,504)Other comprehensive loss, net of
tax . . . . . . . . . . . . . . . . . — — — — — — — (158,929) 83 (158,846)Purchase of shares from and
dividends paid to noncontrollinginterests . . . . . . . . . . . . . . — — — — — — — — (2,605) (2,605)
Other, net . . . . . . . . . . . . . . — — — — — — 1,036 — — 1,036
Balance — December 31, 2014 . . 176,793 $220,991 $495,600 $3,415,738 (42,444) $(1,830,919) $10,558 $(380,406) $10,281 $1,941,843
Stock activity under stock plans . . — — (41,860) — 789 27,785 — — — (14,075)Stock-based compensation . . . . . — — 34,797 19 — — — — — 34,816Tax benefit associated with stock-
based compensation . . . . . . . — — 6,424 — — — — — — 6,424Net earnings . . . . . . . . . . . . — — — 267,669 — — — — 5,605 273,274Cash dividends declared . . . . . . — — — (96,306) — — — — — (96,306)Repurchases of common shares . . — — — — (6,048) (303,651) — — — (303,651)Other comprehensive loss, net of
tax . . . . . . . . . . . . . . . . . — — — — — — — (159,637) 1,437 (158,200)Purchase of shares from and
dividends paid to noncontrollinginterests . . . . . . . . . . . . . . — — — — — — — — (67) (67)
Other, net . . . . . . . . . . . . . . — — — — — — (325) — (325)
Balance — December 31, 2015 . . 176,793 $220,991 $494,961 $3,587,120 (47,703) $(2,106,785) $10,233 $(540,043) $17,256 $1,683,733
See accompanying notes to consolidated financial statements.
67
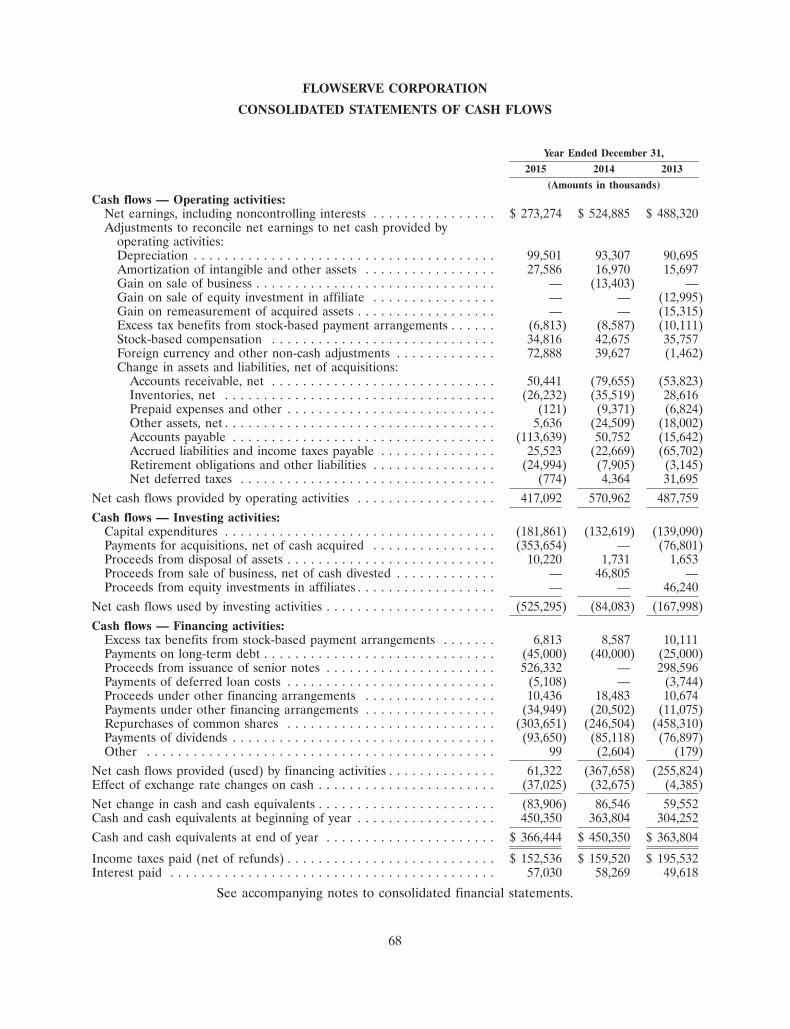
FLOWSERVE CORPORATION
CONSOLIDATED STATEMENTS OF CASH FLOWS
Year Ended December 31,
2015 2014 2013
(Amounts in thousands)Cash flows — Operating activities:
Net earnings, including noncontrolling interests . . . . . . . . . . . . . . . . $ 273,274 $ 524,885 $ 488,320Adjustments to reconcile net earnings to net cash provided by
operating activities:Depreciation . . . . . . . . . . . . . . . . . . . . . . . . . . . . . . . . . . . . . . . 99,501 93,307 90,695Amortization of intangible and other assets . . . . . . . . . . . . . . . . . 27,586 16,970 15,697Gain on sale of business . . . . . . . . . . . . . . . . . . . . . . . . . . . . . . . — (13,403) —Gain on sale of equity investment in affiliate . . . . . . . . . . . . . . . . — — (12,995)Gain on remeasurement of acquired assets . . . . . . . . . . . . . . . . . . — — (15,315)Excess tax benefits from stock-based payment arrangements . . . . . . (6,813) (8,587) (10,111)Stock-based compensation . . . . . . . . . . . . . . . . . . . . . . . . . . . . . 34,816 42,675 35,757Foreign currency and other non-cash adjustments . . . . . . . . . . . . . 72,888 39,627 (1,462)Change in assets and liabilities, net of acquisitions:
Accounts receivable, net . . . . . . . . . . . . . . . . . . . . . . . . . . . . . 50,441 (79,655) (53,823)Inventories, net . . . . . . . . . . . . . . . . . . . . . . . . . . . . . . . . . . . (26,232) (35,519) 28,616Prepaid expenses and other . . . . . . . . . . . . . . . . . . . . . . . . . . . (121) (9,371) (6,824)Other assets, net . . . . . . . . . . . . . . . . . . . . . . . . . . . . . . . . . . . 5,636 (24,509) (18,002)Accounts payable . . . . . . . . . . . . . . . . . . . . . . . . . . . . . . . . . . (113,639) 50,752 (15,642)Accrued liabilities and income taxes payable . . . . . . . . . . . . . . . 25,523 (22,669) (65,702)Retirement obligations and other liabilities . . . . . . . . . . . . . . . . (24,994) (7,905) (3,145)Net deferred taxes . . . . . . . . . . . . . . . . . . . . . . . . . . . . . . . . . (774) 4,364 31,695
Net cash flows provided by operating activities . . . . . . . . . . . . . . . . . . 417,092 570,962 487,759
Cash flows — Investing activities:Capital expenditures . . . . . . . . . . . . . . . . . . . . . . . . . . . . . . . . . . . (181,861) (132,619) (139,090)Payments for acquisitions, net of cash acquired . . . . . . . . . . . . . . . . (353,654) — (76,801)Proceeds from disposal of assets . . . . . . . . . . . . . . . . . . . . . . . . . . . 10,220 1,731 1,653Proceeds from sale of business, net of cash divested . . . . . . . . . . . . . — 46,805 —Proceeds from equity investments in affiliates . . . . . . . . . . . . . . . . . . — — 46,240
Net cash flows used by investing activities . . . . . . . . . . . . . . . . . . . . . . (525,295) (84,083) (167,998)
Cash flows — Financing activities:Excess tax benefits from stock-based payment arrangements . . . . . . . 6,813 8,587 10,111Payments on long-term debt . . . . . . . . . . . . . . . . . . . . . . . . . . . . . . (45,000) (40,000) (25,000)Proceeds from issuance of senior notes . . . . . . . . . . . . . . . . . . . . . . 526,332 — 298,596Payments of deferred loan costs . . . . . . . . . . . . . . . . . . . . . . . . . . . (5,108) — (3,744)Proceeds under other financing arrangements . . . . . . . . . . . . . . . . . 10,436 18,483 10,674Payments under other financing arrangements . . . . . . . . . . . . . . . . . (34,949) (20,502) (11,075)Repurchases of common shares . . . . . . . . . . . . . . . . . . . . . . . . . . . (303,651) (246,504) (458,310)Payments of dividends . . . . . . . . . . . . . . . . . . . . . . . . . . . . . . . . . . (93,650) (85,118) (76,897)Other . . . . . . . . . . . . . . . . . . . . . . . . . . . . . . . . . . . . . . . . . . . . . 99 (2,604) (179)
Net cash flows provided (used) by financing activities . . . . . . . . . . . . . . 61,322 (367,658) (255,824)Effect of exchange rate changes on cash . . . . . . . . . . . . . . . . . . . . . . . (37,025) (32,675) (4,385)
Net change in cash and cash equivalents . . . . . . . . . . . . . . . . . . . . . . . (83,906) 86,546 59,552Cash and cash equivalents at beginning of year . . . . . . . . . . . . . . . . . . 450,350 363,804 304,252
Cash and cash equivalents at end of year . . . . . . . . . . . . . . . . . . . . . . $ 366,444 $ 450,350 $ 363,804
Income taxes paid (net of refunds) . . . . . . . . . . . . . . . . . . . . . . . . . . . $ 152,536 $ 159,520 $ 195,532Interest paid . . . . . . . . . . . . . . . . . . . . . . . . . . . . . . . . . . . . . . . . . . 57,030 58,269 49,618
See accompanying notes to consolidated financial statements.
68
FLOWSERVE CORPORATION
NOTES TO CONSOLIDATED FINANCIAL STATEMENTSAS OF DECEMBER 31, 2015 AND 2014 AND FOR THE
THREE YEARS ENDED DECEMBER 31, 2015
1. SIGNIFICANT ACCOUNTING POLICIES AND ACCOUNTING DEVELOPMENTS
We are principally engaged in the worldwide design, manufacture, distribution and service ofindustrial flow management equipment. We provide long lead time, custom and other highly-engineeredpumps; standardized, general-purpose pumps; mechanical seals; industrial valves; and related automationproducts and solutions primarily for oil and gas, chemical, power generation, water management and othergeneral industries requiring flow management products and services. Equipment manufactured andserviced by us is predominantly used in industries that deal with difficult-to-handle and corrosive fluids, aswell as environments with extreme temperatures, pressure, horsepower and speed. Our business is affectedby economic conditions in the United States (‘‘U.S.’’) and other countries where our products are sold andserviced, by the cyclical nature and competitive environment of our industries served, by the relationship ofthe U.S. dollar to other currencies and by the demand for and pricing of our customers’ end products.
Stock Split — On June 7, 2013 we recorded a three-for-one stock split. Shareholders’ equity and allshare data, including treasury shares and stock-based compensation award shares, and per share datapresented herein have been retrospectively adjusted to reflect the impact of the increase in authorizedshares and the stock split, as appropriate. Details of the stock split are included in Note 14.
Venezuela — Our operations in Venezuela primarily consist of a service center that performs serviceand repair activities. Our Venezuelan subsidiary’s sales for the year ending December 31, 2015 and totalassets at December 31, 2015 represented less than 0.5% of consolidated sales and total assets for the sameperiods. Assets primarily consisted of United States (‘‘U.S.’’) dollar-denominated monetary assets andbolivar-denominated non-monetary assets at December 31, 2015. In addition, certain of our operations inother countries sell equipment and parts that are typically denominated in U.S. dollars directly toVenezuelan customers.
We have experienced delays in collecting payment on our accounts receivable from the national oilcompany in Venezuela, our primary Venezuelan customer. These accounts receivable are primarily U.S.dollar-denominated and are not disputed, and we have not historically written off accounts receivable fromthis customer. Our total outstanding accounts receivable with this customer were approximately 7% and9% of our gross accounts receivable at December 31, 2015 and 2014, respectively. Given the experienceddelays in collecting payments we estimate that approximately 64% of the outstanding accounts receivablewill most likely not be collected within one year and therefore has been classified as long-term within otherassets, net on our December 31, 2015 consolidated balance sheet. As of December 31, 2014, we hadapproximately 48% classified as long-term.
Effective February 13, 2013, the Venezuelan government devalued its official exchange rate from 4.3to 6.3 bolivars to the U.S. dollar. As a result of the devaluation, we recognized a loss of $4.0 million in thefirst quarter of 2013. The loss was reported in other expense, net in our consolidated statements of incomeand resulted in no tax benefit. As of March of 2015, we determined, based on our specific facts andcircumstances, that the SIMADI exchange rate was the most appropriate for the remeasurement of ourVenezuelan subsidiary’s bolivar-denominated net monetary assets in U.S. dollars. As a result of theremeasurement, in the first quarter of 2015 we recognized a loss of $20.6 million of which $18.5 million wasreported in other (expense) income, net and $2.1 million in cost of goods sold in our consolidatedstatement of income and resulted in no tax benefit. As of December 31, 2015, we believe the SIMADIexchange rate continues to be the most appropriate rate to remeasure the U.S. dollar value of the assets,liabilities and results of operations of our Venezuelan subsidiary. At December 31, 2015 the SIMADI
69
exchange rate was 198.7 bolivars to the U.S. dollar, compared with the official exchange rate of 6.3 bolivarsto the U.S. dollar.
We are continuing to assess and monitor the ongoing impact of the changes in the Venezuelan foreignexchange market on our Venezuelan operations and imports into the market, including our Venezuelansubsidiary’s ability to remit cash for dividends and other payments at the SIMADI exchange rate, as well asadditional government actions, political and labor unrest, or other economic conditions, including theVenezuelan government’s fiscal obligations, that may adversely impact our future consolidated financialcondition or results of operations.
Principles of Consolidation — The consolidated financial statements include the accounts of ourcompany and our wholly and majority-owned subsidiaries. In addition, we would consolidate any variableinterest entities for which we are deemed to be the primary beneficiary. Noncontrolling interests ofnon-affiliated parties have been recognized for all majority-owned consolidated subsidiaries. Intercompanyprofits/losses, transactions and balances among consolidated entities have been eliminated from ourconsolidated financial statements. Investments in unconsolidated affiliated companies, which representnoncontrolling ownership interests between 20% and 50%, are accounted for using the equity method,which approximates our equity interest in their underlying equivalent net book value under accountingprinciples generally accepted in the U.S. (‘‘U.S. GAAP’’). Investments in interests where we own less than20% of the investee are accounted for by the cost method, whereby income is only recognized in the eventof dividend receipt. Investments accounted for by the cost method are tested for impairment if animpairment indicator is present.
Use of Estimates — The process of preparing financial statements in conformity with U.S. GAAPrequires us to make estimates and assumptions that affect reported amounts of certain assets, liabilities,revenues and expenses. We believe our estimates and assumptions are reasonable; however, actual resultsmay differ materially from such estimates. The most significant estimates and assumptions are used indetermining:
• Timing and amount of revenue recognition;
• Deferred taxes, tax valuation allowances and tax reserves;
• Reserves for contingent loss;
• Pension and postretirement benefits; and
• Valuation of goodwill, indefinite-lived intangible assets and other long-lived assets.
Revenue Recognition — Revenues for product sales are recognized when the risks and rewards ofownership are transferred to the customers, which is typically based on the contractual delivery termsagreed to with the customer and fulfillment of all but inconsequential or perfunctory actions. In addition,our policy requires persuasive evidence of an arrangement, a fixed or determinable sales price andreasonable assurance of collectibility. We defer the recognition of revenue when advance payments arereceived from customers before performance obligations have been completed and/or services have beenperformed. Freight charges billed to customers are included in sales and the related shipping costs areincluded in cost of sales in our consolidated statements of income. Our contracts typically includecancellation provisions that require customers to reimburse us for costs incurred up to the date ofcancellation, as well as any contractual cancellation penalties.
We enter into certain agreements with multiple deliverables that may include any combination ofdesigning, developing, manufacturing, modifying, installing and commissioning of flow managementequipment and providing services related to the performance of such products. Delivery of these productsand services typically occurs within a one to two-year period, although many arrangements, such as ‘‘short-cycle’’ type orders, have a shorter timeframe for delivery. We separate deliverables into units of accounting
70
based on whether the deliverable(s) have standalone value to the customer (impact of general rights ofreturn is immaterial). Contract value is allocated ratably to the units of accounting in the arrangementbased on their relative selling prices determined as if the deliverables were sold separately.
Revenues for long-term contracts that exceed certain internal thresholds regarding the size andduration of the project and provide for the receipt of progress billings from the customer are recorded onthe percentage of completion method with progress measured on a cost-to-cost basis. Percentage ofcompletion revenue represents less than 7% of our consolidated sales for each year presented.
Revenue on service and repair contracts is recognized after services have been agreed to by thecustomer and rendered. Revenues generated under fixed fee service and repair contracts are recognized ona ratable basis over the term of the contract. These contracts can range in duration, but generally extendfor up to five years. Fixed fee service contracts represent approximately 1% of consolidated sales for eachyear presented.
In certain instances, we provide guaranteed completion dates under the terms of our contracts. Failureto meet contractual delivery dates can result in late delivery penalties or non-recoverable costs. Ininstances where the payment of such costs are deemed to be probable, we perform a project profitabilityanalysis, accounting for such costs as a reduction of realizable revenues, which could potentially causeestimated total project costs to exceed projected total revenues realized from the project. In such instances,we would record reserves to cover such excesses in the period they are determined. In circumstances wherethe total projected revenues still exceed total projected costs, the incurrence of penalties ornon-recoverable costs generally reduces profitability of the project at the time of subsequent revenuerecognition.
Cash and Cash Equivalents — We place temporary cash investments with financial institutions and, bypolicy, invest in those institutions and instruments that have minimal credit risk and market risk. Theseinvestments, with an original maturity of three months or less when purchased, are classified as cashequivalents. They are highly liquid and principal values are not subject to significant risk of change due tointerest rate fluctuations.
Allowance for Doubtful Accounts and Credit Risk — The allowance for doubtful accounts is establishedbased on estimates of the amount of uncollectible accounts receivable, which is determined principallybased upon the aging of the accounts receivable, but also customer credit history, industry and marketsegment information, economic trends and conditions and credit reports. Customer credit issues, customerbankruptcies or general economic conditions may also impact our estimates.
Credit risks are mitigated by the diversity of our customer base across many different geographicregions and industries and by performing creditworthiness analyses on our customers. Additionally, wemitigate credit risk through letters of credit and advance payments received from our customers. As ofDecember 31, 2015, although we have experienced increased aging and slower collection of receivableswith our primary Venezuelan customer, we do not believe that we have any significant concentrations ofcredit risk.
Inventories and Related Reserves — Inventories are stated at the lower of cost or market. Cost isdetermined by the first-in, first-out method. Reserves for excess and obsolete inventories are based uponour assessment of market conditions for our products determined by historical usage and estimated futuredemand. Due to the long life cycles of our products, we carry spare parts inventories that have historicallylow usage rates and provide reserves for such inventory based on demonstrated usage and aging criteria.
Income Taxes, Deferred Taxes, Tax Valuation Allowances and Tax Reserves — We account for incometaxes under the asset and liability method. Deferred tax assets and liabilities are recognized for the futuretax consequences attributable to differences between the financial statement carrying amounts of existingassets and liabilities and their respective tax bases and operating loss and tax credit carryforwards.
71
Deferred tax assets and liabilities are calculated using enacted tax rates expected to apply to taxableincome in the years in which those temporary differences are expected to be recovered or settled. Theeffect on deferred tax assets and liabilities of a change in tax rates is recognized in the period that includesthe enactment date. We record valuation allowances to reflect the estimated amount of deferred tax assetsthat may not be realized based upon our analysis of existing deferred tax assets, net operating losses andtax credits by jurisdiction and expectations of our ability to utilize these tax attributes through a review ofpast, current and estimated future taxable income and establishment of tax strategies.
We provide deferred taxes for the temporary differences associated with our investment in foreignsubsidiaries that have a financial reporting basis that exceeds tax basis, unless we can assert permanentreinvestment in foreign jurisdictions. Financial reporting basis and tax basis differences in investments inforeign subsidiaries consist of both unremitted earnings and losses, as well as foreign currency translationadjustments.
The amount of income taxes we pay is subject to ongoing audits by federal, state, and foreign taxauthorities, which often result in proposed assessments. We establish reserves for open tax years foruncertain tax positions that may be subject to challenge by various tax authorities. The consolidated taxprovision and related accruals include the impact of such reasonably estimable losses and related interestand penalties as deemed appropriate.
We recognize the tax benefit from an uncertain tax position only if it is more likely than not that thetax position will be sustained on examination by the taxing authorities. The determination is based on thetechnical merits of the position and presumes that each uncertain tax position will be examined by therelevant taxing authority that has full knowledge of all relevant information. The tax benefits recognized inthe financial statements from such a position are measured based on the largest benefit that has a greaterthan fifty percent likelihood of being realized upon ultimate settlement.
Legal and Environmental Contingencies — Legal and environmental reserves are recorded based upona case-by-case analysis of the relevant facts and circumstances and an assessment of potential legalobligations and costs. Amounts relating to legal and environmental liabilities are recorded when it isprobable that a loss has been incurred and such loss is estimable. Assessments of legal and environmentalcosts are based on information obtained from our independent and in-house experts and our lossexperience in similar situations. Estimates are updated as applicable when new information regarding thefacts and circumstances of each matter becomes available. Legal fees associated with legal andenvironmental liabilities are expensed as incurred.
Estimates of liabilities for unsettled asbestos-related claims are based on known claims and on ourexperience during the preceding two years for claims filed, settled and dismissed, with adjustments forevents deemed unusual and unlikely to recur, and are included in retirement obligations and otherliabilities in our consolidated balance sheets. A substantial majority of our asbestos-related claims arecovered by insurance or indemnities. Estimated indemnities and receivables from insurance carriers forunsettled claims and receivables for settlements and legal fees paid by us for asbestos-related claims areestimated using our historical experience with insurance recovery rates and estimates of future recoveries,which include estimates of coverage and financial viability of our insurance carriers. Estimated receivablesare included in other assets, net in our consolidated balance sheets. We have claims pending against certaininsurers that, if resolved more favorably than estimated future recoveries, would result in discrete gains inthe applicable quarter. We are currently unable to estimate the impact, if any, of unasserted asbestos-related claims, although future claims would also be subject to existing indemnities and insurancecoverage.
Warranty Accruals — Warranty obligations are based upon product failure rates, materials usage,service delivery costs, an analysis of all identified or expected claims and an estimate of the cost to resolvesuch claims. The estimates of expected claims are generally a factor of historical claims and known product
72
issues. Warranty obligations based on these factors are adjusted based on historical sales trends for thepreceding 24 months.
Insurance Accruals — Insurance accruals are recorded for wholly or partially self-insured risks such asmedical benefits and workers’ compensation and are based upon an analysis of our claim loss history,insurance deductibles, policy limits and other relevant factors that are updated annually and are includedin accrued liabilities in our consolidated balance sheets. The estimates are based upon informationreceived from actuaries, insurance company adjusters, independent claims administrators or otherindependent sources. Receivables from insurance carriers are estimated using our historical experiencewith insurance recovery rates and estimates of future recoveries, which include estimates of coverage andfinancial viability of our insurance carriers. Estimated receivables are included in accounts receivable, netand other assets, net, as applicable, in our consolidated balance sheets.
Pension and Postretirement Obligations — Determination of pension and postretirement benefitsobligations is based on estimates made by management in consultation with independent actuaries andinvestment advisors. Inherent in these valuations are assumptions including discount rates, expected ratesof return on plan assets, retirement rates, mortality rates and rates of compensation increase and otherfactors all of which are reviewed annually and updated if necessary. Current market conditions, includingchanges in rates of return, interest rates and medical inflation rates, are considered in selecting theseassumptions.
Actuarial gains and losses and prior service costs are recognized in accumulated other comprehensiveloss as they arise and we amortize these costs into net pension expense over the remaining expected serviceperiod.
Property, Plant and Equipment and Depreciation — Property, plant and equipment are stated athistorical cost, less accumulated depreciation. If asset retirement obligations exist, they are capitalized aspart of the carrying amount of the asset and depreciated over the remaining useful life of the asset. Theuseful lives of leasehold improvements are the lesser of the remaining lease term or the useful life of theimprovement. When assets are retired or otherwise disposed of, their costs and related accumulateddepreciation are removed from the accounts and any resulting gains or losses are included in income fromoperations for the period. Depreciation is computed by the straight-line method based on the estimateduseful lives of the depreciable assets, or in the case of assets under capital leases, over the related leaseturn. Generally, the estimated useful lives of the assets are:
Buildings and improvements . . . . . . . . . . . . . . . . . . . . . . . . . . . . . . . . . . . . . . . . . . . 10 to 40 yearsMachinery, equipment and tooling . . . . . . . . . . . . . . . . . . . . . . . . . . . . . . . . . . . . . . . 3 to 14 yearsSoftware, furniture and fixtures and other . . . . . . . . . . . . . . . . . . . . . . . . . . . . . . . . . 3 to 7 years
Costs related to routine repairs and maintenance are expensed as incurred.
Internally Developed Software — We capitalize certain costs associated with the development ofinternal-use software. Generally, these costs are related to significant software development projects andare amortized over their estimated useful life, typically three to five years, upon implementation of thesoftware.
Intangible Assets — Intangible assets, excluding trademarks (which are considered to have anindefinite life), consist primarily of engineering drawings, patents, existing customer relationships,software, distribution networks and other items that are being amortized over their estimated useful livesgenerally ranging from four to 40 years. These assets are reviewed for impairment whenever events andcircumstances indicate impairment may have occurred.
Valuation of Goodwill, Indefinite-Lived Intangible Assets and Other Long-Lived Assets — The value ofgoodwill and indefinite-lived intangible assets is tested for impairment as of December 31 each year or
73

whenever events or circumstances indicate such assets may be impaired. The identification of our reportingunits began at the operating segment level and considered whether components one level below theoperating segment levels should be identified as reporting units for purpose of testing goodwill forimpairment based on certain conditions. These conditions included, among other factors, (i) the extent towhich a component represents a business and (ii) the aggregation of economically similar componentswithin the operating segments and resulted in seven reporting units. Other factors that were considered indetermining whether the aggregation of components was appropriate included the similarity of the natureof the products and services, the nature of the production processes, the methods of distribution and thetypes of industries served.
An impairment loss for goodwill is recognized if the implied fair value of goodwill is less than thecarrying value. We estimate the fair value of our reporting units based on an income approach, whereby wecalculate the fair value of a reporting unit based on the present value of estimated future cash flows. Adiscounted cash flow analysis requires us to make various judgmental assumptions about future sales,operating margins, growth rates and discount rates, which are based on our budgets, business plans,economic projections, anticipated future cash flows and market participants. Assumptions are also madefor varying perpetual growth rates for periods beyond the long-term business plan period.
We did not record an impairment of goodwill in 2015, 2014 or 2013; however the estimated fair valueof our Engineered Product Operations (‘‘EPO’’) reporting unit reduced significantly in 2015 due to broad-based capital spending declines and heightened pricing pressure experienced in the oil and gas marketswhich are anticipated to continue in the near to mid-term. The EPO reporting unit is a component of ourEPD reporting segment and is primarily focused on long lead time, custom and other highly-engineeredpumps and pump systems. As of December 31, 2015 our EPO reporting unit had approximately$157 million of goodwill and its estimated fair value exceeded its carrying value by approximately 70%. Keyassumptions used in determining the estimated fair value of our EPO reporting unit included the annualoperating plan and forecasted operating results, successful execution of our current realignment programsand identified strategic initiatives, a constant cost of capital, a short-term stabilization and mid tolong-term improvement of the macro-economic conditions of the oil and gas market, and a relatively stableworld gross domestic product. Although we have concluded that there is no impairment on the goodwillassociated with our EPO reporting unit as of December 31, 2015, we will continue to closely monitor itsperformance and related market conditions for future indicators of potential impairment and reassessaccordingly.
We also consider our market capitalization in our evaluation of the fair value of our goodwill. Ourmarket capitalization decreased as compared with 2014; however, it did not indicate a potentialimpairment of our goodwill as of December 31, 2015.
Impairment losses for indefinite-lived intangible assets are recognized whenever the estimated fairvalue is less than the carrying value. Fair values are calculated for trademarks using a ‘‘relief from royalty’’method, which estimates the fair value of a trademark by determining the present value of estimatedroyalty payments that are avoided as a result of owning the trademark. This method includes judgmentalassumptions about sales growth and discount rates that have a significant impact on the fair value and aresubstantially consistent with the assumptions used to determine the fair value of our reporting unitsdiscussed above. We did not record a material impairment of our trademarks in 2015, 2014 or 2013.
The recoverable value of other long-lived assets, including property, plant and equipment and finite-lived intangible assets, is reviewed when indicators of potential impairments are present. The recoverablevalue is based upon an assessment of the estimated future cash flows related to those assets, utilizingassumptions similar to those for goodwill. Additional considerations related to our long-lived assetsinclude expected maintenance and improvements, changes in expected uses and ongoing operatingperformance and utilization.
74
Deferred Loan Costs — Deferred loan costs, consisting of fees and other expenses associated with debtfinancing, are amortized over the term of the associated debt using the effective interest method.Additional amortization is recorded in periods where optional prepayments on debt are made.
Fair Values of Financial Instruments — Our financial instruments are presented at fair value in ourconsolidated balance sheets, with the exception of our long-term debt. Fair value is defined as the pricethat would be received to sell an asset or paid to transfer a liability in an orderly transaction betweenmarket participants at the measurement date. Where available, fair value is based on observable marketprices or parameters or derived from such prices or parameters. Where observable prices or inputs are notavailable, valuation models may be applied.
Assets and liabilities recorded at fair value in our consolidated balance sheets are categorized basedupon the level of judgment associated with the inputs used to measure their fair values. Hierarchical levels,as defined by Accounting Standards Codification (‘‘ASC’’) 820, ‘‘Fair Value Measurements andDisclosures,’’ are directly related to the amount of subjectivity associated with the inputs to fair valuationof these assets and liabilities. An asset or a liability’s categorization within the fair value hierarchy is basedon the lowest level of significant input to its valuation. Hierarchical levels are as follows:
Level I — Inputs are unadjusted, quoted prices in active markets for identical assets orliabilities at the measurement date.
Level II — Inputs (other than quoted prices included in Level I) are either directly orindirectly observable for the asset or liability through correlation with market data at themeasurement date and for the duration of the instrument’s anticipated life.
Level III — Inputs reflect management’s best estimate of what market participants woulduse in pricing the asset or liability at the measurement date. Consideration is given to the riskinherent in the valuation technique and the risk inherent in the inputs to the model.
Recurring fair value measurements are limited to investments in derivative instruments and certainequity securities. The fair value measurements of our derivative instruments are determined using modelsthat maximize the use of the observable market inputs including interest rate curves and both forward andspot prices for currencies, and are classified as Level II under the fair value hierarchy. The fair values ofour derivative instruments are included in Note 6. The fair value measurements of our investments inequity securities are determined using quoted market prices and are classified as Level I. The fair values ofour investments in equity securities, and changes thereto, are immaterial to our consolidated financialposition and results of operations.
Derivatives and Hedging Activities — We have a foreign currency derivatives and hedging policyoutlining the conditions under which we can enter into financial derivative transactions. We do not usederivative instruments for trading or speculative purposes. All derivative instruments are recognized on thebalance sheet at their fair values. The accounting for gains and losses resulting from changes in fair valuedepends on whether the derivative is designated and qualifies for hedge accounting.
Foreign Exchange Contracts — We employ a foreign currency economic hedging strategy tomitigate certain financial risks resulting from foreign currency exchange rate movements that impactforeign currency denominated receivables and payables, firm committed transactions and forecastedsales and purchases. In 2013 we began to designate certain forward exchange contracts as hedginginstruments and apply hedge accounting to those instruments.
For designated forward exchange contracts, the changes in fair value are recorded in othercomprehensive loss until the underlying hedged item affects earnings, at which time the change in fairvalue is recognized in sales in the consolidated statements of income. For non-designated forwardexchange contracts, the changes in the fair values are recognized immediately in other (expense)
75
income, net in the consolidated statements of income. See Note 6 for further discussion of forwardexchange contracts.
Interest Rate Swaps — We enter into interest rate swap agreements for the purpose of hedgingour cash flow exposure to floating interest rates on certain portions of our debt. Changes in the fairvalue of a designated interest rate swap are recorded in other comprehensive loss until earnings areaffected by the underlying hedged item. Any ineffective portion of the gain or loss is immediatelyrecognized in earnings. Upon settlement, realized gains and losses are recognized in interest expensein the consolidated statements of income. See Note 6 for further discussion of interest rate swaps.
We discontinue hedge accounting when (1) we deem the hedge to be ineffective and determine thatthe designation of the derivative as a hedging instrument is no longer appropriate; (2) the derivativematures, terminates or is sold; or (3) occurrence of the contracted or committed transaction is no longerprobable or will not occur in the originally expected period.
When hedge accounting is discontinued and the derivative remains outstanding, we carry thederivative at its estimated fair value on the balance sheet, recognizing changes in the fair value in currentperiod earnings. If a cash flow hedge becomes ineffective, any deferred gains or losses remain inaccumulated other comprehensive loss until the underlying hedged item is recognized. If it becomesprobable that a hedged forecasted transaction will not occur, deferred gains or losses on the hedginginstrument are recognized in earnings immediately.
We are exposed to risk from credit-related losses resulting from nonperformance by counterparties toour financial instruments. We perform credit evaluations of our counterparties under forward exchangecontracts and interest rate swap agreements and expect all counterparties to meet their obligations. Ifnecessary, we would adjust the values of our derivative contracts for our or our counterparties’ credit risks.
Foreign Currency Translation — Assets and liabilities of our foreign subsidiaries are translated to U.S.dollars at exchange rates prevailing at the balance sheet date, while income and expenses are translated ataverage rates for each month. Translation gains and losses are reported as a component of accumulatedother comprehensive loss. Transactional currency gains and losses arising from transactions in currenciesother than our sites’ functional currencies are included in our consolidated results of operations.
Transaction and translation gains and losses arising from intercompany balances are reported as acomponent of accumulated other comprehensive loss when the underlying transaction stems from along-term equity investment or from debt designated as not due in the foreseeable future. Otherwise, werecognize transaction gains and losses arising from intercompany transactions as a component of income.Where intercompany balances are not long-term investment related or not designated as due beyond theforeseeable future, we may mitigate risk associated with foreign currency fluctuations by entering intoforward exchange contracts.
Stock-Based Compensation — Stock-based compensation is measured at the grant-date fair value. Theexercise price of stock option awards and the value of restricted share, restricted share unit andperformance-based unit awards (collectively referred to as ‘‘Restricted Shares’’) are set at the closing priceof our common stock on the New York Stock Exchange on the date of grant, which is the date such grantsare authorized by our Board of Directors. Restricted share units and performance-based units refer torestricted awards that do not have voting rights and accrue dividends, which are forfeited if vesting doesnot occur.
The intrinsic value of Restricted Shares, which is typically the product of share price at the date ofgrant and the number of Restricted Shares granted, is amortized on a straight-line basis to compensationexpense over the periods in which the restrictions lapse based on the expected number of shares that willvest. The forfeiture rate is based on unvested Restricted Shares forfeited compared with original totalRestricted Shares granted over a 4-year period, excluding significant forfeiture events that are not expectedto recur.
76
Earnings Per Share — We use the two-class method of calculating Earnings Per Share (‘‘EPS’’), whichdetermines earnings per share for each class of common stock and participating security as if all earningsfor the period had been distributed. Unvested restricted share awards that earn non-forfeitable dividendrights qualify as participating securities and, accordingly, are included in the basic computation as such.Our unvested restricted shares participate on an equal basis with common shares; therefore, there is nodifference in undistributed earnings allocated to each participating security. Accordingly, the presentationbelow is prepared on a combined basis and is presented as earnings per common share. The following is areconciliation of net earnings of Flowserve Corporation and weighted average shares for calculating basicnet earnings per common share.
Earnings per weighted average common share outstanding was calculated as follows:
Year Ended December 31,
2015 2014 2013
(Amounts in thousands,except per share data)
Net earnings of Flowserve Corporation . . . . . . . . . . . . . . . . . . . . . . . $267,669 $518,824 $485,530Dividends on restricted shares not expected to vest . . . . . . . . . . . . . . 12 12 13
Earnings attributable to common and participating shareholders . . . . $267,681 $518,836 $485,543
Weighted average shares:Common stock . . . . . . . . . . . . . . . . . . . . . . . . . . . . . . . . . . . . . . . . 132,567 136,334 140,901Participating securities . . . . . . . . . . . . . . . . . . . . . . . . . . . . . . . . . . . 507 578 698
Denominator for basic earnings per common share . . . . . . . . . . . . . . 133,074 136,912 141,599Effect of potentially dilutive securities . . . . . . . . . . . . . . . . . . . . . . . 737 931 830
Denominator for diluted earnings per common share . . . . . . . . . . . . 133,811 137,843 142,429
Net earnings per share attributable to Flowserve Corporationcommon shareholders:Basic . . . . . . . . . . . . . . . . . . . . . . . . . . . . . . . . . . . . . . . . . . . . . . $ 2.01 $ 3.79 $ 3.43Diluted . . . . . . . . . . . . . . . . . . . . . . . . . . . . . . . . . . . . . . . . . . . . 2.00 3.76 3.41
Diluted earnings per share is based upon the weighted average number of shares as determined forbasic earnings per share plus shares potentially issuable in conjunction with stock options, restricted shareunits and performance share units.
Research and Development Expense — Research and development costs are charged to expense whenincurred. Aggregate research and development costs included in selling, general and administrativeexpenses (‘‘SG&A’’) were $45.9 million, $40.9 million and $37.8 million in 2015, 2014 and 2013,respectively. Costs incurred for research and development primarily include salaries and benefits andconsumable supplies, as well as rent, professional fees, utilities and the depreciation of property andequipment used in research and development activities.
Accounting Developments
Pronouncements Implemented
In June 2014, the Financial Accounting Standards Board (‘‘FASB’’) issued Accounting StandardsUpdate (‘‘ASU’’) No. 2014-11 ‘‘Transfers and Servicing (Topic 860): Repurchase-to-Maturity Transactions,Repurchase Financings, and Disclosures.’’ This ASU changes the accounting for repurchase-to-maturitytransactions and linked repurchase financings so that such transactions will now be accounted for assecured borrowings. This accounting change is effective for the first interim or annual period beginningafter December 15, 2014 and early adoption is not permitted. There are also new disclosure requirements
77
in this ASU. Our adoption of ASU No. 2014-11, as of January 1, 2015, did not have an impact on ourconsolidated financial condition and results of operations.
In April 2015, the FASB issued ASU No. 2015-05, ‘‘Intangibles — Goodwill and Other-Internal-UseSoftware (Subtopic 350-40): Customer’s Accounting for Fees Paid in a Cloud Computing Arrangement.’’The ASU provides explicit guidance about a customer’s accounting for fees paid in connection with a cloudcomputing arrangements. ASU 2015-05 is effective for periods beginning after December 15, 2015. Earlyadoption is permitted. We adopted the amendments of this ASU immediately and it did not have animpact on our consolidated financial condition and results of operations.
In May 2015, the FASB issued ASU No. 2015-08, ‘‘Business Combinations (Topic 805): PushdownAccounting — Amendments to SEC Paragraphs Pursuant to Staff Accounting Bulletin No. 115.’’ This ASUamends various U.S. Securities and Exchange Commission (‘‘SEC’’) paragraphs pursuant to the issuanceStaff Accounting Bulletin No. 115. The amendments conform the Board’s guidance on pushdownaccounting to that of the SEC. We adopted the amendments of this ASU immediately and it did not havean impact on our consolidated financial condition and results of operations.
In September 2015, the FASB issued ASU 2015-16, ‘‘Business Combinations (Topic 805): Simplifyingthe Accounting for Measurement-Period Adjustments.’’ The ASU eliminates the requirement to accountfor business combination measurement period adjustments retrospectively. Measurement periodadjustments will now be recognized prospectively in the reporting period in which the adjustment amountis determined. The nature and amount of any measurement period adjustments recognized during thereporting period must be disclosed, including the value of the adjustment to each current period incomestatement line item relating to the income effects that would have been recognized in previous periods ifthe adjustment to provisional amounts were recognized as of the acquisition date. ASU 2015-16 is effectivefor periods beginning after December 15, 2015. Early adoption is permitted. We adopted the amendmentsof this ASU immediately and it did not have an impact on our consolidated financial condition and resultsof operations.
Pronouncements Not Yet Implemented
In May 2014, the FASB issued ASU No. 2014-09, ‘‘Revenue from Contracts with Customers(Topic 606)’’ which supersedes the revenue recognition requirements in ‘‘Revenue Recognition(Topic 605).’’ The standard is principle-based and provides a five-step model to determine when and howrevenue is recognized. The core principle is that a company should recognize revenue when it transferspromised goods or services to customers in an amount that reflects the consideration to which thecompany expects to be entitled in exchange for those goods or services. There are also expanded disclosurerequirements in this ASU. In August 2015, the FASB issued ASU No. 2015-14, ‘‘Revenue from Contractswith Customers (Topic 606): Deferral of Effective Date.’’ As a result, public entities will apply the newstandard for annual reporting periods beginning after December 15, 2017, including interim periods withinthose reporting periods. Early adoption as of the original public entity effective date is permitted. We arecurrently evaluating the impact of ASU No. 2014-09 on our consolidated financial condition and results ofoperations.
In June 2014, the FASB issued ASU No. 2014-12 ‘‘Compensation-Stock Compensation (Topic 718):Accounting for Share-Based Payments When the Terms of an Award Provide That a Performance TargetCould Be Achieved after the Requisite Service Period.’’ This ASU was issued to address share-basedpayment awards with a performance target affecting vesting that could be achieved after the employee’srequisite service period. This ASU is effective for annual periods and interim periods within those annualperiods beginning after December 15, 2015. This ASU may be applied either (a) prospectively to all awardsgranted or modified after the effective date or (b) retrospectively to all awards with performance targetsthat are outstanding as of the beginning of the earliest annual period presented in the financial statements
78
and to all new or modified awards thereafter. The adoption of ASU No. 2014-12 will not have a materialimpact on our consolidated financial condition and results of operations.
In August 2014, the FASB issued ASU No. 2014-15, ‘‘Presentation of Financial Statements — GoingConcern (Subtopic 205-40): Disclosure of Uncertainties about an Entity’s Ability to Continue as a GoingConcern.’’ This ASU requires management to evaluate whether there are conditions or events that raisesubstantial doubt about the ability of a company to continue as a going concern for one year from the datethe financial statements are issued or within one year after the date that the financial statements areavailable to be issued when applicable. Further, the ASU provides management guidance regarding itsresponsibility to disclose the ability of a company to continue as a going concern in the notes to thefinancial statements. This ASU is effective for annual periods ending after December 15, 2016, and interimperiods thereafter, with early adoption permitted. The adoption of ASU No. 2014-15 will not have animpact on our consolidated financial condition and results of operations.
In November 2014, the FASB issued ASU No. 2014-16, ‘‘Derivatives and Hedging (Topic 815):‘‘Determining Whether the Host Contract in a Hybrid Financial Instrument Issued in the Form of a ShareIs More Akin to Debt or to Equity.’’ This ASU was issued to clarify and reinforce the practice of evaluatingall relevant terms and features when reviewing the nature of a host contract. The ASU stipulates that noone term or feature would define the host contract’s economic characteristics and risks. As a result, theeconomic characteristics and risks of the hybrid financial instrument as a whole would determine thenature of the host contract. This ASU is effective for fiscal years, and interim periods within those fiscalyears, beginning after December 15, 2015. The adoption of ASU No. 2014-16 will not have an impact onour consolidated financial condition and results of operations.
In January 2015, the FASB issued ASU No. 2015-01, ‘‘Income Statement-Extraordinary and UnusualItems (Subtopic 225-20): Simplifying Income Statement Presentation by Eliminating the Concept ofExtraordinary Items.’’ In connection with the FASB’s efforts to simplify accounting standards, the FASBreleased new guidance on simplifying Income Statement presentation by eliminating the concept ofextraordinary items from U.S. GAAP. With the issuance of this ASU the FASB determined that theelimination of the concept of extraordinary items from U.S. GAAP would reduce the cost and complexityon the application of accounting standards, while maintaining or improving the usefulness of informationincluded in financial statements. This ASU is effective for fiscal years, and interim periods within thosefiscal years, beginning after December 15, 2015. The adoption of ASU No. 2015-01 will not have an impacton our consolidated financial condition and results of operations.
In February 2015, the FASB issued ASU No. 2015-02, ‘‘Consolidation (Topic 810) — Amendments tothe Consolidation Analysis,’’ which provides guidance on the analysis process companies must perform inorder to determine whether a legal entity should be consolidated. The new ASU simplifies U.S. GAAP byeliminating entity specific consolidation guidance for limited partnerships. It also revises other aspects ofthe consolidation analysis, to include the ownership assessment of variable interest entities (VIEs), feearrangements and how related parties are assessed. The amendments rescind the indefinite deferral ofFASB Statement 167, Amendments to FASB Interpretation No. 46(R), for certain investment funds andreplace it with a permanent scope exception for money market funds. This ASU is effective for periodsbeginning after December 15, 2015. Early adoption is permitted, including adoption in an interim period.The adoption of ASU No. 2015-02 will not have an impact on our consolidated financial condition andresults of operations.
In April 2015, the FASB issued ASU No. 2015-03, ‘‘Interest — Imputation of Interest(Subtopic 835-30): Simplifying the Presentation of Debt Issuance Costs.’’ The ASU was issued inconnection with the FASB’s efforts to simplify accounting standards for the presentation of debt issuancecosts. The amendments of this ASU require companies to present debt issuance costs the same mannerthat present debt discounts are currently reported, as a direct deduction from the carrying value of thatdebt liability. The applicability of this requirement does not impact the recognition and measurement
79
guidance for debt issuance costs. ASU 2015-03 is effective for periods beginning after December 15, 2015.Early adoption is allowed for financial statements that have yet to be issued. The adoption of ASUNo. 2015-03 will not have a material impact on our consolidated financial condition and results ofoperations.
In May 2015, the FASB issued ASU No. 2015-07, ‘‘Fair Value Measurement (Topic 820): Disclosuresfor Investments in Certain Entities That Calculate Net Asset Value per Share (or Its Equivalent) (aconsensus of the Emerging Issues Task Force).’’ The ASU removes the requirement to categorize allinvestments for which fair value is measured using the net asset value per share practical expedient withinthe fair value hierarchy. This ASU is effective for periods beginning after December 15, 2015. Earlyadoption is permitted. The adoption of ASU No. 2015-07 will not have a material impact on ourconsolidated financial condition and results of operations.
In July 2015, the FASB issued ASU No. 2015-11, ‘‘Inventory (Topic 330): Simplifying theMeasurement of Inventory.’’ Previous to the issuance of this ASU, ASC 330 required that an entitymeasure inventory at the lower of cost or market. ASU 2015-11 specifies that ‘‘market’’ is defined as ‘‘netrealizable value,’’ or the estimated selling price in the ordinary course of business, less reasonablypredictable costs of completion, disposal, and transportation. This ASU is effective for fiscal years, and forinterim periods within those fiscal years, beginning after December 15, 2016. Application is to be appliedprospectively with earlier application permitted as of the beginning of an interim or annual reportingperiod. The adoption of ASU No. 2015-11 will not have a material impact on our consolidated financialcondition and results of operations.
In August 2015, the FASB issued ASU No. 2015-15, ‘‘Interest — Imputation of Interest(Subtopic 835-30): Presentation and Subsequent Measurement of Debt Issuance Costs Associated withLine-of-Credit Arrangements — Amendments to SEC Paragraphs Pursuant to Staff Announcement atJune 18, 2015 EITF Meeting (SEC Update).’’ The ASU clarifies the SEC staff’s position on presenting andmeasuring debt issuance costs incurred in connection with line-of credit arrangements. The SEC staff hasannounced that it would ‘‘not object to an entity deferring and presenting debt issuance costs as an assetand subsequently amortizing the deferred debt issuance costs ratably over the term of the line-of-creditarrangement.’’ The adoption of ASU No. 2015-15 will not have a material impact on our consolidatedfinancial condition and results of operations.
In November 2015, the FASB issued ASU No. 2015-17, Balance Sheet Classification of DeferredTaxes to simplify the presentation of deferred income taxes. The amendments in this update require thatdeferred tax liabilities and assets be classified as noncurrent in a classified statement of financial position.This update is effective for periods beginning after December 15, 2016 and early application is permitted.The adoption of ASU No. 2015-17 will not have a material impact on our consolidated financial conditionand results of operations.
In January 2016, the FASB issued ASU 2016-01, ‘‘Financial Instruments — Overall (Subtopic 825-10):Recognition and Measurement of Financial Assets and Financial Liabilities.’’ The ASU requires entities tomeasure equity investments that do not result in consolidation and are not accounted for under the equitymethod at fair value with changes in fair value recognized in net income. The ASU also requires an entityto present separately in other comprehensive income the portion of the total change in the fair value of aliability resulting from a change in the instrument-specific credit risk when the entity has elected tomeasure the liability at fair value in accordance with the fair value option for financial instruments. Therequirement to disclose the method(s) and significant assumptions used to estimate the fair value forfinancial instruments measured at amortized cost on the balance sheet has been eliminated by this ASU.This ASU is effective for fiscal years beginning after December 15, 2017, including interim periods withinthose fiscal years. We are currently evaluating the impact of ASU No. 2016-01 on our consolidatedfinancial condition and results of operations.
80
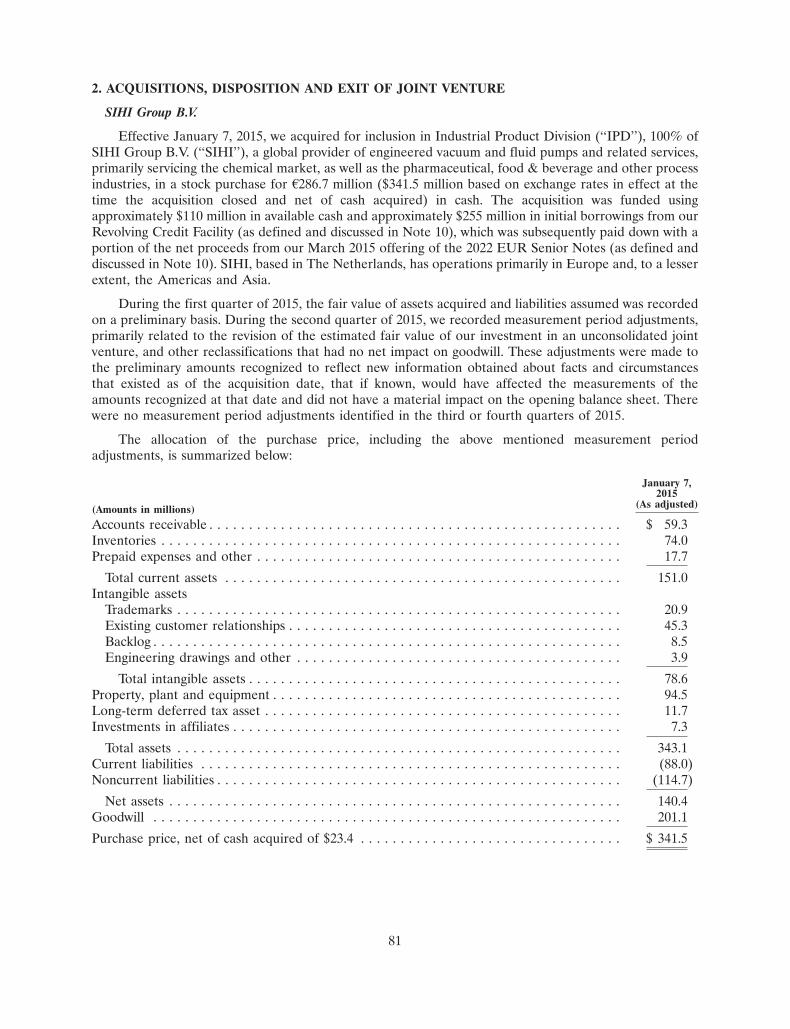
2. ACQUISITIONS, DISPOSITION AND EXIT OF JOINT VENTURE
SIHI Group B.V.
Effective January 7, 2015, we acquired for inclusion in Industrial Product Division (‘‘IPD’’), 100% ofSIHI Group B.V. (‘‘SIHI’’), a global provider of engineered vacuum and fluid pumps and related services,primarily servicing the chemical market, as well as the pharmaceutical, food & beverage and other processindustries, in a stock purchase for A286.7 million ($341.5 million based on exchange rates in effect at thetime the acquisition closed and net of cash acquired) in cash. The acquisition was funded usingapproximately $110 million in available cash and approximately $255 million in initial borrowings from ourRevolving Credit Facility (as defined and discussed in Note 10), which was subsequently paid down with aportion of the net proceeds from our March 2015 offering of the 2022 EUR Senior Notes (as defined anddiscussed in Note 10). SIHI, based in The Netherlands, has operations primarily in Europe and, to a lesserextent, the Americas and Asia.
During the first quarter of 2015, the fair value of assets acquired and liabilities assumed was recordedon a preliminary basis. During the second quarter of 2015, we recorded measurement period adjustments,primarily related to the revision of the estimated fair value of our investment in an unconsolidated jointventure, and other reclassifications that had no net impact on goodwill. These adjustments were made tothe preliminary amounts recognized to reflect new information obtained about facts and circumstancesthat existed as of the acquisition date, that if known, would have affected the measurements of theamounts recognized at that date and did not have a material impact on the opening balance sheet. Therewere no measurement period adjustments identified in the third or fourth quarters of 2015.
The allocation of the purchase price, including the above mentioned measurement periodadjustments, is summarized below:
January 7,2015
(As adjusted)(Amounts in millions)
Accounts receivable . . . . . . . . . . . . . . . . . . . . . . . . . . . . . . . . . . . . . . . . . . . . . . . . . . . . $ 59.3Inventories . . . . . . . . . . . . . . . . . . . . . . . . . . . . . . . . . . . . . . . . . . . . . . . . . . . . . . . . . . 74.0Prepaid expenses and other . . . . . . . . . . . . . . . . . . . . . . . . . . . . . . . . . . . . . . . . . . . . . . 17.7
Total current assets . . . . . . . . . . . . . . . . . . . . . . . . . . . . . . . . . . . . . . . . . . . . . . . . . . 151.0Intangible assets
Trademarks . . . . . . . . . . . . . . . . . . . . . . . . . . . . . . . . . . . . . . . . . . . . . . . . . . . . . . . . 20.9Existing customer relationships . . . . . . . . . . . . . . . . . . . . . . . . . . . . . . . . . . . . . . . . . . 45.3Backlog . . . . . . . . . . . . . . . . . . . . . . . . . . . . . . . . . . . . . . . . . . . . . . . . . . . . . . . . . . . 8.5Engineering drawings and other . . . . . . . . . . . . . . . . . . . . . . . . . . . . . . . . . . . . . . . . . 3.9
Total intangible assets . . . . . . . . . . . . . . . . . . . . . . . . . . . . . . . . . . . . . . . . . . . . . . . 78.6Property, plant and equipment . . . . . . . . . . . . . . . . . . . . . . . . . . . . . . . . . . . . . . . . . . . . 94.5Long-term deferred tax asset . . . . . . . . . . . . . . . . . . . . . . . . . . . . . . . . . . . . . . . . . . . . . 11.7Investments in affiliates . . . . . . . . . . . . . . . . . . . . . . . . . . . . . . . . . . . . . . . . . . . . . . . . . 7.3
Total assets . . . . . . . . . . . . . . . . . . . . . . . . . . . . . . . . . . . . . . . . . . . . . . . . . . . . . . . . 343.1Current liabilities . . . . . . . . . . . . . . . . . . . . . . . . . . . . . . . . . . . . . . . . . . . . . . . . . . . . . (88.0)Noncurrent liabilities . . . . . . . . . . . . . . . . . . . . . . . . . . . . . . . . . . . . . . . . . . . . . . . . . . . (114.7)
Net assets . . . . . . . . . . . . . . . . . . . . . . . . . . . . . . . . . . . . . . . . . . . . . . . . . . . . . . . . . 140.4Goodwill . . . . . . . . . . . . . . . . . . . . . . . . . . . . . . . . . . . . . . . . . . . . . . . . . . . . . . . . . . . 201.1
Purchase price, net of cash acquired of $23.4 . . . . . . . . . . . . . . . . . . . . . . . . . . . . . . . . . $ 341.5
81
The excess of the acquisition date fair value of the total purchase price over the estimated fair value ofthe net assets was recorded as goodwill. Goodwill of $201.1 million represents the value expected to beobtained from strengthening our portfolio of products and services through the addition of SIHI’sengineered vacuum and fluid pumps, as well as the associated aftermarket services and parts. The goodwillrelated to this acquisition is recorded in the IPD segment and is not expected to be deductible for taxpurposes. The trademarks are primarily indefinite-lived intangibles. As of date of acquisition existingcustomer relationships, engineering drawings and backlog had expected weighted average useful lives of10 years, 10 years and less than one year, respectively. In total, amortizable intangible assets have aweighted average useful live of approximately 9 years.
Subsequent to January 7, 2015, the revenues and expenses of SIHI have been included in ourconsolidated statement of income. SIHI operations generated sales of approximately $294.2 million andimpacted net earnings by a loss of $39.5 million for the year ended December 31, 2015. SIHI’s sales(unaudited) were approximately A270 million during its fiscal year ended November 30, 2014. No proformafinancial information has been presented due to immateriality.
Naval OY
Effective March 31, 2014, we sold our Flow Control Division’s (‘‘FCD’’) Naval OY (‘‘Naval’’) businessto a Finnish valve manufacturer. The sale included Naval’s manufacturing facility located in Laitila,Finland and a service and support center located in St. Petersburg, Russia. The cash proceeds for the saletotaled $46.8 million, net of cash divested, and resulted in a $13.4 million pre-tax gain recorded in selling,general and administrative expense in the consolidated statements of income. Net sales related to theNaval business totaled $8.2 million in the first quarter of 2014.
Innovative Mag-Drive, LLC
On December 10, 2013, we acquired for inclusion in Industrial Product Division (‘‘IPD’’), 100% ofInnovative Mag-Drive, LLC (‘‘Innomag’’), a privately-owned, U.S.-based company specializing in advancedsealless magnetic drive centrifugal pumps for the chemical and general industries, in an asset purchase ofup to $78.7 million in cash. Of the total purchase price, $67.5 million has been paid. The remaining$11.2 million of the total purchase price is contingent upon Innomag achieving certain performancemetrics during the two- and five-year periods following the acquisition, and to the extent achieved, isexpected to be paid in cash within four months of the performance measurement dates. We initiallyrecorded a liability of $7.5 million as an estimate of the acquisition date fair value of the contingentconsideration, which is based on the weighted probability of achievement of the performance metrics.
During the fourth quarter of 2015, the estimated fair value of the contingent consideration wasreduced to $0.7 million based on 2015 results and an updated weighted probability of achievement of theperformance metrics within the specified time frame. The resulting gain was included in SG&A in ourconsolidated statement of income. Subsequent to December 10, 2013, the revenues and expenses ofInnomag have been included in our consolidated statements of income. No pro forma information hasbeen provided due to immateriality.
Audco India, Limited
Effective March 28, 2013, we and our joint venture partner agreed to exit our joint venture, AudcoIndia, Limited (‘‘AIL’’), which manufactures integrated industrial valves in India. To effect the exit, in twoseparate transactions, Flow Control Division (‘‘FCD’’) acquired 100% ownership of AIL’s plug valvemanufacturing business in an asset purchase for cash of $10.1 million and sold its 50% equity interest inAIL to the joint venture partner for $46.2 million in cash. We remeasured to fair value our previously heldequity interest in the purchased net assets of the plug valve manufacturing business resulting in net assetsacquired of approximately $25 million and a pre-tax gain of $15.3 million. The sale of our equity interest in
82
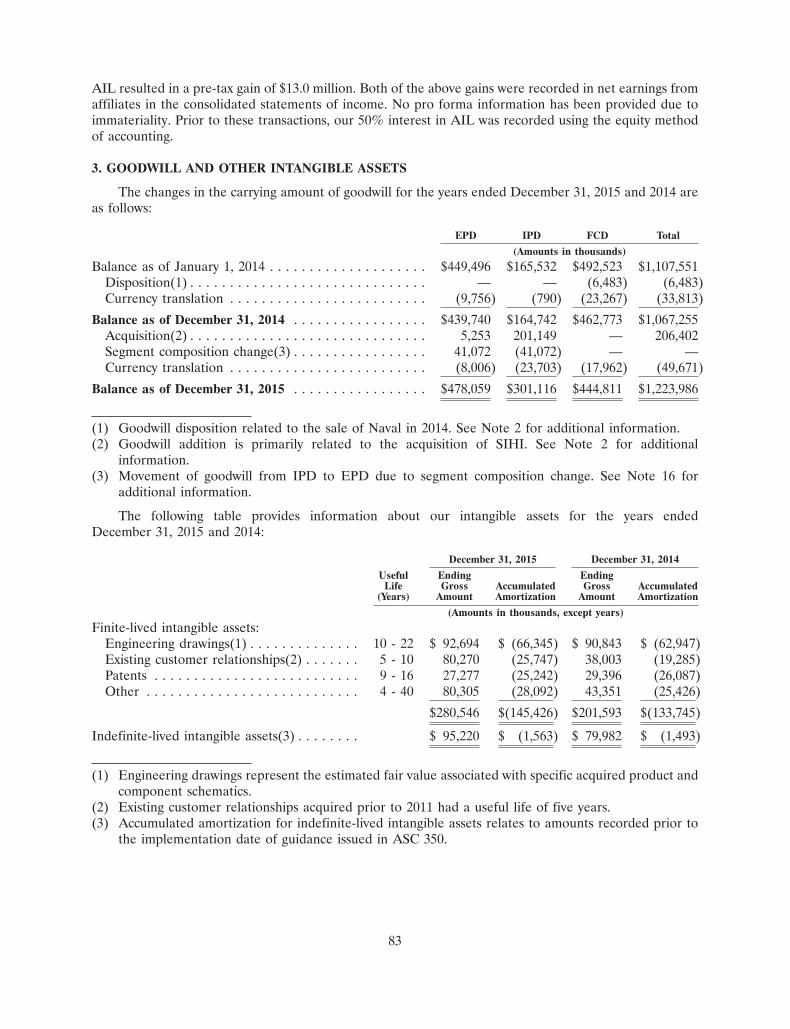
AIL resulted in a pre-tax gain of $13.0 million. Both of the above gains were recorded in net earnings fromaffiliates in the consolidated statements of income. No pro forma information has been provided due toimmateriality. Prior to these transactions, our 50% interest in AIL was recorded using the equity methodof accounting.
3. GOODWILL AND OTHER INTANGIBLE ASSETS
The changes in the carrying amount of goodwill for the years ended December 31, 2015 and 2014 areas follows:
EPD IPD FCD Total
(Amounts in thousands)
Balance as of January 1, 2014 . . . . . . . . . . . . . . . . . . . . $449,496 $165,532 $492,523 $1,107,551Disposition(1) . . . . . . . . . . . . . . . . . . . . . . . . . . . . . . — — (6,483) (6,483)Currency translation . . . . . . . . . . . . . . . . . . . . . . . . . (9,756) (790) (23,267) (33,813)
Balance as of December 31, 2014 . . . . . . . . . . . . . . . . . $439,740 $164,742 $462,773 $1,067,255Acquisition(2) . . . . . . . . . . . . . . . . . . . . . . . . . . . . . . 5,253 201,149 — 206,402Segment composition change(3) . . . . . . . . . . . . . . . . . 41,072 (41,072) — —Currency translation . . . . . . . . . . . . . . . . . . . . . . . . . (8,006) (23,703) (17,962) (49,671)
Balance as of December 31, 2015 . . . . . . . . . . . . . . . . . $478,059 $301,116 $444,811 $1,223,986
(1) Goodwill disposition related to the sale of Naval in 2014. See Note 2 for additional information.(2) Goodwill addition is primarily related to the acquisition of SIHI. See Note 2 for additional
information.(3) Movement of goodwill from IPD to EPD due to segment composition change. See Note 16 for
additional information.
The following table provides information about our intangible assets for the years endedDecember 31, 2015 and 2014:
December 31, 2015 December 31, 2014
Useful Ending EndingLife Gross Accumulated Gross Accumulated
(Years) Amount Amortization Amount Amortization
(Amounts in thousands, except years)
Finite-lived intangible assets:Engineering drawings(1) . . . . . . . . . . . . . . 10 - 22 $ 92,694 $ (66,345) $ 90,843 $ (62,947)Existing customer relationships(2) . . . . . . . 5 - 10 80,270 (25,747) 38,003 (19,285)Patents . . . . . . . . . . . . . . . . . . . . . . . . . . 9 - 16 27,277 (25,242) 29,396 (26,087)Other . . . . . . . . . . . . . . . . . . . . . . . . . . . 4 - 40 80,305 (28,092) 43,351 (25,426)
$280,546 $(145,426) $201,593 $(133,745)
Indefinite-lived intangible assets(3) . . . . . . . . $ 95,220 $ (1,563) $ 79,982 $ (1,493)
(1) Engineering drawings represent the estimated fair value associated with specific acquired product andcomponent schematics.
(2) Existing customer relationships acquired prior to 2011 had a useful life of five years.(3) Accumulated amortization for indefinite-lived intangible assets relates to amounts recorded prior to
the implementation date of guidance issued in ASC 350.
83
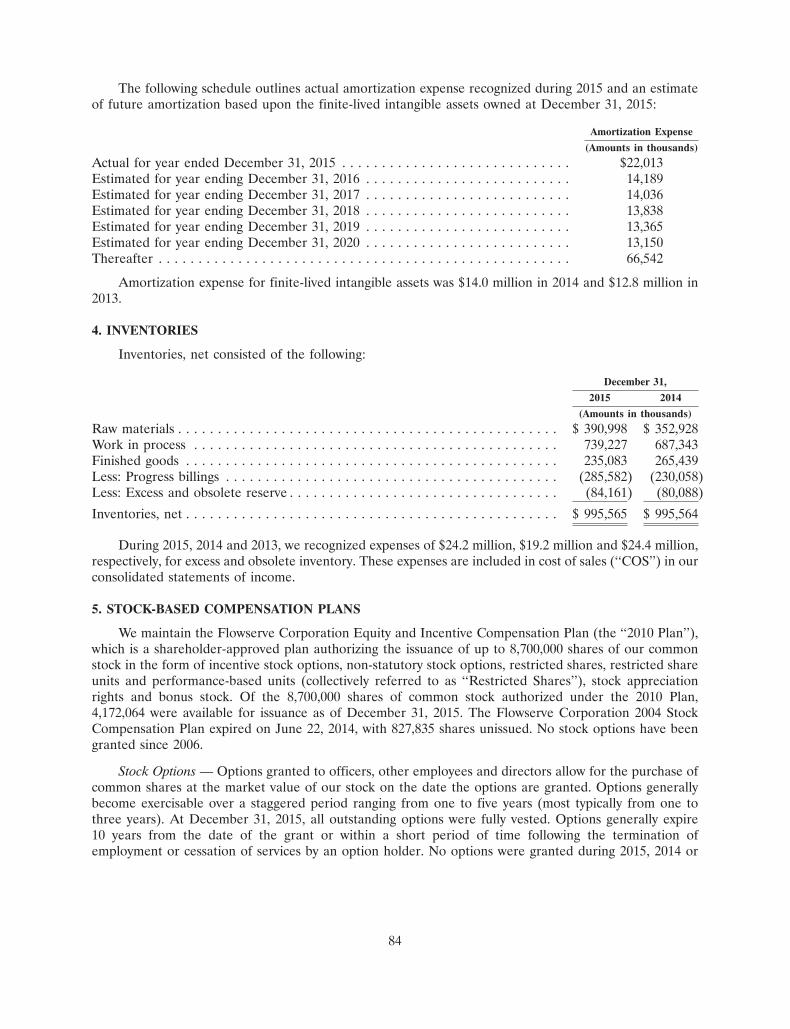
The following schedule outlines actual amortization expense recognized during 2015 and an estimateof future amortization based upon the finite-lived intangible assets owned at December 31, 2015:
Amortization Expense
(Amounts in thousands)
Actual for year ended December 31, 2015 . . . . . . . . . . . . . . . . . . . . . . . . . . . . . $22,013Estimated for year ending December 31, 2016 . . . . . . . . . . . . . . . . . . . . . . . . . . 14,189Estimated for year ending December 31, 2017 . . . . . . . . . . . . . . . . . . . . . . . . . . 14,036Estimated for year ending December 31, 2018 . . . . . . . . . . . . . . . . . . . . . . . . . . 13,838Estimated for year ending December 31, 2019 . . . . . . . . . . . . . . . . . . . . . . . . . . 13,365Estimated for year ending December 31, 2020 . . . . . . . . . . . . . . . . . . . . . . . . . . 13,150Thereafter . . . . . . . . . . . . . . . . . . . . . . . . . . . . . . . . . . . . . . . . . . . . . . . . . . . . 66,542
Amortization expense for finite-lived intangible assets was $14.0 million in 2014 and $12.8 million in2013.
4. INVENTORIES
Inventories, net consisted of the following:
December 31,
2015 2014
(Amounts in thousands)
Raw materials . . . . . . . . . . . . . . . . . . . . . . . . . . . . . . . . . . . . . . . . . . . . . . . . $ 390,998 $ 352,928Work in process . . . . . . . . . . . . . . . . . . . . . . . . . . . . . . . . . . . . . . . . . . . . . . 739,227 687,343Finished goods . . . . . . . . . . . . . . . . . . . . . . . . . . . . . . . . . . . . . . . . . . . . . . . 235,083 265,439Less: Progress billings . . . . . . . . . . . . . . . . . . . . . . . . . . . . . . . . . . . . . . . . . . (285,582) (230,058)Less: Excess and obsolete reserve . . . . . . . . . . . . . . . . . . . . . . . . . . . . . . . . . . (84,161) (80,088)
Inventories, net . . . . . . . . . . . . . . . . . . . . . . . . . . . . . . . . . . . . . . . . . . . . . . . $ 995,565 $ 995,564
During 2015, 2014 and 2013, we recognized expenses of $24.2 million, $19.2 million and $24.4 million,respectively, for excess and obsolete inventory. These expenses are included in cost of sales (‘‘COS’’) in ourconsolidated statements of income.
5. STOCK-BASED COMPENSATION PLANS
We maintain the Flowserve Corporation Equity and Incentive Compensation Plan (the ‘‘2010 Plan’’),which is a shareholder-approved plan authorizing the issuance of up to 8,700,000 shares of our commonstock in the form of incentive stock options, non-statutory stock options, restricted shares, restricted shareunits and performance-based units (collectively referred to as ‘‘Restricted Shares’’), stock appreciationrights and bonus stock. Of the 8,700,000 shares of common stock authorized under the 2010 Plan,4,172,064 were available for issuance as of December 31, 2015. The Flowserve Corporation 2004 StockCompensation Plan expired on June 22, 2014, with 827,835 shares unissued. No stock options have beengranted since 2006.
Stock Options — Options granted to officers, other employees and directors allow for the purchase ofcommon shares at the market value of our stock on the date the options are granted. Options generallybecome exercisable over a staggered period ranging from one to five years (most typically from one tothree years). At December 31, 2015, all outstanding options were fully vested. Options generally expire10 years from the date of the grant or within a short period of time following the termination ofemployment or cessation of services by an option holder. No options were granted during 2015, 2014 or
84
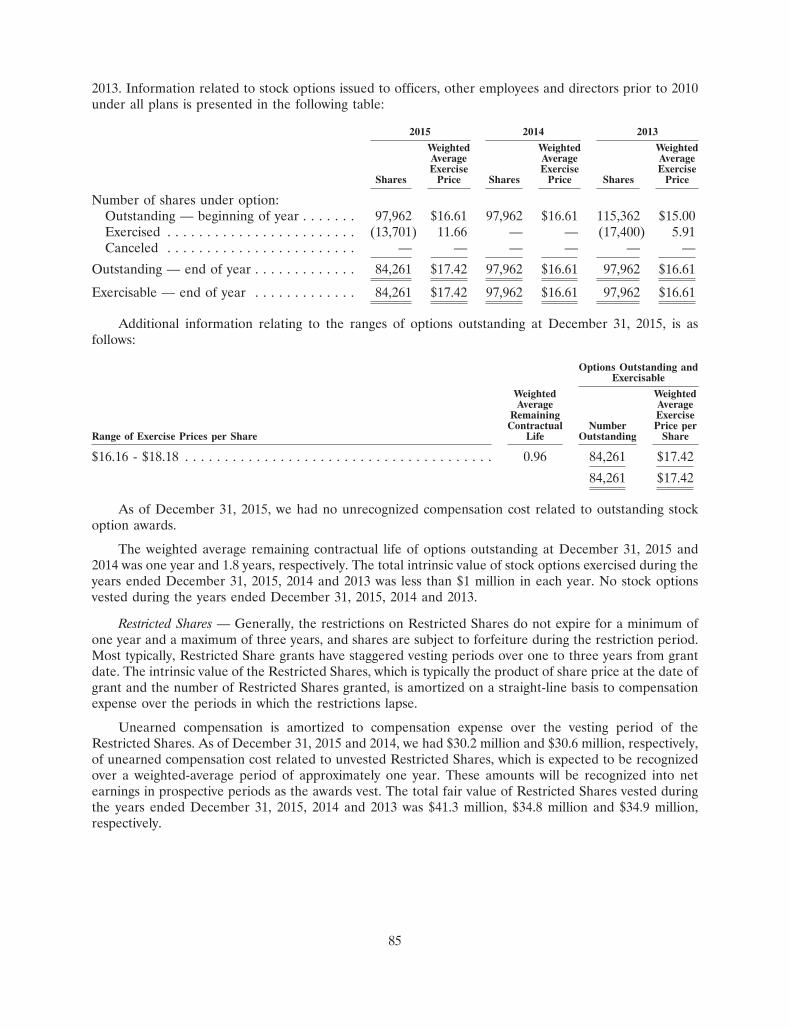
2013. Information related to stock options issued to officers, other employees and directors prior to 2010under all plans is presented in the following table:
2015 2014 2013
Weighted Weighted WeightedAverage Average AverageExercise Exercise Exercise
Shares Price Shares Price Shares Price
Number of shares under option:Outstanding — beginning of year . . . . . . . 97,962 $16.61 97,962 $16.61 115,362 $15.00Exercised . . . . . . . . . . . . . . . . . . . . . . . . (13,701) 11.66 — — (17,400) 5.91Canceled . . . . . . . . . . . . . . . . . . . . . . . . — — — — — —
Outstanding — end of year . . . . . . . . . . . . . 84,261 $17.42 97,962 $16.61 97,962 $16.61
Exercisable — end of year . . . . . . . . . . . . . 84,261 $17.42 97,962 $16.61 97,962 $16.61
Additional information relating to the ranges of options outstanding at December 31, 2015, is asfollows:
Options Outstanding andExercisable
Weighted WeightedAverage Average
Remaining ExerciseContractual Number Price per
Range of Exercise Prices per Share Life Outstanding Share
$16.16 - $18.18 . . . . . . . . . . . . . . . . . . . . . . . . . . . . . . . . . . . . . . . 0.96 84,261 $17.42
84,261 $17.42
As of December 31, 2015, we had no unrecognized compensation cost related to outstanding stockoption awards.
The weighted average remaining contractual life of options outstanding at December 31, 2015 and2014 was one year and 1.8 years, respectively. The total intrinsic value of stock options exercised during theyears ended December 31, 2015, 2014 and 2013 was less than $1 million in each year. No stock optionsvested during the years ended December 31, 2015, 2014 and 2013.
Restricted Shares — Generally, the restrictions on Restricted Shares do not expire for a minimum ofone year and a maximum of three years, and shares are subject to forfeiture during the restriction period.Most typically, Restricted Share grants have staggered vesting periods over one to three years from grantdate. The intrinsic value of the Restricted Shares, which is typically the product of share price at the date ofgrant and the number of Restricted Shares granted, is amortized on a straight-line basis to compensationexpense over the periods in which the restrictions lapse.
Unearned compensation is amortized to compensation expense over the vesting period of theRestricted Shares. As of December 31, 2015 and 2014, we had $30.2 million and $30.6 million, respectively,of unearned compensation cost related to unvested Restricted Shares, which is expected to be recognizedover a weighted-average period of approximately one year. These amounts will be recognized into netearnings in prospective periods as the awards vest. The total fair value of Restricted Shares vested duringthe years ended December 31, 2015, 2014 and 2013 was $41.3 million, $34.8 million and $34.9 million,respectively.
85
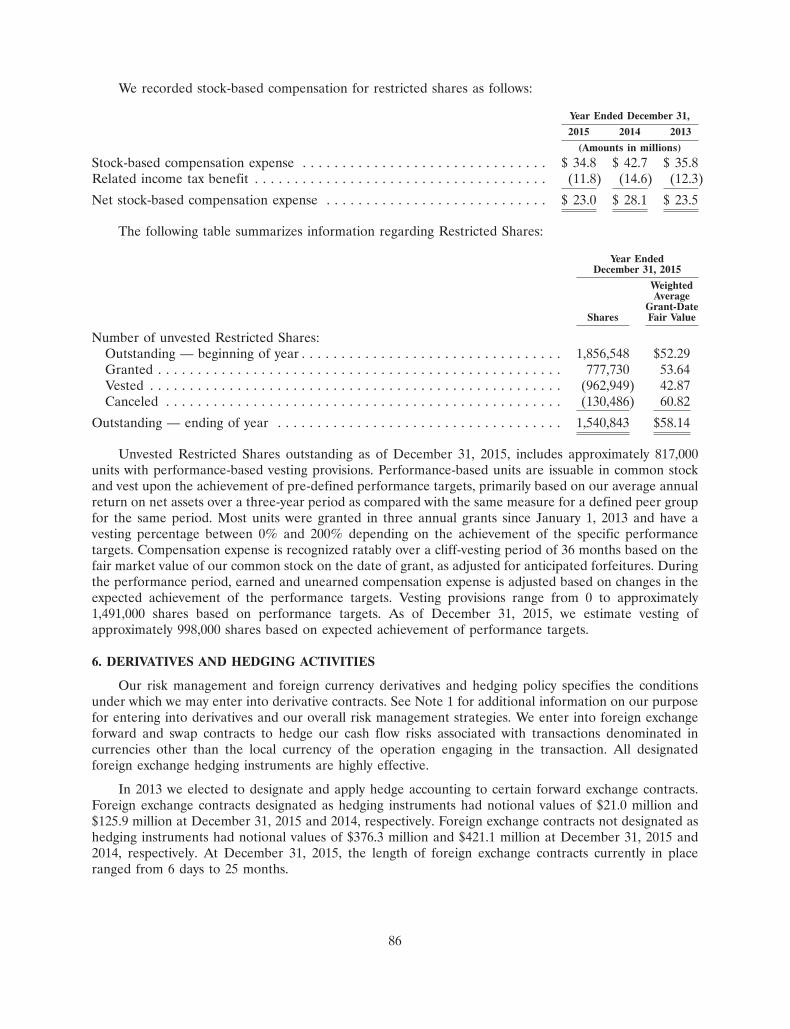
We recorded stock-based compensation for restricted shares as follows:
Year Ended December 31,
2015 2014 2013
(Amounts in millions)
Stock-based compensation expense . . . . . . . . . . . . . . . . . . . . . . . . . . . . . . . $ 34.8 $ 42.7 $ 35.8Related income tax benefit . . . . . . . . . . . . . . . . . . . . . . . . . . . . . . . . . . . . . (11.8) (14.6) (12.3)
Net stock-based compensation expense . . . . . . . . . . . . . . . . . . . . . . . . . . . . $ 23.0 $ 28.1 $ 23.5
The following table summarizes information regarding Restricted Shares:
Year EndedDecember 31, 2015
WeightedAverage
Grant-DateShares Fair Value
Number of unvested Restricted Shares:Outstanding — beginning of year . . . . . . . . . . . . . . . . . . . . . . . . . . . . . . . . . 1,856,548 $52.29Granted . . . . . . . . . . . . . . . . . . . . . . . . . . . . . . . . . . . . . . . . . . . . . . . . . . . 777,730 53.64Vested . . . . . . . . . . . . . . . . . . . . . . . . . . . . . . . . . . . . . . . . . . . . . . . . . . . . (962,949) 42.87Canceled . . . . . . . . . . . . . . . . . . . . . . . . . . . . . . . . . . . . . . . . . . . . . . . . . . (130,486) 60.82
Outstanding — ending of year . . . . . . . . . . . . . . . . . . . . . . . . . . . . . . . . . . . . 1,540,843 $58.14
Unvested Restricted Shares outstanding as of December 31, 2015, includes approximately 817,000units with performance-based vesting provisions. Performance-based units are issuable in common stockand vest upon the achievement of pre-defined performance targets, primarily based on our average annualreturn on net assets over a three-year period as compared with the same measure for a defined peer groupfor the same period. Most units were granted in three annual grants since January 1, 2013 and have avesting percentage between 0% and 200% depending on the achievement of the specific performancetargets. Compensation expense is recognized ratably over a cliff-vesting period of 36 months based on thefair market value of our common stock on the date of grant, as adjusted for anticipated forfeitures. Duringthe performance period, earned and unearned compensation expense is adjusted based on changes in theexpected achievement of the performance targets. Vesting provisions range from 0 to approximately1,491,000 shares based on performance targets. As of December 31, 2015, we estimate vesting ofapproximately 998,000 shares based on expected achievement of performance targets.
6. DERIVATIVES AND HEDGING ACTIVITIES
Our risk management and foreign currency derivatives and hedging policy specifies the conditionsunder which we may enter into derivative contracts. See Note 1 for additional information on our purposefor entering into derivatives and our overall risk management strategies. We enter into foreign exchangeforward and swap contracts to hedge our cash flow risks associated with transactions denominated incurrencies other than the local currency of the operation engaging in the transaction. All designatedforeign exchange hedging instruments are highly effective.
In 2013 we elected to designate and apply hedge accounting to certain forward exchange contracts.Foreign exchange contracts designated as hedging instruments had notional values of $21.0 million and$125.9 million at December 31, 2015 and 2014, respectively. Foreign exchange contracts not designated ashedging instruments had notional values of $376.3 million and $421.1 million at December 31, 2015 and2014, respectively. At December 31, 2015, the length of foreign exchange contracts currently in placeranged from 6 days to 25 months.
86
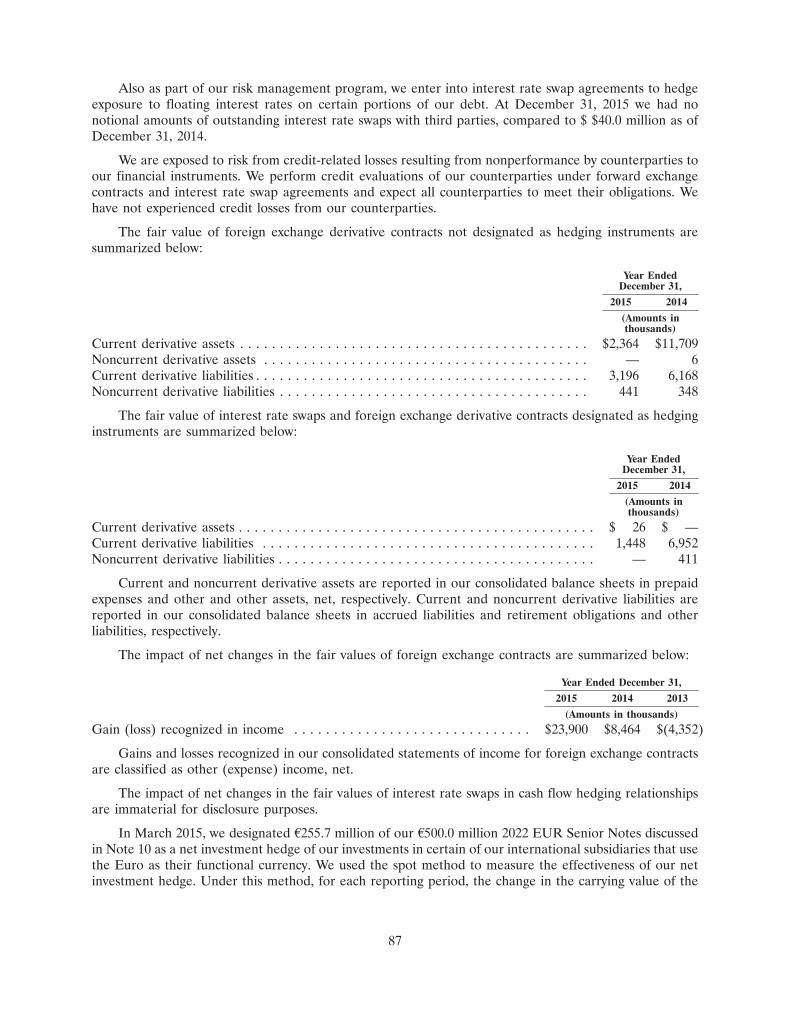
Also as part of our risk management program, we enter into interest rate swap agreements to hedgeexposure to floating interest rates on certain portions of our debt. At December 31, 2015 we had nonotional amounts of outstanding interest rate swaps with third parties, compared to $ $40.0 million as ofDecember 31, 2014.
We are exposed to risk from credit-related losses resulting from nonperformance by counterparties toour financial instruments. We perform credit evaluations of our counterparties under forward exchangecontracts and interest rate swap agreements and expect all counterparties to meet their obligations. Wehave not experienced credit losses from our counterparties.
The fair value of foreign exchange derivative contracts not designated as hedging instruments aresummarized below:
Year EndedDecember 31,
2015 2014
(Amounts inthousands)
Current derivative assets . . . . . . . . . . . . . . . . . . . . . . . . . . . . . . . . . . . . . . . . . . . . $2,364 $11,709Noncurrent derivative assets . . . . . . . . . . . . . . . . . . . . . . . . . . . . . . . . . . . . . . . . . — 6Current derivative liabilities . . . . . . . . . . . . . . . . . . . . . . . . . . . . . . . . . . . . . . . . . . 3,196 6,168Noncurrent derivative liabilities . . . . . . . . . . . . . . . . . . . . . . . . . . . . . . . . . . . . . . . 441 348
The fair value of interest rate swaps and foreign exchange derivative contracts designated as hedginginstruments are summarized below:
Year EndedDecember 31,
2015 2014
(Amounts inthousands)
Current derivative assets . . . . . . . . . . . . . . . . . . . . . . . . . . . . . . . . . . . . . . . . . . . . . $ 26 $ —Current derivative liabilities . . . . . . . . . . . . . . . . . . . . . . . . . . . . . . . . . . . . . . . . . . 1,448 6,952Noncurrent derivative liabilities . . . . . . . . . . . . . . . . . . . . . . . . . . . . . . . . . . . . . . . . — 411
Current and noncurrent derivative assets are reported in our consolidated balance sheets in prepaidexpenses and other and other assets, net, respectively. Current and noncurrent derivative liabilities arereported in our consolidated balance sheets in accrued liabilities and retirement obligations and otherliabilities, respectively.
The impact of net changes in the fair values of foreign exchange contracts are summarized below:
Year Ended December 31,
2015 2014 2013
(Amounts in thousands)
Gain (loss) recognized in income . . . . . . . . . . . . . . . . . . . . . . . . . . . . . . $23,900 $8,464 $(4,352)
Gains and losses recognized in our consolidated statements of income for foreign exchange contractsare classified as other (expense) income, net.
The impact of net changes in the fair values of interest rate swaps in cash flow hedging relationshipsare immaterial for disclosure purposes.
In March 2015, we designated A255.7 million of our A500.0 million 2022 EUR Senior Notes discussedin Note 10 as a net investment hedge of our investments in certain of our international subsidiaries that usethe Euro as their functional currency. We used the spot method to measure the effectiveness of our netinvestment hedge. Under this method, for each reporting period, the change in the carrying value of the
87
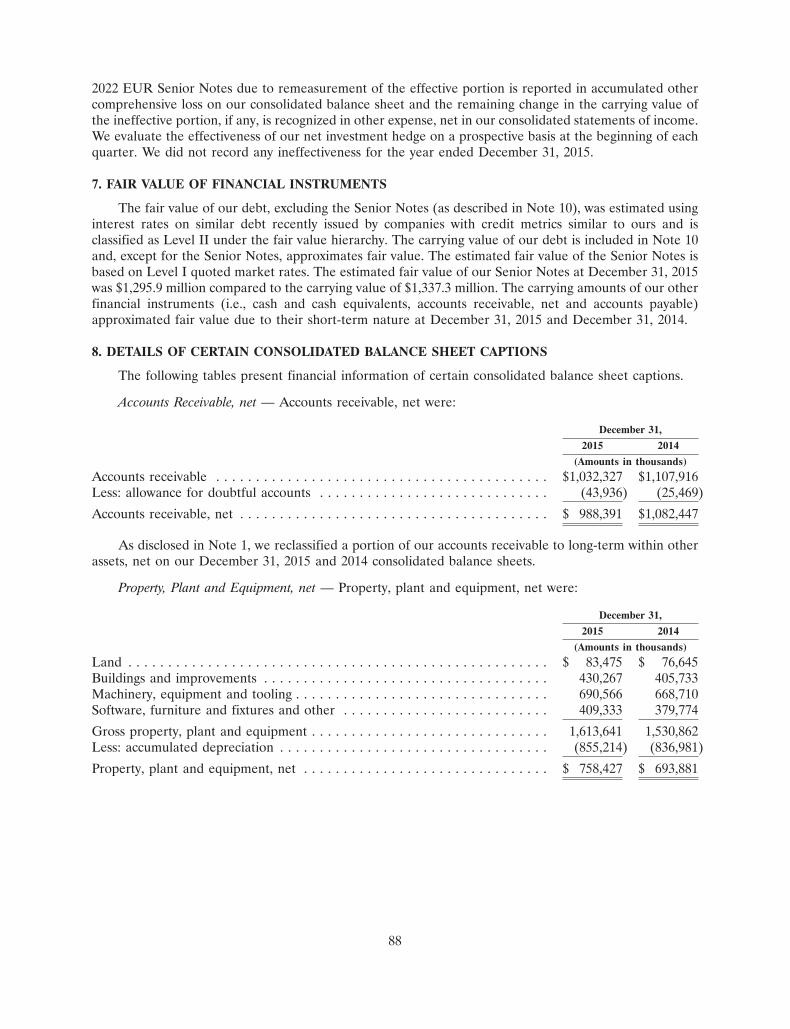
2022 EUR Senior Notes due to remeasurement of the effective portion is reported in accumulated othercomprehensive loss on our consolidated balance sheet and the remaining change in the carrying value ofthe ineffective portion, if any, is recognized in other expense, net in our consolidated statements of income.We evaluate the effectiveness of our net investment hedge on a prospective basis at the beginning of eachquarter. We did not record any ineffectiveness for the year ended December 31, 2015.
7. FAIR VALUE OF FINANCIAL INSTRUMENTS
The fair value of our debt, excluding the Senior Notes (as described in Note 10), was estimated usinginterest rates on similar debt recently issued by companies with credit metrics similar to ours and isclassified as Level II under the fair value hierarchy. The carrying value of our debt is included in Note 10and, except for the Senior Notes, approximates fair value. The estimated fair value of the Senior Notes isbased on Level I quoted market rates. The estimated fair value of our Senior Notes at December 31, 2015was $1,295.9 million compared to the carrying value of $1,337.3 million. The carrying amounts of our otherfinancial instruments (i.e., cash and cash equivalents, accounts receivable, net and accounts payable)approximated fair value due to their short-term nature at December 31, 2015 and December 31, 2014.
8. DETAILS OF CERTAIN CONSOLIDATED BALANCE SHEET CAPTIONS
The following tables present financial information of certain consolidated balance sheet captions.
Accounts Receivable, net — Accounts receivable, net were:
December 31,
2015 2014
(Amounts in thousands)
Accounts receivable . . . . . . . . . . . . . . . . . . . . . . . . . . . . . . . . . . . . . . . . . . $1,032,327 $1,107,916Less: allowance for doubtful accounts . . . . . . . . . . . . . . . . . . . . . . . . . . . . . (43,936) (25,469)
Accounts receivable, net . . . . . . . . . . . . . . . . . . . . . . . . . . . . . . . . . . . . . . . $ 988,391 $1,082,447
As disclosed in Note 1, we reclassified a portion of our accounts receivable to long-term within otherassets, net on our December 31, 2015 and 2014 consolidated balance sheets.
Property, Plant and Equipment, net — Property, plant and equipment, net were:
December 31,
2015 2014
(Amounts in thousands)
Land . . . . . . . . . . . . . . . . . . . . . . . . . . . . . . . . . . . . . . . . . . . . . . . . . . . . . $ 83,475 $ 76,645Buildings and improvements . . . . . . . . . . . . . . . . . . . . . . . . . . . . . . . . . . . . 430,267 405,733Machinery, equipment and tooling . . . . . . . . . . . . . . . . . . . . . . . . . . . . . . . . 690,566 668,710Software, furniture and fixtures and other . . . . . . . . . . . . . . . . . . . . . . . . . . 409,333 379,774
Gross property, plant and equipment . . . . . . . . . . . . . . . . . . . . . . . . . . . . . . 1,613,641 1,530,862Less: accumulated depreciation . . . . . . . . . . . . . . . . . . . . . . . . . . . . . . . . . . (855,214) (836,981)
Property, plant and equipment, net . . . . . . . . . . . . . . . . . . . . . . . . . . . . . . . $ 758,427 $ 693,881
88
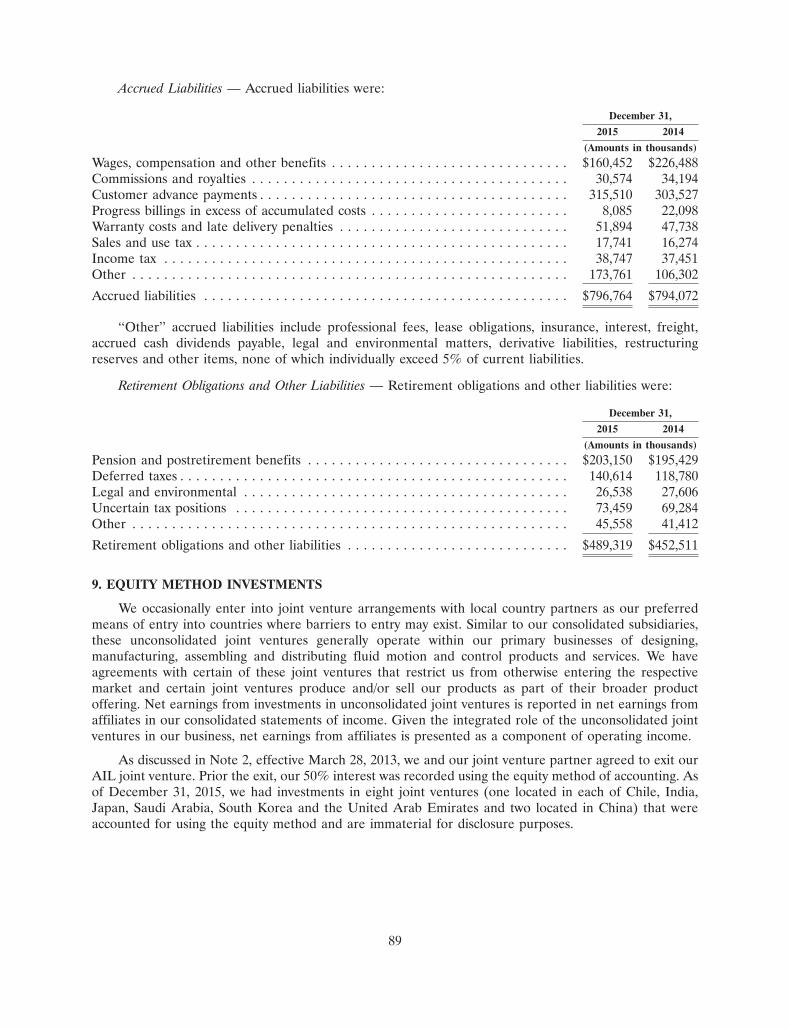
Accrued Liabilities — Accrued liabilities were:
December 31,
2015 2014
(Amounts in thousands)
Wages, compensation and other benefits . . . . . . . . . . . . . . . . . . . . . . . . . . . . . . $160,452 $226,488Commissions and royalties . . . . . . . . . . . . . . . . . . . . . . . . . . . . . . . . . . . . . . . . 30,574 34,194Customer advance payments . . . . . . . . . . . . . . . . . . . . . . . . . . . . . . . . . . . . . . . 315,510 303,527Progress billings in excess of accumulated costs . . . . . . . . . . . . . . . . . . . . . . . . . 8,085 22,098Warranty costs and late delivery penalties . . . . . . . . . . . . . . . . . . . . . . . . . . . . . 51,894 47,738Sales and use tax . . . . . . . . . . . . . . . . . . . . . . . . . . . . . . . . . . . . . . . . . . . . . . . 17,741 16,274Income tax . . . . . . . . . . . . . . . . . . . . . . . . . . . . . . . . . . . . . . . . . . . . . . . . . . . 38,747 37,451Other . . . . . . . . . . . . . . . . . . . . . . . . . . . . . . . . . . . . . . . . . . . . . . . . . . . . . . . 173,761 106,302
Accrued liabilities . . . . . . . . . . . . . . . . . . . . . . . . . . . . . . . . . . . . . . . . . . . . . . $796,764 $794,072
‘‘Other’’ accrued liabilities include professional fees, lease obligations, insurance, interest, freight,accrued cash dividends payable, legal and environmental matters, derivative liabilities, restructuringreserves and other items, none of which individually exceed 5% of current liabilities.
Retirement Obligations and Other Liabilities — Retirement obligations and other liabilities were:
December 31,
2015 2014
(Amounts in thousands)
Pension and postretirement benefits . . . . . . . . . . . . . . . . . . . . . . . . . . . . . . . . . $203,150 $195,429Deferred taxes . . . . . . . . . . . . . . . . . . . . . . . . . . . . . . . . . . . . . . . . . . . . . . . . . 140,614 118,780Legal and environmental . . . . . . . . . . . . . . . . . . . . . . . . . . . . . . . . . . . . . . . . . 26,538 27,606Uncertain tax positions . . . . . . . . . . . . . . . . . . . . . . . . . . . . . . . . . . . . . . . . . . 73,459 69,284Other . . . . . . . . . . . . . . . . . . . . . . . . . . . . . . . . . . . . . . . . . . . . . . . . . . . . . . . 45,558 41,412
Retirement obligations and other liabilities . . . . . . . . . . . . . . . . . . . . . . . . . . . . $489,319 $452,511
9. EQUITY METHOD INVESTMENTS
We occasionally enter into joint venture arrangements with local country partners as our preferredmeans of entry into countries where barriers to entry may exist. Similar to our consolidated subsidiaries,these unconsolidated joint ventures generally operate within our primary businesses of designing,manufacturing, assembling and distributing fluid motion and control products and services. We haveagreements with certain of these joint ventures that restrict us from otherwise entering the respectivemarket and certain joint ventures produce and/or sell our products as part of their broader productoffering. Net earnings from investments in unconsolidated joint ventures is reported in net earnings fromaffiliates in our consolidated statements of income. Given the integrated role of the unconsolidated jointventures in our business, net earnings from affiliates is presented as a component of operating income.
As discussed in Note 2, effective March 28, 2013, we and our joint venture partner agreed to exit ourAIL joint venture. Prior the exit, our 50% interest was recorded using the equity method of accounting. Asof December 31, 2015, we had investments in eight joint ventures (one located in each of Chile, India,Japan, Saudi Arabia, South Korea and the United Arab Emirates and two located in China) that wereaccounted for using the equity method and are immaterial for disclosure purposes.
89
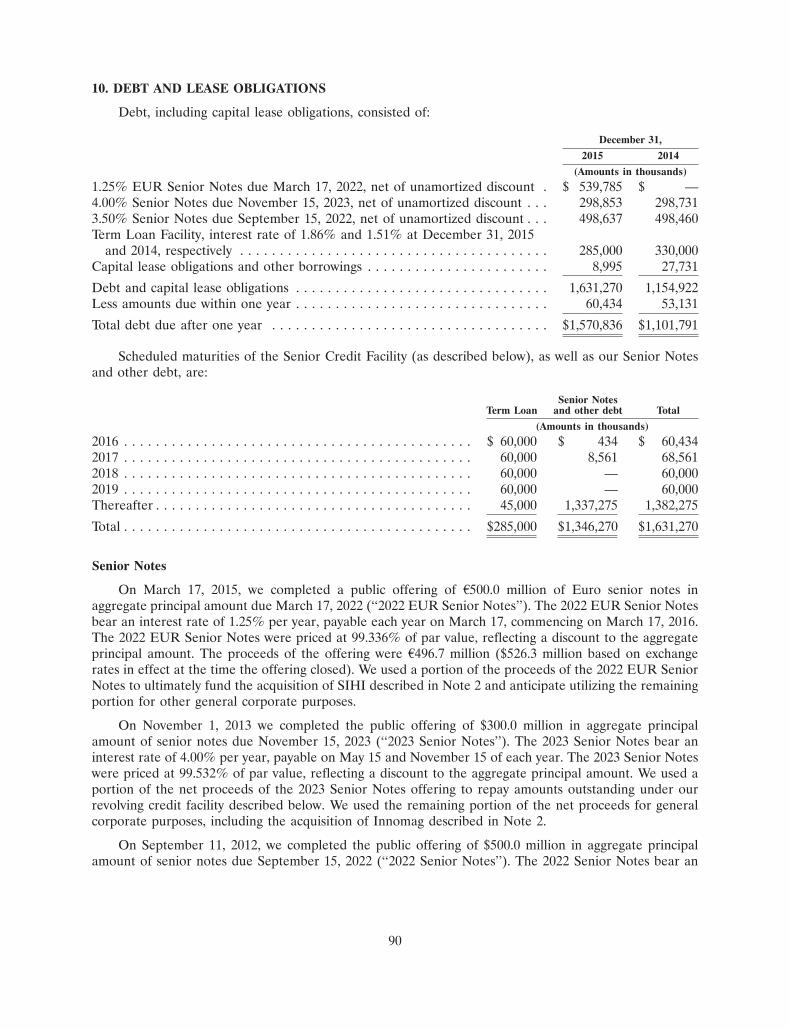
10. DEBT AND LEASE OBLIGATIONS
Debt, including capital lease obligations, consisted of:
December 31,
2015 2014
(Amounts in thousands)
1.25% EUR Senior Notes due March 17, 2022, net of unamortized discount . $ 539,785 $ —4.00% Senior Notes due November 15, 2023, net of unamortized discount . . . 298,853 298,7313.50% Senior Notes due September 15, 2022, net of unamortized discount . . . 498,637 498,460Term Loan Facility, interest rate of 1.86% and 1.51% at December 31, 2015
and 2014, respectively . . . . . . . . . . . . . . . . . . . . . . . . . . . . . . . . . . . . . . . 285,000 330,000Capital lease obligations and other borrowings . . . . . . . . . . . . . . . . . . . . . . . 8,995 27,731
Debt and capital lease obligations . . . . . . . . . . . . . . . . . . . . . . . . . . . . . . . . 1,631,270 1,154,922Less amounts due within one year . . . . . . . . . . . . . . . . . . . . . . . . . . . . . . . . 60,434 53,131
Total debt due after one year . . . . . . . . . . . . . . . . . . . . . . . . . . . . . . . . . . . $1,570,836 $1,101,791
Scheduled maturities of the Senior Credit Facility (as described below), as well as our Senior Notesand other debt, are:
Senior NotesTerm Loan and other debt Total
(Amounts in thousands)
2016 . . . . . . . . . . . . . . . . . . . . . . . . . . . . . . . . . . . . . . . . . . . . $ 60,000 $ 434 $ 60,4342017 . . . . . . . . . . . . . . . . . . . . . . . . . . . . . . . . . . . . . . . . . . . . 60,000 8,561 68,5612018 . . . . . . . . . . . . . . . . . . . . . . . . . . . . . . . . . . . . . . . . . . . . 60,000 — 60,0002019 . . . . . . . . . . . . . . . . . . . . . . . . . . . . . . . . . . . . . . . . . . . . 60,000 — 60,000Thereafter . . . . . . . . . . . . . . . . . . . . . . . . . . . . . . . . . . . . . . . . 45,000 1,337,275 1,382,275
Total . . . . . . . . . . . . . . . . . . . . . . . . . . . . . . . . . . . . . . . . . . . . $285,000 $1,346,270 $1,631,270
Senior Notes
On March 17, 2015, we completed a public offering of A500.0 million of Euro senior notes inaggregate principal amount due March 17, 2022 (‘‘2022 EUR Senior Notes’’). The 2022 EUR Senior Notesbear an interest rate of 1.25% per year, payable each year on March 17, commencing on March 17, 2016.The 2022 EUR Senior Notes were priced at 99.336% of par value, reflecting a discount to the aggregateprincipal amount. The proceeds of the offering were A496.7 million ($526.3 million based on exchangerates in effect at the time the offering closed). We used a portion of the proceeds of the 2022 EUR SeniorNotes to ultimately fund the acquisition of SIHI described in Note 2 and anticipate utilizing the remainingportion for other general corporate purposes.
On November 1, 2013 we completed the public offering of $300.0 million in aggregate principalamount of senior notes due November 15, 2023 (‘‘2023 Senior Notes’’). The 2023 Senior Notes bear aninterest rate of 4.00% per year, payable on May 15 and November 15 of each year. The 2023 Senior Noteswere priced at 99.532% of par value, reflecting a discount to the aggregate principal amount. We used aportion of the net proceeds of the 2023 Senior Notes offering to repay amounts outstanding under ourrevolving credit facility described below. We used the remaining portion of the net proceeds for generalcorporate purposes, including the acquisition of Innomag described in Note 2.
On September 11, 2012, we completed the public offering of $500.0 million in aggregate principalamount of senior notes due September 15, 2022 (‘‘2022 Senior Notes’’). The 2022 Senior Notes bear an
90
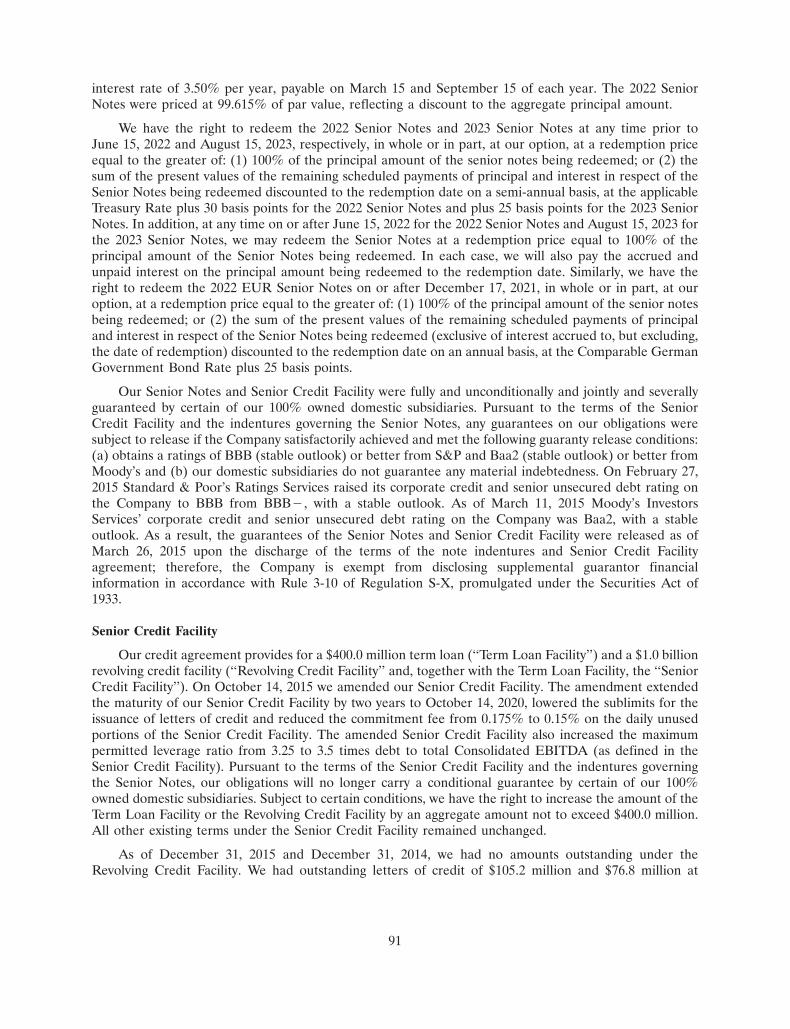
interest rate of 3.50% per year, payable on March 15 and September 15 of each year. The 2022 SeniorNotes were priced at 99.615% of par value, reflecting a discount to the aggregate principal amount.
We have the right to redeem the 2022 Senior Notes and 2023 Senior Notes at any time prior toJune 15, 2022 and August 15, 2023, respectively, in whole or in part, at our option, at a redemption priceequal to the greater of: (1) 100% of the principal amount of the senior notes being redeemed; or (2) thesum of the present values of the remaining scheduled payments of principal and interest in respect of theSenior Notes being redeemed discounted to the redemption date on a semi-annual basis, at the applicableTreasury Rate plus 30 basis points for the 2022 Senior Notes and plus 25 basis points for the 2023 SeniorNotes. In addition, at any time on or after June 15, 2022 for the 2022 Senior Notes and August 15, 2023 forthe 2023 Senior Notes, we may redeem the Senior Notes at a redemption price equal to 100% of theprincipal amount of the Senior Notes being redeemed. In each case, we will also pay the accrued andunpaid interest on the principal amount being redeemed to the redemption date. Similarly, we have theright to redeem the 2022 EUR Senior Notes on or after December 17, 2021, in whole or in part, at ouroption, at a redemption price equal to the greater of: (1) 100% of the principal amount of the senior notesbeing redeemed; or (2) the sum of the present values of the remaining scheduled payments of principaland interest in respect of the Senior Notes being redeemed (exclusive of interest accrued to, but excluding,the date of redemption) discounted to the redemption date on an annual basis, at the Comparable GermanGovernment Bond Rate plus 25 basis points.
Our Senior Notes and Senior Credit Facility were fully and unconditionally and jointly and severallyguaranteed by certain of our 100% owned domestic subsidiaries. Pursuant to the terms of the SeniorCredit Facility and the indentures governing the Senior Notes, any guarantees on our obligations weresubject to release if the Company satisfactorily achieved and met the following guaranty release conditions:(a) obtains a ratings of BBB (stable outlook) or better from S&P and Baa2 (stable outlook) or better fromMoody’s and (b) our domestic subsidiaries do not guarantee any material indebtedness. On February 27,2015 Standard & Poor’s Ratings Services raised its corporate credit and senior unsecured debt rating onthe Company to BBB from BBB�, with a stable outlook. As of March 11, 2015 Moody’s InvestorsServices’ corporate credit and senior unsecured debt rating on the Company was Baa2, with a stableoutlook. As a result, the guarantees of the Senior Notes and Senior Credit Facility were released as ofMarch 26, 2015 upon the discharge of the terms of the note indentures and Senior Credit Facilityagreement; therefore, the Company is exempt from disclosing supplemental guarantor financialinformation in accordance with Rule 3-10 of Regulation S-X, promulgated under the Securities Act of1933.
Senior Credit Facility
Our credit agreement provides for a $400.0 million term loan (‘‘Term Loan Facility’’) and a $1.0 billionrevolving credit facility (‘‘Revolving Credit Facility’’ and, together with the Term Loan Facility, the ‘‘SeniorCredit Facility’’). On October 14, 2015 we amended our Senior Credit Facility. The amendment extendedthe maturity of our Senior Credit Facility by two years to October 14, 2020, lowered the sublimits for theissuance of letters of credit and reduced the commitment fee from 0.175% to 0.15% on the daily unusedportions of the Senior Credit Facility. The amended Senior Credit Facility also increased the maximumpermitted leverage ratio from 3.25 to 3.5 times debt to total Consolidated EBITDA (as defined in theSenior Credit Facility). Pursuant to the terms of the Senior Credit Facility and the indentures governingthe Senior Notes, our obligations will no longer carry a conditional guarantee by certain of our 100%owned domestic subsidiaries. Subject to certain conditions, we have the right to increase the amount of theTerm Loan Facility or the Revolving Credit Facility by an aggregate amount not to exceed $400.0 million.All other existing terms under the Senior Credit Facility remained unchanged.
As of December 31, 2015 and December 31, 2014, we had no amounts outstanding under theRevolving Credit Facility. We had outstanding letters of credit of $105.2 million and $76.8 million at
91
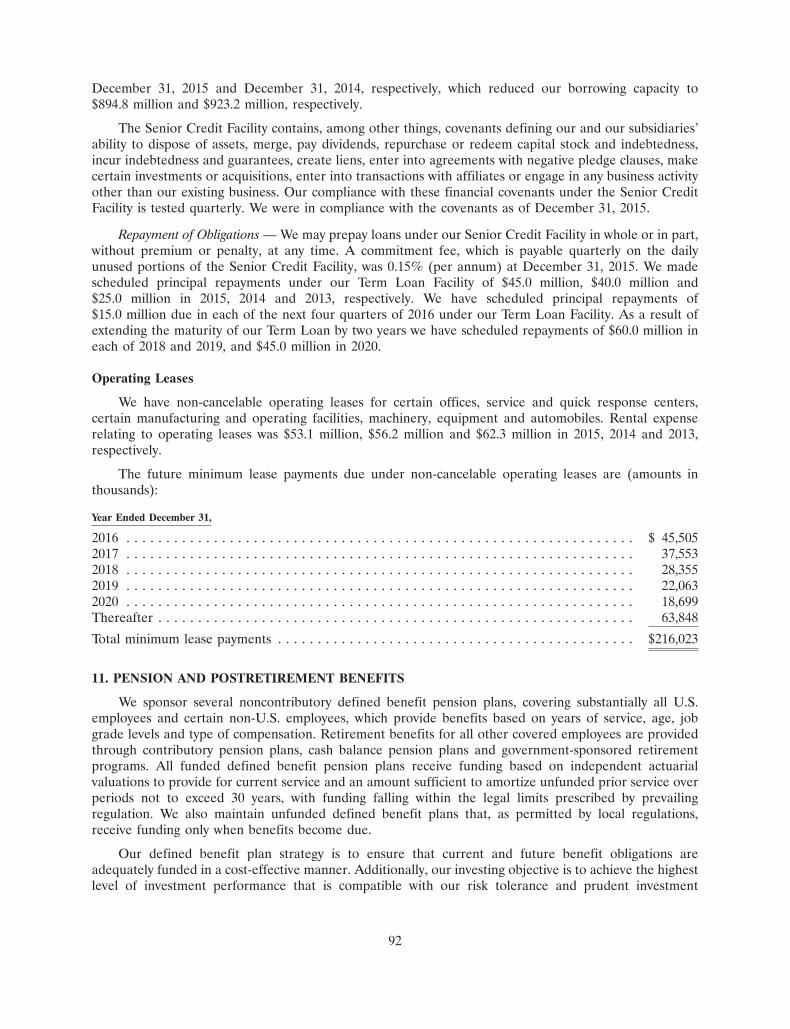
December 31, 2015 and December 31, 2014, respectively, which reduced our borrowing capacity to$894.8 million and $923.2 million, respectively.
The Senior Credit Facility contains, among other things, covenants defining our and our subsidiaries’ability to dispose of assets, merge, pay dividends, repurchase or redeem capital stock and indebtedness,incur indebtedness and guarantees, create liens, enter into agreements with negative pledge clauses, makecertain investments or acquisitions, enter into transactions with affiliates or engage in any business activityother than our existing business. Our compliance with these financial covenants under the Senior CreditFacility is tested quarterly. We were in compliance with the covenants as of December 31, 2015.
Repayment of Obligations — We may prepay loans under our Senior Credit Facility in whole or in part,without premium or penalty, at any time. A commitment fee, which is payable quarterly on the dailyunused portions of the Senior Credit Facility, was 0.15% (per annum) at December 31, 2015. We madescheduled principal repayments under our Term Loan Facility of $45.0 million, $40.0 million and$25.0 million in 2015, 2014 and 2013, respectively. We have scheduled principal repayments of$15.0 million due in each of the next four quarters of 2016 under our Term Loan Facility. As a result ofextending the maturity of our Term Loan by two years we have scheduled repayments of $60.0 million ineach of 2018 and 2019, and $45.0 million in 2020.
Operating Leases
We have non-cancelable operating leases for certain offices, service and quick response centers,certain manufacturing and operating facilities, machinery, equipment and automobiles. Rental expenserelating to operating leases was $53.1 million, $56.2 million and $62.3 million in 2015, 2014 and 2013,respectively.
The future minimum lease payments due under non-cancelable operating leases are (amounts inthousands):
Year Ended December 31,
2016 . . . . . . . . . . . . . . . . . . . . . . . . . . . . . . . . . . . . . . . . . . . . . . . . . . . . . . . . . . . . . . . . $ 45,5052017 . . . . . . . . . . . . . . . . . . . . . . . . . . . . . . . . . . . . . . . . . . . . . . . . . . . . . . . . . . . . . . . . 37,5532018 . . . . . . . . . . . . . . . . . . . . . . . . . . . . . . . . . . . . . . . . . . . . . . . . . . . . . . . . . . . . . . . . 28,3552019 . . . . . . . . . . . . . . . . . . . . . . . . . . . . . . . . . . . . . . . . . . . . . . . . . . . . . . . . . . . . . . . . 22,0632020 . . . . . . . . . . . . . . . . . . . . . . . . . . . . . . . . . . . . . . . . . . . . . . . . . . . . . . . . . . . . . . . . 18,699Thereafter . . . . . . . . . . . . . . . . . . . . . . . . . . . . . . . . . . . . . . . . . . . . . . . . . . . . . . . . . . . . 63,848
Total minimum lease payments . . . . . . . . . . . . . . . . . . . . . . . . . . . . . . . . . . . . . . . . . . . . . $216,023
11. PENSION AND POSTRETIREMENT BENEFITS
We sponsor several noncontributory defined benefit pension plans, covering substantially all U.S.employees and certain non-U.S. employees, which provide benefits based on years of service, age, jobgrade levels and type of compensation. Retirement benefits for all other covered employees are providedthrough contributory pension plans, cash balance pension plans and government-sponsored retirementprograms. All funded defined benefit pension plans receive funding based on independent actuarialvaluations to provide for current service and an amount sufficient to amortize unfunded prior service overperiods not to exceed 30 years, with funding falling within the legal limits prescribed by prevailingregulation. We also maintain unfunded defined benefit plans that, as permitted by local regulations,receive funding only when benefits become due.
Our defined benefit plan strategy is to ensure that current and future benefit obligations areadequately funded in a cost-effective manner. Additionally, our investing objective is to achieve the highestlevel of investment performance that is compatible with our risk tolerance and prudent investment
92
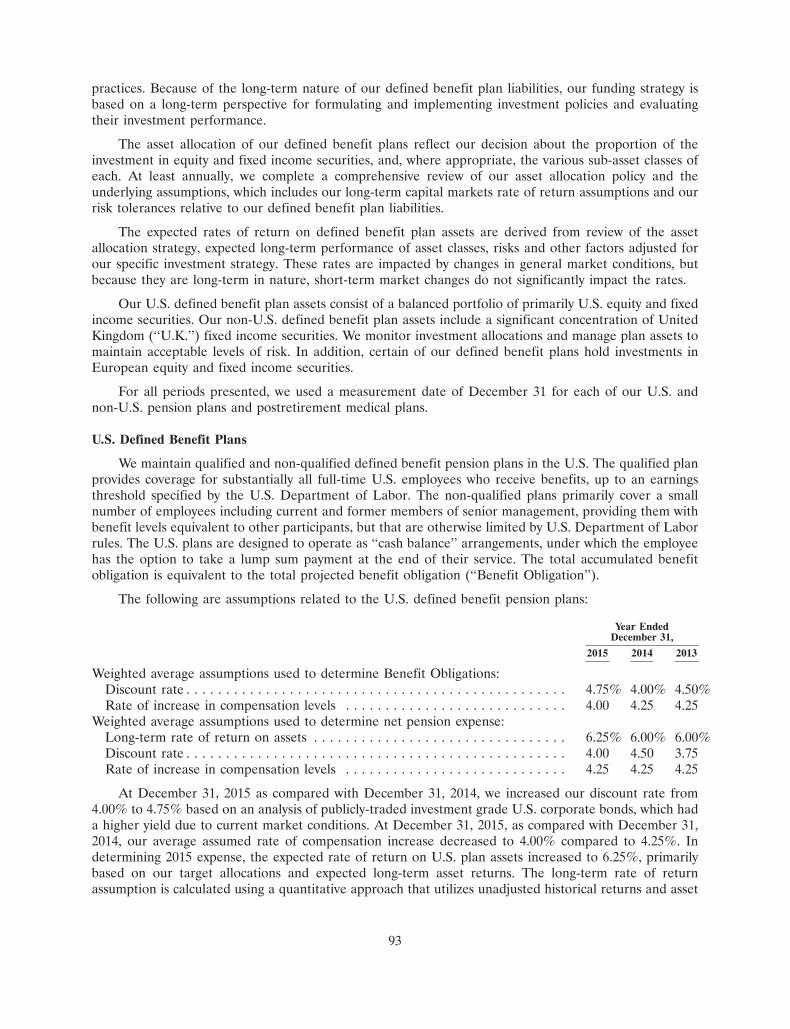
practices. Because of the long-term nature of our defined benefit plan liabilities, our funding strategy isbased on a long-term perspective for formulating and implementing investment policies and evaluatingtheir investment performance.
The asset allocation of our defined benefit plans reflect our decision about the proportion of theinvestment in equity and fixed income securities, and, where appropriate, the various sub-asset classes ofeach. At least annually, we complete a comprehensive review of our asset allocation policy and theunderlying assumptions, which includes our long-term capital markets rate of return assumptions and ourrisk tolerances relative to our defined benefit plan liabilities.
The expected rates of return on defined benefit plan assets are derived from review of the assetallocation strategy, expected long-term performance of asset classes, risks and other factors adjusted forour specific investment strategy. These rates are impacted by changes in general market conditions, butbecause they are long-term in nature, short-term market changes do not significantly impact the rates.
Our U.S. defined benefit plan assets consist of a balanced portfolio of primarily U.S. equity and fixedincome securities. Our non-U.S. defined benefit plan assets include a significant concentration of UnitedKingdom (‘‘U.K.’’) fixed income securities. We monitor investment allocations and manage plan assets tomaintain acceptable levels of risk. In addition, certain of our defined benefit plans hold investments inEuropean equity and fixed income securities.
For all periods presented, we used a measurement date of December 31 for each of our U.S. andnon-U.S. pension plans and postretirement medical plans.
U.S. Defined Benefit Plans
We maintain qualified and non-qualified defined benefit pension plans in the U.S. The qualified planprovides coverage for substantially all full-time U.S. employees who receive benefits, up to an earningsthreshold specified by the U.S. Department of Labor. The non-qualified plans primarily cover a smallnumber of employees including current and former members of senior management, providing them withbenefit levels equivalent to other participants, but that are otherwise limited by U.S. Department of Laborrules. The U.S. plans are designed to operate as ‘‘cash balance’’ arrangements, under which the employeehas the option to take a lump sum payment at the end of their service. The total accumulated benefitobligation is equivalent to the total projected benefit obligation (‘‘Benefit Obligation’’).
The following are assumptions related to the U.S. defined benefit pension plans:
Year EndedDecember 31,
2015 2014 2013
Weighted average assumptions used to determine Benefit Obligations:Discount rate . . . . . . . . . . . . . . . . . . . . . . . . . . . . . . . . . . . . . . . . . . . . . . . . 4.75% 4.00% 4.50%Rate of increase in compensation levels . . . . . . . . . . . . . . . . . . . . . . . . . . . . 4.00 4.25 4.25
Weighted average assumptions used to determine net pension expense:Long-term rate of return on assets . . . . . . . . . . . . . . . . . . . . . . . . . . . . . . . . 6.25% 6.00% 6.00%Discount rate . . . . . . . . . . . . . . . . . . . . . . . . . . . . . . . . . . . . . . . . . . . . . . . . 4.00 4.50 3.75Rate of increase in compensation levels . . . . . . . . . . . . . . . . . . . . . . . . . . . . 4.25 4.25 4.25
At December 31, 2015 as compared with December 31, 2014, we increased our discount rate from4.00% to 4.75% based on an analysis of publicly-traded investment grade U.S. corporate bonds, which hada higher yield due to current market conditions. At December 31, 2015, as compared with December 31,2014, our average assumed rate of compensation increase decreased to 4.00% compared to 4.25%. Indetermining 2015 expense, the expected rate of return on U.S. plan assets increased to 6.25%, primarilybased on our target allocations and expected long-term asset returns. The long-term rate of returnassumption is calculated using a quantitative approach that utilizes unadjusted historical returns and asset
93
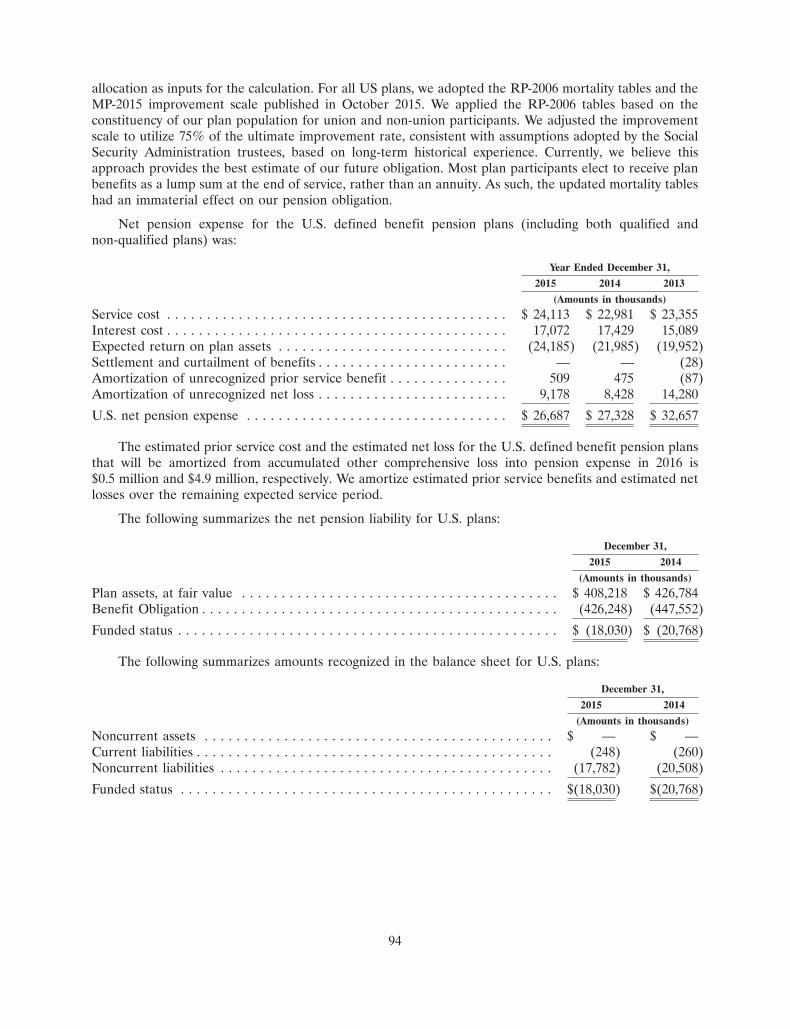
allocation as inputs for the calculation. For all US plans, we adopted the RP-2006 mortality tables and theMP-2015 improvement scale published in October 2015. We applied the RP-2006 tables based on theconstituency of our plan population for union and non-union participants. We adjusted the improvementscale to utilize 75% of the ultimate improvement rate, consistent with assumptions adopted by the SocialSecurity Administration trustees, based on long-term historical experience. Currently, we believe thisapproach provides the best estimate of our future obligation. Most plan participants elect to receive planbenefits as a lump sum at the end of service, rather than an annuity. As such, the updated mortality tableshad an immaterial effect on our pension obligation.
Net pension expense for the U.S. defined benefit pension plans (including both qualified andnon-qualified plans) was:
Year Ended December 31,
2015 2014 2013
(Amounts in thousands)
Service cost . . . . . . . . . . . . . . . . . . . . . . . . . . . . . . . . . . . . . . . . . . . $ 24,113 $ 22,981 $ 23,355Interest cost . . . . . . . . . . . . . . . . . . . . . . . . . . . . . . . . . . . . . . . . . . . 17,072 17,429 15,089Expected return on plan assets . . . . . . . . . . . . . . . . . . . . . . . . . . . . . (24,185) (21,985) (19,952)Settlement and curtailment of benefits . . . . . . . . . . . . . . . . . . . . . . . . — — (28)Amortization of unrecognized prior service benefit . . . . . . . . . . . . . . . 509 475 (87)Amortization of unrecognized net loss . . . . . . . . . . . . . . . . . . . . . . . . 9,178 8,428 14,280
U.S. net pension expense . . . . . . . . . . . . . . . . . . . . . . . . . . . . . . . . . $ 26,687 $ 27,328 $ 32,657
The estimated prior service cost and the estimated net loss for the U.S. defined benefit pension plansthat will be amortized from accumulated other comprehensive loss into pension expense in 2016 is$0.5 million and $4.9 million, respectively. We amortize estimated prior service benefits and estimated netlosses over the remaining expected service period.
The following summarizes the net pension liability for U.S. plans:
December 31,
2015 2014
(Amounts in thousands)
Plan assets, at fair value . . . . . . . . . . . . . . . . . . . . . . . . . . . . . . . . . . . . . . . . $ 408,218 $ 426,784Benefit Obligation . . . . . . . . . . . . . . . . . . . . . . . . . . . . . . . . . . . . . . . . . . . . . (426,248) (447,552)
Funded status . . . . . . . . . . . . . . . . . . . . . . . . . . . . . . . . . . . . . . . . . . . . . . . . $ (18,030) $ (20,768)
The following summarizes amounts recognized in the balance sheet for U.S. plans:
December 31,
2015 2014
(Amounts in thousands)
Noncurrent assets . . . . . . . . . . . . . . . . . . . . . . . . . . . . . . . . . . . . . . . . . . . . $ — $ —Current liabilities . . . . . . . . . . . . . . . . . . . . . . . . . . . . . . . . . . . . . . . . . . . . . (248) (260)Noncurrent liabilities . . . . . . . . . . . . . . . . . . . . . . . . . . . . . . . . . . . . . . . . . . (17,782) (20,508)
Funded status . . . . . . . . . . . . . . . . . . . . . . . . . . . . . . . . . . . . . . . . . . . . . . . $(18,030) $(20,768)
94
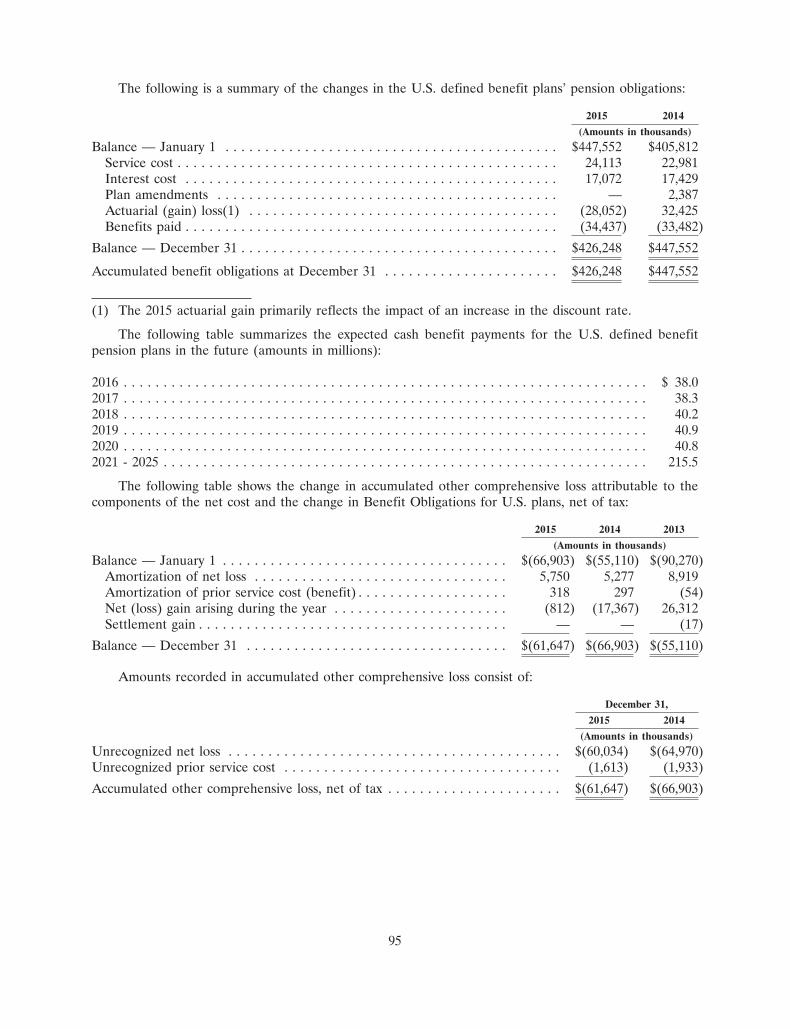
The following is a summary of the changes in the U.S. defined benefit plans’ pension obligations:
2015 2014
(Amounts in thousands)
Balance — January 1 . . . . . . . . . . . . . . . . . . . . . . . . . . . . . . . . . . . . . . . . . . $447,552 $405,812Service cost . . . . . . . . . . . . . . . . . . . . . . . . . . . . . . . . . . . . . . . . . . . . . . . . 24,113 22,981Interest cost . . . . . . . . . . . . . . . . . . . . . . . . . . . . . . . . . . . . . . . . . . . . . . . 17,072 17,429Plan amendments . . . . . . . . . . . . . . . . . . . . . . . . . . . . . . . . . . . . . . . . . . . — 2,387Actuarial (gain) loss(1) . . . . . . . . . . . . . . . . . . . . . . . . . . . . . . . . . . . . . . . (28,052) 32,425Benefits paid . . . . . . . . . . . . . . . . . . . . . . . . . . . . . . . . . . . . . . . . . . . . . . . (34,437) (33,482)
Balance — December 31 . . . . . . . . . . . . . . . . . . . . . . . . . . . . . . . . . . . . . . . . $426,248 $447,552
Accumulated benefit obligations at December 31 . . . . . . . . . . . . . . . . . . . . . . $426,248 $447,552
(1) The 2015 actuarial gain primarily reflects the impact of an increase in the discount rate.
The following table summarizes the expected cash benefit payments for the U.S. defined benefitpension plans in the future (amounts in millions):
2016 . . . . . . . . . . . . . . . . . . . . . . . . . . . . . . . . . . . . . . . . . . . . . . . . . . . . . . . . . . . . . . . . . . $ 38.02017 . . . . . . . . . . . . . . . . . . . . . . . . . . . . . . . . . . . . . . . . . . . . . . . . . . . . . . . . . . . . . . . . . . 38.32018 . . . . . . . . . . . . . . . . . . . . . . . . . . . . . . . . . . . . . . . . . . . . . . . . . . . . . . . . . . . . . . . . . . 40.22019 . . . . . . . . . . . . . . . . . . . . . . . . . . . . . . . . . . . . . . . . . . . . . . . . . . . . . . . . . . . . . . . . . . 40.92020 . . . . . . . . . . . . . . . . . . . . . . . . . . . . . . . . . . . . . . . . . . . . . . . . . . . . . . . . . . . . . . . . . . 40.82021 - 2025 . . . . . . . . . . . . . . . . . . . . . . . . . . . . . . . . . . . . . . . . . . . . . . . . . . . . . . . . . . . . . 215.5
The following table shows the change in accumulated other comprehensive loss attributable to thecomponents of the net cost and the change in Benefit Obligations for U.S. plans, net of tax:
2015 2014 2013
(Amounts in thousands)
Balance — January 1 . . . . . . . . . . . . . . . . . . . . . . . . . . . . . . . . . . . . $(66,903) $(55,110) $(90,270)Amortization of net loss . . . . . . . . . . . . . . . . . . . . . . . . . . . . . . . . 5,750 5,277 8,919Amortization of prior service cost (benefit) . . . . . . . . . . . . . . . . . . . 318 297 (54)Net (loss) gain arising during the year . . . . . . . . . . . . . . . . . . . . . . (812) (17,367) 26,312Settlement gain . . . . . . . . . . . . . . . . . . . . . . . . . . . . . . . . . . . . . . . — — (17)
Balance — December 31 . . . . . . . . . . . . . . . . . . . . . . . . . . . . . . . . . $(61,647) $(66,903) $(55,110)
Amounts recorded in accumulated other comprehensive loss consist of:
December 31,
2015 2014
(Amounts in thousands)
Unrecognized net loss . . . . . . . . . . . . . . . . . . . . . . . . . . . . . . . . . . . . . . . . . . $(60,034) $(64,970)Unrecognized prior service cost . . . . . . . . . . . . . . . . . . . . . . . . . . . . . . . . . . . (1,613) (1,933)
Accumulated other comprehensive loss, net of tax . . . . . . . . . . . . . . . . . . . . . . $(61,647) $(66,903)
95
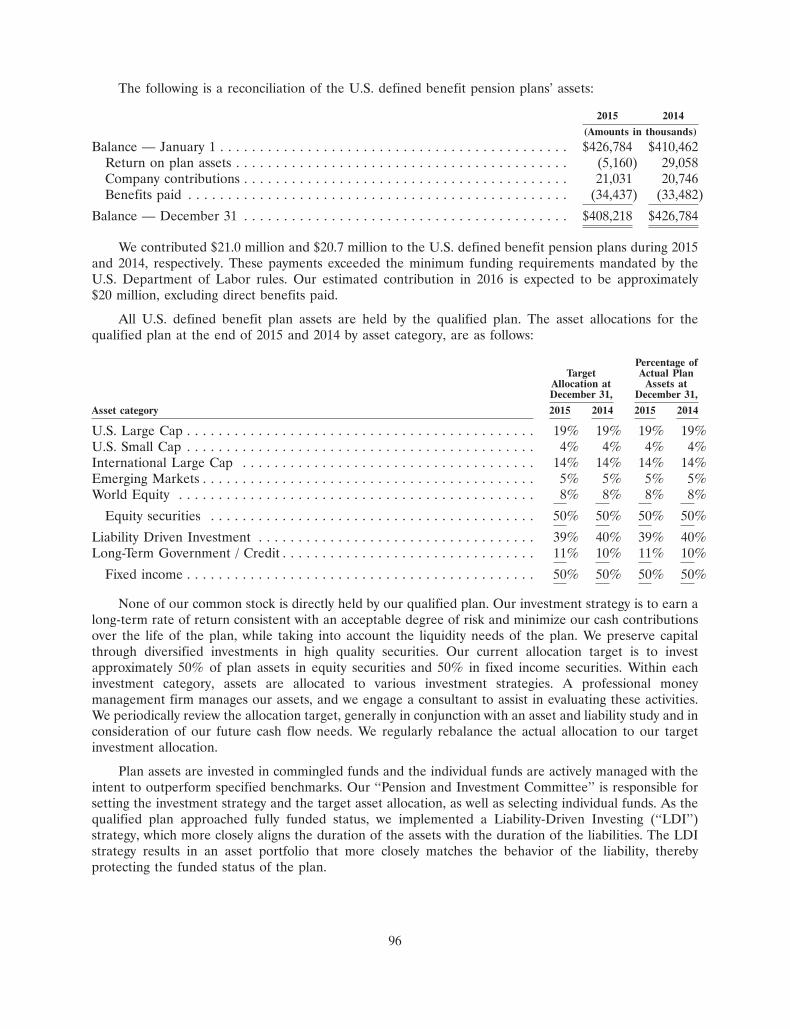
The following is a reconciliation of the U.S. defined benefit pension plans’ assets:
2015 2014
(Amounts in thousands)
Balance — January 1 . . . . . . . . . . . . . . . . . . . . . . . . . . . . . . . . . . . . . . . . . . . . $426,784 $410,462Return on plan assets . . . . . . . . . . . . . . . . . . . . . . . . . . . . . . . . . . . . . . . . . . (5,160) 29,058Company contributions . . . . . . . . . . . . . . . . . . . . . . . . . . . . . . . . . . . . . . . . . 21,031 20,746Benefits paid . . . . . . . . . . . . . . . . . . . . . . . . . . . . . . . . . . . . . . . . . . . . . . . . (34,437) (33,482)
Balance — December 31 . . . . . . . . . . . . . . . . . . . . . . . . . . . . . . . . . . . . . . . . . $408,218 $426,784
We contributed $21.0 million and $20.7 million to the U.S. defined benefit pension plans during 2015and 2014, respectively. These payments exceeded the minimum funding requirements mandated by theU.S. Department of Labor rules. Our estimated contribution in 2016 is expected to be approximately$20 million, excluding direct benefits paid.
All U.S. defined benefit plan assets are held by the qualified plan. The asset allocations for thequalified plan at the end of 2015 and 2014 by asset category, are as follows:
Percentage ofTarget Actual Plan
Allocation at Assets atDecember 31, December 31,
Asset category 2015 2014 2015 2014
U.S. Large Cap . . . . . . . . . . . . . . . . . . . . . . . . . . . . . . . . . . . . . . . . . . . . 19% 19% 19% 19%U.S. Small Cap . . . . . . . . . . . . . . . . . . . . . . . . . . . . . . . . . . . . . . . . . . . . 4% 4% 4% 4%International Large Cap . . . . . . . . . . . . . . . . . . . . . . . . . . . . . . . . . . . . . 14% 14% 14% 14%Emerging Markets . . . . . . . . . . . . . . . . . . . . . . . . . . . . . . . . . . . . . . . . . . 5% 5% 5% 5%World Equity . . . . . . . . . . . . . . . . . . . . . . . . . . . . . . . . . . . . . . . . . . . . . 8% 8% 8% 8%
Equity securities . . . . . . . . . . . . . . . . . . . . . . . . . . . . . . . . . . . . . . . . . 50% 50% 50% 50%
Liability Driven Investment . . . . . . . . . . . . . . . . . . . . . . . . . . . . . . . . . . . 39% 40% 39% 40%Long-Term Government / Credit . . . . . . . . . . . . . . . . . . . . . . . . . . . . . . . . 11% 10% 11% 10%
Fixed income . . . . . . . . . . . . . . . . . . . . . . . . . . . . . . . . . . . . . . . . . . . . 50% 50% 50% 50%
None of our common stock is directly held by our qualified plan. Our investment strategy is to earn along-term rate of return consistent with an acceptable degree of risk and minimize our cash contributionsover the life of the plan, while taking into account the liquidity needs of the plan. We preserve capitalthrough diversified investments in high quality securities. Our current allocation target is to investapproximately 50% of plan assets in equity securities and 50% in fixed income securities. Within eachinvestment category, assets are allocated to various investment strategies. A professional moneymanagement firm manages our assets, and we engage a consultant to assist in evaluating these activities.We periodically review the allocation target, generally in conjunction with an asset and liability study and inconsideration of our future cash flow needs. We regularly rebalance the actual allocation to our targetinvestment allocation.
Plan assets are invested in commingled funds and the individual funds are actively managed with theintent to outperform specified benchmarks. Our ‘‘Pension and Investment Committee’’ is responsible forsetting the investment strategy and the target asset allocation, as well as selecting individual funds. As thequalified plan approached fully funded status, we implemented a Liability-Driven Investing (‘‘LDI’’)strategy, which more closely aligns the duration of the assets with the duration of the liabilities. The LDIstrategy results in an asset portfolio that more closely matches the behavior of the liability, therebyprotecting the funded status of the plan.
96
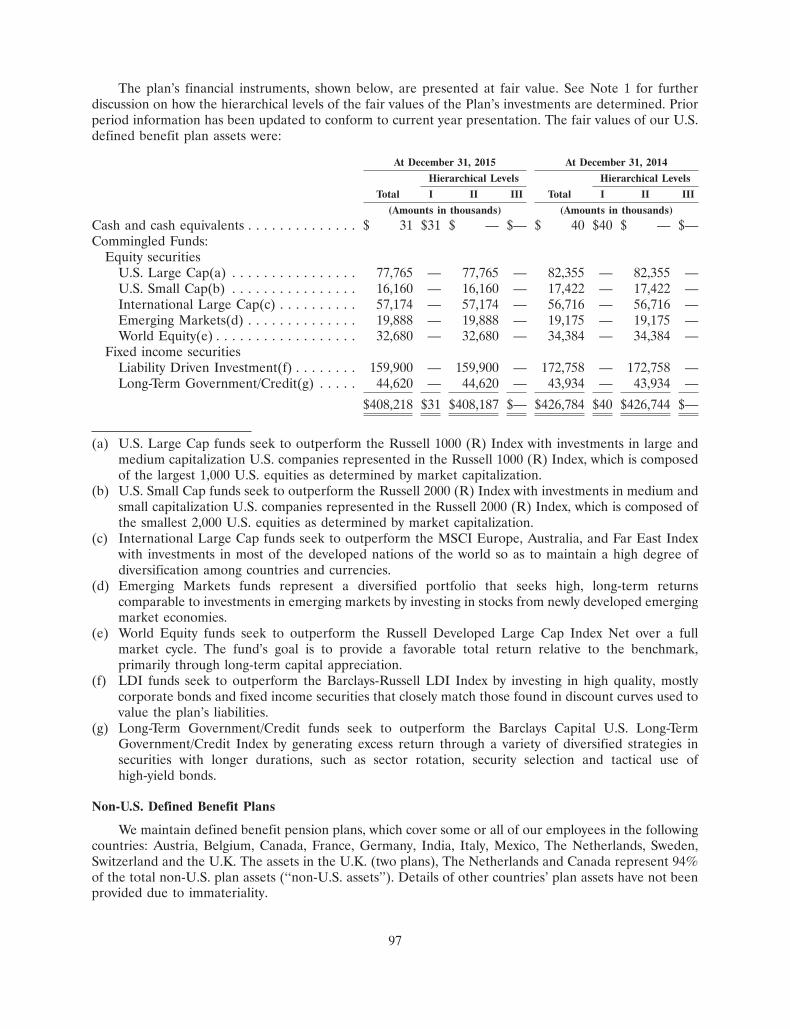
The plan’s financial instruments, shown below, are presented at fair value. See Note 1 for furtherdiscussion on how the hierarchical levels of the fair values of the Plan’s investments are determined. Priorperiod information has been updated to conform to current year presentation. The fair values of our U.S.defined benefit plan assets were:
At December 31, 2015 At December 31, 2014
Hierarchical Levels Hierarchical Levels
Total I II III Total I II III
(Amounts in thousands) (Amounts in thousands)
Cash and cash equivalents . . . . . . . . . . . . . . $ 31 $31 $ — $— $ 40 $40 $ — $—Commingled Funds:
Equity securitiesU.S. Large Cap(a) . . . . . . . . . . . . . . . . 77,765 — 77,765 — 82,355 — 82,355 —U.S. Small Cap(b) . . . . . . . . . . . . . . . . 16,160 — 16,160 — 17,422 — 17,422 —International Large Cap(c) . . . . . . . . . . 57,174 — 57,174 — 56,716 — 56,716 —Emerging Markets(d) . . . . . . . . . . . . . . 19,888 — 19,888 — 19,175 — 19,175 —World Equity(e) . . . . . . . . . . . . . . . . . . 32,680 — 32,680 — 34,384 — 34,384 —
Fixed income securitiesLiability Driven Investment(f) . . . . . . . . 159,900 — 159,900 — 172,758 — 172,758 —Long-Term Government/Credit(g) . . . . . 44,620 — 44,620 — 43,934 — 43,934 —
$408,218 $31 $408,187 $— $426,784 $40 $426,744 $—
(a) U.S. Large Cap funds seek to outperform the Russell 1000 (R) Index with investments in large andmedium capitalization U.S. companies represented in the Russell 1000 (R) Index, which is composedof the largest 1,000 U.S. equities as determined by market capitalization.
(b) U.S. Small Cap funds seek to outperform the Russell 2000 (R) Index with investments in medium andsmall capitalization U.S. companies represented in the Russell 2000 (R) Index, which is composed ofthe smallest 2,000 U.S. equities as determined by market capitalization.
(c) International Large Cap funds seek to outperform the MSCI Europe, Australia, and Far East Indexwith investments in most of the developed nations of the world so as to maintain a high degree ofdiversification among countries and currencies.
(d) Emerging Markets funds represent a diversified portfolio that seeks high, long-term returnscomparable to investments in emerging markets by investing in stocks from newly developed emergingmarket economies.
(e) World Equity funds seek to outperform the Russell Developed Large Cap Index Net over a fullmarket cycle. The fund’s goal is to provide a favorable total return relative to the benchmark,primarily through long-term capital appreciation.
(f) LDI funds seek to outperform the Barclays-Russell LDI Index by investing in high quality, mostlycorporate bonds and fixed income securities that closely match those found in discount curves used tovalue the plan’s liabilities.
(g) Long-Term Government/Credit funds seek to outperform the Barclays Capital U.S. Long-TermGovernment/Credit Index by generating excess return through a variety of diversified strategies insecurities with longer durations, such as sector rotation, security selection and tactical use ofhigh-yield bonds.
Non-U.S. Defined Benefit Plans
We maintain defined benefit pension plans, which cover some or all of our employees in the followingcountries: Austria, Belgium, Canada, France, Germany, India, Italy, Mexico, The Netherlands, Sweden,Switzerland and the U.K. The assets in the U.K. (two plans), The Netherlands and Canada represent 94%of the total non-U.S. plan assets (‘‘non-U.S. assets’’). Details of other countries’ plan assets have not beenprovided due to immateriality.
97
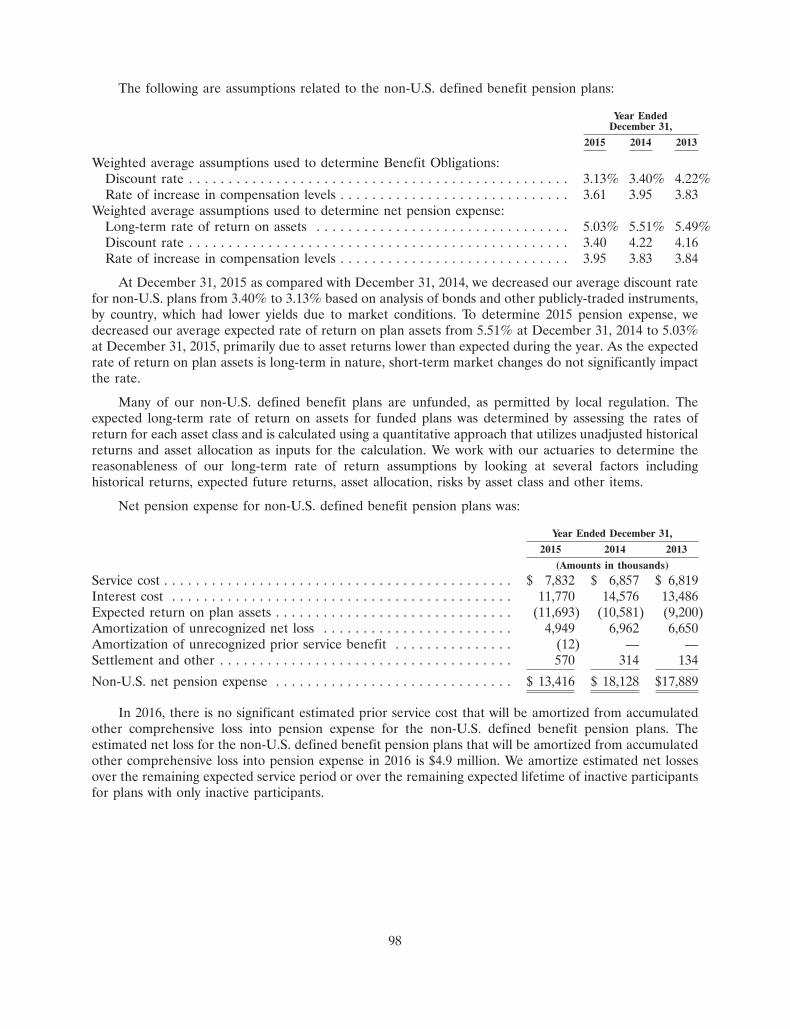
The following are assumptions related to the non-U.S. defined benefit pension plans:
Year EndedDecember 31,
2015 2014 2013
Weighted average assumptions used to determine Benefit Obligations:Discount rate . . . . . . . . . . . . . . . . . . . . . . . . . . . . . . . . . . . . . . . . . . . . . . . . 3.13% 3.40% 4.22%Rate of increase in compensation levels . . . . . . . . . . . . . . . . . . . . . . . . . . . . . 3.61 3.95 3.83
Weighted average assumptions used to determine net pension expense:Long-term rate of return on assets . . . . . . . . . . . . . . . . . . . . . . . . . . . . . . . . 5.03% 5.51% 5.49%Discount rate . . . . . . . . . . . . . . . . . . . . . . . . . . . . . . . . . . . . . . . . . . . . . . . . 3.40 4.22 4.16Rate of increase in compensation levels . . . . . . . . . . . . . . . . . . . . . . . . . . . . . 3.95 3.83 3.84
At December 31, 2015 as compared with December 31, 2014, we decreased our average discount ratefor non-U.S. plans from 3.40% to 3.13% based on analysis of bonds and other publicly-traded instruments,by country, which had lower yields due to market conditions. To determine 2015 pension expense, wedecreased our average expected rate of return on plan assets from 5.51% at December 31, 2014 to 5.03%at December 31, 2015, primarily due to asset returns lower than expected during the year. As the expectedrate of return on plan assets is long-term in nature, short-term market changes do not significantly impactthe rate.
Many of our non-U.S. defined benefit plans are unfunded, as permitted by local regulation. Theexpected long-term rate of return on assets for funded plans was determined by assessing the rates ofreturn for each asset class and is calculated using a quantitative approach that utilizes unadjusted historicalreturns and asset allocation as inputs for the calculation. We work with our actuaries to determine thereasonableness of our long-term rate of return assumptions by looking at several factors includinghistorical returns, expected future returns, asset allocation, risks by asset class and other items.
Net pension expense for non-U.S. defined benefit pension plans was:
Year Ended December 31,
2015 2014 2013
(Amounts in thousands)
Service cost . . . . . . . . . . . . . . . . . . . . . . . . . . . . . . . . . . . . . . . . . . . . $ 7,832 $ 6,857 $ 6,819Interest cost . . . . . . . . . . . . . . . . . . . . . . . . . . . . . . . . . . . . . . . . . . . 11,770 14,576 13,486Expected return on plan assets . . . . . . . . . . . . . . . . . . . . . . . . . . . . . . (11,693) (10,581) (9,200)Amortization of unrecognized net loss . . . . . . . . . . . . . . . . . . . . . . . . 4,949 6,962 6,650Amortization of unrecognized prior service benefit . . . . . . . . . . . . . . . (12) — —Settlement and other . . . . . . . . . . . . . . . . . . . . . . . . . . . . . . . . . . . . . 570 314 134
Non-U.S. net pension expense . . . . . . . . . . . . . . . . . . . . . . . . . . . . . . $ 13,416 $ 18,128 $17,889
In 2016, there is no significant estimated prior service cost that will be amortized from accumulatedother comprehensive loss into pension expense for the non-U.S. defined benefit pension plans. Theestimated net loss for the non-U.S. defined benefit pension plans that will be amortized from accumulatedother comprehensive loss into pension expense in 2016 is $4.9 million. We amortize estimated net lossesover the remaining expected service period or over the remaining expected lifetime of inactive participantsfor plans with only inactive participants.
98
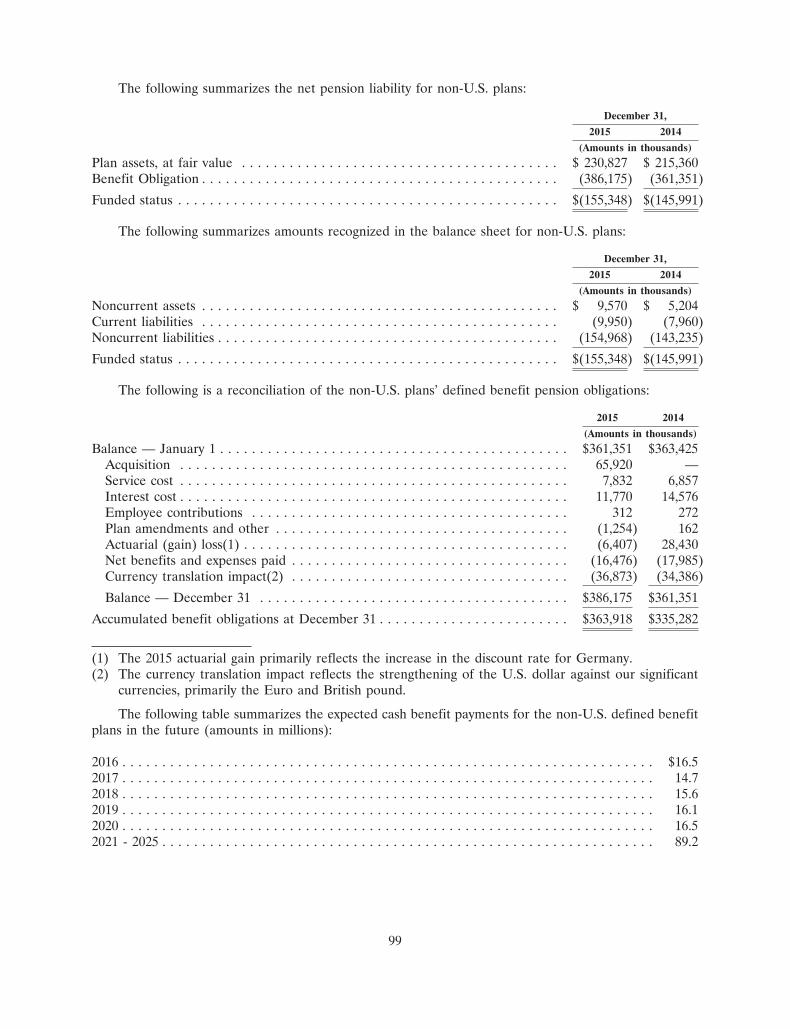
The following summarizes the net pension liability for non-U.S. plans:
December 31,
2015 2014
(Amounts in thousands)
Plan assets, at fair value . . . . . . . . . . . . . . . . . . . . . . . . . . . . . . . . . . . . . . . . $ 230,827 $ 215,360Benefit Obligation . . . . . . . . . . . . . . . . . . . . . . . . . . . . . . . . . . . . . . . . . . . . . (386,175) (361,351)
Funded status . . . . . . . . . . . . . . . . . . . . . . . . . . . . . . . . . . . . . . . . . . . . . . . . $(155,348) $(145,991)
The following summarizes amounts recognized in the balance sheet for non-U.S. plans:
December 31,
2015 2014
(Amounts in thousands)
Noncurrent assets . . . . . . . . . . . . . . . . . . . . . . . . . . . . . . . . . . . . . . . . . . . . . $ 9,570 $ 5,204Current liabilities . . . . . . . . . . . . . . . . . . . . . . . . . . . . . . . . . . . . . . . . . . . . . (9,950) (7,960)Noncurrent liabilities . . . . . . . . . . . . . . . . . . . . . . . . . . . . . . . . . . . . . . . . . . . (154,968) (143,235)
Funded status . . . . . . . . . . . . . . . . . . . . . . . . . . . . . . . . . . . . . . . . . . . . . . . . $(155,348) $(145,991)
The following is a reconciliation of the non-U.S. plans’ defined benefit pension obligations:
2015 2014
(Amounts in thousands)
Balance — January 1 . . . . . . . . . . . . . . . . . . . . . . . . . . . . . . . . . . . . . . . . . . . . $361,351 $363,425Acquisition . . . . . . . . . . . . . . . . . . . . . . . . . . . . . . . . . . . . . . . . . . . . . . . . . 65,920 —Service cost . . . . . . . . . . . . . . . . . . . . . . . . . . . . . . . . . . . . . . . . . . . . . . . . . 7,832 6,857Interest cost . . . . . . . . . . . . . . . . . . . . . . . . . . . . . . . . . . . . . . . . . . . . . . . . . 11,770 14,576Employee contributions . . . . . . . . . . . . . . . . . . . . . . . . . . . . . . . . . . . . . . . . 312 272Plan amendments and other . . . . . . . . . . . . . . . . . . . . . . . . . . . . . . . . . . . . . (1,254) 162Actuarial (gain) loss(1) . . . . . . . . . . . . . . . . . . . . . . . . . . . . . . . . . . . . . . . . . (6,407) 28,430Net benefits and expenses paid . . . . . . . . . . . . . . . . . . . . . . . . . . . . . . . . . . . (16,476) (17,985)Currency translation impact(2) . . . . . . . . . . . . . . . . . . . . . . . . . . . . . . . . . . . (36,873) (34,386)
Balance — December 31 . . . . . . . . . . . . . . . . . . . . . . . . . . . . . . . . . . . . . . . $386,175 $361,351
Accumulated benefit obligations at December 31 . . . . . . . . . . . . . . . . . . . . . . . . $363,918 $335,282
(1) The 2015 actuarial gain primarily reflects the increase in the discount rate for Germany.(2) The currency translation impact reflects the strengthening of the U.S. dollar against our significant
currencies, primarily the Euro and British pound.
The following table summarizes the expected cash benefit payments for the non-U.S. defined benefitplans in the future (amounts in millions):
2016 . . . . . . . . . . . . . . . . . . . . . . . . . . . . . . . . . . . . . . . . . . . . . . . . . . . . . . . . . . . . . . . . . . . $16.52017 . . . . . . . . . . . . . . . . . . . . . . . . . . . . . . . . . . . . . . . . . . . . . . . . . . . . . . . . . . . . . . . . . . . 14.72018 . . . . . . . . . . . . . . . . . . . . . . . . . . . . . . . . . . . . . . . . . . . . . . . . . . . . . . . . . . . . . . . . . . . 15.62019 . . . . . . . . . . . . . . . . . . . . . . . . . . . . . . . . . . . . . . . . . . . . . . . . . . . . . . . . . . . . . . . . . . . 16.12020 . . . . . . . . . . . . . . . . . . . . . . . . . . . . . . . . . . . . . . . . . . . . . . . . . . . . . . . . . . . . . . . . . . . 16.52021 - 2025 . . . . . . . . . . . . . . . . . . . . . . . . . . . . . . . . . . . . . . . . . . . . . . . . . . . . . . . . . . . . . . 89.2
99
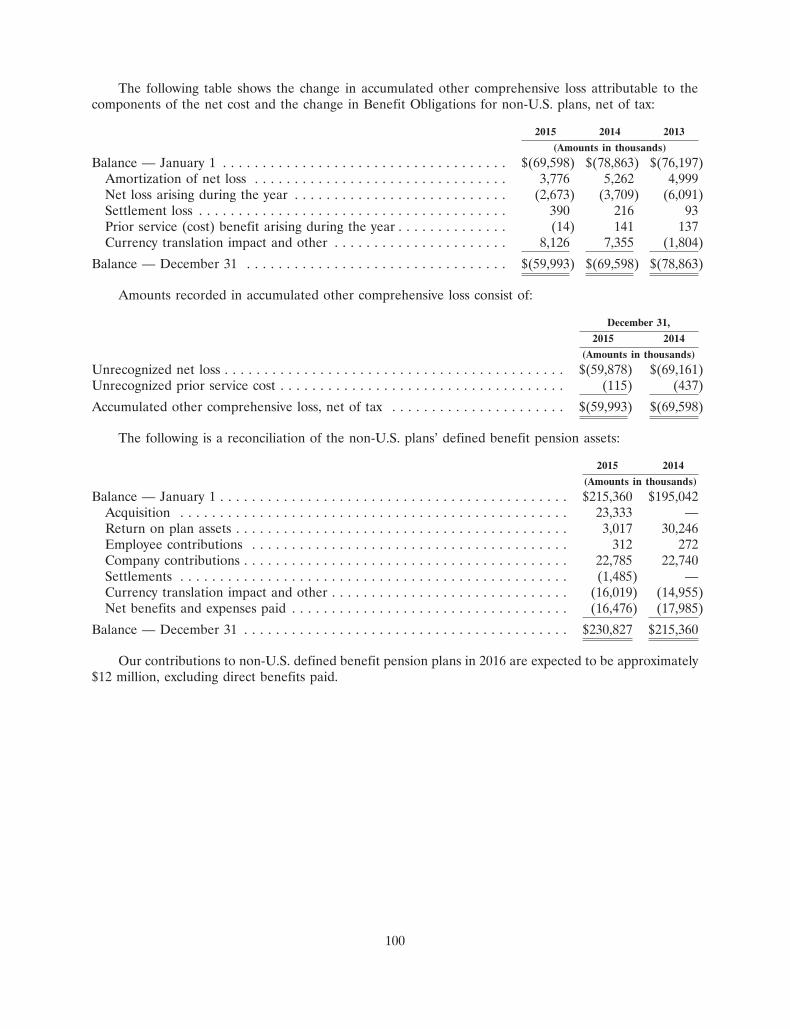
The following table shows the change in accumulated other comprehensive loss attributable to thecomponents of the net cost and the change in Benefit Obligations for non-U.S. plans, net of tax:
2015 2014 2013
(Amounts in thousands)
Balance — January 1 . . . . . . . . . . . . . . . . . . . . . . . . . . . . . . . . . . . . $(69,598) $(78,863) $(76,197)Amortization of net loss . . . . . . . . . . . . . . . . . . . . . . . . . . . . . . . . 3,776 5,262 4,999Net loss arising during the year . . . . . . . . . . . . . . . . . . . . . . . . . . . (2,673) (3,709) (6,091)Settlement loss . . . . . . . . . . . . . . . . . . . . . . . . . . . . . . . . . . . . . . . 390 216 93Prior service (cost) benefit arising during the year . . . . . . . . . . . . . . (14) 141 137Currency translation impact and other . . . . . . . . . . . . . . . . . . . . . . 8,126 7,355 (1,804)
Balance — December 31 . . . . . . . . . . . . . . . . . . . . . . . . . . . . . . . . . $(59,993) $(69,598) $(78,863)
Amounts recorded in accumulated other comprehensive loss consist of:
December 31,
2015 2014
(Amounts in thousands)
Unrecognized net loss . . . . . . . . . . . . . . . . . . . . . . . . . . . . . . . . . . . . . . . . . . . $(59,878) $(69,161)Unrecognized prior service cost . . . . . . . . . . . . . . . . . . . . . . . . . . . . . . . . . . . . (115) (437)
Accumulated other comprehensive loss, net of tax . . . . . . . . . . . . . . . . . . . . . . $(59,993) $(69,598)
The following is a reconciliation of the non-U.S. plans’ defined benefit pension assets:
2015 2014
(Amounts in thousands)
Balance — January 1 . . . . . . . . . . . . . . . . . . . . . . . . . . . . . . . . . . . . . . . . . . . . $215,360 $195,042Acquisition . . . . . . . . . . . . . . . . . . . . . . . . . . . . . . . . . . . . . . . . . . . . . . . . . 23,333 —Return on plan assets . . . . . . . . . . . . . . . . . . . . . . . . . . . . . . . . . . . . . . . . . . 3,017 30,246Employee contributions . . . . . . . . . . . . . . . . . . . . . . . . . . . . . . . . . . . . . . . . 312 272Company contributions . . . . . . . . . . . . . . . . . . . . . . . . . . . . . . . . . . . . . . . . . 22,785 22,740Settlements . . . . . . . . . . . . . . . . . . . . . . . . . . . . . . . . . . . . . . . . . . . . . . . . . (1,485) —Currency translation impact and other . . . . . . . . . . . . . . . . . . . . . . . . . . . . . . (16,019) (14,955)Net benefits and expenses paid . . . . . . . . . . . . . . . . . . . . . . . . . . . . . . . . . . . (16,476) (17,985)
Balance — December 31 . . . . . . . . . . . . . . . . . . . . . . . . . . . . . . . . . . . . . . . . . $230,827 $215,360
Our contributions to non-U.S. defined benefit pension plans in 2016 are expected to be approximately$12 million, excluding direct benefits paid.
100
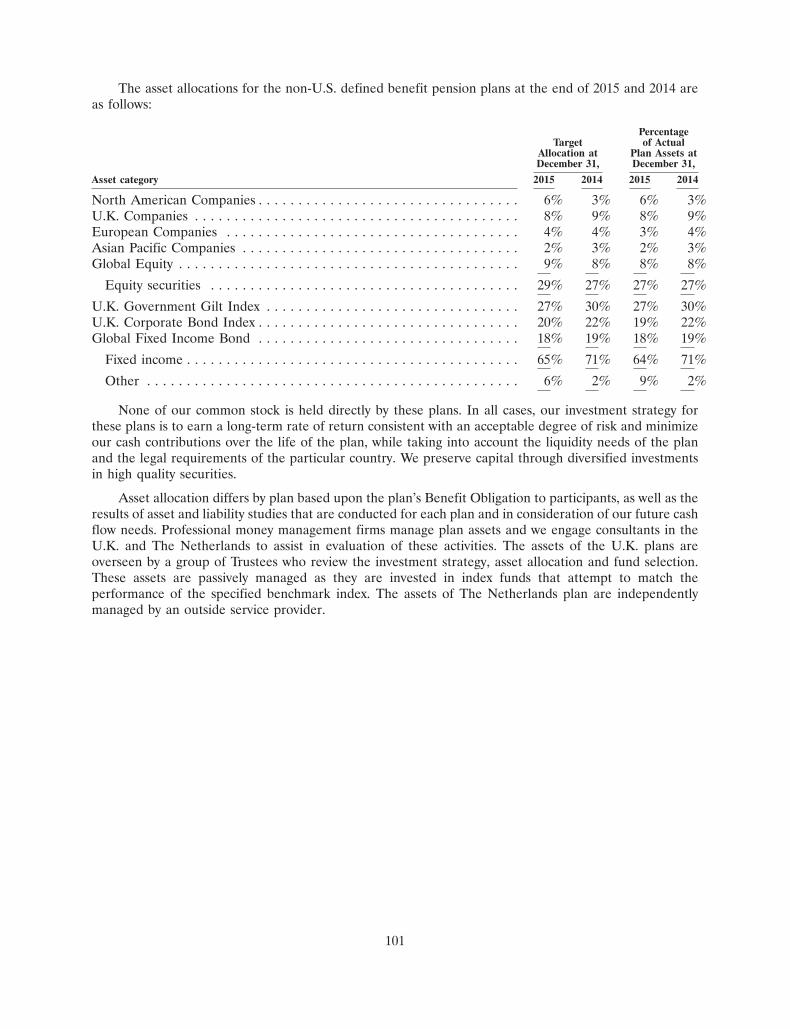
The asset allocations for the non-U.S. defined benefit pension plans at the end of 2015 and 2014 areas follows:
PercentageTarget of Actual
Allocation at Plan Assets atDecember 31, December 31,
Asset category 2015 2014 2015 2014
North American Companies . . . . . . . . . . . . . . . . . . . . . . . . . . . . . . . . . 6% 3% 6% 3%U.K. Companies . . . . . . . . . . . . . . . . . . . . . . . . . . . . . . . . . . . . . . . . . 8% 9% 8% 9%European Companies . . . . . . . . . . . . . . . . . . . . . . . . . . . . . . . . . . . . . 4% 4% 3% 4%Asian Pacific Companies . . . . . . . . . . . . . . . . . . . . . . . . . . . . . . . . . . . 2% 3% 2% 3%Global Equity . . . . . . . . . . . . . . . . . . . . . . . . . . . . . . . . . . . . . . . . . . . 9% 8% 8% 8%
Equity securities . . . . . . . . . . . . . . . . . . . . . . . . . . . . . . . . . . . . . . . 29% 27% 27% 27%
U.K. Government Gilt Index . . . . . . . . . . . . . . . . . . . . . . . . . . . . . . . . 27% 30% 27% 30%U.K. Corporate Bond Index . . . . . . . . . . . . . . . . . . . . . . . . . . . . . . . . . 20% 22% 19% 22%Global Fixed Income Bond . . . . . . . . . . . . . . . . . . . . . . . . . . . . . . . . . 18% 19% 18% 19%
Fixed income . . . . . . . . . . . . . . . . . . . . . . . . . . . . . . . . . . . . . . . . . . 65% 71% 64% 71%
Other . . . . . . . . . . . . . . . . . . . . . . . . . . . . . . . . . . . . . . . . . . . . . . . 6% 2% 9% 2%
None of our common stock is held directly by these plans. In all cases, our investment strategy forthese plans is to earn a long-term rate of return consistent with an acceptable degree of risk and minimizeour cash contributions over the life of the plan, while taking into account the liquidity needs of the planand the legal requirements of the particular country. We preserve capital through diversified investmentsin high quality securities.
Asset allocation differs by plan based upon the plan’s Benefit Obligation to participants, as well as theresults of asset and liability studies that are conducted for each plan and in consideration of our future cashflow needs. Professional money management firms manage plan assets and we engage consultants in theU.K. and The Netherlands to assist in evaluation of these activities. The assets of the U.K. plans areoverseen by a group of Trustees who review the investment strategy, asset allocation and fund selection.These assets are passively managed as they are invested in index funds that attempt to match theperformance of the specified benchmark index. The assets of The Netherlands plan are independentlymanaged by an outside service provider.
101
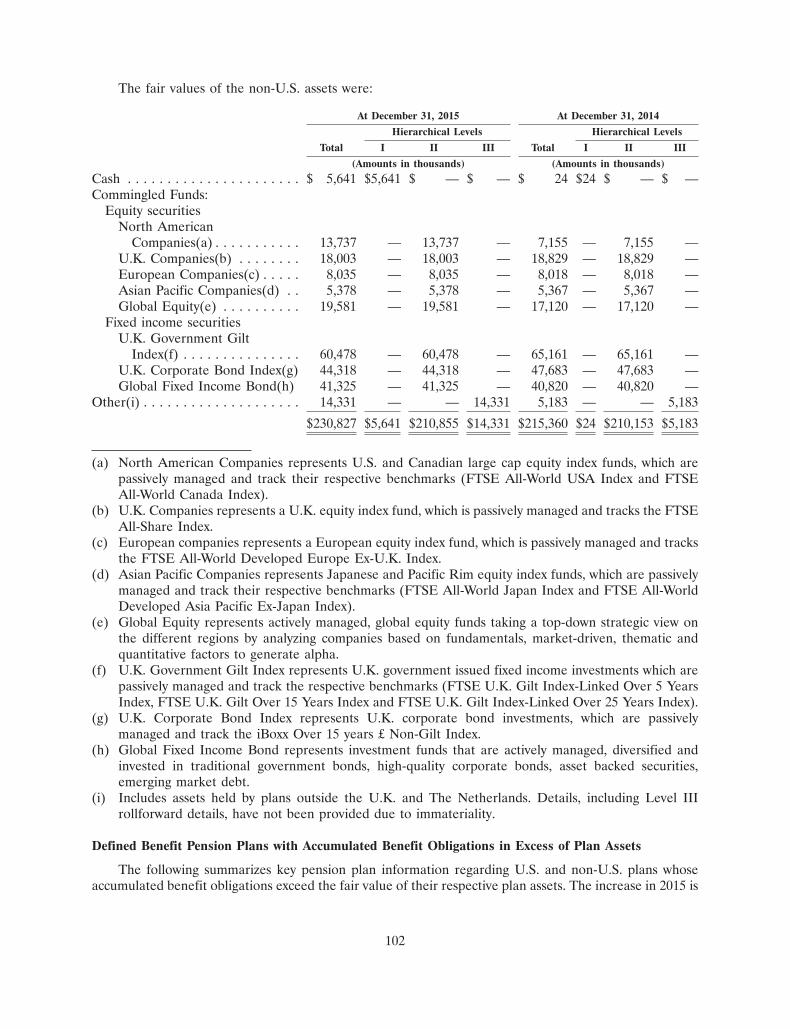
The fair values of the non-U.S. assets were:
At December 31, 2015 At December 31, 2014
Hierarchical Levels Hierarchical Levels
Total I II III Total I II III
(Amounts in thousands) (Amounts in thousands)
Cash . . . . . . . . . . . . . . . . . . . . . . $ 5,641 $5,641 $ — $ — $ 24 $24 $ — $ —Commingled Funds:
Equity securitiesNorth American
Companies(a) . . . . . . . . . . . 13,737 — 13,737 — 7,155 — 7,155 —U.K. Companies(b) . . . . . . . . 18,003 — 18,003 — 18,829 — 18,829 —European Companies(c) . . . . . 8,035 — 8,035 — 8,018 — 8,018 —Asian Pacific Companies(d) . . 5,378 — 5,378 — 5,367 — 5,367 —Global Equity(e) . . . . . . . . . . 19,581 — 19,581 — 17,120 — 17,120 —
Fixed income securitiesU.K. Government Gilt
Index(f) . . . . . . . . . . . . . . . 60,478 — 60,478 — 65,161 — 65,161 —U.K. Corporate Bond Index(g) 44,318 — 44,318 — 47,683 — 47,683 —Global Fixed Income Bond(h) 41,325 — 41,325 — 40,820 — 40,820 —
Other(i) . . . . . . . . . . . . . . . . . . . . 14,331 — — 14,331 5,183 — — 5,183
$230,827 $5,641 $210,855 $14,331 $215,360 $24 $210,153 $5,183
(a) North American Companies represents U.S. and Canadian large cap equity index funds, which arepassively managed and track their respective benchmarks (FTSE All-World USA Index and FTSEAll-World Canada Index).
(b) U.K. Companies represents a U.K. equity index fund, which is passively managed and tracks the FTSEAll-Share Index.
(c) European companies represents a European equity index fund, which is passively managed and tracksthe FTSE All-World Developed Europe Ex-U.K. Index.
(d) Asian Pacific Companies represents Japanese and Pacific Rim equity index funds, which are passivelymanaged and track their respective benchmarks (FTSE All-World Japan Index and FTSE All-WorldDeveloped Asia Pacific Ex-Japan Index).
(e) Global Equity represents actively managed, global equity funds taking a top-down strategic view onthe different regions by analyzing companies based on fundamentals, market-driven, thematic andquantitative factors to generate alpha.
(f) U.K. Government Gilt Index represents U.K. government issued fixed income investments which arepassively managed and track the respective benchmarks (FTSE U.K. Gilt Index-Linked Over 5 YearsIndex, FTSE U.K. Gilt Over 15 Years Index and FTSE U.K. Gilt Index-Linked Over 25 Years Index).
(g) U.K. Corporate Bond Index represents U.K. corporate bond investments, which are passivelymanaged and track the iBoxx Over 15 years £ Non-Gilt Index.
(h) Global Fixed Income Bond represents investment funds that are actively managed, diversified andinvested in traditional government bonds, high-quality corporate bonds, asset backed securities,emerging market debt.
(i) Includes assets held by plans outside the U.K. and The Netherlands. Details, including Level IIIrollforward details, have not been provided due to immateriality.
Defined Benefit Pension Plans with Accumulated Benefit Obligations in Excess of Plan Assets
The following summarizes key pension plan information regarding U.S. and non-U.S. plans whoseaccumulated benefit obligations exceed the fair value of their respective plan assets. The increase in 2015 is
102
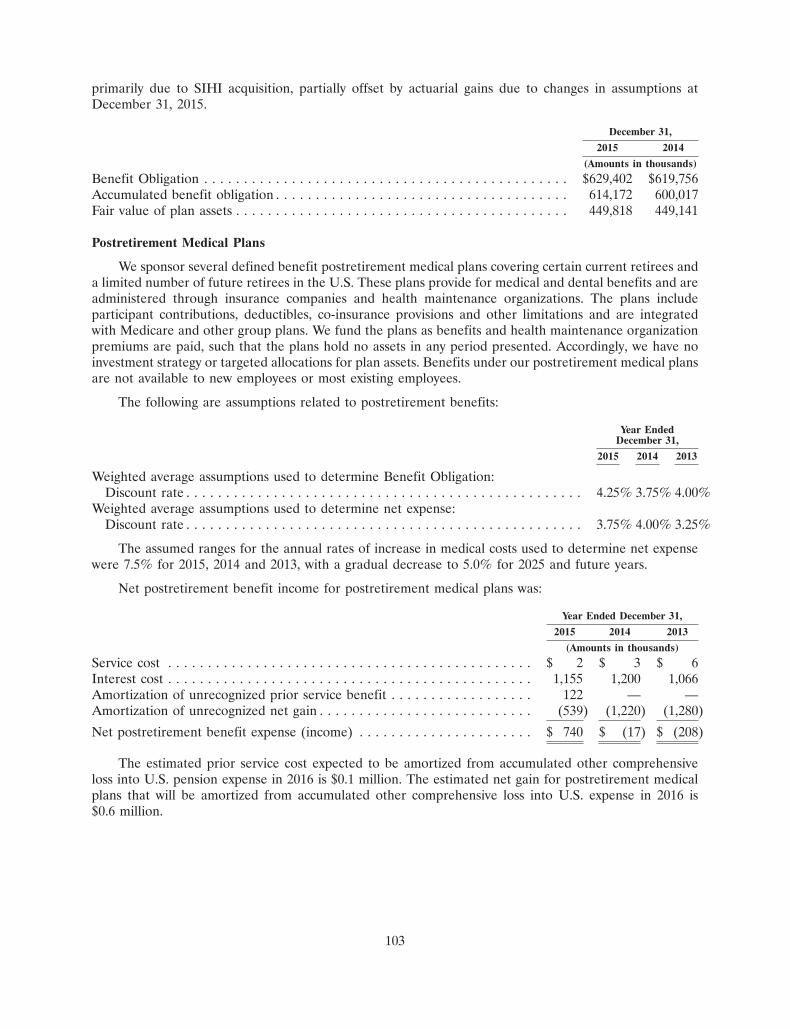
primarily due to SIHI acquisition, partially offset by actuarial gains due to changes in assumptions atDecember 31, 2015.
December 31,
2015 2014
(Amounts in thousands)
Benefit Obligation . . . . . . . . . . . . . . . . . . . . . . . . . . . . . . . . . . . . . . . . . . . . . . $629,402 $619,756Accumulated benefit obligation . . . . . . . . . . . . . . . . . . . . . . . . . . . . . . . . . . . . . 614,172 600,017Fair value of plan assets . . . . . . . . . . . . . . . . . . . . . . . . . . . . . . . . . . . . . . . . . . 449,818 449,141
Postretirement Medical Plans
We sponsor several defined benefit postretirement medical plans covering certain current retirees anda limited number of future retirees in the U.S. These plans provide for medical and dental benefits and areadministered through insurance companies and health maintenance organizations. The plans includeparticipant contributions, deductibles, co-insurance provisions and other limitations and are integratedwith Medicare and other group plans. We fund the plans as benefits and health maintenance organizationpremiums are paid, such that the plans hold no assets in any period presented. Accordingly, we have noinvestment strategy or targeted allocations for plan assets. Benefits under our postretirement medical plansare not available to new employees or most existing employees.
The following are assumptions related to postretirement benefits:
Year EndedDecember 31,
2015 2014 2013
Weighted average assumptions used to determine Benefit Obligation:Discount rate . . . . . . . . . . . . . . . . . . . . . . . . . . . . . . . . . . . . . . . . . . . . . . . . . . 4.25% 3.75% 4.00%
Weighted average assumptions used to determine net expense:Discount rate . . . . . . . . . . . . . . . . . . . . . . . . . . . . . . . . . . . . . . . . . . . . . . . . . . 3.75% 4.00% 3.25%
The assumed ranges for the annual rates of increase in medical costs used to determine net expensewere 7.5% for 2015, 2014 and 2013, with a gradual decrease to 5.0% for 2025 and future years.
Net postretirement benefit income for postretirement medical plans was:
Year Ended December 31,
2015 2014 2013
(Amounts in thousands)
Service cost . . . . . . . . . . . . . . . . . . . . . . . . . . . . . . . . . . . . . . . . . . . . . . $ 2 $ 3 $ 6Interest cost . . . . . . . . . . . . . . . . . . . . . . . . . . . . . . . . . . . . . . . . . . . . . . 1,155 1,200 1,066Amortization of unrecognized prior service benefit . . . . . . . . . . . . . . . . . . 122 — —Amortization of unrecognized net gain . . . . . . . . . . . . . . . . . . . . . . . . . . . (539) (1,220) (1,280)
Net postretirement benefit expense (income) . . . . . . . . . . . . . . . . . . . . . . $ 740 $ (17) $ (208)
The estimated prior service cost expected to be amortized from accumulated other comprehensiveloss into U.S. pension expense in 2016 is $0.1 million. The estimated net gain for postretirement medicalplans that will be amortized from accumulated other comprehensive loss into U.S. expense in 2016 is$0.6 million.
103
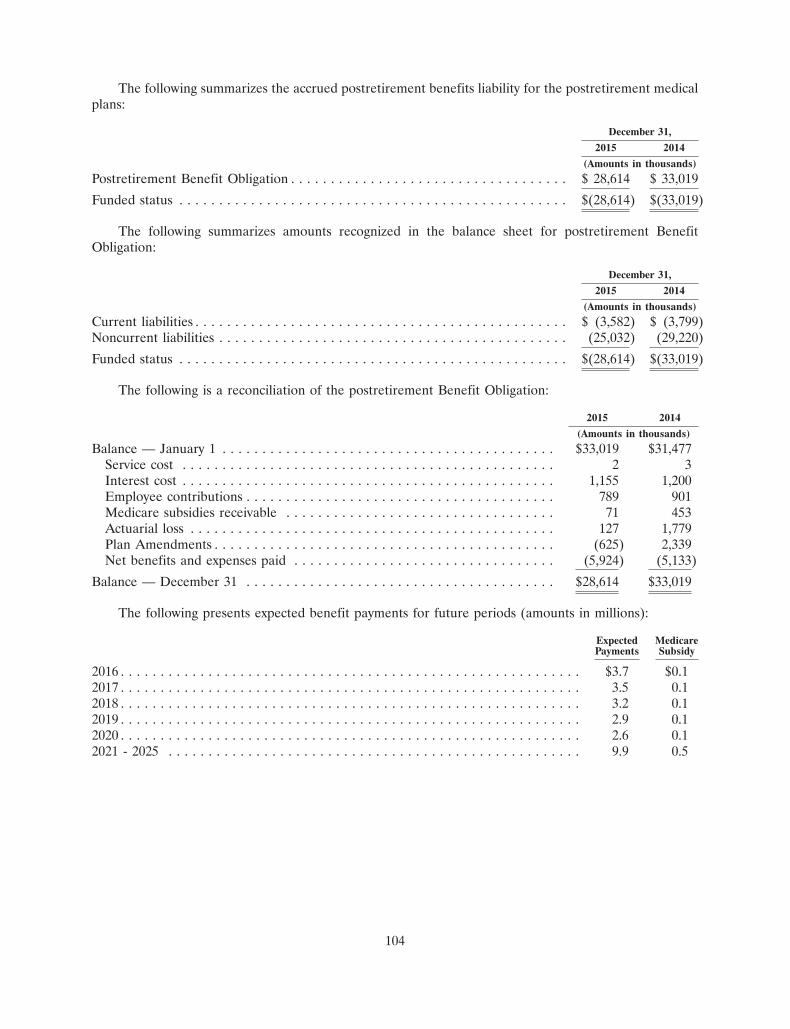
The following summarizes the accrued postretirement benefits liability for the postretirement medicalplans:
December 31,
2015 2014
(Amounts in thousands)
Postretirement Benefit Obligation . . . . . . . . . . . . . . . . . . . . . . . . . . . . . . . . . . . $ 28,614 $ 33,019
Funded status . . . . . . . . . . . . . . . . . . . . . . . . . . . . . . . . . . . . . . . . . . . . . . . . . $(28,614) $(33,019)
The following summarizes amounts recognized in the balance sheet for postretirement BenefitObligation:
December 31,
2015 2014
(Amounts in thousands)
Current liabilities . . . . . . . . . . . . . . . . . . . . . . . . . . . . . . . . . . . . . . . . . . . . . . . $ (3,582) $ (3,799)Noncurrent liabilities . . . . . . . . . . . . . . . . . . . . . . . . . . . . . . . . . . . . . . . . . . . . (25,032) (29,220)
Funded status . . . . . . . . . . . . . . . . . . . . . . . . . . . . . . . . . . . . . . . . . . . . . . . . . $(28,614) $(33,019)
The following is a reconciliation of the postretirement Benefit Obligation:
2015 2014
(Amounts in thousands)
Balance — January 1 . . . . . . . . . . . . . . . . . . . . . . . . . . . . . . . . . . . . . . . . . . $33,019 $31,477Service cost . . . . . . . . . . . . . . . . . . . . . . . . . . . . . . . . . . . . . . . . . . . . . . . 2 3Interest cost . . . . . . . . . . . . . . . . . . . . . . . . . . . . . . . . . . . . . . . . . . . . . . . 1,155 1,200Employee contributions . . . . . . . . . . . . . . . . . . . . . . . . . . . . . . . . . . . . . . . 789 901Medicare subsidies receivable . . . . . . . . . . . . . . . . . . . . . . . . . . . . . . . . . . 71 453Actuarial loss . . . . . . . . . . . . . . . . . . . . . . . . . . . . . . . . . . . . . . . . . . . . . . 127 1,779Plan Amendments . . . . . . . . . . . . . . . . . . . . . . . . . . . . . . . . . . . . . . . . . . . (625) 2,339Net benefits and expenses paid . . . . . . . . . . . . . . . . . . . . . . . . . . . . . . . . . (5,924) (5,133)
Balance — December 31 . . . . . . . . . . . . . . . . . . . . . . . . . . . . . . . . . . . . . . . $28,614 $33,019
The following presents expected benefit payments for future periods (amounts in millions):
Expected MedicarePayments Subsidy
2016 . . . . . . . . . . . . . . . . . . . . . . . . . . . . . . . . . . . . . . . . . . . . . . . . . . . . . . . . . . $3.7 $0.12017 . . . . . . . . . . . . . . . . . . . . . . . . . . . . . . . . . . . . . . . . . . . . . . . . . . . . . . . . . . 3.5 0.12018 . . . . . . . . . . . . . . . . . . . . . . . . . . . . . . . . . . . . . . . . . . . . . . . . . . . . . . . . . . 3.2 0.12019 . . . . . . . . . . . . . . . . . . . . . . . . . . . . . . . . . . . . . . . . . . . . . . . . . . . . . . . . . . 2.9 0.12020 . . . . . . . . . . . . . . . . . . . . . . . . . . . . . . . . . . . . . . . . . . . . . . . . . . . . . . . . . . 2.6 0.12021 - 2025 . . . . . . . . . . . . . . . . . . . . . . . . . . . . . . . . . . . . . . . . . . . . . . . . . . . . 9.9 0.5
104
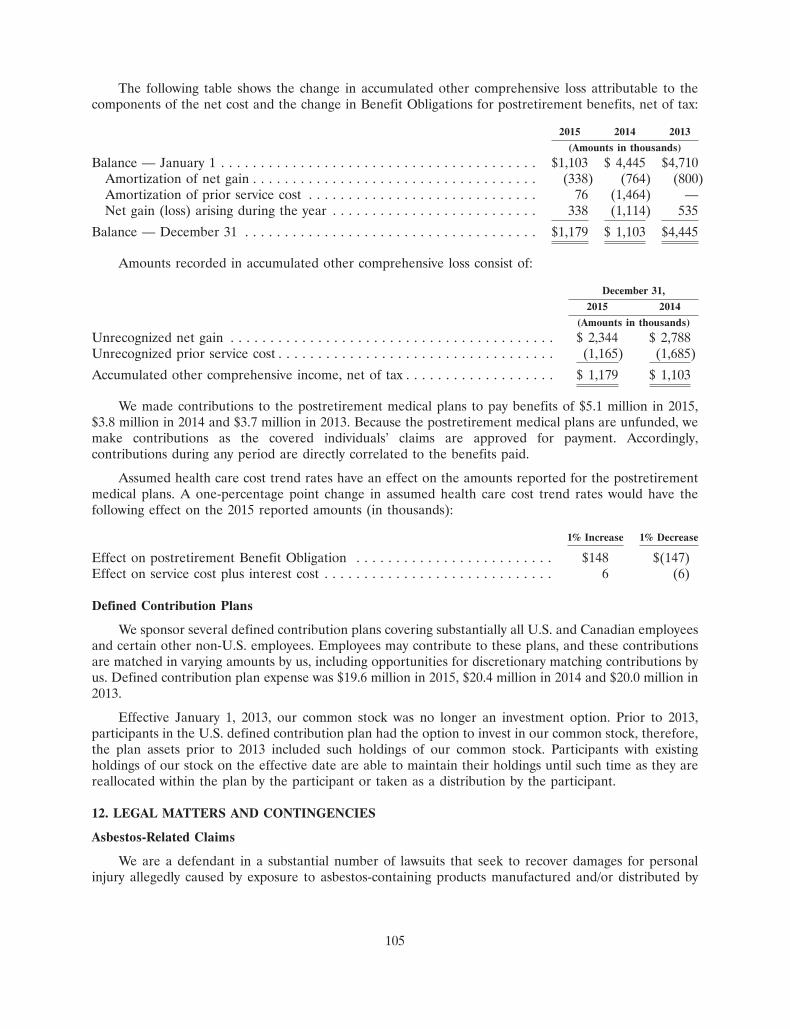
The following table shows the change in accumulated other comprehensive loss attributable to thecomponents of the net cost and the change in Benefit Obligations for postretirement benefits, net of tax:
2015 2014 2013
(Amounts in thousands)
Balance — January 1 . . . . . . . . . . . . . . . . . . . . . . . . . . . . . . . . . . . . . . . . $1,103 $ 4,445 $4,710Amortization of net gain . . . . . . . . . . . . . . . . . . . . . . . . . . . . . . . . . . . . (338) (764) (800)Amortization of prior service cost . . . . . . . . . . . . . . . . . . . . . . . . . . . . . 76 (1,464) —Net gain (loss) arising during the year . . . . . . . . . . . . . . . . . . . . . . . . . . 338 (1,114) 535
Balance — December 31 . . . . . . . . . . . . . . . . . . . . . . . . . . . . . . . . . . . . . $1,179 $ 1,103 $4,445
Amounts recorded in accumulated other comprehensive loss consist of:
December 31,
2015 2014
(Amounts in thousands)
Unrecognized net gain . . . . . . . . . . . . . . . . . . . . . . . . . . . . . . . . . . . . . . . . . $ 2,344 $ 2,788Unrecognized prior service cost . . . . . . . . . . . . . . . . . . . . . . . . . . . . . . . . . . . (1,165) (1,685)
Accumulated other comprehensive income, net of tax . . . . . . . . . . . . . . . . . . . $ 1,179 $ 1,103
We made contributions to the postretirement medical plans to pay benefits of $5.1 million in 2015,$3.8 million in 2014 and $3.7 million in 2013. Because the postretirement medical plans are unfunded, wemake contributions as the covered individuals’ claims are approved for payment. Accordingly,contributions during any period are directly correlated to the benefits paid.
Assumed health care cost trend rates have an effect on the amounts reported for the postretirementmedical plans. A one-percentage point change in assumed health care cost trend rates would have thefollowing effect on the 2015 reported amounts (in thousands):
1% Increase 1% Decrease
Effect on postretirement Benefit Obligation . . . . . . . . . . . . . . . . . . . . . . . . . $148 $(147)Effect on service cost plus interest cost . . . . . . . . . . . . . . . . . . . . . . . . . . . . . 6 (6)
Defined Contribution Plans
We sponsor several defined contribution plans covering substantially all U.S. and Canadian employeesand certain other non-U.S. employees. Employees may contribute to these plans, and these contributionsare matched in varying amounts by us, including opportunities for discretionary matching contributions byus. Defined contribution plan expense was $19.6 million in 2015, $20.4 million in 2014 and $20.0 million in2013.
Effective January 1, 2013, our common stock was no longer an investment option. Prior to 2013,participants in the U.S. defined contribution plan had the option to invest in our common stock, therefore,the plan assets prior to 2013 included such holdings of our common stock. Participants with existingholdings of our stock on the effective date are able to maintain their holdings until such time as they arereallocated within the plan by the participant or taken as a distribution by the participant.
12. LEGAL MATTERS AND CONTINGENCIES
Asbestos-Related Claims
We are a defendant in a substantial number of lawsuits that seek to recover damages for personalinjury allegedly caused by exposure to asbestos-containing products manufactured and/or distributed by
105
our heritage companies in the past. While the overall number of asbestos-related claims has generallydeclined in recent years, there can be no assurance that this trend will continue, or that the average costper claim will not further increase. Asbestos-containing materials incorporated into any such productswere encapsulated and used as internal components of process equipment, and we do not believe that anysignificant emission of asbestos fibers occurred during the use of this equipment.
Our practice is to vigorously contest and resolve these claims, and we have been successful in resolvinga majority of claims with little or no payment. Historically, a high percentage of resolved claims have beencovered by applicable insurance or indemnities from other companies, and we believe that a substantialmajority of existing claims should continue to be covered by insurance or indemnities. Accordingly, wehave recorded a liability for our estimate of the most likely settlement of asserted claims and a relatedreceivable from insurers or other companies for our estimated recovery, to the extent we believe that theamounts of recovery are probable and not otherwise in dispute. While unfavorable rulings, judgments orsettlement terms regarding these claims could have a material adverse impact on our business, financialcondition, results of operations and cash flows, we currently believe the likelihood is remote.
Additionally, we have claims pending against certain insurers that, if resolved more favorably thanreflected in the recorded receivables, would result in discrete gains in the applicable quarter. We arecurrently unable to estimate the impact, if any, of unasserted asbestos-related claims, although futureclaims would also be subject to then existing indemnities and insurance coverage.
United Nations Oil-for-Food Program
In mid-2006, the French authorities began an investigation of over 170 French companies, of whichone of our French subsidiaries was included, concerning suspected inappropriate activities conducted inconnection with the United Nations Oil for Food Program. As previously disclosed, the Frenchinvestigation of our French subsidiary was formally opened in the first quarter of 2010, and our Frenchsubsidiary filed a formal response with the French court. In July 2012, the French court ruled against ourprocedural motions to challenge the constitutionality of the charges and quash the indictment. Hearingsoccurred on April 1-2, 2015, and the Company presented its defense and closing arguments. On June 18,2015, the French court issued its ruling dismissing the case against the Company and the other defendants.However, on July 1, 2015, the French prosecutor lodged an appeal. We currently do not expect to incuradditional case resolution costs of a material amount in this matter. However, if the French authoritiesultimately take enforcement action against our French subsidiary regarding its investigation, we may besubject to monetary and non-monetary penalties, which we currently do not believe will have a materialadverse financial impact on our company.
Other
We are currently involved as a potentially responsible party at five former public waste disposal sites invarious stages of evaluation or remediation. The projected cost of remediation at these sites, as well as ouralleged ‘‘fair share’’ allocation, will remain uncertain until all studies have been completed and the partieshave either negotiated an amicable resolution or the matter has been judicially resolved. At each site, thereare many other parties who have similarly been identified. Many of the other parties identified arefinancially strong and solvent companies that appear able to pay their share of the remediation costs.Based on our information about the waste disposal practices at these sites and the environmentalregulatory process in general, we believe that it is likely that ultimate remediation liability costs for eachsite will be apportioned among all liable parties, including site owners and waste transporters, according tothe volumes and/or toxicity of the wastes shown to have been disposed of at the sites. We believe that ourfinancial exposure for existing disposal sites will not be materially in excess of accrued reserves.
As previously disclosed, we terminated an employee of an overseas subsidiary after uncovering actionsthat violated our Code of Business Conduct and may have violated the Foreign Corrupt Practices Act. We
106
completed our internal investigation into the matter, self-reported the potential violation to the UnitedStates Department of Justice (the ‘‘DOJ’’) and the SEC, and continue to cooperate with the DOJ andSEC. We previously received a subpoena from the SEC requesting additional information anddocumentation related to the matter and are in the process of responding. We currently believe that thismatter will not have a material adverse financial impact on the Company, but there can be no assurancethat the Company will not be subjected to monetary penalties and additional costs.
We are also a defendant in a number of other lawsuits, including product liability claims, that areinsured, subject to the applicable deductibles, arising in the ordinary course of business, and we are alsoinvolved in other uninsured routine litigation incidental to our business. We currently believe none of suchlitigation, either individually or in the aggregate, is material to our business, operations or overall financialcondition. However, litigation is inherently unpredictable, and resolutions or dispositions of claims orlawsuits by settlement or otherwise could have an adverse impact on our financial position, results ofoperations or cash flows for the reporting period in which any such resolution or disposition occurs.
Although none of the aforementioned potential liabilities can be quantified with absolute certaintyexcept as otherwise indicated above, we have established reserves covering exposures relating tocontingencies, to the extent believed to be reasonably estimable and probable based on past experienceand available facts. While additional exposures beyond these reserves could exist, they currently cannot beestimated. We will continue to evaluate and update the reserves as necessary and appropriate.
13. WARRANTY RESERVE
We have recorded reserves for product warranty claims that are included in current liabilities. Thefollowing is a summary of the activity in the warranty reserve:
2015 2014 2013
(Amounts in thousands)
Balance — January 1 . . . . . . . . . . . . . . . . . . . . . . . . . . . . . . . . . . . . $ 31,095 $ 37,828 $ 35,400Accruals for warranty expense, net of adjustments . . . . . . . . . . . . . . 33,113 24,909 33,504Settlements made . . . . . . . . . . . . . . . . . . . . . . . . . . . . . . . . . . . . . (29,634) (31,642) (31,076)
Balance — December 31 . . . . . . . . . . . . . . . . . . . . . . . . . . . . . . . . . $ 34,574 $ 31,095 $ 37,828
14. SHAREHOLDERS’ EQUITY
Stock Split — On May 23, 2013, our certificate of incorporation was amended to increase the numberof authorized shares of common stock from $120.0 million to $305.0 million and enable a three-for-onestock split approved by the Board of Directors on February 7, 2013 in the form of a 200% common stockdividend. The record date for the stock split was June 7, 2013, and additional shares were distributed onJune 21, 2013. As a result of the three-for-one stock split, 117,861,772 shares of common stock were issued.The par value of the common stock remained unchanged at $1.25 per share, which required $147.3 millionto be retrospectively reclassified from capital in excess of par value to common shares all within theshareholders’ equity section of our consolidated balance sheets. For periods prior to 2013, shareholders’equity and all share data, including treasury shares and stock-based compensation award shares, and pershare data presented herein have been retrospectively adjusted to reflect the impact of the increase inauthorized shares and the stock split, as appropriate.
107
Dividends — On February 15, 2016, our Board of Directors authorized an increase in the payment ofquarterly dividends on our common stock from $0.18 per share to $0.19 per share payable beginning onApril 8, 2016. On February 16, 2015, our Board of Directors authorized an increase in the payment ofquarterly dividends on our common stock from $0.16 per share to $0.18 per share payable beginning onApril 10, 2015. On February 17, 2014, our Board of Directors authorized an increase in the payment ofquarterly dividends on our common stock from $0.14 per share to $0.16 per share payable beginning onApril 11, 2014. On February 19, 2013, our Board of Directors authorized an increase in the payment ofquarterly dividends on our common stock from $0.12 per share to $0.14 per share payable beginning onApril 12, 2013. Generally, our dividend date-of-record is in the last month of the quarter, and the dividendis paid the following month. Any subsequent dividends will be reviewed by our Board of Directors anddeclared at its discretion dependent on its assessment of our financial situation and business outlook at theapplicable time.
Share Repurchase Program — On November 13, 2014, our Board of Directors approved a$500.0 million share repurchase authorization, which included approximately $175 million of remainingcapacity under the prior $750.0 million share repurchase authorization. Our share repurchase programdoes not have an expiration date, and we reserve the right to limit or terminate the repurchase program atanytime without notice.
We repurchased 6,047,839, 3,420,656 and 8,142,723 shares for $303.7 million, $246.5 million and$458.3 million during 2015, 2014 and 2013, respectively. As of December 31, 2015, we have $160.7 millionof remaining capacity under our current share repurchase program.
15. INCOME TAXES
The provision for income taxes consists of the following:
Year Ended December 31,
2015 2014 2013
(Amounts in thousands)
Current:U.S. federal . . . . . . . . . . . . . . . . . . . . . . . . . . . . . . . . . . . . . . . . . $ 62,032 $ 62,301 $ 61,670Non-U.S. . . . . . . . . . . . . . . . . . . . . . . . . . . . . . . . . . . . . . . . . . . 78,489 123,052 112,471State and local . . . . . . . . . . . . . . . . . . . . . . . . . . . . . . . . . . . . . . . 4,947 7,422 7,537
Total current . . . . . . . . . . . . . . . . . . . . . . . . . . . . . . . . . . . . . . 145,468 192,775 181,678Deferred:
U.S. federal . . . . . . . . . . . . . . . . . . . . . . . . . . . . . . . . . . . . . . . . . (3,509) 1,270 8,771Non-U.S. . . . . . . . . . . . . . . . . . . . . . . . . . . . . . . . . . . . . . . . . . . 5,543 13,016 13,120State and local . . . . . . . . . . . . . . . . . . . . . . . . . . . . . . . . . . . . . . . 1,420 1,244 1,132
Total deferred . . . . . . . . . . . . . . . . . . . . . . . . . . . . . . . . . . . . . 3,454 15,530 23,023
Total provision . . . . . . . . . . . . . . . . . . . . . . . . . . . . . . . . . . . . . . . . $148,922 $208,305 $204,701
The expected cash payments for the current income tax expense for 2015, 2014 and 2013 were reducedby $6.4 million, $8.6 million and $10.1 million, respectively, as a result of tax deductions related to thevesting of restricted stock and the exercise of non-qualified employee stock options. The income taxbenefit resulting from these stock-based compensation plans has increased capital in excess of par value.
108
The provision for income taxes differs from the statutory corporate rate due to the following:
Year Ended December 31,
2015 2014 2013
(Amounts in millions)
Statutory federal income tax at 35% . . . . . . . . . . . . . . . . . . . . . . . . . . . . $147.8 $256.6 $242.6Foreign impact, net . . . . . . . . . . . . . . . . . . . . . . . . . . . . . . . . . . . . . . . . (25.1) (57.1) (42.5)Change in valuation allowance . . . . . . . . . . . . . . . . . . . . . . . . . . . . . . . . 11.6 (1.6) 1.8State and local income taxes, net . . . . . . . . . . . . . . . . . . . . . . . . . . . . . . . 6.4 8.7 8.7Other . . . . . . . . . . . . . . . . . . . . . . . . . . . . . . . . . . . . . . . . . . . . . . . . . . 8.2 1.7 (5.9)
Total . . . . . . . . . . . . . . . . . . . . . . . . . . . . . . . . . . . . . . . . . . . . . . . . . . . $148.9 $208.3 $204.7
Effective tax rate . . . . . . . . . . . . . . . . . . . . . . . . . . . . . . . . . . . . . . . . . . 35.3% 28.4% 29.5%
The 2015 tax rate differed from the federal statutory rate of 35% primarily due to tax impacts of therealignment programs, the non-deductible Venezuelan exchange rate remeasurement loss and theestablishment of a valuation allowance against our deferred tax assets in Brazil in the amount of$12.6 million (due to deteriorating economic conditions in Brazil), substantially offset by the net impact offoreign operations, which included the impacts of lower foreign tax rates and changes in our reservesestablished for uncertain tax positions. The 2014 and 2013 effective tax rates differed from the federalstatutory rate of 35% primarily due to the net impact of foreign operations, which included the impacts oflower foreign tax rates and changes in our reserves established for uncertain tax positions.
We assert permanent reinvestment on the majority of invested capital and unremitted foreign earningsin our foreign subsidiaries. However, we do not assert permanent reinvestment on a limited number offoreign subsidiaries where future distributions may occur. The cumulative amount of undistributedearnings considered permanently reinvested is $1.5 billion. Should these permanently reinvested earningsbe repatriated in a future period in the form of dividends or otherwise, our provision for income taxes mayincrease materially in that period. Quantification of the deferred tax liability, if any, associated withindefinitely reinvested differences is not practicable due to the complexities with its hypotheticalcalculation. During each of the three years reported in the period ended December 31, 2015, we have notrecognized any net deferred tax assets attributable to excess foreign tax credits on unremitted earnings orforeign currency translation adjustments in our foreign subsidiaries with excess financial reporting basis.
For those subsidiaries where permanent reinvestment was not asserted, we had cash and deemeddividend distributions that resulted in the recognition of $2.4 million of income tax benefit during 2015 and$6.9 million and $5.0 million of income tax expense in 2014 and 2013, respectively. As we have notrecorded a benefit for the excess foreign tax credits associated with deemed repatriation of unremittedearnings, these credits are not available to offset the liability associated with these dividends.
109
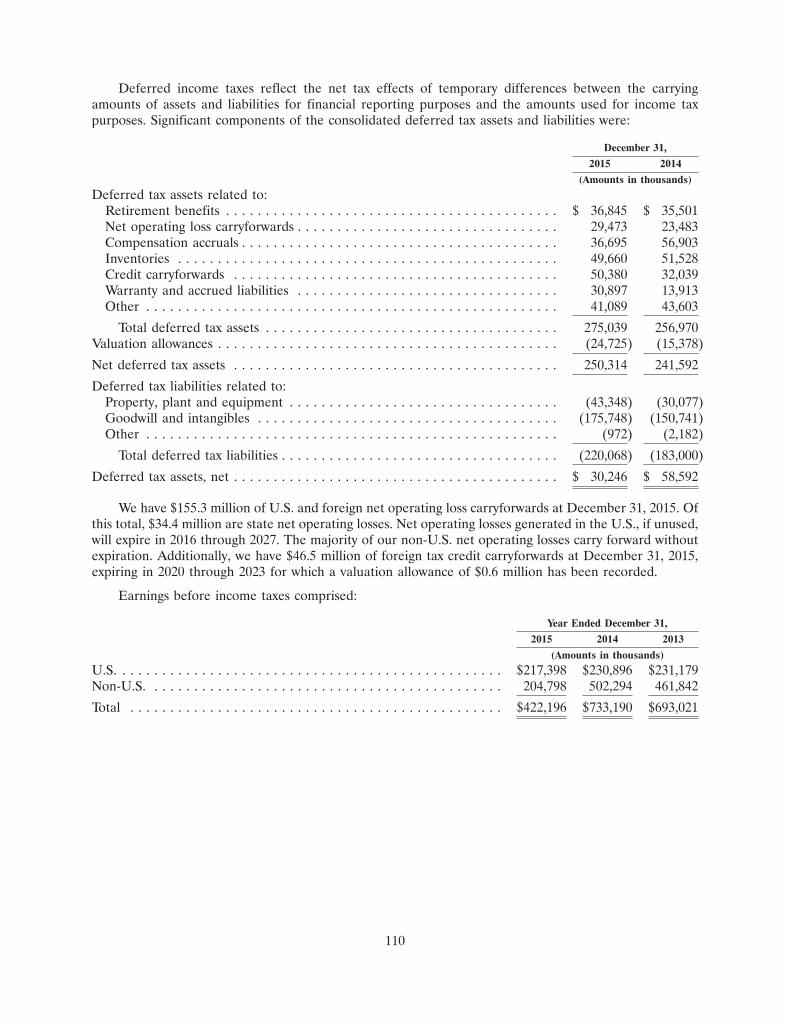
Deferred income taxes reflect the net tax effects of temporary differences between the carryingamounts of assets and liabilities for financial reporting purposes and the amounts used for income taxpurposes. Significant components of the consolidated deferred tax assets and liabilities were:
December 31,
2015 2014
(Amounts in thousands)
Deferred tax assets related to:Retirement benefits . . . . . . . . . . . . . . . . . . . . . . . . . . . . . . . . . . . . . . . . . . $ 36,845 $ 35,501Net operating loss carryforwards . . . . . . . . . . . . . . . . . . . . . . . . . . . . . . . . . 29,473 23,483Compensation accruals . . . . . . . . . . . . . . . . . . . . . . . . . . . . . . . . . . . . . . . . 36,695 56,903Inventories . . . . . . . . . . . . . . . . . . . . . . . . . . . . . . . . . . . . . . . . . . . . . . . . 49,660 51,528Credit carryforwards . . . . . . . . . . . . . . . . . . . . . . . . . . . . . . . . . . . . . . . . . 50,380 32,039Warranty and accrued liabilities . . . . . . . . . . . . . . . . . . . . . . . . . . . . . . . . . 30,897 13,913Other . . . . . . . . . . . . . . . . . . . . . . . . . . . . . . . . . . . . . . . . . . . . . . . . . . . . 41,089 43,603
Total deferred tax assets . . . . . . . . . . . . . . . . . . . . . . . . . . . . . . . . . . . . . 275,039 256,970Valuation allowances . . . . . . . . . . . . . . . . . . . . . . . . . . . . . . . . . . . . . . . . . . . (24,725) (15,378)
Net deferred tax assets . . . . . . . . . . . . . . . . . . . . . . . . . . . . . . . . . . . . . . . . . 250,314 241,592
Deferred tax liabilities related to:Property, plant and equipment . . . . . . . . . . . . . . . . . . . . . . . . . . . . . . . . . . (43,348) (30,077)Goodwill and intangibles . . . . . . . . . . . . . . . . . . . . . . . . . . . . . . . . . . . . . . (175,748) (150,741)Other . . . . . . . . . . . . . . . . . . . . . . . . . . . . . . . . . . . . . . . . . . . . . . . . . . . . (972) (2,182)
Total deferred tax liabilities . . . . . . . . . . . . . . . . . . . . . . . . . . . . . . . . . . . (220,068) (183,000)
Deferred tax assets, net . . . . . . . . . . . . . . . . . . . . . . . . . . . . . . . . . . . . . . . . . $ 30,246 $ 58,592
We have $155.3 million of U.S. and foreign net operating loss carryforwards at December 31, 2015. Ofthis total, $34.4 million are state net operating losses. Net operating losses generated in the U.S., if unused,will expire in 2016 through 2027. The majority of our non-U.S. net operating losses carry forward withoutexpiration. Additionally, we have $46.5 million of foreign tax credit carryforwards at December 31, 2015,expiring in 2020 through 2023 for which a valuation allowance of $0.6 million has been recorded.
Earnings before income taxes comprised:
Year Ended December 31,
2015 2014 2013
(Amounts in thousands)
U.S. . . . . . . . . . . . . . . . . . . . . . . . . . . . . . . . . . . . . . . . . . . . . . . . . $217,398 $230,896 $231,179Non-U.S. . . . . . . . . . . . . . . . . . . . . . . . . . . . . . . . . . . . . . . . . . . . . 204,798 502,294 461,842
Total . . . . . . . . . . . . . . . . . . . . . . . . . . . . . . . . . . . . . . . . . . . . . . . $422,196 $733,190 $693,021
110
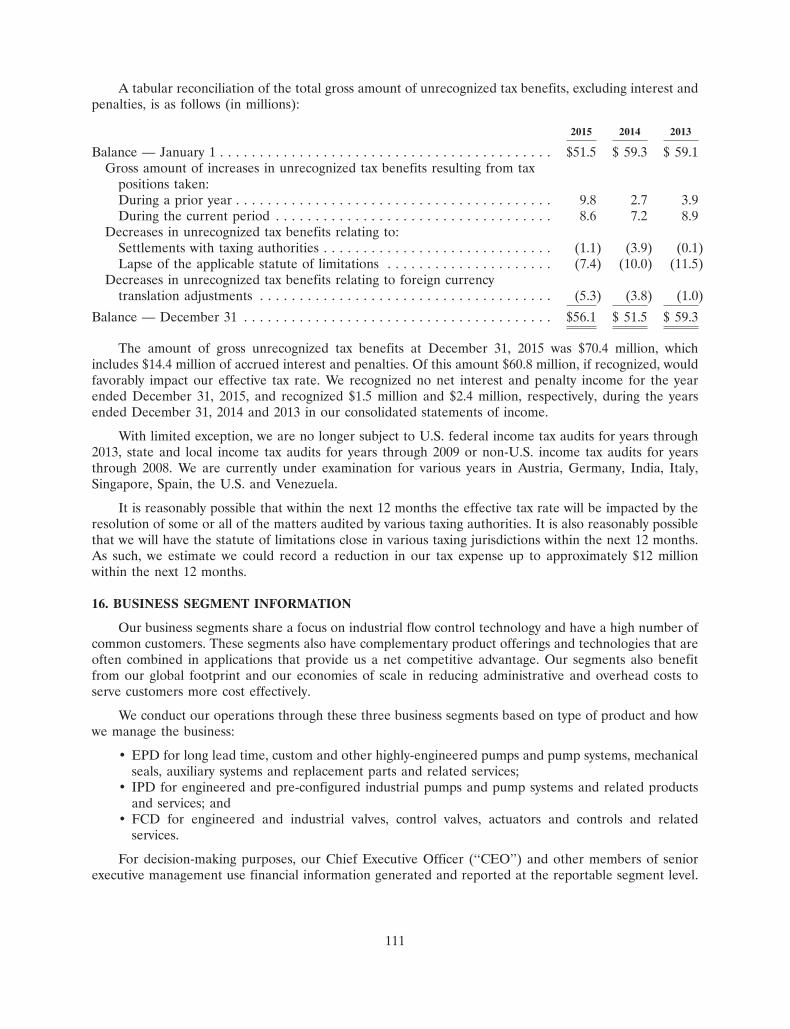
A tabular reconciliation of the total gross amount of unrecognized tax benefits, excluding interest andpenalties, is as follows (in millions):
2015 2014 2013
Balance — January 1 . . . . . . . . . . . . . . . . . . . . . . . . . . . . . . . . . . . . . . . . . . $51.5 $ 59.3 $ 59.1Gross amount of increases in unrecognized tax benefits resulting from tax
positions taken:During a prior year . . . . . . . . . . . . . . . . . . . . . . . . . . . . . . . . . . . . . . . . 9.8 2.7 3.9During the current period . . . . . . . . . . . . . . . . . . . . . . . . . . . . . . . . . . . 8.6 7.2 8.9
Decreases in unrecognized tax benefits relating to:Settlements with taxing authorities . . . . . . . . . . . . . . . . . . . . . . . . . . . . . (1.1) (3.9) (0.1)Lapse of the applicable statute of limitations . . . . . . . . . . . . . . . . . . . . . (7.4) (10.0) (11.5)
Decreases in unrecognized tax benefits relating to foreign currencytranslation adjustments . . . . . . . . . . . . . . . . . . . . . . . . . . . . . . . . . . . . . (5.3) (3.8) (1.0)
Balance — December 31 . . . . . . . . . . . . . . . . . . . . . . . . . . . . . . . . . . . . . . . $56.1 $ 51.5 $ 59.3
The amount of gross unrecognized tax benefits at December 31, 2015 was $70.4 million, whichincludes $14.4 million of accrued interest and penalties. Of this amount $60.8 million, if recognized, wouldfavorably impact our effective tax rate. We recognized no net interest and penalty income for the yearended December 31, 2015, and recognized $1.5 million and $2.4 million, respectively, during the yearsended December 31, 2014 and 2013 in our consolidated statements of income.
With limited exception, we are no longer subject to U.S. federal income tax audits for years through2013, state and local income tax audits for years through 2009 or non-U.S. income tax audits for yearsthrough 2008. We are currently under examination for various years in Austria, Germany, India, Italy,Singapore, Spain, the U.S. and Venezuela.
It is reasonably possible that within the next 12 months the effective tax rate will be impacted by theresolution of some or all of the matters audited by various taxing authorities. It is also reasonably possiblethat we will have the statute of limitations close in various taxing jurisdictions within the next 12 months.As such, we estimate we could record a reduction in our tax expense up to approximately $12 millionwithin the next 12 months.
16. BUSINESS SEGMENT INFORMATION
Our business segments share a focus on industrial flow control technology and have a high number ofcommon customers. These segments also have complementary product offerings and technologies that areoften combined in applications that provide us a net competitive advantage. Our segments also benefitfrom our global footprint and our economies of scale in reducing administrative and overhead costs toserve customers more cost effectively.
We conduct our operations through these three business segments based on type of product and howwe manage the business:
• EPD for long lead time, custom and other highly-engineered pumps and pump systems, mechanicalseals, auxiliary systems and replacement parts and related services;
• IPD for engineered and pre-configured industrial pumps and pump systems and related productsand services; and
• FCD for engineered and industrial valves, control valves, actuators and controls and relatedservices.
For decision-making purposes, our Chief Executive Officer (‘‘CEO’’) and other members of seniorexecutive management use financial information generated and reported at the reportable segment level.
111
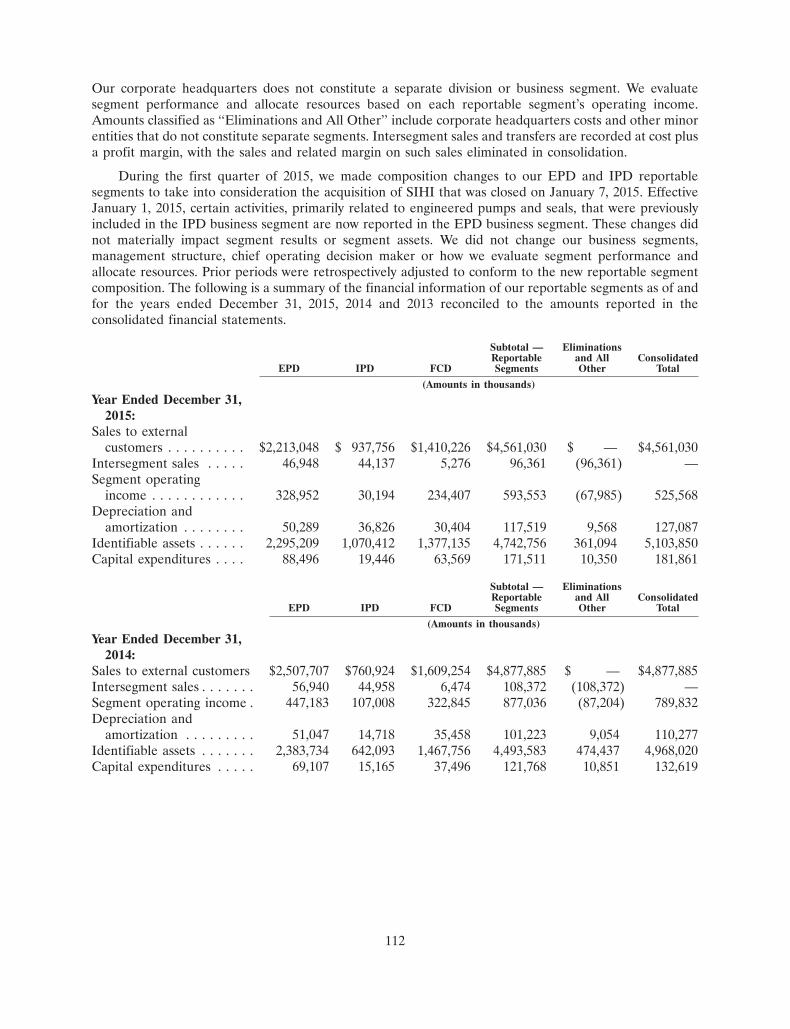
Our corporate headquarters does not constitute a separate division or business segment. We evaluatesegment performance and allocate resources based on each reportable segment’s operating income.Amounts classified as ‘‘Eliminations and All Other’’ include corporate headquarters costs and other minorentities that do not constitute separate segments. Intersegment sales and transfers are recorded at cost plusa profit margin, with the sales and related margin on such sales eliminated in consolidation.
During the first quarter of 2015, we made composition changes to our EPD and IPD reportablesegments to take into consideration the acquisition of SIHI that was closed on January 7, 2015. EffectiveJanuary 1, 2015, certain activities, primarily related to engineered pumps and seals, that were previouslyincluded in the IPD business segment are now reported in the EPD business segment. These changes didnot materially impact segment results or segment assets. We did not change our business segments,management structure, chief operating decision maker or how we evaluate segment performance andallocate resources. Prior periods were retrospectively adjusted to conform to the new reportable segmentcomposition. The following is a summary of the financial information of our reportable segments as of andfor the years ended December 31, 2015, 2014 and 2013 reconciled to the amounts reported in theconsolidated financial statements.
Subtotal — EliminationsReportable and All Consolidated
EPD IPD FCD Segments Other Total
(Amounts in thousands)
Year Ended December 31,2015:
Sales to externalcustomers . . . . . . . . . . $2,213,048 $ 937,756 $1,410,226 $4,561,030 $ — $4,561,030
Intersegment sales . . . . . 46,948 44,137 5,276 96,361 (96,361) —Segment operating
income . . . . . . . . . . . . 328,952 30,194 234,407 593,553 (67,985) 525,568Depreciation and
amortization . . . . . . . . 50,289 36,826 30,404 117,519 9,568 127,087Identifiable assets . . . . . . 2,295,209 1,070,412 1,377,135 4,742,756 361,094 5,103,850Capital expenditures . . . . 88,496 19,446 63,569 171,511 10,350 181,861
Subtotal — EliminationsReportable and All Consolidated
EPD IPD FCD Segments Other Total
(Amounts in thousands)
Year Ended December 31,2014:
Sales to external customers $2,507,707 $760,924 $1,609,254 $4,877,885 $ — $4,877,885Intersegment sales . . . . . . . 56,940 44,958 6,474 108,372 (108,372) —Segment operating income . 447,183 107,008 322,845 877,036 (87,204) 789,832Depreciation and
amortization . . . . . . . . . 51,047 14,718 35,458 101,223 9,054 110,277Identifiable assets . . . . . . . 2,383,734 642,093 1,467,756 4,493,583 474,437 4,968,020Capital expenditures . . . . . 69,107 15,165 37,496 121,768 10,851 132,619
112
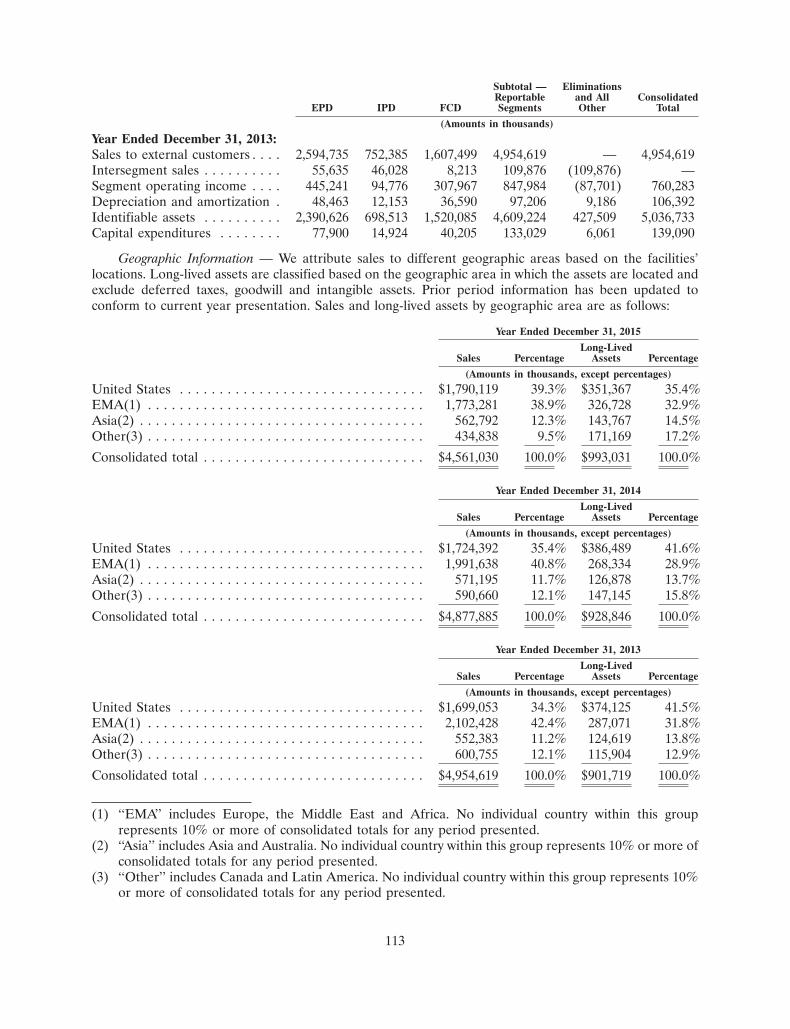
Subtotal — EliminationsReportable and All Consolidated
EPD IPD FCD Segments Other Total
(Amounts in thousands)
Year Ended December 31, 2013:Sales to external customers . . . . 2,594,735 752,385 1,607,499 4,954,619 — 4,954,619Intersegment sales . . . . . . . . . . 55,635 46,028 8,213 109,876 (109,876) —Segment operating income . . . . 445,241 94,776 307,967 847,984 (87,701) 760,283Depreciation and amortization . 48,463 12,153 36,590 97,206 9,186 106,392Identifiable assets . . . . . . . . . . 2,390,626 698,513 1,520,085 4,609,224 427,509 5,036,733Capital expenditures . . . . . . . . 77,900 14,924 40,205 133,029 6,061 139,090
Geographic Information — We attribute sales to different geographic areas based on the facilities’locations. Long-lived assets are classified based on the geographic area in which the assets are located andexclude deferred taxes, goodwill and intangible assets. Prior period information has been updated toconform to current year presentation. Sales and long-lived assets by geographic area are as follows:
Year Ended December 31, 2015
Long-LivedSales Percentage Assets Percentage
(Amounts in thousands, except percentages)
United States . . . . . . . . . . . . . . . . . . . . . . . . . . . . . . . $1,790,119 39.3% $351,367 35.4%EMA(1) . . . . . . . . . . . . . . . . . . . . . . . . . . . . . . . . . . . 1,773,281 38.9% 326,728 32.9%Asia(2) . . . . . . . . . . . . . . . . . . . . . . . . . . . . . . . . . . . . 562,792 12.3% 143,767 14.5%Other(3) . . . . . . . . . . . . . . . . . . . . . . . . . . . . . . . . . . . 434,838 9.5% 171,169 17.2%
Consolidated total . . . . . . . . . . . . . . . . . . . . . . . . . . . . $4,561,030 100.0% $993,031 100.0%
Year Ended December 31, 2014
Long-LivedSales Percentage Assets Percentage
(Amounts in thousands, except percentages)
United States . . . . . . . . . . . . . . . . . . . . . . . . . . . . . . . $1,724,392 35.4% $386,489 41.6%EMA(1) . . . . . . . . . . . . . . . . . . . . . . . . . . . . . . . . . . . 1,991,638 40.8% 268,334 28.9%Asia(2) . . . . . . . . . . . . . . . . . . . . . . . . . . . . . . . . . . . . 571,195 11.7% 126,878 13.7%Other(3) . . . . . . . . . . . . . . . . . . . . . . . . . . . . . . . . . . . 590,660 12.1% 147,145 15.8%
Consolidated total . . . . . . . . . . . . . . . . . . . . . . . . . . . . $4,877,885 100.0% $928,846 100.0%
Year Ended December 31, 2013
Long-LivedSales Percentage Assets Percentage
(Amounts in thousands, except percentages)
United States . . . . . . . . . . . . . . . . . . . . . . . . . . . . . . . $1,699,053 34.3% $374,125 41.5%EMA(1) . . . . . . . . . . . . . . . . . . . . . . . . . . . . . . . . . . . 2,102,428 42.4% 287,071 31.8%Asia(2) . . . . . . . . . . . . . . . . . . . . . . . . . . . . . . . . . . . . 552,383 11.2% 124,619 13.8%Other(3) . . . . . . . . . . . . . . . . . . . . . . . . . . . . . . . . . . . 600,755 12.1% 115,904 12.9%
Consolidated total . . . . . . . . . . . . . . . . . . . . . . . . . . . . $4,954,619 100.0% $901,719 100.0%
(1) ‘‘EMA’’ includes Europe, the Middle East and Africa. No individual country within this grouprepresents 10% or more of consolidated totals for any period presented.
(2) ‘‘Asia’’ includes Asia and Australia. No individual country within this group represents 10% or more ofconsolidated totals for any period presented.
(3) ‘‘Other’’ includes Canada and Latin America. No individual country within this group represents 10%or more of consolidated totals for any period presented.
113
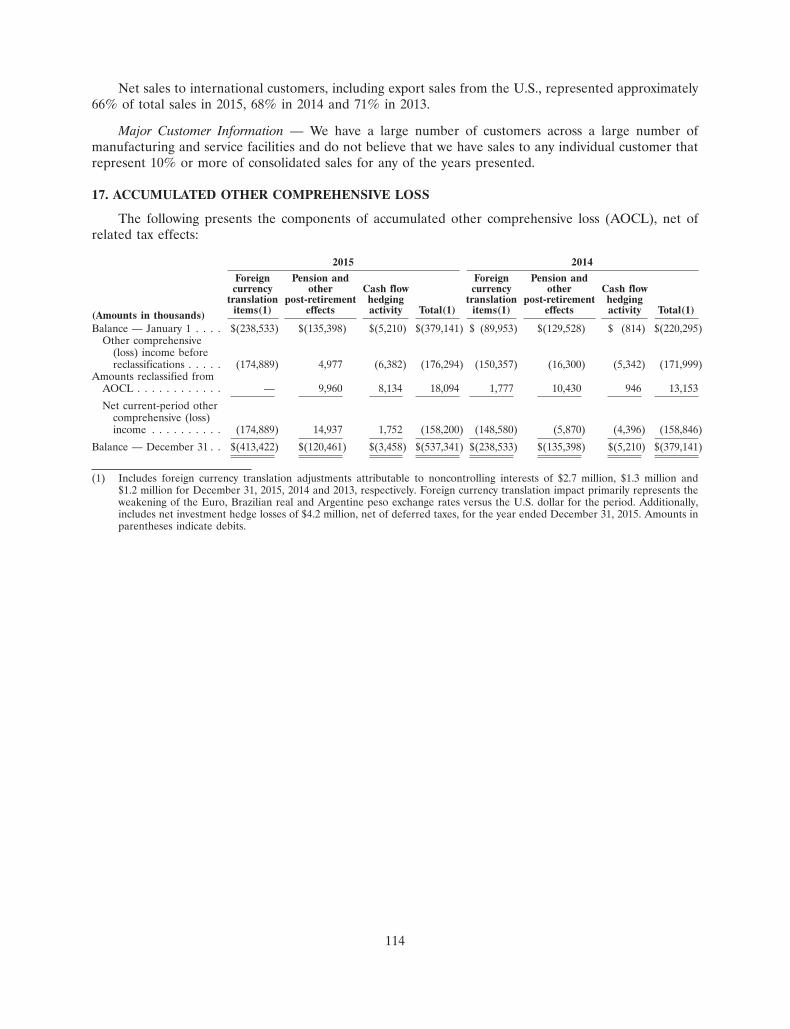
Net sales to international customers, including export sales from the U.S., represented approximately66% of total sales in 2015, 68% in 2014 and 71% in 2013.
Major Customer Information — We have a large number of customers across a large number ofmanufacturing and service facilities and do not believe that we have sales to any individual customer thatrepresent 10% or more of consolidated sales for any of the years presented.
17. ACCUMULATED OTHER COMPREHENSIVE LOSS
The following presents the components of accumulated other comprehensive loss (AOCL), net ofrelated tax effects:
2015 2014
Foreign Pension and Foreign Pension andcurrency other Cash flow currency other Cash flow
translation post-retirement hedging translation post-retirement hedgingitems(1) effects activity Total(1) items(1) effects activity Total(1)(Amounts in thousands)
Balance — January 1 . . . . $(238,533) $(135,398) $(5,210) $(379,141) $ (89,953) $(129,528) $ (814) $(220,295)Other comprehensive
(loss) income beforereclassifications . . . . . (174,889) 4,977 (6,382) (176,294) (150,357) (16,300) (5,342) (171,999)
Amounts reclassified fromAOCL . . . . . . . . . . . . — 9,960 8,134 18,094 1,777 10,430 946 13,153
Net current-period othercomprehensive (loss)income . . . . . . . . . . (174,889) 14,937 1,752 (158,200) (148,580) (5,870) (4,396) (158,846)
Balance — December 31 . . $(413,422) $(120,461) $(3,458) $(537,341) $(238,533) $(135,398) $(5,210) $(379,141)
(1) Includes foreign currency translation adjustments attributable to noncontrolling interests of $2.7 million, $1.3 million and$1.2 million for December 31, 2015, 2014 and 2013, respectively. Foreign currency translation impact primarily represents theweakening of the Euro, Brazilian real and Argentine peso exchange rates versus the U.S. dollar for the period. Additionally,includes net investment hedge losses of $4.2 million, net of deferred taxes, for the year ended December 31, 2015. Amounts inparentheses indicate debits.
114
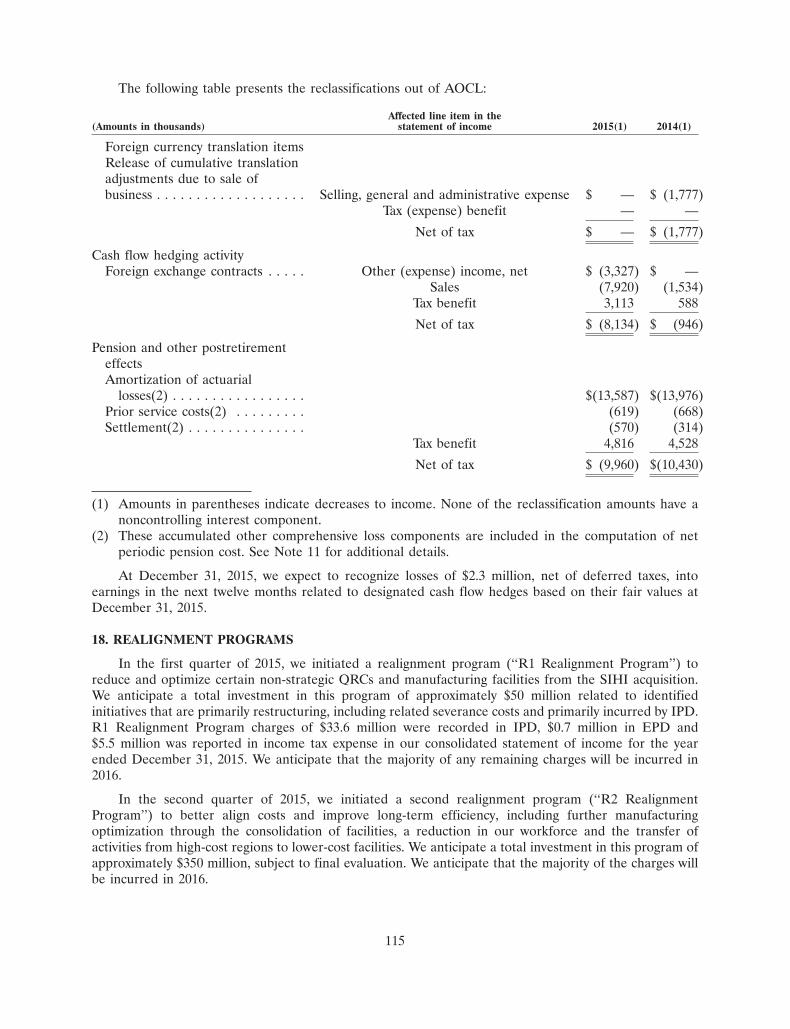
The following table presents the reclassifications out of AOCL:
Affected line item in the(Amounts in thousands) statement of income 2015(1) 2014(1)
Foreign currency translation itemsRelease of cumulative translationadjustments due to sale ofbusiness . . . . . . . . . . . . . . . . . . . Selling, general and administrative expense $ — $ (1,777)
Tax (expense) benefit — —
Net of tax $ — $ (1,777)
Cash flow hedging activityForeign exchange contracts . . . . . Other (expense) income, net $ (3,327) $ —
Sales (7,920) (1,534)Tax benefit 3,113 588
Net of tax $ (8,134) $ (946)
Pension and other postretirementeffectsAmortization of actuarial
losses(2) . . . . . . . . . . . . . . . . . $(13,587) $(13,976)Prior service costs(2) . . . . . . . . . (619) (668)Settlement(2) . . . . . . . . . . . . . . . (570) (314)
Tax benefit 4,816 4,528
Net of tax $ (9,960) $(10,430)
(1) Amounts in parentheses indicate decreases to income. None of the reclassification amounts have anoncontrolling interest component.
(2) These accumulated other comprehensive loss components are included in the computation of netperiodic pension cost. See Note 11 for additional details.
At December 31, 2015, we expect to recognize losses of $2.3 million, net of deferred taxes, intoearnings in the next twelve months related to designated cash flow hedges based on their fair values atDecember 31, 2015.
18. REALIGNMENT PROGRAMS
In the first quarter of 2015, we initiated a realignment program (‘‘R1 Realignment Program’’) toreduce and optimize certain non-strategic QRCs and manufacturing facilities from the SIHI acquisition.We anticipate a total investment in this program of approximately $50 million related to identifiedinitiatives that are primarily restructuring, including related severance costs and primarily incurred by IPD.R1 Realignment Program charges of $33.6 million were recorded in IPD, $0.7 million in EPD and$5.5 million was reported in income tax expense in our consolidated statement of income for the yearended December 31, 2015. We anticipate that the majority of any remaining charges will be incurred in2016.
In the second quarter of 2015, we initiated a second realignment program (‘‘R2 RealignmentProgram’’) to better align costs and improve long-term efficiency, including further manufacturingoptimization through the consolidation of facilities, a reduction in our workforce and the transfer ofactivities from high-cost regions to lower-cost facilities. We anticipate a total investment in this program ofapproximately $350 million, subject to final evaluation. We anticipate that the majority of the charges willbe incurred in 2016.
115
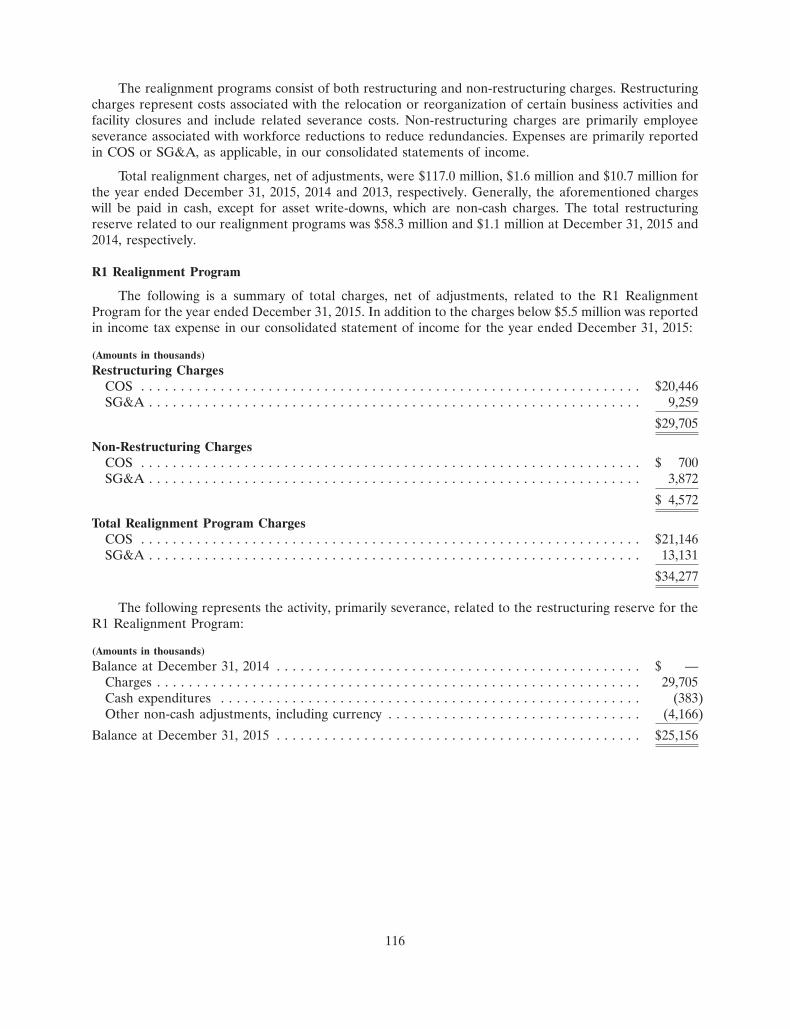
The realignment programs consist of both restructuring and non-restructuring charges. Restructuringcharges represent costs associated with the relocation or reorganization of certain business activities andfacility closures and include related severance costs. Non-restructuring charges are primarily employeeseverance associated with workforce reductions to reduce redundancies. Expenses are primarily reportedin COS or SG&A, as applicable, in our consolidated statements of income.
Total realignment charges, net of adjustments, were $117.0 million, $1.6 million and $10.7 million forthe year ended December 31, 2015, 2014 and 2013, respectively. Generally, the aforementioned chargeswill be paid in cash, except for asset write-downs, which are non-cash charges. The total restructuringreserve related to our realignment programs was $58.3 million and $1.1 million at December 31, 2015 and2014, respectively.
R1 Realignment Program
The following is a summary of total charges, net of adjustments, related to the R1 RealignmentProgram for the year ended December 31, 2015. In addition to the charges below $5.5 million was reportedin income tax expense in our consolidated statement of income for the year ended December 31, 2015:
(Amounts in thousands)
Restructuring ChargesCOS . . . . . . . . . . . . . . . . . . . . . . . . . . . . . . . . . . . . . . . . . . . . . . . . . . . . . . . . . . . . . . . $20,446SG&A . . . . . . . . . . . . . . . . . . . . . . . . . . . . . . . . . . . . . . . . . . . . . . . . . . . . . . . . . . . . . . 9,259
$29,705
Non-Restructuring ChargesCOS . . . . . . . . . . . . . . . . . . . . . . . . . . . . . . . . . . . . . . . . . . . . . . . . . . . . . . . . . . . . . . . $ 700SG&A . . . . . . . . . . . . . . . . . . . . . . . . . . . . . . . . . . . . . . . . . . . . . . . . . . . . . . . . . . . . . . 3,872
$ 4,572
Total Realignment Program ChargesCOS . . . . . . . . . . . . . . . . . . . . . . . . . . . . . . . . . . . . . . . . . . . . . . . . . . . . . . . . . . . . . . . $21,146SG&A . . . . . . . . . . . . . . . . . . . . . . . . . . . . . . . . . . . . . . . . . . . . . . . . . . . . . . . . . . . . . . 13,131
$34,277
The following represents the activity, primarily severance, related to the restructuring reserve for theR1 Realignment Program:
(Amounts in thousands)
Balance at December 31, 2014 . . . . . . . . . . . . . . . . . . . . . . . . . . . . . . . . . . . . . . . . . . . . . . $ —Charges . . . . . . . . . . . . . . . . . . . . . . . . . . . . . . . . . . . . . . . . . . . . . . . . . . . . . . . . . . . . . 29,705Cash expenditures . . . . . . . . . . . . . . . . . . . . . . . . . . . . . . . . . . . . . . . . . . . . . . . . . . . . . (383)Other non-cash adjustments, including currency . . . . . . . . . . . . . . . . . . . . . . . . . . . . . . . . (4,166)
Balance at December 31, 2015 . . . . . . . . . . . . . . . . . . . . . . . . . . . . . . . . . . . . . . . . . . . . . . $25,156
116
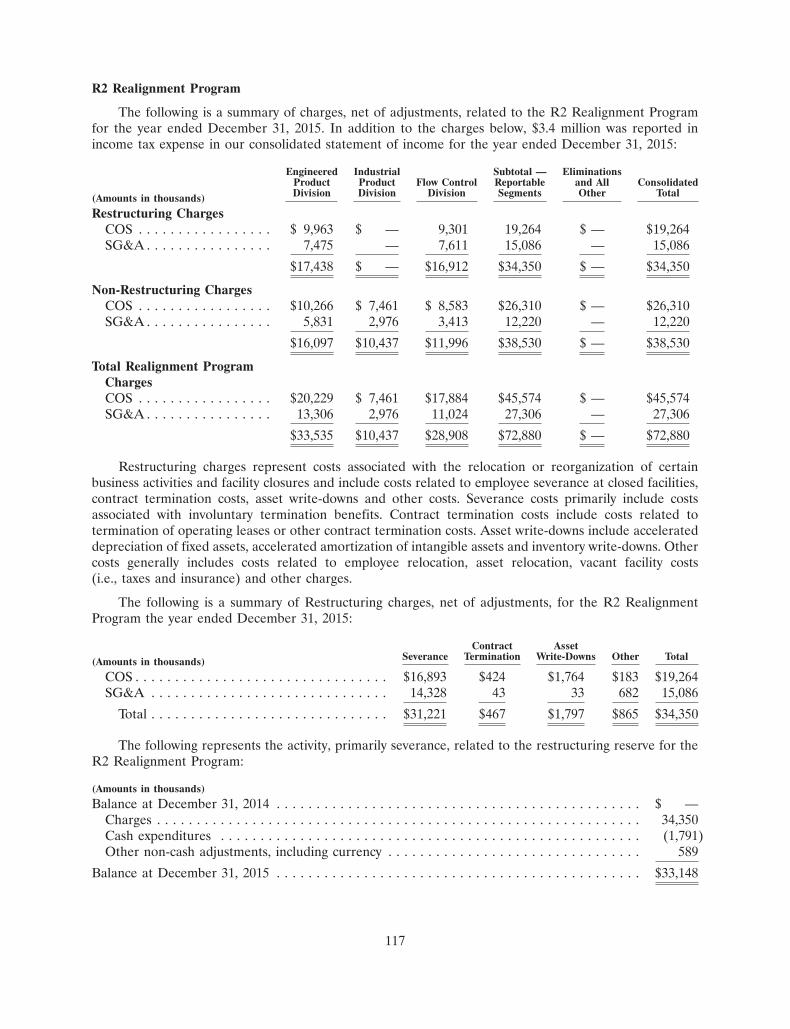
R2 Realignment Program
The following is a summary of charges, net of adjustments, related to the R2 Realignment Programfor the year ended December 31, 2015. In addition to the charges below, $3.4 million was reported inincome tax expense in our consolidated statement of income for the year ended December 31, 2015:
Engineered Industrial Subtotal — EliminationsProduct Product Flow Control Reportable and All ConsolidatedDivision Division Division Segments Other Total(Amounts in thousands)
Restructuring ChargesCOS . . . . . . . . . . . . . . . . . $ 9,963 $ — 9,301 19,264 $ — $19,264SG&A . . . . . . . . . . . . . . . . 7,475 — 7,611 15,086 — 15,086
$17,438 $ — $16,912 $34,350 $ — $34,350
Non-Restructuring ChargesCOS . . . . . . . . . . . . . . . . . $10,266 $ 7,461 $ 8,583 $26,310 $ — $26,310SG&A . . . . . . . . . . . . . . . . 5,831 2,976 3,413 12,220 — 12,220
$16,097 $10,437 $11,996 $38,530 $ — $38,530
Total Realignment ProgramChargesCOS . . . . . . . . . . . . . . . . . $20,229 $ 7,461 $17,884 $45,574 $ — $45,574SG&A . . . . . . . . . . . . . . . . 13,306 2,976 11,024 27,306 — 27,306
$33,535 $10,437 $28,908 $72,880 $ — $72,880
Restructuring charges represent costs associated with the relocation or reorganization of certainbusiness activities and facility closures and include costs related to employee severance at closed facilities,contract termination costs, asset write-downs and other costs. Severance costs primarily include costsassociated with involuntary termination benefits. Contract termination costs include costs related totermination of operating leases or other contract termination costs. Asset write-downs include accelerateddepreciation of fixed assets, accelerated amortization of intangible assets and inventory write-downs. Othercosts generally includes costs related to employee relocation, asset relocation, vacant facility costs(i.e., taxes and insurance) and other charges.
The following is a summary of Restructuring charges, net of adjustments, for the R2 RealignmentProgram the year ended December 31, 2015:
Contract AssetSeverance Termination Write-Downs Other Total(Amounts in thousands)
COS . . . . . . . . . . . . . . . . . . . . . . . . . . . . . . . . $16,893 $424 $1,764 $183 $19,264SG&A . . . . . . . . . . . . . . . . . . . . . . . . . . . . . . 14,328 43 33 682 15,086
Total . . . . . . . . . . . . . . . . . . . . . . . . . . . . . . $31,221 $467 $1,797 $865 $34,350
The following represents the activity, primarily severance, related to the restructuring reserve for theR2 Realignment Program:
(Amounts in thousands)
Balance at December 31, 2014 . . . . . . . . . . . . . . . . . . . . . . . . . . . . . . . . . . . . . . . . . . . . . . $ —Charges . . . . . . . . . . . . . . . . . . . . . . . . . . . . . . . . . . . . . . . . . . . . . . . . . . . . . . . . . . . . . 34,350Cash expenditures . . . . . . . . . . . . . . . . . . . . . . . . . . . . . . . . . . . . . . . . . . . . . . . . . . . . . (1,791)Other non-cash adjustments, including currency . . . . . . . . . . . . . . . . . . . . . . . . . . . . . . . . 589
Balance at December 31, 2015 . . . . . . . . . . . . . . . . . . . . . . . . . . . . . . . . . . . . . . . . . . . . . . $33,148
117
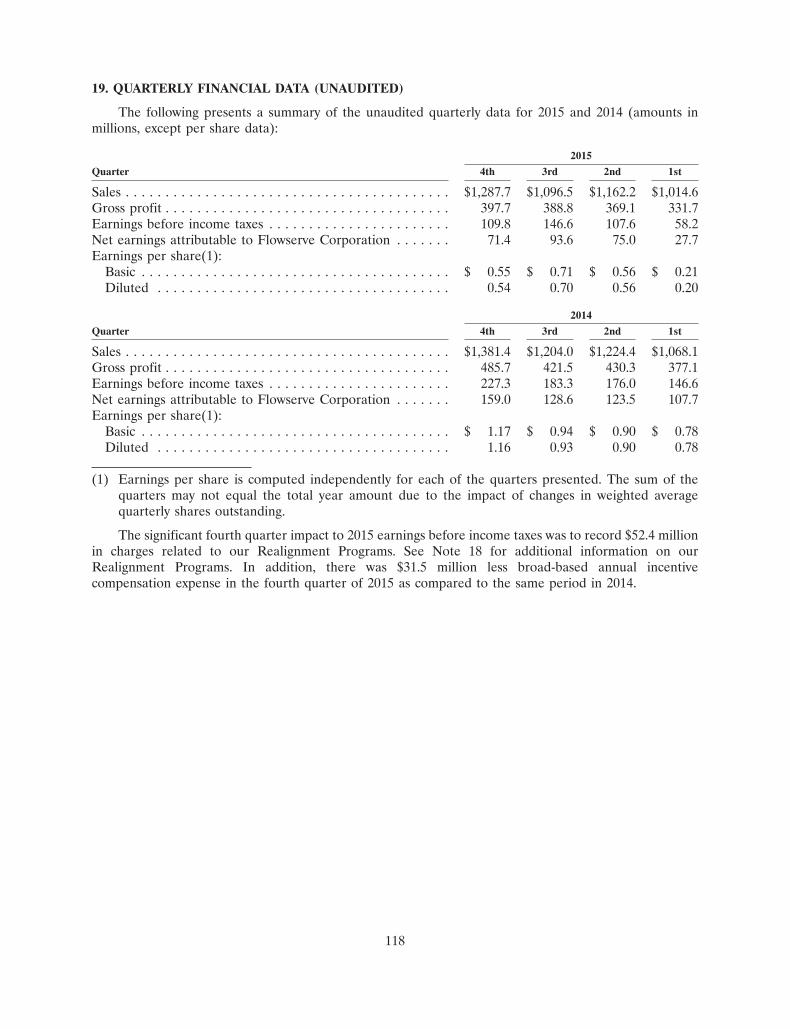
19. QUARTERLY FINANCIAL DATA (UNAUDITED)
The following presents a summary of the unaudited quarterly data for 2015 and 2014 (amounts inmillions, except per share data):
2015
Quarter 4th 3rd 2nd 1st
Sales . . . . . . . . . . . . . . . . . . . . . . . . . . . . . . . . . . . . . . . . . $1,287.7 $1,096.5 $1,162.2 $1,014.6Gross profit . . . . . . . . . . . . . . . . . . . . . . . . . . . . . . . . . . . . 397.7 388.8 369.1 331.7Earnings before income taxes . . . . . . . . . . . . . . . . . . . . . . . 109.8 146.6 107.6 58.2Net earnings attributable to Flowserve Corporation . . . . . . . 71.4 93.6 75.0 27.7Earnings per share(1):
Basic . . . . . . . . . . . . . . . . . . . . . . . . . . . . . . . . . . . . . . . $ 0.55 $ 0.71 $ 0.56 $ 0.21Diluted . . . . . . . . . . . . . . . . . . . . . . . . . . . . . . . . . . . . . 0.54 0.70 0.56 0.20
2014
Quarter 4th 3rd 2nd 1st
Sales . . . . . . . . . . . . . . . . . . . . . . . . . . . . . . . . . . . . . . . . . $1,381.4 $1,204.0 $1,224.4 $1,068.1Gross profit . . . . . . . . . . . . . . . . . . . . . . . . . . . . . . . . . . . . 485.7 421.5 430.3 377.1Earnings before income taxes . . . . . . . . . . . . . . . . . . . . . . . 227.3 183.3 176.0 146.6Net earnings attributable to Flowserve Corporation . . . . . . . 159.0 128.6 123.5 107.7Earnings per share(1):
Basic . . . . . . . . . . . . . . . . . . . . . . . . . . . . . . . . . . . . . . . $ 1.17 $ 0.94 $ 0.90 $ 0.78Diluted . . . . . . . . . . . . . . . . . . . . . . . . . . . . . . . . . . . . . 1.16 0.93 0.90 0.78
(1) Earnings per share is computed independently for each of the quarters presented. The sum of thequarters may not equal the total year amount due to the impact of changes in weighted averagequarterly shares outstanding.
The significant fourth quarter impact to 2015 earnings before income taxes was to record $52.4 millionin charges related to our Realignment Programs. See Note 18 for additional information on ourRealignment Programs. In addition, there was $31.5 million less broad-based annual incentivecompensation expense in the fourth quarter of 2015 as compared to the same period in 2014.
118
ITEM 9. CHANGES IN AND DISAGREEMENTS WITH ACCOUNTANTS ON ACCOUNTING ANDFINANCIAL DISCLOSURE
None.
ITEM 9A. CONTROLS AND PROCEDURES
Disclosure Controls and Procedures
Our disclosure controls and procedures (as defined in Rule 13a-15(e) under the Securities ExchangeAct of 1934 (the ‘‘Exchange Act’’)) are designed to ensure that the information, which we are required todisclose in the reports that we file or submit under the Exchange Act, is recorded, processed, summarizedand reported within the time periods specified in the United States (‘‘U.S.’’) Securities and ExchangeCommission’s (‘‘SEC’’) rules and forms, and that such information is accumulated and communicated toour management, including our Principal Executive Officer and Principal Financial Officer, as appropriateto allow timely decisions regarding required disclosure.
In connection with the preparation of this Annual Report on Form 10-K (‘‘Annual Report’’) for theyear ended December 31, 2015, our management, under the supervision and with the participation of ourPrincipal Executive Officer and our Principal Financial Officer, carried out an evaluation of theeffectiveness of the design and operation of our disclosure controls and procedures as of December 31,2015. Based on this evaluation, our Principal Executive Officer and Principal Financial Officer concludedthat our disclosure controls and procedures were effective at the reasonable assurance level as ofDecember 31, 2015.
Management’s Report on Internal Control Over Financial Reporting
Our management, under the supervision and with the participation of our Principal Executive Officerand Principal Financial Officer, is responsible for establishing and maintaining adequate internal controlover financial reporting, as such term is defined in Rules 13a-15(f) and 15d-15(f) under the Exchange Act.Internal control over financial reporting is a process designed to provide reasonable assurance regardingthe reliability of financial reporting and the preparation of financial statements for external purposes inaccordance with accounting principles generally accepted in the (‘‘U.S. GAAP’’). Internal control overfinancial reporting includes policies and procedures that: (i) pertain to the maintenance of records that, inreasonable detail, accurately and fairly reflect the transactions and dispositions of our assets; (ii) providereasonable assurance that transactions are recorded as necessary to permit preparation of financialstatements in accordance with U.S. GAAP, and that our receipts and expenditures are being made only inaccordance with authorizations of our management and directors; and (iii) provide reasonable assuranceregarding prevention or timely detection of unauthorized acquisition, use or disposition of our assets thatcould have a material effect on the financial statements.
Because of its inherent limitations, internal control over financial reporting may not prevent or detectmisstatements. Also, projections of any evaluation of effectiveness to future periods are subject to the riskthat controls may become inadequate because of changes in conditions, or that the degree of compliancewith existing policies or procedures may deteriorate.
SIHI Group B.V. (‘‘SIHI’’) has been excluded from management’s assessment of internal control overfinancial reporting as of December 31, 2015, because it was acquired by the Company on January 7, 2015.SIHI’s total assets and sales represented approximately 10% and 6%, respectively, of the relatedconsolidated financial statement amounts as of and for the year ended December 31, 2015.
Under the supervision and with the participation of our Principal Executive Officer and PrincipalFinancial Officer, our management conducted an assessment of our internal control over financialreporting as of December 31, 2015, based on the criteria established in Internal Control — IntegratedFramework (2013), issued by the Committee of Sponsoring Organizations of the Treadway Commission.
119
Based on this assessment, our management has concluded that as of December 31, 2015, our internalcontrol over financial reporting was effective.
The effectiveness of our internal control over financial reporting as of December 31, 2015, has beenaudited by PricewaterhouseCoopers LLP, our independent registered public accounting firm, as stated intheir report, which is included herein.
Changes in Internal Control Over Financial Reporting
There were no changes in our internal control over financial reporting during the year endedDecember 31, 2015 that have materially affected, or are reasonably likely to materially affect, our internalcontrol over financial reporting.
PART III
ITEM 10. DIRECTORS, EXECUTIVE OFFICERS AND CORPORATE GOVERNANCE
The information required in this Item 10 is incorporated by reference to our definitive ProxyStatement relating to our 2016 annual meeting of shareholders to be held on May 19, 2016. The ProxyStatement will be filed with the SEC no later than April 26, 2016.
ITEM 11. EXECUTIVE COMPENSATION
The information required in this Item 11 is incorporated by reference to our definitive ProxyStatement relating to our 2016 annual meeting of shareholders to be held on May 19, 2016. The ProxyStatement will be filed with the SEC no later than April 26, 2016.
ITEM 12. SECURITY OWNERSHIP OF CERTAIN BENEFICIAL OWNERS AND MANAGEMENT ANDRELATED STOCKHOLDER MATTERS
The information required in this Item 12 is incorporated by reference to our definitive ProxyStatement relating to our 2016 annual meeting of shareholders to be held on May 19, 2016. The ProxyStatement will be filed with the SEC no later than April 26, 2016.
ITEM 13. CERTAIN RELATIONSHIPS AND RELATED TRANSACTIONS, AND DIRECTORINDEPENDENCE
The information required in this Item 13 is incorporated by reference to our definitive ProxyStatement relating to our 2016 annual meeting of shareholders to be held on May 19, 2016. The ProxyStatement will be filed with the SEC no later than April 26, 2016.
ITEM 14. PRINCIPAL ACCOUNTING FEES AND SERVICES
The information required in this Item 14 is incorporated by reference to our definitive ProxyStatement relating to our 2016 annual meeting of shareholders to be held on May 19, 2016. The ProxyStatement will be filed with the SEC no later than April 26, 2016.
120
PART IV
ITEM 15. EXHIBITS, FINANCIAL STATEMENT SCHEDULES
(a) Documents filed as a part of this Annual Report:
1. Consolidated Financial Statements
The following consolidated financial statements and notes thereto are filed as part of this AnnualReport:
Report of Independent Registered Public Accounting Firm
Flowserve Corporation Consolidated Financial Statements:
Consolidated Balance Sheets at December 31, 2015 and 2014
For each of the three years in the period ended December 31, 2015:
Consolidated Statements of Income
Consolidated Statements of Comprehensive Income
Consolidated Statements of Shareholders’ Equity
Consolidated Statements of Cash Flows
Notes to Consolidated Financial Statements
2. Consolidated Financial Statement Schedules
The following consolidated financial statement schedule is filed as part of this Annual Report:
Schedule II — Valuation and Qualifying Accounts . . . . . . . . . . . . . . . . . . . . . . . . . . . . . . . . . . . 124
Financial statement schedules not included in this Annual Report have been omitted because they arenot applicable or the required information is shown in the consolidated financial statements or notesthereto.
3. Exhibits
See Index to Exhibits to this Annual Report.
121
SIGNATURES
Pursuant to the requirements of Section 13 or 15(d) of the Securities Exchange Act of 1934, theregistrant has duly caused this report to be signed on its behalf by the undersigned, thereunto dulyauthorized.
FLOWSERVE CORPORATION
By: /s/ Mark A. Blinn
Mark A. BlinnPresident and Chief Executive Officer
Date: February 18, 2016
Pursuant to the requirements of the Securities Exchange Act of 1934, this report has been signedbelow by the following persons on behalf of the registrant and in the capacities and on the date indicated.
Signature Title Date
/s/ William C. RusnackNon-Executive Chairman of the Board February 18, 2016
William C. Rusnack
/s/ Mark A. Blinn President, Chief Executive Officer and February 18, 2016Director (Principal Executive Officer)Mark A. Blinn
Executive Vice President and Chief/s/ Karyn F. OvelmenFinancial Officer (Principal Financial February 18, 2016
Karyn F. Ovelmen and Accounting Officer)
/s/ Leif E. DarnerDirector February 18, 2016
Leif E. Darner
/s/ Gayla J. DellyDirector February 18, 2016
Gayla J. Delly
/s/ Lynn L. ElsenhansDirector February 18, 2016
Lynn L. Elsenhans
/s/ Roger L. FixDirector February 18, 2016
Roger L. Fix
122

Signature Title Date
/s/ John R. FriederyDirector February 18, 2016
John R. Friedery
/s/ Joseph E. HarlanDirector February 18, 2016
Joseph E. Harlan
/s/ Rick J. MillsDirector February 18, 2016
Rick J. Mills
/s/ Charles M. RampacekDirector February 18, 2016
Charles M. Rampacek
/s/ David E. RobertsDirector February 18, 2016
David E. Roberts
123

FLOWSERVE CORPORATION
Schedule II — Valuation and Qualifying Accounts
AdditionsCharged to
Additions Other Accounts —Balance at Charged to Acquisitions Deductions Balance at
Beginning of Cost and and Related From End ofDescription Year Expenses Adjustments Reserve Year
(Amounts in thousands)
Year Ended December 31, 2015Allowance for doubtful accounts(a): $25,469 $19,624 $ 152 $ (1,309) $43,936Deferred tax asset valuation
allowance(b): . . . . . . . . . . . . . . . 15,378 18,548 (3,596) (5,605) 24,725Year Ended December 31, 2014
Allowance for doubtful accounts(a): 24,073 17,817 (443) (15,978) 25,469Deferred tax asset valuation
allowance(b): . . . . . . . . . . . . . . . 18,058 1,366 (996) (3,050) 15,378Year Ended December 31, 2013
Allowance for doubtful accounts(a): 21,491 17,412 79 (14,909) 24,073Deferred tax asset valuation
allowance(b): . . . . . . . . . . . . . . . 17,975 2,352 — (2,269) 18,058
(a) Deductions from reserve represent accounts written off and recoveries.(b) Deductions from reserve result from the expiration or utilization of net operating losses and foreign
tax credits previously reserved.
124
INDEX TO EXHIBITS
ExhibitNo. Description
3.1 Restated Certificate of Incorporation of Flowserve Corporation (incorporated by reference toExhibit 3.1 to the Registrant’s Quarterly Report on Form 10-Q for the quarter ended June 30,2013).
3.2 Flowserve Corporation By-Laws, as amended and restated effective December 14, 2015(incorporated by reference to Exhibit 3.1 to the Registrant’s Current Report on Form 8-Kdated December 15, 2015).
4.1 Senior Indenture, dated September 11, 2012, by and between Flowserve Corporation and U.S.Bank National Association, as trustee (incorporated by reference to Exhibit 4.1 to theRegistrant’s Current Report on Form 8-K dated September 11, 2012).
4.2 First Supplemental Indenture, dated September 11, 2012, by and among FlowserveCorporation, certain of its subsidiaries and U.S. Bank National Association, as trustee(incorporated by reference to Exhibit 4.2 to the Registrant’s Current Report on Form 8-Kdated September 11, 2012).
4.3 Second Supplemental Indenture, dated November 1, 2013, by and among FlowserveCorporation, certain of its subsidiaries and U.S. Bank National Association, as trustee(incorporated by reference to Exhibit 4.2 to the Registrant’s Current Report on Form 8-Kdated November 1, 2013).
4.4 Third Supplemental Indenture, dated March 17, 2015, by and among Flowserve Corporation,certain of its subsidiaries and U.S. Bank National Association, as trustee (incorporated byreference to Exhibit 4.2 to the Registrant’s Current Report on Form 8-K dated March 17,2015).
10.1 Credit Agreement, dated August 20, 2012, among Flowserve Corporation, Bank of America,N.A., as swingline lender, letter of credit issuer and administrative agent and the other lendersreferred to therein (incorporated by reference to Exhibit 10.1 to the Registrant’s CurrentReport on Form 8-K, dated August 20, 2012).
10.2 First Amendment to Credit Agreement, dated October 4, 2013, among FlowserveCorporation, Bank of America, N.A., as administrative agent, and the other lenders referredto therein (incorporated by reference to Exhibit 10.1 to the Registrant’s Current Report onForm 8-K, dated October 4, 2013).
10.3 Second Amendment to Credit Agreement, dated October 14, 2015, among FlowserveCorporation, Bank of America, N.A., as administrative agent, and the other lenders referredto therein (incorporated by reference to Exhibit 10.1 to the Registrants’ Current Report onForm 8-K dated October 19, 2015).
10.4 Letter of Credit Agreement, dated as of September 14, 2007 among Flowserve B.V., as anApplicant, Flowserve Corporation, as an Applicant and as Guarantor, the AdditionalApplicants from time to time as a party thereto, the various Lenders from time to time as aparty thereto, and ABN AMRO Bank, N.V., as Administrative Agent and an Issuing Bank(incorporated by reference to Exhibit 10.1 to the Registrant’s Current Report on Form 8-K,dated September 19, 2007).
10.5 First Amendment to Letter of Credit Agreement, dated as of September 11, 2008 amongFlowserve Corporation, Flowserve B.V. and other subsidiaries of the Company party thereto,ABN AMRO Bank, N.V., as Administrative Agent and an Issuing Bank, and the otherfinancial institutions party thereto (incorporated by reference to Exhibit 10.1 to theRegistrant’s Current Report on Form 8-K, dated September 16, 2008).
125

ExhibitNo. Description
10.6 Second Amendment to Letter of Credit Agreement, dated as of September 9, 2009 amongFlowserve Corporation, Flowserve B.V. and other subsidiaries of the Company party thereto,ABN AMRO Bank, N.V., as Administrative Agent and an Issuing Bank, and the otherfinancial institutions party thereto (incorporated by reference to Exhibit 10.1 to theRegistrant’s Current Report on Form 8-K dated September 11, 2009).
10.7 Third Amendment to Letter of Credit Agreement, dated October 26, 2012, among FlowserveCorporation, Flowserve B.V. and other subsidiaries of the Company party thereto, CreditAgricole Corporate and Investment Bank (f/k/a Calyon), as Mandated Lead Arranger,Administrative Agent and an Issuing Bank, and the other financial institutions party thereto(incorporated by reference to Exhibit 10.1 to the Registrant’s Quarterly Report on Form 10-Qfor the quarter ended September 30, 2012).
10.8 Amended and Restated Flowserve Corporation Director Cash Deferral Plan, effectiveJanuary 1, 2009 (incorporated by reference to Exhibit 10.7 to the Registrant’s Annual Reporton Form 10-K for the year ended December 31, 2008).*
10.9 Amended and Restated Flowserve Corporation Director Stock Deferral Plan, dated effectiveJanuary 1, 2009 (incorporated by reference to Exhibit 10.8 to the Registrant’s Annual Reporton Form 10-K for the year ended December 31, 2008).*
10.10 Trust for Non-Qualified Deferred Compensation Benefit Plans, dated February 10, 2011(incorporated by reference to Exhibit 10.8 to the Registrant’s Annual Report on Form 10-Kfor the year ended December 31, 2010).*
10.11 2007 Flowserve Corporation Long-Term Stock Incentive Plan, as amended and restatedeffective January 1, 2010 (incorporated by reference to Exhibit 10.20 to the Registrant’sAnnual Report on Form 10-K for the year ended December 31, 2009).*
10.12 2007 Flowserve Corporation Annual Incentive Plan, as amended and restated effectiveJanuary 1, 2010 (incorporated by reference to Exhibit 10.23 to the Registrant’s Annual Reporton Form 10-K for the year ended December 31, 2009).*
10.13 Flowserve Corporation Deferred Compensation Plan (incorporated by reference toExhibit 10.23 to the Registrant’s Annual Report on Form 10-K for the year endedDecember 31, 2000).*
10.14 Amendment No. 1 to the Flowserve Corporation Deferred Compensation Plan, as amendedand restated, effective June 1, 2000 (incorporated by reference to Exhibit 10.50 to theRegistrant’s Annual Report on Form 10-K for the year ended December 31, 2002).*
10.15 Amendment to the Flowserve Corporation Deferred Compensation Plan, dated December 14,2005 (incorporated by reference to Exhibit 10.70 to the Registrant’s Annual Report onForm 10-K for the year ended December 31, 2004).*
10.16 Amendment No. 3 to the Flowserve Corporation Deferred Compensation Plan, as amendedand restated effective June 1, 2000 (incorporated by reference to Exhibit 10.22 to theRegistrant’s Annual Report on Form 10-K for the year ended December 31, 2007).*
10.17 Flowserve Corporation Officer Severance Plan, amended and restated effective January 1,2010 (incorporated by reference to Exhibit 10.32 to the Registrant’s Annual Report onForm 10-K for the year ended December 31, 2009).*
10.18 Flowserve Corporation Executive Officer Change In Control Severance Plan, amended andrestated effective November 12, 2007 (incorporated by reference to Exhibit 10.38 to theRegistrant’s Annual Report on Form 10-K for the year ended December 31, 2007).*
10.19 First Amendment to the Flowserve Corporation Executive Officer Change In ControlSeverance Plan, effective January 1, 2011 (incorporated by reference to Exhibit 10.21 to theRegistrant’s Annual Report on Form 10-K for the year ended December 31, 2010).*
126
ExhibitNo. Description
10.20 Flowserve Corporation Officer Change In Control Severance Plan, amended and restatedeffective November 12, 2007 (incorporated by reference to Exhibit 10.39 to the Registrant’sAnnual Report on Form 10-K for the year ended December 31, 2007).*
10.21 First Amendment to the Flowserve Corporation Officer Change In Control Severance Plan,effective January 1, 2011 (incorporated by reference to Exhibit 10.23 to the Registrant’sAnnual Report on Form 10-K for the year ended December 31, 2010).*
10.22 Flowserve Corporation Key Management Change In Control Severance Plan, amended andrestated effective November 12, 2007 (incorporated by reference to Exhibit 10.40 to theRegistrant’s Annual Report on Form 10-K for the year ended December 31, 2007).*
10.23 First Amendment to the Flowserve Corporation Key Management Change In ControlSeverance Plan, effective January 1, 2011 (incorporated by reference to Exhibit 10.25 to theRegistrant’s Annual Report on Form 10-K for the year ended December 31, 2010).*
10.24 Flowserve Corporation Senior Management Retirement Plan, amended and restated effectiveJanuary 1, 2008 (incorporated by reference to Exhibit 10.42 to the Registrant’s Annual Reporton Form 10-K for the year ended December 31, 2007).*
10.25 Flowserve Corporation Supplemental Executive Retirement Plan, amended and restatedeffective November 12, 2007 (incorporated by reference to Exhibit 10.43 to the Registrant’sAnnual Report on Form 10-K for the year ended December 31, 2007).*
10.26 Flowserve Corporation 2004 Stock Compensation Plan, effective April 21, 2004 (incorporatedby reference to Appendix A to the Registrant’s 2004 Proxy Statement, dated May 10, 2004).*
10.27 Amendment Number One to the Flowserve Corporation 2004 Stock Compensation Plan,effective March 6, 2008 (incorporated by reference to Exhibit 10.10 to the Registrant’sQuarterly Report on Form 10-Q for the quarter ended March 31, 2008).*
10.28 Amendment Number Two to the Flowserve Corporation 2004 Stock Compensation Plan,effective March 7, 2008 (incorporated by reference to Exhibit 10.11 to the Registrant’sQuarterly Report on Form 10-Q for the quarter ended March 31, 2008).*
10.29 Form of Incentive Stock Option Agreement pursuant to the Flowserve Corporation 2004Stock Compensation Plan (incorporated by reference to Exhibit 10.60 to the Registrant’sAnnual Report on Form 10-K for the year ended December 31, 2004).*
10.30 Form of Non-Qualified Stock Option Agreement pursuant to the Flowserve Corporation 2004Stock Compensation Plan (incorporated by reference to Exhibit 10.61 to the Registrant’sAnnual Report on Form 10-K for the year ended December 31, 2004).*
10.31 Form of Incentive Stock Option Agreement for certain officers pursuant to the FlowserveCorporation 2004 Stock Compensation Plan (incorporated by reference to Exhibit 10.4 to theRegistrant’s Current Report on Form 8-K, dated March 9, 2006).*
10.32 Form A of Performance Restricted Stock Unit Agreement pursuant to FlowserveCorporation’s 2004 Stock Compensation Plan (incorporated by reference to Exhibit 10.3 tothe Registrant’s Quarterly Report on Form 10-Q for the quarter ended March 31, 2008).*
10.33 Form B of Performance Restricted Stock Unit Agreement pursuant to FlowserveCorporation’s 2004 Stock Compensation Plan (incorporated by reference to Exhibit 10.4 tothe Registrant’s Quarterly Report on Form 10-Q for the quarter ended March 31, 2008).*
10.34 Amendment Number One to the Form A and Form B Performance Restricted Stock UnitAgreements pursuant to Flowserve Corporation’s 2004 Stock Compensation Plan, datedMarch 27, 2008 (incorporated by reference to Exhibit 10.5 to the Registrant’s QuarterlyReport on Form 10-Q for the quarter ended March 31, 2008).*
10.35 Form A of Restricted Stock Unit Agreement pursuant to Flowserve Corporation’s 2004 StockCompensation Plan (incorporated by reference to Exhibit 10.6 to the Registrant’s QuarterlyReport on Form 10-Q for the quarter ended March 31, 2008).*
127
ExhibitNo. Description
10.36 Form B of Restricted Stock Unit Agreement pursuant to Flowserve Corporation’s 2004 StockCompensation Plan (incorporated by reference to Exhibit 10.7 to the Registrant’s QuarterlyReport on Form 10-Q for the quarter ended March 31, 2008).*
10.37 Form A of Restricted Stock Agreement pursuant to Flowserve Corporation’s 2004 StockCompensation Plan (incorporated by reference to Exhibit 10.8 to the Registrant’s QuarterlyReport on Form 10-Q for the quarter ended March 31, 2008).*
10.38 Form B of Restricted Stock Agreement pursuant to Flowserve Corporation’s 2004 StockCompensation Plan (incorporated by reference to Exhibit 10.9 to the Registrant’s QuarterlyReport on Form 10-Q for the quarter ended March 31, 2008).*
10.39 Flowserve Corporation Equity and Incentive Compensation Plan (incorporated by referenceto Appendix A to the Registrant’s Proxy Statement on Schedule 14A dated April 3, 2009).*
10.40 Form A of Restricted Stock Agreement pursuant to the Flowserve Corporation Equity andIncentive Compensation Plan (incorporated by reference to Exhibit 10.38 to the Registrant’sAnnual Report on Form 10-K for the year ended December 31, 2012).*
10.41 Form B of Restricted Stock Agreement pursuant to the Flowserve Corporation Equity andIncentive Compensation Plan (incorporated by reference to Exhibit 10.39 to the Registrant’sAnnual Report on Form 10-K for the year ended December 31, 2012).*
10.42 Form A of Restricted Stock Unit Agreement pursuant to the Flowserve Corporation Equityand Incentive Compensation Plan (incorporated by reference to Exhibit 10.40 to theRegistrant’s Annual Report on Form 10-K for the year ended December 31, 2012).*
10.43 Form B of Restricted Stock Unit Agreement pursuant to the Flowserve Corporation Equityand Incentive Compensation Plan (incorporated by reference to Exhibit 10.41 to theRegistrant’s Annual Report on Form 10-K for the year ended December 31, 2012).*
10.44 Form A of Performance Restricted Stock Unit Agreement pursuant to the FlowserveCorporation Equity and Incentive Compensation Plan (incorporated by reference toExhibit 10.42 to the Registrant’s Annual Report on Form 10-K for the year endedDecember 31, 2012).*
10.45 Form B of Performance Restricted Stock Unit Agreement pursuant to the FlowserveCorporation Equity and Incentive Compensation Plan (incorporated by reference toExhibit 10.43 to the Registrant’s Annual Report on Form 10-K for the year endedDecember 31, 2012).*
10.46 Form of Restrictive Covenants Agreement for Officers (incorporated by reference toExhibit 10.1 to the Registrant’s Current Report on Form 8-K, dated as of March 9, 2006).*
10.47+ Form of Indemnification Agreement for all Directors and Officers14.1 Flowserve Financial Management Code of Ethics adopted by the Flowserve Corporation
principal executive officer and CEO, principal financial officer and CFO, principal accountingofficer and controller, and other senior financial managers (incorporated by reference toExhibit 14.1 to the Registrant’s Annual Report on Form 10-K for the year endedDecember 31, 2002).
21.1+ Subsidiaries of the Registrant.23.1+ Consent of PricewaterhouseCoopers LLP.31.1+ Certification of Principal Executive Officer pursuant to Exchange Act Rules 13a-14(a) and
15d-14(a), as adopted pursuant to Section 302 of the Sarbanes-Oxley Act of 2002.31.2+ Certification of Principal Financial Officer pursuant to Exchange Act Rules 13a-14(a) and
15d-14(a), as adopted pursuant to Section 302 of the Sarbanes-Oxley Act of 2002.32.1++ Certification of Principal Executive Officer pursuant to 18 U.S.C. Section 1350, as adopted
pursuant to Section 906 of the Sarbanes-Oxley Act of 2002.32.2++ Certification of Principal Financial Officer pursuant to 18 U.S.C. Section 1350, as adopted
pursuant to Section 906 of the Sarbanes-Oxley Act of 2002.
128
ExhibitNo. Description
101.INS XBRL Instance Document101.SCH XBRL Taxonomy Extension Schema Document101.CAL XBRL Taxonomy Extension Calculation Linkbase Document101.LAB XBRL Taxonomy Extension Label Linkbase Document101.PRE XBRL Taxonomy Extension Presentation Linkbase Document101.DEF XBRL Taxonomy Extension Definition Linkbase Document
* Management contracts and compensatory plans and arrangements required to be filed as exhibits tothis Annual Report on Form 10-K.
+ Filed herewith.++ Furnished herewith.
129
EXHIBIT 31.1
CERTIFICATION OF PRINCIPAL EXECUTIVE OFFICERPURSUANT TO SECTION 302
OF THE SARBANES-OXLEY ACT OF 2002
I, Mark A. Blinn, certify that:
1. I have reviewed this Annual Report on Form 10-K for the fiscal year ended December 31, 2015 ofFlowserve Corporation;
2. Based on my knowledge, this report does not contain any untrue statement of a material fact oromit to state a material fact necessary to make the statements made, in light of the circumstances underwhich such statements were made, not misleading with respect to the period covered by this report;
3. Based on my knowledge, the financial statements, and other financial information included in thisreport, fairly present in all material respects the consolidated financial condition, results of operations andcash flows of the registrant as of, and for, the periods presented in this report;
4. The registrant’s other certifying officer and I are responsible for establishing and maintainingdisclosure controls and procedures (as defined in Exchange Act Rules 13a-15(e) and 15d-15(e)) andinternal control over financial reporting (as defined in Exchange Act Rules 13a-15(f) and 15d-15(f)) for theregistrant and have:
(a) Designed such disclosure controls and procedures, or caused such disclosure controls andprocedures to be designed under our supervision, to ensure that material information relating to theregistrant, including its consolidated subsidiaries, is made known to us by others within those entities,particularly during the period in which this report is being prepared;
(b) Designed such internal control over financial reporting, or caused such internal control overfinancial reporting to be designed under our supervision, to provide reasonable assurance regardingthe reliability of financial reporting and the preparation of financial statements for external purposesin accordance with generally accepted accounting principles;
(c) Evaluated the effectiveness of the registrant’s disclosure controls and procedures andpresented in this report our conclusions about the effectiveness of the disclosure controls andprocedures, as of the end of the period covered by this report based on such evaluation; and
(d) Disclosed in this report any change in the registrant’s internal control over financialreporting that occurred during the registrant’s most recent fiscal quarter (the registrant’s fourth fiscalquarter in the case of an annual report) that has materially affected, or is reasonably likely tomaterially affect, the registrant’s internal control over financial reporting; and
5. The registrant’s other certifying officer and I have disclosed, based on our most recent evaluationof internal control over financial reporting, to the registrant’s auditors and the audit committee of theregistrant’s board of directors (or persons performing the equivalent functions):
(a) All significant deficiencies and material weaknesses in the design or operation of internalcontrol over financial reporting which are reasonably likely to adversely affect the registrant’s abilityto record, process, summarize and report financial information; and
(b) Any fraud, whether or not material, that involves management or other employees who havea significant role in the registrant’s internal control over financial reporting.
/s/ Mark A. Blinn
Mark A. BlinnPresident and Chief Executive Officer(Principal Executive Officer)
Date: February 18, 2016
EXHIBIT 31.2
CERTIFICATION OF PRINCIPAL FINANCIAL OFFICERPURSUANT TO SECTION 302
OF THE SARBANES-OXLEY ACT OF 2002
I, Karyn F. Ovelmen, certify that:
1. I have reviewed this Annual Report on Form 10-K for the fiscal year ended December 31, 2015 ofFlowserve Corporation;
2. Based on my knowledge, this report does not contain any untrue statement of a material fact oromit to state a material fact necessary to make the statements made, in light of the circumstances underwhich such statements were made, not misleading with respect to the period covered by this report;
3. Based on my knowledge, the financial statements, and other financial information included in thisreport, fairly present in all material respects the consolidated financial condition, results of operations andcash flows of the registrant as of, and for, the periods presented in this report;
4. The registrant’s other certifying officer and I are responsible for establishing and maintainingdisclosure controls and procedures (as defined in Exchange Act Rules 13a-15(e) and 15d-15(e)) andinternal control over financial reporting (as defined in Exchange Act Rules 13a-15(f) and 15d-15(f)) for theregistrant and have:
(a) Designed such disclosure controls and procedures, or caused such disclosure controls andprocedures to be designed under our supervision, to ensure that material information relating to theregistrant, including its consolidated subsidiaries, is made known to us by others within those entities,particularly during the period in which this report is being prepared;
(b) Designed such internal control over financial reporting, or caused such internal control overfinancial reporting to be designed under our supervision, to provide reasonable assurance regardingthe reliability of financial reporting and the preparation of financial statements for external purposesin accordance with generally accepted accounting principles;
(c) Evaluated the effectiveness of the registrant’s disclosure controls and procedures andpresented in this report our conclusions about the effectiveness of the disclosure controls andprocedures, as of the end of the period covered by this report based on such evaluation; and
(d) Disclosed in this report any change in the registrant’s internal control over financialreporting that occurred during the registrant’s most recent fiscal quarter (the registrant’s fourth fiscalquarter in the case of an annual report) that has materially affected, or is reasonably likely tomaterially affect, the registrant’s internal control over financial reporting; and
5. The registrant’s other certifying officer and I have disclosed, based on our most recent evaluationof internal control over financial reporting, to the registrant’s auditors and the audit committee of theregistrant’s board of directors (or persons performing the equivalent functions):
(a) All significant deficiencies and material weaknesses in the design or operation of internalcontrol over financial reporting which are reasonably likely to adversely affect the registrant’s abilityto record, process, summarize and report financial information; and
(b) Any fraud, whether or not material, that involves management or other employees who havea significant role in the registrant’s internal control over financial reporting.
/s/ Karyn F. Ovelmen
Karyn F. Ovelmen,Executive Vice President andChief Financial Officer(Principal Financial and Accounting Officer)
Date: February 18, 2016
EXHIBIT 32.1
CERTIFICATION PURSUANT TO18 U.S.C. SECTION 1350
AS ADOPTED PURSUANT TOSECTION 906 OF THE SARBANES-OXLEY ACT OF 2002
I, Mark A. Blinn, President and Chief Executive Officer of Flowserve Corporation (the ‘‘Company’’),certify, pursuant to 18 U.S.C. Section 1350, as adopted pursuant to Section 906 of the Sarbanes-Oxley Actof 2002, that to my knowledge:
(1) the Annual Report on Form 10-K of the Company for the period ended December 31, 2015, asfiled with the Securities and Exchange Commission on the date hereof (the ‘‘Annual Report’’), fullycomplies with the requirements of Section 13(a) or 15(d) of the Securities Exchange Act of 1934; and
(2) the information contained in the Annual Report fairly presents, in all material respects, theconsolidated financial condition and results of operations of the Company.
/s/ Mark A. Blinn
Mark A. BlinnPresident and Chief Executive Officer(Principal Executive Officer)
Date: February 18, 2016
EXHIBIT 32.2
CERTIFICATION PURSUANT TO18 U.S.C. SECTION 1350
AS ADOPTED PURSUANT TOSECTION 906 OF THE SARBANES-OXLEY ACT OF 2002
I, Karyn F. Ovelmen, Senior Vice President and Chief Financial Officer of Flowserve Corporation (the‘‘Company’’), certify, pursuant to 18 U.S.C. Section 1350, as adopted pursuant to Section 906 of theSarbanes-Oxley Act of 2002, that to my knowledge:
(1) the Annual Report on Form 10-K of the Company for the period ended December 31, 2015, asfiled with the Securities and Exchange Commission on the date hereof (the ‘‘Annual Report’’), fullycomplies with the requirements of Section 13(a) or 15(d) of the Securities Exchange Act of 1934; and
(2) the information contained in the Annual Report fairly presents, in all material respects, theconsolidated financial condition and results of operations of the Company.
/s/ Karyn F. Ovelmen
Karyn F. OvelmenExecutive Vice President andChief Financial Officer(Principal Financial and Accounting Officer)
Date: February 18, 2016
=