© infosys technologies limited 2003-2004 performance of infosys for the third quarter ended...
TRANSCRIPT

© Infosys Technologies Limited 2003-2004
Performance of Infosys for the Third Quarter ended December 31, 2003
Performance of Infosys for the Third Quarter ended December 31, 2003
Nandan M. Nilekani S. GopalakrishnanChief Executive Officer, President and Managing Director Chief Operating Officer and Deputy Managing Director

Slide 2© Infosys Technologies Limited 2003-2004
Safe HarbourSafe Harbour
Certain statements in this release concerning our future growth prospects are forward-looking statements, which involve a number of risks and uncertainties that could cause actual results to differ materially from those in such forward-looking statements. The risks and uncertainties relating to these statements include, but are not limited to, risks and uncertainties regarding fluctuations in earnings, our ability to manage growth, intense competition in IT services including those factors which may affect our cost advantage, wage increases in India, our ability to attract and retain highly skilled professionals, time and cost overruns on fixed-price, fixed-time frame contracts, client concentration, restrictions on immigration, industry segment concentration, our ability to manage our international operations, reduced demand for technology in our key focus areas, disruptions in telecommunication networks or system failures, our ability to successfully complete and integrate potential acquisitions, liability for damages on our service contracts, the success of the companies in which Infosys has made strategic investments, withdrawal of governmental fiscal incentives, political instability and regional conflicts, legal restrictions on raising capital or acquiring companies outside India, and unauthorized use of our intellectual property and general economic conditions affecting our industry. Additional risks that could affect our future operating results are more fully described in our United States Securities and Exchange Commission filings including our Annual Report on Form 20-F for the fiscal year ended March 31, 2003 and on Form 6-K for the quarters ended June 30, 2003 and September 30, 2003. These filings are available at www.sec.gov. Infosys may, from time to time, make additional written and oral forward looking statements, including statements contained in the company’s filings with the Securities and Exchange Commission and our reports to shareholders. The company does not undertake to update any forward-looking statements that may be made from time to time by or on behalf of the company.

© Infosys Technologies Limited 2003-2004 Slide 3
AgendaAgenda
Financial Performance
Operational Performance
Client Acquisition & Expansion of Services
Human Resources
Capex and Infrastructure
Progeon
Outlook for the Future
Summary

© Infosys Technologies Limited 2003-2004
Financial PerformanceFinancial Performance
© Infosys Technologies Limited 2003-2004 Slide 5
HighlightsHighlights
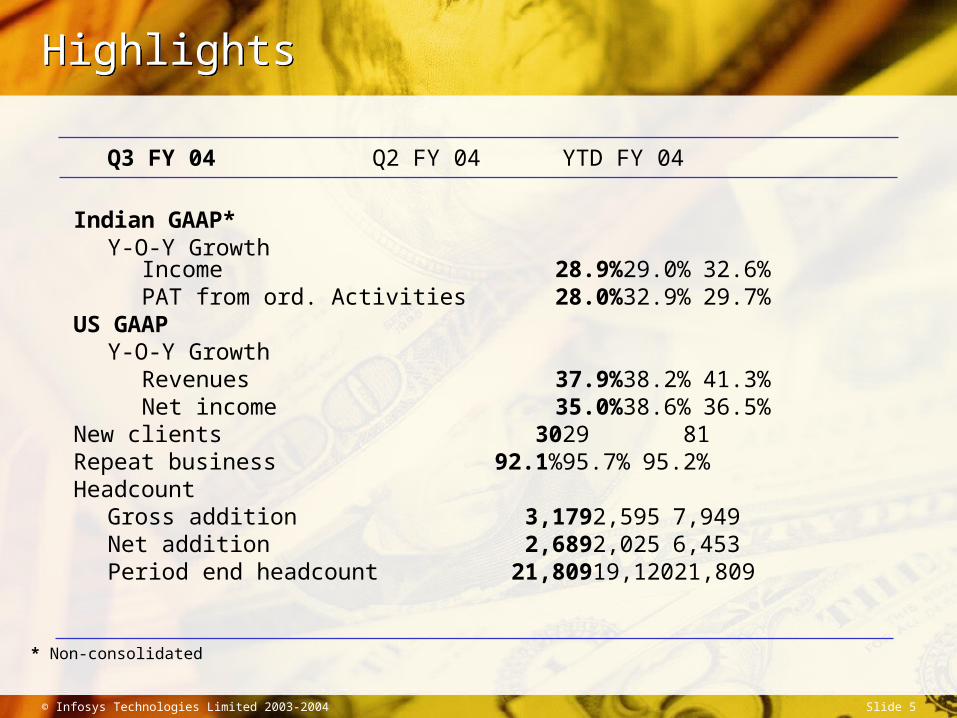
Q3 FY 04 Q2 FY 04 YTD FY 04
Indian GAAP*Y-O-Y Growth
Income 28.9% 29.0%32.6%
PAT from ord. Activities 28.0% 32.9%29.7%
US GAAPY-O-Y Growth
Revenues 37.9% 38.2%41.3%
Net income 35.0% 38.6%36.5%
New clients 30 29 81Repeat business 92.1% 95.7% 95.2%Headcount
Gross addition 3,179 2,595 7,949Net addition 2,689 2,025 6,453Period end headcount 21,809 19,120 21,809* Non-consolidated

© Infosys Technologies Limited 2003-2004 Slide 6
Highlights (Indian GAAP*-Quarterly)Highlights (Indian GAAP*-Quarterly)
(Rs. crore)
FY2004 FY2004 FY 2003 % growth overQ3 Q2 Q3 Q2 04 Q3 03
Income 1,235.26 1,134.75 958.64 8.9 28.9
S/w development expenses 645.48 587.16 481.62 9.9 34.0
Gross profit 589.78 547.59 477.02 7.7 23.6
S,G&A expenses 179.60 169.16 143.53 6.2 25.1
Operating profit 410.18 378.43 333.49 8.4 23.0
Depreciation 62.23 62.33 49.48 (0.2) 25.8
Operating profit after depreciation 347.95 316.10 284.01 10.1 22.5
Other income 47.48 44.28 29.80 7.2 59.3
Provision for investment 2.29 0.22 - - -
PBT 393.14 360.16 313.81 9.2 25.3
Provision for tax 65.00 60.00 57.50 8.3 13.0
PAT from ordinary activities 328.14 300.16 256.31 9.3 28.0
* Non-consolidated
© Infosys Technologies Limited 2003-2004 Slide 7
Balance Sheet Summary*Balance Sheet Summary*
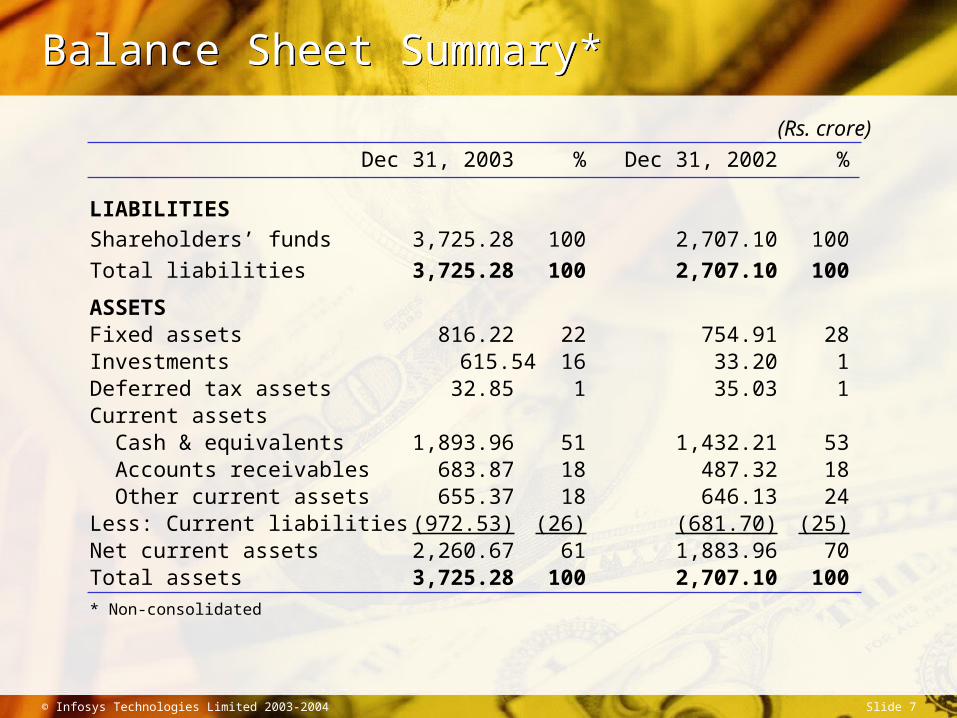
(Rs. crore)
Dec 31, 2003 % Dec 31, 2002 %
LIABILITIES
Shareholders’ funds 3,725.28 100 2,707.10 100
Total liabilities 3,725.28 100 2,707.10 100
ASSETS Fixed assets 816.22 22 754.91 28Investments 615.54 16 33.20 1Deferred tax assets 32.85 1 35.03 1Current assets Cash & equivalents 1,893.96 51 1,432.21 53 Accounts receivables 683.87 18 487.32 18 Other current assets 655.37 18 646.13 24Less: Current liabilities (972.53) (26) (681.70) (25)Net current assets 2,260.67 61 1,883.96 70Total assets 3,725.28 100 2,707.10 100
* Non-consolidated

© Infosys Technologies Limited 2003-2004 Slide 8
Region wise RevenueRegion wise Revenue
%
FY2004 FY2004 FY2003 FY2004 FY 2003
Q3 Q2 Q3 YTD YTD
North America 72.2 73.9 74.2 73.5 73.5
Europe 20.7 18.0 16.4 18.8 17.3
India 0.6 1.6 1.2 1.4 1.8
Rest of the world 6.5 6.5 8.2 6.3 7.4
Total 100.0 100.0 100.0 100.0 100.0

© Infosys Technologies Limited 2003-2004
Operational PerformanceOperational Performance

© Infosys Technologies Limited 2003-2004 Slide 10
UtilizationUtilization
82.5%74.3%
83.8%
73.1%
0.0%
100.0%
Q3 FY 2004 Q2 FY 2004
Q3 FY 2004 73.1% 82.5%
Q2 FY 2004 74.3% 83.8%
Including trainees Excluding trainees

© Infosys Technologies Limited 2003-2004 Slide 11
Revenues by Project typeRevenues by Project type
%
FY2004 FY2004 FY2003 FY2004 FY2003Q3 Q2 Q3 YTD YTD
Fixed Price 34.7 35.4 37.6 35.3 36.5
Time & Material 65.3 64.6 62.4 64.7 63.5
Total 100.0 100.0 100.0 100.0 100.0

© Infosys Technologies Limited 2003-2004 Slide 12
Onsite-Offshore RevenueOnsite-Offshore Revenue
%
FY2004 FY2004 FY2003 FY2004 FY2003
Q3 Q2 Q3 YTD YTD
Onsite 53.4 54.1 58.0 54.5 54.4
Offshore 46.6 45.9 42.0 45.5 45.6
Total 100.0 100.0 100.0 100.0 100.0

© Infosys Technologies Limited 2003-2004 Slide 13
Customer ConcentrationCustomer Concentration
FY2004 FY2004 FY 2003Q3 Q2 Q3
Top client contribution to revenues 5.5% 6.6% 6.3%
Top 5 client contribution to revenues 22.8% 24.6% 23.8%
Top 10 client contribution to revenues 36.1% 37.9% 37.9%
“Million” dollar clients*(No’s) 130 119 99
“Five-million” dollar clients*(No’s) 48 40 30
“Ten-million” dollar clients*(No’s) 22 22 14
“Twenty-million” dollar clients*(No’s) 10 10 7
“Thirty-million” dollar clients*(No’s) 6 5 3
“Forty-million” dollar clients*(No’s) 4 3 -
“Fifty-million” dollar clients*(No’s) 2 - -
* LTM

© Infosys Technologies Limited 2003-2004
Client Acquisition & Expansion of ServicesClient Acquisition &
Expansion of Services
© Infosys Technologies Limited 2003-2004 Slide 15
Client Acquisition & Expansion of ServicesClient Acquisition & Expansion of Services
Client acquisitions during the quarter were 30
In the telecom sector, Infosys saw the addition of leading corporations to its clients list
A premier wireless carrier in the US chose Infosys to design, develop and deploy a
financial and marketing data mart that will help the organisation analyze its financial
performance
One of the Canada’s leading communications companies, providing wireline and
wireless telecommunication products, applications and services, also started working
with the company during the quarter
Infosys was selected by a growing telecom business process outsourcing provider in
the US to partner in the development of its order and inventory management systems
In the Asia Pacific region, a premier telecommunications carrier chose Infosys to help
them increase the effectiveness of their integrated telecommunications services
Another key client added is a leading provider of highly integrated silicon solutions that
enable broadband communications and networking of voice, video and data services

© Infosys Technologies Limited 2003-2004 Slide 16
Client Acquisition & Expansion of ServicesClient Acquisition & Expansion of Services
High-tech companies are finding new ways of improving knowledge and expertise in cutting edge technology An industry leader providing global data and IP network and integration services for
multinational businesses has engaged Infosys in the design, development and support of its global CRM applications
The world’s leading supplier of process control and yield management solutions for the semiconductor and related microelectronics industries also established a partnership with Infosys during the last quarter
Other key client addition in this sector includes a world leader in integrated IT and eProcessing solutions for the financial services industry and a corporation providing global automated international trade management solutions
Media and Entertainment Industry Infosys made significant progress in Media and Entertainment industry with the
addition of three global leaders One of the world’s premier media and entertainment companies chose Infosys to help
them with some of their technology initiatives Infosys has been signed up to assist a global provider of news, data and analysis in
providing accurate and real-time information
© Infosys Technologies Limited 2003-2004 Slide 17
Client Acquisition & Expansion of ServicesClient Acquisition & Expansion of Services
Automobile and Aerospace Industry Infosys partnered with a leader in lumbar and seating comfort technology, to create an
IT strategy that will help streamline its manufacturing processes Infosys has also established relationship with a leading supplier of injection molding
equipment in Canada
Retail Industry Infosys reinforced its position in this segment in the US by adding to its client base a
renowned supplier of specialty outdoor gear and a nationwide chain of superstores in the US, selling domestic merchandise and home furnishings
Financial services
Infosys enhanced its presence in the financial services space by establishing a relationship with a global investment bank based in the UK. The bank chose Infosys to strengthen critical elements of its infrastructure across several locations in the world
Health Care Infosys has started working with a non-profit, independent, regional healthcare
provider in US
© Infosys Technologies Limited 2003-2004 Slide 18
Banking ProductsBanking Products
Infosys Banking Business Unit (BBU) made significant headway in several countries this quarter
One of the premier public sector banks headquartered in Bangalore, India with over 800 branches has chosen to deploy Finacle®
One of the leading bank headquartered in Mauritius, signed up with Infosys to deploy Finacle® making it the fifth among nine banks in the island nation to use the product
With the addition of a bank in Zimbabwe to its client base, Infosys has extended its footprint to seven countries in the African continent.
BBU also established its presence in China this quarter, with one of the leading banks choosing Finacle® for its branches

© Infosys Technologies Limited 2003-2004
Human ResourcesHuman Resources

© Infosys Technologies Limited 2003-2004 Slide 20
Human ResourcesHuman Resources
Total employee strength at 21,809 as on December 31, 2003, up
from 19,120 as on September 30, 2003
Net addition of 2,689 employees during the quarter as compared
to 2,025 during the quarter ended September 30, 2003
Gross addition of employees during the quarter was 3,179, out of
which 545 were laterals
20,253 software professionals as on December 31, 2003, up from
17,625 as on September 30, 2003
Of these 20,253 software professionals, 544 belong to the
Banking Business Unit

© Infosys Technologies Limited 2003-2004
Capex and InfrastructureCapex and Infrastructure

© Infosys Technologies Limited 2003-2004 Slide 22
Capex and InfrastructureCapex and Infrastructure
Capital expenditure of Rs.85.19 crore was incurred during the quarter
As on December 31, 2003, the company had 38,01,250 sq.ft. of space capable of accommodating 20,660 seats and 12,65,000 sq.ft. under completion capable of accommodating 7,320 seats

© Infosys Technologies Limited 2003-2004
ProgeonProgeon

© Infosys Technologies Limited 2003-2004 Slide 24
Highlights (Indian GAAP-Quarterly)Highlights (Indian GAAP-Quarterly)
(Rs. crore)
FY2004 FY2004 FY2003 % growth overQ3 Q2 Q3 Q2 04
Revenue from BPM services 21.79 17.08 8.21 27.6
Cost of revenues 13.05 9.57 6.91 36.4
Gross profit / (Loss) 8.74 7.51 1.30 16.4
S,G&A expenses 7.82 6.22 2.98 25.7
Operating profit / (Loss) 0.92 1.29 (1.68) (28.7)
Depreciation 1.52 1.09 0.57 39.4
Operating profit / (loss) after depreciation (0.60) 0.20 (2.25) -
Other income 0.97 0.62 0.85 56.4
Profit / (Loss) before tax 0.37 0.82 (1.40) (54.9)
Provision for tax - - - -
Profit / (Loss) after tax from
ordinary activities 0.37 0.82 (1.40) (54.9)

© Infosys Technologies Limited 2003-2004 Slide 25
Other HighlightsOther Highlights
Added 1 client during the quarterTotal employee strength at 1,400 as on December 31,
2003, up from 1,038 as on September 30, 2003Net addition of 362 employees during the quarter as
compared to 156 during the quarter ended September 30, 2003

© Infosys Technologies Limited 2003-2004
Outlook for the FutureOutlook for the Future

© Infosys Technologies Limited 2003-2004 Slide 27
Indian GAAPIndian GAAP
Quarter ending March 31, 2004
Infosys non-consolidated Income from software development services and products is
projected to be between Rs.1,260 crore and Rs.1,269 crore
Earnings per share is expected to be Rs.49.50
Infosys consolidated Income from software development services and products is
projected to be between Rs.1,319 crore and Rs.1,331 crore
Earnings per share is expected to be Rs.49.70

© Infosys Technologies Limited 2003-2004 Slide 28
Indian GAAPIndian GAAP
Fiscal year ending March 31, 2004
Infosys non-consolidated Income from software development services and products is
projected to be between Rs.4,712 crore and Rs.4,721 crore
Earnings per share is expected to be Rs.186.20
Infosys consolidated Income from software development services and products is
projected to be between Rs.4,823 crore and Rs.4,835 crore
Earnings per share is expected to be Rs.186.70

© Infosys Technologies Limited 2003-2004
SummarySummary

© Infosys Technologies Limited 2003-2004 Slide 30
SummarySummary
Pricing has been stable
Margins have been maintained
Reorganised Infosys to face new challenges – increased expectations
from clients, a fast-changing economy and a new competitive scenario
Enhanced focus on vertical markets and on providing business
solutions leveraging technology using our Global Delivery Model
Initiatives on increasing work offshore continue to yield results
Added several high-quality clients in the high-tech and financial services
sectors, in addition to leading communication service providers
Our billing for two clients, on a LTM basis, has crossed $50 million each
Completed acquisition of Expert Information Systems Pty. Limited,
Australia and we are working towards a seamless integration
Incorporated wholly owned subsidiary in China

© Infosys Technologies Limited 2003-2004
Thank YouThank You