- innovation centre research - electric vehicle projects
TRANSCRIPT
- Innovation Centre Research -Electric Vehicle Projects
UNECE EVE 34th Session - March 24th, 2020Samuel Pedroso, Research Development Officer
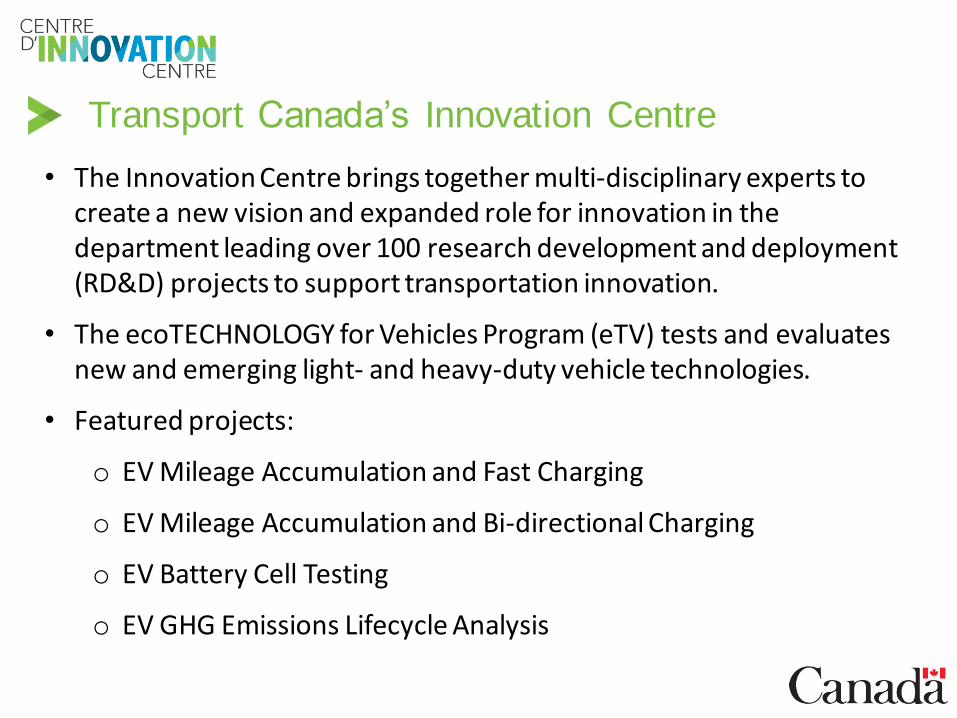
Transport Canada’s Innovation Centre
• The Innovation Centre brings together multi-disciplinary experts to create a new vision and expanded role for innovation in the department leading over 100 research development and deployment (RD&D) projects to support transportation innovation.
• The ecoTECHNOLOGY for Vehicles Program (eTV) tests and evaluates new and emerging light- and heavy-duty vehicle technologies.
• Featured projects:
o EV Mileage Accumulation and Fast Charging
o EV Mileage Accumulation and Bi-directional Charging
o EV Battery Cell Testing
o EV GHG Emissions Lifecycle Analysis
2
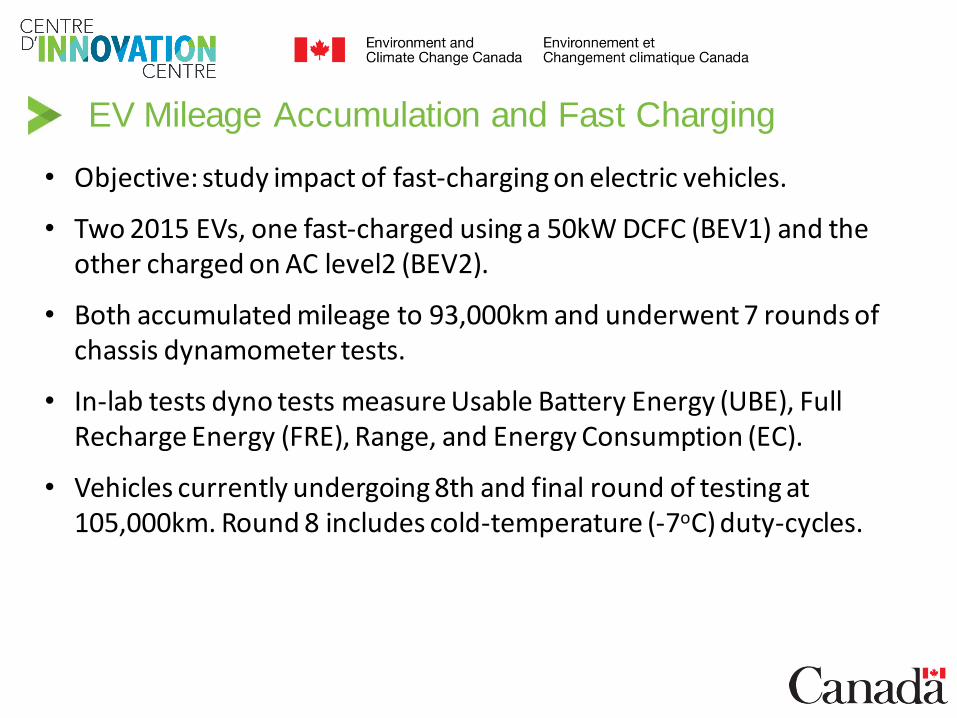
• Objective: study impact of fast-charging on electric vehicles.
• Two 2015 EVs, one fast-charged using a 50kW DCFC (BEV1) and the other charged on AC level2 (BEV2).
• Both accumulated mileage to 93,000km and underwent 7 rounds of chassis dynamometer tests.
• In-lab tests dyno tests measure Usable Battery Energy (UBE), Full Recharge Energy (FRE), Range, and Energy Consumption (EC).
• Vehicles currently undergoing 8th and final round of testing at 105,000km. Round 8 includes cold-temperature (-7oC) duty-cycles.
3
EV Mileage Accumulation and Fast Charging
4
EV Mileage Accumulation and Fast Charging
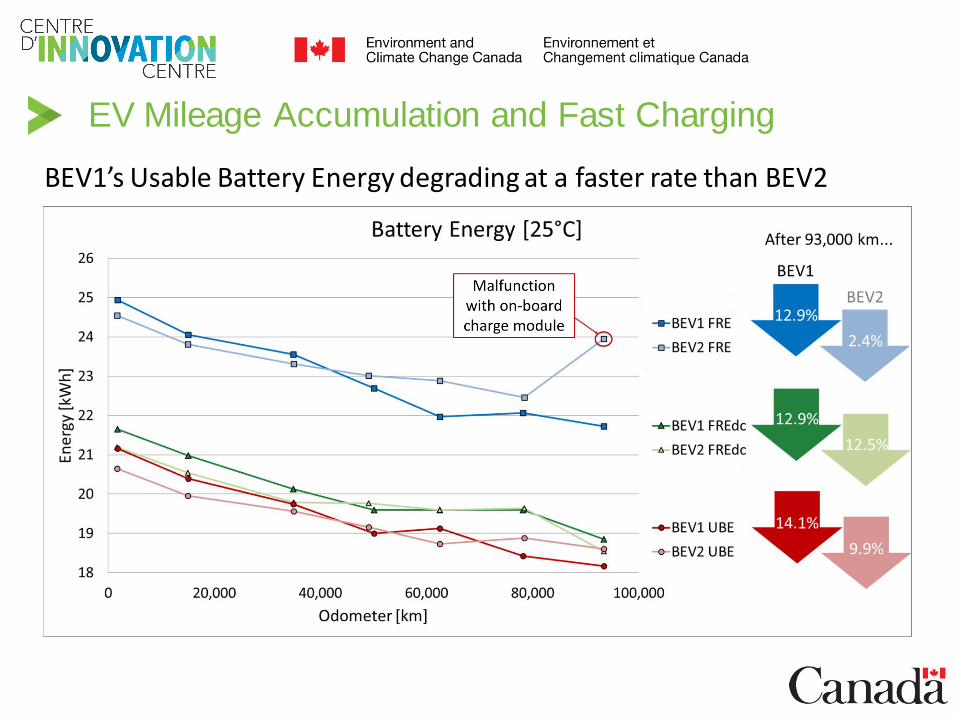
BEV1’s Usable Battery Energy degrading at a faster rate than BEV2
5
EV Mileage Accumulation and Fast Charging
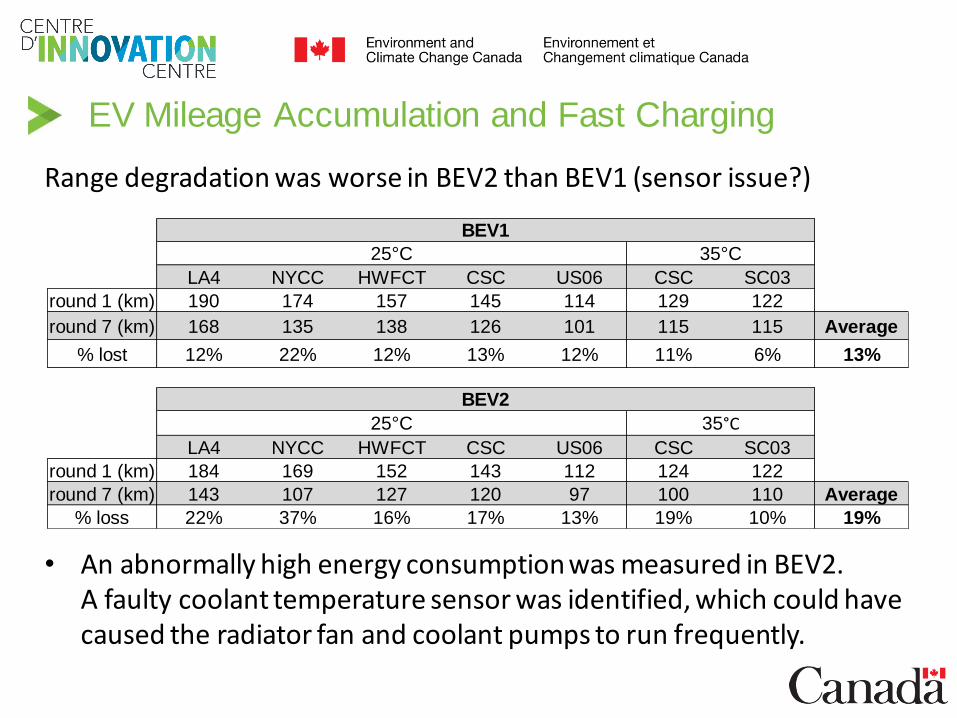
Range degradation was worse in BEV2 than BEV1 (sensor issue?)
• An abnormally high energy consumption was measured in BEV2. A faulty coolant temperature sensor was identified, which could have caused the radiator fan and coolant pumps to run frequently.
LA4 NYCC HWFCT CSC US06 CSC SC03
round 1 (km) 184 169 152 143 112 124 122
round 7 (km) 143 107 127 120 97 100 110 Average
% loss 22% 37% 16% 17% 13% 19% 10% 19%
BEV2
25°C 35°C
LA4 NYCC HWFCT CSC US06 CSC SC03
round 1 (km) 190 174 157 145 114 129 122
round 7 (km) 168 135 138 126 101 115 115 Average
% lost 12% 22% 12% 13% 12% 11% 6% 13%
BEV1
25°C 35°C
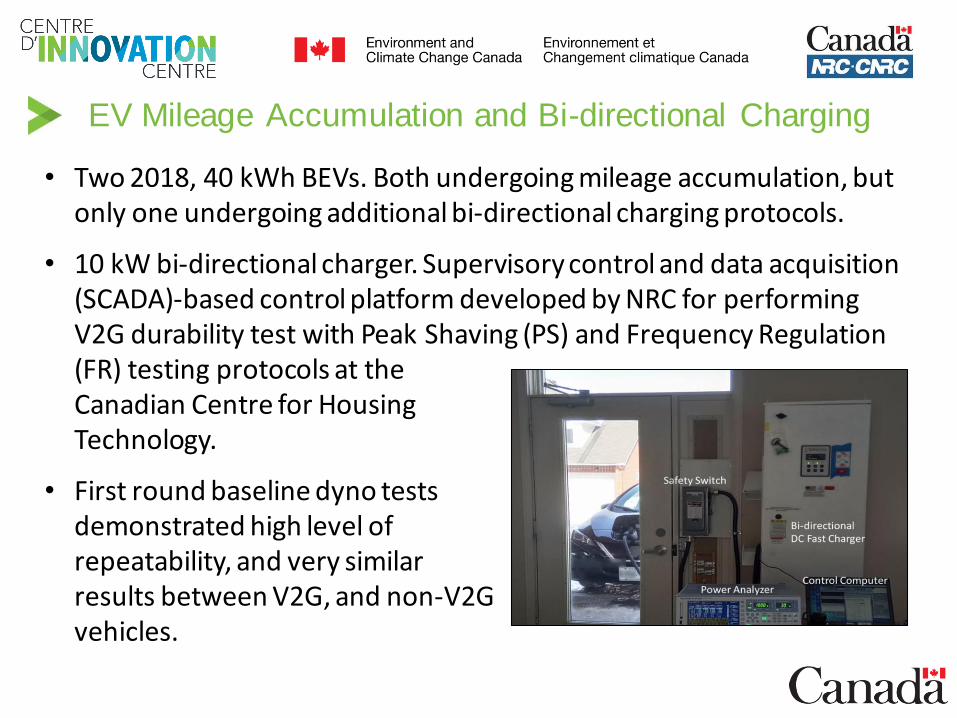
• Two 2018, 40 kWh BEVs. Both undergoing mileage accumulation, but only one undergoing additional bi-directional charging protocols.
• 10 kW bi-directional charger. Supervisory control and data acquisition (SCADA)-based control platform developed by NRC for performing V2G durability test with Peak Shaving (PS) and Frequency Regulation (FR) testing protocols at the Canadian Centre for Housing Technology.
• First round baseline dyno testsdemonstrated high level of repeatability, and very similar results between V2G, and non-V2G vehicles.
6
EV Mileage Accumulation and Bi-directional Charging
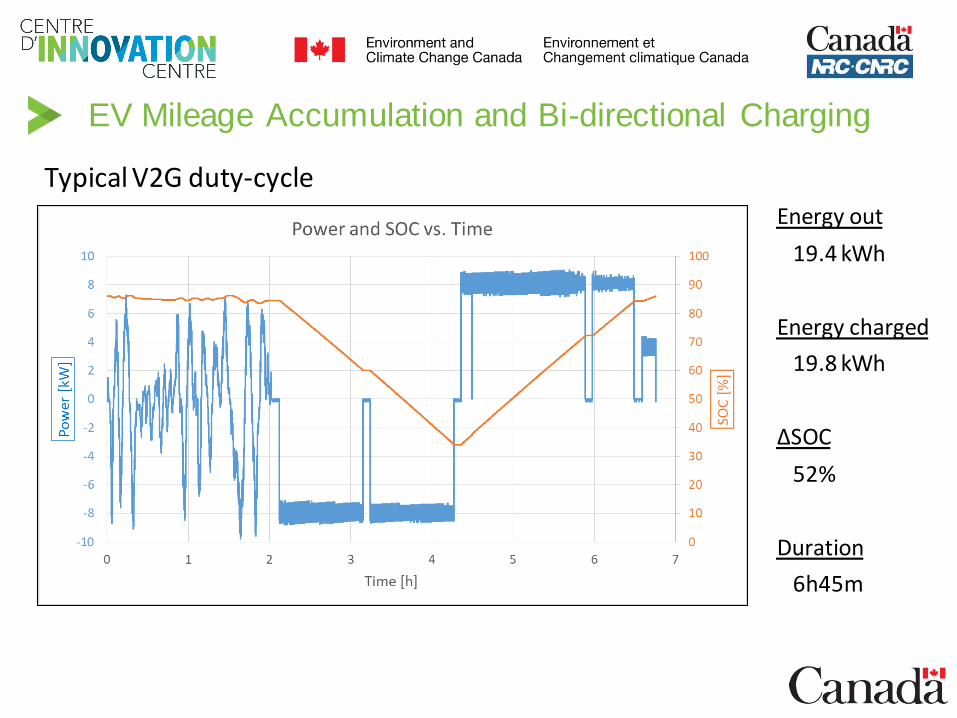
Typical V2G duty-cycle
7
EV Mileage Accumulation and Bi-directional Charging
Energy out
19.4 kWh
Energy charged
19.8 kWh
ΔSOC
52%
Duration
6h45m
• Multi-year project with NRC to investigate impacts of cold temperatures on cell performance and durability, and methods of determining long-term battery durability.
• NRC developed a unique apparatus for testing cold temperature durability of EV battery cells. Heat generated in cells is removed as it get generated from within the cell, allowing for isothermal conditions.
• Cells tested include “fresh” BEV, PHEV, and HEV cells, as well as two high-mileage PHEV cells. Test temperatures range from -5oC to 45oC.
• High-Precision Coulometry continues to be investigated as a potential long-term durability benchmark and method of assessing battery health.
• Additional tasks include looking into possibility of converting standard drive cycles (e.g. LA4, US06, NYCTaxi) into usable cell-level test schedule. 8
Electric Vehicle Battery Cell Testing
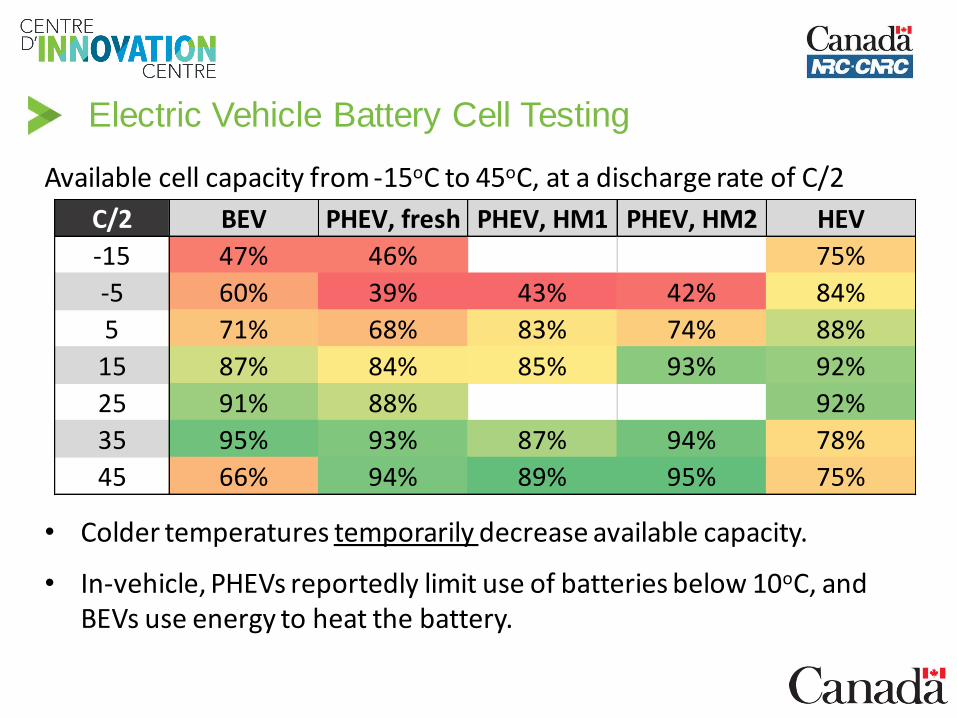
Available cell capacity from -15oC to 45oC, at a discharge rate of C/2
9
Electric Vehicle Battery Cell Testing
• Colder temperatures temporarily decrease available capacity.
• In-vehicle, PHEVs reportedly limit use of batteries below 10oC, and BEVs use energy to heat the battery.
C/2 BEV PHEV, fresh PHEV, HM1 PHEV, HM2 HEV
-15 47% 46% 75%
-5 60% 39% 43% 42% 84%
5 71% 68% 83% 74% 88%
15 87% 84% 85% 93% 92%
25 91% 88% 92%
35 95% 93% 87% 94% 78%
45 66% 94% 89% 95% 75%
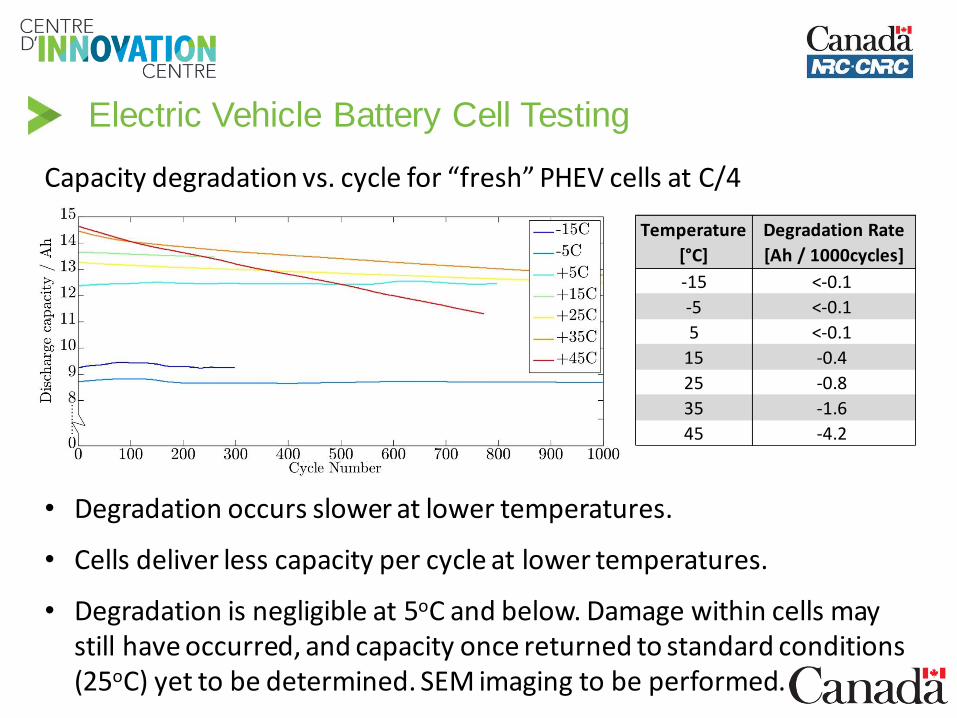
Capacity degradation vs. cycle for “fresh” PHEV cells at C/4
10
Electric Vehicle Battery Cell Testing
• Degradation occurs slower at lower temperatures.
• Cells deliver less capacity per cycle at lower temperatures.
• Degradation is negligible at 5oC and below. Damage within cells may still have occurred, and capacity once returned to standard conditions (25oC) yet to be determined. SEM imaging to be performed.
Temperature
[°C]
Degradation Rate
[Ah / 1000cycles]
-15 <-0.1
-5 <-0.1
5 <-0.1
15 -0.4
25 -0.8
35 -1.6
45 -4.2
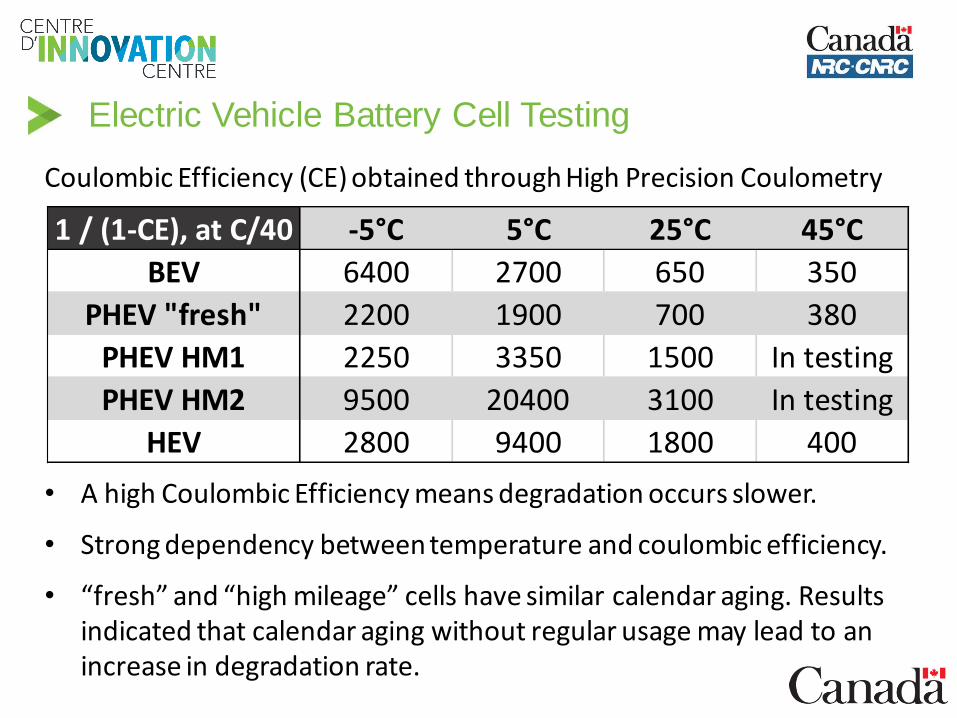
Coulombic Efficiency (CE) obtained through High Precision Coulometry
11
Electric Vehicle Battery Cell Testing
1 / (1-CE), at C/40 -5°C 5°C 25°C 45°C
BEV 6400 2700 650 350
PHEV "fresh" 2200 1900 700 380
PHEV HM1 2250 3350 1500 In testing
PHEV HM2 9500 20400 3100 In testing
HEV 2800 9400 1800 400
• A high Coulombic Efficiency means degradation occurs slower.
• Strong dependency between temperature and coulombic efficiency.
• “fresh” and “high mileage” cells have similar calendar aging. Results indicated that calendar aging without regular usage may lead to an increase in degradation rate.
• NRC developed a GHG emissions LCA model to evaluate the emissions from manufacturing, delivery, operation, maintenance, and disposal of EVs.
• LCA emission sensitivities include: o Lifetime mileage (50,000, 150,000, and 250,000 km)o Provincial grid emission intensity (EI) (~30g to 800g CO2eq/kWh)o Vehicle class (car, SUV, light truck, minivan)o Powertrains (ICE, HEV, PHEV, BEV, FCEV)
• Furthermore, NRC expanded their model to assess the impact of charging behaviors on emissions. Average and Marginal Emission Factor approaches (AEF vs. MEF) were compared.
• An electric HDV LCA was performed, as well as a lifecycle inventory for novel battery chemistries (Solid-state li-ion, and NMC 811).
12
EV GHG Emissions Lifecycle Analysis
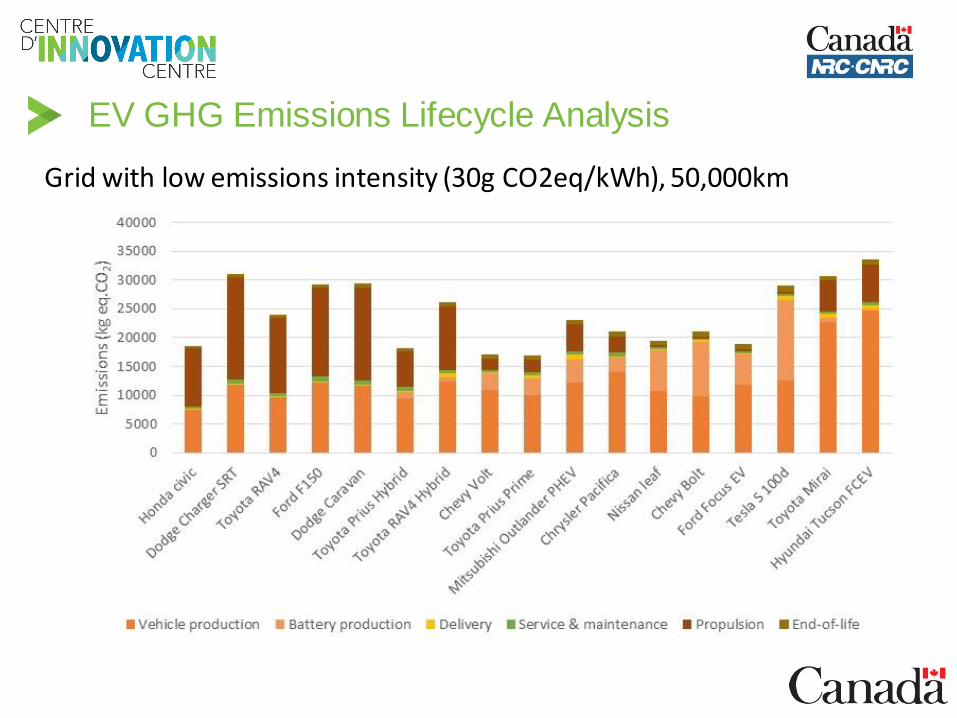
Grid with low emissions intensity (30g CO2eq/kWh), 50,000km
13
EV GHG Emissions Lifecycle Analysis
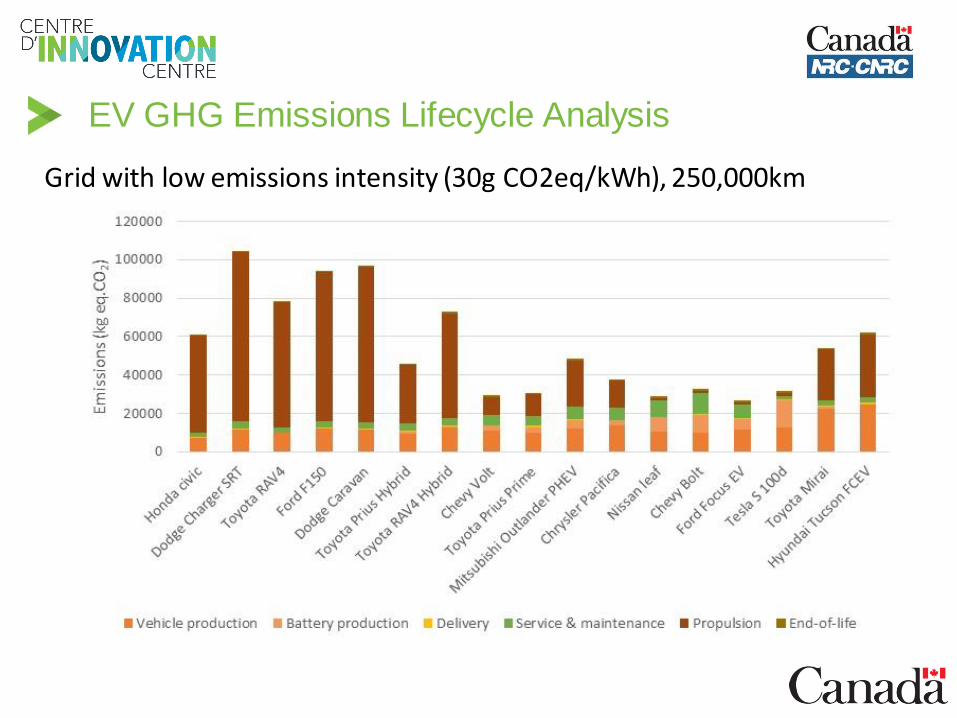
Grid with low emissions intensity (30g CO2eq/kWh), 250,000km
14
EV GHG Emissions Lifecycle Analysis
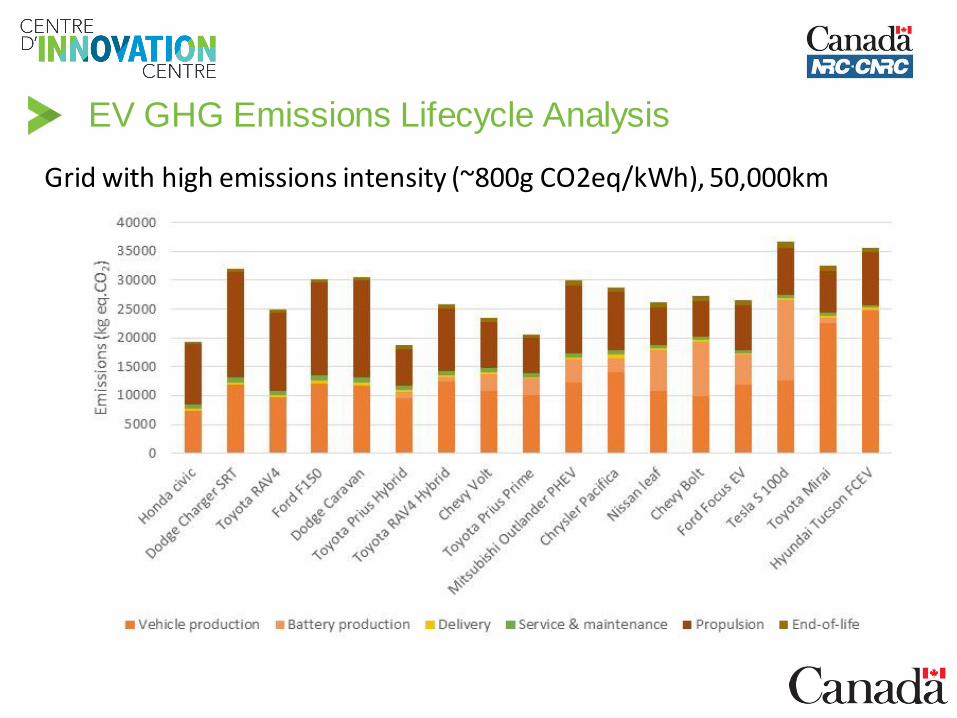
Grid with high emissions intensity (~800g CO2eq/kWh), 50,000km
15
EV GHG Emissions Lifecycle Analysis
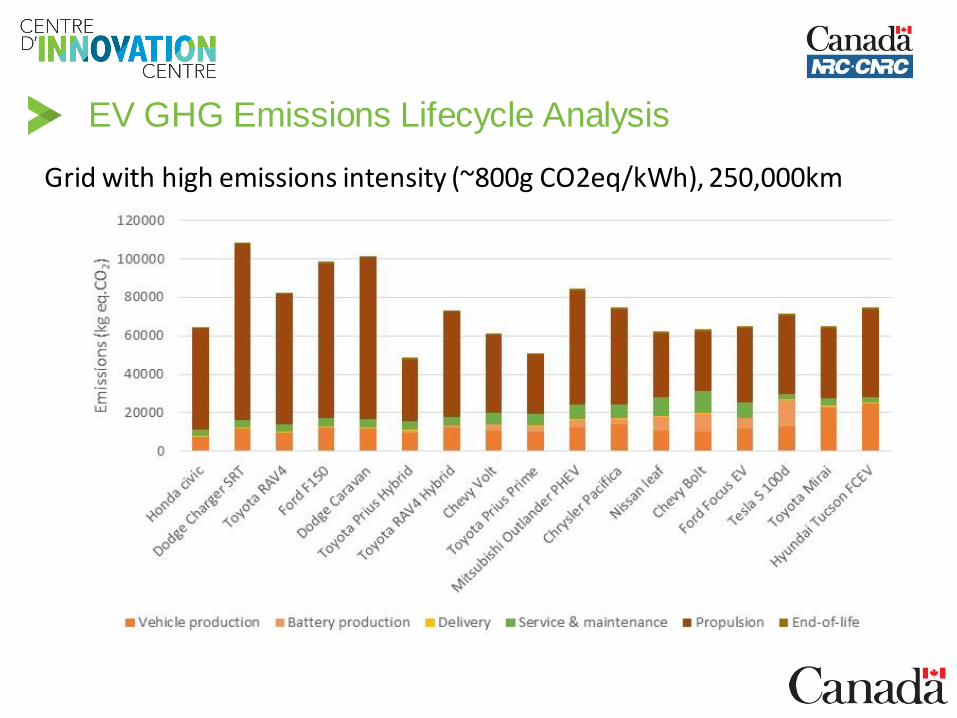
Grid with high emissions intensity (~800g CO2eq/kWh), 250,000km
16
EV GHG Emissions Lifecycle Analysis
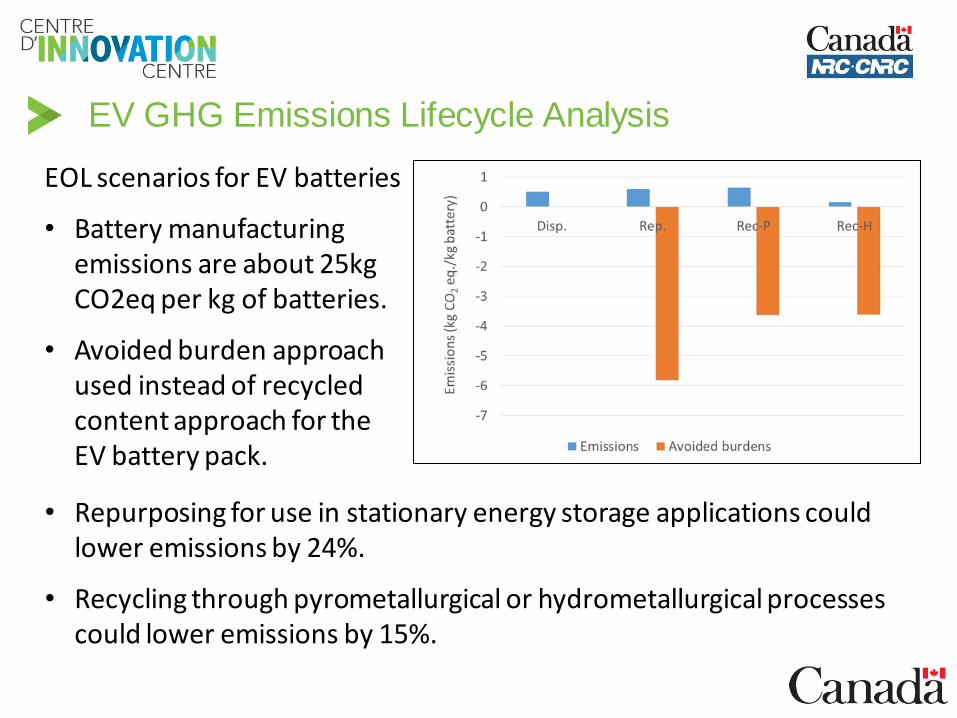
EOL scenarios for EV batteries
• Battery manufacturing emissions are about 25kg CO2eq per kg of batteries.
• Avoided burden approach used instead of recycled content approach for the EV battery pack.
17
EV GHG Emissions Lifecycle Analysis
• Repurposing for use in stationary energy storage applications could lower emissions by 24%.
• Recycling through pyrometallurgical or hydrometallurgical processes could lower emissions by 15%.
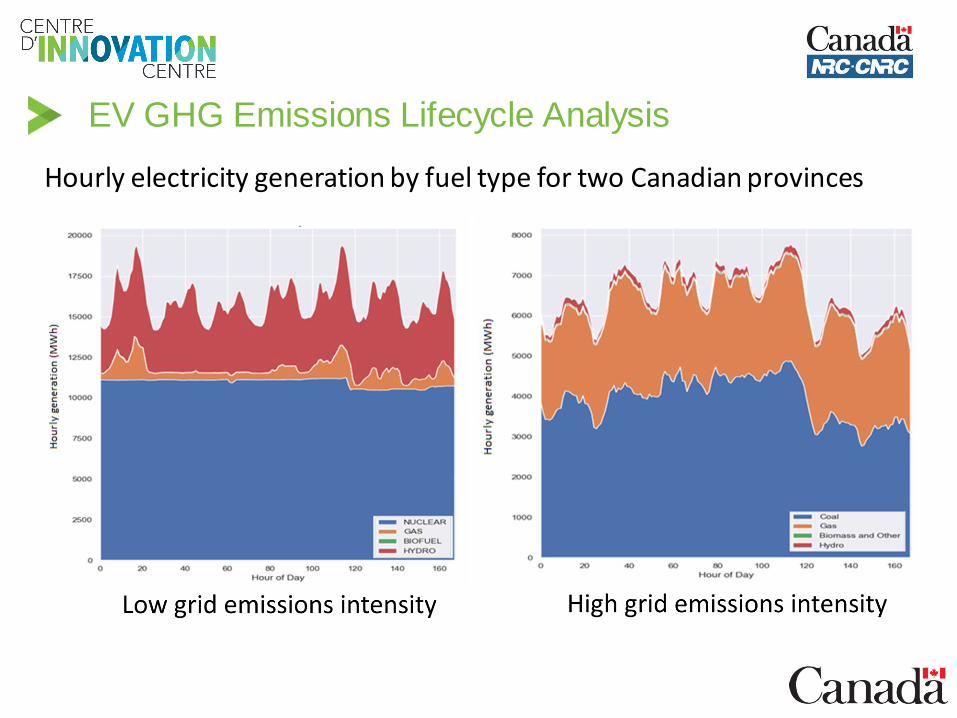
Hourly electricity generation by fuel type for two Canadian provinces
18
EV GHG Emissions Lifecycle Analysis
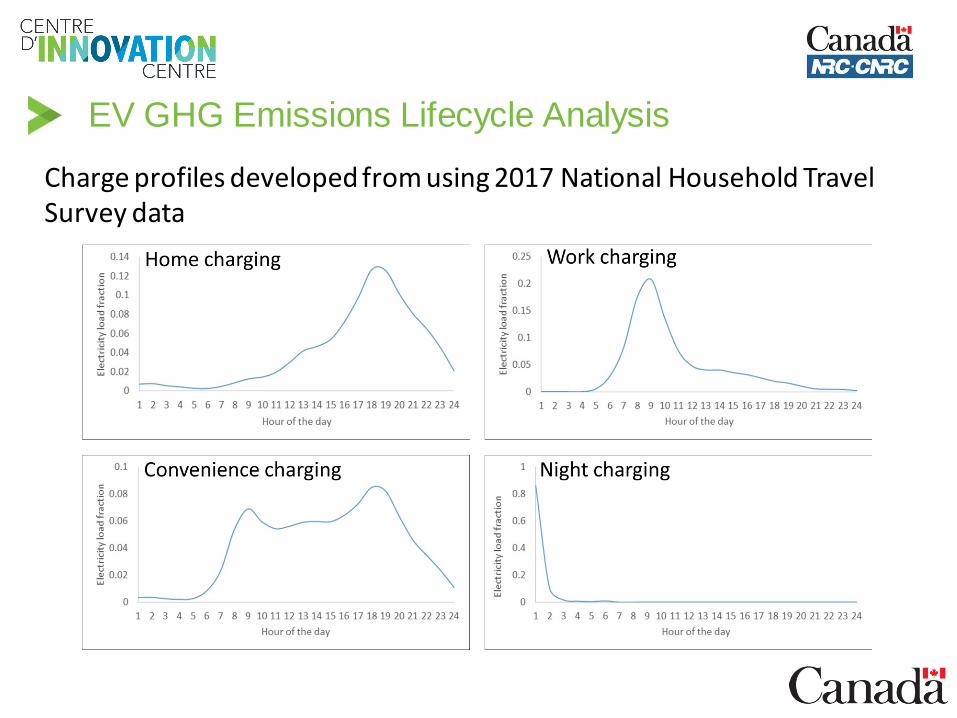
Charge profiles developed from using 2017 National Household Travel Survey data
19
EV GHG Emissions Lifecycle Analysis
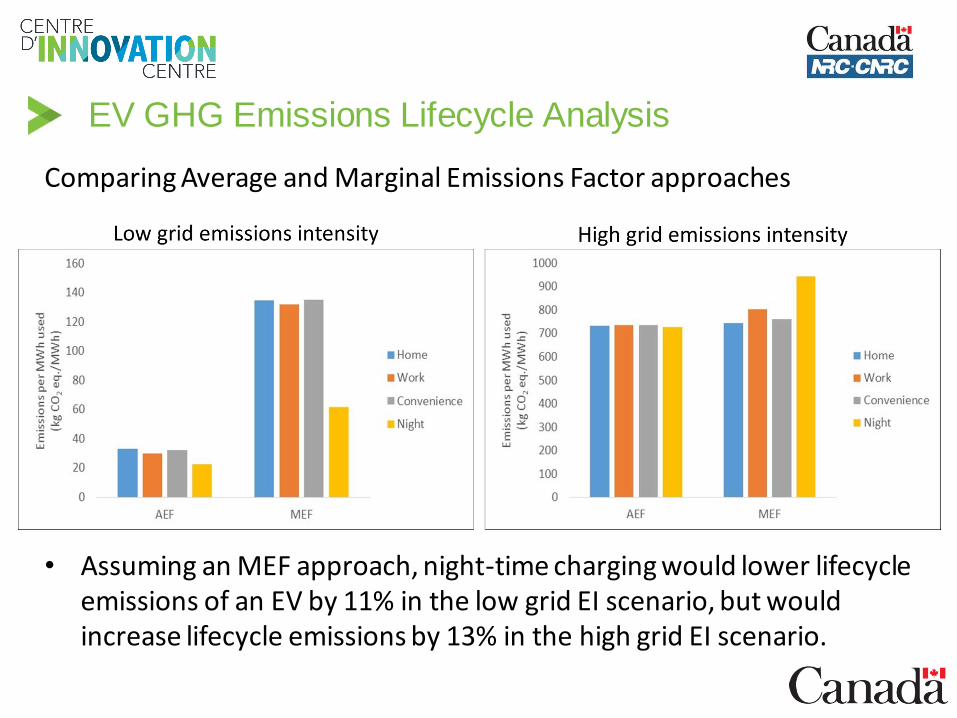
Comparing Average and Marginal Emissions Factor approaches
20
EV GHG Emissions Lifecycle Analysis
• Assuming an MEF approach, night-time charging would lower lifecycle emissions of an EV by 11% in the low grid EI scenario, but would increase lifecycle emissions by 13% in the high grid EI scenario.