配布用 ir資料fy2014 2q決算(e) - corporate.m3.com…布用_ir資料fy2014...
TRANSCRIPT
33M3, Inc.Earnings Presentation Material
M3, Inc.Earnings Presentation Materialgg
October 2014October 2014
Copyright © 2014 M3, Inc. All rights reserved.

The following presentation contains forecasts, future plans, management targets and other forward-looking projections relating to M3 Inc and/or its group These statements are drawnrelating to M3, Inc. and/or its group. These statements are drawn from assumptions of future events based on data currently available to us, and there exist possibilities that such assumptions are objectively incorrect and/or may produce p j y y pdiffering actual results from those mentioned in the statements.
Furthermore, information and data other than those concerning the Company and its subsidiaries/affiliates are quoted from publicthe Company and its subsidiaries/affiliates are quoted from public information, and the Company has not verified and will not warrant its accuracy or dependency.
M3, Inc.
Copyright © 2014 M3, Inc. All rights reserved. 1

Current Business Situation and Outlook
Copyright © 2014 M3, Inc. All rights reserved. 2

SummaryFY H1 sales grew at +21% yoy. Continuing expansion pace
marked during last FY H2. MR kunMR kun
FY H1 sales grew at +28% yoy totaling 3.2 bn yen, with operating profit of 1.1 bn yen at +48% yoy. The mainstay service for doctors provided traction growing at 52% yoy
M3 CareerM3 Career
New orders remained strong, totaling 16.7 bn yen. Boosted f t i t t i h d t t t i
service for doctors provided traction, growing at 52% yoy.
upfront investment in headcount to support growing demand.
Moving costs for MPI(and others) amounted to 180 mn yen
Evidence SolutionEvidence Solution
(1Q:40 mn yen, 2Q:140 mn yen)
Segment profit was 630 mn yen, continuing its expansion at +49% yoy+49% yoy
Membership on China site topped 1mio doctors, increasing coverage to nearly 50%. Marketing business for pharma
i t dil i d d i l MR k
OverseasOverseas
Copyright © 2014 M3, Inc. All rights reserved.
companies steadily increased, producing surplus. MR-kun service launch in pipeline for 2 pharma companies.
3

Summary continued
Established and initiated operations at M3 Marketing, Inc. as a spin-off of CSO segment from MPI . The new company outsources e savvy and more productive “Medical
New Group FirmsNew Group Firms outsources e-savvy and more productive “Medical
Marketers” (compared to traditional MRs) to pharma co’s.FirmsFirms
Upfront investments in anticipation for future growth, such as office relocation and recruitment fees, amounted to 0.7 ~ 1.1 bn yen in FY14 1H.
Provisional Costs
Provisional Costs to 0.7 1.1 bn yen in FY14 1H.
Copyright © 2014 M3, Inc. All rights reserved.4
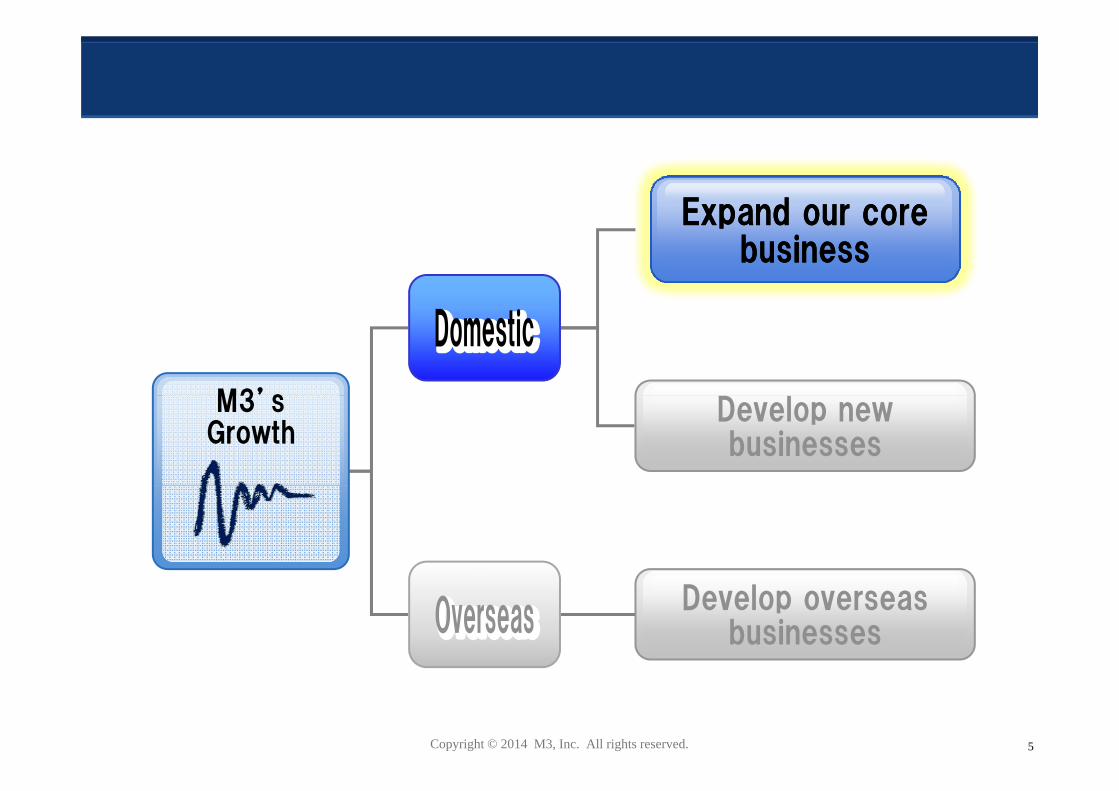
Expand our coreExpand our coreExpand our core business
Expand our core business
M3’s Develop new businesses
M3 s Growth
Develop overseas businesses
Copyright © 2014 M3, Inc. All rights reserved. 5

Doctors’ Information Collection Venue vsPharma’s Marketing Cost Allocation
Doctors spend the most time collecting information via the Internet. Conversely, pharmaceutical firms spend the majority of their budget on MR related costs
Time spent collecting information
PR costs for pharmacompanies
majority of their budget on MR related costs.
via Other(Conferences,
a pa
~100 bn yen~7%
( ,Study Groups, Publications, etc.)
44%
via MRMR Related Costs~1.5 tn yen
17% 92%
via Internet 39%
Copyright © 2014 M3, Inc. All rights reserved. 6
~ 20 bn yenSource: M3 research
~1%

Japanese Pharma’s Huge Marketing Costs
HeadHead AnnualAnnual CostCostHead Head CountCount
Annual Annual Cost Cost per Headper Head
63,000 ¥20 mnMRsMRs(pharmaceutical (pharmaceutical
companies)companies)×× == ¥1.2 tn
MSsMSs++
MSsMSs(pharmaceutical (pharmaceutical
wholesalers)wholesalers)30,000 ¥10 mn == ¥300bn××
TotalTotal Marketing Cost for the industry:Marketing Cost for the industry: ¥¥1 2 ~ 1 51 2 ~ 1 5 tntn
Copyright © 2014 M3, Inc. All rights reserved. 7
Total Total Marketing Cost for the industry: Marketing Cost for the industry: ¥¥1.2 1.5 1.2 1.5 tntnSource: MIX, Research by M3

MR-kun’s Growth Potential in Japan
Currently Potential Market
29 30~35MRMR--kunkunCompanies CompaniesUSERSUSERS Growth
Potentialofof
3~4 timescurrent levels(approx.)
¥350 mnMRMR--kun kun SALESSALES
¥800 mn ~ ¥1 bnper client
via increase in: # f d t¥350 mn
per clientSALESSALES # of products # of member MDs Added value of contents
Major clients Major clients are increasing usage of MRare increasing usage of MR--kun:kun:
t 10t 10 +30+30%%
Copyright © 2014 M3, Inc. All rights reserved.
Average revenue from Average revenue from top 10 top 10 clients grew approx. clients grew approx. +30+30% % YoYYoY
8

Physicians’ Demand for On-Line Detailing
Q. What is the ideal ratio of on-line and off-line promotional information (“details”) from pharma companies?
A
100%100% On-line
On-lineA.
4.7%
80%
60%
20%
40% 75%14.4%
20.0%
50%
40%
50%
60%
35.9%
12.4%
20% 80%
100%100%
11.1%
1.5%According to 400 physicians
100%100% Off-line Off-line
Demand for eDetails is quite high for busy physicians that require timely information at their convenience without the limitations imposed by
Copyright © 2014 M3, Inc. All rights reserved. 9
information at their convenience, without the limitations imposed by their off-line MRsSource: M3 questionnaire to 1,300 physicians

MR-kun: YoY Sales Increase(mn yen)
453
588
452
45 166
464
45
FY12ACT
1Q 2Q 3Q 4Q FY13ACT
1Q 2Q 3Q 4Q FY14FCT
Copyright © 2014 M3, Inc. All rights reserved. 10
The pace of growth marked during last FY 2H continues, and is expected to remain on track for the this FY 2H as well.

MR-kun Annual Fee StructureMR-kun
Base feeDetail fee
Contents Production fee
Operation fee
¥100 per detail sent Production of Basic operations
¥70 mn ¥20 40
¥100 per detail sent Production of customized detail
contents
Basic operations(sending details, replying to physicians’ questions, etc.)
¥30¥70 mn Revised as of Oct.
2005 for new client Prev. fee: ¥60 mio
¥20 ~ 40mn ¥10 mn
ry L
eve
lry
Leve
le p
roduct)
e p
roduct) ¥30 ~ xxx
mn
Entr
Entr
(one
(one
¥130~¥150 mn
¥60 ~70 ¥580 mn ¥200 mn ¥10 mnnts
nts
mn ¥580 mn ¥200 mn ¥10 mn
op 5
op 5
CClielie
Copyright © 2014 M3, Inc. All rights reserved.
To
To
The average of top 5 clients: ¥860 mn11

Expand our coreExpand our core business
D lD lM3’s Develop new businesses
Develop new businesses
M3 s Growth
Develop overseas businesses
Copyright © 2014 M3, Inc. All rights reserved. 12

Consolidated Sales Trend(million yen)
36 887
FY14 FCT50,000
19,040 26,007
36,887
24,633
1,563 2,276 3,854 5,729 7,475 8,534 11,811 14,646 19,040
OverseasDevelopment
19% 20% 22%27% 29% 31%
0% 0% 2% 10% 11% 9% 9% 11% 16% 16% 17% 19%
New business(domestic)81% 80% 76%
27% 29% 31% 40% 43% 44% 49% 55% 59%
Core business(MR-kun)
( )81% 80% 76% 64% 61% 60% 51% 46% 40% 35% 28% 22%
Copyright © 2014 M3, Inc. All rights reserved. 13
FY03 FY04 FY05 FY06 FY07 FY08 FY09 FY10 FY11 FY12 FY13 FY142Q
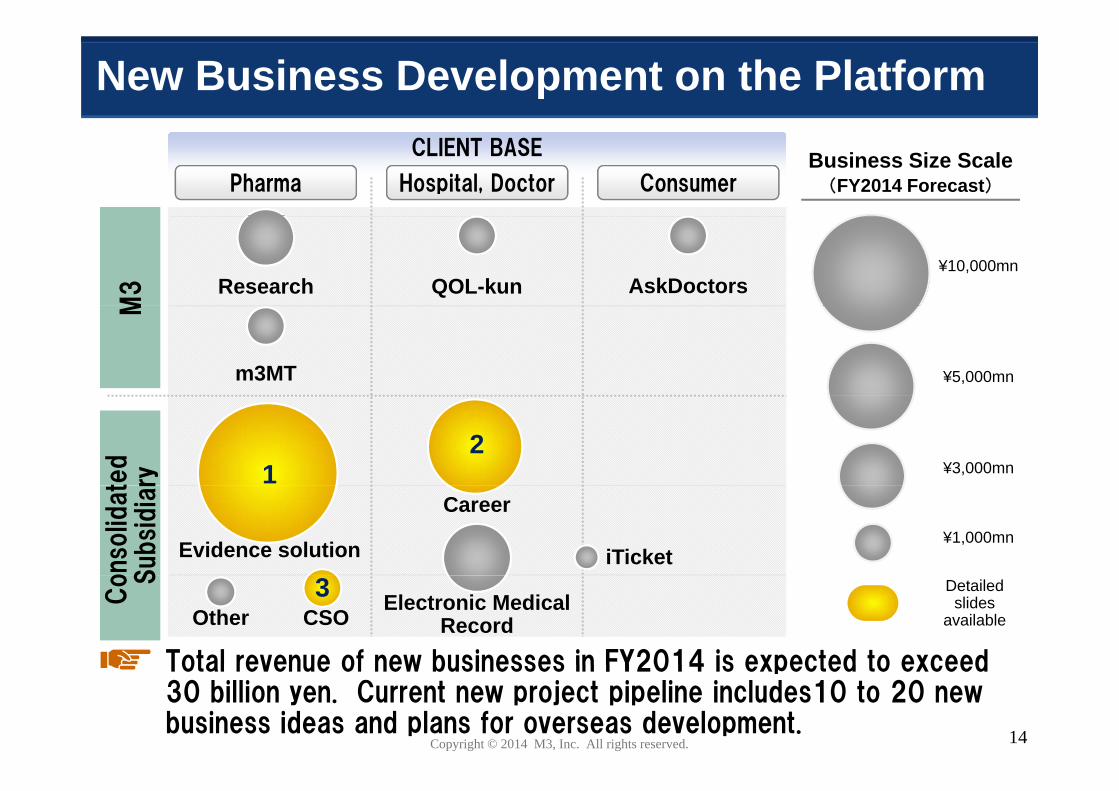
New Business Development on the Platform
Business Size Scale(FY2014 Forecast)
CLIENT BASE
ConsumerHospital, DoctorPharma
Research QOL-kun AskDoctors
M3
¥10,000mn
m3MT ¥5,000mn
M
¥3,000mn
ted
ry 12
Evidence solution
Career
iTicket¥1,000mn
onso
lidat
Subsi
dia
r
OtherElectronic Medical
Record
Detailed slides
available
Co S
Total revenue of new businesses in FY2014 is expected to exceed
CSO3
Copyright © 2014 M3, Inc. All rights reserved.
Total revenue of new businesses in FY2014 is expected to exceed 30 billion yen. Current new project pipeline includes10 to 20 new business ideas and plans for overseas development. 14

Placing Evidence Solution Business in Our Strategy Evid Sol1
“Making use of the Internet to increase, as much as ibl h b f l h li l dpossible, the number of people who can live longer and
healthier lives, and to reduce, as much as possible, the amount of unnecessary medical costs.”
Past Paradigm shifted to online medical 10 years promotion via“MR-kun”
Next Enable the shift to online clinical trials via“Chiken-kun”
Copyright © 2014 M3, Inc. All rights reserved. 15

Patient Enrollment in a Large-Scale Clinical Trial Evid Sol1
In the case of study in the Endocrinology and Metabolism area, m3.com doctors enrolled five times more patients compared to other SMOs:
Nu
1 3001,4001,500
Case studyum
ber o
f pa 900
1,0001,1001,2001,300
atient e
nro
llm 400500600700800900
ment
0100200300400
Other SMOs
A社 B社 C社 D社 E社 F社 G社 H社 I社 J社 K社 L社m3.com
Copyright © 2014 M3, Inc. All rights reserved. 16
Expedited enrollment of cases compared to other SMOs

Number of CRAs by Company Evid Sol1
M3 Group## Company NameCompany Name NumberNumber
1 EPS 8552 Cimic 780
M3 Group 7803 Quintiles 6003 Quintiles 6004 Parexel 5505 MEDISCIENCE PLANNING INC 478MEDISCIENCE PLANNING INC 86 MIC Medical 2607 ACRONET 2008 ASKLEP 1809 Linical 170
M bi 42<MIC research institute ltd>
Number of CRAs within M3 is now at top levels of the
Mebix 42
Copyright © 2014 M3, Inc. All rights reserved. 17
Number of CRAs within M3 is now at top levels of the industry, accelerating the “Shift to Online Trials”
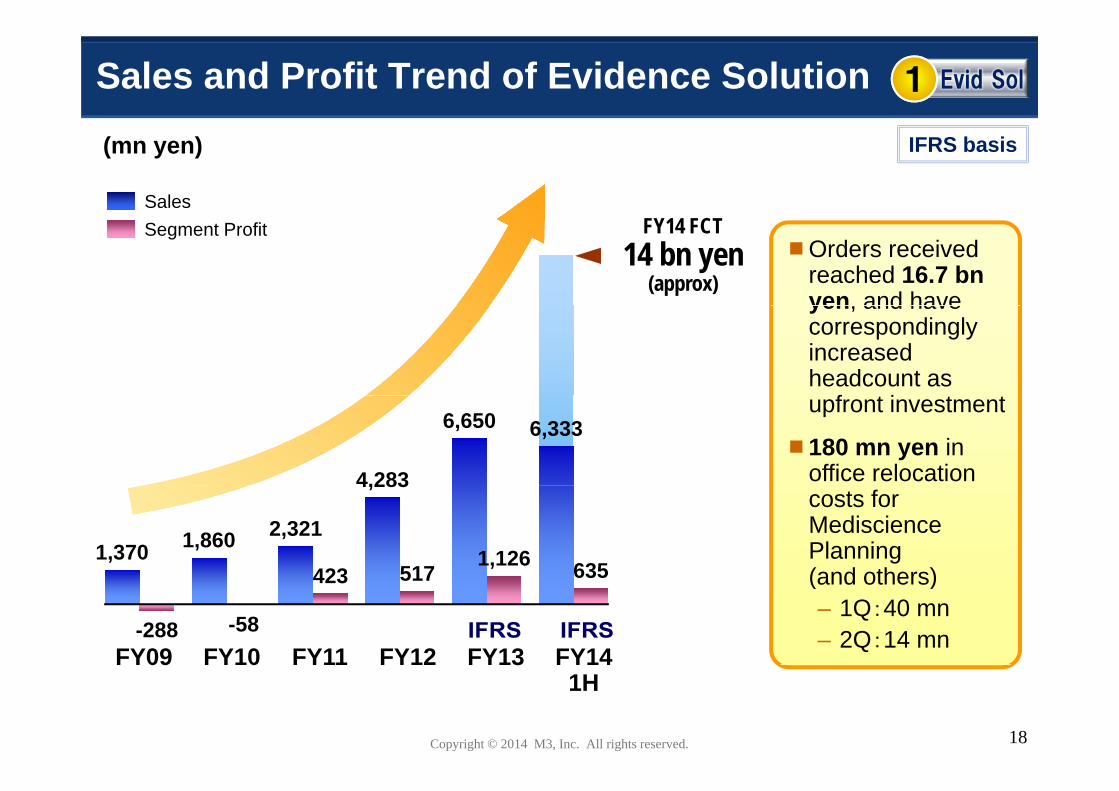
Sales and Profit Trend of Evidence Solution Evid Sol1
(mn yen)
Sales
IFRS basis
Orders received reached 16.7 bnyen and have
Segment Profit FY14 FCT14 bn yen
(approx)yen, and have correspondingly increased headcount as
f t i t tupfront investment
180 mn yen in office relocation 4,283
6,650 6,333
costs for MedisciencePlanning (and others)
1,370 1,860 2,321
4,283
423 5171,126 635 (and others)
– 1Q:40 mn– 2Q:14 mn
FY09 FY10 FY11 FY12 FY13 FY14-288 -58
423 517 635
Copyright © 2014 M3, Inc. All rights reserved. 18
09 0 31H

Sales and Profit Trend of M3 Career Career2
(mn yen)
Sales
JGAAP basis
Development of newly-hired staff
Ordinary Profit FY14 FCT6 bn yen
(approx) newly hired staff has improved productivity
Continued traction
4,594
Continued traction from job search services for doctors (YoY:+52% growth)2,191
3,235 3,209
( g )
Expecting growth in sales by +40% and an even larger increase
1,433
437749
1,070 1,111 even larger increase in operating profit for FY2014
FY10 FY11 FY12 FY13 FY141H
177 437
Copyright © 2014 M3, Inc. All rights reserved.
1H
19

E-Equipped MR(Medical Marketer)Description CSO3
受信トレイ(68)送信トレイ送信済み削除済み
■■■ ■■■■■■■■■■
■■■ ■■■■■■■■
■■■ ■■■■■■■■■■■
■■■ ■■■■■■■■■■
■■■ ■■■■■■■■■■■
■■■ ■■■■■■■■■
■■■ ■■■■■■■■■■■
■■■ ■■■■■■■■■■
受信トレイ(68)送信トレイ送信済み削除済み
■■■ ■■■■■■■■■■
■■■ ■■■■■■■■
■■■ ■■■■■■■■■■■
■■■ ■■■■■■■■■■
■■■ ■■■■■■■■■■■
■■■ ■■■■■■■■■
■■■ ■■■■■■■■■■■
■■■ ■■■■■■■■■■
受信トレイ(68)送信トレイ送信済み削除済み
■■■ ■■■■■■■■■■
■■■ ■■■■■■■■
■■■ ■■■■■■■■■■■
■■■ ■■■■■■■■■■
■■■ ■■■■■■■■■■■
■■■ ■■■■■■■■■
■■■ ■■■■■■■■■■■
■■■ ■■■■■■■■■■
削除済み下書き削除済み下書き削除済み下書き
E-Equipped MR
Cli t
Dispatch
Client
Higher productivity of MRs allows for increased value at less t d t t diti l MR F t th t ti l
Copyright © 2014 M3, Inc. All rights reserved. 20
cost compared to traditional MRs. Future growth potential estimated to be several tens of billions of yen.

Typicial MR vs Medical Marketer CSO3
Typical Contract MR Medical Marketer
N b f D il 400~600 times per month (avg )Number of Details 200~300 times per month (avg.)400 600 times per month (avg.)
* includes internet meetings
Restrictions on diffi lt
Unrestricted meetings and Meetings In-person visitations are difficult exchange of information on m3.com
Number of Doctors 80~150 doctors per MR (avg ) 150~500 doctors per MM (avg )Covered 80 150 doctors per MR (avg.) 150 500 doctors per MM (avg.)
Information Provision Duration (per day) 1~2 hour (net) 3~4 hours (net)
Transport / Wait Time 6~7 hours per day (avg.) 4~5 hours per day (avg.)
Need-based consultation andInformation
Exchanged at Initialin-Person Meeting
General information including basic product details
Need-based consultation andfinal sales pitches
(General information relayed via m3.com prior to in-person meeting)
Copyright © 2014 M3, Inc. All rights reserved. 21
Aggressive hiring plan targeting 1000 MMs within 5 yrs.

Expand our coreExpand our core business
M3’s Develop new businesses
M3 s Growth
Develop overseas businesses
Develop overseas businesses
Copyright © 2014 M3, Inc. All rights reserved. 22

Physicians Registered in Our Site or Research Panel (Global)
(thousand)3,500
Over 2.5 million members in total
Other Nations(M3 Global Research2 500
3,000
(M3 Global Research, MDLinx, Russia)
Korea (MEDIGATE)2,000
2,500
China1,500
S ( )
U.K. (Doctors.net.uk)1,000
Japan (m3.com)
U.S.A (MDLinx + PDR)
0
500
Copyright © 2014 M3, Inc. All rights reserved. 23
FY08 FY09 FY10 FY11 FY12 FY13 FY141Q
0
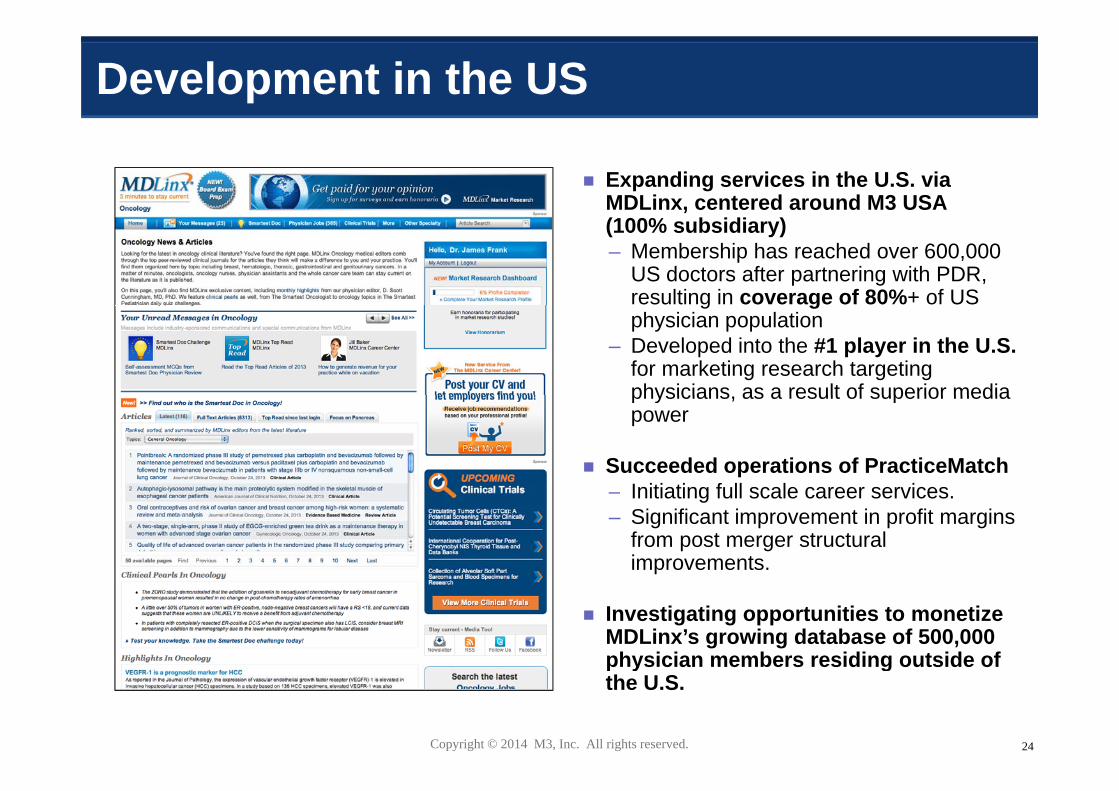
Development in the US
Expanding services in the U.S. via MDLinx, centered around M3 USA (100% subsidiary)– Membership has reached over 600,000
US doctors after partnering with PDR, resulting in coverage of 80%+ of US g gphysician population
– Developed into the #1 player in the U.S. for marketing research targeting physicians as a result of superior mediaphysicians, as a result of superior media power
Succeeded operations of PracticeMatchI iti ti f ll l i– Initiating full scale career services.
– Significant improvement in profit margins from post merger structural improvements.
Investigating opportunities to monetize MDLinx’s growing database of 500,000 physician members residing outside of
Copyright © 2014 M3, Inc. All rights reserved. 24
physician members residing outside of the U.S.
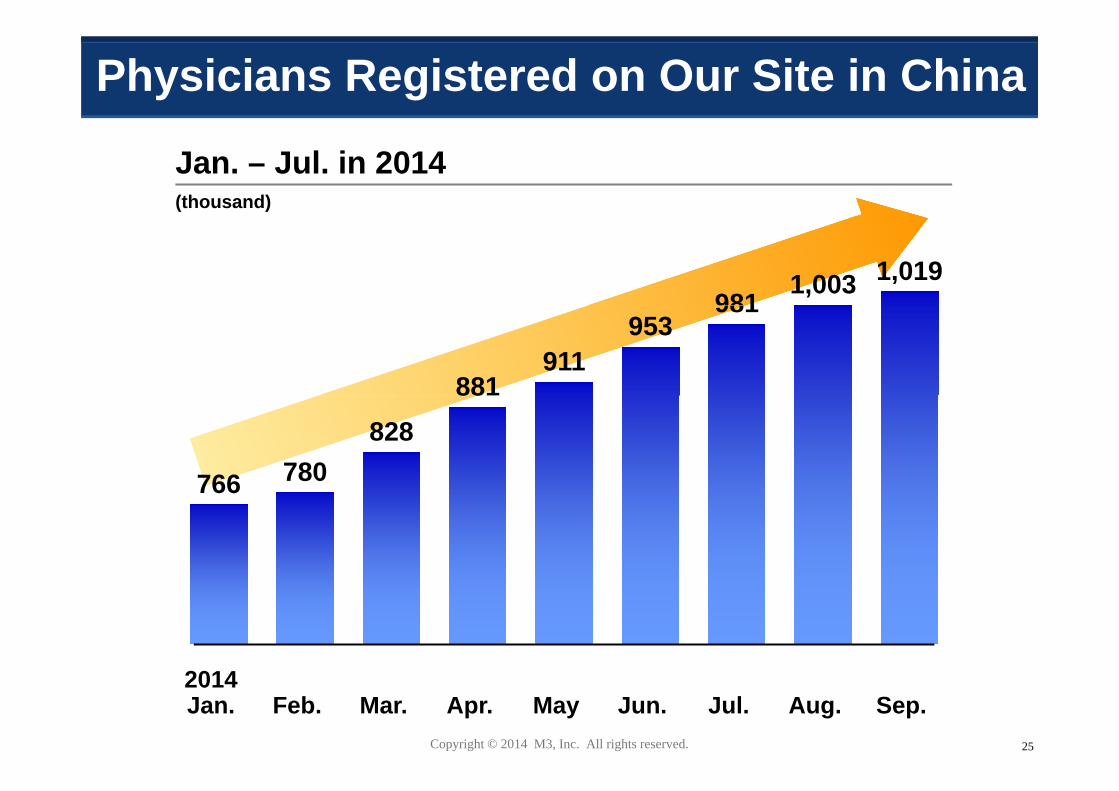
Physicians Registered on Our Site in China
(thousand)
Jan. – Jul. in 2014
9811,003 1,019
881911
953981
766 780828
88
766
Copyright © 2014 M3, Inc. All rights reserved. 25
2014Jan. Feb. Mar. Apr. May Jun. Jul. Aug. Sep.
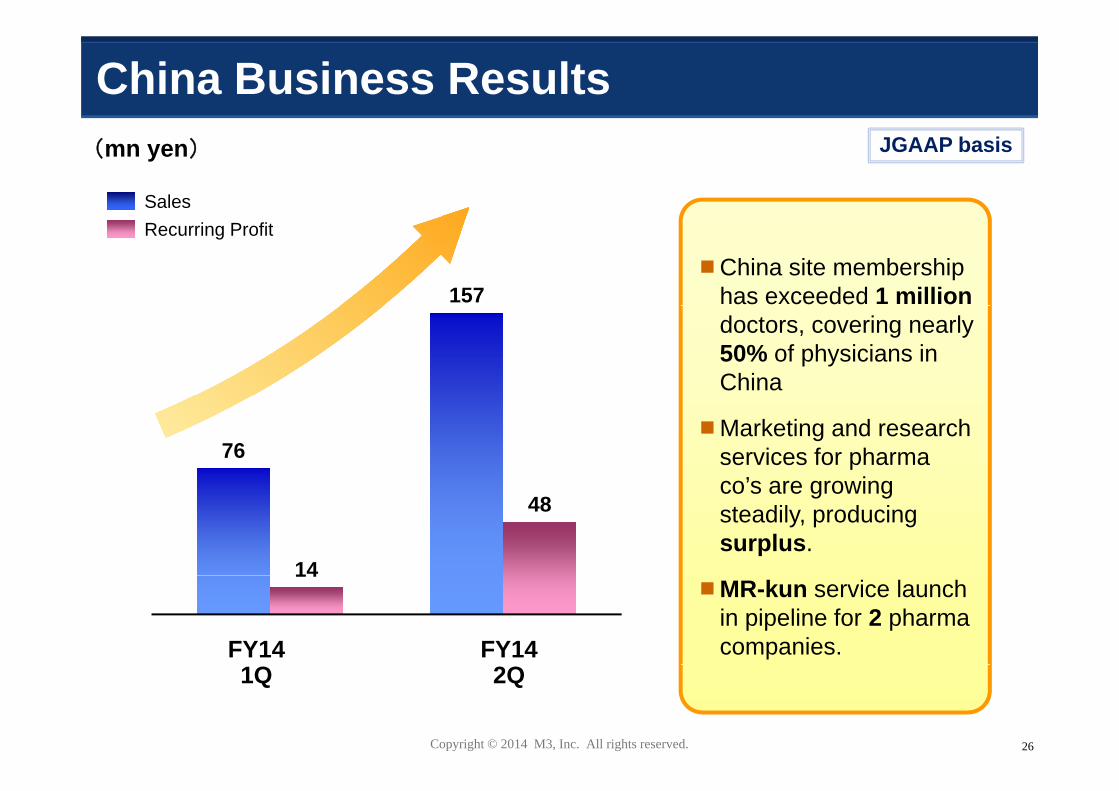
China Business Results(mn yen)
Sales
JGAAP basis
China site membership has exceeded 1 million
Recurring Profit
157 doctors, covering nearly 50% of physicians in China
Marketing and research services for pharmaco’s are growing
76 co s are growing steadily, producing surplus.
14
48
FY14 FY14
MR-kun service launch in pipeline for 2 pharmacompanies.
14
Copyright © 2014 M3, Inc. All rights reserved. 26
1Q 2Q
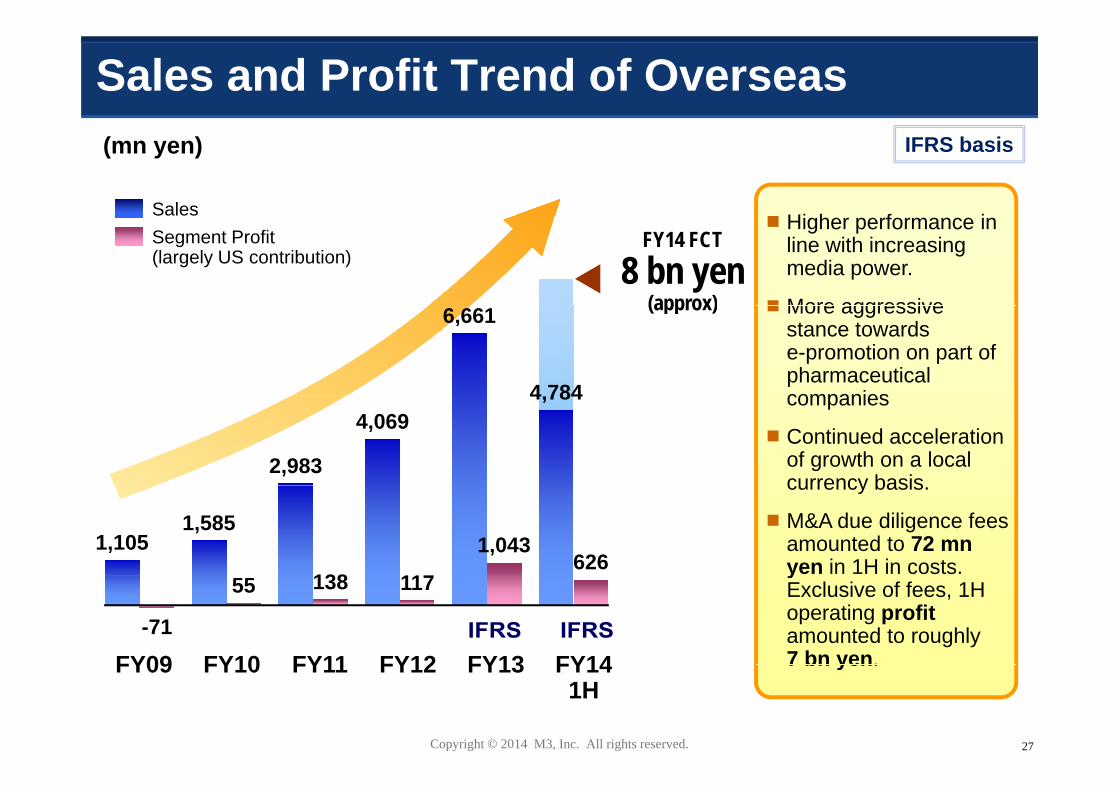
Sales and Profit Trend of Overseas(mn yen)
SalesHi h f i
IFRS basis
Segment Profit(largely US contribution)
Higher performance in line with increasing media power.
More aggressive
FY14 FCT8 bn yen
(approx) More aggressive stance towards e-promotion on part of pharmaceutical companies
(approx)6,661
4 784 companies
Continued acceleration of growth on a local currency basis
2,983
4,069 4,784
currency basis.
M&A due diligence fees amounted to 72 mnyen in 1H in costs.
1,105 1,585
138 117
1,043 626 y
Exclusive of fees, 1H operating profitamounted to roughly 7 bn yen.FY09 FY10 FY11 FY12 FY13 FY14
-71
55 138 117
Copyright © 2014 M3, Inc. All rights reserved.
7 bn yen.FY09 FY10 FY11 FY12 FY13 FY141H
27
M3 Group’s Business Strategyp
Copyright © 2014 M3, Inc. All rights reserved. 28
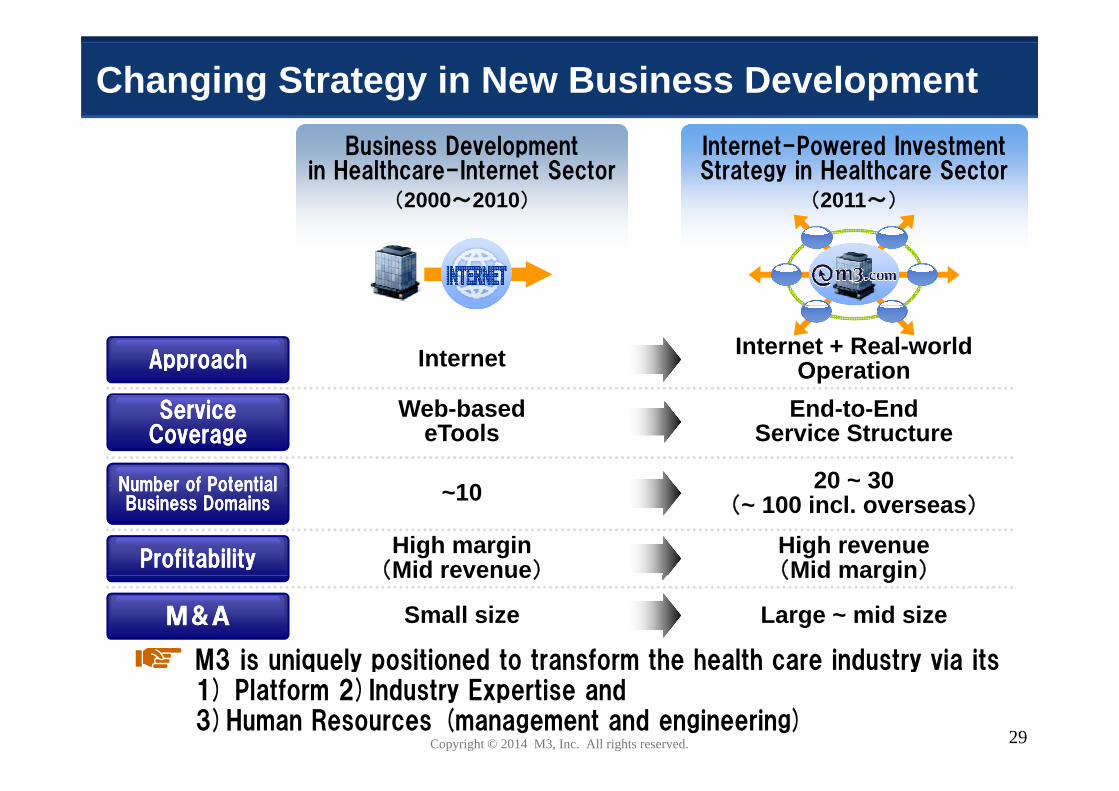
Changing Strategy in New Business DevelopmentBusiness Development
in Healthcare-Internet SectorInternet-Powered Investment Strategy in Healthcare Sector
(2000~2010) (2011~)
ApproachApproach Internet Internet + Real-world Operation
Service CoverageService
CoverageWeb-based
eToolsEnd-to-End
Service Structure
Number of PotentialNumber of Potential 10 20 ~ 30Number of Potential Business Domains
Number of Potential Business Domains ~10 20 30
(~ 100 incl. overseas)
ProfitabilityProfitabilityHigh margin
(Mid revenue)High revenue(Mid margin)(Mid revenue) (Mid margin)
M&AM&A Small size Large ~ mid size
M3 is uniquely positioned to transform the health care industry via its
Copyright © 2014 M3, Inc. All rights reserved.
M3 is uniquely positioned to transform the health care industry via its 1) Platform 2)Industry Expertise and 3)Human Resources (management and engineering)
29

Progress of FY2014
1.1. MRMR--kun, MK supportkun, MK support
1.1. JPNJPN 2.2. USUS 3.3. UKUK 4.4. KORKOR 5.5. CHNCHN (6.(6.GER)GER) (7.ITA)(7.ITA) (8.(8. IND)IND) (9(9
A R E A (8~10)Above 2B yenEarly stage
Exceeded 1 mio
3.3. CareerCareer4.4. Clinical Clinical Trial (CRO, SMO)Trial (CRO, SMO)
55 E M RE M R
2.2. ResearchResearch
B Launched new
Exceeded 1 miomembers
Initiation of MR-Kun
5.5. E.M.R.E.M.R.
6.6. ConsumerConsumer
7.7. Reserve ClinicReserve Clinic
8.8. CSOCSO
B u
s I n e
Launched new research business
Acquired PracticeMatch business platform via transfer of business
9.9. GenomeGenome
8.8. CSOCSO
1010. Operations Support for . Operations Support for Medical InstitutionsMedical Institutions
s s D o
m 11.11. αα
platform via transfer of business. Strategically moving towards full scale
development of career segment.
S i ff f CRO t M3 M k ti I
m a
I n (
20
13. γ13. γ
1515 εε
14. δ14. δ
12.12. ββ
Established M3 Doctor Support which provides operational support for medical institutions
Spin-off of CRO segment as M3 Marketing, Inc.
20~30)
15.15. εε
16.16. ζζ
18.18. θθ
17.17. ηη
operational support for medical institutions
Copyright © 2014 M3, Inc. All rights reserved. 30
20.20. κκ
19.19. ιι

Value Creation via M&A
Va
We aim to create valuealue crea
Synergy Lever 3
We aim to create value across 3 successive terms after execution of M&A.ation
Synergy Lever 2
M&A.
Execution of 10+ M&As in the past 3 years have
t d
Synergy Lever 1
created more synergistic effects than initially expected, as well as provided
Short term Mid term Long term
R t t iTopline Synergy
i i ti
well as provided accumulation of turn-around expertise
Restructuring cost structures
pimprovement via
m3.com integration
maximization,creation of new
business models
ex. Reviewing indirect cost
ex. Expanding existing
ex. Offering new clinical
We plan to use this PE-based strategy to create value overseas as well.
Copyright © 2014 M3, Inc. All rights reserved.
indirect cost existing pipelines via m3.com
new clinical trial services utlizing EMR
31

Financial Results
Copyright © 2014 M3, Inc. All rights reserved. 32

FY2014 1H(2014 Apr-Sep) Consolidated Earnings
( )
FY2013.1HFY2013.1H FY2014.1HFY2014.1H
A t l F t A t l Y Y(mn yen) Actual Forecast Actual YoY
Sales 16,692 23,000 24,630 +48%, , ,
Operating Profit
6,105 6,800 7,518 +23%Profit
Pre-Tax Profit
6,304 6,800 7,559 +20%Profit
Net Profit 3,979 4,000 4,817 +21%
Copyright © 2014 M3, Inc. All rights reserved. 33
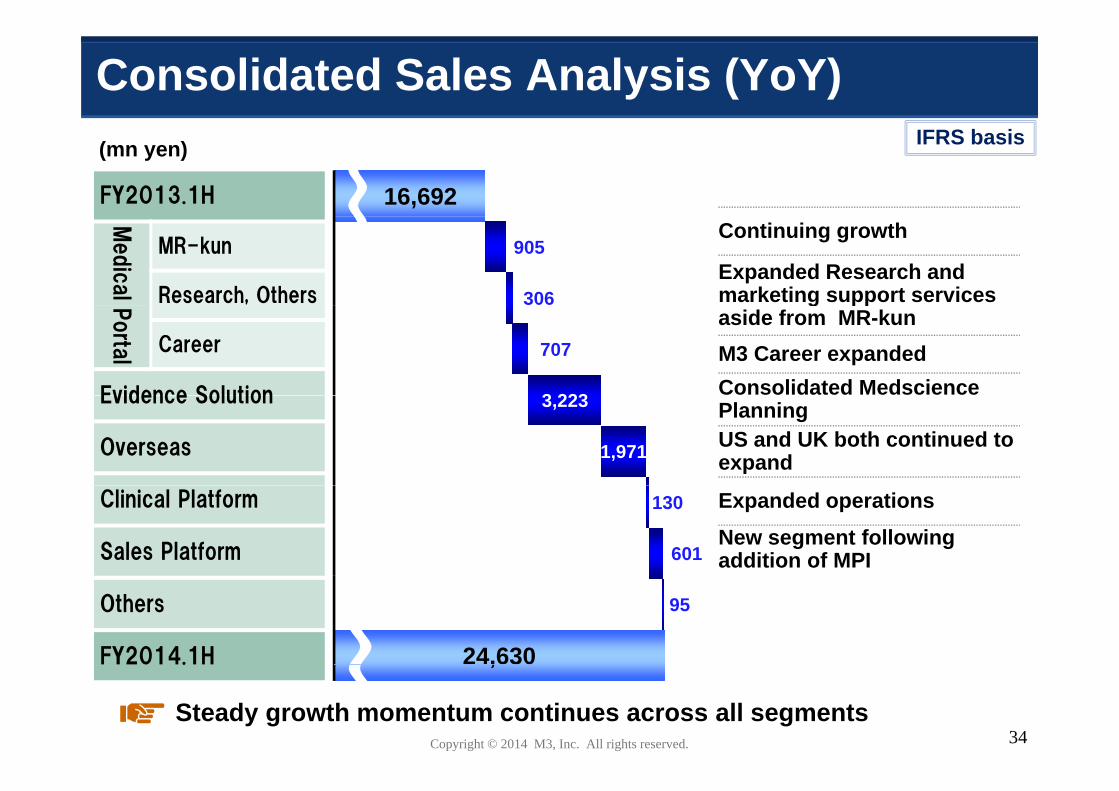
Consolidated Sales Analysis (YoY)(mn yen)
FY2013.1H
IFRS basis
16,692Continuing growth
Expanded Research and marketing support services
Medic
al
MR-kun
Research, Others
905
306 g ppaside from MR-kunM3 Career expandedConsolidated Medscience
Porta
l Career
Evidence Solution
707
3 223 PlanningUS and UK both continued to expand
Evidence Solution
Overseas
3,223
1,971
Expanded operationsNew segment following addition of MPI
Clinical Platform
Sales Platform
130
601
Others
FY2014.1H 24,630
95
Copyright © 2014 M3, Inc. All rights reserved. 34Steady growth momentum continues across all segments
,

Breakdown by Business Segments
(mn yen) FY2013.1HFY2013.1H FY2014.1HFY2014.1H YoYYoY GrowthGrowth
IFRS basis
Medical PortalSales 9,179 11,098 +21%Profit 5,028 6,426 +28%
Evidence Solution
Sales 3,110 6,333 +104%Profit 695 635 ▲9%S l 2 813 4 784 70%
OverseasSales 2,813 4,784 +70%Profit 419 626 +49%S l 1 336 1 466 +10%Clinical
Platform
Sales 1,336 1,466 +10%Profit 138 175 +27%Sal s 601Sales
Platform
Sales - 601 -Profit - ▲153 -Sales 508 675 +33%
Copyright © 2014 M3, Inc. All rights reserved. 35
OthersSales 508 675 +33%Profit 92 17 ▲81%

One-Time Upfront Investment Costs(1H)
373(mn yen)
303
153
303
Total
18074
153 0.7~1.1bn yen
Offi M&AOffice Relocation Costs
M&ADue Diligence
CSOLosses
Recruitment & Training Fees
Productivity Time Lag of New Staff
Upfront investment costs is expected to dampen profits by
Copyright © 2014 M3, Inc. All rights reserved. 36
Upfront investment costs is expected to dampen profits by 0.7 ~ 1.1 bn yen in FY 1H. Profit contribution from current investments expected sometime next fiscal year.

Sales Growth in Relation to Headcount Growth
+56% +85%
Staff (FTE) Sales
+56% +85%
Ads,
etc
.
Flow type services show immediate effect of headcount increase
Banner
A of headcount increase on sales increase.
FY20131H
FY20141H
FY20131H
FY20141H
B
+42% +21%
kun
Sales for stock type services such as MR-kun, which account for
MR-
,a majority of revenues, is expected to pick-up further going forward
Copyright © 2014 M3, Inc. All rights reserved.
FY20131H
FY20141H
FY20131H
FY20141H
37
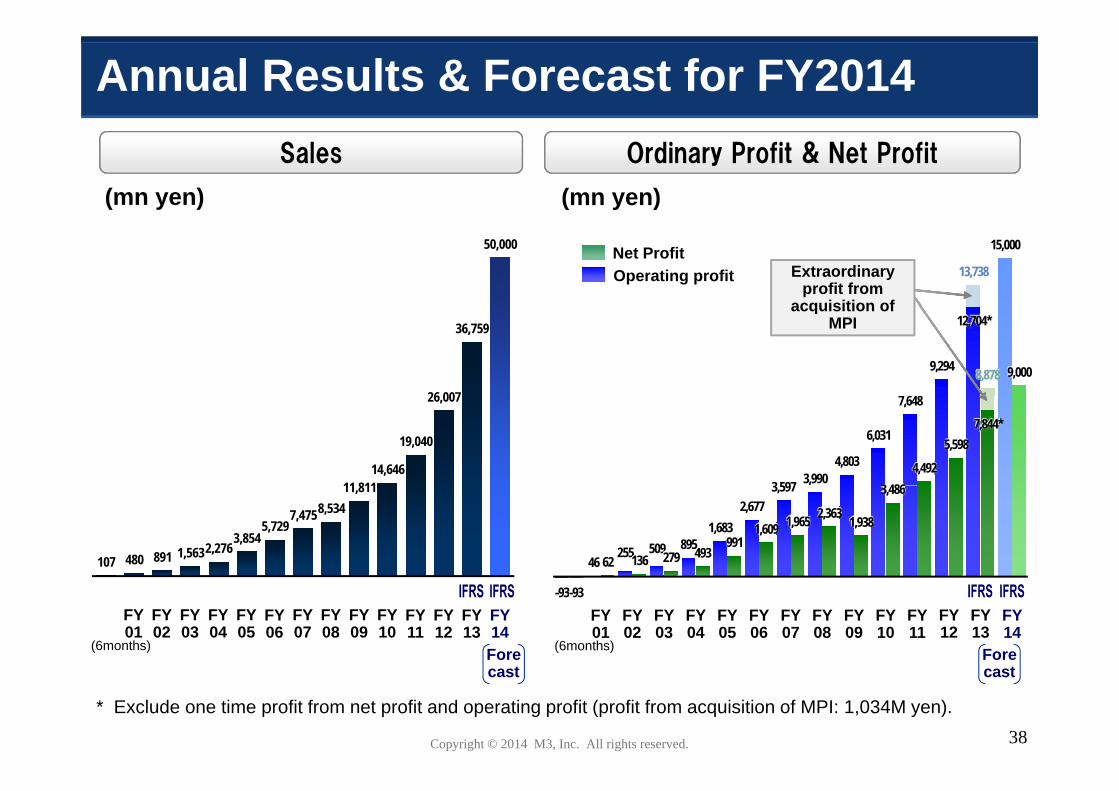
Annual Results & Forecast for FY2014Sales Ordinary Profit & Net Profit
(mn yen) (mn yen)
13,738
15,000
Extraordinary profit from
acquisition of
50,000
Operating profitNet Profit
8,878 9,294
12,704*
9,000
acquisition of MPI
26 007
36,759
3 597 3,990 4,803
6,031
7,648
3 486 4,492
5,598 7,844*
11 811 14,646
19,040
26,007
46 255 509 895
1,683 2,677
3,597
62 136 279 493 991
1,609 1,965 2,363 1,938
3,486
107 480 891 1,563 2,276 3,854
5,729 7,475 8,534
11,811
ForeFore(6months) (6months)
-93 -93 FY01
FY02
FY03
FY04
FY05
FY06
FY07
FY08
FY09
FY10
FY11
FY14
FY12
FY13
FY01
FY02
FY03
FY04
FY05
FY06
FY07
FY08
FY09
FY10
FY11
FY14
FY12
FY13
Copyright © 2014 M3, Inc. All rights reserved. 38
castcast
* Exclude one time profit from net profit and operating profit (profit from acquisition of MPI: 1,034M yen).

Creating New Value in Healthcare
M3
MedicineMediaMetamorphosis
Healthcare sector is enormous…
・ Japanese national spending on medical services is i t l ¥33t ( ¥50t if i h lapproximately ¥33tn (approx. ¥50tn if peripheral
businesses are included)・ Equivalent to 10% of Japanese GDP・ Sector controlled by only 290,000 physicians
representing only 0.2% of the national population
Aim to create new value
・ Solve the issues and problems of the medical sector・ With new and unique business models・ While focusing on areas were we can add high value
(e g have high profit) to boost our enterprise value
Copyright © 2014 M3, Inc. All rights reserved. 39
(e.g., have high profit) to boost our enterprise value
Source: Ministry of Health, Labour and Welfare, the Japan Medical Association, M3