® ®® ® irp workshop feb 9, 2015. ® february 9, 2015 - workshop - review of 2014 irp order -...
TRANSCRIPT

®
®®
®
IRP WorkshopFeb 9, 2015
®
IRP Schedule
February 9, 2015 - Workshop- Review of 2014 IRP Order- December 30 and 31 Weather Event- Demand Forecast and 65% Calculation- Calculating COS Gas Prices
March 25, 2015 - Workshop- Wexpro Drilling and Compression Plans- Review of Upstream Gathering and
Transportation Contracts
2

®
IRP Schedule
May 4, 2015 – Workshop- Heating Season Review- Management of COS Gas for 2014 IRP year- Storage Update- Energy Efficiency Impact on Peak Day - Review of RFP
June 24, 2015 – Technical Conference
3
®
Review of Commission Order
Energy Efficiency Impact on Peak Day
TIMP/DIMP Inspection and Expenses
Demand Forecast and 65% Calculation
Shut-in and Exhibit Reporting
Calculation of COS Gas Price4

®
®®
®
December 30 and 31 Weather Event

® 6

®
Temperatures and Demand
7
12/1/2
014
12/2/2
014
12/3/2
014
12/4/2
014
12/5/2
014
12/6/2
014
12/7/2
014
12/8/2
014
12/9/2
014
12/10/2
014
12/11/2
014
12/12/2
014
12/13/2
014
12/14/2
014
12/15/2
014
12/16/2
014
12/17/2
014
12/18/2
014
12/19/2
014
12/20/2
014
12/21/2
014
12/22/2
014
12/23/2
014
12/24/2
014
12/25/2
014
12/26/2
014
12/27/2
014
12/28/2
014
12/29/2
014
12/30/2
014
12/31/2
014
1/1/2
015
1/2/2
015
1/3/2
015
1/4/2
015
1/5/2
0150
10
20
30
40
50
60
0
200,000
400,000
600,000
800,000
1,000,000
1,200,000
1,400,000
Mean Transport (Dth) Sales (Dth) Total System(Dth)
Tem
p (D
egre
es F
)
Dem
and
(Dth
)

®
December 24 – 28, 2014
Due to Christmas, gas supply purchases and nominations were made on Dec 24th for gas days 25-29
On Dec 26th Questar Pipeline warned that nominations were expected to exceed pipeline capacity
On Dec 26th Questar Gas restricted customers to a 5% +/- tolerance effective Dec 28th until further notice (“OFO”)
Temperatures were near normal for this entire period with snow on Dec 25th
8

®
December 29, 2014
Temperatures dropped beginning on Monday Dec 29th
Weather forecasts continued to predict extreme cold temperatures and high winds for the next few days
The increase in demand for gas day 29 was met with increased withdrawals from Clay Basin and the aquifers
The Cycle 2 scheduled quantity report showed reductions for numerous transportation customers- This report now shows reductions by customer due to changes Questar Pipeline made
to the nominations process- These reductions occurred because the agent was utilizing interruptible capacity on
Questar Pipeline which had a constraint through the Coalville scheduling point- The agent was able to resolve the situation and no customers were contacted
9

®
December 30, 2014 “Icy Hell” Begins
Temperatures were extremely cold throughout the Questar Gas service territory- Demand exceeded the morning estimates due to colder temperatures and
high winds- Demand correlated well with the model used to forecast peak-day demand
Questar Gas used Clay Basin and aquifer storage along with Intraday purchases to manage the increased demand on the system
The Cycle 1 scheduled quantity report showed significant reductions to supply for transportation customers represented by four agents
▪ The reductions ranged from near 50% to 80% for agents based on nominations
10

®
December 30, 2014
Questar Gas notified agents with reductions to fix their nominations for Cycle 2 or customers would be instructed to reduce usage starting at 8:00 am December 31, 2014- Notifications were made through emails, instant messages and phone
calls
The Cycle 2 scheduled quantity report indicated that reductions remained unresolved for two agent’s customers for gas day 31- At 9 pm, customers of these two agents were instructed to restrict their
usage to match their reduced nomination for December 31st, starting at 8:00 am
- One of these agents had their reductions resolved by morning and their customers were notified their supply was available
- The other agent did not have their reductions resolved until later the next day, and then those customers were notified their supply was available
11

®
December 31, 2014 Extreme cold weather continued throughout the service territory and
producing regions- Cold temperatures were now impacting multiple production facilities
By 7:00 am, based on system concerns expressed by QGC Gas Control, the decision was made to call an interruption of all interruptible customers along the Wasatch Front and Wasatch Back- Customers were notified using the “rapid notify” system prior to 9:00 am- Agents were notified on an individual basis that interruptible customers were being
asked to reduce usage to match their firm amount- Nominating parties were then notified that the restriction for packing the Questar Gas
system had been lifted
By afternoon, system concerns were subsiding and the decision was made to allow interruptible customers to resume normal usage at 8:00 am January 1, 2015- Customers were notified using the “rapid notify” system at 5:00 pm
12

®
The end result
13
Gas DayTotal System
(Dth)Transport
(Dth)Total Sales
(Dth) Mean (ºF)12/30/2014 1,280,215 276,346 1,003,869 12
12/31/2014 1,148,547 217,969 930,578 11
December 30, 2014- Highest daily total system demand
▪ Previous high was 1,225,730 Dth on 1/14/2013
- Highest daily total Sales demand▪ Previous high was 997,135 Dth on 2/1/2011
System Interruption- Many customers complied with the interruption- Over 100 customers exceeded their firm amount and will be billed accordingly
®
Demand Forecast and 65% Calculation
14
®
Calculation of 65%
Paragraph12 (a) “The Company and Wexpro will manage the combined cost-of-service production from Wexpro I properties and Wexpro II Trail Unit Acquisition Properties to 65% of Questar Gas’ annual forecasted demand identified in the Company’s Integrated Resource Plan (IRP).”- Settlement Stipulation Docket No. 13-057-13
15

®
Calculation of 65%
Paragraph12 (b) “The IRP plan year starting with the June 2015 through May 2016 IRP will be used to determine the initial annual forecasted demand.”- Settlement Stipulation Docket No. 13-057-13
16
®
Calculation of 65% - Denominator
17
IRP Forecast Demand

®
GS Forecasting Models
18
•Firm Sales
• Statistical Time Series
• Dynamic Regression
• End-use Modeling

® 19
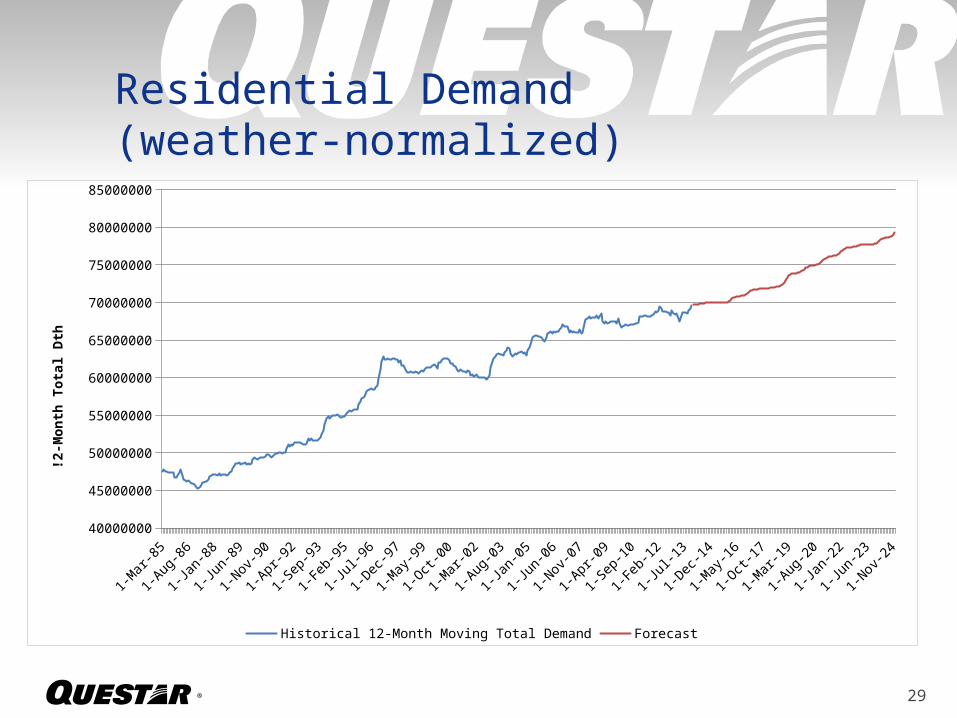
Residential Demand(weather-normalized)
1-Mar-
85
1-Jan-86
1-Nov-8
6
1-Sep-87
1-Jul-8
8
1-May
-89
1-Mar-
90
1-Jan-91
1-Nov-9
1
1-Sep-92
1-Jul-9
3
1-May
-94
1-Mar-
95
1-Jan-96
1-Nov-9
6
1-Sep-97
1-Jul-9
8
1-May
-99
1-Mar-
00
1-Jan-01
1-Nov-0
1
1-Sep-02
1-Jul-0
3
1-May
-04
1-Mar-
05
1-Jan-06
1-Nov-0
6
1-Sep-07
1-Jul-0
8
1-May
-09
1-Mar-
10
1-Jan-11
1-Nov-1
1
1-Sep-12
1-Jul-1
340000000
45000000
50000000
55000000
60000000
65000000
70000000
75000000
Historical 12-Month Moving Total Demand
!2-M
onth
Tot
al D
th

® 20
Usage per Residential Customer(weather-normalized)
1-Mar-
85
1-Dec-
85
1-Sep-86
1-Jun-87
1-Mar-
88
1-Dec-
88
1-Sep-89
1-Jun-90
1-Mar-
91
1-Dec-
91
1-Sep-92
1-Jun-93
1-Mar-
94
1-Dec-
94
1-Sep-95
1-Jun-96
1-Mar-
97
1-Dec-
97
1-Sep-98
1-Jun-99
1-Mar-
00
1-Dec-
00
1-Sep-01
1-Jun-02
1-Mar-
03
1-Dec-
03
1-Sep-04
1-Jun-05
1-Mar-
06
1-Dec-
06
1-Sep-07
1-Jun-08
1-Mar-
09
1-Dec-
09
1-Sep-10
1-Jun-11
1-Mar-
12
1-Dec-
12
1-Sep-13
60
70
80
90
100
110
120
130
Moving 12-month Historical Usage Per Customer
Twel
ve-M
onth
Dth
Per
Cus
tom
er

® 21
Statistical Time Series
1-Mar-
85
1-Mar-
86
1-Mar-
87
1-Mar-
88
1-Mar-
89
1-Mar-
90
1-Mar-
91
1-Mar-
92
1-Mar-
93
1-Mar-
94
1-Mar-
95
1-Mar-
96
1-Mar-
97
1-Mar-
98
1-Mar-
99
1-Mar-
00
1-Mar-
01
1-Mar-
02
1-Mar-
03
1-Mar-
04
1-Mar-
05
1-Mar-
06
1-Mar-
07
1-Mar-
08
1-Mar-
09
1-Mar-
10
1-Mar-
11
1-Mar-
12
1-Mar-
13
1-Mar-
14
1-Mar-
15
1-Mar-
16
1-Mar-
17
1-Mar-
18
1-Mar-
19
1-Mar-
20
1-Mar-
21
1-Mar-
22
1-Mar-
23
1-Mar-
2460
70
80
90
100
110
120
130
Moving 12-month Historical Usage Per Customer
Twel
ve-M
onth
Dth
Per
Cus
tom
er

® 22
Statistical Time Series
1-Mar-
85
1-Mar-
86
1-Mar-
87
1-Mar-
88
1-Mar-
89
1-Mar-
90
1-Mar-
91
1-Mar-
92
1-Mar-
93
1-Mar-
94
1-Mar-
95
1-Mar-
96
1-Mar-
97
1-Mar-
98
1-Mar-
99
1-Mar-
00
1-Mar-
01
1-Mar-
02
1-Mar-
03
1-Mar-
04
1-Mar-
05
1-Mar-
06
1-Mar-
07
1-Mar-
08
1-Mar-
09
1-Mar-
10
1-Mar-
11
1-Mar-
12
1-Mar-
13
1-Mar-
14
1-Mar-
15
1-Mar-
16
1-Mar-
17
1-Mar-
18
1-Mar-
19
1-Mar-
20
1-Mar-
21
1-Mar-
22
1-Mar-
23
1-Mar-
2460
70
80
90
100
110
120
130
Moving 12-month Historical Usage Per Customer
Twel
ve-M
onth
Dth
Per
Cus
tom
er
® 23
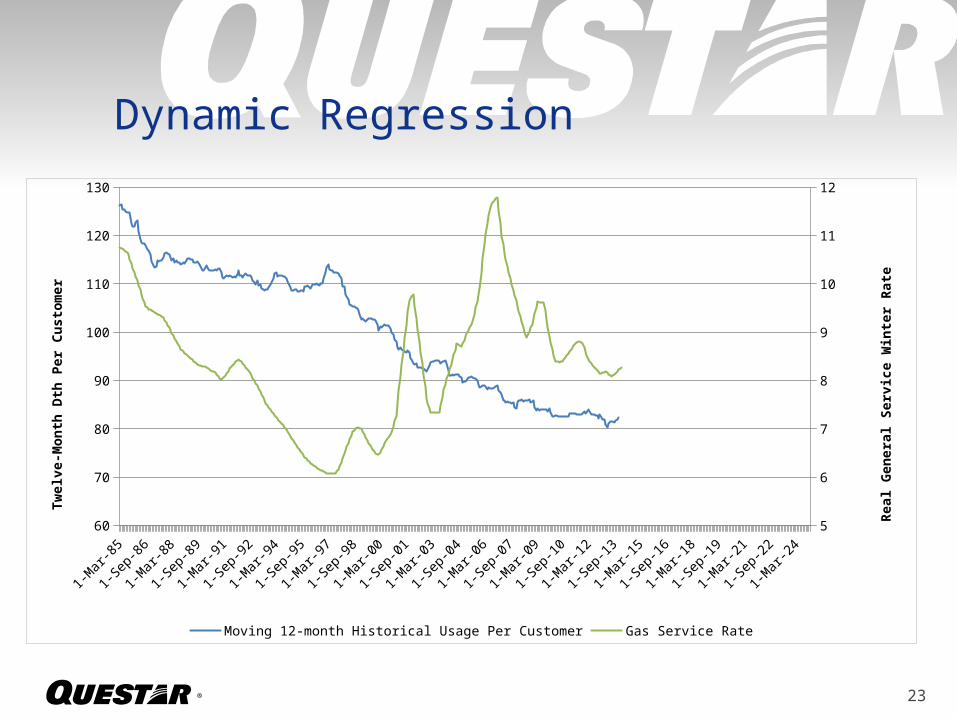
Dynamic Regression
1-Mar-
85
1-Apr-8
6
1-May
-87
1-Jun-88
1-Jul-8
9
1-Aug-9
0
1-Sep-91
1-Oct-
92
1-Nov-9
3
1-Dec-
94
1-Jan-96
1-Feb-97
1-Mar-
98
1-Apr-9
9
1-May
-00
1-Jun-01
1-Jul-0
2
1-Aug-0
3
1-Sep-04
1-Oct-
05
1-Nov-0
6
1-Dec-
07
1-Jan-09
1-Feb-10
1-Mar-
11
1-Apr-1
2
1-May
-13
1-Jun-14
1-Jul-1
5
1-Aug-1
6
1-Sep-17
1-Oct-
18
1-Nov-1
9
1-Dec-
20
1-Jan-22
1-Feb-23
1-Mar-
2460
70
80
90
100
110
120
130
5
6
7
8
9
10
11
12
Moving 12-month Historical Usage Per Customer Gas Service Rate
Twel
ve-M
onth
Dth
Per
Cus
tom
er
Real
Gen
eral
Ser
vice
Win
ter R
ate

® 24
Dynamic Regression
1-Mar-
85
1-Apr-8
6
1-May
-87
1-Jun-88
1-Jul-8
9
1-Aug-9
0
1-Sep-91
1-Oct-
92
1-Nov-9
3
1-Dec-
94
1-Jan-96
1-Feb-97
1-Mar-
98
1-Apr-9
9
1-May
-00
1-Jun-01
1-Jul-0
2
1-Aug-0
3
1-Sep-04
1-Oct-
05
1-Nov-0
6
1-Dec-
07
1-Jan-09
1-Feb-10
1-Mar-
11
1-Apr-1
2
1-May
-13
1-Jun-14
1-Jul-1
5
1-Aug-1
6
1-Sep-17
1-Oct-
18
1-Nov-1
9
1-Dec-
20
1-Jan-22
1-Feb-23
1-Mar-
2460
70
80
90
100
110
120
130
5
6
7
8
9
10
11
12
Moving 12-month Historical Usage Per Customer Gas Service Rate
Twel
ve-M
onth
Dth
Per
Cus
tom
er
Real
Gen
eral
Ser
vice
Win
ter R
ate

® 25
Dynamic Regression
1-Mar-
85
1-Apr-8
6
1-May
-87
1-Jun-88
1-Jul-8
9
1-Aug-9
0
1-Sep-91
1-Oct-
92
1-Nov-9
3
1-Dec-
94
1-Jan-96
1-Feb-97
1-Mar-
98
1-Apr-9
9
1-May
-00
1-Jun-01
1-Jul-0
2
1-Aug-0
3
1-Sep-04
1-Oct-
05
1-Nov-0
6
1-Dec-
07
1-Jan-09
1-Feb-10
1-Mar-
11
1-Apr-1
2
1-May
-13
1-Jun-14
1-Jul-1
5
1-Aug-1
6
1-Sep-17
1-Oct-
18
1-Nov-1
9
1-Dec-
20
1-Jan-22
1-Feb-23
1-Mar-
2460
70
80
90
100
110
120
130
5
6
7
8
9
10
11
12
Moving 12-month Historical Usage Per Customer ForecastGas Service Rate
Twel
ve-M
onth
Dth
Per
Cus
tom
er
Real
Gen
eral
Ser
vice
Win
ter R
ate

® 26
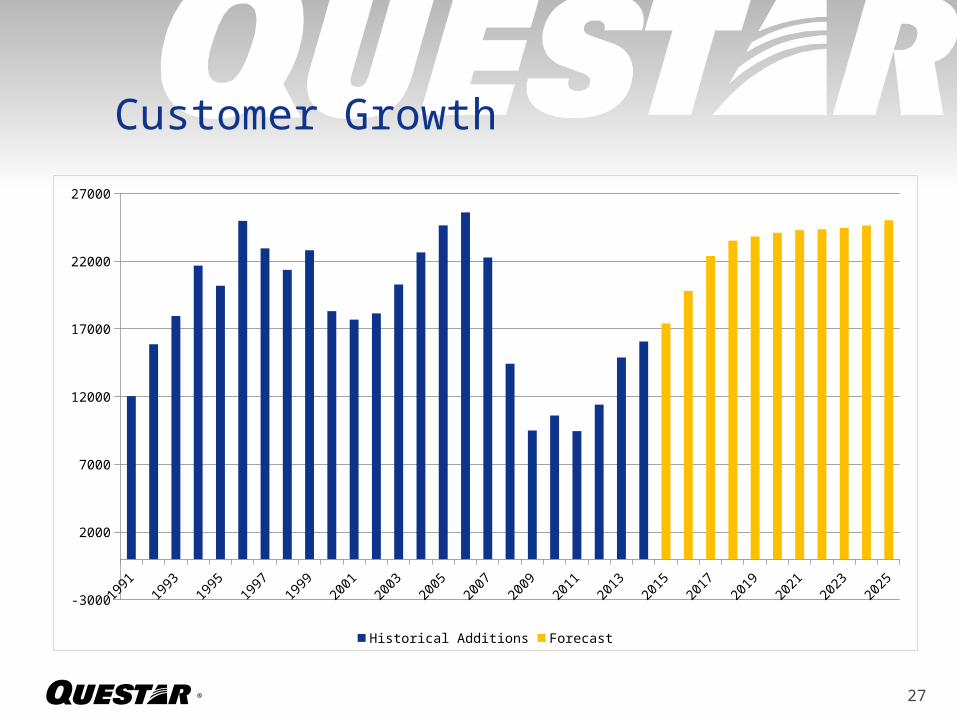
Customer Growth
19911992
19931994
19951996
19971998
19992000
20012002
20032004
20052006
20072008
20092010
20112012
20132014
20152016
20172018
20192020
20212022
20232024
2025
-3000
2000
7000
12000
17000
22000
27000
Historical Additions
® 27
Customer Growth
19911992
19931994
19951996
19971998
19992000
20012002
20032004
20052006
20072008
20092010
20112012
20132014
20152016
20172018
20192020
20212022
20232024
2025
-3000
2000
7000
12000
17000
22000
27000
Historical Additions Forecast

® 28
Residential Demand(weather-normalized)
1-Mar-
85
1-Apr-8
6
1-May
-87
1-Jun-88
1-Jul-8
9
1-Aug-9
0
1-Sep-91
1-Oct-
92
1-Nov-9
3
1-Dec-
94
1-Jan-96
1-Feb-97
1-Mar-
98
1-Apr-9
9
1-May
-00
1-Jun-01
1-Jul-0
2
1-Aug-0
3
1-Sep-04
1-Oct-
05
1-Nov-0
6
1-Dec-
07
1-Jan-09
1-Feb-10
1-Mar-
11
1-Apr-1
2
1-May
-13
1-Jun-14
1-Jul-1
5
1-Aug-1
6
1-Sep-17
1-Oct-
18
1-Nov-1
9
1-Dec-
20
1-Jan-22
1-Feb-23
1-Mar-
2440000000
45000000
50000000
55000000
60000000
65000000
70000000
75000000
80000000
85000000
Historical 12-Month Moving Total Demand
!2-M
onth
Tot
al D
th
® 29
Residential Demand(weather-normalized)
1-Mar-
85
1-Apr-8
6
1-May
-87
1-Jun-88
1-Jul-8
9
1-Aug-9
0
1-Sep-91
1-Oct-
92
1-Nov-9
3
1-Dec-
94
1-Jan-96
1-Feb-97
1-Mar-
98
1-Apr-9
9
1-May
-00
1-Jun-01
1-Jul-0
2
1-Aug-0
3
1-Sep-04
1-Oct-
05
1-Nov-0
6
1-Dec-
07
1-Jan-09
1-Feb-10
1-Mar-
11
1-Apr-1
2
1-May
-13
1-Jun-14
1-Jul-1
5
1-Aug-1
6
1-Sep-17
1-Oct-
18
1-Nov-1
9
1-Dec-
20
1-Jan-22
1-Feb-23
1-Mar-
2440000000
45000000
50000000
55000000
60000000
65000000
70000000
75000000
80000000
85000000
Historical 12-Month Moving Total Demand Forecast
!2-M
onth
Tot
al D
th

® 30
End-use
Water Heater Range Dryer Furnace0
10
20
30
40
50
60
70
Annual Consumption
Dth

® 31
End-use
• Distributes housing by size and shell quality (year built, insulation grade)
• Distributes end-use segments by appliance efficiency
®
Calculation of 65%
32
IRP Forecast Demand
IRP forecast demand is shown in section 3 and exhibits 3.10 and 3.11 of the IRP
®
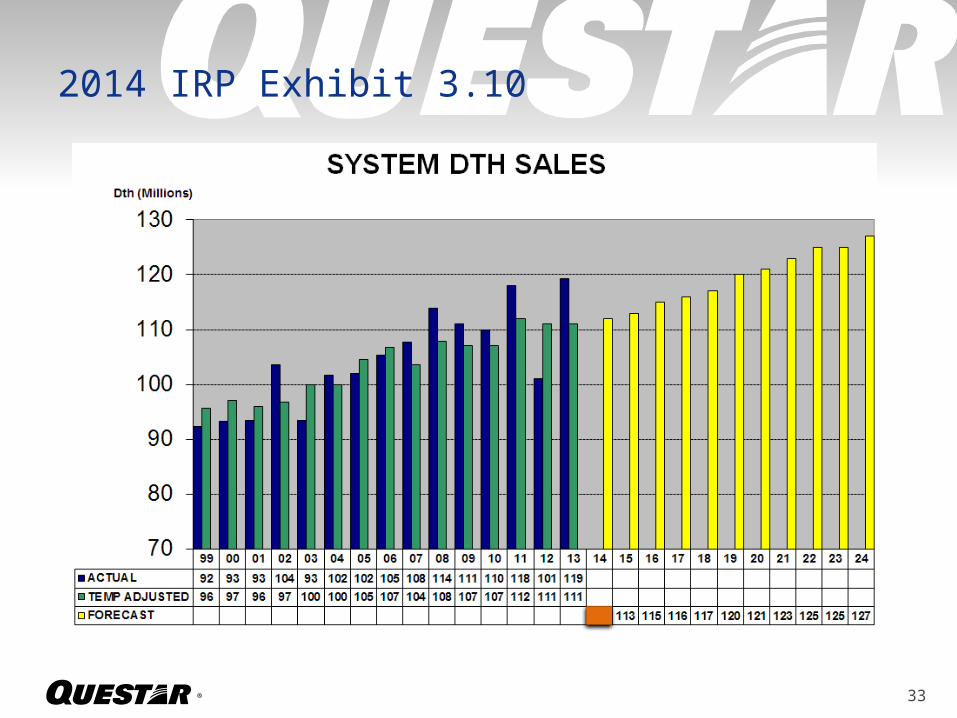
2014 IRP Exhibit 3.10
33
®
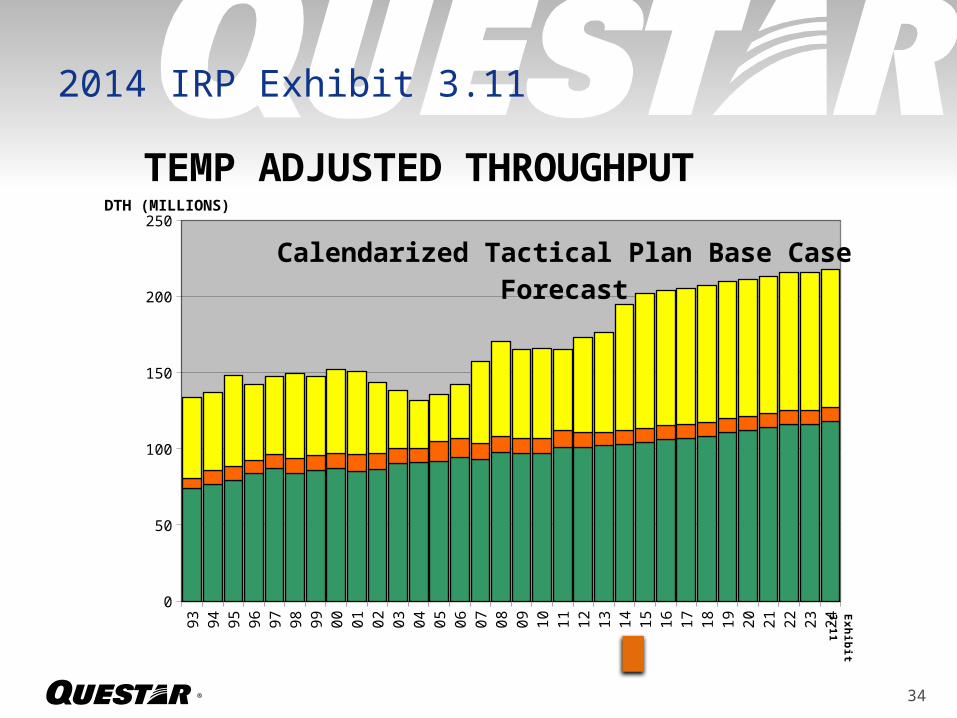
2014 IRP Exhibit 3.11
34
93 94 95 96 97 98 99 00 01 02 03 04 05 06 07 08 09 10 11 12 13 14 15 16 17 18 19 20 21 22 23 24
SYSTEM GS
74.086
76.573
79.43
83.875
86.947
84.053
85.719
86.769
85.15
86.085
90.379
91.10526
91.445255
94.248445
92.674402
97.6
97 97 101
101
102
103
104
106
107
108
111
112
114
116
116
118
NON-GS SALES
6.439
8.911
9.271
8.614
9.523
9.685
9.866
10.356
10.753
10.687
9.713
8.79092
13.111037
12.478552
10.880363
10.3
10 10 11 10 9 9 9 9 9 9 9 9 9 9 9 9
TRANS
53.105
51.382
59.569
49.499
51.312
55.461
51.643
54.836
54.624
46.459
38.341
31.80262
31.204752
35.544794
53.750377
62.3
58 59 53 62 65 83 89 89 89 90 90 90 90 91 91 91
25
75
125
175
225
TEMP ADJUSTED THROUGHPUTDTH (MILLIONS)
Calendarized Tactical Plan Base Case Fore-cast
Ex
hib
it
3.1
1
®
Calculation of 65%
35
Actual Company Production
IRP Forecast Demand
IRP Demand is shown in exhibits 3.10 and 3.11 of the IRP

®
Total QGC Gas Supply
REDACTED

®
Production Supply Chain
37
Processing
Gathering
“Into Pipe” City GateWell Head
IRP Year Dth= 65%
Actual Well-head Production Volumes
Transportation