sebi · justice sodhi committee on insider trading regulations submits report to sebi 41 3. sebi...
TRANSCRIPT
SEBIBULLETIN
JANUARY 2014 VOL. 12 NUMBER 1
^maVr¶ à{V^y{V Am¡a {d{Z‘¶ ~moS>©Securities and Exchange Board of India
EDITORIAL COMMITTEE
• Mr. Ananta Barua
• Mr. J. Ranganayakulu
• Dr. Anil Kumar Sharma
The Securities and Exchange Board of India Bulletin is issued by the Department of Economic and Policy Analysis, Securities and Exchange Board of India under the direction of an Editorial Committee. SEBI is not responsible for accuracy of data/information/ interpretations and opinions expressed in the case of signed articles/speeches as authors are responsible for their personal views. SEBI has no objection to the material published herein being reproduced, provided an acknowledgement of the same is made. This monthly Bulletin is normally published in the third week of the succeeding month. The soft copy of SEBI Bulletin is available free of cost to the subscribers/readers, who register at [email protected] along with their complete address. A readable version of SEBI Bulletin is available at http://www.sebi.gov.in. Any comments and suggestions on any of the features/sections may be sent to [email protected].
SECURITIES AND EXCHANGE BOARD OF INDIA

Contents
Page
CAPITAL MARKET REVIEW 1
GLOBAL MARKET REVIEW – JANUARY 2014 12
PRESS RELEASES 39
A. General 39
1. Third Meeting of the International Advisory Board of SEBI held at Bangalore 39
2. Justice Sodhi Committee on Insider Trading Regulations submits report to SEBI 41
3. SEBI Board Meeting 43
B. Orders 46
1. Order in the matter of application filed by United Bank of India under regulation 46 11(1) of SEBI (Substantial Acquisition of Shares and Takeovers) Regulations, 2011
2. Order in respect of M/s. International Hometex Limited and its directors 46
3. Order in respect of disposing of case against Mr. Harshad Talati of 46 M/s. Shukla Data Technics Limited
4. Order in respect of Motorol Enterprises Limited and its former directors 46
5. Order in the matter of exemption application filed by Indian Overseas Bank 47 under regulation 11(1) of SEBI (Substantial Acquisition of Shares and Takeovers) Regulations, 2011
6. Order in the matter of exemption application filed by Dena Bank under regulation 4711(1) of SEBI (Substantial Acquisition of Shares and Takeovers) Regulations, 2011
7. Order in the matter of M/s. Alderbrooke Portfolio Management Services Pvt. Ltd. 47
8. Order in the matter of M/s. Lee Capital Services Private Limited 48

CIRCULARS 49
1. Illustrative Format of Statement of Assets & Liabilities in SEBI (ICDR) 49Regulations, 2009
2. Simplification of Demat Account Opening Process 49
3. Exchange Traded Cash Settled Interest Rate Futures (IRF) on 10-Year 50 Government of India Security
4. Establishment of Connectivity with both Depositories NSDL and CDSL – 51Companies eligible for shifting from Trade for Trade Settlement (TFTS) to Normal Rolling Settlement
5. Deposit Requirements for Members of the Debt Segment 51
6. Declaration and Undertaking regarding PCC, MCV or equivalent structure by FIIs 52
7. Rationalization of Periodic Call Auction for Illiquid Scrips 53
8. Know Your Client Requirements 54
ORDER PASSED BY CHAIRMAN/MEMBERS AND ADJUDICATING OFFICERS 56
HIGHLIGHTS OF DEVELOPMENTS IN INTERNATIONAL SECURITIES MARKET 62
TABLES 66
PUBLICATIONS 139
1
JANUARY SEBI BULLETIN 2014
1. Trends in Primary Market
A. Equity and Debt Issue
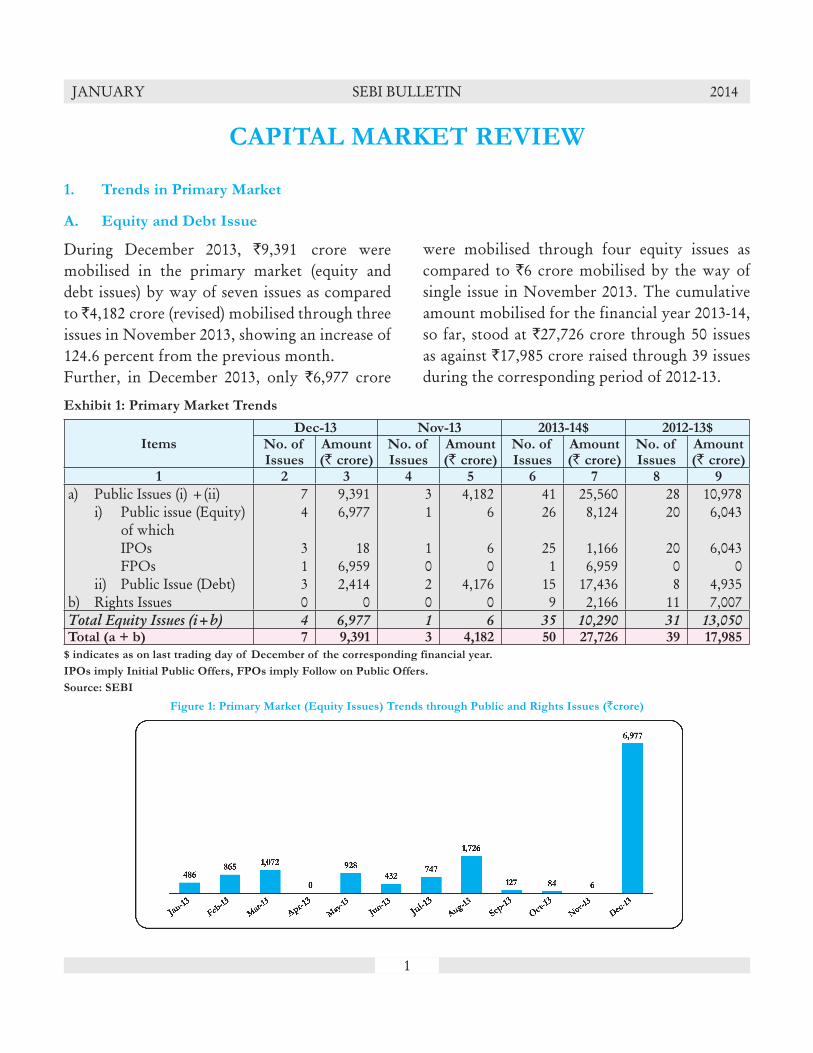
During December 2013, `9,391 crore were mobilised in the primary market (equity and debt issues) by way of seven issues as compared to ̀ 4,182 crore (revised) mobilised through three issues in November 2013, showing an increase of 124.6 percent from the previous month.Further, in December 2013, only `6,977 crore
CAPITAL MARKET REVIEW
were mobilised through four equity issues as compared to `6 crore mobilised by the way of single issue in November 2013. The cumulative amount mobilised for the financial year 2013-14, so far, stood at `27,726 crore through 50 issues as against `17,985 crore raised through 39 issues during the corresponding period of 2012-13.
Exhibit 1: Primary Market Trends
ItemsDec-13 Nov-13 2013-14$ 2012-13$
No. of Issues
Amount (` crore)
No. of Issues
Amount (` crore)
No. of Issues
Amount (` crore)
No. of Issues
Amount (` crore)
1 2 3 4 5 6 7 8 9
a) Public Issues (i) +(ii) 7 9,391 3 4,182 41 25,560 28 10,978 i) Public issue (Equity) 4 6,977 1 6 26 8,124 20 6,043 of which IPOs 3 18 1 6 25 1,166 20 6,043 FPOs 1 6,959 0 0 1 6,959 0 0 ii) Public Issue (Debt) 3 2,414 2 4,176 15 17,436 8 4,935b) Rights Issues 0 0 0 0 9 2,166 11 7,007Total Equity Issues (i+b) 4 6,977 1 6 35 10,290 31 13,050Total (a + b) 7 9,391 3 4,182 50 27,726 39 17,985
$ indicates as on last trading day of December of the corresponding financial year.
IPOs imply Initial Public Offers, FPOs imply Follow on Public Offers.
Source: SEBI
Figure 1: Primary Market (Equity Issues) Trends through Public and Rights Issues (`crore)

2
JANUARY SEBI BULLETIN 2014
C. Preferential Allotments Listed at BSE and NSE
There were 27 preferential allotments (`6,943 crore) listed at BSE and NSE during December 2013 as compared to 24 preferential allotments (`756 crore) in November 2013.The cumulative mobilised amount for the
financial year 2013-14 so far, stood at `42,551 crore through 302 preferential allotments (of which 116 allotments amounting `38,811 crore were listed at both BSE and NSE) (Details in
Table 12)
D. Private Placement of Corporate Debt Reported to BSE and NSE
In the corporate debt market, `24,277 crore were raised through 143 issues by way of private placement listed at BSE and NSE during December 2013 compared to ̀ 11,175 crore raised through 92 issues in November 2013. The cumulative privately placed amount for the financial year 2013-14 so
far, stood at `2,01,838 crore through 1,373 issues (of which 581 issues of `98,708 crore reported to only NSE, 722 issues of ̀ 61,983 crore reported to only BSE and 70 issues of `41,147 crore reported to both BSE and NSE) (Details in Table 13)
E. Resource Mobilisation by Mutual Funds
During December 2013, mutual funds saw a net outflow of `74,578 crore (of which `62,002 crore outflow was from private sector mutual funds while public sector mutual funds saw outflow of `12,575 crore) as compared to an inflow of `49,008 crore (of which ̀ 50,167 crore inflow was from private sector mutual funds while public sector mutual funds saw outflow of `1,160 crore) in November 2013.
During the financial year 2013-14 so far, mutual funds net mobilised `76,098 crore as compared to `1,20,269 crore mobilized in corresponding period of 2012-13. The market value of assets under management stood at `8,25,840 crore as on December 31, 2013 as compared to `8,89,952 crore as on November 30, 2013, indicating a decrease of 7.2 percent. (Details in Table 61)
B. QIPs Listed at BSE and NSE
amount mobilised through QIP route during 2013-14 stood at `5,483 crore through fourteen issues. (Details in Table 11)
During December 2013, there was one QIP issue for `280 crore while there was no QIP issues in the market in November 2013. The cumulative
II. Trends in the Secondary Market
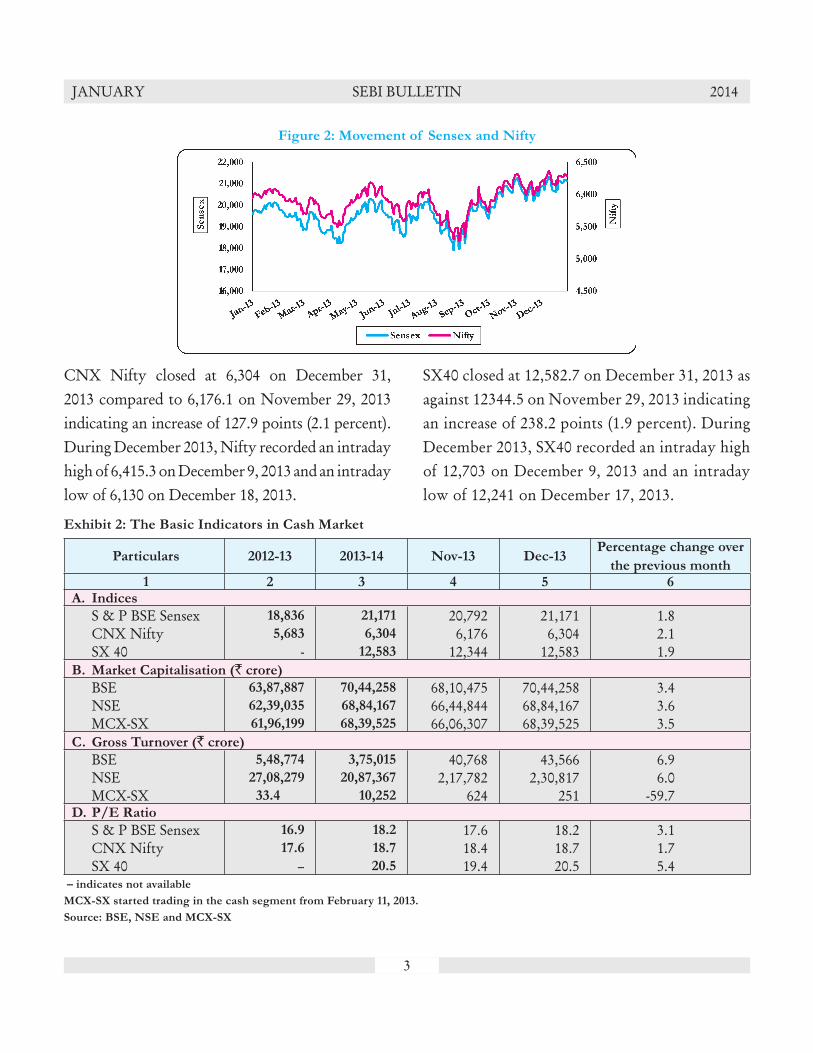
S&P BSE Sensex closed at 21,171 on December 31, 2013, as against 20,791.9 on November 29, 2013, registering an increase of 378.8 points (1.8 percent).
During December 2013, Sensex recorded an intraday high of 21,483.7 on December 9, 2013 and an intraday low of 20,568.7 on December 18, 2013.
3
JANUARY SEBI BULLETIN 2014
Figure 2: Movement of Sensex and Nifty
Exhibit 2: The Basic Indicators in Cash Market
Particulars 2012-13 2013-14 Nov-13 Dec-13Percentage change over
the previous month1 2 3 4 5 6
A. Indices
S & P BSE Sensex 18,836 21,171 20,792 21,171 1.8 CNX Nifty 5,683 6,304 6,176 6,304 2.1 SX 40 - 12,583 12,344 12,583 1.9B. Market Capitalisation (` crore)
BSE 63,87,887 70,44,258 68,10,475 70,44,258 3.4 NSE 62,39,035 68,84,167 66,44,844 68,84,167 3.6 MCX-SX 61,96,199 68,39,525 66,06,307 68,39,525 3.5C. Gross Turnover (` crore)
BSE 5,48,774 3,75,015 40,768 43,566 6.9 NSE 27,08,279 20,87,367 2,17,782 2,30,817 6.0 MCX-SX 33.4 10,252 624 251 -59.7D. P/E Ratio
S & P BSE Sensex 16.9 18.2 17.6 18.2 3.1 CNX Nifty 17.6 18.7 18.4 18.7 1.7 SX 40 – 20.5 19.4 20.5 5.4
– indicates not available
MCX-SX started trading in the cash segment from February 11, 2013.
Source: BSE, NSE and MCX-SX
CNX Nifty closed at 6,304 on December 31, 2013 compared to 6,176.1 on November 29, 2013 indicating an increase of 127.9 points (2.1 percent). During December 2013, Nifty recorded an intraday high of 6,415.3 on December 9, 2013 and an intraday low of 6,130 on December 18, 2013.
SX40 closed at 12,582.7 on December 31, 2013 as against 12344.5 on November 29, 2013 indicating an increase of 238.2 points (1.9 percent). During December 2013, SX40 recorded an intraday high of 12,703 on December 9, 2013 and an intraday low of 12,241 on December 17, 2013.

4
JANUARY SEBI BULLETIN 2014
Figure 3: Monthly Average of BSE Turnover and Sensex
The market capitalisation of BSE increased by 3.4 percent to `70,44,258 as on December 31, 2013 from `68,10,475 as on November 29, 2013. Market capitalisation of NSE, stood at ̀ 68,84,167 crore as on December 31, 2013 compared to `66,44,844 crore as on November 29, 2013,
indicating an increase of 3.6 percent. The market capitalisation of MCX-SX also increased by 3.5 percent to `68,39,525 crore as on November 29, 2013 compared to `66,06,307 crore as on November 29, 2013.
Figure 4: Monthly Average of NSE Turnover and Nifty
The monthly turnover of BSE (cash segment) increased by 6.9 percent from `40,768 crore in November 2013 to `43,566 crore in December 2013. The monthly turnover of NSE (cash segment) also increased by 6.0 percent from
`2,17,782 crore in November, 2013 to `2,30,817 crore in December, 2013. At MCX-SX the monthly turnover decreased substantially by 59.7 percent from `624 crore in November 2013 to `251 crore in December 2013.
The PE ratio of S&P BSE Sensex was 18.2 on December 31, 2013 as against 17.6 on November 29, 2013. The PE ratio of CNX Nifty was 18.7 on December 31, 2013 as against 18.4 on November
29, 2013. The PE ratio of MCX-SX SX40 was 20.5 on December 31, 2013 compared to 19.4 on November 29, 2013.
5
JANUARY SEBI BULLETIN 2014
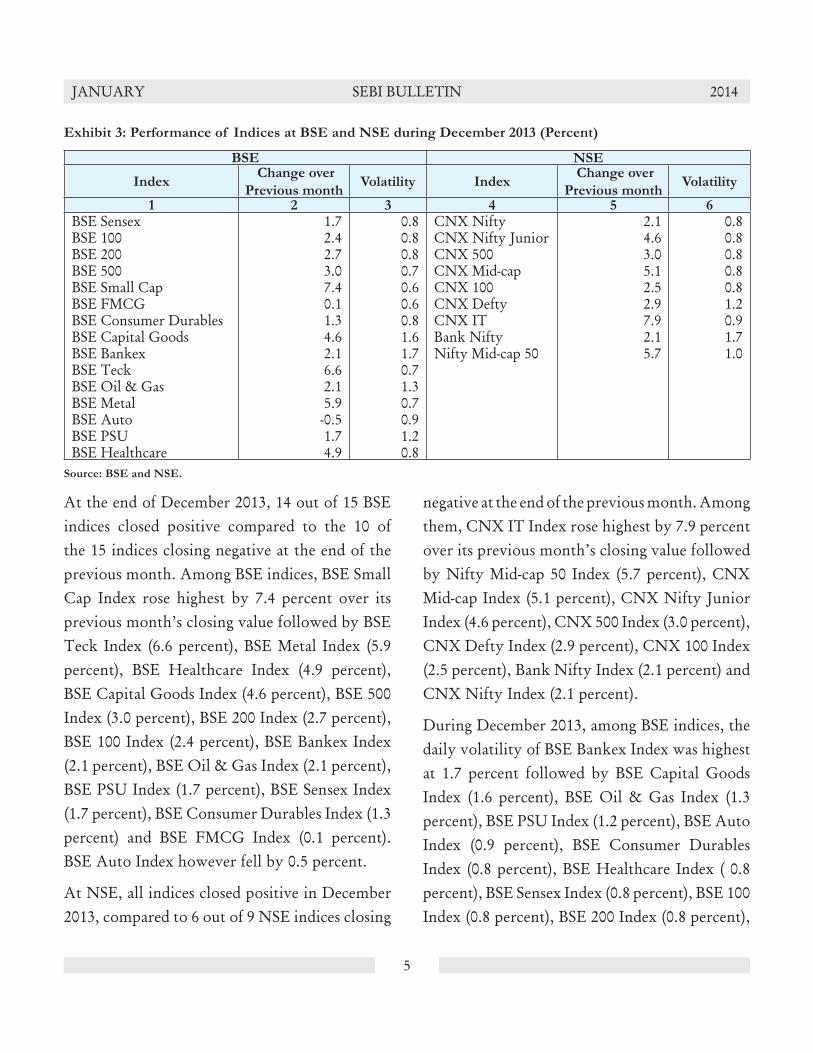
Exhibit 3: Performance of Indices at BSE and NSE during December 2013 (Percent)
BSE NSE
Index Change over
Previous monthVolatility Index
Change over
Previous monthVolatility
1 2 3 4 5 6
BSE Sensex 1.7 0.8 CNX Nifty 2.1 0.8BSE 100 2.4 0.8 CNX Nifty Junior 4.6 0.8BSE 200 2.7 0.8 CNX 500 3.0 0.8BSE 500 3.0 0.7 CNX Mid-cap 5.1 0.8BSE Small Cap 7.4 0.6 CNX 100 2.5 0.8BSE FMCG 0.1 0.6 CNX Defty 2.9 1.2BSE Consumer Durables 1.3 0.8 CNX IT 7.9 0.9BSE Capital Goods 4.6 1.6 Bank Nifty 2.1 1.7BSE Bankex 2.1 1.7 Nifty Mid-cap 50 5.7 1.0BSE Teck 6.6 0.7BSE Oil & Gas 2.1 1.3BSE Metal 5.9 0.7BSE Auto -0.5 0.9BSE PSU 1.7 1.2BSE Healthcare 4.9 0.8
Source: BSE and NSE.
negative at the end of the previous month. Among them, CNX IT Index rose highest by 7.9 percent over its previous month’s closing value followed by Nifty Mid-cap 50 Index (5.7 percent), CNX Mid-cap Index (5.1 percent), CNX Nifty Junior Index (4.6 percent), CNX 500 Index (3.0 percent), CNX Defty Index (2.9 percent), CNX 100 Index (2.5 percent), Bank Nifty Index (2.1 percent) and CNX Nifty Index (2.1 percent).
During December 2013, among BSE indices, the daily volatility of BSE Bankex Index was highest at 1.7 percent followed by BSE Capital Goods Index (1.6 percent), BSE Oil & Gas Index (1.3 percent), BSE PSU Index (1.2 percent), BSE Auto Index (0.9 percent), BSE Consumer Durables Index (0.8 percent), BSE Healthcare Index ( 0.8 percent), BSE Sensex Index (0.8 percent), BSE 100 Index (0.8 percent), BSE 200 Index (0.8 percent),
At the end of December 2013, 14 out of 15 BSE indices closed positive compared to the 10 of the 15 indices closing negative at the end of the previous month. Among BSE indices, BSE Small Cap Index rose highest by 7.4 percent over its previous month’s closing value followed by BSE Teck Index (6.6 percent), BSE Metal Index (5.9 percent), BSE Healthcare Index (4.9 percent), BSE Capital Goods Index (4.6 percent), BSE 500 Index (3.0 percent), BSE 200 Index (2.7 percent), BSE 100 Index (2.4 percent), BSE Bankex Index (2.1 percent), BSE Oil & Gas Index (2.1 percent), BSE PSU Index (1.7 percent), BSE Sensex Index (1.7 percent), BSE Consumer Durables Index (1.3 percent) and BSE FMCG Index (0.1 percent). BSE Auto Index however fell by 0.5 percent.
At NSE, all indices closed positive in December 2013, compared to 6 out of 9 NSE indices closing

6
JANUARY SEBI BULLETIN 2014
BSE 500 Index (0.7 percent), BSE Metal Index (0.7 percent), BSE Teck Index (0.7 percent), BSE FMCG Index (0.6 percent) and BSE Small Cap Index (0.6 percent).At NSE, among all the indices, daily volatility of Bank Nifty Index was highest at 1.7 percent
followed by CNX Defty Index (1.2 percent), Nifty Mid-cap 50 Index (1.0 percent), CNX IT Index (0.9 percent), CNX Nifty Index (0.8 percent), CNX 100 Index (0.8 percent), CNX Mid-cap Index (0.8 percent), CNX 500 Index (0.8 percent) and CNX Nifty Junior Index (0.8 percent).
III. Trends in Depository Accounts
The total number of investor accounts was 130.6 lakh at NSDL and 86.8 lakh at CDSL at the end of December 2013. The number of investor accounts in December 2013 increased by 0.4 percent and 0.3 percent over the previous month at NSDL
and CDSL respectively. A comparison with December 2012 showed there was an increase in the number of investor accounts to the extent of 4.1 percent at NSDL and 5.9 percent at CDSL. (Details in Table 67)
IV. Trends in Derivatives Segment
A. Equity Derivatives
The monthly total turnover in equity derivative market at NSE decreased by 3.8 percent from `28,98,504 crore in November 2013 to ̀ 27,87,962 crore in December 2013. The monthly turnover of index futures also decreased by 7.9 percent from to `2,54,056 crore in November 2013 to `2,33,973 crore in December 2013. Further, the monthly turnover of stock futures increased by 6.7 percent from `3,97,676 crore in November 2013 to `4,24,128 crore in December 2013.
The monthly turnover of put options on index decreased by 5.9 percent from ̀ 10,06,011 crore in November 2013 to `9,46,911 crore in December 2013. The monthly turnover of call options on index decreased by 4.9 percent from `10,73,927 crore in November 2013 to `10,21,710 crore in December 2013. The monthly turnover of put options on stock decreased by 3.8 percent from `57,164 crore in November 2013 to `54,981
crore in December 2013. The monthly turnover of call options on stock also decreased by 3.1 percent from `1,09,671 crore in November 2013 to `1,06,258 crore in December 2013.
The open interest in value terms in equity derivative segment of NSE decreased by 3.2 percent from `1,13,911 crore as on November 29, 2013 to `1,10,212 crore as on December 31, 2013. The open interest in value terms in equity derivative segment for Index Futures, Stock Futures, Put Options on Index, Call Options on Index, Put Options on Stock and Call Options on Stock at the end of December 2013 stood at `15,219 crore, `35,012 crore, `24,953 crore, `29,311 crore, `2,048 crore and `3,668 crore respectively, with a corresponding growth rates of 5.0 percent, 7.0 percent, – 21.5 percent, – 5.7 percent, 36.2 percent and 58.8 percent as compared to November 29, 2013.

7
JANUARY SEBI BULLETIN 2014
The monthly total turnover in equity derivative segment of BSE decreased by 10.8 percent from `6,38,687 crore in November 2013 to `5,69,439 crore in December 2013. The monthly turnover of index futures also decreased by 23.8 percent from `2,481 crore in November 2013 to `1,890 crore in December 2013. Further, the monthly turnover of stock futures increased by 22.2 percent from `2,701 crore in November 2013 to `3,302 crore in December 2013.
The monthly turnover of put options on index increased by 8.6 percent from `2,78,428 crore in November 2013 to `3,02,326 crore in December 2013. The monthly turnover of call options on index decreased by 26.6 percent from `3,53,711 crore in November 2013 to `2,59,649 crore in December 2013. The monthly turnover of put options on stock more than doubled from `665 crore in November 2013 to `1,385 crore in December 2013. The monthly turnover of call options on stock also increased by 26.7 percent from ̀ 700 crore in November 2013 to ̀ 886 crore in December 2013.
The open interest in value terms in equity derivative
segment of BSE increased by 16.6 percent from `867 crore as on November 29, 2013 to `1,011 crore as on December 31, 2013. The open interest in value terms in equity derivative segment for Index Futures, Stock Futures, Put Options on Index, Call Options on Index, at the end of December 2013 stood at `289 crore, `217 crore, `234 crore, `205 crore, respectively, with a corresponding growth rates of 3.6 percent, 7.9 percent, 18.8 percent, 7.5 percent as compared to November 29, 2013. The open interest for Put Options on Stock and Call Options on Stock in December 2013 was `49 crore and `17 crore respectively.
The monthly total turnover in equity derivative segment of MCXSX decreased by 16.3 percent from `8,765 crore in November 2013 to `7,339 crore in December 2013. The monthly turnover of index futures decreased by 9.2 percent from `1,582 crore in November 2013 to `1,437 crore in December 2013 and the monthly turnover of stock futures increased by 4.9 percent from `69 crore in November 2013 to `72 crore in December 2013.
The open interest in value terms in equity derivative segment increased by 32.8 percent
Figure 5: Trends of Equity Derivatives Segment at NSE (`crore)
8
JANUARY SEBI BULLETIN 2014
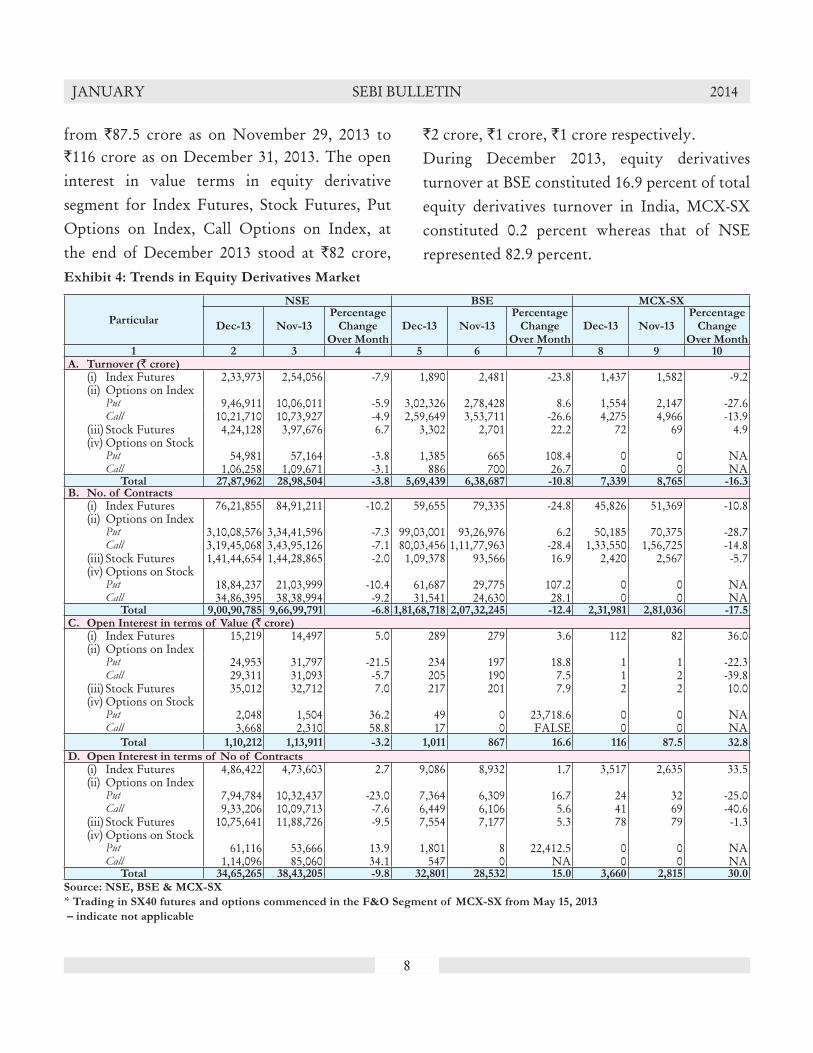
Exhibit 4: Trends in Equity Derivatives Market
Particular
NSE BSE MCX-SX
Dec-13 Nov-13Percentage
Change Over Month
Dec-13 Nov-13Percentage
Change Over Month
Dec-13 Nov-13Percentage
Change Over Month
1 2 3 4 5 6 7 8 9 10A. Turnover (` crore) (i) Index Futures 2,33,973 2,54,056 -7.9 1,890 2,481 -23.8 1,437 1,582 -9.2 (ii) Options on Index Put 9,46,911 10,06,011 -5.9 3,02,326 2,78,428 8.6 1,554 2,147 -27.6 Call 10,21,710 10,73,927 -4.9 2,59,649 3,53,711 -26.6 4,275 4,966 -13.9 (iii) Stock Futures 4,24,128 3,97,676 6.7 3,302 2,701 22.2 72 69 4.9 (iv) Options on Stock Put 54,981 57,164 -3.8 1,385 665 108.4 0 0 NA Call 1,06,258 1,09,671 -3.1 886 700 26.7 0 0 NA
Total 27,87,962 28,98,504 -3.8 5,69,439 6,38,687 -10.8 7,339 8,765 -16.3B. No. of Contracts (i) Index Futures 76,21,855 84,91,211 -10.2 59,655 79,335 -24.8 45,826 51,369 -10.8 (ii) Options on Index Put 3,10,08,576 3,34,41,596 -7.3 99,03,001 93,26,976 6.2 50,185 70,375 -28.7 Call 3,19,45,068 3,43,95,126 -7.1 80,03,456 1,11,77,963 -28.4 1,33,550 1,56,725 -14.8 (iii) Stock Futures 1,41,44,654 1,44,28,865 -2.0 1,09,378 93,566 16.9 2,420 2,567 -5.7 (iv) Options on Stock Put 18,84,237 21,03,999 -10.4 61,687 29,775 107.2 0 0 NA Call 34,86,395 38,38,994 -9.2 31,541 24,630 28.1 0 0 NA
Total 9,00,90,785 9,66,99,791 -6.8 1,81,68,718 2,07,32,245 -12.4 2,31,981 2,81,036 -17.5C. Open Interest in terms of Value (` crore) (i) Index Futures 15,219 14,497 5.0 289 279 3.6 112 82 36.0 (ii) Options on Index Put 24,953 31,797 -21.5 234 197 18.8 1 1 -22.3 Call 29,311 31,093 -5.7 205 190 7.5 1 2 -39.8 (iii) Stock Futures 35,012 32,712 7.0 217 201 7.9 2 2 10.0 (iv) Options on Stock Put 2,048 1,504 36.2 49 0 23,718.6 0 0 NA Call 3,668 2,310 58.8 17 0 FALSE 0 0 NA
Total 1,10,212 1,13,911 -3.2 1,011 867 16.6 116 87.5 32.8
D. Open Interest in terms of No of Contracts (i) Index Futures 4,86,422 4,73,603 2.7 9,086 8,932 1.7 3,517 2,635 33.5 (ii) Options on Index Put 7,94,784 10,32,437 -23.0 7,364 6,309 16.7 24 32 -25.0 Call 9,33,206 10,09,713 -7.6 6,449 6,106 5.6 41 69 -40.6 (iii) Stock Futures 10,75,641 11,88,726 -9.5 7,554 7,177 5.3 78 79 -1.3 (iv) Options on Stock Put 61,116 53,666 13.9 1,801 8 22,412.5 0 0 NA Call 1,14,096 85,060 34.1 547 0 NA 0 0 NA
Total 34,65,265 38,43,205 -9.8 32,801 28,532 15.0 3,660 2,815 30.0
Source: NSE, BSE & MCX-SX
* Trading in SX40 futures and options commenced in the F&O Segment of MCX-SX from May 15, 2013
– indicate not applicable
from `87.5 crore as on November 29, 2013 to `116 crore as on December 31, 2013. The open interest in value terms in equity derivative segment for Index Futures, Stock Futures, Put Options on Index, Call Options on Index, at the end of December 2013 stood at `82 crore,
`2 crore, `1 crore, `1 crore respectively.During December 2013, equity derivatives turnover at BSE constituted 16.9 percent of total equity derivatives turnover in India, MCX-SX constituted 0.2 percent whereas that of NSE represented 82.9 percent.

9
JANUARY SEBI BULLETIN 2014
During December 2013, the monthly turnover of currency derivatives at NSE decreased by 6 percent to `1,86,064 crore from `1,97,909 crore in November 2013. Further, at MCX-SX, the monthly turnover of currency derivatives also decreased by 0.8 percent to `87,641 crore in
December 2013 from ̀ 88,360 crore in November 2013. The turnover of currency derivatives at USE however increased by 13.5 percent from `16,757 crore in November 2013 to `19,016 crore in December 2013. (Details in Table 46, 47
and 48)
B. Currency Derivatives at NSE, MCX-SX and USE
Figure 6: Trends of Currency Derivatives at NSE, MCX-SX and USE (`crore)
V. Trading in Corporate Debt Market
During December 2013, there were 718 trades with a value of `6,548 crore reported on BSE as compared to 578 trades with a value of `5,199 crore in November 2013. At NSE, 1,300 trades were reported in December 2013 with a trading value of `13,244 crore as compared to 1,324
trades with a trading value of `19,085 crore in November 2013. Further, 2,887 trades with a value of ̀ 37,090 crore were reported to FIMMDA in December 2013 as against 2,535 trades with a value of `35,623 crore in November 2013. (Details in Table 14)
Figure 7: Trends of Reported Turnover of Corporate Bonds (`crore)
10
JANUARY SEBI BULLETIN 2014
VI. Trends in Institutional Investment
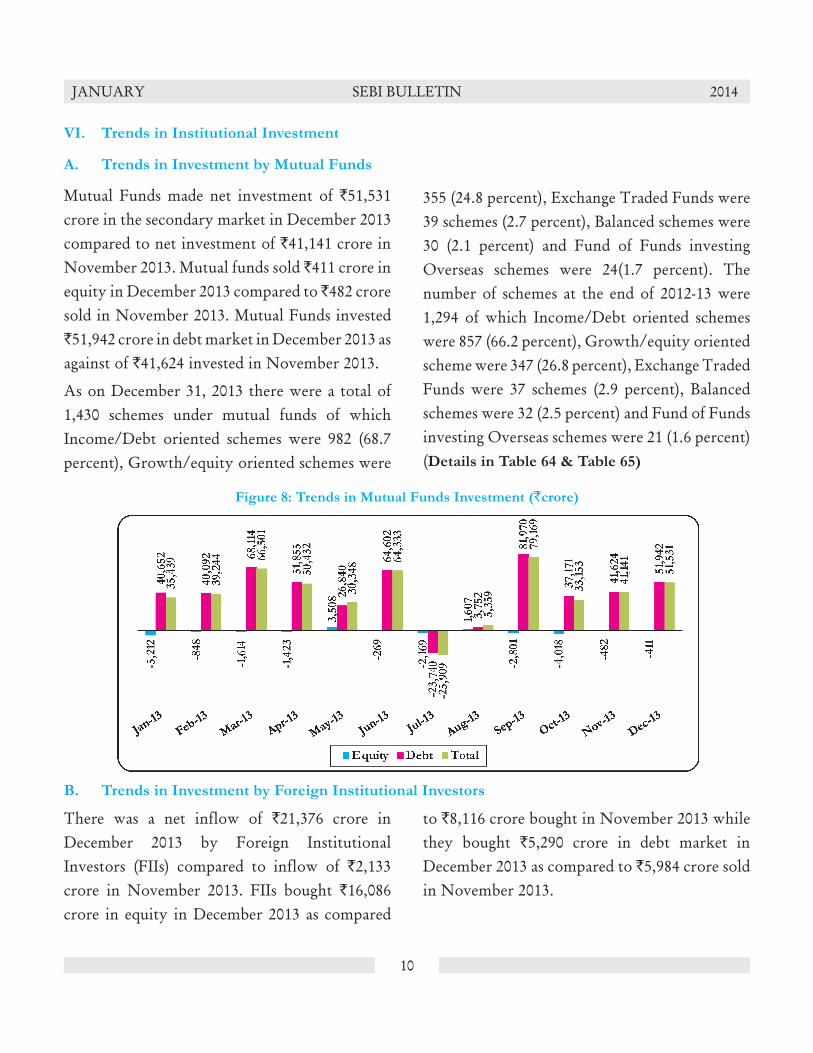
A. Trends in Investment by Mutual Funds
Mutual Funds made net investment of `51,531 crore in the secondary market in December 2013 compared to net investment of `41,141 crore in November 2013. Mutual funds sold ̀ 411 crore in equity in December 2013 compared to ̀ 482 crore sold in November 2013. Mutual Funds invested `51,942 crore in debt market in December 2013 as against of `41,624 invested in November 2013.
As on December 31, 2013 there were a total of 1,430 schemes under mutual funds of which Income/Debt oriented schemes were 982 (68.7 percent), Growth/equity oriented schemes were
355 (24.8 percent), Exchange Traded Funds were 39 schemes (2.7 percent), Balanced schemes were 30 (2.1 percent) and Fund of Funds investing Overseas schemes were 24(1.7 percent). The number of schemes at the end of 2012-13 were 1,294 of which Income/Debt oriented schemes were 857 (66.2 percent), Growth/equity oriented scheme were 347 (26.8 percent), Exchange Traded Funds were 37 schemes (2.9 percent), Balanced schemes were 32 (2.5 percent) and Fund of Funds investing Overseas schemes were 21 (1.6 percent) (Details in Table 64 & Table 65)
Figure 8: Trends in Mutual Funds Investment (`crore)
There was a net inflow of `21,376 crore in December 2013 by Foreign Institutional Investors (FIIs) compared to inflow of `2,133 crore in November 2013. FIIs bought `16,086 crore in equity in December 2013 as compared
to `8,116 crore bought in November 2013 while they bought `5,290 crore in debt market in December 2013 as compared to `5,984 crore sold in November 2013.
B. Trends in Investment by Foreign Institutional Investors

11
JANUARY SEBI BULLETIN 2014
Figure 9: Trends in FIIs Investment (`crore)
Total assets under management (AUM) of Portfolio Management Services (PMS) industry have increased by 3.0 percent from `7,01,417 crore in November 2013 to `7,22,233 crore in December 2013. As on December 31, 2013, AUM of discretionary PMS constitute 76.5 percent of the total AUM of PMS followed by advisory PMS (18.3 percent) and non discretionary PMS
(5.1 percent).In terms of number of clients, discretionary services category ranks first with total of 43,159 clients, out of 58,175 clients in PMS industry, followed by advisory services with 9,918 clients and non-discretionary category with 5,098 clients. (Details in Table 66)
VIII. Trends in Substantial Acquisition of Shares and Takeovers
In December 2013, six open offers with total value of `128 crore were made to public against three public offers with total value of `62 crore in November 2013. Two open offers each were
made during the month were for Consolidation of Holdings, Change in control of management and substantial acquisition. (Details in Table 5)
���
VII. Trends in Portfolio Management Services
The assets under custody of FIIs at the end of December 2013 stands at `14,64,355 crore, out of which the value of participatory notes including
PNs on derivatives is ̀ 1,67,566 crore, constituting 11.4 percent of the total asset under custody of FIIs. (Details in Table 57 & Table 59)
12
JANUARY SEBI BULLETIN 2014
Monthly Review of Global Financial Markets – January 2014#
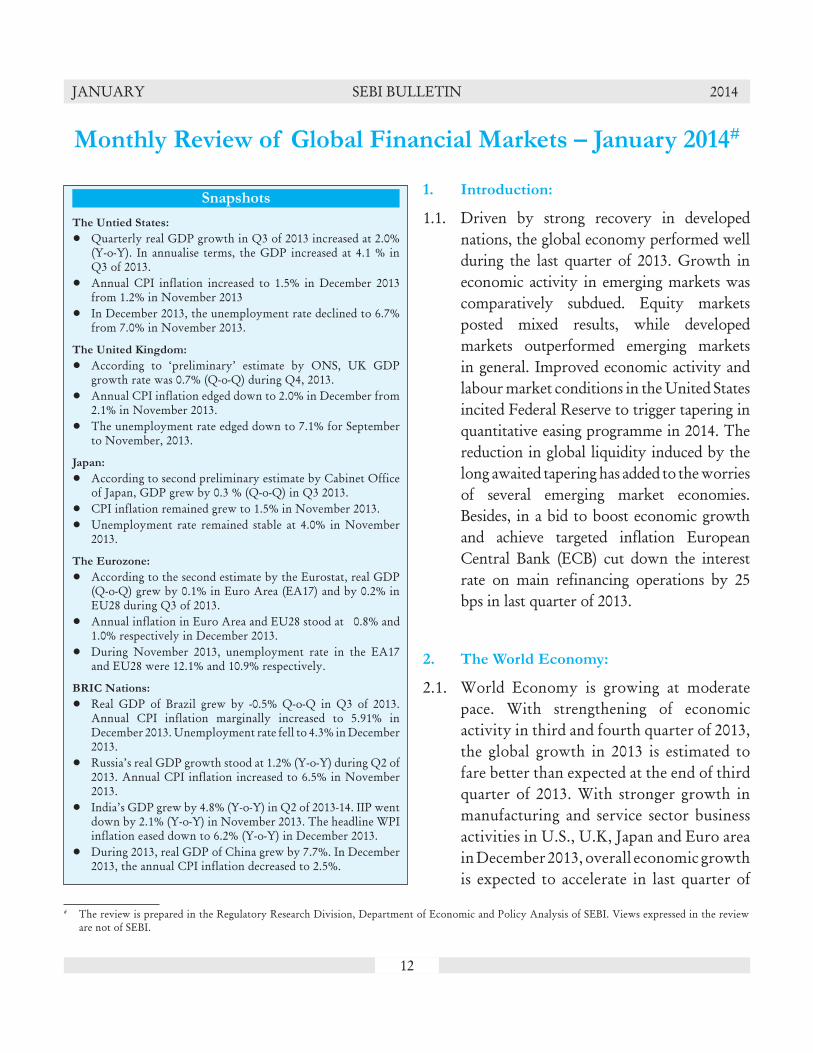
1. Introduction:
1.1. Driven by strong recovery in developed nations, the global economy performed well during the last quarter of 2013. Growth in economic activity in emerging markets was comparatively subdued. Equity markets posted mixed results, while developed markets outperformed emerging markets in general. Improved economic activity and labour market conditions in the United States incited Federal Reserve to trigger tapering in quantitative easing programme in 2014. The reduction in global liquidity induced by the long awaited tapering has added to the worries of several emerging market economies. Besides, in a bid to boost economic growth and achieve targeted inflation European Central Bank (ECB) cut down the interest rate on main refinancing operations by 25 bps in last quarter of 2013.
2. The World Economy:
2.1. World Economy is growing at moderate pace. With strengthening of economic activity in third and fourth quarter of 2013, the global growth in 2013 is estimated to fare better than expected at the end of third quarter of 2013. With stronger growth in manufacturing and service sector business activities in U.S., U.K, Japan and Euro area in December 2013, overall economic growth is expected to accelerate in last quarter of
# The review is prepared in the Regulatory Research Division, Department of Economic and Policy Analysis of SEBI. Views expressed in the review are not of SEBI.
Snapshots
The Untied States:
• Quarterly real GDP growth in Q3 of 2013 increased at 2.0% (Y-o-Y). In annualise terms, the GDP increased at 4.1 % in Q3 of 2013.
• Annual CPI inflation increased to 1.5% in December 2013 from 1.2% in November 2013
• In December 2013, the unemployment rate declined to 6.7% from 7.0% in November 2013.
The United Kingdom:
• According to ‘preliminary’ estimate by ONS, UK GDP growth rate was 0.7% (Q-o-Q) during Q4, 2013.
• Annual CPI inflation edged down to 2.0% in December from 2.1% in November 2013.
• The unemployment rate edged down to 7.1% for September to November, 2013.
Japan:
• According to second preliminary estimate by Cabinet Office of Japan, GDP grew by 0.3 % (Q-o-Q) in Q3 2013.
• CPI inflation remained grew to 1.5% in November 2013.• Unemployment rate remained stable at 4.0% in November
2013.
The Eurozone:
• According to the second estimate by the Eurostat, real GDP (Q-o-Q) grew by 0.1% in Euro Area (EA17) and by 0.2% in EU28 during Q3 of 2013.
• Annual inflation in Euro Area and EU28 stood at 0.8% and 1.0% respectively in December 2013.
• During November 2013, unemployment rate in the EA17 and EU28 were 12.1% and 10.9% respectively.
BRIC Nations:
• Real GDP of Brazil grew by -0.5% Q-o-Q in Q3 of 2013. Annual CPI inflation marginally increased to 5.91% in December 2013. Unemployment rate fell to 4.3% in December 2013.
• Russia’s real GDP growth stood at 1.2% (Y-o-Y) during Q2 of 2013. Annual CPI inflation increased to 6.5% in November 2013.
• India’s GDP grew by 4.8% (Y-o-Y) in Q2 of 2013-14. IIP went down by 2.1% (Y-o-Y) in November 2013. The headline WPI inflation eased down to 6.2% (Y-o-Y) in December 2013.
• During 2013, real GDP of China grew by 7.7%. In December 2013, the annual CPI inflation decreased to 2.5%.

13
JANUARY SEBI BULLETIN 2014
2013. On the other hand, growth outlook for emerging economies remains subdued.
2.2. International Monetary Fund (IMF) in its World Economic Outlook Update published in January 2014 has revised upward its growth for 2013 and projection for global growth for 2014 from its forecast in the October 2013 World Economic Outlook (WEO). According to IMF estimates, global economy is estimated to grow at 3.7 per cent in 2014 and 3.9 per cent in 2015. In 2013, the global economic
growth stood at 3.0 per cent.
2.3. The January 2014 WEO Update by IMF projects the growth in advanced economies at 2.2 per cent in 2014 and 2.3 per cent in 2015. Growth rate projections for emerging markets and developing economies for 2014 and 2015 stood at 5.1 per cent and 5.4 per cent, respectively. The projection for real GDP growth in India has also been marked upward significantly, with growth projected at 5.4 per cent in 2014 and 6.4 per cent in 2015 (Exhibit 1).
Exhibit 1: Overview of the World Economic Outlook Projections - January 2014
Nations / Regions
Year over Year Q4 over Q4
ProjectionsDifference from
October 2013 WEO Update
Estimates Projections
2012 2013 2014 2015 2014 2015 2013 2014 2015World Output1 3.1 3.0 3.7 3.9 0.1 0.0 3.3 3.6 3.8Advanced Economies 1.4 1.3 2.2 2.3 0.2 -0.2 2.0 2.1 2.3
United States 2.8 1.9 2.8 3.0 0.2 -0.4 2.5 2.8 3.0Euro Area -0.7 -0.4 1.0 1.4 0.1 0.1 0.5 1.2 1.5 Germany 0.9 0.5 1.6 1.4 0.2 0.1 1.6 1.3 1.4 France 0.0 0.2 0.9 1.5 0.0 0.0 0.6 1.2 1.6 Italy -2.5 -1.8 0.6 1.1 -0.1 0.1 -0.8 1.0 1.2 Spain -1.6 -1.2 0.6 0.8 0.4 0.3 -0.2 0.7 0.9Japan 1.4 1.7 1.7 1.0 0.4 -0.2 3.1 0.9 0.6United Kingdom 0.3 1.7 2.4 2.2 0.6 0.2 2.3 2.7 1.8Canada 1.7 1.7 2.2 2.4 0.1 -0.1 2.2 2.3 2.4Other Advanced Economies 1.9 2.2 3.0 3.2 -0.1 -0.1 2.7 2.9 3.4Emerging Market and Developing Economies1 4.9 4.7 5.1 5.4 0.0 0.1 4.8 5.4 5.6
Developing Asia 6.4 6.5 6.7 6.8 0.2 0.2 6.4 6.8 7.0ASEAN-52 6.2 5.0 5.1 5.6 -0.3 0.0 4.0 5.6 5.6BRICS Nations
Brazil 1.0 2.3 2.3 2.8 -0.2 -0.4 1.9 2.6 3.0 Russia 3.4 1.5 2.0 2.5 -1.0 -1.0 1.9 1.5 3.2 India3 3.2 4.4 5.4 6.4 0.2 0.1 4.6 5.5 7.0
China 7.7 7.7 7.5 7.3 0.3 0.2 7.8 7.6 7.3 South Africa 2.5 1.8 2.8 3.3 -0.1 0.0 1.9 3.2 3.3
Note: The aggregated quarterly data are seasonally adjusted. Figures represent percentage change unless noted otherwise. 1 The quarterly estimates and projections account for 90 percent of the world purchasing-power-parity weights and around 80 per
cent of emerging market and developing economies 2 Indonesia, Malaysia, Philippines, Thailand, Vietnam. 3 For, India, data and forecasts are presented on a fiscal year basis.Source: IMF

14
JANUARY SEBI BULLETIN 2014
Exhibit 2: Major Macroeconomic Indicators
Country / Region
Quarterly Growth Rate of
Real GDPAnnual CPI
Inflation RateUnemployment Rate
Benchmark
Interest RateQ-o-Q Y-o-Y
Deve
lop
ed
Eco
no
mie
s
OECD 0.60 (Q3) 1.40 (Q3) 1.50 (Nov) 7.80 (Nov) NAUSA 1.02 (Q3) 1.96 (Q3) 1.50 (Dec) 6.70 (Dec) 0.25UK 0.70 (Q4) 2.77 (Q4) 2.00 (Dec) 7.10 (Sept-Nov) 0.50Japan 0.26 (Q3) 2.40 (Q3) 1.50 (Nov) 4.00 (Nov) 0.10Euro Area (EA17) 0.08 (Q3) -0.36 (Q3) 0.80 (Dec) 12.10 (Nov) 0.25European Union (EU28) 0.23 (Q3) 0.08 (Q3) 1.00 (Dec) 10.90 (Nov) NA
BR
IC
Brazil -0.48 (Q3) 2.19 (Q3) 5.91 (Dec) 4.30 (Dec) 10.50Russia -0.26 (Q2) 1.24 (Q2) 6.50 (Nov) 5.50 (Oct) 5.50India* NA 4.80 (Q3) 6.16 (Dec) NA 8.00China 1.80 (Q4) 7.70 (Q4) 2.50 (Dec) NA 6.00
Oth
er
EM
Es Korea 0.92 (Q4) 4.00 (Q4) 1.10 (Dec) 2.90 (Nov) 2.50
Indonesia 1.33 (Q3) 5.64 (Q3) 8.40 (Dec) NA 7.50Turkey 0.86 (Q3) 4.40 (Q3) 7.40 (Dec) 9.70 (Oct) 10.00
Note: Months mentioned in bracket are for the Year-2013. (Q2), (Q3) & (Q4) represent second, third and fourth quarter of 2013 respectively. * Wholesale Price Index (WPI) inflation data is considered for measuring inflation in India. # Bank of Russia’s newly introduced “Key rate” NA – Not AvailableSource: Official Database & Central Banks of respective countries, OECD
Organisation for Economic Co-operation and Development (OECD):
cent), United Kingdom (0.8 per cent), and Canada (0.7 per cent).
2.5. OECD area annual consumer price inflation increased to 1.5 per cent in November 2014 from 1.3 per cent in October 2013. The annual inflation went up in November 2013, after declining consecutively for four months. High increase in energy prices during the month drove the overall inflation rate. Food price inflation decreased marginally to 1.5 per cent in November, compared with 1.6 per cent in previous month. Excluding food and energy, the OECD annual inflation rate increased to 1.6 per cent in November 2013. Among
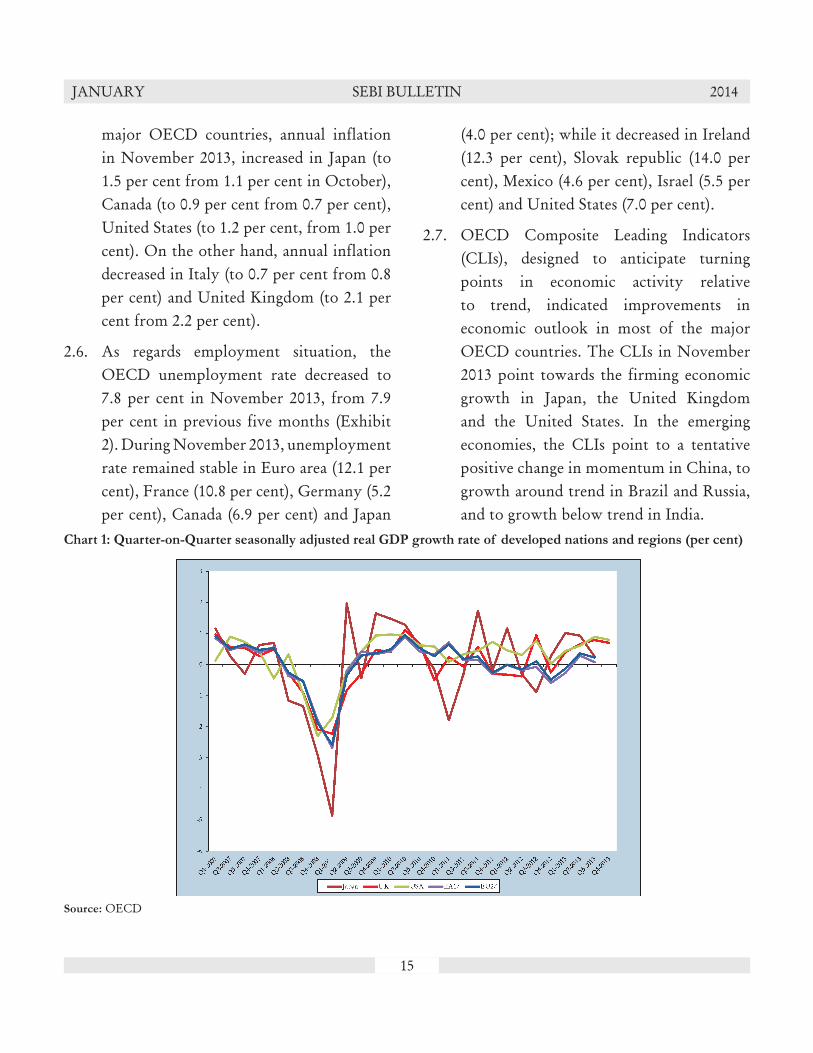
2.4. As per provisional estimated released by OECD, quarterly real GDP in the OECD area grew by 1.4 per cent Year-on-Year (Y-o-Y) during the third quarter of 2013 compared to 1.0 per cent (Y-o-Y) in second quarter of 2013. Compared with the second quarter of 2013, the real GDP grew by 0.5 per cent Quarter-on-Quarter (Q-o-Q) in Q3 2013. Quarterly GDP in G20 area recorded a growth of 0.9 per cent (Q-o-Q) during the third quarter of 2013, up from a growth of 0.8 per cent in previous quarter. During the third quarter of 2013, the GDP growth (Q-o-Q) in OECD area was supported by higher growth in United States (1.0 per
15
JANUARY SEBI BULLETIN 2014
major OECD countries, annual inflation in November 2013, increased in Japan (to 1.5 per cent from 1.1 per cent in October), Canada (to 0.9 per cent from 0.7 per cent), United States (to 1.2 per cent, from 1.0 per cent). On the other hand, annual inflation decreased in Italy (to 0.7 per cent from 0.8 per cent) and United Kingdom (to 2.1 per cent from 2.2 per cent).
2.6. As regards employment situation, the OECD unemployment rate decreased to 7.8 per cent in November 2013, from 7.9 per cent in previous five months (Exhibit 2). During November 2013, unemployment rate remained stable in Euro area (12.1 per cent), France (10.8 per cent), Germany (5.2 per cent), Canada (6.9 per cent) and Japan
(4.0 per cent); while it decreased in Ireland (12.3 per cent), Slovak republic (14.0 per cent), Mexico (4.6 per cent), Israel (5.5 per cent) and United States (7.0 per cent).
2.7. OECD Composite Leading Indicators (CLIs), designed to anticipate turning points in economic activity relative to trend, indicated improvements in economic outlook in most of the major OECD countries. The CLIs in November 2013 point towards the firming economic growth in Japan, the United Kingdom and the United States. In the emerging economies, the CLIs point to a tentative positive change in momentum in China, to growth around trend in Brazil and Russia, and to growth below trend in India.
Chart 1: Quarter-on-Quarter seasonally adjusted real GDP growth rate of developed nations and regions (per cent)
Source: OECD

16
JANUARY SEBI BULLETIN 2014
The United States:
2.8. According to the “third” estimates released by the Bureau of Economic Analysis (BEA), real gross domestic product of the United States grew by 2.0 per cent (Y-o-Y) during third quarter of 2013, indicating an upward revision from the “second” estimate of 1.8 per cent for Q3 2013. In annualised terms, the GDP increased at the 4.1 per cent (compared to 3.6 per cent in “second” estimates and 2.8 per cent in “advance” estimates) in Q3 of 2013 as compared to annual growth of 2.5 per cent in the second quarter of 2013. An increase in real GDP in the third quarter was mainly led by positive contributions
from personal consumption expenditures (PCE), private inventory investment, exports, residential fixed investment, non-residential fixed investment, and state and local government spending, which was partially offset by negative contribution from federal government spending. During December 2013, U.S. manufacturing sector witnessed strongest expansion since March 2012. Sharp increase in rate of output growth during the month was reflected by increase in the Markit U.S. Manufacturing PMI to 55.0 from 54.7 in previous month.
2.9. As per data released by the Bureau of Labor Statistics, the annual consumer price inflation
Chart 2: Year-on-Year Consumer Price Inflation* (per cent)
Note: * Wholesale Price Index (WPI) inflation is considered for measuring inflation in India
Source: OECD, Office of Economic Advisor to Government of India

17
JANUARY SEBI BULLETIN 2014
increased to 1.5 per cent in December 2013 (from 1.2 per cent in November 2013), after declining consecutively for the past four months. Compared to previous month, consumer price index increased by 0.3 per cent in December 2013. Over the last 12 months, the core inflation, i.e. prices of all items less food and energy increased by 1.7 per cent at the end of December 2013. The food inflation stood at 1.1 per cent, while the energy prices grew by 0.5 per cent during the month. During December 2013, the unemployment rate declined to 6.7 per cent from 7.0 per cent in previous month.
2.10. The Federal Open Market Committee (FOMC) during its meeting in January 2014, decided to reduce the pace of asset purchase by another $10 billion since February 2014. The Committee has decided to purchase additional agency mortgage-backed securities at a pace of $30 billion instead of $35 billion per month and the longer-term Treasury securities at a pace of $35 billion rather than $40 billion per month.
2.11. Observations: Revised estimates of real GDP growth for the third quarter of 2013 have shown improvements in economic activity. Investments in fixed asset are on increasing trend. Strong pickup in manufacturing sector and better labour market condition have imparted confidence to policy makers to continue with tapering in quantitative easing programme.
The United Kingdom:
2.12. As per the “preliminary” estimate of GDP, released by the Office for National Statistics, the quarterly real GDP grew by 2.8 per cent in the fourth quarter of 2013 (Y-o-Y) as compared to 1.5 per cent in third quarter and 1.3 per cent in second quarter of 2013. The real GDP increased by 0.7 per cent (Q-o-Q) in the fourth quarter of 2013, lower than the GDP growth of 0.8 per cent in Q3 of 2013. Output increased in three out of four main industrial groupings. Output increased by 0.8 per cent in services (service sector contributed 0.61 percentage points to the quarterly GDP growth), 0.7 per cent in production and 0.5 per cent in agriculture sector during Q4 of 2013 compared with previous quarter. During December 2013, manufacturing sector in U.K. expanded successively for the ninth month however at marginally slower rate compared to previous month. Markit UK Manufacturing PMI stood at 57.3 in December 2013 compared to 58.4 in previous month, indicating strong expansion in manufacturing activities.
2.13. As regards the price situation, annual CPI inflation further eased down to 2.0 per cent in December 2013 from 2.1 per cent in previous month. The largest downward contribution to change in annual inflation rate during the month was due to reduction in prices of food & non-alcoholic beverages and recreational goods & services.

18
JANUARY SEBI BULLETIN 2014
2.14. The Bank of England’s Monetary Policy Committee at its meeting on January 09, 2014, maintained the official Bank Rate paid on commercial bank reserves unchanged at 0.5 per cent and decided to continue the stock of asset purchases, financed by the issuance of central bank reserves at £375 billion. The unemployment rate of the economically active population for period September to November 2013 further reduced to 7.1 per cent as compared to 7.4 per cent as for the period August to October 2013.
2.15. Observations: U.K. economy is recovering, as preliminary estimates of GDP for the last quarter of 2013 confirmed the growth trajectory. Manufacturing, construction and service sector (services accounts for more than three quarters of output) are expanding at increased rate thereby adding to new job creation. With improving economic conditions, International Monetary Fund (IMF) has increased its growth forecast for the UK economy to 2.4 per cent for 2014.
Japan:
2.16. According to the “second” preliminary estimate of GDP, released by the Cabinet Office of Japan, the real GDP of Japan grew by 1.1 per cent (downward revision from 1.9 per cent in first preliminary estimate) in annualised terms during the third quarter of 2013 against annualised growth of 3.6 per cent in Q2 2013. The
real GDP grew by 0.3 per cent (Q-o-Q) (lower than the first estimate of 0.5 per cent) in Q3 2013 in comparison to 0.9 per cent in previous quarter. Compared to the third quarter of 2012, real GDP grew by 2.4 per cent in Q3 2013, higher than the growth of 1.2 per cent in Q2 2013. Weaker than earlier estimated business spending, contributed to the downward revision in the GDP figures.
2.17. During December 2013, manufacturing sector continued to grow at strong pace. Seasonally adjusted Markit Japan Manufacturing PMI stood at 55.2 in December 2013 as in previous month. While, service sector activities grew at modest pace in December 2013, with rise in Services PMI to 52.1 from 51.8 in November 2013.
2.18. According to the estimates by Statistics Bureau and the Director-General for Policy Planning of Japan, the annual CPI inflation grew to 1.5 per cent in November 2013 from 1.1 per cent in previous month. Compared to previous month, the consumer price index for Japan remained unchanged in November 2013. In its Monetary Policy meeting held in January 22, 2014, Bank of Japan decided to conduct money market operations so that the monetary base will increase at an annual pace of about 60-70 trillion yen. The unemployment rate in Japan remained stable at 4.0 per cent in November 2013 as in previous month.
19
JANUARY SEBI BULLETIN 2014
Observations: Japanese economy is on recovery track. With increasing demand at home as well as from abroad, industrial production is growing. Business fixed investment and corporate profits have also shown improvements. The high rate of expansion in manufacturing sector has induced optimistic expectations in near future. However, employment situation remained unchanged since past couple of months.
The Eurozone:
2.19. The real GDP grew by 0.1 per cent (Q-o-Q) in Euro Area (EA17) and by 0.2 per cent (Q-o-Q) in EU28 during the third quarter of 2013, as per the “second” estimate by the Eurostat, the statistical office of the European Union. During the second quarter of 2013, the real GDP grew by 0.3 per cent (Q-o-Q) in Euro Area (EA17) and by 0.4 per cent (Q-o-Q) in EU28. Compared with the same quarter of the previous year, seasonally adjusted GDP fell by 0.4 per cent in the Euro area and rose by 0.1 per cent in EU28 in the third quarter of 2013, after contracting by 0.6 per cent and 0.1 per cent in Euro area and EU28 respectively, in previous quarter. During the third quarter of 2013, household final consumption expenditure rose by 0.1 per cent in the euro area and by 0.2 per cent in the EU28, while Gross fixed capital formation increased by 0.4 per cent in the euro area and by 0.6 per cent in the EU28.
2.20. The Eurozone manufacturing sector expanded for the sixth consecutive month
in December 2013. Markit Eurozone Manufacturing PMI posted 52.7 in December 2013, higher from 51.6 in previous month. (PMI above 50 mark indicates an expansion in business activity). Among major Eurozone economies, Netherland, Germany, Austria, Ireland, Italy and Spain reported expansion in manufacturing activities in December 2013, while France, Greece reported a contraction in business activity.
2.21. As regards the price situation, Euro Area annual inflation decreased marginally to 0.8 per cent in December 2013 from 0.9 per cent in previous month while annual inflation in European Union remained stable at 1.0 per cent in December 2013 as compared with previous month. The highest annual inflation in December was reported in U.K., Estonia and Austria (all 2.0 per cent), followed by Finland (1.9 per cent). On the other hand, annual inflation in Greece improved to -1.8 per cent in December from -2.9 per cent in previous month.
2.22. During November 2013, unemployment rate in both Euro Area and EU28 remained stable at 12.1 per cent and 10.9 per cent respectively. The highest unemployment rate was recorded in Greece (27.4 per cent for September 2013) and Spain (26.7 per cent for November 2013). The European Central Bank (ECB) in its meeting on
20
JANUARY SEBI BULLETIN 2014
January 09, 2014, kept the key interest rates unchanged on the main refinancing operations, interest rates on the marginal lending facility and the deposit facility at 0.25 per cent, 0.75 per cent and 0.00 per cent respectively.
2.23. Observations: Erozone economy is moving ahead on fragile recovery track. Declining inflation rate in spite of recent rate cut by European Central Bank (ECB) has raised concern for achieving target inflation rate of 2 per cent. Spain has shown considerable improvements with positive GDP growth in third and fourth quarter of 2013; on the other hand, GDP data from France has been disappointing.
Brazil:
2.24. Seasonally adjusted Real GDP of Brazil shrank by 0.5 per cent (Q-o-Q) in the third quarter of 2013, as per the estimates by Instituto Brasileiro de Geografia e Estatística. In comparison with the third quarter of 2012, the GDP grew by 2.2 per cent. High interest rates and weak commodity prices are hampering the growth of Brazilian economy. Output from Industry and Services sector increased to 1.9 per cent and 2.2 per cent, respectively in third quarter of 2013 as compared to the same quarter a year ago. On the contrary, agriculture sector output shrank by 1 per cent in Q3 of 2013 as compared to Q3 of 2012.
2.25. Brazil’s annual inflation rate (IPCA) increased to 5.91 per cent in December 2013, in comparison to 5.77 per cent in November 2013. On monthly basis, the benchmark index increased to 0.92 per cent in December 2013, as compared to 0.54 per cent in November 2013. Brazil’s central bank has raised its base lending rate by a half percentage point, from 10 per cent to 10.5 per cent signalling that it is maintaining a firm stance against rising prices in the wake of recent higher-than-expected inflation data. As regards the unemployment situation, the unemployment rate fell further to 4.3 per cent in December 2013 in comparison to 4.6 per cent in November 2013. The unemployment rate in December 2012 was 4.6 per cent. With the latest results, Brazil’s economy has reached its lowest unemployment rate since March 2002.
Russia:
2.26. According to estimates by the Russian State Statistics Service (Rosstat), quarterly real GDP of Russia grew at 1.2 per cent (Y-o-Y) during Q2 of 2013, compared to a growth of 1.6 per cent in first quarter of 2013. Russia’s economy ministry has also downgraded its GDP growth outlook of year 2013 to 1.4 per cent (lowest level since 2000). The worsening economic outlook this year has affected Russian financial markets and became one of the

21
JANUARY SEBI BULLETIN 2014
main reasons behind the ruble’s slide to its weakest levels since 2009 against the euro-dollar basket, the central banks’ barometer of the currency market. The economy ministry now sees an average ruble exchange rate at 33.9 against the dollar next year, which is 1.5 per cent weaker than was expected in September 2013 and more than 6 per cent weaker than the average in 2013.
2.27. As regards price situation, the annual CPI inflation rate jumped to 6.5 per cent in November 2013 from 6.3 per cent in October 2013. The acceleration of inflation was mainly attributed to rise in prices of fruits and vegetables. The Bank of Russia has targeted an inflation of 5 per cent for 2014 and cut the target by 0.5 per cent in the following two years. Bank of Russia has stated that the food driven acceleration in prices prevented it to ease policy rates in December 2013. The one-week auction rate, the benchmark ‘Key Rate’ introduced in September 2013, was kept at 5.5 percent. The Bank of Russia is using the ‘Key rate’ as the main indicator of the monetary policy stance. The unemployment rate moved up to 5.5 per cent in October 2013 from 5.3 per cent in September 2013.
China:
2.28. Gross domestic product of China grew by 7.7 per cent in 2013 over 2012, according to China’s National Bureau of Statistics. Capital formation accounted for 54 percent of China’s economic growth in 2013. Net exports, on the other hand, detracted 4.4 percent from overall growth.
2.29. The HSBC China manufacturing Purchasing Manager Index (PMI) decreased marginally from 50.8 in November 2013 to 50.5 in December 2013, reflecting a modest rate of growth of output in China’s manufacturing sector. Witnessing similar trend, PMI for services sector also decreased from 52.3 in November 2013 to 51.2 in December 2013.
2.30. As regards price situation, the annual Consumer Price Inflation in China eased to 2.5 per cent in December 2013 (Y-o-Y) as compared to 3.0 per cent in November 2013 (Y-o-Y). The prices grew by 2.5 per cent in cities and 2.5 per cent in rural areas. The food prices went up by 4.1 per cent, while the non-food prices increased 1.7 per cent. The prices of consumer goods went up by 2.2 per cent and the prices of services grew by 3.3 per cent.
22
JANUARY SEBI BULLETIN 2014
3. Review of Global Financial Markets:
3.1. Federal Reserve announced the much awaited tapering in its monetary stimulus. During December 2013, Federal Open Market Committee (FOMC) decided to modestly reduce the pace of its asset purchases by USD 10 billion per month from January 2014, as it found an improvement in the outlook for labour market conditions as well as in economic activity. U.S. equity market coupled with good economic data welcomed the Federal Reserve’s move and buoyed up, while emerging markets observed mixed trends during the month. Bond Market in most of the major economies such as U.S., U.K., Germany etc. recorded reduced demand for the government bonds and observed surge in bond yields.
Stock Market:
3.2. Stock market across the world posted mixed results at the end of December 2013. For the fourth consecutive month, U.S.
equities continued the growth trend and posted strong gains at the end of the month. Among major S&P sectors, Industries and Information technology sectors grew well. On contrary, several emerging market witnessed a fall for second consecutive month on account of the beginning of tapering in quantitative easing programme by Federal Reserve. Besides, country specific factors such as political situation, fiscal deficit and social disruption were also responsible for the downturn in equity markets of respective countries.
3.3. MSCI World Index, which is a leading indicator for tracking the overall performance of stock markets in developed markets, continued its growth trend and grew by 2.0 per cent during December 2013 compared to a growth of 1.6 per cent in previous month; On the other hand, MSCI Emerging Market Index witnessed a fall of 1.5 per cent during the month (Chart 3).

23
JANUARY SEBI BULLETIN 2014
Chart 3: Movement in MSCI World and Emerging Market Index
Source: Bloomberg
Bond Market:
3.4. Long term Treasury bond prices of major developed as well as developing countries declined consecutively for the second month in December 2013 after witnessing an uptrend for the previous two months. The yield of 10 year U.S. government bonds grew by 10.3 per cent during December 2013 following a growth of 7.5 per cent in previous month. Witnessing similar trend, the yield of 10 year Germany bund grew by 13.9 per cent, while that of 10 year U.K. government bond witnessed a growth of
9.1 per cent during the month. The yield of 10 year Spanish government bonds showed a marginal growth of 0.8 per cent in December 2013.
3.5. Among emerging market economies, yield of 10 year Russian government bonds grew by 8.4 per cent in November 2013, while that of 10 year Chinese and Indian government bonds increased by 3.8 and 0.9 per cent respectively during the month under review.

24
JANUARY SEBI BULLETIN 2014
Chart 4: Movement in 10 year bond yield of major countries
Source: Bloomberg
Currency Market:
3.6. At the end of December 2013, major currencies across the world observed marginal gain against US dollar, with Japan being an exception. During the month, Japanese Yen depreciated by 2.7 per cent against USD and declined to a low of ¥105.26 against the base currency due to the easy monetary policy stance of Bank of Japan and less accommodative monetary
policy by Federal Reserve. In December 2013, Euro appreciated by 1.4 per cent against USD, while British pound rose by 1.2 per cent against USD. The Indian Rupee managed to appreciate by 0.9 per cent against USD during the month under review (as per closing price of the interbank foreign currency trade).

25
JANUARY SEBI BULLETIN 2014
Chart 5: Movement of major currencies against US Dollar ($)
Source: Bloomberg
Note: Exchange rate represents the closing price of the interbank foreign currency trade.
Trend in Market Indices:
3.7. Major stock indices all over the world exhibited mixed trends during December 2013. Among major stock indices of developed markets covered in the review, Nikkei 225 of Japan continued its growth trend for the second month and grew by 4.0 per cent during the month, followed by Dow Jones Industrial Average of U.S. (3.0 per cent) and Nasdaq Composite of U.S. (2.9 per cent). On the other hand, Hang Seng Index of Hong Kong (HSI) fell by 2.4 per cent during December 2013, followed by Straits Times of Singapore (0.3 per cent).
3.8. As regards the emerging market indices, Hermes of Egypt posted a gain of 8.3 per cent at the end of December 2013, followed by Karachi 30 of Pakistan (3.1 per cent) and FTSE Bursa Malaysia KLCI (3.0 per cent). On contrary, ISE National 100 of Turkey witnessed a decline of 10.5 per cent, followed by Indice Bolsa General of Argentina (7.8 per cent) and Stock exchange of Thai (SET) Index (5.3 per cent) at the end of the month under review.

26
JANUARY SEBI BULLETIN 2014
Chart 6: Trend in Major Developed Market Indices
Source: Bloomberg
Chart 7: Trend in Market Indices in BRIC Nations
Source: Bloomberg

27
JANUARY SEBI BULLETIN 2014
Market Capitalisation:
3.9. Market capitalisation of major stock exchanges in the world during December 2013 is given in table A6 and is illustrated in Chart 8. The market capitalisation of major stocks listed in both developed as well as developing markets exhibited mixed trend during the month. Among developed markets, the market capitalisation of London Stock Exchange group grew by 4.5 per cent, followed by NYSE Euronext (US) (3.2 per cent) and NASDAQ OMX Nordic Exchange (3.0 per cent). On the other hand, market capitalisation of
Singapore Exchange fell by 1.0 per cent, followed by Australian Stock Exchange (0.8 per cent).
3.10. As regards the major emerging markets, the market capitalisation of National Stock Exchange India grew by 4.7 per cent during December 2013, followed by Bombay Stock Exchange (4.5 per cent) and Saudi Stock Market - Tadawul (3.3 per cent). On the other hand, market capitalisation of Stock Exchange of Thailand fell by 6.5 per cent, followed by BM&FBOVESPA of Brazil (3.7 per cent).
Chart 8: Trend in Market Capitalisation of Major Exchanges (US$ Million)
Source: World Federation of Exchanges

28
JANUARY SEBI BULLETIN 2014
Derivative Market:
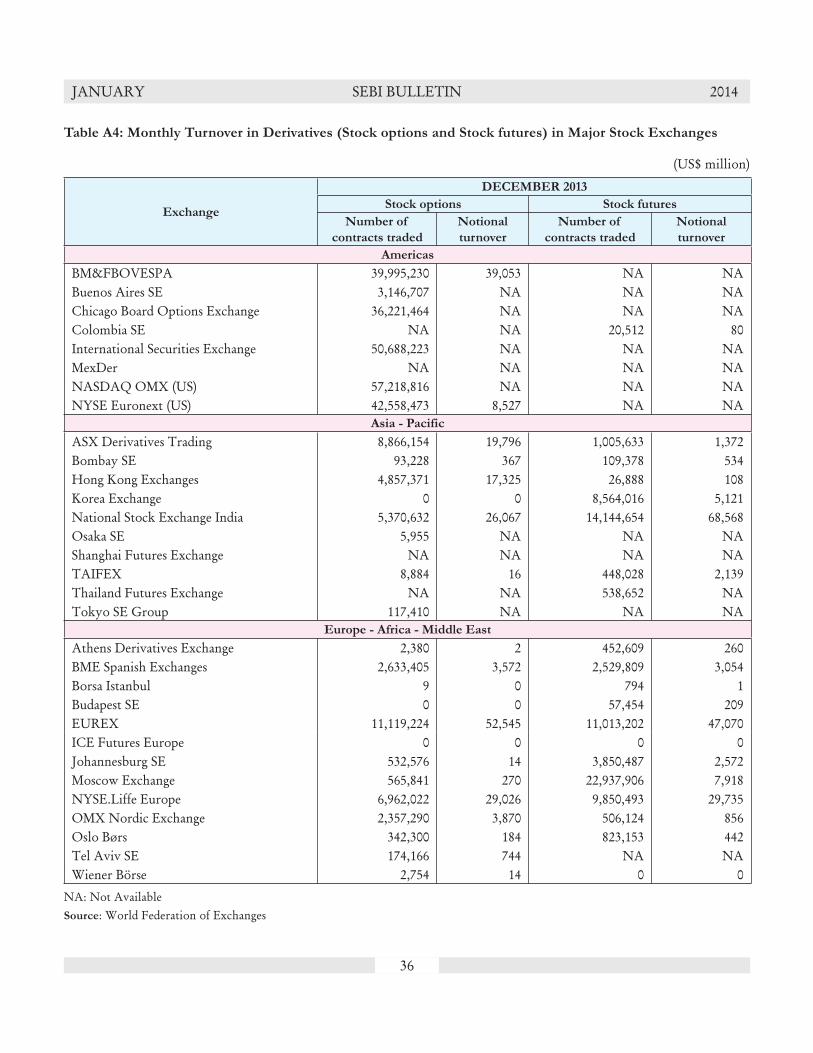
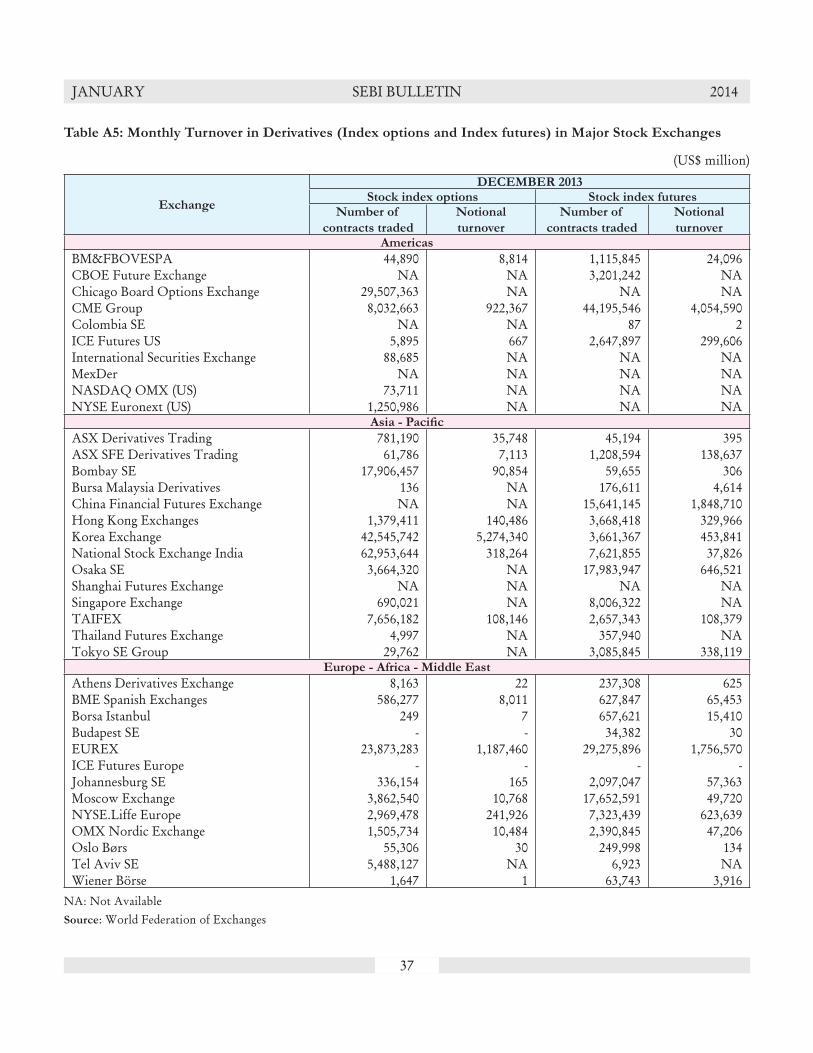
3.11. Among the major stock exchanges covered in the review (Table A4 & A5) during December 2013, the monthly turnover of index futures in CME Group was USD 4,054,590 million, followed by China Financial Futures Exchange (USD 1,848,710 million) and EUREX (USD 1,756,570 million). Among the major stock exchanges, in terms of trading in stock futures, National Stock Exchange India recorded the monthly turnover of USD 68,568 million followed by Eurex (USD 47,070 million). The monthly turnover in options on index for Korea Exchange stood at USD 5,274,340 million, followed by EUREX (USD 1,187,460 million). As regards options on stocks, EUREX recorded a monthly turnover of USD 52,545 million, followed by BM&FBOVESPA (USD 39,053 million) and NYSE Liffe Europe (USD 29,026 million).
4. Review of Indian Economy
Output
4.1. As per quarterly estimates of Gross Domestic Product for the second quarter of 2013-14, India’s GDP at factor cost at constant (2004-05) prices, grew by 4.8 per cent (Y-o-Y) in Q2 of 2013-14 over previous year, in comparison to the GDP growth of 4.4 per cent (Y-o-Y) in Q1 of 2013-14. Agriculture and allied activities, which registered a growth of 2.7 per cent in Q1 of 2013-14, showed an improvement and grew by 4.6 per cent in Q2 of 2013-14. Industries also showed a marginal improvement and increased by 1.7 per cent in Q2 as compared to a contraction in Q1. Services showed a dismal performance and grew by 5.7 per cent in Q2 of 2013-14, its first sub-6 growth since 2000-01. According to the central government estimates, the Indian economy expanded by 4.5 per cent in 2012-13 as compared to an earlier estimate of 5 per cent (Exhibit 3).
Exhibit 3: Quarterly GDP growth in India (Y-o-Y)
Items2012-13 2013-14
Q1 Q2 Q3 Q4 Q1 Q21 2 3 4 5 6 7
1. Agriculture & allied activities 2.9 1.7 1.8 1.4 2.7 4.62. Industry -0.2 0.5 2.3 2.0 -0.9 1.7
Mining & Quarrying 0.4 1.7 -0.7 -3.1 -2.8 -0.4 Manufacturing -1.0 0.1 2.5 2.6 -1.2 1.0 Electricity, Gas & Water Supply 6.2 3.2 4.5 2.8 3.7 7.73. Services 7.6 7.1 6.2 6.3 6.2 5.7
Construction 7.0 3.1 2.9 4.4 2.8 4.3 Trade, Hotel, Transport and Communications 6.1 6.8 6.4 6.2 3.9 4.0 Finance, Insurance, Real Estate & Business Services 9.3 8.3 7.8 9.1 8.9 10.0 Community, Social & Personal Services 8.9 8.4 5.6 4.0 9.4 4.2Gross Domestic Product at factor cost 5.4 5.2 4.7 4.8 4.4 4.8
Source: CSO

29
JANUARY SEBI BULLETIN 2014
4.2. The HSBC Purchasing Managers’ Index (PMI) for December 2013 indicated an improvement in manufacturing sector, though weaker than its long run trend. The PMI decreased slightly to 50.7 points in December from 51.3 in November 2013.
4.3. Central government’s fiscal deficit stood at `5.16 lakh crore for the April-December 2013, against the Budget Estimate of `5.43 lakh crore for the entire financial year (95.2 per cent of budget estimates of FY 2013-14). For April-December 2012, the Centre’s fiscal deficit stood at 78.8 per cent of Budget Estimates of FY 2012-13. The government has targeted fiscal deficit as 4.8 per cent of GDP in 2013-14 as compared to 4.9 per cent in 2012-13.
Index of Industrial Production
4.4. India’s General Index of Industrial Production (IIP) contracted by 2.1 per cent (Y-o-Y) in November 2013 as compared to the level in the month of November 2012. The manufacturing sector, which constitutes over 75 per cent of the index, declined by 3.5 per cent in November 2013.
During April-November 2013, the sector’s output contracted 0.6 per cent. The output of eight core sector industries expanded by 2.1 per cent in November 2013 against 1.7 per cent increase in October 2013. The eight core industries have a combined weight of about 38 per cent in the IIP.
Inflation
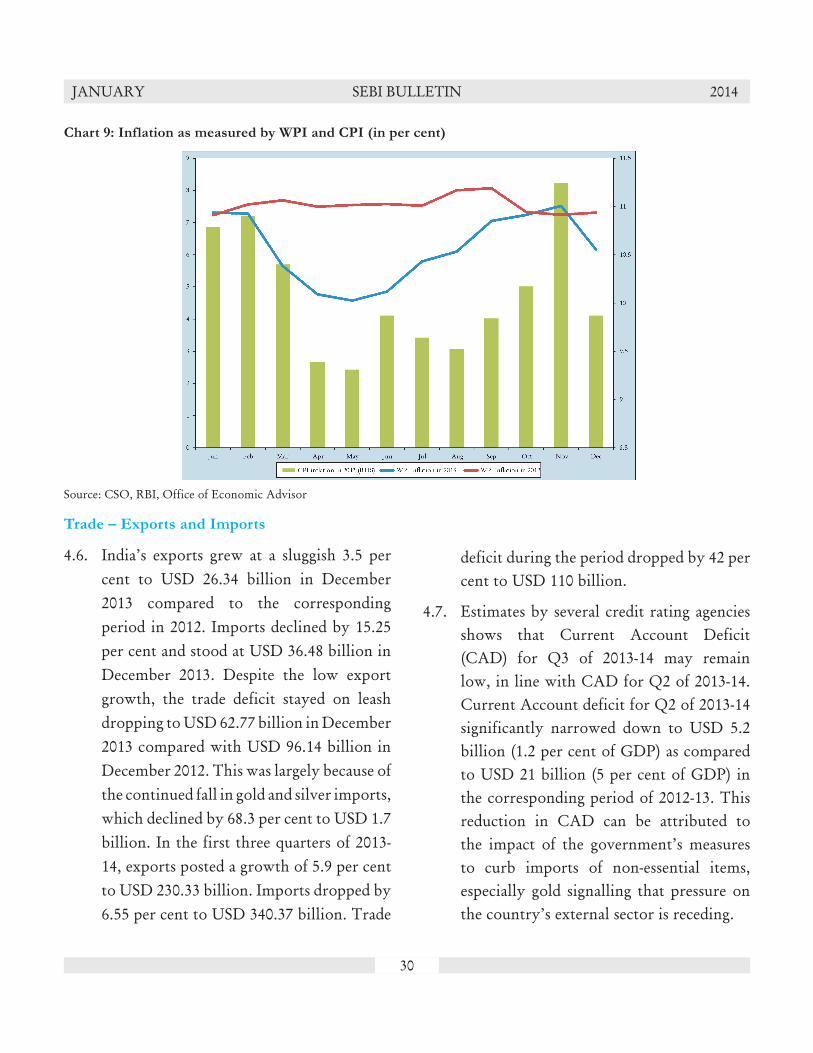
4.5. The Wholesale Price Index (WPI) inflation for the month of December 2013 eased to 6.16 per cent as compared to 7.52 per cent in November 2013. Food prices rose 13.68 per cent year-on-year in December 2013, much slower than an annual rise of 19.93 percent in November. The inflation for primary articles dipped from 34-months high of 15.9 per cent in November 2013 to 10.8 per cent in December 2013, while the inflation for fuel and power group was steady at 11.0 per cent in December 2013. The inflation for manufactured products was also flat at 2.6 per cent in December 2013. Cooling in food prices slowed down retail inflation to a three-month low of 9.87 percent in December 2013, from 11.24 per cent in the previous month.
30
JANUARY SEBI BULLETIN 2014
Chart 9: Inflation as measured by WPI and CPI (in per cent)
Source: CSO, RBI, Office of Economic Advisor
Trade – Exports and Imports
4.6. India’s exports grew at a sluggish 3.5 per cent to USD 26.34 billion in December 2013 compared to the corresponding period in 2012. Imports declined by 15.25 per cent and stood at USD 36.48 billion in December 2013. Despite the low export growth, the trade deficit stayed on leash dropping to USD 62.77 billion in December 2013 compared with USD 96.14 billion in December 2012. This was largely because of the continued fall in gold and silver imports, which declined by 68.3 per cent to USD 1.7 billion. In the first three quarters of 2013-14, exports posted a growth of 5.9 per cent to USD 230.33 billion. Imports dropped by 6.55 per cent to USD 340.37 billion. Trade
deficit during the period dropped by 42 per cent to USD 110 billion.
4.7. Estimates by several credit rating agencies shows that Current Account Deficit (CAD) for Q3 of 2013-14 may remain low, in line with CAD for Q2 of 2013-14. Current Account deficit for Q2 of 2013-14 significantly narrowed down to USD 5.2 billion (1.2 per cent of GDP) as compared to USD 21 billion (5 per cent of GDP) in the corresponding period of 2012-13. This reduction in CAD can be attributed to the impact of the government’s measures to curb imports of non-essential items, especially gold signalling that pressure on the country’s external sector is receding.
31
JANUARY SEBI BULLETIN 2014
Rupee Movement
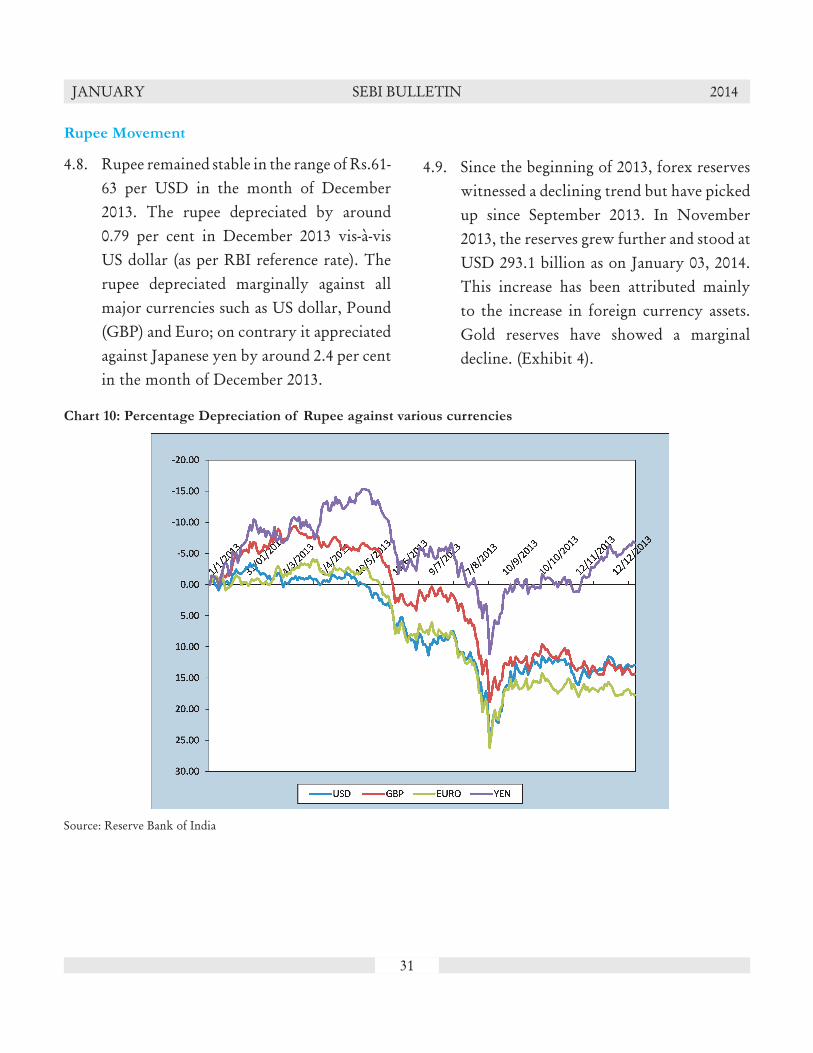
4.8. Rupee remained stable in the range of Rs.61-63 per USD in the month of December 2013. The rupee depreciated by around 0.79 per cent in December 2013 vis-à-vis US dollar (as per RBI reference rate). The rupee depreciated marginally against all major currencies such as US dollar, Pound (GBP) and Euro; on contrary it appreciated against Japanese yen by around 2.4 per cent in the month of December 2013.
4.9. Since the beginning of 2013, forex reserves witnessed a declining trend but have picked up since September 2013. In November 2013, the reserves grew further and stood at USD 293.1 billion as on January 03, 2014. This increase has been attributed mainly to the increase in foreign currency assets. Gold reserves have showed a marginal decline. (Exhibit 4).
Chart 10: Percentage Depreciation of Rupee against various currencies
Source: Reserve Bank of India

32
JANUARY SEBI BULLETIN 2014
Exhibit 4: Foreign Exchange Reserves (USD billion)
Jan 03,
2014
Dec
06,
2013
Nov
01,
2013
Oct 06,
2013
Sep 06,
2013
Aug 02,
2013
July 05, 2013
June 07,
2013
May 03,
2013
April 05,
2013
Total Reserves 293.11 295.07 281.3 277.7 274.8 277.2 280.2 289.7 294.3 293.8Foreign Currency Assets
266.95 268.76 253.6 249.3 246.7 250.0 252.1 260.1 263.7 261.5
Gold 19.73 20.6 21.2 21.8 21.7 20.7 21.5 22.8 23.9 25.7SDRs 4.4 4.4 4.4 4.4 4.4 4.4 4.3 4.38 4.36 4.3Reserve Position in the IMF
2.0 1.9 2.0 2.2 2.0 2.2 2.2 2.3 2.2 2.3
Source: RBI
Commodities Market
4.10. The turnover of the commodity bourses fell by 36.38 per cent to Rs 82.46 lakh crore for April-December 2013, as against Rs 129.6 lakh crore in the year-ago period, due to sharp fall in trading volumes in most commodities. After the imposition of commodity transaction cost since July 2013 and due to the around Rs 5,500 crore payment crisis at NSEL(spot exchange), the business turnover declined in most of
the 17 commodity bourses in the country. The turnover from bullion fell by 39.45 per cent to Rs 36.34 lakh crore during April-December 2013-14, from Rs 60 lakh crore in the year-ago period. The business from energy items dropped by 30 per cent to Rs 19.85 lakh crore from Rs 28.56 lakh crore, while the turnover from metals declined by 39 per cent to Rs 14.72 lakh crore from Rs 24 lakh crore.
Exhibit 5: Commodity market trading during April- November 2013
Name of the Commodity Volume (lakh tonnes) Value (in Rs. billion)
Agricultural Commodities
Food Items 1,824.98 807,619.89
Non-food Items 815.12 346,895.51
Bullion
Gold 0.08 2,153,408.08
Silver 3.25 1,481,471.20
Metals 796.84 1,472,356.69
Energy 3,681.95 1,985,110.12
Total 7,122.22 8,246,861.49
Source: FMC

33
JANUARY SEBI BULLETIN 2014
5. Annex Tables:
Table A1: Trend in major International Indices
Country Index
As on
March*,
2012
As on
March*,
2013
As on
Nov*, 2013
As on
Dec*, 2013
1 2 3 4 5 6Developed Markets
Australia All Ordinaries 4419.97 4979.87 5314.32 5353.08France CAC 40 3423.81 3731.42 4295.21 4295.95Germany Dax 6946.83 7795.31 9405.30 9488.82Hong Kong HSI Hang Seng 20555.58 22299.63 23881.29 23306.39Japan NIKKEI Nikkei 225 10083.56 12397.91 15661.87 16291.31Singapore STI Straits Times 3010.46 3308.10 3176.35 3167.43UK FTSE 100 5768.45 6411.74 6650.57 6749.09USA DOW JONES Dow Jones Industrial Average 13212.04 14578.54 16086.41 16576.66USA NASDAQ Composite Nasdaq Composite 3091.57 3267.52 4059.89 4176.59
Emerging Markets
India (BSE) S&P BSE Sensex 17404.20 18835.77 20791.93 21170.68India (NSE) CNX Nifty 5295.55 5682.55 6176.10 6304.00Argentina Indice Bolsa General 155480.50 198283.33 287678.88 265324.59Brazil Bovespa 64510.97 56352.09 52482.49 51507.16Chile Stock Market Select 4671.28 4432.14 3789.06 3699.19China Shanghai SE Composite IX 2262.79 2236.62 2220.50 2115.98Colombia IGBC General 15038.26 14135.35 13215.07 13071.27Egypt Hermes 494.87 516.06 623.76 675.38Hungary Budapest Stock Exchange 18635.67 17857.42 18809.76 18564.08Indonesia Jakatra Composite 4121.55 4940.99 4256.44 4274.18Malaysia FTSE Bursa Malaysia KLCI 1596.33 1671.63 1812.72 1866.96Mexico Bolsa 39521.24 44077.09 42499.13 42727.09Pakistan Karachi 30 12114.13 14208.38 18246.01 18808.86Russia Russian Traded 2323.77 2077.16 1969.71 2001.07South Korea Kospi Index 2014.04 2004.89 2044.87 2011.34South Africa FTSE/JSE Africa All Share 33554.21 39860.84 44975.67 46256.23Taiwan Taiwan Taiex 7933.00 7918.61 8406.83 8611.51Thailand Stock Exchange of Thai 1196.77 1561.06 1371.13 1298.71Turkey ISE National 100 62423.04 85898.99 75748.27 67801.73
*Indices are as on last trading day of the month
Source: Bloomberg

34
JANUARY SEBI BULLETIN 2014
Table A2: Volatility and P/E Ratio of Major International Indices
Country Index
Volatility
(per cent)P/E Ratio
Nov-13 Dec-13 Nov-13 Dec-13
1 2 3 4 5 6Developed Markets
Australia All Ordinaries 0.55 0.77 24.83 25.01France CAC 40 0.61 1.05 18.44 18.41Germany Dax 0.40 1.04 16.03 16.13Hong Kong HSI Hang Seng 0.97 0.64 10.82 10.57Japan NIKKEI Nikkei 225 1.12 1.19 45.06 46.87Singapore STI Straits Times 0.35 0.55 13.60 13.54UK FTSE 100 0.48 0.72 16.38 16.63USA DOW JONES Dow Jones Industrial Average 0.45 0.65 15.56 16.03USA NASDAQ Composite Nasdaq Composite 0.76 0.60 24.61 25.77
Emerging Markets
India (BSE) Sensex 1.07 0.81 17.61 18.16India (NSE) S&P CNX Nifty 1.10 0.84 18.38 18.70Argentina Indice Bolsa General 2.15 1.37 n.a. n.a.Brazil Bovespa 1.24 1.07 84.42 81.92Chile Stock Market Select 1.04 0.30 18.55 18.11China Shanghai SE Composite IX 0.98 0.92 11.14 10.63Colombia IGBC General 1.06 0.84 18.72 18.51Egypt Hermes 1.01 0.76 30.14 35.98Hungary Budapest Stock Exchange 1.04 0.90 19.70 19.55Indonesia Jakatra Composite 1.04 0.99 19.37 19.48Malaysia FTSE Bursa Malaysia KLCI 0.35 0.40 17.48 18.03Mexico Bolsa 0.92 0.57 20.03 20.06Pakistan Karachi 30 0.97 0.50 8.81 8.86Russia Russian Traded 1.15 0.84 5.16 5.19South Korea Kospi Index 0.84 0.56 17.29 17.02South Africa FTSE/JSE Africa All Share 0.83 1.03 19.80 20.33Taiwan Taiwan Taiex 0.70 0.48 24.04 24.57Thailand Stock Exchange of Thai 1.17 0.79 15.36 14.46Turkey ISE National 100 1.42 2.43 10.02 8.96
Note: PE ratio for Sensex and S&P CNX Nifty have been taken from BSE, NSE respectivelyn.a.: Not AvailableSource: Bloomberg, BSE, NSE
35
JANUARY SEBI BULLETIN 2014
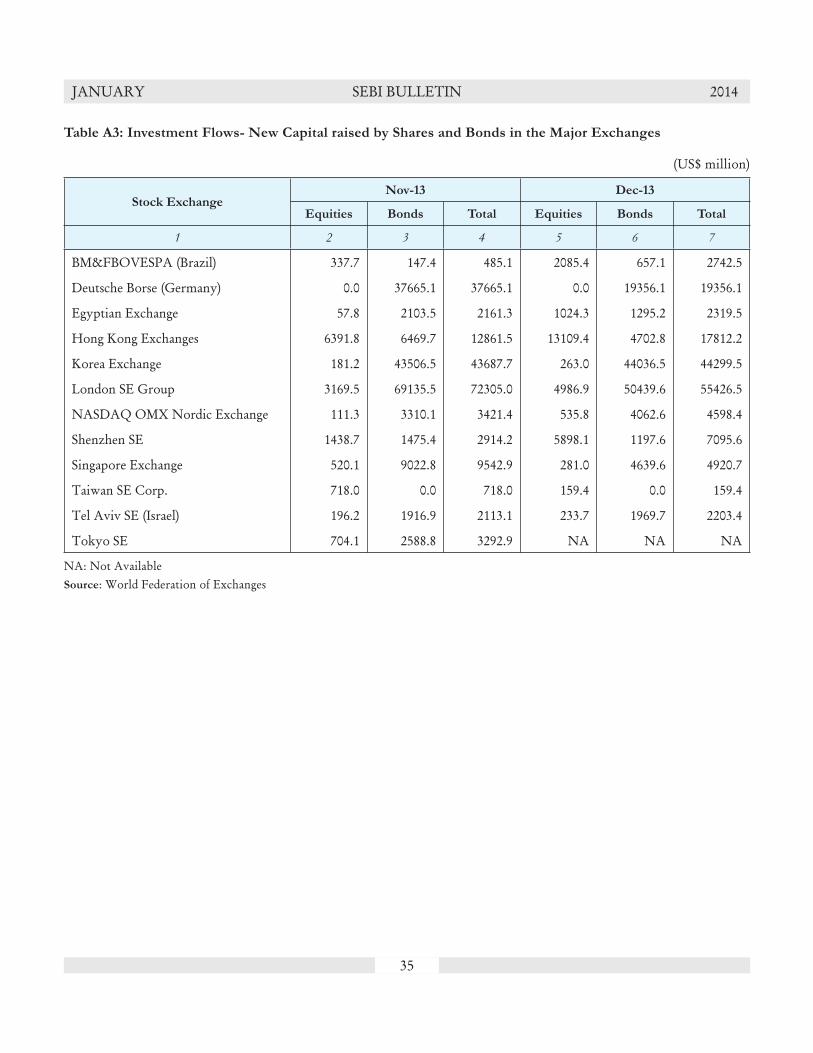
Table A3: Investment Flows- New Capital raised by Shares and Bonds in the Major Exchanges
(US$ million)
Stock ExchangeNov-13 Dec-13
Equities Bonds Total Equities Bonds Total
1 2 3 4 5 6 7
BM&FBOVESPA (Brazil) 337.7 147.4 485.1 2085.4 657.1 2742.5
Deutsche Borse (Germany) 0.0 37665.1 37665.1 0.0 19356.1 19356.1
Egyptian Exchange 57.8 2103.5 2161.3 1024.3 1295.2 2319.5
Hong Kong Exchanges 6391.8 6469.7 12861.5 13109.4 4702.8 17812.2
Korea Exchange 181.2 43506.5 43687.7 263.0 44036.5 44299.5
London SE Group 3169.5 69135.5 72305.0 4986.9 50439.6 55426.5
NASDAQ OMX Nordic Exchange 111.3 3310.1 3421.4 535.8 4062.6 4598.4
Shenzhen SE 1438.7 1475.4 2914.2 5898.1 1197.6 7095.6
Singapore Exchange 520.1 9022.8 9542.9 281.0 4639.6 4920.7
Taiwan SE Corp. 718.0 0.0 718.0 159.4 0.0 159.4
Tel Aviv SE (Israel) 196.2 1916.9 2113.1 233.7 1969.7 2203.4
Tokyo SE 704.1 2588.8 3292.9 NA NA NA
NA: Not AvailableSource: World Federation of Exchanges
36
JANUARY SEBI BULLETIN 2014
Table A4: Monthly Turnover in Derivatives (Stock options and Stock futures) in Major Stock Exchanges
(US$ million)
Exchange
DECEMBER 2013
Stock options Stock futures
Number of
contracts traded
Notional
turnover
Number of
contracts traded
Notional
turnover
Americas
BM&FBOVESPA 39,995,230 39,053 NA NABuenos Aires SE 3,146,707 NA NA NAChicago Board Options Exchange 36,221,464 NA NA NAColombia SE NA NA 20,512 80International Securities Exchange 50,688,223 NA NA NAMexDer NA NA NA NANASDAQ OMX (US) 57,218,816 NA NA NANYSE Euronext (US) 42,558,473 8,527 NA NA
Asia - Pacific
ASX Derivatives Trading 8,866,154 19,796 1,005,633 1,372Bombay SE 93,228 367 109,378 534Hong Kong Exchanges 4,857,371 17,325 26,888 108Korea Exchange 0 0 8,564,016 5,121National Stock Exchange India 5,370,632 26,067 14,144,654 68,568Osaka SE 5,955 NA NA NAShanghai Futures Exchange NA NA NA NATAIFEX 8,884 16 448,028 2,139Thailand Futures Exchange NA NA 538,652 NATokyo SE Group 117,410 NA NA NA
Europe - Africa - Middle East
Athens Derivatives Exchange 2,380 2 452,609 260BME Spanish Exchanges 2,633,405 3,572 2,529,809 3,054Borsa Istanbul 9 0 794 1Budapest SE 0 0 57,454 209EUREX 11,119,224 52,545 11,013,202 47,070ICE Futures Europe 0 0 0 0Johannesburg SE 532,576 14 3,850,487 2,572Moscow Exchange 565,841 270 22,937,906 7,918NYSE.Liffe Europe 6,962,022 29,026 9,850,493 29,735OMX Nordic Exchange 2,357,290 3,870 506,124 856Oslo Børs 342,300 184 823,153 442Tel Aviv SE 174,166 744 NA NAWiener Börse 2,754 14 0 0
NA: Not AvailableSource: World Federation of Exchanges
37
JANUARY SEBI BULLETIN 2014
Table A5: Monthly Turnover in Derivatives (Index options and Index futures) in Major Stock Exchanges
(US$ million)
Exchange
DECEMBER 2013Stock index options Stock index futures
Number of
contracts traded
Notional
turnover
Number of
contracts traded
Notional
turnoverAmericas
BM&FBOVESPA 44,890 8,814 1,115,845 24,096CBOE Future Exchange NA NA 3,201,242 NAChicago Board Options Exchange 29,507,363 NA NA NACME Group 8,032,663 922,367 44,195,546 4,054,590Colombia SE NA NA 87 2ICE Futures US 5,895 667 2,647,897 299,606International Securities Exchange 88,685 NA NA NAMexDer NA NA NA NANASDAQ OMX (US) 73,711 NA NA NANYSE Euronext (US) 1,250,986 NA NA NA
Asia - Pacifi c
ASX Derivatives Trading 781,190 35,748 45,194 395ASX SFE Derivatives Trading 61,786 7,113 1,208,594 138,637Bombay SE 17,906,457 90,854 59,655 306Bursa Malaysia Derivatives 136 NA 176,611 4,614China Financial Futures Exchange NA NA 15,641,145 1,848,710Hong Kong Exchanges 1,379,411 140,486 3,668,418 329,966Korea Exchange 42,545,742 5,274,340 3,661,367 453,841National Stock Exchange India 62,953,644 318,264 7,621,855 37,826Osaka SE 3,664,320 NA 17,983,947 646,521Shanghai Futures Exchange NA NA NA NASingapore Exchange 690,021 NA 8,006,322 NATAIFEX 7,656,182 108,146 2,657,343 108,379Thailand Futures Exchange 4,997 NA 357,940 NATokyo SE Group 29,762 NA 3,085,845 338,119
Europe - Africa - Middle East
Athens Derivatives Exchange 8,163 22 237,308 625BME Spanish Exchanges 586,277 8,011 627,847 65,453Borsa Istanbul 249 7 657,621 15,410Budapest SE - - 34,382 30EUREX 23,873,283 1,187,460 29,275,896 1,756,570ICE Futures Europe - - - -Johannesburg SE 336,154 165 2,097,047 57,363Moscow Exchange 3,862,540 10,768 17,652,591 49,720NYSE.Liffe Europe 2,969,478 241,926 7,323,439 623,639OMX Nordic Exchange 1,505,734 10,484 2,390,845 47,206Oslo Børs 55,306 30 249,998 134Tel Aviv SE 5,488,127 NA 6,923 NAWiener Börse 1,647 1 63,743 3,916
NA: Not AvailableSource: World Federation of Exchanges

38
JANUARY SEBI BULLETIN 2014
Table A6: Market Capitalisation of Major Stock Exchanges
(US$ million)Stock Exchange Mar-13 Nov-13 Dec-13 M-o-M change (%)
1 2 3 4 5Developed Market
Australian SE 1,481,011 1,376,664 1,365,958 (0.8)Deutsche Börse 1,487,491 1,885,368 1,936,106 2.7Hong Kong Exchange 2,828,042 3,113,061 3,100,777 (0.4)London SE Group 3,713,488 4,239,243 4,428,975 4.5NASDAQ OMX Nordic Exchange 1,076,662 1,232,222 1,269,214 3.0NYSE Euronext (Europe) 2,902,848 3,506,274 3,583,900 2.2NYSE Euronext (US) 15,223,314 17,397,279 17,949,884 3.2Singapore Exchange 800,330 751,678 744,413 (1.0)Japan SE Group 3,886,962 4,512,630 4,543,169 0.7
Emerging Market
Bombay SE 1,175,324 1,089,850 1,138,834 4.5National Stock Exchange India 1,147,936 1,063,345 1,112,952 4.7BM&FBOVESPA 1,215,264 1,059,203 1,020,455 (3.7)Bursa Malaysia 462,535 502,544 500,387 (0.4)Colombia SE 242,717 207,373 202,693 (2.3)Indonesia SE 495,270 351,074 346,674 (1.3)Johannesburg SE 865,863 941,108 942,812 0.2Korea Exchange 1,154,881 1,250,590 1,234,549 (1.3)Mexican Exchange 558,398 520,511 526,016 1.1Saudi Stock Market - Tadawul 387,302 452,458 467,366 3.3Shanghai SE 2,531,447 2,588,153 2,496,990 (3.5)Shenzhen SE 1,228,993 1,476,782 1,452,154 (1.7)Taiwan SE Corp. 740,026 806,780 822,707 2.0The Stock Exchange of Thailand 458,182 379,056 354,340 (6.5)
M-o-M: Month on MonthNote: Figures mentioned in brackets () represent negative figures.Source: World Federation of Exchanges
Sources:1. OECD database2. Bureau of Economic Analysis (US)3. Bureau of Labor Statistics (US)4. The Conference Board (US)5. The Federal Reserve System (US)6. Institute for Supply Management (US)7. Office for National Statistics (UK)8. Bank of England (UK)9. The Cabinet Office (Japan)10. Statistics Bureau, Director-General for Policy Planning
(Statistical Standards) (Japan)11. Bank of Japan12. Eurostat (EA17 and EU27)13. European Central Bank (EA17)14. Instituto Brasileiro de Geografia e Estatística (Brazilian Institute of
Geography and Statistics)
15. Banco Central do Brasil (Central Bank of Brazil)16. Federal State Statistics Service (Russian Federation)17. The Central Bank of the Russian Federation18. The Central Statistical Office (India)19. Office of the Economic Adviser to the Government of India20. The Reserve Bank of India21. National Bureau of Statistics of China22. Peoples Bank of China23. Markit Financial Information Services24. World Federation of Exchanges25. Bloomberg26. The Bombay Stock Exchange27. The National Stock Exchange28. The Bank of Korea29. Bank Indonesia30. Central Bank of The Republic of Turkey

39
JANUARY SEBI BULLETIN 2014
A. GENERAL
1. Third Meeting of the International Advisory
Board of SEBI held at Bangalore
The third meeting of the International Advisory Board (IAB) of the Securities and Exchange Board of India (SEBI) was held on December 9 & 10, 2013 at Bangalore. Major issues discussed during the meeting are:
i. Insider Trading: Global best practices and lessons for India
IAB deliberated on insider trading prohibition frameworks in various jurisdictions and observed that SEBI has a comparable framework. It also appreciated SEBI’s policy of not settling cases of insider trading. IAB suggested that SEBI should publicize major insider trading cases in a separate section on SEBI website for easier access; may have provisions to compensate victims, if any, of insider trading offences; and should encourage an effective whistle blowing framework in securities market by ensuring adequate legal protection of whistle blowers. Heavy penalty along with naming and shaming were also suggested to be used as major deterrence to insider trading and other offenses in the securities market.
ii. REITs & Business Trusts: Proposed framework for India vis-à-vis global practices
PRESS RELEASES
IAB discussed various aspects of the proposed REITs frameworks by SEBI and observed that the proposed framework is of good standard. In this context IAB members highlighted various aspects and concerns of REITs markets in Australia, USA, Hong Kong, Singapore, South Africa, etc. Some of the suggestions which emerged from the discussion include – having an internationally competitive taxation regime, including pass through status for REITs; oversight of managers of REITs in addition to the oversight of their trustees; gradual expansion of REITs to include retail investments; and a separate framework for Infrastructure Investment Trusts.
iii. SEBI’s Consent Mechanism: The global experience and learning for SEBI
The IAB deliberated on the revised consent mechanism which is applicable only to certain range of cases that excludes cases involving serious violations. IAB, after deliberating on the formula based determination of consent mechanism, suggested judgmental variations in consent amount on a case to case basis so as to make it effectively deterrent in nature. IAB expressed its satisfaction on the framework for consent mechanism which includes High Powered Advisory Committee

40
JANUARY SEBI BULLETIN 2014
(HPAC) and the committee of Whole Time Members of SEBI, both of which together bring in the necessary independence to the mechanism of deciding consent amount.
iv. Cyber Security: Issues and concerns for securities market infrastructure.
It was noted that there seems to be a general consensus around the world markets that though, presently, there are no global standards to deal with this issue, the same needs to be tackled on a priority basis. Need for having adequate Disaster Recovery System (DRS) & Business Continuity Plan (BCP) was emphasized. It was also agreed that to begin with there is a felt need to prevent and manage internal sabotage and to strengthen our internal systems towards this end.
In addition to the above issues, IAB also deliberated on recent macro-economic trends and their impact on securities markets. It was observed that slowing down of growth in Indian economy is more attributable to internal factors rather than external. It was further observed that share of manufacturing output in Indian GDP has been stagnant despite faster growth in Indian economy in the last two decades, a phenomenon different from other growing economies like China, Korea, Taiwan, etc. (where share of manufacturing output increased with economic growth). Need for development of corporate bond market was also emphasized.
A presentation on the development and regulation of the South African securities markets was also made and some potential lessons like the necessity of a robust debt market, the need for strong auditing and reporting standards and protection of minority shareholders’ interest were highlighted.
SEBI had constituted the IAB in September, 2011, as part of the measures initiated by SEBI to respond to the challenges arising out of the global financial crisis. The role of IAB is to guide SEBI with its advice on future direction for the organization, taking into account relevant global experiences, emerging challenges and latest developments in the regulatory space.
Meetings of IAB are organized by SEBI in India. Its previous two meetings were held on January 27, 2012 at Delhi and on November 3 – 4, 2012 at Mumbai.
The current Members of the IAB, in addition to Chairman, SEBI are Prof. Viral Acharya, Ms. Jane Diplock, Mr. Russell Loubser, Prof. Mark Maletz, Prof. Maureen O’Hara, Prof. Arvind Panagariya and Dr. Andrew Sheng (arranged alphabetically by the surnames). Mr. Loubser has recently joined the IAB.
Prof. Acharya is the C.V. Starr Professor of Economics in the Department of Finance at New York University Stern School of Business and a Member of Advisory Scientific Committee of European Systemic Risk Board.
41
JANUARY SEBI BULLETIN 2014
Ms. Diplock is presently an Independent Director of Singapore Exchange Limited, Australian Financial Services Group Pty Limited, International Integrated Reporting Committee Board and Member of Public Interest Oversight Board (PIOB). She is also the former Chairman of both the Executive Committee of IOSCO and of the New Zealand Securities Commission.
Mr. Loubser, former CEO of Johannesburg Stock Exchange, has been one of the prime movers of modernization and development of stock exchange business in South Africa. He was a member of the team that started the Futures Industry in South Africa in 1987. He has served as Chair, Working Committee of World Federation of Exchanges and as Deputy Chair of South African Futures Exchange. Mr. Loubser was also a member of the prestigious King Commission on Corporate Governance.
Prof. Maletz is a Senior Fellow at Harvard Business School and an internationally recognized thought leader in the areas of leadership development and organization transformation. Prof. O’Hara, the Robert W. Purcell Professor of Finance at the Johnson Graduate School of Management, Cornell University, is the Chairman of the Economic Advisory Board of the FINRA and a Member of the CFTC-SEC Task Force investigating the ‘flash crash’.
Prof. Panagariya is the Jagdish Bhagwati Professor of Indian Political Economy at Columbia University and the former Chief Economist of the Asian Development Bank.
Dr. Sheng, the former Chairman of the Securities and Futures Commission of Hong Kong, is presently the Chief Advisor to the China Banking Regulatory Commission and a Board Member of the Qatar Financial Centre Regulatory Authority.
Mr. Prashant Saran, Mr. Rajeev Kumar Agarwal & Mr. S. Raman – Whole Time Members of SEBI and all the Executive Directors of SEBI also participated in the two day deliberations.
Ref: PR No. 119/2013 dated December 10, 2013.
2. Justice Sodhi Committee on Insider Trading
Regulations submits report to SEBI
The High Level Committee to Review the SEBI (Prohibition of Insider Trading) Regulations, 1992 constituted under the Chairmanship of Justice (Shri.) N.K. Sodhi, former chief justice of Karnataka and Kerala High Courts and former presiding officer of the Securities Appellate Tribunal, submitted its report to SEBI Chairman, Shri U.K. Sinha, on December 7, 2013 at Chandigarh.
The Committee has made a range of recommendations to the legal framework for prohibition of insider trading in India and has focused on making this area of regulation more predictable, precise and clear by suggesting a combination of principles-based regulations and rules that are backed by principles. The Committee has also suggested that each regulatory provision may be backed by a note on legislative intent.
42
JANUARY SEBI BULLETIN 2014
Some of the salient features of the proposed regulations are set out below:-
1 While enlarging the definition of “insider”, the term “connected person” has been defined more clearly and immediate relatives are presumed to be connected persons, with a right to rebut the presumption. The term “immediate relative” would cover close relatives who are either financially dependent or consult an insider in connection with trading in securities.
2 Insiders would be prohibited from communicating, providing or allowing access to UPSI unless required for discharge of duties or for compliance with law.
3 The regulations would bring greater clarity on what constitutes “unpublished price sensitive information” (“UPSI”) by defining what constitutes “generally available information” (essentially, information to which non-discriminatory public access would be available). A list of types of information that may ordinarily be regarded as price sensitive information has also been provided.
4 Trading in listed securities when in possession of UPSI would be prohibited except in certain situations provided in the regulations.
5 Insiders who are liable to possess UPSI all round the year would have the option to formulate pre-scheduled trading plans. In
such cases, the new UPSI that may come into their possession without having been with them when formulating the plan would not impede their ability to trade. Trading plans would, however, be required to be disclosed to the stock exchanges and have to be strictly adhered to.
6 Conducting due diligence on listed companies would be permissible for purposes of transactions entailing an obligation to make an open offer under the Takeover Regulations. In all other cases, due diligence would be permissible subject to making the diligence findings that constitute UPSI generally available prior to the proposed trading. In all cases, the board of directors would need to opine that permitting the conduct of due diligence is in the best interests of the company, and would also have to ensure execution of non-disclosure and non-dealing agreements.
7 Trades by promoters, employees, directors and their immediate relatives would need to be disclosed internally to the company. Trades within a calendar quarter of a value beyond Rs. 10 lakhs or such other amount as SEBI may specify, would be required to be disclosed to the stock exchanges.
8 Every entity that has issued securities which are listed on a stock exchange or which are intended to be so listed would be required to formulate and publish a Code of Fair Disclosure governing disclosure of events
43
JANUARY SEBI BULLETIN 2014
and circumstances that would impact price discovery of its securities.
9 Every listed company and market intermediary is required to formulate a Code of Conduct to regulate, monitor and report trading in securities by its employees and other connected persons. All other persons such as auditors, law firms, accountancy firms, analysts, consultants etc. who handle UPSI in the course of business operations may formulate a code of conduct and the existence of such a code would evidence the seriousness with which the organization treats compliance requirements.
10 Companies would be entitled to require third-party connected persons who are not employees to disclose their trading and holdings in securities of the company.
Ref: PR No. 120/2013 dated December 11, 2013.
3. SEBI Board Meeting
The SEBI Board met in Mumbai today and took the following decisions:
1. The Amendment to Securities and
Exchange Board of India (Collective
Investment Schemes) Regulations, 1999
The Securities Laws (Amendment) Ordinance, 2013 provides for regulation of pooling of funds under any scheme or arrangement, involving a corpus amount of one hundred crore rupees or more, to
be deemed to be a Collective Investment Scheme, subject to sub-section (3) of section 11AA of the SEBI Act.
Accordingly, a proposal to amend the Securities and Exchange Board of India (Collective Investment Schemes) Regulations, 1999, providing a framework for regulation of such deemed Collective Investment Schemes and additional requirements for continuous compliance by a registered Collective Investment Scheme, was approved by the Board.
2. Amendments to SEBI (Investor Protection
and Education Fund) Regulations, 2009
Consequent to the promulgation of Securities Laws (Amendment) (Second) Ordinance, 2013, the Board has approved amendment to SEBI (IPEF) Regulations, 2009 enabling utilization of such amounts primarily for restitution to investors and in case of failure of identification of investors, for the credit of amounts disgorged under the SEBI Act 1992, the Securities Contracts (Regulation) Act 1956 or the Depositories Act 1996 to the Investor Protection and Education Fund of SEBI.
3. Class of companies eligible to file shelf
prospectus for public issuance of non-
convertible debt securities
While Companies Act, 1956 had allowed only Banks and Public Financial institutions to file Shelf Prospectus, the Companies Act,
44
JANUARY SEBI BULLETIN 2014
2013 enables SEBI to specify the class of the companies which can be allowed to file Shelf Prospectus. In this regard, the Board has decided to allow the following class of entities to file Shelf Prospectus for public issuance of non-convertible debt securities:
(i) Public financial institutions and Scheduled Banks;
(ii) Issuers authorized by the notification of CBDT to make public issue tax free secured bonds;
(iii) Infrastructure Debt Funds – Non-Banking Financial Companies;
(iv) NBFCs, registered with RBI, Housing Finance Companies registered with National Housing Bank (NHB) and entities which have listed their shares/debentures in the stock exchanges for at least three years complying with the following criteria:
• net worth of Rs. 500 Crores,
• track record of three years of distributable profits,
• having a credit rating of not less than “AA-”,
• having no default history or regulatory action pending with RBI, SEBI or NHB;
To avoid fragmentation of the issues, which will affect the floating stock and thereby
liquidity, it is further stipulated that only a maximum of four issuances can be made under a Shelf Prospectus.
Further, companies filing a shelf prospectus with the Registrar of Companies are not required to file prospectus afresh at every stage of offer of securities, within the period of validity of such shelf prospectus i.e. one year. They are required to file only an information memorandum, containing material updations, with respect to subsequent issues.
4. SEBI (Procedure for Search and Seizure)
Regulations, 2013
The Securities Laws (Amendment) Second Ordinance, 2013, inter alia, confers direct powers on Chairman, SEBI to authorize the Investigating Authority or any other officer of SEBI to search any premises where incriminating documents are lying and seize such documents for the purpose of investigation. The Ordinance also empowers SEBI to make regulations for executing the search operations and to ensure safe custody of any books of account or other documents that are seized.
In this respect, the Board approved the SEBI (Procedure for Search and Seizure) Regulations, 2013, made on the lines of the provisions in the Income Tax Act, 1961 and for providing the detailed procedures for such search and seizures by SEBI.

45
JANUARY SEBI BULLETIN 2014
5. Making IPO Grading Mechanism
Voluntary – Amendment to SEBI (Issue
of Capital and Disclosure Requirements)
Regulations, 2009
Considering the requests received from market participants, viz. investor associations and Association of Investment Bankers of India (AIBI), the recommendation of the advisory committee of SEBI, and to align with the principles laid down by Financial Stability Board (FSB) on reducing the reliance on Credit Rating Agencies, the Board approved the proposal to make the IPO grading mechanism “voluntary” as against the current provision of the same being “mandatory”.
6. SEBI (Settlement of Administrative and
Civil Proceedings) Regulations, 2013
The SEBI (Settlement of Administrative and Civil Proceedings) Regulations, 2013 were approved by the Board, subject to inclusion of the guidelines determining the settlement terms as part of regulations These regulations have been framed, keeping in view the provisions of the SEBI Act, as modified by the Securities Laws (Amendment) Second Ordinance, 2013, as also the public comments received on the Consultation Paper on the draft regulations that was placed on the SEBI website.
The salient features of the SEBI (Settlement of Administrative and Civil Proceedings) Regulations, 2013 are as under:
i. The Regulations lay down the stand alone common substantive procedure for settlement of administrative and civil proceedings under all the securities laws;
ii. The Regulations formalize the already existing settlement process;
iii. They also provide for the guiding factors for dealing with the settlement process;
iv. Serious offences such as insider trading, etc. are excluded from the scope of settlement;
v. In order to impart transparency in the process, the roles of the of internal committee(s) and high powered advisory committee are specifically defined;
vi. The Regulations also provide for terms of settlement in monetary as well as non – monetary terms or combination of both.
7. FPI Regulations
As regards FPI Regulations, the communication from the Department of Economic Affairs to the CBDT and to SEBI, conveying the decision that all three categories of FPIs would be given similar tax treatment as available to FIIs presently, was noted.
Ref: PR No. 125/2013 dated December 24, 2013.
46
JANUARY SEBI BULLETIN 2014
B. ORDER
i. Order in the matter of application filed
by United Bank of India under regulation
11(1) of SEBI (Substantial Acquisition of
Shares and Takeovers) Regulations, 2011
Shri Prashant Saran, Whole Time Member, SEBI, has passed an order dated December 3, 2013, granting exemption to the Government of India (“GoI” or “Acquirer”) from the applicability of Regulation 3(2) of SEBI (Substantial Acquisition of Shares and Takeover) Regulations, 2011, in respect of the proposed increase in shareholding from 82.232% to 87.998%, pursuant to allotment of 18,00,41,152 equity shares of United Bank of India (Applicant) by way of preferential allotment.
The applicant has filed the application dated November 6, 2013 seeking the said exemption.
Ref: PR No. 116/2013 dated December 04, 2013.
ii. Order in respect of M/s. International
Hometex Limited and its directors
Shri Rajeev Kumar Agarwal, Whole Time Member, SEBI, has vide order dated December 4, 2013 revoked the directions issued vide order dated August 10, 2012 restraining and prohibiting M/s. International Hometex Limited and its directors Mr. Vineet Kumar Agarwal, Mr. Vinod Kumar Agarwal and Mr. Vishwinder Nath Gupta from accessing the securities market and buying, selling or dealing
in securities, directly or indirectly, in manner whatsoever.
Ref: PR No. 117/2013 dated December 06, 2013.
iii. Order in respect of disposing of case
against Mr. Harshad Talati of M/s. Shukla
Data Technics Limited
In the matter of non-redressal of investor grievances by M/s. Shukla Data Technics Limited, Shri Rajeev Kumar Agarwal, Whole Time Member, SEBI, vide order dated December 3, 2013 has disposed of the showcause notice issued to Mr. Harshad Talati.
Ref: PR No. 118/2013 dated December 06, 2013.
iv. Order in respect of Motorol Enterprises
Limited and its former directors
Shri Rajeev Kumar Agarwal, Whole Time Member, SEBI, has vide order dated December 17, 2013 revoked the directions issued vide order dated December 15, 2010, restraining and prohibiting Motorol Enterprises Limited and its former directors Mr. Rinki S. Gandhi and Mr. Thakar S. Mahesh from accessing the securities market and buying, selling or dealing in securities, directly or indirectly, in manner whatsoever. It is also noted in the order that, other directors Mr. Gandhi K. Chandrakant and Mr. Gandhi K. Shashikant have expired and the directions against them have already become infructuous.
Ref: PR No. 121/2013 dated December 18, 2013.

47
JANUARY SEBI BULLETIN 2014
v. Order in the matter of exemption
application filed by Indian Overseas Bank
under regulation 11(1) of SEBI (Substantial
Acquisition of Shares and Takeovers)
Regulations, 2011
Shri Prashant Saran, Whole Time Member, SEBI, has passed an order dated December 18, 2013, granting exemption under regulation 11 of SEBI (Substantial Acquisition of Shares and Takeover) Regulations, 2011 (Takeover Regulations) to the Government of India (“GoI” or “Acquirer”) from the obligation to make an open offer under regulation 3(2) of Takeover Regulations with respect to its proposed increase in shareholding from 73.80% to 79.01%, pursuant to allotment 22,97,53,015 equity shares of Indian Overseas Bank (Applicant) by way of preferential allotment.
Ref: PR No. 122/2013 dated December 20, 2013.
vi. Order in the matter of exemption
application filed by Dena Bank under
regulation 11(1) of SEBI (Substantial
Acquisition of Shares and Takeovers)
Regulations, 2011
Shri Prashant Saran, Whole Time Member, SEBI, has passed an order dated December 19, 2013, granting exemption under Regulation 11 of SEBI (Substantial Acquisition of Shares and Takeover) Regulations, 2011 (Takeover Regulations) to the Government of India (“GoI” or “Acquirer”) from the applicability of Regulation 3(2) of Takeover
Regulations with respect to its proposed increase in shareholding from 55.24% to 66.57%, pursuant to allotment of 11,85,83,771 equity shares of Dena Bank (Applicant) by way of preferential allotment.
Ref: PR No. 123/2013 dated December 20, 2013.
vii. Order in the matter of M/s. Alderbrooke
Portfolio Management Services Pvt. Ltd.
Shri S. Raman, Whole Time Member, SEBI has passed an ex-parte order on December 20, 2013 in the matter of M/s. Alderbrooke Portfolio Management Services Pvt. Ltd.
M/s. Alderbrooke Portfolio Management Services Pvt. Ltd. and its directors, Mr. Anandkumar Kanubhai Ravat and Mr. Jalpeshkumar Amrutlal Makwana, are restrained from accessing the securities market and further prohibited from buying, selling or otherwise dealing in securities, directly or indirectly, or being associated with the securities market in any manner whatsoever, till further directions.
The aforesaid entities are further directed to
i. cease and desist from acting as a portfolio manager and not to solicit or undertake such activity or any other activities in the securities market, directly or indirectly, in any manner whatsoever ;
ii. immediately withdraw and remove all advertisements, representations,
48
JANUARY SEBI BULLETIN 2014
literatures, brochures, materials, publications, documents, websites, etc. in relation to their portfolio management activities or any activities in the securities market;
iii. not to divert any funds raised from investors.
Ref: PR No. 124/2013 dated December 23, 2013.
viii. Order in the matter of M/s. Lee Capital
Services Private Limited
Shri Rajeev Kumar Agarwal, Whole Time Member, SEBI has passed an ex-parte order on December 19, 2013 in the matter of M/s. Lee Capital Services Private Limited.
Lee Capital Services Private Limited, a member of Cochin Stock Exchange having registration number as INB 091235631, and also a sub-broker of Cochin Stock Brokers Limited having registration numbers as INS 233765036 and INS 013422931 on National Stock Exchange Limited (“NSE”) and BSE Limited (“BSE”), respectively and its directors, Mr. Santhosh Kumar K.L. and Mr. Kunjiraman Pillai have been directed:
i. to close, terminate, and wind up all its schemes and to refund the monies
collected from the investors in its schemes along with income, profits or returns promised to them under its schemes or interest at the rate of 10% per annum, whichever is higher, from the date of investment till the date of refund, within a period of three months from the date of this order and submit a winding up and repayment report to SEBI;
ii. to restrain from buying, selling or dealing in the securities market, either directly or indirectly, in any manner whatsoever, till further directions:
iii. to cease and desist from unauthorized activities and not to solicit or undertake such activities or any other unregistered activity in the securities market, directly or indirectly, in any manner whatsoever;
iv. to immediately withdraw and remove all advertisements, representations, literatures, brochures, materials, publications, documents, websites, etc. in relation to those schemes/activities or any unregistered activity in the securities market.
Ref: PR No. 126/2013 dated December 27, 2013.
49
JANUARY SEBI BULLETIN 2014
I. Illustrative Format of Statement of Assets
& Liabilities in SEBI (ICDR) Regulations,
2009
1. Regulation – (2)(IX)(B)(9)(f) of Part-A of Schedule VIII of SEBI (ICDR) Regulations, 2009 provides for the illustrative format of Statement of Assets and Liabilities in offer document which is in accordance with the erstwhile format of Schedule VI of the Companies Act, 1956.
2. After the notification and implementation of the revised Schedule VI of Companies Act, 1956, the aforesaid format has been updated and brought in line with the requirements of the Companies Act, 1956. The revised format is also in line with the requirements of Companies Act, 2013 as Schedule III of Companies Act, 2013 has adopted the same format as notified under revised Schedule VI of Companies Act, 1956.
3. This circular is applicable for all draft/final offer documents filed with the Board on or after the date of this circular.
4. It may be noted that necessary amendments to SEBI (ICDR) Regulations, 2009 are being carried out and upon such amendment, this circular would stand rescinded.
Source: CIR/CFD/DIL/15/2013 dated December 03, 2013
CIRCULARS
II. Simplification of Demat Account Opening
Process
1. SEBI has taken a number of steps in the recent past to simplify the Account opening and KYC process in the securities markets. In continuation of the efforts in the same direction, it has now been decided in consultation with both the Depositories and Associations of stock brokers and Depository Participants to further simplify and rationalize the demat account opening process.
2. The existing Beneficial Owner-Depository Participant Agreements shall be replaced with a common document “Rights and Obligations of the Beneficial Owner and Depository Participant”. The document shall be mandatory and binding on all the existing and new clients and depository participants. This will harmonize the account opening process for trading as well as demat account. This will also rationalise the number of signatures by the investor, which he is required to affix at present on a number of pages.
3. The Depository Participant shall provide a copy of Rights and Obligations Document to the beneficial owner and shall take an acknowledgement of the same. They shall ensure that any clause in any voluntary

50
JANUARY SEBI BULLETIN 2014
document neither dilutes the responsibility of the depository participant nor it shall be in conflict with any of the clauses in this Document, Rules, Bye-laws, Regulations, Notices, Guidelines and Circulars issued by SEBI and the Depositories from time to time. Any such clause introduced in the existing as well as new documents shall stand null and void.
4. The Depositories are directed to:
i. Bring the provisions of this circular to the notice of the Depository Participants and also disseminate the same on their websites. They shall take necessary steps to implement this circular immediately and ensure its full compliance in respect of all new clients within 3 months from the date of this circular.
ii. Advise the depository participants to intimate their clients the modified provisions of the Rights and Obligations Document, replacing the existing BO-DP agreements.
iii. Make necessary amendments to the relevant bye-laws, rules and regulations for the implementation of the above decision in coordination with each another to achieve uniformity in approach.
iv. Communicate to SEBI, the status of the implementation of the provisions
of this circular in their Monthly Development Reports.
Source: CIR/ MIRSD/12/2013 dated December 04, 2013
III. Exchange Traded Cash Settled Interest
Rate Futures (IRF) on 10-Year Government
of India Security
1. SEBI vide circular No. SEBI/DNPD/Cir – 46 /2009 dated August 28, 2009 permitted Stock Exchanges to launch physically settled futures on 10-Year Government of India (GoI) Security.
2. In consultation with RBI, after taking into account feedback from market participants and Stock Exchanges, it has been decided to permit stock exchanges to introduce cash settled Interest Rate Futures on 10-Year Government of India Security.
3. The product specifications, position limits and risk management framework for cash settled futures on 10-year GoI security have been given. Two different designs (Option-A: Coupon bearing Government of India security as underlying and Option-B: Coupon bearing notional 10-year Government of India security with settlement price based on basket of Securities as underlying) are permitted for cash settled futures on 10-year GoI Secuirty. Exchanges are permitted to launch contracts on either one or both of these options.

51
JANUARY SEBI BULLETIN 2014
4. The cash settled 10-year IRF is being introduced on a pilot basis and the product features would be reviewed based on the experience gained.
5. Before the launch of the product, the Stock Exchange/Clearing Corporation shall submit the proposal to SEBI for approval giving the details of contract specifications, risk management framework, the safeguards and the risk protection mechanisms, the surveillance systems etc.
Source: CIR/MRD/DRMNP/35/2013 dated December 05, 2013
IV. Establishment of Connectivity with
both Depositories NSDL and CDSL –
Companies eligible for shifting from Trade
for Trade Settlement (TFTS) to Normal
Rolling Settlement
1. It is observed from the information provided by the depositories that 19 companies have established connectivity with both the depositories.
2. The stock exchanges may consider shifting the trading in these securities to normal Rolling Settlement subject to the following:
i. At least 50% of other than promoter holdings as per clause 35 of Listing Agreement are in dematerialized mode before shifting the trading in the securities of the company from TFTS to normal Rolling Settlement.
For this purpose, the listed companies shall obtain a certificate from its Registrar and Transfer Agent (RTA) and submit the same to the stock exchange/s. However, if an issuer-company does not have a separate RTA, it may obtain a certificate in this regard from a practicing company Secretary/Chartered Accountant and submit the same to the stock exchange/s.
ii. There are no other grounds/reasons for continuation of the trading in TFTS.
3. The Stock Exchanges are advised to report to SEBI, the action taken in this regard in the Monthly/Quarterly Development Report.
Source: CIR/ MRD/DP/ 36 /2013 dated December 16, 2013
V. Deposit Requirements for Members of the
Debt Segment
1. SEBI vide circular no CIR/MRD/DP/03/2013 dated January 24, 2013 prescribed guidelines for providing dedicated debt segment on stock exchanges. Subsequently, SEBI (Stock Brokers and Sub-Brokers) Regulations was amended to enable registration of Stock Broker, Proprietary Trading Member, Clearing Member and Self Clearing Member of debt segment of the stock exchange.
52
JANUARY SEBI BULLETIN 2014
2. Further, SEBI vide circular no CIR/MRD/DP/27/2013 dated September 12, 2013 prescribed the “Risk Management Framework for Dedicated Debt Segment on Stock Exchanges”.
3. In continuation to the above, the deposit requirements for the members of the debt segment shall be as under –
a. Stock Broker / Proprietary Trading Member: SEBI circular dated December 19, 2012 on Base Minimum Capital shall also be applicable to Stock Broker / Proprietary Trading Member of the debt segment.
b. Clearing Member (CM)/Self Clearing Member (SCM): The deposit shall be ` 10 lacs. No exposure shall be granted against such deposit requirement of the Clearing Member/Self Clearing Member. Provided no deposit shall be payable by entity desirous of being CM/SCM in debt segment, in case, it is already a CM or SCM or stock broker of any other segment of the stock exchange/clearing corporation.
Provided further that no deposit shall be payable in case a CM / SCM clears and settles trades only on gross basis for both securities and funds, and where no settlement guarantee is provided by the clearing corporation.
4. The Stock Exchanges and Clearing corporations are directed to:
a. take necessary steps to put in place systems for implementation of the circular, including necessary amendments to the relevant bye-laws, rules and regulations, within one month from the issuance of the circular;
b. bring the provisions of this circular to the notice of the members and also disseminate the same on its website;
c. communicate to SEBI the status of implementation of the provisions of this circular.
Source: CIR/MRD/DRMNP/37/2013 dated December 19, 2013
VI. Declaration and Undertaking regarding
PCC, MCV or equivalent structure by
FIIs
SEBI vide circular CIR/IMD/FIIC/1/2010 dated April 15, 2010 had mandated all Foreign
Institutional Investors/ Sub Accounts to submit Declaration and Undertaking with regard to their opaque structure such as Protected Cell Companies (PCC), Multi Class Share Vehicles (MCV) or equivalent structure.
In light of representations received it is clarified as follows:
If any applicant is required by its regulator
or under any law to ring fence its assets and
liabilities from other funds/ sub funds, such
applicant shall not be treated as having opaque
structure, provided:

53
JANUARY SEBI BULLETIN 2014
i. the applicant is regulated in its home
jurisdiction
ii. each fund/ sub fund in the applicant
satisfies broad based criteria, and
iii. the applicant gives an undertaking
to provide information regarding its
beneficial owners as and when SEBI
seeks this information.
The custodians are requested to bring the contents of this circular to the notice of their respective FII clients for necessary compliance.
Source: CIR/IMD/FIIC/21/ 2013 dated December 19, 2013
VII. Rationalization of Periodic Call Auction
for Illiquid Scrips
1. SEBI vide circular no CIR/MRD/DP/ 6/2013 dated February 14, 2013 issued guidelines for trading in the illiquid scrips through Periodic Call Auction session. After introduction of periodic call auction framework, representations have been received from market participants regarding the aforesaid circular. The issues raised by market participants were examined and deliberated in Secondary Market Advisory Committee (SMAC).
2. Based on recommendations of SMAC and feedback received from market participants and stock exchanges, it has been decided to rationalize the periodic call auction mechanism.
3. Accordingly, following conditions of aforesaid circular are modified as under:
3.1. Para 2.2 shall be replaced by the following
a) For the purpose of this circular, a scrip which trades in the normal market and is not shifted to trade for trade settlement, shall be classified as illiquid on a stock exchange if the following conditions are met:
i. Average daily turnover of less than Rs.2 lakhs calculated for previous two quarters and
ii. The scrip is classified as illiquid at all exchanges where it is traded
b) Of the scrips identified as per above criteria, scrips which satisfy any of the following conditions shall be excluded.
i. Scrips with average market capitalization more than Rs.10Cr.
ii. Scrips where company is paying dividend in at least two out of last three years.
iii. Scrips where company is profitable in at least 2 out of last 3 years, and not more than 20% of promoters shareholding is pledged in the latest quarter and book value is 3 times or more than the face value.
54
JANUARY SEBI BULLETIN 2014
3.2. Para 2.4.1 shall be replaced by the following:
“The scrip has remained in periodic call auction for at least one quarter.”
3.3. Para 2.6 shall be replaced by following:
“Number of auction sessions – Stock Exchange may determine the number of call auction session for illiquid stocks. However in order have minimum trading sessions and uniform closing session, there shall be at least 2 sessions in a trading day with one uniform closing session across the exchanges.”
3.4. Para 2.8 shall be replaced by following:
“Order Placement – The orders may remain valid throughout the trading day and un-matched orders remaining at the end of a call auction session may be moved into next call auction session.”
4. All other conditions for trading in periodic call auction sessions contained in the circulars CIR/MRD/DP/21/2010 dated July 15, 2010, CIR/MRD/DP/32/2010 September 17, 2010 and CIR/MRD/DP/6/2013 February 14, 2013 remain unchanged.
5. Stock Exchanges are directed to:
5.1. take necessary steps and put in place necessary systems for implementation of this circular from the beginning of the next quarter.
5.2. make necessary amendments to the relevant bye-laws, rules and regulations for the implementation of the above decision;
5.3. bring the provisions of this circular to the notice of the member brokers of the stock exchange and also to disseminate the same on the website.
Source: CIR/MRD/DP/38 /2013 dated December 19, 2013
VIII. Know Your Client Requirements
1. This is in reference to SEBI circulars no. CIR/MIRSD/16/2011 dated August 22, 2011 and MIRSD/SE/Cir-21/2011 dated October 5, 2011 on uniform Know Your Client (‘KYC’) norms.
2. Vide above mentioned circulars, SEBI simplified the account opening process for the investors. A standard Account Opening Form (AOF) has been prescribed which is divided in 2 parts – Part I contains the basic KYC details of the investor used by all SEBI registered intermediaries and Part II captures additional information specific to the area of activity of the intermediary. Further, with the centralised KRA system in place, the client has to undertake the KYC process i.e. Part I of the AOF only once which means he need not undergo the KYC process again when he approaches different intermediaries in securities markets.
3. It has now been decided in consultation with various market participants to shift

55
JANUARY SEBI BULLETIN 2014
certain information in Section C of Part I to Part II of the AOF (for both individuals and non-individuals). Part II shall be modified by the intermediary accordingly.
4. Information as contained in revised Part I of AOF shall only be required to be captured in the systems of KRAs from the date of this circular. However, in view of existing pre-printed forms available with the intermediaries, a time period of six months, effective from the date of this circular, is provided to bring about the aforementioned modifications in the KYC form.
5. The above modifications would assist in avoiding repeated modifications in the KRA system as information provided by the clients in Section C changes over a period of time and will facilitate in making the KYC uniform for the entire financial sector.
6 Intermediaries dealing with Eligible Foreign Investors investing under Portfolio Investment Scheme may be guided by the clarifications issued vide SEBI circular CIR/MIRSD/07/2013 dated September 12, 2013
Source: CIR/MIRSD/13/2013 dated December 26, 2013
56
JANUARY SEBI BULLETIN 2014
• SEBI granted exemption to the Government of India, from complying with the requirements of Regulation 3(2) of the SEBI (Substantial Acquisition of Shares and Takeovers) Regulations, 2011 with respect to its proposed acquisition of 18,00,41,152 shares by way of preferential allotment by the Target Company i.e., United Bank of India, against the infusion of `700 crores by the GoI, which may increase the shareholding/voting rights of the Government of India in the Target Company from 82.232% to 87.998%.
• SEBI revoked the directions issued vide the order dated April 13, 2012 against the Ex-Director Mr. Harshad Talati of M/s. Shukla Data Technics Limited.
• SEBI revoked the directions issued vide the order dated August 10, 2012 against M/s. International Hometex Limited and its directors, Mr. Vineet Kumar Agarwal, Mr. Vinod Kumar Agarwal and Mr. Vishwinder Nath Gupta.
• SEBI in exercise of the powers conferred upon under 11(1), 11(B) and 11(4) of the SEBI Act, 1992 and Regulation 65 of CIS Regulations, 1999 directed M/s. KIM Infrastructure and Developers Limited and its directors, viz Shri Ravinder Singh
ORDERS PASSED BY CHAIRMAN/MEMBERS
AND ADJUDICATING OFFICER
Sidhu, Shri Rajesh Kumar, Shri Sukhpal Singh Barar, Shri Sanjib Sikdar, Shri Rana Raminder, Shri Palwinder Singh, Shri Satnam Singh:
i. Not to collect any more money from investors including under the existing schemes
ii. Not to launch any new schemes
iii. To give a full inventory of the assets owned by the company
iv. Not to dispose of any of the properties or alienate any of the assets of the schemes
v. Not to divert any funds raised from public at large which are kept in bank account(s) and/or in the custody of M/s. KIM Infrastructure and Developers Limited
• SEBI revoked the directions issued vide the ad-interim ex-parte order dated February 15, 2013 against M/s. Shreyans Credit and Capital Private Limited, M/s. Betul Minerals and Constructions Private Limited, M/s. Aventis Biofeeds Private Limited, M/s. Betul Oils & Feeds Private Limited, M/s. Sunmate Trade Private Limited, M/s. Moebius Credit and Capital Private Limited, M/s. Navinya Multitrade
57
JANUARY SEBI BULLETIN 2014
Private Limited, M/s. Uni24 Techno Solutions Private Limited and M/s. Vision Millennium Exports Private Limited and Others in the matter of dealing in the scrip of M/s. Ruchi Soya Industries Limited.
• SEBI imposed a penalty of `5,00,000 [Rupees Five Lakh Only] under Section 15F and `5,00,000 [Rupees Five Lakh Only] under Section 15HB of the SEBI Act, 1992 [total penalty of ` 10, 00, 000 (Rupees Ten Lakh only)] on M/s. Share India Securities Limited (Formerly known as M/s. FMS Securities Limited) for violating /contravening the provisions of Regulation 18B of the Brokers Regulations read with SEBI Circular No. SMD/POLICY/Cir-11/97 dated May 21, 1997, SEBI circular Nos. SMD/SED/CIR/93/23321 dated November 18, 1993 and SEBI/MRD/SE/Cir – 33/2003/27/08 dated August 27, 2003 read with clause A(1), A(2) & A(5) of the Code of Conduct for Stock Brokers mentioned under schedule II of the Brokers Regulations read with Regulation 7 of the Brokers Regulations, 1992.
• SEBI under section 19 of the SEBI Act, 1992 read with sections 11(4)(b) and 11B revoked the directions issued vide the order dated December 15, 2010 against M/s. Motorol Enterprises Limited and its former directors, Mr. Rinki S. Gandhi and Mr. Thakar S. Mahesh.
• SEBI under section 19 of the SEBI Act, 1992 read with sections 11(1), 11(2)(j), 11(4) and 11B thereof and section 12A of the SCRA, 1956, revoked the directions issued vide the interim order dated June 04, 2013 against Dr. Agarwal’s Eye Hospital Limited, its directors, promoters and promoter group.
• SEBI under section 19 of the SEBI Act, 1992 read with regulation 11(5) of SAST Regulations, 2011 granted exemption to the proposed acquirer, the Government of India, from complying with the requirements of regulation 3(2) of the SAST Regulations, 2011 with respect to its proposed acquisition of 22,97,53,015 shares by way of preferential allotment by the Target Company i.e., Indian Overseas Bank.
• SEBI under section 19 of the SEBI Act, 1992 read with regulation 11(5) of SAST Regulations, 2011 granted exemption to the proposed acquirer, the Government of India, from complying with the requirements of regulation 3(2) of the SAST Regulations, 2011 with respect to its proposed acquisition of 11,85,83,771 shares by way of preferential allotment by the Target Company i.e., Dena Bank.
• In order to protect the interest of investors and the integrity of securities market and in exercise of the powers conferred upon by virtue of section 19 read with sections

58
JANUARY SEBI BULLETIN 2014
11(1), 11(4), 11B and 11D of SEBI Act, 1992, by way of ex-parte order, SEBI:
i. directed M/s Lee Capital Services Private Limited to close, terminate, and wind up all its schemes and to refund the monies collected from the investors in its schemes along with income, profits or returns promised to them under its schemes or interest at the rate of 10% per annum, whichever is higher
ii. restrain M/s Lee Capital Services Private Limited, Mr. Santhosh Kumar K.L. and Mr. Kunjiraman Pillai from buying, selling or dealing in the securities market, either directly or indirectly, in any manner whatsoever, till further directions
iii. directed the above entities:–
• to cease and desist from unauthorized activities as noted above and not to solicit or undertake such activities or any other unregistered activity in the securities market, directly or indirectly, in any manner whatsoever;
• to immediately withdraw and remove all advertisements, representations, literatures, brochures, materials, publications, documents, websites, etc. in
relation to those schemes/activities or any unregistered activity in the securities market.
• SEBI under sections 11(1), 11(4), 11B and 11D of SEBI Act, 1992, pending enquiry, directed:
i. M/s. Alderbrooke Portfolio Management Services Pvt. Ltd. and its directors Mr. Anandkumar Kanubhai Ravat and Mr. Jalpeshkumar Amrutlal Makwana are restrained from accessing the securities market and further prohibited from buying, selling or dealing in the securities market, either directly or indirectly, or being associated with the securities market in any manner whatsoever, till further directions
ii. The aforesaid entities to withdraw and remove all advertisements, representations, literatures, brochures, materials, publications, documents, websites, etc. in relation to their portfolio management activities or any activities in the securities market
iii. Not to divert any funds raised from the investors
• SEBI imposed a penalty of `5,00,000 [Rupees Five Lakh Only] under Section 15A of SEBI Act, 1992 on Shri G. Suresh in the matter of M/s. CG – Vak Software
59
JANUARY SEBI BULLETIN 2014
& Exports Ltd for not complying with Regulation 7 (1) read with Regulation 7 (2) of SAST Regulations, 1997.
• SEBI imposed a penalty of `3,00,000 [Rupees Three Lakh Only] under Section 15A(b) of SEBI Act, 1992 on M/s. CG – Vak Software & Exports Ltd for not complying with Regulation 13 (6) of the PIT Regulations, 1992.
• SEBI imposed the following penalties under Section 15HA of the SEBI Act, 1992 on each of the 9 Noticees, for violating /contravening the provisions of Regulation 3(a), (b), (c), (d), 4(1), 4(2)(d) and (e) of the PFUTP Regulations, 2003:
i. ̀ 1 crore (Rupees one crore only) each on M/s. Sanwaria Agro Oils Limited, Mr. Anil Agrawal and Mr. Rajesh Kapoor
ii. ̀ 25 lakhs (Rupees twenty five lakhs only) each on M/s. Unique Ways Realtors Pvt. Ltd, M/s. Unique Ways Management Services Pvt. Ltd, M/s. Uniways Infra Pvt. Ltd, M/s. Uniways Agri Commodities Pvt. Ltd, M/s. Uniways Telefilms Pvt. Ltd and M/s. Uni Arc Pvt. Ltd.
• SEBI imposed a penalty of `5,00,000 [Rupees Five Lakh Only] under Section 15A(b) of SEBI Act, 1992 on Mr. Virat Sevantilal Shah, Mr. Alok Virat Shah & Mr. Rajan Sevantilal Shah in the matter of
M/s. Shree Surgovind Tradelink Limited for violation of Regulation 7(1) read with Regulation 7(2) of SAST Regulations, 1997 and Regulation 29 (2) read with 29 (3) of SAST Regulations, 1997.
• SEBI imposed a penalty of `6,00,000 [Rupees Six Lakh Only] under Section 15A(b) of SEBI Act, 1992 on M/s. Shree Surgovind Tradelink Limited in the matter of M/s. Shree Surgovind Tradelink Limited for violation of Regulation 8(3) of SAST Regulations, 1997.
• SEBI imposed a penalty of `4,50,000 [Rupees Four Lakh Fifty Thousand Only] under Section 15A(b) of SEBI Act, 1992 on M/s. Akriti Realtech Limited in the matter of M/s. SRS Real Infrastructure Limited for violation of provisions of Regulation 29(1) & Regulation 29(2) read with Regulation 29(3) of SAST Regulations, 2011 and regulation 13(1) and 13(3) read with Regulation 13(5) of PIT Regulations, 1992.
• SEBI, under Sections 11, 11B and 19 of the SEBI Act, 1992 read with the regulations 65 and 73 of the SEBI(Collective Investment Schemes) Regulations, 1999 restrained and debarred M/s. Sun-Plant Agro Ltd, Shri Awdesh Kumar Singh, Shri Girija Shankar Kumar and Shri Sant Kumar from
i. accessing the securities market and further prohibit them from buying,

60
JANUARY SEBI BULLETIN 2014
selling or dealing in securities market, directly or indirectly, in any manner whatsoever for a period of 5 years.
ii. Prohibit the above entities/persons from mobilizing funds under any schemes or arrangement, existing or future, as defined under section 11AA of the SEBI Act.
• SEBI, under section 19 of the SEBI Act, 1992 read with sections 11(1), 11(4) and 11B thereof, confirmed the directions issued in respect of Mr. Imtiyaz Hanif Khanda and Mr. Vali Mamad Habib Ghaniwala vide ad-interim ex-parte order dated August 20, 2013.
• SEBI under section 19 of the SEBI Act, read with sections 11(1), 11(4) and 11B thereof, confirmed the directions issued against 13 entities vide the ad interim ex-parte order dated April 18, 2013 in the matter of dealings in the shares of M/s P.M. Telelinnks Ltd. and M/s 8K Miles Software Solutions Ltd.
• SEBI, under section 19 read with section 12(3) of the SEBI Act, 1992 and regulation 28(2) of the SEBI (Intermediaries) Regulations, 2008, suspended the certificate of registration of M/s Baba Bhoothnath Trade and Commerce Pvt Limited, Stock Broker (NSE and BSE) for a period of 15 days in the matter of trading in the shares of M/s. Taksheel Solutions Ltd.
• SEBI imposed a penalty of `10,00,000 (Rupees ten lacs only) under section 15HA and `10,00,000 (Rupees ten lacs only) under 15HB of the SEBI Act, {i.e. a total penalty of `20,00,000 (Rupees twenty lacs only)} on M/s Angel Broking Limited and `10,00,000 (Rupees ten lacs only) under section 15HA of SEBI Act on M/s Angel Infin Pvt. Ltd. in the matter of M/s Asian Sterling Green Woods Limited for violation of Regulation 3(a), 4(1) and 4(2)(a), (b), (e) & (g) of PFUTP Regulations and M/s Angel Broking Limited failed to carry out its business with due, skill, care and due diligence in violation of Regulation 7 read with Clause A (1), A(3), A(4) and A(5) of Code of Conduct for Stock Brokers as specified in Schedule II of the SEBI Stock Brokers Regulations.
• SEBI imposed a monetary penalty of `5,00,000/ – (Rupees Five Lakhs Only/-) on M/s Zenith Capitals Limited for violation of the statutory obligation under regulation 8(3) of SAST Regulations, 1997.
• SEBI imposed a monetary penalty of `1,00,000 (Rupees One Lakh only) against 10 entities in the matter of M/s Zenith Capitals Limited for violation of the statutory obligation under regulation 8(3) of SAST Regulations, 1997.
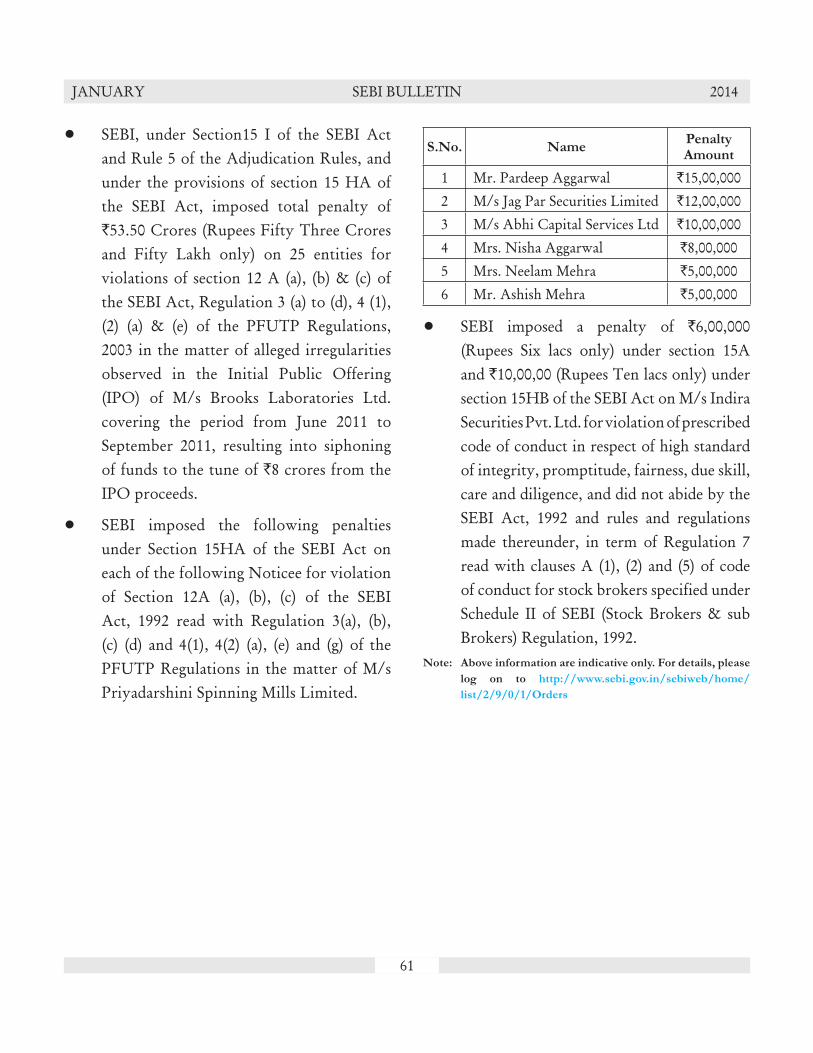
61
JANUARY SEBI BULLETIN 2014
• SEBI, under Section15 I of the SEBI Act and Rule 5 of the Adjudication Rules, and under the provisions of section 15 HA of the SEBI Act, imposed total penalty of `53.50 Crores (Rupees Fifty Three Crores and Fifty Lakh only) on 25 entities for violations of section 12 A (a), (b) & (c) of the SEBI Act, Regulation 3 (a) to (d), 4 (1), (2) (a) & (e) of the PFUTP Regulations, 2003 in the matter of alleged irregularities observed in the Initial Public Offering (IPO) of M/s Brooks Laboratories Ltd. covering the period from June 2011 to September 2011, resulting into siphoning of funds to the tune of `8 crores from the IPO proceeds.
• SEBI imposed the following penalties under Section 15HA of the SEBI Act on each of the following Noticee for violation of Section 12A (a), (b), (c) of the SEBI Act, 1992 read with Regulation 3(a), (b), (c) (d) and 4(1), 4(2) (a), (e) and (g) of the PFUTP Regulations in the matter of M/s Priyadarshini Spinning Mills Limited.
S.No. NamePenalty Amount
1 Mr. Pardeep Aggarwal `15,00,0002 M/s Jag Par Securities Limited `12,00,0003 M/s Abhi Capital Services Ltd `10,00,0004 Mrs. Nisha Aggarwal `8,00,0005 Mrs. Neelam Mehra `5,00,0006 Mr. Ashish Mehra `5,00,000
• SEBI imposed a penalty of `6,00,000 (Rupees Six lacs only) under section 15A and `10,00,00 (Rupees Ten lacs only) under section 15HB of the SEBI Act on M/s Indira Securities Pvt. Ltd. for violation of prescribed code of conduct in respect of high standard of integrity, promptitude, fairness, due skill, care and diligence, and did not abide by the SEBI Act, 1992 and rules and regulations made thereunder, in term of Regulation 7 read with clauses A (1), (2) and (5) of code of conduct for stock brokers specified under Schedule II of SEBI (Stock Brokers & sub Brokers) Regulation, 1992.
Note: Above information are indicative only. For details, please
log on to http://www.sebi.gov.in/sebiweb/home/
list/2/9/0/1/Orders
62
JANUARY SEBI BULLETIN 2014
1. IOSCO Research Launches Statistics Web
Portal on Securities Markets
The Research Department of the International Organization of Securities Commissions (IOSCO) launched a statistics web portal that provides the public with a global overview of specific securities markets. The objectives of the new portal are threefold. First, it seeks to provide a centralized point for monitoring global trends, risks and vulnerabilities; second, to provide a mechanism for comparison of how well markets are recovering in light of the crisis; and finally, to provide IOSCO members and the broader financial community with easy access to key statistics, charts and indicators on a number of securities markets.Source: h t t p : / / w w w . i o s c o . o r g / r e s e a r c h / i n d e x .
cfm?section=statistics
2. Malaysia Publishes Consultation on Trade
Repository Reporting Requirement for
OTC Derivatives
The enhancement of transparency of over-the-counter (OTC) derivatives is an important step forward to facilitate assessment of risk to financial stability, potential market irregularities and in determining appropriate resolution strategies in dealing with distressed financial institutions.
HIGHLIGHTS OF DEVELOPMENTS IN
INTERNATIONAL SECURITIES MARKETS
In achieving these objectives, the Suruhanjaya Sekuriti Malaysia, Bank Negara Malaysia and Perbadanan Insurans Deposit Malaysia issued a joint consultation paper on the trade repository reporting requirements for OTC derivatives which sets out the details of the mandatory reporting requirements and the transitional arrangements.Source: http://www.bnm.gov.my/documents/2013/TR_Joint_
Consultation_Paper_final191113.pdf
3. Monetary Authority of Singapore
Consultation Paper on the Review of the
Banking Act
The Monetary Authority of Singapore (MAS) is reviewing the Banking Act (BA) to ensure that it remains current and reflects MAS’ requirements and expectations. Specifically, MAS intends to codify its expectations as to the information that banks should provide to MAS and the risk management practices that banks should implement. MAS also propose several changes to the BA to rationalise and enhance its supervisory powers over banks and their directors, executive officers and external auditors. These proposed changes are discussed in this consultation paper.Source: h t t p : / / w w w. m a s . g ov. s g / ~ / m e d i a / r e s o u r c e /
publications/consult_papers/2013/28%20Nov%20
2013%20Consultation%20Paper%20on%20BA%20
Review.pdf
63
JANUARY SEBI BULLETIN 2014
4. FCA Issues Guidance on Information
Required from AIFMs on Depositary
Arrangements
The Financial Conduct Authority (FCA) issued guidance on the information that alternative investment fund managers (AIFMs) need to provide the FCA in respect of their depositary arrangements. This guidance is applicable both to firms seeking a variation of permission arising out of the implementation of the AIFM Directive (AIFMD) and to new applicants seeking authorisation to manage an alternative investment fund (AIF).
The guidance note establish, in particular, that where information about depositary arrangements is missing from a firm’s application for authorisation, the firm will not be permitted to start managing the AIF in question until one month after the missing information has been provided, even if authorisation is granted in the interim.Source: http://www.fca.org.uk/static/documents/aifm-
depositary-arrangements.pdf
5. GFMA and Other Associations Submit
Comments to the EBA on the Use of a
LEI
On 28 November, GFMA, the International Swaps and Derivatives Association, Inc (ISDA), the Investment Industry Association of Canada (IIAC), ISITC Europe and the UK Investment Management Association provide comments to the European Banking Authority (EBA) on
the EBA’s Consultative Document on the use of the Legal Entity Identifier (LEI) for entity identification in EU regulatory reporting.
The Associations strongly agree with the EBA’s recommendation to support “the adoption of Legal Entity Identification system proposed by the Financial Stability Board (FSB) and endorsed by the G20, aimed at achieving a unique, worldwide identification of parties to financial transactions” and to call for “competent authorities [to] request that all institutions under their supervisory remit obtain a pre-LEI code” and use that LEI when providing information to the EBA concerning institutions.
The groups offer a few brief comments on the Draft Recommendation as well respond to the questions included in the paper.Source: h t tp ://www.gfma.org/cor r espondence/i tem.
aspx?id=558
6. BCBS Regulatory Consistency Assessment
Programme (RCAP) Assessment of Basel
III regulations in Brazil
The Basel Committee on Banking Supervision (Basel Committee) sets a high priority on the implementation of the regulatory standards underpinning the Basel III framework. This recent report presents the findings of the Basel Committee’s RCAP Assessment Team on the domestic adoption of Basel III risk-based capital standards in Brazil and their consistency with Basel Committee requirements. The assessment team held discussions with senior officials and
64
JANUARY SEBI BULLETIN 2014
technical staff of the Central Bank of Brazil, selected large Brazilian banks, one accounting/audit firm and a rating agency.Source: http://www.bis.org/bcbs/implementation/l2_br.pdf
7. IOSCO Issues Report on the Impact
of Trading Fee Models on Trading
Behaviour
The International Organization of Securities Commissions published its final report on Trading Fee Models and their Impact on Trading Behaviour, which provides a comprehensive overview of trading fees and trading fee models around the globe and how they influence trading behaviour.Source: h t tp ://www. iosco .org/l ibrar y/pubdocs/pdf/
IOSCOPD430.pdf
8. IOSCO Issues Report on Regulatory Issues
Raised by Changes in Market Structure
The International Organization of Securities Commissions published its final report on Regulatory Issues Raised by Changes in Market Structure, which makes four recommendations that seek to promote market liquidity and efficiency, price transparency, and investors´ execution quality in a fragmented environment.
The report identifies possible outstanding issues and risks posed by existing or developing market structures and it describes how these risks should be addressed. Finally, it recommends that regulators monitor the impact of fragmentation on market quality.Source: http://www.iosco.org/library/index.cfm?section=pub
docs&publicDocID=431
9. IOSCO Publishes Report on Regulation
of Retail Structured Products
The International Organization of Securities Commissions (IOSCO) published the final report, Regulation of Retail Structured Products, which provides a toolkit outlining regulatory options that securities regulators may find useful to regulate retail structured products. The Toolkit has been developed with the goal of enhancing investor protection by providing securities regulators with possible approaches to address certain concerns with retail structured products. The proposed tools are intended to allow for a wide range of application and adaptation in different jurisdictions, and regulators may choose to implement some, all, or none of them in their jurisdictionSource: http://www.iosco.org/library/index.cfm?section=pub
docs&publicDocID=434
10. IMF Issues Working Paper on
Securitization
On 19 December, the International Monetary Fund (IMF) issued a working group paper, Securitization: Lessons Learned and the Road Ahead. This paper examines the financial stability implications arising from securitization markets, with one eye on the past and another on the future. The paper begins by deriving a number of “lessons learned” based on an examination of key industry developments in the years before the crisis. Emphasis is placed on the various ways in which securitization

65
JANUARY SEBI BULLETIN 2014
markets dramatically changed shape in the years preceding the crisis, vis-à-vis their earlier (simpler) incarnation. Current impediments to securitization markets are then discussed, including a treatment of various regulatory initiatives, the operational infrastructure of securitization markets, and related official sector intervention. Finally, a broad suite of policy recommendations is presented to address the factors that either contributed to the crisis or may currently be posing obstacles to growth-supportive, sustainable securitization markets. These proposals are guided by the objective of preserving the beneficial features of securitization, while mitigating those that pose a potential risk to financial stability.Source: http://www.imf.org/external/pubs/ft/wp/2013/
wp13255.pdf
11. 2013 Annual Report of the US Office of
Financial Research (OFR)
The report fulfills a requirement for the OFR to submit a report annually to Congress to assess the state of the United States financial system and analyze threats to U.S. financial stability. The report presents a prototype Financial Stability Monitor, a comprehensive new tool to track threats to financial stability and the interplay among them. In addition, the report discusses important gaps in financial data and describes progress in implementing the Global Legal Entity Identifier System. The LEI is a global standard for uniquely identifying parties to financial transactions.Source: http://www.treasury.gov/initiatives/ofr/about/
Documents/OFR_AnnualReport2013_FINAL_12-17-
2013_Accessible.pdf
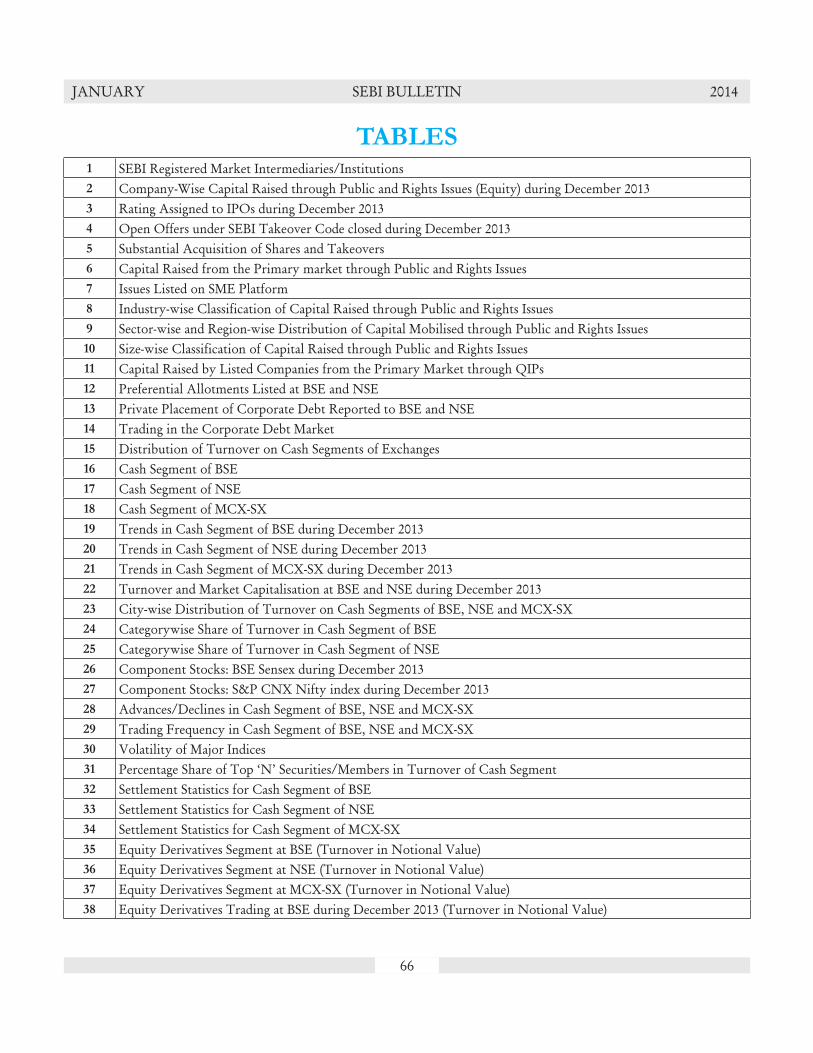
66
JANUARY SEBI BULLETIN 2014
TABLES1 SEBI Registered Market Intermediaries/Institutions2 Company-Wise Capital Raised through Public and Rights Issues (Equity) during December 20133 Rating Assigned to IPOs during December 20134 Open Offers under SEBI Takeover Code closed during December 20135 Substantial Acquisition of Shares and Takeovers6 Capital Raised from the Primary market through Public and Rights Issues7 Issues Listed on SME Platform8 Industry-wise Classification of Capital Raised through Public and Rights Issues9 Sector-wise and Region-wise Distribution of Capital Mobilised through Public and Rights Issues10 Size-wise Classification of Capital Raised through Public and Rights Issues11 Capital Raised by Listed Companies from the Primary Market through QIPs12 Preferential Allotments Listed at BSE and NSE13 Private Placement of Corporate Debt Reported to BSE and NSE14 Trading in the Corporate Debt Market15 Distribution of Turnover on Cash Segments of Exchanges16 Cash Segment of BSE17 Cash Segment of NSE18 Cash Segment of MCX-SX19 Trends in Cash Segment of BSE during December 201320 Trends in Cash Segment of NSE during December 201321 Trends in Cash Segment of MCX-SX during December 201322 Turnover and Market Capitalisation at BSE and NSE during December 201323 City-wise Distribution of Turnover on Cash Segments of BSE, NSE and MCX-SX24 Categorywise Share of Turnover in Cash Segment of BSE25 Categorywise Share of Turnover in Cash Segment of NSE26 Component Stocks: BSE Sensex during December 201327 Component Stocks: S&P CNX Nifty index during December 201328 Advances/Declines in Cash Segment of BSE, NSE and MCX-SX29 Trading Frequency in Cash Segment of BSE, NSE and MCX-SX30 Volatility of Major Indices31 Percentage Share of Top ‘N’ Securities/Members in Turnover of Cash Segment32 Settlement Statistics for Cash Segment of BSE33 Settlement Statistics for Cash Segment of NSE34 Settlement Statistics for Cash Segment of MCX-SX35 Equity Derivatives Segment at BSE (Turnover in Notional Value)36 Equity Derivatives Segment at NSE (Turnover in Notional Value)37 Equity Derivatives Segment at MCX-SX (Turnover in Notional Value)38 Equity Derivatives Trading at BSE during December 2013 (Turnover in Notional Value)
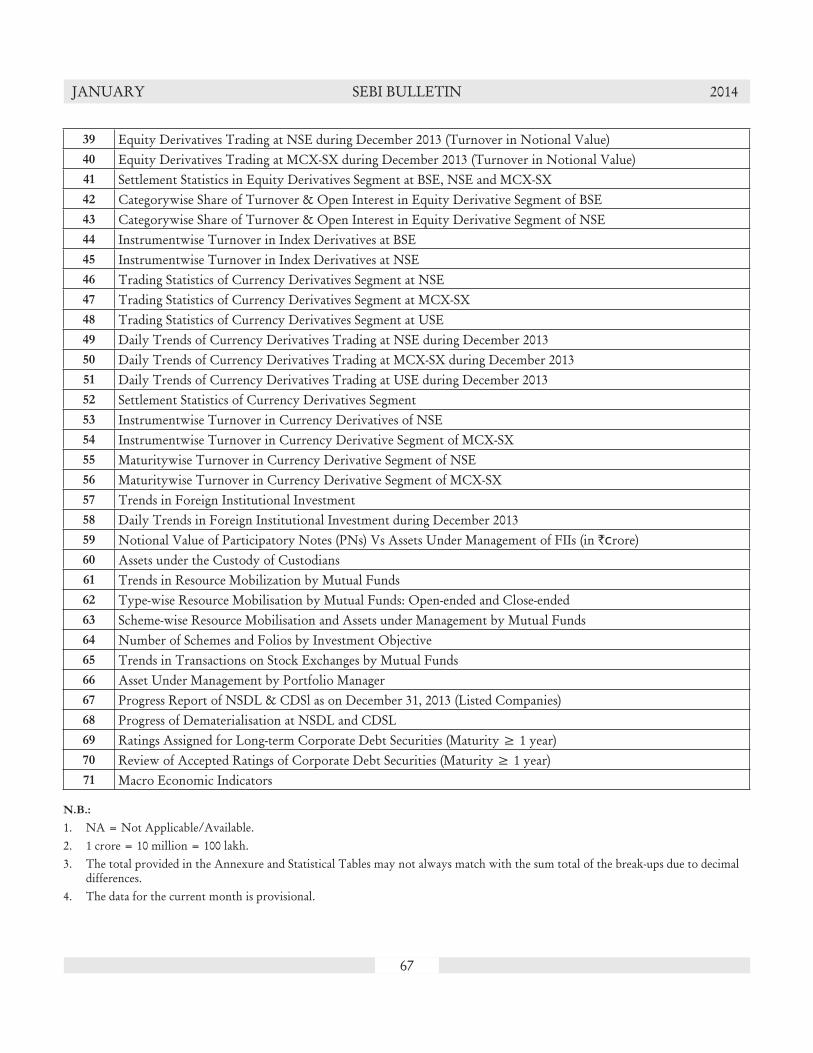
67
JANUARY SEBI BULLETIN 2014
39 Equity Derivatives Trading at NSE during December 2013 (Turnover in Notional Value)40 Equity Derivatives Trading at MCX-SX during December 2013 (Turnover in Notional Value)41 Settlement Statistics in Equity Derivatives Segment at BSE, NSE and MCX-SX42 Categorywise Share of Turnover & Open Interest in Equity Derivative Segment of BSE43 Categorywise Share of Turnover & Open Interest in Equity Derivative Segment of NSE44 Instrumentwise Turnover in Index Derivatives at BSE45 Instrumentwise Turnover in Index Derivatives at NSE46 Trading Statistics of Currency Derivatives Segment at NSE47 Trading Statistics of Currency Derivatives Segment at MCX-SX48 Trading Statistics of Currency Derivatives Segment at USE49 Daily Trends of Currency Derivatives Trading at NSE during December 201350 Daily Trends of Currency Derivatives Trading at MCX-SX during December 201351 Daily Trends of Currency Derivatives Trading at USE during December 201352 Settlement Statistics of Currency Derivatives Segment53 Instrumentwise Turnover in Currency Derivatives of NSE54 Instrumentwise Turnover in Currency Derivative Segment of MCX-SX55 Maturitywise Turnover in Currency Derivative Segment of NSE56 Maturitywise Turnover in Currency Derivative Segment of MCX-SX57 Trends in Foreign Institutional Investment58 Daily Trends in Foreign Institutional Investment during December 201359 Notional Value of Participatory Notes (PNs) Vs Assets Under Management of FIIs (in `crore)60 Assets under the Custody of Custodians61 Trends in Resource Mobilization by Mutual Funds62 Type-wise Resource Mobilisation by Mutual Funds: Open-ended and Close-ended63 Scheme-wise Resource Mobilisation and Assets under Management by Mutual Funds64 Number of Schemes and Folios by Investment Objective65 Trends in Transactions on Stock Exchanges by Mutual Funds66 Asset Under Management by Portfolio Manager67 Progress Report of NSDL & CDSl as on December 31, 2013 (Listed Companies)68 Progress of Dematerialisation at NSDL and CDSL69 Ratings Assigned for Long-term Corporate Debt Securities (Maturity ≥ 1 year)70 Review of Accepted Ratings of Corporate Debt Securities (Maturity ≥ 1 year)71 Macro Economic Indicators
N.B.:
1. NA = Not Applicable/Available.2. 1 crore = 10 million = 100 lakh.3. The total provided in the Annexure and Statistical Tables may not always match with the sum total of the break-ups due to decimal
differences.4. The data for the current month is provisional.

68
JANUARY SEBI BULLETIN 2014
Table 1: SEBI Registered Market Intermediares/Institutions
Market Intermediaries 2010-11 2011-12 2012-13 2013-14$
1 2 3 4 5
Stock Exchanges (Cash Market) 19 19 20 20Stock Exchanges (Derivatives Market) 2 2 3 3Stock Exchanges (Currency Derivatives) 4 4 3 3Brokers (Cash Segment)* 10,203 10,268 10,128 9,414Corporate Brokers (Cash Segment)** 4,774 4,877 5,113 4,924Brokers (Equity Derivative) 2,111 2,337 2,957 3,066Brokers (Currency Derivatives) 2,008 2,173 2,330 2,375Sub-brokers (Cash Segment) 83,808 77,141 70,242 54871Foreign Institutional Investors 1,722 1,765 1,757 1739Sub-accounts 5,686 6,322 6,335 6394Custodians 17 19 19 19Depositories 2 2 2 2Depository Participants of NSDL & CDSL 805 854 871 866Qualified Depository Participants of NSDL & CDSL NA NA 59 62Merchant Bankers NA 200 198 198Bankers to an Issue 55 57 57 56Underwriters 3 3 3 3Debenture Trustees 29 31 31 32Credit Rating Agencies 6 6 6 6KYC Registration Agency (KRA) NA NA 5 5Venture Capital Funds 184 212 211 210Foreign Venture Capital Investors 153 174 182 193Alternative Investment Funds NA NA 42 90Registrars to an Issue & Share Transfer Agents 73 74 72 72Portfolio Managers 267 250 241 221Mutual Funds 51 49 52 50Investment Advisors NA NA NA 70Collective Investment Schemes 1 1 1 1Approved Intermediaries (Stock Lending Schemes) 2 2 2 2STP (Centralised Hub) 1 1 1 1STP Service Providers 2 2 2 2
** including brokers on Mangalore SE (9), Magadh SE (22)
* including brokers on Mangalore SE (57), Magadh SE (189)
$ indicates as on December 31, 2013
NA: Not Applicable
Source: SEBI

69
JANUARY SEBI BULLETIN 2014T
ab
le 2
: C
om
pan
y-W
ise C
ap
ital
Rais
ed
th
rou
gh
Pu
bli
c a
nd
Rig
hts
Iss
ues
(Eq
uit
y)
du
rin
g D
ecem
ber
2013
S.
No
.N
am
e o
f t
he I
ssu
er/
Co
mp
an
y
Date
of
Op
en
ing
Typ
e o
f
Issu
e
Typ
e o
f
Inst
rum
en
t
No
. o
f
Sh
are
s
Issu
ed
Face
Valu
e
(`)
Pre
miu
m
Valu
e
(`)
Issu
e
pri
ce
(`)
Siz
e o
f
Issu
e
(`c
rore
)
12
34
56
78
910
1Po
wer
Gri
d C
orpo
ratio
n of
Indi
a Lt
d3-
Dec
-13
FPO
Equi
ty78
7053
309
1080
9069
59
2T
entiw
al W
ire
Prod
ucts
Ltd
11-D
ec-1
3IP
O-S
ME
Equi
ty16
3000
010
313
2
3R
CI I
ndus
trie
s & T
echn
olog
ies L
td30
-Dec
-13
IPO
-SM
EEq
uity
2880
000
1030
4012
4Su
yog
Tel
emat
ics L
td30
-Dec
-13
IPO
-SM
EEq
uity
1812
000
1015
255
No
te:
All
th
e I
ssu
es
are
co
mp
iled
fro
m t
he P
rosp
ectu
s’ o
f I
ssu
er
Co
mp
an
ies
fi le
d w
ith
SE
BI.
So
urc
e:
SE
BI.
70
JANUARY SEBI BULLETIN 2014
Table 3: Ratings Assigned to IPOs during December 2013
S.No. Name of the CompanyCredit Rating
Agencies
Rating
Assigned
1 2 3 4
NIL
Notes: 1. IPO grading is the grade assigned by a Credit Rating Agency (CRA) registered with SEBI. 2. The IPO grading is assigned
on a fi ve point scale from 1 to 5 with an “IPO Grade 5” indicating strong fundamentals and an “IPO Grade 1” indicating poor
fundamentals.
Source: Credit Rating Agencies.

71
JANUARY SEBI BULLETIN 2014
Table 4 : Open Offers under SEBI Takeover Code closed during December 2013
S.
No.Target Company Acquirer
Offer
Opening
Date
Offer
Closing
Date
Offer SizeOffer
Price
(`) per
share
No. of
Shares
Percent
of
Equity
Capital
1 2 3 4 5 6 7 8
1KALINDEE RAIL NIRMAN(ENGINEERS) LTD.
TEXMACO RAIL & ENGINEERING LTD.
20-Nov-13 3-Dec-13 4952280 30 71.00
2KALINDEE RAIL NIRMAN (ENGINEERS) LTD.
JUPITER METAL PVT.LTD. &, JUPITER
METAL PVT.LTD.20-Nov-13 3-Dec-13 4291975 26 70.00
3ASIAN OILFIELD SERVICES LTD
SAMARA CAPITAL PARTNERS FUND LTD
2-Dec-13 31-Dec-13 5804355 26 21.50
4NEWTIME INFRASTRUCTURE LTD
FUTUREVISION CONSULTANTS(P)
LTD.10-Dec-13 23-Dec-13 43189649 25.36 13.00
Source: SEBI.
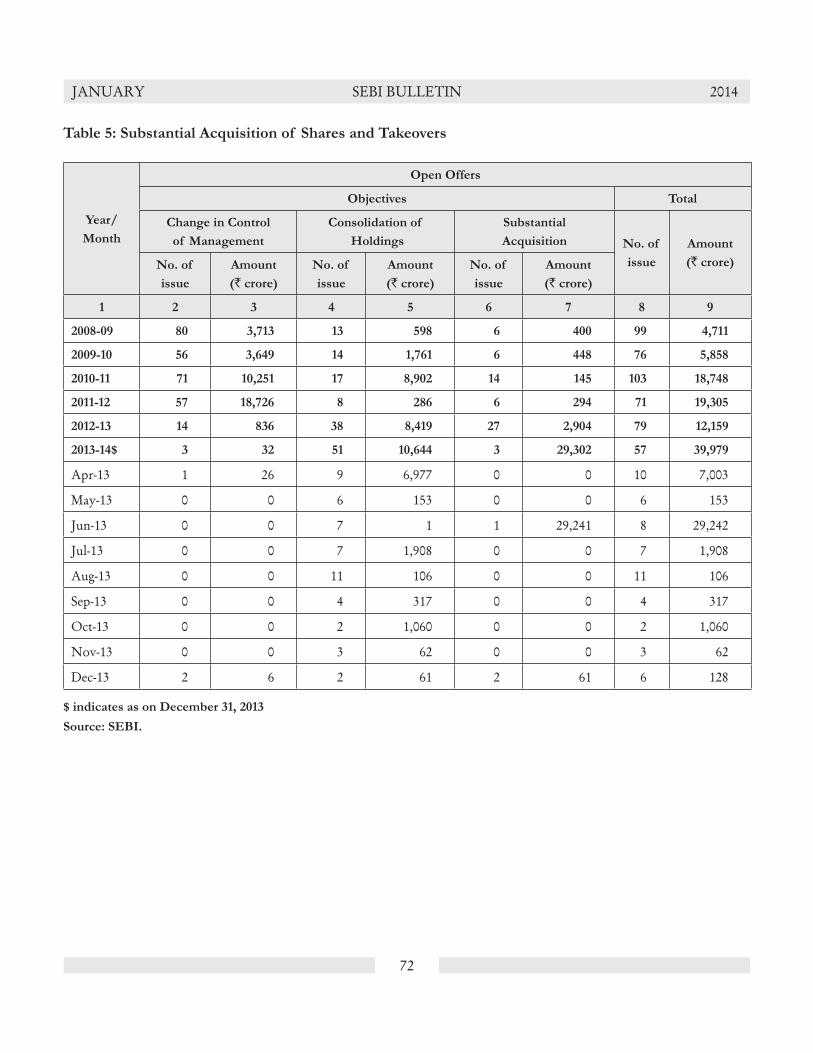
72
JANUARY SEBI BULLETIN 2014
Table 5: Substantial Acquisition of Shares and Takeovers
Year/
Month
Open Offers
Objectives Total
Change in Control
of Management
Consolidation of
Holdings
Substantial
Acquisition No. of
issue
Amount
(` crore)No. of
issue
Amount
(` crore)
No. of
issue
Amount
(` crore)
No. of
issue
Amount
(` crore)
1 2 3 4 5 6 7 8 9
2008-09 80 3,713 13 598 6 400 99 4,711
2009-10 56 3,649 14 1,761 6 448 76 5,858
2010-11 71 10,251 17 8,902 14 145 103 18,748
2011-12 57 18,726 8 286 6 294 71 19,305
2012-13 14 836 38 8,419 27 2,904 79 12,159
2013-14$ 3 32 51 10,644 3 29,302 57 39,979
Apr-13 1 26 9 6,977 0 0 10 7,003
May-13 0 0 6 153 0 0 6 153
Jun-13 0 0 7 1 1 29,241 8 29,242
Jul-13 0 0 7 1,908 0 0 7 1,908
Aug-13 0 0 11 106 0 0 11 106
Sep-13 0 0 4 317 0 0 4 317
Oct-13 0 0 2 1,060 0 0 2 1,060
Nov-13 0 0 3 62 0 0 3 62
Dec-13 2 6 2 61 2 61 6 128
$ indicates as on December 31, 2013
Source: SEBI.
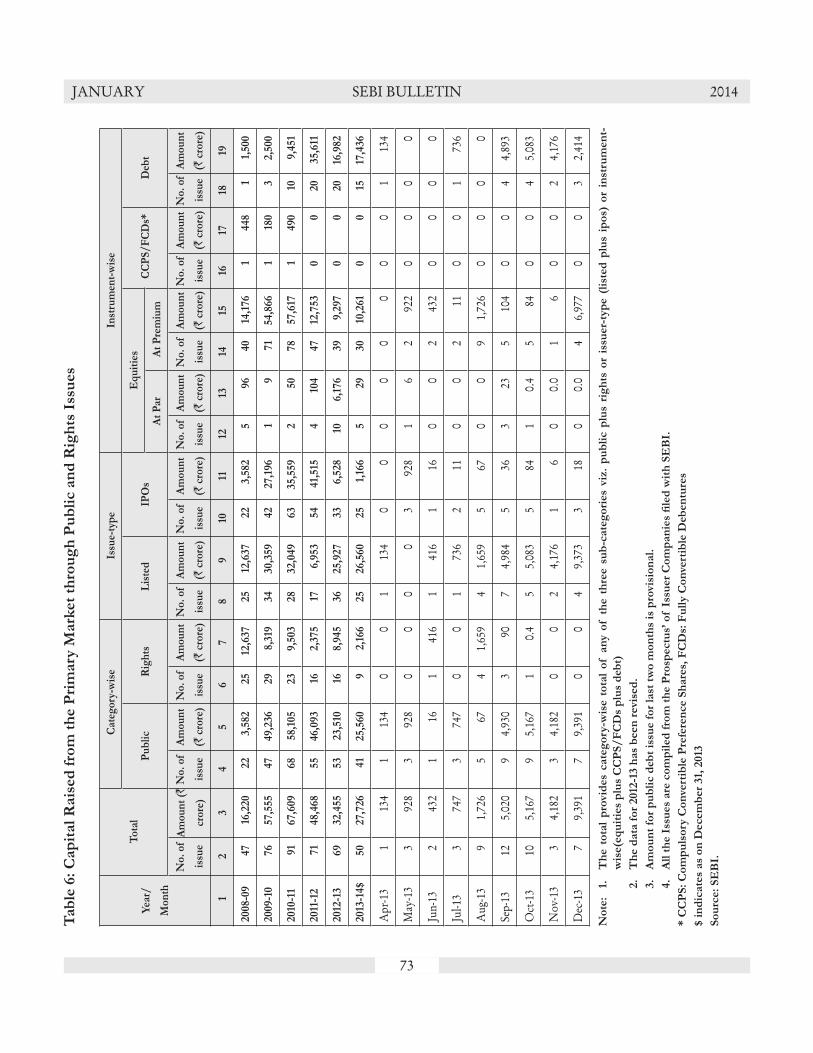
73
JANUARY SEBI BULLETIN 2014T
ab
le 6
: C
ap
ital
Rais
ed
fro
m t
he P
rim
ary
Mark
et
thro
ug
h P
ub
lic a
nd
Rig
hts
Iss
ues
Yea
r/
Mo
nth
To
tal
Cat
ego
ry-w
ise
Issu
e-ty
pe
Inst
rum
ent-
wis
e
Pu
bli
cR
igh
ts L
iste
dIP
Os
Eq
uit
ies
CC
PS
/F
CD
s*D
ebt
At
Par
At
Pre
miu
m
No
. o
f
issu
e
Am
ou
nt
(`
cro
re)
No
. o
f
issu
e
Am
ou
nt
(` c
rore
)
No
. o
f
issu
e
Am
ou
nt
(` c
rore
)
No
. o
f
issu
e
Am
ou
nt
(` c
rore
)
No
. o
f
issu
e
Am
ou
nt
(` c
rore
)
No
. o
f
issu
e
Am
ou
nt
(` c
rore
)
No
. o
f
issu
e
Am
ou
nt
(` c
rore
)
No
. o
f
issu
e
Am
ou
nt
(` c
rore
)
No
. o
f
issu
e
Am
ou
nt
(` c
rore
)
12
34
56
78
910
1112
1314
1516
1718
19
2008
-09
4716
,220
223,
582
2512
,637
2512
,637
223,
582
596
4014
,176
144
81
1,50
0
2009
-10
7657
,555
4749
,236
298,
319
3430
,359
4227
,196
19
7154
,866
118
03
2,50
0
2010
-11
9167
,609
6858
,105
239,
503
2832
,049
6335
,559
250
7857
,617
149
010
9,45
1
2011
-12
7148
,468
5546
,093
162,
375
176,
953
5441
,515
410
447
12,7
530
020
35,6
11
2012
-13
6932
,455
5323
,510
168,
945
3625
,927
336,
528
106,
176
399,
297
00
2016
,982
2013
-14$
5027
,726
4125
,560
92,
166
2526
,560
251,
166
529
3010
,261
00
1517
,436
Apr
-13
113
41
134
00
113
40
00
00
00
01
134
May
-13
392
83
928
00
00
392
81
62
922
00
00
Jun-
132
432
116
141
61
416
116
00
243
20
00
0
Jul-1
33
747
374
70
01
736
211
00
211
00
173
6
Aug
-13
91,
726
567
41,
659
41,
659
567
00
91,
726
00
00
Sep-
1312
5,02
09
4,93
03
907
4,98
45
363
235
104
00
44,
893
Oct
-13
105,
167
95,
167
10.
45
5,08
35
841
0.4
584
00
45,
083
Nov
-13
34,
182
34,
182
00
24,
176
16
00.
01
60
02
4,17
6
Dec
-13
79,
391
79,
391
00
49,
373
318
00.
04
6,97
70
03
2,41
4
No
te:
1.
Th
e t
ota
l p
rovid
es
cate
go
ry-w
ise t
ota
l o
f a
ny o
f t
he t
hre
e s
ub
-cate
go
ries
viz
. p
ub
lic p
lus
rig
hts
or
issu
er-
typ
e (
list
ed
plu
s ip
os)
or
inst
rum
en
t-
wis
e(e
qu
itie
s p
lus
CC
PS
/F
CD
s p
lus
deb
t)
2.
Th
e d
ata
fo
r 2012
-13 h
as
been
revis
ed
.
3.
Am
ou
nt
for
pu
bli
c d
ebt
issu
e f
or
last
tw
o m
on
ths
is p
rovis
ion
al.
4.
All
th
e I
ssu
es
are
co
mp
iled
fro
m t
he P
rosp
ectu
s’ o
f I
ssu
er
Co
mp
an
ies
fi le
d w
ith
SE
BI.
* C
CP
S:
Co
mp
uls
ory
Co
nve
rtib
le P
refe
ren
ce S
hare
s, F
CD
s: F
ull
y C
on
vert
ible
Deb
en
ture
s
$ i
nd
icate
s as
on
Decem
ber
31,
2013
So
urc
e:
SE
BI.

74
JANUARY SEBI BULLETIN 2014
Table 7: Issues Listed on SME Platform
Year/MonthTotal
No. of issue Amount (` crore)
1 2 3
2012-13 24 239
2013-14$ 24 247
Apr-13 0 0
May-13 2 9
Jun-13 1 16
Jul-13 2 11
Aug-13 5 67
Sep-13 5 36
Oct-13 5 84
Nov-13 1 6
Dec-13 3 18
$ indicates as on December 31, 2013
Source: SEBI

75
JANUARY SEBI BULLETIN 2014
Table 8: Industry-wise Classifi cation of Capital Raised through Public and Rights Issues
Industry
2010-11 2011-12 2012-13 2013-14$ Dec-13
No. of
issue
Amount (`crore)
No.
of
issue
Amount (`crore)
No.
of
issue
Amount (`crore)
No.
of
issue
Amount (`crore)
No.
of
issue
Amount (`crore)
1 2 3 4 5 6 7 8 9 10 11
Banking/FIs 18 17,248 20 35,611 7 2,475 1 2,370 2 664
Cement & Construction 3 2,841 2 187 1 9 3 725 0 0
Chemical 5 247 0 0 1 9 0 0 0 0
Electronics 0 0 1 121 0 0 0 0 0 0
Engineering 5 1,394 1 217 2 74 2 25 0 0
Entertainment 4 715 1 89 1 12 2 602 0 0
Finance 3 2,210 10 7,708 16 16,536 19 8,953 0 0
Food Processing 1 1,245 0 0 2 19 0 0 0 0
Health Care 3 292 1 65 2 210 0 0 0 0
Information Technology 1 170 2 138 1 4 1 19 0 0
Paper & Pulp 0 0 2 306 0 0 1 27.75 0 0
Plastic 0 0 1 11 0 0 1 5.94 0 0
Power 4 9,469 0 0 0 0 4 13149.24 2 8,709
Printing 1 52 2 71 0 0 0 0.00 0 0
Telecommunication 0 0 0 0 1 4,173 1 4.53 1 5
Textile 3 207 0 0 4 582 1 3.50 0 0
Others 40 31,519 28 3,943 31 8,352 14 1,841 2 14
Total 91 67,609 71 48,468 69 32,455 50 27,726 7 9,391
Notes: 1. All the public debt issues are included in Banking/FIs
$ indicates as on December 31, 2013
Source: SEBI.
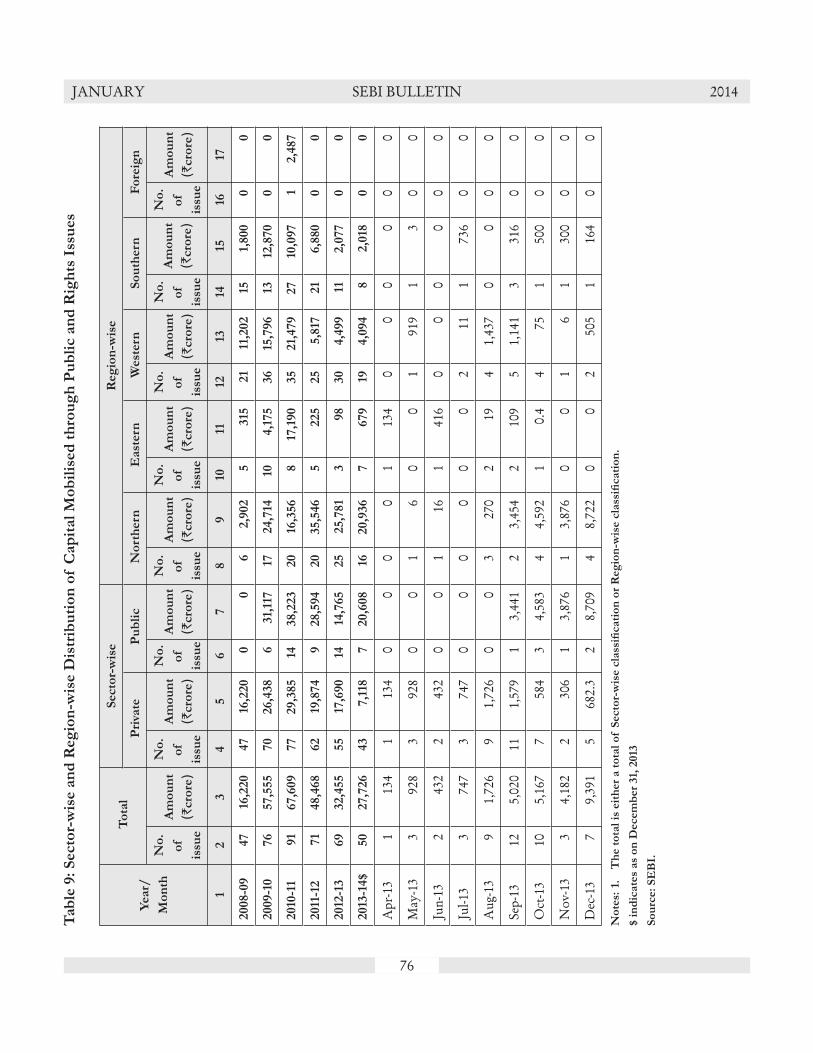
76
JANUARY SEBI BULLETIN 2014T
ab
le 9
: S
ecto
r-w
ise a
nd
Reg
ion
-wis
e D
istr
ibu
tio
n o
f C
ap
ital
Mo
bil
ised
th
rou
gh
Pu
bli
c a
nd
Rig
hts
Iss
ues
Year/
Mo
nth
To
tal
Secto
r-w
ise
Reg
ion
-wis
e
Pri
vate
Pu
bli
c N
ort
hern
East
ern
West
ern
So
uth
ern
Fo
reig
n
No
.
of
issu
e
Am
ou
nt
(`cro
re)
No
.
of
issu
e
Am
ou
nt
(`cro
re)
No
.
of
issu
e
Am
ou
nt
(`cro
re)
No
.
of
issu
e
Am
ou
nt
(`cro
re)
No
.
of
issu
e
Am
ou
nt
(`cro
re)
No
.
of
issu
e
Am
ou
nt
(`cro
re)
No
.
of
issu
e
Am
ou
nt
(`cro
re)
No
.
of
issu
e
Am
ou
nt
(`cro
re)
12
34
56
78
910
1112
1314
1516
17
2008-0
947
16,2
20
47
16,2
20
00
62,9
02
5315
21
11,2
02
151,
800
00
2009-1
076
57,5
55
70
26,4
38
631,
117
1724,7
1410
4,1
75
36
15,7
96
1312
,870
00
2010
-11
91
67,6
09
77
29,3
85
1438,2
23
20
16,3
56
817
,190
35
21,
479
27
10,0
97
12,4
87
2011
-12
71
48,4
68
62
19,8
74
928,5
94
20
35,5
46
5225
25
5,8
1721
6,8
80
00
2012
-13
69
32,4
55
55
17,6
90
1414
,765
25
25,7
81
398
30
4,4
99
112,0
77
00
2013
-14$
50
27,7
26
43
7,1
187
20,6
08
1620,9
36
7679
194,0
94
82,0
180
0
Apr
-13
113
41
134
00
00
113
40
00
00
0
May
-13
392
83
928
00
16
00
191
91
30
0
Jun-
132
432
243
20
01
161
416
00
00
00
Jul-1
33
747
374
70
00
00
02
111
736
00
Aug
-13
91,
726
91,
726
00
327
02
194
1,43
70
00
0
Sep-
1312
5,02
011
1,57
91
3,44
12
3,45
42
109
51,
141
331
60
0
Oct
-13
105,
167
758
43
4,58
34
4,59
21
0.4
475
150
00
0
Nov
-13
34,
182
230
61
3,87
61
3,87
60
01
61
300
00
Dec
-13
79,
391
568
2.3
28,
709
48,
722
00
250
51
164
00
No
tes:
1.
Th
e t
ota
l is
eit
her
a t
ota
l o
f S
ecto
r-w
ise c
lass
ifi c
ati
on
or
Reg
ion
-wis
e c
lass
ifi c
ati
on
.
$ i
nd
icate
s as
on
Decem
ber
31,
2013
So
urc
e:
SE
BI.
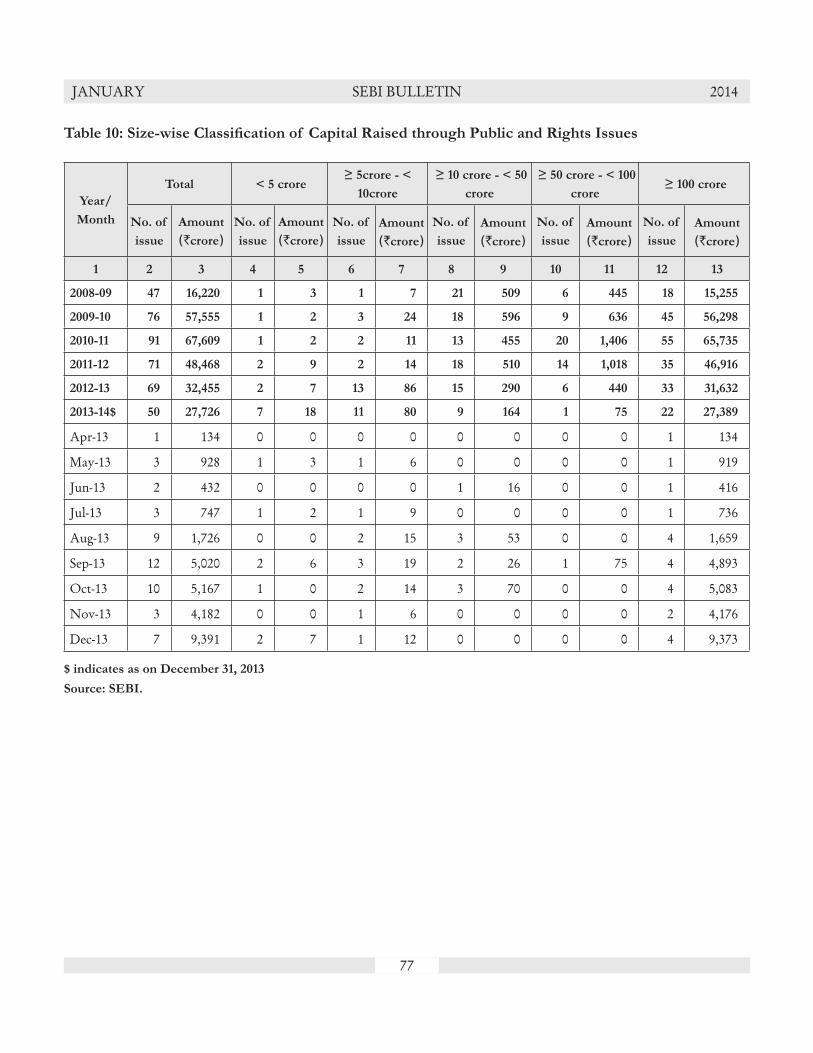
77
JANUARY SEBI BULLETIN 2014
Table 10: Size-wise Classifi cation of Capital Raised through Public and Rights Issues
Year/
Month
Total < 5 crore≥ 5crore - <
10crore
≥ 10 crore - < 50
crore
≥ 50 crore - < 100
crore ≥ 100 crore
No. of
issue
Amount
(`crore)No. of
issue
Amount
(`crore)No. of
issue
Amount (`crore)
No. of
issue
Amount (`crore)
No. of
issue
Amount (`crore)
No. of
issue
Amount (`crore)
1 2 3 4 5 6 7 8 9 10 11 12 13
2008-09 47 16,220 1 3 1 7 21 509 6 445 18 15,255
2009-10 76 57,555 1 2 3 24 18 596 9 636 45 56,298
2010-11 91 67,609 1 2 2 11 13 455 20 1,406 55 65,735
2011-12 71 48,468 2 9 2 14 18 510 14 1,018 35 46,916
2012-13 69 32,455 2 7 13 86 15 290 6 440 33 31,632
2013-14$ 50 27,726 7 18 11 80 9 164 1 75 22 27,389
Apr-13 1 134 0 0 0 0 0 0 0 0 1 134
May-13 3 928 1 3 1 6 0 0 0 0 1 919
Jun-13 2 432 0 0 0 0 1 16 0 0 1 416
Jul-13 3 747 1 2 1 9 0 0 0 0 1 736
Aug-13 9 1,726 0 0 2 15 3 53 0 0 4 1,659
Sep-13 12 5,020 2 6 3 19 2 26 1 75 4 4,893
Oct-13 10 5,167 1 0 2 14 3 70 0 0 4 5,083
Nov-13 3 4,182 0 0 1 6 0 0 0 0 2 4,176
Dec-13 7 9,391 2 7 1 12 0 0 0 0 4 9,373
$ indicates as on December 31, 2013
Source: SEBI.

78
JANUARY SEBI BULLETIN 2014
Table 11: Capital Raised by Listed Companies from the Primary Market through QIPs
Year/Month
NSE BSE Common Total
No. of
issues
Amount (`crore)
No. of
issues
Amount (`crore)
No. of
issues
Amount (`crore)
No. of
issues
Amount (`crore)
1 2 3 4 5 6 7 8 9
2010-11 10 2,802 3 90 46 22,959 59 25,850
2011-12 1 8 1 40 14 1 2,114 16 1 2,163
2012-13 1 950 1 160 43 2 14,885 45 2 15,996
2013-14$ 1 160 0 0 13 5,323 14 5,483
Apr-13 1 160 0 0 3 3 227 4 3 387
May-13 0 0 0 0 5 4 2,833 5 4 2,833
Jun-13 0 0 0 0 2 5 1,066 2 5 1,066
Jul-13 0 0 0 0 2 6 918 2 6 918
Aug-13 0 0 0 0 0 0 0 0
Sep-13 0 0 0 0 0 0 0 0
Oct-13 0 0 0 0 0 0 0 0
Nov-13 0 0 0 0 0 0 0 0
Dec-13 0 0 0 0 1 7 280 1 7 280
Notes: 1. The above data includes both "no. of issues" and "Amount" raised on conversion of convertible securities issued on QIP
basis.1 Includes one issue of Institutional Placement Programme (Issue Size of ` 470.74 crore).2 Includes two issues of Institutional Placement Programme (Issue Size of ` 940.8 crore).3 Includes two issues of Institutional Placement Programme (Issue Size of ` 156.77 crore).4 Includes four issue of Institutional Placement Programme (Issue Size of `2561.47 crore).5 Includes two issue of Institutional Placement Programme (Issue Size of `1066 crore).6 Includes one issue of Institutional Placement Programme (Issue Size of `37.05 crore).7 Includes one Institutional Placement Programme issue (Issue Size of `279.55 crore).
$ indicates as on December 31, 2013
Source: BSE and NSE.

79
JANUARY SEBI BULLETIN 2014
Table 12 : Preferential Allotments Listed at BSE and NSE
Year/
Month
NSE BSE Common Total
No.of
issues
Amount (`crore)
No.of
issues
Amount (`crore)
No.of
issues
Amount (`crore)
No.of
issues
Amount (`crore)
1 2 3 4 5 6 7 8 9
2010-11 83 1,393 156 12,072 134 17,046 373 30,511
2011-12 133 2,820 88 4,166 90 18,723 311 25,709
2012-13 188 7,442 87 12,729 145 26,768 420 46,939
2013-14$ 165 3,027 21 713 116 38,811 302 42,551
Apr-13 21 659 3 42 13 11,143 37 11,844
May-13 24 403 0 0 32 3,767 56 4,170
Jun-13 20 179 0 0 13 11,699 33 11,878
Jul-13 15 371 2 88 10 1,147 27 1,605
Aug-13 24 178 4 431 7 453 35 1,062
Sep-13 17 323 4 71 11 532 32 926
Oct-13 20 367 4 63 7 2,935 31 3,366
Nov-13 14 132 1 2 9 622 24 756
Dec-13 10 414 3 17 14 6,512 27 6,943
$ indicates as on December 31, 2013
Source: BSE and NSE.

80
JANUARY SEBI BULLETIN 2014
Table 13: Private Placement of Corporate Debt Reported to BSE and NSE
Year/
Month
NSE BSE Common Total
No. of
Issues
Amount (`crore)
No. of
Issues
Amount (`crore)
No. of
Issues
Amount (`crore)
No. of
Issues
Amount (`crore)
1 2 3 4 5 6 7 8 9
2007-08 580 90,718 120 11,711 44 16,056 744 1,18,485
2008-09 699 1,24,810 285 17,045 57 31,426 1,041 1,73,281
2009-10 647 1,43,286 597 49,739 34 19,610 1,278 2,12,635
2010-11 774 1,53,370 591 52,591 39 12,825 1,404 2,18,785
2011-12 1,152 1,89,803 783 56,974 18 14,505 1,953 2,61,282
2012-13 1,295 2,06,187 1,094 72,474 100 82,801 2,489 3,61,462
2013-14$ 581 98,708 722 61,983 70 41,147 1,373 2,01,838
Apr-13 78 19,134 114 11,298 14 11,380 206 41,812
May-13 112 17,651 113 8,788 11 7,320 236 33,759
Jun-13 149 20,145 67 10,282 6 4,787 222 35,214
Jul-13 48 4,549 84 7,273 9 360 141 12,182
Aug-13 15 595 37 1,344 3 150 55 2,089
Sep-13 44 7,800 81 7,614 3 2,350 128 17,763
Oct-13 61 13,533 81 5,315 8 4,720 150 23,567
Nov-13 36 3,127 50 2,070 6 5,978 92 11,175
Dec-13 38 12,175 95 8,000 10 4,102 143 24,277
$ indicates as on December 31, 2013
Source: SEBI
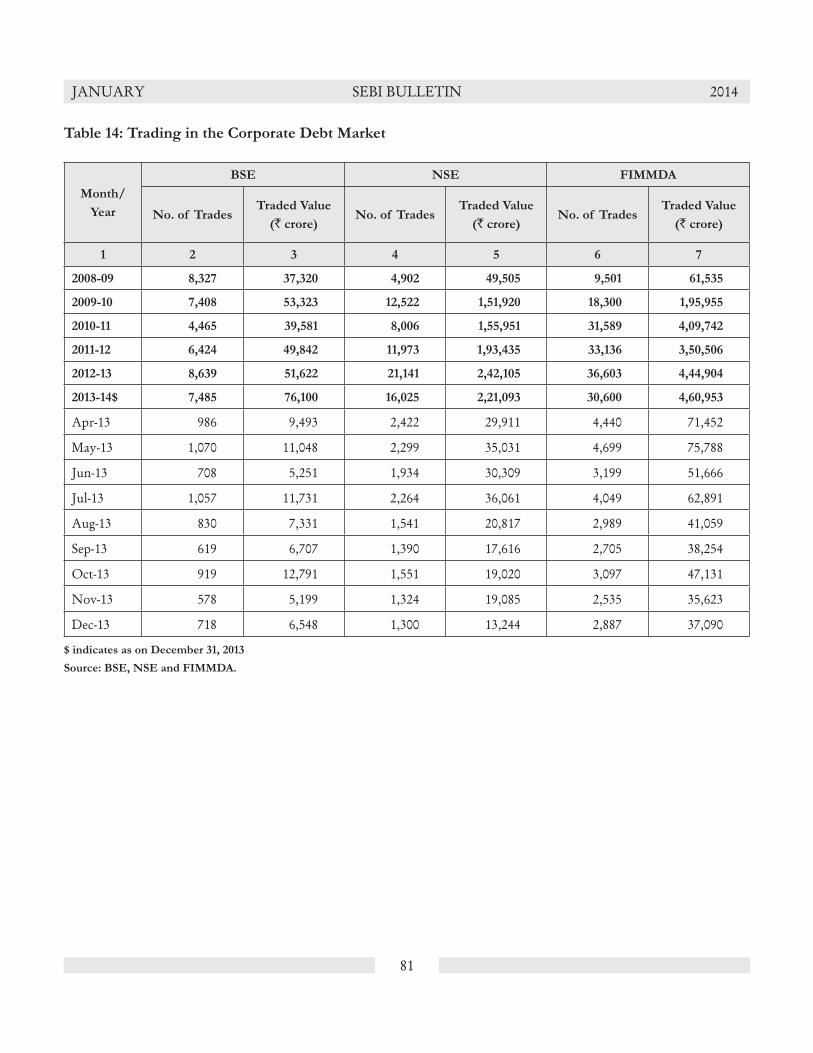
81
JANUARY SEBI BULLETIN 2014
Table 14: Trading in the Corporate Debt Market
Month/
Year
BSE NSE FIMMDA
No. of TradesTraded Value
(` crore)No. of Trades
Traded Value
(` crore)No. of Trades
Traded Value
(` crore)
1 2 3 4 5 6 7
2008-09 8,327 37,320 4,902 49,505 9,501 61,535
2009-10 7,408 53,323 12,522 1,51,920 18,300 1,95,955
2010-11 4,465 39,581 8,006 1,55,951 31,589 4,09,742
2011-12 6,424 49,842 11,973 1,93,435 33,136 3,50,506
2012-13 8,639 51,622 21,141 2,42,105 36,603 4,44,904
2013-14$ 7,485 76,100 16,025 2,21,093 30,600 4,60,953
Apr-13 986 9,493 2,422 29,911 4,440 71,452
May-13 1,070 11,048 2,299 35,031 4,699 75,788
Jun-13 708 5,251 1,934 30,309 3,199 51,666
Jul-13 1,057 11,731 2,264 36,061 4,049 62,891
Aug-13 830 7,331 1,541 20,817 2,989 41,059
Sep-13 619 6,707 1,390 17,616 2,705 38,254
Oct-13 919 12,791 1,551 19,020 3,097 47,131
Nov-13 578 5,199 1,324 19,085 2,535 35,623
Dec-13 718 6,548 1,300 13,244 2,887 37,090
$ indicates as on December 31, 2013
Source: BSE, NSE and FIMMDA.
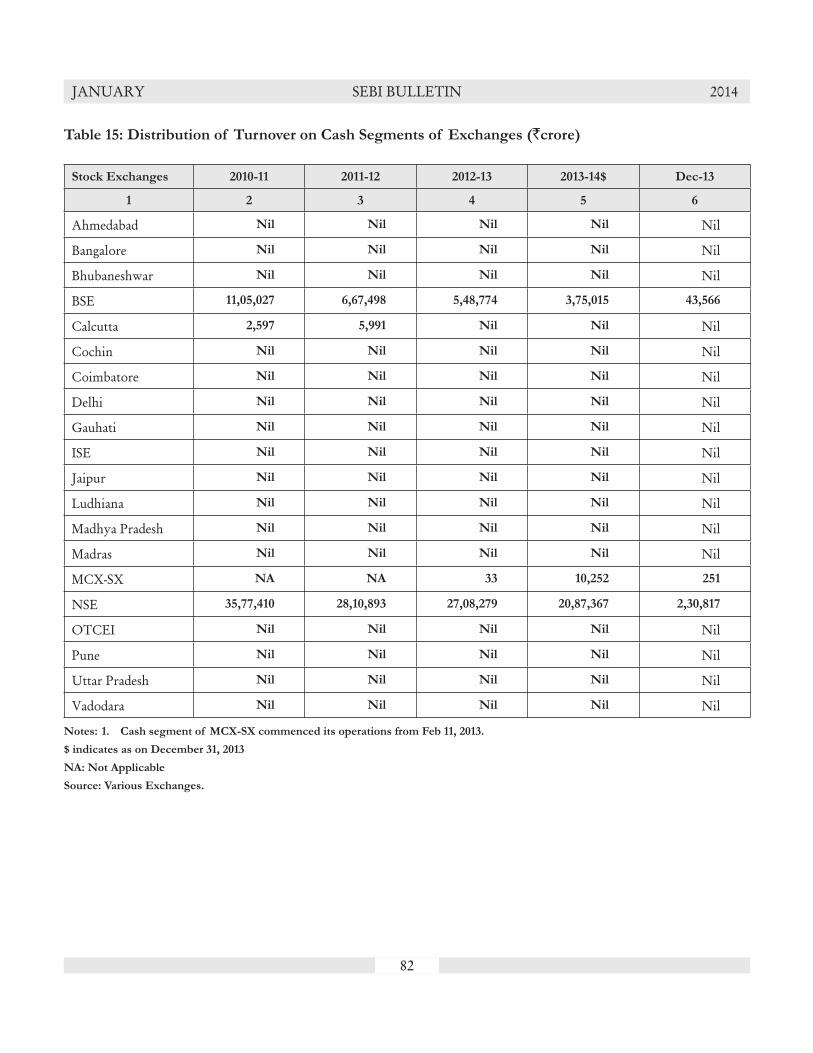
82
JANUARY SEBI BULLETIN 2014
Table 15: Distribution of Turnover on Cash Segments of Exchanges (`crore)
Stock Exchanges 2010-11 2011-12 2012-13 2013-14$ Dec-13
1 2 3 4 5 6
Ahmedabad Nil Nil Nil Nil Nil
Bangalore Nil Nil Nil Nil Nil
Bhubaneshwar Nil Nil Nil Nil Nil
BSE 11,05,027 6,67,498 5,48,774 3,75,015 43,566
Calcutta 2,597 5,991 Nil Nil Nil
Cochin Nil Nil Nil Nil Nil
Coimbatore Nil Nil Nil Nil Nil
Delhi Nil Nil Nil Nil Nil
Gauhati Nil Nil Nil Nil Nil
ISE Nil Nil Nil Nil Nil
Jaipur Nil Nil Nil Nil Nil
Ludhiana Nil Nil Nil Nil Nil
Madhya Pradesh Nil Nil Nil Nil Nil
Madras Nil Nil Nil Nil Nil
MCX-SX NA NA 33 10,252 251
NSE 35,77,410 28,10,893 27,08,279 20,87,367 2,30,817
OTCEI Nil Nil Nil Nil Nil
Pune Nil Nil Nil Nil Nil
Uttar Pradesh Nil Nil Nil Nil Nil
Vadodara Nil Nil Nil Nil Nil
Notes: 1. Cash segment of MCX-SX commenced its operations from Feb 11, 2013.
$ indicates as on December 31, 2013
NA: Not Applicable
Source: Various Exchanges.

83
JANUARY SEBI BULLETIN 2014T
ab
le 1
6:
Cash
Seg
men
t o
f B
SE
Year/
Mo
nth
No
. o
f
Co
mp
an
ies
Lis
ted
No
. o
f
Co
mp
an
ies
Perm
itte
d*
No
. o
f
co
mp
an
ies
trad
ed
No
. o
f
Tra
din
g
Days
No
. o
f
Tra
des
(Lak
h)
Tra
ded
Qu
an
tity
(Lak
h)
Tu
rno
ver
(` c
rore
)
Ave
rag
e
Dail
y
Tu
rno
ver
(` c
rore
)
Ave
rag
e
Tra
de S
ize
(`)
Dem
at
Secu
riti
es
Tra
ded
(Lak
h)
Dem
at
Tu
rno
ver
(` c
rore
)
Mark
et
Cap
i-
tali
sati
on
(` c
rore
)
BS
E S
&P
Sen
sex
Hig
hL
ow
Clo
se
12
34
56
78
910
1112
1314
1516
2008-0
94,9
29
66
3,1
94
243
5,4
08
7,3
9,6
00
11,0
0,0
74
4,5
27
20,3
42
7,3
9,2
87
10,9
9,8
71
30,8
6,0
75
17735.7
7697.4
9708.5
2009-1
04,9
75
86
3,2
97
244
6,0
56
11,3
6,5
1313
,78,8
09
5,6
51
22,7
68
11,3
5,7
50
13,7
8,5
29
61,
65,6
1917
793.0
9546.3
17527.8
2010
-11
5,0
67
91
2,9
33
255
5,2
85
9,9
0,7
77
11,0
5,0
27
4,3
33
20,9
109,8
9,9
99
11,0
3,9
78
68,3
9,0
84
211
08.6
15960.2
19445.2
2011
-12
5,1
33
95
2,9
77
249
3,9
44
6,5
4,1
37
6,6
7,4
98
2,6
81
16,9
25
6,5
3,4
45
6,6
6,7
61
62,1
4,9
41
19811
.115
135.9
17404.2
2012
-13
5,2
1176
2,8
67
250
3,2
35
5,6
7,2
20
5,4
8,7
74
2,1
95
16,9
63
5,6
7,1
25
5,4
8,7
25
63,8
7,8
87
20203.7
15749.0
18835.8
2013
-14$
5,2
94
92
2,6
82
188
2,6
79
3,3
7,1
57
3,7
5,0
151,
995
13,9
97
3,3
7,1
57
3,7
5,0
1570,4
4,2
58
214
83.7
17448.7
211
70.7
Apr
-13
5,22
493
2,44
720
220
35,2
6940
,980
2,04
918
,615
35,2
6940
,980
66,4
5,78
519
622.
718
144.
219
504.
2
May
-13
5,23
093
2,46
423
241
40,3
4849
,996
2,17
420
,713
40,3
4849
,996
66,7
8,73
720
443.
619
451.
319
760.
3
Jun-
135,
241
932,
478
2024
533
,324
36,3
771,
819
14,8
2633
,324
36,3
7764
,05,
118
1986
0.2
1846
7.2
1939
5.8
Jul-1
35,
249
922,
339
2334
337
,643
41,5
351,
806
12,1
1837
,643
41,5
3562
,63,
106
2035
1.1
1912
6.8
1934
5.7
Aug
-13
5,25
792
2,37
220
340
35,4
1240
,876
2,04
412
,014
35,4
1240
,876
60,3
0,07
819
569.
217
448.
718
619.
7
Sep-
135,
267
922,
389
2031
936
,376
39,8
981,
995
12,5
2136
,376
39,8
9863
,86,
134
2073
9.7
1816
6.2
1937
9.8
Oct
-13
5,27
792
2,62
121
328
40,1
3541
,018
1,95
312
,504
40,1
3541
,018
68,4
4,23
321
205.
419
264.
721
164.
5
Nov
-13
5,28
692
2,63
620
315
36,5
4740
,768
2,03
812
,951
36,5
4740
,768
68,1
0,47
521
321.
520
137.
720
791.
9
Dec
-13
5,29
492
2,68
221
328
42,1
0243
,566
2,07
513
,288
42,1
0243
,566
70,4
4,25
821
483.
720
568.
721
170.
7
* E
xclu
din
g M
utu
al
Fu
nd
Sch
em
es
fro
m F
eb 2
013
.
$ i
nd
icate
s as
on
Decem
ber
31,
2013
So
urc
e:
BS
E .
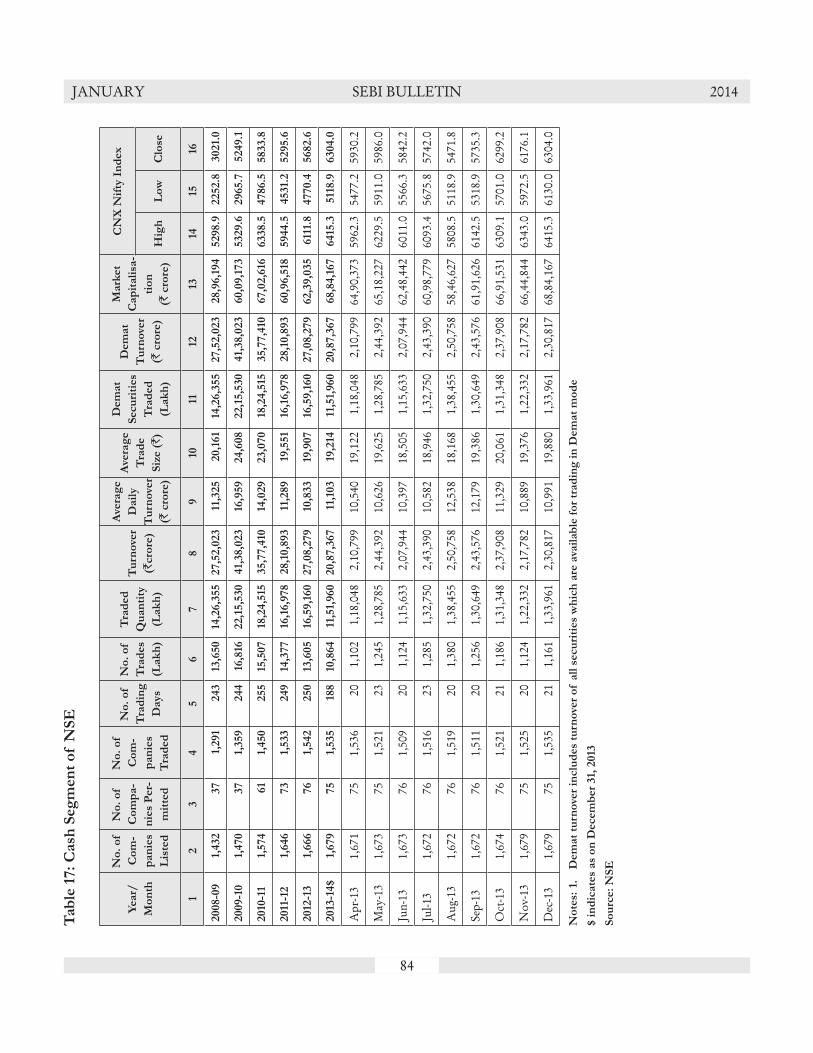
84
JANUARY SEBI BULLETIN 2014T
ab
le 1
7:
Cash
Seg
men
t o
f N
SE
Year/
Mo
nth
No
. o
f
Co
m-
pan
ies
Lis
ted
No
. o
f
Co
mp
a-
nie
s P
er-
mit
ted
No
. o
f
Co
m-
pan
ies
Tra
ded
No
. o
f
Tra
din
g
Days
No
. o
f
Tra
des
(Lak
h)
Tra
ded
Qu
an
tity
(Lak
h)
Tu
rno
ver
(`cro
re)
Ave
rag
e
Dail
y
Tu
rno
ver
(` c
rore
)
Ave
rag
e
Tra
de
Siz
e (`)
Dem
at
Secu
riti
es
Tra
ded
(Lak
h)
Dem
at
Tu
rno
ver
(` c
rore
)
Mark
et
Cap
itali
sa-
tio
n
(` c
rore
)
CN
X N
ifty
In
dex
Hig
hL
ow
Clo
se
12
34
56
78
910
1112
1314
1516
2008-0
91,
432
37
1,291
243
13,6
50
14,2
6,3
55
27,5
2,0
23
11,3
25
20,1
61
14,2
6,3
55
27,5
2,0
23
28,9
6,1
94
5298.9
2252.8
3021.
0
2009-1
01,
470
37
1,359
244
16,8
1622,1
5,5
30
41,
38,0
23
16,9
59
24,6
08
22,1
5,5
30
41,
38,0
23
60,0
9,1
73
5329.6
2965.7
5249.1
2010
-11
1,574
61
1,450
255
15,5
07
18,2
4,5
1535,7
7,4
1014
,029
23,0
70
18,2
4,5
1535,7
7,4
1067,0
2,6
166338.5
4786.5
5833.8
2011
-12
1,646
73
1,533
249
14,3
77
16,1
6,9
78
28,1
0,8
93
11,2
89
19,5
51
16,1
6,9
78
28,1
0,8
93
60,9
6,5
185944.5
4531.
25295.6
2012
-13
1,666
76
1,542
250
13,6
05
16,5
9,1
60
27,0
8,2
79
10,8
33
19,9
07
16,5
9,1
60
27,0
8,2
79
62,3
9,0
35
611
1.8
4770.4
5682.6
2013
-14$
1,679
75
1,535
188
10,8
64
11,5
1,960
20,8
7,3
67
11,1
03
19,2
1411
,51,
960
20,8
7,3
67
68,8
4,1
67
6415
.3511
8.9
6304.0
Apr
-13
1,67
175
1,53
620
1,10
21,
18,0
482,
10,7
9910
,540
19,1
221,
18,0
482,
10,7
9964
,90,
373
5962
.354
77.2
5930
.2
May
-13
1,67
375
1,52
123
1,24
51,
28,7
852,
44,3
9210
,626
19,6
251,
28,7
852,
44,3
9265
,18,
227
6229
.559
11.0
5986
.0
Jun-
131,
673
761,
509
201,
124
1,15
,633
2,07
,944
10,3
9718
,505
1,15
,633
2,07
,944
62,4
8,44
260
11.0
5566
.358
42.2
Jul-1
31,
672
761,
516
231,
285
1,32
,750
2,43
,390
10,5
8218
,946
1,32
,750
2,43
,390
60,9
8,77
960
93.4
5675
.857
42.0
Aug
-13
1,67
276
1,51
920
1,38
01,
38,4
552,
50,7
5812
,538
18,1
681,
38,4
552,
50,7
5858
,46,
627
5808
.551
18.9
5471
.8
Sep-
131,
672
761,
511
201,
256
1,30
,649
2,43
,576
12,1
7919
,386
1,30
,649
2,43
,576
61,9
1,62
661
42.5
5318
.957
35.3
Oct
-13
1,67
476
1,52
121
1,18
61,
31,3
482,
37,9
0811
,329
20,0
611,
31,3
482,
37,9
0866
,91,
531
6309
.157
01.0
6299
.2
Nov
-13
1,67
975
1,52
520
1,12
41,
22,3
322,
17,7
8210
,889
19,3
761,
22,3
322,
17,7
8266
,44,
844
6343
.059
72.5
6176
.1
Dec
-13
1,67
975
1,53
521
1,16
11,
33,9
612,
30,8
1710
,991
19,8
801,
33,9
612,
30,8
1768
,84,
167
6415
.361
30.0
6304
.0
No
tes:
1.
Dem
at
turn
ove
r in
clu
des
turn
ove
r o
f a
ll s
ecu
riti
es
wh
ich
are
ava
ilab
le f
or
trad
ing
in
Dem
at
mo
de
$ i
nd
icate
s as
on
Decem
ber
31,
2013
So
urc
e:
NS
E
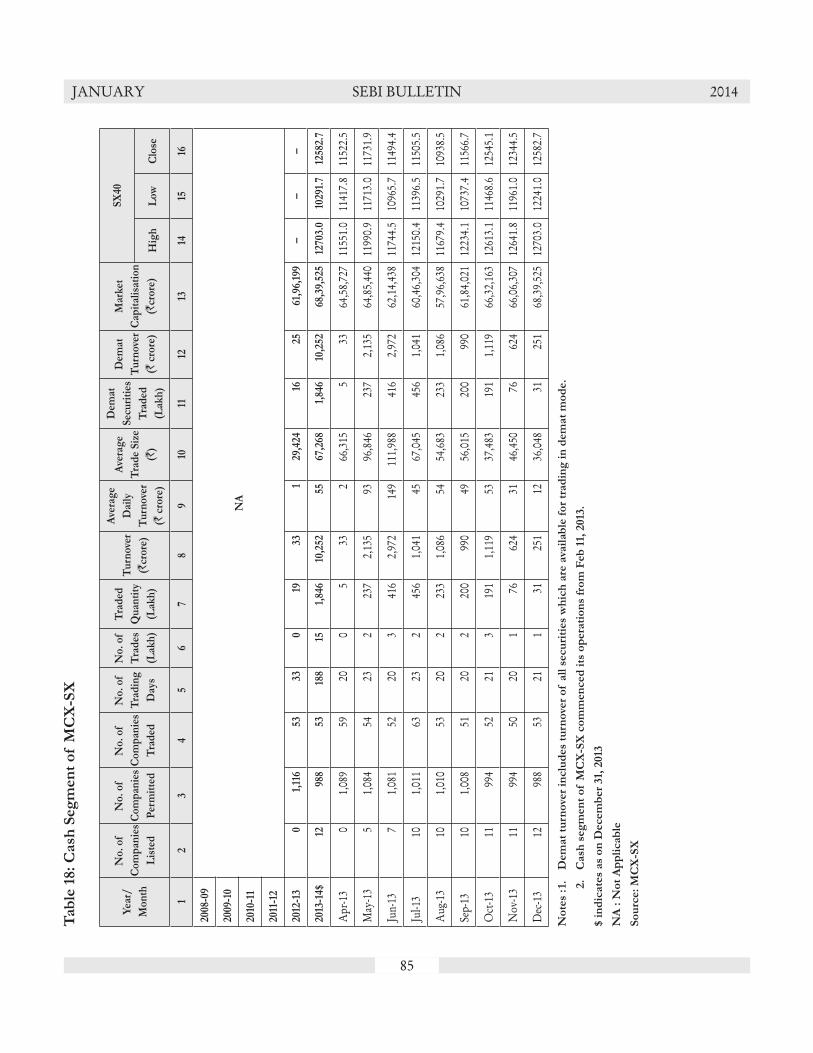
85
JANUARY SEBI BULLETIN 2014T
ab
le 1
8:
Cash
Seg
men
t o
f M
CX
-SX
Yea
r/
Mo
nth
No
. o
f
Co
mp
anie
s
Lis
ted
No
. o
f
Co
mp
anie
s
Per
mit
ted
No
. o
f
Co
mp
anie
s
Tra
ded
No
. o
f
Tra
din
g
Day
s
No
. o
f
Tra
des
(Lak
h)
Tra
ded
Qu
anti
ty
(Lak
h)
Tu
rno
ver
(`cr
ore
)
Ave
rag
e
Dai
ly
Tu
rno
ver
(` c
rore
)
Ave
rag
e
Tra
de
Siz
e
(`)
Dem
at
Sec
uri
ties
Tra
ded
(Lak
h)
Dem
at
Tu
rno
ver
(` c
rore
)
Mar
ket
Cap
ital
isat
ion
(`cr
ore
)
SX
40
Hig
hL
ow
Clo
se
12
34
56
78
910
1112
1314
1516
2008
-09
NA
2009
-10
2010
-11
2011
-12
2012
-13
01,
116
5333
019
331
29,4
2416
2561
,96,
199
––
–
2013
-14$
1298
853
188
151,
846
10,2
5255
67,2
681,
846
10,2
5268
,39,
525
1270
3.0
1029
1.7
1258
2.7
Apr
-13
01,
089
5920
05
332
66,3
155
3364
,58,
727
1155
1.0
1141
7.8
1152
2.5
May
-13
51,
084
5423
223
72,
135
9396
,846
237
2,13
564
,85,
440
1199
0.9
1171
3.0
1173
1.9
Jun-
137
1,08
152
203
416
2,97
214
911
1,98
841
62,
972
62,1
4,43
811
744.
510
965.
711
494.
4
Jul-1
310
1,01
163
232
456
1,04
145
67,0
4545
61,
041
60,4
6,30
412
150.
411
396.
511
505.
5
Aug
-13
101,
010
5320
223
31,
086
5454
,683
233
1,08
657
,96,
638
1167
9.4
1029
1.7
1093
8.5
Sep-
1310
1,00
851
202
200
990
4956
,015
200
990
61,8
4,02
112
234.
110
737.
411
566.
7
Oct
-13
1199
452
213
191
1,11
953
37,4
8319
11,
119
66,3
2,16
312
613.
111
468.
612
545.
1
Nov
-13
1199
450
201
7662
431
46,4
5076
624
66,0
6,30
712
641.
811
961.
012
344.
5
Dec
-13
1298
853
211
3125
112
36,0
4831
251
68,3
9,52
512
703.
012
241.
012
582.
7
No
tes
: 1.
Dem
at
turn
ove
r in
clu
des
turn
ove
r o
f a
ll s
ecu
riti
es
wh
ich
are
ava
ilab
le f
or
trad
ing
in
dem
at
mo
de.
2.
Cash
seg
men
t o
f M
CX
-SX
co
mm
en
ced
its
op
era
tio
ns
fro
m F
eb 1
1, 2
013
.
$ i
nd
icate
s as
on
Decem
ber
31,
2013
NA
: N
ot
Ap
pli
cab
le
So
urc
e:
MC
X-S
X
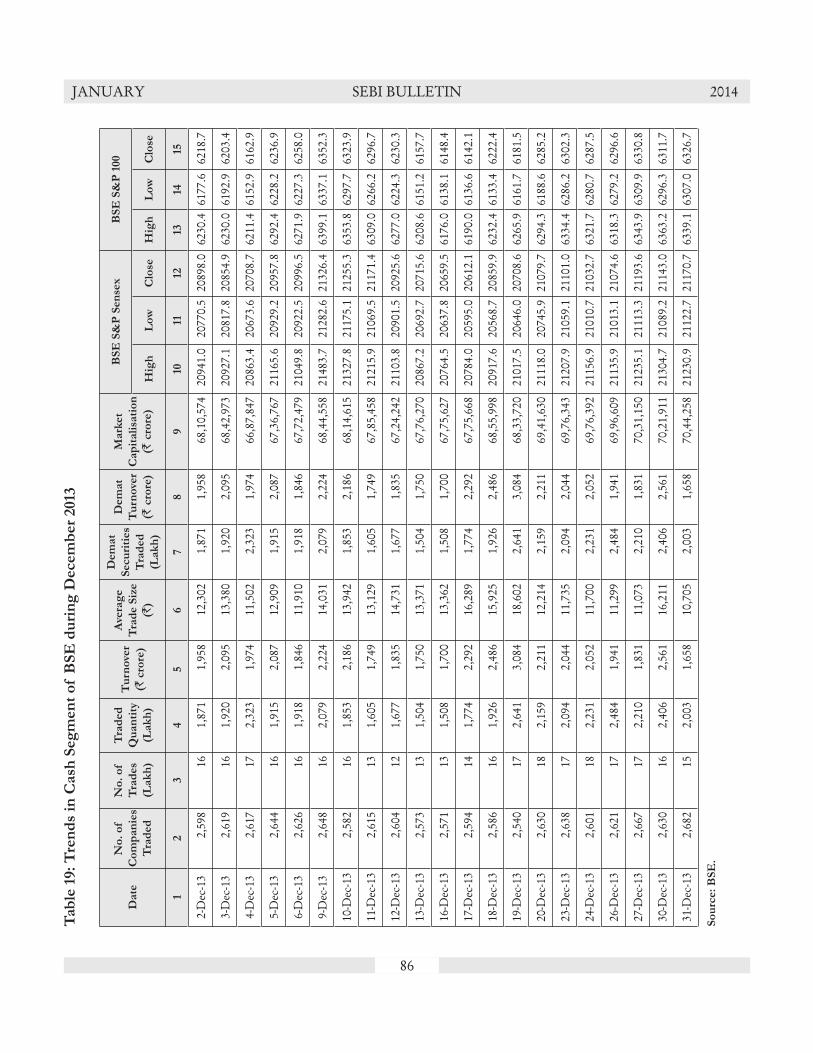
86
JANUARY SEBI BULLETIN 2014T
ab
le 1
9:
Tre
nd
s in
Cash
Seg
men
t o
f B
SE
du
rin
g D
ecem
ber
2013
Date
No
. o
f
Co
mp
an
ies
Tra
ded
No
. o
f
Tra
des
(Lak
h)
Tra
ded
Qu
an
tity
(Lak
h)
Tu
rno
ver
(` c
rore
)
Ave
rag
e
Tra
de S
ize
(`)
Dem
at
Secu
riti
es
Tra
ded
(Lak
h)
Dem
at
Tu
rno
ver
(` c
rore
)
Mark
et
Cap
itali
sati
on
(` c
rore
)
BS
E S
&P
Sen
sex
BS
E S
&P
100
Hig
hL
ow
Clo
seH
igh
Lo
wC
lose
12
34
56
78
910
1112
1314
15
2-D
ec-1
32,
598
161,
871
1,95
812
,302
1,87
11,
958
68,1
0,57
420
941.
020
770.
520
898.
062
30.4
6177
.662
18.7
3-D
ec-1
32,
619
161,
920
2,09
513
,380
1,92
02,
095
68,4
2,97
320
927.
120
817.
820
854.
962
30.0
6192
.962
03.4
4-D
ec-1
32,
617
172,
323
1,97
411
,502
2,32
31,
974
66,8
7,84
720
863.
420
673.
620
708.
762
11.4
6152
.961
62.9
5-D
ec-1
32,
644
161,
915
2,08
712
,909
1,91
52,
087
67,3
6,76
721
165.
620
929.
220
957.
862
92.4
6228
.262
36.9
6-D
ec-1
32,
626
161,
918
1,84
611
,910
1,91
81,
846
67,7
2,47
921
049.
820
922.
520
996.
562
71.9
6227
.362
58.0
9-D
ec-1
32,
648
162,
079
2,22
414
,031
2,07
92,
224
68,4
4,55
821
483.
721
282.
621
326.
463
99.1
6337
.163
52.3
10-D
ec-1
32,
582
161,
853
2,18
613
,942
1,85
32,
186
68,1
4,61
521
327.
821
175.
121
255.
363
53.8
6297
.763
23.9
11-D
ec-1
32,
615
131,
605
1,74
913
,129
1,60
51,
749
67,8
5,45
821
215.
921
069.
521
171.
463
09.0
6266
.262
96.7
12-D
ec-1
32,
604
121,
677
1,83
514
,731
1,67
71,
835
67,2
4,24
221
103.
820
901.
520
925.
662
77.0
6224
.362
30.3
13-D
ec-1
32,
573
131,
504
1,75
013
,371
1,50
41,
750
67,7
6,27
020
867.
220
692.
720
715.
662
08.6
6151
.261
57.7
16-D
ec-1
32,
571
131,
508
1,70
013
,362
1,50
81,
700
67,7
5,62
720
764.
520
637.
820
659.
561
76.0
6138
.161
48.4
17-D
ec-1
32,
594
141,
774
2,29
216
,289
1,77
42,
292
67,7
5,66
820
784.
020
595.
020
612.
161
90.0
6136
.661
42.1
18-D
ec-1
32,
586
161,
926
2,48
615
,925
1,92
62,
486
68,5
5,99
820
917.
620
568.
720
859.
962
32.4
6133
.462
22.4
19-D
ec-1
32,
540
172,
641
3,08
418
,602
2,64
13,
084
68,3
3,72
021
017.
520
646.
020
708.
662
65.9
6161
.761
81.5
20-D
ec-1
32,
630
182,
159
2,21
112
,214
2,15
92,
211
69,4
1,63
021
118.
020
745.
921
079.
762
94.3
6188
.662
85.2
23-D
ec-1
32,
638
172,
094
2,04
411
,735
2,09
42,
044
69,7
6,34
321
207.
921
059.
121
101.
063
34.4
6286
.263
02.3
24-D
ec-1
32,
601
182,
231
2,05
211
,700
2,23
12,
052
69,7
6,39
221
156.
921
010.
721
032.
763
21.7
6280
.762
87.5
26-D
ec-1
32,
621
172,
484
1,94
111
,299
2,48
41,
941
69,9
6,60
921
135.
921
013.
121
074.
663
18.3
6279
.262
96.6
27-D
ec-1
32,
667
172,
210
1,83
111
,073
2,21
01,
831
70,3
1,15
021
235.
121
113.
321
193.
663
43.9
6309
.963
30.8
30-D
ec-1
32,
630
162,
406
2,56
116
,211
2,40
62,
561
70,2
1,91
121
304.
721
089.
221
143.
063
63.2
6296
.363
11.7
31-D
ec-1
32,
682
152,
003
1,65
810
,705
2,00
31,
658
70,4
4,25
821
230.
921
122.
721
170.
763
39.1
6307
.063
26.7
So
urc
e:
BS
E.
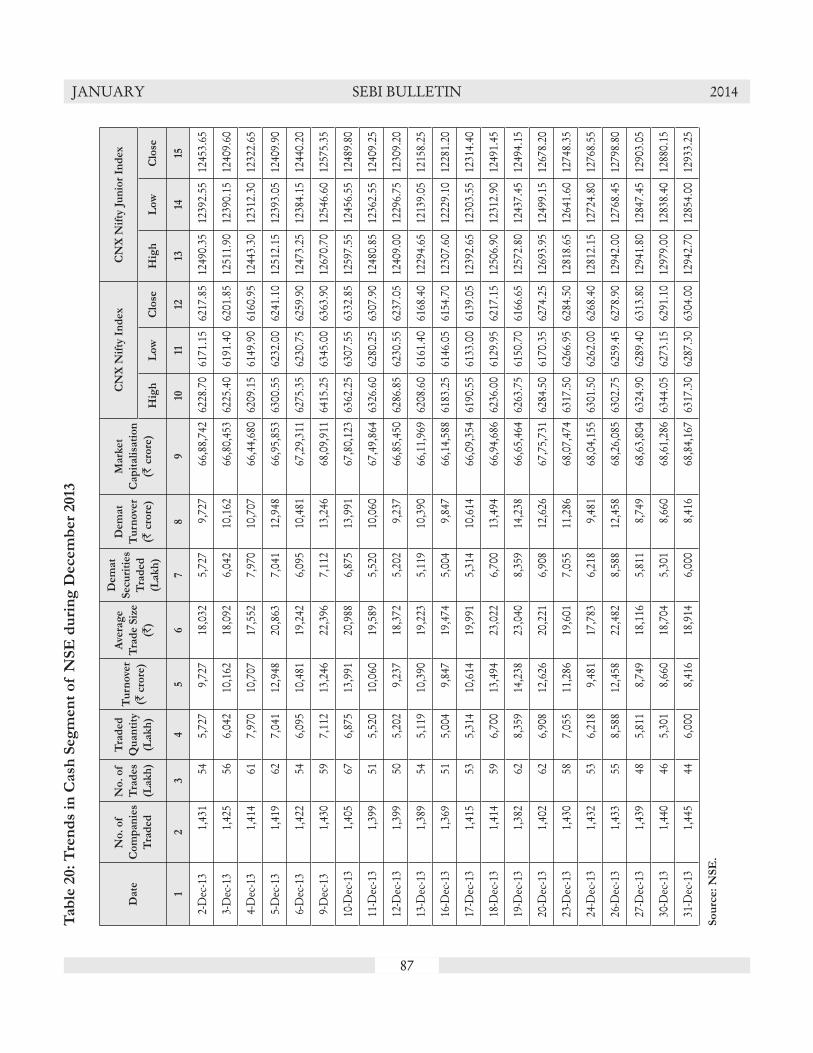
87
JANUARY SEBI BULLETIN 2014T
ab
le 2
0:
Tre
nd
s in
Cash
Seg
men
t o
f N
SE
du
rin
g D
ecem
ber
2013
Date
No
. o
f
Co
mp
an
ies
Tra
ded
No
. o
f
Tra
des
(Lak
h)
Tra
ded
Qu
an
tity
(Lak
h)
Tu
rno
ver
(` c
rore
)
Ave
rag
e
Tra
de
Siz
e
(`)
Dem
at
Sec
uri
ties
Tra
ded
(Lak
h)
Dem
at
Tu
rno
ver
(` c
rore
)
Mark
et
Cap
itali
sati
on
(` c
rore
)
CN
X N
ifty
In
dex
CN
X N
ifty
Ju
nio
r In
dex
Hig
hL
ow
Clo
seH
igh
Lo
wC
lose
12
34
56
78
910
1112
1314
15
2-D
ec-1
31,
431
545,
727
9,72
718
,032
5,72
79,
727
66,8
8,74
262
28.7
061
71.1
562
17.8
512
490.
3512
392.
5512
453.
65
3-D
ec-1
31,
425
566,
042
10,1
6218
,092
6,04
210
,162
66,8
0,45
362
25.4
061
91.4
062
01.8
512
511.
9012
390.
1512
409.
60
4-D
ec-1
31,
414
617,
970
10,7
0717
,552
7,97
010
,707
66,4
4,68
062
09.1
561
49.9
061
60.9
512
443.
3012
312.
3012
322.
65
5-D
ec-1
31,
419
627,
041
12,9
4820
,863
7,04
112
,948
66,9
5,85
363
00.5
562
32.0
062
41.1
012
512.
1512
393.
0512
409.
90
6-D
ec-1
31,
422
546,
095
10,4
8119
,242
6,09
510
,481
67,2
9,31
162
75.3
562
30.7
562
59.9
012
473.
2512
384.
1512
440.
20
9-D
ec-1
31,
430
597,
112
13,2
4622
,396
7,11
213
,246
68,0
9,91
164
15.2
563
45.0
063
63.9
012
670.
7012
546.
6012
575.
35
10-D
ec-1
31,
405
676,
875
13,9
9120
,988
6,87
513
,991
67,8
0,12
363
62.2
563
07.5
563
32.8
512
597.
5512
456.
5512
489.
80
11-D
ec-1
31,
399
515,
520
10,0
6019
,589
5,52
010
,060
67,4
9,86
463
26.6
062
80.2
563
07.9
012
480.
8512
362.
5512
409.
25
12-D
ec-1
31,
399
505,
202
9,23
718
,372
5,20
29,
237
66,8
5,45
062
86.8
562
30.5
562
37.0
512
409.
0012
296.
7512
309.
20
13-D
ec-1
31,
389
545,
119
10,3
9019
,223
5,11
910
,390
66,1
1,96
962
08.6
061
61.4
061
68.4
012
294.
6512
139.
0512
158.
25
16-D
ec-1
31,
369
515,
004
9,84
719
,474
5,00
49,
847
66,1
4,58
861
83.2
561
46.0
561
54.7
012
307.
6012
229.
1012
281.
20
17-D
ec-1
31,
415
535,
314
10,6
1419
,991
5,31
410
,614
66,0
9,35
461
90.5
561
33.0
061
39.0
512
392.
6512
303.
5512
314.
40
18-D
ec-1
31,
414
596,
700
13,4
9423
,022
6,70
013
,494
66,9
4,68
662
36.0
061
29.9
562
17.1
512
506.
9012
312.
9012
491.
45
19-D
ec-1
31,
382
628,
359
14,2
3823
,040
8,35
914
,238
66,6
5,46
462
63.7
561
50.7
061
66.6
512
572.
8012
437.
4512
494.
15
20-D
ec-1
31,
402
626,
908
12,6
2620
,221
6,90
812
,626
67,7
5,73
162
84.5
061
70.3
562
74.2
512
693.
9512
499.
1512
678.
20
23-D
ec-1
31,
430
587,
055
11,2
8619
,601
7,05
511
,286
68,0
7,47
463
17.5
062
66.9
562
84.5
012
818.
6512
641.
6012
748.
35
24-D
ec-1
31,
432
536,
218
9,48
117
,783
6,21
89,
481
68,0
4,15
563
01.5
062
62.0
062
68.4
012
812.
1512
724.
8012
768.
55
26-D
ec-1
31,
433
558,
588
12,4
5822
,482
8,58
812
,458
68,2
6,08
563
02.7
562
59.4
562
78.9
012
942.
0012
768.
4512
798.
80
27-D
ec-1
31,
439
485,
811
8,74
918
,116
5,81
18,
749
68,6
3,80
463
24.9
062
89.4
063
13.8
012
941.
8012
847.
4512
903.
05
30-D
ec-1
31,
440
465,
301
8,66
018
,704
5,30
18,
660
68,6
1,28
663
44.0
562
73.1
562
91.1
012
979.
0012
838.
4012
880.
15
31-D
ec-1
31,
445
446,
000
8,41
618
,914
6,00
08,
416
68,8
4,16
763
17.3
062
87.3
063
04.0
012
942.
7012
854.
0012
933.
25
So
urc
e:
NS
E.

88
JANUARY SEBI BULLETIN 2014T
ab
le 2
1: T
ren
ds
in C
ash
Seg
men
t o
f M
CX
-SX
du
rin
g D
ecem
ber
2013
Date
No
. o
f
Co
mp
an
ies
Tra
ded
No
. o
f
Tra
des
(Lak
h)
Tra
ded
Qu
an
tity
(Lak
h)
Tu
rno
ver
(` c
rore
)
Ave
rag
e
Tra
de S
ize
(`)
Dem
at
Secu
riti
es
Tra
ded
(Lak
h)
Dem
at
Tu
rno
ver
(` c
rore
)
Mark
et
Cap
itali
sati
on
(` c
rore
)
SX
40
Hig
hL
ow
Clo
se
12
34
56
78
910
1112
2-D
ec-1
345
0.03
1.66
15.9
50,7
271.
6615
.92
66,2
9,43
612
423.
7012
343.
4012
375.
76
3-D
ec-1
331
0.03
1.43
12.2
34,8
781.
4312
.18
66,3
7,44
812
413.
5712
340.
2612
371.
94
4-D
ec-1
330
0.03
0.83
7.5
26,3
570.
837.
4666
,13,
502
1239
4.56
1228
6.11
1230
7.07
5-D
ec-1
342
0.04
1.44
10.6
30,0
351.
4410
.63
66,5
7,47
312
546.
0412
307.
0712
427.
14
6-D
ec-1
341
0.03
1.40
10.5
31,3
901.
4010
.53
66,9
2,23
512
469.
5712
400.
3212
454.
12
9-D
ec-1
338
0.04
1.70
13.5
33,0
371.
7013
.46
67,6
8,75
012
702.
9712
454.
1212
634.
79
10-D
ec-1
343
0.04
1.75
13.3
35,8
171.
7513
.35
67,4
4,12
412
666.
1612
584.
9512
616.
20
11-D
ec-1
340
0.03
1.71
11.1
38,5
931.
7111
.15
67,1
4,34
212
620.
6212
513.
7312
569.
51
12-D
ec-1
338
0.03
1.61
11.7
40,3
021.
6111
.74
66,5
0,33
712
569.
5112
409.
0212
432.
57
13-D
ec-1
339
0.03
1.57
12.9
37,2
171.
5712
.93
65,7
6,11
012
432.
5712
302.
8912
315.
20
16-D
ec-1
346
0.04
1.95
14.7
40,5
101.
9514
.71
65,7
6,81
712
331.
7812
268.
0512
285.
28
17-D
ec-1
339
0.04
1.78
13.4
38,3
091.
7813
.42
65,7
4,89
912
340.
7712
240.
9512
264.
64
18-D
ec-1
339
0.03
2.00
14.6
46,6
252.
0014
.57
66,5
3,41
512
445.
7412
264.
6412
399.
59
19-D
ec-1
348
0.03
1.60
9.9
33,5
311.
609.
9466
,28,
976
1244
6.23
1228
3.77
1233
6.53
20-D
ec-1
323
0.03
1.06
8.6
28,3
521.
068.
6267
,32,
349
1256
2.27
1233
1.55
1252
5.54
23-D
ec-1
332
0.03
0.92
7.2
23,2
970.
927.
2267
,77,
773
1260
3.92
1251
6.79
1255
9.21
24-D
ec-1
336
0.03
1.34
10.9
32,9
781.
3410
.90
67,6
8,69
412
577.
2412
492.
3912
510.
16
26-D
ec-1
336
0.04
1.53
17.6
40,1
081.
5317
.64
67,9
3,44
612
612.
0812
496.
9812
533.
26
27-D
ec-1
335
0.04
1.68
14.5
38,8
731.
6814
.53
68,2
7,50
812
612.
1712
528.
8512
594.
59
30-D
ec-1
336
0.03
1.46
11.8
38,1
361.
4611
.83
68,1
3,64
812
638.
1512
484.
3112
552.
70
31-D
ec-1
329
0.02
1.04
8.7
36,1
111.
048.
7068
,39,
525
1260
6.50
1254
9.14
1258
2.69
No
tes:
1.
Cash
seg
men
t o
f M
CX
-SX
co
mm
en
ced
its
op
era
tio
ns
fro
m F
eb 1
1, 2
013
.
NA
: N
ot
Ap
pli
cab
le
So
urc
e:
MC
X-S
X
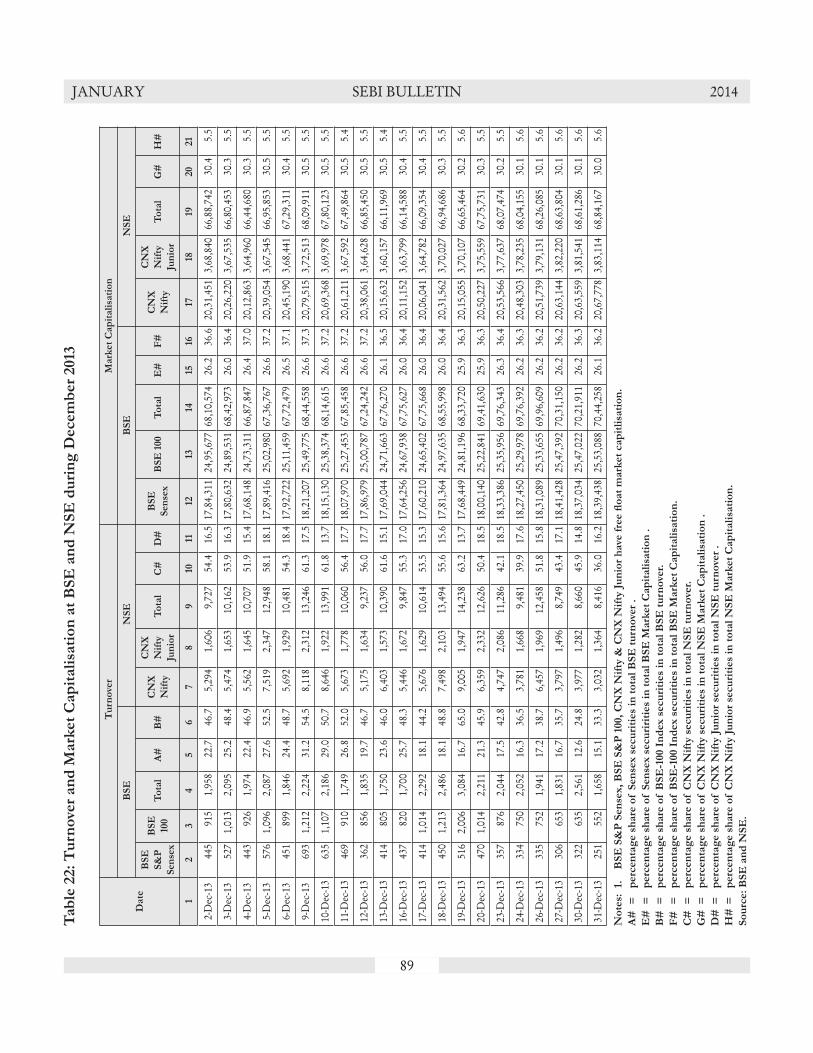
89
JANUARY SEBI BULLETIN 2014T
ab
le 2
2:
Tu
rno
ver
an
d M
ark
et
Cap
itali
sati
on
at
BS
E a
nd
NS
E d
uri
ng
Decem
ber
2013
Date
Tu
rno
ver
Mark
et
Cap
itali
sati
on
BS
E N
SE
BS
E N
SE
BS
E
S&
P
Sen
sex
BS
E
100
To
tal
A#
B#
CN
X
Nif
ty
CN
X
Nif
ty
Jun
ior
To
tal
C#
D#
BS
E
Sen
sex
BS
E 1
00
To
tal
E#
F#
CN
X
Nif
ty
CN
X
Nif
ty
Jun
ior
To
tal
G#
H#
12
34
56
78
910
1112
1314
1516
1718
1920
21
2-D
ec-1
344
591
51,
958
22.7
46.7
5,29
41,
606
9,72
754
.416
.517
,84,
311
24,9
5,67
768
,10,
574
26.2
36.6
20,3
1,45
13,
68,8
4066
,88,
742
30.4
5.5
3-D
ec-1
352
71,
013
2,09
525
.248
.45,
474
1,65
310
,162
53.9
16.3
17,8
0,63
224
,89,
531
68,4
2,97
326
.036
.420
,26,
220
3,67
,535
66,8
0,45
330
.35.
5
4-D
ec-1
344
392
61,
974
22.4
46.9
5,56
21,
645
10,7
0751
.915
.417
,68,
148
24,7
3,31
166
,87,
847
26.4
37.0
20,1
2,86
33,
64,9
6066
,44,
680
30.3
5.5
5-D
ec-1
357
61,
096
2,08
727
.652
.57,
519
2,34
712
,948
58.1
18.1
17,8
9,41
625
,02,
980
67,3
6,76
726
.637
.220
,39,
054
3,67
,545
66,9
5,85
330
.55.
5
6-D
ec-1
345
189
91,
846
24.4
48.7
5,69
21,
929
10,4
8154
.318
.417
,92,
722
25,1
1,45
967
,72,
479
26.5
37.1
20,4
5,19
03,
68,4
4167
,29,
311
30.4
5.5
9-D
ec-1
369
31,
212
2,22
431
.254
.58,
118
2,31
213
,246
61.3
17.5
18,2
1,20
725
,49,
775
68,4
4,55
826
.637
.320
,79,
515
3,72
,513
68,0
9,91
130
.55.
5
10-D
ec-1
363
51,
107
2,18
629
.050
.78,
646
1,92
213
,991
61.8
13.7
18,1
5,13
025
,38,
374
68,1
4,61
526
.637
.220
,69,
368
3,69
,978
67,8
0,12
330
.55.
5
11-D
ec-1
346
991
01,
749
26.8
52.0
5,67
31,
778
10,0
6056
.417
.718
,07,
970
25,2
7,45
367
,85,
458
26.6
37.2
20,6
1,21
13,
67,5
9267
,49,
864
30.5
5.4
12-D
ec-1
336
285
61,
835
19.7
46.7
5,17
51,
634
9,23
756
.017
.717
,86,
979
25,0
0,78
767
,24,
242
26.6
37.2
20,3
8,06
13,
64,6
2866
,85,
450
30.5
5.5
13-D
ec-1
341
480
51,
750
23.6
46.0
6,40
31,
573
10,3
9061
.615
.117
,69,
044
24,7
1,66
367
,76,
270
26.1
36.5
20,1
5,63
23,
60,1
5766
,11,
969
30.5
5.4
16-D
ec-1
343
782
01,
700
25.7
48.3
5,44
61,
672
9,84
755
.317
.017
,64,
256
24,6
7,93
867
,75,
627
26.0
36.4
20,1
1,15
23,
63,7
9966
,14,
588
30.4
5.5
17-D
ec-1
341
41,
014
2,29
218
.144
.25,
676
1,62
910
,614
53.5
15.3
17,6
0,21
024
,65,
402
67,7
5,66
826
.036
.420
,06,
041
3,64
,782
66,0
9,35
430
.45.
5
18-D
ec-1
345
01,
213
2,48
618
.148
.87,
498
2,10
313
,494
55.6
15.6
17,8
1,36
424
,97,
635
68,5
5,99
826
.036
.420
,31,
562
3,70
,027
66,9
4,68
630
.35.
5
19-D
ec-1
351
62,
006
3,08
416
.765
.09,
005
1,94
714
,238
63.2
13.7
17,6
8,44
924
,81,
196
68,3
3,72
025
.936
.320
,15,
055
3,70
,107
66,6
5,46
430
.25.
6
20-D
ec-1
347
01,
014
2,21
121
.345
.96,
359
2,33
212
,626
50.4
18.5
18,0
0,14
025
,22,
841
69,4
1,63
025
.936
.320
,50,
227
3,75
,559
67,7
5,73
130
.35.
5
23-D
ec-1
335
787
62,
044
17.5
42.8
4,74
72,
086
11,2
8642
.118
.518
,33,
386
25,3
5,95
669
,76,
343
26.3
36.4
20,5
3,56
63,
77,6
3768
,07,
474
30.2
5.5
24-D
ec-1
333
475
02,
052
16.3
36.5
3,78
11,
668
9,48
139
.917
.618
,27,
450
25,2
9,97
869
,76,
392
26.2
36.3
20,4
8,30
33,
78,2
3568
,04,
155
30.1
5.6
26-D
ec-1
333
575
21,
941
17.2
38.7
6,45
71,
969
12,4
5851
.815
.818
,31,
089
25,3
3,65
569
,96,
609
26.2
36.2
20,5
1,73
93,
79,1
3168
,26,
085
30.1
5.6
27-D
ec-1
330
665
31,
831
16.7
35.7
3,79
71,
496
8,74
943
.417
.118
,41,
428
25,4
7,39
270
,31,
150
26.2
36.2
20,6
3,14
43,
82,2
2068
,63,
804
30.1
5.6
30-D
ec-1
332
263
52,
561
12.6
24.8
3,97
71,
282
8,66
045
.914
.818
,37,
034
25,4
7,02
270
,21,
911
26.2
36.3
20,6
3,55
93,
81,5
4168
,61,
286
30.1
5.6
31-D
ec-1
325
155
21,
658
15.1
33.3
3,03
21,
364
8,41
636
.016
.218
,39,
438
25,5
3,08
870
,44,
258
26.1
36.2
20,6
7,77
83,
83,1
1468
,84,
167
30.0
5.6
No
tes:
1.
B
SE
S&
P S
en
sex,
BS
E S
&P
100,
CN
X N
ifty
& C
NX
Nif
ty J
un
ior
have
fre
e fl
oat
mark
et
cap
itli
sati
on
.
A#
=
p
erc
en
tag
e s
hare
of S
en
sex s
ecu
riti
es
in t
ota
l B
SE
tu
rno
ver
.
E#
=
p
erc
en
tag
e s
hare
of S
en
sex s
ecu
riri
ties
in t
ota
l B
SE
Mark
et
Cap
itali
sati
on
.
B#
=
p
erc
en
tag
e s
hare
of B
SE
-100 I
nd
ex s
ecu
riti
es
in t
ota
l B
SE
tu
rno
ver.
F#
=
p
erc
en
tag
e s
hare
of B
SE
-100 I
nd
ex s
ecu
riti
es
in t
ota
l B
SE
Mark
et
Cap
itali
sati
on
.
C#
=
p
erc
en
tag
e s
hare
of C
NX
Nif
ty s
ecu
riti
es
in t
ota
l N
SE
tu
rno
ver.
G#
=
p
erc
en
tag
e s
hare
of C
NX
Nif
ty s
ecu
riti
es
in t
ota
l N
SE
Mark
et
Cap
itali
sati
on
.
D#
=
perc
en
tag
e s
hare
of C
NX
Nif
ty J
un
ior
secu
riti
es
in t
ota
l N
SE
tu
rno
ver
.
H#
=
perc
en
tag
e s
hare
of C
NX
Nif
ty J
un
ior
secu
riti
es
in t
ota
l N
SE
Mark
et
Cap
itali
sati
on
.
So
urc
e:
BS
E a
nd
NS
E.

90
JANUARY SEBI BULLETIN 2014T
ab
le 2
3:
Cit
y-w
ise D
istr
ibu
tio
n o
f T
urn
ove
r o
n C
ash
Seg
men
ts o
f B
SE
, N
SE
an
d M
CX
-SX
(Per
cent
age
shar
e in
Tur
nove
r
S.
No
.
Cit
yB
SE
NS
EM
CX
-SX
*
Sto
ck
Exch
an
ge/
Cit
y2010
-11
2011
-12
2012
-13
Dec-1
32010
-11
2011
-12
2012
-13
Dec-1
32010
-11
2011
-12
2012
-13
Dec-1
3
12
34
56
78
910
1112
1314
1A
hmed
abad
9.4
9.5
8.0
5.5
6.2
6.1
3.8
3.4
NA
3.0
0.4
2Ba
ngal
ore
0.4
0.3
0.3
0.3
0.6
0.5
0.3
2.0
0.1
0.0
3Ba
roda
2.1
0.0
0.8
0.7
0.5
0.4
0.4
0.4
3.8
0.2
4Bh
uban
eshw
ar0.
00.
00.
00.
00.
00.
00.
00.
00.
00.
0
5C
henn
ai0.
40.
40.
50.
91.
61.
41.
31.
50.
00.
0
6C
ochi
n0.
00.
00.
10.
21.
71.
71.
31.
50.
00.
0
7C
oim
bato
re0.
00.
10.
00.
00.
30.
20.
20.
20.
00.
0
8D
elhi
12.8
10.9
4.6
3.9
10.8
8.4
7.5
10.3
3.1
45.4
9G
uwah
ati
0.0
0.0
0.1
0.1
0.0
0.0
0.0
0.0
0.0
0.0
10
Hyd
erab
ad0.
50.
30.
30.
31.
61.
43.
64.
30.
50.
0
11
Indo
re0.
60.
40.
40.
50.
60.
40.
40.
50.
10.
0
12
Jaip
ur1.
00.
90.
91.
00.
50.
40.
30.
50.
30.
0
13
Kan
pur
0.7
0.7
0.7
0.8
0.1
0.1
0.1
0.2
0.0
0.0
14
Kol
kata
2.0
5.0
6.3
6.2
7.5
8.6
7.8
6.7
13.3
0.0
15
Ludh
iana
0.2
0.2
0.1
0.1
0.1
0.1
0.1
0.1
0.0
0.0
16
Man
galo
re0.
00.
00.
10.
00.
00.
00.
00.
00.
00.
0
17
Mum
bai
36.3
37.4
51.7
57.0
58.6
60.4
63.8
58.6
57.1
5.0
18
Patn
a0.
10.
10.
10.
10.
20.
00.
00.
00.
00.
0
19
Pune
0.7
0.6
0.6
0.5
0.0
0.2
0.2
0.2
0.0
0.0
20
Raj
kot
4.8
4.9
4.0
3.1
1.6
1.4
1.0
1.1
0.1
0.1
21
Oth
ers
28.0
28.4
20.3
18.6
7.5
8.2
8.0
8.3
18.6
49.0
To
tal
100.0
100.0
100.0
100.0
100.0
100.0
100.0
100.0
100.0
100.0
No
tes:
1.
Cash
seg
men
t o
f M
CX
-SX
co
mm
en
ced
its
op
era
tio
ns
fro
m F
eb 1
1, 2
013
.
* T
he c
ity-w
ise d
istr
ibu
tio
n o
f t
urn
ove
r is
base
d o
n t
he c
itie
s u
plo
ad
ed
in
th
e U
CC
data
base
of t
he E
xch
an
ge f
or
cli
en
tele
tra
des
an
d m
em
ber'
s re
gis
tere
d
offi
ce c
ity f
or
pro
pri
eta
ry t
rad
es.
NA
: N
ot
Ap
pli
cab
le
So
urc
e:
BS
E a
nd
NS
E.
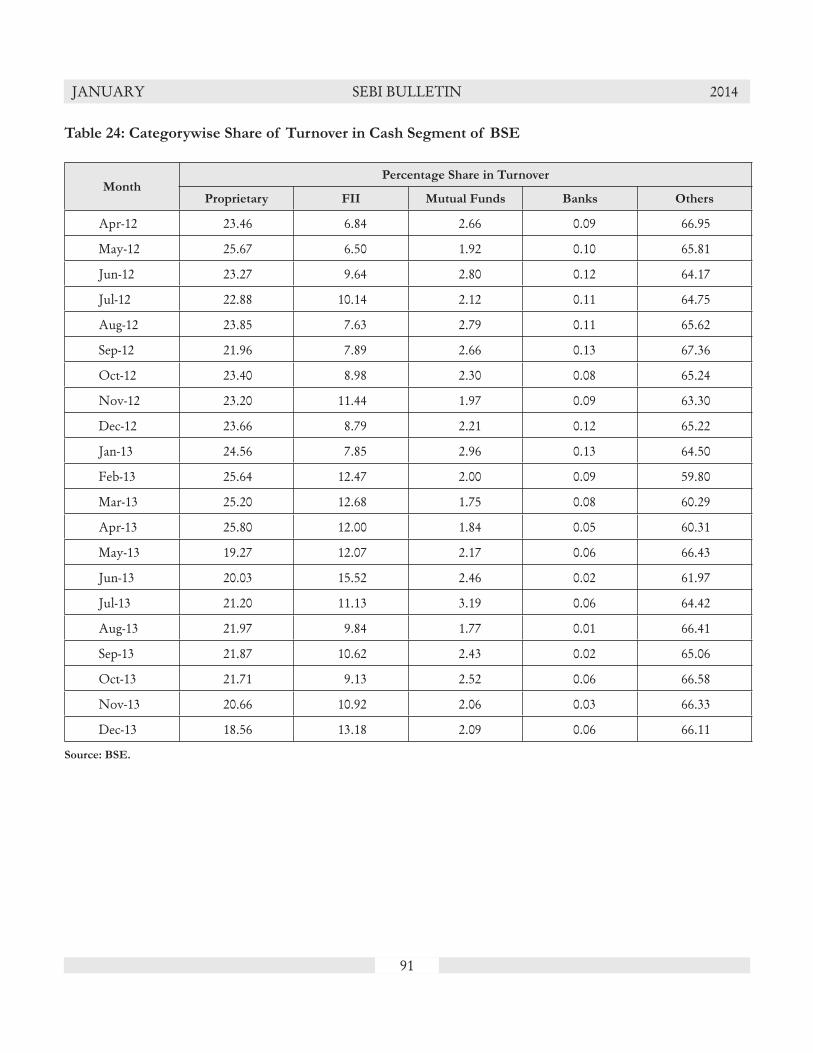
91
JANUARY SEBI BULLETIN 2014
Table 24: Categorywise Share of Turnover in Cash Segment of BSE
MonthPercentage Share in Turnover
Proprietary FII Mutual Funds Banks Others
Apr-12 23.46 6.84 2.66 0.09 66.95
May-12 25.67 6.50 1.92 0.10 65.81
Jun-12 23.27 9.64 2.80 0.12 64.17
Jul-12 22.88 10.14 2.12 0.11 64.75
Aug-12 23.85 7.63 2.79 0.11 65.62
Sep-12 21.96 7.89 2.66 0.13 67.36
Oct-12 23.40 8.98 2.30 0.08 65.24
Nov-12 23.20 11.44 1.97 0.09 63.30
Dec-12 23.66 8.79 2.21 0.12 65.22
Jan-13 24.56 7.85 2.96 0.13 64.50
Feb-13 25.64 12.47 2.00 0.09 59.80
Mar-13 25.20 12.68 1.75 0.08 60.29
Apr-13 25.80 12.00 1.84 0.05 60.31
May-13 19.27 12.07 2.17 0.06 66.43
Jun-13 20.03 15.52 2.46 0.02 61.97
Jul-13 21.20 11.13 3.19 0.06 64.42
Aug-13 21.97 9.84 1.77 0.01 66.41
Sep-13 21.87 10.62 2.43 0.02 65.06
Oct-13 21.71 9.13 2.52 0.06 66.58
Nov-13 20.66 10.92 2.06 0.03 66.33
Dec-13 18.56 13.18 2.09 0.06 66.11
Source: BSE.
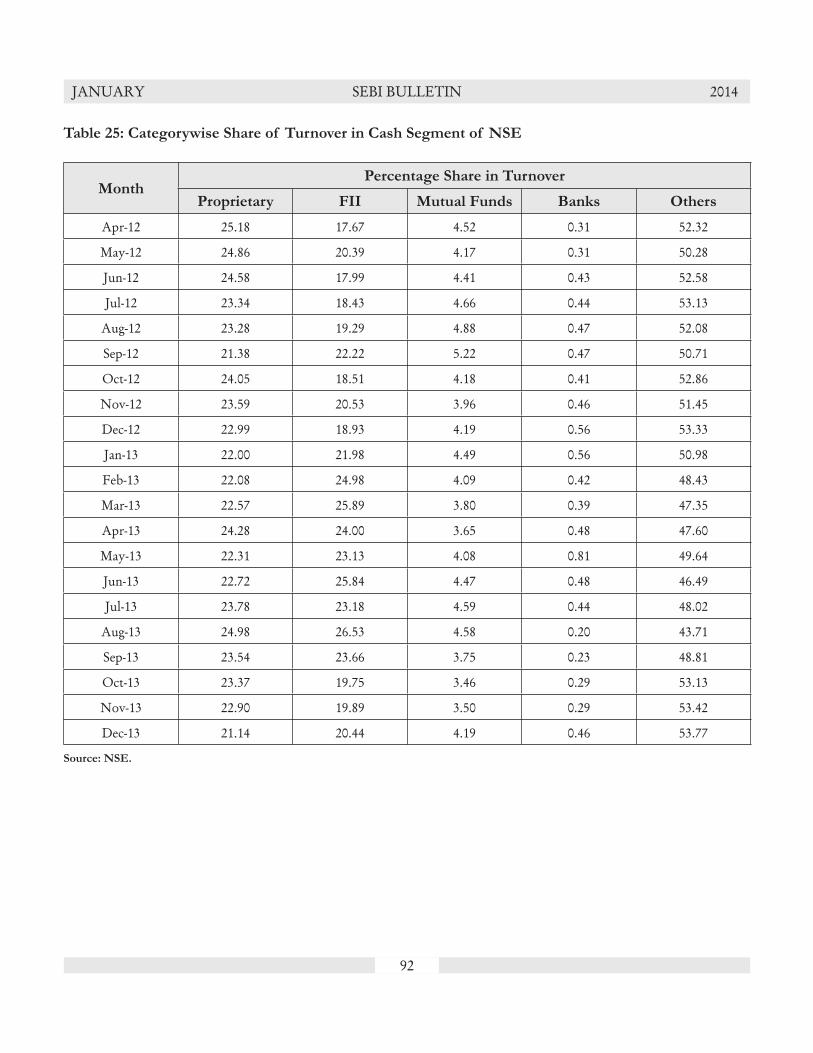
92
JANUARY SEBI BULLETIN 2014
Table 25: Categorywise Share of Turnover in Cash Segment of NSE
MonthPercentage Share in Turnover
Proprietary FII Mutual Funds Banks Others
Apr-12 25.18 17.67 4.52 0.31 52.32
May-12 24.86 20.39 4.17 0.31 50.28
Jun-12 24.58 17.99 4.41 0.43 52.58
Jul-12 23.34 18.43 4.66 0.44 53.13
Aug-12 23.28 19.29 4.88 0.47 52.08
Sep-12 21.38 22.22 5.22 0.47 50.71
Oct-12 24.05 18.51 4.18 0.41 52.86
Nov-12 23.59 20.53 3.96 0.46 51.45
Dec-12 22.99 18.93 4.19 0.56 53.33
Jan-13 22.00 21.98 4.49 0.56 50.98
Feb-13 22.08 24.98 4.09 0.42 48.43
Mar-13 22.57 25.89 3.80 0.39 47.35
Apr-13 24.28 24.00 3.65 0.48 47.60
May-13 22.31 23.13 4.08 0.81 49.64
Jun-13 22.72 25.84 4.47 0.48 46.49
Jul-13 23.78 23.18 4.59 0.44 48.02
Aug-13 24.98 26.53 4.58 0.20 43.71
Sep-13 23.54 23.66 3.75 0.23 48.81
Oct-13 23.37 19.75 3.46 0.29 53.13
Nov-13 22.90 19.89 3.50 0.29 53.42
Dec-13 21.14 20.44 4.19 0.46 53.77
Source: NSE.
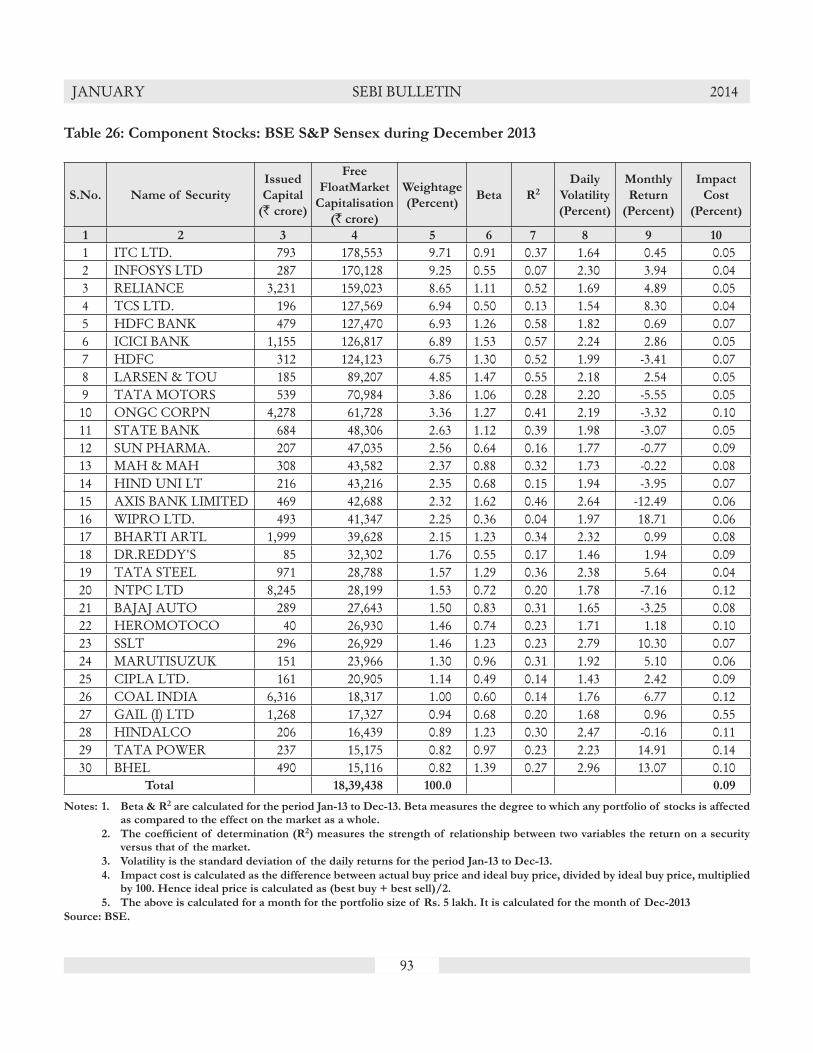
93
JANUARY SEBI BULLETIN 2014
Table 26: Component Stocks: BSE S&P Sensex during December 2013
S.No. Name of Security
Issued
Capital
(` crore)
Free
FloatMarket
Capitalisation
(` crore)
Weightage
(Percent)Beta R2
Daily
Volatility
(Percent)
Monthly
Return
(Percent)
Impact
Cost
(Percent)
1 2 3 4 5 6 7 8 9 10
1 ITC LTD. 793 178,553 9.71 0.91 0.37 1.64 0.45 0.052 INFOSYS LTD 287 170,128 9.25 0.55 0.07 2.30 3.94 0.043 RELIANCE 3,231 159,023 8.65 1.11 0.52 1.69 4.89 0.054 TCS LTD. 196 127,569 6.94 0.50 0.13 1.54 8.30 0.045 HDFC BANK 479 127,470 6.93 1.26 0.58 1.82 0.69 0.076 ICICI BANK 1,155 126,817 6.89 1.53 0.57 2.24 2.86 0.057 HDFC 312 124,123 6.75 1.30 0.52 1.99 -3.41 0.078 LARSEN & TOU 185 89,207 4.85 1.47 0.55 2.18 2.54 0.059 TATA MOTORS 539 70,984 3.86 1.06 0.28 2.20 -5.55 0.0510 ONGC CORPN 4,278 61,728 3.36 1.27 0.41 2.19 -3.32 0.1011 STATE BANK 684 48,306 2.63 1.12 0.39 1.98 -3.07 0.0512 SUN PHARMA. 207 47,035 2.56 0.64 0.16 1.77 -0.77 0.0913 MAH & MAH 308 43,582 2.37 0.88 0.32 1.73 -0.22 0.0814 HIND UNI LT 216 43,216 2.35 0.68 0.15 1.94 -3.95 0.0715 AXIS BANK LIMITED 469 42,688 2.32 1.62 0.46 2.64 -12.49 0.0616 WIPRO LTD. 493 41,347 2.25 0.36 0.04 1.97 18.71 0.0617 BHARTI ARTL 1,999 39,628 2.15 1.23 0.34 2.32 0.99 0.0818 DR.REDDY'S 85 32,302 1.76 0.55 0.17 1.46 1.94 0.0919 TATA STEEL 971 28,788 1.57 1.29 0.36 2.38 5.64 0.0420 NTPC LTD 8,245 28,199 1.53 0.72 0.20 1.78 -7.16 0.1221 BAJAJ AUTO 289 27,643 1.50 0.83 0.31 1.65 -3.25 0.0822 HEROMOTOCO 40 26,930 1.46 0.74 0.23 1.71 1.18 0.1023 SSLT 296 26,929 1.46 1.23 0.23 2.79 10.30 0.0724 MARUTISUZUK 151 23,966 1.30 0.96 0.31 1.92 5.10 0.0625 CIPLA LTD. 161 20,905 1.14 0.49 0.14 1.43 2.42 0.0926 COAL INDIA 6,316 18,317 1.00 0.60 0.14 1.76 6.77 0.1227 GAIL (I) LTD 1,268 17,327 0.94 0.68 0.20 1.68 0.96 0.5528 HINDALCO 206 16,439 0.89 1.23 0.30 2.47 -0.16 0.1129 TATA POWER 237 15,175 0.82 0.97 0.23 2.23 14.91 0.1430 BHEL 490 15,116 0.82 1.39 0.27 2.96 13.07 0.10
Total 18,39,438 100.0 0.09
Notes: 1. Beta & R2 are calculated for the period Jan-13 to Dec-13. Beta measures the degree to which any portfolio of stocks is affected as compared to the effect on the market as a whole.
2. The coeffi cient of determination (R2) measures the strength of relationship between two variables the return on a security versus that of the market.
3. Volatility is the standard deviation of the daily returns for the period Jan-13 to Dec-13.
4. Impact cost is calculated as the difference between actual buy price and ideal buy price, divided by ideal buy price, multiplied by 100. Hence ideal price is calculated as (best buy + best sell)/2.
5. The above is calculated for a month for the portfolio size of Rs. 5 lakh. It is calculated for the month of Dec-2013
Source: BSE.
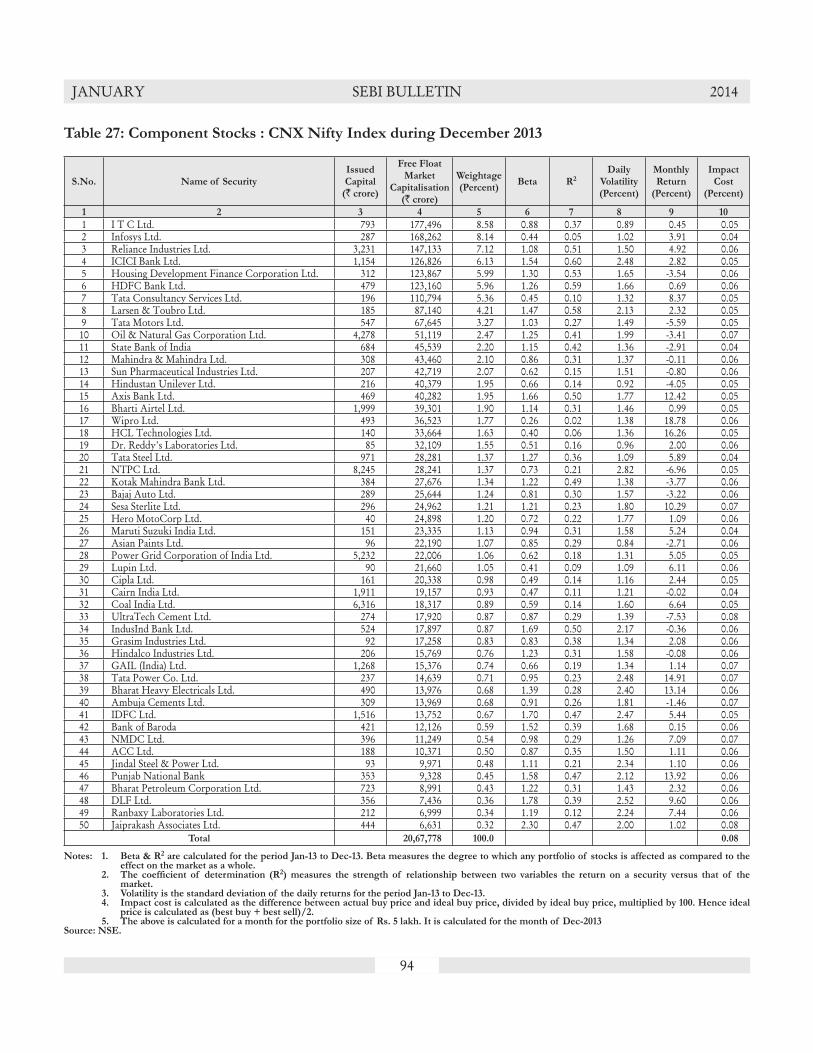
94
JANUARY SEBI BULLETIN 2014
Table 27: Component Stocks : CNX Nifty Index during December 2013
S.No. Name of SecurityIssuedCapital
(` crore)
Free Float Market
Capitalisation (` crore)
Weightage (Percent)
Beta R2
Daily Volatility (Percent)
Monthly Return
(Percent)
Impact Cost
(Percent)
1 2 3 4 5 6 7 8 9 10
1 I T C Ltd. 793 177,496 8.58 0.88 0.37 0.89 0.45 0.052 Infosys Ltd. 287 168,262 8.14 0.44 0.05 1.02 3.91 0.043 Reliance Industries Ltd. 3,231 147,133 7.12 1.08 0.51 1.50 4.92 0.064 ICICI Bank Ltd. 1,154 126,826 6.13 1.54 0.60 2.48 2.82 0.055 Housing Development Finance Corporation Ltd. 312 123,867 5.99 1.30 0.53 1.65 -3.54 0.066 HDFC Bank Ltd. 479 123,160 5.96 1.26 0.59 1.66 0.69 0.067 Tata Consultancy Services Ltd. 196 110,794 5.36 0.45 0.10 1.32 8.37 0.058 Larsen & Toubro Ltd. 185 87,140 4.21 1.47 0.58 2.13 2.32 0.059 Tata Motors Ltd. 547 67,645 3.27 1.03 0.27 1.49 -5.59 0.0510 Oil & Natural Gas Corporation Ltd. 4,278 51,119 2.47 1.25 0.41 1.99 -3.41 0.0711 State Bank of India 684 45,539 2.20 1.15 0.42 1.36 -2.91 0.0412 Mahindra & Mahindra Ltd. 308 43,460 2.10 0.86 0.31 1.37 -0.11 0.0613 Sun Pharmaceutical Industries Ltd. 207 42,719 2.07 0.62 0.15 1.51 -0.80 0.0614 Hindustan Unilever Ltd. 216 40,379 1.95 0.66 0.14 0.92 -4.05 0.0515 Axis Bank Ltd. 469 40,282 1.95 1.66 0.50 1.77 12.42 0.0516 Bharti Airtel Ltd. 1,999 39,301 1.90 1.14 0.31 1.46 0.99 0.0517 Wipro Ltd. 493 36,523 1.77 0.26 0.02 1.38 18.78 0.0618 HCL Technologies Ltd. 140 33,664 1.63 0.40 0.06 1.36 16.26 0.0519 Dr. Reddy's Laboratories Ltd. 85 32,109 1.55 0.51 0.16 0.96 2.00 0.0620 Tata Steel Ltd. 971 28,281 1.37 1.27 0.36 1.09 5.89 0.0421 NTPC Ltd. 8,245 28,241 1.37 0.73 0.21 2.82 -6.96 0.0522 Kotak Mahindra Bank Ltd. 384 27,676 1.34 1.22 0.49 1.38 -3.77 0.0623 Bajaj Auto Ltd. 289 25,644 1.24 0.81 0.30 1.57 -3.22 0.0624 Sesa Sterlite Ltd. 296 24,962 1.21 1.21 0.23 1.80 10.29 0.0725 Hero MotoCorp Ltd. 40 24,898 1.20 0.72 0.22 1.77 1.09 0.0626 Maruti Suzuki India Ltd. 151 23,335 1.13 0.94 0.31 1.58 5.24 0.0427 Asian Paints Ltd. 96 22,190 1.07 0.85 0.29 0.84 -2.71 0.0628 Power Grid Corporation of India Ltd. 5,232 22,006 1.06 0.62 0.18 1.31 5.05 0.0529 Lupin Ltd. 90 21,660 1.05 0.41 0.09 1.09 6.11 0.0630 Cipla Ltd. 161 20,338 0.98 0.49 0.14 1.16 2.44 0.0531 Cairn India Ltd. 1,911 19,157 0.93 0.47 0.11 1.21 -0.02 0.0432 Coal India Ltd. 6,316 18,317 0.89 0.59 0.14 1.60 6.64 0.0533 UltraTech Cement Ltd. 274 17,920 0.87 0.87 0.29 1.39 -7.53 0.0834 IndusInd Bank Ltd. 524 17,897 0.87 1.69 0.50 2.17 -0.36 0.0635 Grasim Industries Ltd. 92 17,258 0.83 0.83 0.38 1.34 2.08 0.0636 Hindalco Industries Ltd. 206 15,769 0.76 1.23 0.31 1.58 -0.08 0.0637 GAIL (India) Ltd. 1,268 15,376 0.74 0.66 0.19 1.34 1.14 0.0738 Tata Power Co. Ltd. 237 14,639 0.71 0.95 0.23 2.48 14.91 0.0739 Bharat Heavy Electricals Ltd. 490 13,976 0.68 1.39 0.28 2.40 13.14 0.0640 Ambuja Cements Ltd. 309 13,969 0.68 0.91 0.26 1.81 -1.46 0.0741 IDFC Ltd. 1,516 13,752 0.67 1.70 0.47 2.47 5.44 0.0542 Bank of Baroda 421 12,126 0.59 1.52 0.39 1.68 0.15 0.0643 NMDC Ltd. 396 11,249 0.54 0.98 0.29 1.26 7.09 0.0744 ACC Ltd. 188 10,371 0.50 0.87 0.35 1.50 1.11 0.0645 Jindal Steel & Power Ltd. 93 9,971 0.48 1.11 0.21 2.34 1.10 0.0646 Punjab National Bank 353 9,328 0.45 1.58 0.47 2.12 13.92 0.0647 Bharat Petroleum Corporation Ltd. 723 8,991 0.43 1.22 0.31 1.43 2.32 0.0648 DLF Ltd. 356 7,436 0.36 1.78 0.39 2.52 9.60 0.0649 Ranbaxy Laboratories Ltd. 212 6,999 0.34 1.19 0.12 2.24 7.44 0.0650 Jaiprakash Associates Ltd. 444 6,631 0.32 2.30 0.47 2.00 1.02 0.08
Total 20,67,778 100.0 0.08
Notes: 1. Beta & R2 are calculated for the period Jan-13 to Dec-13. Beta measures the degree to which any portfolio of stocks is affected as compared to the effect on the market as a whole.
2. The coeffi cient of determination (R2) measures the strength of relationship between two variables the return on a security versus that of the market.
3. Volatility is the standard deviation of the daily returns for the period Jan-13 to Dec-13. 4. Impact cost is calculated as the difference between actual buy price and ideal buy price, divided by ideal buy price, multiplied by 100. Hence ideal
price is calculated as (best buy + best sell)/2. 5. The above is calculated for a month for the portfolio size of Rs. 5 lakh. It is calculated for the month of Dec-2013Source: NSE.

95
JANUARY SEBI BULLETIN 2014
Table 28: Advances/Declines in Cash Segment of BSE, NSE and MCX-SX
Month
BSE NSE MCX-SX
Advances Declines
Advance
/ Decline
Ratio
Advances Declines
Advance
/ Decline
Ratio
Advances Declines
Advance
/ Decline
Ratio
1 2 3 4 5 6 7 8 9 10
Apr-12 1,517 1,885 0.8 681 883 0.8
May-12 888 2,469 0.4 284 1,274 0.2
Jun-12 1,395 1,953 0.7 697 861 0.8
Jul-12 2,172 1,199 1.8 1,166 395 3.0
Aug-12 1,178 2,226 0.5 510 1,054 0.5
Sep-12 1,723 1,692 1.0 894 673 1.3
Oct-12 2,295 1,139 2.0 1,223 345 3.5
Nov-12 1,414 2,014 0.7 640 930 0.7
Dec-12 1,904 1,522 1.3 989 587 1.7
Jan-13 1,514 1,495 1.0 743 837 0.9
Feb-13 702 2,278 0.3 174 1,400 0.1 31 39 0.8
Mar-13 648 2,814 0.2 193 1,378 0.1 15 38 0.4
Apr-13 1,184 2,196 0.5 521 1,045 0.5 29 30 1.0
May-13 1,638 1,613 1.0 729 594 1.2 5 49 0.1
Jun-13 933 2,245 0.4 242 1,081 0.2 45 7 6.4
Jul-13 1,156 2,006 0.6 427 901 0.5 29 33 0.9
Aug-13 823 2,347 0.4 175 1,021 0.2 32 21 1.5
Sep-13 1,819 1,371 1.3 835 360 2.3 11 40 0.3
Oct-13 2,012 1,245 1.6 916 273 3.4 33 18 1.8
Nov-13 1,954 1,328 1.5 820 354 2.3 38 12 3.2
Dec-13 1,819 1,470 1.2 757 423 1.8 26 27 1.0
Notes: 1. Advance/Decline is calculated based on the average price methodology.
2. Cash segment of MCX-SX commenced its operations from Feb 11, 2013.
NA : Not Applicable
Source: BSE, NSE and MCX-SX.

96
JANUARY SEBI BULLETIN 2014
Table 29: Trading Frequency in Cash Segment of BSE, NSE and MCX-SX
Month
BSE NSE MCX-SX
No. of
Companies
Listed
No. of
companies
Traded
Percent of
Traded to
Listed
No. of
Companies
Listed
No. of
companies
Traded
Percent of
Traded to
Listed
No. of
Companies
Listed *
No. of
companies
Traded
Percent of
Traded to
Listed
1 2 3 4 5 6 7 8 9 10
Apr-12 5,133 2,853 55.6 1,649 1,529 92.7
May-12 5,140 2,694 52.4 1,651 1,530 92.7
Jun-12 5,141 2,952 57.4 1,648 1,532 93.0
Jul-12 5,149 2,835 55.1 1,652 1,532 92.7
Aug-12 5,157 2,903 56.3 1,652 1,535 92.9
Sep-12 5,163 3,010 58.3 1,657 1,538 92.8
Oct-12 5,171 2,903 56.1 1,660 1,541 92.8
Nov-12 5,180 3,058 59.0 1,661 1,541 92.8
Dec-12 5,191 2,986 57.5 1,665 1,546 92.9
Jan-13 5,195 2,918 56.2 1,664 1,545 92.8
Feb-13 5,197 2,895 55.7 1,665 1,542 92.6 1,118 71 6.4
Mar-13 5,211 2,867 55.0 1,666 1,542 92.6 1,116 53 4.7
Apr-13 5,224 2,447 46.8 1,587 1,536 96.8 1,089 59 5.4
May-13 5,230 2,464 47.1 1,589 1,521 95.7 1,084 54 5.0
Jun-13 5,241 2,478 47.3 1,589 1,509 95.0 1,081 52 4.8
Jul-13 5,249 2,339 44.6 1,590 1,516 95.3 1,011 63 6.2
Aug-13 5,257 2,372 45.1 1,588 1,519 95.7 1,010 53 5.2
Sep-13 5,267 2,389 45.4 1,672 1,511 90.4 1,008 51 5.1
Oct-13 5,277 2,621 49.7 1,674 1,521 90.9 994 52 5.2
Nov-13 5,286 2,636 49.9 1,679 1,525 90.8 994 50 5.0
Dec-13 5,294 2,682 50.7 1,679 1,535 91.4 988 53 5.4
Notes: 1. Cash segment of MCX-SX commenced its operations from Feb 11, 2013.
*permitted to trade
NA : Not Applicable
Source: BSE, NSE and MCX-SX.
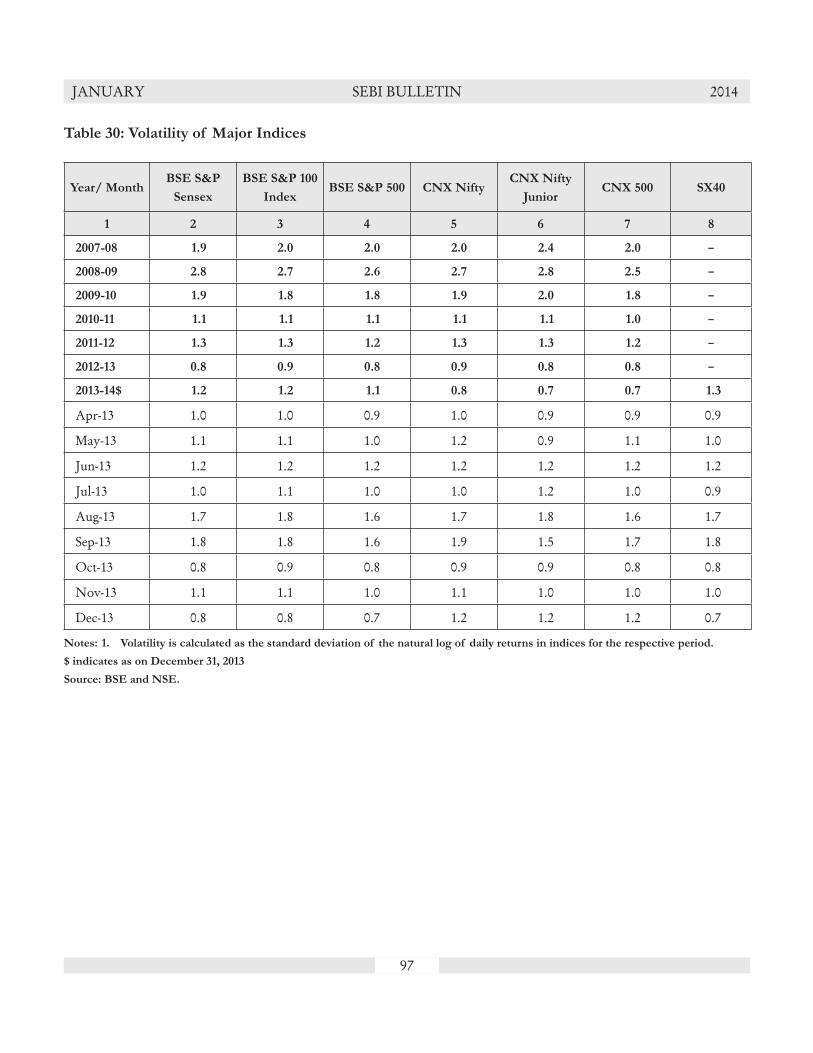
97
JANUARY SEBI BULLETIN 2014
Table 30: Volatility of Major Indices
Year/ MonthBSE S&P
Sensex
BSE S&P 100
IndexBSE S&P 500 CNX Nifty
CNX Nifty
JuniorCNX 500 SX40
1 2 3 4 5 6 7 8
2007-08 1.9 2.0 2.0 2.0 2.4 2.0 –
2008-09 2.8 2.7 2.6 2.7 2.8 2.5 –
2009-10 1.9 1.8 1.8 1.9 2.0 1.8 –
2010-11 1.1 1.1 1.1 1.1 1.1 1.0 –
2011-12 1.3 1.3 1.2 1.3 1.3 1.2 –
2012-13 0.8 0.9 0.8 0.9 0.8 0.8 –
2013-14$ 1.2 1.2 1.1 0.8 0.7 0.7 1.3
Apr-13 1.0 1.0 0.9 1.0 0.9 0.9 0.9
May-13 1.1 1.1 1.0 1.2 0.9 1.1 1.0
Jun-13 1.2 1.2 1.2 1.2 1.2 1.2 1.2
Jul-13 1.0 1.1 1.0 1.0 1.2 1.0 0.9
Aug-13 1.7 1.8 1.6 1.7 1.8 1.6 1.7
Sep-13 1.8 1.8 1.6 1.9 1.5 1.7 1.8
Oct-13 0.8 0.9 0.8 0.9 0.9 0.8 0.8
Nov-13 1.1 1.1 1.0 1.1 1.0 1.0 1.0
Dec-13 0.8 0.8 0.7 1.2 1.2 1.2 0.7
Notes: 1. Volatility is calculated as the standard deviation of the natural log of daily returns in indices for the respective period.
$ indicates as on December 31, 2013
Source: BSE and NSE.
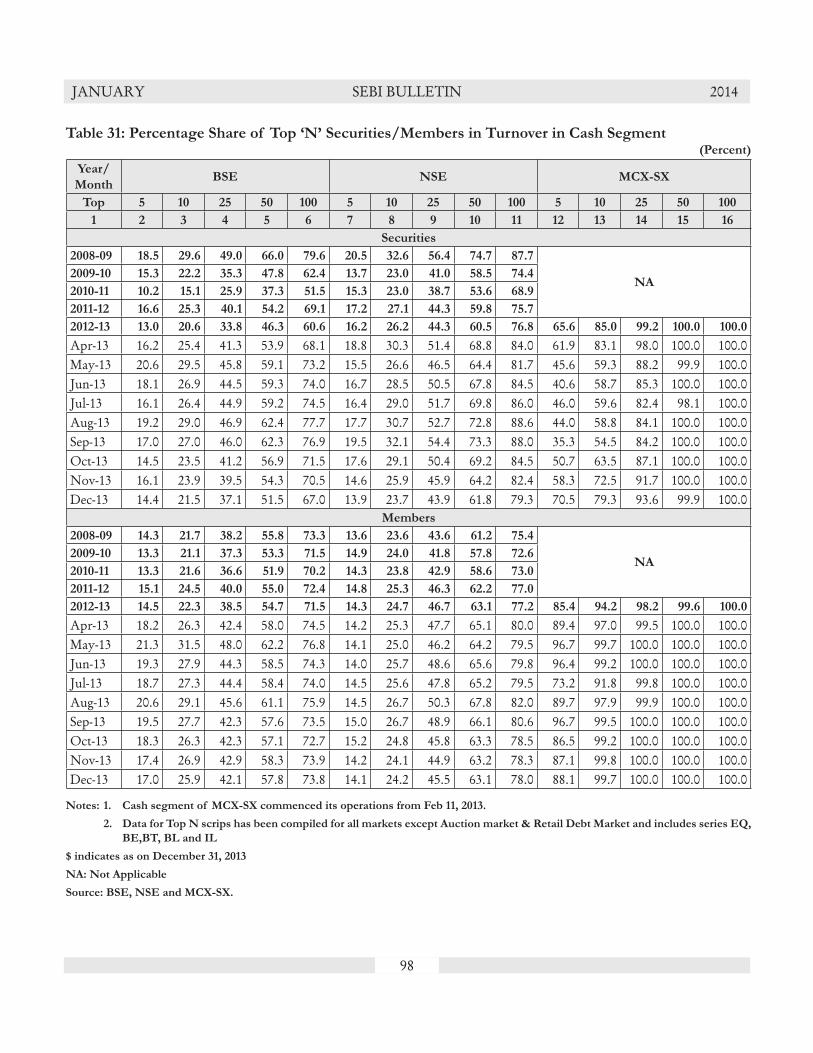
98
JANUARY SEBI BULLETIN 2014
Table 31: Percentage Share of Top ‘N’ Securities/Members in Turnover in Cash Segment(Percent)
Year/
MonthBSE NSE MCX-SX
Top 5 10 25 50 100 5 10 25 50 100 5 10 25 50 100
1 2 3 4 5 6 7 8 9 10 11 12 13 14 15 16
Securities
2008-09 18.5 29.6 49.0 66.0 79.6 20.5 32.6 56.4 74.7 87.7
NA2009-10 15.3 22.2 35.3 47.8 62.4 13.7 23.0 41.0 58.5 74.4
2010-11 10.2 15.1 25.9 37.3 51.5 15.3 23.0 38.7 53.6 68.9
2011-12 16.6 25.3 40.1 54.2 69.1 17.2 27.1 44.3 59.8 75.7
2012-13 13.0 20.6 33.8 46.3 60.6 16.2 26.2 44.3 60.5 76.8 65.6 85.0 99.2 100.0 100.0
Apr-13 16.2 25.4 41.3 53.9 68.1 18.8 30.3 51.4 68.8 84.0 61.9 83.1 98.0 100.0 100.0May-13 20.6 29.5 45.8 59.1 73.2 15.5 26.6 46.5 64.4 81.7 45.6 59.3 88.2 99.9 100.0Jun-13 18.1 26.9 44.5 59.3 74.0 16.7 28.5 50.5 67.8 84.5 40.6 58.7 85.3 100.0 100.0Jul-13 16.1 26.4 44.9 59.2 74.5 16.4 29.0 51.7 69.8 86.0 46.0 59.6 82.4 98.1 100.0Aug-13 19.2 29.0 46.9 62.4 77.7 17.7 30.7 52.7 72.8 88.6 44.0 58.8 84.1 100.0 100.0Sep-13 17.0 27.0 46.0 62.3 76.9 19.5 32.1 54.4 73.3 88.0 35.3 54.5 84.2 100.0 100.0Oct-13 14.5 23.5 41.2 56.9 71.5 17.6 29.1 50.4 69.2 84.5 50.7 63.5 87.1 100.0 100.0Nov-13 16.1 23.9 39.5 54.3 70.5 14.6 25.9 45.9 64.2 82.4 58.3 72.5 91.7 100.0 100.0Dec-13 14.4 21.5 37.1 51.5 67.0 13.9 23.7 43.9 61.8 79.3 70.5 79.3 93.6 99.9 100.0
Members
2008-09 14.3 21.7 38.2 55.8 73.3 13.6 23.6 43.6 61.2 75.4
NA2009-10 13.3 21.1 37.3 53.3 71.5 14.9 24.0 41.8 57.8 72.6
2010-11 13.3 21.6 36.6 51.9 70.2 14.3 23.8 42.9 58.6 73.0
2011-12 15.1 24.5 40.0 55.0 72.4 14.8 25.3 46.3 62.2 77.0
2012-13 14.5 22.3 38.5 54.7 71.5 14.3 24.7 46.7 63.1 77.2 85.4 94.2 98.2 99.6 100.0
Apr-13 18.2 26.3 42.4 58.0 74.5 14.2 25.3 47.7 65.1 80.0 89.4 97.0 99.5 100.0 100.0May-13 21.3 31.5 48.0 62.2 76.8 14.1 25.0 46.2 64.2 79.5 96.7 99.7 100.0 100.0 100.0Jun-13 19.3 27.9 44.3 58.5 74.3 14.0 25.7 48.6 65.6 79.8 96.4 99.2 100.0 100.0 100.0Jul-13 18.7 27.3 44.4 58.4 74.0 14.5 25.6 47.8 65.2 79.5 73.2 91.8 99.8 100.0 100.0Aug-13 20.6 29.1 45.6 61.1 75.9 14.5 26.7 50.3 67.8 82.0 89.7 97.9 99.9 100.0 100.0Sep-13 19.5 27.7 42.3 57.6 73.5 15.0 26.7 48.9 66.1 80.6 96.7 99.5 100.0 100.0 100.0Oct-13 18.3 26.3 42.3 57.1 72.7 15.2 24.8 45.8 63.3 78.5 86.5 99.2 100.0 100.0 100.0Nov-13 17.4 26.9 42.9 58.3 73.9 14.2 24.1 44.9 63.2 78.3 87.1 99.8 100.0 100.0 100.0Dec-13 17.0 25.9 42.1 57.8 73.8 14.1 24.2 45.5 63.1 78.0 88.1 99.7 100.0 100.0 100.0
Notes: 1. Cash segment of MCX-SX commenced its operations from Feb 11, 2013.
2. Data for Top N scrips has been compiled for all markets except Auction market & Retail Debt Market and includes series EQ,
BE,BT, BL and IL
$ indicates as on December 31, 2013
NA: Not Applicable
Source: BSE, NSE and MCX-SX.
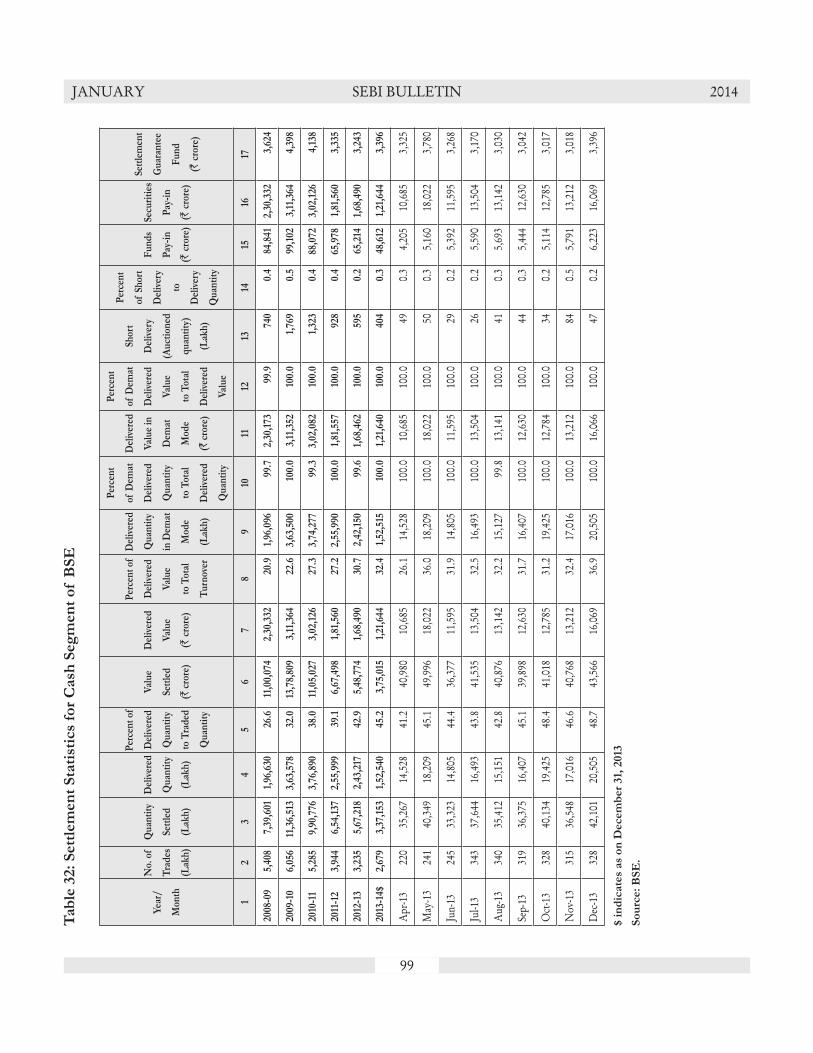
99
JANUARY SEBI BULLETIN 2014T
ab
le 3
2:
Sett
lem
en
t S
tati
stic
s fo
r C
ash
Seg
men
t o
f B
SE
Yea
r/
Mon
th
No.
of
Tra
des
(Lak
h)
Qu
anti
ty
Sett
led
(Lak
h)
Del
iver
ed
Qu
anti
ty
(Lak
h)
Per
cen
t of
Del
iver
ed
Qu
anti
ty
to T
rad
ed
Qu
anti
ty
Val
ue
Sett
led
(` c
rore
)
Del
iver
ed
Val
ue
(` c
rore
)
Per
cen
t of
Del
iver
ed
Val
ue
to T
otal
Tu
rnov
er
Del
iver
ed
Qu
anti
ty
in D
emat
Mod
e
(Lak
h)
Per
cen
t
of D
emat
Del
iver
ed
Qu
anti
ty
to T
otal
Del
iver
ed
Qu
anti
ty
Del
iver
ed
Val
ue
in
Dem
at
Mod
e
(` c
rore
)
Per
cen
t
of D
emat
Del
iver
ed
Val
ue
to T
otal
Del
iver
ed
Val
ue
Shor
t
Del
iver
y
(Au
ctio
ned
qu
anti
ty)
(Lak
h)
Per
cen
t
of S
hor
t
Del
iver
y
to
Del
iver
y
Qu
anti
ty
Fu
nd
s
Pay
-in
(` c
rore
)
Secu
riti
es
Pay
-in
(` c
rore
)
Sett
lem
ent
Gu
aran
tee
Fu
nd
(` c
rore
)
12
34
56
78
910
1112
1314
1516
17
2008
-09
5,40
87,
39,6
011,
96,6
3026
.611
,00,
074
2,30
,332
20.9
1,96
,096
99.7
2,30
,173
99.9
740
0.4
84,8
412,
30,3
323,
624
2009
-10
6,05
611
,36,
513
3,63
,578
32.0
13,7
8,80
93,
11,3
6422
.63,
63,5
0010
0.0
3,11
,352
100.
01,
769
0.5
99,1
023,
11,3
644,
398
2010
-11
5,28
59,
90,7
763,
76,8
9038
.011
,05,
027
3,02
,126
27.3
3,74
,277
99.3
3,02
,082
100.
01,
323
0.4
88,0
723,
02,1
264,
138
2011
-12
3,94
46,
54,1
372,
55,9
9939
.16,
67,4
981,
81,5
6027
.22,
55,9
9010
0.0
1,81
,557
100.
092
80.
465
,978
1,81
,560
3,33
5
2012
-13
3,23
55,
67,2
182,
43,2
1742
.95,
48,7
741,
68,4
9030
.72,
42,1
5099
.61,
68,4
6210
0.0
595
0.2
65,2
141,
68,4
903,
243
2013
-14$
2,67
93,
37,1
531,
52,5
4045
.23,
75,0
151,
21,6
4432
.41,
52,5
1510
0.0
1,21
,640
100.
040
40.
348
,612
1,21
,644
3,39
6
Apr
-13
220
35,2
6714
,528
41.2
40,9
8010
,685
26.1
14,5
2810
0.0
10,6
8510
0.0
490.
34,
205
10,6
853,
325
May
-13
241
40,3
4918
,209
45.1
49,9
9618
,022
36.0
18,2
0910
0.0
18,0
2210
0.0
500.
35,
160
18,0
223,
780
Jun-
1324
533
,323
14,8
0544
.436
,377
11,5
9531
.914
,805
100.
011
,595
100.
029
0.2
5,39
211
,595
3,26
8
Jul-1
334
337
,644
16,4
9343
.841
,535
13,5
0432
.516
,493
100.
013
,504
100.
026
0.2
5,59
013
,504
3,17
0
Aug
-13
340
35,4
1215
,151
42.8
40,8
7613
,142
32.2
15,1
2799
.813
,141
100.
041
0.3
5,69
313
,142
3,03
0
Sep-
1331
936
,375
16,4
0745
.139
,898
12,6
3031
.716
,407
100.
012
,630
100.
044
0.3
5,44
412
,630
3,04
2
Oct
-13
328
40,1
3419
,425
48.4
41,0
1812
,785
31.2
19,4
2510
0.0
12,7
8410
0.0
340.
25,
114
12,7
853,
017
Nov
-13
315
36,5
4817
,016
46.6
40,7
6813
,212
32.4
17,0
1610
0.0
13,2
1210
0.0
840.
55,
791
13,2
123,
018
Dec
-13
328
42,1
0120
,505
48.7
43,5
6616
,069
36.9
20,5
0510
0.0
16,0
6610
0.0
470.
26,
223
16,0
693,
396
$ i
nd
icate
s as
on
Decem
ber
31,
2013
So
urc
e:
BS
E.

100
JANUARY SEBI BULLETIN 2014T
ab
le 3
3:
Sett
lem
en
t S
tati
stic
s fo
r C
ash
Seg
men
t o
f N
SE
Yea
r/
Mo
nth
No
. o
f
Tra
des
(Lak
h)
Qu
anti
ty
Set
tled
(Lak
h)
Del
iver
ed
Qu
anti
ty
(Lak
h)
Per
cen
t o
f
Del
iver
ed
Qu
anti
ty
to T
rad
ed
Qu
anti
ty
Val
ue
Set
tled
(` c
rore
)
Del
iver
ed
Val
ue
(` c
rore
)
Per
cen
t o
f
Del
iver
ed
Val
ue
to T
ota
l
Tu
rno
ver
Del
iver
ed
Qu
anti
ty
in D
emat
Mo
de
(Lak
h)
Per
cen
t
of
Dem
at
Del
iver
ed
Qu
anti
ty
to T
ota
l
Del
iver
ed
Qu
anti
ty
Del
iver
ed
Val
ue
in
Dem
at
Mo
de
(` c
rore
)
Per
cen
t
of
Dem
at
Del
iver
ed
Val
ue
to T
ota
l
Del
iver
ed
Val
ue
Sh
ort
Del
iver
y
(Au
ctio
ned
qu
anti
ty)
(Lak
h)
Per
cen
t
of
Sh
ort
Del
iver
y
to
Del
iver
y
Qu
anti
ty
Fu
nd
s
Pay
-in
(` c
rore
)
Sec
uri
ties
Pay
-in
(` c
rore
)
Set
tlem
ent
Gu
aran
tee
Fu
nd
(` c
rore
)
12
34
56
78
910
1112
1314
1516
17
2008
-09
13,6
3914
,18,
928
3,03
,299
21.4
27,4
9,45
06,
10,4
9822
.23,
03,2
9910
0.0
6,10
,498
100.
062
50.
22,
20,7
046,
10,4
984,
844
2009
-10
16,7
8822
,05,
878
4,73
,952
21.5
41,2
9,21
49,
16,4
6022
.24,
73,9
5210
0.0
9,16
,460
100.
086
20.
22,
78,3
879,
16,4
605,
547
2010
-11
15,4
8018
,10,
910
4,97
,367
27.5
35,6
5,19
59,
78,0
1527
.44,
97,3
6710
0.0
9,78
,015
100.
090
30.
22,
93,3
579,
79,2
695,
100
2011
-12
14,3
7216
,05,
205
4,43
,232
27.6
28,0
3,88
97,
84,4
0728
.04,
43,2
3210
0.0
7,84
,407
100.
070
20.
22,
51,7
547,
85,2
684,
821
2012
-13
13,5
7416
,44,
259
4,59
,349
27.9
27,0
0,65
67,
96,7
8429
.54,
59,3
4910
0.0
7,96
,784
100.
066
10.
12,
51,0
347,
97,5
044,
732
2013
-14$
10,8
8011
,43,
461
3,18
,651
27.9
20,8
6,13
16,
14,2
9129
.43,
18,6
5110
0.0
6,14
,291
100.
046
40.
12,
04,2
496,
14,7
884,
302
Apr
-13
1,10
61,
19,1
1132
,248
27.1
2,11
,212
61,2
1729
.032
,248
100.
061
,217
100.
055
0.2
19,8
6661
,273
4,67
6
May
-13
1,22
71,
25,2
6134
,576
27.6
2,36
,531
68,1
8328
.834
,576
100.
068
,183
100.
067
0.2
21,5
7768
,263
4,84
7
Jun-
131,
119
1,14
,499
32,0
2128
.02,
05,9
0764
,118
31.1
32,0
2110
0.0
64,1
1810
0.0
480.
223
,232
64,1
674,
699
Jul-1
31,
287
1,32
,615
37,2
8628
.12,
47,1
2575
,586
30.6
37,2
8610
0.0
75,5
8610
0.0
550.
223
,748
75,6
384,
551
Aug
-13
1,36
01,
34,6
1535
,919
26.7
2,42
,937
71,1
3029
.335
,919
100.
071
,130
100.
047
0.1
24,0
8571
,175
4,11
5
Sep-
131,
300
1,35
,780
38,6
6528
.52,
56,4
0974
,608
29.1
38,6
6510
0.0
74,6
0810
0.0
470.
125
,825
74,6
754,
195
Oct
-13
1,16
71,
25,3
0433
,501
26.7
2,28
,521
62,7
5927
.533
,501
100.
062
,759
100.
048
0.1
19,3
8462
,810
4,14
9
Nov
-13
1,13
91,
21,2
0934
,084
28.1
2,22
,304
63,8
0828
.734
,084
100.
063
,808
100.
045
0.1
21,5
0463
,857
4,29
5
Dec
-13
1,17
61,
35,0
6840
,351
29.9
2,35
,184
72,8
8331
.040
,351
100.
072
,883
100.
050
0.1
25,0
2872
,930
4,30
2
$ i
nd
icate
s as
on
Decem
ber
31,
2013
So
urc
e:
NS
E.

101
JANUARY SEBI BULLETIN 2014T
ab
le 3
4:
Sett
lem
en
t S
tati
stic
s fo
r C
ash
Seg
men
t o
f M
CX
-SX
Yea
r/
Mo
nth
No
. o
f
Tra
des
(Lak
h)
Qu
anti
ty
Set
tled
(Lak
h)
Del
iver
ed
Qu
anti
ty
(Lak
h)
Per
cen
t o
f
Del
iver
ed
Qu
anti
ty
to T
rad
ed
Qu
anti
ty
Val
ue
Set
tled
(` c
rore
)
Del
iver
ed
Val
ue
(` c
rore
)
Per
cen
t
of
Del
iver
ed
Val
ue
to T
ota
l
Tu
rno
ver
Del
iver
ed
Qu
anti
ty
in D
emat
Mo
de
(Lak
h)
Per
cen
t
of
Dem
at
Del
iver
ed
Qu
anti
ty
to T
ota
l
Del
iver
ed
Qu
anti
ty
Del
iver
ed
Val
ue
in
Dem
at
Mo
de
(` c
rore
)
Per
cen
t o
f
Dem
at D
e-
live
red
Val
-
ue
to T
ota
l
Del
iver
ed
Val
ue
Sh
ort
Del
iver
y
(Au
ctio
ned
qu
anti
ty)
(Lak
h)
Per
cen
t
of
Sh
ort
Del
iver
y to
Del
iver
y
Qu
anti
ty
Fu
nd
s
Pay
-in
(` c
rore
)
Sec
uri
ties
Pay
-in
(` c
rore
)
Set
tlem
ent
Gu
aran
tee
Fu
nd
(` c
rore
)
12
34
56
78
910
1112
1314
1516
17
2008
-09
NA
2009
-10
2010
-11
2011
-12
2012
-13
017
01.
825
28.
30
100.
02
100.
00
0.1
22
57
2013
-14$
151,
852
432.
310
,291
232
2.3
4310
0.0
232
100.
00
0.4
135
232
52
Apr
-13
04
114
.525
624
.31
100.
06
100.
00
0.1
56
58
May
-13
220
34
1.9
1,78
324
1.4
410
0.0
2410
0.0
00.
413
2461
Jun-
133
441
92.
03,
267
491.
59
100.
049
100.
00
0.1
2349
64
Jul-1
32
456
102.
21,
037
484.
710
100.
048
100.
00
0.1
3248
68
Aug
-13
222
46
2.5
1,04
129
2.8
610
0.0
2910
0.0
00.
115
2954
Sep-
132
210
41.
91,
048
222.
14
100.
022
100.
00
1.3
1622
53
Oct
-13
319
24
2.1
1,09
019
1.8
410
0.0
1910
0.0
01.
311
1951
Nov
-13
292
33.
674
821
2.8
310
0.0
2110
0.0
01.
014
2152
Dec
-13
131
27.
825
214
5.6
210
0.0
1410
0.0
00.
57
1452
No
tes:
1.
Cash
seg
men
t o
f M
CX
-SX
co
mm
en
ced
its
op
era
tio
ns
fro
m F
eb 1
1, 2
013
.
$ i
nd
icate
s as
on
Decem
ber
31,
2013
NA
: N
ot
Ap
pli
cab
le
So
urc
e:
MC
X-S
X.
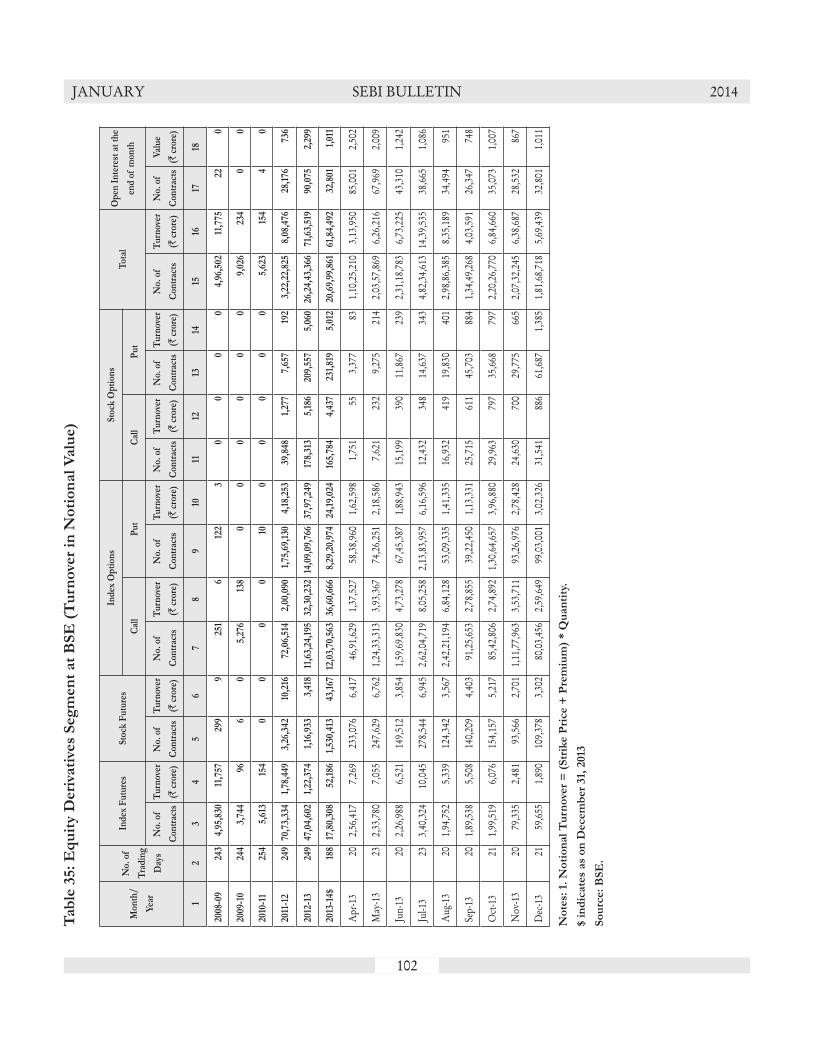
102
JANUARY SEBI BULLETIN 2014T
ab
le 3
5:
Eq
uit
y D
eri
vati
ves
Seg
men
t at
BS
E (
Tu
rno
ver
in N
oti
on
al
Valu
e)
Mon
th/
Yea
r
No.
of
Tra
din
g
Day
s
Ind
ex F
utu
res
Stoc
k F
utu
res
Ind
ex O
pti
ons
Stoc
k O
pti
ons
Tot
alO
pen
In
tere
st a
t th
e
end
of
mon
thC
all
Pu
tC
all
Pu
t
No.
of
Con
trac
ts
Tu
rnov
er
(` c
rore
)
No.
of
Con
trac
ts
Tu
rnov
er
(` c
rore
)
No.
of
Con
trac
ts
Tu
rnov
er
(` c
rore
)
No.
of
Con
trac
ts
Tu
rnov
er
(` c
rore
)
No.
of
Con
trac
ts
Tu
rnov
er
(` c
rore
)
No.
of
Con
trac
ts
Tu
rnov
er
(` c
rore
)
No.
of
Con
trac
ts
Tu
rnov
er
(` c
rore
)
No.
of
Con
trac
ts
Val
ue
(` c
rore
)
12
34
56
78
910
1112
1314
1516
1718
2008
-09
243
4,95
,830
11,7
5729
99
251
612
23
00
00
4,96
,502
11,7
7522
0
2009
-10
244
3,74
496
60
5,27
613
80
00
00
09,
026
234
00
2010
-11
254
5,61
315
40
00
010
00
00
05,
623
154
40
2011
-12
249
70,7
3,33
41,
78,4
493,
26,3
4210
,216
72,0
6,51
42,
00,0
901,
75,6
9,13
04,
18,2
5339
,848
1,27
77,
657
192
3,22
,22,
825
8,08
,476
28,1
7673
6
2012
-13
249
47,0
4,60
21,
22,3
741,
16,9
333,
418
11,6
3,24
,195
32,3
0,23
214
,09,
09,7
6637
,97,
249
178,
313
5,18
620
9,55
75,
060
26,2
4,43
,366
71,6
3,51
990
,075
2,29
9
2013
-14$
188
17,8
0,30
852
,186
1,53
0,41
343
,167
12,0
3,70
,563
36,6
0,66
68,
29,2
0,97
424
,19,
024
165,
784
4,43
723
1,81
95,
012
20,6
9,99
,861
61,8
4,49
232
,801
1,01
1
Apr
-13
202,
56,4
177,
269
233,
076
6,41
746
,91,
629
1,37
,527
58,3
8,96
01,
62,5
981,
751
553,
377
831,
10,2
5,21
03,
13,9
5085
,001
2,50
2
May
-13
232,
33,7
807,
055
247,
629
6,76
21,
24,3
3,31
33,
93,3
6774
,26,
251
2,18
,586
7,62
123
29,
275
214
2,03
,57,
869
6,26
,216
67,9
692,
009
Jun-
1320
2,26
,988
6,52
114
9,51
23,
854
1,59
,69,
830
4,73
,278
67,4
5,38
71,
88,9
4315
,199
390
11,8
6723
92,
31,1
8,78
36,
73,2
2543
,310
1,24
2
Jul-1
323
3,40
,324
10,0
4527
8,54
46,
945
2,62
,04,
719
8,05
,258
2,13
,83,
957
6,16
,596
12,4
3234
814
,637
343
4,82
,34,
613
14,3
9,53
538
,665
1,08
6
Aug
-13
201,
94,7
525,
339
124,
342
3,56
72,
42,2
1,19
46,
84,1
2853
,09,
335
1,41
,335
16,9
3241
919
,830
401
2,98
,86,
385
8,35
,189
34,4
9495
1
Sep-
1320
1,89
,538
5,50
814
0,20
94,
403
91,2
5,65
32,
78,8
5539
,22,
450
1,13
,331
25,7
1561
145
,703
884
1,34
,49,
268
4,03
,591
26,3
4774
8
Oct
-13
211,
99,5
196,
076
154,
157
5,21
785
,42,
806
2,74
,892
1,30
,64,
657
3,96
,880
29,9
6379
735
,668
797
2,20
,26,
770
6,84
,660
35,0
731,
007
Nov
-13
2079
,335
2,48
193
,566
2,70
11,
11,7
7,96
33,
53,7
1193
,26,
976
2,78
,428
24,6
3070
029
,775
665
2,07
,32,
245
6,38
,687
28,5
3286
7
Dec
-13
2159
,655
1,89
010
9,37
83,
302
80,0
3,45
62,
59,6
4999
,03,
001
3,02
,326
31,5
4188
661
,687
1,38
51,
81,6
8,71
85,
69,4
3932
,801
1,01
1
No
tes:
1.
No
tio
nal
Tu
rno
ver
= (
Str
ike P
rice +
Pre
miu
m)
* Q
uan
tity
.
$ i
nd
icate
s as
on
Decem
ber
31,
2013
So
urc
e:
BS
E.

103
JANUARY SEBI BULLETIN 2014T
ab
le 3
6:
Eq
uit
y D
eri
vati
ves
Seg
men
t at
NS
E (
Tu
rno
ver
in N
oti
on
al
Valu
e)
Mon
th/
Yea
r
No.
of
Tra
ding
Day
s
Inde
x F
utur
esSt
ock
Fut
ures
Inde
x O
ptio
nsSt
ock
Opt
ions
Tot
alO
pen
Inte
rest
at t
he
end
of m
onth
Cal
lP
utC
all
Put
No.
of
Con
trac
ts
Tur
nove
r
(` c
rore
)
No.
of
Con
trac
ts
Tur
nove
r
(` c
rore
)
No.
of
Con
trac
ts
Tur
nove
r
(` c
rore
)
No.
of
Con
trac
ts
Tur
nove
r
(` c
rore
)
No.
of
Con
trac
ts
Tur
nove
r
(` c
rore
)
No.
of
Con
trac
ts
Tur
nove
r
(` c
rore
)
No.
of
Con
trac
ts
Tur
nove
r
(` c
rore
)
No.
of
Con
trac
ts
Val
ue
(` c
rore
)
12
34
56
78
910
1112
1314
1516
1718
2008
-09
243
21,0
4,28
,103
35,7
0,11
122
,15,
77,9
8034
,79,
642
11,0
4,31
,974
20,0
2,54
410
,16,
56,4
7017
,28,
957
97,6
2,96
81,
71,8
4335
,33,
002
57,3
8465
,73,
90,4
971,
10,1
0,48
232
,27,
759
57,7
05
2009
-10
244
17,8
3,06
,889
39,3
4,38
914
,55,
91,2
4051
,95,
247
16,7
6,83
,928
40,4
9,26
617
,36,
95,5
9539
,78,
699
1,06
,14,
147
3,89
,158
34,0
2,12
31,
16,9
0767
,92,
93,9
221,
76,6
3,66
534
,89,
790
97,9
78
2010
-11
254
16,5
0,23
,653
43,5
6,75
518
,60,
41,4
5954
,95,
757
31,4
5,33
,244
90,9
0,70
233
,61,
05,3
1392
,74,
664
2,42
,73,
560
7,77
,109
82,3
4,83
32,
53,2
3510
3,42
,12,
062
2,92
,48,
221
36,9
0,37
31,
01,8
16
2011
-12
249
14,6
1,88
,740
35,7
7,99
815
,83,
44,6
1740
,74,
671
42,8
0,34
,677
1,15
,54,
301
43,5
9,83
,059
1,11
,65,
731
2,45
,65,
283
6,71
,770
1,19
,29,
088
3,05
,261
120,
50,4
5,46
43,
13,4
9,73
233
,44,
473
89,0
49
2012
-13
249
9,61
,00,
385
25,2
7,13
114
,77,
11,6
9142
,23,
872
40,8
5,30
,477
1,15
,81,
485
41,2
3,46
,672
1,12
,00,
089
4,24
,99,
219
13,0
2,77
92,
42,7
8,97
46,
97,6
4811
3,14
,67,
418
3,15
,33,
004
30,4
1,19
285
,952
2013
-14$
188
8,23
,03,
673
23,8
4,31
212
,92,
55,1
2635
,83,
036
35,1
1,51
,655
1,06
,08,
794
36,9
3,40
,488
1,06
,50,
766
3,78
,66,
170
11,1
4,66
62,
27,5
9,95
16,
31,6
8199
,26,
77,0
632,
89,7
3,25
434
,65,
265
1,10
,212
Apr-1
320
72,22
,107
2,08,5
901,2
2,51,7
533,6
5,064
3,66,6
8,657
10,73
,820
3,96,5
2,676
11,18
,649
48,59
,702
1,51,0
7431
,93,88
892
,965
10,38
,48,78
330
,10,16
339
,76,67
11,1
6,182
May
-1323
79,91
,561
2,45,7
831,4
0,19,1
614,0
9,851
4,10,9
6,623
12,80
,250
4,48,2
9,941
13,41
,397
47,52
,926
1,44,9
8428
,31,96
881
,537
11,55
,22,18
035
,03,80
136
,71,32
81,0
7,372
Jun-
1320
85,01
,380
2,46,3
511,2
7,19,9
063,4
3,493
4,30,5
0,058
12,77
,075
4,06,2
8,761
11,60
,862
36,95
,971
1,05,9
4921
,17,13
557
,156
11,07
,13,21
131
,90,88
735
,96,97
71,0
2,791
Jul-1
323
87,04
,083
2,53,6
441,5
2,23,4
664,2
8,504
3,53,7
0,256
10,70
,559
4,05,8
0,664
11,80
,855
50,86
,783
1,55,4
0331
,90,61
491
,427
10,81
,55,86
631
,80,39
341
,54,44
71,1
4,454
Aug-1
320
1,24,3
3,264
3,27,7
351,6
9,77,0
824,1
0,088
5,06,2
9,713
14,23
,125
5,51,7
0,680
14,77
,853
43,16
,576
1,10,0
1826
,96,55
965
,102
14,22
,23,87
438
,13,92
141
,09,32
41,0
8,286
Sep-1
320
1,12,8
6,692
3,17,1
541,4
8,61,4
023,8
7,799
4,13,6
2,175
12,43
,097
4,56,8
9,156
12,81
,648
35,79
,164
97,93
321
,33,57
853
,926
11,89
,12,16
733
,81,55
837
,03,28
01,0
2,738
Oct-
1321
1,00,5
1,520
2,97,0
261,4
6,28,8
374,1
6,432
3,66,3
3,979
11,45
,230
3,83,3
8,438
11,36
,579
42,49
,659
1,33,3
7626
,07,97
377
,423
10,65
,10,40
632
,06,06
634
,96,54
71,0
6,976
Nov
-1320
84,91
,211
2,54,0
561,4
4,28,8
653,9
7,676
3,43,9
5,126
10,73
,927
3,34,4
1,596
10,06
,011
38,38
,994
1,09,6
7121
,03,99
957
,164
9,66,9
9,791
28,98
,504
38,43
,205
1,13,9
11
Dec-1
321
76,21
,855
2,33,9
731,4
1,44,6
544,2
4,128
3,19,4
5,068
10,21
,710
3,10,0
8,576
9,46,9
1134
,86,39
51,0
6,258
18,84
,237
54,98
19,0
0,90,7
8527
,87,96
234
,65,26
51,1
0,212
No
tes:
1.
No
tio
nal
Tu
rno
ver
= (
Str
ike P
rice +
Pre
miu
m)
* Q
uan
tity
.
$ i
nd
icate
s as
on
Decem
ber
31,
2013
So
urc
e:
NS
E.
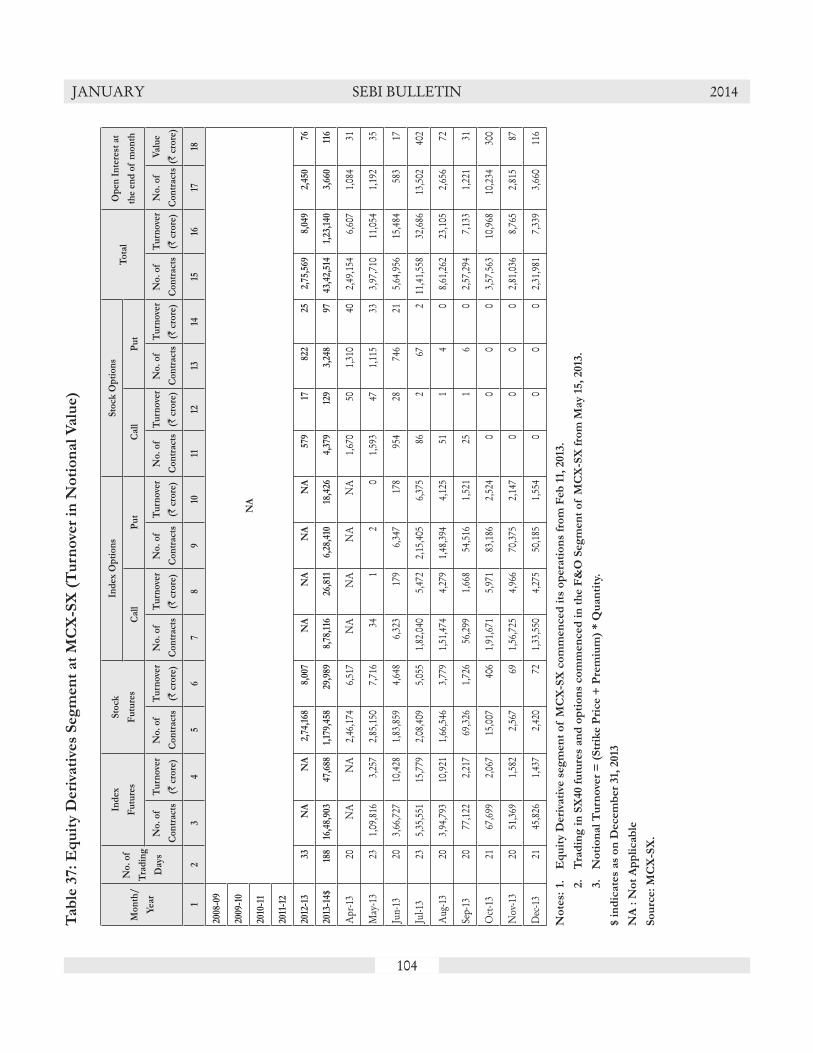
104
JANUARY SEBI BULLETIN 2014T
ab
le 3
7:
Eq
uit
y D
eri
vati
ves
Seg
men
t at
MC
X-S
X (
Tu
rno
ver
in N
oti
on
al
Valu
e)
Mo
nth
/
Yea
r
No
. o
f
Tra
din
g
Day
s
Ind
ex
Fu
ture
s
Sto
ck
Fu
ture
s
Ind
ex O
pti
on
sS
tock
Op
tio
ns
To
tal
Op
en I
nte
rest
at
the
end
of
mo
nth
Cal
lP
ut
Cal
lP
ut
No
. o
f
Co
ntr
acts
Tu
rno
ver
(` c
rore
)
No
. o
f
Co
ntr
acts
Tu
rno
ver
(` c
rore
)
No
. o
f
Co
ntr
acts
Tu
rno
ver
(` c
rore
)
No
. o
f
Co
ntr
acts
Tu
rno
ver
(` c
rore
)
No
. o
f
Co
ntr
acts
Tu
rno
ver
(` c
rore
)
No
. o
f
Co
ntr
acts
Tu
rno
ver
(` c
rore
)
No
. o
f
Co
ntr
acts
Tu
rno
ver
(` c
rore
)
No
. o
f
Co
ntr
acts
Val
ue
(` c
rore
)
12
34
56
78
910
1112
1314
1516
1718
2008
-09
NA
2009
-10
2010
-11
2011
-12
2012
-13
33N
AN
A2,
74,1
688,
007
NA
NA
NA
NA
579
1782
225
2,75
,569
8,04
92,
450
76
2013
-14$
188
16,4
8,90
347
,688
1,17
9,45
829
,989
8,78
,116
26,8
116,
28,4
1018
,426
4,37
912
93,
248
9743
,42,
514
1,23
,140
3,66
011
6
Apr
-13
20N
AN
A2,
46,1
746,
517
NA
NA
NA
NA
1,67
050
1,31
040
2,49
,154
6,60
71,
084
31
May
-13
231,
09,8
163,
257
2,85
,150
7,71
634
12
01,
593
471,
115
333,
97,7
1011
,054
1,19
235
Jun-
1320
3,66
,727
10,4
281,
83,8
594,
648
6,32
317
96,
347
178
954
2874
621
5,64
,956
15,4
8458
317
Jul-1
323
5,35
,551
15,7
792,
08,4
095,
055
1,82
,040
5,47
22,
15,4
056,
375
862
672
11,4
1,55
832
,686
13,5
0240
2
Aug
-13
203,
94,7
9310
,921
1,66
,546
3,77
91,
51,4
744,
279
1,48
,394
4,12
551
14
08,
61,2
6223
,105
2,65
672
Sep-
1320
77,1
222,
217
69,3
261,
726
56,2
991,
668
54,5
161,
521
251
60
2,57
,294
7,13
31,
221
31
Oct
-13
2167
,699
2,06
715
,007
406
1,91
,671
5,97
183
,186
2,52
40
00
03,
57,5
6310
,968
10,2
3430
0
Nov
-13
2051
,369
1,58
22,
567
691,
56,7
254,
966
70,3
752,
147
00
00
2,81
,036
8,76
52,
815
87
Dec
-13
2145
,826
1,43
72,
420
721,
33,5
504,
275
50,1
851,
554
00
00
2,31
,981
7,33
93,
660
116
No
tes:
1.
Eq
uit
y D
eri
vati
ve s
eg
men
t o
f M
CX
-SX
co
mm
en
ced
its
op
era
tio
ns
fro
m F
eb 1
1, 2
013
.
2.
Tra
din
g i
n S
X40 f
utu
res
an
d o
pti
on
s co
mm
en
ced
in
th
e F
&O
Seg
men
t o
f M
CX
-SX
fro
m M
ay 1
5,
2013
.
3.
No
tio
nal
Tu
rno
ver
= (
Str
ike P
rice +
Pre
miu
m)
* Q
uan
tity
.
$ i
nd
icate
s as
on
Decem
ber
31,
2013
NA
: N
ot
Ap
pli
cab
le
So
urc
e:
MC
X-S
X.

105
JANUARY SEBI BULLETIN 2014T
ab
le 3
8:
Eq
uit
y D
eri
vati
ves
Tra
din
g a
t B
SE
du
rin
g D
ecem
ber
2013
(T
urn
ove
r in
No
tio
nal
Valu
e)
Date
Ind
ex F
utu
res
Sto
ck
Fu
ture
s
Ind
ex O
pti
on
sS
tock
Op
tio
ns
To
tal
Tu
rno
ver
Op
en
In
tere
st
at
the e
nd
of
the d
ay
Call
sP
uts
C
all
sP
uts
No.
of
Con
-
trac
ts
Tu
rn-
over
(` c
rore
)
No.
of
Con
-
trac
ts
Tu
rn-
over
(` c
rore
)
No.
of
Con
trac
ts
Tu
rn-
over
(` c
rore
)
No.
of
Con
trac
ts
Tu
rn-
over
(` c
rore
)
No.
of
Con
-
trac
ts
Tu
rn-
over
(`
cror
e)
No.
of
Con
-
trac
ts
Tu
rn-
over
(` c
rore
)
No.
of
Con
trac
ts
Tu
rn-
over
(` c
rore
)
No.
of
con
-
trac
ts
Val
ue
(` c
rore
)
1 2
3
4
5
6
7
8
9
10
11
12
13
14
15
16
17
2-D
ec-1
32,
680
853,
911
114
4,24
113
813
1,92
74,
039
158
437
18
143,
288
4,38
929
,622
901
3-D
ec-1
31,
946
613,
658
115
2,17
571
135,
023
4,13
621
76
554
1114
3,57
34,
400
32,6
4499
5
4-D
ec-1
32,
284
724,
372
126
2,82
291
134,
675
4,13
535
99
886
1714
5,39
84,
450
35,2
101,
056
5-D
ec-1
33,
210
102
5,41
716
93,
093
100
203,
284
6,21
56,
623
189
12,9
6228
923
4,58
97,
063
56,0
331,
579
6-D
ec-1
32,
491
794,
680
142
3,18
010
416
5,94
95,
150
491
501
176,
399
5,47
735
,424
1,09
3
9-D
ec-1
32,
221
714,
672
156
7,55
724
730
0,22
49,
259
266
651
69
315,
456
9,74
935
,395
1,09
9
10-D
ec-1
32,
193
704,
637
147
332,
099
10,9
9010
,610
329
209
519
54
349,
943
11,5
4537
,158
1,15
0
11-D
ec-1
32,
164
694,
603
139
221,
886
7,28
915
8,79
84,
954
205
555
310
388,
209
12,4
6639
,052
1,19
7
12-D
ec-1
31,
790
574,
468
135
587,
321
19,2
5410
,431
323
6,98
120
011
,535
280
622,
526
20,2
4959
,421
1,71
7
13-D
ec-1
31,
904
604,
362
130
829,
676
26,9
4921
,476
668
181
271
857,
463
27,8
0741
,103
1,25
4
16-D
ec-1
32,
656
834,
497
134
663,
138
21,3
7332
,845
1,00
923
56
372
770
3,74
322
,611
42,6
211,
292
17-D
ec-1
32,
256
704,
521
134
16,5
1053
188
2,61
726
,459
265
730
56
906,
474
27,2
0743
,276
1,30
5
18-D
ec-1
32,
537
795,
400
156
33,4
991,
074
1,25
5,98
637
,614
246
61,
236
261,
298,
904
38,9
5644
,468
1,35
4
19-D
ec-1
32,
311
725,
677
169
1,08
6,82
334
,927
32,7
3299
57,
183
192
12,2
7829
31,
147,
004
36,6
4963
,993
1,84
2
20-D
ec-1
36,
027
190
4,87
914
897
4,03
631
,285
1,49
6,39
445
,383
60
180
2,48
1,36
077
,006
42,6
081,
326
23-D
ec-1
35,
037
161
7,42
521
941
6,20
813
,607
2,49
5,52
676
,577
186
463
314
2,92
5,01
590
,582
43,7
731,
356
24-D
ec-1
34,
653
148
9,90
328
61,
444,
053
47,1
2135
9,25
311
,046
338
976
316
1,81
8,96
358
,625
45,1
411,
387
26-D
ec-1
34,
307
137
8,93
527
31,
357,
529
43,9
201,
431,
281
44,0
447,
427
214
16,6
3235
22,
826,
111
88,9
4076
,799
2,20
7
27-D
ec-1
33,
067
984,
632
140
5,45
617
828
0,87
48,
675
30
379
829
4,41
19,
100
25,3
0778
1
30-D
ec-1
32,
120
684,
532
138
7,87
225
915
3,42
54,
784
242
988
820
169,
079
5,27
830
,346
932
31-D
ec-1
31,
801
584,
197
132
4,28
214
120
9,67
16,
532
325
1253
414
220,
810
6,88
932
,801
1,01
1
No
tes:
1.
Ind
ex F
utu
res,
In
dex O
pti
on
s, S
tock
Op
tio
ns
an
d S
tock
Fu
ture
s w
ere
in
tro
du
ced
in
Sep
tem
ber
2000,
Sep
tem
ber
2001,
Sep
tem
ber
2001
an
d
No
vem
ber
2001,
resp
ecti
vely
.
2.
Op
en
in
tere
st v
alu
e i
s co
mp
ute
d a
s U
nd
erl
yin
g c
lose
pri
ce*Q
uan
tity
.
3.
No
tio
nal
Tu
rno
ver
= (
Str
ike P
rice +
Pre
miu
m)
* Q
uan
tity
.
So
urc
e :
BS
E.
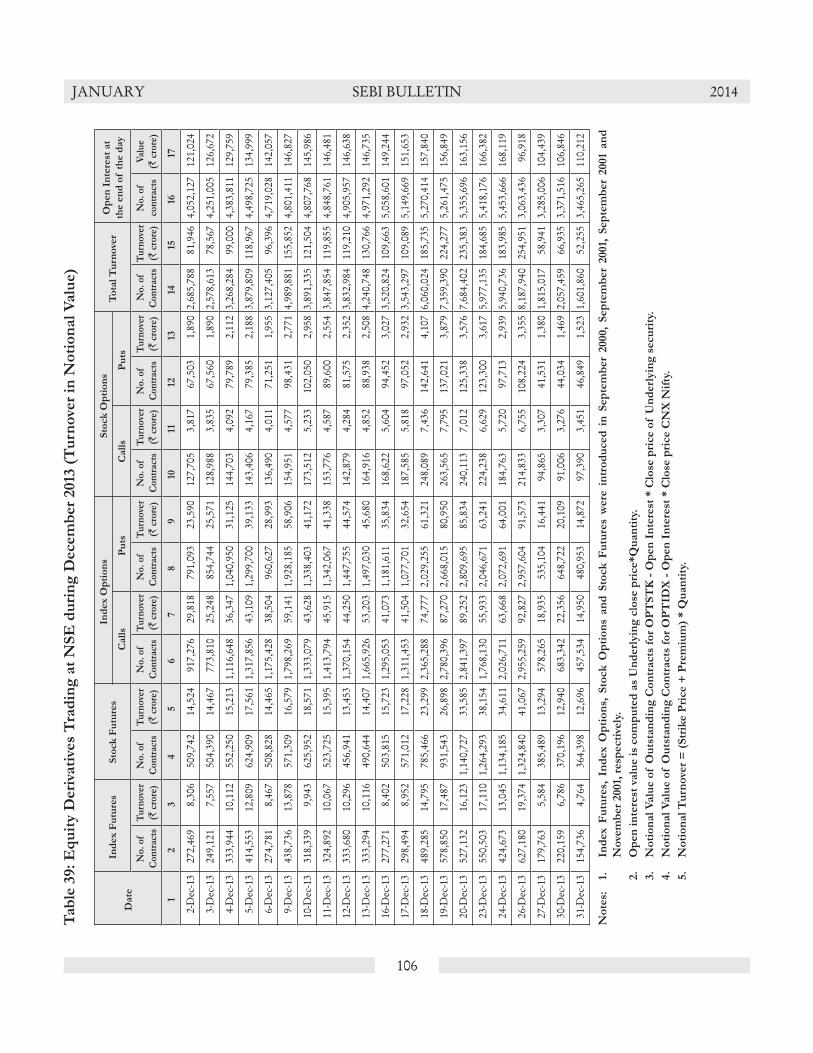
106
JANUARY SEBI BULLETIN 2014T
ab
le 3
9:
Eq
uit
y D
eri
vati
ves
Tra
din
g a
t N
SE
du
rin
g D
ecem
ber
2013
(T
urn
ove
r in
No
tio
nal
Valu
e)
Date
Ind
ex F
utu
res
Sto
ck
Fu
ture
sIn
dex O
pti
on
sS
tock
Op
tio
ns
To
tal
Tu
rno
ver
Op
en
In
tere
st a
t
the e
nd
of t
he d
ay
Call
sP
uts
Call
sP
uts
No
. o
f
Co
ntr
acts
Tu
rno
ver
(` c
rore
)
No
. o
f
Co
ntr
acts
Tu
rno
ver
(` c
rore
)
No
. o
f
Co
ntr
acts
Tu
rno
ver
(` c
rore
)
No
. o
f
Co
ntr
acts
Tu
rno
ver
(` c
rore
)
No
. o
f
Co
ntr
acts
Tu
rno
ver
(` c
rore
)
No
. o
f
Co
ntr
acts
Tu
rno
ver
(` c
rore
)
No
. o
f
Co
ntr
acts
Tu
rno
ver
(` c
rore
)
No
. o
f
con
trac
ts
Val
ue
(` c
rore
)
1 2
3
4
5
6
7
8
9
10
11
12
13
14
15
16
17
2-D
ec-1
327
2,46
9 8,
306
509
,742
1
4,52
4 91
7,27
6 29
,818
7
91,0
93
23,5
90
127,
705
3,81
7 67
,503
1,
890
2,68
5,78
8 81
,946
4,
052,
127
121,
024
3-D
ec-1
324
9,12
1 7,
557
504
,390
1
4,46
7 77
3,81
0 25
,248
8
54,7
44
25,5
71
128,
988
3,83
5 67
,560
1,
890
2,57
8,61
3 78
,567
4,
251,
005
126,
672
4-D
ec-1
333
3,94
4 1
0,11
2 5
52,2
50
15,
213
1,1
16,6
48
36,3
47
1,04
0,95
0 31
,125
14
4,70
3 4,
092
79,7
89
2,11
2 3,
268,
284
99,0
00
4,38
3,81
1 12
9,75
9
5-D
ec-1
341
4,55
3 1
2,80
9 6
24,9
09
17,
561
1,3
17,8
56
43,1
09
1,29
9,70
0 39
,133
14
3,40
6 4,
167
79,3
85
2,18
8 3,
879,
809
118,
967
4,49
8,72
5 13
4,99
9
6-D
ec-1
327
4,78
1 8,
467
508
,828
1
4,46
5 1
,175
,428
38
,504
9
60,6
27
28,9
93
136,
490
4,01
1 71
,251
1,
955
3,12
7,40
5 96
,396
4,
719,
028
142,
057
9-D
ec-1
343
8,73
6 1
3,87
8 5
71,3
09
16,
579
1,7
98,2
69
59,1
41
1,92
8,18
5 58
,906
15
4,95
1 4,
577
98,4
31
2,77
1 4,
989,
881
155,
852
4,80
1,41
1 14
6,82
7
10-D
ec-1
331
8,33
9 9,
943
625
,952
1
8,57
1 1
,333
,079
43
,628
1,
338,
403
41,1
72
173,
512
5,23
3 10
2,05
0 2,
958
3,89
1,33
5 12
1,50
4 4,
807,
768
145,
986
11-D
ec-1
332
4,89
2 1
0,06
7 5
23,7
25
15,
395
1,4
13,7
94
45,9
15
1,34
2,06
7 41
,338
15
3,77
6 4,
587
89,6
00
2,55
4 3,
847,
854
119,
855
4,84
8,76
1 14
6,48
1
12-D
ec-1
333
3,68
0 1
0,29
6 4
56,9
41
13,
453
1,3
70,1
54
44,2
50
1,44
7,75
5 44
,574
14
2,87
9 4,
284
81,5
75
2,35
2 3,
832,
984
119,
210
4,90
5,95
7 14
6,63
8
13-D
ec-1
333
3,29
4 1
0,11
6 4
90,6
44
14,
407
1,6
65,9
26
53,2
03
1,49
7,03
0 45
,680
16
4,91
6 4,
852
88,9
38
2,50
8 4,
240,
748
130,
766
4,97
1,29
2 14
6,73
5
16-D
ec-1
327
7,27
1 8,
402
503
,815
1
5,72
3 1
,295
,053
41
,073
1,
181,
611
35,8
34
168,
622
5,60
4 94
,452
3,
027
3,52
0,82
4 10
9,66
3 5,
058,
601
149,
244
17-D
ec-1
329
8,49
4 8,
952
571
,012
1
7,22
8 1
,311
,453
41
,504
1,
077,
701
32,6
54
187,
585
5,81
8 97
,052
2,
932
3,54
3,29
7 10
9,08
9 5,
149,
669
151,
653
18-D
ec-1
348
9,28
5 1
4,79
5 7
85,4
66
23,
299
2,3
65,2
88
74,7
77
2,02
9,25
5 61
,321
24
8,08
9 7,
436
142,
641
4,10
7 6,
060,
024
185,
735
5,27
0,41
4 15
7,84
0
19-D
ec-1
357
8,85
0 1
7,48
7 9
31,5
43
26,
898
2,7
80,3
96
87,2
70
2,66
8,01
5 80
,950
26
3,56
5 7,
795
137,
021
3,87
9 7,
359,
390
224,
277
5,26
1,47
5 15
6,84
9
20-D
ec-1
352
7,13
2 1
6,12
3 1
,140
,727
3
3,58
5 2
,841
,397
89
,252
2,
809,
695
85,8
34
240,
113
7,01
2 12
5,33
8 3,
576
7,68
4,40
2 23
5,38
3 5,
355,
696
163,
156
23-D
ec-1
355
0,50
3 1
7,11
0 1
,264
,293
3
8,15
4 1
,768
,130
55
,933
2,
046,
671
63,2
41
224,
238
6,62
9 12
3,30
0 3,
617
5,97
7,13
5 18
4,68
5 5,
418,
176
166,
382
24-D
ec-1
342
4,67
3 1
3,04
5 1
,134
,185
3
4,61
1 2
,026
,711
63
,668
2,
072,
691
64,0
01
184,
763
5,72
0 97
,713
2,
939
5,94
0,73
6 18
3,98
5 5,
453,
666
168,
119
26-D
ec-1
362
7,18
0 1
9,37
4 1
,324
,840
4
1,06
7 2
,955
,259
92
,827
2,
957,
604
91,5
73
214,
833
6,75
5 10
8,22
4 3,
355
8,18
7,94
0 25
4,95
1 3,
063,
436
96,9
18
27-D
ec-1
317
9,76
3 5,
584
385
,489
1
3,29
4 57
8,26
5 18
,935
5
35,1
04
16,4
41
94,8
65
3,30
7 41
,531
1,
380
1,81
5,01
7 58
,941
3,
285,
006
104,
439
30-D
ec-1
322
0,15
9 6,
786
370
,196
1
2,94
0 68
3,34
2 22
,356
6
48,7
22
20,1
09
91,0
06
3,27
6 44
,034
1,
469
2,05
7,45
9 66
,935
3,
371,
516
106,
846
31-D
ec-1
315
4,73
6 4,
764
364
,398
1
2,69
6 45
7,53
4 14
,950
4
80,9
53
14,8
72
97,3
90
3,45
1 46
,849
1,
523
1,60
1,86
0 52
,255
3,
465,
265
110,
212
No
tes:
1.
In
dex F
utu
res,
In
dex O
pti
on
s, S
tock
Op
tio
ns
an
d S
tock
Fu
ture
s w
ere
in
tro
du
ced
in
Sep
tem
ber
2000,
Sep
tem
ber
2001,
Sep
tem
ber
2001
an
d
No
vem
ber
2001,
resp
ecti
vely
.
2.
O
pen
in
tere
st v
alu
e i
s co
mp
ute
d a
s U
nd
erl
yin
g c
lose
pri
ce*Q
uan
tity
.
3.
No
tio
nal
Valu
e o
f O
uts
tan
din
g C
on
tracts
fo
r O
PT
ST
K -
Op
en
In
tere
st *
Clo
se p
rice o
f U
nd
erl
yin
g s
ecu
rity
.
4.
No
tio
nal
Valu
e o
f O
uts
tan
din
g C
on
tracts
fo
r O
PT
IDX
- O
pen
In
tere
st *
Clo
se p
rice C
NX
Nif
ty.
5.
No
tio
nal
Tu
rno
ver
= (
Str
ike P
rice +
Pre
miu
m)
* Q
uan
tity
.

107
JANUARY SEBI BULLETIN 2014T
ab
le 4
0:
Eq
uit
y D
eri
vati
ves
Tra
din
g a
t M
CX
-SX
du
rin
g D
ecem
ber
2013
(T
urn
ove
r in
No
tio
nal
Valu
e)
Date
Ind
ex F
utu
res
Sto
ck
Fu
ture
sIn
dex O
pti
on
sS
tock
Op
tio
ns
To
tal
Tu
rno
ver
Op
en
In
tere
st a
t
the e
nd
of t
he d
ay
Call
sP
uts
Call
sP
uts
No
. o
f
Co
ntr
acts
Tu
rno
ver
(` c
rore
)
No
. o
f
Co
ntr
acts
Tu
rno
ver
(` c
rore
)
No
. o
f
Co
ntr
acts
Tu
rno
ver
(` c
rore
)
No
. o
f
Co
ntr
acts
Tu
rno
ver
(` c
rore
)
No
. o
f
Co
ntr
acts
Tu
rno
ver
(` c
rore
)
No
. o
f
Co
ntr
acts
Tu
rno
ver
(` c
rore
)
No
. o
f
Co
ntr
acts
Tu
rno
ver
(` c
rore
)
No
. o
f
con
trac
ts
Val
ue
(` c
rore
)
1 2
3
4
5
6
7
8
9
10
11
12
13
14
15
16
17
2-D
ec-1
34,
922
154
47
1 2,
205
71
1,3
10
39
- -
- -
8,48
4 2
65
3,1
19
97
3-D
ec-1
34,
453
139
31
1 84
7 28
1
,195
3
6 -
- -
- 6,
526
203
3
,475
1
08
4-D
ec-1
33,
675
114
33
1 2,
974
97
645
19
- -
- -
7,32
7 2
31
3,5
78
111
5-D
ec-1
33,
701
116
69
2 1,
216
39
3,0
25
91
- -
- -
8,01
1 2
48
4,0
94
128
6-D
ec-1
31,
883
59
129
4 3,
002
97
748
23
- -
- -
5,76
2 1
83
4,2
88
134
9-D
ec-1
31,
391
44
73
2 3,
930
128
1,0
25
32
- -
- -
6,41
9 2
06
4,5
03
143
10-D
ec-1
32,
010
64
231
7 10
,899
35
4 3
,304
1
03
- -
- -
16,4
44
528
5
,034
1
60
11-D
ec-1
34,
539
143
119
3 14
,981
48
2 6
,160
1
94
- -
- -
25,7
99
822
5
,324
1
68
12-D
ec-1
32,
884
90
118
3 1,
121
36
1,6
12
50
- -
- -
5,73
5 1
80
5,5
80
174
13-D
ec-1
389
2 28
63
2
18,7
61
593
6,8
81
213
-
- -
- 26
,597
8
35
5,6
20
174
16-D
ec-1
386
7 27
61
2
6,70
5 21
1 1
0,34
9 3
25
- -
- -
17,9
82
565
5
,761
1
78
17-D
ec-1
367
5 21
10
8 4
9,46
4 29
8 2
,642
8
2 -
- -
- 12
,889
4
05
5,8
12
179
18-D
ec-1
31,
157
36
91
3 5,
830
183
2,8
34
87
- -
- -
9,91
2 3
08
5,8
68
183
19-D
ec-1
397
3 30
13
2 4
3,33
8 10
4 6
0
- -
- -
4,44
9 1
39
5,9
92
185
20-D
ec-1
31,
770
55
216
6 13
,777
43
3 1
,514
4
7 -
- -
- 17
,277
5
42
6,1
35
193
23-D
ec-1
31,
296
41
290
9 8,
048
256
824
25
- -
- -
10,4
58
331
6
,454
2
03
24-D
ec-1
32,
354
74
193
6 6,
831
222
1,4
00
43
- -
- -
10,7
78
345
6
,412
2
01
26-D
ec-1
32,
205
69
263
8 50
4 16
52
4 1
6 -
- -
- 3,
496
110
6
,543
2
06
27-D
ec-1
31,
407
45
72
2 5,
721
187
1,0
78
33
- -
- -
8,27
8 2
67
2,9
79
95
30-D
ec-1
31,
549
49
47
2 7,
353
240
2,3
00
71
- -
- -
11,2
49
362
3
,568
1
13
31-D
ec-1
31,
223
39
34
1 6,
043
197
809
25
- -
- -
8,10
9 2
62
3,6
60
116
No
tio
nal
Tu
rno
ver
/ O
pen
In
tere
st v
alu
e =
(S
trik
e P
rice +
Pre
miu
m)
* Q
uan
tity
.
NA
: N
ot
Ap
pli
cab
le
So
urc
e :
MC
X-S
X.
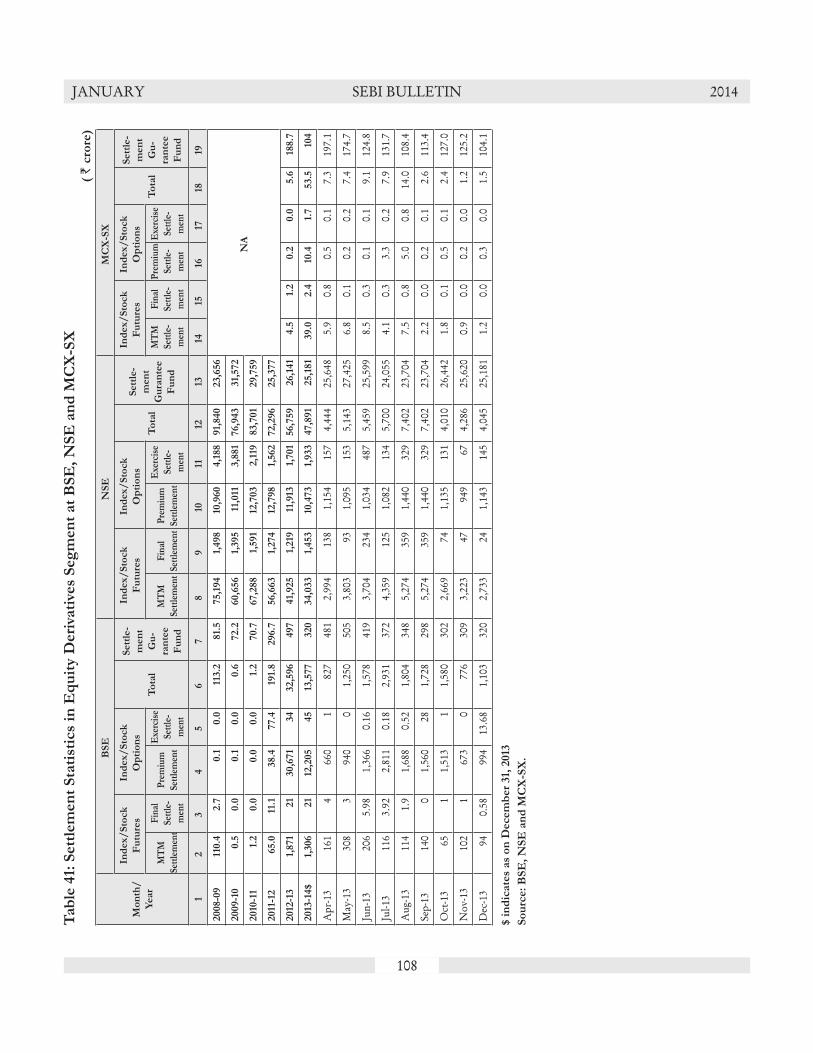
108
JANUARY SEBI BULLETIN 2014T
ab
le 4
1: S
ett
lem
en
t S
tati
stic
s in
Eq
uit
y D
eri
vati
ves
Seg
men
t at
BS
E,
NS
E a
nd
MC
X-S
X
( `
cro
re)
Mo
nth
/
Year
BS
EN
SE
MC
X-S
X
Ind
ex/
Sto
ck
Fu
ture
s
Ind
ex/
Sto
ck
Op
tio
ns
To
tal
Sett
le-
men
t
Gu
-
ran
tee
Fu
nd
Ind
ex/
Sto
ck
Fu
ture
s
Ind
ex/
Sto
ck
Op
tio
ns
To
tal
Sett
le-
men
t
Gu
ran
tee
Fu
nd
Ind
ex/
Sto
ck
Fu
ture
s
Ind
ex/
Sto
ck
Op
tio
ns
To
tal
Sett
le-
men
t
Gu
-
ran
tee
Fu
nd
MT
M
Sett
lem
ent
Fin
al
Sett
le-
men
t
Pre
miu
m
Sett
lem
ent
Exe
rcis
e
Sett
le-
men
t
MT
M
Sett
lem
ent
Fin
al
Sett
lem
ent
Pre
miu
m
Sett
lem
ent
Exe
rcis
e
Sett
le-
men
t
MT
M
Sett
le-
men
t
Fin
al
Sett
le-
men
t
Pre
miu
m
Sett
le-
men
t
Exe
rcis
e
Sett
le-
men
t
1 2
3
4
5
6
7
8
9
10
11
12
13
14
15
16
17
18
19
2008-0
911
0.4
2.7
0.1
0.0
113.2
81.
575,1
94
1,498
10,9
60
4,1
88
91,
840
23,6
56
NA
2009-1
00.5
0.0
0.1
0.0
0.6
72.2
60,6
56
1,395
11,0
113,8
81
76,9
43
31,
572
2010
-11
1.2
0.0
0.0
0.0
1.2
70.7
67,2
88
1,591
12,7
03
2,1
1983,7
01
29,7
59
2011
-12
65.0
11.1
38.4
77.4
191.
8296.7
56,6
63
1,274
12,7
98
1,562
72,2
96
25,3
77
2012
-13
1,871
21
30,6
71
34
32,5
96
497
41,
925
1,219
11,9
131,
701
56,7
59
26,1
41
4.5
1.2
0.2
0.0
5.6
188.7
2013
-14$
1,306
21
12,2
05
45
13,5
77
320
34,0
33
1,453
10,4
73
1,933
47,8
91
25,1
81
39.0
2.4
10.4
1.7
53.5
104
Apr
-13
161
466
01
827
481
2,99
413
81,
154
157
4,44
425
,648
5.9
0.8
0.5
0.1
7.3
197.
1
May
-13
308
394
00
1,25
050
53,
803
931,
095
153
5,14
327
,425
6.8
0.1
0.2
0.2
7.4
174.
7
Jun-
1320
65.
981,
366
0.16
1,57
841
93,
704
234
1,03
448
75,
459
25,5
998.
50.
30.
10.
19.
112
4.8
Jul-1
311
63.
922,
811
0.18
2,93
137
24,
359
125
1,08
213
45,
700
24,0
554.
10.
33.
30.
27.
913
1.7
Aug
-13
114
1.9
1,68
80.
521,
804
348
5,27
435
91,
440
329
7,40
223
,704
7.5
0.8
5.0
0.8
14.0
108.
4
Sep-
1314
00
1,56
028
1,72
829
85,
274
359
1,44
032
97,
402
23,7
042.
20.
00.
20.
12.
611
3.4
Oct
-13
651
1,51
31
1,58
030
22,
669
741,
135
131
4,01
026
,442
1.8
0.1
0.5
0.1
2.4
127.
0
Nov
-13
102
167
30
776
309
3,22
347
949
674,
286
25,6
200.
90.
00.
20.
01.
212
5.2
Dec
-13
940.
5899
413
.68
1,10
332
02,
733
241,
143
145
4,04
525
,181
1.2
0.0
0.3
0.0
1.5
104.
1
$ i
nd
icate
s as
on
Decem
ber
31,
2013
So
urc
e:
BS
E,
NS
E a
nd
MC
X-S
X.
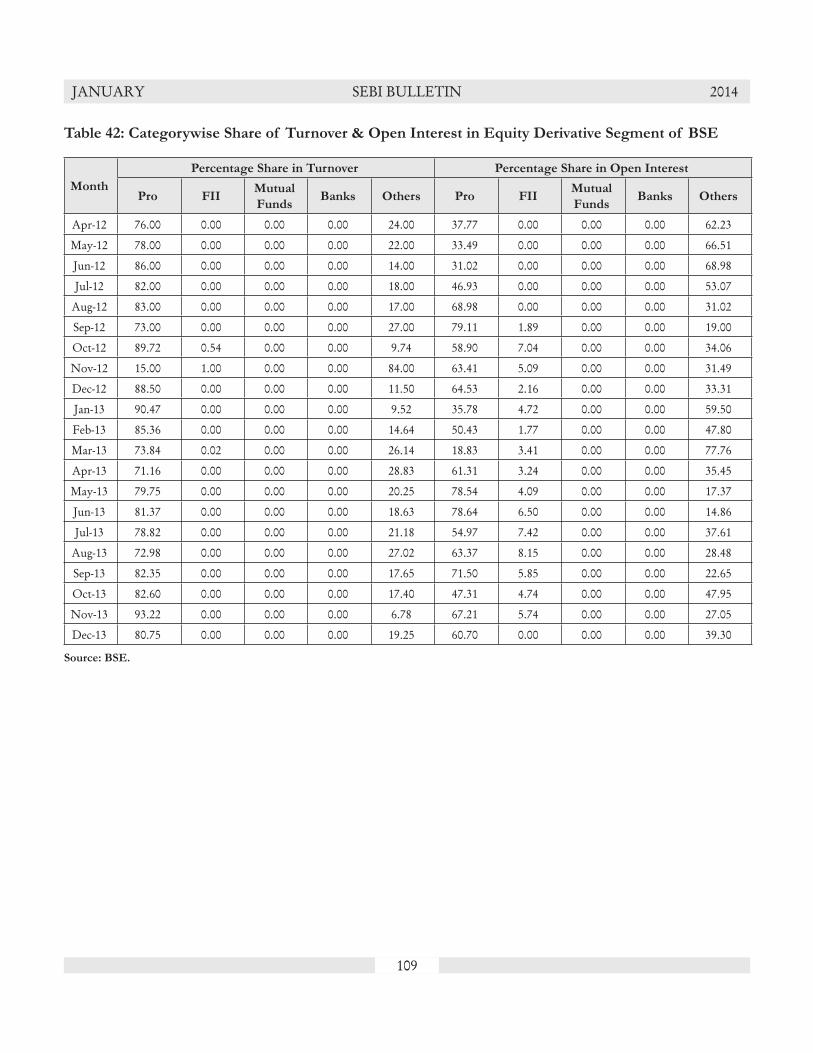
109
JANUARY SEBI BULLETIN 2014
Table 42: Categorywise Share of Turnover & Open Interest in Equity Derivative Segment of BSE
Month
Percentage Share in Turnover Percentage Share in Open Interest
Pro FIIMutual
FundsBanks Others Pro FII
Mutual
FundsBanks Others
Apr-12 76.00 0.00 0.00 0.00 24.00 37.77 0.00 0.00 0.00 62.23
May-12 78.00 0.00 0.00 0.00 22.00 33.49 0.00 0.00 0.00 66.51
Jun-12 86.00 0.00 0.00 0.00 14.00 31.02 0.00 0.00 0.00 68.98
Jul-12 82.00 0.00 0.00 0.00 18.00 46.93 0.00 0.00 0.00 53.07
Aug-12 83.00 0.00 0.00 0.00 17.00 68.98 0.00 0.00 0.00 31.02
Sep-12 73.00 0.00 0.00 0.00 27.00 79.11 1.89 0.00 0.00 19.00
Oct-12 89.72 0.54 0.00 0.00 9.74 58.90 7.04 0.00 0.00 34.06
Nov-12 15.00 1.00 0.00 0.00 84.00 63.41 5.09 0.00 0.00 31.49
Dec-12 88.50 0.00 0.00 0.00 11.50 64.53 2.16 0.00 0.00 33.31
Jan-13 90.47 0.00 0.00 0.00 9.52 35.78 4.72 0.00 0.00 59.50
Feb-13 85.36 0.00 0.00 0.00 14.64 50.43 1.77 0.00 0.00 47.80
Mar-13 73.84 0.02 0.00 0.00 26.14 18.83 3.41 0.00 0.00 77.76
Apr-13 71.16 0.00 0.00 0.00 28.83 61.31 3.24 0.00 0.00 35.45
May-13 79.75 0.00 0.00 0.00 20.25 78.54 4.09 0.00 0.00 17.37
Jun-13 81.37 0.00 0.00 0.00 18.63 78.64 6.50 0.00 0.00 14.86
Jul-13 78.82 0.00 0.00 0.00 21.18 54.97 7.42 0.00 0.00 37.61
Aug-13 72.98 0.00 0.00 0.00 27.02 63.37 8.15 0.00 0.00 28.48
Sep-13 82.35 0.00 0.00 0.00 17.65 71.50 5.85 0.00 0.00 22.65
Oct-13 82.60 0.00 0.00 0.00 17.40 47.31 4.74 0.00 0.00 47.95
Nov-13 93.22 0.00 0.00 0.00 6.78 67.21 5.74 0.00 0.00 27.05
Dec-13 80.75 0.00 0.00 0.00 19.25 60.70 0.00 0.00 0.00 39.30
Source: BSE.
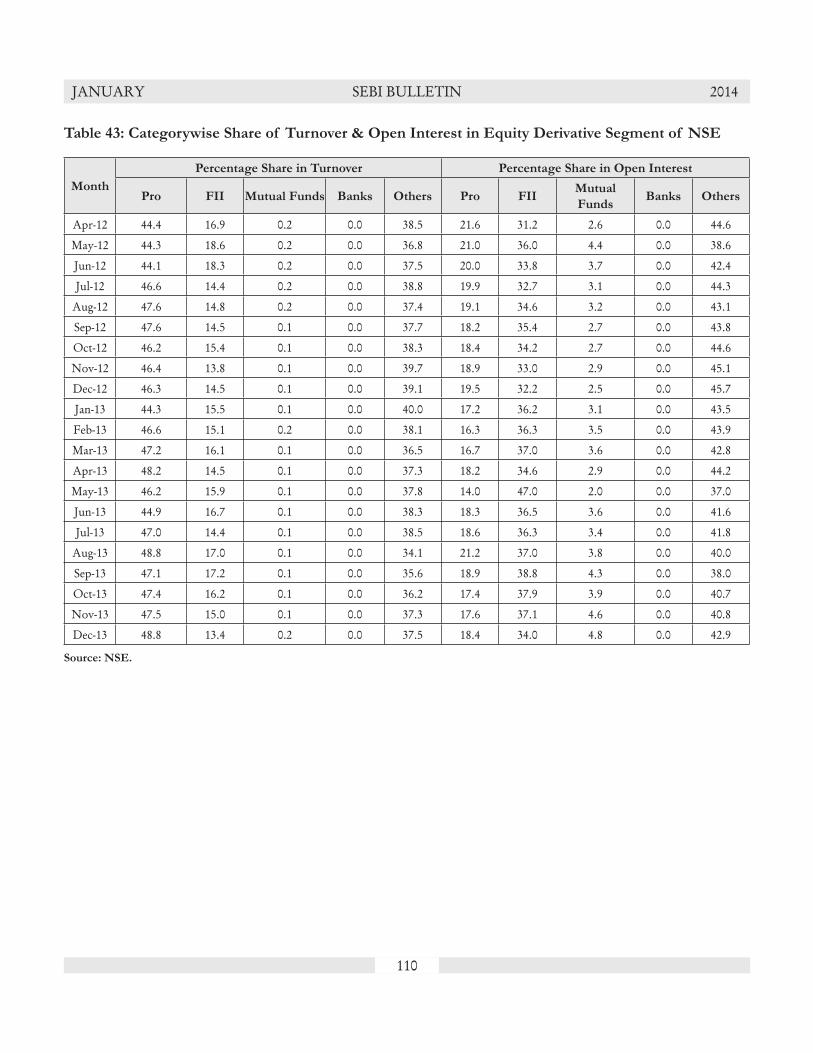
110
JANUARY SEBI BULLETIN 2014
Table 43: Categorywise Share of Turnover & Open Interest in Equity Derivative Segment of NSE
Month
Percentage Share in Turnover Percentage Share in Open Interest
Pro FII Mutual Funds Banks Others Pro FIIMutual
FundsBanks Others
Apr-12 44.4 16.9 0.2 0.0 38.5 21.6 31.2 2.6 0.0 44.6
May-12 44.3 18.6 0.2 0.0 36.8 21.0 36.0 4.4 0.0 38.6
Jun-12 44.1 18.3 0.2 0.0 37.5 20.0 33.8 3.7 0.0 42.4
Jul-12 46.6 14.4 0.2 0.0 38.8 19.9 32.7 3.1 0.0 44.3
Aug-12 47.6 14.8 0.2 0.0 37.4 19.1 34.6 3.2 0.0 43.1
Sep-12 47.6 14.5 0.1 0.0 37.7 18.2 35.4 2.7 0.0 43.8
Oct-12 46.2 15.4 0.1 0.0 38.3 18.4 34.2 2.7 0.0 44.6
Nov-12 46.4 13.8 0.1 0.0 39.7 18.9 33.0 2.9 0.0 45.1
Dec-12 46.3 14.5 0.1 0.0 39.1 19.5 32.2 2.5 0.0 45.7
Jan-13 44.3 15.5 0.1 0.0 40.0 17.2 36.2 3.1 0.0 43.5
Feb-13 46.6 15.1 0.2 0.0 38.1 16.3 36.3 3.5 0.0 43.9
Mar-13 47.2 16.1 0.1 0.0 36.5 16.7 37.0 3.6 0.0 42.8
Apr-13 48.2 14.5 0.1 0.0 37.3 18.2 34.6 2.9 0.0 44.2
May-13 46.2 15.9 0.1 0.0 37.8 14.0 47.0 2.0 0.0 37.0
Jun-13 44.9 16.7 0.1 0.0 38.3 18.3 36.5 3.6 0.0 41.6
Jul-13 47.0 14.4 0.1 0.0 38.5 18.6 36.3 3.4 0.0 41.8
Aug-13 48.8 17.0 0.1 0.0 34.1 21.2 37.0 3.8 0.0 40.0
Sep-13 47.1 17.2 0.1 0.0 35.6 18.9 38.8 4.3 0.0 38.0
Oct-13 47.4 16.2 0.1 0.0 36.2 17.4 37.9 3.9 0.0 40.7
Nov-13 47.5 15.0 0.1 0.0 37.3 17.6 37.1 4.6 0.0 40.8
Dec-13 48.8 13.4 0.2 0.0 37.5 18.4 34.0 4.8 0.0 42.9
Source: NSE.

111
JANUARY SEBI BULLETIN 2014
Table 44: Instrumentwise Turnover in Index Derivatives at BSE
Month
Turnover (in Percentage)
BSE 30
SENSEX
BSE
BANKEX
BSE OIL &
GAS INDEX
BSE TECK
INDEX BSE100
HANG
SENG
Index
Futures
MICEX
Index
Futures
FTSE/
JSE Top40
Futures
IBOVESPA
Futures
Apr-12 100.00 0.00 0.00 0.00 0.00 0.00 0.00 0.00 0.00
May-12 99.81 0.19 0.00 0.00 0.00 0.00 0.00 0.00 0.00
Jun-12 99.66 0.34 0.00 0.00 0.00 0.00 0.00 0.00 0.00
Jul-12 100.00 0.00 0.00 0.00 0.00 0.00 0.00 0.00 0.00
Aug-12 0.81 0.00 0.00 0.00 99.19 0.00 0.00 0.00 0.00
Sep-12 0.92 0.00 0.00 0.00 99.08 0.00 0.00 0.00 0.00
Oct-12 4.22 0.00 0.00 0.00 95.78 0.00 0.00 0.00 0.00
Nov-12 38.96 0.00 0.00 0.00 61.04 0.00 0.00 0.00 0.00
Dec-12 42.34 0.00 0.00 0.00 57.66 0.00 0.00 0.00 0.00
Jan-13 31.25 0.00 0.00 0.00 68.75 0.00 0.00 0.00 0.00
Feb-13 99.91 0.00 0.00 0.00 0.09 0.00 0.00 0.00 0.00
Mar-13 99.99 0.00 0.00 0.00 0.01 0.00 0.00 0.00 0.00
Apr-13 91.39 0.00 0.00 0.00 8.61 0.00 0.00 0.00 0.00
May-13 0.66 0.00 0.00 0.00 99.33 0.00 0.00 0.00 0.00
Jun-13 0.30 0.00 0.00 0.00 99.70 0.00 0.00 0.00 0.00
Jul-13 0.16 0.00 0.00 0.00 99.84 0.00 0.00 0.00 0.00
Aug-13 0.02 0.00 0.00 0.00 99.98 0.00 0.00 0.00 0.00
Sep-13 95.50 0.00 0.00 0.00 4.50 0.00 0.00 0.00 0.00
Oct-13 99.25 0.00 0.00 0.00 0.75 0.00 0.00 0.00 0.00
Nov-13 100.00 0.00 0.00 0.00 0.00 0.00 0.00 0.00 0.00
Dec-13 100.00 0.00 0.00 0.00 0.00 0.00 0.00 0.00 0.00
Source: BSE.

112
JANUARY SEBI BULLETIN 2014
Table 45: Instrumentwise Turnover in Index Derivatives at NSE
MonthTurnover (in Percentage)
NIFTY CNXIT BANKNIFTY NFTYMCAP50 CNXPSE CNXINFRA FTSE100 S&P500 DJIA
Apr-12 96.29 0.01 3.13 0.00 0.00 0.00 0.00 0.01 0.56
May-12 96.20 0.00 3.08 0.00 0.00 0.00 0.18 0.01 0.52
Jun-12 95.49 0.00 3.85 0.00 0.00 0.00 0.11 0.01 0.52
Jul-12 95.37 0.01 4.08 0.00 0.00 0.00 0.07 0.01 0.47
Aug-12 95.32 0.00 4.20 0.00 0.00 0.00 0.06 0.01 0.40
Sep-12 94.39 0.01 5.21 0.00 0.00 0.00 0.05 0.01 0.34
Oct-12 94.20 0.00 5.32 0.00 0.00 0.00 0.05 0.00 0.42
Nov-12 94.33 0.00 5.32 0.00 0.00 0.00 0.01 0.01 0.33
Dec-12 93.79 0.00 5.92 0.00 0.00 0.00 0.01 0.01 0.26
Jan-13 92.36 0.01 7.40 0.00 0.00 0.00 0.01 0.01 0.22
Feb-13 93.52 0.01 6.43 0.00 0.00 0.00 0.01 0.01 0.02
Mar-13 92.15 0.01 7.79 0.00 0.00 0.00 0.01 0.01 0.04
Apr-13 91.98 0.01 7.95 0.00 0.00 0.00 0.00 0.02 0.04
May-13 92.26 0.00 7.69 0.00 0.00 0.00 0.00 0.02 0.03
Jun-13 93.57 0.00 6.37 0.00 0.00 0.00 0.00 0.01 0.03
Jul-13 91.83 0.01 8.13 0.00 0.00 0.00 0.00 0.01 0.02
Aug-13 93.61 0.01 6.35 0.00 0.00 0.00 0.00 0.01 0.01
Sep-13 93.39 0.01 6.58 0.00 0.00 0.00 0.00 0.01 0.02
Oct-13 91.86 0.01 8.09 0.00 0.00 0.00 0.00 0.01 0.02
Nov-13 91.22 0.01 8.74 0.01 0.00 0.00 0.00 0.01 0.02
Dec-13 89.60 0.01 10.34 0.01 0.00 0.00 0.00 0.01 0.02
Source: NSE.
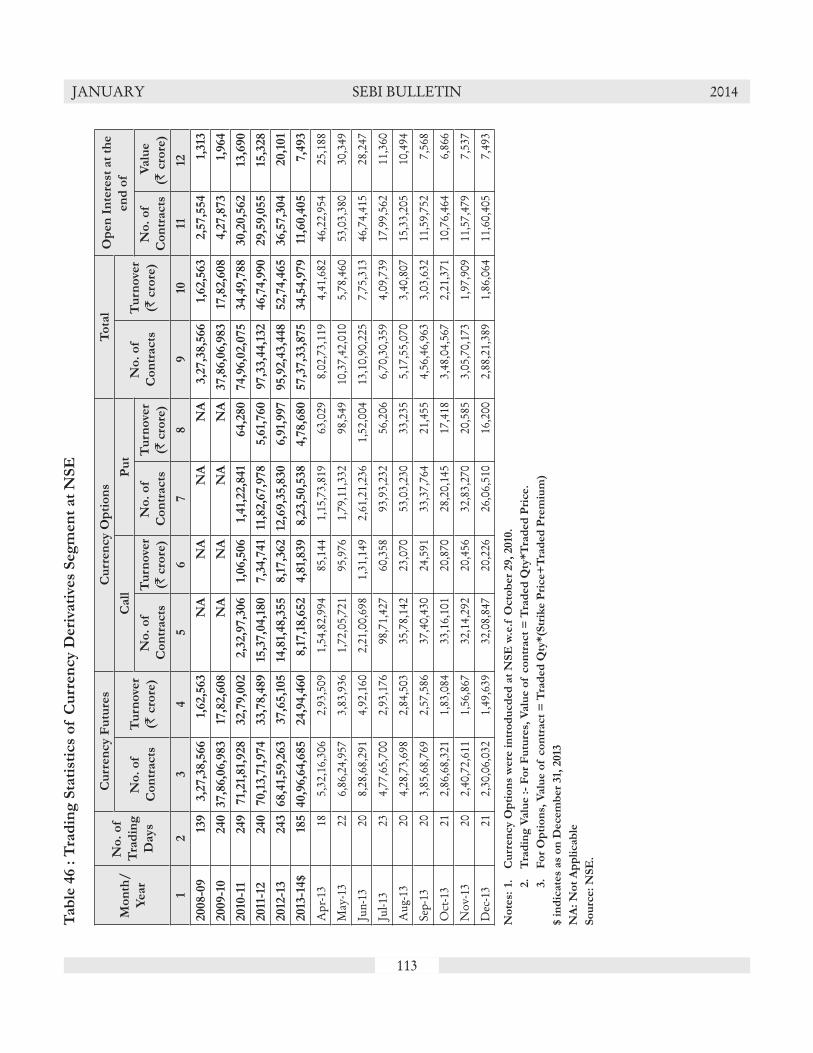
113
JANUARY SEBI BULLETIN 2014T
ab
le 4
6 :
Tra
din
g S
tati
stic
s o
f C
urr
en
cy D
eri
vati
ves
Seg
men
t at
NS
E
Mo
nth
/
Year
No
. o
f
Tra
din
g
Days
Cu
rren
cy F
utu
res
Cu
rren
cy O
pti
on
sT
ota
lO
pen
In
tere
st a
t th
e
en
d o
fN
o.
of
Co
ntr
acts
Tu
rno
ver
(` c
rore
)
Call
Pu
tN
o.
of
Co
ntr
acts
Tu
rno
ver
(` c
rore
)N
o.
of
Co
ntr
acts
Tu
rno
ver
(` c
rore
)
No
. o
f
Co
ntr
acts
Tu
rno
ver
(` c
rore
)
No
. o
f
Co
ntr
acts
Valu
e
(` c
rore
)
12
34
56
78
910
1112
2008-0
913
93,2
7,3
8,5
66
1,62,5
63
NA
NA
NA
NA
3,2
7,3
8,5
66
1,62,5
63
2,5
7,5
54
1,313
2009-1
0240
37,8
6,0
6,9
83
17,8
2,6
08
NA
NA
NA
NA
37,8
6,0
6,9
83
17,8
2,6
08
4,2
7,8
73
1,964
2010
-11
249
71,
21,
81,
928
32,7
9,0
02
2,3
2,9
7,3
06
1,06,5
06
1,41,
22,8
41
64,2
80
74,9
6,0
2,0
75
34,4
9,7
88
30,2
0,5
62
13,6
90
2011
-12
240
70,1
3,7
1,974
33,7
8,4
89
15,3
7,0
4,1
80
7,3
4,7
41
11,8
2,6
7,9
78
5,6
1,760
97,3
3,4
4,1
32
46,7
4,9
90
29,5
9,0
55
15,3
28
2012
-13
243
68,4
1,59,2
63
37,6
5,1
05
14,8
1,48,3
55
8,1
7,3
62
12,6
9,3
5,8
30
6,9
1,997
95,9
2,4
3,4
48
52,7
4,4
65
36,5
7,3
04
20,1
01
2013
-14$
185
40,9
6,6
4,6
85
24,9
4,4
60
8,1
7,1
8,6
52
4,8
1,839
8,2
3,5
0,5
38
4,7
8,6
80
57,3
7,3
3,8
75
34,5
4,9
79
11,6
0,4
05
7,4
93
Apr
-13
185,
32,1
6,30
62,
93,5
091,
54,8
2,99
485
,144
1,15
,73,
819
63,0
298,
02,7
3,11
94,
41,6
8246
,22,
954
25,1
88
May
-13
226,
86,2
4,95
73,
83,9
361,
72,0
5,72
195
,976
1,79
,11,
332
98,5
4910
,37,
42,0
105,
78,4
6053
,03,
380
30,3
49
Jun-
1320
8,28
,68,
291
4,92
,160
2,21
,00,
698
1,31
,149
2,61
,21,
236
1,52
,004
13,1
0,90
,225
7,75
,313
46,7
4,41
528
,247
Jul-1
323
4,77
,65,
700
2,93
,176
98,7
1,42
760
,358
93,9
3,23
256
,206
6,70
,30,
359
4,09
,739
17,9
9,56
211
,360
Aug
-13
204,
28,7
3,69
82,
84,5
0335
,78,
142
23,0
7053
,03,
230
33,2
355,
17,5
5,07
03,
40,8
0715
,33,
205
10,4
94
Sep-
1320
3,85
,68,
769
2,57
,586
37,4
0,43
024
,591
33,3
7,76
421
,455
4,56
,46,
963
3,03
,632
11,5
9,75
27,
568
Oct
-13
212,
86,6
8,32
11,
83,0
8433
,16,
101
20,8
7028
,20,
145
17,4
183,
48,0
4,56
72,
21,3
7110
,76,
464
6,86
6
Nov
-13
202,
40,7
2,61
11,
56,8
6732
,14,
292
20,4
5632
,83,
270
20,5
853,
05,7
0,17
31,
97,9
0911
,57,
479
7,53
7
Dec
-13
212,
30,0
6,03
21,
49,6
3932
,08,
847
20,2
2626
,06,
510
16,2
002,
88,2
1,38
91,
86,0
6411
,60,
405
7,49
3
No
tes:
1.
Cu
rren
cy O
pti
on
s w
ere
in
tro
du
cd
ed
at
NS
E w
.e.f
Octo
ber
29,
2010
.
2.
Tra
din
g V
alu
e :
- F
or
Fu
ture
s, V
alu
e o
f c
on
tract
= T
rad
ed
Qty
*T
rad
ed
Pri
ce.
3.
Fo
r O
pti
on
s, V
alu
e o
f c
on
tract
= T
rad
ed
Qty
*(S
trik
e P
rice+
Tra
ded
Pre
miu
m)
$ i
nd
icate
s as
on
Decem
ber
31,
2013
NA
: N
ot
Ap
pli
cab
le
So
urc
e:
NS
E.
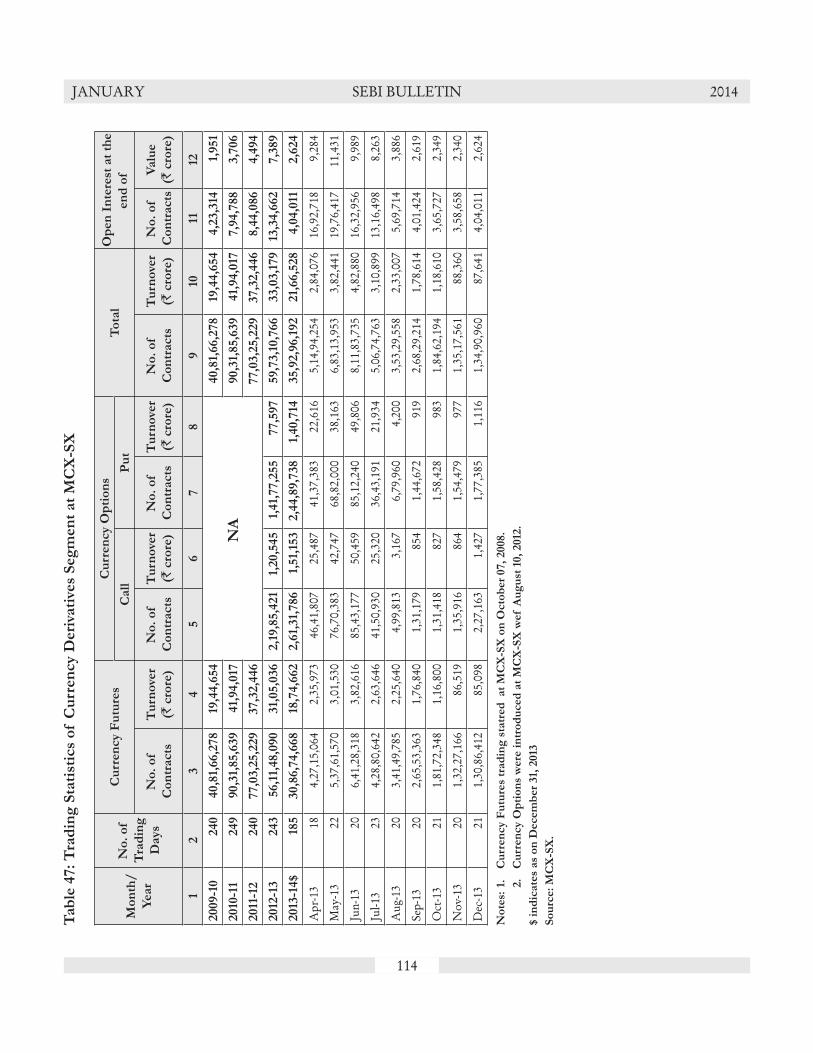
114
JANUARY SEBI BULLETIN 2014T
ab
le 4
7:
Tra
din
g S
tati
stic
s o
f C
urr
en
cy D
eri
vati
ves
Seg
men
t at
MC
X-S
X
Mo
nth
/
Year
No
. o
f
Tra
din
g
Days
Cu
rren
cy F
utu
res
Cu
rren
cy O
pti
on
sT
ota
lO
pen
In
tere
st a
t th
e
en
d o
f
Call
Pu
t
No
. o
f
Co
ntr
acts
Tu
rno
ver
(` c
rore
)
No
. o
f
Co
ntr
acts
Tu
rno
ver
(` c
rore
)
No
. o
f
Co
ntr
acts
Tu
rno
ver
(` c
rore
)
No
. o
f
Co
ntr
acts
Tu
rno
ver
(` c
rore
)
No
. o
f
Co
ntr
acts
Valu
e
(` c
rore
)
1 2
3
4
5
6
7
8
9
10
11
12
2009-1
0240
40,8
1,66,2
78
19,4
4,6
54
NA
40,8
1,66,2
78
19,4
4,6
54
4,2
3,3
141,
951
2010
-11
249
90,3
1,85,6
39
41,
94,0
1790,3
1,85,6
39
41,
94,0
177,9
4,7
88
3,7
06
2011
-12
240
77,0
3,2
5,2
29
37,3
2,4
46
77,0
3,2
5,2
29
37,3
2,4
46
8,4
4,0
86
4,4
94
2012
-13
243
56,1
1,48,0
90
31,
05,0
36
2,1
9,8
5,4
21
1,20,5
45
1,41,
77,2
55
77,5
97
59,7
3,1
0,7
66
33,0
3,1
79
13,3
4,6
62
7,3
89
2013
-14$
185
30,8
6,7
4,6
68
18,7
4,6
62
2,6
1,31,
786
1,51,
153
2,4
4,8
9,7
38
1,40,7
1435,9
2,9
6,1
92
21,
66,5
28
4,0
4,0
112,6
24
Apr
-13
184,
27,1
5,06
42,
35,9
7346
,41,
807
25,4
8741
,37,
383
22,6
165,
14,9
4,25
42,
84,0
7616
,92,
718
9,28
4
May
-13
225,
37,6
1,57
03,
01,5
3076
,70,
383
42,7
4768
,82,
000
38,1
636,
83,1
3,95
33,
82,4
4119
,76,
417
11,4
31
Jun-
1320
6,41
,28,
318
3,82
,616
85,4
3,17
750
,459
85,1
2,24
049
,806
8,11
,83,
735
4,82
,880
16,3
2,95
69,
989
Jul-1
323
4,28
,80,
642
2,63
,646
41,5
0,93
025
,320
36,4
3,19
121
,934
5,06
,74,
763
3,10
,899
13,1
6,49
88,
263
Aug
-13
203,
41,4
9,78
52,
25,6
404,
99,8
133,
167
6,79
,960
4,20
03,
53,2
9,55
82,
33,0
075,
69,7
143,
886
Sep-
1320
2,65
,53,
363
1,76
,840
1,31
,179
854
1,44
,672
919
2,68
,29,
214
1,78
,614
4,01
,424
2,61
9
Oct
-13
211,
81,7
2,34
81,
16,8
001,
31,4
1882
71,
58,4
2898
31,
84,6
2,19
41,
18,6
103,
65,7
272,
349
Nov
-13
201,
32,2
7,16
686
,519
1,35
,916
864
1,54
,479
977
1,35
,17,
561
88,3
603,
58,6
582,
340
Dec
-13
211,
30,8
6,41
285
,098
2,27
,163
1,42
71,
77,3
851,
116
1,34
,90,
960
87,6
414,
04,0
112,
624
No
tes:
1.
Cu
rren
cy F
utu
res
trad
ing
sta
tred
at
MC
X-S
X o
n O
cto
ber
07,
2008.
2.
Cu
rren
cy O
pti
on
s w
ere
in
tro
du
ced
at
MC
X-S
X w
ef A
ug
ust
10,
2012
.
$ i
nd
icate
s as
on
Decem
ber
31,
2013
So
urc
e:
MC
X-S
X.

115
JANUARY SEBI BULLETIN 2014T
ab
le 4
8:
Tra
din
g S
tati
stic
s o
f C
urr
en
cy D
eri
vati
ves
Seg
men
t at
US
E
Mo
nth
/
Year
No
. o
f
Tra
din
g
Days
Cu
rren
cy F
utu
res
Cu
rren
cy O
pti
on
sT
ota
lO
pen
In
tere
st a
t th
e
en
d o
f
Call
Pu
t
No
. o
f
Co
ntr
acts
Tu
rno
ver
(` c
rore
)
No
. o
f
Co
ntr
acts
Tu
rno
ver
(` c
rore
)
No
. o
f
Co
ntr
acts
Tu
rno
ver
(` c
rore
)
No
. o
f
Co
ntr
acts
Tu
rno
ver
(` c
rore
)
No
. o
f
Co
ntr
acts
Valu
e
(` c
rore
)
1 2
3
4
5
6
7
8
9
10
11
12
2011
-12
240
30,7
8,1
3,4
59
14,5
4,1
44
48,8
4,4
33
22,4
28
26,9
7,6
51
12,4
05
31,
53,9
5,5
43
14,8
8,9
78
23,7
54
125
2012
-13
243
1,47,5
6,8
95
83,4
99
52,7
9,2
90
29,1
46
37,3
0,6
61
20,2
152,3
7,6
6,8
46
1,32,8
61
53,4
57
292
2013
-14$
185
91,
41,
684
60,0
1599,4
5,0
46
61,
929
1,08,5
2,5
76
63,4
42
2,9
9,3
9,3
06
1,85,3
85
19,0
84
142
Apr
-13
1812
,76,
257
7,06
910
,10,
214
5,57
98,
09,7
144,
384
30,9
6,18
517
,033
9,64
753
May
-13
2214
,25,
772
7,93
712
,47,
475
7,00
516
,78,
167
9,13
143
,51,
414
24,0
7414
,289
81
Jun-
1320
11,0
3,04
66,
519
8,85
,028
5,29
218
,98,
288
10,7
7738
,86,
362
22,5
8711
,562
69
Jul-1
323
9,29
,787
5,97
112
,51,
908
7,70
413
,98,
587
8,22
135
,80,
282
21,8
9612
,134
84
Aug
-13
209,
23,6
396,
779
10,2
7,34
66,
577
15,8
0,63
69,
633
35,3
1,62
122
,989
19,7
3316
2
Sep-
1320
11,3
0,21
38,
726
8,89
,189
6,05
28,
07,1
015,
013
28,2
6,50
319
,791
18,3
7414
7
Oct
-13
219,
33,1
516,
775
13,0
3,98
38,
513
9,87
,320
5,95
432
,24,
454
21,2
4213
,033
106
Nov
-13
206,
13,5
064,
367
12,0
5,26
17,
848
7,39
,904
4,54
125
,58,
671
16,7
579,
329
74
Dec
-13
218,
06,3
135,
871
11,2
4,64
27,
359
9,52
,859
5,78
728
,83,
814
19,0
1619
,084
142
No
tes:
1.
Cu
rren
cy F
utu
res
an
d C
urr
en
cy O
pti
on
s tr
ad
ing
sta
rted
at
US
E o
n S
ep
tem
ber
20,
2010
an
d O
cto
ber
29,
2010
resp
ecti
vely
.
$ i
nd
icate
s as
on
Decem
ber
31,
2013
So
urc
e:
US
E.

116
JANUARY SEBI BULLETIN 2014
Table 49: Daily Trends of Currency Derivatives trading at NSE during December 2013
Date
Currency FuturesCurrency Option
Total TurnoverOpen Interest at the
end of Calls Puts
No. of
Contracts
Traded
Value
(` crore)
No. of
Contracts
Traded
Value
(` crore)
No. of
Contracts
Traded
Value
(` crore)
No. of
Contracts
Traded
Value
(` crore)
No. of
Contracts
Value
(` crore)
1 2 3 4 5 6 7 8 9 10 11
2-Dec-13 13,91,237 8,992 1,45,607 928 1,07,862 675 16,44,706 10,596 12,40,544 8,052
3-Dec-13 8,21,740 5,378 56,853 364 41,709 260 9,20,302 6,002 12,21,774 7,926
4-Dec-13 11,80,500 7,691 1,10,427 705 79,970 501 13,70,897 8,897 12,58,133 8,126
5-Dec-13 13,17,358 8,558 2,17,833 1,380 1,57,838 979 16,93,029 10,918 12,67,688 8,082
6-Dec-13 9,02,415 5,805 1,34,403 849 98,328 610 11,35,146 7,264 13,11,819 8,335
9-Dec-13 12,84,771 8,289 2,54,047 1,593 1,68,446 1,042 17,07,264 10,923 13,91,903 8,815
10-Dec-13 10,90,489 6,996 1,75,458 1,100 97,876 608 13,63,823 8,704 13,98,387 8,866
11-Dec-13 8,85,312 5,661 1,22,642 767 71,086 438 10,79,040 6,865 13,78,015 8,761
12-Dec-13 10,50,879 6,768 1,37,041 860 1,13,676 699 13,01,596 8,327 13,99,044 8,945
13-Dec-13 10,21,752 6,645 1,49,161 941 1,58,630 978 13,29,543 8,564 13,96,678 8,991
16-Dec-13 11,47,994 7,471 1,46,932 925 1,23,344 761 14,18,270 9,157 14,62,929 9,386
17-Dec-13 10,12,019 6,594 1,23,982 780 99,598 615 12,35,599 7,989 14,60,393 9,407
18-Dec-13 13,28,449 8,643 1,69,301 1,065 1,54,339 953 16,52,089 10,660 14,63,300 9,439
19-Dec-13 13,40,178 8,876 2,58,117 1,631 2,43,405 1,509 18,41,700 12,016 14,37,174 9,257
20-Dec-13 11,84,666 7,753 2,25,840 1,423 2,47,790 1,559 16,58,296 10,735 14,44,706 9,276
23-Dec-13 9,50,616 6,136 1,54,530 970 1,31,570 827 12,36,716 7,933 14,62,103 9,356
24-Dec-13 8,02,575 5,191 1,57,593 988 1,09,097 679 10,69,265 6,858 14,48,610 9,248
26-Dec-13 11,54,205 7,488 1,26,808 794 1,22,744 762 14,03,757 9,044 14,86,146 9,508
27-Dec-13 16,17,897 10,589 1,91,129 1,205 1,70,379 1,069 19,79,405 12,864 10,33,974 6,704
30-Dec-13 8,80,733 5,832 75,267 478 64,341 401 10,20,341 6,711 10,95,619 7,096
31-Dec-13 6,40,247 4,283 75,876 480 44,482 275 7,60,605 5,039 11,60,405 7,493
Source: NSE.
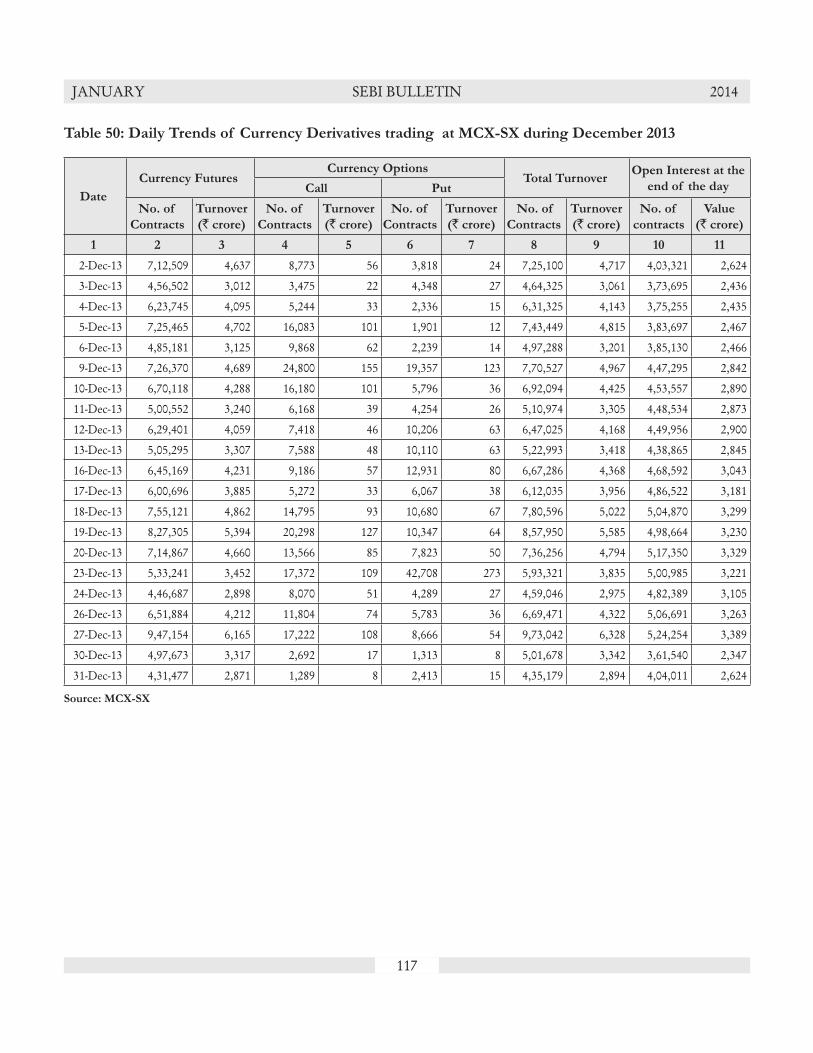
117
JANUARY SEBI BULLETIN 2014
Table 50: Daily Trends of Currency Derivatives trading at MCX-SX during December 2013
Date
Currency FuturesCurrency Options
Total TurnoverOpen Interest at the
end of the dayCall Put
No. of
Contracts
Turnover
(` crore)
No. of
Contracts
Turnover
(` crore)
No. of
Contracts
Turnover
(` crore)
No. of
Contracts
Turnover
(` crore)
No. of
contracts
Value
(` crore)
1 2 3 4 5 6 7 8 9 10 11
2-Dec-13 7,12,509 4,637 8,773 56 3,818 24 7,25,100 4,717 4,03,321 2,624
3-Dec-13 4,56,502 3,012 3,475 22 4,348 27 4,64,325 3,061 3,73,695 2,436
4-Dec-13 6,23,745 4,095 5,244 33 2,336 15 6,31,325 4,143 3,75,255 2,435
5-Dec-13 7,25,465 4,702 16,083 101 1,901 12 7,43,449 4,815 3,83,697 2,467
6-Dec-13 4,85,181 3,125 9,868 62 2,239 14 4,97,288 3,201 3,85,130 2,466
9-Dec-13 7,26,370 4,689 24,800 155 19,357 123 7,70,527 4,967 4,47,295 2,842
10-Dec-13 6,70,118 4,288 16,180 101 5,796 36 6,92,094 4,425 4,53,557 2,890
11-Dec-13 5,00,552 3,240 6,168 39 4,254 26 5,10,974 3,305 4,48,534 2,873
12-Dec-13 6,29,401 4,059 7,418 46 10,206 63 6,47,025 4,168 4,49,956 2,900
13-Dec-13 5,05,295 3,307 7,588 48 10,110 63 5,22,993 3,418 4,38,865 2,845
16-Dec-13 6,45,169 4,231 9,186 57 12,931 80 6,67,286 4,368 4,68,592 3,043
17-Dec-13 6,00,696 3,885 5,272 33 6,067 38 6,12,035 3,956 4,86,522 3,181
18-Dec-13 7,55,121 4,862 14,795 93 10,680 67 7,80,596 5,022 5,04,870 3,299
19-Dec-13 8,27,305 5,394 20,298 127 10,347 64 8,57,950 5,585 4,98,664 3,230
20-Dec-13 7,14,867 4,660 13,566 85 7,823 50 7,36,256 4,794 5,17,350 3,329
23-Dec-13 5,33,241 3,452 17,372 109 42,708 273 5,93,321 3,835 5,00,985 3,221
24-Dec-13 4,46,687 2,898 8,070 51 4,289 27 4,59,046 2,975 4,82,389 3,105
26-Dec-13 6,51,884 4,212 11,804 74 5,783 36 6,69,471 4,322 5,06,691 3,263
27-Dec-13 9,47,154 6,165 17,222 108 8,666 54 9,73,042 6,328 5,24,254 3,389
30-Dec-13 4,97,673 3,317 2,692 17 1,313 8 5,01,678 3,342 3,61,540 2,347
31-Dec-13 4,31,477 2,871 1,289 8 2,413 15 4,35,179 2,894 4,04,011 2,624
Source: MCX-SX

118
JANUARY SEBI BULLETIN 2014
Table 51: Daily Trends of Currency Derivatives trading at USE during December 2013
Date
Currency FuturesCurrency Options
Total TurnoverOpen Interest at the
end of the dayCalls Puts
No. of
Contracts
Turnover
(` crore)
No. of
Contracts
Turnover
(` crore)
No. of
Contracts
Turnover
(` crore)
No. of
Contracts
Turnover
(` crore)
No. of
contracts
Value
(` crore)
1 2 3 4 5 6 7 8 9 10 11
2-Dec-13 35,848 258 1,10,609 731 27,288 163 1,73,745 1,152 15,802 131
3-Dec-13 21,380 161 44,344 301 33,048 200 98,772 662 13,220 103
4-Dec-13 25,420 183 50,144 323 14,028 88 89,592 594 18,637 149
5-Dec-13 39,511 270 43,688 287 30,404 180 1,13,603 737 17,130 129
6-Dec-13 72,750 470 33,818 225 37,976 229 1,44,544 925 16,627 134
9-Dec-13 23,730 164 48,248 312 73,396 444 1,45,374 920 16,631 127
10-Dec-13 39,250 293 75,208 485 19,099 118 1,33,557 896 16,067 134
11-Dec-13 67,416 501 1,04,079 677 62,988 379 2,34,483 1,558 17,045 133
12-Dec-13 28,005 203 39,172 257 31,318 186 98,495 646 16,361 120
13-Dec-13 49,519 361 69,302 452 55,953 334 1,74,774 1,147 20,178 160
16-Dec-13 52,787 385 47,617 316 56,600 344 1,57,004 1,046 16,492 124
17-Dec-13 31,033 195 35,504 235 27,315 164 93,852 594 15,467 118
18-Dec-13 10,981 72 49,866 327 43,790 269 1,04,637 668 15,440 116
19-Dec-13 20,218 149 57,974 383 38,178 229 1,16,370 761 15,251 116
20-Dec-13 18,433 121 23,538 153 25,214 153 67,185 428 14,424 114
23-Dec-13 54,334 391 22,120 142 45,880 282 1,22,334 815 21,180 177
24-Dec-13 41,169 314 23,191 146 34,576 211 98,936 670 21,768 181
26-Dec-13 61,823 506 39,887 254 62,456 389 1,64,166 1,148 19,571 156
27-Dec-13 24,205 189 80,724 527 83,954 523 1,88,883 1,238 24,418 177
30-Dec-13 30,997 229 70,390 461 41,372 249 1,42,759 939 23,055 174
31-Dec-13 57,504 455 55,219 366 1,08,026 654 2,20,749 1,474 19,084 142
Source: USE.
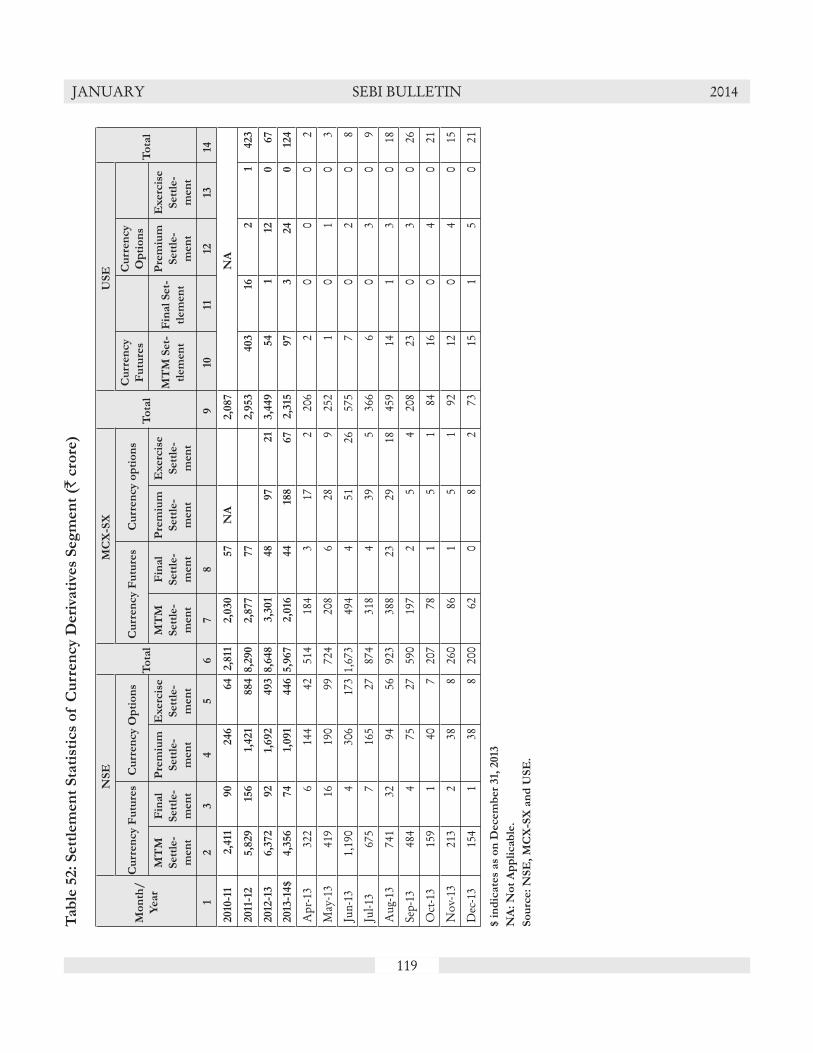
119
JANUARY SEBI BULLETIN 2014T
ab
le 5
2:
Sett
lem
en
t S
tati
stic
s o
f C
urr
en
cy D
eri
vati
ves
Seg
men
t (`
cro
re)
Mo
nth
/
Year
NS
E
To
tal
MC
X-S
X
To
tal
US
E
To
tal
Cu
rren
cy F
utu
res
Cu
rren
cy O
pti
on
sC
urr
en
cy F
utu
res
Cu
rren
cy o
pti
on
sC
urr
en
cy
Fu
ture
s
Cu
rren
cy
Op
tio
ns
MT
M
Sett
le-
men
t
Fin
al
Sett
le-
men
t
Pre
miu
m
Sett
le-
men
t
Exerc
ise
Sett
le-
men
t
MT
M
Sett
le-
men
t
Fin
al
Sett
le-
men
t
Pre
miu
m
Sett
le-
men
t
Exerc
ise
Sett
le-
men
t
MT
M S
et-
tlem
en
t
Fin
al
Set-
tlem
en
t
Pre
miu
m
Sett
le-
men
t
Exerc
ise
Sett
le-
men
t
12
34
56
78
910
1112
1314
2010
-11
2,4
1190
246
64
2,8
112,0
30
57
NA
2,0
87
NA
2011
-12
5,8
29
156
1,421
884
8,2
90
2,8
77
77
2,9
53
403
162
1423
2012
-13
6,3
72
92
1,692
493
8,6
48
3,3
01
48
97
21
3,4
49
54
112
067
2013
-14$
4,3
56
74
1,091
446
5,9
67
2,0
1644
188
67
2,3
1597
324
012
4
Apr
-13
322
614
442
514
184
317
220
62
00
02
May
-13
419
1619
099
724
208
628
925
21
01
03
Jun-
131,
190
430
617
31,
673
494
451
2657
57
02
08
Jul-1
367
57
165
2787
431
84
395
366
60
30
9
Aug
-13
741
3294
5692
338
823
2918
459
141
30
18
Sep-
1348
44
7527
590
197
25
420
823
03
026
Oct
-13
159
140
720
778
15
184
160
40
21
Nov
-13
213
238
826
086
15
192
120
40
15
Dec
-13
154
138
820
062
08
273
151
50
21
$ i
nd
icate
s as
on
Decem
ber
31,
2013
NA
: N
ot
Ap
pli
cab
le.
So
urc
e:
NS
E,
MC
X-S
X a
nd
US
E.
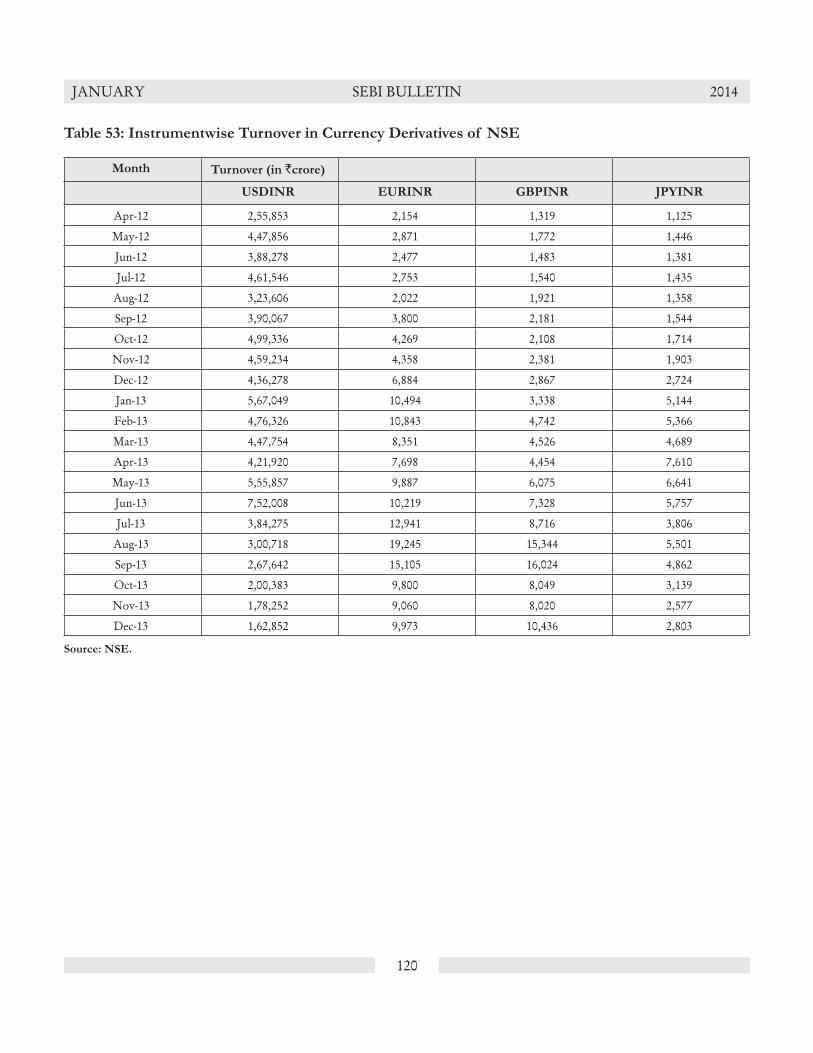
120
JANUARY SEBI BULLETIN 2014
Table 53: Instrumentwise Turnover in Currency Derivatives of NSE
Month Turnover (in `crore)
USDINR EURINR GBPINR JPYINR
Apr-12 2,55,853 2,154 1,319 1,125
May-12 4,47,856 2,871 1,772 1,446
Jun-12 3,88,278 2,477 1,483 1,381
Jul-12 4,61,546 2,753 1,540 1,435
Aug-12 3,23,606 2,022 1,921 1,358
Sep-12 3,90,067 3,800 2,181 1,544
Oct-12 4,99,336 4,269 2,108 1,714
Nov-12 4,59,234 4,358 2,381 1,903
Dec-12 4,36,278 6,884 2,867 2,724
Jan-13 5,67,049 10,494 3,338 5,144
Feb-13 4,76,326 10,843 4,742 5,366
Mar-13 4,47,754 8,351 4,526 4,689
Apr-13 4,21,920 7,698 4,454 7,610
May-13 5,55,857 9,887 6,075 6,641
Jun-13 7,52,008 10,219 7,328 5,757
Jul-13 3,84,275 12,941 8,716 3,806
Aug-13 3,00,718 19,245 15,344 5,501
Sep-13 2,67,642 15,105 16,024 4,862
Oct-13 2,00,383 9,800 8,049 3,139
Nov-13 1,78,252 9,060 8,020 2,577
Dec-13 1,62,852 9,973 10,436 2,803
Source: NSE.
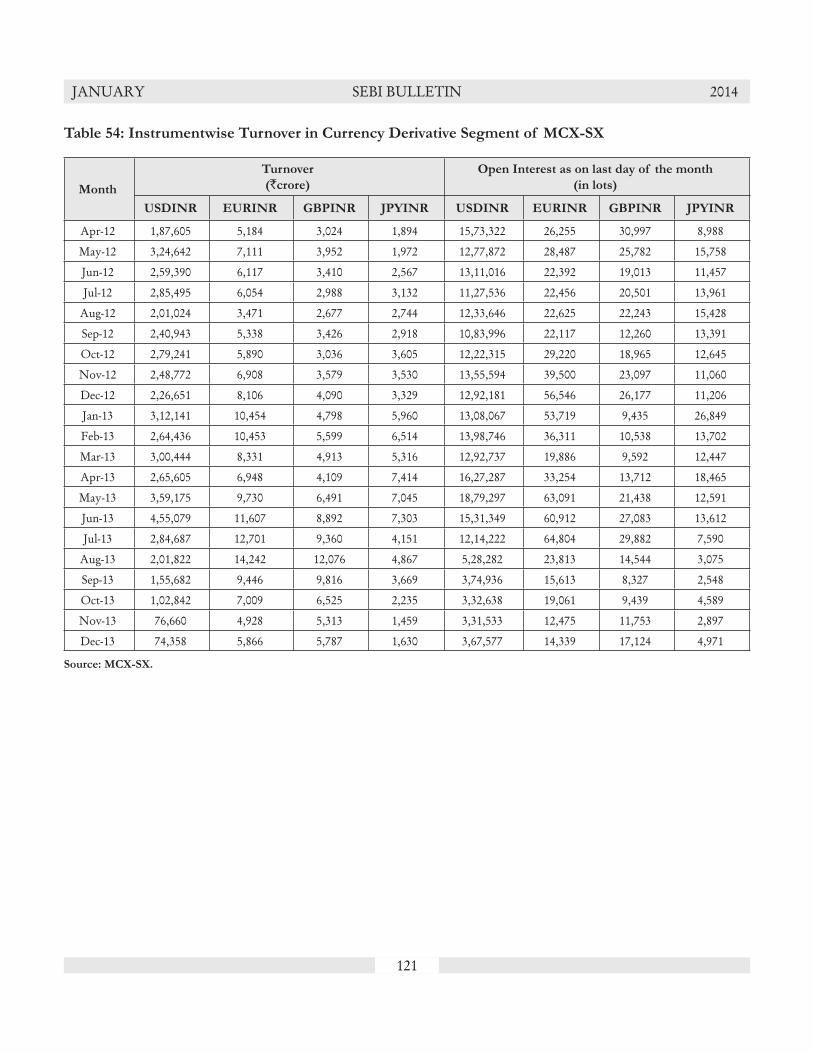
121
JANUARY SEBI BULLETIN 2014
Table 54: Instrumentwise Turnover in Currency Derivative Segment of MCX-SX
Month
Turnover
(`crore)
Open Interest as on last day of the month
(in lots)
USDINR EURINR GBPINR JPYINR USDINR EURINR GBPINR JPYINR
Apr-12 1,87,605 5,184 3,024 1,894 15,73,322 26,255 30,997 8,988
May-12 3,24,642 7,111 3,952 1,972 12,77,872 28,487 25,782 15,758
Jun-12 2,59,390 6,117 3,410 2,567 13,11,016 22,392 19,013 11,457
Jul-12 2,85,495 6,054 2,988 3,132 11,27,536 22,456 20,501 13,961
Aug-12 2,01,024 3,471 2,677 2,744 12,33,646 22,625 22,243 15,428
Sep-12 2,40,943 5,338 3,426 2,918 10,83,996 22,117 12,260 13,391
Oct-12 2,79,241 5,890 3,036 3,605 12,22,315 29,220 18,965 12,645
Nov-12 2,48,772 6,908 3,579 3,530 13,55,594 39,500 23,097 11,060
Dec-12 2,26,651 8,106 4,090 3,329 12,92,181 56,546 26,177 11,206
Jan-13 3,12,141 10,454 4,798 5,960 13,08,067 53,719 9,435 26,849
Feb-13 2,64,436 10,453 5,599 6,514 13,98,746 36,311 10,538 13,702
Mar-13 3,00,444 8,331 4,913 5,316 12,92,737 19,886 9,592 12,447
Apr-13 2,65,605 6,948 4,109 7,414 16,27,287 33,254 13,712 18,465
May-13 3,59,175 9,730 6,491 7,045 18,79,297 63,091 21,438 12,591
Jun-13 4,55,079 11,607 8,892 7,303 15,31,349 60,912 27,083 13,612
Jul-13 2,84,687 12,701 9,360 4,151 12,14,222 64,804 29,882 7,590
Aug-13 2,01,822 14,242 12,076 4,867 5,28,282 23,813 14,544 3,075
Sep-13 1,55,682 9,446 9,816 3,669 3,74,936 15,613 8,327 2,548
Oct-13 1,02,842 7,009 6,525 2,235 3,32,638 19,061 9,439 4,589
Nov-13 76,660 4,928 5,313 1,459 3,31,533 12,475 11,753 2,897
Dec-13 74,358 5,866 5,787 1,630 3,67,577 14,339 17,124 4,971
Source: MCX-SX.

122
JANUARY SEBI BULLETIN 2014
Table 55: Maturitywise Turnover in Currency Derivative Segment of NSE (in `crore)
MonthCurrency Futures Currency Options
1 Month 2 Month 3 Month > 3 months 1 Month 2 Month 3 Month > 3 months
Apr-12 1,61,721 28,787 2,244 2,633 56,282 7,552 459 772
May-12 2,87,945 39,354 5,770 4,707 1,03,683 10,230 342 1,915
Jun-12 2,55,277 34,838 4,036 3,619 87,598 8,068 142 43
Jul-12 2,89,422 37,091 4,767 4,550 1,19,543 10,135 1,655 112
Aug-12 2,05,243 30,197 3,886 2,942 76,806 9,686 111 37
Sep-12 2,36,046 38,067 4,745 3,650 1,03,100 11,600 152 232
Oct-12 3,14,137 39,494 5,077 3,793 1,33,587 11,101 205 34
Nov-12 2,66,908 46,653 6,014 3,942 1,31,847 12,323 174 13
Dec-12 2,75,160 37,157 5,715 3,861 1,15,214 11,493 152 1
Jan-13 3,43,114 47,936 6,290 4,292 1,67,703 16,554 136 0
Feb-13 2,90,943 46,969 6,145 2,802 1,37,024 12,256 1,073 66
Mar-13 2,67,192 42,558 4,933 2,486 1,31,089 16,824 222 18
Apr-13 2,40,857 44,929 4,620 3,103 1,27,104 20,665 375 29
May-13 3,09,368 62,183 8,260 4,125 1,68,796 25,594 113 21
Jun-13 4,02,363 74,883 8,652 6,262 2,47,298 35,608 54 192
Jul-13 2,52,951 29,626 4,964 5,635 1,12,548 3,930 86 0
Aug-13 2,29,520 46,557 4,437 3,988 51,567 4,714 7 17
Sep-13 2,26,794 25,895 2,742 2,155 43,257 2,789 0 0
Oct-13 1,60,037 19,226 2,293 1,529 35,408 2,867 12 0
Nov-13 1,34,548 19,479 1,557 1,283 37,370 3,669 3 0
Dec-13 1,29,608 17,337 1,605 1,088 32,884 3,542 0 0
Source: NSE.
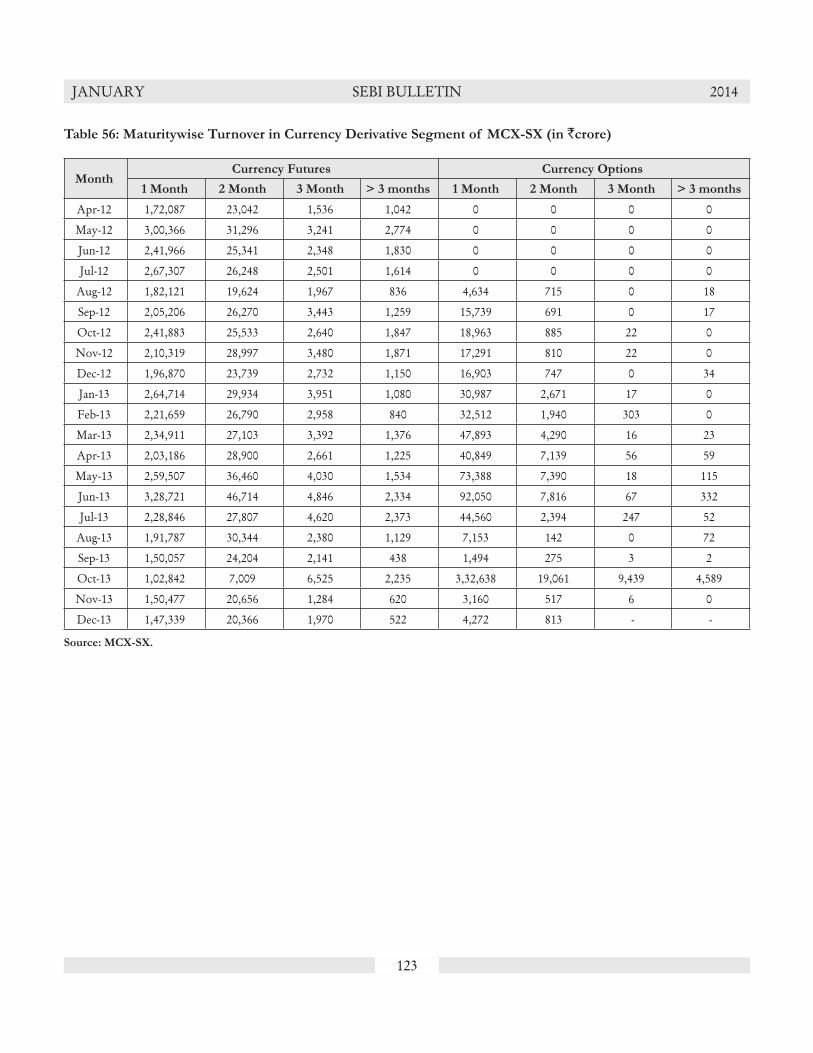
123
JANUARY SEBI BULLETIN 2014
Table 56: Maturitywise Turnover in Currency Derivative Segment of MCX-SX (in `crore)
MonthCurrency Futures Currency Options
1 Month 2 Month 3 Month > 3 months 1 Month 2 Month 3 Month > 3 months
Apr-12 1,72,087 23,042 1,536 1,042 0 0 0 0
May-12 3,00,366 31,296 3,241 2,774 0 0 0 0
Jun-12 2,41,966 25,341 2,348 1,830 0 0 0 0
Jul-12 2,67,307 26,248 2,501 1,614 0 0 0 0
Aug-12 1,82,121 19,624 1,967 836 4,634 715 0 18
Sep-12 2,05,206 26,270 3,443 1,259 15,739 691 0 17
Oct-12 2,41,883 25,533 2,640 1,847 18,963 885 22 0
Nov-12 2,10,319 28,997 3,480 1,871 17,291 810 22 0
Dec-12 1,96,870 23,739 2,732 1,150 16,903 747 0 34
Jan-13 2,64,714 29,934 3,951 1,080 30,987 2,671 17 0
Feb-13 2,21,659 26,790 2,958 840 32,512 1,940 303 0
Mar-13 2,34,911 27,103 3,392 1,376 47,893 4,290 16 23
Apr-13 2,03,186 28,900 2,661 1,225 40,849 7,139 56 59
May-13 2,59,507 36,460 4,030 1,534 73,388 7,390 18 115
Jun-13 3,28,721 46,714 4,846 2,334 92,050 7,816 67 332
Jul-13 2,28,846 27,807 4,620 2,373 44,560 2,394 247 52
Aug-13 1,91,787 30,344 2,380 1,129 7,153 142 0 72
Sep-13 1,50,057 24,204 2,141 438 1,494 275 3 2
Oct-13 1,02,842 7,009 6,525 2,235 3,32,638 19,061 9,439 4,589
Nov-13 1,50,477 20,656 1,284 620 3,160 517 6 0
Dec-13 1,47,339 20,366 1,970 522 4,272 813 - -
Source: MCX-SX.

124
JANUARY SEBI BULLETIN 2014
Table 57: Trends in Foreign Institutional Investment
PeriodGross Purchase
(` crore)
Gross Sales
(` crore)
Net Investment
(` crore)
Net Investment
(US $ mn.)
Cumulative Net
Investment
(US $ mn.)
1 2 3 4 5 6
2008-09 6,14,579 6,60,389 -45,811 -9,837 59,081
2009-10 8,46,438 7,03,780 1,42,658 30,251 89,333
2010-11 9,92,599 8,46,161 1,46,438 32,226 1,21,559
2011-12 9,21,285 8,27,562 93,725 18,923 1,40,482
2012-13 9,04,845 7,36,481 1,68,367 31,047 1,71,529
2013-14$ 7,28,296 7,34,375 -6,078 -539 1,70,989
Apr-13 86,203 75,455 10,749 1,992 1,73,521
May-13 1,01,674 73,536 28,138 5,176 1,78,697
Jun-13 66,998 1,11,160 -44,162 -7,536 1,71,161
Jul-13 75,348 93,472 -18,124 -3,026 1,68,135
Aug-13 86,776 1,02,472 -15,695 -2,457 1,65,679
Sep-13 93,575 86,196 7,380 1,151 1,66,830
Oct-13 71,822 69,694 2,128 357 1,67,186
Nov-13 65,767 63,635 2,133 343 1,67,530
Dec-13 80,133 58,756 21,376 3,460 1,70,989
Notes: 1. The data presented above is compiled on the basis of reports submitted to SEBI by custodians.
$ indicates as on December 31, 2013
Source : SEBI

125
JANUARY SEBI BULLETIN 2014T
ab
le 5
8:
Dail
y T
ren
ds
in F
ore
ign
In
stit
uti
on
al
Inve
stm
en
t d
uri
ng
Decem
ber
2013
Date
Eq
uit
yD
ebt
To
tal
Gro
ss
Pu
rch
ase
(` c
rore
)
Gro
ss
Sale
s
(` c
rore
)
Net
Inve
stm
en
t
(`
cro
re)
Net
Inve
stm
en
t
(US
$ m
n.)*
Gro
ss
Pu
rch
ase
(` c
rore
)
Gro
ss S
ale
s
(` c
rore
)
Net
Inve
stm
en
t
(`
cro
re)
Net
Inve
stm
en
t
(US
$ m
n)*
Gro
ss
Pu
rch
ase
(` c
rore
)
Gro
ss S
ale
s
(` c
rore
)
Net
Inve
stm
en
t
(`
cro
re)
Net
Inve
stm
en
t
(US
$ m
n.)*
12
34
56
78
910
1112
13
2-D
ec-1
32,
622
1,87
774
612
015
014
09
22,
772
2,01
775
512
1
3-D
ec-1
32,
230
1,43
579
412
81,
244
784
460
743,
474
2,21
91,
255
202
4-D
ec-1
32,
530
2,00
852
284
1,22
022
299
816
03,
750
2,23
11,
520
244
5-D
ec-1
32,
442
2,27
416
827
184
968
-784
-126
2,62
63,
242
-617
-99
6-D
ec-1
33,
937
2,63
91,
298
210
1,28
590
538
062
5,22
23,
544
1,67
827
2
10-D
ec-1
37,
970
4,59
43,
375
552
1,91
163
91,
271
208
9,88
05,
234
4,64
776
0
11-D
ec-1
34,
574
4,14
343
170
1,57
225
41,
318
215
6,14
64,
397
1,74
828
6
12-D
ec-1
32,
984
2,00
198
216
077
845
632
252
3,76
12,
457
1,30
421
3
13-D
ec-1
32,
875
2,63
623
939
662
841
-179
-29
3,53
63,
477
6010
17-D
ec-1
35,
509
5,74
6-2
37-3
882
498
1-1
57-2
56,
332
6,72
7-3
95-6
4
18-D
ec-1
34,
175
2,86
81,
307
211
1,03
31,
493
-460
-74
5,20
84,
360
848
137
19-D
ec-1
35,
280
3,39
41,
886
305
1,65
149
11,
160
187
6,93
13,
885
3,04
649
2
20-D
ec-1
34,
282
2,05
02,
232
358
1,14
029
484
613
65,
422
2,34
43,
078
493
23-D
ec-1
33,
464
2,62
783
813
592
516
376
212
24,
389
2,79
01,
600
257
26-D
ec-1
33,
960
3,77
118
931
509
693
-184
-30
4,46
84,
463
51
27-D
ec-1
32,
661
1,87
878
412
636
417
-382
-62
2,69
72,
295
402
65
30-D
ec-1
31,
461
1,05
740
465
552
151
401
652,
013
1,20
880
513
0
31-D
ec-1
31,
306
1,17
712
921
200
690
-490
-79
1,50
61,
867
-362
-58
To
tal
64,2
59
48,1
74
16,0
86
2,6
02
15,8
73
10,5
83
5,2
90
858
80,1
33
58,7
56
21,
376
3,4
60
No
tes:
Th
e d
ata
pre
sen
ted
fo
r D
ecem
ber
10, 2013
is
co
mp
iled
on
th
e b
asi
s o
f r
ep
ort
s su
bm
itte
d t
o S
EB
I b
y a
ll c
ust
od
ian
s o
n D
ecem
ber
10, 2013
an
d c
on
stit
ute
s tr
ad
es
co
nd
ucte
d b
y F
IIs
on
Decem
ber
6,
2013
an
d D
ecem
ber
9,
2013
.
Th
e d
ata
pre
sen
ted
fo
r D
ecem
ber
17, 2013
is
co
mp
iled
on
th
e b
asi
s o
f r
ep
ort
s su
bm
itte
d t
o S
EB
I b
y a
ll c
ust
od
ian
s o
n D
ecem
ber
17, 2013
an
d c
on
stit
ute
s tr
ad
es
co
nd
ucte
d b
y F
IIs
on
Decem
ber
13,
2013
an
d D
ecem
ber
16,
2013
.
Th
e d
ata
pre
sen
ted
fo
r D
ecem
ber
26, 2013
is
co
mp
iled
on
th
e b
asi
s o
f r
ep
ort
s su
bm
itte
d t
o S
EB
I b
y a
ll c
ust
od
ian
s o
n D
ecem
ber
26, 2013
an
d c
on
stit
ute
s tr
ad
es
co
nd
ucte
d b
y F
IIs
on
Decem
ber
23,
2013
an
d D
ecem
ber
24,
2013
.
Th
e d
ata
pre
sen
ted
ab
ove
is
co
mp
iled
on
th
e b
asi
s o
f r
ep
ort
s su
bm
itte
d t
o S
EB
I b
y c
ust
od
ian
s o
n 3
1/12
/2013
an
d c
on
stit
ute
s tr
ad
es
co
nd
ucte
d b
y F
IIs
on
an
d
up
to t
he p
revio
us
trad
ing
day(s
).
* C
on
vers
ion
rate
: T
he d
ail
y R
BI
refe
ren
ce r
ate
as
on
th
e t
rad
ing
day h
as
been
ad
op
ted
. (I
f t
he t
rad
ing
day i
s a b
an
k h
oli
day,
im
med
iate
ly p
reced
ing
day’s
refe
ren
ce r
ate
has
been
use
d).
So
urc
e:
SE
BI

126
JANUARY SEBI BULLETIN 2014
Table 59: Notional Value of Participatory Notes (PNs) Vs Assets Under Management of FIIs
(in ` Crores)
Month
Total value of PNs
on Equity & Debt
including PNs on
derivatives
Total value of PNs
on Equity & Debt
excluding PNs on
derivatives
Assets Under
Custody of FIIs
Total value of PNs
on Equity & Debt
including PNs on
derivatives as % of
(4)
Total value of PNs
on Equity & Debt
excluding PNs on
derivatives as %
of (4)
1 2 3 4 5 6
2011-12 1,65,832 1,15,332 11,07,399 15.0 10.4
2012-13 1,47,905 1,04,229 13,36,557 11.1 7.8
2013-14$ 1,67,566 1,15,181 14,64,355 11.4 7.9
Apr-13 1,57,578 1,11,486 13,91,619 11.3 8.0
May-13 1,68,263 1,10,904 14,38,980 11.7 7.7
Jun-13 1,47,498 99,763 13,49,184 10.9 7.4
Jul-13 1,48,118 94,814 12,93,687 11.5 7.3
Aug-13 1,64,817 1,02,224 12,42,154 13.3 8.2
Sep-13 1,71,154 1,06,527 13,10,194 13.1 8.1
Oct-13 1,83,862 1,11,847 14,16,560 13.0 7.9
Nov-13 1,83,237 1,11,567 14,06,462 13.0 7.9
Dec-13 1,67,566 1,15,181 14,64,355 11.4 7.9
* Data for the month of November 2013 is Provisonal
$ indicates as on December 31, 2013
Source:SEBI.
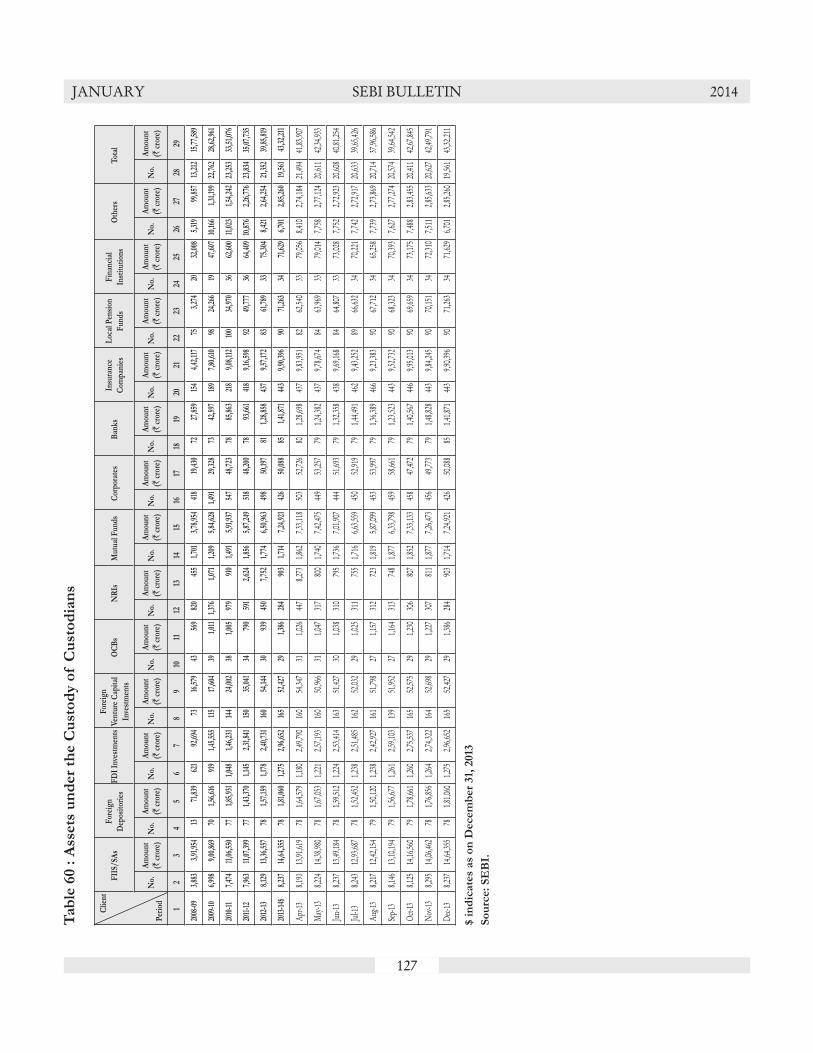
127
JANUARY SEBI BULLETIN 2014T
ab
le 6
0 :
Ass
ets
un
der
the C
ust
od
y o
f C
ust
od
ian
s
Clie
nt
Per
iod
FII
S/SA
sF
orei
gn
Dep
osit
orie
sF
DI
Inve
stm
ents
For
eign
Ven
ture
Cap
ital
Inve
stm
ents
OC
Bs
NR
IsM
utua
l Fun
dsC
orpo
rate
sB
anks
Insu
ranc
e
Com
pani
es
Loc
al P
ensi
on
Fun
ds
Fin
anci
al
Inst
itut
ions
O
ther
sT
otal
No.
Am
ount
(` c
rore
)N
o.A
mou
nt
(` c
rore
)N
o.A
mou
nt
(` c
rore
)N
o.A
mou
nt
(` c
rore
)N
o.A
mou
nt
(` c
rore
)N
o.A
mou
nt
(` c
rore
)N
o.A
mou
nt
(` c
rore
)N
o.A
mou
nt
(` c
rore
)N
o.A
mou
nt
(` c
rore
)N
o.A
mou
nt
(` c
rore
)N
o.A
mou
nt
(` c
rore
)N
o.A
mou
nt
(` c
rore
)N
o.A
mou
nt
(` c
rore
)N
o.A
mou
nt
(` c
rore
)
12
34
56
78
910
1112
1314
1516
1718
1920
2122
2324
2526
2728
29
2008
-09
3,88
33,
91,9
5413
71,8
3962
192
,694
7316
,579
4356
982
045
51,
701
3,78
,954
418
19,4
3072
27,8
5915
44,
42,1
1775
3,27
420
32,0
085,
319
99,8
5713
,212
15,7
7,58
9
2009
-10
6,99
89,
00,8
6970
1,56
,616
919
1,45
,555
115
17,6
0439
1,01
11,
376
1,07
11,
209
5,84
,628
1,49
129
,328
7342
,597
189
7,80
,610
9824
,266
1947
,607
10,1
661,
31,1
9922
,762
28,6
2,96
1
2010
-11
7,47
411
,06,
550
771,
85,9
311,
048
1,46
,231
144
24,0
0238
1,00
597
991
01,
491
5,91
,937
547
48,7
2378
85,8
6321
89,
08,1
1210
034
,970
3662
,600
11,0
231,
54,2
4223
,253
33,5
1,07
6
2011
-12
7,96
311
,07,
399
771,
43,3
701,
145
2,31
,841
150
35,0
4134
790
591
2,62
41,
856
5,87
,249
518
48,2
0078
93,6
6141
89,
16,5
9892
49,7
7736
64,4
0910
,876
2,26
,776
23,8
3435
,07,
735
2012
-13
8,12
913
,36,
557
781,
57,1
591,
178
2,40
,731
160
54,1
4430
939
450
7,75
21,
774
6,50
,963
498
50,1
9781
1,28
,858
437
9,57
,172
8361
,789
3375
,304
8,42
12,
64,2
5421
,352
39,8
5,81
9
2013
-14$
8,23
714
,64,
355
781,
81,0
601,
275
2,96
,652
165
52,4
2729
1,38
628
490
31,
714
7,24
,921
426
50,0
8885
1,41
,871
443
9,90
,396
9071
,263
3471
,629
6,70
12,
85,2
6019
,561
43,3
2,21
1
Apr-1
38,1
9113
,91,61
978
1,64,5
791,1
802,4
9,790
160
54,34
731
1,026
447
8,273
1,862
7,33,1
1850
352
,726
801,2
8,698
437
9,83,9
5182
62,54
033
79,05
68,4
102,7
4,184
21,49
441
,83,90
7
May-1
38,2
2414
,38,98
078
1,67,0
531,2
212,5
7,193
160
50,96
631
1,047
317
800
1,740
7,42,4
7544
953
,257
791,2
4,382
437
9,78,6
7484
63,96
933
79,01
47,7
582,7
7,124
20,61
142
,34,93
3
Jun-13
8,237
13,49
,184
781,5
9,512
1,224
2,53,4
1416
351
,427
301,0
3831
079
51,7
367,0
1,907
444
51,69
379
1,32,3
5843
89,6
9,168
8464
,807
3373
,028
7,752
2,72,9
2320
,608
40,81
,254
Jul-13
8,243
12,93
,687
781,5
2,452
1,238
2,51,4
8516
252
,032
291,0
2531
175
51,7
166,6
3,559
450
52,91
979
1,44,4
9146
29,4
3,252
8966
,632
3470
,221
7,742
2,72,9
1720
,633
39,65
,426
Aug-1
38,2
1712
,42,15
479
1,50,1
201,2
382,4
2,927
161
51,79
827
1,157
312
723
1,819
5,87,0
9945
353
,997
791,3
6,389
466
9,23,3
8390
67,71
234
65,25
87,7
392,7
3,869
20,71
437
,96,58
6
Sep-13
8,146
13,10
,194
791,5
6,677
1,261
2,59,1
0313
951
,952
271,1
6431
374
81,8
776,3
3,798
459
58,66
179
1,23,5
2344
39,5
2,732
9068
,323
3470
,393
7,627
2,77,2
7420
,574
39,64
,542
Oct-1
38,1
2514
,16,56
079
1,78,6
611,2
602,7
5,537
165
52,57
529
1,230
306
807
1,852
7,33,1
3345
847
,472
791,4
0,567
446
9,95,0
1390
69,65
934
73,17
57,4
882,8
3,455
20,41
142
,67,84
5
Nov-1
38,2
9514
,06,46
278
1,76,8
561,2
642,7
4,322
164
52,69
829
1,227
307
811
1,877
7,26,4
7345
649
,773
791,4
8,828
443
9,84,2
4590
70,15
134
72,31
07,5
112,8
5,633
20,62
742
,49,79
1
Dec-1
38,2
3714
,64,35
578
1,81,0
601,2
752,9
6,652
165
52,42
729
1,386
284
903
1,714
7,24,9
2142
650
,088
851,4
1,871
443
9,90,3
9690
71,26
334
71,62
96,7
012,8
5,260
19,56
143
,32,21
1
$ i
nd
icate
s as
on
Decem
ber
31,
2013
So
urc
e:
SE
BI.

128
JANUARY SEBI BULLETIN 2014T
ab
le 6
1: T
ren
ds
in R
eso
urc
e M
ob
ilis
ati
on
by M
utu
al
Fu
nd
s
(` c
rore
)
Peri
od
Gro
ss M
ob
ilis
ati
on
Red
em
pti
on
Net
Infl
ow
/O
utf
low
Ass
ets
at
the
En
d o
f
Peri
od
Pvt.
Secto
rU
TI
Pu
bli
c
Secto
rT
ota
l P
vt.
Secto
rU
TI
Pu
bli
c
Secto
rT
ota
l P
vt.
Secto
rU
TI
Pu
bli
c
Secto
rT
ota
l
12
34
56
78
910
1112
1314
2008-0
9
42,9
2,7
51
4,2
3,1
31
7,1
0,4
72
54,2
6,3
54
43,2
6,7
68
4,2
6,7
90
7,0
1,092
54,5
4,6
50
-34,0
18-3
,658
9,3
80
-28,2
96
4,1
7,3
00
2009-1
0
76,9
8,4
83
8,8
1,851
14,3
8,6
88
1,00
,19,
023
76,4
3,5
55
8,6
6,1
98
14,2
6,1
89
99,3
5,9
42
54,9
28
15,6
53
12,4
99
83,0
80
6,1
3,9
79
2010
-11
69,2
2,9
24
7,8
3,8
58
11,5
2,7
33
88,5
9,5
1569,4
2,1
40
8,0
0,4
94
11,6
6,2
88
89,0
8,9
21
-19,2
15-1
6,6
36
-13,5
55
-49,4
06
5,9
2,2
50
2011
-12
56,8
3,7
44
5,2
2,4
53
6,1
3,4
82
68,1
9,6
79
56,9
9,1
89
5,2
5,6
37
6,1
6,8
77
68,4
1,702
-15,4
46
-3,1
84
-3,3
94
-22,0
24
5,8
7,2
17
2012
-13
59,8
7,8
89
6,3
3,3
50
6,4
6,6
46
72,6
7,8
85
59,1
9,9
79
6,2
8,7
20
6,4
2,6
47
71,
91,
346
67,9
114,6
29
3,9
99
76,5
39
7,0
1,443
2013
-14$
59,4
1,725
5,5
8,0
49
6,8
6,3
01
71,
86,0
75
58,8
1,530
5,5
1,039
6,7
7,4
09
71,
09,9
78
60,1
96
7,0
108,8
92
76,0
98
8,2
5,8
40
Apr
-13
5,50
,268
58,1
6770
,175
6,78
,610
4,65
,846
43,7
3162
,459
5,72
,036
84,4
2214
,436
7,71
71,
06,5
748,
25,5
52
May
-13
5,96
,199
62,1
2644
,732
7,03
,057
5,62
,524
59,3
8543
,713
6,65
,622
33,6
762,
741
1,01
937
,435
8,68
,426
Jun-
135,
68,6
8461
,744
67,8
536,
98,2
816,
09,4
0567
,986
69,2
947,
46,6
85-4
0,72
1-6
,242
-1,4
41-4
8,40
38,
11,4
81
Jul-1
36,
37,6
3965
,762
73,5
527,
76,9
536,
89,2
6465
,391
72,3
658,
27,0
20-5
1,62
537
11,
187
-50,
067
7,60
,833
Aug
-13
6,82
,127
53,2
8869
,822
8,05
,237
6,54
,828
56,2
7470
,422
7,81
,524
27,2
99-2
,986
-601
23,7
137,
66,1
03
Sep-
137,
24,2
9358
,597
83,9
918,
66,8
817,
52,5
2961
,886
86,3
769,
00,7
91-2
8,23
5-3
,289
-2,3
85-3
3,91
07,
45,9
69
Oct
-13
7,95
,729
80,5
781,
05,2
219,
81,5
287,
48,5
1471
,651
95,0
379,
15,2
0247
,215
8,92
610
,184
66,3
258,
33,9
61
Nov
-13
6,56
,296
52,3
0282
,299
7,90
,896
6,06
,129
53,8
0381
,957
7,41
,889
50,1
67-1
,502
342
49,0
088,
89,9
52
Dec
-13
7,30
,490
65,4
8588
,656
8,84
,631
7,92
,492
70,9
3195
,786
9,59
,209
-62,
002
-5,4
46-7
,129
-74,
578
8,25
,840
$ i
nd
icate
s as
on
Decem
ber
31,
2013
So
urc
e:
SE
BI.
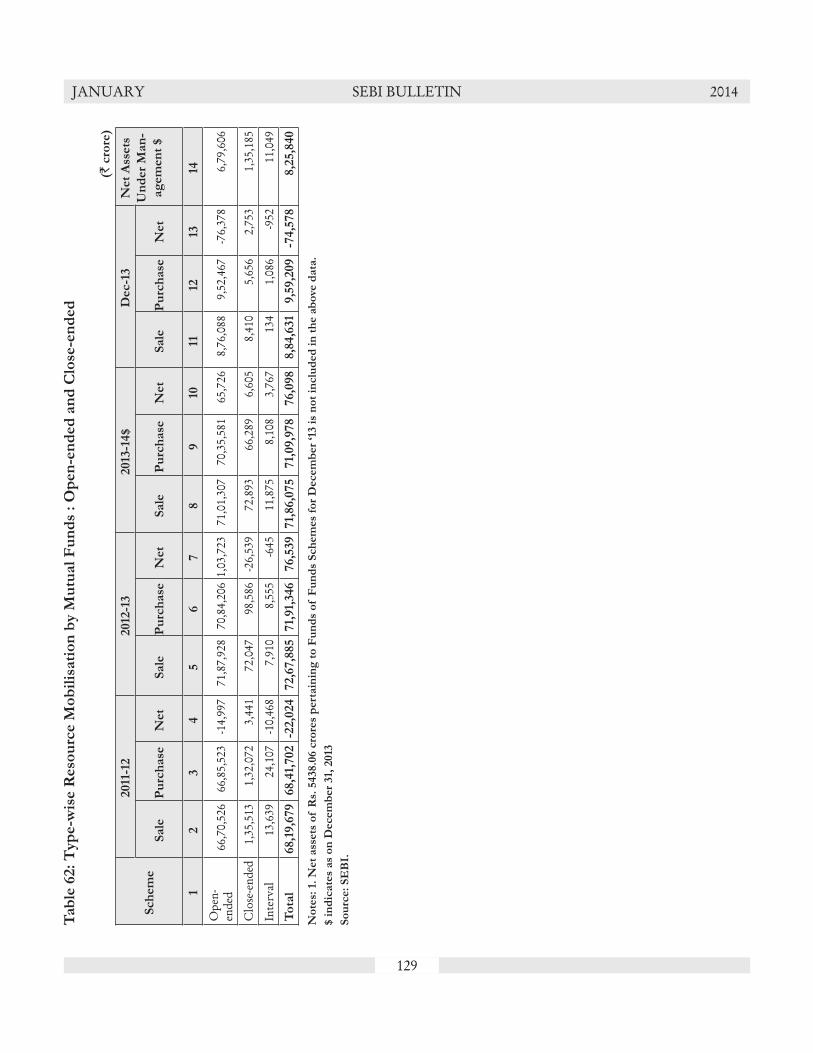
129
JANUARY SEBI BULLETIN 2014T
ab
le 6
2:
Typ
e-w
ise R
eso
urc
e M
ob
ilis
ati
on
by M
utu
al
Fu
nd
s :
Op
en
-en
ded
an
d C
lose
-en
ded
(` c
rore
)
Sch
em
e
2011
-12
2012
-13
2013
-14$
Dec-1
3N
et
Ass
ets
Un
der
Man
-
ag
em
en
t $
Sale
Pu
rch
ase
Net
Sale
Pu
rch
ase
Net
Sale
Pu
rch
ase
Net
Sale
Pu
rch
ase
Net
12
34
56
78
910
1112
1314
Ope
n-en
ded
66,7
0,52
666
,85,
523
-14,
997
71,8
7,92
870
,84,
206
1,03
,723
71,0
1,30
770
,35,
581
65,7
268,
76,0
889,
52,4
67-7
6,37
86,
79,6
06
Clo
se-e
nded
1,35
,513
1,32
,072
3,44
172
,047
98,5
86-2
6,53
972
,893
66,2
896,
605
8,41
05,
656
2,75
31,
35,1
85
Inte
rval
13,6
3924
,107
-10,
468
7,91
08,
555
-645
11,8
758,
108
3,76
713
41,
086
-952
11,0
49
To
tal
68,1
9,6
79
68,4
1,702
-22,0
24
72,6
7,8
85
71,
91,
346
76,5
39
71,
86,0
75
71,
09,9
78
76,0
98
8,8
4,6
31
9,5
9,2
09
-74,5
78
8,2
5,8
40
No
tes:
1.
Net
ass
ets
of R
s. 5
438.0
6 c
rore
s p
ert
ain
ing
to
Fu
nd
s o
f F
un
ds
Sch
em
es
for
Decem
ber
‘13 i
s n
ot
inclu
ded
in
th
e a
bo
ve d
ata
.
$ i
nd
icate
s as
on
Decem
ber
31,
2013
So
urc
e:
SE
BI.
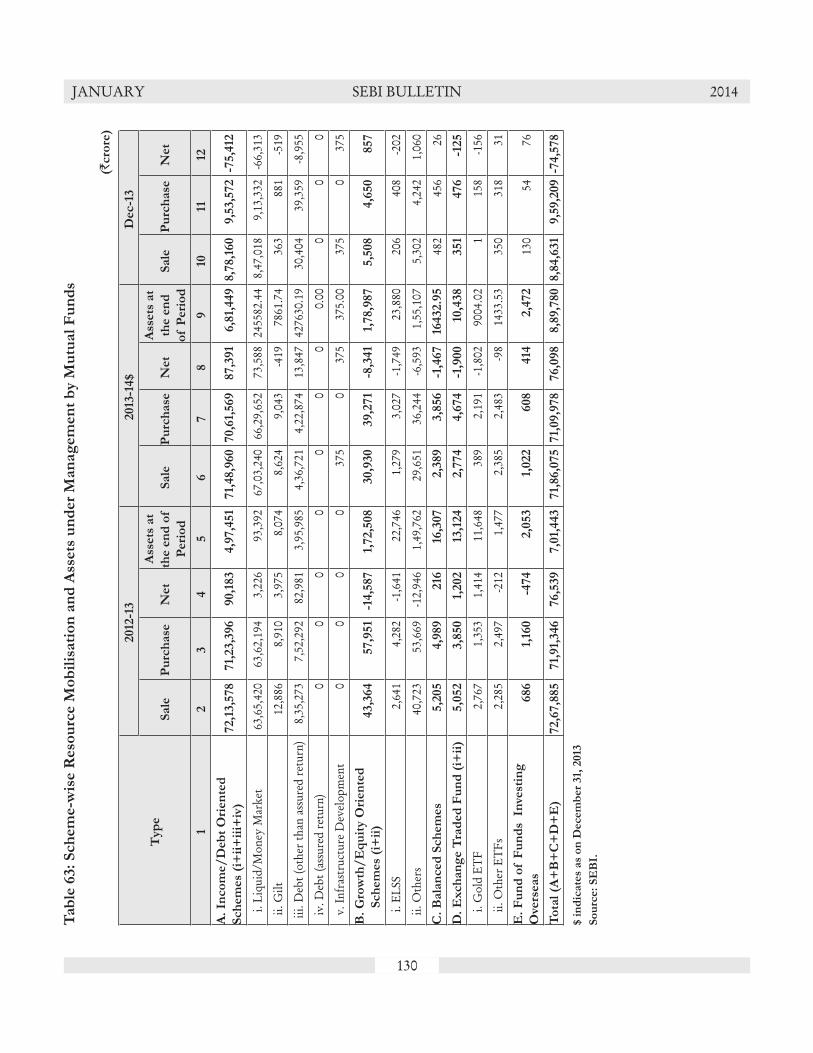
130
JANUARY SEBI BULLETIN 2014T
ab
le 6
3:
Sch
em
e-w
ise R
eso
urc
e M
ob
ilis
ati
on
an
d A
ssets
un
der
Man
ag
em
en
t b
y M
utu
al
Fu
nd
s
(`cro
re)
Typ
e
2012
-13
2013
-14$
Dec-1
3
Sale
Pu
rch
ase
Net
Ass
ets
at
the e
nd
of
Peri
od
Sale
Pu
rch
ase
Net
Ass
ets
at
the e
nd
of P
eri
od
Sale
Pu
rch
ase
Net
12
34
56
78
910
1112
A.
Inco
me/
Deb
t O
rien
ted
Sch
em
es
(i+
ii+
iii+
iv)
72,1
3,5
78
71,
23,3
96
90,1
83
4,9
7,4
51
71,
48,9
60
70,6
1,569
87,3
91
6,8
1,449
8,7
8,1
60
9,5
3,5
72
-75,4
12
i.
Liq
uid/
Mon
ey M
arke
t63
,65,
420
63,6
2,19
43,
226
93,3
9267
,03,
240
66,2
9,65
273
,588
2455
82.4
48,
47,0
189,
13,3
32-6
6,31
3
ii.
Gilt
12,8
868,
910
3,97
58,
074
8,62
49,
043
-419
7861
.74
363
881
-519
iii.
Deb
t (ot
her
than
ass
ured
ret
urn)
8,35
,273
7,52
,292
82,9
813,
95,9
854,
36,7
214,
22,8
7413
,847
4276
30.1
930
,404
39,3
59-8
,955
iv
. Deb
t (as
sure
d re
turn
)0
00
00
00
0.00
00
0
v.
Infr
astr
uctu
re D
evel
opm
ent
00
00
375
037
537
5.00
375
037
5
B.
Gro
wth
/E
qu
ity O
rien
ted
S
ch
em
es
(i+
ii)
43,3
64
57,9
51
-14,5
87
1,72,5
08
30,9
30
39,2
71
-8,3
41
1,78,9
87
5,5
08
4,6
50
857
i.
ELS
S2,
641
4,28
2-1
,641
22,7
461,
279
3,02
7-1
,749
23,8
8020
640
8-2
02
ii.
Oth
ers
40,7
2353
,669
-12,
946
1,49
,762
29,6
5136
,244
-6,5
931,
55,1
075,
302
4,24
21,
060
C.
Bala
nced
Sch
em
es
5,2
05
4,9
89
216
16,3
07
2,3
89
3,8
56
-1,4
67
16432.9
548
245
626
D.
Exch
an
ge T
rad
ed
Fu
nd
(i+
ii)
5,0
52
3,8
50
1,202
13,1
24
2,7
74
4,6
74
-1,9
00
10,4
38
351
476
-125
i.
Gol
d ET
F2,
767
1,35
31,
414
11,6
4838
92,
191
-1,8
0290
04.0
21
158
-156
ii
. Oth
er E
TFs
2,28
52,
497
-212
1,47
72,
385
2,48
3-9
814
33.5
335
031
831
E.
Fu
nd
of F
un
ds
In
vest
ing
Ove
rseas
686
1,16
0-4
74
2,0
53
1,022
608
414
2,4
72
130
5476
To
tal
(A+
B+
C+
D+
E)
72,6
7,8
85
71,
91,
346
76,5
39
7,0
1,443
71,
86,0
75
71,
09,9
78
76,0
98
8,8
9,7
80
8,8
4,6
31
9,5
9,2
09
-74,5
78
$ i
nd
icate
s as
on
Decem
ber
31,
2013
So
urc
e:
SE
BI.
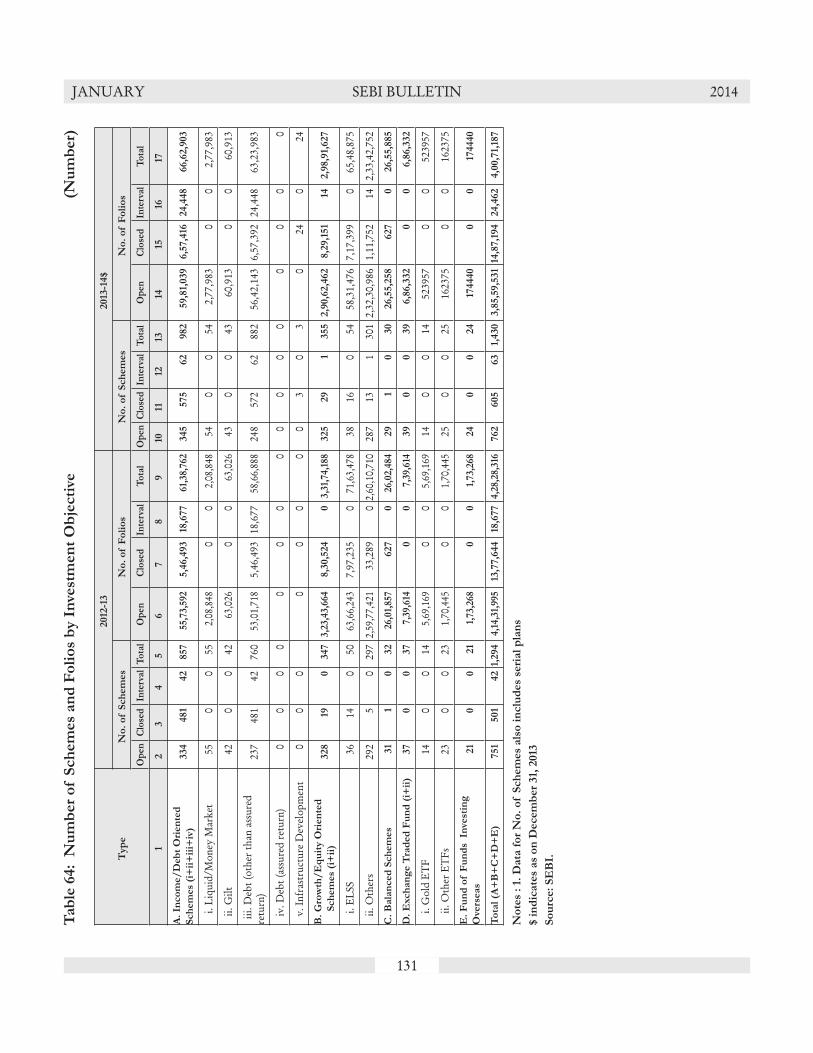
131
JANUARY SEBI BULLETIN 2014T
ab
le 6
4:
Nu
mb
er
of S
ch
em
es
an
d F
oli
os
by I
nve
stm
en
t O
bje
cti
ve
(Nu
mb
er)
Typ
e
2012
-13
2013
-14$
No
. o
f S
ch
em
es
No
. o
f F
oli
os
No
. o
f S
ch
em
es
No
. o
f F
oli
os
Op
enC
lose
dIn
terv
alT
ota
lO
pen
Clo
sed
Inte
rval
To
tal
Op
enC
lose
dIn
terv
alT
ota
lO
pen
Clo
sed
Inte
rval
To
tal
12
34
56
78
910
1112
1314
1516
17
A.
Inco
me/
Deb
t O
rien
ted
Sch
em
es
(i+
ii+
iii+
iv)
334
481
42
857
55,7
3,59
25,4
6,4
93
18,6
77
61,3
8,76
2345
575
62
982
59,8
1,039
6,5
7,4
1624,4
48
66,6
2,9
03
i.
Liq
uid/
Mon
ey M
arke
t55
00
552,
08,8
480
02,
08,8
4854
00
542,
77,9
830
02,
77,9
83
ii.
Gilt
420
042
63,0
260
063
,026
430
043
60,9
130
060
,913
iii.
Deb
t (ot
her
than
ass
ured
re
turn
)23
748
142
760
53,0
1,71
85,
46,4
9318
,677
58,6
6,88
824
857
262
882
56,4
2,14
36,
57,3
9224
,448
63,2
3,98
3
iv
. Deb
t (as
sure
d re
turn
)0
00
00
00
00
00
00
00
0
v.
Infr
astr
uctu
re D
evel
opm
ent
00
00
00
00
30
30
240
24
B.
Gro
wth
/E
qu
ity O
rien
ted
S
ch
em
es
(i+
ii)
328
190
347
3,23
,43,
664
8,3
0,5
24
03,
31,7
4,18
8325
29
1355
2,9
0,6
2,4
62
8,2
9,1
51
142,9
8,9
1,627
i.
ELS
S36
140
5063
,66,
243
7,97
,235
071
,63,
478
3816
054
58,3
1,47
67,
17,3
990
65,4
8,87
5
ii.
Oth
ers
292
50
297
2,59
,77,
421
33,2
890
2,60
,10,
710
287
131
301
2,32
,30,
986
1,11
,752
142,
33,4
2,75
2
C.
Bala
nced
Sch
em
es
31
10
32
26,0
1,85
7627
026
,02,
484
29
10
30
26,5
5,2
58
627
026,5
5,8
85
D.
Exch
an
ge T
rad
ed
Fu
nd
(i+
ii)
37
00
37
7,39
,614
00
7,39
,614
39
00
39
6,8
6,3
32
00
6,8
6,3
32
i.
Gol
d ET
F14
00
145,
69,1
690
05,
69,1
6914
00
1452
3957
00
5239
57
ii
. Oth
er E
TFs
230
023
1,70
,445
00
1,70
,445
250
025
1623
750
016
2375
E.
Fu
nd
of F
un
ds
In
vest
ing
Ove
rseas
21
00
21
1,73
,268
00
1,73
,268
24
00
24
174440
00
174440
To
tal
(A+
B+
C+
D+
E)
751
501
42
1,294
4,14
,31,
995
13,7
7,6
44
18,6
77
4,28
,28,
316
762
605
63
1,430
3,8
5,5
9,5
31
14,8
7,1
94
24,4
62
4,0
0,7
1,18
7
No
tes
: 1.
Data
fo
r N
o.
of S
ch
em
es
als
o i
nclu
des
seri
al
pla
ns
$ i
nd
icate
s as
on
Decem
ber
31,
2013
So
urc
e:
SE
BI.
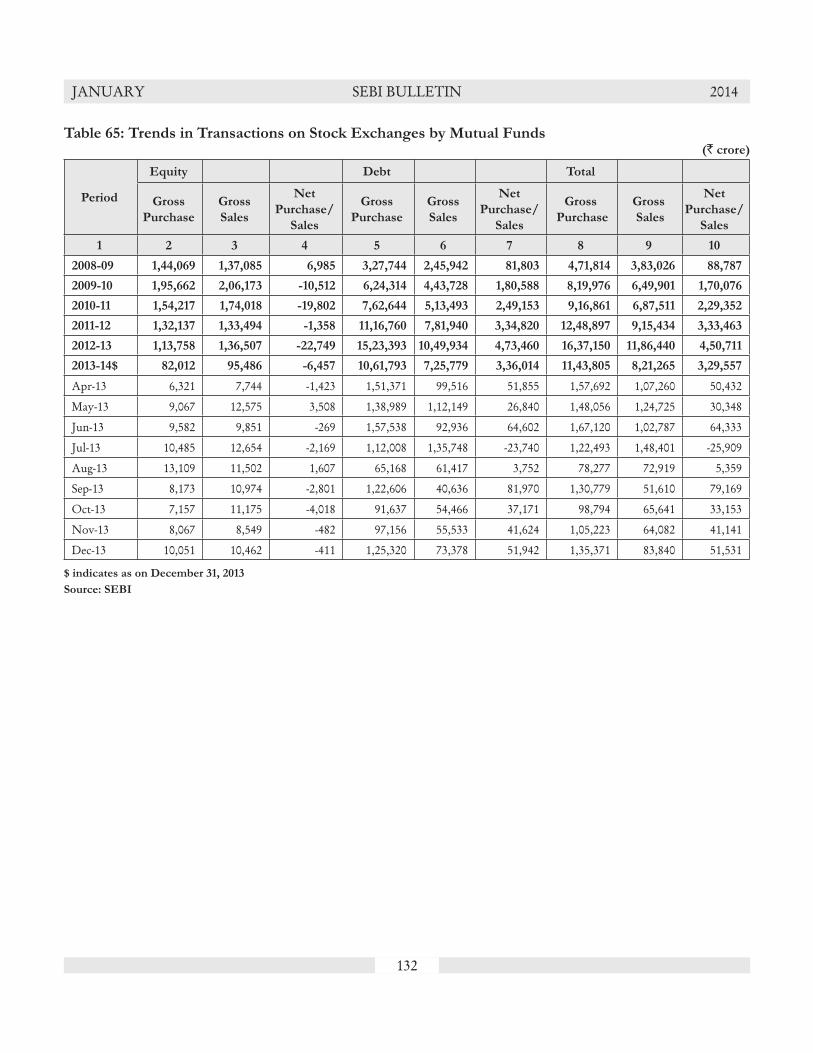
132
JANUARY SEBI BULLETIN 2014
Table 65: Trends in Transactions on Stock Exchanges by Mutual Funds (` crore)
Period
Equity Debt Total
Gross
Purchase
Gross
Sales
Net
Purchase/
Sales
Gross
Purchase
Gross
Sales
Net
Purchase/
Sales
Gross
Purchase
Gross
Sales
Net
Purchase/
Sales
1 2 3 4 5 6 7 8 9 10
2008-09 1,44,069 1,37,085 6,985 3,27,744 2,45,942 81,803 4,71,814 3,83,026 88,787
2009-10 1,95,662 2,06,173 -10,512 6,24,314 4,43,728 1,80,588 8,19,976 6,49,901 1,70,076
2010-11 1,54,217 1,74,018 -19,802 7,62,644 5,13,493 2,49,153 9,16,861 6,87,511 2,29,352
2011-12 1,32,137 1,33,494 -1,358 11,16,760 7,81,940 3,34,820 12,48,897 9,15,434 3,33,463
2012-13 1,13,758 1,36,507 -22,749 15,23,393 10,49,934 4,73,460 16,37,150 11,86,440 4,50,711
2013-14$ 82,012 95,486 -6,457 10,61,793 7,25,779 3,36,014 11,43,805 8,21,265 3,29,557
Apr-13 6,321 7,744 -1,423 1,51,371 99,516 51,855 1,57,692 1,07,260 50,432
May-13 9,067 12,575 3,508 1,38,989 1,12,149 26,840 1,48,056 1,24,725 30,348
Jun-13 9,582 9,851 -269 1,57,538 92,936 64,602 1,67,120 1,02,787 64,333
Jul-13 10,485 12,654 -2,169 1,12,008 1,35,748 -23,740 1,22,493 1,48,401 -25,909
Aug-13 13,109 11,502 1,607 65,168 61,417 3,752 78,277 72,919 5,359
Sep-13 8,173 10,974 -2,801 1,22,606 40,636 81,970 1,30,779 51,610 79,169
Oct-13 7,157 11,175 -4,018 91,637 54,466 37,171 98,794 65,641 33,153
Nov-13 8,067 8,549 -482 97,156 55,533 41,624 1,05,223 64,082 41,141
Dec-13 10,051 10,462 -411 1,25,320 73,378 51,942 1,35,371 83,840 51,531
$ indicates as on December 31, 2013
Source: SEBI

133
JANUARY SEBI BULLETIN 2014T
ab
le 6
6 :
Ass
et
Un
der
Man
ag
em
en
t b
y P
ort
foli
o M
an
ag
er
Year/
Mo
nth
2011
-12
2012
-13
No
v-1
3D
ec-1
3
Rep
ort
ing
Po
rtfo
lio
Man
ag
ers
Part
icu
lars
Dis
cre
-
tio
nary
No
n-
Dis
cre
-
tio
nary
Ad
vis
ory
Dis
cre
-
tio
nary
No
n-
Dis
cre
-
tio
nary
Ad
vis
ory
Dis
cre
-
tio
nary
No
n-D
is-
cre
tio
nary
Ad
vis
ory
Dis
cre
tio
n-
ary
No
n-D
is-
cre
tio
nary
Ad
vis
ory
12
34
56
78
910
1112
13
No
. o
f C
lien
ts65
,600
5,71
29,
296
50,9
374,
461
11,1
8743
,458
5,09
89,
431
43,1
595,
098
9,91
8
AU
M (`
in c
rore
)
List
ed E
quity
15,1
713,
602
73,
914*
15,7
383,
888
79,
841*
17,0
255,
187
1,2
8,19
3*
18,1
005,
614
1,3
2,34
8*
Unl
isted
Equ
ity1,
725
511,
481
561,
442
721,
507
73
Plai
n D
ebt
3,92
,566
11,1
124,
62,7
1516
,898
5,05
,912
22,5
765,
17,6
3623
,931
Stru
ctur
ed D
ebt
1,69
275
61,
063
726
658
606
570
633
Equi
ty
Der
ivat
ive
152
075
011
9-2
122
0
Mut
ual F
und
3,77
02,
857
3,93
94,
406
3,16
55,
926
2,93
86,
662
Oth
ers
8,69
938
114
,841
324
14,3
1431
311
,848
251
To
tal
4,2
3,7
74
18,7
59
4,9
9,8
51
26,2
98
5,3
8,5
48
#34,6
77
552721.
23#
37,1
64
No
tes:
1.
Th
e a
bo
ve d
ata
is
base
d o
n t
he m
on
thly
rep
ort
s re
ceiv
ed
fro
m p
ort
foli
o m
an
ag
ers
.
*V
alu
e o
f A
ssets
fo
r w
hic
h A
dvis
ory
Serv
ices
are
bein
g g
iven
.
#O
f t
he a
bo
ve A
UM
`5,1
3,8
53.9
5 cro
re i
s co
ntr
ibu
ted
by f
un
ds
fro
m E
PF
O/
PF
s.
So
urc
e:
SE
BI.

134
JANUARY SEBI BULLETIN 2014T
ab
le 6
7:
Pro
gre
ss R
ep
ort
of N
SD
L &
CD
SL
as
on
Decem
ber
31,
2013
(L
iste
d c
om
pan
ies)
Para
mete
rU
nit
NS
DL
CD
SL
Dec-1
3N
ov-1
3D
ec-1
2
Perc
ent
Cha
nge o
ver
Cor
resp
ondi
ng
Prev
ious
yea
r
Perc
ent
Cha
nge
duri
ng
mon
th
Dec-1
3N
ov-1
3D
ec-1
2
Perc
ent
Cha
nge o
ver
Cor
resp
ondi
ng
Prev
ious
yea
r
Perc
ent
Cha
nge
duri
ng
mon
th
12
34
56
78
910
1112
Num
ber
of c
ompa
nies
sign
ed u
p to
mak
e th
eir
shar
es a
vaila
ble
for
dem
ater
ializ
atio
nN
umbe
r5,
612
5,59
95,
462
2.7
0.2
5,82
25,
802
5,61
03.
80.
3
Num
ber
of D
epos
itory
Par
ticip
ants
(r
egist
ered
)N
umbe
r28
028
028
2-0
.70.
058
058
057
60.
70.
0
Num
ber
of S
tock
Exc
hang
es
(con
nect
ed)
Num
ber
88
80.
00.
08
87
0.0
0.0
Num
ber
of In
vest
ors A
ccou
nts
Lakh
130.
613
0.0
125.
44.
10.
486
.886
.582
.05.
90.
3
Qua
ntity
of S
hare
s dem
ater
ializ
edcr
ore
35,0
6535
,024
33,7
853.
80.
18,
770
8,67
27,
833
12.0
1.1
Val
ue o
f Sha
res d
emat
eria
lized
`cro
re59
,72,
650
57,3
5,74
957
,38,
816
4.1
4.1
9,05
,171
8,84
,878
9,88
,777
-8.5
2.3
Qua
ntity
of S
ecur
ities
dem
ater
ializ
ed #
cror
e35
,845
35,7
7234
,589
3.6
0.2
8,90
28,
794
7,93
212
.21.
2
Val
ue o
f Sec
uriti
es d
emat
eria
lized
#`c
rore
71,8
8,52
069
,44,
869
67,9
8,46
55.
73.
59,
39,5
899,
17,1
9810
,24,
810
-8.3
2.4
Qua
ntity
of s
hare
s set
tled
duri
ng th
e m
onth
cror
e58
650
775
7-2
2.6
15.7
398
327
472
-15.
821
.5
Ave
rage
Qua
ntity
of s
hare
s set
tled
daily
(qua
ntity
of s
hare
s set
tled
duri
ng
the
mon
th (d
ivid
ed b
y 30
))cr
ore
2017
25-2
2.6
15.7
1311
16-1
5.8
21.5
Val
ue o
f sha
res s
ettle
d du
ring
the
mon
th in
dem
ater
ializ
ed fo
rm`c
rore
1,10
,959
97,3
631,
28,2
02-1
3.5
14.0
30,6
1925
,701
36,7
37-1
6.7
19.1
Ave
rage
Val
ue o
f sha
res s
ettle
d da
ily
(val
ue o
f sha
res s
ettle
d du
ring
the
mon
th (d
ivid
ed b
y 30
))`c
rore
3,69
93,
245
4,27
3-1
3.5
14.0
1,02
185
71,
225
-16.
719
.1
Tra
inin
g Pr
ogra
mm
es c
ondu
cted
for
repr
esen
tativ
es o
f Cor
pora
tes,
DPs
and
Br
oker
sN
umbe
r23
1513
76.9
53.3
290
380
701
-58.
60.
0
The
rat
io o
f dem
ater
ializ
ed e
quity
sh
ares
to th
e to
tal o
utst
andi
ng sh
ares
(m
arke
t val
ue)
perc
ent
84.1
83.5
82.3
2.2
0.6
13.3
13.7
14.6
-8.7
-2.4
No
tes:
1.
Sh
are
s in
clu
des
on
ly e
qu
ity s
hare
s.
2.
Secu
riti
es
inclu
de c
om
mo
n e
qu
ity s
hare
s, P
ref s
hare
s, d
eben
ture
, M
F u
nit
s, e
tc.
3.
No
. o
f d
ays
tak
en
fo
r calc
ula
tin
g D
ail
y A
vera
ge i
s 30 d
ays
inst
ead
of A
ctu
al
sett
lem
en
t d
ays.
4.
Qu
an
tity
an
d v
alu
e o
f s
hare
s m
en
tio
ned
are
sin
gle
sid
ed
.
# S
ou
rce f
or
list
ed
secu
riti
es
info
rmst
ion
: Is
suer/
NS
E/
BS
E
So
urc
e:
NS
DL
an
d C
DS
L.
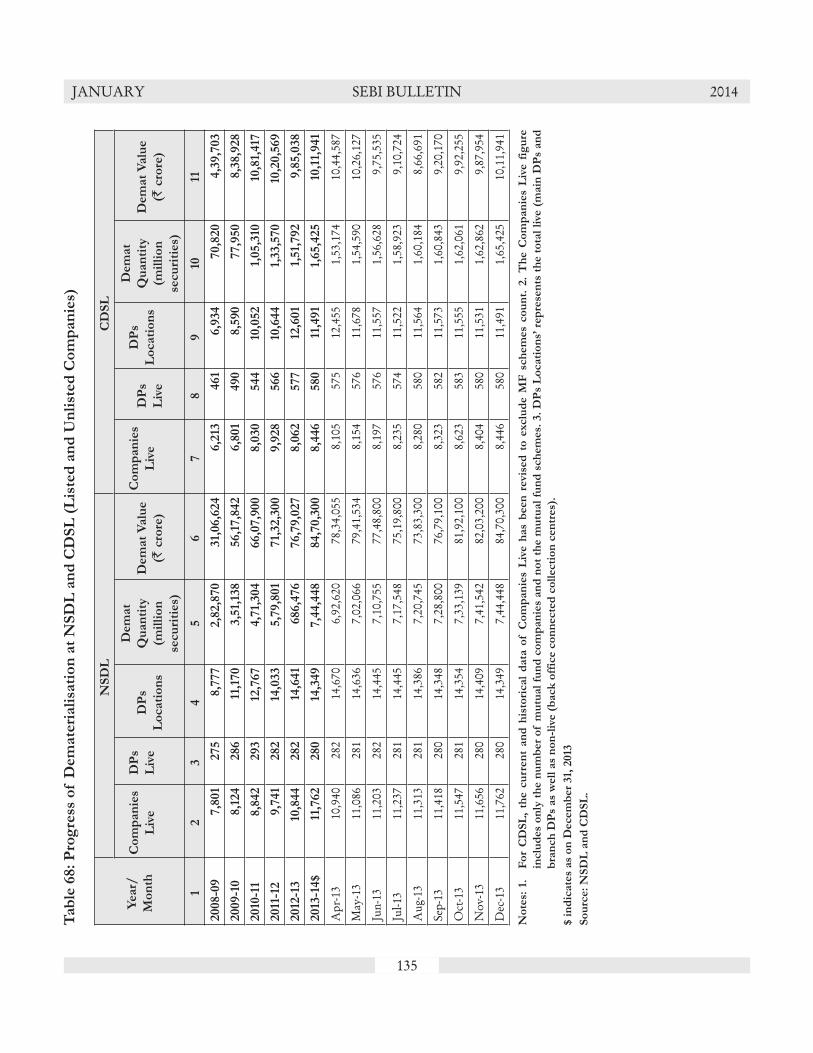
135
JANUARY SEBI BULLETIN 2014T
ab
le 6
8:
Pro
gre
ss o
f D
em
ate
riali
sati
on
at
NS
DL
an
d C
DS
L (
Lis
ted
an
d U
nli
sted
Co
mp
an
ies)
Year/
Mo
nth
NS
DL
CD
SL
Co
mp
an
ies
Liv
e
DP
s
Liv
eD
Ps
Lo
cati
on
s
Dem
at
Qu
an
tity
(mil
lio
n
secu
riti
es)
Dem
at
Valu
e
(` c
rore
)
Co
mp
an
ies
Liv
eD
Ps
Liv
e
DP
s
Lo
cati
on
s
Dem
at
Qu
an
tity
(mil
lio
n
secu
riti
es)
Dem
at
Valu
e
(` c
rore
)
12
34
56
78
910
11
2008-0
9
7,8
01
275
8,7
77
2,8
2,8
70
31,
06,6
24
6,2
13461
6,9
34
70,8
20
4,3
9,7
03
2009-1
08,1
24
286
11,1
70
3,5
1,13
856,1
7,8
42
6,8
01
490
8,5
90
77,9
50
8,3
8,9
28
2010
-11
8,8
42
293
12,7
67
4,7
1,304
66,0
7,9
00
8,0
30
544
10,0
52
1,05,3
1010
,81,
417
2011
-12
9,7
41
282
14,0
33
5,7
9,8
01
71,
32,3
00
9,9
28
566
10,6
44
1,33,5
70
10,2
0,5
69
2012
-13
10,8
44
282
14,6
41
686,4
76
76,7
9,0
27
8,0
62
577
12,6
01
1,51,
792
9,8
5,0
38
2013
-14$
11,7
62
280
14,3
49
7,4
4,4
48
84,7
0,3
00
8,4
46
580
11,4
91
1,65,4
25
10,1
1,941
Apr
-13
10,9
4028
214
,670
6,92
,620
78,3
4,05
58,
105
575
12,4
551,
53,1
7410
,44,
587
May
-13
11,0
8628
114
,636
7,02
,066
79,4
1,53
48,
154
576
11,6
781,
54,5
9010
,26,
127
Jun-
1311
,203
282
14,4
457,
10,7
5577
,48,
800
8,19
757
611
,557
1,56
,628
9,75
,535
Jul-1
311
,237
281
14,4
457,
17,5
4875
,19,
800
8,23
557
411
,522
1,58
,923
9,10
,724
Aug
-13
11,3
1328
114
,386
7,20
,745
73,8
3,30
08,
280
580
11,5
641,
60,1
848,
66,6
91
Sep-
1311
,418
280
14,3
487,
28,8
0076
,79,
100
8,32
358
211
,573
1,60
,843
9,20
,170
Oct
-13
11,5
4728
114
,354
7,33
,139
81,9
2,10
08,
623
583
11,5
551,
62,0
619,
92,2
55
Nov
-13
11,6
5628
014
,409
7,41
,542
82,0
3,20
08,
404
580
11,5
311,
62,8
629,
87,9
54
Dec
-13
11,7
6228
014
,349
7,44
,448
84,7
0,30
08,
446
580
11,4
911,
65,4
2510
,11,
941
No
tes:
1.
Fo
r C
DS
L,
the c
urr
en
t an
d h
isto
rical
data
of C
om
pan
ies
Liv
e h
as
been
revis
ed
to
exclu
de M
F s
ch
em
es
co
un
t. 2
. T
he C
om
pan
ies
Liv
e f
igu
re
inclu
des
on
ly t
he n
um
ber
of m
utu
al
fun
d c
om
pan
ies
an
d n
ot
the m
utu
al
fun
d s
ch
em
es.
3.
DP
s L
ocati
on
s’ r
ep
rese
nts
th
e t
ota
l li
ve (
main
DP
s an
d
bra
nch
DP
s as
well
as
no
n-l
ive (
back
off
ice c
on
necte
d c
oll
ecti
on
cen
tres)
.
$ i
nd
icate
s as
on
Decem
ber
31,
2013
So
urc
e:
NS
DL
an
d C
DS
L.
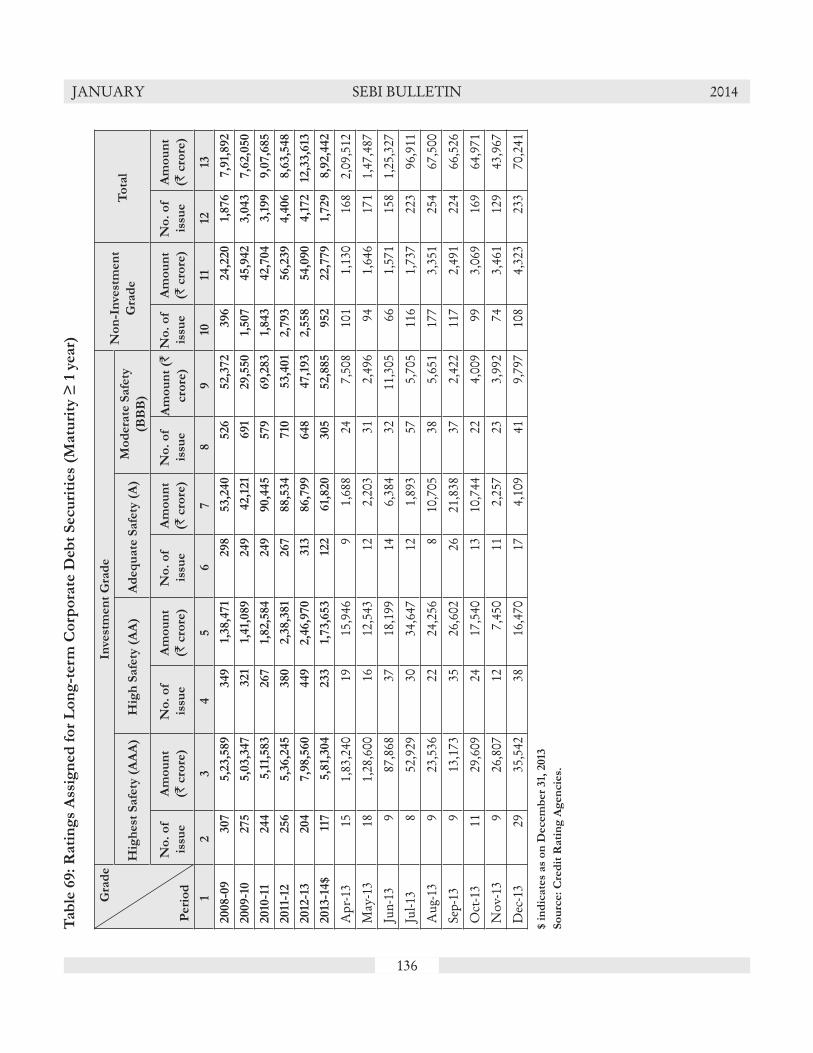
136
JANUARY SEBI BULLETIN 2014T
ab
le 6
9:
Rati
ng
s A
ssig
ned
fo
r L
on
g-t
erm
Co
rpo
rate
Deb
t S
ecu
riti
es
(Matu
rity
≥ 1
year)
Gra
de
Peri
od
Inve
stm
en
t G
rad
eN
on
-In
vest
men
t
Gra
de
To
tal
Hig
hest
Safe
ty (
AA
A)
Hig
h S
afe
ty (
AA
)A
deq
uate
Safe
ty (
A)
Mo
dera
te S
afe
ty
(BB
B)
No
. o
f
issu
e
Am
ou
nt
(` c
rore
)
No
. o
f
issu
e
Am
ou
nt
(` c
rore
)
No
. o
f
issu
e
Am
ou
nt
(` c
rore
)
No
. o
f
issu
e
Am
ou
nt
(`
cro
re)
No
. o
f
issu
e
Am
ou
nt
(` c
rore
)
No
. o
f
issu
e
Am
ou
nt
(` c
rore
)
12
34
56
78
910
1112
13
2008-0
9
307
5,2
3,5
89
349
1,38,4
71
298
53,2
40
526
52,3
72
396
24,2
20
1,876
7,9
1,892
2009-1
0
275
5,0
3,3
47
321
1,41,
089
249
42,1
21
691
29,5
50
1,507
45,9
42
3,0
43
7,6
2,0
50
2010
-11
244
5,1
1,583
267
1,82,5
84
249
90,4
45
579
69,2
83
1,843
42,7
04
3,1
99
9,0
7,6
85
2011
-12
256
5,3
6,2
45
380
2,3
8,3
81
267
88,5
34
710
53,4
01
2,7
93
56,2
39
4,4
06
8,6
3,5
48
2012
-13
204
7,9
8,5
60
449
2,4
6,9
70
313
86,7
99
648
47,1
93
2,5
58
54,0
90
4,1
72
12,3
3,6
13
2013
-14$
117
5,8
1,304
233
1,73,6
53
122
61,
820
305
52,8
85
952
22,7
79
1,729
8,9
2,4
42
Apr
-13
151,
83,2
4019
15,9
469
1,68
824
7,50
810
11,
130
168
2,09
,512
May
-13
181,
28,6
0016
12,5
4312
2,20
331
2,49
694
1,64
617
11,
47,4
87
Jun-
139
87,8
6837
18,1
9914
6,38
432
11,3
0566
1,57
115
81,
25,3
27
Jul-1
38
52,9
2930
34,6
4712
1,89
357
5,70
511
61,
737
223
96,9
11
Aug
-13
923
,536
2224
,256
810
,705
385,
651
177
3,35
125
467
,500
Sep-
139
13,1
7335
26,6
0226
21,8
3837
2,42
211
72,
491
224
66,5
26
Oct
-13
1129
,609
2417
,540
1310
,744
224,
009
993,
069
169
64,9
71
Nov
-13
926
,807
127,
450
112,
257
233,
992
743,
461
129
43,9
67
Dec
-13
2935
,542
3816
,470
174,
109
419,
797
108
4,32
323
370
,241
$ i
nd
icate
s as
on
Decem
ber
31,
2013
So
urc
e:
Cre
dit
Rati
ng
Ag
en
cie
s.

137
JANUARY SEBI BULLETIN 2014T
ab
le 7
0:
Revie
w o
f A
ccep
ted
Rati
ng
s o
f C
orp
ora
te D
ebt
Secu
riti
es
(Matu
rity
≥ 1
year)
G
rad
e
Peri
od
Up
gra
ded
Do
wn
gra
ded
Reaff
irm
ed
Rati
ng
Watc
hW
ith
dra
wn
/
Su
spen
ded
No
t M
ean
ing
ful
Cate
go
ryT
ota
l
No
. o
f
issu
e
Am
ou
nt
(` c
rore
)
No
. o
f
issu
e
Am
ou
nt
(` c
rore
)
No
. o
f
issu
e
Am
ou
nt
(` c
rore
)
No
. o
f
issu
e
Am
ou
nt
(` c
rore
)
No
. o
f
issu
e
Am
ou
nt
(` c
rore
)
No
. o
f
issu
e
Am
ou
nt
(` c
rore
)
No
. o
f
issu
e
Am
ou
nt
(` c
rore
)
12
34
56
78
910
1112
1314
15
2008-0
9
36
17,0
33
251
1,60,0
21
1,430
23,2
3,4
24
52
1,23,3
03
335
44,8
53
190
2,1
05
26,6
8,7
25
2009-1
019
761,
052
324
1,31,
668
2,7
66
30,8
0,7
27
70
27,7
26
358
84,5
69
00
3,7
1533,8
5,7
41
2010
-11
743
1,57,3
95
310
28,2
03
3,6
05
41,
99,7
1410
038,6
62
518
87,3
140
05,3
41
45,1
1,289
2011
-12
696
1,01,
523
650
1,35,5
153,9
35
37,3
6,5
92
45
32,8
07
717
81,
947
00
6,0
58
40,5
2,7
74
2012
-13
463
28,6
24
904
2,1
9,3
21
3,8
27
39,1
6,7
72
57
22,8
98
637
107,1
77
00
5,8
92
49,8
8,1
63
2013
-14$
144
23,8
84
177
82,0
64
1,410
3,7
61,
896
1310
,006
240
48,4
42
00
1,972
3,9
24,6
46
Apr
-13
242,
703
51,
350
953,
42,2
971
100
1370
10
013
83,
47,1
51
May
-13
726
29
2,78
469
6,26
,494
110
032
1,72
80
011
86,
31,3
68
Jun-
1325
5,92
716
5,79
020
74,
51,3
343
7,14
317
2,04
90
026
84,
72,2
43
Jul-1
313
2,95
28
1,69
910
04,
30,4
622
933
1553
40
013
84,
36,5
80
Aug
-13
2264
817
10,1
4513
32,
29,3
080
040
4,39
50
021
22,
44,4
96
Sep-
1314
796
238,
006
365
7,62
,813
00
3922
,930
00
441
7,94
,545
Oct
-13
762
221
19,2
9210
92,
11,1
790
028
11,9
030
016
52,
42,9
96
Nov
-13
93,
516
4115
,633
105
3,12
,072
573
020
1,15
30
018
03,
33,1
04
Dec
-13
236,
458
3717
,364
227
3,95
,937
11,
000
363,
050
00
312
4,22
,163
$ i
nd
icate
s as
on
Decem
ber
31,
2013
So
urc
e:
Cre
dit
Rati
ng
Ag
en
cie
s.
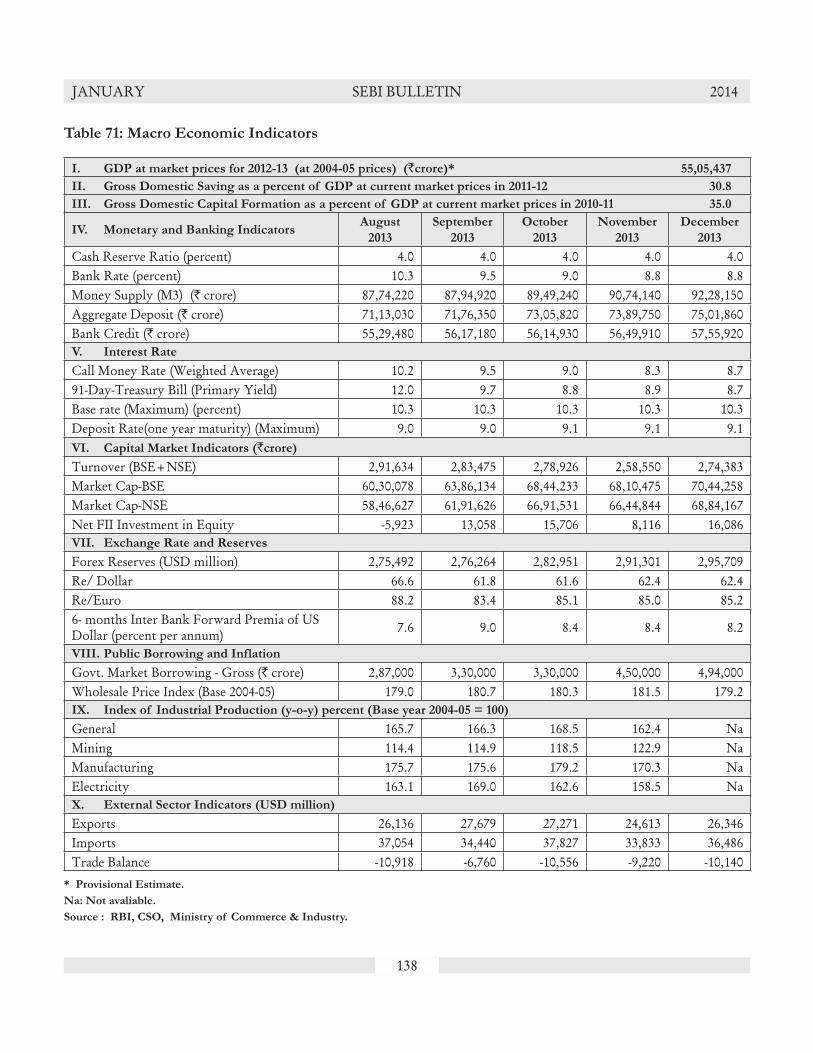
138
JANUARY SEBI BULLETIN 2014
Table 71: Macro Economic Indicators
I. GDP at market prices for 2012-13 (at 2004-05 prices) (`crore)* 55,05,437
II. Gross Domestic Saving as a percent of GDP at current market prices in 2011-12 30.8
III. Gross Domestic Capital Formation as a percent of GDP at current market prices in 2010-11 35.0
IV. Monetary and Banking Indicators August
2013
September
2013
October
2013
November
2013
December
2013
Cash Reserve Ratio (percent) 4.0 4.0 4.0 4.0 4.0Bank Rate (percent) 10.3 9.5 9.0 8.8 8.8Money Supply (M3) (` crore) 87,74,220 87,94,920 89,49,240 90,74,140 92,28,150Aggregate Deposit (` crore) 71,13,030 71,76,350 73,05,820 73,89,750 75,01,860Bank Credit (` crore) 55,29,480 56,17,180 56,14,930 56,49,910 57,55,920V. Interest Rate
Call Money Rate (Weighted Average) 10.2 9.5 9.0 8.3 8.791-Day-Treasury Bill (Primary Yield) 12.0 9.7 8.8 8.9 8.7Base rate (Maximum) (percent) 10.3 10.3 10.3 10.3 10.3Deposit Rate(one year maturity) (Maximum) 9.0 9.0 9.1 9.1 9.1VI. Capital Market Indicators (`crore)
Turnover (BSE+NSE) 2,91,634 2,83,475 2,78,926 2,58,550 2,74,383Market Cap-BSE 60,30,078 63,86,134 68,44,233 68,10,475 70,44,258Market Cap-NSE 58,46,627 61,91,626 66,91,531 66,44,844 68,84,167Net FII Investment in Equity -5,923 13,058 15,706 8,116 16,086VII. Exchange Rate and Reserves
Forex Reserves (USD million) 2,75,492 2,76,264 2,82,951 2,91,301 2,95,709Re/ Dollar 66.6 61.8 61.6 62.4 62.4Re/Euro 88.2 83.4 85.1 85.0 85.26- months Inter Bank Forward Premia of US Dollar (percent per annum) 7.6 9.0 8.4 8.4 8.2
VIII. Public Borrowing and Inflation
Govt. Market Borrowing - Gross (` crore) 2,87,000 3,30,000 3,30,000 4,50,000 4,94,000Wholesale Price Index (Base 2004-05) 179.0 180.7 180.3 181.5 179.2IX. Index of Industrial Production (y-o-y) percent (Base year 2004-05 = 100)
General 165.7 166.3 168.5 162.4 NaMining 114.4 114.9 118.5 122.9 NaManufacturing 175.7 175.6 179.2 170.3 NaElectricity 163.1 169.0 162.6 158.5 NaX. External Sector Indicators (USD million)
Exports 26,136 27,679 27,271 24,613 26,346Imports 37,054 34,440 37,827 33,833 36,486Trade Balance -10,918 -6,760 -10,556 -9,220 -10,140
* Provisional Estimate.
Na: Not avaliable.
Source : RBI, CSO, Ministry of Commerce & Industry.

139
JANUARY SEBI BULLETIN 2014
PUBLICATIONS
1. Annual Report : 2012-132. Handbook of Statistics on Indian Securities Market, 2012
Interested persons may contact the Department of Economic and Policy Analysis of SEBI to obtain a copy of Annual Report/Handbook of Statistics at the following address:
Department of Economic and Policy AnalysisSecurities and Exchange Board of IndiaPlot No. C4-A, ‘G’ Block,Bandra Kurla Complex,Bandra (E), Mumbai-400051
Tel no. +91-2226449000Fax no. +91-2226449021