- kuwait enterprise risk management …kuwaiterm.com/ppt/18-tony_milsom.pdf · ·...
TRANSCRIPT

www.kuwai term.com

TONY MILSOM Specialist – Risk
Engineering
KPC
Quantitative Risk Management
Methods, Techniques and Tools
w w w. k u w a i t e r m . c o m

KPC ERM Objectives:
SOURCE: Team analysis
Three key objectives of KPC’s risk journey
Achieve high certainty that the oil sector will meet
the expectations of the State
Enable the oil sector to make a more fact-based and
quantitative assessment of risk vs. return trade-offs
in its activities and projects
Ensure the availability of adequate funding to
support oil sector capital expenditure
6

Risk modeled and
have effect
KCo1 KCo2 KCo3 KCo4 KCo5 KCo6 KCo7 KCo8 KCo9
7b HR and HSSE – Labor disruptions
6d Retail margin volatility
5d Charter rates
9 New technologies
7a HR and HSSE - Manpower
8b Operational - Sabotage
10 Unexpected drop in reserves
1 Domestic political influence
2 Regional instability
3 Project execution
4 Hydrocarbon market disruption
5a Crude price volatility
5b Gas price volatility
5c Interest rate volatility
6a FX volatility
6b Refining margin volatility
6c Petrochemical price volatility
6e Counter-party credit risk
8a Operational - Production
Risk
SOURCE: Team Analysis
The top ten risks for KPC were identified and
mapped to each of the K-Cos
KPC
1400 risks from risk
registers
were considered
9

KPMs help measure success of these directives…. KPC’s strategic directives (not exhaustive)…
Upstream
▪ Increase crude production to
4.0 mmbpd by 2020
▪ Increase non-assoc. gas prod.
capacities to 2.1 BSCF/d by
2020
▪ …
Downstream
▪ Grow domestic refining capacity
to 1.4 mmbpd (new built) and
subsequent 1,6 mmbpd
(enhancement of facilities)
▪ Increase refining complexity
▪ …
Midstream
and others
▪ Human Capital attraction and
retention
▪ …
Production/
capacity
▪ Free gas production
▪ Proven reserves
▪ …
Costs
▪ Cost of risk
▪ R&T spend vs. plan
▪ …
HSEE
▪ Fatal cases
▪ Environmental incidents
▪ …
Kuwaitization
and stake-
holders
▪ Percentage of Kuwaitis in KPC ▪ Share of Capex spent locally ▪ …
Profitability
▪ Profit margin
▪ ROACE
▪ …
▪ Strategic project risk
▪ Political/regulatory
▪ Operational/technical
▪ Portfolio/business risk
▪ Financial risks (counterparty,
liquidity, market)
Ability to attain targets on KPMs are influenced by multiple risks
Risk modeling aims to increase transparency and
improve decision making
12

13
Cash flow at risk model
Model top risk effects via quantitative risk model
Price Technical
Political
▪ Capex
▪ Production disruption
▪ Tax changes
▪ Nationalization
Company-by-
company profiles
▪ Production
▪ Capex
▪ Opex
LOX-ZZV233-20061123-MHDC
13
Working D
raft -Last M
odified 11/24/2006 4:22:00 AM
Industry has a limited set of project growth options. We characterised
these with 28 projects covering 75% of industry growth potential
Russia non-PSC
Norway oil
GoM DW
Canada oil sand
NOC bonusbuyback
Mid East GTL
Angola DW
U.K. oil
Nigeria DW
Oman oil
Mid East LNG
Malaysia DW
U.K. gas
US onshore gas
NA Arctic gas
Mexico DWCentral
Africa OilNOC
redevelopment
OECD Frontier
Exploration
Non-OECD
Frontier
Exploration
NA Steam flood
Estimated 75% of future
hydrocarbon resource
types modelled
Source: USGS; McKinsey
$35
04080
120
$55 Forward Curve
Growth projects/Strategic initiatives
Company portfolio
Risk assessment
Quantitative risk model
SOURCE: McKinsey Risk Practice
Project valuation model
Risk return portfolio
model
13

Refining
capacity
Risk measures
▪ Annual crude capacity
Financial
risk
measures ▪ Annual cash flow to both Kuwaiti government and KPC (remaining cash flow share)
Gas
production
▪ Annual associated and non-associated gas production
Crude
capacity
▪ Annual refining capacity
Probability distribution variable
Stakeholder
and KPC cash
flow
Cash flow
for KPC and
Subsidiaries
▪ Annual cash flow for next year(s) (operating cash flow)
Non-
financial
risk
measures
Risk measures chosen on
the basis of KPC and K-
Companies KPMs
▪ For financial KPMs (e.g.,
ROACE), cash flow
identified as main driver
of uncertainty
▪ For non-financial KPMs,
production and capacity
levels identified as most
impactful factors
The impact of risks is assessed by five key measures in
line with the business KPM’s
14

Risk Modeling
15

Each K Company has it’s own risk model; output measures
risks modelled both in deterministic and stochastic cases
SOURCE: Team analysis; expert interviews; k-company working teams
War/political scenario
Project delays
Oil price
Relevant risk factors
▪ All relevant risks modelled for all
K Companies
▪ Focused risks modelled in detail
for K Companies
▪ Deviation from base case due to
each of these risks modelled
separately
Financial models
▪ All 9 K companies deterministic
financial cash flows is modelled
▪ For each of these deterministic, the
impact of all relevant risks modelled
separately for output
…
KPI
KNPC
KOC
Model output
Financial Non-financial
▪ Cash flow
distribution (by
each risk type
for each K
Company)1
▪ Varies by K
company
▪ For KGOC and
KOC
– Oil capacity
– Gas
production
▪ For KNPC
– Refining
capacity
1 While we calculate cumulative cash flows, we will use discount rate as follows – 0% for next 5 years, 10% for remaining 15 years/there after
17

Model provides cash flow from operation over time and
as a cumulative distribution
SOURCE: K-Company CFAR model – illustrative example. Team analysis
20YY +3 +2 +1 20XX
Mean Baseline 95th
5th
Mn KD
Yearly cash flow from operations
(20XX-20YY)
5th 95th Mean
Cumulative operating five year cash
flow (20XX-20YY)
Model can also calculate
deviation from baseline for
production volumes
Pro
bab
ilit
y
Cash flow
Cash
flo
w
x y z
Illustrative
Baseline
18

Rank risks based on contribution to total cash flow at
risk, and quantifies diversification effect
Cash Flow @ Risk =
Baseline – 5th Percentile Risks
Total
Diversification
HSSE and HR risks
Operational risks
Refining/petrochemical prices
New technologies risks
Large project execution risks
External influence on
key decisions
Global crude/gas price volatility Remarks
▪ Baseline refers to
currently projected
cash flows from the 5
Year plan
▪ Diversification results
from low or negative
correlation of various
individual risks leading
to total risk lower than
sum of individual risks
SOURCE: K-Company CFAR model – illustrative example. Team analysis
5 year cash flows (20XX-YY) Illustrative
19

Risk Modeling Strategic Projects
20

Current project appraisal approach with a
probabilistic risk view
From deterministic … … to probabilistic
3 2 1
Future value
Frequency of occurrence in simulation
3
2 1 High
case Base
Case
Low
case
▪ Discrete scenarios with no associated
understanding of probability of
occurrence
▪ Scenarios based on “intuitive”
assessment – bias likely in selection
▪ Fat tail risks often ignored
▪ Fact based assessment of full range of
outcomes with associated probabilities
▪ Removes bias towards “most likely
scenario”
▪ Quantify potential downsides and
upsides at appropriate probability
21

The risk-return quantification methodology adds probabilistic
metrics on top of the current appraisal and strategic metrics
SOURCE: Team analysis
▪ Stress-test expected economic performance of the project
▪ Prioritize and assess magnitude of key risks to focus mitigation actions
▪ Estimate likelihood of project success and the underlying value to the organization
Return
metrics
Time metrics
Sensitivity/
Scenarios
Value metrics
Additional risk-adjusted metrics
introduced by the methodology
Metrics currently used for
program appraisal1
▪ Expected IRR
▪ RAROC (Risk adjusted return on capital)
▪ IRR
▪ Profitability index
▪ Expected payback period ▪ Payback period
▪ NPV at risk (NPVaR)
▪ Probabilities
– To breakeven
– To meet baseline
▪ Sensitivity of NPV to
– CAPEX overrun
– Oil price
– Project delay
▪ Scenarios
▪ Expected NPV ▪ NPV
1 Using base case assumptions
23

Ranking N
… and informs decision making at portfolio level ILLUSTRATIVE
Technology
22
8
12
17
17
22
20
54
13
2
9
8
6
5
3
4
1
7
158
75
85
53
30
55
50
145
35
!
!
Expected NPV
KD million
I
A
B
C
D
E
F
G
H
Site
New Prioritization
NPV/(Inv+NPVatRisk) (%)
5
9
8
2
6
3
4
1
7
Old Prioritization
NPV/investment (%)
31
15
19
48
23
37
33
97
19
SOURCE: McKinsey Risk Practice 26

Overview of risk-based economics for project
Key metrics
▪ IRR, % 13 10%
▪ Payback period, year 10 tbd
▪ NPVaR, KD B1-P5
▪ Prob. to breakeven, % 70% tbd
▪ NPV/I, % >0
24% ▪ Prob. to meet baseline, % tbd
▪ Profitability index 1.88 >1
E1 ▪ NPV, KD
Min
Required
Expected
metrics
NPV distribution, KD
Key risks
Key risks
NPVaR,
KD
Contribution,
Percent
0
NPVaR = B1-P5
Expected
NPV Baseline
Observations
▪ Difference between baseline NPV and expected NPV, mainly driven
by crude price, results in a lower probability to meet the baseline
▪ Probability to breakeven implying that the project is likely to be
profitable
▪ Large NPVaR brings down expected return on capital after risk
adjustment
E1 B1 (P5)
24%
5th
percentile
10
9
1.8
B1
Baseline
metrics
▪ RAROC, % 10% >0
80% Return on
capital
BIGGER ▪ Capex , KD BIG
85%
Breakeven
point
SOURCE: Economic model, team analysis
70%
NPV,
KD
20BB ▪ Commissioning date 20AA
.CCCX ▪ Peak production, tpa CCC2
69
4
20
R4
Execution delay
Feedstock availability
Crude price
Refining margins
Capex overrun
R1
R2
R3
-R5
59
Probability to
meet baseline
Probability to
breakeven
-1
Illustrative Numbers
28

Risk Modeling Strategic Options
30

▪ KPC strategy identifies a set
of strategic initiatives to guide
future investments
Risk based capital allocation
▪ Assess project economics for
each strategic initiative
▪ Integrate risks in the economic
appraisal and generate risk
based metrics
▪ Rank projects based on
RAROC
▪ Prioritize and select projects
given budget constraint
Risk based project appraisal Project selection
Budget
limit
Capex KD mm
RAROC %
2 Project 1 5 3 4
Risk could be integrated in both capital allocation and project
appraisal processes in a consistent way
SOURCE: team analysis
Pre-
requisites
Process
▪ Assess strategic initiatives
on a stand-alone basis
▪ Assess impact of
combinations of strategic
initiatives on KPC portfolio
▪ Pipeline of projects by strategic
initiative, with project economic
model and parameters
▪ Understanding of project risks
▪ Pipeline of projects for a
strategic initiative, with risk
based economic assessment
▪ Budget allocated to initiative
Outcome
▪ Risk based project economic
metrics including RAROC
▪ Suggested list of projects for
approval within a strategic
initiative
▪ Allocated budget for each
strategic initiative and/or K-
company
1
2
31

Taking the Stakeholder perspective can significantly
change the risk-return profile of strategic options
SOURCE: Strategic Planning model, team analysis
Stakeholder view
RAROC Less risky strategy
More risky strategy
Alternative option preferable
Preferred option depends
on risk appetite
Preferred option depends on
risk appetite
Current FYP preferable
10.0 9.5 9.0 8.5 8.0 7.5 7.0 6.5 6.0 5.5 5.0 4.5 4.0 3.5 3.0
Value (NPV), KD
Risk (NPVaR), KDmm
Option 6
Option 5
Option 4
Option 3 Option 2
Option 1a
Option 1
(Current plan)
Alternative option
preferable
Preferred option
depends on risk appetite
Preferred option depends on risk
appetite
Current FYP preferable
Value creation of strategic options on portfolio
RAROC Less risky strategy
More risky strategy
KPC view
10 9
Risk (NPVaR), KDmm
Option 6
Option 5 Option 4
Option 3
Option 2
Option 1a Option 1
(Current plan)
Value (NPV), KD
Illustrative
33
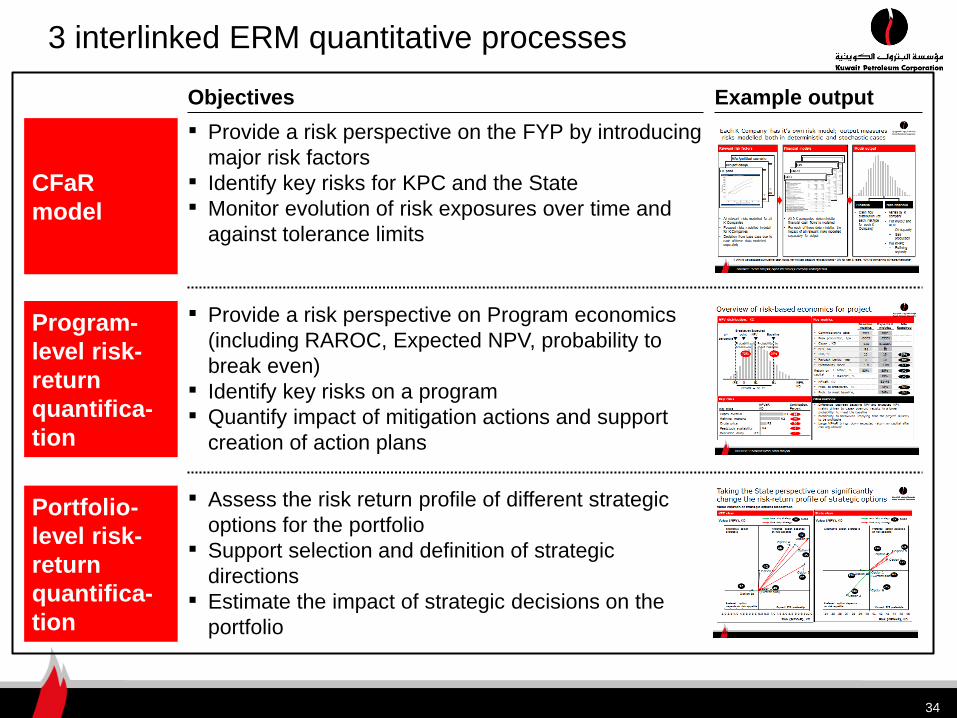
3 interlinked ERM quantitative processes
Objectives Example output
CFaR
model
▪ Provide a risk perspective on the FYP by introducing
major risk factors
▪ Identify key risks for KPC and the State
▪ Monitor evolution of risk exposures over time and
against tolerance limits
▪ Provide a risk perspective on Program economics
(including RAROC, Expected NPV, probability to
break even)
▪ Identify key risks on a program
▪ Quantify impact of mitigation actions and support
creation of action plans
Program-
level risk-
return
quantifica-
tion
▪ Assess the risk return profile of different strategic
options for the portfolio
▪ Support selection and definition of strategic
directions
▪ Estimate the impact of strategic decisions on the
portfolio
Portfolio-
level risk-
return
quantifica-
tion
34

By the end of the ERM journey KPC will be a much
more effective organisation
A much deeper understanding of major risks and how they affect the
businesses and Oil sector's ability to implement the 2030 strategy
Concrete materials with quantification of the risks improving ability to
engage the stakeholders in an informed manner
Attention drawn towards the extreme tail risks facing the oil sector
Suitable leading risk indicators and a good understanding how to
quantify and assess the impact of range of mitigation options
Ability to evaluate the investment portfolio from a risk adjusted point of
view to create increased organizational value both at a KPC level and
individual K-co level
Effective management tools to support better decision making
35
