copyright · macoma...
TRANSCRIPT


Copyright
By
Carol Leigh Beahm
2015

Depositional Environment of the Basal Etchegoin Formation
within the Poso Creek Oil Field, Kern County, California
A Thesis
By
Carol Beahm
Submitted to the Department of Geological Sciences,
California State University Bakersfield
In partial fulfillment of the requirements of the degree of
Masters of Geology
Fall 2015
Depositional Environment of the Basal Etchegoin Formation within the Poso Creek Oil
Field, Kern County, California
By Carol Beahm
This thesis has been accepted on behalf of the Department of Geological Science by the
members of the supervisory committee:
Dr. Janice Gillespie Committee Chair
J
Committee
Kenneth Frost, Linn Energy Committee Member
' '

Acknowledgements
I owe much to Linn Energy (formerly Berry Petroleum) for allowing me the use of their data,
resources, and time for the completion of this paper. In particular, I would like to thank my
Asset Manager, Greg Wagner, for not becoming entirely too impatient during the course of time
spent on this project and for encouraging me and directing me all the way through. I would also
like to thank Ken Frost for acting as a geologic mentor and thesis advisor for these many years.
I would like to thank my professors Jan Gillespie and Rob Negrini. Not only for serving as
committee members, but for being my advisors and mentors for over a decade now and for
giving me much of the geologic knowledge I have today.
The Well Repository at CSUB provided the core data necessary for this project. This is a
wonderful source for any local geologic study.
And a special dedication to my family. To my children, Porter (5 yrs) and Annabelle (2 yrs),
who probably do not realize that this project has been occurring their entire lives. And to my
parents, Terry and Cathy Register, and my parents-in-law, Kevin and Marion Beahm, for
babysitting while I had class or needed time to study or write. And, last but not least, my
husband, whom, I’m sure did something….If anything, for not letting me quit (either this
program or my job).

TABLE OF CONTENTS
ABSTRACT………………………………………………………………………………………1
INTRODUCTION……………………………………………………………………………….2
Location…………………………………………………………………………………...2
Statement of Problem……………………………………………………………………...4
Background………………………………………………………………………………..4
Stratigraphy………………………………………………………………………………...4
Age……………………………………………………………………………………..……8
Tectonic Regime………………………………………………………………….11
Depositional Environment……………………………………………………….13
Sea Level Fluctuation……………………………………………………………16
Provenance and Sediment Influx……………………………………………………….17
Structure and Tectonism………………………………………………………………...18
Lithology…………………………………………………………………………….….…20
Electric Log Response………………………………………………………………...…20
METHODOLOGY……………………………………………………………………………..21
Cores…………………………………………………………………………………..…21
Electric Log Correlation…………………………………………………………………24
Mapping………………………………………………………………………………….26
RESULTS……………………………………………………………………………………….28
Core Description…………………………………………………………………………28
Chanac………………………………………………………………………………….…30
Lower Basal Etchegoin……………………………………………………………….…31
Facies 1…………………………………………………………………..32
Facies 2…………………………………………………………………..34
Upper Basal Etchegoin………………………………………………………….…35
B Sand………………………………………………………………………………..……36
Macoma Claystone………………………………………………………………………36
Maps…………...................................................................................................................36
Structure Maps……………………………………………………………………..36
Isochore Maps………………………………………………………………………40
Lower Basal Etchegoin (LBE)………………………………………..….40
Upper Basal Etchegoin (UBE)…………………………………………...45
B Sand……………………………………………………………………47
Macoma Claystone…………………………………………………….…48

DISCUSSION………………………………………………………………..………………….50
Depositional Environments……………………………………………………………....51
Lower Basal Etchegoin (LBE)……………………………………………………...51
Upper Basal Etchegoin (UBE) and B Sand……………………………………...56
Macoma Claystone………………………………………………………………………60
CONCLUSION…………………………………………………………………………………60
REFERENCES……………………………………………………………….…………………75

LIST OF FIGURE
FIGURE 1:
FIGURE 2:
FIGURE 3:
FIGURE 4:
FIGURE 5:
FIGURE 6:
FIGURE 7:
FIGURE 8:
FIGURE 9:
FIGURE 10:
FIGURE 11:
FIGURE 12:
FIGURE 13:
FIGURE 14:
FIGURE 15:
FIGURE 16:
FIGURE 17:
FIGURE 18:
FIGURE 19:
FIGURE 20:
FIGURE 21:
FIGURE 22:
FIGURE 23:
FIGURE 24:
FIGURE 25:
FIGURE 26:
FIGURE 27:
FIGURE 28:
FIGURE 29:
FIGURE 30:
FIGURE 31:
FIGURE 32:
FIGURE 33:
Location map showing the San Joaquin Valley in California with its surrounding
mountains, Bakersfield, the Bakersfield Arch, and the study area
Oil field map of T 27S, R 27E, Mount Diablo, CA
Generalized stratigraphy of the southern San Joaquin Valley
Type Log of the Middle Miocene through Pleistocene Formations in Poso Creek Oil
Field
Generalized cross section of the southern San Joaquin Valley. Cross section is to the
south of the study area
Type log showing the Upper Basal Etchegoin (UBE) and Lower Basal Etchegoin
(LBE) subdivisions of the Basal Etchegoin, from McVan 31R, T 27S, R 27E, Sec14
Paleogeography of the SJB
Paleogeography of the SJB at 5.3 Ma, early Pliocene, showing depositonal
environments of the Etchegoin Formation
Map showing fault trends and ages of last displacement on faults, along with
sedimentological ages
Location map of the cores viewed in this study
Type Log used in the Kern Front Oil Field area showing the B Sand underlying the
Macoma Claystone
Cross plots from the three best conventional cores in the study. Demonstrates
correlation of spontaneous potential (SP), gamma ray (GR) and the deep resistivity
(RD) curve AHT90 electric logs with grain size.
Examples of the variations in electric log signatures that were mapped
Photograph of the core showing a bed containing shell fragments and calcite cement
from 1178.7 to 1179 ft in Poso 16
Electric log cross section showing contrast between marine Etchegoin Formation
electric log signatures and underlying fluvial log signatures of the Chanac Formation
Generalized, composite sketch of grain size trends and sedimentary structures of the
Basal Etchegoin
Cross plots from Poso 16 between grain size phi units and electric log values showing
correlations to facies determination
Structure map of the top of LBE
Stratigraphic cross section A-A’ displaying the westward thickening of the Macoma
Claystone and the LBE
Gross interval isochore map of the LBE
Isochore map of the LBE Facies 1
Isochore map of LBE Facies 2
Electric log signatures plotted against the isochore map of the LBE Facies 1
Electric log signatures plotted against the isochore map of the LBE Facies 2
Gross interval isochore map of the UBE
Isochore map of the UBE net sand
Electric log signatures plotted against the net sand isochore map of the UBE
Gross isochore map of the B
Stratigraphic cross section B-B’ displaying the B Sand grading into the Macoma
Claystone to the north
Isochore map of the Macoma Claystone
Chart displaying frequency of sedimentary characteristics within each subdivision of
the LBE
Macro-scale depositional facies reconstruction of the LBE deltaic sands with inserts
of Facies 1 isochore and Facies 2 isochore
Macro-scale depositional facies reconstruction of the barrier island and lagoonal
sands and gross isochore map of the UBE and the B Sand
PAGE 2
PAGE 3
PAGE 5
PAGE 7
PAGE 9
PAGE 10
PAGE 12
PAGE 14
PAGE 19
PAGE 22
PAGE 25
PAGE 27
PAGE 28
PAGE 30
PAGE 31
PAGE 33
PAGE 37
PAGE 38
PAGE 39
PAGE 40
PAGE 41
PAGE 42
PAGE 43
PAGE 44
PAGE 45
PAGE 46
PAGE 47
PAGE 48
PAGE 49
PAGE 50
PAGE 52
PAGE 55
PAGE 59

APPENDIX A
APPENDIX B
LIST OF APPENDICES
Core descriptions and electric logs for individual wells
Identification and characterization of depositional facies
Deltas
Barriers
PAGE 62
PAGE 68
PAGE 69
PAGE 72

1
ABSTRACT
Grain size, lithology, and sedimentary structures of the Miocene/Pliocene basal
Etchegoin Formation were described from cores within the southeastern edge of the San Joaquin
Basin, north of Bakersfield, CA for depositional environment analysis. Lithological facies
established from the cores were correlated to electric log signatures from oil wells within the
area (e.g., fining upward, coarsening upward). Each electric log signature was mapped as a
specific well symbol. Electric log correlations for the top and bottom of each subunit within the
Basal Etchegoin were also used to construct structure, gross isochore, and net facies isochore
maps. The isochore maps and the relative positioning of the electric log signatures supports the
depositional environment shown in core as well as provide depositional facies between and
outside of core locations.
Overall, the basal Etchegoin represents a transgressive sequence. Four stratigraphic units
and three sedimentary facies were correlated and mapped. Facies from the lowermost
stratigraphic unit, the Lower Basal Etchegoin, represent deposits ranging from the prodelta to the
lower delta plain of a tide dominated delta. Facies from the overlying units, the Upper Basal
Etchegoin and B Sand, are representative of a barrier island and lagoonal system, respectively.
The fourth and uppermost unit, the Macoma Claystone, is an offshore marine deposit that
completes the transgressive sequence.

2
INTRODUCTION
Location
The southern San Joaquin basin of California contains a large number of oil and gas
reservoirs as a result of its organic-rich source rocks coupled with complex stratigraphy and
tectonic activity that formed abundant stratigraphic and structural traps. Due to their economic
value, there is great interest in increased geological understanding of the sands that form these
reservoirs. There is also a large amount of subsurface well data containing valuable geologic
information that contributes to the study of these formations. This study focuses on the basal
sands of the Etchegoin Formation in T 27S, R 27E, Mount Diablo base meridian (MDBM), in
the southeast portion of the San Joaquin Valley, north of Bakersfield, California (Figure 1).
Figure 1. Location map showing the San Joaquin Valley in California with its surrounding
mountains, Bakersfield, the Bakersfield Arch, and the study area in red square (from Google
Maps©).

3
There are two large oil fields within the study area that currently produce from the
Etchegoin Formation sands: Kern Front and Poso Creek (Figure 2). Considering that these two
fields have produced a cumulative 304 million barrels, with the Etchegoin being the primary
reservoir for both fields (CA DOGGR, 2009), there is a significant lack of information on the
environment of deposition of the Etchegoin within the area. Poso Creek Oil Field comprises the
majority of the study area. The McVan area of the field is in the eastern portion of the township;
the larger Premier and Enas areas are in the western portion of the township. While most of
Kern Front Oil Field lies in the township to the south, it provides significant well control at the
southern end of the study area. Wells within the West Area of Mount Poso Oil Field display the
easternmost marine sands of the Etchegoin; east of this area the Etchegoin sands pinch out or
grade laterally into nonmarine strata on the flanks of the Sierra Nevada Mountains (Perkins,
1987). Therefore, the West Area of Mount Poso Oil Field has been included in the study despite
it being outside the T 27S, R 27E township boundaries.
Figure 2. Oil field map of T 27S, R 27E, Mount Diablo, CA. Study area is in red cross
hatches. Well locations are shown as dots on maps. Various well symbols represent various
well types (e.g., oil production, water injector, etc.)

4
Statement of Problem
Understanding the regional geology of oil-bearing sands has significant economic
advantages. The depositional environment of reservoir sands not only influences rock properties
such as permeability and porosity, but also impacts the areal extent and continuity of the sands.
While numerous studies have been conducted on the Etchegoin Formation on the west
side of the San Joaquin Valley (Loomis, 1990; Lagoe et al, 2009; Prothero, 2010; Tucker and
Thorne, 1998), only a few studies have been done on this formation in the eastern area of the
basin (Link et al., 1990; Kodl et al., 1990; Bartow, 1991). In the Coalinga area, on the western
slope of the valley, the Etchegoin Formation has a maximum thickness of 5485 ft (Loomis,
1990), a very high density of subsurface well data, and outcrops near the Kettleman Hills,
(Figure 1). In the eastern part of the San Joaquin Valley, the Etchegoin does not crop out and is
significantly thinner than its western counterpart.
This study will discuss depositional characteristics of the producing sands and provide an
interpretation for the depositional environment of the basal sands of the Etchegoin Formation in
and around the McVan Area of Poso Creek Oil Field.
Background
Stratigraphy
Cenozoic strata of the San Joaquin Valley thicken southeastward from about 2,600 ft
over the western part of the Stockton arch to over 30,000 ft in the Maricopa-Tejon subbasin
(Figure 1) (Bartow, 1991). On the east side of the San Joaquin Valley, the basin-filling
sediments lie on a westward-tilted block of Sierra Nevada plutonic and metamorphic basement,

5
while sediments in the central and western parts of the valley are underlain by uplifted oceanic
crust and trench deposits of Jurassic age (Figure 3) (Bartow, 1991).
Figure 3. Generalized stratigraphy of the southern San Joaquin Valley
(modified from Gauteir et al., 2003).

6
As a result of deposition in a semi-enclosed basin, the thickness of the Etchegoin
Formation is quite variable (Perkins, 1987). It is thickest (~5,000 ft) in the Coalinga region and
pinches out or grades laterally into nonmarine strata along the northern, eastern and southern
margins of the San Joaquin Basin (SJB) (Perkins, 1987). Along the axis of the valley, the
thickness averages about 2,600 ft (Perkins, 1987).
Etchegoin strata have not been reported north of the Stockton Arch (Perkins, 1987). A
thick sandstone sequence underlying the Etchegoin formation in the northwest Coalinga area
(Figure 1), the Jacalitos Formation, is considered a lower member of the Etchegoin by some
geologists (Berryman, 1973). Others have assigned the Jacalitos formation status within the
Etchegoin Group which consists of the Jacalitos, Etchegoin, and San Joaquin formations
(Loomis, 1989). However, the Jacalitos does not extend as far south as Elk Hills Oil Field
(Figure 1) (Berryman, 1973) and studies from the oil fields in the eastern basin do not report it.
In addition, the San Joaquin Formation does not extend to the eastern edges of the basin; hence,
the designation of the Etchegoin Group as established at Coalinga is not applicable to this study.
An upper and lower division of the Etchegoin has been conventionally used throughout
the valley although individual stratigraphic units cannot be correlated across the basin. The
proportional thicknesses of the lower and upper units vary across the valley (Perkins, 1987).
Generally, the lower Etchegoin consists of fine grained marine sediments that grade upward into
coarser, more terrigenous sediments of the upper Etchegoin. The lower unit consists of clays and
silts that are rich in biosiliceous material (Gillespie et.al., 2008; Loomis, 1989; Berryman, 1973).
The upper unit consists of interbedded sandstone and siltstone (Loomis, 1989; Berryman, 1973;
Link et al., 1990). On the eastern slope of the SJB, the basal and upper units are separated by the
Macoma Claystone (Figure 4) (CA DOGGR, 1998).

7
Figure 4. Type Log of the Middle Miocene through Pleistocene Formations in Poso Creek Oil Field
(CA DOGGR, 1998).
On the east side of the basin, the Etchegoin Formation is described as a distinctive 200-
300 ft thick marine sandstone and mudstone (Link et. al., 1990) (Figure 5). The Etchegoin

8
unconformably overlies either the nonmarine upper Miocene Chanac Formation or the regressive
marine Santa Margarita Formation. It is conformably overlain by either the shallow marine San
Joaquin Formation or the nonmarine Plio-Pleistocene Kern River Formation (Link et. al., 1990;
Perkins, 1987; Foss, 1972). The Etchegoin formation grades into and intertongues with the
lower Kern River formation towards the eastern margins of the basin (Gautier and Scheirer,
2003). The conformable and intertonguing relationships between the Kern River and Etchegoin
formations represent episodic transgressive marine deposition (Kodl et.al., 1990). The lower
Etchegoin grades into the Macoma Claystone to the west (Link et. al., 1990).
On the eastern slope of the basin, the Basal Etchegoin has been divided into Upper and
Lower Basal units (Figure 6) (Link et. al., 1990). According to Link et al. (1990), the Lower
Basal Etchegoin (LBE) is a continuous, 50-75 ft thick unit overlying the Chanac in the nearby
Kern Front oilfield. The Upper Basal Etchegoin (UBE) is 100-150 ft thick and consists of
discontinuous, lenticular sand packages with a west to northwest horizontal trace.
Age
The Etchegoin is late Miocene to late Pliocene in age (Berryman, 1973). Disagreements
regarding the age of the base of the group could be due to how the formation is defined. It is
typically considered to consist of fluctuating shallow marine facies located stratigraphically
above the deeper marine rocks of the Monterey Formation and Reef Ridge Shale and below
shallow to nonmarine rocks of the San Joaquin and Tulare formations. These environmental
conditions may have occurred at different times in different areas of the basin (Scheirer and
Magoon, 2003; Loomis, 1990). Diatom assemblages suggestive of 5.3 - 5.5 Ma at the base of
the Etchegoin Formation in Lost Hills, South Belridge, and Cymric oil fields were reported by

9
Loomis (1990). Ages of ~7 and 5.8 Ma from 87
Sr/86
Sr fossil shell analyses were reported by
Loomis (1990) at the base of the Jacalitos Formation. Detrital zircon fission-track analyses from
Figure 5. Generalized cross section of the southern San Joaquin Valley. Cross section is to the south of the
study area. The Etchegoin Formation is highlighted in yellow (CA DOGGR, 1998).

10
Figure 6. Type log showing the Upper Basal Etchegoin (UBE) and Lower Basal Etchegoin
(LBE) subdivisions of the Basal Etchegoin, from McVan 31R, T 27S, R 27E, Sec14. (See
Electric Log Correlation section and Fig. 13 for explanation on positive SP relief.)
an unspecified stratigraphic unit within the Etchegoin by Obradovich et al. (1981) yielded 7 ±
1.2 Ma, although Sarna-Wojcicki et al. (1991) suggests that the interval was contaminated with
detrital zircons from older volcanic layers. Benthic foraminiferal stages correlated from the
COSUNA project (COSUNA, 1984) also give an estimated age of ~7 Ma.
The age of the upper Etchegoin is better constrained; tephrochronologic correlations with
tuff beds stratigraphically above the Etchegoin suggest its age ranges from 2.2 Ma to 4.5 +/-0.5
Ma (Scheirer and Magoon, 2003; Loomis, 1990). Therefore, the age of the Etchegoin group

11
ranges from about 7 Ma to 2.2 Ma. This time frame encompasses the late Miocene through
Pliocene.
Tectonic Regime
Basin and Range faulting and related left-lateral movement on the Garlock fault began
before Etchegoin deposition (Bartow, 1991). This extension resulted in the westward movement
of the Sierra Nevada block and SJB and the related formation of the constraining bend in the San
Andreas Fault (Bartow, 1991). The time at which the Sierra Nevada achieved its current
elevation is still under much debate. However, most authors agree that most of the Sierra
Nevada’s uplift occurred within the past 20 Ma, with at least 2 km of its current elevation having
been gained within the last 10 Ma, and most likely within the last 3 my (Zandt et al., 2004;
Saleeby et al., 2003). Uplift accelerated in the late Cenozoic, beginning towards the southern
end of the range (Bartow, 1991). Uplift of the Sierra Nevada was accompanied by minor east-
west extension in the eastern basin (Beyer and Bartow, 1988). Also associated with the onset of
Etchegoin deposition was the emergence of the southern part of the Diablo range (Figure 7),
which lasted until 6 Ma, on the west side of the valley (Perkins, 1987).
As the sea withdrew, marine deposition became more limited. Prior to Etchegoin
deposition, California was characterized by two marine embayments: one in the San Francisco
Bay region and the other in the central-southern part of the San Joaquin Valley, through the
Santa Maria Basin (Perkins, 1987) (Figure 7a). Near the Miocene-Pliocene boundary, the slip
rate on the San Andreas Fault accelerated (Bowersox, 2005; Bartow, 1991). This caused the
Salinia Terrane to move northward so that it began closing off the SJB from the Pacific Ocean
(Beyer and Bartow, 1988). The southern seaway closed with the uplift of the Temblor and

12
Figure 7. Paleogeography of the SJB. Displays the tectonic movements that affected Etchegoin deposition.
Shows location of San Andreas Fault, Mendocino Triple Junction, Garlock Fault, and surrounding mountain
ranges. Modern city locations included for reference. A) Middle Miocene (~16Ma), pre-Etchegoin conditions
of two marine embayments. From Bartow (1991). B) Late Miocene (~9-10Ma). Displays movement along the
San Andreas Fault that began closing the SJB during the onset of Etchegoin deposition. From Bartow (1991).
C) Early Pliocene (~5Ma). Displays the restricted marine deposition in the SJB and the Priest Valley Straight.
From Bowersox (2005). D) Pliocene (~3-4Ma) shows continued uplift and movement along the San Andreas
Fault that continued restriction of marine deposition in the SJB.
13
southern Coast Ranges beginning by ~5.4 Ma and the northern seaway became partially blocked
by a Gabilan range subsea high (Figure 7c). This left the narrow, silling Priest Valley Strait near
Coalinga as the sole connection to the Pacific Ocean (Atwater and Stock, 1998; Bowersox, 2005;
Perkins, 1987). During this time, the western part of the Maricopa-Tejon sub-basin was
subsiding rapidly. In the northern part of the basin, the Diablo Range uplift and associated
volcanism were active, in association with the passing of the Mendocino Triple Junction
(Bartow, 1991). The sea became progressively restricted in the SJB during late Miocene and
Pliocene due to tectonic uplift, increased sedimentation rate, and a eustatic regression (Loomis,
1990).
Depositional Environment
Throughout the Tertiary, tectonism and sea-level fluctuations shifted the locus of shallow
marine and nonmarine deposition within the basin (Perkins, 1987). Sediment deposits in the
central SJB remained largely marine in origin until the late Miocene, when deposition of
shallow-marine and nonmarine clastic sediment increasingly spread throughout the basin
(Perkins, 1987).
While deposition of the upper Miocene, Pliocene, and Pleistocene sequences in the SJB
began with the transgression of the sea in late Miocene time (Bartow, 1991), the structural
closing of the SJB capped the initial transgressive sequence with a localized regressive sequence.
Thus, Etchegoin sands grade laterally eastward and stratigraphically upward from deep marine to
shallow tidal facies (Steward, 1996; Gillespie et al., 2008). Within the deepest part of the SJB,
brown shales found in the lower Etchegoin Formation are indicative of anoxic conditions
(Bowersox, 2005). Cores near the center of the valley display highly bioturbated sections

14
indicating lagoonal origin (Hector et al., 2008). Faunal distributions from shallow Etchegoin
deposits along the eastern edge of the basin identify marsh, tidal channel, intertidal, lagoonal,
littoral, and shallow sublittoral environments within a generally brackish basin (Lagoe et.al.,
2009) (Figure 8). The western side of the basin was a protected bay or estuarine environment
characterized by numerous sand shoals and tidal channels (Loomis, 1989). On the eastern side
of the basin, the Etchegoin has been described as a fluvial plain-deltaic environment that records
the progradation of the Kern River fan delta (Link et.al., 1990; Gillespie et.al., 2008).
Figure 8. Paleogeography of the SJB at 5.3 Ma, early Pliocene, showing depositonal environments of the
Etchegoin Formation. From Reid (1995).
Fauna indicate that the restricted connection to the cooler water of the Pacific maintained
warm, tropical climates in the SJB through the early Pliocene. Water temperatures within the

15
basin began declining by ~4.5 Ma, during the deposition of the upper Etchegoin formation, and
reached a thermal minimum by 3.95 Ma (Bowersox, 2005). This thermal minimum was
coincident with a sea level lowstand that is represented by the overlying San Joaquin Formation
(Bowersox, 2005). By 3 Ma, the Sierra Nevada had begun the initial stages of glaciation (Reid,
1995).
Planktonic foraminifera suggests that a counterclockwise current direction was
established in the SJB by late early / early middle Miocene (Bowersox, 2005). This is further
supported by paleocurrent studies of Loomis (1990) in the Coalinga area that indicate a mean
southward current direction.
Link et al. (1990) defined shoreface, river-mouth bar, prodelta, paralic, marine, and
distributary channel deposits within the Etchegoin Formation at Kern Front Oil Field, south of
the study area. These deposits are represented by four lithofacies that consist of a basal
transgressive unit overlain by shoreface and river-mouth bar deltaic deposits that interfinger with
and are overlain by prodelta to paralic mudstones. These deposits are overlain by distributary
and/or fluvial channels.
According to Link et al. (1990), deposits of the basal deltaic facies consists of shoreface
and river-mouth bar deposits subjected to marine reworking by waves, wind, and tidal processes.
The delta was supplied by high sediment-load rivers. Deposits consist of localized pods of
coarse-grained sediment, and north-south tracing sand bodies from longshore transport
processes.
Fine grained deposits of the paralic to prodelta facies were formed from hemipelagic
sedimentation of silt and sand, flocculation of clay-sized material, and concentration of fecal

16
peloids in relatively quiet water in shallow-marine to paralic settings. Link et al. (1990) believe
this facies to correlate laterally with the Macoma Claystone to the west.
The sandstones and conglomerates of the marine and distributary channel facies form
discontinuous, lenticular bodies characterized by processes commonly found in fluvial and/or
marine channels. The mapped geometry of these sand bodies suggests west-draining, dendritic
patterns that may have been tidally influenced (Link et. al., 1990).
Overall, the depositional environment described by Link et al. (1990) on the eastern side
of the basin is one in which alluvial fans occurred at the base of the rising Sierra Nevada
mountains that transitioned basinward into braided-stream deposits. The coastal plain, which
spanned from the marine embayment shoreline towards the alluvial fans, consisted of a low-
relief, muddy plain with marshes and ponds. High sediment-load from westward flowing,
sinuous river systems crossed the coastal plain and deposited their sediment load at the shoreline.
The coarse-grained sediments were reworked by marine processes that formed long, linear
shoreline sands that extended northward. Thus, the shoreface and river-mouth bar deposits grade
westward into prodelta mudstone and eventually into offshore mudstone of the Macoma
Claystone.
Sea Level Fluctuation
Although the sea was becoming more and more restricted throughout the Miocene and
Pliocene, it was still subject to periods of regression and transgression. Both the upper and lower
boundaries of the Etchegoin are associated with sea level lowstands (Bowersox, 2005).
Bowersox (2005) found three periods of relative high sea-levels separating two periods of sea
level falls.

17
In the San Joaquin Valley, tectonic activity and sedimentation rate affected transgressions
and regressions as much, or more than, eustatic sea level changes (Bartow, 1991). Loomis
(1990) found that localized tectonic events overshadowed large scale sea level changes during
the late Miocene and Pliocene within the sedimentological record. The lowstand at the upper
boundary is suggestive of a local sea-level change resulting from a tectonic event (Bowersox,
2005), such as uplift of the eastern part of the northern Diablo Range (Perkins, 1987).
The sea began withdrawal from the SJB in the latest Miocene. This retreat accelerated
through the Pliocene as progradation of coarse clastic sediments continued from all sides of the
basin (Bartow, 1991). At that time, six major rivers from the southern Sierra Nevada and Diablo
Range watersheds flowed into the basin (Bowersox, 2005). The regression culminated with the
final retreat of the sea near the end of the Pliocene as the then-emergent Salinia Terrane
completely closed the Priest Valley Straight (Bartow, 1991).
Provenance and Sediment Influx
As movement along the San Andreas Fault closed the western seaway and restricted the
connection between the San Joaquin Valley and the Pacific Ocean, Etchegoin facies became
increasingly less marine and more terrigenous (Perkins, 1987). From the west, the Gabilan range
provided volcanic and plutonic detritus, the Santa Cruz Mountains shed arkosic detritus
eastward, and the Diablo Range provided reworked Santa Margarita and metamorphosed
Franciscan complex detritus (Perkins, 1987).
The southern Sierra Nevada contributed large amounts of plutonic detritus to the
Etchegoin, primarily in the east, and was the dominant source area of sediments on the
Bakersfield Arch during late Miocene time (Perkins, 1987; Gillespie et. al., 2008).

18
Structure and Tectonism
General regional structure in the study area is comprised of a west-southwest dipping
faulted homocline. Dips on outcropping Tertiary units in the Bakersfield area average 4-6°W-
SW (Beyer and Bartow, 1988). Towards the eastern margins of the valley, strata thin and
depositionally pinch-out as they onlap onto the Sierran Nevada block and underlying strata.
While transpressional stresses along the San Andreas Fault deeply impacted the west side
of the basin causing extensive folding and thrust faulting, the east side of the basin remained
relatively calm during Miocene and Pliocene time. According to Bartow (1991), deformation
consisted mostly of southwest tilt and minor late Cenozoic normal faulting associated with late
Miocene to recent uplift of the Sierra Nevada block.
However, a significant portion of the offset in the area was pre-uplift. These faults are
mostly located in the Bakersfield arch area. Many subsurface faults have been mapped in areas
where oil-well density is sufficient to delineate faults. Most of these faults provide the trapping
mechanism for hydrocarbon accumulations. They trend mostly north to northwest (Figure 9) and
have a net down-to-the-west displacement (although down-to-the-northeast faults are also
common) with individual offsets of as much as 1970 feet (Bartow, 1991). Decreased offset of
younger strata is common in this region. In general, the north-south tracing faults were active in
the the early Tertiary and were reactivated in the late Miocene (Bartow, 1991). A secondary
fault trend of west to west-northwest is also apparent. East-west tracing faults may have had
their origin in the latest Oligocene and early Miocene and were probably active unitl the late
Miocene. While many faults in the area have historical movement, few show displacement of
Quaternary deposits (Jennings and Bryant, 2010; Bartow,1991).
19
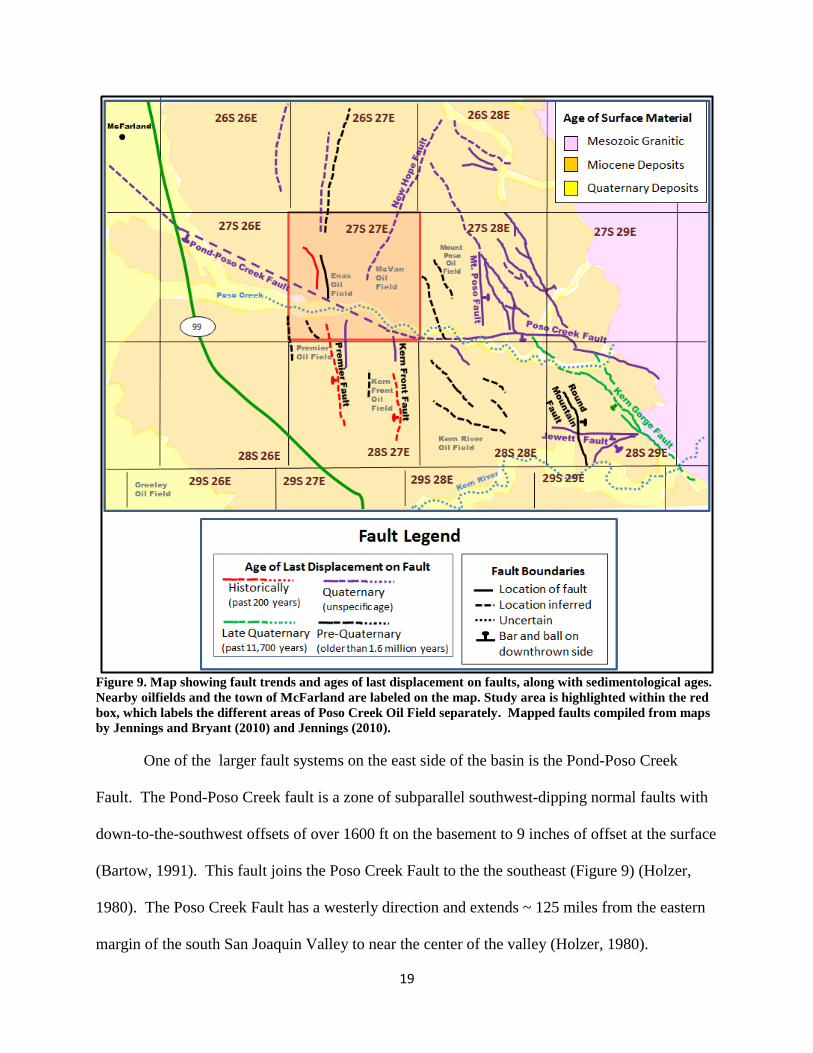
Figure 9. Map showing fault trends and ages of last displacement on faults, along with sedimentological ages.
Nearby oilfields and the town of McFarland are labeled on the map. Study area is highlighted within the red
box, which labels the different areas of Poso Creek Oil Field separately. Mapped faults compiled from maps
by Jennings and Bryant (2010) and Jennings (2010).
One of the larger fault systems on the east side of the basin is the Pond-Poso Creek
Fault. The Pond-Poso Creek fault is a zone of subparallel southwest-dipping normal faults with
down-to-the-southwest offsets of over 1600 ft on the basement to 9 inches of offset at the surface
(Bartow, 1991). This fault joins the Poso Creek Fault to the the southeast (Figure 9) (Holzer,
1980). The Poso Creek Fault has a westerly direction and extends ~ 125 miles from the eastern
margin of the south San Joaquin Valley to near the center of the valley (Holzer, 1980).

20
Lithology
Using core data, Link et al., (1990) described the Etchegoin in the Kern Front Oil Field
as being poorly indurated. Sandstones are distinctive due to their lack of cement and comprise
64% of the formation. Sandstones range from light gray to dark gray and grayish olive green to
light olive. Sandstones occur in beds up to 5 ft thick with an average thickness of 1 ft. The
Etchegoin sandstones are feldspathic litharenites, arkoses, and wackes of medium- to coarse-
grained, poorly-sorted detritus. Grains are held together by an extensive clay matrix or are
cemented by viscous hydrocarbons. While porosity within the sandstone shows little variation,
ranging from 27-41%, permeability varies over a wide range, from 33 to 5,100 md (Link et al.,
1990).
Conglomerates comprise 8% of the Etchegoin and occur in beds up to 2 ft thick with an
average thickness of 1 ft. Pebbles are light gray to medium gray. Clasts are angular- to well-
rounded, granule- to cobble- sized clasts of granodiorite, granite, gneiss, and mica schist (Link et
al., 1990).
Mudstone comprises the other 28% of the Etchegoin and is interbedded with thin beds of
sandstone or gravel. Mudstones are dark gray, light olive gray, and pale yellow-brown.
Maximum mudstone bed thickness is 10 ft with an average thickness of 1 ft. The thin beds of
sandstone interbedded within the mud layers typically consist of silty and sandy clay, siltstone,
and fine-grained sandstone.
Electric Log Response
According to, the Etchegoin formation has a complex electric log character due to highly
radioactive, mineralogically immature sandstones, and highly variable grain sizes (Link et al.,

21
1990; Taylor, 2008). Within the eastern basin, fresh formation water increases the complexity of
electric log signatures (e.g., creating a positive SP curve in sands compared to clay beds that
have not had connate water flushed by fresh water aquifers). Due to similar resistivity readings
from oil saturated pores and pores saturated with fresh water, resistivity variations reflect
differences in rock properties rather than fluids, which allows resistivity to be used as a
correlation index. High resistivity corresponds to low shale volume.
METHODS
Cores
Sedimentary structures and textures were recorded from cores of the Etchegoin
Formation within T 27S, R 27E. According to the formation depths reported in the Division of
Oil and Gas Well Summary Reports, nine Etchegoin cores/material from cores within the study
area are available for viewing (Figure 10). Only the Basal Etchegoin units have oil production in
the area, hence all the cores available were from that unit of the formation. Thus, all references
to the Etchegoin Formation to follow refer only to the basal units which underlie the Macoma
Claystone. Berry Petroleum Company provided two cores from the McVan Area of Poso Creek
Oil Field: Poso 16 and Enas 23-17. Both of these cores were taken in 2006 and had been stored
in a warehouse lacking climate control. All of the other cores in this study had been stored in the
Well Repository at California State University, Bakersfield, which also lacks climate control.
Only one core, USL 1-20 drilled in 1978, was available from the Enas Area of Poso
Creek. The well DePauli 82X, outside of the Enas Area boundary, was cored in 1981. Three
cores are within the Premier Area: USL 2-2, Midway Premier 15, and Midway Premier 1. USL
2-2 was cored in 1980; Midway Premier 15 in 1943, and Midway Premier 1 in 1929. McNeil 1,

22
Figure 10. Location map of the cores viewed in this study. Conventional cores shown in blue stars and wells
with core chips shown in green stars. T 27S, R 27E is highlighted in the red cross hatch.
north of the McVan Area, was drilled in 1939.
However, only wells from the McVan Area (USL 35-14C, Poso 16, and Enas 23-17) and
USL 2-2 within the Premier Area had full conventional cores remaining from their original
collection. The other wells only had core chips sampled from the conventional cores stored in
the repository available for viewing. While sediment texture was reported from the core chips,
sedimentary structures and unit boundary relationships could not be determined from the limited
amount of sample present. The majority of the chips contain only sand samples, such as De Pauli
82X which did not have any clay beds, indicating that the preserved chips were biased towards
quality reservoir sand and do not represent accurate lithology of the cores. Data from core chips

23
was useful in supporting correlations of formations and lithotypes from electrical log signatures
not in close proximity to one of the conventional cores available.
I described the cores from the Macoma Claystone, if available, to the Chanac. The
Chanac formation was identified by either the unconformity between the Etchegoin and Chanac
or by the nonmarine character of the sediments of the Chanac. The contact depth visible in core
confirmed and/or clarified the electric logs.
Lithology and grain size were determined under binocular microscope from a square inch
removed from the center of the core. Sampling interval was dependent on bed thickness or
lithology changes, as each bed was described as well as any grading sequences within a bed.
Hydrocarbons were removed from the heavily oil saturated samples with a combination of
lighter fluid and acetone. Sediment color was described using the Munsell 2.5 and 5 Yr Soil
Chart. Grain-size measurement was determined from the Udden-Wentworth Scale (Krumbein,
1934). Degree of sphericity and rounding were determined after Powers (1953). Degree of
sorting was determined after Folk (1965). Percentages of mineralogy and grain size were
determined using “Percentage Diagrams for Estimating Composition by Volume” (Compton,
1985). Clay- and silt- sized particles were excluded from sorting, rounding, and lithology
measurements; beds without any sand-sized particles did not have any measurement taken for
these classifications.
Core points were depth corrected using a combination of electrical log correlation and
consideration of core cut / recovery logs in conjunction with driller core barrel depths. Enas 23-
17 was the only conventional core that appeared to need depth corrections due to its lack of
correlation between the recorded lithology and electric log signatures. The measured depths
recorded from the core viewing were converted from a 12 inch per foot into a 1/10 of a foot scale

24
to enable loading into the software mapping program (IHS Petra ®). Rounding and sorting
properties were assigned numerical digits in order to display the data. A numerical scale of 1
(very poorly sorted / very angular) to 5 (very well sorted/ well rounded) was used. When a range
of rounding was reported, the median value was used. Structural features noted were flagged to
enable their plotting along the well track.
Sedimentary structures were noted when present along with unit boundary relationships.
Bed thickness descriptions are in accordance with Bates and Jackson (1984) in which very thin-
bedded ranges from 1 cm to 5 cm thick; thin-bedded ranges from 2 inches to 2 ft thick; thick-
bedded ranges from 2 to 4 ft thick; and very thick bedded is greater than 4 ft thick. Each change
in sand character was considered a layer and its bedform, structure, and texture was recorded
according to the measured depth on the side of the PVC pipe which housed the core. Samples
were taken from each layer within the core. Multiple samples were taken from layers displaying
grain size changes in order to accurately record the varying grain sizes. Sediments were often
unconsolidated and dry, and given their poor storage techniques, many sedimentary structures
and bedforms were not preserved. Fortunately, original core images were provided by Berry
Petroleum Company for Poso 16 and Enas 23-17. These images provided a more accurate, in-
situ structural view of the sediments than the physical core allowed.
Electric Log Correlation
Only wells with electric logs recorded throughout the entire Etchegoin Formation were
included in this study so that the full thickness of the formation was measured and grain-size
trends could be noted across the entire interval.

25
Log correlation within the study area maintained the stratigraphy shown in the type log in
Figure 6, with the addition of the B Sand (Figure 11), after Link et al. (1990) in the Kern Front
area. The B Sand grades into the Macoma Claystone outside of the Kern Front Oil Field and is
overlain by it within the oil field.
Figure 11. Type Log used in the Kern Front
Oil Field area showing the B Sand underlying
the Macoma Claystone. Electric log displays
spontaneous potential (SP) and deep resistivity
(RD) curves.
The Macoma Claystone is consistent throughout the study area as the marker between the
Upper and Basal Etchegoin. Generally, four distinct lithological sequences are present within
the Basal Etchegoin. In electric logs these are viewed as: 1) a coarsening upward package of one
or two sand beds overlying the Chanac (Lower Basal Etchegoin-LBE); 2) a finer grained, usually

26
fining upward package overlying the LBE (Upper Basal Etchegoin-UBE); 3) a fine grained bed
underlying the Macoma Claystone in the Kern Front area (B Sand); and 4) the overlying clay
(Macoma Claystone). The number of facies designations was limited by the type of data
available. While many subfacies could be identified within the cores, electric logs, which have a
vertical resolution of about three feet, can only identify features which are predominantly
controlled by clay content.
Due to the presence of fresh water aquifers in the area, the spontaneous potential (SP) log
could not be used to determine grain size in the wells. However, Link et al. (1990) noted that
resistivity curves on the electrical logs shows a strong correlation to grain size. Electric log
values were plotted against grain size measurements from the conventional cores in this study
that provided the most information (i.e. Enas 23-17, Poso 16, and USL 35-14C) to determine if
they could be used as grain size indicators (Figure 12). The numerical value used to represent
the grain size was determined using the equation: ∑ ((Wentworth phi value) (the % of that
sample comprised of that respective grain size)). Since the SP and gamma ray (GR) values stay
within the same range for all grain sizes, resistivity was predominantly used for correlations.
Regardless, a combination of all electric logs were taken into consideration while correlating
lithofacies to electric log signatures.
Mapping
Electric log signatures were correlated to cores to identify the lithological units identified
above, i.e., the Macoma Claystone, B Sand, UBE, and LBE. Lithological facies of differing
grain size and bed thicknesses were also correlated to electric log signatures. One sand facies
was correlated from the UBE and two facies from the LBE.

27
Figure 12. Cross plots from the three best conventional cores in the study. Demonstrates relationship of
spontaneous potential (SP), gamma ray (GR) and the deep resistivity (RD) curve AHT90 electric logs with
grain size. Grain size is plotted on the x-axis and increases to the right; electric logs are plotted on the y-axis.

28
Because an abundance of literature has correlated grain-size trends from electric logs
and depositional environments (Selley, 1996), these trends were noted for both the UBE and
LBE from resistivity readings. Subunits were marked as fining upward, coarsening upward,
blocky, or spiky (Figure 13).
Figure 13. Examples of the variations in electric log signatures that were mapped. Depositional facies for
each log signature vary, but the above are examples of 1) blocky: alluvial coastal plain 2) fining up:
transgressed barrier island 3) coarsening up: delta 4) spiky: washover fan.
Structure and isochore maps were constructed for the Macoma Claystone, UBE, and LBE
using IHS Petra ®. Grain-size trends in the sand were mapped by symbols.
RESULTS
Core Description
Cores from each basal Etchegoin geologic unit, i.e., LBE, UBE, B Sand, and Macoma
Claystone were described. Sediments found in the cores were predominantly unconsolidated.
Sand mineralogy is primarily quartz and feldspar with minor constituents of hornblende,
muscovite, and biotite. Grain sizes range from clay to pebble; clay and fine- to medium- sized
sand grains are dominant. The degree of rounding observed covers the full range from very

29
angular to well rounded, with larger grain sizes being more angular. However, there are
exceptions to the inverse correlation of grain-size and rounding, particularly in the LBE of Enas
23-17 where many layers contain very well rounded grain up to pebble-size (Appendix A).
Clasts are rare and are mostly granitic with few metamorphics. Shells are also present.
The lack of clay in the core chips is likely a result from biased sampling while collecting
the core chips from the conventional core (Appendix A). The collectors were presumably more
interested in preserving good reservoir sands, rather than the clay layers. This biased sampling
gives the false impression of a higher content of large grains within the wells represented from
core chips and does not present a complete representation of the stratigraphy. This data is used
for confirming log correlations more so than core correlations.
Bed thickness varies from a half inch to fifteen feet thick. Sand beds are pale brown to
very dark grayish brown on the 2.5 yr Munsell color chart and clay beds are light gray to dark
olive gray on the 5 yr Munsell color chart. The majority of beds are well sorted. Poor sorting is
more commonly associated with beds containing coarse- or pebble- sized grains. Sedimentary
structures identified consist of rip up clasts, ripple marks, lamination, bioturbation, cross-beds,
massive, and coarsening- and fining- upward sequences.
Occasional very thin to thin calcite-cemented beds are the exception to the overall
unconsolidated nature of the sediments (Figure 14). The calcite beds represent the lowermost
level of sorting within the cores. These beds are always found in conjunction with high shell
density — partial dissolution of the shells most likely provided the calcite cement. Shell
fragments are large and completely unsorted and unstratified.

30
Figure 14. Photograph of the core showing a bed containing shell fragments and calcite cement from 1178.7
to 1179 ft in Poso 16. Left track shows core in normal light, right track shows core under ultraviolet light,
which causes hydrocarbons to fluoresce orange. Arrows point to shells within carbonated cemented sands.
Photograph taken by PTS Laboratories upon core retrieval.
Chanac
The Chanac itself was not described in this study. The Chanac is evident in core by a
high content of pebble-sized grains or its high angle cross-bedding that sharply contrasts with the
low angle cross-bedding and fine grained sediments of the lower LBE. Apart from containing
larger grain size particles than the LBE, its lithologic characteristics are very similar to those of
the Basal Etchegoin. The Chanac is also unindurated and poorly cemented and its mineralogy is

31
also highly granitic. Fortunately, the two formations are distinguishable using electric log
correlations. The underlying Chanac has strong fluvial characteristics in its log signatures, such
as the repeated fining upward sand beds commonly used to demonstrate meandering
environments or the blocky signature common in alluvial fans or braided streams (Figure 15).
Figure 15. Electric log cross section showing contrast between marine Etchegoin Formation electric log
signatures and underlying fluvial log signatures of the Chanac Formation.
Lower Basal Etchegoin (LBE)
In cores, the LBE is represented by laminated clay layers alternating with thin cross-
bedded or bioturbated sands rich in shell content and calcite beds. Generally, the LBE is a
coarsening and thickening upward sand package that contains numerous thin beds and fine
grained sediments at the base of the unit (Figure 16). The overlying thick, coarse-grained beds

32
and the lower thin, fine- to medium- grained beds are identified as two different lithological
facies.
Electric log correlations were used throughout the study to differentiate Facies 1 and 2
within the LBE. While all electric logs are beneficial in correlating facies, resistivity and SP are
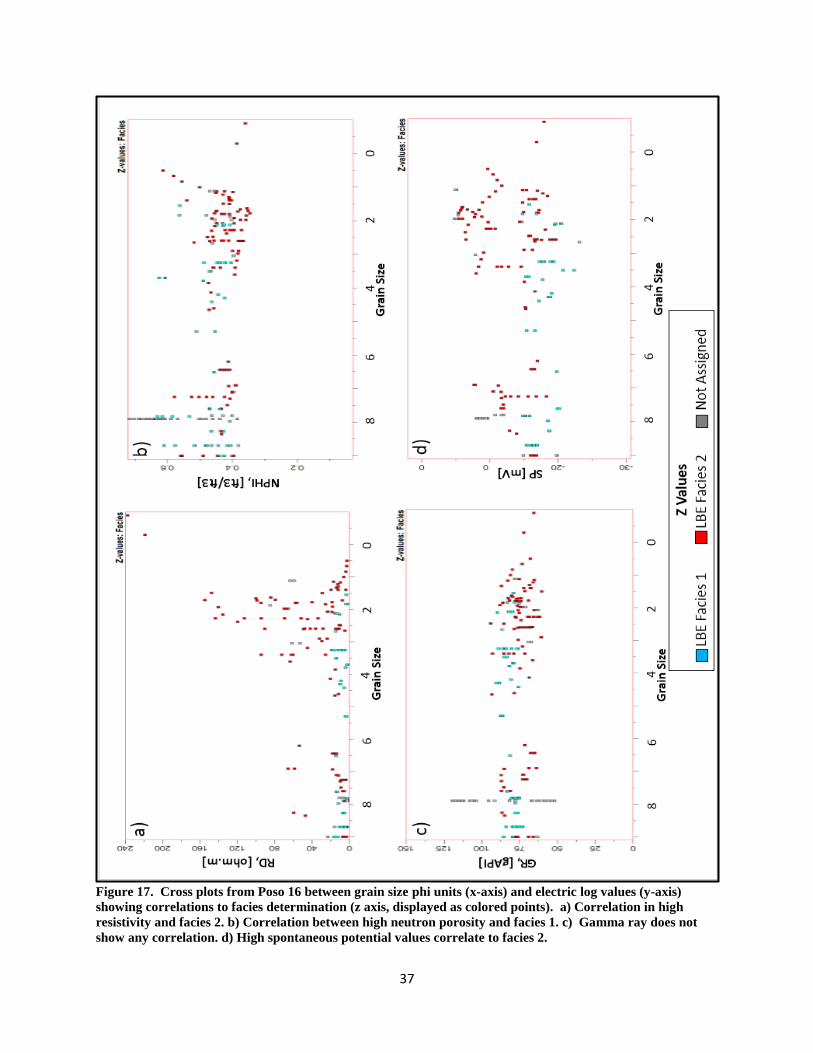
the best logs for facies correlations (Figure 17). Facies 2 of the LBE is characterized by high
resistivity readings and large negative SP deflection. Higher values in both of these logs
correlate strongly to Facies 2. Neutron porosity logs show slightly higher readings within Facies
2 and GR shows slightly higher readings within Facies 1, due to a higher concentration of
uranium and potassium in clays. However, there are some discrepancies between electric log
characteristics and core descriptions, particularly in intervals containing large amounts of clay to
very fine grained sediment. The resistivity commonly displays Facies 1 of the LBE as a clay
while the core shows thin-bedded medium sand and clay alterations.
Facies 1
Facies 1 generally comprises the lowermost portion of the LBE and consists of very thin
to thick interbeds of clay and fine- to medium- grained sand beds. Clay beds dominate this
facies (Figure 16). Clay bed contacts are either gradational or sharp, with the thick clay beds
displaying predominantly sharp contacts.
Grains are well sorted to very well sorted and subrounded to very well rounded
(Appendix A). Layers containing very well rounded grains also contain very well sorted grains.
Sands range from fine- to coarse- grained.
Clay beds in Facies 1 are commonly either bioturbated or laminated. Rip up clasts of
reworked clays are present only at the base of coarse-grained beds indicating that their basal
contacts represent local unconformities such as those found at the base of channels.

33
Figure 16. Generalized, composite sketch of grain-size trends and sedimentary structures of the Basal
Etchegoin. For descriptions of individual cores, see Appendix A.

34
Facies 2
Facies 2 represents the upper part of the LBE. It overlies and interfingers with Facies 1.
Core recoveries from Facies 2 was typically poor (Appendix A). Electric logs suggest that the
sediment that is missing from the cores is relatively coarse grained given the high RD at the
depths of the missing core. Correlations with USL 35-14C (in which this facies was retrieved)
further supports that Facies 2 is coarse grained. The lack of coarse sediment in the core barrel is
not uncommon since sands are typically poorly indurated relative to clays, making them harder
to retrieve in the core barrel. Core descriptions of this facies were taken predominantly from
USL 35-14C.
Facies 2 consists of thick to very thick beds of coarse- to pebble- sized grains that
alternate with very thin to thin clay beds (Figure 16). Facies 2 contains calcite-cemented beds
and also contains greater than 5% shell content. Apart from the calcite beds, in which rip-up
clasts of clay are present, bed contacts are conformable.
Grains are poorly sorted to very well sorted and subrounded to well rounded. Grains are
not as well sorted and are much more angular in Facies 2 than they are in Facies 1 (Appendix A).
The only massive beds within the LBE are in Facies 2. Fining upward sequences from
pebbles to medium grained sands are present within individual sand beds from the lower portions
of Facies 2.
Enas 23-17 was the outlier to the other cores viewed, primarily in regard to the LBE
(Appendix A). Not only does it contain large grains that are well rounded, Facies 1 is absent and
Facies 2 does not contain any calcite cement or layers with high shell content. Enas 23-17 is
further south than the other two conventional cores in the eastern portion of the study area and
represents the stratigraphy and lithology of the LBE in the southeast.

35
Upper Basal Etchegoin (UBE)
The UBE is separated from the coarsening upward sequence of the LBE by clay or very
fine grained sand beds (Figure 16). This contact was gradational, except in well USL 35-14C, in
which it was very sharp (Appendix A). The UBE is represented in core by alternating layers of
clay and medium grained sand to pebble-sized beds. Sand beds are the dominant lithology. The
UBE is predominantly thickly to very thickly bedded. The UBE consists predominantly of sands
that fine upwards from pebbles to fine grained sand, although a few coarsening upward
sequences are present. Fining upward sequences are much more common in the UBE than in the
LBE. Fining upward sequences range from pebbles to clay and coarsening upward sequences
range from fine to very coarse sand. While gradational contacts are common, the majority of
thick and very thick clay beds have abrupt contacts.
Sand beds in the UBE are primarily poorly sorted, with grain sizes ranging from fine
grained sand to pebbles (Appendix A). Approximately 10 to 25% of the sediment in most of the
sand layers is coarse grained. Pebbles make up to 20% of the sediments in some beds in the
McVan area.
Rip up clasts of fine grain to clay-size sediment were observed in only a few sand layers
overlying a fine grained layer. Bioturbation was only present in beds overlying the LBE contact.
A few fine- to medium- grained beds exhibit low to medium angle cross-beds.
The UBE contains finer grain sizes in the Premier and Enas areas than in the McVan area
(Appendix A). Pebbles are entirely absent from the more basinward areas to the west, where the
UBE is composed of mostly fine- to medium- grained sand. The UBE is also thinner in the
western wells, as demonstrated in the core from well USL 2-2.

36
The sand beds in the UBE often appear as fine grained in the electric logs while they are
actually very coarse in the cores, as is seen in Enas 23-17 (Appendix A). This demonstrates that
the electric logs tend to underestimate grain sizes in the sediments, due to an averaging effect in
the resolution of the log data.
B Sand
The B Sand is only present in well USL 2-2 (Appendix A). This core had been stored
poorly, and as a result, most sedimentary structures were destroyed. In USL 2-2, the B Sand is a
thick, medium grained sand bed. The sand is well sorted and the grains are very well rounded. It
is separated from the UBE by a thick clay bed which has sharp upper and lower contacts.
Macoma Claystone
Overlying the UBE is the massive Macoma Claystone (Figure 16). The contact between
the UBE and the Macoma is very sharp. The Macoma Claystone contains 80 to 95% clay
content; very fine- to medium- sized sand grains make up the remaining 5 to 20% of the deposit.
Maps
Structure Maps
The structure maps of each unit within the Basal Etchegoin shows the 3.3° to 3.7°
westward dip of the regional homocline along the foothills of the Sierra Nevada Mountain
Range. Displacement along these faults ranges from 50 ft to 100 ft. However, dip increases to
8.3° to 8.8° between the Premier Area and Kern Front due to large scale normal faulting within
37
Figure 17. Cross plots from Poso 16 between grain size phi units (x-axis) and electric log values (y-axis)
showing correlations to facies determination (z axis, displayed as colored points). a) Correlation in high
resistivity and facies 2. b) Correlation between high neutron porosity and facies 1. c) Gamma ray does not
show any correlation. d) High spontaneous potential values correlate to facies 2.

38
Figure 18. Structure map of the top of LBE. Eastern extents of the UBE (blue) and Macoma Claystone (red)
are shown. Contour interval on map is 100 ft.
that area. The UBE and LBE sands differ in their aerial extent however: the UBE and the
Macoma Claystone extend further east than does the LBE (Figure 18).
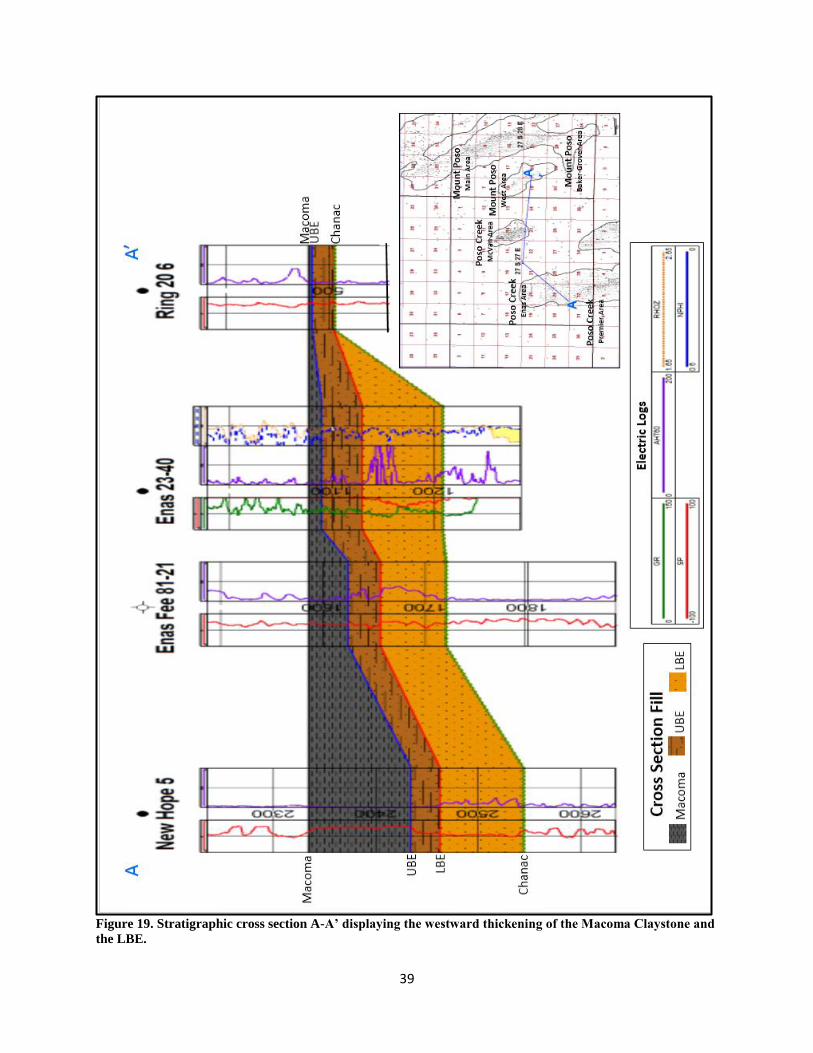
The Macoma Claystone thins to the east and becomes indistinguishable from clay beds in
the Upper Etchegoin on electric logs (Figure 19), thus it is not mapped as far east as the UBE
(Figure 18). However, it does extend further eastward than the LBE.
39
Figure 19. Stratigraphic cross section A-A’ displaying the westward thickening of the Macoma Claystone and
the LBE.
40
Isochore Maps
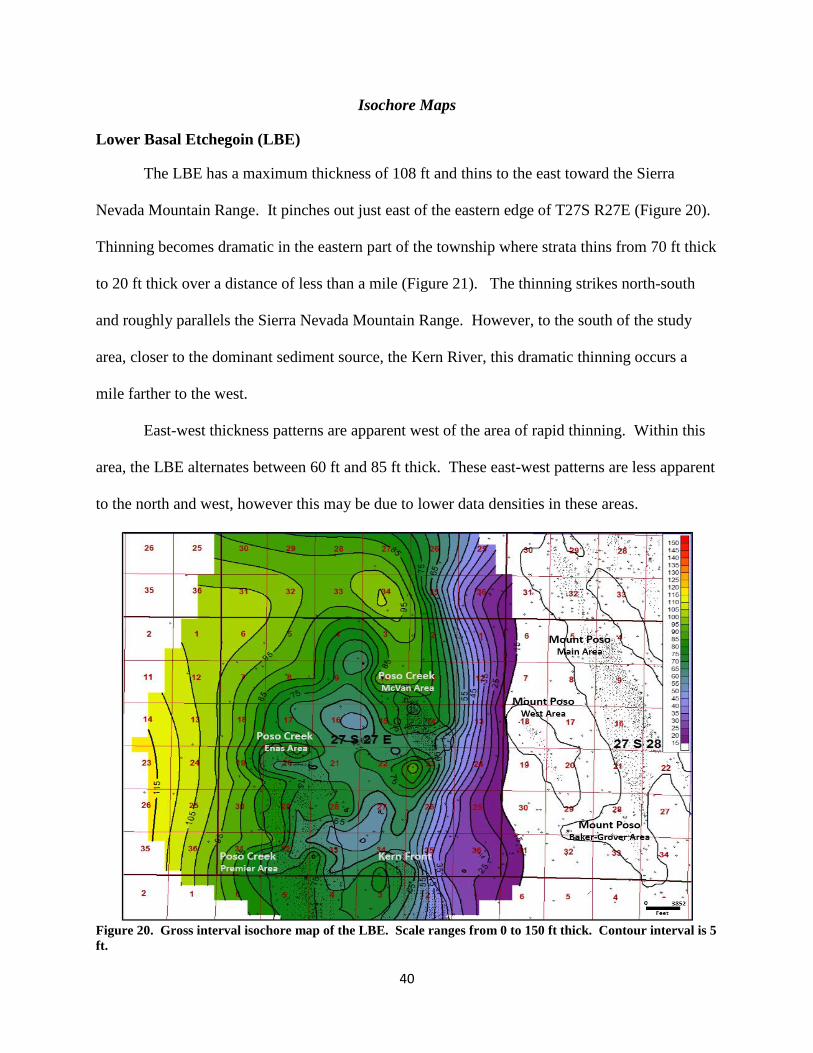
Lower Basal Etchegoin (LBE)
The LBE has a maximum thickness of 108 ft and thins to the east toward the Sierra
Nevada Mountain Range. It pinches out just east of the eastern edge of T27S R27E (Figure 20).
Thinning becomes dramatic in the eastern part of the township where strata thins from 70 ft thick
to 20 ft thick over a distance of less than a mile (Figure 21). The thinning strikes north-south
and roughly parallels the Sierra Nevada Mountain Range. However, to the south of the study
area, closer to the dominant sediment source, the Kern River, this dramatic thinning occurs a
mile farther to the west.
East-west thickness patterns are apparent west of the area of rapid thinning. Within this
area, the LBE alternates between 60 ft and 85 ft thick. These east-west patterns are less apparent
to the north and west, however this may be due to lower data densities in these areas.
Figure 20. Gross interval isochore map of the LBE. Scale ranges from 0 to 150 ft thick. Contour interval is 5
ft.

41
The maximum thickness of Facies 1 in the LBE is 28 ft (Figure 21). The maximum
thickness occurs twice, both times within oil fields. The isochore map of Facies 1 shows little
variation within the mapped area, except for thinning to the east along the LBE pinch-out.
Figure 21. Isochore map of the LBE Facies 1. Scale ranges from 0 to 150 ft thick. Contour Interval is 4 ft.
The Facies 2 in the LBE (Figure 22) reaches a maximum thickness of 75 ft northeast of
the Enas area. The general westward thickening of the formation is apparent. The map also
shows alternating areas of high and low thickness with east-west orientations.
The gross interval isochore maps of the different facies sands of the LBE did not extend
as far east as the LBE isochore itself. This is due to the inability to determine the facies’
characteristics in the LBE where it was very thin near its pinch out.

42
Figure 22. Isochore map of LBE Facies 2. Scale ranges from 0 to 150 ft with contour intervals of 5 ft.
Facies 2 shows more variability in its thickness than Facies 1 (Figure 24). This is
especially true in the southeast, where Facies 2 extends much farther east than Facies 1. Here,
Facies 2 thickens in areas where Facies 1 is absent.
The majority of the grain-size trends within the LBE are coarsening upward (Figures 23
and 24). This was present throughout the entire study area with a noticeably high density of
coarsening upward signatures near the pinch-out to the east. Fining upward sequences are also
present and display a strong correlation to the thicker Facies 2 deposits. Spiky signatures are
more common in the western portion of the township and show a close proximity to fining
upward sequences. Blocky log signatures are the least common, but are present in clusters.

43
Most of the blocky signatures were adjacent to the area where the LBE pinches out to the east.
Blocky signatures are more strongly associated with coarsening upward sequences than any other
grain-size trend.
Figure 23. Electric log signatures plotted against the isochore map of the LBE Facies 1.

44
Figure 24. Electric log signatures plotted against the isochore map of the LBE Facies 2.
45
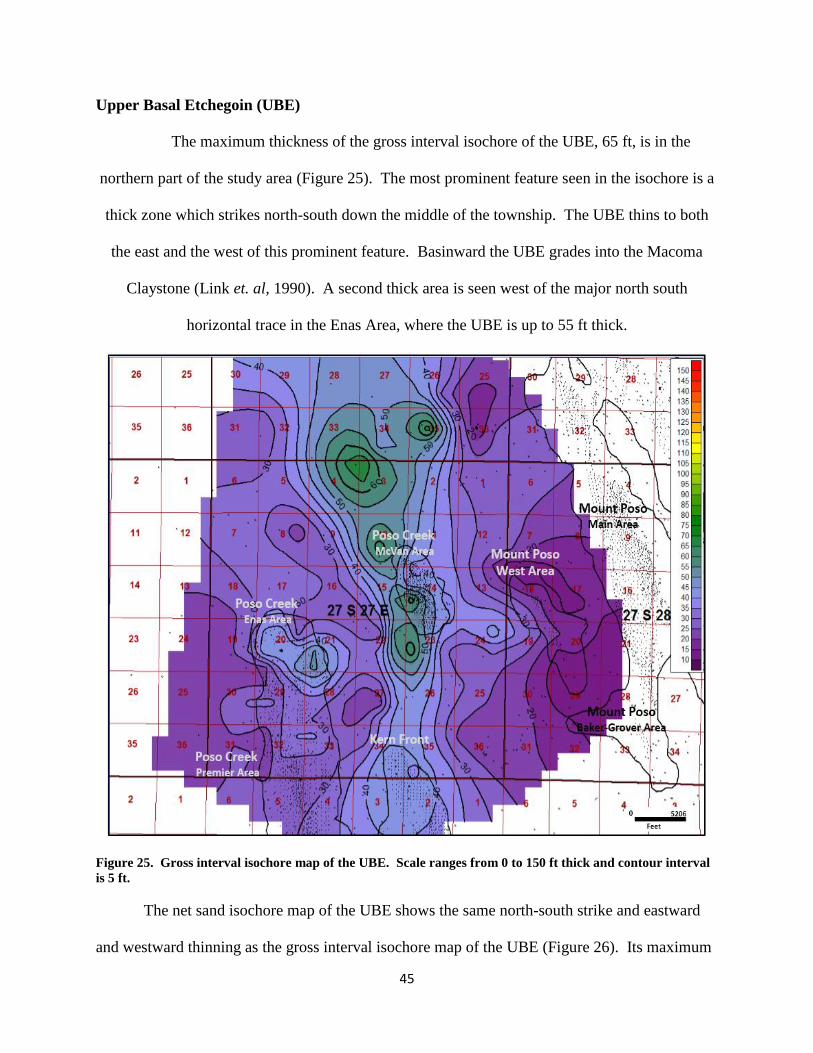
Upper Basal Etchegoin (UBE)
The maximum thickness of the gross interval isochore of the UBE, 65 ft, is in the
northern part of the study area (Figure 25). The most prominent feature seen in the isochore is a
thick zone which strikes north-south down the middle of the township. The UBE thins to both
the east and the west of this prominent feature. Basinward the UBE grades into the Macoma
Claystone (Link et. al, 1990). A second thick area is seen west of the major north south
horizontal trace in the Enas Area, where the UBE is up to 55 ft thick.
Figure 25. Gross interval isochore map of the UBE. Scale ranges from 0 to 150 ft thick and contour interval
is 5 ft.
The net sand isochore map of the UBE shows the same north-south strike and eastward
and westward thinning as the gross interval isochore map of the UBE (Figure 26). Its maximum

46
thickness is 60 ft. The thickest areas of sand largely coincide with the thickest areas in the gross
interval isochore, indicating that the UBE deposits are mostly sand in these areas.
Figure 26. Isochore map of the UBE net sand. Scale ranges from 0 to 150 ft thick and the contour interval is
5 ft.
Fining up is the most common log signature in the UBE and is present throughout the
entire map (Figure 27). Fining upward signatures are especially common in the eastern area.
Spiky log signatures are also very common and are present throughout the area, but in higher
concentrations within the thinner UBE deposits to the west. Coarsening upward sequences are
not as common but are seen in higher concentrations along the eastern edge of the north-south

47
tracing thick UBE deposits. Blocky signatures are rare, but when they are present they are
associated with coarsening upward log signatures.
Figure 27. Electric log signatures plotted against the net sand isochore map of the UBE.
B Sand
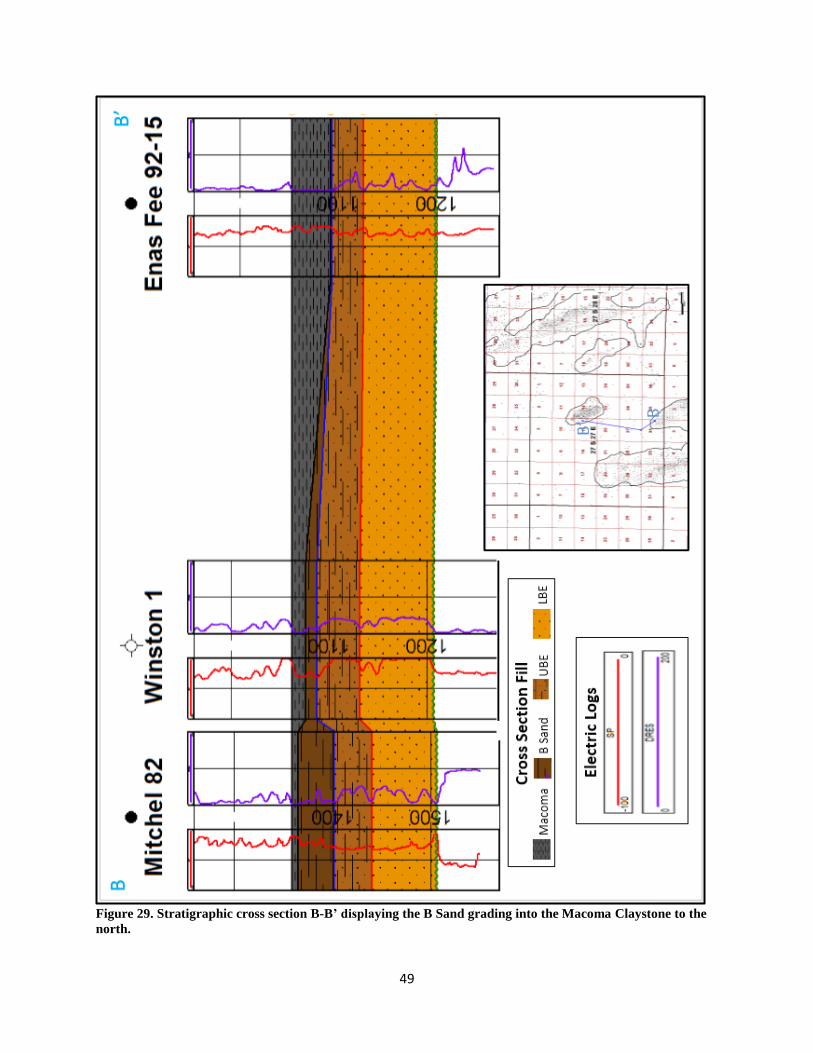
The B Sand is only present in the southeast area of the township. Its maximum thickness
is 30 ft in Section 35 (Figure 28). The gross isochore map shows a northwest striking

48
lithological unit. Outside of this area it grades into the Macoma Claystone, which overlies the
UBE in the rest of the area (Figure 29).
Figure 28. Gross isochore map of the B. Scale ranges from 0 to 150 ft thick. Contour interval is 5 ft.
Macoma Claystone
The Macoma Claystone has a maximum thickness of 220 ft in the western part of the
study area (Figure 30). It extends slightly farther east than does the UBE. The Macoma
Claystone thins from 100 ft thick to 20 ft thick three miles east of township 27S, R 28E, except
in the most northern two sections, where the Macoma remains 50 ft thick all the way to the
eastern edge of the township. In the southeast part of the study area, where the lower portion of
49
Figure 29. Stratigraphic cross section B-B’ displaying the B Sand grading into the Macoma Claystone to the
north.

50
the Macoma grades into the B Sand, its thickness is relatively constant, varying by only 10 ft
over 430 square miles. In the northeast portion of the study area, the Macoma thickens
eastwardly from 60 ft to 80 ft thick.
Figure 30. Isochore map of the Macoma Claystone. Scale ranges from 0 to 220 ft thick. Contour interval is
10 ft.
DISCUSSION
Overall, the sediments in the core, the electrical log signatures, and the geometries in the
isochore maps are consistent with the hypothesis that the Basal Etchegoin represents a marine
transgression (Kodl et al., 1990; Link et al., 1990; Bartow, 1991; Steward, 1996; Gillespie et al.,

51
2008, Bowersox, 2005; and Loomis, 1990) and is transitional between the underlying Chanac
(fluvial) and the overlying Macoma Claystone (marine offshore).
The lithology of the Etchegoin in the study area matches the lithology of the granitic
Sierra Nevada Mountain Range (Link et al., 1990). This implies that the marine sediments were
largely sourced from the emergent Sierra Nevada. The close proximity of the shoreline to the
Sierras explains the low degree of rounding seen in most of the medium- and coarse grained
sands.
Depositional Environments
Lower Basal Etchegoin (LBE)
Both Bowersox (2005) and Link et al. (1990) note the presence of deltaic shorelines near
the study area. A deltaic environment is supported by electric logs, cores, and isochore mapping
in this study. The sedimentary structures observed in the cores agree with the generic vertical
profile set forth by Selley (1996) for delta deposits: a fine-grained, laminated or rippled marine
facies (i.e., delta front / Facies 1) that is overlain by coarser grained, cross-bedded channel sands
(i.e., delta plain / Facies 2). This profile appears as an overall upward coarsening and thickening
sequence on wireline logs (Selley, 1996; Kitazawa, 2006), and is the most common log signature
within the LBE (Figure 24). Coarsening upward sequences are characteristic of many deltaic
facies, such as bay-filling sediments and tidal ridges (Appendix B). Selley (1996), explained the
vertical repetition of this profile and the interfingering of facies, by delta switching and repeated
episodes of filling of interdistributary bays by crevassing. When the LBE is divided into 3
segments, the vertical profile of prodelta deposits overlain by delta front and delta plain deposits
is observed in the core sediments viewed in this study (Figure 31).

52
Figure 31. Chart displaying frequency of sedimentary characteristics within each subdivision of the LBE.
The lowermost third of the LBE, which unconformably overlies fluvial deposits of the
Chanac Formation, commonly consists of Facies 1, which contains clay beds, cross-beds of 1 to
3 inches thick, bioturbation, lamination, thin beds, and ripple marks (Figure 31). These features
are most prominent in the cores Poso 16 and USL 35-14C (Appendix A). These structures are
characteristic of a prodelta and delta front in which sand slumping, crevasse filling of
interdistributary bays, and/or minor sea level changes create alternating clay and sand beds
(Appendix B) (Selley, 1996). Prodelta deposits are represented by spikey electric log signatures.
Spikey log signatures increase in frequency basinward (westward). Lower delta front facies
visible in core consist of interdistributary bay and distributary mouth bar deposits (Appendix B).
These deposits display ripple marks and bioturbation and are either fine grained sand or alternate
between fine and coarse grained beds. They are characteristic of deltas with a low slope, as is
expected due to the low gradient of the basin margin.
The sands in the middle part of the LBE represent the interfingering of Facies 1 and
Facies 2. These deposits contain more cross-beds, graded beds, thin beds, rip-up clasts and less
bioturbation and lamination than those in the lower third of the LBE (Figure 31). These

53
structures are characteristic of bay-fill, distributary mouth bars, distributary channels, and lower
tidal river deposits of upper delta front environments (Appendix B) (Hori et al., 2001; Coleman
and Prior, 1982; Kitawaza, 2006; Boggs, 2001; and Selley, 1996). These environments are most
strongly represented in electric logs by blocky and spikey signatures. Spikey signatures in this
environment are associated with crevasse splays into interdistributary bays and blocky signatures
are interpreted to be distributary mouth bar deposits.
The majority of the uppermost third of the LBE consists of Facies 2, which always
overlies and sometimes interfingers with Facies 1. While much of this facies was lost during
coring, what was captured revealed well sorted, very well rounded grains with an increase in
massive beds, rip-up clasts, and calcite cement compared to the middle beds (Figure 31). The
upper sands also showed decreased frequencies of clay beds, cross-beds, lamination, and thin
beds. These features are characteristic of upper delta front and lower delta plain environments
characterized by distributary channels, tidal rivers, tidal-ridges, and subtidal lag facies (see
Appendix B for core characterization) (Coleman and Prior (1982); Kitawaza (2006); Selley,
(1996).
Tidal channels consist of coarse sediment, especially when close to the main tidal channel
(Kitazawa, 2006). Facies 2 matches descriptions of tidal ridges very well. According to
Coleman and Prior (1982), tidal ridges, which are large, linear topographic forms commonly
found within and seaward of the river mouth, tend to contain the coarsest and best sorted sand
units and can show multi-directional cross strata. Fining upward signatures are interpreted as
tidal channels or distributary channels. Pelecypod shell fragments are common throughout the
sand deposits of both tidal ridges and channels and are commonly concentrated into thin lag
deposits, in the cores (Coleman and Prior, 1982). These lag deposits are an indication of erosion

54
by strong tidal currents (Kitazawa, 2006). The tidal facies observed in cores is likely due to
reworking by waves and tidal currents during transgressive episodes (Boyd et al., 1992).
The areal mapping of the LBE that results from this study further supports the
depositional environments observed in core: a fluvial deltaic depositional system that has been
tidally influenced/reworked during a transgression. In a distributary mouth bar environment,
tides create strong bidirectional currents that form large, linear tidal ridges just seaward of the
river mouth (Coleman and Prior, 1982). The tidal ridges that form from reworking the
distributary mouth bar are commonly oriented parallel to river channels and perpendicular to the
shoreline (Coleman and Prior, 1982; Selley, 1996; Kitawaza, 2006). The isochore map of LBE
Facies 2 (Figure 22) shows parallel, elongate sand ridges with east-west horizontal traces that are
perpendicular to the paleo-shoreline along the Sierra Nevada Mountain Range. The control
points within the mapped area do not allow for the depiction of individual tidal ridges or
channels, which average 2000 ft wide and can be 1 to 3 miles apart (Coleman and Prior, 1982).
However, the general ridge-like pattern is apparent on the isochore map.
The great thickness (up to 50 ft) of the coarse-grained, thick beds of Facies 2 (Figure 32)
in and eastward of section 27 suggests the presence of a large distributary channel in which
strong fluvial currents prevented marine deposition. This feature can be seen in Enas 23-17,
which is the closest core to the distributary channel (channel sands from 1197-1203 ft and 1205
to 1225 ft of Enas 23-17 in Appendix A). In these sections, electric logs most commonly show
fining upward signatures, and, more rarely, spikey log signatures. This location is only 6 miles
from the Pond-Poso Creek Fault which contains a modern day stream (Figure 9). This fluvial
system, or an ancient one following the same path, may have been an important source of
sediment for the deltaic system.

55
Figure 32. a) Macro-scale depositional facies reconstruction of the LBE deltaic sands with inserts of b) Facies
1 isochore (Figure 21) and c) Facies 2 isochore (Figure 22). Electric logs signatures displayed on maps as
symbols.

56
Upper Basal Etchegoin (UBE) and B Sand
A barrier island / lagoonal depositional environment for the UBE is suggested by log
signatures and lithology (see Appendix B for core characterization of each subfacies and
references). This is supported by Link et al. (1990), who interpreted the UBE as paralic
backbay, estuary/tidal, and/or lower coastal plain channels to the south in the Kern Front field.
Four major sedimentary environments are commonly found in the barrier island system: fluvial
coastal plain, lagoonal complex, the barrier island itself, and offshore marine shelf (Appendix B)
(Selley, 1996). Only where there is a delicate balance of land-derived sediment and sea level rise
are all four facies preserved, which is rare in the geologic record (Selley, 1996). With the
exception of the offshore marine shelf facies, these environments are all represented in the UBE
sediments and mapping from this study. Features in the core such as bioturbation, and thin,
fining upward beds in the UBE support environmental deposits of alluvial coastal plains,
lagoons, flood tidal deltas, washover fans, tidal inlet channels, and barrier islands (Appendix B).
The UBE has grain sizes that range from very fine to pebble-size (pebbles are present in
Enas 23-17, see Appendix B), with medium to coarse sand being prominent. The conventional
cores from the McVan Area display flood tidal delta, washover, and lagoonal subfacies of the
barrier island system (Appendix B). Lagoonal facies are characterized by rippled and burrowed
interlaminated fine sands, silts, muds, and peat deposits (Boggs, 2001; Selley, 1996). Flood tidal
delta and washover deposits are marked by fine- to coarse- grained, crossbedded sandstone that
vary in thickness from 1 to 4 m thick (McCubbin, 1982). Depending on the thickness of the
flood tidal delta deposits, they can display either fining upward (thinly bedded deposits) or
coarsening upward log signatures (thickly bedded deposits) (Nishikawa and Ito, 2000;

57
McCubbin, 1982). A washover fan from a single storm can be up to two feet thick and extend a
few hundred feet (McCubbin, 1982).
During transgression, the vertical profile of a barrier island fines upwards, as commonly
seen in the UBE, as opposed to the coarsening upward barrier island that occurs during
regression (McCubbin, 1982 and Selley, 1996). In transgressive settings, tidal delta and
washover deposits form the majority of the preserved barrier system and are quite prevalent in
the lagoon behind a barrier island. Large cross-bedded sand deposits in the lagoon are a
significant component of transgressive barrier sequences as well, as tidal channels often cut the
barrier island during transgression and flow into the lagoon (Selley, 1996; Boggs, 2001). Hence,
sand beds between fine-grained deposits may represent washover fans interbedded with lagoonal
environments (McCubbin, 1982).
Beach and shoreface deposits were not noted in the available cores for this study. While
there are not any conventional cores from the seaward side of the barrier island, the absence of
beach deposits can also be explained by rapid sea advancement in which barriers are quickly
submerged to form offshore bars and shoals (Selley, 1996).
A barrier island / lagoonal environment is also evident in the isochore map of the UBE
that resulted from this study (Figure 25), in which barriers are defined as sandy islands or
peninsulas elongated parallel to the shore and separated from the mainland by lagoons or
marshes (McCubbin, 1982). None of the cores viewed in this study lie directly within the barrier
island itself (Figure 33). Enas 23-17 contains the coarsest grained sediments of the UBE cores
and it is the core that most closely plots on the barrier island itself (Appendix B). The cores from
the Enas and Premier areas to the west of the barrier system are more fine grained and represent
the seaward transition into a muddy offshore zone represented by the Macoma Claystone (Selley,

58
1996). On the western side of the barrier island, spiky log signatures represent interbedded
offshore muds and sands seaward of the barrier island complex (Selley, 1996) (Appendix B).
The B sand isochore map (Figure 28) is similar in geometry to that of the UBE (Figure
25), except that its greatest sand thickness lies nearly one mile farther east than that of the
underlying UBE. This, coupled with the fining upward log signature that is commonly seen in
barrier islands during transgression (McCubbin, 1982 and Selley, 1996), suggests that the B Sand
is the uppermost bed of the UBE barrier island. Due to the rising sea level, it overlies the UBE
barrier island sands and has a slight, landward displacement. The B Sand represents the final
deposition of the barrier island.
The UBE/B Sand barrier island lies one section to the east of the mapped fault in Enas
Oil Field and lies along the strike of the basin margin (Figures 18 and 33). This suggests the
barrier island was deposited on the shelf-slope break. In the central part of the study area
(sections 15 and 14), the isochore map of the UBE/B Sand (Figure 33) suggests that the barrier
sand thins, which may indicate the presence of a tidal inlet. The lower thickness/ft gradient east
and west of the inferred tidal inlet in the net sand isochore map suggests the presence of a flood-
tidal delta and ebb-tidal delta, respectively (Appendix B).
The location of the UBE to the east of the LBE demonstrates the subsequent transgressive
episode and the landward migration of the shoreline (Figure 18). When the rate of relative sea
level rise exceeds the rate of sediment supply, estuaries and lagoons are formed (Boyd et al.,
1992). When wave and tidal current reworking becomes intense, delta shorelines shift landward
and are reworked into coastal barriers, beaches, or dune complexes (Appendix B) (McCubbin,
1982). This is currently occurring in the Mississippi delta where abandoned delta lobes are
reworked by waves as the sea advances (Selley, 1996). Barrier island sands are often formed
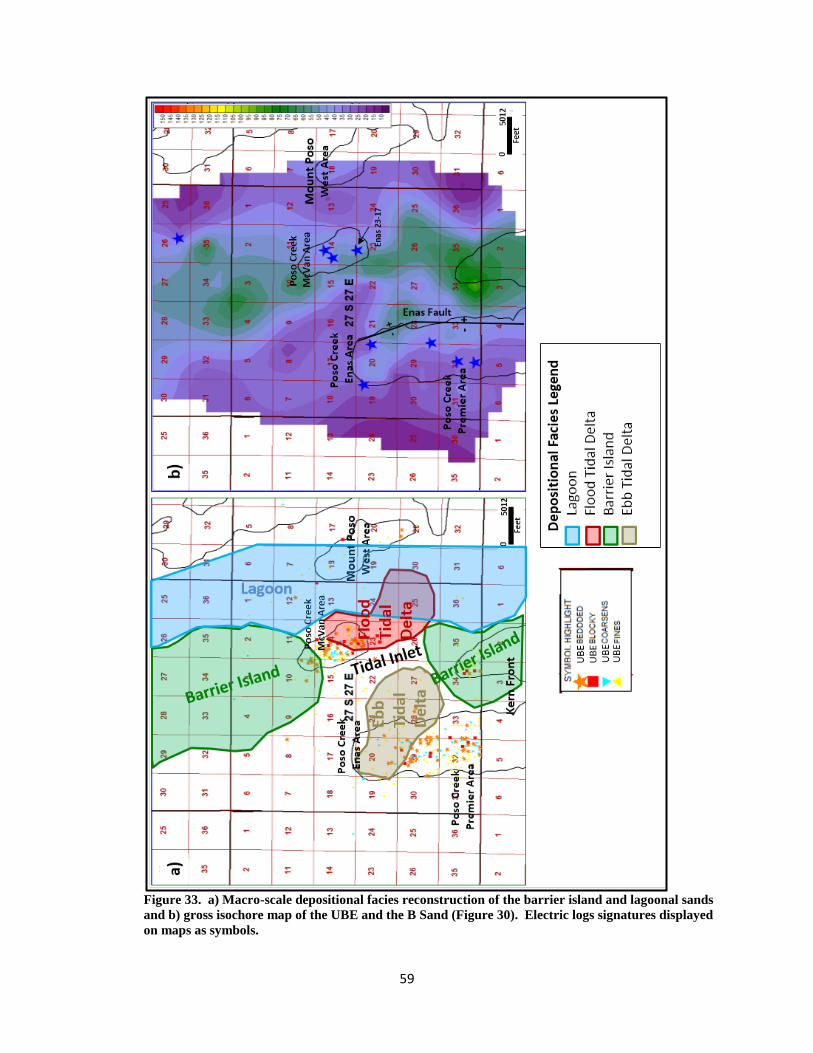
59
Figure 33. a) Macro-scale depositional facies reconstruction of the barrier island and lagoonal sands
and b) gross isochore map of the UBE and the B Sand (Figure 30). Electric logs signatures displayed
on maps as symbols.

60
during transgression or delta lobe switching due to the decrease in fluvial influence as the
shoreline moves further landward (Boyd et al., 1992; Selley, 1996).
Macoma Claystone
The Macoma Claystone represents the final sequence in the marine transgression of the
Basal Etchegoin. As seen in the core, the Macoma Claystone is massive and lacks any grains
larger than fine sand. On electric logs, it provides a shale baseline (i.e., positive SP deviation).
These features are characteristics of offshore marine deposits.
The isochore map of the Macoma Claystone (Figure 30) shows it thickening west of the
UBE/B Sand barrier island (Sections 16, 21, 28, and 33) where it likely represents a gradation
from barrier island and lagoon deposition to offshore deposition. The Macoma Claystone is
thicker in the north, near sections 1 and 2 of T27S R27E. The greater thickness in this area (as
opposed to the southern portion around section 26) is likely due to the lack of B Sand deposition
in the north, which allowed offshore marine deposits to transgress more rapidly there. This
location likely served as a bay in the overall north-northwest striking shoreline.
CONCLUSION
The Basal Etchegoin sands represents a marine transgression of an inland sea during
Miocene/Pliocene time. The sands were deposited on a low gradient slope, which steepens to the
west of the fault in Enas Oil Field (Figure 9). The sands were sourced from the rising Sierra
Nevada Mountains and fed by a river system that roughly parallels the current Poso Creek Fault
system (Figure 9). The Lower Basal Etchegoin (LBE) is a tidally influenced deltaic deposit
reworked by longshore currents as the delta lobe was abandoned. These sediments, the Upper

61
Basal Etchegoin (UBE), were deposited in a barrier island/lagoon environment. The Macoma
Claystone, which overlies the UBE completes the transgressive sequence.

62
Appendix A
The stratigraphic columns displayed in this appendix are exact, detailed graphical
depictions of each core viewed in this study. Every bed from the core is displayed here,
including the smallest bed thickness recorded (one half inch). Electrical logs are shown in the
first column. The second column displays the sum of the percent of total sediment for each grain
size. The fourth column displays the degree of sorting, followed by the degree of rounding (5th
column), and sedimentary structures observed (6th
column). Facies 1 and 2 of the LBE are
colored within the depth track. Facies for wells with core chips was primarily determined using
electric log correlation as core chips alone do not typically provide enough information for
characterization.
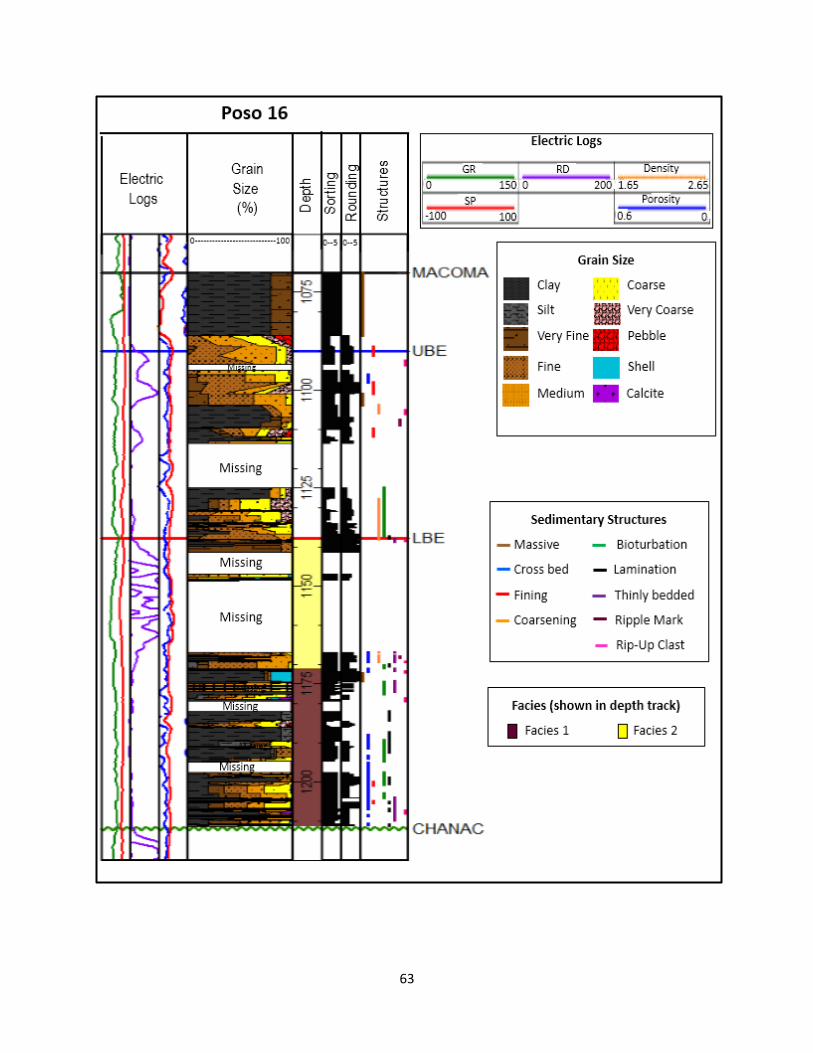
63

64

65

66
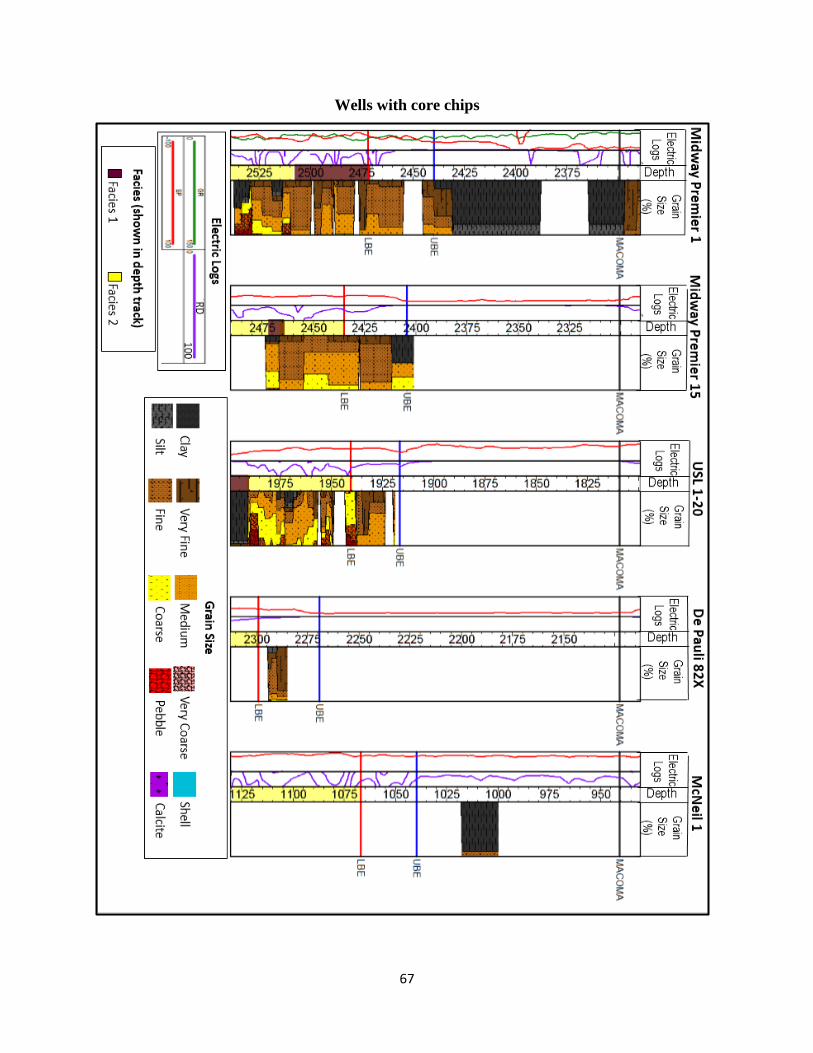
67
Wells with core chips

68
Appendix B
This Appendix contains information used to identify and characterize the depositional
facies. Schematics label depositional facies that are common in deltaic (LBE) and barrier island
(UBE) environments. Charts depict the sedimentary structures and electric log signatures
observed in both the LBE and UBE and the corresponding depositional environment in which
each structure may be found. The logs give examples of log characteristics of specific sub facies
of the depositional environment. The charts are compiled from many literature sources which
are cited next to the corresponding chart.

69
Environmental Facies of Deltas (LBE)
Modified from Selley (1996 ).

70
Compiled from Hori et al. (2001), Coleman and Prior (1982), Kitawaza (2006), Boggs (2001), and (Selley,
1996).

71

72
Environmental Facies of Barriers (UBE)
Modified from Heteren (2014).

73
Compiled from McCubbin (1982) and Nishikawa and Ito (2000).
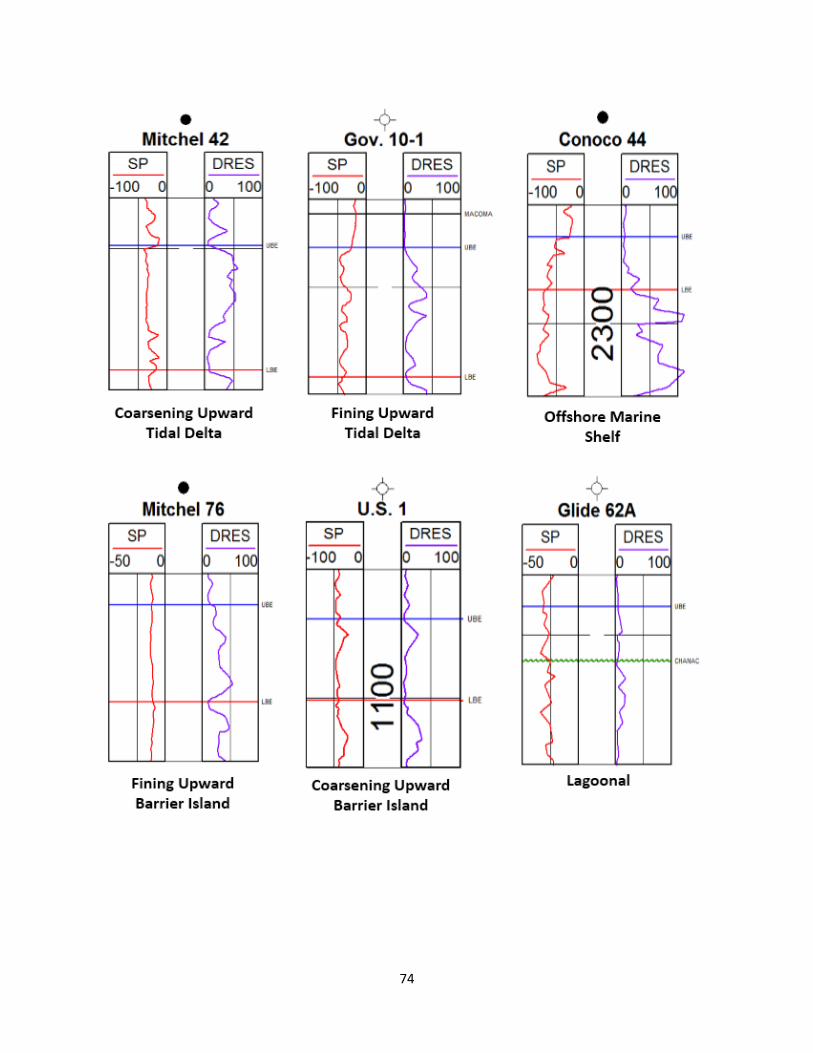
74

75
REFERENCES
Atwater, T. and Stock, J., 1998, Pacific-North America plate tectonics of the Neogene
Southwestern United States: an update, International Geology Review, vol. 40, p. 375-
402.
Bartow, J.A., 1991, The Cenozoic evolution of the San Joaquin Valley, California: U.S.
Geological Survey Professional Paper 1501, 40 p.
Bates, R.L and Jackson, J.A., eds., 1984, Dictionary of Geological Terms, Third Edition: The
American Geological Institute, Anchor Books, New York.
Berryman, W.M., 1973, Lithologic characteristics of Pliocene rocks cored at Elk Hills, Kern
County, California: Contributions to Economic Geology Geological Survey Bulletin
1332D, p. D1-D54.
Beyer, L.A. and Bartow, J.A., 1988, Summary of geology and petroleum plays used to assess
undiscovered recoverable petroleum resources, San Joaquin Basin Province, California:
United States Department of the Interior Geological Survey, Open-File Report 87-45OZ,
80 p.
Boggs, S.J., 2001, Marginal Marine Environments; in: Principles of Sedimentary and
Stratigraphy: Prentice Hall, New Jersey, p.321-356.
Bowersox, R.J., 2005, Reassessment of extinction patterns of Pliocene molluscs from California
and environmental forcing of extinction in the San Joaquin Basin: Palaeogeography,
Palaeoclimatology, Palaeoecology, vol. 221, iss. 1-2, p. 55-82.
Boyd, R., Dalrymple, R., and Zaitlin, B.A., 1992, Classification of clastic coastal depositional
environments: Sedimentary Geology, vol. 80, p.139-150.
California Department of Conservation: Division of Oil, gas, and Geothermal Resources, 1998,
California Oil & Gas Fields, Volume 1 – Central California, p. 328-335.
California Division of Oil, Gas, and Geothermal Resources, 2009, 2009 Annual Report of the
State Oil & Gas Supervisor, 267 p.
Coleman, J.M. and Prior, D.B., 1982, Deltaic environments of deposition, in: P. A. Scholle and
D. Spearing, eds., Sandstone Depositional Environments: AAPG Memoir 31, p. 139-178.
Compton, R.R., 1985, Geology in the field: Wiley, USA, 398 p.
COSUNA, 1984, (Bishop, .C. and Davis, J.F., coordinators), Correlation of stratigraphic units in
North America – southern California province correlations chart: American Association
of Petroleum Geologist, Tulsa, Oklahoma, I plate.
Folk, R.L., 1965, Petrology of Sedimentary Rocks: Hemphill,, Texas 170 p.
Foss, C.D., 1972, A preliminary sketch of the San Joaquin Valley stratigraphic framework; in
Rennie, E.W., ed., Guidebook: Geology and Oil Fields of the West Side Central San
Joaquin Valley: AAPG, SEG, and SEPM Pacific Sections, p. 40-50.
Gautier, D.L. and Scheirer, A.H., 2003, Miocene total petroleum system – southeast stable shelf
assessment unit of the San Joaquin Basin Province: Assessment of Undiscovered Oil and Gas
Resources of the San Joaquin Basin Province of California: United States Geological Survey,
ch. 5, p 2-39. Gautier, D.L., Scheirer, H.A., Tennyson, M.E., Peters, K.E., Magoon P.E., L.E., Charpentier, R.R.,
Cook, T.A., French, C.T., Klett, T.R., Pollastro, R.M., and C.J. Schenk, 2003, Executive Summary—Assessment of Undiscovered Oil and Gas Resources of the San Joaquin Basin Province of California: U.S. Geological Survey Professional Paper 1713, v. 1713-01, p.1-2.
76
Gillespie, J., Auffant, A., Cobos, L. S., Mahan, A., Negrini, R., Steward, D., and Taylor, S.,
2008, Changing sediment sources in the Mio-Pliocene Etchegoin Formation on the
Western Bakersfield Arch and Elk Hills, California [Abstract]: AAPG Pacific Section
Search and Discovery Article 90076.
Hector, S.T., Johns, M., and Cunningham, B., 2008, The Randolph Oil Zone, Semitropic Field,
Kern County, California: A highly bioturbated, high-pressure, low-permeability reservoir
in the Lower Pliocene Etchegoin Formation [Abstract]: AAPG Pacific Section,
Bakersfield, California. Heteren, S.V., 2014, Barrier Systems; in Masselink, G. and Gehrels, R., eds, Coastal Environments and
Global Change: Jon Wiley and Sons, UK, p. 194-226.
Holzer, T.L., 1980, Faulting caused by groundwater level declines, San Joaquin Valley,
California: Water Resources Research, vol. 16, no. 6, p. 1065-1070.
Hori, K., Yoshiki, S, Quanhong, Z., Xinrong, C, Pinxian, W., Yoshio, S., and Congxian, L.,
2001, Sedimentary facies of the tide-dominated paleo-Changjiang (Yangtze) estuary
during the last transgression: Marine Geology, vol. 177, p. 3321-351.
Jennings, C.W. 2010, Geologic Map of California: California Geological Survey, Geologic Data
Map No. 2.
Jennings, C.W. and Bryant, W.A., 2010 Fault Activity Map of California: California Geological
Survey, Geologic Data Map No. 6.
Kitazawa, T., 2006, Pleistocene macrotidal tide-dominated estuary-delta succession, along the
Dong Nai River, southern Vietnam: Sedimentary Geology, vol. 194, p. 115-140.
Kodl, E.J., Eacmen, J.C., and Coburn, M.G., 1990, A geologic update of the emplacement
mechanism within the Kern River Formation at the Kern River Field: AAPG Structure,
Stratigraphy, and Hydrocarbon Occurrences of the San Joaquin Basin, California, p. 59-
71.
Krumbein, W.C., 1934, Size frequency distribution of sediments: Journal of Sedimentary
Petrology, v. 4, p. 65-77.
Lagoe, M.B., Tenison, J.A., and Buehring, R., 2009, Foraminifera and paleoenvironments in the
Etchegoin and Lower San Joaquin Formations, West-Central San Joaquin Valley,
California [Abstract]: AAPG-SEPM-SEG-SPWLA Pacific Section Annual meeting.
Link, M.H., Helmold, K.P., and Long, W.T., 1990, Depositional Environments and reservoir
characteristics of the Upper Miocene Etchegoin and Chanac Formations, Kern Front Oil
Field, California: Structure, Stratigraphy and Hydrocarbon Occurrences of the San
Joaquin Basin, California, AAPG, p. 73-96.
Loomis, K.B., 1989, Lithofacies and depositional environments of Etchegoin Group: Model for
Late Neogene sedimentation in Western San Joaquin Basin [Abstract]: AAPG Pacific
Section, 10-12 May 1989, Palm Springs, California.
Loomis, K.B., 1990, Depositional environments and sedimentary history of the Etchegoin
Group, West-Central San Joaquin Valley, California: AAPG Pacific Section Structure,
Stratigraphy, and Hydrocarbon Occurrences of the San Joaquin Basin, California.
McCubbin, D.G., 1982, Barrier-island and strand-plain facies, in: P. A. Scholle and D. Spearing,
eds., Sandstone Depositional Environments: AAPG Memoir 31, p. 247-279.
Nishikawa, T. and Ito, M., 2000, Late Pleistocene barrier-island development reconstructed from
genetic classification and timing of erosional surfaces, paleo-Tokyo Bay, Japan:
Sedimentary Geology, 137, p 25-42.
Obradovich, J.D., Naeser, C.W., and Izett, G.A., 1981, Geochronology bearing on the age of the

77
Monterey Formation and siliceous rocks in California, in: Scheirer, A.H. and Magoon, L.
B., 2003, Age, distribution, and stratigraphic relationship of rock units in the San Joaquin
Basin Province, California: Assessment of undiscovered oil and gas resources of the San
Joaquin Basin Province of California, USGS, ch. 5, p 2-39.
Perkins, J.A., 1987, Provenance of the Upper Miocene and Pliocene Etchegoin Formation:
Implications for paleogeography of the Late Miocene of Central California: Department
of the Interior U. S. Geological Survey Open-File Report 87-167.
Powers, M.C., 1953, A new roundness scale for sedimentary particles: Journal of Sedimentary
Research, vol. 23, no. 2, p. 117-119. Prothero, D.R., 2010, Magnetic stratigraphy of the Miocene-Pliocene Etchegoin Group, Western San
Joaquin Basin, California [Abstract]: AAPG Pacific Section Meeting, Anaheim, California, 27-19
May 2010 Reid, S.A., 1995, Miocene and Pliocene depositional systems of the southern San Joaquin basin
and formation of sandstone reservoirs in the Elk Hills area, California, in: Fritshce, A.E.
ed., Cenozoic paleogeography of the western United States – II: Pacific Section, SEPM,
book 75, p.131-150.
Saleeby, J., Ducea, M., and Clemens-Knott, D., 2003, Production and loss of high-density
batholithic root, southern Sierra Nevada, California: Tectonics, v. 22, p. 1064-1087, doi:
10.1029/2002TC001374.
Sarna-Wojcicki, A.M., Lajoie, K.R., Meyer, C.E., Adam, D.P., and Rieck, H.J., 1991,
Tephrochronology correlation of upper Neogene sediments along the Pacific margin,
conterminous United States, in Scheirer, A.H. and Magoon, L. B., 2003, Age,
distribution, and stratigraphic relationship of rock units in the San Joaquin Basin
Province, California: Assessment of undiscovered oil and gas resources of the San
Joaquin Basin Province of California, USGS, ch. 5, p 2-39.
Scheirer, A.H. and Magoon, L. B., 2003, Age, distribution, and stratigraphic relationship of rock
units in the San Joaquin Basin Province, California: Assessment of undiscovered oil and
gas resources of the San Joaquin Basin Province of California, USGS, ch. 5, p 2-39.
Selley, R.C., 1996, Ancient Sedimentary Environments: And Their Sub-surface Diagnosis,
London, Chapman and Hall, 300 p.
Steward, D.C., 1996, Sequence stratigraphy of a Pliocene delta complex deposited in an active
margin setting, Etchegoin and San Joaquin Gas Sands, San Joaquin Basin, California
[Abstract]: AAPG Convention and Exhibition 19-22 May 1996, San Diego, California.
Taylor, S.A., 2008, Geologic and petrophysical characterization of the basal Etchegoin
Formation: Elk Hills Field, San Joaquin Valley, California [Thesis]: California State
University, Bakersfield.
Tucker, K. and Thorne, J., 1998, Capturing the geology accurately in alternative reservoir
modeling processes – an example from the Etchegoin Reservoir at West Coalinga Field,
California [Abstract]: AAPG Pacific Section Search and Discovery.
Zandt, G., Gilbert, H., Owens, T.J., Ducea, M., Saleeby, J., and Jones, C.H., 2004, Active
foundering of a continental arc root beneath the southern Sierra Nevada in
California: Nature, v. 431, p. 41-46.