-market and industry trends - adpi · -market and industry trends chicago ... in 2008 the global...
TRANSCRIPT
3A Business Consulting3A Business Consulting97
Dairy and whey ingredients- market and industry trends
Chicago - April 27, 2010
Tage Affertsholt, 3A Business Consulting

3A Business Consulting3A Business Consulting98
Introduction
Dairy and whey ingredients –market overview
Dairy and whey ingredients –production/trade trends
Dairy and whey ingredients –industry trends & outlook
1
2
3
4
Agenda
3A Business Consulting3A Business Consulting99
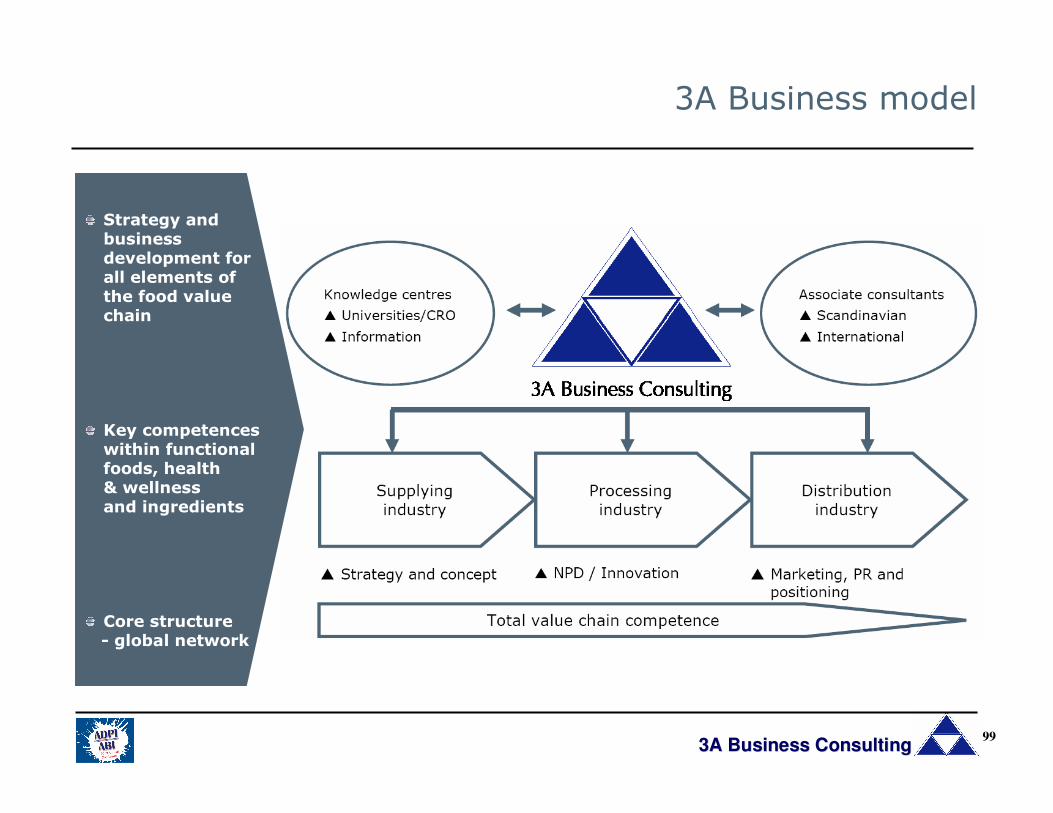
3A Business model
Strategy and businessdevelopment for all elements of the food value chain
Key competenceswithin functional foods, health& wellness and ingredients
Core structure - global network
3A Business Consulting3A Business Consulting100
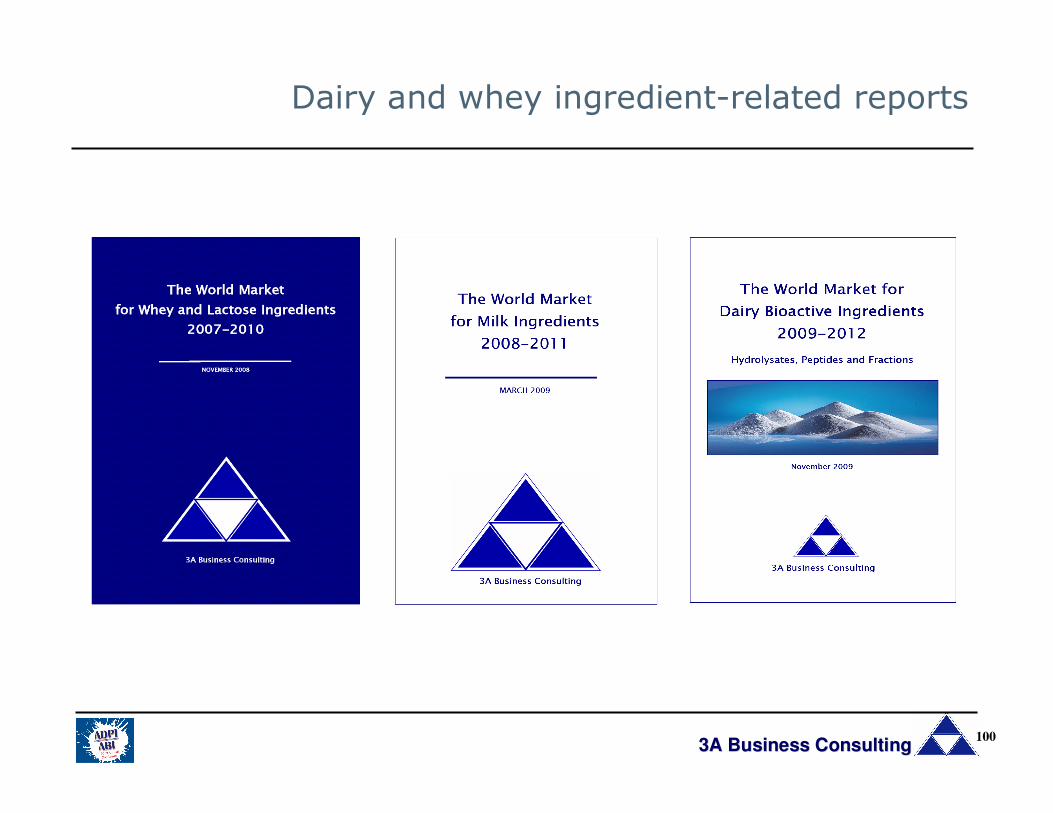
Dairy and whey ingredient-related reports

3A Business Consulting3A Business Consulting101
Dairy ingredient overview
Milk as raw
material
Whey as raw material
SMPWMPCaseinCaseinates
Micellar casein
WPDWPWPC35 Lactose Permeate
MPCMPI
WPC80WPI
Minerals Lactose-pharma
MPHPeptidesProtein fractions
WPH
PeptidesProtein fractionsPhospho-lipids Lactose derivatives
Added value level
Milk ingredients
Whey ingredients
Note: Cheese and butterfat as an ingredient is not included in respective 3A reports, although an important market
Applications
Pharma
Nutrition
Health care
Personal care
Food
Feed
CheeseCasein

3A Business Consulting3A Business Consulting102
Introduction
Dairy and whey ingredients –market overview
Dairy and whey ingredients –production/trade trends
Dairy and whey ingredients –industry trends & outlook
1
2
3
4
Agenda

3A Business Consulting3A Business Consulting103
Milk production vs. exports and imports 2008
86.3
44.1
35.9
25.8
16.7 14.511.6 11.6 11.1
8.4 7.3 6.1 5.93.1
0.2
13.0
0.2
0.9
0.0
0.1 4.
0
0.0 1.6
0.2
0.7
0.6
1.2
0.0 2.3
1.6
0.1
0.7
0.1
0.1 2.6
0.5
1.6
0.0
0.2
0.4
147.6
0.1
0.13.7
10.3
0
20
40
60
80
100
120
140
EUU
nite
d Sta
tes
Indi
a
Chi
na
Rus
siaN
ew Z
eala
nd
Brazi
l
Ukr
aine
Pakis
tan
Mex
ico
Austra
lia
Japa
nArg
entin
a
Can
ada
Switz
erla
nd
Qu
an
tity
in
Mil
lio
ns t
on
nes
Milk Production
Exports in Milk equivalent
Imports in Milk equivalent
Source: EU Commission

3A Business Consulting3A Business Consulting104
Imports of dairy products 2008
(in million tonnes of milk equivalent)
India
9
Mexico
2 578
China
2 317
Russia
1 623
Japan
1 576
United States
1 245Brazil
732Australia
546
Pakistan
91Ukraine
150
Canada
236
Switzerland
368
EU
566
Argentina
22
New Zealand
90
Source: EU Commission
3A Business Consulting3A Business Consulting105
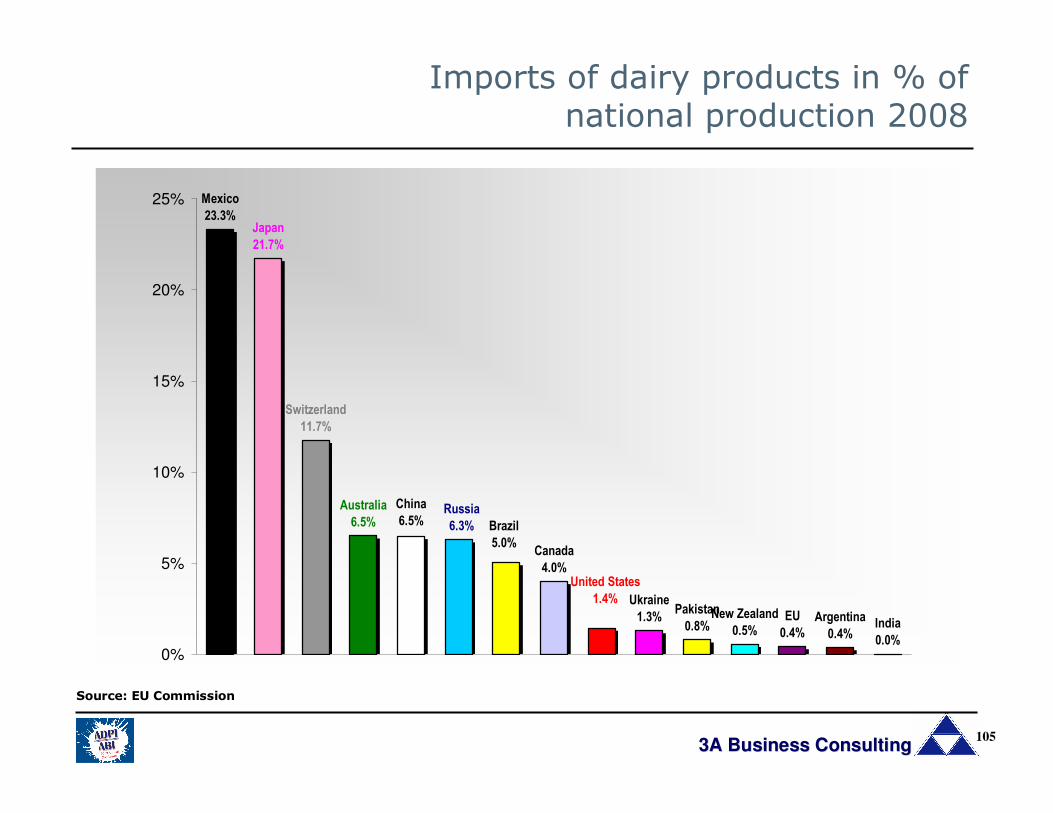
Imports of dairy products in % of national production 2008
EU
0.4%
Argentina
0.4%India
0.0%
Mexico
23.3%Japan
21.7%
Switzerland
11.7%
Australia
6.5%
China
6.5%Russia
6.3%
Canada
4.0%
New Zealand
0.5%
Pakistan
0.8%
Ukraine
1.3%
United States
1.4%
Brazil
5.0%
0%
5%
10%
15%
20%
25%
Source: EU Commission
3A Business Consulting3A Business Consulting106
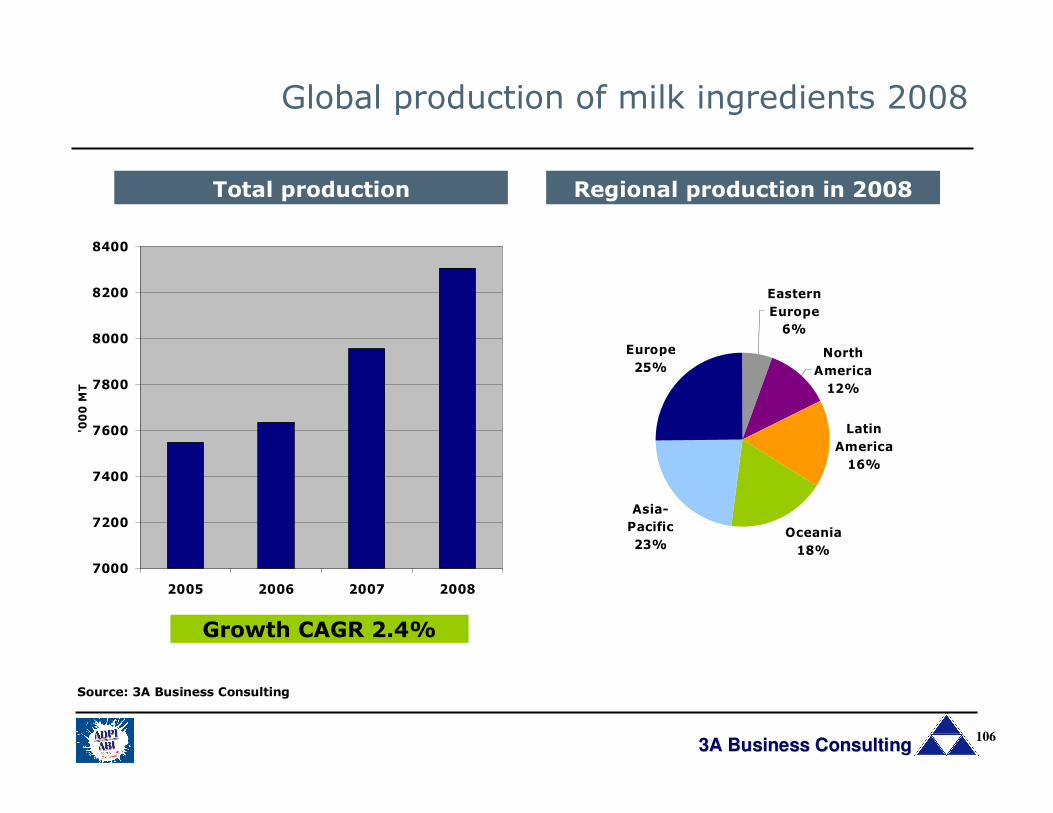
Global production of milk ingredients 2008
7000
7200
7400
7600
7800
8000
8200
8400
2005 2006 2007 2008
'000 MT
Europe
25%
Asia-
Pacific
23%Oceania
18%
Latin
America
16%
North
America
12%
Eastern
Europe
6%
Total production Regional production in 2008
Source: 3A Business Consulting
Growth CAGR 2.4%

3A Business Consulting3A Business Consulting107
Global production of milk ingredients 2008 - per main category
SMP
WMP
HighLow
Low
High
Growth
Volume Size of blue circles indicates market size
Casein/caseinate MPC/MPI
Other milk ingredients can be found, however volumes are
comparatively small
Total production volume approx.
8,300,000 MT
In 2008 the global milk ingredient market was worth roughly USD 19 bio
Between ’05-’08, market volume up 2-3% p.a. and market value up by 27%
Source: 3A Business Consulting

3A Business Consulting3A Business Consulting108
Global whey ingredients market 2008
Growth
Volume
HighLow
Low
High
Whey powder
WPC80
WPH
WPI
DWP
WPC35
Other protein ingredients can be found, however
volumes comparatively small
Size of blue circles indicates market size
The global whey protein market was worth roughly USD 3.8 bio in 2008
Between ’05-’08, market volume up 3% and market value up by 24%
Market volume of approx. Market volume of approx. Market volume of approx. Market volume of approx. 3,200,000 MT3,200,000 MT3,200,000 MT3,200,000 MT
3A Business Consulting3A Business Consulting109
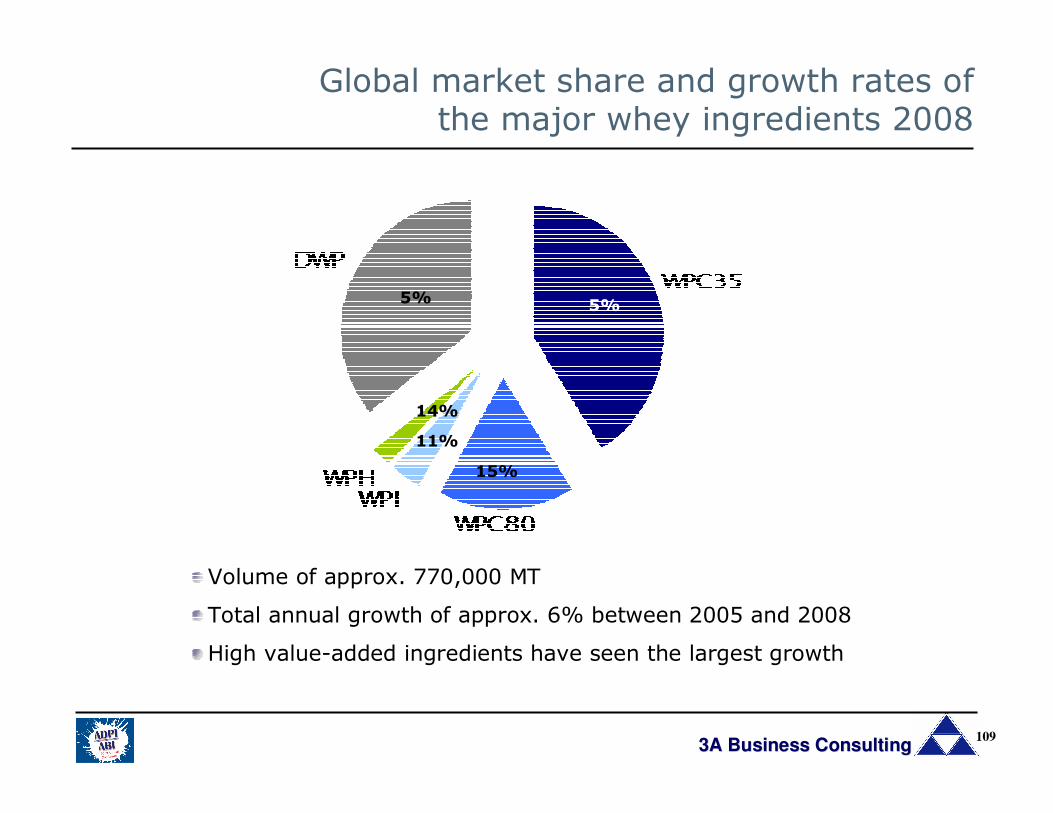
Global market share and growth rates of the major whey ingredients 2008
5%
11%
14%
15%
5%
Volume of approx. 770,000 MT
Total annual growth of approx. 6% between 2005 and 2008
High value-added ingredients have seen the largest growth
3A Business Consulting3A Business Consulting110
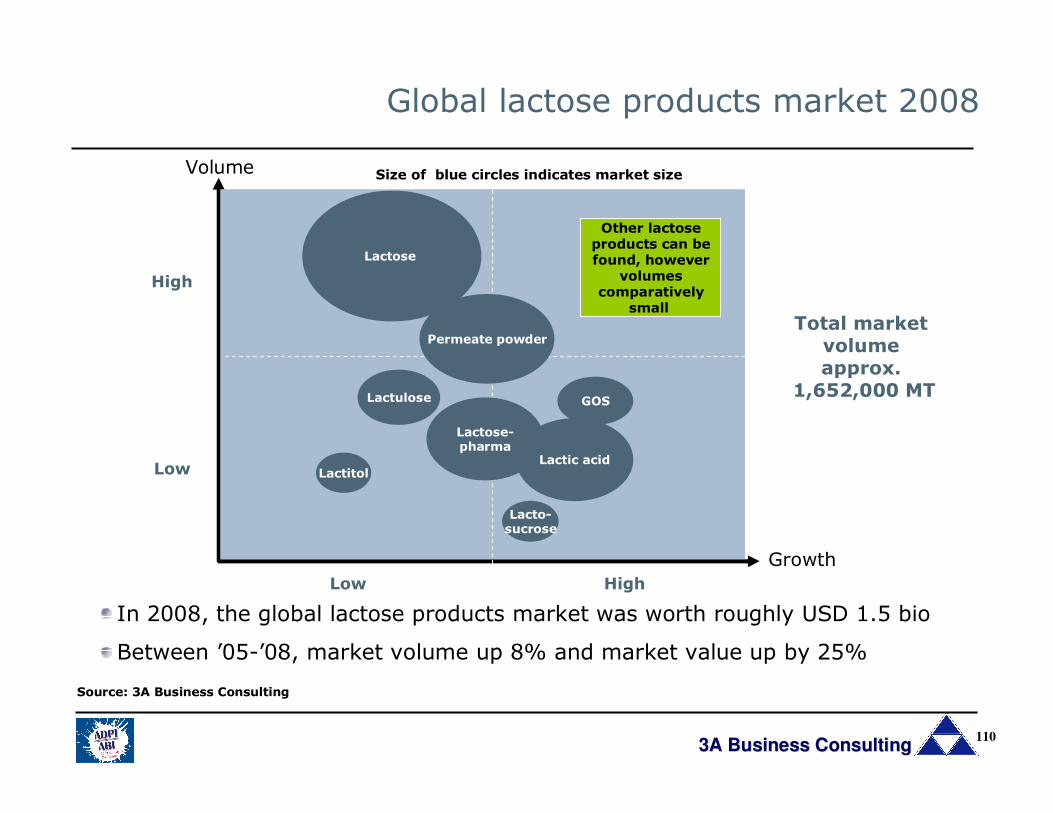
Global lactose products market 2008
Growth
HighLow
Volume
Low
High
Size of blue circles indicates market size
Lactose
Lactose-pharma
Permeate powder
Lactulose
Lactitol
GOS
Lacto-sucrose
Lactic acid
Other lactose products can be found, however
volumes comparatively
small
Total market volume approx.
1,652,000 MT
In 2008, the global lactose products market was worth roughly USD 1.5 bio
Between ’05-’08, market volume up 8% and market value up by 25%
Source: 3A Business Consulting
3A Business Consulting3A Business Consulting111
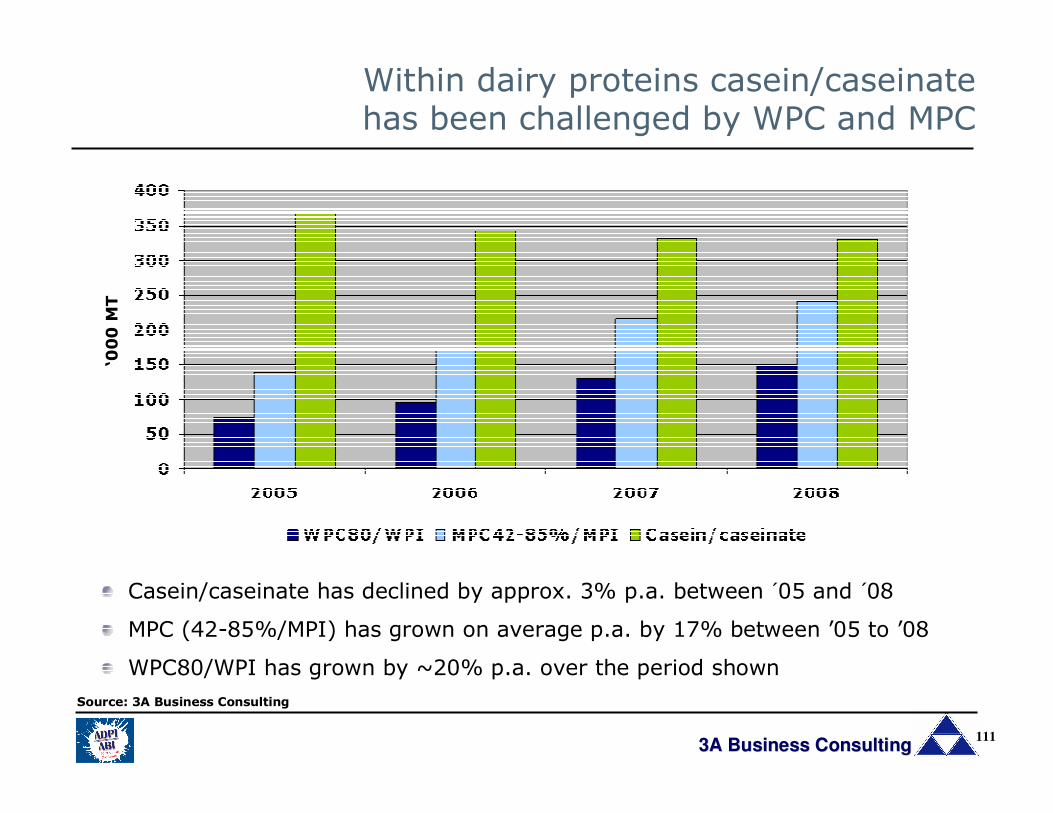
Within dairy proteins casein/caseinate has been challenged by WPC and MPC
Casein/caseinate has declined by approx. 3% p.a. between ´05 and ´08
MPC (42-85%/MPI) has grown on average p.a. by 17% between ’05 to ’08
WPC80/WPI has grown by ~20% p.a. over the period shown
Source: 3A Business Consulting
‘000 MT

3A Business Consulting3A Business Consulting112
Bioactives are an emerging dairy ingredient category
The global market for dairy bioactive ingredients is minor, even when compared to other high-end dairy ingredient volumes
Market volume is estimated to be approx. 33,000 MT and to be worth approximately USD 700 million in 2009
MPC80, MPI & casein/caseinates
Dairyprotein fractions
Dairy peptides
400,000 MT
WPC80& WPI
MPH& WPH
Est. growth rate 10-20% p.a.
3A Business Consulting3A Business Consulting113
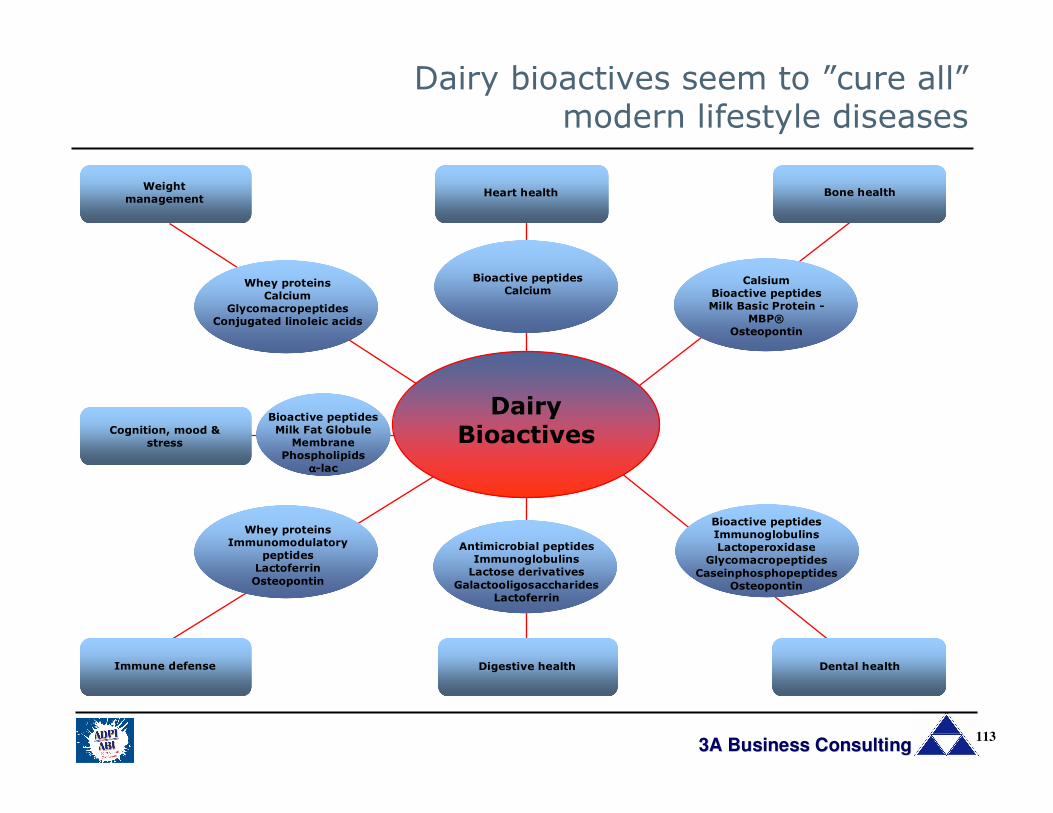
Dairy bioactives seem to ”cure all” modern lifestyle diseases
Dental healthDigestive healthImmune defense
Cognition, mood & stress
Bone healthHeart healthWeight
management
Whey proteins Immunomodulatory
peptidesLactoferrin
Osteopontin
Antimicrobial peptidesImmunoglobulins Lactose derivatives
Galactooligosaccharides Lactoferrin
Bioactive peptidesMilk Fat Globule
MembranePhospholipids
αααα-lac
Whey proteins Calcium
Glycomacropeptides Conjugated linoleic acids
Bioactive peptidesCalcium
Bioactive peptidesImmunoglobulins Lactoperoxidase
Glycomacropeptides
Caseinphosphopeptides Osteopontin
CalsiumBioactive peptidesMilk Basic Protein -
MBP®Osteopontin
DairyBioactives
3A Business Consulting3A Business Consulting114
Introduction
Dairy and whey ingredients –market overview
Dairy and whey ingredients –production/trade trends
Dairy and whey ingredients –industry trends & outlook
1
2
3
4
Agenda
3A Business Consulting3A Business Consulting115
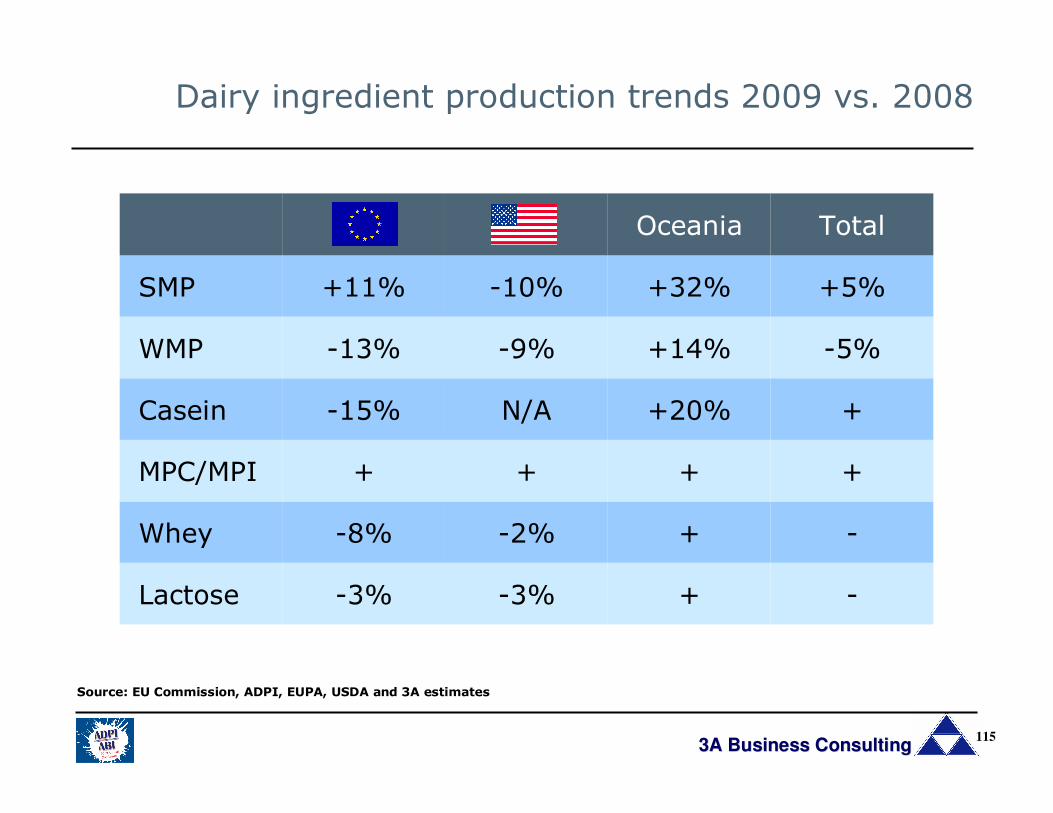
Dairy ingredient production trends 2009 vs. 2008
-+-3%-3%Lactose
-+-2%-8%Whey
++++MPC/MPI
++20%N/A-15%Casein
-5%+14%-9%-13%WMP
+5%+32%-10%+11%SMP
TotalOceaniaUSEU
Source: EU Commission, ADPI, EUPA, USDA and 3A estimates

3A Business Consulting3A Business Consulting116
-15%
-10%
-5%
0%
5%
10%
15%
EU US
EU total sales in 2009 were down 2% and stocks end 2009 down 28% vs. 2008
US total sales in 2009 were ±0 and stocks end 2009 down 29% vs. 2008
EU production trends in 2010: >+10% vs. 2009 end Feb
US production trends in 2010: +8% vs. 2009 end Feb
Whey ingredients production trends 2009 vs. 2008
WP WPC<50%
WPC80/WPI
LactoseAll wheyproducts

3A Business Consulting3A Business Consulting117
Dairy ingredients – export trends 2009
++14%+18%+27%Lactose
+++3%+19%Whey
+±0%N/A+MPC/MPI
++13%N/A+4%Casein
+6%+28%N/A-7%WMP
+12%+55%-36%+28%SMP
TotalOceaniaUSEU
Note: Oceania casein and lactose figures refer to NZSource: EU Commission, USDA and 3A estimates
3A Business Consulting3A Business Consulting118
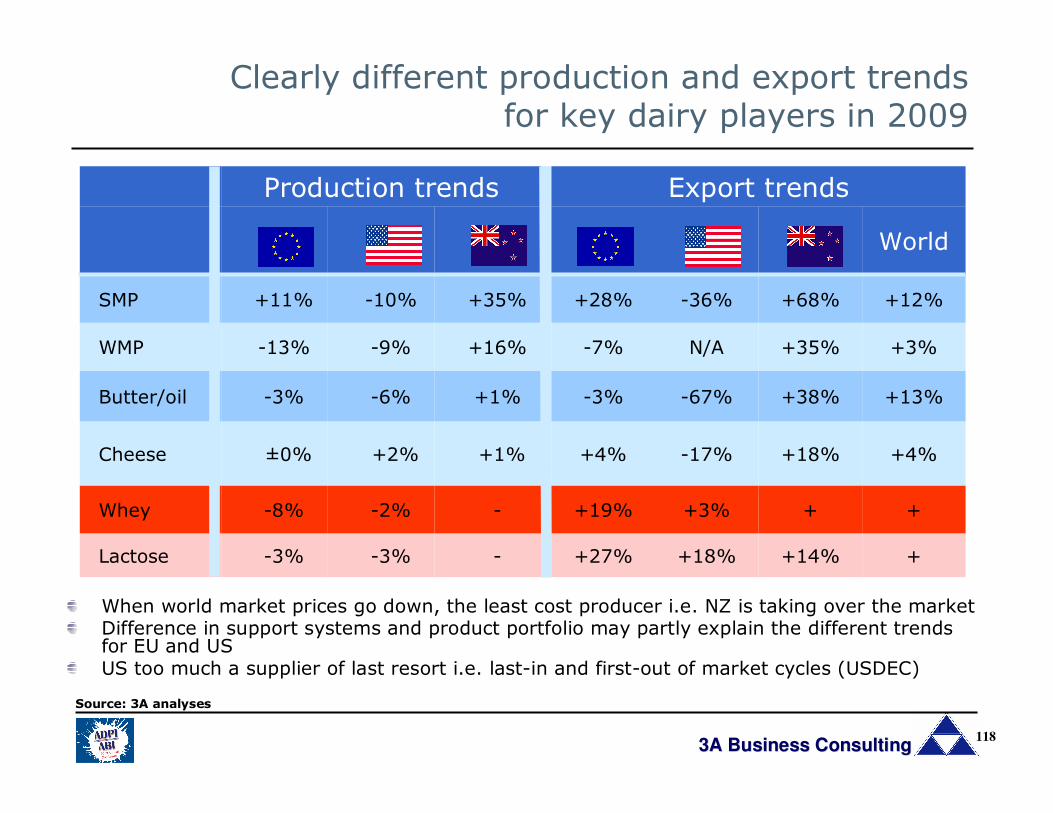
Clearly different production and export trends for key dairy players in 2009
When world market prices go down, the least cost producer i.e. NZ is taking over the marketDifference in support systems and product portfolio may partly explain the different trends for EU and USUS too much a supplier of last resort i.e. last-in and first-out of market cycles (USDEC)
+
+
+4%
+13%
+3%
+12%
World
-
-
+1%
+1%
+16%
+35%
NZ
-3%
-2%
+2%
-6%
-9%
-10%
US
-3%
-8%
±0%
-3%
-13%
+11%
EU
Production trends
Lactose
Whey
Cheese
Butter/oil
WMP
SMP
Export trends
+14%+18%+27%
++3%+19%
+18%-17%+4%
+38%-67%-3%
+35%N/A-7%
+68%-36%+28%
NZUSEU
Source: 3A analyses
3A Business Consulting3A Business Consulting119
Introduction
Dairy and whey ingredients –market overview
Dairy and whey ingredients –production/trade trends
Dairy and whey ingredients –industry trends & outlook
1
2
3
4
Agenda

3A Business Consulting3A Business Consulting120
Dairy and whey ingredient prices still fairly volatile
Note: Based on average US prices Source: Wisconsin University & 3A Business Consulting
The dramatic fluctuations between 2007 and 2009 resulted from supply/demand imbalances and boosted by economic recession
0
1 .000
2 .000
3 .000
4 .000
5 .000
6 .000
jan-
04
jul-04
jan-0
5
jul-05
jan-0
6
jul-06
jan-0
7
jul-07
jan-0
8
jul-08
jan-0
9
jul-09
jan-1
0
USD per MT
Lac tose SMP WP WPC 3 5
Price development 2004-10 – dairy and whey ingredients
3A Business Consulting3A Business Consulting121
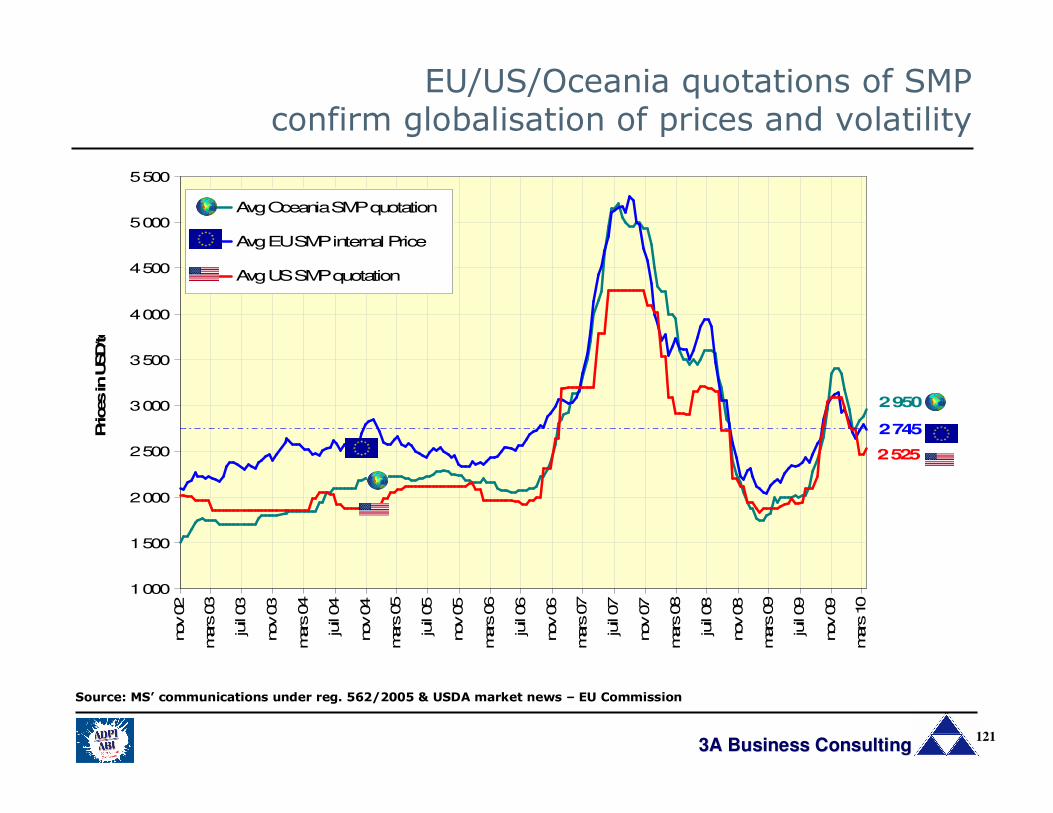
2 950
2 745
2 525
1 000
1 500
2 000
2 500
3 000
3 500
4 000
4 500
5 000
5 500nov 02
mars
03
juil 03
nov 03
mars
04
juil 04
nov 04
mars
05
juil 05
nov 05
mars
06
juil 06
nov 06
mars
07
juil 07
nov 07
mars
08
juil 08
nov 08
mars
09
juil 09
nov 09
mars
10
Prices in U
SD/tonne
Avg Oceania SMP quotation
Avg EU SMP internal Price
Avg US SMP quotation
Source: MS’ communications under reg. 562/2005 & USDA market news – EU Commission
EU/US/Oceania quotations of SMP confirm globalisation of prices and volatility
3A Business Consulting3A Business Consulting122
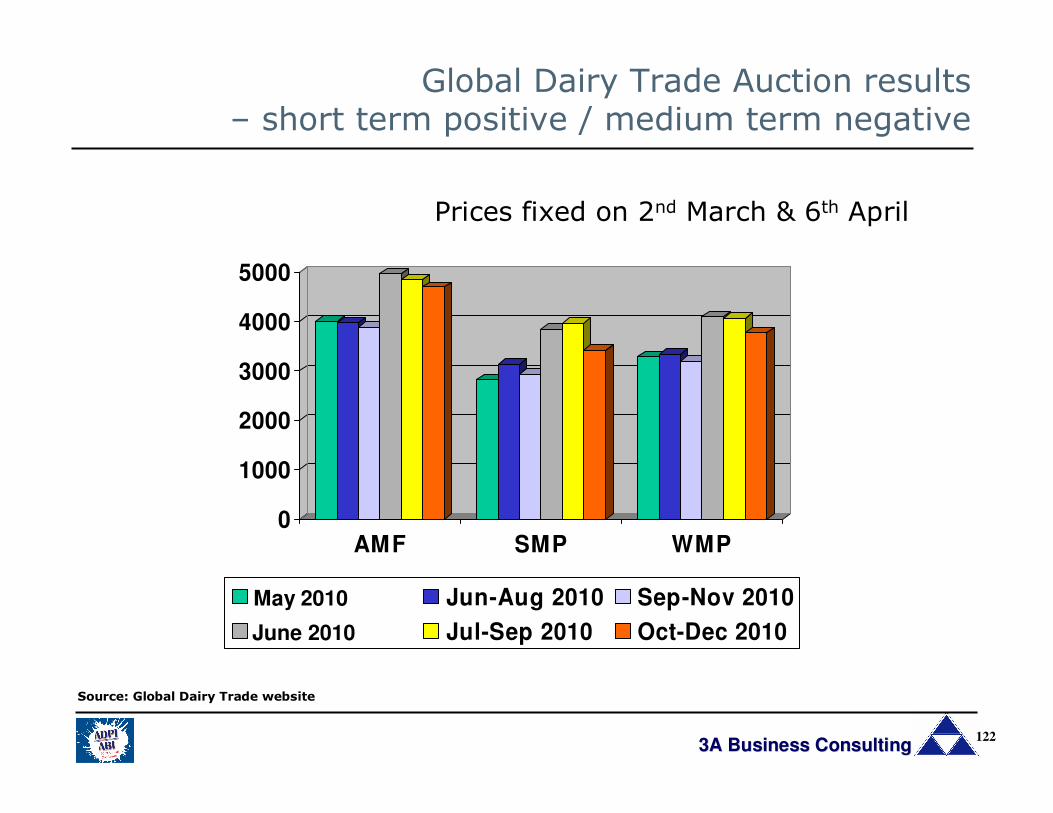
Prices fixed on 2nd March & 6th April
0
1000
2000
3000
4000
5000
AMF SMP WMP
maj-10 Jun-Aug 2010 Sep-Nov 2010
jun-10 Jul-Sep 2010 Oct-Dec 2010
Global Dairy Trade Auction results – short term positive / medium term negative
Source: Global Dairy Trade website
May 2010
June 2010
3A Business Consulting3A Business Consulting123
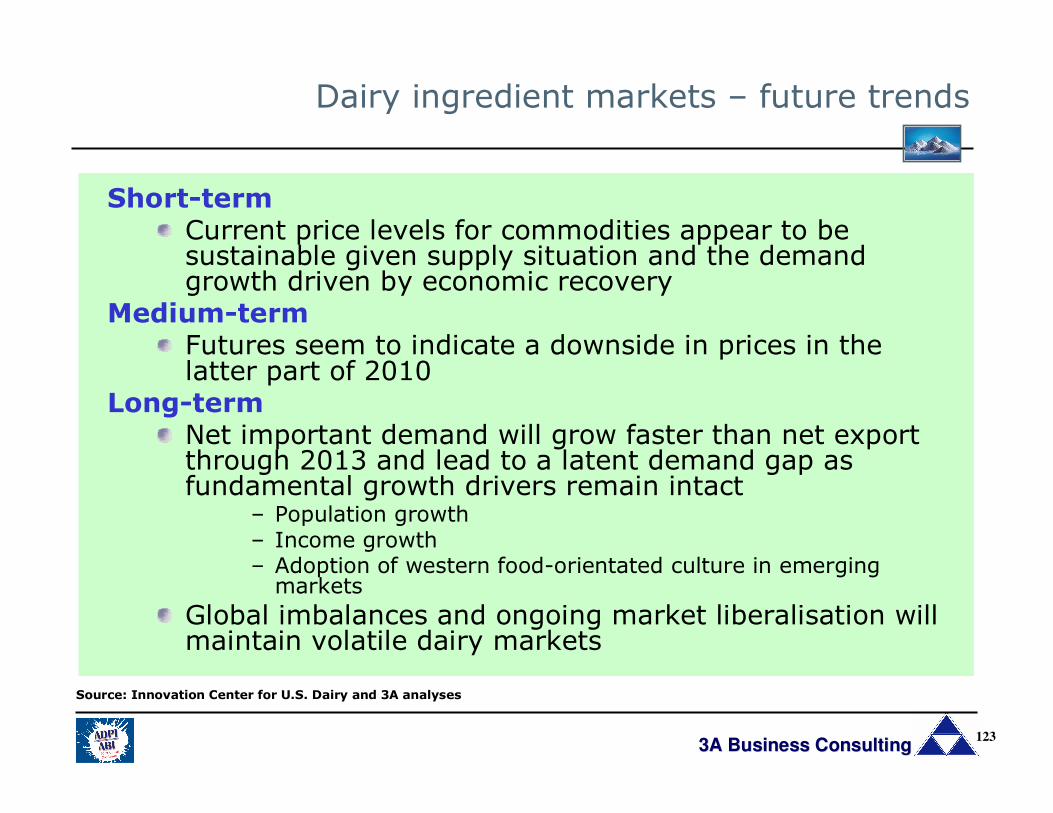
Dairy ingredient markets – future trends
Short-termCurrent price levels for commodities appear to besustainable given supply situation and the demandgrowth driven by economic recovery
Medium-termFutures seem to indicate a downside in prices in the latter part of 2010
Long-termNet important demand will grow faster than net exportthrough 2013 and lead to a latent demand gap as fundamental growth drivers remain intact
– Population growth– Income growth– Adoption of western food-orientated culture in emergingmarkets
Global imbalances and ongoing market liberalisation willmaintain volatile dairy markets
Source: Innovation Center for U.S. Dairy and 3A analyses

3A Business Consulting3A Business Consulting124
Asia-Pacific: No 1 market for dairy ingredients and willremain strongly import dependent
Latin America: Has potential to become a major supplier to the world market (particularly Brazil and Argentina)
Oceania: Production and export set to increase medium term
Eastern Europe: Russia to remain an important import market despite government incentives to increase production. Ukraine has the potential to play a bigger role on worldmarkets
US: Holds the potential for both a bigger production and a more significant role on the world market
EU: Still the world’s largest producer of dairy ingredients, however its relative importance in global markets to decrease– mostly for butter, SMP, WMP and less for cheese and whey
Dairy ingredient markets – future long-term trends
3A Business Consulting3A Business Consulting125
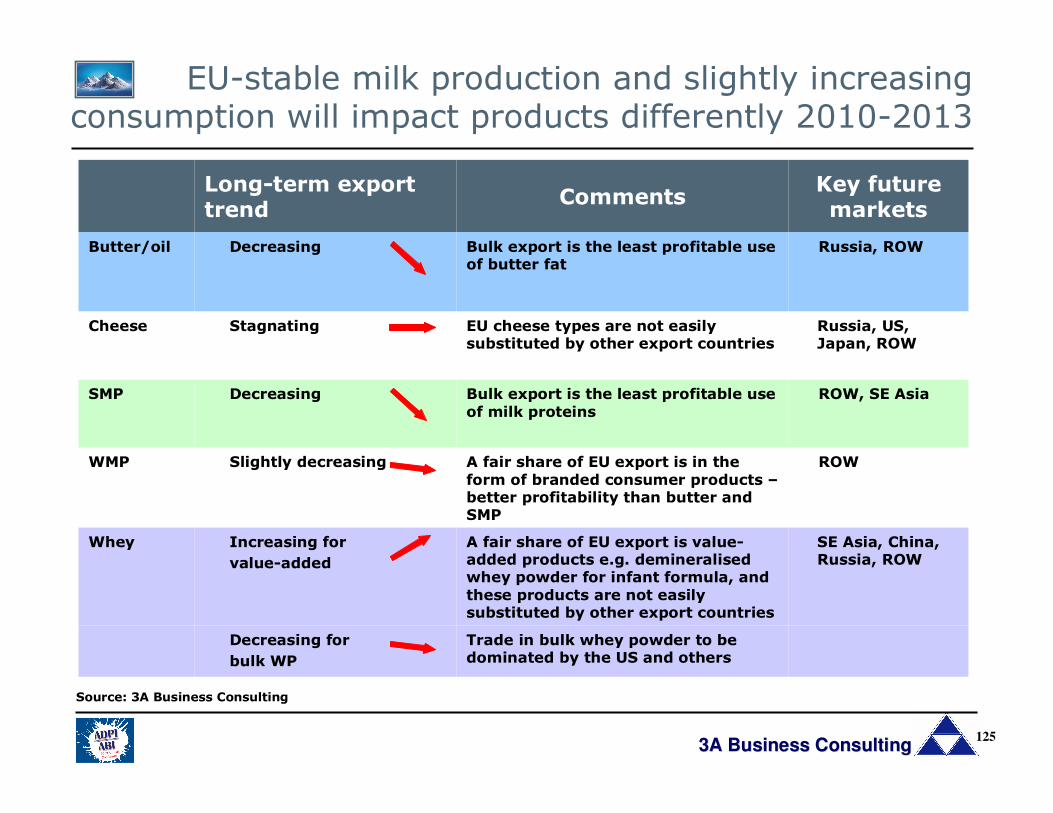
EU-stable milk production and slightly increasing consumption will impact products differently 2010-2013
Whey
WMP
SMP
Cheese
Butter/oil
Trade in bulk whey powder to bedominated by the US and others
A fair share of EU export is value-added products e.g. demineralisedwhey powder for infant formula, and
these products are not easilysubstituted by other export countries
A fair share of EU export is in the
form of branded consumer products –better profitability than butter and SMP
Bulk export is the least profitable use
of milk proteins
EU cheese types are not easilysubstituted by other export countries
Bulk export is the least profitable useof butter fat
Comments
SE Asia, China, Russia, ROW
Increasing for
value-added
Decreasing for
bulk WP
ROWSlightly decreasing
ROW, SE AsiaDecreasing
Russia, US, Japan, ROW
Stagnating
Russia, ROWDecreasing
Key future markets
Long-term exporttrend
Source: 3A Business Consulting
3A Business Consulting3A Business Consulting126
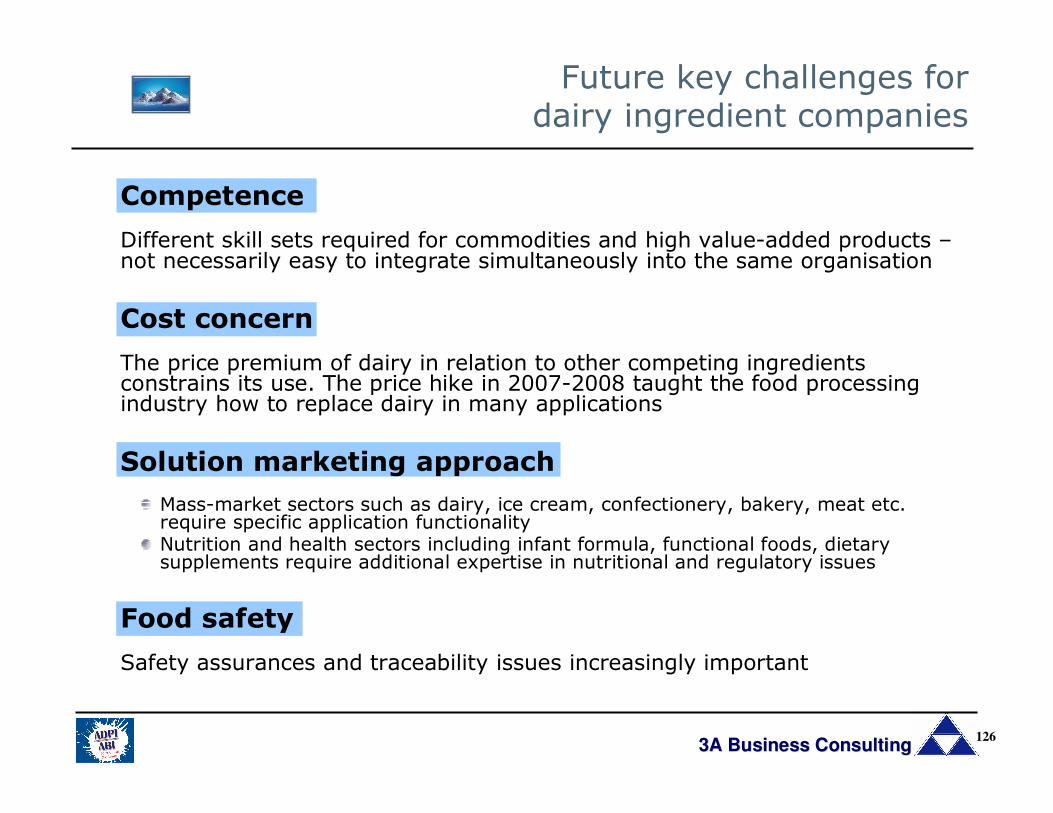
Future key challenges for dairy ingredient companies
Competence
Different skill sets required for commodities and high value-added products –not necessarily easy to integrate simultaneously into the same organisation
Cost concern
The price premium of dairy in relation to other competing ingredientsconstrains its use. The price hike in 2007-2008 taught the food processingindustry how to replace dairy in many applications
Solution marketing approach
Mass-market sectors such as dairy, ice cream, confectionery, bakery, meat etc. require specific application functionalityNutrition and health sectors including infant formula, functional foods, dietarysupplements require additional expertise in nutritional and regulatory issues
Food safety
Safety assurances and traceability issues increasingly important
