livrepository.liverpool.ac.uklivrepository.liverpool.ac.uk/3010827/1/echoes monograph v3.0.docx ·...
TRANSCRIPT

The Effectiveness, cost-effectiveness and acceptability of Community versus Hospital Eye
Service follow-up for patients with neovascular age-related macular degeneration with
quiescent disease: a virtual randomised balanced incomplete block trial (ECHoES)
Reeves BC1, Scott LJ1, Taylor J1, Hogg R2, Rogers CA1, Wordsworth S3, Townsend D4, Muldrew
A2, Peto T5, Violato M3, Dakin H3, Cappel-Porter H1, Mills N4, O’Reilly D6, Harding SP7
Chakravarthy U2
Affiliations:1 Clinical Trials and Evaluation Unit, School of Clinical Sciences, University of Bristol, Bristol, UK
2 Institute of Clinical Science, The Queen’s University of Belfast, Belfast, UK
3 Health Economics Research Centre, Nuffield Department of Population Health, University of
Oxford, Oxford, UK
4 School of Social and Community Medicine, University of Bristol, Bristol, UK
5 NIHR Biomedical Research Centre at Moorfields Eye Hospital NHS Foundation Trust and UCL
Institute of Ophthalmology, London, UK
6 School of Medicine, Dentistry and Biomedical Sciences, The Queen’s University of Belfast,
Belfast, UK
7 Department of Eye and Vision Science, Institute of Ageing and Chronic Disease, University of
Liverpool, Liverpool, UK
Declaration of competing interests
Scott, Taylor, Wordsworth, Townsend, Muldrew, Peto, Violato, Dakin, Cappel-Porter, Mills and
O’Reilly all confirm they have no conflicts of interest. Reeves reports receiving grants from the
NIHR HTA programme during the conduct of the study; NIHR grants (paying for his time through
his academic employer) for various ophthalmological studies including ones investigating wet age-
related macular degeneration; personal fees from Janssen-Cilag outside the submitted work; and
membership of HTA Commissioning Board and Systematic Reviews Programme Advisory Group.
In particular, he is a co-investigator on the NIHR-funded IVAN trial (ISRCTN92166560) and
continuing follow-up of the IVAN trial cohort. Hogg reports she received grants and personal fees

from Novartis, outside the submitted work. Rogers reports she received a fee from Novartis for a
lecture unrelated to this work. Harding reports grants from the National Institute for Health
Research during the conduct of the study. Chakravarthy reports membership of HTA IPP Panel.
Contact details for corresponding author
Usha Chakravarthy, Centre for Experimental Medicine, Queen’s University of Belfast, Institute of
Clinical Science, Grosvenor Road, Belfast BT12 6BA. Email [email protected].
Key words
Neovascular age-related macular degeneration
Treatment decision-making
Optometrist
Ophthalmologist
Cross-over trial
Reactivated lesion
Quiescent lesion
Reference standard
Sensitivity
Specificity
Vignette
Hospital eye service
Community follow-up
Colour fundus photography
Optical coherence tomography

Abstract
The Effectiveness, cost-effectiveness and acceptability of Community versus Hospital Eye
Service follow-up for patients with neovascular age-related macular degeneration with
quiescent disease: a virtual randomised balanced incomplete block trial (ECHoES)
Reeves BC, Scott LJ, Taylor J, Hogg R, Rogers CA, Wordsworth A, Townsend D, Muldrew A,
Peto T, Violato M, Dakin H, Cappel-Porter H, Mills N, O’Reilly D, Harding SP, Chakravarthy U.
Background
Patients with neovascular age-related macular degeneration (nAMD) usually attend regular
reviews, even when the disease is quiescent. Reviews are burdensome to health services, patients
and carers.
Objectives
To compare the proportion of correct lesion classifications made by community-based optometrists
and ophthalmologists from vignettes of patients; to estimate the cost-effectiveness of community
follow-up by optometrists compared to follow-up by ophthalmologists in the Hospital Eye Service
(HES); to ascertain views of patients, their representatives, optometrists, ophthalmologists and
clinical commissioners on the proposed shared care model.
Design
Community-based optometrists and ophthalmologists in the HES classified lesions from vignettes
comprising clinical information, colour fundus (CF) and optical coherence tomography (OCT)
images. Participants’ classifications were validated against experts’ classifications (reference
standard).
Setting
Internet-based application.
Participants
Ophthalmologists had to have: ≥3 years’ post-registration experience in ophthalmology; part 1 of
the Royal College of Ophthalmologists, Diploma in Ophthalmology or equivalent; experience in

the AMD service. Optometrists had to be: fully qualified; registered with the General Optical
Council for ≥3 years; not participating in nAMD shared care.
Interventions
The trial sought to emulate a conventional trial, comparing optometrists’ and ophthalmologists’
decision-making but vignettes, not patients, were assessed. Therefore, there were no interventions.
Participants received training prior to assessing vignettes.
Main outcome measures
Primary outcome: correct classification of the activity status of a lesion based on a vignette,
compared to a reference standard. Secondary outcomes: frequencies of potentially sight threatening
errors; participants’ judgements about specific lesion components; participant-rated confidence in
their decisions; cost-effectiveness of follow-up by community-based optometrists compared to
HES ophthalmologists.
Results
155 participants registered for the trial; 96 (48 in each professional group) completed training and
main assessments and formed the analysis population. Optometrists and ophthalmologists achieved
1702/2016 (84.4%) and 1722/2016 (85.4%) correct classifications, respectively (odds ratio [OR]
0.91, 95% confidence interval [CI] 0.66-1.25, p=0.543). Optometrists’ decision-making was non-
inferior to ophthalmologists’ with respect to the pre-specified limit of 10% absolute difference
(0.298 on the odds scale). Frequencies of sight-threatening errors were similar for optometrists and
ophthalmologists (57/994 (5.7%) versus 62/994 (6.2%), OR 0.93, 95% CI 0.55-1.57, p=0.789).
Ophthalmologists assessed lesion components as present less often than optometrists and were
more confident about their lesion classifications than optometrists. The mean care pathway cost for
assessment was very similar by group, namely £397.33 for ophthalmologists and £410.78 for
optometrists. The optometrist led monitoring reviews were slightly more costly and less effective
than ophthalmologist led reviews, although the differences were extremely small. There was
consensus that optometrist-led monitoring has the potential to reduce clinical workload and be
more patient-centred. However, potential barriers are: ophthalmologists’ perceptions of
optometrists’ competence; the need for clinical training; the ability of the professions to work
collaboratively; the financial feasibility of shared care for Clinical Commissioning Groups.

Conclusions
The ability of optometrists to make nAMD retreatment decisions from vignettes is non-inferior to
that of ophthalmologists. Various barriers to implementing shared cared for nAMD were identified.
Study registration
ISRCTN07479761
Funding
The National Institute for Health Research Health Technology Assessment programme.
Abstract word count: 494

Contents
List of tables....................................................................................................................................................................
List of figures....................................................................................................................................................................
List of abbreviations...........................................................................................................................................................
Scientific summary..........................................................................................................................................................
Plain English Summary...................................................................................................................................................
1. Introduction..................................................................................................................................................................
1.1 Background......................................................................................................................................1
1.2 Existing evidence.............................................................................................................................2
1.3 Relevance to the NHS/ health policy................................................................................................3
1.4 Aims and objectives.........................................................................................................................4
2. Methods........................................................................................................................................................................
2.1 Study design.....................................................................................................................................5
2.2 Vignettes..........................................................................................................................................6
2.3 Participants.......................................................................................................................................6
2.3.1 Recruitment.................................................................................................................................................
2.3.2 Eligibility criteria.........................................................................................................................................
2.3.3 Training participants....................................................................................................................................
2.4 Reference standard...........................................................................................................................9
2.5 Outcomes.......................................................................................................................................10
2.5.1 Primary outcome........................................................................................................................................
2.5.2 Secondary outcomes..................................................................................................................................
2.5.3 Adverse events...........................................................................................................................................
2.5.4 Implementation/ management/ data collection..........................................................................................
2.6 Sample size....................................................................................................................................12
6

2.7 Statistical methods.........................................................................................................................13
2.7.1 Group comparisons....................................................................................................................................
2.7.2 Non-inferiority limit..................................................................................................................................
2.7.3 Sensitivity analysis....................................................................................................................................
2.7.4 Post-hoc analysis.......................................................................................................................................
2.7.5 Missing data...............................................................................................................................................
2.7.6 Statistical significance...............................................................................................................................
2.8 Changes since commencement of study.........................................................................................15
2.9 Health economics...........................................................................................................................16
2.9.1 Aims and research questions.....................................................................................................................
2.9.2 Analysis Perspective..................................................................................................................................
2.9.3 Economic evaluation methods...................................................................................................................
2.9.4 Care cost pathway decision tree................................................................................................................
2.9.5 Budget impact............................................................................................................................................
2.10 Qualitative research........................................................................................................................24
2.10.1 Recruitment...............................................................................................................................................
2.10.2 Sampling....................................................................................................................................................
2.10.3 Data collection...........................................................................................................................................
2.10.4 Data analysis..............................................................................................................................................
2.10.5 ECHoES participants’ perspectives of training and shared care...............................................................
3. Results: classification of lesion and lesion components (objectives 1 to 3)..............................................................
3.1 Registered participants...................................................................................................................28
3.2 Recruitment....................................................................................................................................28
3.3 Withdrawals...................................................................................................................................30
3.4 Numbers analysed..........................................................................................................................30
3.5 Reference standard classifications..................................................................................................30
7

3.6 Participant characteristics...............................................................................................................30
3.7 Primary outcome............................................................................................................................31
3.8 Secondary outcomes.......................................................................................................................34
3.8.1 Serious sight threatening errors.................................................................................................................
3.8.2 Lesion components....................................................................................................................................
3.8.3 Confidence ratings.....................................................................................................................................
3.9 Key vignette information...............................................................................................................39
3.10 Sensitivity analysis.........................................................................................................................40
3.11 Additional (post-hoc) analyses.......................................................................................................41
3.11.1 Vignette classifications compared to referral recommendations...............................................................
3.11.2 Duration of vignette assessment................................................................................................................
3.11.3 Expert classifications for derivation of the reference standard.................................................................
3.11.4 Comparing lesion component classifications across experts.....................................................................
3.12 Participants views on ECHoES training.........................................................................................48
4. Results: health economics (objective 4)....................................................................................................................
4.1 Resource use and unit costs............................................................................................................51
4.2 Cost-effectiveness of monitoring by optometrists compared to ophthalmologists.........................60
4.3 Sensitivity analyses........................................................................................................................65
4.4 Budget impact................................................................................................................................67
5. Results: views of patients and health professionals about the shared care model (objective 5)................................
5.1 Participants in focus groups and interviews...................................................................................71
5.1.1 Health professionals..................................................................................................................................
5.1.2 Service users..............................................................................................................................................
5.2 Results of focus groups and interviews..........................................................................................74
5.2.1 Current clinic capacity: Pushed to the limit...............................................................................................
5.2.2 Potential for a more patient-centred model...............................................................................................
8

5.2.3 Perceptions of optometrists’ competency..................................................................................................
5.2.4 (Lack of) communication between optometrists and ophthalmologists....................................................
5.2.5 The cost of shared care..............................................................................................................................
5.2.6 The importance of specialist training........................................................................................................
5.3 Trial participants’ opinions on shared care.....................................................................................84
6. Discussion..................................................................................................................................................................
6.1 Main findings: study conduct.........................................................................................................86
6.1.1 Recruitment...............................................................................................................................................
6.1.2 Images used to create vignettes and constraints on viewing images.........................................................
6.1.3 Reference standard....................................................................................................................................
6.2 Main findings: study results...........................................................................................................89
6.2.1 Classification of lesion activation status and lesion components..............................................................
6.2.2 Health economics......................................................................................................................................
6.2.3 Views of patients and health professionals about the shared care model..................................................
6.3 Participant and public involvement................................................................................................96
6.4 Strengths and limitations................................................................................................................96
6.4.1 Classification of lesion activation status and lesion components..............................................................
6.4.2 Health economics......................................................................................................................................
6.4.3 Views of patients and health professionals about the shared care model..................................................
6.5 Lessons for the future...................................................................................................................101
6.5.1 Lessons for a future shared care approach to the management of nAMD...............................................
6.5.2 Lessons for a future economic evaluation alongside a virtual trial.........................................................
6.5.3 Lessons for qualitative research alongside a virtual trial........................................................................
6.6 Future research.............................................................................................................................102
7. Conclusion...............................................................................................................................................................
Acknowledgements.........................................................................................................................................................
9

Contribution of authors...................................................................................................................................................
References.......................................................................................................................................................................
Appendix 1 ECHoES Trial Steering committee.............................................................................................................
Appendix 2 Screenshots from the web application.........................................................................................................
Appendix 3 Additional figures........................................................................................................................................
Appendix 4 Additional health economics evaluation information..................................................................................
Appendix 5 Statistical analysis plan................................................................................................................................
10

List of tables
Table 1 Research question components tested in the ECHoES trial compared to the hypothetical parallel
group trial that it aimed to emulate....................................................................................................5
Table 2 Framework for reference classifications..........................................................................................10
Table 3 Definition of primary outcome........................................................................................................11
Table 4 Summary of methods used in the economic evaluation..................................................................17
Table 5 Characteristics of participants..........................................................................................................31
Table 6 Correct lesion classification (primary outcome), sensitivity and specificity...................................31
Table 7 Participants’ lesion classifications compared to the reference standard..........................................33
Table 8 Sight threatening and non sight threatening serious errors..............................................................35
Table 9 Identification of lesion components by professional group a...........................................................36
Table 10 Confidence in classification of activity status of lesions by professional group.............................38
Table 11 Referral recommendation by lesion classification decision............................................................41
Table 12 Reference standard compared to initial expert classification..........................................................45
Table 13 Lesion component classifications of individual experts..................................................................46
Table 14 Comparison of lesion component classifications across experts.....................................................47
Table 15 Participants opinions on ECHoES training.....................................................................................49
Table 16 Optometrist capital (equipment and building) resources.................................................................51
Table 17 Staff performing each task and average duration of each task........................................................53
Table 18 Time spent by optometrists on revisiting webinars and consulting other resources.......................54
Table 19 Time spent by ophthalmologists on revisiting webinars and consulting other resources................55
Table 20 ECHoES unit costs (2013/2014 prices unless otherwise stated).....................................................55
Table 21 Salaries of staff employed in optometrist practices.........................................................................59
Table 22 Cost of a monitoring review performed by community optometrists.............................................59
Table 23 Care pathways costs – base case analysis........................................................................................60
Table 24 Base case analysis of cost-effectiveness of monitoring review performed by optometrists versus
cost of a monitoring review performed by ophthalmologists..........................................................63
Table 25 Data inputs for budget impact calculations.....................................................................................67
Table 26 Results of budget impact calculations.............................................................................................69
Table 27 Health professional participants' background..................................................................................71
Table 28 Service user participants' demographic and health related details..................................................73
Table 29 Components of a typical monitoring review and skills required...................................................136
11

Table 30 Resource use and costs of training................................................................................................137
Table 31 Care cost pathways for sensitivity analysis 1................................................................................138
Table 32 Impact on cost-effectiveness of sensitivity analysis 1...................................................................139
Table 33 Care cost pathways for sensitivity analysis 2................................................................................141
Table 34 Impact on cost-effectiveness of sensitivity analysis 2...................................................................142
Table 35 Care cost pathways for sensitivity analysis 3................................................................................144
Table 36 Impact on cost-effectiveness of sensitivity analysis 3...................................................................145
Table 37 Care cost pathways for sensitivity analysis 4................................................................................147
Table 38 Impact on cost-effectiveness of sensitivity analysis 4...................................................................148
12

List of figures
Figure 1 Decision tree for hospital ophthalmologist review..........................................................................21
Figure 2 Decision tree for community optometrist review............................................................................22
Figure 3 Flow of participants.........................................................................................................................29
Figure 4 Comparison between optometrists and ophthalmologists for the primary outcome.......................32
Figure 5 Participants’ lesion classifications for vignettes classified as reactivated or quiescent by the
reference standard............................................................................................................................34
Figure 6 Lesion components..........................................................................................................................37
Figure 7 Influence of key vignette information.............................................................................................40
Figure 8 Duration of vignette assessment......................................................................................................43
Figure 9 Correct responses by vignette assessment duration.........................................................................44
Figure 10 Optometrists versus Ophthalmologists Cost-Effectiveness Plane...................................................64
Figure 11 Cost-effectiveness acceptability curve............................................................................................65
Figure 12 Information collected from ophthalmologists on registration.......................................................111
Figure 13 Information collected from optometrists on registration...............................................................112
Figure 14 Participant data collected from ophthalmologists..........................................................................113
Figure 15 Participant data collected from optometrists.................................................................................114
Figure 16 Example of an ECHoES vignette..................................................................................................115
Figure 17 Vignette assessment questions.......................................................................................................116
Figure 18 Example of a web application validation message to the assessor................................................117
Figure 19 Ophthalmologist years of experience against number of correct responses..................................118
Figure 20 Comparison of participant scores for each set of vignettes...........................................................119
Figure 21 Cost effectiveness plane for sensitivity analysis 1 (inner ellipse: 81%; outer ellipse: 95%)........140
Figure 22 Cost-effectiveness acceptability curve for sensitivity analysis 1..................................................140
Figure 23 Cost effectiveness plane for sensitivity analysis 2 (inner ellipse: 84%; outer ellipse: 95%)........143
Figure 24 Cost-effectiveness acceptability curve sensitivity analysis 2........................................................143
Figure 25 Cost effectiveness plane for sensitivity analysis 3 (inner ellipse: 50%; outer ellipse: 95%)........145
Figure 26 Cost-effectiveness acceptability curve for sensitivity analysis 3..................................................146
Figure 27 Cost effectiveness plane for sensitivity analysis 4 (inner ellipse 50%; outer ellipse: 95%)..........149
Figure 28 Cost-effectiveness acceptability curve for sensitivity analysis 4..................................................149
13

List of abbreviations
Acrony
mDetails
AMD Age-related macular degeneration
BCVA Best corrected visual acuity
CCG Clinical commissioning group
CEAC Cost-effectiveness acceptability curve
CF Colour fundus
CI Confidence interval
CTEU Clinical trials and evaluation unit
DRT Diffuse retinal thickening
ETDRS Early Treatment of Diabetic Retinopathy Study
GOC General optical council
GOS General optical service
GP General practitioner
HES Hospital eye service
HTA Health technology assessment
ICER Incremental cost effectiveness ratio
IQR Inter-quartile range
IRC Intra-retinal cysts
IRR Incidence rate ratio
IT Information technology
IVANA randomised controlled trial to assess the effectiveness and cost-effectiveness of alternative treatments to Inhibit VEGF in Age-related choroidal Neovascularisation
nAMD Neovascular age-related macular degeneration
NHS National health service
NIHR National institute for health research
OCT Optical coherence tomography
OR Odds ratio
PED Pigment epithelial detachment
PPI Patient and public involvement
14

PRN Pro re nata
RAP Retinal angiomatous proliferation
SAP Statistical analysis plan
SD Standard deviation
SRF Sub-retinal fluid
TSC Trial steering committee
VAT Value added tax
VEGF Vascular endothelial growth factor
15

Scientific summary
Introduction
Neovascular age-related macular degeneration (nAMD) causes severe sight loss and blindness. Anti-VEGF
drugs (that inhibit vascular endothelial growth factor) are used to treat nAMD until the lesion becomes quiescent;
patients are subsequently monitored for lesion reactivation at regular (usually monthly) Hospital Eye Service
(HES) appointments. Regular review, often without treatment, uses clinic space and other resources and is
burdensome to patients and carers. If community-based optometrists were able to monitor lesion reactivation
with similar accuracy to ophthalmologists in the HES, there would be a strong case for devolving monitoring of
patients with quiescent disease to community optometrists. Community optometrists have the necessary training
to recognise nAMD but would need training to acquire and interpret optical coherence tomography (OCT)
images to decide whether lesions have reactivated. Advantages of devolving monitoring to community
optometrists could include freeing-up HES clinic capacity and less travel time for patients.
Objectives
The study had five objectives:
I. To compare the proportion of ophthalmologists’ and optometrists’ lesion classifications scored as ‘correct’
compared to the reference standard.
II. To estimate the agreement, and nature of disagreements, between lesion classifications, and lesion
components identified, by optometrists and ophthalmologists.
III. To estimate the influence of vignette clinical and demographic information on lesion classifications.
IV. To estimate the cost-effectiveness of monitoring patients with quiescent lesions in the community by
optometrists compared to ophthalmologists in the HES.
V. To ascertain the views of patients, their representatives, optometrists, ophthalmologists and clinical
commissioners on the proposed shared care model.
Methods
Study design
Vignettes were created summarising information about participants in a previous study with eyes affected by
nAMD. Vignettes described eyes twice in the course of treatment, once when the disease was inactive (baseline)
and subsequently (index) when the disease was inactive or active. Vignettes included demographic details of
patients, a summary of their nAMD history, clinical information, colour fundus (CF) and OCT images.
16
Ophthalmologists in the HES and optometrists in the community classified index lesions as ‘reactivated’,
‘suspicious’ or ‘quiescent.’ Their classifications were scored as correct or not against a reference standard. A
total of 288 vignettes were created; each participant assessed 42 vignettes, each vignette being assessed seven
times within each professional group in a randomised balanced incomplete block design. Participants had to
attend two webinar training sessions (each lasting approximately one hour) and correctly classify the lesion
status of at least 75% of 24 training vignettes before they could enter the main phase of the trial.
Settings and participants
We recruited ophthalmologists and optometrists working in the UK, through information circulated to members
of the UK and Welsh medical retina groups and through optometry journals and forums. Ophthalmologists had
to have 3 years post-registration experience in ophthalmology, have passed part 1 of the Royal College of
Ophthalmologists or the Diploma in Ophthalmology or equivalent, and have experience within the AMD service.
Optometrists had to be fully qualified, registered with the General Optical Council (GOC) for ≥3 years, and not
be participating in any AMD shared care scheme.
Interventions
The trial sought to emulate a conventional trial, comparing optometrists’ and ophthalmologists’ decision-making
but vignettes, not patients, were assessed. Therefore, there were no interventions. Participants received training
before assessing vignettes.
Reference standard
Three medical retina experts independently assessed all 288 vignettes, scoring lesion components and classifying
the activity status of the index images in the same way as participants. Rules for classifying a lesion as
reactivated or quiescent from the assessment of lesion components were pre-specified. The experts collectively
reviewed the subset of vignettes for which their classifications disagreed and reached consensus. This consensus
classification (‘reactivated’, ‘suspicious’ or ‘quiescent’ lesion) formed the reference standard to determine which
of the participants’ lesion classifications were ‘correct.’
Outcomes
The primary outcome was correct classification of the lesion status in a vignette by a participant, based on
assessing the index images in a vignette, compared to the reference standard. Activity status could be classified
as ‘reactivated’, ‘suspicious’ or ‘quiescent’. A lesion classification was scored as ‘correct’ if both participant and
17

reference standard lesion classifications were ‘reactivated’, or both participant and reference standard lesion
classifications were ‘suspicious’/ ‘quiescent’ (i.e. suspicious and quiescent classifications were grouped, making
the primary outcome binary).
Secondary outcomes were: the frequency of potentially sight threatening errors (reference standard=reactivated
and participant classification=quiescent); participants’ judgements about the presence or absence, and increase
from baseline, of lesion components (sub-retinal fluid (SRF), intra-retinal cysts (IRC), diffuse retinal thickening
(DRT), pigment epithelial detachment (PED), blood and exudates); participant-rated confidence in their
decisions about the primary outcome on a 5-point scale; cost-effectiveness of monitoring patients with quiescent
lesions by optometrists in the community compared to ophthalmologists in the HES.
Sample size
A sample of 288 vignettes was chosen to have at least 90% power to test the hypothesis that the proportion of
lesions correctly classified by the optometrist group was no more than 10% lower than the proportion correctly
classified by the ophthalmologist group, assuming that the proportion of lesions correctly classified by the
ophthalmologist group was at least 95%. The trial in fact had 90% power to detect non-inferiority for lower
proportions of vignettes correctly classified by the ophthalmologist group, since each vignette was assessed
seven times by each group.
Statistical analyses
All primary and secondary outcomes were analysed using mixed effects regression models, adjusting for the
order in which vignettes were viewed as a fixed effect (tertiles: 1-14, 15-28, 29-42), and participant and vignette
as random effects. All outcomes were binary and analysed using logistic regression with group estimates
presented as odds ratios (OR) with 95% confidence intervals (CI). Hypotheses were tested with likelihood ratio
tests; two-tailed p-values<0.05 were considered statistically significant.
Economic evaluation
A within-trial cost-effectiveness analysis compared optometrist-led vs. ophthalmologist-led reviews of the need
for retreatment for patients with quiescent nAMD from the perspective of the UK National Health Service
(NHS), personal social services and private practice optometrists. The main outcome measure was a cost per
‘correct’ lesion classification. Costs of reviews by optometrists were collected using a bespoke resource use
questionnaire developed for trial participants; costs for ophthalmologists were taken from those calculated in the
18

IVAN trial. Decision trees were used to model alternative cost care pathways based on the optometrists’ and
ophthalmologists’ lesion classifications for the trial vignettes. The optometrists were considered cost-effective if
the incremental cost-effectiveness ratio (ICER) fell below £20,000.
Qualitative research
Focus groups and interviews were conducted with HES users, eye specialists and other health professionals
involved in caring for patients with eye conditions in the UK to explore their views on shared care for nAMD.
Participants were recruited through various sources using maximum variation sampling. Discussions were audio-
recorded, transcribed verbatim and analysed thematically until the point of data saturation.
Results
Trial cohort
Between 01/06/2013 and 06/03/2014, 155 participants registered their interest; of these, 62 ophthalmologists and
67 optometrists consented to take part. Participants could withdraw or be withdrawn throughout the trial for
various reasons: not completing webinar training; not attaining the required performance level in their training
vignettes; no longer wanting to take part; no longer required to reach the target sample size. Ninety six
participants, 48 from each profession, completed the main trial assessments and formed the analysis population.
Reference standard classifications
The reference standard classified 142 (49.3%) of the 288 vignettes as reactivated, five (1.7%) as suspicious and
141 (49.0%) as quiescent.
Participant characteristics
The average age and proportion of women among optometrists and ophthalmologists were similar (mean age
(standard deviation); 43.1(10.1) years and 42.2(8.0) years respectively; 50.0% vs. 43.8%). Optometrists had on
average more years of qualified experience than ophthalmologists (median (interquartile range); 17.4 (10.1 to
28.4) and 11.4 (4.8 to 16.9) years respectively).
Primary outcome
Ophthalmologists and optometrists correctly classified 1722/2016 (85.4%) and 1702/2016 (84.4%) of vignettes.
The difference was not statistically significant (OR 0.91, 95%CI 0.66–1.25, p=0.543) and showed optometrists
19

to be non-inferior to ophthalmologists with respect to lesion classification according to the pre-specified limit of
10% absolute difference (0.298 on the odds scale).
Secondary outcomes
Serious sight-threatening errors (which could only occur for the vignettes classified as ‘reactivated’ by the
reference standard) occurred in 62/994 (6.2%) of ophthalmologists’ classifications and 57/994 (5.7%) of
optometrists’ classifications. This difference was not statistically significant (OR=0.93, 95%CI 0.55–1.57,
p=0.789). Ophthalmologists judged lesion components to be present less often than optometrists for all
components except PED; the differences between groups were statistically significant for SRF (25.5% vs. 31.1%,
OR=1.73, 95%CI 1.21–2.48), DRT (23.9% vs. 41.0%, OR=3.46, 95%CI 2.09–5.71), blood (7.4% vs. 9.6%,
OR=1.56, 95%CI 1.00–2.44) and exudates (7.5% vs. 18.8%, OR=3.10, 95%CI 1.58–6.08), but not for IRC
(39.6% vs. 40.1%, OR=1.00, 95%CI 0.61–1.65) or PED (41.9% vs. 41.8%, OR=0.91, 95%CI 0.47–1.79).
Ophthalmologists were significantly more likely to be ‘very confident’ about their lesion classifications than
optometrists (58.3% vs. 28.5%, OR 0.15, 95%CI 0.07–0.32).
Economic evaluation
The mean cost for an optometrist-led monitoring review in the community was £51.82 per review, compared to
£75.60 for an ophthalmologist-led review in hospital. However, once information on retreatment decisions were
considered (e.g. follow-up consultations and anti-VEGF injections), the average cost per care pathway was very
similar between the two professional groups. The cost for optometrist-led monitoring was £410.78 compared to
£397.33 for ophthalmologist-led monitoring (difference of £13.45).
Acceptability of the shared care model to patients and health professionals
Findings from the focus groups and interviews found consensus that optometrist-led monitoring of patients with
quiescent nAMD in the community has the potential to reduce clinical workload and could represent a more
patient-centred option for patients. However, potential barriers were identified which could limit the feasibility
of a shared care scheme, including ophthalmologists’ perceptions of optometrists’ competence, the need for
clinical training, whether optometry and ophthalmology could work more collaboratively, and whether shared
care was a financially efficient option for Clinical Commissioning Groups.
Discussion
Main findings: study conduct
20

The virtual trial design required each participant to assess specific set of vignettes, which made recruitment and
conduct of the trial challenging in a short time-frame. Fewer suitable images were available to create vignettes
than anticipated, requiring changes to the methods. Some images used to create vignettes were suboptimal and
paired viewing of baseline and index images was not possible. The reference standard was not available to assess
performance after training but this did not disadvantage any participant.
Main findings: study results
Optometrists were non-inferior to ophthalmologists with respect to the overall proportion of lesions correctly
classified but they made different kinds of error. Compared to ophthalmologists, they were less likely to classify
a reactivated lesion as quiescent or suspicious and more likely to classify a quiescent or suspicious as reactivated.
These findings suggested optometrists adopted a more cautious decision criterion. Such caution may be desirable
although it limits the potential for community monitoring to reduce the HES workload and be cost-effective. No
harms could arise in the trial because decisions were being made for vignettes.
The economic evaluation showed that monitoring by optometrists had slightly higher costs and resulted in
slightly fewer correct retreatment decisions compared to ophthalmologists. However, the differences were very
small (an incremental cost of £13 per consultation and one additional incorrect decision per 101 reviews
conducted).
Focus group participants and interviewees agreed that monitoring by community-based optometrists may reduce
HES workload and could represent a more patient-centred option for patients. However, potential barriers to
implementation include ophthalmologists’ perceptions of optometrists’ competence, the need for training and for
optometrists and ophthalmologists to work more collaboratively.
Strengths and limitations
The ECHoES study was done rapidly at low cost and was feasible when a conventional trial may not have been.
The virtual nature of the trial and the adequacy of training are important potential limitations. However, ‘2-stop
clinics’ in the HES are common and often depend on ‘virtual’ lesion assessment in the absence of the patient;
and the trial results suggest training was satisfactory. The absence of an existing shared care pathway required
optometrists to identify hypothetical resources and costs. It also contributed to uncertainty about the cost-
21

effectiveness estimates, highlighted by a sensitivity analysis which excluded re-review in the HES of a patient
rapidly referred by an optometrist.
Lessons for the future (if applicable)
We applied methods planned at the time of trial conception with few modifications and recommend further trials
of this nature to address research questions when appropriate data repositories are available.
The study required participating optometrists and service users interviewed about the proposed shared model to
consider a hypothetical scenario. This is not intrinsic to a virtual trial but is a likely feature, since the design has
most to offer when a particular service is not yet established. This constraint imposes some limitations and
uncertainties. Conversely, the qualitative research highlighted the importance of exploring views of relevant
stakeholders alongside a virtual trial; key concerns were identified that would need to be addressed in
formulating a concrete shared care model.
Future research
The ECHoES web application was robust and could be used for future training or research. Improvements in
technology, and increasing expertise of OCT technicians capturing OCT images, may make the vignettes based
on the IVAN image repository irrelevant. Creating new vignettes based on up-to-date images for patients
managed in the HES would be easy to do but would require investment.
The web application could be modified to allow automatic image importation from imaging equipment and
viewing by multiple users across a local area network. Wider integration with the HES could allow for tele-
medicine-style shared care, including interaction with HES ophthalmologists in scheduled ‘virtual’ clinics,
providing training and potentially improving trust between professions.
The benefit of reducing HES workload was not considered in the economic evaluation. A framework of
programme budgeting and marginal analysis could explicitly explore the resource implications of shifting
resources within a given health service area.
22

Future qualitative research could investigate professional differences of opinion that were identified in
multidisciplinary focus groups.
Conclusion
Optometrists were as good as ophthalmologists in classifying the activity status of a lesion in vignettes but made
different types of error. Optometrists adopted a more cautious decision criterion, making them less likely to
misclassify reactivated lesions, potentially a desirable attribute. The economic evaluation showed small
differences in the costs and effects of monitoring by optometrists and ophthalmologists for patients with
quiescent nAMD. Patients and professionals were enthusiastic about the possibilities of a shared care model for
nAMD but had concerns about implementation.
Study registration
ISRCTN07479761
Funding
The National Institute for Health Research Health Technology Assessment programme.
Scientific summary word count: 2400
23
Plain English Summary
Wet age-related macular degeneration (AMD) is common and causes severe sight loss and blindness. Active
disease is treated monthly until it becomes inactive; patients are then monitored regularly in hospital in case the
disease reactivates, needing further treatment. Monitoring is burdensome to patients, their carers and the NHS.
This study investigated whether community-based optometrists, after appropriate training, can make decisions
about disease reactivation as accurately as hospital-based ophthalmologists. We also investigated whether
monitoring by community-based optometrists would provide value for money for the NHS.
Profiles were created summarising anonymous information about patients with wet AMD twice during their
treatment, once when the disease was inactive and subsequently when the disease was inactive or active. Profiles
comprised pictures of the eye used by doctors to make retreatment decisions, the age, gender and other summary
patient details. 155 ophthalmologists and optometrists volunteered. 48 of each profession completed training and
studied 42 profiles. By comparing pictures for the two times, they decided whether the disease had reactivated or
not. Optometrists and ophthalmologists made correct decisions for 84.4% and 85.4% of profiles, respectively.
Optometrists were more cautious than ophthalmologists, correctly identifying more reactivated profiles but also
incorrectly classifying more inactive profiles as reactivated. Average costs for monitoring were very similar:
£397.33 and £410.78 for ophthalmologists and optometrists, respectively.
We concluded that, with adequate training, optometrists make retreatment decisions as well as ophthalmologists.
Monitoring by community-based optometrists is likely to be more patient-centred and reduce NHS workload but
may be challenging to implement.
Plain English summary word count: 248
1. Introduction
1.1 Background
Wet, or neovascular, age-related macular degeneration (nAMD) is a common condition which can cause severe
sight loss and blindness. It is due to a pathological process where new blood vessels arising from the choroid
24

breach the normal tissue barriers and come to lie within the sub pigment epithelial and sub-retinal spaces. These
new blood vessels leak fluid and, because they are fragile, they can bleed easily. The collection of fluid or blood
between the tissue layers and within the neural retina is incompatible with normal eyesight. Other variants of
nAMD which are usually treated as nAMD include: (a) an abnormal vascular complex arising de novo from the
retinal circulation, known as retinal angiomatous proliferation (RAP) and (b) intra-choroidal aneurysmal
dilatation(s) of the vasculature, known as polypoidal choroidopathy.
Currently, patients with nAMD (or nAMD variants) are treated with intravitreal injections of anti-VEGF drugs1
(that inhibit vascular endothelial growth factor). The most commonly used drugs are ranibizumab (Lucentis®),
bevacizumab (Avastin®) and aflibercept (Eylea®). Ranibizumab prevents sight loss in over 90% of eyes with
nAMD when given as monthly intravitreal injections for up to two years.2, 3 Bevacizumab (unlicensed for
nAMD) and aflibercept are non-inferior to ranibizumab in maintaining visual acuity after one year of treatment,4-
6 and bevacizumab is also non-inferior to ranibizumab after two years of treatment.7-9
Anti-VEGF drugs render the nAMD lesion quiescent by making the leaky vessels competent. However, adequate
concentrations of the drug need to be present in order to maintain the neovascular complexes in a quiescent non-
leaky state and to ameliorate the exudative manifestations. Once the macula has been rendered fluid free,
cessation of treatment is the norm and patients are monitored for relapse at regular clinic visits which are usually
monthly. Monitoring involves visual acuity checks, clinical examination and optical coherence tomography
(OCT), with treatment being restarted if required. There is now evidence that intensive regular monthly review to
detect recurrence, restarting treatment when necessary, can result in functional outcomes similar to those
observed in industry-sponsored trials of ranibizumab in which patients received monthly treatment over two
years.1, 3, 8 However, regular monthly review in the Hospital Eye Service (HES), even without treatment, blocks
clinic space, uses valuable resources, is expensive and is also burdensome to the patients and their carers.
Ophthalmologists have also investigated giving ‘prophylactic’ treatment to quiescent eyes, extending the interval
between clinic visits providing the disease remains quiescent, in order to lessen the burden of regular visits to
patients and to the National Health Service (NHS). A disadvantage of this method of treatment is that it can lead
to unnecessary overtreatment.
1.2 Existing evidence
There is currently no evidence about the effectiveness of community follow-up by optometrists for nAMD. On
25

the other hand there is evidence about the effectiveness of optometrists in providing ‘shared care’ with the HES
for glaucoma and diabetic eye disease and the training programmes that have been used to achieve them.
Evaluations comparing management by optometrists and ophthalmologists have shown acceptable levels of
agreement between the decisions made in the context of glaucoma and accident and emergency services.10, 11
Thus, there are existing models of shared care-management which are well established through formal
evaluation. A recent review has outlined different approaches used to increase the capacity in nAMD services
across the UK.12 The case studies in this review show a variety of scenarios with many involving extended roles
for optometrists and nurse practitioners but these occur within the HES. Some studies have also evaluated the
potential of remote care but these approaches involve assessments by an ophthalmologist specialising in medical
retina working in the HES of OCTs captured by outreach services.13, 14
Taking and interpreting retinal images are skills that can be easily taught (the former is usually carried out by
technicians in the HES) and, therefore, the final evaluation in a telemedicine scenario need not always involve an
ophthalmologist. Many of the hospital based scenarios involve specialist optometrists and nurse practitioners
making clinical decisions, although the effectiveness of these management pathways has not been formally
evaluated yet. The transfer of the care of patients who are not receiving active treatment for nAMD requires the
ability to interpret signs in the fundus of the eye (either through clinical examination or fundus photography)
combined with an examination of OCT scans of the macula, as well as the facility for patients to be returned
seamlessly and expediently to the hospital eye service when there is re-activation of disease. Optometrists
represent a highly skilled and motivated workforce in the UK and the vast majority of optometric practitioners
are based in the community. A number of UK community optometric practices have already invested in the
technology for performing digital fundus photography and OCT and use these technologies to make decisions
about diagnosis and the need to refer a patient to the HES. However, the skill and the ability of optometrists to
differentiate quiescent nAMD from active nAMD have not been evaluated. Also, to the best of our knowledge,
no shared care management scheme for nAMD has been formally evaluated.
1.3 Relevance to the NHS/ health policy
Even when nAMD has been successfully controlled by treatment with an anti-VEGF drug, clinicians continue to
review patients regularly because there is a very high risk of relapse, evidenced by the proportion of patients
remain in follow up for many years after initiation of therapy.15 One of two strategies are typically used: (a)
monthly review until active disease recurs, termed the pro re nata (PRN) regimen, or (b) the treat and extend
26

regimen. The latter method requires that treatment is administered even if there is no fluid at the macula but the
subsequent review interval is extended by approximately two weeks. The PRN regimen is very burdensome for
patients and for the NHS and the treat and extend regimen leads to over treatment with its attendant risks and
additional expense.
If monitoring of the need for retreatment by community optometrists could be shown to have similar accuracy
compared to monitoring of the need for retreatment by ophthalmologists in the HES, there would be a strong
impetus to devolve monitoring of patients whose disease is quiescent to the community setting. Community
optometrists have the necessary training to recognise nAMD (they are responsible for the majority of referrals to
the HES) but would need to be trained to acquire OCT images and to interpret them in order to assess the need
for retreatment. If optometrists can be trained to perform these tasks and make the correct clinical decision, they
could manage patients with quiescent disease effectively in the community until reactivation occurs, at which
point rapid referral to the HES could be initiated.
Advantages of devolving monitoring to community optometrists include freeing-up of clinic capacity for the
over stretched NHS and less travel time for patients.
1.4 Aims and objectives
The aim of the ECHoES trial was to test the hypothesis that, compared to conventional HES follow-up,
community follow-up by optometrists (after appropriate training) is not inferior for patients with nAMD with
stable vision.
This hypothesis was tested by comparing decisions made by samples of ophthalmologists working in the HES
and optometrists working in the community about the need for retreatment using clinical vignettes and images
generated in the IVAN clinical trial (Health Technology Assessment (HTA) ref: 07/36/01; ISRCTN92166560 9).
Retreatment decisions made by participants in both groups were validated against a reference standard (2.4).
The trial had five specific objectives:
I. To compare the proportion of retreatment decisions classified as ‘correct’ (against the reference standard,
27

‘active’ vs. ‘suspicious’ or ‘inactive lesion’) made by optometrists and ophthalmologists.
II. To estimate the agreement, and nature of disagreements, between retreatment decisions made by
optometrists and ophthalmologists.
III. To estimate the influence of vignette clinical and demographic information on retreatment decisions.
IV. To estimate the cost-effectiveness of follow-up in the community by optometrists compared to follow-up
by ophthalmologists in the HES.
V. To ascertain the views of patient representatives, optometrists, ophthalmologists and clinical
commissioners on the proposed shared care model.
28

2. Methods
2.1 Study design
The ECHoES trial is a non-inferiority trial designed to emulate a parallel group design (Table
1). However, since all vignettes were reviewed by both optometrists and ophthalmologists in
a randomised balanced incomplete block design,16, 17 the ECHoES trial is more analogous to a
cross-over trial than a parallel group trial. This trial is registered, ISRCTN 07479761.
Table 1 Research question components tested in the ECHoES trial compared to the hypothetical parallel group trial that it aimed to emulate
Research question component
ECHoES (cross over) trial Conventional (parallel group) trial
Population Vignettes representing the clinical features of patients with quiescent nAMD being monitored for reactivation of disease
Patients with quiescent nAMD being monitored for nAMD reactivation
Intervention Assessment of vignettes by a traineda
optometrist to identify nAMD reactivation
Monthly review by a community optometrist, after trainingb, to detect nAMD reactivation
Comparator Assessment of vignettes by a traineda
ophthalmologist to identify nAMD reactivation
Monthly review by an ophthalmologist in the HESb to detect nAMD reactivation
Outcome Correct identification of reactivated nAMD (presumed to lead to appropriate treatment to preserve visual acuity)
Visual acuity
a In the ECHoES trial, both professional groups were required to undergo identical training.b In the parallel group trial, optometrists would be required to undergo training (not defined here but which could be similar to the training provided in the ECHoES trial). In a pragmatic design, ophthalmologists in the HES might be assumed to be adequately trained already, since both trials would recruit from ophthalmologists who already make such decisions in the HES.
The trial aimed to quantify and compare the diagnostic accuracy of ophthalmologists and
optometrists in assessing reactivation of quiescent nAMD lesions, compared to the reference
standard (2.4). This type of design was only possible with limited permutations of the total
number of vignettes, participants, and number of vignettes per participant. For the ECHoES
trial, a total of 288 vignettes were created. Forty eight ophthalmologists and 48 optometrists
Page 29

each assessed a sample of 42 vignettes. Each vignette was assessed by 7 ophthalmologists
and 7 optometrists. Each sample of 42 vignettes was assessed in the same order by one
optometrist and one ophthalmologist, both selected randomly from their respective cohorts.
2.2 Vignettes
A database of vignettes was created for the ECHoES trial using images collected in the IVAN
trial (HTA ref: 07/36/01; ISRCTN92166560 9), which included a large repository of fundus
images and OCT scans from eyes with varying levels of lesion activity. In the IVAN trial,
OCT and fundus images were captured from 610 participants every 3 months for up to 2
years, generating a repository of almost 5,000 sets of images, with associated clinical data.
However, only a subset (estimated to be about 25% of all of the available OCT images) were
captured using the newer generation Fourier domain technology (now the clinical standard),
which provides optimal images of the posterior ocular findings. The vignettes in the ECHoES
trial were populated only with OCT scans captured on spectral/Fourier domain systems.
Each vignette consisted of sets of retinal images (colour and OCT) at two time points
(baseline and index), with accompanying clinical information (gender, age, smoking status
and cardiac history) and best corrected visual acuity (BCVA) measurements obtained at both
time points. The ‘baseline’ set were images from a study visit when the nAMD was deemed
quiescent (i.e. all macular tissue compartments were fluid free) and the ‘index’ set consisted
of images from another study visit. Considering both baseline and index images, and taking
into account the available clinical and BCVA information, participants reviewed these
vignettes and made classification decisions about whether the index lesion was believed to be
reactivated, suspicious or quiescent. Further details are published elsewhere.18 A reference
standard lesion classification was assigned to each vignette on the basis of independent
assessment by three retinal experts (2.4).
2.3 Participants
2.3.1 Recruitment
The ECHoES trial was publicised in optometry journals and forums to attract optometrists,
and circulated to ophthalmologists who were members of the UK and Welsh medical retinal
Page 30

groups. Potential participants were directed to the ECHoES website where they could read
the information sheet and register their interest in the trial.
2.3.2 Eligibility criteria
Participants had to meet the following inclusion/ exclusion criteria:
Ophthalmologists:
3 years post-registration experience in Ophthalmology.
Passed part 1 of the Royal College of Ophthalmologists or the Diploma in
Ophthalmology or an equivalent.
Working in the NHS at the time of participation in the ECHoES trial
Experience within an AMD service.
Optometrists:
Fully qualified and registered with the General Optical Council (GOC) for at least 3
years.
Practicing within the General Optical Service (GOS) at the time of participation in
the ECHoES trial
Must not be working within AMD shared care schemes or undertaking OCT
interpretation within AMD care pathways
There were also some practical circumstances in which a potential participant was not
accepted to assess the main study vignette set:
Unable to attend any of the webinar training sessions
Unable to achieve an adequate standard (75%) with respect to the assessment of
lesion activity status (i.e. reactivated, suspicious or quiescent) on the training set of
vignettes.
2.3.3 Training participants
Both ophthalmologists and optometrists are qualified to detect retinal pathology but
optometrists (and some ophthalmologists) may not have the skills to assess fundus and OCT
Page 31

images for reactivation of nAMD. Therefore, the training was designed to provide the key
information necessary to perform this task successfully, so all participants had a similar level
of background knowledge when starting their main trial vignette assessments. The training
included two parts.
Webinar lectures
All participants were required to attend two mandatory webinar lectures. The first webinar
covered the objectives of the EcHoES trial, its design, eligibility criteria for participation,
outcomes of interest and the background to detection and management of nAMD. The second
webinar covered the detailed clinical features of active and inactive nAMD, the imaging
modalities used to determine activity of the lesion and interpretation of the images. Each
webinar lecture lasted approximately one hour, with an additional 15 minutes for questions.
Test of competence
After confirmation of attendance at the webinars, participants were allocated 24 training
vignettes. In order to qualify for the main trial, participants had to assign the ‘correct’ activity
status to at least 75% (18 of 24) of their allocated training vignettes, according to expert
assessments (2.4). If participants failed to reach this threshold, they were allocated a further
24 vignettes (second training set) to complete. If participants failed to reach the performance
threshold for progressing to the main trial on their second set of training vignettes, they were
withdrawn from the trial. Participants who successfully passed the training phase (after either
one or two attempts) were allocated 42 vignettes for assessment in the main phase of the trial.
Training vignettes were randomly sampled from the same pool of 288 vignettes as those used
in the main study. However, the sampling method ensured that participants assessed different
vignettes in their main study phase from those assessed during their training phase; the
samples for assessment in the main trial were allocated to participant IDs in advance (as part
of the trial design) and training sets of vignettes were sampled randomly from the 246
remaining vignettes.
Page 32
2.4 Reference standard
The reference standard was established based on the judgements of three medical retina
experts. Using the web-based application (2.5.4), these experts independently assessed the
vignette features and made lesion classification decisions for all 288 index images. As the
judgements of experts did not always agree, a consensus meeting was held to review the
subset of vignettes for which experts’ classifications of lesion status disagreed. The experts
reviewed these vignettes together without reference to their previous assessments and reached
a consensus agreement. This consensus decision (‘reactivated’, ‘suspicious’ or ‘quiescent’
lesion) for all 288 vignettes made up the reference standard, and was used to determine
‘correct’ participant lesion classification decisions.
As described in the protocol19, classification of a lesion as reactivated or quiescent depended
on the presence or absence of pre-defined lesion components and whether or not the lesion
component had increased from baseline. Two imaging modalities were used. These were
colour fundus (CF) photographs and (OCTs. Lesion components in colour photographs that
were pre-specified to comprised haemorrhage and exudate. Tomographic components
comprised sub-retinal fluid (SRF), diffuse retinal thickening (DRT), localised intra-retinal
cysts (IRC) and pigment epithelial detachment (PED). Experts indicated whether each lesion
component was present or absent. Rules for the classification of a lesion as reactivated or
quiescent from the assessment of lesion components were pre-specified (Table 2). Experts
could disagree about the presence or absence of specific lesion component and whether or not
these components had increased from baseline, however they had to follow the rules when
classifying a lesion as reactivated or quiescent (note that the PED lesion component did not
inform lesion classification as active or quiescent). Validation prompts reflecting these rules
were added to the web application after the training phase to prevent data entry or key stroke
errors; the validation rules did not assist participants in making the overall assessment
because they had to enter their assessments of the relevant image features present in each
vignette before classifying the lesion status.
Due to the short duration of the trial, participant training and assessments were undertaken
concurrently with the independent experts’ assessments of the vignettes. Therefore, training
sets of vignettes were scored against experts’ assessments that were complete at the time.
Page 33

Subsequently, checks were instituted to ensure that no participant was excluded from the
main trial who might have passed the threshold performance score had the consensus
reference standard been available at the time.
Table 2 Framework for reference classifications
Feature Lesion reactivated Lesion Quiescent
SRF on OCT Yes No
Or And
IRC on OCT Yes, and increased from baseline No/ not increased from
baseline
Or And
DRT on OCT Yes, and increased from baseline No/ not increased from
baseline
Or And
Blood on CF Yes, and increased from baseline No/ not increased from
baseline
Or And
Exudates on CF Yes, and increased from baseline No/ not increased from
baseline
SRF=sub-retinal fluid, IRC=intra-retinal cysts, DRT=diffuse retinal thickening, OCT=optical coherence
tomography, CF=colour fundus.
2.5 Outcomes
2.5.1 Primary outcomeThe primary outcome was correct classification of the activity status of the lesion by a
participant, based on assessing the index images in a vignette, compared to the reference
standard (2.4). Activity status could be classified as ‘reactivated’, ‘suspicious’ or ‘quiescent’.
For the primary outcome, a participant’s classification was scored as ‘correct’ if:
Both the participant and the reference standard lesion classification was reactivated
Page 34

Both the participant and the reference standard lesion classification was quiescent
Both the participant and the reference standard lesion classification was suspicious
Either the participant or the reference standard lesion classification was suspicious,
and the other classification (reference standard or participant) was quiescent.
In effect, for the primary outcome, suspicious and quiescent classifications were grouped,
making the primary outcome binary (Table 3).
Table 3 Definition of primary outcome
Participant classification
Reference standard classification
Reactivated Suspicious Quiescent
Reactivated
Suspicious
Quiescent
2.5.2 Secondary outcomes
(a) The frequency of potentially sight threatening ‘serious’ errors. An error of this kind was
considered to have occurred when a participant’s classification of a vignette was ‘lesion
quiescent’ and the reference standard classification was ‘lesion reactivated’, i.e. a
definitive false negative classification by the participant. Definitive false positives were
not considered sight threatening but were tabulated. Misclassifications involving
classifications of ‘lesion suspicious’ were also not considered sight threatening.
(b) Judgements about the presence or absence of specific lesion components, e.g. blood and
exudates in the fundus colour images; SRF, IRC, DRT and PED in the OCT images and,
if present, whether these features had increased since baseline.
(c) Participant-rated confidence in their decisions about the primary outcome, on a 5-point
scale.
2.5.3 Adverse eventsThis study does not involve any risks to the participants therefore it was not possible for
clinical adverse events to be attributed to study specific procedures.
Page 35
2.5.4 Implementation/ management/ data collection
A secure web-based application was developed to allow participants to take part in the trial
remotely (see example screenshots Appendix 2). The website www.echoestrial.org/demo
shows how assessors carried out assessments in the trial. Participants registered interest,
entered their details, completed questionnaires (regarding opinions on ECHoES training and
shared care), and assessed their training and main study vignettes through this application.
The webinar material was also available in the web application for participants to consult if
they needed to revisit it.
Additionally, the web application had tools accessible only to the trial team to help manage
and monitor the conduct and progression of the trial. Further details are published elsewhere 18.
2.6 Sample size
With respect to the primary outcome, the trial was designed to answer the non-inferiority
question “Is the performance of optometrists as good as that of ophthalmologists?” A sample
of 288 vignettes was chosen to have at least 90% power to test the hypothesis that the
proportion of vignettes for which lesion status was correctly classified by the optometrist
group was no more than 10% lower than the proportion correctly classified identified by the
ophthalmologist group, if the proportion of vignettes for which lesion status was correctly
classified by the ophthalmologist group was at least 95%. This sample size calculation
assumed that each vignette would be assessed by only one ophthalmologist and one
optometrist. However, as each vignette was assessed 7 times by each group, the trial in fact
had 90% power to detect non-inferiority for lower proportions of vignettes correctly
classified by the ophthalmologist group.
2.7 Statistical methods
The analysis population consisted of the 96 participants who completed the assessments of
their training and main study samples of vignettes. Continuous variables were summarised by
means and standard deviations (SD), or medians and interquartile ranges (IQR) if
Page 36
distributions were skewed. Categorical data were summarised as a number and percentage.
Baseline participant characteristics were described and groups formally compared using t-
tests, Mann-Whitney tests, chi-squared tests or Fishers exact tests as appropriate.
2.7.1 Group comparisonsAll primary and secondary outcomes were analysed using mixed effects regression models,
adjusting for the order the vignettes were viewed as a fixed effect (tertiles: 1-14, 15-28, 29-
42) and participant and vignette as random effects. All outcomes were binary and as such
analysed using logistic regression with group estimates presented as odds ratios (OR) with
95% confidence intervals (CI).
In addition to the group comparisons, the influence of key vignette features (age, gender,
smoking status, cardiac history (including angina, myocardial infarction and/or heart disease),
and baseline and index BCVA (modelled as the sum and difference of BCVA at the two time
points)) on the number of incorrect vignette classifications were investigated, adjusting for
the reference standard classification (reactivated vs. quiescent/suspicious). This additional
analysis was carried out using fixed effects Poisson regression with the outcome of the
number of incorrect classifications. The prior hypothesis was that this information would not
influence the number of correct (or incorrect) classifications.
The sensitivity and specificity of the primary outcome are also presented. For these
performance measures, the sensitivity is the proportion of lesions for which the reference
standard is ‘reactivated’ and participants correctly classified the lesion. The specificity is the
proportion of lesions for which the reference standard is either ‘suspicious’ or ‘quiescent’
and the participant’s classification is also ‘suspicious’ or ‘quiescent’.
2.7.2 Non-inferiority limitFor the sample size calculation, it was agreed an absolute difference of 10% would be the
maximum acceptable difference between the two groups, assuming that ophthalmologists
would correctly assess 95% of their vignettes. As the group comparison of the primary
outcome was analysed using logistic regression and presented as an OR, this non-inferiority
Page 37

margin was converted to the odds scale. Therefore, this limit was expressed as an OR of
0.298 (i.e. the odds correct for the worst acceptable performance by optometrists (85%)
divided by the odds correct for worst assumed performance of ophthalmologists (95%):
(0.85/0.15) / (0.95/0.05)).
2.7.3 Sensitivity analysisA sensitivity analysis of the primary outcome, regrouping vignettes graded as suspicious into
the ‘lesion reactivated’ group rather than ‘quiescent lesion’ group, was undertaken to assess
the sensitivity of the conclusions to the classification of the vignettes graded as suspicious.
This analysis was pre-specified in the analysis plan but not in the trial protocol.
2.7.4 Post-hoc analysisThe following post-hoc analyses were pre-specified in the analysis plan but not in the trial
protocol.
Lesion classification decisions were tabulated against referral decisions for both
groups.
A descriptive analysis of the time taken to complete each vignette, and how the
duration of this time changed with experience in the trial (learning curve), was
performed. The relationship between the duration of this time and participants
‘success’ in correctly classifying vignettes was also explored.
Cross tabulations and Kappa statistics were used to compare experts’ initial
classifications with the final reference standard. Similarly, cross tabulations and
Kappa statistics were used to compare lesion component classifications between the
three experts.
In addition, a descriptive analysis of the participants’ opinions about the training provided in
the ECHoES trial, as well as their perceptions of shared care, was carried out (2.10.5).
2.7.5 Missing dataBy design, there was no missing data for the primary and secondary outcomes. However,
time taken to complete vignettes was calculated as the time between when each vignette was Page 38

‘saved’ on the database. It was therefore not possible to calculate this for the first vignette of
each session. Additionally, it was assumed that times longer than 20 minutes (database
timeout time) were due to interruptions so these were set to missing. As the analysis using
these times was descriptive and was not specified in the protocol, complete case analysis was
performed and missing/available data described.
2.7.6 Statistical significanceFor hypothesis tests, two-tailed p-values<0.05 were considered statistically significant.
Likelihood ratio tests were used in preference to Wald tests for hypothesis testing.
All data management and analyses were performed in SAS version 9.3 (SAS Institute Inc.,
Cary, NC, USA) or Stata version 13.1 (StataCorp LP, College Station, Texas, USA).
2.8 Changes since commencement of study
At the end of their participation in the trial, all participants were asked to complete a
questionnaire regarding their opinions about the training provided in the ECHoES trial and
their attitudes towards a shared care model. This was made available to all ECHoES
participants.
Additionally, the reference standard was originally planned to include only two categories,
namely lesion reactivated or lesion quiescent. However, after a concordance exercise was
carried out by the three retinal experts on the ECHoES team, a third category of suspicious
lesion was added. This change occurred before any experts’ or participants’ lesion
classifications were made.
Finally, after much consideration it was agreed the primary analysis would be carried out
using logistic regression rather than Poisson regression in order to fully account for the
incomplete block design. Fitting a Poisson model would not have allowed us to include both
vignette and participant as random effects in the model.
Page 39

2.9 Health economics
2.9.1 Aims and research questions The economic evaluation component of ECHoES aimed to estimate the incremental cost and
incremental cost-effectiveness of community optometrists compared to hospital based
ophthalmologists performing retreatment assessments for patients with quiescent nAMD.
This would enable us to determine which professional group represents the best use of scarce
NHS resources in this context. The main outcome measure was a cost per correct retreatment
decision, with correct meaning that both experts and trial participants judge the vignettes to
be lesion reactivated, lesion quiescent or lesion suspicious.
2.9.2 Analysis PerspectiveThe economic evaluation took the cost perspective of the UK NHS, personal social services
and private practice optometrists and was performed in accordance with established
guidelines and recent publications.20-22 Whilst it is possible that any incorrect retreatment
decisions (false positives) could lead to costs being incurred by patients, their families or
employers due to time away from usual activities, these wider societal costs were felt to be
small compared to the implications for the NHS. Therefore, in line with the IVAN trial9, we
decided not to adopt a societal perspective in the ECHoES trial.
2.9.3 Economic evaluation methodsThe methods used in the economic evaluation are summarized in Table 4. Data on resource
use and costs were collected using bespoke costing questionnaires for community
optometrists. With the help of the ECHoES study team (clinicians and optometrists), we first
identified the typical components/tasks which comprise a monitoring review for nAMD and
then subcategorized these tasks into resource groups such as staffing, equipment and building
space. As some optometrist practices are likely to incur set up costs associated with assessing
the need for retreatment, we compiled a list of items of equipment necessary for performing
each task within a monitoring review. The resource use and cost questionnaire asked each
participant which items of equipment from this list their practice currently owned and how
much they had paid for the items. The questionnaire was piloted with a handful of
optometrists and ophthalmologists who were able to advise on whether our questionnaire was
straightforward to comprehend and complete. For any items which would be necessary for Page 40

the review, but which the practice did not already own, we inferred that these items would
have to be purchased “ex-novo”. Once the total costs of equipment were identified, along
with their predicted life span as suggested by study clinicians, we created an equivalent
annual cost for all of the equipment using a 3.5% discount rate,23 and divided this cost by the
number of potential patients who could undergo the monitoring reviews in the community
practices. See Appendix 4 for a copy of the bespoke costing questionnaires for the
optometrists in the ECHoES trial.
We estimated the costs associated with training optometrists to perform the assessments. The
costs were estimated for the 2 hour duration webinar, plus time spent to revisit the webinar
and time spent in checking other resources. Finally, the amount of time the ECHoES study
clinicians spent preparing and delivering the webinars was also estimated.
For information on the costs of ophthalmologists performing the monitoring assessments, we
used cost data from the IVAN trial where we had undertaken a very detailed micro-costing
study.24
In economic evaluation, it is advised that value added tax (VAT) should be excluded from the
analysis.20 Where possible we used costs without VAT for our base case analysis.
Table 4 Summary of methods used in the economic evaluation
Aspect of method Strategy used in base case analysis
Form of economic evaluation
Cost-effectiveness analysis for comparison between optometrists and ophthalmologists
Perspective NHS, personal social services and private practice optometrists costs
Dataset Optometrist and ophthalmologists enrolled in the ECHoES trial
Missing data Imputation
Costs included in analysis
EquipmentStaffBuildingTraining for Webinars
Effectiveness Correct retreatment decisions
Page 41

measurement
Sensitivity analysis Three injections of ranibizumab (Lucentis) and consultations instead of one, using aflibercept (Eylea) instead of ranibizumab (Lucentis) and using bevacizumab (Avastin) instead of ranibizumab (Lucentis)
Time horizon A within-trial analysis, taking an average of 2 weeks (maximum of 4 weeks’ time)
Missing data
Only 40 of the 61 optometrists who were initially invited to complete the health economics
questionnaire (those who completed webinar training) actually submitted the questionnaire;
34 of the 40 completed their main assessments for the trial. Fifty-five of the 61 optometrists
who were invited to complete the health economics questionnaire replied to the feed-back
questionnaire, which also contained information on the time spent on training by the
optometrist. This training time was costed and contributes to the calculation of the cost per
monitoring review for optometrists. Therefore, in order to maximize use of questionnaires
replied, a cost per monitoring review was estimated using all available information as
reported by all optometrists rather than focusing only on the 48 that subsequently completed
the main assessments.
For consistency with the procedure adopted in the IVAN trial costing, mean values of the
relevant variables were imputed to the 21 optometrists who did not submit the cost
questionnaire and to the six who did not complete the feed-back questionnaire. The estimated
costs from the 61 practices were randomly assigned (see next paragraph) to each of the 2016
vignettes assessed by the 48 optometrists who completed the main assignment.
Cost model – random, allocation
From the IVAN trial, we had estimates of the cost of clinician-led monitoring reviews from
28 eye hospitals. Using a random allocation procedure similar to the one used in the IVAN
trial9, these estimates were allocated to each of the 2016 vignettes assessed by the 48
ophthalmologists in ECHoES. From the data collected for the ECHoES trial, we had
estimates of the cost of the monitoring review from 61 (after imputation) optometric practices
Page 42
which varied across practices. Although it would have been possible to link each vignette to
the cost derived for the optometry practice in which the optometrist assessing the vignette
worked, this would have ignored the heterogeneity between practices and the uncertainty
around the estimates of the mean cost of the monitoring review. Therefore, we adopted the
same approach as used for the IVAN trial, which was to randomly allocate costs. We
randomly sampled from the distribution of costs from different optometrist practices using
the procedure described below. Each of the 61 practices (for which the cost of a monitoring
review had been estimated) reported the monthly number of nAMD patients that they could
accommodate after all required changes in the practice (purchase of necessary equipment,
changes to the structure/size of the practice, new staff, etc.) would have been implemented.
These numbers were used to calculate weights, i.e. each weight was the number of nAMD
patients that the practice could accommodate per month divided by the summation of all
patients with quiescent nAMD who could theoretically be accommodated by all of the
practices per month after implementing changes. Cumulative weights were then calculated
and assigned to each optometric practice. For each vignette (potential patient) a random
number was generated. This random number determined which of the monitoring review
costs each vignette (potential patients) was randomly assigned to. For each vignette (potential
patient) assessed by a community optometrist, we randomly drew a value for the cost of the
community optometry review from the distribution of ECHoES monitoring review costs; for
each vignette assessed by an ophthalmologist, we randomly drew a value for the cost of a
hospital review from the cost distribution used in IVAN. For those vignettes where an
incorrect treatment decision resulted in an additional hospital monitoring consultation, or an
unnecessary injection, we drew additional random numbers to sample those consultation
costs from the distribution of costs as reported for the IVAN trial.
2.9.4 Care cost pathway decision tree In order to generate an estimate for a cost for a correct retreatment decision, we first mapped
the various care pathways that would possibly happen from the treatment assessments in the
study, by comparing the reference lesion classification for each vignette to the actual
classification made by the study participants (48 ophthalmologists and 48 optometrists). This
gave rise to two versions of a simple decision tree, one for ophthalmologists (Figure 1) and
one for optometrists (Figure 2). The starting point for the decision trees was the ‘actual’ truth.
The three main branches of the trees were: true active, true quiescent and suspicious.
Page 43

Participants’ main trial assessments provided information about the number of participants
who made correct and incorrect decisions on treatment as compared to the reference standard
decisions.
Figure 1 Decision tree for hospital ophthalmologist review
Page 44

Figure 2 Decision tree for community optometrist review
The decisions that both groups made about the vignettes were then placed into the decision
trees and the associated costs for the different pathways were calculated. This process
generated an average cost for each of the alternative care pathways. Any ‘incorrect’ decisions
implied that patients would have had unnecessary repeat monitoring visits at the optometrist
practice or at the hospital and maybe unnecessary anti-VEGF injections if they misclassified
patients as requiring treatment. All costs are reported in 2013/2014 prices unless specified
otherwise.
Page 45

Our baseline analysis calculated the average cost and outcome on a per patient basis. From
these estimates, the incremental cost-effectiveness ratios (ICER) for the different assessment
options were derived, producing an incremental cost per accurate retreatment decision.
Sensitivity analyses were carried out to demonstrate the impact of variation around the key
parameters in the analysis on the baseline cost-effectiveness results. The four sensitivity
analyses which we conducted were:
Sensitivity analysis 1: all patients initiating treatment were assumed to have a course
of three ranibizumab given at three subsequent injection consultations, with no
additional monitoring reviews. This matched the way in which discontinuous
treatment was administered in the IVAN trial;
Sensitivity analysis 2: treatment was assumed to be one aflibercept injection given
during an injection consultation;
Sensitivity analysis 3: treatment consisted of one bevacizumab injection given during
an injection consultation;
Sensitivity analysis 4: only considered the cost of a monitoring review rather than
considering the cost of the whole pathway.
The economic evaluation results were expressed in terms of a cost-effectiveness acceptability
curve (CEAC). This indicates the likelihood that the results fall below a given cost-
effectiveness ceiling and could help decision makers to assess whether optometrists are likely
to represent value for money for the NHS when compared with ophthalmologist in making
decision about retreatment in nAMD patients and also completely disparate health care
interventions. All analyses were conducted in Stata (Version 12.1), except the budget impact
analysis.
2.9.5 Budget impact Freeing up HES clinic time could lead to an increase in the overall capacity of the NHS to
manage both the nAMD population more effectively and to manage non-nAMD eye patients
(more time for ophthalmologists to spend with non-nAMD patients if they are seeing fewer
nAMD patients for monitoring). Therefore, we attempted to estimate the potential time and
costs that could be saved by HES clinics if some of the management of nAMD patients could
Page 46

be undertaken in the community. This was done by using the resource use information
collected during the IVAN trial as a basis to consider what proportion of an
ophthalmologist’s time is spent on retreatment decisions for this group of patients relative to
other aspects of their care. We brought together data from the IVAN trial (average number of
patients attending a clinic) and information from the literature, and used expert opinion from
the ECHoES study ophthalmologists and optometrists to try to estimate the total number of
patients with quiescent or no lesion in both eyes who would be eligible for monitoring by a
community optometrist in a given month and the total number of monitoring visits that could
be transferred from a hospital to the community per year. We then replaced the costs of the
ophthalmologist’s time with the cost of the optometrist’s time and examined the difference.
The Excel spreadsheet calculations for the budget impact are reported in Appendix 4.
2.10 Qualitative research
Focus groups were conducted with ophthalmologists, optometrists and eye service users
separately, and one-to-one interviews were conducted with other health professionals
involved in the care and services of those with eye conditions.
2.10.1 Recruitment
Focus groups with optometrists and ophthalmologists
Two focus groups were conducted with ophthalmologists and optometrists separately, held at
specialist conferences (the National Optical Conference for optometrists in Birmingham,
November 2013, and the Elizabeth Thomas Seminar for ophthalmologists in Nottingham,
December 2013). For the optometrist focus groups, information about the study was placed in
specialist press and the ECHoES study website. Focus group participants were also recruited
by the snowball technique, with healthcare professionals informing other potentially
interested colleagues. For the ophthalmologist focus groups, conference organisers emailed
information about the study to delegates. Interested participants were asked to contact the
qualitative researcher for more information.
Interviews with commissioners, clinical advisors to Clinical Commissioning Groups
(CCGs) and public health representatives
Page 47

CCGs in England were contacted by an email which contained information about the study,
asking it to be forwarded on to general practitioners (GPs)/commissioners in each CCG who
were responsible for commissioning ophthalmology care. Those who were interested were
asked to contact the qualitative researcher for more information. Subsequent selection of
clinical advisors and public health representatives was guided via the snowball technique.
Interviews were mostly conducted in person (n = 6) although, when it was not practicable to
do so, a telephone interview was conducted (n = 4). Interviews were conducted between
March and June 2014.
Focus groups with service users
Participants with nAMD were recruited from local support groups organised by the Macular
Society, formerly known as the Macular Disease Society, a UK based charity for anyone
affected by central vision loss with over 15000 members and 270 local support groups around
the UK (http://www.macularsociety.org). Three support groups in the South West of England
were initially selected, one based in a major city, one in a large town, and one in a rural
village. Service users with any history of nAMD were invited to join the study (regardless of
whether they had nAMD in one eye or both, dry AMD in their other eye, or were currently
receiving or had had any treatment in the past).The researcher attended the local support
meetings to explain about the research and provide attendees with a participant information
leaflet to take home. Contact details of those potentially interested at this stage were obtained.
Those who expressed an interest were telephoned by the researcher a week later to discuss
the study further and to answer any questions to help them decide whether or not to take part.
2.10.2 Sampling
Basic demographic, health and professional information was collected from those who agreed
to be contacted for sampling purposes. A purposeful sampling strategy was used to ensure
that the feasibility and acceptability of the proposed shared model of care for nAMD was
captured from a range of perspectives. Within this sampling approach, maximum variation
was sought in relation to profession, age, gender and geographic location (for health
professionals) and gender, age, type of AMD and time since diagnosis (for service users).
Participant characteristics were assessed as the study progressed, and individuals or groups
that were underrepresented were targeted (i.e. commissioners or clinical advisors). Where it
Page 48

was felt that variation had been achieved, potential participants were thanked for their interest
and informed that sufficient numbers had been recruited (i.e. optometrists).
2.10.3 Data collection
A favourable ethical approval for this study was granted by a UK NHS Research Ethics
Committee. Written consent was obtained from participants at the start of each focus group or
interview. Separate topic guides were developed for service users,
optometrists/ophthalmologists (with additional questions for each professional group) and all
other health professionals, to ensure that discussions within each group covered the same
basic issues but with sufficient flexibility to allow new issues of importance to the informants
to emerge. These were based on the study aims, relevant literature and feedback from eye
health professionals in the ECHoES study team, and consisted of open-ended questions about
the current model of care for nAMD and perspectives of stable patients being monitored in
the community by optometrists. They were adapted as analysis progressed to enable
exploration of emerging themes.
DT conducted all of the focus groups and interviews, which were predominantly led by the
participants themselves, with DT flexibly guiding the discussion by occasionally probing for
more information, clarifying any ambiguous statements, encouraging the discussion to stay
on track, and, in the focus groups, providing an opportunity for all participants to contribute
to the discussion. All participants were offered a £20 gift voucher to thank them for their time
(two commissioners declined the voucher).
2.10.4 Data analysis
Focus groups and interviews were transcribed verbatim and checked against the audio-
recording for accuracy. Transcripts were imported into NVivo (version 10) where data were
systematically assigned codes and analysed thematically using constant comparison methods
derived from grounded theory methodology.25 Transcripts were repeatedly read and on-going
potential ideas and coding schemes were noted at every stage of analysis. To ensure each
transcript was given equal attention in the coding process, data were analysed sentence by
sentence and interesting features were coded. Clusters of related codes were then organised
Page 49

into potential themes, and emerging themes and codes within transcripts and across the
dataset were then compared to explore shared or disparate views among participants. The
transcripts were reread to ensure the proposed themes adequately covered the coded extracts,
and the themes were refined accordingly. Emerging themes were discussed with a second
experienced social scientist (NM) with reference to the raw data. Data collection and analysis
proceeded in parallel, with emerging findings informing further sampling and data collection.
Data collection and analysis continued until the point of data saturation i.e. the point at which
no new themes emerged.
2.10.5 ECHoES participants’ perspectives of training and shared care
In addition to the information collected during focus groups and interviews, the opinions of
all optometrists and ophthalmologists who had taken part in the ECHoES trial were sought in
a short online questionnaire. The survey related to participants’ experiences of the training
and their attitudes towards shared care for nAMD. Questions required either a binary, Likert
scale or a free-text response.
Quantitative data were analysed in Excel and presented as proportions. Free text responses
were imported into NVivo (version 10) and coded into categories, which were derived from
the main survey questions, relating to feedback on the training programme (experiences of
using the web application, ease of training and additional resources used) and attitudes
towards shared care (general perspectives of the proposed model, and perceived facilitators
and barriers to implementation). Data were analysed thematically using techniques of
constant comparative techniques of grounded theory, whereby codes within and across the
dataset were compared to look for shared or disparate views among optometrists and
ophthalmologists.
Page 50

3. Results: classification of lesion and lesion components (objectives 1 to
3)
3.1 Registered participants
A total of 155 health care professionals, 72 ophthalmologists and 83 optometrists, registered
their interest in the ECHoES trial. Of these, 62 ophthalmologists and 67 optometrists
consented to take part. Everyone who registered an interest was eligible for the trial; those
who did not consent either did not return their consent forms or were no longer required for
the trial. See Figure 3 for details.
3.2 Recruitment
Participants were initially recruited between 01 June and 09 October 2013. However, as
participants progressed through the training stages, it became apparent that the withdrawal
rate of optometrists was higher than expected and that more would be required if the planned
sample size were to be met. Recruitment was therefore reopened between 13 February and 06
March 2014, when a further seven optometrists consented to take part. A number of
participants withdrew or were withdrawn by coordinating staff throughout the trial, mostly
due to missing webinars or failing their assessment of training vignettes (see Figure 3 and
section 3.3 for details). The final participant completed the main study vignettes on 21 April
2014. As planned, 48 ophthalmologists and 48 optometrists completed the full trial.
Page 51

Registered health care professionals (n=155)
Ophthalmologist (n=72) Optometrist (n=83)
Withdrawals (n=6):Target reached so not required (n=3)Did not attend webinar 1 (n=3)
Completed webinars and allocated their training vignettes (n=56)
Passed training first attempt (n=48)
Passed training second attempt (n=2)
Passed training first attempt (n=38):
Passed training second attempt (n=11):
Completed main trial and included in analysis dataset (n=48)
Completed main trial and included in analysis dataset (n=48)
Excluded (n=10):Not invited to consent (n=1)Did not return consent form (n=9)
Excluded (n=16):Did not return consent form (n=16)
Consented (n=62) Consented (n=67)
Withdrawals (n=6):Target reached so not required (n=1)Did not want to ‘wait and see’ (n=1)Did not attend webinar 1 (n=3)Did not attend webinar 2 (n=1)
Withdrawals (n=6):Did not complete vignette training (n=2)Failed training (n=4)
Withdrawals (n=1):Target reached so not required (n=1)
Withdrawals (n=12):Did not complete vignette training (n=3)Failed training (n=8)Target reached so not required (n=1)
Completed webinars and allocated their training vignettes (n=61)
Withdrawals (n=2):Target reached so not required (n=2)
Figure 3 Flow of participants
At the start of the trial we were unsure of how many participants we would need to recruit in order to meet our target of 48 participants in each group. Therefore, we over recruited at the consent stage and asked a number of participants to complete the webinar and then ‘wait and see’ whether we needed them to participate in the main trial. We also slightly over recruited at each stage of the trial to account for drop outs. This resulted in a small number of participants being withdrawn at various stages of the trial because they were no longer required.
Page 52

3.3 Withdrawals
During the ECHoES trial, withdrawals could occur for a number of reasons. Firstly, a
participant could withdraw or be withdrawn between consenting and receiving their training
vignettes if the mandatory webinar training was not completed, they no longer wanted to take
part, or they were no longer needed for the trial. This occurred for 6 ophthalmologists and 6
optometrists (see Figure 3 for details). Secondly, participants could be withdrawn if the
threshold performance score for the assessments of their training vignettes was not attained.
Of the 54 ophthalmologists who completed their vignette training, 48 (88.9%) passed first
time, 2 (3.7%) passed on their second attempt and 4 (7.4%) failed their second attempt so
were withdrawn. Of the 57 optometrists who completed their vignette training, 38 (66.7%)
passed first time, 11 (19.3%) passed on their second attempt and 8 (14.0%) failed their
second attempt and were withdrawn from the trial. Two ophthalmologists and one
optometrist who passed their training vignettes were withdrawn from the trial as the target
sample size (48 in each group completing main assessments) had already been reached.
3.4 Numbers analysed
Ninety six participants, 48 ophthalmologists and 48 optometrists, were included in the
analysis population. For the primary and secondary outcomes, all participants were included
as by design there were no missing data.
3.5 Reference standard classifications
The reference standard classified 142 (49.3%) of the 288 vignettes as reactivated, five (1.7%)
as suspicious and 141 (49.0%) as quiescent.
3.6 Participant characteristics
The characteristics of participants collected for the trial included only age, gender and date of
qualification for the participant’s profession. As participants were not randomised to the two
comparison groups, baseline characteristics were presented descriptively and formally
compared. Table 5 shows that the gender balance and average ages were similar among
optometrists and ophthalmologists (mean (SD); 43.1(10.1) years and 42.2(8.0) years
respectively; 50.0% vs. 43.8% women). Optometrists had on average significantly more years
Page 53

of qualified experience than ophthalmologists (median (IQR); 17.4 (10.1 to 28.4) and 11.4
(4.8 to 16.9) years respectively).
Table 5 Characteristics of participants
Characteristic Ophthalmologists(n=48)
Optometrists(n=48) p-value
Age (years) (mean, SD) 42.2 8.0 43.1 10.1 0.616
Gender (female) (n, %) 21/48 43.8% 24/48 50.0% 0.539
Years since qualification, (median, IQR) 11.4 (4.8, 16.9) 17.4 (10.1, 28.4) <0.001
3.7 Primary outcome
The primary outcome (correct lesion classification by a participant compared to the reference
standard; 2.5.1) was achieved by the ophthalmologists for 1722/2016 (85.4%) vignettes and
by the optometrists for 1702/2016 (84.4%) vignettes (Table 6). The odds of an optometrist
being correct was not statistically different from the odds of an ophthalmologist being correct
(OR 0.91, 95% CI 0.66 to 1.25, p-value 0.543). The ability of optometrists to assess vignettes
is non-inferior (both clinically and statistically) to the ability of ophthalmologists, according
to the pre-specified limit of 10% absolute difference (0.298 on the odds scale; illustrated by
the dotted black line on Figure 4). In this primary outcome model, the variance attributed to
the participant random effect was far smaller than that of the vignette random effect (0.360
and 2.062 respectively).
Table 6 Correct lesion classification (primary outcome), sensitivity and specificity
Primary outcome Ophthalmologists(n=48)
Optometrists(n=48)
OR(95% CI) p-value
n % n %
Lesions correctly classified (overall) 1722/2016 85.4%
1702/2016 84.4% 0.91 (0.66, 1.25) 0.543
Sensitivity (overall) 736/994 74.0% 795/994 80.0% 1.52 (1.08, 2.15) 0.018
Specificity (overall) 986/1022 96.5% 907/1022 88.7% 0.27 (0.17, 0.44) <0.001Page 54

Median correct participant score (IQR) 37.0
(35.0, 38.5) 36.0
(33.0, 38.0)
Median sensitivity, participant level (IQR) 76.5
(64.9, 87.1) 83.7
(71.6, 94.1)
Median specificity, participant level (IQR) 100.0
(94.6, 100.0) 94.7
(79.2, 100.0)
The number of vignettes classified correctly, and the sensitivity and specificity, are shown summed across all
participants within each professional group (‘overall,’ first three rows) and at the level of participants
(‘participant level,’ last three rows). The first row of the table represents the primary analysis.
Figure 4 Comparison between optometrists and ophthalmologists for the primary outcome
Black dashed line represents the non-inferiority limit of 0.298. Effect size point estimate is shown as the odds
ratio and the error bar represents the 95% confidence interval. Line of no difference is illustrated by the solid
vertical line at 1.
The median number of correct lesion classifications (compared to the reference standard) by
individual participants was 37 (IQR 35.0 to 38.5) in the ophthalmologists group compared to
36 (IQR 33.0 to 38.0) in the optometrists group. The lowest number of correct lesion
classifications was 26/42 in the ophthalmologists group and 24/42 in the optometrists group;
the highest number of correct lesion reactivation decisions was 41/42, achieved by one
ophthalmologist and three optometrists. It was recommended by a reviewer that the
relationship between years of experience and the number of correct responses of
ophthalmologists should be explored. Appendix 3 Figure 19 suggested no clear relationship.
Appendix 3 Figure 20 shows a plot of individual optometrist participant scores against their
paired ophthalmologist counterparts for the 48 different sets of vignettes. The sensitivity and
specificity (Table 6; described in 2.7.1), and detailed breakdown of the participants’
Page 55

classifications (Table 7 and Figure 5), show the agreement between participants and the
reference standard in more detail. Figure 5 shows that optometrists were more likely to
correctly classify a vignette as reactivated than ophthalmologists (80% vs. 74.0%) but were
less likely to correctly classify a vignette as quiescent (65.7% vs. 81.7%).
A post-hoc analysis to look at this subgroup effect was undertaken. The interaction between
participant group and reference standard vignette classification (reactivated vs.
quiescent/suspicious) was statistically significant (interaction p-value <0.001); the odds of an
optometrist being correct was about 50% higher than an ophthalmologist if the reference
standard classification was reactivated (OR 1.52, 95% CI 1.08 to 2.15, p-value 0.018) but
about 70% lower if the reference standard classification was quiescent/suspicious (OR 0.27,
95% CI 0.17 to 0.44, p-value <0.001).
Table 7 Participants’ lesion classifications compared to the reference standard
Participant lesion classification by reference standard classification
Ophthalmologists Optometrists Overall
n % n % n %
Reactivated (n=142)
Reactivated 736/994 74.0% 795/994 80.0% 1531/1988 77.0%
Suspicious 196/994 19.7% 142/994 14.3% 338/1988 17.0%
Quiescent 62/994 6.2% 57/994 5.7% 119/1988 6.0%
Suspicious (n=5)
Reactivated 1/35 2.9% 10/35 28.6% 11/70 15.7%
Suspicious 17/35 48.6% 11/35 31.4% 28/70 40.0%
Quiescent 17/35 48.6% 14/35 40.0% 31/70 44.3%
Quiescent (n=141)
Reactivated 35/987 3.5% 105/987 10.6% 140/1974 7.1%
Suspicious 146/987 14.8% 234/987 23.7% 380/1974 19.3%
Quiescent 806/987 81.7% 648/987 65.7% 1454/1974 73.7%
Page 56

Figure 5 Participants’ lesion classifications for vignettes classified as reactivated or quiescent by the reference standard
74.0
19.7
6.2
80.0
14.3
5.7
3.5
14.8
81.7
10.6
23.7
65.7
20%
40%
60%
80%
100%
Ophthalmologists Optometrists Ophthalmologists Optometrists
Reference standard = Reactivated(994 observations on 142 vignettes)
Reference standard = Quiescent(987 observations on 141 vignettes)
Reactivated Suspicious Quiescent
Per
cent
age
of p
artic
ipan
ts
The 35 observations in each group for the 5 vignettes classified by the reference standard as “suspicious” are not
shown in this graph. (The data are: ophthalmologists: 1=Reactivated (2.9%), 17=Suspicious (48.6%),
17=Quiescent (48.6%); optometrists: 10=Reactivated (28.6%), 11=Suspicious (31.4%), 14=Quiescent (40.0%).
These data are consistent with a more cautious approach to decision-making about retreatment by optometrists
compared to ophthalmologists.)
3.8 Secondary outcomes
3.8.1 Serious sight threatening errors
Serious sight-threatening errors could only occur for the vignettes which were classified as
‘reactivated’ by the reference standard. These errors occurred in 62/994 (6.2%) of
ophthalmologists’ classifications and 57/994 (5.7%) of optometrists’ classifications; this
difference was not statistically significant (OR 0.93, 95% CI 0.55 to 1.57, p-value 0.789).
Each participant viewed between 15 and 27 ‘reactivated’ vignettes and the most sight
threatening errors made by a single participant was eight (out of 25) in the ophthalmologists
group and five (out of 19) in the optometrists group (Table 8). Table 8 also shows the number
of non-sight-threatening errors, i.e. participants classifying vignettes as reactivated when the
reference standard was quiescent. This type of error occurred more frequently in the
Page 57

optometrists group (105/987, 10.6%) than the ophthalmologists group (35/987, 3.5%); this
difference was not formally compared.
Table 8 Sight threatening and non sight threatening serious errors
Type of serious error
Ophthalmologists(n=48)
Optometrists(n=48)
OR(95% CI) p-value
n % n %
Sight threatening 62/994 6.2% 57/994 5.7% 0.93 (0.55, 1.57) 0.789
Non sight threatening 35/987 3.5% 105/987 10.6%
Number of participants making different numbers of sight threatening serious errorsa
0 error 17/48 35.4% 19/48 39.6%
1 error 13/48 27.1% 13/48 27.1%
2 errors 11/48 22.9% 8/48 16.7%
3 errors 5/48 10.4% 5/48 10.4%
4 errors 1/48 2.1% 2/48 4.2%
5 errors 0/48 0.0% 1/48 2.1%
8 errors 1/48 2.1% 0/48 0.0%
Number of participants making different numbers of non sight threatening serious errorsa
0 error 27/48 56.3% 19/48 39.6%
1 error 11/48 22.9% 6/48 12.5%
2 errors 7/48 14.6% 7/48 14.6%
3 errors 2/48 4.2% 4/48 8.3%
4 errors 1/48 2.1% 3/48 6.3%
5 errors 0/48 0.0% 5/48 10.4%
7 errors 0/48 0.0% 3/48 6.3%
15 errors 0/48 0.0% 1/48 2.1%
A participant could only make one such error per vignette, i.e. only one (of 48) ophthalmologists made 8 sight
threatening errors and only one (of 48) optometrists made 15 non sight threatening errors.
Page 58

3.8.2 Lesion components
We did not attempt to reach a consensus between the three experts for the individual features
of the vignettes. Therefore, responses given by the professional groups for these individual
features were formally compared to each other, rather than to any reference standard.
Optometrists judged lesion components to be present more often than ophthalmologists for all
components except PED (Table 9 and Figure 6). This difference was particularly evident for
DRT and exudates; the odds of identifying these components as present were more than three
times higher in the optometrists group than ophthalmologists group (OR 3.46, 95% CI (2.09
to 5.71), p-value <0.001 and OR 3.10, 95% CI (1.58, 6.08), p-value <0.001, respectively).
SRF was also reported significantly more often by optometrists than ophthalmologists (OR
1.73, 95% CI 1.21 to 2.48, p-value 0.002). The difference between the groups was of
borderline statistical significance for blood (OR 1.56, 95% CI 1.00 to 2.44, p-values 0.048).
The differences between the groups for IRC and PED did not differ statistically (OR 1.00,
95% CI 0.61 to 1.65, p-value 0.985 and OR 0.91, 95% CI 0.47 to 1.79, p-value 0.786,
respectively).
Table 9 Identification of lesion components by professional group a
Secondary outcomes Ophthalmologists(n=48)
Optometrists(n=48)
OR(95% CI) p-value
n % n %
Is there SRF? 515/2016 25.5% 627/2016 31.1% 1.73(1.21, 2.48) 0.002
Has it increased since baseline? 498/515 96.7% 541/627 86.3%
Are there IRC? 799/2016 39.6% 808/2016 40.1% 1.00(0.61, 1.65) 0.985
Has it increased since baseline? 667/799 83.5% 683/808 84.5%
Is there DRT? 482/2016 23.9% 826/2016 41.0% 3.46(2.09, 5.71) <0.001
Has it increased since baseline? 381/482 79.0% 597/826 72.3%
Is there any PED? 845/2016 41.9% 842/2016 41.8% 0.91 0.786Page 59

(0.47, 1.79)
Has it increased since baseline? 311/845 36.8% 392/842 46.6%
Is there blood? 150/2016 7.4% 194/2016 9.6% 1.56(1.00, 2.44) 0.048
New or increased since baseline? 126/150 84.0% 146/194 75.3%
Are there exudates? 152/2016 7.5% 380/2016 18.8% 3.10(1.58, 6.08) <0.001
New or increased since baseline? 38/152 25.0% 87/380 22.9%
a Table 13 shows the frequencies with which lesions components were identified by the experts.
Figure 6 Lesion components
3.10 (1.58, 6.08)
1.56 (1.00, 2.44)
0.91 (0.47, 1.79)
3.46 (2.09, 5.71)
1.00 (0.61, 1.65)
1.73 (1.21, 2.48)
p=0.001
p=0.048
p=0.786
p<0.001
p=0.984
p=0.002
Exudates
Blood
PED
Diffuse retinal thickening
Intra-retinal cysts
Sub-retinal fluid
.06 .12 .25 .5 1 2 4 8 16
Odds ratio (95% CI) <-- More ophthalmologists More optometrists --> reported lesion component present
Point estimates for different lesion components are odds ratios and error bars are 95% confidence intervals. Line
of no difference is illustrated by the vertical dashed line at 1.
3.8.3 Confidence ratings
Page 60

The confidence ratings displayed in Table 10 show that ophthalmologists were clearly more
confident in their decisions than optometrists. Ophthalmologists stated that they were very
confident (5 on the rating scale) in their judgements for 1175/2016 (58.3%) vignettes whereas
optometrists reporting the same level of confidence in their judgements for only 575/2016
(28.5%) vignettes (OR 0.15, 95% CI 0.07 to 0.32, p-value <0.001). For both groups, a
confidence rating of 5 resulted in a correct answer over 90% of the time, but there did not
appear to be any clear relationship between confidence and correctness for less confident
ratings, especially for optometrists (Table 10).
Table 10 Confidence in classification of activity status of lesions by professional group
Secondary outcomes Ophthalmologists(n=48)
Optometrists(n=48)
OR(95% CI) p-value
n % n %
Confidence rating
1 7/2016 0.3% 52/2016 2.6%
0.15(0.07, 0.32) a <0.001
2 26/2016 1.3% 140/2016 6.9%
3 220/2016 10.9% 496/2016 24.6%
4 588/2016 29.2% 753/2016 37.4%
51175/201
6 58.3% 575/2016 28.5%
Correct lesion classifications for each confidence rating b
1 3/7 42.9% 42/52 80.8%
2 21/26 80.8% 114/140 81.4%
3 147/220 66.8% 362/496 73.0%
4 474/588 80.6% 634/753 84.2%
51077/117
5 91.7% 550/575 95.7%
a Comparison of optometrists vs. ophthalmologists; odds of a confidence rating of 5 vs a rating of 1-4
Page 61

b For example, of the 7 vignettes which ophthalmologists gave a confidence rating of 1, 3 were correct with
respect to the primary outcome.
3.9 Key vignette information
It was stated in the protocol that the effect of key vignette features on correct reactivation
decisions would be assessed. For interpretability we modelled the effect of these features on
the number of incorrect classifications.
The influence of vignette features was investigated using Poisson regression, adjusting for the
reference standard classification. Interactions between these vignette characteristics and
professional group were tested but were not retained as they were not statistically significant
at the 5% level. The outcome of this analysis can be seen in Figure 7; professional group,
gender, cardiac history and age did not significantly influence the number of incorrect
classifications. In contrast, the reference standard classification, smoking status and BCVA
sum and difference were all statistically significant (p<0.001, p=0.005, p=0.001 and p=0.004
respectively). Vignettes of current smokers were more likely to be incorrectly classified than
non-smokers, but differences between ex-smoker and non-smoker vignettes were not found
(incidence rate ratio [IRR] 1.33, 95% CI 1.05 to 1.70, and IRR 0.91, 95% CI 0.76 to 1.10,
respectively). Vignettes with better BCVA (larger average BCVA over the two visits) were
less likely to be incorrectly classified (IRR 0.996, 95% CI 0.993 to 0.998), while vignettes
with a greater increase in BCVA from baseline to index visit were more likely to be
incorrectly classified (IRR 1.017, 95% CI 1.005 to 1.028). Vignettes classified as reactivated
by the reference standard were more likely to be incorrectly classified (IRR 3.16, 95% CI
2.62 to 3.81); this finding was in agreement with the raw data displayed in Figure 5 (noting
that, in the two right hand columns, classifications of quiescent and suspicious should be
pooled for the total percentage correct).
Page 62

Figure 7 Influence of key vignette information
1.017 (1.005, 1.028), p=0.0040.996 (0.993, 0.998), p=0.001 1.000 (0.987, 1.014), p=0.964 0.897 (0.721, 1.116), p=0.325 1.334 (1.048, 1.699)0.913 (0.757, 1.101), p=0.005 0.915 (0.766, 1.092), p=0.327 3.160 (2.618, 3.814), p<0.001 1.081 (0.920, 1.271), p=0.342
BCVA differenceBVCA sum
Age (years)
Cardiac historyNo cardiac history
Current smokerEx-smoker
Never smoked
FemaleMale
RS ReactivatedRS Quiescent/Suspicious
OptometristsOphthalmologists
0.5 1 2 4Incidence rate ratio (95% CI)
<-- Less incorrect responses More incorrect responses -->
RS=reference standard. BCVA=best corrected visual acuity. Cardiac history included angina, myocardial
infarction and/or heart failure. Point estimates show rate ratios and error bars are 95% confidence intervals. Line
of no difference is illustrated by the vertical dashed line at 1. For items of information with multiple categories,
p-values are for tests across all categories.
3.10 Sensitivity analysis
For the primary outcome, a vignette classification was defined as ‘correct’ if the reference
standard and the participant both classified the vignette as ‘reactivated’, or both classified a
vignette as ‘suspicious’/ ‘quiescent’. A sensitivity analysis of the primary outcome was
performed in which suspicious classifications were grouped with reactivated classifications
instead of quiescent classifications. In this analysis, ophthalmologists correctly classified
1756/2016 (87.1%) vignettes and optometrists correctly classified 1606/2016 (79.7%). This
difference was statistically significant (OR 0.51, 95% CI 0.38 to 0.67, p-value <0.001), but
the lower end of the CI did not cross the non-inferiority margin (0.298). Therefore, when
correct classifications were redefined in this way, optometrists were statistically inferior but
clinically non-inferior to ophthalmologists.
Page 63

3.11 Additional (post-hoc) analyses
3.11.1 Vignette classifications compared to referral recommendations It was of interest to see how lesion classification decisions related to referral decisions. These
should be congruent (as referral decisions should be made based on classification decisions)
but no such rules were imposed in this trial. Table 11 illustrates that, as expected, lesions
classified as reactivated were usually paired with a recommendation for rapid referred to
hospital (1679/1682, 99.9%) and lesions classified as quiescent were usually paired with a
recommendation for review in four weeks (1526/1604, 95.1%). There was very little
difference between the two professional groups in the extent to which lesion classifications
and referral decisions were paired. Lesions classified as suspicious were often paired with a
recommendation for review in two weeks (605/746, 81.1%) but rapid referral to hospital was
not uncommon (131/746, 17.6%). Optometrists tended to pair suspicious classifications with
review in two weeks more often than ophthalmologists (87.3% vs. 74.4%), whereas
ophthalmologists tended to pair suspicious classifications with rapid referral to hospital more
often than optometrists (24.8% vs. 10.9%).
Table 11 Referral recommendation by lesion classification decision
Referral decisions by lesion classification
Ophthalmologists(n=48)
Optometrists(n=48)
Overall(n=96)
n % n % n %
Reactivated
Refer to hospital 771/772 99.9% 908/910 99.8% 1679/1682 99.8%
Review in 2 weeks 0/772 0.0% 2/910 0.2% 2/1682 0.1%
Review in 4 weeks 1/772 0.1% 0/910 0.0% 1/1682 0.1%
Suspicious
Refer to hospital 89/359 24.8% 42/387 10.9% 131/746 17.6%
Review in 2 weeks 267/359 74.4% 338/387 87.3% 605/746 81.1%
Review in 4 weeks 3/359 0.8% 7/387 1.8% 10/746 1.3%
Quiescent
Page 64

Refer to hospital 1/885 0.1% 1/719 0.1% 2/1604 0.1%
Review in 2 weeks 44/885 5.0% 32/719 4.5% 76/1604 4.7%
Review in 4 weeks 840/885 94.9% 686/719 95.4% 1526/1604 95.1%
3.11.2 Duration of vignette assessment The assessment durations were calculated for each participant as the difference between the
time an assessment was saved and the time the previous assessment was saved. Therefore,
this information was not available for all 4032 assessments because many participants took
breaks between assessments (see 2.7.5 for details). The median durations of vignette
assessment for all main study assessments were 2:21 minutes (IQR 1:39 to 3:27, n=1835) for
ophthalmologists and 3:02 minutes (IQR 2:05 to 4:57, n=1758) for optometrists. Assessment
time on average reduced as experience increased, especially in the optometrists group; for
ophthalmologists and optometrist respectively, the median assessment durations were 2:44
minutes (IQR 2:03 to 4:40, n=45) and 5:23 minutes (IQR 3:18 to 10:03, n=41) for the second
main study vignette, and 1:55 minutes (IQR 1:19 to 2:49, n=48) and 2:31 minutes (IQR 1:52
to 4:26, n=48) for the 42nd (final) main study vignette. Figure 8 shows this relationship.
Page 65

Figure 8 Duration of vignette assessment
0
1
2
3
4
5
6
7
8
Ass
essm
ent t
ime
(min
s)
2-6 7-12 13-18 19-24 25-30 31-36 37-42Vignette order
Ophthalmologists Optometrists
Point estimates show median assessment durations and error bars show interquartile ranges.
For vignette assessments where assessment duration was not missing, there were 1570/1835
(85.6%) correct responses by ophthalmologists and 1492/1758 (84.9%) correct responses by
optometrists. Figure 9 illustrates the relationship between assessment duration and the
percentage of correct responses; broadly speaking, shorter assessment durations were more
likely to result in correct lesion assessments than longer assessment durations. This
relationship was similar for both professional groups.
Page 66

Figure 9 Correct responses by vignette assessment duration
Number of vignettesOphthalmologistsOptometrists
60%
70%
80%
90%
100%
Per
cent
age
corr
ect
<1
8537
1-2
615362
2-3
528460
3-4
279284
4-5
121179
5-6
65128
6-7
3474
7+
108234
Assessment time (mins)
Ophthalmologists Optometrists
Point estimates show the percentage of correct assessments and errors bars show exact 95% confidence
intervals.
3.11.3 Expert classifications for derivation of the reference standardEach expert individually assessed the vignettes in order to develop the reference standard
(2.4). The lesion classifications of the three experts were congruent for these assessments for
219/288 (76.0%) vignettes (comprising 103/219 classifications of reactivated and 116/219 of
quiescent). The three experts then held a consensus meeting and jointly assessed the vignettes
for which there was disagreement about the lesion classification. The presence or absence of
lesion components in index images of these vignettes, and their change from baseline, were
discussed in detail. Consensus lesion classifications were agreed which, together with the
congruent classifications, constituted the final reference standard. Experts did not attempt to
reach consensus about specific lesion components. A few specific vignettes were reassessed
by experts who felt that they had made errors about the lesion components in their original
assessments. When carrying out these reassessments, data were only collected for
assessments of the lesion components.
Page 67
Table 12 shows the reference standard classification against each expert’s initial individual
classification; 774/864 (89.6%) of the individual classifications remained unchanged with the
rest (10.4%) being amended after group discussions. The responses that did not change are
shaded grey. The majority of the changed classifications involved an initial classification of
suspicious by one or other expert.
Table 12 Reference standard compared to initial expert classification
Reference standard
Individual experts Reactivated
(n=142)
Suspicious
(n=5)
Quiescent
(n=141)
Agreement
Expert 1 89.9%
Reactivated 131 1 4
Suspicious 6 4 13
Quiescent 5 0 124
Expert 2 86.1%
Reactivated 110 0 0
Suspicious 14 0 3
Quiescent 18 5 138
Expert 3 92.7%
Reactivated 134 1 5
Suspicious 3 3 6
Quiescent 5 1 130
3.11.4 Comparing lesion component classifications across experts
Although a reference standard was established for the overall lesion classification, no such
standard was established for the lesion component classifications. Therefore, it was of interest
to compare lesion component classifications across experts for the six lesion components.
The experts could classify each lesion component as either absent, present but not increased
since baseline, or present and increased since baseline. The frequencies with which each
Page 68

expert identified different lesion components across all vignettes are shown in Table 13.
Agreement between experts with respect to lesion components is shown in Table 14. Table
14 highlights that agreement was best for blood and exudates; the three experts agreed about
blood classification for 266/288 (92.4%) vignettes and exudate classification for 260/288
(90.3%) vignettes. Table 13 shows that experts observed no blood or exudates on the index
colour images of >90% of the vignettes. Agreement for SRF and IRC was also high with total
agreement for 259/288 (89.9%) and 243/288 (84.4%) of the vignettes respectively.
Interestingly, for both these components, expert 2 disagreed with the other two experts
slightly more often than experts 1 and 3 did with each other; Table 13 highlights that expert 2
identified SRF to be present more often than experts 1 and 3, and identified IRC to be present
less often than experts 1 and 3. Agreement between experts was lower for DRT and PED than
the other components, suggesting classification of these components was potentially more
difficult or less clear cut. Additionally, Table 14 shows the agreement between the experts
about the overall lesion classification, prior to any discussions to agree the reference
standard.
Table 13 Lesion component classifications of individual experts
Lesion component Absent Present but not
increased
Present and
increased since
baseline
n (%) n (%) n (%)
SRF
Expert 1 222 (77.1%) 0 (0.0%) 66 (22.9%)
Expert 2 197 (68.4%) 3 (1.0%) 88 (30.6%)
Expert 3 220 (76.4%) 0 (0.0%) 68 (23.6%)
IRC
Expert 1 193 (67.0%) 9 (3.1%) 86 (29.9%)
Expert 2 206 (71.5%) 12 (4.2%) 70 (24.3%)
Expert 3 190 (66.0%) 6 (2.1%) 92 (31.9%)
DRT
Expert 1 189 (65.6%) 6 (2.1%) 93 (32.3%)
Expert 2 237 (82.3%) 5 (1.7%) 46 (16.0%)
Expert 3 252 (87.5%) 6 (2.1%) 30 (10.4%)
Page 69

PED
Expert 1 129 (44.8%) 95 (33.0%) 64 (22.2%)
Expert 2 53 (18.4%) 185 (64.2%) 50 (17.4%)
Expert 3 93 (32.3%) 127 (44.1%) 68 (23.6%)
Blood
Expert 1 267 (92.7%) 2 (0.7%) 19 (6.6%)
Expert 2 266 (92.4%) 2 (0.7%) 20 (6.9%)
Expert 3 261 (90.6%) 2 (0.7%) 25 (8.7%)
Exudates
Expert 1 266 (92.4%) 13 (4.5%) 9 (3.1%)
Expert 2 279 (96.9%) 7 (2.4%) 2 (0.7%)
Expert 3 283 (98.3%) 1 (0.3%) 4 (1.4%)
SRF=sub-retinal fluid, IRC=intra-retinal cysts, DRT=diffuse retinal thickening, PED=pigment epithelial
detachment.
Table 14 Comparison of lesion component classifications across experts
Lesion
component
All experts
agree
Experts 1
and 2 agree
(3 differs)
Experts 1
and 3 agree
(2 differs)
Experts 2
and 3 agree
(1 differs)
None
agree
Kappa
statistic
n (%) n (%) n (%) n (%) n (%) n (%)
Overall lesion
classification
219 (76.0%) 16 (5.6%) 31 (10.8%) 15 (5.2%) 7 (2.4%) 0.697
SRF 259 (89.9%) 4 (1.4%) 21 (7.3%) 4 (1.4%) 0 (0.0%) 0.827
IRC 243 (84.4%) 8 (2.8%) 22 (7.6%) 11 (3.8%) 4 (1.4%) 0.759
DRT 189 (65.6%) 36 (12.5%) 17 (5.9%) 43 (14.9%) 3 (1.0%) 0.327
PED 134 (46.5%) 23 (8.0%) 55 (19.1%) 67 (23.3%) 9 (3.1%) 0.420
Blood 266 (92.4%) 7 (2.4%) 6 (2.1%) 9 (3.1%) 0 (0.0%) 0.660
Page 70

Exudates 260 (90.3%) 4 (1.4%) 4 (1.4%) 19 (6.6%) 1 (0.3%) 0.183
SRF=sub-retinal fluid, IRC=intra-retinal cysts, DRT=diffuse retinal thickening, PED=pigment epithelial
detachment.
3.12 Participants views on ECHoES training
This section includes information provided by all participants who completed the
questionnaire eliciting their opinions of the ECHoES training, regardless of whether they
completed the study and were included in the analysis population. A total of 102 participants
completed the questionnaire: 47 ophthalmologists (44 of whom passed training and became
main study participants) and 55 optometrists (47 of whom passed training and became main
study participants).
Overall, participants gave positive feedback about the training. In particular, both the
ophthalmologists and the optometrists commented on the thorough nature of the webinars and
how helpful the trial staff were, particularly the trial co-ordinator. Many optometrists were
pleased to have taken part, finding the training to be ‘very useful’ and noting that the training
had improved their confidence.
Optom262: “Well designed, a lot of thought and hard work to set and to run.”
Ophthalm131: “Extremely useful and well structured.”
Optom269: “I learnt a lot and am pleased I took the opportunity to take part.”
Table 15 shows that more ophthalmologists than optometrists found the web application
harder to use. Of those who provided free text responses, the majority (both ophthalmologists
and optometrists) commented on the content of the training. Specifically, ten participants felt
that the quality of the OCT images were poor. Eight participants (five of whom were
optometrists) also commented that it would have been helpful to have a side by side
comparison of baseline and index images on the same screen, as it was difficult to assess and
time consuming to have to change back and forth between scans. Three participants
commented that they used two different screens alongside each other to overcome this.
Optom254: “Some of the images were difficult to view as they were of poor quality.”
Page 71

Optom268: “I found it time-consuming changing between the baseline and index scans. I speeded up once I solved this by having one set on my iPad and one set on my monitor.”
Optom225: “Only issue I had was that we were unable to compare the baseline and index images side by side which made assessing more difficult.”
Table 15 shows that 78% of optometrists felt that additional training may be required,
compared to only 30% of ophthalmologists. One ophthalmologist and five optometrists
elaborated on this, stating that they had found the content of the webinars to be confusing
(particularly in terms of the questions about lesion components) and one ophthalmologist and
three optometrists said they had found the training challenging.
Optom256: “Uncertainty about the some of the decisions I was making - not good for the nerves!”
Ophthalm102: “Questions sometimes were confusing.”
Opthalm107: “It was really challenging…. you really had to think.”
Years of ophthalmic experience did not appear to influence how well the training was
received; ophthalmologist participants who felt that additional training was required had a
median of 9.6 years of experience (IQR 4.6 to 15.3) whereas ophthalmologist participants
who felt training was completely sufficient had a median of 11.0 years of experience (IQR
5.6 to 16.1). Almost all optometrists (96%) stated that they had revisited the webinar content
compared to half of ophthalmologists (49%; Table 15). On average, the optometrists also
spent over an hour longer revisiting the material than the ophthalmologists. Only 11% of
ophthalmologists said that they had used other resources, compared to 67% of optometrists.
Most participants used websites (25%), a textbook (20%), had discussions with colleagues
(6%) and looked through previous conference notes (3%). With respect to textbooks, the
majority of participants had used ‘Clinical Ophthalmology’ by Kanski and Bowling.26
Table 15 Participants opinions on ECHoES training
ECHoES training feedback
Ophthalmologists
(n=47)
Optometrists
(n=55)
n % n %
What did you think of the training?
Excellent 11/47 23.4% 4/55 7.3%
Page 72

Very good 17/47 36.2% 17/55 30.9%
Good 15/47 31.9% 18/55 32.7%
Fair 4/47 8.5% 11/55 20.0%
Poor 0/47 0.0% 5/55 9.1%
Very poor 0/47 0.0% 0/55 0.0%
How easy did you find the web application to use?
Very easy 23/47 48.9% 22/55 40.0%
Easy 20/47 42.6% 23/55 41.8%
Neutral 2/47 4.3% 7/55 12.7%
Difficult 2/47 4.3% 2/55 3.6%
Very difficult 0/47 0.0% 1/55 1.8%
Was the training sufficient?
Completely sufficient 33/47 70.2% 6/55 10.9%
Additional training required 14/47 29.8% 43/55 78.2%
Completely different training required 0/47 0.0% 6/55 10.9%
Did you revisit webinars?
Did not revisit 24/47 51.1% 2/55 3.6%
Did revisit 23/47 48.9% 53/55 96.4%
If revisited, how long for? (hours; median,
IQR) 1 (1, 2) 3 (2, 3)
Did you use other resources?
Did not use other resources 42/47 89.4% 18/55 32.7%
Did use other resources 5/47 10.6% 37/55 67.3%
If other resources used, how long for? (hours;
median, IQR) 3 (1, 3) 3 (2, 4)
Page 73

4. Results: health economics (objective 4)
4.1 Resource use and unit costs
Tables 16 to 22 present the main results of the analysis of resource use and costs. In
summary, Tables 16 to 19 present resource use results, with Table 20 providing information
on most of the unit costs which would be added to the resource use information and staff unit
cost information is presented in the next table (Table 21). The resource use and unit costs
information are combined and presented in Table 22, which reports the cost of a monitoring
review performed by community optometrists.
More specifically, Table 16 shows the mean numbers of equipment items which the
community optometrists stated that they already had in their practices when they completed
the online resource questionnaire. Although most practices have a CF camera, less than half
have a projector which includes an ETDRS (Early treatment of diabetic retinopathy study)
chart or a retro-illuminated light box.
Table 16 Optometrist capital (equipment and building) resources
Resource item Number of
responses
Mean number
(SD)
Building
Approximate size (floor space, square metres) 27 173.10 (266.37)
Approximate size (number of rooms) 40 3.5 (2.20)
Equipment for monitoring review
Mean number of items of
equipment per practice
(SD)
ETDRS visual acuity charts: 4 metres viewing
distance required (with/without mirrors)
40 0.575 (0.984)
Projector that includes ETDRS chart 39 0.46 (0.756)
Retro-illuminated light box 39 0.49 (1.022)
Trial frame 40 2.225 (1.230)
Lens set 40 2 (0.905)
Page 74

Light meter to measure luminance. e.g. SPER
Scientific
40 0.1 (0.304)
Slit-lamp 40 1.75 (0.776)
CF camera 39 0.72 (0.456)
OCT acquisition system 37 0.22 (0.417)
OCT acquisition system with fundus
photography included as a component
38 0.342 (0.481)
Computer 39 4.92 (3.382)
Computer network a 40 0.63 (0.490)
Printer 40 2.73 (1.66)
a Maximum of 1 network included per practice
In terms of floor space, the respondents said that the average floor space was 173 square
metres and the average number of rooms in the practice was 3.5 (SD =2.20). Of the 39
community optometrists who replied to the question about the need to make modifications to
their premises in order to assess nAMD patients, just over 50% said that they would need to
do so (mean = 0.54, SD 0.505).
In terms of staffing resources, Table 17 presents a breakdown of activities for the monitoring
review, the staff members who would perform the various tasks and the average predicted
time for the tasks. The optometrists said that they would always take a patient history, carry
out a clinical examination and make the final assessment and that they would be largely
responsible for other activities such as undertaking OCTs; pre-registration optometrists and
other support staff could help in some of these other activities. The optometrists stated that
they anticipated booking appointments for patients only rarely, since this activity was mainly
done by clerical/administrative staff.
Table 17 Staff performing each task and average duration of each task
Role in Main member of Other staff performing Mean durationc Number of
Page 75

monitoring
review
staff performing
task (%)
task (%) in minutes (SD) responses
Taking patient
history
Optometrist
(100%)
Pre-registration optometrista 4 (1.50) 40
Clinical
examination
Slit lamp
biomicroscopy
Anterior
segment and
macula
Optometrist
(100%)
Pre-registration optometristb 4 (1.50) 40
Visual acuity
assessment
Optometrist (95%) Pre-registration optometrist,
optical assistant (5%)
8 (2.98) 38
Administration of
1% tropicamide
drops
Optometrist
(92.5%)
Pre-registration optometrist,
optical assistant (7.5%)
1 (0.37) 37
CF photography
(or equivalent CF
image)
Optometrist
(67.5%)
Pre-registration optometrist,
optical assistant,
clerical/retailer staff,
practice manager other
administrative staff (32.5%)
4 (1.38) 27
Spectral domain
OCT
Optometrist
(67.5%)
Pre-registration optometrist,
optical assistant,
clerical/retailer staff,
practice manager other
administrative staff (32.5%)
4 (1.35) 27
Final assessment Optometrist
(100%)
n/a 5 (1.88) 40
Update Optometrist
(77.5%)
Pre-registration optometrist,
optical assistant,
clerical/retailer staff,
practice manager other
administrative staff (22.5%)
2 (0.73) 31
Page 76

Booking
appointments
Optometrist (2.5%) Pre-registration optometrist,
optical assistant,
clerical/retailer staff,
practice manager other
administrative staff (97.5%)
1 (n/a) 1
CF=colour fundus. OCT=optical coherence tomography. a Pre-registration optometrist could replace main optometrist in this task.b Pre-registration optometrist could replace main optometrist in this taskc Based on optometrist report of duration of the whole monitoring consultation and expert advice on the
percentage of time devoted to each task.
Tables 18 and 19 present information on the number of times that optometrists and
ophthalmologists revisited the webinars and consulted other resources. As already described
(3.12), the ophthalmologists were less likely to revisit the webinars or seek out other sources
of information, which might be predicted given that they have more experience in caring for
nAMD patients compared to optometrists.
Table 18 Time spent by optometrists on revisiting webinars and consulting other resources
Time spent Number of optometrists revisiting webinars (% of observations)
Number of optometrists consulting other resources
(% of observations)
up to 30 minutes 4 (8%) 4 (11%)
30 minutes – 1 hours 16 (30%) 13 (34%)
1 -2 hours 21 (40%) 10 (26%)
2-4 hours 9 (17%) 8 (21%)
over 4 hours 3 (6%) 3 (8%)
Number of observations 53 38
Table 19 Time spent by ophthalmologists on revisiting webinars and consulting other resources
Time spent Number of ophthalmologists Number of ophthalmologists Page 77
revisiting webinars (% of observations)
consulting other resources (% of observations)
up to 30 minutes 13 (57%) 3 (38%)
30 minutes – 1 hours 5 (22%) n/a
1 -2 hours 4 (17%) 4 (50%)
2-4 hours n/a n/a
over 4 hours 1 (4%) 1 (12%)
Number of observations 23 8
The medical retina experts spent 30 hours preparing and delivering the webinar training for
the ECHoES trial (i.e. 15 hours for preparing the webinars, 5 hours for agreeing on the
content of webinars and 10 hours for delivering the webinars to the participants).
Table 20 provides a summary of the unit costs which were attached to the resource use
information above.
Table 20 ECHoES unit costs (2013/2014 prices unless otherwise stated)
Item Unit cost (£)
Source Notes
ETDRS visual acuity charts - 4 metres viewing distance required
£83.00 Expert’s opinion: http://sussexvision.co.uk/index.php/distance-tests/logmar-charts/4-metre-viewing/logmar-4m-etdrs-chart-r-original.html
(accessed 30/09/14)
Sussex Vision item.
ECHoES protocol requires three of them: one for doing the refraction, one for the right eye and one for the left eye.
Projector that includes ETDRS chart
£2,850.00 Personal communication with Topcon: model
1240263 CC-100XP LED with remote control
(accessed 29/09/14)
Model
1240263 CC-100XP LED with remote control
Retro-illuminated light box
£878.00 Expert’s opinion:
http://sussexvision.co.uk/
Sussex vision item
Page 78

Item Unit cost (£)
Source Notes
index.php/distance-tests/logmar-test-types/precision-vision-logmar-cabinet.html
(accessed 30/09/14)
Bulb for retro-illuminated light box
£15.00 Expert’s opinion:
http://sussexvision.co.uk/index.php/distance-tests/logmar-test-types/tube-for-sdt-396-lpv-cabinet-without-diffuser.html
(accessed 30/09/14)
Sussex vision item.
Two bulbs: bulb needs to be replaced every two years, for each chart.
Trial frame £375.00 Expert’s opinion:
http://www.opticalmarketplace.co.uk/new-equipment/optical-equipment/trial-frames/omp1559/oculus-ub4-trial-frame/
(accessed 30/09/14)
Optical market place
Lens set £475.00 Expert’s opinion:
http://www.opticalmarketplace.co.uk/new-equipment/optical-equipment/trial-lens-sets/omp1464/quality-trial-lens-set/
(accessed 30/09/14)
Optical market place item
Light meter to measure luminance. e.g. SPER Scientific
£120.00 Expert’s opinion:
http://www.coleparmer.co.uk/Product/Sper_Scientific_840006_Light_Meter_with_Analog_Output/UY-01588-24?referred_id=3482&gclid=CKX6m8PjiMECFUn3wgodxJYA6Q
(accessed 30/09/14)
Cole Parmer item
Slit-lamp £4000.00 Expert’s opinion Personal communication
Computer £549.00 http://www.dell.com/uk/business/p/desktops-n-workstations.aspx?
Dell desktop OptiPlex 9020
Page 79
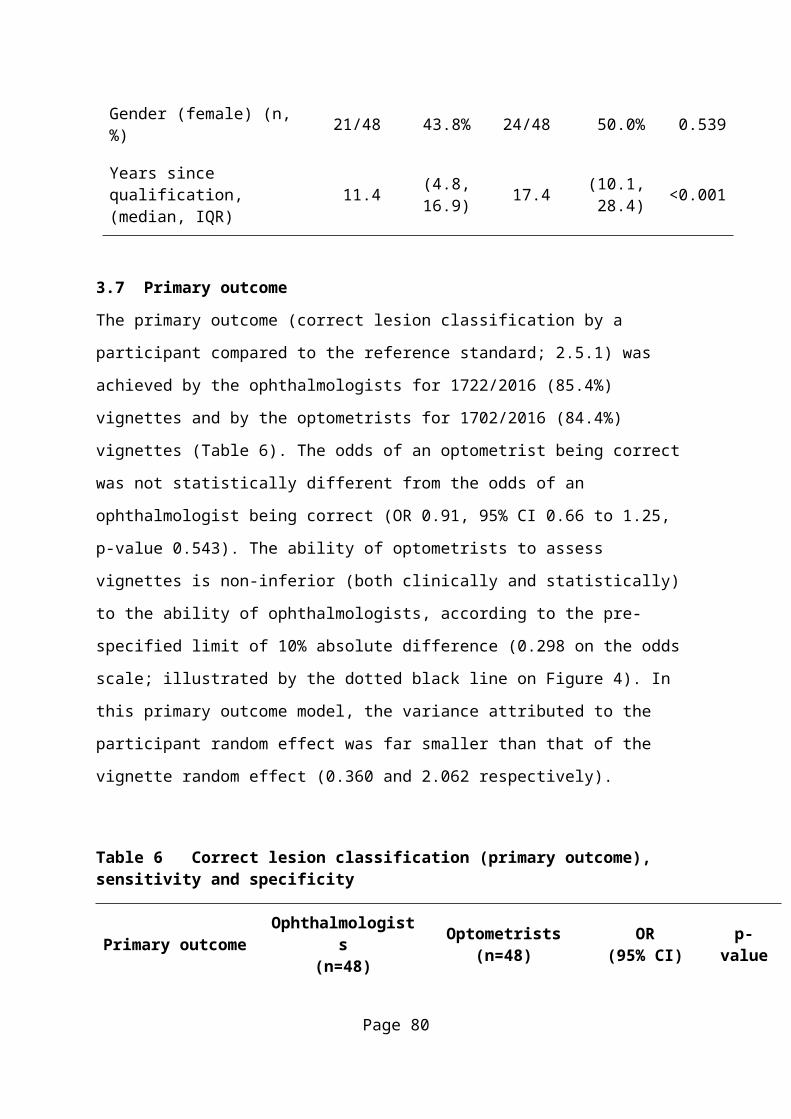
Item Unit cost (£)
Source Notes
c=uk&l=en&s=bsd&~ck=mn
(accessed 01/10/14)
Computer network £1000.00 Expert’s opinion confirming estimates at http://www.itdonut.co.uk/it/communications/networking
(accessed 29/09/14)
Guide price to build a simple network of up to ten computers
Printer £155.00 http://accessories.euro.dell.com/sna/sna.aspx?c=uk&cs=ukdhs1&l=en&s=dhs&~topic=printer_shopall_lasers
(accessed 1/10/14)
Dell C1660w colour printer
Eye drops, tropicamide 1%
£0.50 British National Formulary
https://www.medicinescomplete.com/mc/bnf/current/PHP6943-minims-tropicamide.htm?q=minims%20tropicamide&t=search&ss=text&p=1#PHP6943-minims-tropicamide
(accessed 06/11/14)
Single use - net price
20 × 0.5 mL = £10.00
Consultant £139.00 Personal Social services Research Unit. Units Costs of Health and Social Care 2013. University of Kent.
Table 15.5a Consultant: medical. Cost including
Qualifications.
ratio ‘salary oncost/salary’ 0.234
Personal Social services Research Unit. Units Costs of Health and Social Care 2013. University of Kent.
Table 9.1a Community physiotherapist. Ratio applied to salary as reported by participant to the Health Economics Questionnaire
ratio ‘qualification/salary’ 0.237
Personal Social services Research Unit. Units Costs of Health and Social Care 2013. University of Kent.
Table 9.1a Community physiotherapist. Ratio applied to salary as reported by participant to the Health Economics Questionnaire
ratio ‘overheads/salary’
0.756 Personal Social services Research Unit. Units Costs of Health and Social Care 2013. University of
Table 9.1a Community physiotherapist. Ratio applied to salary as reported
Page 80
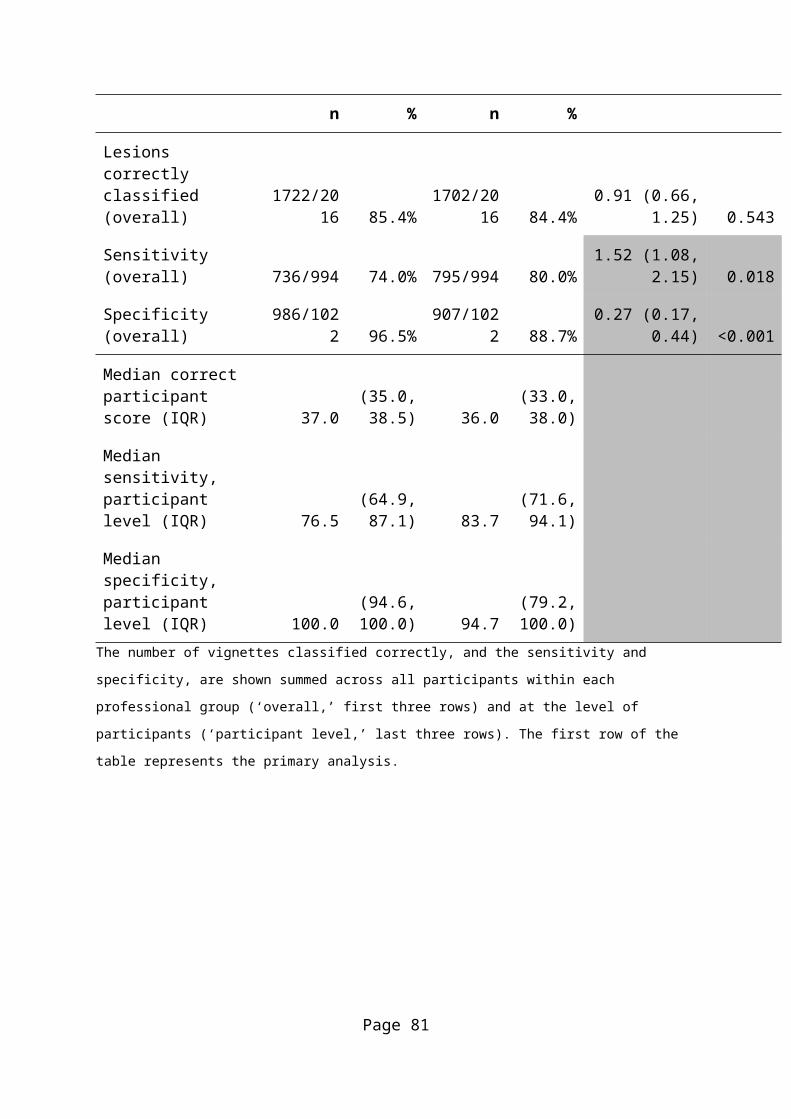
Item Unit cost (£)
Source Notes
Kent. by participant to the Health Economics Questionnaire
ratio ‘capital overheads/salary’ 0.093
Personal Social services Research Unit. Units Costs of Health and Social Care 2013. University of Kent.
Table 9.1a Community physiotherapist. Ratio applied to salary as reported by participant to the Health Economics Questionnaire
Ranibizumab
(dose of 0.5mg)
£742.00 British National Formulary https://www.medicinescomplete.com/mc/bnf/current/PHP7170-Ranibizumab.htm?q=ranibizumab&t=search&ss=text&p=2#PHP7170-Ranibizumab
(accessed 12/11/2014)
Aflibercept £816.00 British National Formulary
https://www.medicinescomplete.com/mc/bnf/current/PHP19020-Aflibercept.htm?q=Aflibercept&t=search&ss=text&p=1#PHP19020-Aflibercept
(accessed 14/11/14)
Bevacizumab
(dose of 1.25mg)
£49.00 Dakin et al (2014) Price typically charged by the not-for-profit NHS provider used in the IVAN trial (£49/prefilled syringe).
a Table numbers refer to tables in the source document
In terms of unit cost information on salaries for staff working in community optometrist
practice, Table 21 provides a breakdown of the salary bands for different types of staff.
Table 21 Salaries of staff employed in optometrist practices
Salary band Optometrist Pre-registration optometrist
Optical assistant
Clerical/ retailer staff
Practice manager
Other administrative
staff
Page 81

Less than £20,000
4 5 24 14 3 10
£20,000 to £29,999
2 n/a 4 2 5 2
£30,000 to £39,999
9 n/a n/a n/a 6 n/a
£40,000 to £49,999
9 n/a n/a n/a n/a n/a
£50,000 to £59,999
10 n/a n/a n/a n/a n/a
£60,000 to £69,999
4 n/a n/a n/a n/a n/a
£70,000 to £79,999
1 n/a n/a n/a n/a n/a
£80,000 per year or more
1 n/a n/a n/a n/a n/a
Observations 40 5 28 16 14 12
Table 22 shows the combination of resource use and unit cost information which produces
the cost for each of the cost categories. The table also shows the sum of these categories,
which leads to the total average cost per optometrist monitoring review equal to £51.82 per
review (SD 8.153). This figure compares to the average figure of £75.60 (SD 44.31) for
ophthalmologists performing a monitory review, as costed in the IVAN trial.
Table 22 Cost of a monitoring review performed by community optometrists
Cost items Mean cost (SD)
Equipment £22.99* (5.552)
Refurbishment/building/rent £0.05 (0.147)
Staff labour £27.26 (7.317)
Preparation and delivery of webinar training £0.13 (0.101)
Optometrist’s time on training £0.89 (1.080)
Page 82

Eye drops, tropicamide 1% £0.50 (n/a)
Total cost per monitoring review £51.82 (8.153)
* The figure for ophthalmologist cost of purchasing and setting up equipment and facilities was £2 per patient,
with much of the rest of the remaining costs being making up the £75.60 being attributable to staff labour.
4.2 Cost-effectiveness of monitoring by optometrists compared to ophthalmologists
The care pathway cost table (Table 23) shows the cost and effect information combined,
highlighting the impact that incorrect assessments could have on costs. The pathway includes
the cost of a monitoring consultation itself and also downstream costs (e.g. ranibizumab
injections and follow-up visits based on the care cost pathway decision tree).
Table 23 Care pathways costs – base case analysis
Lesion status assessment Observations (% of total)
Pathways costa Mean (SD)
Experts (true) Optometrists’ decision
Reactivated Reactivated 795 (39.43) £935.40 (45.50)
Reactivated Suspicious 142 (7.04) £103.61 (18.51)
Reactivated Quiescent 57 (2.83) £51.29 ( 9.08)
Suspicious Reactivated 10 (0.50) £118.12 (16.39)
Suspicious Suspicious 11 (0.55) £57.04 (9.10)
Suspicious Quiescent 14 (0.69) £52.96 (9.37)
Quiescent Reactivated 105 (5.21) £117.14 (32.61)
Quiescent Suspicious 234 (11.61) £78.31 (11.53)
Quiescent Quiescent 648 (32.14) £51.98 (8.23)
Total 216 (100%) -
Experts (true) Ophthalmologists’ decision
Reactivated Reactivated 736 (36.51) £882.67 (46.41)
Page 83

Lesion status assessment Observations (% of total)
Pathways costa Mean (SD)
Reactivated Suspicious 196 (9.72) £153.18 (92.25)
Reactivated Quiescent 62 (3.08) £77.01 (45.49)
Suspicious Reactivated 1 (0.05) £877.38 (n/a)
Suspicious Suspicious 17 (0.84) £68.84 (31.00)1
Suspicious Quiescent 17 (0.84) £60.57 (17.16)1
Quiescent Reactivated 35 (1.73) £882.29 (38.00)
Quiescent Suspicious 146 (7.24) £150.34 (95.19)
Quiescent Quiescent 806 (39.98) £75.28 (44.72)
Total 216 (100%) -
a This figure is not equal to the cost of one monitoring review for IVAN which was £71 due to the random assignment of costs as described in the methods section for the economic evaluation.
Table 23 shows that, of the vignettes that experts rated as reactivated, the optometrists made
more correct decisions compared to the ophthalmologists (39.43% compared to 36.51%) and
were less likely to mis-classify reactivated lesions as suspicious or quiescent. When
optometrists correctly judge the lesion as reactived, the patient needs to be referred for
another monitoring review at the hospital eye clinic before they actually receive treatment
(anti-VEGF injection). There were 795 vignettes assessed in this category for the
optometrists (39.43%) and only 736 (36.51%) for the ophthalmologists. There are two points
to note here. Firstly, if the optometrist is correct in their diagnosis in the model of care
delineated in this study, the additional cost for an ophthalmologist-led monitoring review will
represent an unnecessary cost. However, if the optometrist is incorrect, then the further
ophthalmologist-led monitoring review will represent a cost saving because in our model of
care we assume that the ophthalmologists are able to detect the mistake and, therefore, the
patient will not undergo the unnecessary treatment. Secondly, and inversely to the
optometrists case, when an ophthalmologist says that a patient requires treatment there is not
a second monitoring review; the patient simply continues to have their treatment, thereby
directly incurring costs. This represents a cost saving with respect to the optometrist’s care
model if the ophthalmologist’s diagnosis is correct (cost of a second monitoring review
Page 84

avoided) but will instead represent an additional unnecessary cost in the event that the
ophthalmologist undertakes unnecessary treatment. Of the vignettes that experts rated as
suspicious, 10 (0.50%) were incorrectly classed as reactivated observations in this category
for the optometrists, compared to only 1 (0.05%) in the ophthalmology group. In this case,
the second monitoring review in the optometrists’ pathway is actually helpful, as it can
prevent unnecessary treatment. However, if we assume that this ophthalmologist would go
onto provide treatment when the patient did not need it, this would cost £877 compared to
only £118 for an optometrist making an incorrect decision here (this figure is the cost of
optometrist review, plus the cost of an ophthalmologist review).
For the truly quiescent vignettes that the health professional incorrectly assesses as
reactivated, the ophthalmologists go ahead with treatment, while the optometrists will refer a
patient to the HES where the mistake will be identified before giving treatment. However,
although the cost consequences of incorrectly rating quiescent eyes as reactivated are much
smaller for optometrists than ophthalmologists, optometrists are three times more likely to
make this error. For cases where participants correctly rate the vignette as suspicious, only
the routine monitoring review is considered here as both optometrists and ophthalmologists
will recommend a subsequent routine check, so options will be cheaper for optometrists than
ophthalmologists in this case, reflecting the differential in cost between the two professionals.
A similar pathway is implemented in ‘suspicious’ cases incorrectly rated as ‘quiescent’.
Table 24 presents the base case analysis of the cost-effectiveness of optometrists as compared
to ophthalmologists in performing monitoring reviews. The cost of a monitoring review is
based on an average of the patient cost pathways in the previous table (unweighted according
to the most likely pathways). The table shows that the mean care pathway cost for each
assessment is quite similar between groups, with £410.78 for optometrists and £397.33 for
ophthalmologists, producing an incremental cost difference of £13.45 (95% CI £17.96,
£44.85). The higher cost for optometrists compared to ophthalmologists may reflect the fact
that optometrists were more likely to incorrectly classify vignettes as reactivated, thereby
incurring higher unnecessary costs for the health service.
Page 85

Table 24 Base case analysis of cost-effectiveness of monitoring review performed by optometrists versus cost of a monitoring review performed by ophthalmologists
OptometristsMean (SD)(n=2016)
OphthalmologistsMean (SD)(n=2016)
Cost of a monitoring review (pathway cost) £410.78 (424.92) £397.33 (387.46)
Proportion of correct assessments 0.844 (0.363) 0.854 (0.353)
Incremental cost (95% CI) £13.45 (-£17.96, £44.85)
Incremental benefit, proportion of correct assessments (95% CI)
-0.0099 (-0.045, 0.025)
ICER, incremental cost per correct assessmenta Dominated
a The 95% confidence interval around the ICER could not be defined
In terms of effectiveness information, the proportion of correct treatment decisions is also
quite similar with around 85% of optometrists and ophthalmologists making correct
decisions; ophthalmologists made marginally more correct decisions but this difference was
not statistically significant. With higher mean costs (albeit not statistically significant) and
lower proportion of correct treatment decisions (albeit not statistically significant) differences
between the groups, Figure 10 shows that the strategy of optometrists performing monitoring
reviews is dominated by ophthalmologist-led reviews, with optometrist-led monitoring
reviews being more costly and less effective. However, the differences are extremely small:
optometrist-led reviews increase the total costs by only £13 per review (3% of the total cost
of the care pathway) and result in only one more incorrect decision per 101 monitoring
reviews conducted. Furthermore, there is substantial uncertainty around this finding. The
CEAC shown in Figure 11 shows that the probability that it is cost-effective for optometrists
to perform monitoring reviews is below 30% regardless of how much we are willing to pay
per correct decision. In fact, if the NHS is willing to pay less than £600 per correct decision,
which is likely to be the case, the probability that it is cost-effective to conduct monitoring by
community optometrists is 14% (for willingness to pay equal to £200) compared to 8% (for
willingness to pay equal to £600).
Page 86
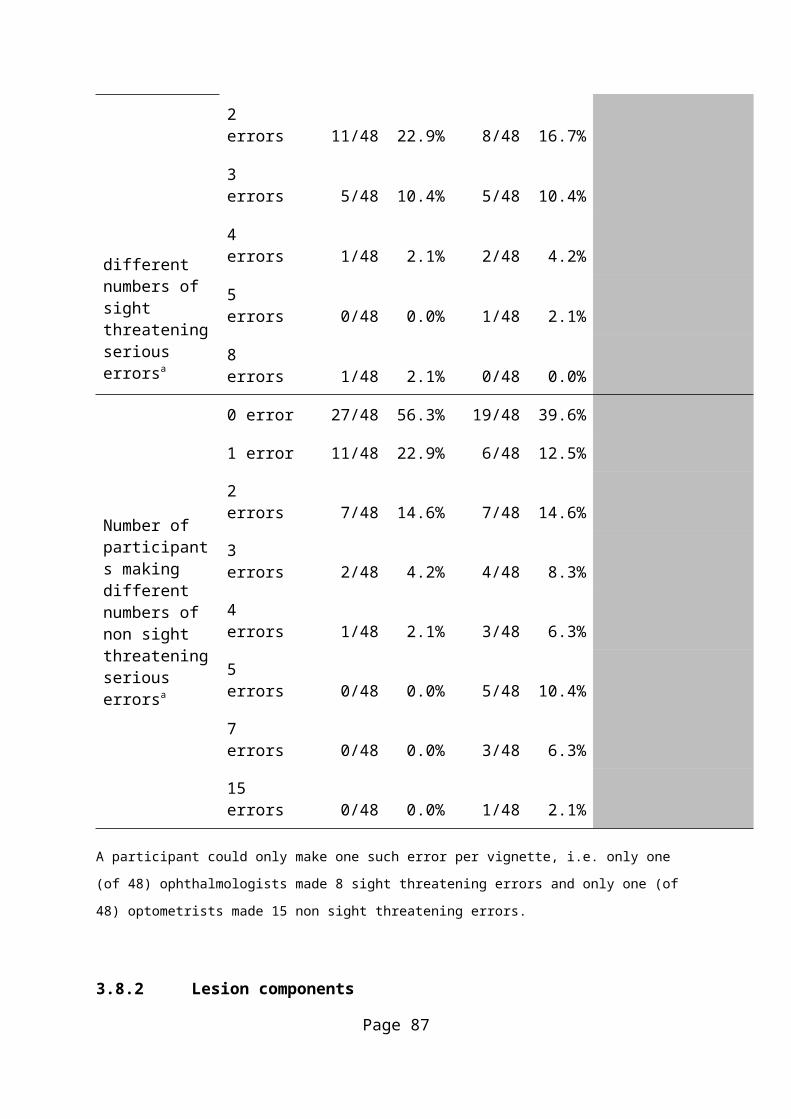
Thus, it appears that there is no willingness to pay level for which we can be 95% confident
that the 2 ways of performing a monitoring review differ in value, i.e. differ in terms of cost-
effectiveness.
Figure 10 Optometrists versus Ophthalmologists Cost-Effectiveness Plane
-22
-4.5
1330
.548
DIF
FER
EN
CE
IN C
OS
T
-.0448096 -.0273651 -.0099206 .0075239 .0249684DIFFERENCE IN EFFECT
The CEAC in Figure 11 shows the probability that the optometrists are cost-effective
compared to ophthalmologists for a range of willingness to pay thresholds. If a decision-
maker is willing to pay £200 for an extra correct retreatment decision, then the probability of
optometrists being cost-effective is around 14%. The probability that optometrists are cost-
effective changes little across a broad range of willingness to pay thresholds, indicating that
this probability is invariant to the willingness to pay threshold.
Page 87

Figure 11 Cost-effectiveness acceptability curve
0.2
5.5
.75
1%
AC
CE
PTA
BLE
0 10000 20000 30000 40000 50000WILLINGNESS TO PAY
Figure 10 presents the cost-effectiveness plane and graphs the point estimate of the ICER and
two confidence ellipses, with the outer ellipse representing the 95% CI and the inner being
the 85% confidence ellipse for our base case analysis. The figure highlights that the 95% CI
is not definable and there is not willingness to pay for which we can be 95% confident that
the optometrist-led and the ophthalmologists-led monitoring reviews differ in value from
each other. The widest definable Fieller interval is 85% and the green line shows the tangent
to the 85% confidence ellipse.
4.3 Sensitivity analyses
One-way sensitivity analyses investigated the impact of varying the way of delivering
treatment for lesions assessed as reactivated, which is one of the main cost drivers in our
analysis. In the base case analysis it was assumed that treatment for an active lesion consisted
of one ranibizumab injection given during an injection consultation. In three of our sensitivity
analyses, one ranibizumab injection was replaced with alternative treatments to reflect new
emerging practices across eye hospitals (sensitivity analyses 1 and 2) and to make a
comparison with a much cheaper drug assessed in the IVAN trial (sensitivity analysis 3): Page 88

Sensitivity analysis 1 : all patients initiating treatment for a reactivated lesion were
assumed to have a course of three ranibizumab given at three subsequent injection
consultations, with no additional monitoring reviews. The ‘mandatory’ three
injections, at monthly intervals, matched the discontinuous treatment regimen
administered in the IVAN trial (although, in the IVAN trial, monitoring continued
thereafter);
Sensitivity analysis 2 : treatment was assumed to be given in the form of one
aflibercept injection during an injection consultation;
Sensitivity analysis 3 : treatment consisted of one bevacizumab injection given during
an injection consultation;
Sensitivity analysis 4 : only considered the cost of a monitoring review rather than
considering the cost of the whole pathway.
Sensitivity analysis 1 (three ranibizumab injections and consultations) increases the costs of
lesion care at the eye hospital due to more treatment and consultations and, once combined
with data on the consequences of retreatment decisions in our care pathways model,
optometrists remained dominated, although there remained very little difference in costs or
effects between optometrists and ophthalmologists. Akin to our base case analysis, there was
also no acceptable willingness to pay for which we can be 95% confident that the two
alternative ways of performing a monitoring review differ in value. A similar result was
found for the sensitivity analysis which used aflibercept rather than ranibizumab for
treatment, which was predictable given that aflibercept is more expensive than ranibizumab.
When switching to the much cheaper bevacizumab (in place of ranibizumab) with a reduced
cost of treatment, again very little difference was found in costs and effects difference across
the two groups, with optometrist-led reviews again being more costly and less effective than
ophthalmologists-led monitoring reviews. However, the fourth sensitivity analysis which
considered only the cost of the monitoring review, rather than the total care pathway
information, found community optometrist-led care cost £23.70 less per consultation than
ophthalmologist-led care (the difference between the crude consultation costs, p<0.001). As a
result, optometrist-led care was less effective and significantly less costly than
ophthalmologist-led care. Ophthalmologist-led care cost an additional £2389 per additional
correct treatment decision compared with optometrist-led care. Although the maximum the
NHS is willing to pay for a correct retreatment decision is unknown, it is unlikely to be this
Page 89

high (since this figure is higher than the cost of simply treating all patients without assessing
whether the eye is quiescent). At ceiling ratios of £600 or lower, we can be >95% confident
that optometrists are a cost-effective option compared to ophthalmologists in this fourth
sensitivity analysis. This final sensitivity analysis highlights how important it was to have
built a simple decision model to explore the consequences after the initial monitoring review
and not just use the information from the initial review. However, it also suggests that the
conclusions may be sensitive to the assumptions within the decision-tree. The economic
evaluation section in the Appendix (Appendix 4) presents the results of the sensitivity
analysis in respect to the cost care pathways, cost-effectiveness analysis and then the
respective cost-effectiveness planes for the four sensitivity analyses.
4.4 Budget impact
Data on the prevalence and incidence of nAMD (Table 25) were used to calculate that around
219,000 patients currently attend VEGF clinics in England in any given month, of which
52,000 (19%) have bilateral disease (Table 26). In our budget impact calculations, we
assumed that patients would be referred from the HES to community optometrists for
monitoring if they did not meet the IVAN retreatment criteria one month after finishing a
course of anti-VEGF treatment. We assumed that patients with bilateral disease would not be
referred from the HES community optometrists for monitoring if they met retreatment criteria
in either eye in the same month; the probability of meeting retreatment criteria was assumed
to be independent in the two eyes.
Table 25 Data inputs for budget impact calculations
Data Value Source
Population of adults aged 50 and over in England
19,323,400 Population of England aged 50 years and over – office of National statistics 27
Prevalence of diagnosed nAMD among over 50's
1.2% The estimated prevalence and incidence of late stage age related macular degeneration in the UK 28
Proportion of diagnosed prevalent nAMD cases starting anti-VEGF treatment
100% Assumption
Page 90

Data Value Source
Incidence of diagnosed nAMD among over 50's
0.11% TA294 Macular degeneration (wet age-related) - aflibercept: costing template 29
Proportion of people eligible for treatment
80% TA294 Macular degeneration (wet age-related) - aflibercept: costing template 29
Proportion of prevalent cases with bilateral nAMD
19% TA294 Macular degeneration (wet age-related) - aflibercept: costing template 29
Proportion of patients seen in clinic who finish a course of treatment in month N
18% In IVAN, proportion of months in which patients in the discontinuous arm completed a 3-month cycle
Of those eyes completing a cycle of treatment at visit N, what proportion remain quiescent at visit N+1 (the month after the end of treatment)
62% In IVAN, proportion of study eyes in the discontinuous group becoming quiescent at visit N+1 after completing a 3-month cycle of treatment at visit N, by month stratum: weighted average of months 3-24
Median duration (in months) of quiescence for those eyes achieving quiescence after the end of treatment: i.e. number of months for which we expect a quiescent eye to remain quiescent
2.0 Based on median time to retreatment in IVAN from each time a patient becomes treatment free. Medians were calculated for each 3 month period and the median of the 3 month periods was used. Converted from days to months assuming each month is 30 days
Mean cost of monitoring consultation conducted by community optometrist
£51.90 ECHoES costing analysis (Table 22)
Mean cost of monitoring consultation conducted by hospital ophthalmologist
£75.60 IVAN costing analysis
Total cost of monitoring consultation and downstream costs (e.g. injections and follow-up visits): community optometrist
£410.78 ECHoES economic evaluation (Table 24)
Total cost of monitoring consultation and downstream costs (e.g. injections and follow-up visits): hospital ophthalmologist
£397.33 ECHoES economic evaluation (Table 24)
In the IVAN trial, 18% of study eyes in the discontinuous treatment arms completed a three-
month cycle of treatment each month, of which 38% still met retreatment criteria at the next
visit. The probability of meeting retreatment criteria and the duration of quiescence were
constant over the trial period; therefore, no distinction was made between the first and Page 91

subsequent years of treatment. Applying these figures to the national patient numbers and
allowing for patients with bilateral disease suggests that around 21,949 of the total of 219,514
patients currently attending clinics may be eligible for referral to community optometry
review each month (Table 26), assuming that such referrals would occur in all patients who
are quiescent according to IVAN criteria one month after their last anti-VEGF injection. In
IVAN, quiescence lasted a median of 61 days; allowing for this duration and extrapolating
monthly figures to 12 months suggests that 535,548 monitoring reviews could be done by
community optometrists in England (Table 26) each year.
Table 26 Results of budget impact calculations
Estimated patient numbers in England per year
Total number of patients attending clinic All patients 219,514
Unilateral nAMD 167,263
Bilateral nAMD 52,250
Total number of patients quiescent in both eyes who become eligible for community optometry in any given month
All patients 21,949
Unilateral nAMD 18,366
Bilateral nAMD 3,583
Total number of monitoring visits that could be transferred from hospital to community per year
All patients 535,548
Unilateral nAMD 448,128
Bilateral nAMD 87,420
Budget impact – initial consultations only
Total cost of community optometrist monitoring consultations in England £27,794,931
Total cost of hospital ophthalmologist monitoring consultations in England £40,487,414
Budget impact (i.e. incremental cost of using community optometry rather than hospital monitoring) -£12,692,483
Budget impact – including downstream costs
Total cost of community optometrist monitoring consultations and downstream costs (e.g. injections and follow-up visits) in England £219,992,329
Total cost of hospital ophthalmologist monitoring consultations and downstream £212,789,211Page 92

costs (e.g. injections and follow-up visits) in England
Budget impact (i.e. incremental cost of using community optometry rather than hospital monitoring) £7,203,118
Applying the results of the ECHoES costing analysis suggests that the initial monitoring
consultation is £23.70 cheaper if performed by community optometrists rather than hospital
ophthalmologist-led teams. Scaling this up across the 535,548 visits that could be transferred
to community optometrists suggests that initial savings of £12.7 million could be made for
the NHS in England. However, this figure takes no account of the increased numbers of
second monitoring reviews or additional intravitreal injections that result from optometrist
judgements. If we allow for the costs accrued from the entire pathway (Table 24), optometrist
care is £13.45 more costly and therefore referring patients to community optometry review
will cost an additional £7.2 million across England.
Page 93

5. Results: views of patients and health professionals about the shared
care model (objective 5)
5.1 Participants in focus groups and interviews
5.1.1 Health professionalsThe focus groups lasted a mean of 91 minutes, ranging from 99 to 121 minutes. The
interviews lasted a mean of 48 minutes, ranging from 31 to 61 minutes. In total, 24 health
professionals were recruited. This consisted of eight optometrists, six ophthalmologists, two
public health representatives, six NHS commissioners and two clinical eye care advisors to
their local CCGs. Of these, 12 were women and 12 were men. Participants had a mean age of
39 years old (range 31 to 64 years) and stated that they had been in their profession for a
mean of 21 years (range 4 to 40 years). Although none had participated in shared care for
nAMD, eleven participants had experience of shared care schemes for other conditions such
as diabetic retinopathy screening and ocular hypertension monitoring. Table 27 shows
participants’ professional background. Years in profession and location are not presented for
the ‘other’ health professionals (i.e. those other than ophthalmologists and optometrists) to
protect their anonymity given their unique roles. However, these participants’ locations were
distributed evenly throughout England and they had been in their profession for an average of
20 years (range 8 to 37 years).
Table 27 Health professional participants' background
Participant1 Role(s) Years in profession2
Location2
Focus group 1:
Optom1 Optometrist 37 South West England
Optom2 Optometrist 28 South East England
Optom3 Optometrist 29 North West England
Optom4 Optometrist 37 West Midlands
Optom5 Optometrist 15 South West England
Optom6 Optometrist 20 South West England
Optom7 Optometrist 36 South West England
Optom8 Optometrist 40 West Midlands
Page 94

Focus group 2:
Ophthalm1 Ophthalmologist 20 North West England
Ophthalm2 Ophthalmologist 20 London
Ophthalm3 Ophthalmologist 4 Dundee
Ophthalm4 Ophthalmologist 7 East Midlands
Ophthalm5 Ophthalmologist 17 North West England
Ophthalm6 Ophthalmologist 3 South West England
Interviews:
CA1 Optometrist, Clinical Advisor to local CCG
- -
CA2 Optometrist, Clinical Advisor to local CCG
- -
Comm1 Commissioner, Pharmacist - -
Comm2 Commissioner, GP - -
Comm3 Commissioner, GP - -
Comm4 Commissioner, GP - -
Comm5 Commissioner, Pharmacist - -
Comm6 Commissioner, Optometrist - -
PH1 Member of Eye Health Local Professional
Network, Optometrist
- -
PH2 Optical advisor for eye charity, Optometrist
- -
1 Health professionals are identified by their professional role and their individual participant number (PH = public health representative, Comm = Commissioner, CA = Clinical Advisor, Optom = Optometrist, Ophthalm = Ophthalmologist).2 Due to their unique role, the other health professionals’ years in profession and location have been removed to protect anonymity.
5.1.2 Service usersThe focus groups lasted a mean of 71 minutes, ranging from 65 – 90 minutes. Three focus
groups were conducted with 23 participants in total with seven or eight participants in each
group. The sample consisted of 15 women (65%) and eight men (35%) who described
themselves as white British. The sampling strategy intended to recruit individuals from a mix
of ethnicities, but all those at the supporting groups who were willing to be contacted were Page 95

white British. They had a mean age of 82 years (range 72-93). All had nAMD and attended
the same eye hospital in a major city, and were diagnosed an average of 5.9 years ago (range
6 months – 20 years). Nine participants had active nAMD in one eye (39%), nine were stable
in one eye (39%), four people were active in both eyes (18%), and one person was stable in
both eyes (4%). Eight participants had dry AMD in their other eye (35%). The partners of
two participants (who were also their carers) joined the focus group but spoke very little;
their comments were not included in the final analysis. Table 28 provides participants’
demographic and health related details.
Table 28 Service user participants' demographic and health related details
Participant1 Gender
Age
Location of support group
Information about condition
Time since diagnosis
Focus group 3:
Arthur Male 80 City Advanced active nAMD in one eye
20 years
Edith Female 83 City Inactive nAMD in one eye 7 years
Edward Male 78 City Active wet in one eye, dry in other
10 years
Elizabeth Female 81 City Inactive wet in one eye, dry in other
12 years
Harriett Female 86 City Inactive nAMD in one eye, dry in other
2.5 years
Kath Female 77 City Inactive in nAMD in both eyes
15 years
Ruth Female 87 City Active nAMD in one eye 10 months
Tom Male 79 City Inactive wet in one eye, dry in other
13 years
Focus group 4:
Alice Female 79 Large town Inactive nAMD in one eye 5 years
Debbie Female 84 Large town Advanced active nAMD in one eye, dry in other
4 years
Julie Female 86 Large town Active nAMD in one eye, dry in other
6 months
Mandy Male 93 Large town Active nAMD in one eye 6 months
Maria Female 93 Large town Inactive nAMD in one eye 20 years
Page 96

Pam Female 83 Large town Active nAMD in one eye, dry in other
4 years
Ralph Male 79 Large town Active nAMD in one eye 7 years
Robert Female 78 Large town Active nAMD in both eyes
10 years
Focus group 5:
George Male 85 Rural village Active nAMD in both eyes
6 years
Harry Male 72 Rural village Inactive nAMD in one eye 1 year
Henry Male 82 Rural village Active nAMD in one eye, dry in other
4 years
Olivia Female 84 Rural village Active nAMD in both eyes
8 years
Pat Female 78 Rural village Active nAMD in both eyes
7 years
Tracey Female 77 Rural village Inactive nAMD in one eye 11 years
Yvonne Female 76 Rural village Inactive nAMD in one eye 1 year
1Pseudonyms were assigned to participants.
5.2 Results of focus groups and interviewsOverall, the majority of participants were extremely enthusiastic about the possibility of a
shared care model being implemented for nAMD care. Thematic analysis of the focus group
and interview data produced six key themes: ‘Current clinic capacity: Pushed to the limit’,
‘Potential for a more patient-centred model’, ‘Perceptions of optometrists’ competency’,
‘(Lack of) communication between optometrists and ophthalmologists’, ‘The cost of shared
care’ and ‘The importance of specialist training’. The interpretation of themes and sub-
themes is supported by illustrative quotes.
5.2.1 Current clinic capacity: Pushed to the limit Many health professionals stated that the number of repeat visits for patients was rising
exponentially, which was attributed to an increase in the number of patients who were being
diagnosed with nAMD and new government guidelines for treatment.
Page 97

Comm3: “The numbers going through the system are higher, and they need treatment for longer.”
Hospital clinics were felt to be “pushed to their limit” (Optom7, Ophthalm3) and the
ophthalmologists felt frustrated that their time was mostly spent on stable patients who did
not require treatment.
Ophthalm2: “You are taking the potential time from the ones that actually need the care. There is a limit of work that you can do. I mean you can’t go home at 8 every day.”
Both the health professionals and service users described how patients would often have to
wait for long periods of time for their appointment because of how busy the eye hospital
clinics were:
Harry: “Well, quite honestly when you go to the eye hospital, it always seems to be packed out left, right and centre.”
Henry: “Sometimes we have to wait a long time, but you know it can’t be helped.”
PH2: “It’s just generally the issue of they have had to wait a long time […] You’ve got to think also there are diabetics among there that have to regulate their meals, and they have their set routine in terms of their meals and health. It’s the same with everybody, but perhaps diabetics most, because it affects them straight away. I've known diabetics that have gone into a hypo [hypoglycaemia] because they were waiting around. Because they had a 9 ’clock appointment and it got to 11. It’s just a real shame.”
There was a sense that the current model would inevitably need to adapt to cope with this
demand and agreement that optometrists monitoring in the community had the potential to
reduce clinical workload.
Optom6: “It will help shift a lot of the workload out of the hospital environment where they are overrun with this and putting it into a more capable environment with local optometrists.”
Ruth: “[Monitoring in the community] will make less queues at the hospital. At the moment they’re choc à bloc with people.”
The optometrists, clinical advisors and commissioners also described how a shared care
scheme represented a great opportunity to enhance optometrists’ professional roles by
developing their skills.
Comm3: “It’s fantastic for the optometry profession, because it must give them much more exciting and interesting careers, and career progression, and variety within their work.”
Page 98

5.2.2 Potential for a more patient-centred modelMost health professionals also felt that the current model of care was not appropriate for
older patients with limited vision who had to regularly travel to the hospital.
Comm2: “The problem is that all the patients have got to go to the eye hospital all the time, which isn't very patient-centric… It's not very easy for people to get in once a month - which is obviously what Lucentis is about - for their assessment. Given that they are, almost by definition, elderly and with poor vision, it's not an ideal centre for it.”
The service users found it stressful travelling to and from the hospital for care. Many stated
that they were unable to drive due to their nAMD, which was described as a “massive blow”
to their independence (Pat). These service users reported difficulty seeing the bus numbers,
and most needed to get multiple buses each way as there were no direct buses. Others were
driven by family or friends, but described parking as “awful” (Arthur).
Ralph: “It's not just getting to the hospital. It's all that time afterwards, if you've got to get the bus, it's - in the winter, it's even worse.”
Robert: “One of the things that's come out here is that everyone is, obviously, getting older. They're stressed when they have to go out of the town because getting home when you've got …”
Mandy: “Oh, it’s terrible.”
Robert: “So if they have someone in the town who is an optician and deals with us, it's only a short distance from home.”
Monitoring in the community was described as a “wonderful” idea (Elizabeth), particularly
for those who lived further away from the hospital or older participants who had severe
vision loss.
Tracey: “For me, living out of town in [small town], to get to an optician on the bus is easy, whereas it’s a day’s expedition to come into [city].”
Many rarely saw the same consultant or nurse at the hospital, and felt that staff were often
impersonal as they were ‘so busy’. This was likened to “being on a conveyer belt” (Pam).
George: “If a doctor said, “Well, that’s alright”, that’s it. It’s reassurance. I think they’re trying to speed up time, and I know they’re very busy and they obviously look at the photographs and they can see everything, but for patients’ feel-good interest, I always like a doctor or someone to say, “That’s alright. You’re not doing too badly. Well, you’re in your eighties now.” Just to talk to you properly.”
Arthur: “I think one of the greatest things wrong in the eye hospital is they…. they kick you out the door.”
Page 99

In addition, most others felt that they did not receive enough information about the status of
their condition.
Harriett: “Just be told what’s happening –”
Ruth: “The only criticism I would have is to try to find out how you’re doing and whether you’re getting worse or getting better, or stable, because they’re all so busy.”
These participants were therefore enthusiastic about the potential for continuity of care where
they hoped to build up a relationship with their optometrist:
Edward: “I think one of the things, I think you’ll agree, has come to light this morning, is basically that many aspects of the eye hospital, it’s so impersonal. I think that probably a system like you’re suggesting would probably add a personal touch to it and a more one on one situation.... That’s the big thing, seeing the same person. Like I said, the personal touch... The relationship would build up.”
5.2.3 Perceptions of optometrists’ competencyThe optometrists in the focus groups, who acknowledged that they had a special interest in
nAMD, were very positive about the possibility of shared care and felt that their profession
was more than capable of monitoring in the community. This was also echoed by the
commissioners, clinical advisors and public health representatives.
Comm3: “They’re [optometrists] really incredible, impressive professionals, with just a huge amount of experience at looking at eyes.”
However, several health professionals (from mixed professions) commented that
ophthalmologists would resist shared care as they were not convinced of optometrists’
competence.
Comm4: “I think it's the misconception that optometrists won't do as good a job as secondary care. So I think that'll be the biggest barrier.”
This was considered to be problematic for shared care as there was uncertainty as to whether
ophthalmologists would ever truly relinquish responsibility of patients.
Ophthalm1: “I would not want to close the door on them, ever. I’d still want them to contact me if they noticed any change.”
Comm3: “Honestly, I think that clinicians aren't always very good at letting go […] It will be an issue.”
Page 100

There was hesitation by ophthalmologists as to whether optometrists were capable of
monitoring nAMD. The ophthalmologists referred to how they frequently received incorrect
referrals from optometrists. Furthermore, they highlighted the ways in which nAMD differed
to other eye diseases where shared cared schemes existed.
Ophthalm3: “When you work in ophthalmology for quite some time you see just the amount of work that comes to you from inappropriate referrals. Really they’re just doubling work up.”
Ophthalm5: “This is not like glaucoma where you notice pressure or you don't feel okay and refer back to the hospital. This is something... it’s based on the scan and each patient is different. There’s only a few parameters for glaucoma, whereas here there are ... it's complex […] So we can’t expect an optometrist to ... [laughter].”
The ophthalmologists felt that the hospital provided an environment where they had access to
all previous scans and other colleagues’ expertise, which enabled them to confidently make a
clinical judgement. They expressed uncertainty about whether optometrists would have these
resources. Ultimately, due to this perceived complexity of assessing the need for retreatment
and the support and resources available in the hospital, the ophthalmologists felt that patients
being monitoring in the community would be a compromise.
Ophthalm6: “So what we are trying to say is hospital care is the best [laughter]”.
Several ophthalmologists felt that patients would prefer to remain being monitored by a
consultant at the hospital, whom they would inherently trust. In line with this, service users
with active nAMD also tended to be apprehensive about the level of optometrist competence
in the community, and commented that lengthy waiting times were secondary to receiving the
best care for their condition.
Ophthalm1: “If we put ourselves in their position what would we prefer to have? I’ll prefer to be seen by a doctor in a hospital.”
Henry: “So, you’ve got to have confidence in the person that is monitoring you […] I feel that to rely on somebody that has been trained up to identify problems can’t really be as efficient as seeing an actual doctor who specialises in that subject, and because of that, I wouldn’t be happy going to an optician. It might take you longer. We have sat up there for hours, but the end result is well worth it.”
The majority of service users described needing to be able to ‘have faith’ in their optometrist
if they were to participate in shared care. Those whose optometrist had diagnosed their
nAMD commented that this gave them a sense of confidence in their optometrist’s abilities.
Page 101

Harriett: “I would trust my optician. He really seems to care. I would trust him. If my wet macular was stable, I’d be very happy to go to my optician because I’ve got confidence in him, because he detected it in the beginning.”
However, a few service users were apprehensive about shared care and did not wholly trust the idea of monitoring by an optometrist. Those that expressed this did not have faith in their optometrist because the optometrist had not recognised the condition initially
Henry: “Personally I wouldn’t have faith in the optometrist. I would much prefer to stay with the hospital.”
5.2.4 (Lack of) communication between optometrists and ophthalmologistsOverall, the health professionals described the relationship between optometry and
ophthalmology as poor.
Optom8: “Collaboration optometry and ophthalmology? No way. It’s absolutely dreadful!” [laughter]
These participants described how “systems-based” issues made communication between the
two professions poor. This was described by all professions except the ophthalmologists. For
instance, most of the optometrists described how it could be extremely difficult to relay
information to ophthalmologists because of incompatible computer email systems and
variation in technology.
Optom8: “Our problem is we’ve got NHS.net in optometry and because everyone else, they’re all NHS.co.uk. So their end isn’t secure. We can do NHS.net to NHS.net, but we can’t do NHS.net to NHS.co.uk, which is what all hospitals give their consultants. It’s absolutely crazy”
Optom5: “They’ve not embraced NHS.net at all.”
Optom2: “Some optometric practices don’t even have computers. Particularly in the [city] area where many of them are way behind. We actually had to buy them fax machines when this started to make it work. You’d expect most people had that sort of facility, but they didn’t. To make it work, we would do that. So I think standardisation of forms across our units, across the country, and making those forms readily available, and everybody knows that they’ve got to look for the red-topped form in the practice or whatever, could possibly aid this model of shared care.”
Optom1: “The other big issue is transfer. If you’re actually going to transfer the data, they are massive, massive, massive files. I was talking to an optometrist who has an OCT and sends scans to an ophthalmologist, and he literally has to do it overnight. Just for one patient, it takes so long.”
All of the optometrists also commented that technology had caused issues with their referrals
to ophthalmologists in the past, in that they often got lost between the two professions. As a
Page 102
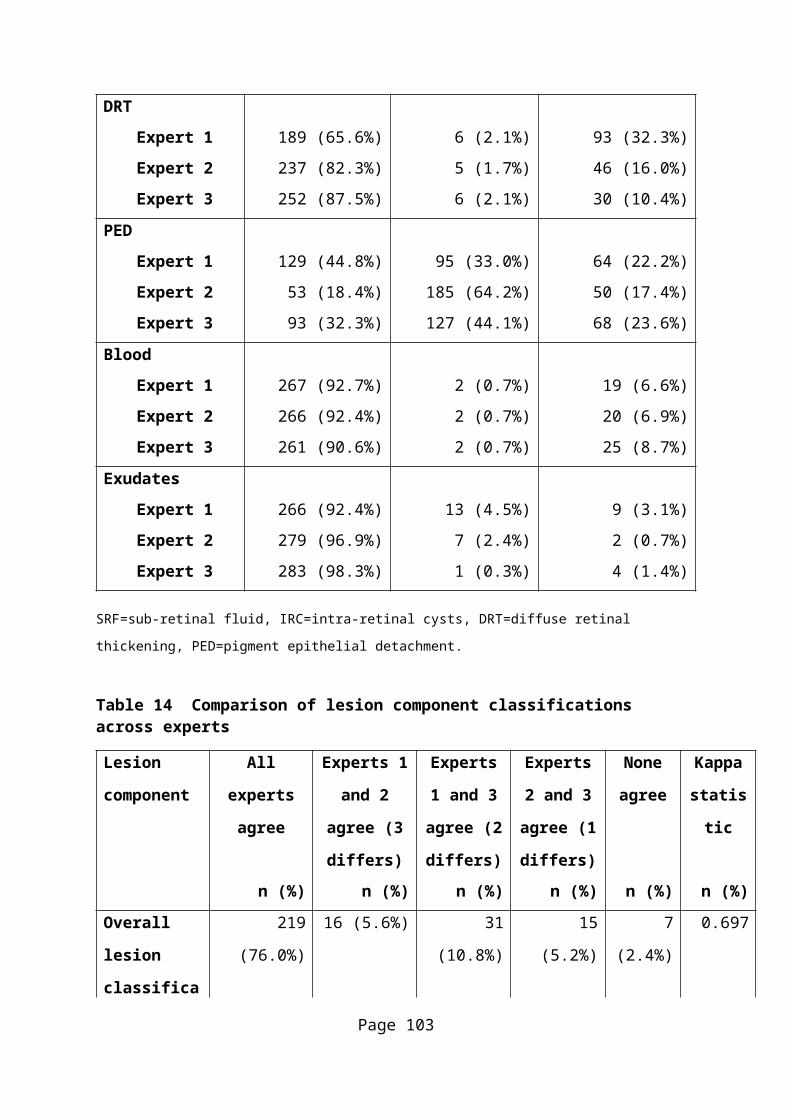
result, the optometrists stated that they would follow up each referral by calling the
consultant to ensure it had been received or they sent referrals via multiple technology
methods to ensure that one would reach the consultant.
Optom2: “It does happen that patients will wander back in two weeks later and say, “Oh, you told me I’d be seen within a couple of weeks. I haven’t heard a thing.” Then we contact the hospital and we think, “Okay, what’s happening?””
However, many participants (both health professionals and service users) explained that one
of the key concerns of nAMD was the rapid progression of the disease if the condition
became active. In particular, several service users described the devastating consequences of
their vision deteriorating within days.
Pat: “Last week I was all-seeing and driving and everything, and on Thursday I thought, “There’s something missing on that signpost”, and the glare was terrible. So then I couldn’t read the paper at lunchtime... To me, it’s been a disastrous week. I can no longer drive. I can no longer read. This is a week! To me, that’s a disaster. It’s very frightening.”
Participants, particularly the ophthalmologists and service users, therefore expressed
concerns about a potential delay between primary and secondary care if retreatment was
required.
Edward: “The problem is that the more steps you have in the system, the longer it takes. We don’t have the time.”
Ophthalm1: “The nature of the disease is such that it needs urgent attention. So it’s better if we see the patient […] I can’t imagine going to the optometrist and him making a decision to refer the patient back, all that delay.”
The health professionals emphasised that in order for shared care to be delivered successfully,
it would be essential that the two healthcare professions were able to work collaboratively so
that an efficient pathway could be developed.
Comm2: “I think they would like to make sure that there's a seamless process between community and hospital, and that nothing drops through the cracks. So I think they would need to make sure that there's a robust recall service, and that if there is an issue, that there's a pathway back for the patient into secondary care. So those kinds of things, I think, would need to be ironed out before it goes ahead.”
5.2.5 The cost of shared careA theme unique to the health professionals was the financial implications of implementing a
shared care model. Both the optometrists and the ophthalmologists believed that financial
Page 103

considerations should be secondary to the care of the patients, although the other health
professionals described how a harsh reality of healthcare meant that shared care would not be
commissioned unless it “got the most out of the NHS pound” (PH2).
Optom4: “I think you have to possibly take out the finance issues. How you buy something should be secondary to what the patient needs.”
PH1: “You’ve got to show the CCGs that you're saving money over sending them into the hospital. Because otherwise, they're just not going to commission it.”
The commissioner participants undertook several roles professionally and were often
optometrists or GPs alongside this position. The multiple perspectives from a commissioning
and clinical point of view appeared to conflict when contemplating nAMD care, in terms of
patient outcomes and financial efficiency.
Comm4: “Patients would like it [being monitored in the community] because it’s much closer to home, they don’t have to go to hospital. They don’t have to sit and queue and wait in pain, park and all that sort of stuff that patients usually tell you... […] From a commissioner’s perspective… In terms of saving and shifting costs across the health system for eye care services, it certainly doesn’t achieve that.”
The health professionals were divided as to whether monitoring in the community would
represent a more cost efficient model. For instance, some perceived that NHS costs of
managing sight loss could ultimately decrease.
PH2: “So if you could use the monitoring to stop the wet AMD getting worse, so that it’s kind of preventative, then you would be addressing the public health indicator of dropping those numbers of people registered with AMD sight loss. [..] Yes, that would be the biggest advantage that I would see of it.”
Many also considered that there may be an opportunity to save money with a differential fee
for optometrists and ophthalmologists. Conversely, the ophthalmologists stated that the
money from following up with patients with nAMD could be set towards resources to
improve secondary care resources, rather than being “lost” to the community (Ophthalm3).
Comm4: “It would be a cost efficient option for the commissioners because we would be paying something like £60 for an optometrist to measure the patient’s visual acuity, rather than £100 and whatever it is for a consultant outpatient episode.”
Ophthalm3: “If the optometrist where I am gets compensated, that pot of money comes from the resources from the hospital and we’re struggling as it is. We’re diverting resources to somebody else who’s not doing as much work as we are doing in the hospital, just doesn’t make sense.”
Page 104
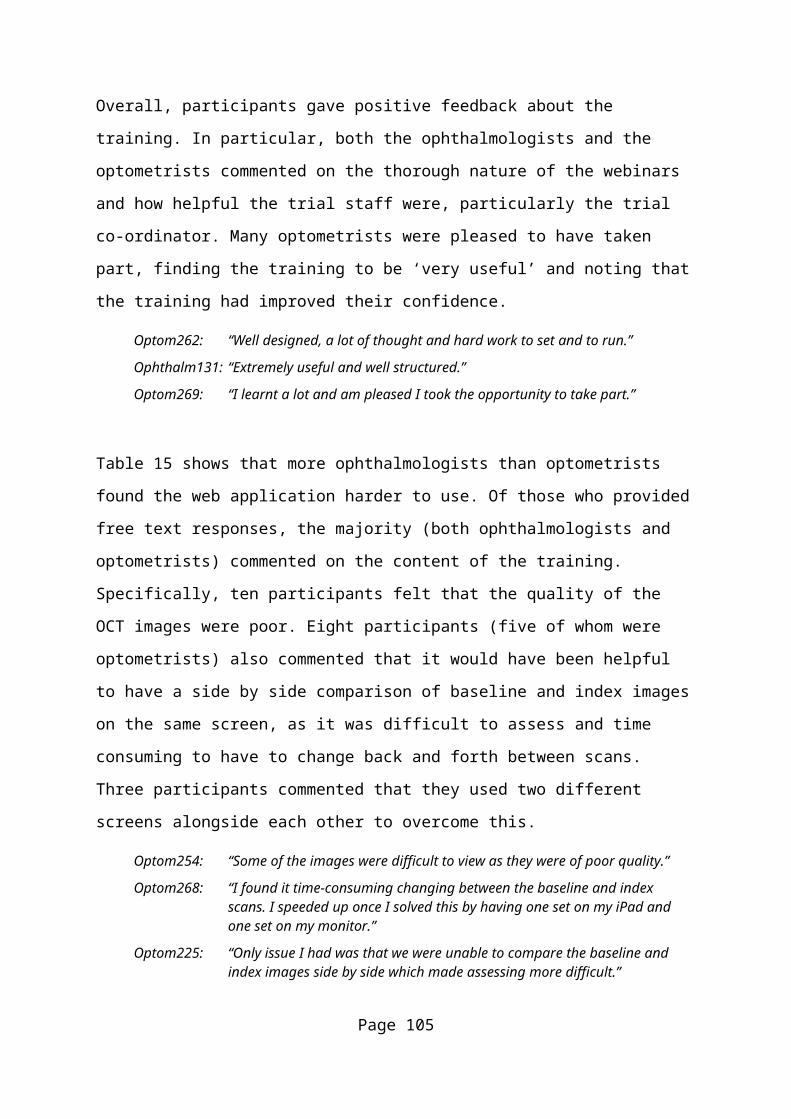
The ophthalmologists stated that they took around 15 minutes to see a patient and determine
the need for retreatment whilst the optometrists’ estimates varied between 20, 30 or 40
minutes. As the requirements to determine reactivation were listed (including a clinical
examination, administration of tropicamide drops and use of an OCT), the optometrists
concluded the latter estimate of up to 40 minutes was more realistic to make a clinical
decision and explain the results to the patient.
Optom3: “It has to be realistic so you can practice and sustain it.”
Optom8: “I’ll allow 30 and probably spend 40 [...] But once you’ve got an OCT sitting there and you start looking at it, and you really want to explain it to the patient and they say, “Oh, thank you. No one ever tells me anything like that at the hospital. It makes you feel so good at the end. You’ve actually told the patient what’s really wrong and, “Rest assured my dear, it’s not getting any worse, so we don’t need to send you back. ‘‘Oh, thank you!” It probably would take me 40 minutes.”
Several commissioners and one clinical advisor therefore highlighted a potential conflict
between practices’ clinical and commercial interests and stated that optometrists would need
to be paid a sufficient amount to ensure that shared care was economically possible.
Comm1: “If the current business model for eye care is that funding comes from selling glasses, then if you fill your clinic appointments up with OCTs which will be a lovely service for patients, but if the only thing that’s happening is that you are breaking even with doing an OCT, your practise isn’t going to survive.”
There was also agreement that an OCT, although considered essential for monitoring nAMD,
was an expensive piece of kit that not all practices could invest in. The clinical advisors and
public health representatives felt that CCGs should provide OCTs, although most of the
commissioners and the ophthalmologists felt it should be self-funded to demonstrate a level
of commitment to monitoring in the community or that those practices which already had an
OCT would represent a more enthusiastic, clinically orientated team.
Comm6: “Well, it’s on the optometrists, really. Whether they’ve got the kit or whether they will want to invest in one. I think what it will be is that you’ve have a small group of practises within a particular area, who will show keenness. […] They will be the more cutting edge practises.”
PH2: “I think CCGs should pay for that [an OCT], the NHS. I don’t think it should be the optometrist.”
A further financial issue was whether ophthalmologists would repeat tests, due to difficultly
relinquishing responsibility or not trusting an optometrist’s judgement.
Page 105

CA1: “If you’re doing injecting from a message that you’ve got from the community, then actually if something was to go wrong, you can’t just say, “I did it because the optician outside told me to do it.” Do you know what I mean? […] For their peace of mind.”
Ophthalm1: “You’d have to attend another OCT in the hospital, look at the scans and then we have to take everything, yes, you may need another angiogram, just to be certain.”
Consequently, a main concern of the commissioners was that the CCGs might be charged for
repeated testing.
Comm1: “From a commissioner’s point of view, we would want to make sure then we would only be being charged for that element of it, and they wouldn’t go on and repeat all the tests again.”
5.2.6 The importance of specialist trainingThe health professionals spent a considerable amount of time addressing how they felt
training should be delivered, in terms of which method was most effective for learning and
ensuring training was delivered in a way to reassure ophthalmologists that optometrists were
being trained to a high standard.
PH2: “I think the training needs to be very carefully designed.”
Optom4: “The ophthalmologists have to believe in the competence of the optometrist. It’s important that they have belief in the quality of the accreditation.”
Virtual training was deemed appropriate for providing a ‘foundation’ level of knowledge,
although most felt that this alone would not be sufficient to train the optometrists. In
particular, the ophthalmologists were unconvinced by the applicability of a virtual trial.
Comm1: “I think it complements training, but I don’t think it should be the sole course of training. I think you still need a bit of hands-on”.
Ophthalm3: “I’m sure in your studies you will find 100% virtual case studies that you give, that you will find good correlation between what the ophthalmologist would say and what the optician would say in a virtual case. You can’t just say “Yes, the optom has 100% exactly the same as the ophthalmologist, which says that now they are just as good.””
Clinical experience, whereby optometrists would gain experience of monitoring nAMD
patients in a hospital setting, was viewed as an ‘essential’ component of training.
Ophthalm2: “I think they need to come and see the real patient. There’s no point on sitting on the MediSoft or whatever and clicking boxes and thinking they know it all. Real life is not like that. I mean there are the OCT scans like that, sometimes they can be very devious and very challenging and very confusing…”
Page 106

The majority of participants felt that having ophthalmologists’ supervising this training
would provide assurance of optometrists’ competence and enable greater collaboration
between the two professions. However, they acknowledged that this would be time
consuming.
Comm2: “I would suggest that they [optometrists] would spend a certain amount of time in a consultant clinic. Most services will have a specialist clinic for macular degeneration, so they would maybe spend a session a week, or something, in such a clinic for six months, just getting familiar with the treatments and the monitoring, etc. Also that will help the consultants’ gain a bit of confidence in the optom as well. So it's a working partnership going on there.”
Optom5: “I think they would be involved if they had an element of control over it. If they’d done the training and if they knew who they were sending the patients out to and they knew what protocols were being followed, the service spec. You don’t get these things to work unless you’ve got clinical buy in. You just don’t. You can set up all you want, but you’ve got to get the clinicians involved.”
CA2: “The hospital departments are caving in and creaking under the weight…so getting a consultant to be doing local training can be difficult.”
5.3 Trial participants’ opinions on shared careFeedback questionnaires were completed by 47 ophthalmologists and 55 optometrists, most
of whom had completed the study and were included in the analysis population (see 3.12 for
details). Findings from the ECHoES participants’ questionnaire survey in relation to
perspectives of shared care mirrored those from the focus groups and interviews described
above, and therefore act as a method of triangulation to increase plausibility and
dependability of the main qualitative research 30. The vast majority commented in the
questionnaire that monitoring in the community represented an excellent opportunity to
reduce current clinical capacity and a more efficient use of consultants’ time which would
enable them to focus on active patients who required retreatment. In addition, many noted
that shared care was a more accessible option for patients and provided a welcome
opportunity for the professional development of optometrists.
Ophthalm105: “I think it is an excellent idea.”
Optom270: “Makes perfect sense.”
However, a major concern of eighteen optometrists was that ophthalmologists would resist
the shared care scheme as they were not convinced of optometrists’ competence. In line with
this, several ophthalmologists stated that there was inter-professional distrust and
acknowledged that a buy-in from their profession would be difficult.Page 107

Optom278: “Ophthalmologist fears in delegating care to optometrists if patient care is compromised.”
Optom202: “Ophthalmology departments do not want to let go of their patients.”
Similar to the findings from the focus groups and interview data, most respondents
emphasised the need for appropriate training which should include supervision by
ophthalmologists. However, several commented that training would be a time-consuming
process for both disciplines.
Ophthalm222: “Good quality training with HES involvement from the start.”
Optom207: “The local ophthalmologists would have to be prepared to give time to on-hands training to those optometrists participating.”
In addition, both groups felt that these inter-professional barriers had the potential to be
problematic, in regards to poor communication between primary and secondary care sectors
which could cause a delay for patients who required retreatment.
Optom242: “Need to create a good system of communication between optometrists and ophthalmologists.”
Ophthalm138: “Work collaboratively and build partnership keeping patient at the centre.”
Furthermore, respondents also expressed uncertainty as to how shared care should be funded.
Twenty one optometrists and eleven ophthalmologists highlighted that most of practices did
not own an OCT and would struggle to afford such an expensive piece of kit. Several
optometrists also felt that if practices were not compensated sufficiently to the enhanced role,
their practice’s business would ultimately suffer.
Optom201: “Each practitioner will need an OCT, which the majority of optometry practices do not have at the moment.”
Optom216: “There needs to be sufficient funding for the outlay on the OCT equipment and the professional time on the high street to make this a viable investment in order to not lose money.”
Page 108

6. Discussion
6.1 Main findings: study conduct
6.1.1 RecruitmentThe staged nature of the trial and the risk of withdrawals (most, but not all, participants
progressing from training to the main trial or withdrawing for other reasons) combined with
the priority of maintaining the balanced incomplete blocks design made recruitment
challenging, particularly given the short duration of the trial. The balanced incomplete blocks
design meant that each participant had to be assigned a specified set of vignettes for the main
trial assessment on completion of webinar training. This constraint prevented an extra
participant from being recruited until an existing participant had definitively withdrawn.
Since participants could not all be recruited at the same time, and progressed at different
speeds, we did not know until a considerable time had elapsed whether additional participants
would be needed. In order to expedite completion of the trial, we re-opened recruitment at a
later stage and deliberately over-recruited participants to the webinar training, some of whom
did not progress into the main trial because the target sample size had been reached. Close to
the end of the main trial, in order to increase the likelihood of completing the main trial
according to our revised schedule, we also assigned two participants to one set of vignettes in
order to be more confident that at least one would complete the assessments promptly.
The need to over-recruit also had financial consequences for the trial budget. Participants
who chose to withdraw themselves during their participation in the trial were paid only for
the time spent on webinar training and not for any training or main vignette assessments that
had been carried out up to the time of withdrawal. However, those participants who were
withdrawn by the trial team, either because of failure at the training stage or because the trial
had reached its target, were reimbursed fully up to the point of withdrawal, as if they had
completed the study.
6.1.2 Images used to create vignettes and constraints on viewing imagesDespite the overall size of the IVAN image repository, the number of suitable baseline and
index images available to create vignettes was much smaller than anticipated. This limitation
required us to identify a different combination of (a) number of participants, (b) number of
Page 109

vignettes per participant and (c) number of times each vignette was assessed. The final design
recruited 96 participants (48 in each professional group), each of whom assessed 42
vignettes, with each vignette being assessed seven times (by each group), requiring a total of
288 vignettes and 4032 assessments. This total was considerably smaller compared to our
original plan for 96 participants each to assess 48 vignettes, with each vignette being assessed
four times, which would have required 1152 vignettes.
The smaller number of available vignettes also forced us to sample sets of training vignettes
from among the 288 vignettes used for the main trial assessments. This constraint meant that
extra participants (recruited when recruitment reopened) could not start their training
assessments until an earlier participant had withdrawn and freed up a specified set of
vignettes for the main trial assessment.
All images used to create vignettes were reviewed by a senior grader from NetwORC UK
(AM) and a retina specialist (UC) to identify appropriate pairs of sufficient quality. Almost
all of the CF photographs in the IVAN repository that were potentially suitable for inclusion
were considered to be of sufficient clarity and focus for constructing the vignettes. However,
OCT images were subject to several limitations:
We made the decision that vignettes could only be constructed with OCT images
captured by spectral domain tomographic equipment. Spectral domain OCT systems
provide images of greater clarity, resolution and definition and represent systems to
which clinicians and optometrists are currently exposed. These spectral domain
systems came into widespread use in 2008. When the IVAN study started in 2007/8,
the standard for clinical trials was time domain OCT because the data import and
export protocols and grading methods had only been established and validated for
these acquisition systems. Therefore, the majority of sites in the IVAN trial used time
domain systems to capture OCT scans. Nonetheless, as the old time domain systems
began to fail, most IVAN clinical sites replaced these with spectral domain systems.
Validation of the spectral domain systems for trials was undertaken and, therefore,
spectral domain OCT images were permitted in the IVAN protocol. Approximately
one third of all IVAN participants had OCT scans acquired on one of the three types
of commonly used spectral domain systems (Heidelberg Spectralis; Zeiss; Optovue).
Page 110

All the spectral domain systems yielded high quality scans. However, the lower aspect
ratios of the Zeiss and Optovue made it more difficult to interpret images compared to
the Spectralis. This is because the appearance of the Spectralis scans is more similar
to that observed on a standard retinal histological preparation. The Spectralis is also in
more widespread use in the UK. Both experts and participants commented that OCT
images from the Zeiss and Optovue spectral domain systems were unfamiliar and,
therefore, more difficult to interpret and that they were less certain about their
assessments.
Baseline and index OCT scans consisted of 6 radial line scans which passed through
the fovea. Ideally, scan lines at the same clock-face orientations should be captured at
every visit and be displayed in the same order so that an assessor can compare the
appearance of the retina at specific locations. For some of the scans, the orientations
did not match exactly for baseline and index images.
The web application presented ‘thumbnail’ images of all six OCT scans and an
assessor could ‘click’ on an image to enlarge it and to toggle backwards and forwards
between the six enlarged images. (The website www.echoestrial.org/demo shows how
assessors carried out assessments in the trial.) However, it was not possible to view
baseline and index images for corresponding orientations simultaneously because of
the limitation of providing the application on a single monitor. ‘Paired’ viewing of
OCT scans is a desirable feature and it is usual practice for clinicians to use a paired
display which allows the viewer to scroll through the different scan orientations from
two visits on a single screen. One participant (Optom268, 3.12) achieved this by
having one set of images on an iPad and one set on a conventional computer display.
6.1.3 Reference standardThe original plan (described in the grant application) was for the reference standard to be
derived directly from grading data collected during the IVAN trial. For various reasons, this
was not considered acceptable once we started to set up the study: there are occasional errors
in the grading data and the list of features/questions drawn up for the web assessment (Table
2) did not completely match the table in the protocol or the grading data available. There
were two key differences, namely (i) the distinction between presence of a feature in the
index OCT and whether or not an increase in the feature had occurred from the baseline to
the index OCT and (ii) the inclusion of DRT as a feature. Grading data were used to select Page 111

baseline and index OCT pairs that were likely to suitable, based on the features described in
the table in the protocol, but it was decided that the reference standard should be assigned by
expert ophthalmologists (reading centre leads, UC, TP and SPH).
This decision was taken when the first draft of the assessment part of the website was
available, in late June 2013. We accepted that training could begin while vignettes were being
assessed by experts. However, there was still insufficient time for the three experts to assess
each vignette by the time participants’ responses to the training vignettes had to be scored.
Instead, we aimed for two experts to assess each vignette (one third by each pair of expert
ophthalmologists) but only had one expert assessment for each vignette, with these
assessments done by two of the three experts, when we started to assess participants’
responses on their training vignettes.
As participants’ assessments on the training vignettes accrued, it became clear that there were
some vignettes that participants were getting consistently wrong. Consequently, the two
experts who had provided the expert assessments reviewed about 30 vignettes. Some of these
were believed to be mistakes (mainly key stroke errors when completing the web data entry)
by an expert and the overall assessment was changed for 10 vignettes. These new gradings
were later used in the derivation of the reference standard.
6.2 Main findings: study results
6.2.1 Classification of lesion activation status and lesion components
Optometrists were non-inferior to ophthalmologists with respect to their overall ability to
classify lesions correctly, i.e. the primary outcome. Neither group attained the level of
performance expected at the outset (on which the target sample size was calculated).
However, optometrists made different kinds of error. Compared to ophthalmologists, they
were less likely to classify a reactivated lesion as quiescent or suspicious (false negative
misclassifications) and more likely to classify a quiescent or suspicious as reactivated (false
positive misclassifications); better sensitivity, worse specificity). It is likely that this finding
arises because optometrists tended to adopt a more cautious decision criterion, which would
be consistent with their obligations under the GOS contract (to refer any suspected
Page 112

pathology). The finding may also reflect optometrists having more difficulty in interpreting
the diversity of appearance of quiescent lesions, i.e. eyes with an abnormal appearance but
not needing treatment that are normally managed in the HES.
The poorer than expected overall performance may have arisen because the quality of the
images was sub-optimal. In real-life, any monitoring review (whether carried out by an
ophthalmologist or optometrist) is likely to include examination of the patient, e.g. slit-lamp
biomicroscopy, as well as review of CF and OCT images. Some components, i.e. blood and
exudates, might be identified more reliably from this examination than from images. If this
were the case, the combination of the vignette information with direct examination would
increase the performance.
No harms could arise in the trial itself because all of the decisions being made were for
anonymised vignettes. However, the health economic evaluation considered carefully the
costs and consequences of the different types of error predominantly made by each group. In
the context of community optometry, it seems desirable that optometrists should use a
cautious decision criterion for referral, although this limits the potential benefit of the shared
care model both in terms of the impact on workload in the HES (because of false positive
referrals) and its potential cost-effectiveness.
Optometrists were also non-inferior to ophthalmologists with respect to the frequency of false
negative sight-threatening errors (i.e. failure to identify a lesion as reactivated). In fact,
optometrists were slightly less likely than ophthalmologists to make such errors because of
their tendency to adopt a more cautious decision criterion. Conversely, optometrists made
more non sight threatening errors (false positive error, i.e. failure to identify a lesion as
quiescent or suspicious) than ophthalmologists.
Except for PED (which did not inform the classification of lesion activity), lesion
components were identified as present more often by optometrists than ophthalmologists,
again consistent with optometrists adopting a more cautious decision criterion. This tendency
was particularly evident for DRT and exudates. Ophthalmologists were much more confident
Page 113

in their classifications than optometrists. However, there was no association between
confidence and the odds of classifying a lesion correctly. For all grades of confidence in the
classification, optometrists had slightly better odds of classifying a lesion correctly. As
hypothesised, other items of information included in a vignette did not influence participants’
lesion classifications.
The sensitivity analysis found a statistically significant difference, but not clinically
important one, with respect to the pre-specified non-inferiority margin, in favour of
ophthalmologists. The alternative definition of the primary outcome used in this analysis
involved reassigning four cells from Table 3. Participants’ classifications changed from
incorrect to correct for two cells (suspicious reference lesions classified as reactivated by
participants, and reactivated reference lesions classified as suspicious by participants) and
from correct to incorrect for two cells (suspicious reference lesions classified as quiescent by
participants, and quiescent reference lesions classified as suspicious by participants). Of
these, the latter were both the most numerous (380/4032 participants’ classifications) and
showed the greatest difference in frequency between ophthalmologists and optometrists (88
more such classifications by optometrists, considered incorrect in the sensitivity analysis;
Table 7). Reactivated reference lesions classified as suspicious by participants were second
most numerous (338/4032), with the difference in frequency going in the opposite direction
(54 more such classifications by ophthalmologists, considered correct in the sensitivity
analysis). Both of these changes favoured the performance of the ophthalmologists. The large
number of quiescent reference lesions classified as suspicious by optometrists almost
certainly arises from their tendency to adopt a more cautious decision criterion. It is not
obviously the case that it would be desirable to encourage optometrists to shift their criterion
to a less cautious position, i.e. to ‘trade’ an improvement in specificity for a reduction in
sensitivity, given the potential sight-threatening consequences of false negative errors. The
desirability of shifting the criterion would depend on the likelihoods of (a) reactivation being
identified by the optometrist at the next monitoring review (when relevant lesion components
are likely to have increased) and (b) irrecoverable sight loss from deterioration of the lesion.
The time taken to assess vignettes decreased as participants worked through their assessments
for the main trial and this finding was particularly marked for the optometrists. Interestingly,
Page 114

the time taken by optometrists more than halved and approached that taken by
ophthalmologists by the time they reached their final assessment (2 minutes 31 seconds
compared to 1 minute 55 seconds). This information gives some indication of how quickly
optometrists can become proficient in assessing fundus colour photographs and OCT images.
We also investigated whether the time taken was associated with the odds of a correct
assessment and found, in both professional groups, that a correct lesion assessment was more
likely with a shorter assessment duration. This finding suggests that duration of assessment
may have been a proxy for difficult assessments.
Data about the agreement between expert medical retina consultants represents a bonus from
the study, since such data have not previously been reported. (These experts are responsible
for the three sites that together comprise the UK Network of Ophthalmic Reading Centres.)
All three experts assigned congruent lesion classifications to over three-quarters of vignettes
and disagreed completely (all three experts classified a lesion differently) for only seven
vignettes. The level of agreement judged on the basis of kappa values (Table 14) varied by
lesion component from excellent for SRF, IRC and blood to poor for exudates and DRT
(although all experts agreed about exudates for >90% of vignettes; the kappa was still low
because exudates were rarely present). These data emphasize several important points.
Firstly, the assessment task was difficult and was sometimes compromised by the images that
were available (6.1.2). Secondly, signs of reactivation inevitably spanned a continuum and,
hence, there was a need to assign a reference classification of suspicious for some vignettes.
Thirdly, the vignettes created from the IVAN trial repository represented a real-world
spectrum of reactivation that was appropriate for the ECHoES trial.
There are no similar studies with which to compare our data and, consequently, no meta-
analysis combining our findings with previous findings.
It is difficult to assess the extent to which the performance of participants is representative of
the performance of the two professions and, hence, the applicability of the findings. Models
of shared care for other eye conditions have been voluntary. Indeed, it is difficult to conceive
a model in which optometrists, who are private practitioners, might be required to provide
shared care. Our recruitment methods sought volunteer optometrists, presumably who were Page 115

interested in shared care, albeit in the context of a research project. We cannot be sure that
our recruitment methods for optometrists were generally applicable but can imagine that
similar methods might be used, for example by clinical commissioners, seeking to
commission shared care in a particular geographic region. The motivations of the volunteer
ophthalmologists are less clear but a similar interest in the feasibility of shared care for
nAMD is a possibility. The key question is whether volunteer ophthalmologists might have
been less than averagely expert/experienced – or optometrists more than averagely
expert/experienced – compared to the kinds of people who might volunteer for shared care.
We think that this is unlikely but have no evidence to substantiate this.
For the findings to be applicable, the vignettes used for the study also needed to be
representative of the clinical circumstances that community-based optometrists would be
likely to encounter. In this respect, we are more confident that the study findings are
applicable. The IVAN trial was pragmatic and had broad eligibility criteria. It recruited
participants on presentation and followed their progress in the trial. Although their treatment
was specified by their experimental allocation, all treatment regimens had similar effects on
vision and morphology which were consistent with clinical experience and other trials of
anti-VEGF drugs. Decisions about the need for retreatment had to be made in the IVAN trial
just as in usual care. The availability of spectral domain tomographic equipment was limited
by hospitals and clinic scheduling.
6.2.2 Health economics
The results of the economic evaluation show that, when we take account of downstream costs
(e.g. follow-up consultations and injections), the optometrists had slightly higher costs and
made slightly fewer correct retreatment decisions compared to ophthalmologists when
performing the virtual monitoring review for the ECHoES trial. However, the differences
were very small (an incremental cost of £13/consultation and one additional incorrect
decision per 101 reviews conducted) and the differences were not significantly different.
6.2.3 Views of patients and health professionals about the shared care model
Page 116

Overall, the findings show there was consensus that optometrists monitoring quiescent
nAMD in the community have the potential to reduce clinical workload and could represent a
more patient-centred option for patients. However, a number of potential barriers were
identified which could limit the feasibility of a shared care scheme, including
ophthalmologists’ perceptions of optometrists’ competence, the need for clinical training,
whether optometry and ophthalmology could work more collaboratively, and whether shared
care was a financially efficient option for CCGs.
Participants felt that hospital eye clinics were pushed to the maximum capacity with the
volume of patients who required care for nAMD. Research has found an insufficiency of
resources to deliver nAMD in secondary care from the burden of follow up visits required in
patients with inactive nAMD.31 Therefore, the health professionals agreed that shared care
would relieve the ophthalmology workload. Shared care schemes are also attractive to
patients who would find it more convenient to be monitored closer to their home.32, 33 In line
with previous research, the service users described how they were frustrated at the lack of
support and information that they had received about their condition.34, 35 Consequently, they
felt that being monitored in the community would enable them to build up a relationship with
one optometrist, with whom there would be more of an opportunity to receive better support
and information.
Whilst most participants felt that motivated optometrists would be capable of monitoring
patients, several ophthalmologists and service users were unsure as to whether the expertise
of an optometrist in detecting reactivation of nAMD would be equal to that of an
ophthalmologist. Previous research exploring perceptions of shared care for glaucoma has
found that specialists are not convinced of optometrists’ expertise, even with additional
training.36 Furthermore, interviews with service users who had declined to take part in a
shared care scheme for a range of eye diseases (including nAMD) did so because of their
familiarity with, and the reputation of, the HES.33
Overall, the health professionals described poor collaboration between community
optometrists and ophthalmologists working in the HES. Many participants, particularly the
ophthalmologists and service users, voiced concerns about a potential delay between primary Page 117
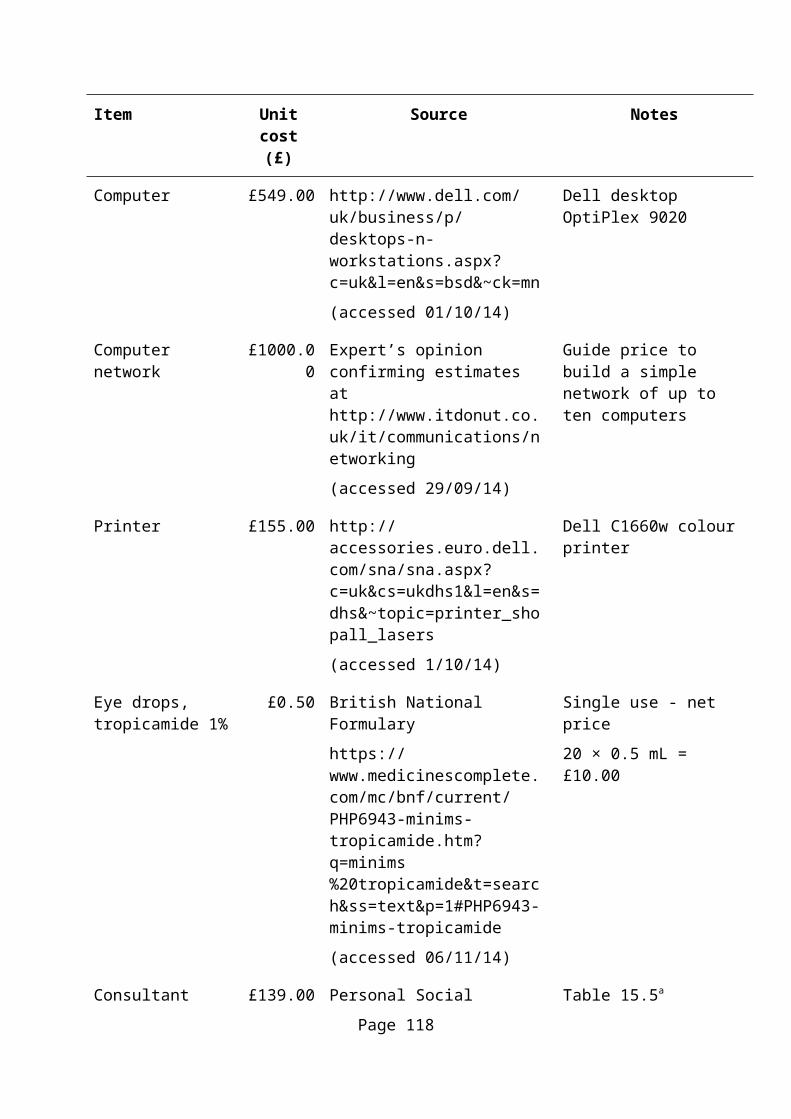
and secondary if required retreatment was required. This is a new finding, as previous
research exploring patient perceptions of shared care for a range of eye conditions has not
found this to be an issue.32, 33, 37, 38 Long-term research has demonstrated that recurrence of
neovascular activity is common,39 and any delay beyond the recommended interval may
cause patients to unnecessarily lose vision permanently.31 Given that vision can deteriorate in
a short time if nAMD is not treated and the potential impact this could have on independence
and quality of life for patients, it is perhaps not surprising that receiving prompt treatment is
an important priority for nAMD care.
The health professionals felt that, although virtual training could provide a foundation level
of knowledge, clinical experience under the supervision of an ophthalmologist would be a
more effective method of training. Shared care research for a variety of eye conditions has
reported that, although web-based training is a convenient and effective option, it is not
representative of clinical practice and may not be appropriate for teaching practical clinical
skills which need to be developed through attendance at a training course.33, 40 Health
professionals in the current study also highlighted that face-to-face training of this kind
would provide reassurance to the ophthalmologists that optometrists were being trained to a
high standard and further encourage to inter-professional collaboration.
The health professionals considered the financial implications of moving to a shared care
model, although commissioners appeared to experience conflict between what was best for
the patient and what was financially efficient. There was also agreement that optometry
practices may struggle to obtain appropriate equipment but uncertainty as to how funding for
OCTs would be provided. In line with this research, studies exploring optometrists’
perspectives of extending or enhancing their roles has highlighted a conflict between the
retail and clinical side of the optometric practice.40, 41 Amoaku et al 31 points out that the
technology involved in monitoring nAMD, particularly an OCT, is expensive and
optometrists would be unlikely to receive any grants for their purchase. An additional
financial consideration was that there could an opportunity to save money with a reduced fee
for optometrists monitoring rather than ophthalmologists, although commissioners expressed
concerns about the possibility - and subsequent cost - of repeat testing by ophthalmologists
who doubted optometrists’ judgements when a patient was deemed to require re-retreatment.
Page 118

In summary, the qualitative research demonstrates enthusiasm for shared care for nAMD.
However, ophthalmologists and patients would need reassurance that greater convenience
would not compromise the quality care, both in terms of optometrist competence and the
speed of the referral pathways back into secondary care if retreatment was deemed to be
necessary. The research highlighted poor communication and trust between ophthalmologists
and optometrists and there was agreement, that if shared care were to be implemented, it
would need to ensure that the two professions were worked more collaboratively. Training
for optometrists, under the supervision of ophthalmologists, was deemed to be the most
effective method of training and could improve the communication and trust between the
disciplines.
6.3 Participant and public involvement
Patient and public involvement (PPI) impacted on the trial in two main ways. Firstly, review
of the grant application highlighted the need for the study to explore the views of patients and
health professionals about the shared care model. Secondly, we ensured that a patient
perspective was represented on the trial steering committee (TSC).
The first impact of PPI led to inclusion of substantial qualitative research (interviews and
focus groups) with patients with nAMD, ophthalmologists, optometrists and clinical
commissioners. This research highlighted that implementation of shared care for nAMD is
likely to be challenging. The second impact of PPI led to the nomination and appointment of
Cathy Yelf as the patient representative on the TSC. Cathy Yelf is the Head of External
Relations for the Macular Society.
Because of the virtual nature of the trial, there was no need for PPI to inform recruitment and
aspects of the conduct of the trial.
6.4 Strengths and limitations
6.4.1 Classification of lesion activation status and lesion components
Page 119

The virtual nature of the trial element of the ECHoES study made it feasible to address the
research question when a conventional trial may not have been feasible, either because of
reluctance by patients or the professions to participate or because of the high cost of a
conventional trial.18 We were able to carry out the trial within a relatively short period of time
and at low cost compared to a conventional trial of the research question and the study design
did not require any compromise with respect to the risk of bias. Participants engaged
extremely well with the tasks that they were set, evidenced by the trial having complete data
for the analysis population and the level of participation in additional tasks not communicated
to participants at the outset, e.g. questionnaires about training and the likely resources needed
to provide shared care in community optometric practices.
There are two limitations that may be perceived to be critical, namely the virtual nature of the
trial itself and the adequacy of training. A critic might argue that decision-making on the
basis of a vignette bears no resemblance to face-to-face decision-making in a HES clinic.
However, decision-making on the basis of investigations made previously, in the absence of
the patient, reflects quite well how some hospitals are managing their workload by
implementing a 2-step process. Patients are first recalled for a monitoring appointment to
capture BCVA and retinal images (usually staffed by non-medical personnel), the
information is then reviewed ‘off-line’ assessment by an ophthalmologist or other trained
member of staff, and the patient recalled rapidly for treatment if required. In our view, the
task of vignette assessment in the ECHoES study closely parallels this off-line assessment in
the HES.
The importance of training was highlighted by identification of concern about the
competence of optometrists as a potential barrier to implementation (5.2.3). The quality of the
training was perceived to be good, very good or excellent by over 90% of ophthalmologists
but only about 70% of optometrists; 70% of ophthalmologists considered that the training
was sufficient compared to only 20% of optometrists; and almost all optometrists, but only
half of the ophthalmologists, revisited the webinars (3.12). These simple responses to the
questionnaire items eliciting feedback about training were supported by free text comments.
These differences in perception about training are likely to have arisen for various reasons:
some ophthalmologists may considered that they were already trained; the training was
Page 120

inevitably conceived by ophthalmologists from a HES perspective; and the relative
unfamiliarity of the task for optometrists may have made them less confident about the
competence that the training had in fact conferred. Both the feedback questionnaire and the
qualitative research suggest that a bigger investment in training would be required if shared
care were to be implemented. The nature of further training that would address the need
voiced by optometrists is unclear.
The nature of some of the images available to create the vignettes and the method for viewing
OCT images were also potential limitations of the study (6.1.2). These limitations may
explain in part why the performance of ophthalmologists was worse than expected (about
85% correct compared to the expected 95%). Consequently, the performance levels observed
in the trial should, perhaps, be considered to be the minimum achievable. It is possible that
ophthalmologists (most of whom were already familiar with OCT scans) could have been
selectively disadvantaged, in that they were used to seeing scans captured on spectral domain
systems and displayed on very high resolution monitors. Alternatively, they may have had the
advantage of having seen older scans in the HES, which optometrists may not have done.
Therefore, it is unknown whether vignettes created from more recent information may have
favoured the performance of one professional group over the other. The important point is
that the trial design ensured a ‘level playing field’ in terms of the assessments that both
groups, and experts, carried out.
Finally, the final reference standard was not available by the time that participants’ training
performance had to be assessed (6.1.3). This could have been a serious limitation if the
information used to assess participants’ performance at the time misclassified participants
with respect to their performance and their ability to progress in the trial. However, as
previously stated (2.4), when all experts had classified all vignettes, we checked the
performance of all applicants for their training vignettes using the final reference standard
classifications. No applicant was refused admission to the main trial on the basis of the
interim expert classifications who would have progressed to the main trial on the basis of the
final reference classifications.
Page 121

6.4.2 Health economics
The cost-effectiveness results should be considered in light of some limitations of the study.
Because the ECHoES trial was virtual, participants were asked questions about a service not
implemented yet, which posed challenges for optometrists in identifying appropriate costing
information for their potential nAMD monitoring review provision. The health economics
questionnaire was not a compulsory part of the trial and we wanted to avoid overburdening
participants with lots of questions. Therefore, we used expert opinion to inform the economic
evaluation about the types and models of different pieces of equipment, the average volume
of patients using some of the equipment items and the expected working-life of equipment.
Furthermore, the costs used in the economic evaluation rely on the assumptions inherent
within the decision-trees shown in Figures 1 and 2.
Expert opinion was also used to help to map the pathways for the care cost model with
respect to the likely courses of action arising from various decisions being made by
optometrists and ophthalmologists. In particular, the optometrist pathway assumes that all
patients classed as reactivated receive a second monitoring review in hospital (at the more
expensive ophthalmologist cost, rather than the cheaper optometrist review cost), which
increases costs for correct judgements of lesion reactivation in the optometrist pathway but
also enables a second opportunity for any errors to be corrected before costly ranibizumab
injections are given. In real world implementations of shared care, other pathways may be
devised or pathways may improve with time after they have been implemented. For example,
the optometrist pathway is likely to include direct clinical examination, as well as review of
CF and OCT images; and an integrated shared care pathway could allow the HES to review
information obtained by community optometrists following rapid referral (as envisaged by
the last item of the economic question, Appendix 4 part 1 Q8), rather than repeating
monitoring tests. Alternatively, shared care pathways may also improve with time after they
have been implemented.
6.4.3 Views of patients and health professionals about the shared care model
A purposeful sampling approach was adopted within and across the research to ensure that
the feasibility and acceptability of the proposed shared model of care for nAMD was captured
from a range of perspectives. However, ophthalmologists and optometrists were recruited Page 122

from specialist conferences, which may limit the extent to which their perspectives are
representative of optometrists and ophthalmologists in the UK. Furthermore service users
were recruited from Macular Society support meetings and such individuals may be more
proactive and informed about their condition than non-members.35 Service users at the
support groups who were willing to be contacted were white British, possibly because white
people may be more susceptible to developing nAMD42 or because people from ethnic
minority groups are less likely to access eye care services.43, 44 It should also be acknowledged
that all service users attended the same eye hospital for their nAMD care and some aspects of
their care may differ to other hospitals throughout the UK, although the themes relating to
current experiences of hospital care have also been highlighted by previous research.32, 34, 35
Focus groups were used to explore and understand key issues when considering barriers and
facilitators to implementation. Separate rather than mixed focus groups were undertaken to
capture any potential inter-professional trust issues which emerged from previous research.33
One-to-one interviews were conducted with other health professionals because it was not
possible to ascertain a convenient location, date and time to organise a third focus group.
These interviews provided a rich account of the perceived feasibility and acceptability of a
shared care scheme and allowed the findings from the focus groups to be followed up further
and explored in-depth.
None of the participants had experience of shared care for nAMD. Research has questioned
whether evaluations of hypothetical scenarios accurately relate to judgments in real-life
situations.45, 46 However, participants gave negative as well as positive views of the shared
care model, which suggests that they carefully considered the practicalities of
implementation. In addition, focus groups provided an opportunity to prompt a range of
issues about shared care to be discussed which participants may not have otherwise
considered individually in one-to-one interviews.47 Furthermore, the issues identified in this
study about a hypothetical shared care scheme mirror many of the findings from studies in
which participants gave feedback after direct experience of shared care.33, 40
Page 123

6.5 Lessons for the future
6.5.1 Lessons for a future shared care approach to the management of nAMD
It is clear that, given foreseeable health technologies for treating nAMD (including potential
emerging therapies combining anti-VEGF drugs with stereotactic radiotherapy), the need for
efficient methods of long term review will remain an urgent priority. Some form of shared
care with community-based optometrists is one approach for achieving this, not-withstanding
the findings of the economic evaluation (6.6). The ECHoES study has demonstrated that
community-based optometrists can develop competency in decision-making about lesion
reactivation that is equivalent to the competency of ophthalmologists working the HES.
Although it was not straightforward to conduct the study in a short period of time, we were
able to apply the methods we planned at the time of the grant application with few
modifications. We would recommend further trials of this nature to address research
questions where appropriate data repositories can be identified.
6.5.2 Lessons for a future economic evaluation alongside a virtual trial
The virtual trial imposed the limitation of asking participating optometrists to identify the
resources and likely costs for providing a service that had not yet been implemented. This is
not an intrinsic feature of virtual trials but is a likely feature, since the attraction of a virtual
trial is greatest when there are obstacles to provide a service. The absence of an existing
shared care pathway also contributed to uncertainty about the cost-effectiveness estimates.
This was highlighted by the economic evaluation sensitivity analyses, notably the analysis
which excluded re-review in the HES of a patient rapidly referred by a community-based
optometrist.
6.5.3 Lessons for qualitative research alongside a virtual trial
This study highlights the importance of exploring the views of relevant stakeholders about
the acceptability of shared care for nAMD and barriers to its implementation alongside a
virtual trial. The qualitative research identified key concerns that would need to be addressed
in formulating a concrete shared care model. Had the study proceeded as originally proposed
by the applicants, the headline non-inferiority findings might have led to unreasonable
optimism about the feasibility of shared care for nAMD.Page 124

6.6 Future research
The ECHoES platform remains in place and could be used either for further research or
future training. It proved to be robust for carrying out the trial and the medical retina experts
see no reason to alter its main features, including the rules for classifying lesion activity
based on assessing lesion components. It would be interesting to assess the performance of
other professional groups using the ECHoES training and assessment protocols e.g. hospital
optometrists and ophthalmologists in training who did not meeting the qualifications/
experience criteria specified for this study.
Further research is required to investigate whether lesion components can be defined more
precisely, especially where there was less than good agreement between experts. DRT is a
good example of this and as, like SRF, this component may be a key sign of reactivation, a
clearer definition may be important.
Improvements in technology, and the expertise of OCT technicians in capturing OCT images,
may make the vignettes based on the IVAN image repository increasingly irrelevant.
Replacing these images with images for patients currently being managed in the HES would
be easy to do, in principle, but would require investment (primarily, the time of experts to
assess the new images to provide the reference classifications and the necessary approvals to
use patients’ data).
A further, desirable information technology (IT) feature to add to the web application would
be an interface with modern CF and OCT equipment, allowing images to be imported
automatically for assessment, e.g. within a local network operating in an optometry practice
(potentially across multiple sites). Wider network integration with the HES could allow for a
tele-medicine style of shared care, with optometrists having responsibility for capturing the
images required and discussion with HES ophthalmologists in scheduled ‘virtual’ clinics to
review them. Such an arrangement could allow trust between professions to evolve over time,
with subsequent handover over decision-making to specified optometrists, without the need
for formal face-to-face training in hospitals.
Page 125

A key attraction of a shared care model for nAMD is the ability to relieve the HES of some
its workload. Yet this benefit is not formally included in a conventional health economic
evaluation (like the one reported here), which provides a direct comparison of two or more
interventions in terms or their cost-effectiveness. It would be useful for follow-up work to
explore the process of freeing up HES resources through implementation of shared care for
nAMD. One potential approach for doing this would be to use the simple framework of
programme budgeting and marginal analysis, which can explicitly explore the resource
implications of moving resources around within a given health service area.48
Although the final results of the research exploring the health professionals’ views on shared
care for nAMD were formulated from a combination of focus groups and interviews, the
constant comparative method provided an opportunity to highlight similarities and
differences between the disciplines. Future research could conduct a mixed focus group to
enable the range of health professionals to engage in a discussion to address the differences
of opinion that were identified in this study.
Page 126

7. ConclusionThe ECHoES study has demonstrated that community-based optometrists can develop
competency in decision-making about lesion reactivation that is equivalent to the competency
of ophthalmologists working the HES. Overall, optometrists were as good as
ophthalmologists in classifying the activity status of a lesion but tended to make different
types of error. The tendency of optometrists to adopt a more cautious decision criterion than
ophthalmologists, making them less likely to misclassify reactivated lesions, may be a
desirable attribute.
Our cost-effectiveness analysis showed that there was little difference in costs and effects
between optometrists and ophthalmologists in cost per correct retreatment decision for
patients with nAMD in the ECHoES trial. Since optometrists have less training and
experience compared to ophthalmologists, once they become more familiar with undertaking
monitoring reviews, a shared care model like this has the potential to represent a cost-
effective way of managing patients with nAMD and freeing up resources in hospital eye
clinics, especially as the cost for the review itself was cheaper in the community. The
findings of the economic evaluation should be used carefully to guide further planning of
shared care models since the hypothetical nature of shared service provision in the ECHoES
study gave rise to important uncertainties. Indeed, the economic model should be useful to
explore concrete shared care pathways.
Patients and professionals were enthusiastic about the opportunities afforded by a shared care
model for nAMD, which has the potential to reduce clinic capacity and represent a more
patient centric model of care. However, ophthalmologists and service users need reassurance
that the convenience of community monitoring would not compromise the standard of care.
Training for optometrists, under the supervision of ophthalmologists, was deemed to be the
most effective method to ensure competency; it might also improve communication and trust
between the professions.
Page 127

AcknowledgementsThe trial was funded by the United Kingdom National Institute for Health Research (NIHR)
HTA program (ref: 11/129/195). The authors would like to thank Michelle McGaughey for
her assistance in setting up and running the webinar training sessions, and the CTEU database
team in Bristol for their assistance in maintaining the web application.
The views and opinions expressed are those of the authors and do not necessarily reflect
those of the HTA programme, the NIHR, the UK NHS or the Department of Health.
Contribution of authorsProf Barnaby C Reeves (professorial research fellow, health services research) was involved
in writing the application for trial funding, designing and managing the trial, and drafting this
report.
Ms Lauren J Scott (medical statistician, clinical trials) was involved in managing the trial,
carrying out the statistical analysis and drafting this report.
Dr Jodi Taylor (trial coordinator, clinical trials) was involved in managing the trial and
drafting this report.
Dr Ruth Hogg (Lecturer in optometry, optometry) was involved in writing the application for
trial funding and designing the trial.
Dr Chris A Rogers (reader in medical statistics, clinical trials) was involved in writing the
application for trial funding, and designing and managing the trial, and supervised the
statistical analysis.
Dr Sarah Wordsworth (senior researcher, health economics) was involved in writing the
application for trial funding, designing the trial, designing the health economic evaluation
questionnaire and carrying out the health economic analysis.
Dr Daisy Townsend (research associate, qualitative research) was involved in conducting and
analysing the findings of the interviews and focus group meetings.
Dr Alyson Muldrew (research scientist, ophthalmology) was involved in designing the trial
and developing the vignette database.
Dr Tunde Peto (head of ophthalmic image analysis centreconsultant ophthalmologist, medical
retina) provided trial input and expert assessment of vignettes.
Page 128

Dr Mara Violato (senior researcher, health economics) was involved in designing the health
economic evaluation questionnaire and carrying out the health economics analysis.
Dr Helen Dakin (senior researcher, health economics) was involved in carrying out the health
economics analysis.
Ms Heike Cappel-Porter (database manager, clinical trials) created and maintained the web
application.
Dr Nicola Mills (research fellow, qualitative research) was involved in designing the trial,
and supervised the collection and analysis of the focus group meetingsand interview data.
Dr Dermot O’Reilly (clinical senior lecturer, public health) conceived the trial and was
involved in writing the application for trial funding.
Prof Simon P Harding (clinical professor in ophthalmology, medical retina) was involved in
writing the application for trial funding, and provided trial input and expert assessment of
vignettes.
Prof Usha Chakravarthy (clinical professor in ophthalmology, medical retina) was involved
in writing the application for trial funding, designing the trial and developing the vignette
database, and provided trial input and expert assessment of vignettes.
Total word count (including tables): 30,12030,104
Page 129

References
1. National Institute for Health and Clinical Excellence. Ranibizumab and pegaptanib for the treatment of age-related macular degeneration August 2008.
2. Rosenfeld PJ, Brown DM, Heier JS, Boyer DS, Kaiser PK, Chung CY, et al. Ranibizumab for neovascular age-related macular degeneration. N Engl J Med. 2006;355(14):1419-31.
3. Brown DM, Kaiser PK, Michels M, Soubrane G, Heier JS, Kim RY, et al. Ranibizumab versus verteporfin for neovascular age-related macular degeneration. N Engl J Med. 2006;355(14):1432-44.
4. IVAN study investigators, Chakravarthy U, Harding SP, Rogers CA, Downes SM, Lotery AJ, et al. Ranibizumab versus bevacizumab to treat neovascular age-related macular degeneration: one-year findings from the IVAN randomized trial. Ophthalmology. 2012;119(7):1399-411.
5. Heier JS, Brown DM, Chong V, Korobelnik JF, Kaiser PK, Nguyen QD, et al. Intravitreal aflibercept (VEGF trap-eye) in wet age-related macular degeneration. Ophthalmology. 2012;119(12):2537-48.
6. CATT research group, Martin DF, Maguire MG, Ying GS, Grunwald JE, Fine SL, et al. Ranibizumab and bevacizumab for neovascular age-related macular degeneration. N Engl J Med. 2011;364(20):1897-908.
7. Chakravarthy U, Harding SP, Rogers CA, Downes SM, Lotery AJ, Culliford LA, et al. Alternative treatments to inhibit VEGF in age-related choroidal neovascularisation: 2-year findings of the IVAN randomised controlled trial. Lancet. 2013;382(9900):1258-67.
8. Martin DF, Maguire MG, Fine SL, Ying GS, Jaffe GJ, Grunwald JE, et al. Ranibizumab and bevacizumab for treatment of neovascular age-related macular degeneration: two-year results. Ophthalmology. 2012;119(7):1388-98.
9. Chakravarthy U, Harding SP, Rogers CA, Downes S, Lotery AJ, Dakin H, et al. A randomised controlled trial to assess the effectiveness and cost-effectiveness of alternative treatments to Inhibit VEGF in Age-related choroidal Neovascularisation (IVAN). Health Technol Assess. 2015;In press.
10. Hau S, Ehrlich D, Binstead K, Verma S. An evaluation of optometrists' ability to correctly identify and manage patients with ocular disease in the accident and emergency department of an eye hospital. Br J Ophthalmol. 2007;91(4):437-40.
11. Banes MJ, Culham LE, Bunce C, Xing W, Viswanathan A, Garway-Heathm D. Agreement between optometrists and ophthalmologists on clinical management decisions for patients with glaucoma. Br J Ophthalmol. 2006;90(5):579-85.
12. Amoaku W, Blakeney S, Freeman M, Gale R, Johnston R, Kelly SP, et al. Action on AMD. Optimising patient management: act now to ensure current and continual delivery of best possible patient care. Eye. 2012;26:S2-S21.
13. Kelly SP, Wallwork I, Haider D, Qureshi K. Teleophthalmology with optical coherence tomography imaging in community optometry. Evaluation of a quality improvement for macular patients. Clin Ophthalmol. 2011;5:1673-8.
14. Cameron JR, Ahmed S, Curry P, Forrest G, Sanders R. Impact of direct electronic optometric referral with ocular imaging to a hospital eye service. Eye. 2009;23(5):1134-40.
15. Singer MA, Awh CC, Sadda S, Freeman WR, Antoszyk AN, Wong P, et al. HORIZON: An Open-Label Extension Trial of Ranibizumab for Choroidal
Page 130

Neovascularization Secondary to Age-Related Macular Degeneration. Ophthalmology. 2012;119(6):1175-83.
16. Cochran WG, Cox MG. Experimental designs. 2nd ed: John Wiley & Sons; 1992. p. 611.
17. Fleiss JL. Balanced Incomplete Block-Designs for Interrater Reliability Studies. Appl Psychol Meas. 1981;5(1):105-12.
18. Taylor J, Scott LJ, Rogers CA, Muldrew A, O'Reilly D, Wordsworth S, et al. The Effectiveness of Community vs. Hospital Eye Service follow-up for patients with neovascular age-related macular degeneration with quiescent disease: design and implementation of the ECHoES study. BMC Med Res Methodol.Submitted.
19. HTA. ECHoES trial protocol [05/01/2015]. Available from: http://www.nets.nihr.ac.uk/projects/hta/11129195.
20. National Institute for Health and Clinical Excellence. Guide to the Methods of Technology Appraisal2013.
21. Petrou S, Gray A. Economic evaluation alongside randomised controlled trials: design, conduct, analysis, and reporting. BMJ. 2011;342:d1548.
22. Husereau D, Drummond M, Petrou S, Carswell C, Moher D, Greenberg D, et al. Consolidated Health Economic Evaluation Reporting Standards (CHEERS) statement. BMC Med. 2013;11:80.
23. Drummond MF, Sculpher MJ, Torrance GW, O'Brien B, Stoddart GL. Methods for the Economic Evaluation of Health Care Programmes. 3rd ed. New York: Oxford University Press; 2005.
24. Dakin HA, Wordsworth S, Rogers CA, Abangma G, Raftery J, Harding SP, et al. Cost-effectiveness of ranibizumab and bevacizumab for age-related macular degeneration: 2-year findings from the IVAN randomised trial. BMJ Open. 2014;4(7):e005094.
25. Strauss A, Corbin J. Grounded theory methodology
In: Denzin NK LY, editor. Handbook of Qualitative Research. London: Sage; 1994.26. Kanski JJ, Bowling B. Clinical Ophthalmology; A systematic approach: Saunders;
2011.27. Population of England aged 50 years and over – office of National statistics
[21/12/2014]. Available from: http://www.ons.gov.uk/ons/rel/snpp/sub-national-population-projections/2012-based-projections/rft-population-regions.xls.
28. Owen CG, Jarrar Z, Wormald R, Cook DG, Fletcher AE, Rudnicka AR. The estimated prevalence and incidence of late stage age related macular degeneration in the UK. Br J Ophthalmol. 2012;96(5):752-6.
29. TA294 Macular degeneration (wet age-related) - aflibercept: costing template [21/12/2014]. Available from: http://www.nice.org.uk/guidance/ta294/resources.
30. Patton MQ. Qualitative Research & Evaluation Methods. 3rd ed: SAGE publications; 2002.
31. Amoaku W, Blakeney S, Freeman M, Gale R, Johnston R, Kelly S, et al. Optimising patient management: act now to ensure current and continual delivery of best possible patient care. Eye. 2012;26(Suppl 1):S2–21.
32. Bhargava J, Bhan-Bhargava A, Foss A, King A. Views of glaucoma patients on provision of follow-up care; an assessment of patient preferences by conjoint analysis Br J Ophthalmol. 2008;92(12):1601-5.
33. O’Connor P, Harper C, Brunton C, Clews S, Haymes S, Keeffe J. Shared care for chronic eye diseases: perspectives of ophthalmologists, optometrists and patients. Med J Aust. 2012;196:646-50.
Page 131

34. Burton A, Shaw R, Gibson J. ‘I’d like to know what causes it, you know, anything I’ve done?’ Are we meeting the information and support needs of patients with macular degeneration? A qualitative study. BMJ Open. 2013;3(11).
35. Mitchell J, Bradley P, Anderson S, ffytche T, Bradley C. Perceived quality of health care in macular disease: a survey of members of the Macular Disease Society. Br J Ophthalmol. 2002;86:777-81
36. Holtzer-Goor K, Plochg T, Lemij H, Sprundel Ev, Koopmanschap M, Klazinga N. Why a sucessful task substitition in glaucoma care could not be transferred from a hospital setting to a primary care setting: a qualitative study. Implementation Science. 2013;8.
37. Gray S, Spry P, Brookes S, Edwards T, Spencer I, Baker I, et al. The Bristol shared care glaucoma study: outcome at follow up at 2 years Br J Ophthalmol. 2000;84:456-63.
38. Gray S, Spencer I, P S, Brookes S, Baker I, Edwards T, et al. The Bristol shared care glaucoma study-validity of measurement and patient satisfaction. J Public Health Med. 1997;19:431-6.
39. Singer M, Awh C, Sadda S, Freeman W, Antoszyk A, Wong P, et al. HORIZON: an open-label extension trial of ranibizumab for choroidal neovascularization secondary to age-related macular degeneration Ophthalmology. 2012;119:1175-83.
40. Konstantakopoulou E, Harper R, Edgar D, Lawrenson J. A qualitative study of stakeholder views regarding participation in locally commissioned enhanced optometric services. BMJ Open. 2014;4:e00478.
41. Myint J, Edgar D, Kotecha A, Murdoch I, Lawrenson J. Barriers perceived by UK-based community optometrists to the detection of primary open angle glaucoma. Ophthalmic Physiol Opt. 2010 30:847-53.
42. Klein R, Klein BE, Knudtson MD, Wong TY, Cotch MF, Liu K, et al. Prevalence of age-related macular degeneration in 4 racial/ethnic groups in the multi-ethnic study of atherosclerosis. Ophthalmology. 2006;113(3):373-80.
43. Rahi J, Peckham C, PM PC. Visual impairment due to undiagnosed refractive error in working age adults in Britain ():. British Journal Ophthalmology. 2008;92(9):1190-4.
44. Gulliford M, Dodhia H, Chamley M, McCormick K, Mohamed M, Naithani S, et al. Socio-economic and ethnic inequalities in diabetes retinal screening. Diabet Med. 2010;27(3):282-8.
45. Wilson J, While A. Methodological issues surrounding the use of vignettes in qualitative research Journal of Interprofessional Care. 1998;12:79-87.
46. Collette J, EChilds. Minding the gap: Meaning, affect, and the potential shortcomings of vignettes. Social Science Research. 2011;40:513-22.
47. Willig C. Introducing Qualitative Research in Psychology. England: McGraw-Hill; 2008.
48. Donaldson C, Bate A, Mitton C, Dionne F, Ruta D. Rational disinvestment. QJM. 2010;103(10):801-7.
Page 132

Appendix 1
ECHoES Trial Steering committee
Independent members
Chair: Prof Jon Gibson, Professor of Ophthalmology at Aston University
Patient representative/ service user: Cathy Yelf, Macular Society
Hospital optometrist: Dr Robert Harper
Community optometrist: Mr Timothy Young, McDowell Opticians, Belfast
Ophthalmologist: Prof Yit Yang, New Cross Hospital, Wolverhampton
Statistician / trialist: Prof Nicholas Freemantle, University College London Medical
School
Non-independent members
Trial Representatives: Professor Usha Chakravarthy, Prof Barney Reeves & Dr Jodi
Taylor
A representative of the sponsor institution
A representative of the funding body
Given the virtual nature of the trial, which did not impact on the care of any actual patients,
we did not convene a Data Monitoring and Safety Committee.
Page 133

Appendix 2
Screenshots from the web application
Figure 12 Information collected from ophthalmologists on registration
Page 134

Figure 13 Information collected from optometrists on registration
Page 135
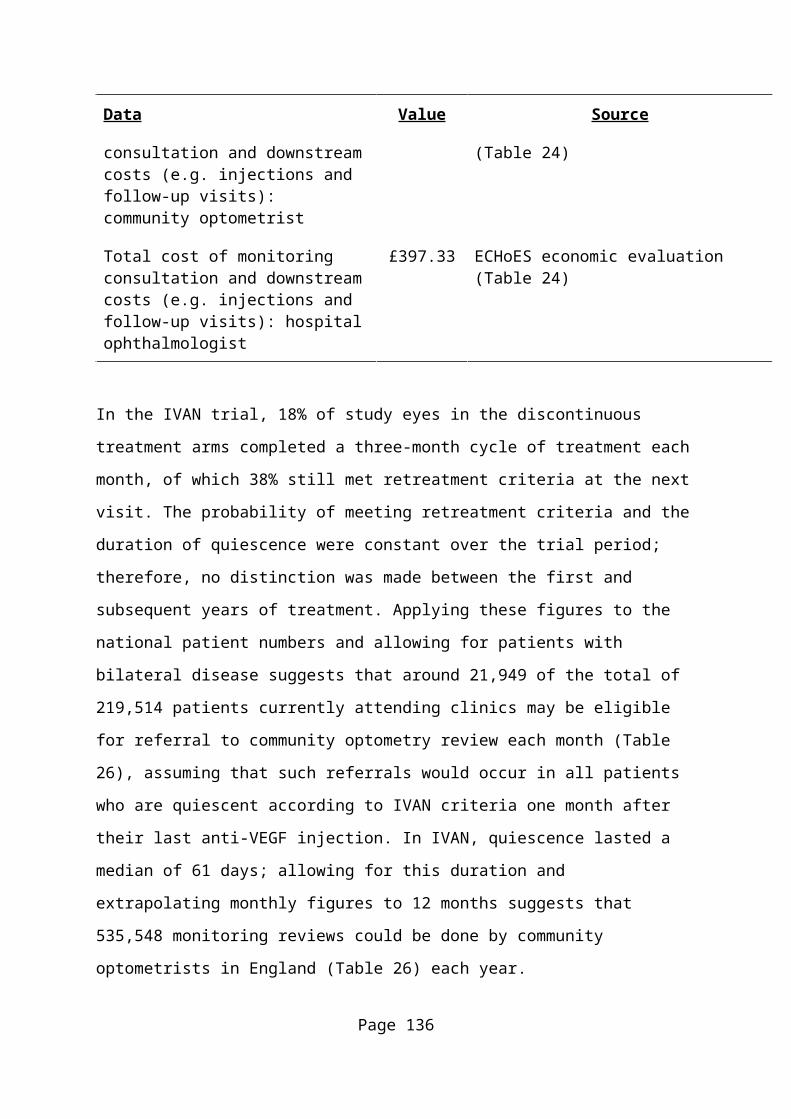
Figure 14 Participant data collected from ophthalmologists
Page 136

Figure 15 Participant data collected from optometrists
Page 137

Figure 16 Example of an ECHoES vignette
Page 138

Figure 17 Vignette assessment questions
Page 139
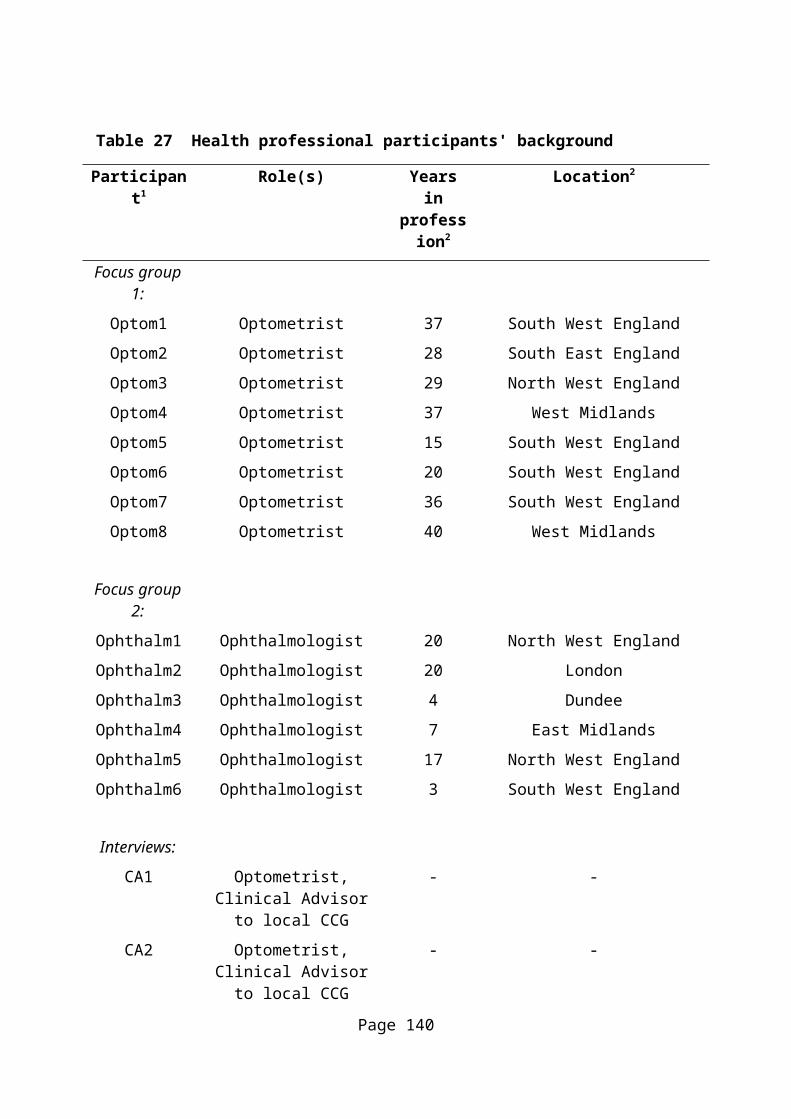
Figure 18 Example of a web application validation message to the assessor
Page 140

Appendix 3
Additional figures
Figure 19 Ophthalmologist years of experience against number of correct responses
2426
2830
3234
3638
4042
Num
ber o
f cor
rect
resp
onse
s
0 4 8 12 16 20 24 28Years of experience
Page 141

Figure 20 Comparison of participant scores for each set of vignettes
-20
-15
-10
-50
510
1520
Sco
re d
iffer
ence
(oph
thal
mol
ogis
t - o
ptom
etris
t)
24 26 28 30 32 34 36 38 40 42Mean average participant score
Note. Values above the dotted line are vignettes sets for which ophthalmologists correctly assessed more vignettes than their optometrist counterparts, and values below the dotted line are vignette sets for which optometrists scored higher. For example, the value with a score difference of 16 and mean score of 32 is a set of vignettes for which the ophthalmologist scored 40/42 and the optometrist scored 24/42.
Page 142
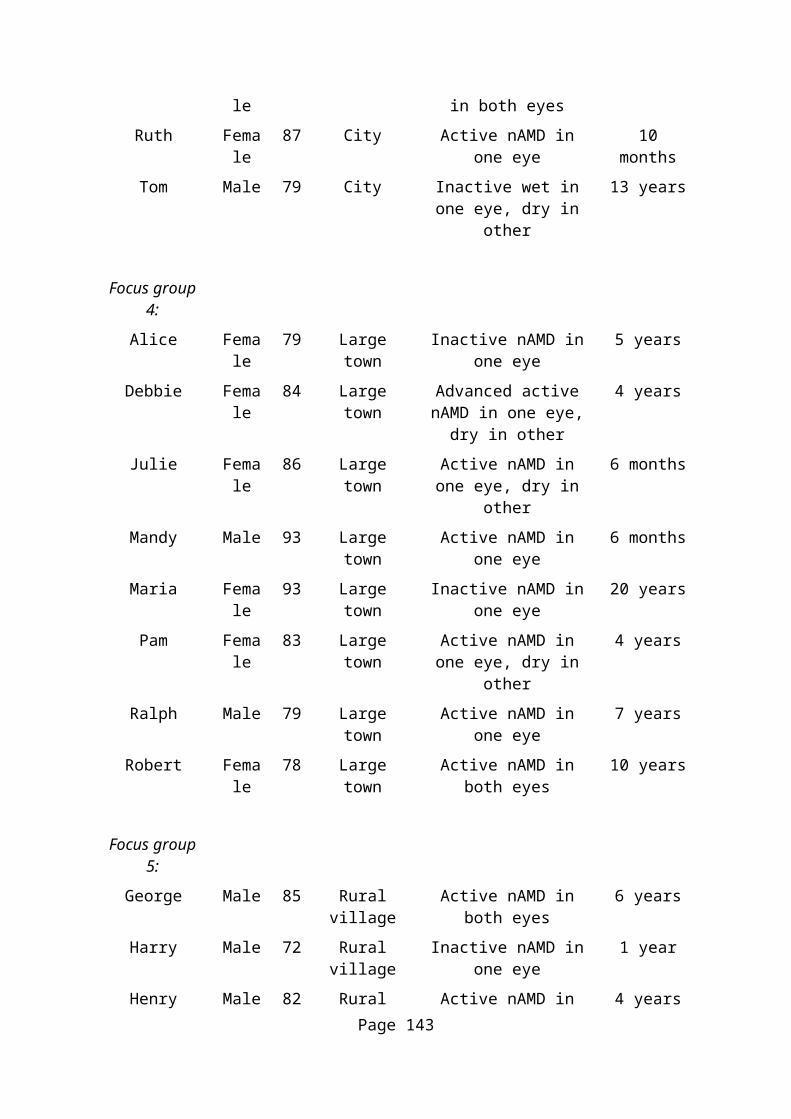
Appendix 4
Additional health economic evaluation information
1 Copy of ECHoES Resource use and cost questionnaire for optometrists
The Effectiveness of Community vs. Hospital Eye Service follow-up for patients with neovascular age-related macular degeneration with quiescent disease: a virtual trial.
RESOURCE USE AND COST QUESTIONNAIRE FOR OPTOMETRISTSDate..............................(please fill in)
Thank you for taking time to complete this questionnaire. Your answers will be kept confidential and used only for the ECHoES study.
One component of the ECHoES study is to provide the NHS with information on how cost-effective it is for optometrists to perform retreatment assessments for patients with quiescent neovascular age-related macular degeneration (nAMD).
In order to do this we would like you to answer, to the best of your knowledge, the following questions about any resources and costs that would be associated with providing this new service in optometric practices.
Notes on questionnaire completion: If you do not know the answer to any given question, please give your best guess
wherever possible and otherwise leave it blank and complete the rest of the questionnaire.
Please write “0” in response to any questions to which the answer is zero. All costs should include VAT whenever applicable. Questions will be reported in Italics, while explanatory text to set the background to the
question will be reported in normal font.
If you have any questions regarding this questionnaire please contact:Dr Mara Violato ([email protected]; Tel 01865 289265) or
Dr Sarah Wordsworth ([email protected]; Tel 01865 289268)
Page 143

******************************Set up/ Capital and operative costs******************************Imagine that the community optometric practice where you work is going to be involved in shared care-management for monitoring the need for retreatment of patients with nAMD whose disease has been rendered quiescent by anti-VEGF drugs, such as Avastin or Lucentis. We would like to know which facilities the practice already has and which facilities need to be set up in order to be able to offer this new monitoring service.
When answering, please keep in mind that the appointment for monitoring will typically consist of the components and skills summarised in Table a:
Table aComponent Description Skills requiredHistory Discussion of patient-reported
vision status in each eye and comparison to status at previous visit.
Communication skills
Clinical examinationSlit lamp biomicroscopy: Anterior segment and macula
Clinical exam to ensure absence of VEGF-related adverse events and/or incidental other disease.
Slit lamp and ophthalmoscopy skills
Visual acuity assessment Visual acuity recorded as letters read on an ETDRS chart at 4 metres (with/without mirrors) using previously recorded refraction.
The results will then be recorded in the patient medical record.
Test and interpret visual acuity
Administration of 1% tropicamide drops
Pupil dilation. Drops will need to be administered 20 minutes before CF photography and spectral domain coherence tomography.
Instillation of eye drops
CF photography (or equivalent CF image)
One good quality photograph centred on the centre of the macula of each eye.
Taking and interpreting retinal images
Spectral domain OCT Cube scan of the posterior pole for each eye. Images will be acquired using a standardised protocol, which is pre-set on the OCT machine.
Taking and interpreting OCT images
Final assessment A retreatment decision will be made on the basis of the visual acuity data and interpretation of images obtained.
The decision and rationale will need to be entered in the patient record.
Ability to assess the need for retreatment and arrange necessary follow-up
Page 144

Q1. Given the above description, how long do you think each monitoring review will take? Please include in your estimate the 20 minutes that the patient will have to wait for the dilating drops to work.
…..minutes
As optometric practices are very heterogeneous, we would first like to have a sense of such diversity in order to plan a shared-care programme that accounts for the needs of all practices. We would therefore like you to describe your practice by replying to the following questions. N.B. If you own/work in more than one practice, please reply to the whole questionnaire referring only to the practice where you spend most of your time. Q2. What is the approximate size of the practice you work in? (Please answer ONLY ONE of the alternative options)
… square metres … square feet I am unsure
Q3. How many rooms are there in your practice?… rooms
Q4. What facilities are available in the practice you work in that could be used to assess visual function and/or perform optometric monitoring on patients with nAMD? N.B. If the practice does not have a specific piece of equipment please type “0” in the corresponding line. Go to page 2 to see again Table a describing a typical monitoring review.
Equipment Quantity currently in the practiceETDRS visual acuity charts - 4 metres viewing distance required (with/without mirrors)Projector that includes ETDRS chartRetro-illuminated light boxTrial frameLens set Light meter to measure luminance. e.g. SPER ScientificSlit-lampColour fundus camera OCT acquisition systemOCT acquisition system with fundus photography included as a componentComputer Do you have a computer network (allowing images to be viewed at more than one workstation)?
YES/NO
Colour fundus camera software OCT software PrinterOther (please specify)
Page 145

PLEASE COMPLETE ALSO QUESTIONS Q4.a, Q4.b and Q4.c AS APPROPRIATE IF YOUR PRACTICE HAS ANY OF THE FOLLOWING:Colour fundus cameraOCT acquisition systemOCT acquisition system with fundus photography included as a component
Q4.a“Colour fundus camera”
Approximately when was the latest colour fundus camera acquired?…. years and …. months ago
What model is the colour fundus camera that you most recently acquired?…………………………………………………………………………………………………………………………………………………………………………………………………………………………………………………………………………………………………………………….
How many patients currently use the colour fundus camera per week?…………………..
How much did the colour fundus camera cost?(Please choose and complete only one of the following options)Costs should include VAT
£……………… one off purchase AND £…………… per year for service/maintenance/call out fee
£…………….. per month hire AND £……………….. per year service/maintenance/call out fee
£…………….. per month hire INCLUDING service/maintenance/call out fee I am unsure
Q4.b“OCT acquisition system”Approximately when was the latest OCT acquisition system acquired?
…. years and …. months ago
What model is the OCT that you most recently acquired?
………………………………………………………………………………………………………………………………………………………….………………………………………………………………………………………………………………………………………………………….
How many patients currently use the OCT acquisition system per week?………………………..
How much did the OCT acquisition system cost?(Please choose and complete only one of the following options)
Costs should include VAT
Page 146

£……………… one off purchase AND £….. per month service/maintenance/call out fee £……………… per month hire AND £….. per month service/maintenance/call out fee £……………… per month hire INCLUDING service/maintenance/call out fee I am unsure
Q4.c“OCT acquisition system with added colour fundus photography feature”Approximately when was the most recent OCT acquisition system with added colour fundus photography feature acquired?
…. years and …. months agoWhat model is the OCT acquisition system with added colour fundus photography that you most recently acquired?
………………………………………………………………………………………………………………………………………………………….………………………………………………………………………………………………………………………………………………………….
How many patients currently use the OCT acquisition system with added colour fundus photography per week?………………………………………
How much did the OCT acquisition system with added colour fundus photography feature cost to buy and how much is maintenance?(Please choose and complete only one of the following options)
Costs should include VAT £……………… one off purchase AND £….. per month service/maintenance/call out fee £……………… per month hire AND £….. per month service/maintenance/call out fee £……………… per month hire INCLUDING service/maintenance/call out fee I am unsure
Page 147

Q5. We would like now to know about the staff (including yourself) in your practice, their role, working hours, average salary and how long they would potentially spend on each monitoring review to perform retreatment assessments for patients with quiescent nAMD. Please complete the table below to the best of your knowledge. If a staff type indicated in the table is not employed at your practice, then leave the corresponding row blank. If there is more than one staff for each type, please fill in a row for each (e.g. Optometrist 1, Optometrist 2, etc…). Go to page 2 to see again Table a describing a typical monitoring review. If you need additional space, please give further details on a separate piece of paper and label it as “Q5”.
For replies in columns 2 and 5, please use one of the categories indicated below the table.
Table Q5Staff type Role that they would have
during the consultation(please choose one or more from the list below a )
Time that they would spend on patient-related activities per monitoring review (minutes)Please refer back to the total consultation length that you reported in your reply Q1
Hours worked per week
Annual salary (gross) bandb
Optometrist 1: yourself
Pre-registration optometrist 1
Page 148

Staff type Role that they would have during the consultation(please choose one or more from the list below a )
Time that they would spend on patient-related activities per monitoring review (minutes)Please refer back to the total consultation length that you reported in your reply Q1
Hours worked per week
Annual salary (gross) bandb
Optical assistant 1
Clerical/retailer staff 1
Page 149

Staff type Role that they would have during the consultation(please choose one or more from the list below a )
Time that they would spend on patient-related activities per monitoring review (minutes)Please refer back to the total consultation length that you reported in your reply Q1
Hours worked per week
Annual salary (gross) bandb
Practice manager
Other administrative staff 1
Page 150

Staff type Role that they would have during the consultation(please choose one or more from the list below a )
Time that they would spend on patient-related activities per monitoring review (minutes)Please refer back to the total consultation length that you reported in your reply Q1
Hours worked per week
Annual salary (gross) bandb
Other (specify)
Please use one or more of the following categories in column 2: 1. History 2. Clinical examination 3. Visual acuity assessment4. Administration of eye drops 5. Colour fundus photography 6. OCT
7. Assessment of need for retreatment and next follow-up 8. Updating patient records9. Booking appointments 10. None of the above 11. Other (please specify)
b Please give the salary in one of the following bands: Less than £20,000; £20,000 to £29,999; £30,000 to £39,999; £40,000 to £49,999; £50,000 to £59,999; £60,000 to £69,999; £70,000 to £79,999; £80,000 per year or more.
We anticipate that for any given monitoring visit, each individual task will be conducted by one individual optometrist. If that is not the case could you, please give details of which tasks would be done jointly by two or more people working on the same patient visit? ………………………………………………………………………………………………………………………………………………………………………………………………………………………………………………………………………………………………………………………………………
Page 151

……………………………………………………………………………………………………………………………………………….…………………………………………………………………………………………………………………………………………………………….
Page 152
Q6. Given the CURRENT size and structure of your practice would it be necessary to set up or modify any room(s) to offer the additional monitoring service?
Yes No
If YES Q6.a How many rooms would need to be set up/modified? ……………………
Q6.b What kind of adjustments would be required to the existing space in your practice?
(Please tick as many options as appropriate) It would be necessary to modify an existing room(s) to create the necessary space to
offer the new service It would be necessary to build a separate room by scaling down the size of another room
in the practice It would be necessary to rent an additional room adjacent to the practice It would be necessary to extend the current size of the practice by building an “extra”
room Other (please specify)
………………………………………………………………………………………………………………………………………………………………………………………………………………………………………………………………………………………………………………………………………………………………………………………………………………………
Q6.c With reference to the previous question, what kind of costs would your practice incur to set/up modify any existing/additional room for providing the monitoring service?
(Please tick as many options as appropriate) Refurbishment /conversion – please answer also Q6.d Building/construction work– please answer also Q6.e Additional rent – please answer also Q6.f New OCT acquisition system
How many additional OCT systems would be required? …..systems New colour fundus photography
How many additional photography systems would be required? …..systems New OCT acquisition system with added colour fundus photography
How many additional OCT/photography systems would be required? …..systems Other new specialist equipment (please specify)
………………………………………………………………………………………………………………………………………………………………………………………………………………………………………………………………………………………………………………………………………………………………………………………………………………………..
New furniture (please specify) ………………………………………………………………………………………………………………………………………………………………………………………………………………………………………………………………………………………………………………………………………………………………………………………………………………………..
Other (please specify) ………………………………………………………………………………………………………………………………………………………………………………………………………………………………………………………………………………………………………………………………………………………………………………………………………………………..
Page 153

If you expect your practice would incur “building/construction work” or “refurbishment /conversion work” or would need to “rent an additional room”, how much would that cost (excluding cost for specialist equipment, office equipment and furniture/furnishing)? Please include VAT in your replies if applicable.
Q6.d “Refurbishment /conversion”(Please choose and complete only one of the following options)
£……………………………….”one-off” expenditure I am unsure Other (please specify)
………………………………………………………………………………………………………………………………………………………………………………………………………………………………………………………………………………………………………………………………………………………………………………………………………………………
Q6.e “Building/construction work”(Please choose and complete only one of the following options)
£……………………………….”one-off” expenditure I am unsure Other (please specify)
………………………………………………………………………………………………………………………………………………………………………………………………………………………………………………………………………………………………………………………………………………………………………………………………………………………
Q6.f “Additional rent”(Please choose and complete only one of the following options)
£………………………………per month I am unsure Other (please specify)
………………………………………………………………………………………………………………………………………………………………………………………………………………………………………………………………………………………………………………………………………………………………………………………………………………………
Q7. After you have done any modifications to the practice (if needed) and hired any additional staff required (if necessary), how many patients with quiescent nAMD do you think your practice could accommodate per month in addition to your current monthly volume of clients? Please keep in mind the description of a typical monitoring review as presented at the beginning of the questionnaire (go to page 2 to see again Table a) and the estimated time for each monitoring review in minutes that you indicated in Q1.
…..patients per month
How many optometrists would this workload be shared amongst? …………………..
Page 154

*************Staff training *************
Q8. For each skill listed in the table below, please indicate what training you and your colleagues have received or would need to perform retreatment assessments for patients with quiescent nAMD. Go to page 2 to see again Table a describing a typical monitoring review. Please give as many details about the additional training as possible. If you do not know what training opportunities are available, please leave the last column blank. If you need additional space, please give further details on a separate piece of paper and label it as “Q8”.
Table Q8
Skills Do you currently feel confident that you have mastered this skill?
Details of the training I or colleagues have already received on this (course type, provider, length, cost, etc…)Costs should include VAT
Number of staff in your practice (including yourself) who would benefit from further training to perform the monitoring review
Details about training required, if known (course type, provider, length, cost, etc…)Costs should include VAT
Slit lamp biomicroscopy
Yes/No
Conduct test and interpret
Yes/No
Page 155

Skills Do you currently feel confident that you have mastered this skill?
Details of the training I or colleagues have already received on this (course type, provider, length, cost, etc…)Costs should include VAT
Number of staff in your practice (including yourself) who would benefit from further training to perform the monitoring review
Details about training required, if known (course type, provider, length, cost, etc…)Costs should include VAT
ETDRS visual acuity assessment
Administration of 1% tropicamide drops
Yes/No
Taking colour fundus
Yes/No
Page 156
Skills Do you currently feel confident that you have mastered this skill?
Details of the training I or colleagues have already received on this (course type, provider, length, cost, etc…)Costs should include VAT
Number of staff in your practice (including yourself) who would benefit from further training to perform the monitoring review
Details about training required, if known (course type, provider, length, cost, etc…)Costs should include VAT
photography images
Interpreting colour fundus photography images
Yes/No
Taking OCT images
Yes/No
Page 157

Skills Do you currently feel confident that you have mastered this skill?
Details of the training I or colleagues have already received on this (course type, provider, length, cost, etc…)Costs should include VAT
Number of staff in your practice (including yourself) who would benefit from further training to perform the monitoring review
Details about training required, if known (course type, provider, length, cost, etc…)Costs should include VAT
Interpreting OCT images
Yes/No
Making decisions about the need for retreatment and time to next follow-up
Yes/No
Page 158

Are you familiar with any electronic patient record systems? Yes No
If yes, which? …………………………………………………………………………………………………………………………………………………………………………………………………………………………………………………………………………………………
Would you be willing to use an electronic patient record system in order to offer shared care of quiescent nAMD? Yes No
**************Final questions**************
Q9. What would motivate you to join a shared-care scheme? Please choose as many options as applicable. (Please tick as many options as appropriate)
To allow the NHS to make a better use of the scarce resources by optometrists sharing the care of quiescent nAMD patients
Clinical interest Career development Practice reputation Income generation Other (please specify)……………………………………………………………………………………………………………
……………………………………………………………………………………………………………………………………………………………………………………………………………………………………………………………………………………
Q10. Are there any other costs or resources that your practice would need to incur in order to provide monitoring reviews for nAMD patients that are not mentioned in the questionnaire?
Yes No
If YES
Please provide details below…………………………………………………………………………………………………………………………………………………………………………………………………………………………………………………………………………………………………………………………………………………………………………………………………………………………………………
Q11. If you have any comments on the questionnaire (such as difficulties that you encountered interpreting or finding the information for any specific sections), please record them here.
…………………………………………………………………………………………………………………………………………………………………………………………………………………………………………………………………………………………………………………………………………………………………………………………………………………………………………
Page 159

2 Components of a typical monitoring review
Table 29 Components of a typical monitoring review and skills required
Component Description Skills requiredHistory Discussion of patient-reported
vision status in each eye and comparison to status at previous visit.
Communication skills
Clinical examinationSlit lamp biomicroscopy: Anterior segment and macula
Clinical exam to ensure absence of VEGF-related adverse events and/or incidental other disease.
Slit lamp and ophthalmoscopy skills
Visual acuity assessment Visual acuity recorded as letters read on an ETDRS chart at 4 metres (with/without mirrors) using previously recorded refraction.
The results will then be recorded in the patient medical record.
Test and interpret visual acuity
Administration of 1% tropicamide drops
Pupil dilation. Drops will need to be administered 20 minutes before colour fundus photography and spectral domain coherence tomography.
Instillation of eye drops
Colour fundus photography (or equivalent colour fundus image)
One good quality photograph centred on the centre of the macula of each eye.
Taking and interpreting retinal images
Spectral domain OCT Cube scan of the posterior pole for each eye. Images will be acquired using a standardised protocol, which is pre-set on the OCT machine.
Taking and interpreting OCT images
Final assessment A retreatment decision will be made on the basis of the visual acuity data and interpretation of images obtained.
The decision and rationale will need to be entered in the patient record.
Ability to assess the need for retreatment and arrange necessary follow-up
Page 160

3 Resource use and costs associated with training
The cost of each of the three training activities was calculated by multiplying time spent on each activity by the unit
cost of optometrist time. The average cost per hour of optometrist time was £62.13 (SD: 34.62) and its calculation was
based on participants’ report on salary and hours worked (through the health economics questionnaire). Given that our
objective was to estimate the cost of optometrist training per monitoring review, each of the three components of costs
in the above table were divided by the annual volume of patients (after the changes in the practice would take place, as
reported by each optometrist in reply to question Q7 in the health economics questionnaire, to obtain the cost of
optometrist training per monitoring review, i.e. £0.89 (SD: 1.080).
Table 30 Resource use and costs of training
Training type Optometrist’s time (minutes)
Mean (SD)
Optometrist’ cost (£)
Mean (SD)
Attending webinars 120 (0) £124 (69.26)
Revisiting webinars 90 (68.74) £96 (111.58)
Consulting other resources 64 (76.21) £66 (112.35)
Observations 48 48
Page 161

4 Sensitivity Analysis 1: Three ranibizumab injections and consultations instead of one
Table 31 Care cost pathways for sensitivity analysis 1
Lesion status assessment Obs1 (%) Pathways cost2
Mean (SD)
Experts Optometrists
Reactivated Reactivated 795 (39.43) £2548.83 (67.90)
Reactivated Suspicious 142 (7.04) £103.61 (18.51)
Reactivated Quiescent 57 (2.83) £51.29 (9.08)
Suspicious Reactivated 10 (0.50) £118.12 (16.39)
Suspicious Suspicious 11 (0.55) £57.04 (9.10)
Suspicious Quiescent 14 (0.69) £52.96 (9.37)
Quiescent Reactivated 105 (5.21) £117.14 (32.61)
Quiescent Suspicious 234 (11.61) £78.31 (11.53)
Quiescent Quiescent 648 (32.14) £51.98 (8.23)
Experts Ophthalmologists
Reactivated Reactivated 736 (36.51) £2495.81 (70.01)
Reactivated Suspicious 196 (9.72) £153.18 (92.25)
Reactivated Quiescent 62 (3.08) £77.01 (45.49)
Suspicious Reactivated 1 (0.05) £2452.74 (N/A)
Suspicious Suspicious 17 (0.84) £68.84 (31.004)
Suspicious Quiescent 17 (0.84) £60.57 (17.16)
Quiescent Reactivated 35 (1.73) £2493.45 (65.87)
Quiescent Suspicious 146 (7.24) £150.34 (95.19)
Quiescent Quiescent 806 (39.98) £75.28 (44.72)1The number of observations (i.e. vignettes) is 4032, namely 2016 referring to Optometrists and 2016 referring to Ophthalmologists. 2Pathway cost includes the cost of a monitoring consultation and downstream costs (e.g. injections and follow-up visits)
Page 162

Table 32 Impact on cost-effectiveness of sensitivity analysis 1
OptometristsMean (SD)(n=2016)
OphthalmologistsMean (SD)(n=2016)
Cost of a monitoring review (pathway cost) £1,047.03 (1,213.05) £1,015.01 (1,168.80)
Proportion of correct assessments 0.844 (0.363) 0.854 (0.353)
Incremental cost (95% CI) £32.02 (-£60.87032, £124.9)
Incremental benefit, proportion of correct assessments (95% CI)
-0.0099 (-0.045, 0.025)
ICER, incremental cost per correct assessment* Dominated*The 95% confidence interval around the ICER could not be defined
Page 163

Figure 21 Cost effectiveness plane for sensitivity analysis 1 (inner ellipse: 81%; outer ellipse: 95%)
-63
-15.
2532
.580
.25
128
DIF
FER
EN
CE
IN C
OS
T
-.042407 -.0261638 -.0099206 .0063225 .0225657DIFFERENCE IN EFFECT
Figure 22 Cost-effectiveness acceptability curve for sensitivity analysis 1
0.2
5.5
.75
1%
AC
CE
PTA
BLE
0 10000 20000 30000 40000 50000WILLINGNESS TO PAY
Page 164

5 Sensitivity analysis 2: One aflibercept injection instead of one ranibizumab
Table 33 Care cost pathways for sensitivity analysis 2
Lesion status assessment Obs1 (%) Pathways cost2
Mean (SD)
Experts Optometrists
Reactivated Reactivated 795 (39.43) £1009.24 (45.50)
Reactivated Suspicious 142 (7.04) £103.61 (18.51)
Reactivated Quiescent 57 (2.83) £51.29 (9.08)
Suspicious Reactivated 10 (0.50) £118.12 (16.39)
Suspicious Suspicious 11 (0.55) £57.04 (9.10)
Suspicious Quiescent 14 (0.69) £52.96 (9.37)
Quiescent Reactivated 105 (5.21) £117.14 (32.61)
Quiescent Suspicious 234 (11.61) £78.31 (11.53)
Quiescent Quiescent 648 (32.14) £51.98 (8.23)
Experts Ophthalmologists
Reactivated Reactivated 736 (36.51) £956.50 (46.41)
Reactivated Suspicious 196 (9.72) £153.18 (92.25)
Reactivated Quiescent 62 (3.08) £77.01 (45.49)
Suspicious Reactivated 1 (0.05) £2452.74 (N/A)
Suspicious Suspicious 17 (0.84) £68.84 (31.004)
Suspicious Quiescent 17 (0.84) £60.57 (17.16)
Quiescent Reactivated 35 (1.73) £2493.45 (65.87)
Quiescent Suspicious 146 (7.24) £150.34 (95.19)
Quiescent Quiescent 806 (39.98) £75.28 (44.72)1The number of observations (i.e. vignettes) is 4032, namely 2016 referring to Optometrists and 2016 referring to Ophthalmologists.2Pathway cost includes the cost of a monitoring consultation and downstream costs (e.g. injections and follow-up visits)
Page 165

Table 34 Impact on cost-effectiveness of sensitivity analysis 2
Optometrists
Mean (SD)
(n=2016)
Ophthalmologists
Mean (SD)
(n=2016)
Cost of a monitoring review (pathway cost) £439.90 (460.90) £425.61 (422.93)
Proportion of correct assessments 0.844 (0.363) 0.854 (0.353)
Incremental cost (95% CI) £14.29 (-£19.91, £48.49)
Incremental benefit, proportion of correct
assessments (95% CI)
-0.0099 (-0.045, 0.025)
ICER, incremental cost per correct assessment* Dominated
* The 95% confidence interval around the ICER could not be defined
Page 166

Figure 23 Cost effectiveness plane for sensitivity analysis 2 (inner ellipse: 84%; outer ellipse: 95%)
-23
-4.2
514
.533
.25
52D
IFFE
RE
NC
E IN
CO
ST
-.0445119 -.0272163 -.0099206 .007375 .0246707DIFFERENCE IN EFFECT
Figure 24 Cost-effectiveness acceptability curve sensitivity analysis 2
0.2
5.5
.75
1%
AC
CE
PTA
BLE
0 10000 20000 30000 40000 50000WILLINGNESS TO PAY
Page 167

6 Sensitivity analysis 3: One bevacizumab injection instead of one ranibizumab
Table 35 Care cost pathways for sensitivity analysis 3
Lesion status assessment Obs1 (%) Pathways cost2
Mean (SD)
Experts Optometrists
Reactivated Reactivated 795 (39.43) £242.23 (45.50)
Reactivated Suspicious 142 (7.04) £103.61 (18.51)
Reactivated Quiescent 57 (2.83) £51.29 (9.08)
Suspicious Reactivated 10 (0.50) £118.12 (16.39)
Suspicious Suspicious 11 (0.55) £57.04 (9.10)
Suspicious Quiescent 14 (0.69) £52.96 (9.37)
Quiescent Reactivated 105 (5.21) £117.14 (32.61)
Quiescent Suspicious 234 (11.61) £78.31 (11.53)
Quiescent Quiescent 648 (32.14) £51.98 (8.23)
Experts Ophthalmologists
Reactivated Reactivated 736 (36.51) £189.50 (46.41)
Reactivated Suspicious 196 (9.72) £153.18 (92.25)
Reactivated Quiescent 62 (3.08) £77.01 (45.49)
Suspicious Reactivated 1 (0.05) £184.21 (N/A)
Suspicious Suspicious 17 (0.84) £68.84 (31.004)
Suspicious Quiescent 17 (0.84) £60.57 (17.16)
Quiescent Reactivated 35 (1.73) £189.12 (38.002)
Quiescent Suspicious 146 (7.24) £150.34 (95.19)
Quiescent Quiescent 806 (39.98) £75.28 (44.72)1The number of observations (i.e. vignettes) is 4032, namely 2016 referring to Optometrists and 2016 referring to Ophthalmologists.2Pathway cost includes the cost of a monitoring consultation and downstream costs (e.g. injections and follow-up visits)
Page 168

Table 36 Impact on cost-effectiveness of sensitivity analysis 3
Optometrists
Mean (SD)
(n=2016)
Ophthalmologists
Mean (SD)
(n=2016)
Cost of a monitoring review (pathway cost) £137.43 (91.78) £131.89 (77.12)
Proportion of correct assessments 0.844 (0.363) 0.854 (0.353)
Incremental cost (95% CI) £5.54 (-£0.834, £11.916)
Incremental benefit, proportion of correct
assessments (95% CI)
-0.0099 (-0.045, 0.025)
ICER, incremental cost per correct assessment* Dominated*The 95% confidence interval around the ICER could not be defined
Figure 25 Cost effectiveness plane for sensitivity analysis 3 (inner ellipse: 50%; outer ellipse: 95%)
-31.
255.
59.
7514
DIF
FER
EN
CE
IN C
OS
T
-.0480492 -.0289849 -.0099206 .0091437 .028208DIFFERENCE IN EFFECT
Page 169

Figure 26 Cost-effectiveness acceptability curve for sensitivity analysis 3
0.2
5.5
.75
1%
AC
CE
PTA
BLE
0 10000 20000 30000 40000 50000WILLINGNESS TO PAY
Page 170

7 Sensitivity analysis 4: Only monitoring review cost, no pathway cost
Table 37 Care cost pathways for sensitivity analysis 4
Lesion status assessment Obs1 (%) Pathways cost2
Mean (SD)
Experts Optometrists
Reactivated Reactivated 795 (39.43) £51.79 (8.49)
Reactivated Suspicious 142 (7.04) £51.81 (9.26)
Reactivated Quiescent 57 (2.83) £51.29 (9.08)
Suspicious Reactivated 10 (0.50) £50.64 (7.12)
Suspicious Suspicious 11 (0.55) £57.04 (9.10)
Suspicious Quiescent 14 (0.69) £52.96 (9.37)
Quiescent Reactivated 105 (5.21) £51.49 (8.01)
Quiescent Suspicious 234 (11.61) £52.21 (7.69)
Quiescent Quiescent 648 (32.14) £51.98 (8.23)
Experts Ophthalmologists
Reactivated Reactivated 736 (36.51) £76.09 (43.66)
Reactivated Suspicious 196 (9.72) £76.59 (46.13)
Reactivated Quiescent 62 (3.08) £77.01 (45.49)
Suspicious Reactivated 1 (0.05) £89.70 (N/A)
Suspicious Suspicious 17 (0.84) £68.84 (31.004)
Suspicious Quiescent 17 (0.84) £60.57 (17.16)
Quiescent Reactivated 35 (1.73) £76.71 (38.22)
Quiescent Suspicious 146 (7.24) £75.17 (47.59)
Quiescent Quiescent 806 (39.98) £75.28 (44.72)1The number of observations (i.e. vignettes) is 4032, namely 2016 referring to Optometrists and 2016 referring to Ophthalmologists.2Pathway cost includes the cost of a monitoring consultation and downstream costs (e.g. injections and follow-up visits)
Page 171

Table 38 Impact on cost-effectiveness of sensitivity analysis 4
Optometrists
Mean (SD)
(n=2016)
Ophthalmologists
Mean (SD)
(n=2016)
Cost of a monitoring review £51.90 (8.36) £75.60 (44.31)
Proportion of correct assessments 0.844 (0.363) 0.854 (0.353)
Incremental cost (95% CI) -£23.70 (-£26.09,-£21.31)
Incremental benefit, proportion of correct
assessments (95% CI)
-0.0099 (-0.045, 0.025)
ICER, incremental cost per correct
assessment (95% CI) Fieller’s method*
£2389.07
lower limit (ll): £535; upper limit (ul): -£943* We can be 95% confident that the way of performing a monitoring review with the larger point estimate for effect (i.e. monitoring review
performed by ophthalmologists) represents bad value compared with the alternative.
Page 172

Figure 27 Cost effectiveness plane for sensitivity analysis 4 (inner ellipse 50%; outer ellipse: 95%)
-27
-20.
25-1
3.5
-6.7
50
DIF
FER
EN
CE
IN C
OS
T
-.0480492 -.0289849 -.0099206 .0091437 .028208DIFFERENCE IN EFFECT
Figure 28 Cost-effectiveness acceptability curve for sensitivity analysis 4
0.2
5.5
.75
1%
AC
CE
PTA
BLE
0 10000 20000 30000 40000 50000WILLINGNESS TO PAY
Page 173

Appendix 5
Statistical analysis plan
1. INTRODUCTION TO SAP
1.1 Scope
This statistical analysis plan (SAP) details information regarding the statistical analysis of the completed ECHoES trial and covers analyses of trial data outlined in the study protocol. It does not include the health economic evaluation or analysis of the focus group discussions.
1.2 Editorial changes
Any changes made to this SAP after approval must be clearly justified and documented as an amendment at the end of this document. The SAP should then be re-approved.
1.3 SAP document approval
The trial statistician should authorise this document.
2. STUDY BACKGROUND AND OBJECTIVES
2.1 Study backgroundWet, or neovascular, age-related macular degeneration (nAMD) is a condition which causes severe sight loss in older people. There is currently no evidence about the effectiveness of community follow-up by optometrists for nAMD. However, there is evidence about the acceptability of further training to optometrists, and their effectiveness in providing ‘shared care’ with the Hospital eye clinic setting (HES), for other eye diseases. Community optometrists already participate successfully in shared care management schemes for patients with glaucoma and diabetic eye disease, and evaluations comparing agreement between management by optometrists and ophthalmologists has been shown to be acceptable in the context of glaucoma and accident and emergency services [1, 2].
The question of interest to the NHS is whether community optometrists can be trained to make decisions about the need for retreatment in patients with nAMD whose disease has been rendered quiescent by treatment with anti-vascular endothelial growth factor (VEGF) drugs with the same accuracy as ophthalmologists working in the HES.
2.2 Study objectivesThe aim of the trial is to test the hypothesis that, compared to conventional hospital eye clinic follow-up, community follow-up by optometrists (after appropriate training) is not inferior for patients with nAMD with stable vision. This hypothesis will be tested by comparing decisions made by samples of ophthalmologists working in the HES and optometrists working in the community about the need for retreatment, following a period in which patients have not required treatment. Rather than carrying out a new (prospective) trial, optometrists and ophthalmologists participating in the trial will make decisions about vignettes composed of clinical information and colour fundus (CF) and ocular coherence tomography (OCT) images collected in the course of the IVAN trial (HTA ref: 07/36/01). Retreatment decisions made by participants in both groups will be validated against a reference standard based on the opinions of three medical retinal experts (see section 4.1).
Page 174

The trial has five specific objectives:
I. To compare the proportion of retreatment decisions (based on lesion classifications, see section 2.3) classified as ‘correct’ (against the reference standard, ‘reactivated’ vs. ‘suspicious’ or ‘inactive lesion’, see section 4.1) made by optometrists and ophthalmologists.
II. To estimate the agreement, and nature of disagreements, between retreatment decisions made by optometrists and ophthalmologists.
III. To estimate the influence of vignette clinical and demographic information on retreatment decisions.IV. To estimate the cost-effectiveness of follow-up in the community by optometrists compared to follow-up
by ophthalmologists in the HES. This is not covered in this SAP.V. To ascertain the views of patient representatives, optometrists, ophthalmologists and clinical
commissioners on the proposed shared care model. This is not covered in this SAP.
2.3 Terminology
Throughout the protocol and this SAP, the terms lesion classification, retreatment decision and referral decision are used interchangeably. Unless otherwise stated, the analyses will use the lesion classification question, for which participants must classify the vignette as reactivated, suspicious or quiescent. The logic behind this is that the identification of key vignette features and the resultant classification of lesions is the difficult part; retreatment/ referral decisions can be defined by rules based on these classifications.
2.4 Primary outcome
The primary outcome is a participant’s judgement of lesion classification (“Reactivated lesion” vs. “Inactive lesion” or “Suspicious lesion”) against the reference standard (see section 4.1). The number of ‘correct’ assessments will be compared between the two participant groups (see section 4.2 for details).
2.5 Secondary outcomesThe secondary outcomes are:
(d) The frequency of “serious” errors judged likely to be sight-threatening. This classification will be assigned to a participant’s classification of a vignette when the participant’s decision is “lesion quiescent” and the reference standard classification is “lesion reactivation”, i.e. a definitive false negative classification by the participant. Definitive false positive decisions will not be considered serious but will be tabulated separately. Misclassifications involving classifications of “suspicious lesion”, whether assigned as the reference standard or by a participant, will also not be considered serious.
(b) Judgements about the presence or absence of lesion components, e.g. blood, exudates and sub retinal fluid (SRF) in the fundus colour images; SRF, intra-retinal fluid/cysts and pigment epithelial detachment (PED) in the OCT images.
(c) Participant-rated confidence in their decisions about the lesion classification, on a 5-point scale.
3. STUDY POPULATION
The study population consists of fully qualified optometrists registered with the General Optical Council (GOC) for at least 3 years, and ophthalmologists with 3 years post-registration experience in Ophthalmology. The planned number of participants to be included in the study is 96, with a 1:1 ratio of optometrists and ophthalmologists. On the basis that some participants will be unable to attend the webinars, will not complete the training vignettes or will not correctly assess an adequate number of training vignettes, more than 96 participants will be recruited to attend the webinars. The first 48 ophthalmologists and 48 optometrists enrolled in the study will be assigned their training vignettes and the additional participants will be assigned vignettes on an as needed basis.
Page 175

The initial sample size calculation was based on the number of vignettes required to be assessed, and the number of participants was then decided based on this calculation.
3.1 Trial design
The participants are not randomised into the trial as by training they are either an optometrist or an ophthalmologist. However, randomisation, using a randomised block design, was used in assigning vignettes to each participant. The ‘main study’ vignettes (i.e. excluding training vignettes) were assigned to participants in a random order such that each vignette is seen seven times by an ophthalmologist and seven times by an optometrist, and each of the 48 participants in each group sees 42 vignettes. There are therefore a total of 288 (48x42/7) vignettes included in the trial. The selection of vignettes and the order they are viewed is matched for the two groups in a 1:1 ratio in order to reduce any bias that may be introduced by different assessors viewing different vignettes in different orders. Each participant is also assigned a random 24 training vignettes (and a further 24 training vignettes if they fail their first set) such that none of the vignettes in their training set(s) appear in their main study set. Again, this is matched across groups.
3.2 Flow of participants
Participants who are consented into the study must first complete two webinar training sessions. Once these have been complete they are allocated a training set of 24 vignettes, of which they must correctly assess at least 18 (75%) to pass their training. If they pass, they will then be allocated their 42 ‘main study’ vignettes. If they fail their first training vignettes, they are allocated a second training set of a further 24 vignettes. If they pass this second training set they will be allocated their 42 main study vignettes; if they fail their second set of training they will be withdrawn from the study. Only participants who assess all of their 42 main study vignettes will be included in the analysis population (see section 3.5). Participants are followed up until they have assessed all of their main study vignettes or until they withdraw or are withdrawn from the study. The planned study time is approximately six months from registration until study completion.
The participant flow will be described via the flowchart.
3.3 Protocol deviations
There is no protocol deviations defined for this study.
3.4 WithdrawalsParticipants can withdraw from the study at any time after registration. They may also be withdrawn by the study team if they do not correctly assess an adequate number of vignettes in their training sets (see section 3.1 for details).
3.5 Analysis population
The analysis population will consist of the 48 ophthalmologists and 48 optometrists who complete their 42 main study vignettes. Participants who withdraw or are withdrawn before completion of their main study vignettes will not be included in the analysis population but their progression in the trial will be described in the flowchart.
4. DERIVATIONS
4.1 Reference standard
All vignettes will be assessed by three experts; it is expected that for most vignettes the classification decisions of all experts will agree. For those where there is disagreement, the three experts will collectively make a final consensus decision. The agreed assessment decision for each vignette (“reactivated”, “suspicious” or
Page 176

“quiescent” lesion) will be known as the reference standard and will be used to calculate ‘correct’ assessment decisions of all participants.
4.2 Primary outcome
For the primary outcome, a binary ‘active lesion’ variable will be derived for both the reference standard and the participant responses, as follows:
If a vignette is classified as “lesion reactivated” then active lesion = Yes
If a vignette is classified as “lesion quiescent” or “lesion suspicious” then active lesion = No
Else missing (by design there should not be any missing data)
An indicator of whether participants have made the correct classification for each vignette will then be derived as follows:
If the reference standard and a participant have both classified a vignette as an active lesion or have both classified a vignette as not an active lesion, then classification status = correct
If the reference standard have classified a vignette as an active lesion and a participant has not classified it as an active lesion, or vice versa, then classification status = incorrect
Else missing (by design there should not be any missing data)
An overall count of the number of vignettes that each participant correctly classified (out of a possible 42) will also be derived.
4.3 Other variables
New variable RulesSecondary outcome (a): ‘Serious’ errors judged to be sight threatening
If reference standard= lesion reactivated and participant opinion = lesion quiescent, then = YesIf reference standard= lesion reactivated and participant opinion = lesion suspicious or lesion reactivated, then = NoElse missing
Years since qualification for optometrists
Year since qualification = Date of consent – date of registration with the General Optical Council
Years since qualification for ophthalmologists
First, a date of qualification was calculated:Dateofqual = Royal college date if available, else MRCOphth date if available, else FRCOphth date if available, else diploma date, else other appropriate date.Years of experience = Date of consent – dateofqual
5. STATISTICAL ANALYSES
5.1 Participant characteristics
Participant characteristics will be described by group for participants in the analysis population.
Page 177

Continuous variables will be summarised using the mean and standard deviation (SD) (or median and inter quartile range (IQR) if the distribution is skewed), and categorical data will be summarised as a number and percentage. The summary statistic headings given are those we expect to use based on a-priori knowledge of the measurements but may change.
Characteristics of the participants will be described and compared formally using t-tests, Mann-Whitney tests, chi-squared tests or Fishers exact tests as appropriate.
5.2 Primary and secondary outcome data5.2.1 Adjustment in models
The intention is to adjust all primary and secondary outcome models for participant and vignette number as random effects, and the order that the vignettes were viewed in as a fixed effect (modelled as tertiles: 1-14, 15-28 and 29-42).
5.2.2 Analysis models
All outcomes listed in the study protocol will be presented as follows. For all formal group comparisons, the ophthalmologists will be the reference group.
5.2.3 The primary outcome
The number and percentage of correct active lesion decisions will be presented by group, and formally compared using logistic regression. The sensitivity and specificity for each of the professional groups, as well as a summary of individual participants, will also be presented; a more detailed descriptive breakdown of vignette classifications will be presented separately.
The adjusted odds ratio (OR) and corresponding 95% confidence interval (CI) for the group effect (generated from the logistic regression model) will be presented. Using this OR and 95% CI, we will address the non-inferiority limit stated in the protocol: less than 10% absolute difference between the groups assuming the ophthalmologist group would correctly assess 95% of their vignettes. To test this it is necessary to convert this 10% difference to the odds scale as follows:
Using the values in the below table, the odds ratio of a correct response is calculated by (c/d) / (a/b). The non-inferiority limit on the odds scale is therefore ((0.85/0.15) / (0.95/0.05) = 0.298.
Ophthalmologist Optometrist Overall
Correct a c a+c
Incorrect b d b+d
Overall a+b c+d a+b+c+d
In addition to the analysis described above, the influence of key vignette features on correct lesion decisions will be investigated using Poisson regression, and presented as incidence rate ratios (IRR) and 95% CIs. Key features include baseline VA, index VA, age and sex of patients, smoking status and past history of angina or heart disease. All features will be retained in the model regardless of statistical significance. The reference standard and group will also be fitted as fixed effects. Interactions between the vignette features and group will also be tested and if significant at the 5% level, estimates will be presented separately for the two groups.
Note: The protocol states that the primary outcome would be analysed using Poisson regression. However, after further consideration we are proposing to fit a logistic rather than Poisson model in order to fully account
Page 178
for the incomplete block design in the analysis. Fitting a Poisson model would not allow us to include both participant and vignette in the model.
5.2.4 Secondary outcome (a) – serious errors
The numbers and percentages of serious errors judged to be sight threatening will be presented by group. Additionally, the frequencies of such errors will be presented at participant level. The groups will be compared using logistic regression, applied to the subset of vignettes with a reference standard classification of reactivated (other vignettes by definition cannot result in a serious error)
5.2.5 Secondary outcome (b) – lesion characteristics
Participants’ judgements about presence (or absence) of each of the lesion components (e.g. SRF, PED and bloods) will be summarised by numbers and percentages in each group and formal comparisons between the groups will be made using logistic regression. There is no agreed reference standard for the lesion components so participant’s classifications will only be compared to each other, not to a ‘correct’ response.
5.2.6 Secondary outcome (c) – confidence in decision making
Participants’ confidence in each of their lesion classification decisions, on a five point scale, will be summarised for each group. Logistic regression will be used to formally compare confidence (5 vs. 1 to 4) between the two groups. Additionally, the number of correct reactivation decisions will be tabulated by confidence level for each group.
5.2.7 Statistical significanceFor hypothesis tests, two-tailed p-values<0.05 are considered statistically significant. Likelihood ratio tests will be used in preference to Wald tests for hypothesis testing.
5.2.8 Model assumptions
Underlying assumptions will be checked using standard methods, e.g. graphical plots etc. If assumptions are not valid then alternative methods of analysis will be sought. If outlying observations are found and the models do not fit the data adequately, such observations will be excluded from the main analyses. Sensitivity analyses may be performed to examine the effect on the study’s conclusions of excluding outlying observations.
5.2.9 Subgroup analyses
There are no subgroup analyses planned for this study.
5.2.10 Sensitivity analyses
A sensitivity analysis of the primary outcome, reclassifying vignettes graded as suspicious as ‘active lesion’ group, rather than ‘no active lesion’ group will be undertaken, to assess the sensitivity of the conclusions to the classification of the vignettes graded as suspicious.
5.2.11 Additional analysis
Lesion classification decisions will be tabulated against referral decisions for ophthalmologists and optometrists.
A descriptive analysis of the time taken to complete each vignette, and how this time changes with experience in the trial (learning curve), will be performed. The relationship between this time and participants ‘success’ in correctly classifying vignettes will also be explored.
Page 179

Cross tabulations and Kappa statistics will be used to compare experts’ initial classifications with the final reference standard. Similarly, cross tabulations and Kappa statistics will be used to compare lesion component classifications between the three experts.
5.2.12 Missing data
By design there should be no missing data in this study apart from time taken to complete vignettes. The time that user “saved” the assessment decision was recorded for each vignette and therefore the time between saving one vignette and the next can be calculated. However, the time taken for the first vignette (of each session) cannot be calculated as the time of the start of the session was not captured. Similarly, if a participant takes a break within a session this cannot be identified (expect that the time between saving the decisions on two consecutive vignettes may be excessively long). As time taken to complete vignettes is not an outcome specified in the protocol, and the only vignette where the time will be missing is the first of a session and the vignettes were randomised these times will be assumed to be missing at random and a complete case analysis will be performed.
5.2.13 Multiple testing
No formal adjustment will be made for multiple testing.
5.3 Safety data
There is no safety data in this study as there are no risks to participants and therefore it is not possible for clinical adverse events to be attributed to study specific procedures.
6. BIBLIOGRAPHY
1. Banes MJ, Culham LE, Bunce C, Xing W, Viswanathan A, Garway-Heath D. Agreement between optometrists and ophthalmologists on clinical management decisions for patients with glaucoma. The British journal of ophthalmology. May 2006;90(5):579-585.
2. Hau S, Ehrlich D, Binstead K, Verma S. An evaluation of optometrists' ability to correctly identify and manage patients with ocular disease in the accident and emergency department of an eye hospital. The British journal of ophthalmology. Apr 2007;91(4):437-440.
7. AMENDMENTS TO THE SAP
Previous version
Previous date
New version
New date
Brief summary of changes
Page 180