studentsrepo.um.edu.mystudentsrepo.um.edu.my/8010/1/thesis-fatemeh_saadat_ghareh_bagh.pdf · my...
TRANSCRIPT

IONIC LIQUIDS AND DEEP EUTECTIC SOLVENTS AND THEIR POTENTIAL USE IN PRODUCTION OF SODIUM
FATEMEH SAADAT GHAREH BAGH
A THESIS SUBMITTED IN FULFILMENT OF THE REQUIREMENTS FOR THE DEGREE OF DOCTOR OF
PHILOSOPHY
DEPARTMENT OF CHEMICAL ENGINEERING
FACULTY OF ENGINEERING
UNIVERSITY OF MALAYA
KUALA LUMPUR
2014

ORIGINAL LITERARY WORK DECLARATION
Name of Candidate: Fatemeh saadat ghareh Bagh (Passport No. L9523678)
Registration/Matric No.: KHA100015
Name of Degree: Doctor of Philosophy (Ph.D.)
Title of Project Paper/Research Report/Dissertation/Thesis (“this Wrok”):
NOVEL DEEP EUTECTIC SOLVENTS AND THEIR POTENTIAL USE IN
THE PRODUCTION OF SODIUM METAL
Field of Study: Chemical Engineering
I do solemnly and sincerely declare that:
(1) I am the sole author/writer of this Work; (2) This Work is original; (3) Any use of any work in which copyright exists was done by way of fair dealing
and for permitted purposes and any excerpt or extract from, or reference to or reproduction of any copyright work has been disclosed expressly and sufficiently and the title of the work and its authorship have been acknowledged in this Work;
(4) I do not have any actual knowledge or ought I reasonably to know that the making of this Work constitutes an infringement of any copyright work;
(5) I hereby assign all and every rights in the copyright to this Work to the University of Malaya (“UM”), who henceforth shall be owner of the copyright in this Work and that any reproduction or use in any form or by any means whatsoever is prohibited without the written consent of UM having been the first had and obtained;
(6) I am fully aware that if in the course of making this Work I have infringed any copyright whether intentionally or otherwise, I may be subject to legal action or any other action as may be determined by UM.
Candidate’s Signature Date:
Subscribed and solemnly declared before,
Witness’s signature
Name: Date:
Designation: Department of Chemical Engineering,
Faculty of Engineering, University of Malaya, Kuala Lumpur, 50603, Malaysia
Tel./Fax.:

iii
ACKNOWLEDGMENT
My first and sincere appreciation goes to Professor Ali Hashim, Dr Inas M. Alnashef
and Dr Farouq M. Jalli ,my senior supervisors for all I have learned from them and for
their continuous help and support in all stages of this thesis. I would also like to thank
them for being an open person to ideas, and for encouraging and helping me to shape
my interest and ideas.
I would like to express my deep gratitude and respect to my love, dearest friend, and
husband who sacrificed his life for me and provided unconditional love and care. I
would not have made it this far without him. My daughter has been my best friend
during these years of PhD. I love her dearly and thank God for her presence in my life.
My greatest appreciation and friendship goes to my closest friend, Mukhtar Aljadri,
who was always a great support in all my struggles and frustrations in studies in this
country. Cheers to Mukhtar for being a great reliable person to whom I could always
talk about my problems and excitements. Thanks him for questioning me about my
ideas, helping me think rationally and even for hearing my problems.
I would like to thank my family, especially my mother and father for always believing
in me, for their continuous love and their supports in my decisions. Without whom I
could not have made it here.

iv
ABSTRACT
Sodium metal is an essential reducing agent, and it has a wide range of applications. In
the present study ionic liquids (ILs) and their analogues known as deep eutectic solvents
(DESs) have been proposed as electrolytes for sodium metal production at moderate
temperatures of 90ºC to 150ºC. These electrolytes can be recognized as “green” solvents
as they can potentially replace hazardous and polluting organic solvents.
In using ILs or DESs as electrolytes for the production of sodium, three factors are of
paramount importance: the solubility of commercially available sodium salts in the IL
or DES, the conductivity of the solution of sodium salt in IL or DES, and the stability of
the sodium metal in the IL or DES. DESs possess additional advantages over ILs
especially because of the ease of synthesizing them and due to the lower cost of
preparation. The evaluation of DESs as new electrolytes requires an insight of their
main physical properties. For this purpose, some physical properties of specially-
prepared DESs were measured and the results were reported. Zinc chloride-based DESs
were characterized for their melting temperatures, viscosities, electrical conductivities
and refractive indices.
Subsequently, the solubility of different commercially available sodium salts were
measured in different DESs and ILs at different temperatures. The solubility of sodium
chloride increased with temperature in all the investigated ILs. The chemical structure
of cations and anions in the ILs affected the solubility. The effect of the cation was
larger than that of the anion.Different DESs were prepared by mixing ammonium or
phosphonium salts, with different hydrogen bond donors (HBDs), or metal halides at
several molar ratios. The effect of temperature on the solubility of sodium salts was
found to be different from one DES to another. In certain DESs, the solubility of sodium
salts increased with increasing temperature. The constituents of the DES and the molar

v
ratios affected the solubility of sodium salts. DESs based on HBDs had very low
solubility of NaCl in comparison to those that used metal halides as complexing agents.
Sodium metal reacted with DESs containing HBDs; however, sodium metal was stable
and did not react with DESs synthesized by utilizing metal halides.
NRTL model was used to correlate the solubility of NaCl in some ILs as well as DESs
at different temperatures. In most cases the experimental and calculated solubilities for
NaCl in DESs and ILs were in good agreement.
Cyclic voltammetry analysis was used to study the stability of sodium within the
potential range found for metal halide-based DESs at different salt:metal halide molar
ratios under different temperatures. It was found that the electrical windows of DESs
droped with the increase in ZnCl2 molar composition in the DES and increased as the
temperature increased. Reduction peak was observed for sodium ion in some ZnCl2-
based DESs at certain temperatures.
This work shows that DESs are superior to conventional molten salt electrolytes of
Downs Process for the production of sodium metal due to lower operational temperature
and less negative effects on the environment.
vi
ABSTRAK
Logam natrium merupakan agen penurunan yang penting. Ianya mempunyai pelbagai
kegunaan. Dalam kajian ini, IL dan DES telah dicadangkan sebagai elektrolit untuk
penghasilan logam natrium pada suhu sederhana antara 90 ºC hingga 150 ºC. Elektrolit-
elektrolit ini boleh dikenali sebagai “pelarut hijau” memandangkan mereka berpotensi
untuk menggantikan pelarut organik yang berbahaya dan mencemarkan.
Dalam penggunaan cecair ionik (ionic liquids atau ILs) atau analog mereka yang
dikenali sebagai pelarut “deep eutectic” (Deep Eutectic Solvents atau DES) sebagai
pelarut dan elektrolit untuk penghasilan logam natrium, tiga faktor penting untuk proses
tersebut termasuklah: keterlarutan garam natrium komersil dalam IL atau DES,
kekonduksian larutan garam natrium dalam IL atau DES, dan kestabilan logam natrium
dalam IL atau DES. DES mempunyai kelebihan berbanding IL terutamanya kerana
penghasilan yang mudah dan berkos rendah. Penilaian DES sebagai elektrolit baru
memerlukan pemahaman terhadap sifat fizikal mereka. Untuk tujuan ini, sebahagian
ciri-ciri fizikal DES yang disediakan khas telah didapatkan dan keputusannya
dilaporkan. DES berasaskan zink klorida telah dikarakterisasikan berdasarkan suhu
lebur, kelikatan, konduktiviti elektrikal, dan indeks biasan pada julat suhu yang besar.
Seterusnya, keterlarutan garam natrium komersil yang berlainan telah diukur dalam
DES dan IL yang berlainan pada suhu berlainan. Keterlarutan natrium klorida
meningkat dengan suhu dalam semua IL yang dikaji. Struktur kimia kation dan anion
dalam IL mempengaruhi keterlarutan. Kesan kation lebih besar berbanding anion. DES
berlainan dihasilkan dengan mencampurkan garam ammonium dan fosfonium, dengan
penderma ikatan hidrogen (hydrogen bond donors atau HBD) yang berlainan, atau
logam halida pada beberapa nisbah molar. Kesan suhu pada keterlarutan garam natrium
telah didapati berbeza daripada satu DES dengan yang lain. Dalam sesetengah DES,

vii
keterlarutan garam natrium meningkat dengan peningkatan suhu. Konstituen-konstituen
DES dan nisbah molar mempengaruhi keterlarutan garam natrium. DES berasaskan
HBD mempunyai keterlarutan NaCl yang sangat rendah berbanding DES yang
menggunakan logam halida sebagai agen pengkompleksan. Logam natrium
bertindakbalas dengan DES yang mengandungi etilena glikol dan gliserol sebagai HBD;
namun, logam natrium adalah stabil dan tidak bertindakbalas dengan DES yang
disintesis menggunakan logam halida.
Pekali aktiviti termodinamik model “non-random two-liquid” (NRTL) telah digunakan
untuk mengkorelasi keterlarutan NaCl dalam beberapa IL dan DES pada suhu berlainan.
Dalam kebanyakan kes, keterlarutan yang didapati daripada eksperimen dengan yang
dikira untuk NaCl dalam DES dan IL adalah hampir sama.
Analisis "cyclic voltammetry" telah digunakan untuk mengkaji kestabilan natrium
dalam julat berpotensi yang ditemukan untuk DES berasaskan logam halida pada
pelbagai nisbah molar garam:logam halida pada suhu yang berbeza. Keputusan
menunjukkan bahawa julat elektrikal untuk DES berkurangan dengan meningkatnya
komposisi molar ZnCl2 dalam DES dan meningkat seiring peningkatan suhu.
Pengurangan puncak diperhatikan untuk ion natrium dalam sebahagian DES berasaskan
ZnCl2 pada suhu tertentu.
Kajian ini menunjukkan DES mempunyai kelebihan berbanding elektrolit larutan garam
konvensional dalam proses Down’s untuk penghasilan logam natrium oleh sebab suhu
operasi yang lebih rendah dan kurang kesan negative terhadap alam sekitar.

viii
TABLE OF CONTENTS
ACKNOWLEDGMENT iii ABSTRACT iv ABSTRAK vi TABLE OF CONTENTS viii LIST OG FIGURES xii LIST OF TABLES xvii LIST OF ABBREVIATIONS xix NOMENCLATURE xx
1 CHAPTER I INTRODUCTION 1 1.1 INTRODUCTION 1 1.2 IONIC LIQUIDS AND THEIR IMPORTANCE 3 1.3 PROBLEM STATEMENT 5 1.4 RESEARCH OBJECTIVES 7 1.5 RESEARCH METHODOLOGY 7 1.6 THESIS OUTLINE 8
2 CHAPTER II LITERATURE REVIEW 9 2.1 SODIUM METAL 9 2.1.1 Chemical Properties of Sodium Metal 10 2.1.2 Production of Sodium Metal 11 2.1.3 Product Grade and Quality Levels 19 2.1.4 Factors Affecting Pricing 19 2.1.5 Drawbacks of Downs Process 19 2.2 GREEN ELECTROLYTES (GREEN
SOLVENTS) 21
2.3 INTRODUCTION TO IONIC LIQUIDS 23 2.3.1 Physical properties of ILs 24 2.3.2 History of ILs 26 2.3.3 Synthesis of ILs 27 2.3.4 Applications of ILs 28 2.3.4.1 Applications of ILs as
electrolytes 29
2.3.4.2 ILs in fuel cells 31 2.3.4.3 ILs in Electrochemical Sensors
and Biosensors 31
2.3.4.4 ILs in supercapacitors 32 2.3.4.5 Application of ILs in batteries 33 2.3.5 ILs at extreme temperatures 35 2.3.6 Limitations of the use of ILs 36 2.4 DEEP EUTECTIC SOLVENTS (DESs) 37

ix
2.4.1 Synthesis of DESs 43 2.4.2 Physical properties of DESs 43 2.4.2.1 Freezing point (melting point) 44 2.4.2.2 Viscosity 44 2.4.2.3 Electrical conductivity 45 2.4.2.4 Refractive index 46 2.4.2.5 Density 47 2.4.3 Applications of DESs 48 2.4.3.1 DESs in CO2 capture process 49 2.4.3.2 Dissolution of metal oxides 50 2.4.3.3 Purification of biodiesel 51 2.4.3.4 DESs for ionic conductivity
enhancement 52
2.4.3.5 DESs as solvents for extraction of aromatic hydrocarbons from naphtha
52
2.4.3.6 DESs as catalysts 53
2.4.3.7 DESs as electrolytes 54 2.5 ILs/DESs ELECTROLYTE as MOLTEN SALT
in DOWNS PROCESS 58
2.5.1 Solubility 59 2.5.2 Stability 61
3 CHAPTER III METHODOLOGY 62 3.1 SYNTHESIS OF DESs 62
3.1.1 Chemicals 62 3.1.2 Synthetic procedure 63 3.2 CHARACTERIZATION OF DESs 64
3.3 MEASURING THE SOLUBILITY OF SODIUM SALTS IN DESs AND ILs
68
3.4 MEASURING THE CONDUCTIVITIES OF SODIUM SOLUTIONS
69
3.5 MEASURING THE STABILITY OF SODIUM METAL IN DESs
70
3.6 CYCLIC VOLTAMMETRY 70
4 CHAPTER IV RESULTS AND DISCUSSION 72 4.1 SYNTHESIS AND CHARACTERIZATION OF
DIFFERENT DESs 74
4.1.1 Melting temperatures 74 4.1.2 Viscosities 76

x
4.1.3 Electrical conductivity 81 4.1.4 Refractive index 92 4.2 SOLUBILITY OF DIFFERENT SODIUM
SALTS IN ILs AND DESs 96
4.2.1 Solubility of sodium chloride, sodium bromide, and sodium carbonate in ammonium-based DESs
97
4.2.1.1 Stability of sodium metal in DESs 1 – 9
107
4.2.1.2 Solubility modelling 107 4.2.2. Solubility of sodium chloride in
phosphonium-based DESs 111
4.2.2.1 Stability of sodium metal in DESs 10 – 16
117
4.2.2.2 Solubility modelling 117 4.2.3 Solubility of sodium chloride in different
ILs 123
4.2.3.1 Solubility modelling 127 4.3 ELECTRICAL CONDUCTIVITY OF SODIUM
CHLORIDE SATURATED IN DESs 131
4.4 THE ELECTROCHEMICAL POTENTIAL WINDOWS OF ZnCl2 BASED DESs
141
5 CHAPTER V CONCLUSIONS 153 5.1 A SIMPLE AND EFFICIENT METHOD CAN
BE USED FOR THE SYNTHESIS OF DESs 153
5.2 DIFFERENT CONDITIONS ARE NEEDED FOR THE SYNTHESIS Of DESs OF DIFFERENT COMBINATIONS
153
5.3 PHYSICAL PROPERTIES OF DESs ARE TEMPERATURE AND COMPONENT DEPENDENT
154
5.4 SOLUBILITY OF SODIUM SALTS IN ILs OR DESs DEPENDED ON VARIOUS PARAMETERS
154
5.5 NRTL ACTIVITY COEFFICIENTS MODEL CAN BE APPLIED SUCCESSFULLY FOR THE STUDIED SYSTEMS
155
5.6 ZnCl¬2 –BASED DESs HAD A HIGH POTENTIAL FOR BEING ELECTROLYTES FOR SODIUM PRODUCTION
155

xi
6 CHAPTER VI RECOMMENDATIONS FOR FUTURE WORK
156
BIBLIOGRPHY 157
APPENDIX A 169

xii
LIST OF FIGURES
Figure 2.1 Castner’s Cell 13 Figure 2.2 Down’s Cell 14 Figure 2.3 Flowchart for sodium metal production process by DuPont 16 Figure 2.4 Schematic representation of eutectic mixture formation 37 Figure 2.5 Structure of anthracene and phenantherne 60
Figure 4.1 Melting temperatures of DES5 (●), DES8 (▼), DES12 (▲) and DES15 (■) as a function of salt:HBD mole ratio 76
Figure 4.2 Viscosity μ of DES5 1:1 (●), 1:2 (■) and 1:3 (▲) as a function of inversed temperature T-1. Curves represent fitting by Equation 1
78
Figure 4.3 Viscosity μ of DES8 1:2 (●), 1:3 (■) and 1:4 (▲) as a function of inversed temperature, T-1. Curves represent fitting by Equation 1
79
Figure 4.4 Viscosity μ of DES12 1:2 (●), 1:3 (■) and 1:4 (▲) as a function of inversed temperature, T-1. Curves represent fitting by Equation 1
80
Figure 4.5 Viscosity μ of DES15 1:2 (●), 1:3 (■) and 1:4 (▲) as a function of inversed temperature, T-1. Curves represent fitting by Equation 1.
80
Figure 4.6 Viscosity μ of DES5 1:2 (●), DES8 1:2 (■), DES12 1:2 (▲), DES15 1:2 (▼) as a function of inversed temperature, T-1. Curves represent fitting by Equation 1
81
Figure 4.7 Electrical conductivity σ of DES1 1:1.75 (●), 1:2 (■), and 1:2.5 (▲) as a function of the inversed temperature. Curves represent fitting by Equation 4.2.
83
Figure 4.8 Electrical conductivity σ of DES2 1:1 (●), 1:2 (■), and 1:3 (▲) as a function of the inversed temperature. Curves represent fitting by Equation 4.2.
84
Figure 4.9 Electrical conductivity σ of DES3 1:2.5 (●), 1:3 (■), and 1:4 (▲) as a function of the inversed temperature. Curves represent fitting by Equation 4.2.
85
Figure 4.10 Electrical conductivity σ of DES4 1:2 (●), 1:3 (■), and 1:4 (▲) as a function of the inversed temperature. Curves represent fitting by Equation 4.2.
85
Figure 4.11 Electrical conductivity σ of DES5 1:1 (●), 1:2 (■), 1:3 (▲), and 1:4 (▼) as a function of the inversed temperature. Curves represent fitting by Equation 4.2.
86
Figure 4.12 Electrical conductivity σ of DES8 1:1 (●), 1:2 (■), 1:3 (▲), and 1:4 (▼) as a function of the inversed temperature. Curves represent fitting by Equation 4.2
87
Figure 4.13 Electrical Conductivity σ of DES10 1:3 (●), 1:4 (■), and 1:5 (▲) as a function of the inversed temperature. Curves represent fitting by Equation 4.2
88

xiii
Figure 4.14 Electrical conductivity σ of DES11 1:2 (●), 1:3 (■), and 1:4 (▲) as a function of the inversed temperature. Curves represent fitting by Equation 4.2.
88
Figure 4.15 Electrical conductivity σ of DES12 1:2 (●), 1:3 (■), 1:4 (▲), and 1:5 (▼) as a function of the inversed temp. Curves represent fitting by Equation 4.2
89
Figure 4.16 Electrical conductivity σ of DES12 1:2 (●), 1:3 (■), 1:4 (▲), and 1:5 (▼) as a function of the inversed temp. Curves represent fitting by Equation 4.2
90
Figure 4.17 Refractive index nD of DES5 1:1 (●), 1:2 (■), 1:3 (▲), and 1:4 (▼) as a function of temperature. Lines represent fitting by Equation 4.4
95
Figure 4.18 Refractive index nD of DES8 1:1 (●), 1:2 (■), 1:3 (▲), and 1:4 (▼) as a function of temperature. Lines represent fitting by Equation 4.4.
95
Figure 4.19 Refractive index nD of DES12 1:2 (●), 1:3 (■), 1:4 (▲), and 1:5 (▼) as a function of temperature. Lines represent fitting by Equation 4.4
96
Figure 4.20 Refractive index nD of DES15 1:2 (●), 1:3 (■), 1:4 (▲), and 1:5 (▼) as a function of temperature. Lines represent fitting by Equation 4.4
96
Figure 4.21
Solubility of NaCl, NaBr and Na2CO3 in DES1 as a function of temperature. The continuous line is drawn through the experimental data of the same system for visual clarity
99
Figure 4.22
Solubility profiles of NaCl and NaBr in DES2 as a function of temperature. NaCl series, for salt:HBD ratios 1:1.5 (●), 1:2 (○), 1:2.5 (♦) and 1:3 (◊). NaBr series, for salt:HBD ratios 1:1.5 (▼), 1:2 (s), 1:2.5 (▲) and 1:3 (Δ)
100
Figure 4.23 Solubility profiles of NaCl in DES3 as a function of temperature. NaCl series, for salt:HBD ratios 1:2.5 (●), 1:3 (○), 1:4 (♦) and 1:4.5 (◊)
101
Figure 4.24 Solubility (Concentration) profiles of NaCl in DES4 as a function of temperature. NaCl series, for salt:HBD ratios 1:2.5 (●), 1:3 (○), 1:4 (♦)
102
Figure 4.25
Solubility profiles of NaCl and NaBr in DES5 as a function of temperature. NaCl series, for salt:HBD ratios 1:1 (●), 1:2 (○), and 1:3 (♦). NaBr series, for salt:metal halide ratios 1:1 (◊), 1:2 (▼), and 1:3 (s)
103
Figure 4.26 Comparison of solubility (Concentration) of NaCl in DES5, 6 and 7 at 60 oC 105
Figure 4.27 Solubility (Concentration) profiles of NaCl in DES8 as a function of temperature. NaCl series, for salt:metal halide ratios 1:1 (●), 1:2 (○), 1:3 (▲) and 1:4 (Δ)
106
Figure 4.28 Solubility profile of NaCl in DES9 (salt:metal halide molar ratio 1:3) as a function of temperature 107

xiv
Figure 4.29
Calculated (NRTL) vs experimental solubilities of sodium chloride in DES2, DES3, DES4, and DES5 for different ratios and at different temperatures. z is the ratio of the HBD in the DES considering that the salt’s ratio is always 1
110
Figure 4.30 Solubility profiles of NaCl in DES10 as a function of temperature (passed lines are based on NRTL calculations) 111
Figure 4.31 Solubility profiles of NaCl in DES11 as a function of temperature (passed line is based on NRTL calculations) 113
Figure 4.32 Solubility profiles of NaCl in DES12 as a function of temperature (passed lines are based on NRTL calculations). 114
Figure 4.33 Solubility profiles of NaCl in DES13 as a function of temperature (passed lines are based on NRTL calculations) 115
Figure 4.34 Solubility profiles of NaCl in DES14 as a function of temperature (passed lines are based on NRTL calculations) 116
Figure 4.35 Solubility profiles of NaCl in DES15 as a function of temperature (passed lines are based on NRTL calculations) 116
Figure 4.36 Solubility profiles of NaCl in DES16 as a function of temperature (passed lines are based on NRTL calculations) 117
Figure 4.37 Experimental solubility (Concentration) of NaCl in imidazolium-based ILs. (∆) IL1, (ᴏ) IL2, (□) IL3, (¶) IL4, (s) IL5, (▲) IL6, (l) IL7, (■)IL8, («) IL9, (q) IL10
124
Figure 4.38 Experimental solubility (Concentration) of NaCl in pyrrolidinium-based ILs. (∆) IL11, (ᴏ) IL12, (□) IL13 125
Figure 4.39 Experimental solubility (Concentration) of NaCl in pyridinium-based ILs. (∆) IL14, (ᴏ) IL15 126
Figure 4.40 Experimental solubility of NaCl in IL16 (∆) 127
Figure 4.41 Experimental and calculated solubilities (mole fraction) by NRTL for NaCl in imidazolium-based ILs. (∆) IL1, (ᴏ) IL2, (□) IL3. Line represents NRTL data
130
Figure 4.42 Experimental and calculated solubilities (mole fraction) by NRTL for NaCl in (∆) IL10, (□) IL16. Lines represent NRTL data
131
Figure 4.43
Electrical conductivity, σ, of saturated NaCl in DES1 1:1.75 (●), 1:2 (■), and 1:2.5 (▲) as a function of the inversed temperature. Curves represent fitting by Equation 4.2
134
Figure 4.44 Electrical conductivity, σ, of saturated NaCl in DES2 1:1 (●), 1:2 (■), and 1:3 (▲) as a function of the inversed temperature. Curves represent fitting by Equation 4.2
134
Figure 4.45 Electrical conductivity, σ, of saturated NaCl in DES3 1:2.5 (●), 1:3 (■), and 1:4 (▲) as a function of the inversed temperature. Curves represent fitting by Equation 4.2
135
Figure 4.46 Electrical conductivity, σ, of saturated NaCl in DES4 1:2 (●), 1:3 (■), and 1:4 (▲) as a function of the inversed temperature. Curves represent fitting by Equation 4.2
136

xv
Figure 4.47
Electrical conductivity, σ, of saturated NaCl in DES5 1:1 (●), 1:2 (■), 1:3 (▲), and 1:4 (▼) as a function of the inversed temperature. Curves represent fitting by Equation 4.2
137
Figure 4.48
Electrical conductivity, σ, of saturated NaCl in DES8 1:1 (●), 1:2 (■), 1:3 (▲), and 1:4 (▼) as a function of the inversed temperature. Curves represent fitting by Equation 4.2
137
Figure 4.49 Electrical Conductivity, σ, of saturated NaCl in DES10 1:3 (●), 1:4 (■), and 1:5 (▲) as a function of the inversed temperature. Curves represent fitting by Equation 4.2
138
Figure 4.50 Electrical conductivity, σ, of saturated NaCl in DES11 1:2 (●), 1:3 (■), and 1:4 (▲) as a function of the inversed temperature. Curves represent fitting by Equation 4.2
139
Figure 4.51 Electrical conductivity, σ, of saturated NaCl in DES12 1:2 (●), 1:3 (■), 1:4 (▲), and 1:5 (▼) as a function of the inversed temp. Curves represent fitting by Equation 4.2
140
Figure 4.52 Electrical conductivity, σ, of saturated NaCl in DES15 1:2 (●), 1:3 (■), 1:4 (▲), and 1:5 (▼) as a function of the inversed temp. Curves represent fitting by Equation 4.2
140
Figure 4.53
Electrochemical window of DES5(1:1) as a function of temperature on a GC (3 mm) working electrode/ Ag reference electrode/ Pt counter electrode at scan rate of 100 mVs-1
144
Figure 4.54
Electrochemical window of DES5(1:3) as a function of temperature on a GC (3 mm) working electrode/ Ag reference electrode/ Pt counter electrode at scan rate of 100 mVs-1
145
Figure 4.55
Cyclic voltammetry for the reduction of saturated sodium chloride in DES5(1:1) at 130oC on a GC (3 mm) working electrode/ Ag reference electrode/ Pt counter electrode at scan rate of 100 mVs-1
145
Figure 4.56
Electrochemical window of DES8(1:1) as a function of temperature on a GC (3 mm) working electrode/ Ag reference electrode/ Pt counter electrode at scan rate of 100 mVs-1
146
Figure 4.57
Electrochemical window of DES8(1:2) as a function of temperature on a GC (3 mm) working electrode/ Ag reference electrode/ Pt counter electrode at scan rate of 100 mVs-1
146
Figure 4.58
Electrochemical window of DES8(1:3) as a function of temperature on a GC (3 mm) working electrode/ Ag reference electrode/ Pt counter electrode at scan rate of 100 mVs-1
147
Figure 4.59
Electrochemical window of DES12(1:2) as a function of temperature on a GC (3 mm) working electrode/ Ag reference electrode/ Pt counter electrode at scan rate of 100 mVs-1
149

xvi
Figure 4.60
Electrochemical window of DES12(1:3) as a function of temperature on a GC (3 mm) working electrode/ Ag reference electrode/ Pt counter electrode at scan rate of 100 mVs-1
149
Figure 4.61
Cyclic voltammetry for the reduction of saturated sodium in DES12(1:2) at 100 oC on a GC (3 mm) working electrode/ Ag reference electrode/ Pt counter electrode at scan rate of 100 mVs-1
150
Figure 4.62
Electrochemical window of DES15(1:2) as a function of temperature on a GC (3 mm) working electrode/ Ag reference electrode/ Pt counter electrode at scan rate of 100 mVs-1
151
Figure 4.63
Electrochemical window of DES15(1:3) as a function of temperature on a GC (3 mm) working electrode/ Ag reference electrode/ Pt counter electrode at scan rate of 100 mVs-1
151
Figure 4.64
Cyclic voltammetry for the reduction of saturated sodium in DES15(1:2) under 130oC on a GC (3 mm) working electrode/ Ag reference electrode/ Pt counter electrode at scan rate of 100 mVs-1
152

xvii
LIST OF TABLES
Table 1.1 Main sodium metal producers in China in 2012 2 Table 2.1 Physical properties of sodium metal 9
Table 2.2 Sodium metal grades and specifications by DuPont and MSSA 19
Table 2.3 Common cations and anions in ILs 25 Table 2.4 Properties of some ionic liquids suitable for electrochemistry 30
Table 2.5 Typical structures of the quaternary salts and HBDs used for DES synthesis 41
Table 3.1 Equipment used in the DESs synthesis 63
Table 3.2 Devices used for characterization of DESs with their uncertainties 64
Table 4.1 DESs studied in this work with their abbreviations 72 Table 4.2 ILs studied for the solubility of NaCl 73 Table 4.3 Melting temperatures for DESs 5, 8, 12 and 15 75
Table 4.4 Experimental results for viscosity (Pa.S) of DESs 5,8,12, and15at different molar ratios and temperatures
77
Table 4.5 Values of µo and Eµ for the fitting by Equation 4.1 78
Table 4.6 Experimental results of electrical conductivity (mS cm-1) for DESs 1 and 2 at different molar ratios
83
Table 4.7 Experimental results of electrical conductivity (mS cm-1) for DESs 3 and 4 at different molar ratios 84
Table 4.8 Experimental results of electrical conductivity (mS cm-1) for DESs 5 and 8 at different molar ratios 86
Table 4.9 Table 4.9: Experimental results of electrical conductivity (mS cm-1) for DESs 10 and 11 at different molar ratios 87
Table 4.10 Experimental results of electrical conductivity (mS cm-1) for DESs 12 and 15 at different molar ratios. 89
Table 4.11 Values of σ∞ and Eσ for the fitting by Equation 4.2 91
Table 4.12 Experimental refractive indices nD of DESs 5, 8, 12, and 15 at different molar ratios 93
Table 4.13 Values of a and b for the fitting by Equation 4.4 94
Table 4.14 Solubility(wt%) of sodium chloride, sodium carbonate, and sodium bromide in DES1 at different temperatures 98
Table 4.15 Solubility(wt%) of sodium chloride and sodium bromide in DES2 at different temperatures. 99
Table 4.16 Solubility of sodium chloride in DES3 at different temperatures 101
Table 4.17 Solubility of sodium chloride in DES4 at different temperatures 101
Table 4.18 Solubility of sodium chloride and sodium bromide in DES5 at different temperatures 103
Table 4.19 Comparison of solubility of sodium chloride in DESs 5, 6, and 7 at 60 oC 104
Table 4.20 Solubility of sodium chloride in DES8 at different temperatures 106

xviii
Table 4.21 Solubility of sodium chloride in DES9 at different temperatures 106
Table 4.22 NRTL binary interaction parameters between NaCl and DES2 to DES5 for different molar ratios (i ≡ NaCl and j ≡ DES)
110
Table 4.23 NRTL binary interaction parameters between NaCl and DES10, DES12 – DES16 for different molar ratios (i ≡ DES and j ≡ NaCl).
118
Table 4.24 Comparison of NRTL and experimental solubilities of NaCl in DES10 at different molar ratios 119
Table 4.25 Comparison of NRTL and experimental solubilities of NaCl in DES11 at 1:3.5 molar ratio 119
Table 4.26 Comparison of NRTL and experimental solubilities of NaCl in DES12 at different molar ratios. 120
Table 4.27 Comparison of NRTL and experimental solubilities of NaCl in DES13 at different molar ratios 120
Table 4.28 Comparison of NRTL and experimental solubilities of NaCl in DES14 at different molar ratios 121
Table 4.29 Comparison of NRTL and experimental solubilities of NaCl in DES15 at different molar ratios 121
Table 4.30 Comparison of NRTL and experimental solubilities of NaCl in DES16 at different molar ratios 122
Table 4.31 Experimental solubilities of NaCl in studied ILs 123
Table 4.32 NRTL binary interaction parameters between NaCl and different ILs(1 ≡ NaCl and 2 ≡ IL) 130
Table 4.33 Experimental electrical conductivity (mS cm-1) of saturated NaCl in DESs 1 and 2 at different molar ratios. 133
Table 4.34 Experimental electrical conductivity (mS cm-1) of saturated NaCl in DESs 3 and 4 at different molar ratios. 135
Table 4.35 Experimental electrical conductivity (mS cm-1) of saturated NaCl in DESs 5 and 8 at different molar ratios. 136
Table 4.36 Experimental electrical conductivity (mS.cm-1) of saturated NaCl in DESs 10 and 11 at different molar ratios. 138
Table 4.37 Experimental electrical conductivity (mS cm-1) of saturated NaCl in DESs 12 and 15 at different molar ratios 139
Table 4.38 Values of σ∞ and Eσ for the fitting by Equation 4.2 in the system of NaCl(saturated)/DES 141
Table 4.39 Electrochemical windows obtained at Pt counter electrode, glassy carbon working electrode, and a silver wire quasi reference electrode for DESs 5, 8, 12, and 15
142

xix
LIST OF ABBREVIATIONS
[bmim][BF4] 1-Butyl-3-methylimidazolium tetrafluoroborate [bmim][Cl] 1-Butyl-3-methylimidazolium chloride [bmim][DCA] 1-Butyl-3-methylimidazolium dicyanamide
[bmim][Tf2N] 1-Butyl-3-methylimidazolium bis (trifluoromethylsulfonyl)-imide
[bmim][TfO] 1-Butyl-3-methylimidazolium trifluoromethanesulfonate [bmp][DCA] 1-Butyl-1-methylpyrrolidinium dicyanamide [bmp][TfA] 1-Butyl-1-methylpyrrolidinium trifluoroacetate [bmpyr][CF3SO3] 1-Butyl-1-methylpyrrolidinium trifluoromethanesulfonate [bmpyr][DCA] N-Butyl-3-methylpyridinium dicyanamide [bmpyr][MSO4] N-Butyl-3-methylpyridinium methylsulfate [C8mim][Cl] 1-Octyl-3-methylimidazolium chloride [edmi][Cl] 1-Ethyl-2,3-dimethylimidazolium chloride [emim][DMP] 1-Ethyl-3-methylimidazolium dimethylphosphate [emim][EtSO4] 1-Ethyl-3-methylimidazolium ethylsulfate [emim][MeSO3] 1-Ethyl-3-methylimidazolium methanesulfonate [EtOHNMe3][Me2PO4] (2-Hydroxy ethyl) trimethylammonium dimethylphosphate ChCl Choline Chloride DES Deep Eutectic Solvent EPA Environment Protection Agency FTIR Fourier Transform Infrared GC Glassy Carbon HBD Hydrogen Bond Donor ICP-AES Inductively Coupled Plasma-Atomic Emission Spectrometer IL Ionic Liquid MSSA Métaux Spéciaux SA NMR Nuclear Magnetic Resonance RTIL Room Temperature Ionic Liquid XRD X-ray Diffraction

xx
NOMENCLATURE
Eµ Activation Energy of Viscosity(Pa.m3.mol-1) γ Activity Coefficient τij Binary Interaction Parameters k Boltzmann’s constant (meVK-1 ) xi Composition of Component i in Binory Mixture I Current (A) ρ Density (g cm-3)
ΔCp Difference in Heat Capacity Between the Solute in the Two States (kJ mol-1 K-1)
σ∞ Electrical Conductivity as T reaches infinity (mScm-1) σ Electrical Conductivity (mS cm-1) Eσ Electron Mobility (meV) a, b Fitting parameters in Equation 4.4 R Ideal Gas Constant (Pa.m3mol-1K-1) ΔHfus Latent Heat of Fusion of NaCl (kJ mol-1 ) m.p. Melting Point (K) Tm Melting Temperature (K) z Mole ratio of HBDs whereby mole ratio of salt is 1 τij0 , τijT Optimized Parameters in Equation 4.9 E Potential Voltage (V) nD Refractive Index s Solubility (wt%) ʋ Speed of Light in the Medium of Concern (m s-1) c Speed of Light in Vacuum (m s-1) T Temperature Tr Triple Point Temperature µ Viscosity (Pa.s) µ0 Viscosity Constant (Pa.s)

1
CHAPTER I
INTRODUCTION
1.1 Introduction
Sodium (Na) metal is an essential alkali metal having wide technical and
commercial applications, such as its utilization as an intermediate product in the
manufacturing of chemicals and pharmaceuticals, and as metal refiner (Thayer, 2008,
Pearson et al., 2008). These wide applications are possible due to the fact that sodium
metal is a strong reducing agent (Banks, 1989, Pearson et al., 2008, Thayer, 2008).
Sodium is one of the most effective coolants in nuclear reactors since the operating
temperatures of these reactors are less than the boiling point of sodium (Pearson et al.,
2008). Sodium as well as its alloys with potassium are utilized as heat transfer agents in
chemical heat transfer units. Furthermore, sodium is an important substance for
producing artificial rubber (Pearson et al., 2008, Thayer, 2008) .
It is interesting to know that sodium metal in its pure form is a hazardous material.
It is highly reactive with many compounds available naturally in the environment, such
as water (Kroschwitz, 1995, Banks, 1990). Upon contact with different compounds,
sodium metal can combust spontaneously resulting in an enormous amount of heat.
Therefore, it is a problematic and expensive matter to store or transport this pure metal
(Kroschwitz, 1995, Thayer, 2008).
According to the United States International Trade Commission report in 2008,
the main producers of sodium metal in the world are DuPont from the United States,
Métaux Spéciaux SA (MSSA) from France, and three Chinese companies. In 2008,
MSSA with production rate of 27000 metric tons per year was the world’s largest
producer. The global demand of sodium metal at the end of 2008 was 80,000 to 90,000

2
metric tons per year and it has been anticipated that by end of 2013, the global demand
would rise to 100,000 to 120,000 metric tons per year. Declining tax incentives, rising
energy cost and quality concerns are limiting Chinese sodium exports, leaving MSSA
and DuPont as the main global suppliers. MSSA is also the only producer of highly
purified sodium used as a coolant for fast-breeder nuclear reactors. MSSA exports most
of its product, while DuPont uses much of its sodium output itself for producing
biodiesel catalysts or sells it at a contracted price to Rohm and Haas, its largest
customer for sodium borohydride and other chemicals (Pearson et al., 2008).
In 2012, according to the global and Chinese sodium metal industry report, China
in parallel with the United States and France became not only one of the big producers
of sodium metal but also a big consumer. China’s demand for sodium metal was
expected to drive up owing to the growing consumption worldwide and the
development of domestic atomic energy industry. Table 1.1 introduces the main sodium
metal producers in China in 2012 (Pearson et al., 2008).
Table 1.1: Main sodium metal producers in China in 2012 (Pearson et al., 2008).
Manufacture Capacity(Tons /Year)
Inner Mongolia Lantai Industrial Co., Ltd 45,000
Wanji Holding Group Co., Ltd 22,500
Ningxia Yinchuan Sodium Factory 4,000
Yinchuan Jingying Fine Chemistry Co., Ltd 3,500
Zunbao Titanium Co., Ltd 10,000( still not in production)
Currently, Downs process based on electrolysis of sodium salts, in particular
sodium chloride (NaCl), is broadly used by the main producing companies (Thompson,
2004, Pearson et al., 2008). Since the melting point of sodium chloride is 804 °C, the
electrolysis process at this temperature can cause corrosion of the cell because of the
produced sodium fog. Moreover, there is a high possibility of short electrical circuits.
Hence, calcium chloride (CaCl2) is added to NaCl at a ratio of 2:3 by mass to decrease
3
the fusion temperature to about 600 °C and increases the electrical conductivity. This
lowering in fusion temperature makes the process feasible. The mixture is electrolyzed
in a cylindrical outer iron cell lined with fire bricks. The cell is fitted with a central
graphite anode and a surrounding iron cathode. The two electrodes are separated by a
cylindrical iron gauze diaphragm which screens the graphite anode from the ring-shaped
iron cathode. This keeps away the molten sodium metal which floats to the top of the
cathode compartment from gaseous chlorine formed at the anode. In addition, the
molten sodium metal must be prevented from contacting with oxygen because the metal
would be oxidized instantaneously under the high-temperature conditions of the cell
reaction. The sodium metal collects in the inverted trough placed over the cathode, rises
up the pipe and is tapped off through the iron vessel (Keppler et al., 2003, Thompson et
al., 2004, Pearson et al., 2008).
1.2 Ionic Liquids And Their Importance
ILs have been accepted as key role players in modern green chemistry (Petkovic
et al., 2011). This has excited the interest of both the academia and the chemical
industries. These chemicals can reduce the use of hazardous and polluting organic
solvents as well as taking part in various new syntheses due to their unique
characteristics (Seddon et al., 2006). The terms room temperature ionic liquid (RTIL),
nonaqueous ionic liquid, molten salt, liquid organic salt and fused salt have all been
used to describe these salts in the liquid phase. ILs are known as salts that are liquid at
room temperature in contrast to high-temperature molten salts. They have a unique
array of physico-chemical properties, such as low vapor pressure and non flammability
which make them suitable in numerous applications in which conventional organic
solvents are not sufficiently effective or not applicable (Earle and Seddon, 2000).
In the late 1990s, there was a significant increase in research on ILs, from
synthesis and characterization to their possible applications. They are now a major topic
4
of academic and industrial interest with numerous existing and potential applications.
The number of scientific papers, books, and patents covering the latest advances in ionic
liquids are available in the literature (Hagiwara and Ito, 2000, Petkovi et al., 2009,) .
The main advantage of ILs is the profiles of their physical and chemical
properties, resulting from the complex interplay between hydrogen bonding and Van
Der Waal interactions. Remarkably, many ILs’ properties can be controlled by
structurally modifying their cations and anions (Plechkova and Seddon, 2008). ILs are
such a class of potentially useful liquids in environmental friendly applications (Gan et
al., 2006, Arce et al., 2007, Petkovic et al., 2011). Therefore, they have been explored
for use in various research and industrial applications, from electronic applications,
including electrolytes for batteries and capacitors to separation processes, such as
extraction of metals or matrices for mass spectrometry. One drawback of utilizing ILs is
that they are usually expensive and unavailable at industrial scale (Keskin et al., 2007,
Petkovic et al., 2011) .
ILs analogous, known as deep eutectic solvents (DESs), have been recognized as
an alternative to traditional solvents and ILs (Hou et al., 2008). A DES is generally
composed of two or three components which are capable of associating with each other,
through hydrogen bond interactions, to form a eutectic mixture (Abbott et al., 2003a).
These components are cheap and environmentally safe (Chen et al., 2010). The
resulting DES is characterized by a melting point lower than those of the individual
components. In 2004, Professor Andrew Abbott and his group reported the synthesis of
the first deep eutectic solvent from a mixture of choline chloride (ChCl) as a salt and
urea as hydrogen-bond donor (HBD), with a salt:HBD molar ratio of 1:2. The melting
point of ChCl is 302°C and that of urea is 133°C while the above mentioned eutectic
liquid melts at 12 °C (Abbott et al., 2004a).

5
It was reported that these ILs analogues or DESs can seriously compete with ILs
in terms of physical properties, synthesis, and more importantly in price (Earle et al.,
2000, Abbott et al., 2003a, Kareem et al., 2010). As mentioned above, it is possible to
choose their components to be biodegradable and non-toxic, adding more advantages to
them. Additionally, most DESs are non-reactive with water (Chen et al., 2010). Since
the time that Abbott and his colleagues reported the first choline chloride:urea DES,
numerous researches on DESs synthesis and applications have been carried out (Abbott
et al., 2004b). New DESs were introduced and numerous applications were studied
(Kareem et al., 2010, Hayyan et al., 2012). To date, numerous research papers, patents,
and books have been published covering various possible applications of DESs. In
Chapter Two, a comprehensive literature review on ILs and DESs is presented.
1.3 Problem Statement
Energy crisis and global warming are the major challenges of 21st century. These
crises have risen up due to (i) limited energy resources and energy security, (ii)
sustainability of utilized energy resources, as well as (iii) environmental impact of
conventional fuels and climate change (Akella et al., 2007, Zheng et al., 2010).
The demands on energy became incredibly huge, and the resources of
conventional energy, such as coal, oil, petroleum and natural gas are limited. These
resources are estimated to last until 2040 (Hayward, 2010). On the other hand, it has
been recognised that the nuclear energy can have serious harmful impact on the
environment if accidents happen. This was clear in both Chernobyl and Fukushima
disasters, where radiation leaked out of the reactors due to accidental events (Hayward,
2010). All of these factors necessitated the wise use of alternative forms of energy.
Renewable sources of energy, such as solar energy, wind energy, geothermal energy,
bioenergy, ocean energy, and hydropower are completely clean, natural and harmless.
The obvious problem concerning utilizing renewable energy resources lies in their high

6
costs of generation. The high cost of these forms of energy originated from two facts.
Firstly, the technology of renewable energy, such as solar panels, is newer in
comparison to the conventional ones. Secondly, the materials used in the manufacturing
of renewable energy systems are often rare and costly (Namovicz, 2011).
The manufacturers in developed countries terminated the production of sodium
metal, including the leading manufacturers, DuPont, MSSA and some Russian
manufacturers. This is due to the fact that Down’s Process features high energy
consumption (Global and China Sodium Metal Industry Report, 2012).
Several concepts have been proposed to reduce emissions and energy
consumption, but none have been successfully applied on an industrial scale.
Developing an electrolytic process that can be used to produce sodium metal more
economically is increasingly important. The operability of the process must also be
improved, making automation possible. Suitable processing techniques are limited
because sodium has a strong affinity to oxygen and water due to its negative reduction
potential. Therefore, sodium chloride cannot be electrolyzed in aqueous solutions. All
processes must also comply with existing environmental regulations. Therefore, a novel
process that electrolyzes sodium chloride at or near ambient temperatures has numerous
industrial potential applications (Paterson, 1966, Keppler et al., 2003, Anastas, 2010).
The concept of green solvents was adopted to represent the efforts spent to
minimize the industrial impact on the environment by utilizing safer and friendlier
solvents than the conventional ones. This adoption led to the development of four direct
implementations for this concept. They are: i) replacing the hazardous solvents by
solvents of better environmental, health and safety properties, ii) using bio-solvents
produced from renewable sources, iii) replacing the volatile organic compounds used as
solvents by benign solvents, and iv) using ionic liquids (ILs) as well as their analogues
7
known as deep eutectic solvents (DESs) which are considered as non-volatile because
they showed negligible vapor pressure.( Keskin et al., 2007, Anastas, 2010)
The work elaborated in this thesis is an attempt to overcome the problem of high-
energy consumption in sodium metal production by introducing ILs and DESs as low-
temperature electrolytes for this process.
1.4 Research Objectives
In using ILs or DESs as electrolytes for the production of sodium, three factors
are of paramount importance for the process: the solubility of commercially available
sodium salts in the IL or DES, the conductivity of the solution of sodium salt in IL or
DES, and the stability of the sodium metal in the IL or DES. Additionally, the pertinent
physical properties of these DESs are important to be characterized if these DESs are
planned to be used industrially. Thus, in summary, the objectives of this work are as
follow:
1- Synthesis of different DESs including new metal halide-based DESs in the
laboratory.
2- Measuring the physical properties for some of these DESs.
3- Studying the solubility of some commercially available sodium salts in ILs and
DESs.
4- Studying the conductivity of sodium chloride (NaCl) in DESs.
5- Investigating the stability of sodium metal in selected DESs
6- Applying thermodynamic models to correlate the experimental data.
7- Evaluating of cyclic voltammetry of selected DESs
1.5 Research Methodology
8
The methodology followed to achieve the objectives of this project will be dealt
with comprehensively in Chapter Three. However, a brief introduction to the
methodology is given here:
1- Synthesis of DESs.
2- Characterization of physical properties of these solvents using various
equipment.
3- Preparation of solubility experiments.
4- Addition of sodium salts to ILs and DESs.
5- Sampling of the experimental mixtures for the measurement of solubility.
6- Analysis of the samples using Induced Coupled Plasma (ICP) analysis.
7- Final results are drawn from the ICP results.
8- Estimation of the stability of sodium metal inside DESs.
9- Applying the non-random two liquid (NRTL) model for activity coefficients to
correlate the experimental results.
10- Cyclic voltammetry analysis using a computer-controlled i-Autolab potentiostat
1.6 Thesis Outline
This thesis comprises the following main chapters:
1. Chapter One - INTRODUCTION
2. Chapter Two - LITERATURE REVIEW
3. Chapter Three - METHODOLOGY
4. Chapter Four - RESULTS AND DISCUSSIONS
5. Chapter Five - CONCLUSIONS

9
CHAPTER II
LITERATURE REVIEW
2.1 Sodium Metal
Sodium or Natrium in Latin has been used for centuries in both organic and
inorganic industries (Thayer, 2008). Alkali metals or group I in the Periodic Table
consists of lithium, sodium, potassium, rubidium, cesium, and francium. This group of
metals possess lower densities than other metals, one loosely bound valence electron,
the largest atomic radii in their periods, lower ionization energies, low
electronegativities and highly reactive than common metals (Banks, 1990). Atomic
sodium possesses 11 protons, 11 electrons and 12 neutrons that lead to its atomic
number of 11 and atomic mass of 22.98977 g/mol. Table 2.1 represents the physical
properties of sodium metal (Banks, 1990, Eggeman, 2007).
Table 2.1: Physical properties of sodium metal (Eggeman, 2007).
Phase at room temp. solid Density at 20 oC 0.968 g/cm3 Hardness 0.5 Mohs Liquid density at f.p. 0.927 g/cm3 Melting point 97.72 oC Boiling point 883 oC Heat of fusion 2.60 kJ/mol Heat of vaporization 97.42 kJ/mol Molar heat capacity 28.230 kJ/ mol K Energy of first ionisation 495.7 kJ/mol Standard potential - 2.71 V Colour Silvery white
Sodium has a body centered cubic (bcc) structure and is found in the form of a solid
metallic substance at room temperature. Due to its softness, it can be easily cut with a

10
table knife. When it is exposed to air, it reacts rapidly with oxygen and oxidizes to a
dull and gray coating (Eggeman, 2007). Sodium is a good conductor of electricity which
means that electric current can pass through this element without high resistance
(Pearson et al., 2008).
2.1.1 Chemical Properties of Sodium Metal
Sodium is more reactive than lithium and less reactive than potassium (Banks,
1990, Klemm et al., 2005). In the presence of air, it reacts with oxygen instantly to form
sodium oxide coating. This coating prevents any further reaction of the oxygen with the
underlying metal layers. Therefore, it is often stored by immersing in nitrogen
atmosphere or inside inert liquids like naphtha or kerosene (Wells, 1984). When it is
burnt in the open atmosphere, sodium peroxide (Na2O2) will be produced whereas upon
burning in limited supply of oxygen, it forms sodium oxide (Na2O). If this burning
process is carried out under high pressure, sodium superoxide (NaO2) would be formed
(Wells, 1984, Greenwood, 1997). At a temperature over 200 oC, sodium reacts with
hydrogen to produce sodium hydride (NaH) (Holleman et al., 2001). Sodium reacts with
water through an exothermic reaction and produces sodium hydroxide (NaOH) and
hydrogen gas. The released heat often ignites the hydrogen gas and a fire may break out
to the extent that a loud explosion would occur if a big piece of sodium is brought in
contact with water (Klemm et al., 2005). Sodium is able to react with ammonia either in
the presence of pure carbon or cobalt. In the presence of carbon, it produces sodium
cyanide (NaCN) and hydrogen, and in the presence of cobalt, it produces sodium amide
(NaNH2) and hydrogen (Greenlee et al., 1946). Sodium amalgam, which is an alloy of
sodium and mercury, is formed by the reaction of sodium and mercury (Renfrow et al.,
1939). On addition of sodium into alcohol, alkoxide is produced. This reaction is similar
to sodium’s reaction with water since in both cases it replaces one hydrogen atom
(Chandran et al., 2006). Sodium halides can be produced by vigorous reaction of

11
sodium metal with fluorine and chlorine at room temperature to produce sodium
fluoride (NaF) and sodium chloride (NaCl), respectively. However, it reacts potentially
with vaporized bromine and iodine to produce sodium bromide (NaBr) and sodium
iodide (NaI). When sodium comes in contact with alkenes and dienes, it forms
additional products. One such product formed the basis of making an early synthetic
rubber known as Buna Rubber. Sodium reacts with organic halides in order to produce
sodium organic compounds (Greenwood et al., 1997, Klemm et al., 2005).
After aluminium, magnesium, calcium and iron, sodium is the fifth most abundant
element on earth, comprising 2.6 % of the earth’s crust (Banks, 1990). Sodium metal in
its pure form is a hazardous material. This is because it is highly reactive due to its
extremely low ionization energy. It may combust spontaneously if it comes into contact
with air or water. These facts make it a hazardous material that is difficult and
expensive to transport and store (Kroschwitz, 1995, Thayer, 2008).
2.1.2 Production of Sodium Metal
The most common source for the production of sodium metal is sodium chloride
(NaCl) (Banks, 1990). It is found in nature as rock salt and in sea water. Other sources
of sodium metal are minerals, among which are soda niter (NaNO3), cryolite
(Na3AlF6), zeolites (NaAlSi2O6-H2O), and sodalite (Na4Al3(SiO4)3Cl) (Banks, 1990,
Pearson et al.,2008 ).
Sodium metal is not found in its pure form in nature due to its vigorous reactivity
(Banks, 1990, Keppler et al., 2003, Thompson et al., 2004). In October 1807,
Humphrey Davy isolated sodium by electrolysing molten soda (NaOH) (Banks, 1990).
The next year, Gay-Lussac and Louis Jacques Thénard produced sodium metal by
reducing sodium hydroxide with iron at high temperatures (Banks, 1990). More than
four decades later, in 1855, Henri Étienne Sainte-Claire Deville developed the first
12
commercial process to produce sodium metal from its carbonate by carbon as catalyst at
temperatures over 1100 oC (Wallace, 1953). However, in 1890, Hamilton Castner
distilled off sodium metal by electrolysis of fused caustic soda at 330 oC in Oldbury,
England, at a rate of two tons/week. Later on, Castner’s cell was used to produce
sodium at a rate of 105 tons/week until late in 1952 when the producing plant was
finally discontinued. Figure 2.1 illustrates a schematic diagram of Castner’s cell
(Wallace, 1953). Castner’s process is principally based on the electrolysis of caustic
soda (NaOH) involving three steps:
a) Producing individual ions through fusing NaOH
NaOH → Na+ + OH- (2-1)
b) In the electrolysis cell, Na+ ion tends to move toward the iron cathode and the
molten sodium is formed.
Na+ + e - → Na (2-2)
c) At the nickel anode, H2O and O2 are evolved due to oxidation of OH-:
4OH- → 2H2O + O2 + 4e- (2-3)

13
Figure 2.1: Castner’s Cell (Wallace, 1953).
In 1921, a process involving the electrolysis of a mixture of fused sodium chloride
(NaCl), calcium chloride (CaCl2), and barium chloride (BaCl2) in Downs cell was
introduced to reduce the melting point of the electrolyte to slightly below 600 °C
(Thompson et al., 2004, Keppler et al., 2003). This made the process more practical
compared to using pure NaCl which has a higher melting point of about 804 °C. This
change was applied because operating an electrolytic process at 804 °C was difficult
and presented numerous operating constraints. During electrolysis, calcium was also
obtained at the cathode but sodium and calcium were separated from each other due to
the difference in density. The density of sodium is 0.67 g/cm3 and the density of
calcium is 2.54 g/cm3 at operating temperature, making molten sodium and calcium
immiscible (Keppler et al., 2003, Thompson et al., 2004, Pearson et al., 2008).
As the decomposition potential of calcium is close to that of sodium, calcium co-
deposits with sodium at the cathode during the electrolysis. This is the reason for having
traces of calcium in sodium metal produced by Downs process (Pearson et al., 2008). A
schematic diagram of Downs cell is shown in Figure 2.2. Downs cell consists of a large
steel tank lined with a refractory material containing one or more carbon anodes, each

14
surrounded by a cathode. The small gap between the cathode and anode is filled with a
molten mixture of NaCl, CaCl2 and BaCl2. When electrical current is applied across the
gap, NaCl produces sodium metal, which is collected at the cathode, and chlorine gas
(Cl2), which is collected at the anode. A fine metal mesh between the cathode and
anode prevents the sodium and chlorine from reacting again to form NaCl. The chlorine
gas bubbles up through the molten salt and is collected in the chlorine dome at the top
center of the vessel (Pearson et al., 2008). It is then liquified to be used for various
industrial purposes. Being less dense than the molten salts, the sodium metal floats up
from the cathodes into a collector, then goes up a riser and into a holding container
(Pearson et al., 2008).
Figure 2.2: Downs Cell (Pearson et al., 2008).
The chemistry of reaction in Downs Cell is:
a) Fused NaCl contains sodium and chloride ions
NaCl→ Na+ + Cl- (2-4)
b) At the cathode: Na+ ions migrate to the cathode where they are reduced to Na

15
Na+ + e- → Na (Reduction) (2-5)
c) At the anode: Cl- ions migrate to the anode and oxidised to form chlorine gas
2Cl- → Cl2 + 2e- (Oxidation) (2-6)
d) Overall Reaction
2Na+ + 2Cl- → 2Na + Cl2 (2-7)
The reduced sodium metal in the iron cathode of Downs cell is required to be
filtered while it is cooled. Afterwards, the excess calcium would be precipitated by
adjusting with a mixture of an inert gas containing 0.1% - 2% of nitrogen (N2) and
0.1% - 0.5% of oxygen (O2) at a temperature below 300 oC. The separation method is
based on the oxidation of calcium to calcium oxide during the purification of sodium
(Pearson et al., 2008).
Downs process shown in figure 2.3 produces sodium with 99.8% purity, is the
currently utilized method in industry worldwide (Keppler et al., 2003,
Thompson et al., 2004, Pearson et al., 2008, Thayer, 2008). The major producers are
DuPont and MSSA companies (Thayer, 2008). It has been stated that the production
process for manufacturing sodium metal from the Downs cells is essentially the same
for the two manufacturers (Pearson et al., 2008, Thayer, 2008).
16
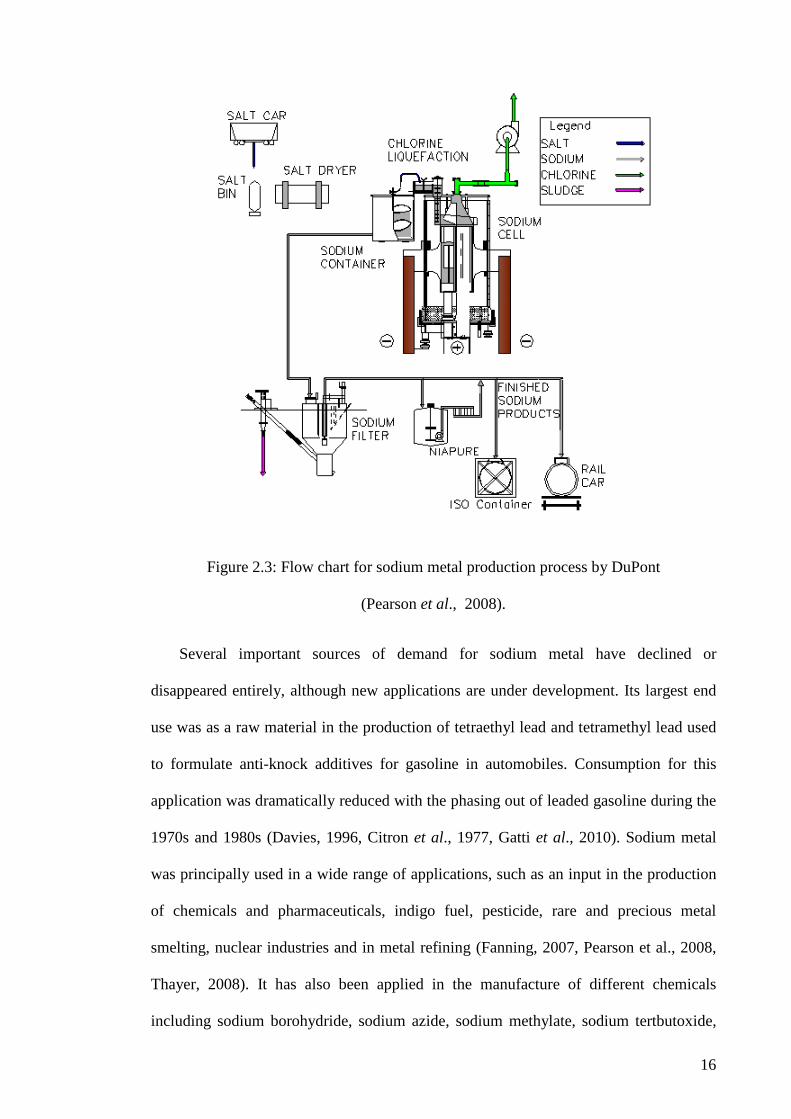
Figure 2.3: Flow chart for sodium metal production process by DuPont
(Pearson et al., 2008).
Several important sources of demand for sodium metal have declined or
disappeared entirely, although new applications are under development. Its largest end
use was as a raw material in the production of tetraethyl lead and tetramethyl lead used
to formulate anti-knock additives for gasoline in automobiles. Consumption for this
application was dramatically reduced with the phasing out of leaded gasoline during the
1970s and 1980s (Davies, 1996, Citron et al., 1977, Gatti et al., 2010). Sodium metal
was principally used in a wide range of applications, such as an input in the production
of chemicals and pharmaceuticals, indigo fuel, pesticide, rare and precious metal
smelting, nuclear industries and in metal refining (Fanning, 2007, Pearson et al., 2008,
Thayer, 2008). It has also been applied in the manufacture of different chemicals
including sodium borohydride, sodium azide, sodium methylate, sodium tertbutoxide,

17
agricultural chemicals; such as herbicides and insecticides, dyes; such as synthetic
indigo, nylon synthetic fibers, rubber compounds, and flavorings and fragrances.
Sodium metal is also used to produce pharmaceutical products such as barbiturate,
vitamins A and C, ibuprofen, and sulfa methoxizane (Klemm et al., 2005). In metal
manufacturing, sodium metal is used as a reducing agent to produce pure metals such as
titanium, tantalum, hafnium, and zirconium (Thayer, 2008, Pearson et al., 2008).
Possessing vast difference in its melting and boiling points, 98 oC to 882 oC, it has been
used as heat transfer medium in atomic reactors and in die casting machines. Other
metal industry uses include silicon manufacturing, refining metallic lead; silver; and
zinc, alloying metals and steel de-scaling via sodium hydride. Additionally, sodium
metal is useful as a scavenging agent in smelting processes (Fanning, 2007).
Three downstream products of sodium metal are of special interest due to the
potential for strong growth in the future. Firstly, sodium methylate is a catalyst used in
the production of biodiesel fuel (Thayer, 2008), which will likely witness an increased
production due to regulations mandates for biofuel usage in some countries. Secondly,
polysilicon wafers used in solar cells may benefit from the United States’ government
support for alternative energy (Pearson et al., 2008). Lastly, titanium metal primarily
used in aircraft manufacturing could be produced in a less expensive manner via a new
production process that uses sodium metal (Thayer, 2008).
Since the sodium metal industry features high energy consumption, manufacturers
in developed countries including leading industrial manufacturers in America, France,
and Russia, have halted its production, according to a global sodium metal report in
2012. In China, by contrast, major sodium metal enterprises are expanding their
capacities and many start-ups emerged, helping worldwide sodium capacity to be
transferred to China in phases. Recently, the sodium metal production capacity of China
has exceeded 100,000 tons/yr, offering a surplus in the market.

18
China is not only a big producer of sodium metal now, but also a big consumer. In
2006, the demand for sodium metal in China hit 82,000 tons/yr, and then in 2010 the
figure was close to 100,000 tons/yr. China’s demand for sodium metal is expected to
drive up due to the increasing consumption worldwide as well as the skyrocketing
development of domestic atomic energy industry (Global and China Sodium Metal
Industry Report, 2012).
Indigo Fuel is the key consumer of sodium, occupying 60% of the total demand.
Indigo Fuel LTD was incorporated in 2005 to provide convenient quality fuel oil service
at a higher quality than the industrial standard (Pearson et al., 2008). The development
of nuclear power industry has in recent years fuelled the demand for nuclear-grade
sodium which features higher specific heat than vast majority of metals and good
thermal insulation properties and serves as an ideal coolant for fast reactors (Fanning,
2007). Thus far, fast reactors are in service worldwide, including Phenix, Super-Phenix,
Russian BN-600 and Chinese CEFR, which are all employing nuclear-grade sodium as
coolant (IAEA, 2007).
It is expected that the demand for nuclear-grade sodium will show incredible
growth with the application of the fourth generation nuclear power technology. In the
upcoming three to five years, the demand for nuclear grade sodium will mainly be
contributed by two fast reactors, i.e. Fujian Sanming and Russian BN-1200, with the
targeted demand hitting 8,000 tons/yr and 6,000 tons/yr, respectively (IAEA, 2007).
According to the United States International Trade Commission’s Report in
November 2008 (Pearson et al., 2008), the Chinese exportation of sodium metal reached
a total of 16,917,000 pounds in 2007.
19
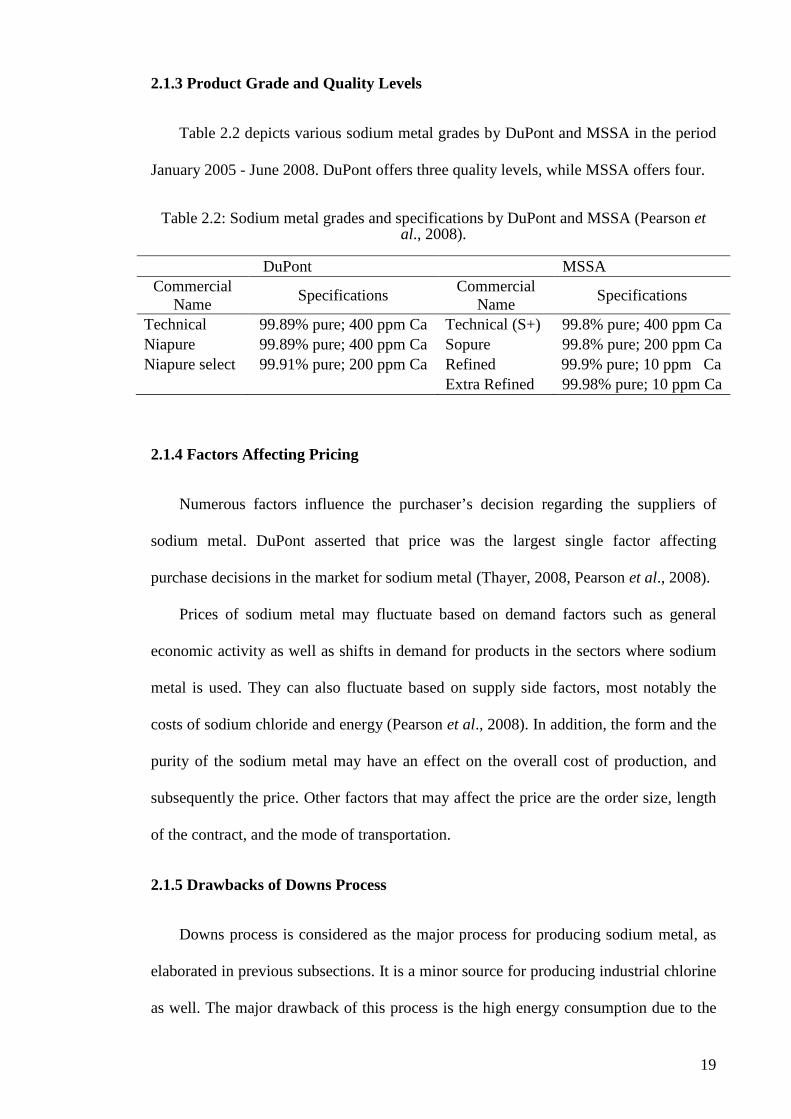
2.1.3 Product Grade and Quality Levels
Table 2.2 depicts various sodium metal grades by DuPont and MSSA in the period
January 2005 - June 2008. DuPont offers three quality levels, while MSSA offers four.
Table 2.2: Sodium metal grades and specifications by DuPont and MSSA (Pearson et al., 2008).
DuPont MSSA Commercial
Name Specifications Commercial Name Specifications
Technical 99.89% pure; 400 ppm Ca Technical (S+) 99.8% pure; 400 ppm Ca Niapure 99.89% pure; 400 ppm Ca Sopure 99.8% pure; 200 ppm Ca Niapure select 99.91% pure; 200 ppm Ca Refined 99.9% pure; 10 ppm Ca
Extra Refined 99.98% pure; 10 ppm Ca
2.1.4 Factors Affecting Pricing
Numerous factors influence the purchaser’s decision regarding the suppliers of
sodium metal. DuPont asserted that price was the largest single factor affecting
purchase decisions in the market for sodium metal (Thayer, 2008, Pearson et al., 2008).
Prices of sodium metal may fluctuate based on demand factors such as general
economic activity as well as shifts in demand for products in the sectors where sodium
metal is used. They can also fluctuate based on supply side factors, most notably the
costs of sodium chloride and energy (Pearson et al., 2008). In addition, the form and the
purity of the sodium metal may have an effect on the overall cost of production, and
subsequently the price. Other factors that may affect the price are the order size, length
of the contract, and the mode of transportation.
2.1.5 Drawbacks of Downs Process
Downs process is considered as the major process for producing sodium metal, as
elaborated in previous subsections. It is a minor source for producing industrial chlorine
as well. The major drawback of this process is the high energy consumption due to the

20
elevated temperatures at which it operates. The electrolyte mixture has a melting
temperature of about 580 oC to 600 oC (Banks, 1990, Paterson, 1966, Keppler et al.,
2003, Thompson et al., 2004). As a result, cell freeze-ups and other upsets are frequent,
leading to an increase in the overall costs of production. For this reason, a smooth
operation of the cell is found to be difficult and the process is not amenable to
automation (Thompson et al., 2004). Operating an electrolytic process at such
temperature is difficult and presents a serious operational constraint. Additionally, the
concentric cylindrical cell design of the Downs process (Figure 2.2) imposes a poor
space efficiency. This translates directly into high capital and operating costs per ton
produced.
Several concepts have been proposed to reduce emissions and energy consumption,
but none has been successfully applied on an industrial scale. There is an increasing
need to develop an electrolytic process that can be used to produce sodium metal in a
more economical way. There is also a need to develop a process that can improve the
operability, for instance, making automation possible (Paterson, 1966, Keppler et al.,
2003, Thompson et al., 2004). The options for new processing techniques are limited
because sodium has a strong affinity to both oxygen and water (Klemm et al., 2005).
Thus, considering production of sodium metal, NaCl cannot be electrolysed in aqueous
solutions. Furthermore, any new process should comply with existing environmental
regulations. A new process in which NaCl would be electrolyzed at or near ambient
temperatures would have a good industrial potential (AlNashef, 2010). Hence, it is of
paramount importance to introduce new electrolytes in which the production of sodium
from its common salts such as NaCl is possible at low to moderate temperatures. These
electrolytes will be considered as “green” materials if they succeed in reducing the
operation temperature (AlNashef, 2010).

21
2.2 Green Electrolytes (Green Solvents)
Organic solvents are important in chemical industry. They were utilized as media
for reactions in the synthesis of various compounds, as extraction solvents for
separation and purification, as well as in drying. They are also very important in
analytical methodologies, spectrometry and measurements of physico-chemical
properties (Plechkova and Seddon, 2007). The majority of traditional organic solvents
are hazardous, with problems of toxicity, cost, and waste by-products resulting from
their use in the chemical industry. Using these solvents in chemical laboratories and
chemical industries is raising an important issue for the health and safety of workers as
well as pollution for the environment. Green chemistry deals with research focused on
finding solutions for issues related to excessive use of non-renewable energy and
hazardous or toxic materials with greener alternatives (Anastas et al., 2003, Plechkova
and Seddon, 2007, Anastas, 2010). Paul Anderson, a senior chemist in the Environment
Protection Agency (EPA), developed the principles of green solvents during 1990s and
introduced them as a set of guidelines. These guidelines were intended to be followed
by the chemical manufacturers to reduce pollution in their plants and to make chemical
processes safer and more sustainable. The main target was that the products and
processes should be cost-competitive and be designed to include as many as possible of
the following:
a) Source reduction/prevention of chemical hazards, which includes
• Design chemical products to be less hazardous to human health and
environment. This meant that these products should be less toxic to
organisms and ecosystems, not persistent or bioaccumulative in organisms or
the environment, and inherently safer with respect to handling and use.
• Use feedstocks and reagents that are less hazardous to human health and
environment.
22
• Design syntheses and other processes to consume less energy and materials.
• Use feedstock derived from renewable resources or from abundant waste.
• Design chemical products that can be reused or recycled.
b) Treat hazardous chemicals and convert them to safe end materials.
c) Proper disposal of chemicals not of more use (Anantas et al., 2003).
The most popular green solvents are water and supercritical carbon dioxide.
Recently, room temperature ionic liquids (RTILs) were also recognized by many
researchers as green solvents, mainly due to the fact that they possess negligible vapour
pressure. This means that they do not emit any hazardous vapours when they are used,
eliminating the opportunity for the formation of combustible or toxic clouds (Anantas et
al., 2003).
All three of the above mentioned green solvents have their benefits and drawbacks.
Water is abundant, nontoxic, and intensive compound. However, it is a poor solvent for
most organic compounds and it is difficult to be removed from end products.
Supercritical carbon dioxide is abundant, can dissolve most organic solvents, and can be
removed easily. The main problem of utilizing it is the requirement for large energy
input to generate the pressure needed to liquefy it. RTILs are non flammable, non
volatile, and easy to recycle. However, most of these solvents are derived from
petroleum products and thus are toxic to aquatic organisms (Pandey, 2006, Plechkova
and Seddon, 2007). Therefore, there was an urgent need to develop new type of green
solvents that can be prepared from abundant, inexpensive, innocuous, and biorenewable
components and can be reused or recycled. Ionic liquids (ILs) analogues known as deep
eutectic solvents (DESs) possess the former principles mentioned earlier in this section
(Zhang et al., 2012).

23
In the following Sections, ILs and DESs are presented and discussed
comprehensively.
2.3 Introduction to ILs
An ionic liquid is a liquid which is composed entirely of ions, such as KCl and
KOH at high temperatures. If a compound is in liquid state at or near room temperature
and is composed of ions only, then it is called “room temperature ionic liquid” or RTIL
(Rui, 2010). In practice, the concept of RTIL is extended to include ILs within the
temperature range 0-100 °C (Galiński et al., 2006).
The attractive force between the anion and the cation in ILs is coulombic force. The
magnitude of this force is related to the charge number and radius of anion and cation.
Ionic compounds have a larger ionic radius and smaller force between them, thus an
ionic compound has a low melting point (George et al., 2011). Their ability to be liquid
at or around room temperature initiated a big interest in them within the chemical
society.
The application of common organic solvents, such as toluene, diethyl ether or
methanol is limited nowadays due to more strict regulations imposed on the industry. In
contrast, ILs due to their specific properties and their potential as green solvents do not
encounter this problem. An intriguing characteristic is to fine tune the physical and
chemical properties by suitable choice of cations and anions (Zhang et al., 2012).
Therefore, ILs are recognized as designer solvents, which means that their properties
such as viscosity, melting point, hydrophobicity, and density can be easily adjusted to
suit the requirements of a particular process. ILs have been the subject of considerable
interest due to their very low volatility and their ability to dissolve a wide variety of
compounds, which makes them useful as “green” solvents for energy applications and
industrial processes. ILs involving fully quarternized nitrogen cations have negligible

24
vapor pressure and are non-flammable. These properties are important when addressing
the health and safety concerns for the working personnel. Negligible vapor pressure
means that the solvent will not evaporate at normal temperatures, eliminating the risk of
the formation of combustible clouds or the risk of suffocation (Huang et al., 2001,
Stewart et al., 2004).
2.3.1 Physical Properties of ILs
ILs possess numerous important favorable properties in physics and chemistry,
such as their low melting points, moderate viscosities and densities, and high thermal
stability. Different cations and anions can be selected to prepare different ILs, and their
compatibility with water is thus controllable (Wang, 2007). They are little denser than
water, miscible with substances having very wide range of polarities, and can
simultaneously dissolve organic and inorganic substances.
The negligible vapor pressure, wide electrochemical window (between 2 V and
4.5 V except for Bronsted acidic system), large liquid range, and high electrical
conductivity are other favorable physical properties of ILs. The molecule of an IL is
composed of a large asymmetric cation and an organic or inorganic anion (Johnson,
2007, Forsyth et al., 2004). The most common cations and anions that compromise the
well-known ILs are presented in Table 2.3.

25
Table 2.3: Common cations and anions in ILs (Wilkes et al., 1982, Wasserscheid and Keim, 2000, Tsuda and Hussey, 2007).
Cations
Imidazolium Pyrazolium Triazolium Thiazolium Oxazolium
Pyridinium Pyridazinium Pyridnium Pyrazinium
Anions
NO3-
Nitrate Cl-
Chloride Br-
Bromide CuCl2- ClO4
-
Perchlorate BF4
-
Tetrafluoroborate
PF6-
Hexafluorophosphate
CF3SO3-
Trifluoromethanesulfonate
N(SO2CF3)2
- N(SO2CF2CF3
)2-
The physical behavior of ILs was found to be dependent largely on the utilized
cation and anion. Additionally, this behavior can be easily changed by utilizing various
cations and anions. The solubility of ILs in water depends significantly on the structure
of the anion (Plechkova and Seddon, 2007, Holbrey et al., 2003). For instance, most of
the chloride-based ILs are miscible with water, while the ILs composed of the anions
hexafluorophosphate (PF6-) or bis(trifluoromethylsulfonyl)imide (Tf2N-) are
hydrophobic. This shows an advantage for ILs over conventional solvents, which is the
possibility of anion replacement that enables designing compounds with properties
required for a particular application. Thus, the solvent properties of ILs can be tuned for
a specific application by varying the anion-cation combinations (Shvedene et al., 2005,
Plechkova and Seddon, 2007, Zhou et al., 2012).
ILs can replace hazardous and polluting organic solvents in industrial applications.
They are receiving an increasing interest as environmental-friendly solvents for many
synthetic and catalytic processes. Having high electrical conductivity due to their ionic
structure is the essential character of ILs that predisposes them as potential efficient
electrolytes. This is an advantage for their potential to serve as electrolytes in
electrochemical processes (Tsuda and Hussey, 2007).

26
In ILs, a combination of bulky and asymmetrical cations and evenly shaped anions
form a regular structure of liquid phase. This means that the anion of ILs cannot pack
well. The combination of larger asymmetric organic cation and smaller inorganic
counterparts lower the lattice energy and hence the melting point of the formed ILs. In
some ILs, the anions are relatively large and playing a role in decreasing the melting
point. For instance, the melting point of 1-butyl-3-methylimidazolium tetrafluoroborate
([bmim][BF4]) is -71oC in comparison with that of 1-butyl-3-methylimidazolium
hexafluorophosphate ([bmim][PF6]) which is 11oC (Coll et al., 2005, Ganjali et al,
2009). Consequently, ILs are often liquid at ambient temperature (Keskin et al., 2007,
Plechkova and Seddon, 2007).
ILs are polar solvents and consist of loosely coordinating bulky ions. They are able
to dissolve various organic, inorganic, and organo metallic materials. They are
immiscible with many organic solvents. Furthermore, they are nonaqueous polar
alternatives for phase transfer processes (Cooper and O’Sullivan, 1992, Keskin et al.,
2007).
What was discussed above is general and valid for the most commonly used ILs.
However, it must be noted that there are many ILs containing different anions and
cations and their properties cover a vast range. Therefore, the above statements should
not be generalized for all existing ILs and for those designed in the future (Keskin et al.,
2007).
2.3.2 History of ILs
The use of the first IL goes back to 1914 when ethylammonium nitrate,
[EtNH3][NO3], with melting point of 12 oC was synthesised. However, ILs did not
achieve a decent interest until the discovery of binary ionic liquids synthesised from
mixtures of aluminium chloride and N-alkylpyridinium or 1,3-dialkylimidazolium

27
chloride. The most problematic factor of chloroaluminate based ILs was their instability
in the presence of air and water. Moreover, they are not inert towards various organic
compounds and this limited their applications. In 1970, a work was presented for
developing ILs as electrolytes for nuclear warhead batteries and space probes (Chen,
2001, Keskin et al., 2007).
These type of batteries and space probes required molten salts to operate. These
molten salts were hot enough to damage the nearby materials. Therefore, chemists
searched for salts which remain liquid at lower temperatures and eventually they
identified alkyl-substituted imidazolium and pyridinium cations, with halide or
tetrahalogenoaluminate anions that initially could use as electrolytes in battery
applications. Wilkes and his colleagues improved specific ILs for the use as battery
electrolytes (Wilkes et al., 1982). In 1980s, imidazolium-based cations were found to
have better properties, such as air/moisture stability and more potential variations
(Carmichael and Seddon, 2000, Aki et al., 2001, Sheldon et al., 2002, Kölle and
Dronskowski, 2004). In 1990s, applications of air-stable ILs, such as 1-n-butyl-3-
methylimidazolium tetrafluoroborate ([bmim][BF4]) and 1-n-butyl-3-
methylimidazolium hexafluorophosphate ([bmim][PF6]) as well as water-stable ILs
were increased rapidly to the extent that ILs became among the most promising
chemicals as solvents in chemical processes (Aki et al., 2001, Wasserscheid et al.,
2002).
2.3.3 Synthesis of ILs
There are three basic methods to synthesis the ILs, namely: the methatesis
reactions, acid-base neutralization, and direct combination.
a) Metathesis Reactions
Numerous ILs are prepared by a metathesis reaction from a halide or similar salt of
the desired cation. Pyridinium and imidazolium halides can be obtained according to

28
this method. Generally, these kinds of reactions are divided into two categories
depending on the water solubility of the targeted IL: metathesis by free acids or
ammonium salts of alkali metals, and metathesis by silver (Ag) salt. For example, in
1996, the synthesis of water immiscible ILs, such as dialkylimidazolium
bis(triflyl)amides and dialkylimidazolium nonafluorobutanesulphonate were reported by
reacting a halide or triflate with lithium bis(triflyl)amide. The production of water
miscible ILs is an important and difficult task since it requires separation of the by-
products from the desired IL. For instance 1-ethyl-3-methylimidazolium
tetrafluoroborate [C2mim][BF4] was produced in 1992 by metathesis reaction of 1-
ethyl-3-methylimidazolium iodid [C2mim]I and silver tetrafluoroborate (AgBF4) in
methanol.
Metathesis reaction is suitable for synthesizing new ILs. However, the prepared ILs
are usually contaminated with small amounts of halide ions that may react with solute
materials (Wilkes and Zaworotko, 1992, Bao et al., 2003).
b) Acid-base neutralization
Monoalkylammonium nitrats are produced by the neutralization of the aqueous
solutions of the amine (base) with nitric acid. The by-product is water , which can be
removed under vacuum. Similarly, tetraalkylammonium sulfonates are prepared by the
reaction of sulfonic acid and tetraalkylammonium hydroxide. In order to purify the
produced IL, it must be dissolved in either acetonitrile or tetrahydrofuran and treated
with carbon active for at least 24 hours, and the organic solvent can be removed under
vacuum (Wilkes and Zaworotko, 1992, Bao et al., 2003).
c) Direct combination
Some ILs are prepared by direct combination of a metal salt and a metal halide,
such as halogenaluminate(III) as well as chlorocuprate(I) based ILs. However, the
29
chlorocuprate(I) based ILs are sensitive to oxygen, and are not utilized widely in
synthesis (Welton, 1999).
2.3.4 Applications of ILs
Apart from the fact that ILs are utilized as green solvents in different chemical and
engineering processes (Plechkova and Seddon, 2007), they possess numerous other
applications. Various electronic applications, such as electrolytes for batteries,
capacitors and charge storage devices, as well as conducting and light emitting materials
have utilized ILs as solvents. In the area of polymers, ILs have applications as grafted
components, solvents for polymerization, and modifiers of polymer morphology. They
were utilized as solvents for the synthesis as well as stabilization of nanomaterials.
ILs have been the focus of most researchers on nonaqueous electrodeposition and
recovery of metals. Separations, spectroscopy, and mass spectrometry are other broad
applications for ILs. They have also been employed widely in solvent extraction,
particularly for recovery of metal salts. Moreover, ILs are being utilized recently as
optical materials, lubricants, fuels for propulsion, and refrigerants (Plechkova and
Seddon, 2007, Handy, 2011).
2.3.4.1 Applications of ILs as Electrolytes
Another useful aspect of some ILs is their wide window of electrochemical
stability, which can be as large as 6 V. This wide window makes ILs promising
candidates for use as electrolytes for electrochemistry. While materials with large
voltage windows are desirable, they may also possess unacceptable viscosities and
insufficient conductivities for use as electrolytes. High viscosities often result in higher
oxidation potentials due to decreased mass transfer rates and longer reaction times
(Tsuda and Hussey, 2007, Pinter et al., 2010). Examples of main physical and
electrochemical properties of some IL electrolytes (ILEs) are shown in Table 2.4.

30
Table 2.4: Properties of some ionic liquids suitable for electrochemistry. (Stenger-Smith and Irvin, 2009)
Ionic Liquid M.P. (oC)
Viscosity (Pa s) at
25 oC Conductivity (S/cm) Electrochemical
window (V)
1-ethyl-3-methylimidazolium bis (trifluoromethylsulfonyl)imide -17 18 8.8 4.1
1-ethyl-3-methylimidazolium trifluoromethanesulfonate -9 43 9.2 4.1
1-butyl-1-methylpyrrolidinium bis(trifluoromethylsulfonyl)imide -50 71 2.2 5.5
1-hexyl-3-methylimidazolium hexafluorophosphate -80 548 1 5.5
1-ethyl-3-methylimidazolium dicyanamide -21 17 27 5.9
1-methyl-3-octylimidazolium tetrafluoroborate -88 422 0.43 6
The ILs shown in Table 2.4 have attracted significant attention as alternative
electrolytes in industrial processes. They can be used in a pure form or in combination
with other solvents (Stenger-Smith et al., 2002, Pringle et al., 2005, Zakeeruddin and
Graetzel, 2009). Advantages of ILs include a broad temperature range of application,
low volatility, and good electrochemical and thermal stabilities (Armand et al., 2009).
Wide electrochemical windows and negligible vapor pressures make ILs
advantageous for the electroplating of metals and semiconductors (Tsuda and Hussey,
2007, Keskin et al., 2007, Palmieri et al., 2009). ILs are also promising in enabling the
technology of high-temperature fuel cells (Greaves, 2008, Handy, 2011). ILs offer an
excellent alternative to conventional aqueous proton transfer systems at temperatures
exceeding 100 °C, i.e. when water as a solvent is not an option. ILs have been showing
an enhancement for long-term stability of electromechanical actuators utilizing
electroactive or ion exchange polymers (Ding et al., 2003). The most prominent
illustration of stability enhancement using ILs is in the electrochromic devices. When
1 - butyl-3-methylimidazolium tetrafluoroborate ([bmim][BF4]) was used as the
electrolyte in a polyaniline-based electrochromic display, there was no significant loss
in electroactivity after 1,000,000 cycles (Armand et al., 2009, Handy, 2011). ILs were

31
also utilized as electrolytes in the synthesis of electrochemical sensors, biosensors and
supercapacitors (Handy, 2011).
2.3.4.2 ILs in Fuel Cells
Many factors had encouraged researchers to utilize ILs as electrolytic solvents in
fuel cells (Handy, 2011, Ke et al., 2012). Examples are the high demand to improve the
anhydrous proton conducting electrolytes used in fuel cells, and the need for developing
electrolytes able to operate at temperatures above 120 oC, especially in polymeric-
electrolyte membrane fuel cells. ILs were required to act as protonic solvents or be
capable to conduct protons. The developed fuel cells were categorized in five
categories: i) molten carbonate, ii) solid oxide, iii) phosphoric acid, iv) polymeric
electrolyte membrane, and v) alkaline fuel cells (Handy, 2011, Ke et al., 2012). The
non-Bronsted acid-base room temperature imidazolium ionic liquids, such as 1-n-butyl-
3-methylimidazolium tetrafluoroborate, were found to be outstanding electrolytes for
fuel cells (Noda and Susan, 2003).
2.3.4.3 ILs in Electrochemical Sensors and Biosensors
Due to the entire ionic composition, the intrinsic conductivity, and the negligible
vapor pressure of ILs, they have been utilized as electrochemical sensors for gaseous
analytes, such as oxygen (O2), carbon dioxide (CO2), sulfur dioxide (SO2) and
ammonia (NH3) (Buzzeo et al., 2004, Peng et al., 2008). Cai and colleagues (Cai et al.,
2001) had developed an SO2 gas sensor resembling the Clark model that employs an IL
as the electrolyte. Furthermore, several groups have used different kinds of ILs in
electrode modification for the design of electrochemical sensors or as novel electrolytic
materials. For instance, Lu et al. in 2001 utilized a novel chitosan/1-butyl-3-
methylimidazolium hexafluorophosphate composite material as a new immobilization
matrix to entrap proteins, in addition they studied the electrochemical behaviors of
hemoglobin (Hb) on glassy carbon electrode (Singh et al., 2012).

32
Biosensors are small devices employing biochemical molecular recognition
properties as the basis for a selective analysis. The major processes involved in any
biosensor system are (i) analyte recognition, (ii) signal transduction, and (iii) readout. In
an electrochemical biosensor, a molecular sensing device couples a biological
recognition element to an electrode transducer, which converts the biological
recognition event into an electrical signal (Singh et al., 2012). ILs have shown good
compatibility with biomolecules and enzymes and even whole cells are active in various
ILs. 1-Butyl-3-methylimidazolium chloride ([bmim][Cl]) was found miscible with silk,
which is an attractive biomaterial with excellent mechanical properties and
biocompatibility (Singh et al., 2012, Buzzeo et al., 2004).
2.3.4.4 ILs in Supercapacitors
Electrochemical capacitors (ECs), also known as supercapacitors, are power
leveling charge storage devices in which oxidation and reduction of electroactive
polymers, metal oxides, or carbonaceous materials are taking place to store electrical
energy. They require an electrolyte for their operation. During the charging process, the
EC cathode is reduced and the anode is oxidized to store electrical energy. Later on, this
charge is released during discharge, as electrode materials return to their neutral states
(Namisnyk, 2003).
The most promising applications of ECs are memory protection systems for
portable electronics, load leveling for electric utilities and energy storage for electric
vehicles. ECs generally provide more power per unit mass than batteries and store more
energy per unit mass than traditional capacitors. Consequently, they are used to supply
burst power for electric vehicles (Namisnyk, 2003).
The most common commercial electrolytes used in ECs are organic solvents
containing a salt, typically an alkylammonium salt dissolved in acetonitrile. These
mixtures have good conductivity and ion transport properties, but also have high
33
volatility, flammability and toxicity (Stenger-Smith, 2002). These characteristics raise
safety and environmental concerns. Moreover, the use of acetonitrile generally limits
their applications above 70 oC due to the risk of cell rupture. It also has a very low flash
point, i.e. 10 oC, and emits toxic gases such as cyanogen (CN2) and nitrogen oxides
(NOx) as combustion products.
The use of ILs (Frackowiak et al., 2005, Kim et al., 2011) in ECs allows volatile
and hazardous conventional solvents to be eliminated and improves the operational
stability of these devices. Therefore, their utilization opens up the possibility of utilizing
energy storage devices for applications at higher temperatures such as military
equipment, hand-held surgical tools for sterile surgical environments, subterranean
probes and other power systems exposed to high temperature environments (Kim et al.,
2011, Balducci et al., 2004, Frackowiak et al., 2005) .
2.3.4.5 Application of ILs in Batteries
For a long period of time, battery cells used caustic and hazardous electrolytes. By
the introduction of ILs as electrolytes in these cells, scientists believe that numerous
new types of batteries can be introduced. This is due to the fact that ILs are non-volatile
and thermally-stable in contrast to the common electrolytes (Stenger-Smith and Irvin,
2009).
Generally, conventional batteries are composed of an organic electrolyte, a graphite
anode and a lithium transition metal oxide as cathode, such as lithium cobalt oxide
(LiCoO2) and lithium nickel oxide (LiNiO2). The used electrolytes consist of an
electrochemically stable lithium salt, such as lithium hexafluorophosphate (LiPF6) and
ethylene carbonate (C3H4O3) dissolved in an organic solvent such as dimethyl
carbonate (C3H4O3). The dissolved C3H4O3 plays a role by forming a film on the
anode to protect the electrolyte against reduction while it is ionically-conductive. The
34
drawback of these batteries is the low boiling point and flammability of the organic
solvent which cause a safety risk (Lewandowski and Swiderska-Mocek, 2009)
Unlike highly acidic conventional electrolytes, ILs due to their unique properties
have fostered the interest in battery applications to develop novel types of solid state
rechargeable batteries such as lithium-ion batteries. These kinds of batteries are broadly
used in portable electrical and electronic products such as laptops and cell phones owing
to the highest energy density among rechargeable energy storage systems. The utilized
electrolyte in a lithium ion battery consists of a lithium salt dissolved in the IL, such as
1-ethyl-3-methylimidazolium bis(trifluoromethylsulfonyl)imide ([C2mim][NTf2])
(Abu-lebdeh and Davidson, 2013).
Various ILs were studied for this application, such as 1-ethyl-3-methylimidazolium
chloride and 1-metyle1-butylpyridinum chloride due to their incombustibility. In
addition, other ILs based on tetrafluoroborate [BF4], bis(trifluoromethylsulfonyl)imide
[NTf2], and hexafluorophosphate [PF6] as anions and ethylmethylimidazolium
[EtMeIm], [Et2Me2Im], [BuMe2Im], and [Me3HexN] as cations have been reported for
this application(Clare et al., 2008) .
Furthermore, ILs have been used as alternative electrolytes in nickel-metal hydride
(NiMH) batteries, the standard lead-acid battery, and flow batteries. In 2012,
researchers at the Queen’s University Belfast have developed a novel battery
technology based on a design of a flow battery which stores and releases energy by the
electrochemical reactions of ILs as they pass through a membrane.
The purity of the electrolytes used in energy storage applications is crucial for the
stability and performance of electrochemical devices. ILs are no exception. Depending
on the synthetic routes employed for the preparation of ILs, impurities in these materials
may include water, superfluous cations or anions, or other solvents. Even trace amounts
of contaminants can result in undesirable side reactions and hamper the performance of

35
electroactive polymer-based devices. Chloride and water impurities have been shown to
influence the viscosity of ionic liquids (Seddon et al., 2000, Zhang and Bond, 2005)
Small amounts, i.e. few ppm’s, of sorbents such as alumina and silica can also result in
reduced electrochemical performance of ILs (Clare et al., 2008, Stenger-Smith and
Irvin, 2009). Purification approaches that produce ILs suitable for use in
electrochemistry often involve column chromatography or vacuum distillation of
impurities.
2.3.5 ILs at Extreme Temperatures
As the focus on energy production and storage attained an increasing pattern, there
is a growing demand for charge storage devices that operate at a wide range of
temperatures. For instance, charge storage devices are ideally operational at
temperatures as low as -30 °C in the automotive industry (Pesaran et al., 2007). Other
requirements for these devices are even more severe, as the temperatures reach -60 °C.
It has been reported that batteries undergo severe performance deficiency at low
temperatures (Stenger-Smith and Irvin, 2009). Low temperatures slow down the
kinetics of the charge/discharge process and increase the viscosity of the electrolytes
leading to a reduced ability of charge transportation. These changes in the property lead
to performance deficiency or failure upon long exposure to low temperatures. One of
the most serious effects of low temperatures on solution-based electrolytes is the
reduction in the solubility of the electrolyte material, which in turn leads to precipitation
of the salt and destruction of the EC or battery (Stenger-Smith and Irvin, 2009).
ILs as electrolytes are used at the moderately low temperatures required by the
automotive industry. However, few of these can operate at extremely low temperatures
(Stenger-Smith and Irvin, 2009). What is more challenging is the fact that these
electrolytes should support various electrochemical processes in a variety of reaction
systems across a broad temperature interval. There are very few ILs that remain liquid
36
at extremely low temperatures and their viscosities may become relatively high for most
of the electrochemical applications. To overcome this challenge, the use of mixtures of
different ILs and the use of viscosity-reducing additives have been proposed. Not only
the low temperatures are of concern to researchers, but also the elevated temperatures,
i.e. up to 60 °C (Pesaran et al., 2007). As most solvent-based electrolytes have high
solvent volatility at elevated temperatures, solvent evaporation can result in numerous
unfavoured issues. These issues include fire and explosion in sealed systems and in
electrolyte precipitation, destruction of the charge storage materials, and loss of charge
storage capability in open systems. Thus, the negligible vapour pressure of ILs makes
them excellent electrolytes for use at elevated temperatures (Stenger-Smith and Irvin,
2009).
2.3.6 Limitations of the Use of ILs
To date, cations such as N-alkyimidazolium, N-alkylpyridinium, N-
alkylthiazolium, N,N-dialkylpyrazolium, tetraalkylammonium, and coordinating
inorganic bulky anions such as BF4−, PF6
−, F3CSO3– and (F3CSO2)2N−, ZnCl3
−, are the
most investigated components of traditional ILs (Endres, 2002, Endres, 2004).
Imidazolium based ILs for their micro-by phasic structure composed of polar and non-
polar domains had undergone numerous simulations and experimental research (Santos
et al., 2007). Drawbacks that hindered the full utilization of ILs are mostly connected to
their toxicity (Morrison et al., 2009). Possible drain of the ILs to the soil or water
channels make them persistent pollutants and pose environmental risks. Not forgetting
to mention the cost factor, drawbacks are now obvious for the industrial management
bodies in considering ILs for complete utilization.
Even though ultrasonic irradiation ostensibly can break down traditional ILs into
more environmentally benign non-toxic compounds, such as biurea and acetoxyacetic

37
acid (Xuehui, et al., 2007), this irradiation requires high frequency sound waves on
solutions of hydrogen peroxide and acetic acid to be implemented.
Other main challenging issues are not only the synthesis, but also the drying and
purifying steps of traditional ILs. Moreover, the equipment used in processes utilizing
ILs necessitate certain skills, owing to the complicated reaction mechanism of
traditional ILs. Lastly, physico-chemical properties of ILs can simply be influenced by
small amounts of impurities especially in catalytic activities and electrochemical
applications.
Recently, Abbott and his colleagues (Abbott et al., 2001) demonstrated that a
mixture of solid organic salt and a complexing agent can form a liquid at temperatures
below 100◦C, known as deep eutectic solvent (DES).
2.4 Deep Eutectic Solvents (DESs)
The term “deep eutectic solvent” refers to liquids close to the eutectic composition
of the mixtures and is represented diagrammatically in Figure 2.4. The eutectic point of
a mixture refers to the molar ratio of the components which gives the lowest melting
point.
Figure 2.4: Schematic representation of eutectic mixture formation

38
It is found in the literature that DESs are mostly synthesized by mixing a
quaternary salt (X) with a hydrogen bond donor (HBD) or a complexing agent (Y).
Professor Andrew Abbott and co-workers have introduced the first research article on
the synthesis of DESs in 2004 (Abbott et al., 2004a). Their initial view was that it is
possible to synthesize a DES from a quaternary salt and a HBD. Their research was
focused on quaternary ammonium salt, (2-hydroxyethyl)trimethylammonium chloride,
which is known commercially as choline chloride. It is a well-known vitamin used in
the diet of cows and chicken; thus, it possesses no harmful impact and is considered as a
totally “green” compound (Aquilina et al., 2011). The selected HBD was carbamide
(urea) which is a fertilizer used in agriculture. Obviously both components are harmless
and green, resulting in a totally green DES upon their mixing (Mavrovic et al., 2010)
DESs are now a class of solvents that possess desirable characteristics such as low
cost, high solute solubility, wide potential window, and negligible impacts on the
environment (Abbott et al., 2003a, Abbott et al., 2006a, Kareem et al., 2010, Ju et al.,
2012). The possibility to design their structure by choosing the proper salt and HBD as
well as the similar salvation properties to ILs made them analogues for ILs. Added
advantage is the ease of the preparation in comparison with ILs. DESs are produced
from physical mixing of the salt and HBD with acute heating involving neither chemical
reaction nor the need for catalysts (Yu et al., 2008, Weaver et al., 2010, Ilgen et al.,
2009, Reinhardt et al., 2008); while, the production of ILs involves chemical reactions
of the raw materials. Side products will form impurities to the IL and require additional
purification (Keskin et al., 2007). An example is given for the production of 1-butyl-3-
methylimidazolium hexafluorophosphoate according to the following reaction
(Swatloski et al., 2003):

39
+ NaPF6
+ NaCl (2-8)
Sodium chloride (NaCl) as a side product is an impurity to the IL and its removal is
essential to improve the quality of the product.
The combination of the salt and the HBD or the complexing agent in DES synthesis
creates a new compound with a melting point lower than that of its constituent
components. The mechanism by which a DES is formed is not complicated. The HBD
or the complexing agent interacts with the anion of the salt and increases its effective
size, which in turn reduces the anion interaction with the cation. Thus, the melting point
of the mixture is decreased (Zhang et al., 2012, Carriazo et al., 2012). Generally, DESs
are characterized by a large depression of freezing point and by being liquids at
temperatures lower than 150 oC (Carriazo et al., 2012). However, most of them are
liquid between room temperature and 70 oC (Zhang et al., 2012, Carriazo et al., 2012).
A classic example is the mixture of choline chloride/urea DES. The melting points of
ChCl and urea are 302 oC and 133 oC, respectively. When mixed at a 1:2 molar ratio of
ChCl:urea, a liquid eutectic mixture was formed which has a melting temperature of
12 oC (Abbott et al., 2003a, Zhao and Baker, 2013).
(2-9)
As mentioned earlier in this Section, DESs have advantages in the preparation
procedure over ILs. Firstly, the preparation procedure of these eutectic mixtures, unlike
traditional ILs, is simple and needs only to mix two different compounds mechanically

40
with acute heating without the need for a catalyst. Secondly, a total mass efficiency and
zero emission in the synthesis are achieved. This means that all the masses of the salt
and HBD or complexing agent involved are converted to DES, which is
environmentally benign as there is no side products, especially in the form of vapours.
Lastly, substance density and energy density in the preparation process is lower in
comparison to ILs synthesis (Kareem et al., 2010, Hayyan et al., 2012, Zhao and Baker,
2013). All these advantages of the DESs make them suitable for strict industrial
requirements and large-scale production in comparison to the traditional ILs synthesized
by metathesis and ion exchange.
In 2007, DESs were defined using the general formula R1R2R3R4N+X-:Y-, (Abbott
et al., 2007a) where X is generally a halide ion (often Cl-), Y is a complexing agent.
Four general types of DESs were given as below:
Type I DES: Y = MClx, M = Zn, Sn, Fe, Al, Ga Type II DES: Y = MClx.yH2O, M = Cr, Co, Cu, Ni, Fe Type III DES: Y = R5Z with Z= CONH2
-, COOH-, OH-
Type IV DES: MClx, such as ZnCl2, mixed with a HBD such as urea, ethylene
glycol, acetamide or hexanediol.
Like ILs, most of the DESs possess ionic species, especially choline chloride-based
ones. However, they cannot be considered as ILs because they are not completely
composed of cations (Abbott et al., 2003a).
Since the time the interest on DESs became obvious in the literature, many
combinations of salts and HBDs or complexing agents were reported. Table 2.5 shows a
summary of typical quaternary salts as well as some HBDs utilized by different
researchers (Abbott et al., 2003b, Abbott et al., 2009, Kareem et al., 2010, Shahbaz et
al., 2010, Hayyan et al., 2012, Kareem et al., 2012a, Kareem et al., 2012b).

41
Table 2.5: Typical structures of the quaternary salts and HBDs used for DES synthesis (Zhang et al., 2012, Zhao and Baker, 2013)
Quaternary salts HBDs

42
Choline chloride (C5H14ClNO) is widely available in the market at low prices. It is
biodegradable and non-toxic. These characteristics favour its use as an organic salt to
produce eutectic solvents with safe HBDs, such as urea, glycerol, carboxylic acids, or
carbohydrate–derived polyols (Zhang et al., 2012). In comparison with traditional ILs,
DESs derived from choline chloride possess numerous superiorities which reinforce
the greenness of these solvents, such as low price, ease of storage, ease of preparation,
biodegradability, biocompatibility and non-toxicity. In addition, choline chloride-based
DESs are very similar to traditional imidazolium-based ILs from both physical and
chemical aspects. Intensive investigations were carried out by different researchers
(Zhao and Baker, 2013, Zhang et al., 2012) to characterize these types of DESs.
Properties such as density, viscosity, refractive index, electrical conductivity, surface
tension, and chemical inertness were found to be close to those of ILs. Consequently,
applications of imidazolium ILs can be replaced by DESs. Moreover, in contrast with
traditional organic solvents, storing DESs is easy due to their non flammability and
non volatility properties (Zhao and Baker, 2013, Zhang et al., 2012). From the view
point of green chemistry, apart from their biodegradability and water stability, some
DESs are compatible with enzymes, making them even more attractive. Choline
chloride based DESs were successfully applied in numerous chemical and biochemical
applications, such as metal oxide processing (Abbott et al., 2006a), electropolishing
(Abbott et al., 2006b) and extraction of glycerol from biodiesel (Shahbaz et al., 2010).
Similar to ILs, ChCl-based DESs are studied for their potential application in carbon
dioxide (CO2) absorption. Li and co-workers (Li et al., 2008, Zhang et al., 2012)
reported the absorption of CO2 in a wide range of DESs from ChCl:urea and the
solubility of CO2 in ChCl:urea DES with water content.
43
2.4.1 Synthesis of DESs
DESs as “advanced ILs” (Gorke et al., 2010) are favorable solvents in comparison
to ILs. One of the favoring factors is the ease of their synthesis. They can be easily
prepared in high purity with very limited resources. The requirements are only a
jacketed vessel with mechanical mixer and a mixing temperature of lower than 100oC.
Additionally, their components can be selected from biodegradable and
environmentally benign materials that possess low or no toxicity. (Abbott et al., 2003a,
Abbott et al., 2009, Kareem et al., 2010, Shahbaz et al., 2010, Kareem et al., 2012a,
Kareem et al., 2012b, Hayyan et al., 2012).
The mechanism in which a DES is formed is that the complexing agent, typically a
HBD, interacts with the anion of the salt and increases its effective size. This interaction
reduces the anion interaction with the cation and thus decreases the freezing point of the
mixture. DESs are characterized by a very large depression of freezing point and by
being liquids at temperatures lower than 150 oC. Abbott et al. (2004a) have described a
method for synthesizing DESs. This method also was adopted by Kareem et al. (2010,
2012a, 2012b) and Shahbaz et al. (2011a, 2011b, 2011c, 2012a, 2012b).
The mixing time and the temperature required to cause a complete interaction
between the salt and the HBD are not systematically calculated. They are acquired
through laboratory experience. The DES is said to be formed completely when the salt
and HBD change to a homogeneous liquid (Abbott et al., 2004a).
2.4.2 Physical Properties of DESs
As a similarity to ILs, DESs can be designed by combining desired components in
various molar ratios to tune their physicochemical properties (Zhang et al., 2012). In
this way, different task-specific DESs with different physicochemical properties, such
44
as freezing point, viscosity, conductivity, and pH can be derived. Owing to their
promising applications, numerous efforts have been devoted to the physicochemical
characterization of DESs.
2.4.2.1 Freezing Point (Melting Point)
DESs are distinguished for their unique properties, essentially low melting points
which make them favorable to traditional conventional solvents. The interest in their
applications is influenced by liquid phase under 100oC, thus they are suitable to replace
traditional molten salts that operate at very high operational temperatures. Abbott et al.
(2003a) showed that DESs of choline chloride (ChCl) + urea had some unique solvent’s
properties. It was shown that the self-association taking place between the salt and the
HBD depends on the type of components, and additionally their molar ratios play a key
role in controlling the melting point of the DES. Kareem et al. (2010) and Shahbaz et al.
(2010) presented similar findings to those of Abbott et al. (2003b) for phosphonium-
based DESs and choline-based DES, respectively. A melting point of – 66 oC was
achieved for ChCl + ethylene glycol at a salt:HBD molar ratio of 1:2. Moreover, Hua et
al. (2011) and Hayyan et al. (2013) authenticated the controlling role of salt:HBD molar
ratio in glycerol and glucose based DESs, respectively.
2.4.2.2 Viscosity
Owing to the potential application of DESs as green media in chemical processes,
the development of DESs with low viscosity is critically important.
Viscosity is defined as the resistivity of a fluid to flow in streams. It is an important
property, especially when fluids, generally, and liquids, specifically, are used as
lubricants (Streeter et al., 1998). Viscosity of a DES, similar to melting point, is
strongly influenced by the atomic structure of its components, the molar ratio by which
it is prepared, the operating temperature, and the water content. The ionic size of

45
components, void volume and interaction forces between components, such as
electrostatic and Van der Waals, all significantly affect the viscosity of DESs (Abbott et
al., 1999).
Viscosity of most eutectic mixtures obviously changes as a function of the
temperature. (Kareem et al., 2010, Hayyan et al., 2012):
Hayyan et al. (2012) presented a DES made of ChCl and D-fructose as a HBD. It
was shown that the variation of the salt:HBD molar ratio influenced the viscosity of the
resulting DES. The lowest viscosity attained was when the salt:HBD is 2:1 whereby the
viscosity is 12 Pa.s at around 30 oC. Yet, the viscosity of this DES is higher than those
reported for choline chloride-based DES by Kareem et al. (2010) with viscosities in the
range of 0.068 and 0.14 Pa.s.
2.4.2.3 Electrical Conductivity
Electrical conductivity is one of the fundamental physical properties which
represent how well a material can conduct electrical current. It is also an indication for
how much a material is resistive for the motion of electrons within its molecules, i.e.
resistivity (Ju et al., 2012). The higher the value of the conductivity, the lower the
resistance it provides to the flow of electric current (Ju et al., 2012, Holbery et al.,
2003). In addition, it is a useful measurement, as in the case of using liquids as
electrolytes in electrochemical processes, such as in batteries or in electroplating
process. In engineering applications, it is crucial to measure the electrical conductivity
of an electrolyte in order to design, control and optimize the electrolytic processes and
the production of electrochemical power sources. For corrosion protection, electrical
conductivity provides practical information for assessing the corrosivity of aqueous
media and for cathodic protection system.(Holbery et al., 2003).

46
Electrical conductivity of DESs is influenced by their relatively high viscosity.
Therefore, DESs exhibit poor ionic electrical conductivity around or lower than 2
mS cm-1 at room temperature. In addition, due to the strong impact of the molecular
structure and molar ratio of DES components on viscosity, the electrical conductivity of
DESs is strongly influenced by these factors. A detailed description of electrical
conductivity and its behavior with temperature for different ammonium and
phosphonium based DES is presented in Chapter 4 of this work. Conductivities of
DESs generally increase significantly as the temperature increases due to a decline in
the viscosity.
2.4.2.4 Refractive Index
The index of refraction or refractive index is an important property, especially for
optical identification of particular substances, inspecting the purity of materials and in
measuring the concentration of solutes in solutions (Awwad and AlDujaili, 2001).
There are few recent studies that investigated the change in the refractive index of
DESs with temperature. The work by Kareem et al. (2010) and Hayyan et al. (2013)
showed that the refractive index of DESs decreases linearly as the temperature
increases. Five different DESs were investigated, and it was found that the values of the
refractive index for phosphonium salts-based DESs varied between 1.47 and 1.57
(Kareem et al., 2010), for glucose-based DESs varied between 1.65 and 1.66 while for
fructose-based DESs varied between 1.50 and 1.52 (Hayyan et al., 2012, Hayyan et al.,
2013). A study by Shahbaz et al. (2013) proposed a predictive method to theoretically
calculate the refractive indices of DESs. This method is based on the molar refraction
method proposed by Wildman and Crippen (1999). The calculated refractive indices by
this method were compared to the experimental values and the error percentages were
estimated. The maximum error was 2.9918 % for ChCl:glycerol DES at salt:HBD molar
47
ratio of 1:1 while the minimum error was 0.2741 % for N,N-diethylethanol ammonium
chloride:ethylene glycol DES at salt:HBD molar ratio of 1:3.
2.4.2.5 Density
Recent studies have reported the measurements of densities of DESs over various
range of temperatures (Kareem et al., 2010, Abbott et al., 2011a, Shahbaz et al., 2011c,
Hayyan et al., 2013). Density of a substance is the amount of mass in a unit volume.
Most of the materials in liquid phase tend to follow the general rule, i.e. density varies
in an inversely proportional pattern with temperature. The reported measurements for
density of DESs showed the same behaviour. Some DESs possess low densities, such as
N,N-diethylenethanol ammonium chloride: ethylene glycol (1:4) which has a density of
1.0590 gr/cm3at 95 oC. Other DESs possess moderate densities, such as methyltriphenyl
phosphonium bromide: glycerol (1:2) with a density of 1.2486 g cm-3 at 95 oC. The
studies on DESs’ densities showed that the density of a DES is similar to other physical
properties in their dependence on the salt:HBD molar ratio. This means that the
variation in salt:HBD molar ratio leads to a variation of the density of the resulting
DES. This fact was illustrated by the work of Shahbaz et al. (2011c).
From the various works that dealt with the estimation of the densities of different
DESs, it was shown that phosphonium-based DESs possess higher densities than water
(Kareem et al., 2010, Shahbaz et al., 2012c). In the work of Abbott et al. (2011a),
density’s profile versus the salt’s concentration in a DES made from ChCl and glycerol
was reported. The density of this DES was 1.26 g/cm3 at zero % molar concentration of
ChCl. The density started to decrease as the ChCl concentration increased until it
reached 1.18 g/cm3 when the ChCl concentration became around 33 % mol.

48
2.4.3 Applications of DESs
Zhang et al. (2012) showed that the use of DESs not only allows the design of safer
processes but also provides a straightforward access to new chemicals and materials.
The advantages of DESs over conventional ILs can be summarized as follows:
ease in preparation, lower costs, the elimination of purification step and
biodegradability. However, other than what has been reported in earlier sections, the
applications of DESs are virtually unknown. This indicates the wide industrial horizon
in which they can play essential roles. As DESs has emerged as an efficient, non-toxic
and cheap replacement for conventional solvents, their potential applications in various
chemical and electrochemical applications are significant. The electrodeposition of
metals from zinc–tin alloys on ChCl:urea DESs was one of the first applications dealing
with DESs (Abbott et al., 2007a). Jhong et al. (2009) applied ChCl:glycerol DES as
electrolyte for dye-sensitized solar cells. Biosett (2013) has reported physical properties
of lithium bis[(trifluoromethyl)sulfonyl]imide:N-methylacetamide DES as superionic
electrolyte for lithium ion batteries and electric double layer capacitors. It was found
that, this DES possesses wide liquid-phase range from −60 °C to 280 °C, low vapor
pressure, and high ionic conductivity up to 28.4 mS cm-1 at 150 °C and at ratio of 1:4,
therefore this solution can be practically used as electrolyte for electrochemical storage
systems such as electric double-layer capacitors (EDLCs) and/or lithium ion batteries
(LiBs).
The exponentially growing flow of research papers and patents concerning the
synthesis and applications of DESs indicates the significant expansion in research on
DESs.

49
2.4.3.1 DESs in CO2 Capture Process
According to the Intergovernmental Panel on Climate Change (IPCC), global
greenhouse gas emissions must be reduced by 50 to 80% by 2050 to avoid dramatic
consequences of global warming (Metz et al., 2005). By the end of the 21st century, it is
predicted that the emissions of greenhouse gases will increase the average global
temperature by 1.1 to 6.4 oC. The consequences of elevated global temperatures will be
melting of glaciers, leading to reduced water and food resources. The most important
greenhouse gas is carbon dioxide (CO2) because it is produced widely by the industry as
a result of burning fossil fuels. Anthropogenic CO2 emissions are mainly from fossil
fuels, being the most important global energy sources. Therefore, it is of an urgent need
to reduce CO2 emissions from the industry (Metz et al., 2005). CO2 capture by washing
the flue gases with amine solutions, such as monoethanol amine (MEA) and diethanol
amine (DEA), has been proposed and studied widely (Gray et al., 2008, Houshmand et
al., 2013, Song et al., 2013). Although the utilization of amine solutions in CO2 capture
is efficient in terms of the yield of the process, drawbacks related to this utilization have
been reported. High energy consumption and corrosion of process units due to the use
of corrosive amine solutions as well as the degradation, toxicity and inefficient
recyclability of these absorbents are among the drawbacks connected with CO2 capture
by amine solutions (Dawodu and Meisen, 1996, Schach et al., 2010).
Li et al. (2008) repoted that ChCl:urea DES has the potential in capturing CO2. It
was shown that ChCl:urea DES under different operating conditions of pressure and
temperature has a high capacity to dissolve CO2. The solubility was reported to be
increasing with increasing pressure. Additionally, the different salt:HBD molar ratios
did not give a significant difference in the solubility of CO2 in the DES. Su et al. (2009)
reported a work similar to the earlier work of Li et al., whereby it was confirmed that
CO2 has a good solubility in the ChCl:urea DES.
50
2.4.3.2 Dissolution of Metal Oxides
Selective solubility of different metal oxides in “green” solvents under different
temperatures is essentially important for metal extraction processes in hydrometallurgy
or recovery of metals from waste materials produced by electric arc furnace
(Cherginets, 2001, Fray and Chen, 2001). Electrowinning and liquid-liquid extraction
have been used to recover and concentrate the metals, typically from their oxides
(Abbott et al., 2006b). Aqueous acids, alkalis and some high temperature molten salts
have been used extensively in recovery of metals, such as titanium and aluminum
(Cherginets, 2001, Abbott et al., 2006a). Preliminary studies have shown that traditional
imidazolium-based ILs are potentially applicable in metal recovery (Zhang and Bond,
2005, Wu et al., 2002, McCluskey et al., 2002). They have been applied for the
extraction of the gold and silver from a mineral matrix and the recovery of uranium and
plutonium from used nuclear fuel (Abbott et al., 2006a). DESs as a potential
replacement for ILs have shown the potential to dissolve metal oxides successfully
(Abbott et al., 2003a, Abbott et al., 2006a). For example, ChCl:urea DES is capable of
selectivity extracting zinc oxide (ZnO) and lead oxide (PbO) versus ferric oxide
(Fe2O3) and aluminum oxide (Al2O3) from the waste of electric arc furnace (Abbott et
al., 2006a). Moreover, ChCl:urea DES is capable of dissolving a broad range of organic
and inorganic compounds, even those which are not soluble in water, such as lithium
chloride (LiCl), silver chloride (AgCl), aromatic acids, i.e. benzoic acid and amino acids
(d-alanine). Abbott et al. (2003a) demonstrated the solubility of metal oxides in
ChCl:urea DESs. It was shown that, for instance, the solubility of copper oxide (CuO)
in a ChCl:urea eutectic mixture was 0.12 mol/L. In a later article (Abbott et al., 2006a),
the solubility of ZnO, CuO and Fe3O4 in different ChCl:carboxylic DESs was reported.
It has been shown that the solubility of these oxides vary from 0.071 mol/L to 0.554
51
mol/L. It was also concluded that the solubility of different metal oxides would be
dependent on the nature of the DES and metal oxides (Zhang et al., 2012).
2.4.3.3 Purification of Biodiesel
Despite the use of liquid-liquid decantation to separate glycerol from biodiesel, the
ASTM specification requires more purification for biodiesel prior to its use in vehicles
(Shahbaz et al., 2010). Unlike biodiesel, glycerol is highly polar. Abbott et al. (2007c)
demonstrated the utilization of DESs to additionally treat biodiesel, owing to their
compatible properties with ILs such as polarity. Ammonium-based DESs such as
acetylcholine chloride:glycerol DES with ratio of 1:1 was used to separate glycerol from
raw biodiesel. The results showed a significant decrease, 99%, of the content of glycerol
in biodiesel. Evaluation of ammonium chloride DESs versus ammonium bromide DESs
showed that the former DESs such as acetylcholine chloride-based DES was more
efficient, i.e. 99% than ammonium bromide DES such as Pr4NBr:glycerol DES (Abbott
et al., 2007c, Zhang et al., 2012). This high efficiency of ammonium chloride-based
DESs may be attributed to the higher electronegativity of the chloride agent. Similarly,
Hayyan et al. (2010) showed that ChCl:glycerol based DESs can also be used as a
solvent for the separation of glycerol from palm oil-derived biodiesel. Recently,
Shahbaz et al. (2010) used other ChCl-based DESs for the extraction of residual
glycerol from biodiesel. For example, ChCl:ethylene glycol and ChCl:2,2,2-
trifluracetamide DESs were found to be efficient in this extraction. It has been shown
that the best separation efficiency was achieved using a ChCl–ethylene glycol DES with
a salt:HBD molar ratio of 1:2.5 with a DES:biodiesel ratio of 2.5:1. ChCl–2,2,2
trifluracetamide DES with a salt:HBD molar ratio of 1:1.75 was also highly efficient in
the separation of glycerol from biodiesel at DES:biodiesel ratio of 3:1. In addition to
ammonium based DESs, Shahbaz et al. (2010) utilized phosphonium-based DESs for

52
the purification of palm oil-derived biodiesel. Phosphonium-based DESs were
synthesized from methyltriphenylphosphonium bromide as a salt with three different
HDBs, i.e. glycerol, ethylene glycol or triethylene glycol. It was shown that ethylene
glycol and triethylene glycol-based DESs were very efficient, over 90%, for removing
residual glycerol from palm oil-derived biodiesel.
2.4.3.4 DESs for Ionic Conductivity Enhancement
Ramesh et al. (2012) used a ChCl:urea DES to improve the ionic transport
mechanism and electrical conductivity as a suitable additive to the series of electrolytes
of corn starch and lithium bis(trifluoromethanesulfonyl)imide. It was shown that the
ionic conductivity of traditional ILs was increased by the amorphous elastomeric phase
in corn starch: lithium bis(trifluoromethanesulfonyl)imide matrix. The ionic transport
mechanism was found to be improved, and an appreciable amount of ion conducting
polymer electrolytes was produced.
2.4.3.5 DESs as Solvents for Extraction of Aromatic Hydrocarbons from Naphtha
The removal of aromatic hydrocarbons from naphtha prior to the thermal cracking
process to produce ethylene is a necessary process to gain economical and industrial
benefits. It is a challenging process since these hydrocarbons have similar boiling points
and cannot be separated by normal distillation. Solvent extraction is commonly used in
industrial processes for aromatic hydrocarbon separation because of the mild operating
conditions and due to its simplicity (Gaile et al., 2004). Industrially used chemicals as
extractants are mostly conventional polar organic solvents, such as with problems of
toxicity and flammability. Meindersma (2005), Arce et al. (2007), Garcia et al. (2010),
and Dominguez et al. (2013) utilized different ILs as extraction solvents in the
separation of aromatics from naphtha. Different phosphonium-based DESs were

53
successfully used in ternary systems of benzene + hexane + DES and toluene + heptane
+ DES by Kareem et al. (2012a and 2012b). It was found that the DES of molar ratio of
1:6 methyltriphenylphosphonium bromide:ethylene glycol showed the best separation
performance in comparison to sulfolane which is the commercial solvent for this
extraction. In the system of toluene + heptane + DES, DESs composed of
tetrabutylphosphonium bromide and two HBDs, i.e. ethylene glycol and sulfolane, were
applied within a range of temperatures 30 oC to 60 oC. The results showed high
seletivities of the DESs towards toluene, but not as high as those of sulfolane. However,
the advantage was that the DESs investigated did not suffer a solvent loss to the
raffinate phase.
2.4.3.6 DESs as Catalysts
Not only DESs were successful solvents in separation processes due to their low
price and simplicity in synthesis but also they have been applied successfully as
catalysts in different applications, similar to traditional ILs. Lindberg et al. (2010) used
choline chloride-based DESs with ethane-diol, urea and ethylene glycol as HBDs in the
hydrolysis of 1,2-trans-2-methylstyrene oxide. Recently, Hayyan et al. (2013)
introduced phosphonium-based DESs as advantageous catalyst over ILs for the
production of biodiesel from industrial low grade crude palm oil. In that work, Hayyan
and colleagues used allyltriphenylphosphonium bromide as the phosphonium salt and p-
toluenesulfonic acid monohydrate as HBD. The DES produced was jelly viscous under
laboratory conditions, and the biodiesel produced from low grade crude palm oil met
the international standards, i.e. ASTM D6751 and EN 14214. Durand et al. (2012)
concentrated on analysing the advantages and limitations of several DESs as “green”
solvents for biotransformation using immobilized Candida antarctica lipase B as a
catalyst. Selected DESs for this utilization composed of two different ammonium salts,
54
i.e. choline chloride and ethylammonium chloride, with different HBDs, i.e. urea,
glycerol, oxalic acid, malonic acid, and ethylene glycol. It was shown that the DESs
composed of glycerol or urea combined with choline chloride as salt allowed the best
initial specific activity of the lipase in comparison to those in conventional organic
media. Azizi et al. (2012) introduced DESs as a dual catalyst and reaction medium for
the efficient formation of aromatic amines without hazardous organic solvent and
catalyst. Choline chloride-based DES with tin(II)chloride (SnCl2) as a complexing
agent was investigated as an environmental friendly catalyst for this application. The
development of practical and harmless method to produce N,N-diarylamidines and
formamides in the presence of DESs as catalyst and reaction medium was also
investigated
2.4.3.7 DESs as Electrolytes
ILs are highly electrochemically stable which makes them promising candidates for
electrolytic applications. Similarly, DESs became promising green electrolytes as
proper replacement for high melting point molten salts and ILs in electrolysis and
batteries applications. This is due to the fact that DESs share most of the favorable
characteristics of ILs and more favorably they can be synthesized more easily than ILs
(Zhang et al., 2012). Some of the applications of DESs as electrolytes are summarized
below:
a) Electrodeposition in DESs
ChCl-based DESs with HBDs such as urea or ethylene glycol have been widely
applied as electrolytes in the electrodeposition of metals. Abbott et al. (2007a)
introduced the electrodeposition of zinc (Zn)-tin (Sn) alloys in ChCl-basd DESs. It has
been shown that DESs composed of ChCl as salt and urea or ethylene glycol as HBD

55
are capable in depositing Sn, Zn and their alloys electrically. In addition, composite
materials such as aluminium oxide (Al2O3) were found to be able to deposit in DESs
media. Abbott et al. (2009) utilized the same DESs successfully in the electrodeposition
of copper (Cu) with an efficiency of approximately 100%. It was found that the rate of
electrodeposition is significantly dependent on the ratio of the DES and the
concentration of the solvent. Additionally, Abbott et al. (2006c) studied the
electrodeposition of stainless steel in ChCl based DESs.
Pollet et al. (2008) introduced possible utilization of ChCl:glycerol DES in the
electrodeposition of Cu on platinum (Pt) electrodes. The electrodeposition process was
carried out under three different conditions, i.e. without driving force; with driving force
of 20 kHz; and with driving force of 850 kHz. Under normal conditions and without any
driving force, the electrodepositon was driven only by diffusion. However, ultrasound
waves served as the driving force to accelerate the electrodeposition.
ChCl-DESs were also successfully applied in producing CuGaSe2 (CGS)
semiconductors in thin film solar cells (Steichen et al., 2011). It was found that
ChCl:urea DES with salt:HBD molar ratio of 1:2 is capable in depositing Cu and galium
(Ga) to produce CGS economically.
The same DES was applied by Gómez and colleagues in the electrodeposition
analysis of cobalt (Co), samarium (Sm) and samarium-cobalt (SmCo) system (Gómez et
al., 2011). In order to decrease the viscosity of DES to support less mass transfer rate
and longer reaction time, the electrodeposition process took place at a high operating
temperature of 70 oC. It was found that the DES had the capability to permit the
electrodeposition in non-aggressive conditions for alloys containing some transition
metals. In parallel, the same DES was applied for the electrodepositinon of pure nickel
(Ni) (Yang et al., 2011). You et al. (2012) demonstrated facile electrodeposition of Ni–

56
Co alloys from ChCl:ethylene glycol DES containing NiCl2.6H2O and CoCl2.6H2O at
room temperature.
Saravanan and Mohan (2011) introduced DESs synthesized from ChCl,
chromium(III) chloride hexahydrate (CrCl3.6H2O), nickel(II) chloride hexahydrate
(NiCl2.6H2O), iron (II) sulfate heptahydrate (FeSO4.7H2O), potasium chloride (KCl) as
well as ethylene glycol at specific ratios. These DESs were utilized in the
electrodeposition of Fe-Ni-Cr alloy on mild steel substrate. Other studies on the
electrodeposition of metals from DESs media were also reported by Bozzini et al.
(2012), Abbott et al. (2011b), Yang et al. (2012), Gu et al. (2012), Wei et al. (2012),
and Cojocaru et al. (2011).
Unlike the electrodeposition of metals in DESs media, the electrolytic deposition in
DESs of ChCl and urea or ethylene glycol was introduced by Abbott et al. (2007b). The
DESs were applied in the electrolytic deposition of metallic silver on copper substrates
from a solution of silver ions (Ag+). Silver deposits resulted from electrolytic deposition
from DESs were at several microns through dip-coating. Electroless deposition of
metals inside DESs was also studied by Abbott et al. (2008).
b) DESs in redox flow batteries
Bahadori et al. (2012) conducted the electrochemical screening of both ammonium
and phosphonium-based DESs in their work on the potential applications of redox flow
batteries. To select the best DES in their study, ferrocene/ferrocenium redox couple was
chosen as the Nernstian redox probe. The investigated DESs for this application were
ammonium salts, i.e. ChCl and N,N-diethylethanolammonium chloride, and
phosphonum salt, i.e. methyltriphenylphosphonium bromide while the HBDs were
glycerol, ethylene glycol and ferrocene. The potential windows of DESs were
determined electrochemically at Pt (platinum) microelectrode and a GC (glassy carbon)

57
electrode. The reductive and oxidative potential limits were reported versus the Fc/Fc+
couple. It was observed that DESs synthesized from ammonium salts provided a larger
potential window in comparison to the phosphonium-based ones when either Pt or GC
working electrodes were employed. It was shown that N,Ndiethylethanolammonium
chloride:ethylene glycol DES with salt:HBD molar ratio of 1:2 possessed the highest
standard heterogeneous rate constant of 5.44×10⁻⁴ cm s-1 and the compatible cyclic
voltametry with ILs as big as 5.7 V. It was concluded that this DES can be utilized as an
electrolyte in redox flow batteries.
c) DESs in dye synthesized solar cells
Dye synthesized solar cells are low-cost solar cells belonging to the group of thin
film solar cells. Jhong et al. (2009) investigated ammonium iodide-based DES with
glycerol as HBD as electrolyte in dye-sensitized solar cells. DES-based electrolyte
possesses numerous outstanding features in comparison to the traditional imidazolium-
based ILs. It has been shown that current-voltage characteristics stand at 0.533 V on
Voc, 12.0 mAcm-2 on Jsc, 0.582 on fill factor, and 3.88% cell efficiency under AM 1.5,
100 mWcm-2 illuminations. The comparable cell performance with other advantages of
DSEs makes glycerol-based DES a strong candidate for future electrolytic development
of dye-sensitized solar cells.
d) DESs as electrolyte in lithium ion batteries and electric double layer
capacitors
Biosset et al. (2013) investigated the potential application of N-methylacetamide:
lithium bis[(trifluoromethyl)sulfonyl]imide DES as environmentally advantageous
electrolyte in lithium ion batteries and electric double layer capacitors. Owing to the
favorable properties of the DES for ratio of 4:1, such as wide liquid-phase range from
−60oC to 280oC, low vapor pressure, and high ionic conductivity of up to 28.4 mS cm-1
at 150oC, it is suggested that this DES can be used as a promising electrolyte for EDLCs

58
(electrical double-layer capacitors) and LiBs
(lithium bis[(trifluoromethyl)sulfonyl]imide) applications, especially for those
requiring high safety and stability.
e) DESs in electropolishing of metals
Abbott et al. (2006b) utilized ChCl:ethylene glycol DES for the electropolishing of
type 316 stainless steel, and the choice of this DES was due to its favorable
characteristics, such as high current efficiencies, negligible gas evolution at the
anode/solution interface during polishing, and being comparatively benign and non-
corrosive in comparison to the traditional aqueous acid solutions. The electropolishing
was successfully demonstrated and the dissolution mechanism was shown to be
different from that found in aqueous acid solutions. Additionally, the dissolution of the
oxide film was slow in the DES medium in comparison with aqueous solutions. The
DES was not only non-corrosive but also air and moisture stable, adding one more
advantage to the DES over the acid solutions.
2.5 ILs/DESs Electrolyte as Molten Salt in Downs Process
Earlier, the Downs process was introduced as the current industrial process for the
production of sodium metal. The utilization of typical molten salt mixture of NaCl in a
certain ratio with CaCl2 and BaCl2 is aimed at decreasing the melting temperature of
NaCl from above 800oC to slightly below 600oC. This reduced temperature is still
extremely high and therefore economically and environmentally unacceptable.
The high operating temperature of this process is considered as an operational
drawback. Additionally, operating an electrolytic process at 600oC is difficult and
presents numerous constraints. At such operating temperature, the process generates
pollutants and consumes a high volume of energy (Keppler et al., 2003, Thompson et
al., 2004). Moreover, the concentric cylindrical cell design of the Downs process
necessitated by the high operating temperature leads to very poor space efficiency in the

59
cell. This translates directly into high capital and operating costs per unit production. To
overcome this difficulty, the utilization of a green efficient electrolyte has been
proposed. The utilization of ILs and DESs instead of molten salts for the production of
sodium, brings into focus three significant characteristics, namely solubility, electrical
conductivity and stability. The solubility of commercially available sodium salts and the
electrical conductivity of solution of sodium salt in IL or DES must be high, and the
stability of sodium in IL or DES must be achieved (AlNashef, 2012).
2.5.1 Solubility
Solubility is in general a strong function of the intermolecular forces between solute
and solvent. It is undeniable that in the absence of specific chemical effects,
intermolecular forces between chemically similar species lead to a similar endothermic
enthalpy of solution than those between dissimilar species (Prausnitz et al., 1998).
However, factors other than intermolecular forces between solvent and solute also play
a large role in determining the solubility of solid. To illustrate this, the solubilities of
two isomers, such as anthracene and phenanthrene in benzene at 25oC are taken as an
example (see Figure 2.6). Even though both solids are chemically similar to each other
and to the solvent, the solubilities are different. The solubility of phenanthrene is 20.7
mol% which is about 25 times larger than that of anthracene, i.e. 0.81 mol%. It means
that not only does solubility depend on the activity coefficient of the solute, which is a
function of the intermolecular forces between solute and solvent, but also on the
fugacity of the standard state to which that activity coefficient refers and on the fugacity
of the pure solid (Prausnitz, et al., 1998).

60
Figure 2.5: Structure of anthracene and phenanthrene
If the solute is designated by subscript 2, the equation of equilibrium would be:
𝑓2(𝑝𝑢𝑟𝑒 𝑠𝑜𝑙𝑖𝑑) = 𝑓2(𝑠𝑜𝑙𝑢𝑡𝑒 𝑖𝑛 𝑙𝑖𝑞𝑢𝑖𝑑 𝑠𝑜𝑙𝑢𝑡𝑖𝑜𝑛)
(2.10)
Equation 2.10 is based on the assumption that there is no appreciable solubility of the
liquid solvent in the solid phase, or
𝑓2(𝑝𝑢𝑟𝑒 𝑠𝑜𝑙𝑖𝑑) = γ2𝑥2𝑓20 (2.11)
where x2 is the solubility in mole fraction of the solute in the solvent, γ2 is the liquid-
phase activity coefficient and f20 the standard-state fugacity to which γ2 refers.
From Equation 2.11, the solubility is
𝑥2 = 𝑓2(𝑝𝑢𝑟𝑒 𝑠𝑜𝑙𝑖𝑑)
γ2𝑓20 (2.12)
Thus, the solubility depends not only on the activity coefficient but also on the ratio
of the two fugacities as indicated by Equation 2.12.
Solubility of a solid in a liquid is strongly influenced by temperature. To a certain
extent, the higher the temperature, the higher the solubility. As the temperature of a
solution is increased, the average kinetic energy of the molecules that make up the
anthracene phenanthrene

61
solution also increases. This increase in kinetic energy allows the molecules of the
solvent to more effectively break apart the solute molecules that are held together
by intermolecular attractions. The average kinetic energy of the solute molecules also
increases, destabilizing the solid state. The increased vibration of the molecules causes
them to be less able to hold together, and thus they dissolve more readily (Prausnitz et
al., 1998).
The electrical conductivity part has been presented in section 2.4.2.3.
2.5.2 Stability
It is well known that sodium metal is highly reactive when it is in its pure form. For
this reason, sodium metal cannot be found pure in nature. It is therefore found in the
form of compounds such as sodium halides, nitrites and oxides. Sodium has a fast and
exothermic reaction when it comes into contact with atmospheric oxygen or water. It
reacts with water to form sodium hydroxide and releases flammable hydrogen. Thus,
the presence of any traces of water in the DES used for its production is not favorable
(Pearson et al., 2008)
As the proposed change to Downs process assumes the production of pure sodium
metal in ILs or DESs as media, it is important to choose an IL or DES with which the
pure sodium will not react. Thus, the stability of sodium metal inside various ILs and
DESs must be studied.

62
CHAPTER III
METHODOLOGY
This chapter is composed of five sections. Section 3.1 discusses the synthesis of
DESs. Section 3.2 explains the characterization procedure of the physical properties of
some of the synthesized DESs. Section 3.3 shows the procedure followed for the
measurement of the solubility of sodium salts in different DESs and ILs. Section 3.4
tackles the experimental work for measuring the electrical conductivity for solutions of
sodium salts in DESs. Finally, Section 3.5 presents the experimental procedure for
measuring the stability of sodium metal in some of the DESs. The whole of the
experimental work was carried out under a glove box (Innovative Technology, USA)
environment whereby the humidity was less than 0.4 ppm.
3.1 Synthesis of DESs
3.1.1 Chemicals
Various salts and HBDs or metal halides as complexing agents were utilized to
synthesize the DESs. Choline chloride (ChCl), N,Ndiethylethanolammonium chloride,
methyltriphenylphosphonium bromide, ethyltriphenylphosphonium bromide,
tetrabutylphosphonium bromide, ethylene glycol, glycerol, anhydrous zinc chloride (ZnCl2),
anhydrous tin chloride (SnCl2), anhydrous iron (III) chloride (FeCl3), sodium chloride (NaCl)
and sodium bromide (NaBr) were acquired from Merck (Germany). All chemicals used were
synthesis grade, i.e. highly pure, not less than 99% and were used without further purification.

63
3.1.2 Synthetic Procedure
Abbott et al. (2004a) reported that DESs can be synthesized by mixing
predetermined amounts of a quaternary ammonium salt and hydrogen-bond donor at a
certain temperature until a homogeneous colourless liquid is formed. This method was
followed by many researches, and is utilized in this work to successfully synthesize
different DESs. This method is easy to follow and less expensive in comparison to the
synthesizing of ILs.
As the formation of DES depends in part on temperature and on the way the salt
and HBD or metal halide are mixed, the mixing is an important operation in the
synthesis of DES. The significant parameters are the type of mixing, mixing time, and
mixing speed. Some DESs require mechanical stirring, some of them can be formed by
shaking the mixing vessels while others can be stirred magnetically. The extent and type
of mixing depend on the type and phase of the salt and the HBD or metal halide used in
the synthesis of DES. In general, DES is said to be completely formed and is ready for
use when the salt and HBD or metal halide combine together to give a homogenous
liquid.
The equipment used in the synthesis of DESs are summarized in Table 3.1.
Table 3.1 : Equipment used in the DESs synthesis.
Stirring Type Equipment and accessories Model
Mechanical Mechanical agitators, stirring speed
controllers, jacketed vessels, oil/water bath.
Locally fabricated speed controller and mechanical agitators. Protech
water bath.
Shaking Incubating shaker, sealed vials. Adolf Kühner AG, Schewir ASF-1-V incubating shaker
Magnetic Hotplate magnetic stirrers, magnetic bars, sealed vessels.
IKA C-MAG HS7 S2 hotplate stirrer.

64
3.2 Characterization of DESs
Abbott et al. (2004a) reported that DES results from the formation of complex
anions which decrease the lattice energy and the freezing point of the system. The mole
ratio of salt: HBD or metal halide in the DES is an important factor that affect the
physical properties of the resulting DES. This is obvious when the physical properties
of different DESs synthesized from one combination of salt and HBD or metal halide at
different mole ratios are compared.
A list for the characterization equipment and the measurements obtained along with
the uncertainties in measurement are shown in Table 3.2.
Table 3.2 : Devices used for characterization of DESs with their uncertainties.
Property Device Estimated Uncertainty
Melting temperature Mettler Toledo Differential Scanning Calorimetry ±0.01 oC
Viscosity Brookfield R/S plus Rheometer (3 to 5) % of measured value* Conductivity Cheetah multi parameters meter ±1 µS.cm-1
Refractive index ABBE SASTEC ST-WYA-25 refractometer ±0.00001 * As per the manufacturer guide
The detailed experimental procedures followed to measure the physical properties
of some of the DESs are explained below.
a) Melting temperature
The melting temperature is defined as the temperature at which the substance
changes from liquid phase to solid phase upon temperature depression. Identifying this
exact temperature is possible by using visual methods. The capillary tube method is the
common method used in organic chemistry laboratories. It utilises a magnifying lens
that magnifies the vision of the glass tube which contains the sample. A light might be

65
used to provide better visibility. Upon heating or cooling the sample by an oil bath, the
sample passes through its melting temperature at which the change in phases is
detectable visually. This method is the one used in various analysis equipment such as
Thomas Hoover melting point apparatus (advertised in Chemical and Engineering News
Journal, 1961).
Although the above mentioned method is satisfactory for melting point analysis,
another method of interest is the heat flow measurement method. The principle of this
method is that when a sample passes through its melting temperature upon heating, it
emits a certain amount of heat which is detectable by micro-scale sensors. The
Differential Scanning Calorimetry (DSC) is an apparatus that measures the heat flow
emitted from a sample upon heating over a range of temperatures.
To measure the melting temperature of a compound by DSC, a sample of less than
10 mg of this compound is placed inside a special pan made mainly from aluminium
and a hole is made in the cover of that pan. The temperature of the sample is gradually
raised. The hole allows the heat emitted to transfer outside the pan whereby special
sensors measure this heat and record it. If the sample is liquid at room temperature, then
it must be cooled down till it freezes. The measurement starts from a point at which the
sample is in the solid state. If the sample is solid at room temperature, then the heating
program may start from the ambient temperature to a temperature at which the sample is
in the liquid state. The heating of the sample from below its melting temperature to
above this temperature is carried out through a computerized program. On the initiation
of the program the sample starts to emit a certain amount of heat till it reaches the glass
transition point whereby only a few molecules of the sample change from the solid state
to liquid state. At the glass transition point, the amount of heat emitted will be reduced
sharply to assist in converting the state of the sample. The specialized sensors detect this
sudden depression and it is drawn as a drop in the curve of the heat flow. When the

66
entire sample has melted down, the heat emission will be uniform again. This sudden
drop in the heat flow curve will be identified on the x-axis which represents the
temperature, and this temperature will be the melting temperature of the sample.
b) Viscosity
Viscosity is a measure of the resistance that the fluid shows to gradual deformation
by shear or tensile stresses. The low viscosity of a fluid indicates an easy flow of that
fluid in process streams, and vice versa.
Brookfield R/S Plus rheometer was used to measure viscosity. Temperature control
was achieved by an external water bath that was connected to the jacket-like cell. A
stainless steel testing tube was placed inside the jacket cell. A certain period of time was
allowed after the desired temperature was reached in the water bath to ensure that the
cell, test tube and the DES sample were all at the same desired temperature. Only then,
the rheometer was run and measurements of the dynamic viscosity taken.
c) Electrical Conductivity
The conduction of electrical current through a medium requires the presence of
charged atoms or ions. It is common knowledge that not all liquids contain ions, and
thus not all liquids conduct electric current. Salty water conducts electricity due to the
presence of the salt ions, but sugary water does not as there are no such ions. As
different liquids may contain different amounts and types of ions, their conductivity
varies. The conductivity of a liquid is an indication of the concentration of ions in it and
their type. The measurement of the electrical conductivity of a liquid is accomplished by
the use of conductivity meters. These meters use a probe in which two poles are
represented by two metallic ends. As an example, these ends could be in the shape of
rings. Upon immersing the probe in the liquid medium of interest, the meter generates
an electrical current and sends it to two metal ends in the probe. The current is
67
transferred by the medium from one metallic end to another. The received amount of
current is compared to the transmitted one, and the conductivity of the liquid is
displayed.
Cheetah multi parameters meter model DZS - 780 is the apparatus used in the
present work. It has a wide temperature range for measurements, i.e. from -5 oC up to
135 oC. The meter was calibrated by standard buffer solutions supplied by the
manufacturer. The measurements of the electrical conductivities at different
temperatures were carried out by placing the DES on a hot plate, equipped with a
temperature controller. To ascertain that the temperature displayed by the hot plate was
accurate, external thermometers were used to measure the temperature inside the DES
medium.
d) Refractive Index
The refractive index nD is a dimensionless factor which measures the bending of a
ray of light when passing from one medium into another (Hale and Querry, 1973). The
mathematical expression that is commonly used to calculate refractive index is given in
the following equation:
𝑛𝐷 = 𝑐𝑣 (3.1)
where c is the speed of light in vacuum and ʋ is the speed of light in the medium of
concern.
The value of nD for some of the DESs was measured at a specific range of
temperatures. This range usually starts from a few degrees Kelvin above the melting
temperature of the DES up to a maximum of 363 K. ABBE SASTEC refractometer
model number ST-WYA-25 was used to measure the refractive indices. This meter uses
68
an external oil bath for heating the sample, thus high temperatures can be achieved in
the measurement prism. The measurement is achieved when the device sends a beam of
light through the lens to the sample and measures the angle by which the reflected light
is returning back to the device. This angle is then converted to a refractive index. The
meter was calibrated by measuring the refractive index of glycerol at 298 K, which was
found to be 1.4746, exactly same as what is reported in the literature (Rheims et
al.,1997).
3.3 Measuring the Solubility of Sodium Salts in DESs and ILs
The electrochemical separation of the Na+ ions from sodium salts is carried out by
passing a high voltage electrical current through the electrolyte in which the salt is
dissolved. Thus, if DESs or ILs are to be utilized as electrolytes for the production of
sodium metal from its common salts, it is important to know the extent in which a
sodium salt dissolves in a certain DES or IL.
In the shake flask experiments, the solute is added to the solvent and the mixture is
stirred (shaken) vigorously for 24 hours or longer. Continuous observation is required to
determine if the solute has completely dissolved or not. If it is completely dissolved,
addition of more solute is required and the observation is repeated. Saturation is reached
and confirmed by observing the presence of undissolved solute in the solvent after
several additions of the solute.
Both the stirring and settling must be performed under the same temperature.
Samples from the solution are then taken from the upper part that does not hold
suspended undissolved salt. The sample may require filtering if suspended salt is
suspected to be present. After filtration, samples are taken for chemical analysis. To
prevent crystallization, dilution may be necessary in certain cases of sample preparation.
If necessary, the samples are diluted with de-ionized water. Finally, samples are
analyzed using Perkin-Elmer Optima 5300DV inductively coupled plasma-atomic
69
emission spectrometer (ICP-AES). For reasons of accuracy, each analysis should be
repeated three times and the average of the three analyses is to be considered.
Shake Flask method was used in this work as it is the most accurate method to
determine solubility. In the present work, the solubilities of three different low-cost
sodium salts, namely sodium chloride (NaCl), sodium bromide (NaBr) and sodium
carbonate (Na2CO3) were measured in various DESs and ILs under different
temperatures (25°C – 150°C). This was carried out by adding about 0.1 g of sodium salt
(anhydrous) to 5 g of DES or IL and stirred for 24 – 48 hours at constant temperature. If
the solvent was able to dissolve all the 0.1 g of the sodium salt, more salt was added and
observation was focused to ensure that a saturated solution was achieved. During these
measurements, three important factors were taken into consideration. Firstly, the solvent
and sodium salt must be of high purity. This is because any amount of impurities, no
matter how small, will affect the measured solubility. For this reason, all the chemicals
used in the present work were of synthesis grade. Secondly, the samples withdrawn
from the saturated solutions did not contain any undissolved salt. Lastly, the
temperature during stirring was carefully controlled. The uncertainty of the ICP is
estimated to be ±0.02 for solubility >20wt% and ±0.05 for solubility < 10 wt%.
3.4 Measuring the Conductivities of Sodium Solutions
The conductivity of the solutions of sodium salts in different DESs is important for
the final selection of the most suitable DES for sodium metal production. As this
production process is electrochemical, high conductivity of the electrolytic solution is
favorable. Accordingly, some of the solutions of sodium salts in DESs were subjected to
electrical conductivities measurements. The measurement here is from the measurement
of electrical conductivity described in Subsection 3.2 (b). The difference here is that the
electrical conductivity was measured for a solution of sodium salt in a DES, while it
was for pure DES earlier.
70
3.5 Measuring the Stability of Sodium Metal in DESs
It is well known that sodium metal is highly reactive when it is in its pure form. For
this reason, sodium metal cannot be found in a pure form in nature, but in the form of
compounds. This is due to the reaction of pure sodium with other elements or
compounds to form sodium halides, nitrate and oxides. Thus, it is important to know
whether the sodium metal proposed to be produced DES is going to react with the DES
or remain intact, i.e. stable.
The stability of sodium inside the proposed DESs was studied by placing
approximately 0.5 g of pure sodium metal in 5 ml of each DES in a glove box and
monitoring the results of this addition over a time span of one week.
3.6 Cyclic Voltammetry
Cyclic voltammetry is the most widely used technique for acquiring qualitative
information about electrochemical behavior of electrolytes (Wibowo et al., 2010,
Barrosse-Antle et al., 2010). It offers a rapid location of redox potentials of the
electroactive species. In the current work, the electrolytic behavior of ZnCl2-based
DESs in electrolysis of sodium chloride were investigated in those possess high
solubility and high conductivity of sodium chloride at optimum thermal conditions. The
electrochemical cell consisted of a typical three-electrode set-up. The counter electrode
was a Pt wire, and an Ag wire (immersed in 65% HNO3 prior to experiments, then
rinsed thoroughly with water and ethanol) was used as a quasi-reference electrode. A
glassy carbon (GC, 3 mm diameter) were used as working electrodes. The working
electrodes were carefully polished before each voltammetric experiment with 0.25 M
alumina suspensions and ultrasonically rinsed in acetone. All electrochemical

71
experiments were performed using a computer-controlled i-Autolab potentiostat
(PGSTAT302N) and experiments were carried out inside a Faraday cage.

72
CHAPTER IV
RESULTS AND DISCUSSION
Different types of DESs have been synthesized in the present work and some of
these DESs have not been reported before. Their novelty is due to the unique
combinations of chemicals used in their synthesis. Most of the DESs that have been
investigated and reported in the literature were synthesized from a salt and a hydrogen-
bond donor (HBD). However, in the present work, some of the DESs were synthesized
from a salt and a metal halide. Moreover, one DES was synthesized from a combination
of a salt and two metal halides. The DESs used in the present study along with their
abbreviations are summarized in Table 4.1.
Table 4.1: DESs studied in this work with their abbreviations.
Salt:HBD Mole ratios Abbreviation Choline chloride:Ethylene glycol 4:7 4:8 4:9 4:10 DES1 Choline chloride:Glycerol 2:2 2:3 2:4 2:5 2:6 DES2 N,Ndiethylethanolammonium chloride:Ethylene glycol 2:5 2:6 2:8 2:9 DES3
N,Ndiethylethanolammonium chloride:Glycerol 2:4 2:5 2:6 2:8 DES4 Choline chloride:Zinc chloride 1:1 1:2 1:3 1:4 DES5 Choline chloride:Tin chloride 1:3 DES6 Choline chloride:Zinc chloride:Tin chloride 1:1:1 DES7 N,Ndiethylethanolammonium chloride:Zinc chloride 1:1 1:2 1:3 1:4 DES8
N,Ndiethylethanolammonium chloride:Iron(III) chloride 1:3 DES9
Methyltriphenylphosphonium bromide:Ethylene Glycol 1:3 1:4 1:5 DES10
Methyltriphenlphosphonium bromide:Glycerol 2:4 2:6 2:7 2:8 DES11 Ethyltriphenylphosphonium bromide:Zinc chloride 1:2 1:3 1:4 1:5 DES12
Ethyltriphenylphosphonium bromide:Zinc bromide 1:2 1:3 1:4 DES13
Ethyltriphenylphosphonium bromide:Iron (III) chloride 1:3 1:4 1:5 DES14
Tetrabutylphosphonium bromide:Zinc chloride 1:2 1:3 1:4 1:5 DES15 Tetrabutylphosphonium bromide:Iron(III) chloride 1:3 1:4 1:5 DES16
The solubility of NaCl in selected ILs was also investigated. The ILs employed are
listed in Table 4.2.

73
Table 4.2: ILs studied for the solubility of NaCl.
No IL Structure Common name
M.wt. g/mol
m.p. oC
1 1-Ethyl-3-methylimidazolium ethylsulfate
[emim] [EtSO4] 236.29 < -20
2 1-Ethyl-3-methylimidazolium methanesulfonate
[emim] [MeSO3] 206.27 35
3 1-Ethyl-3-methylimidazolium dimethylphosphate
[emim] [DMP] 264.26 20
4 1-Ethyl-2,3-dimethylimidazolium chloride
[edmi] [Cl] 160.65 96
5 1-Butyl-3-methylimidazolium chloride
[bmim] [Cl] 174.67 70
6 1-Butyl-3-methylimidazolium dicyanamide
[bmim] [DCA] 205.26 -6
7 1-Butyl-3-methylimidazolium trifluoromethanesulfonate
[bmim] [TfO] 288.29 16.4
8 1-Butyl-3-methylimidazolium tetrafluoroborate
[bmim] [BF4] 226.02 -71
9 1-Butyl-3-methylimidazolium bis (trifluoromethylsulfonyl)-imide
[bmim] [Tf2N] 419.36 1
10 1-Octyl-3-methylimidazolium chloride
[C8mim] [Cl] 230.78 NA
11 1-Butyl-1-methylpyrrolidinium dicyanamide
[bmp] [DCA] 208.31 -55
12 1-Butyl-1-methylpyrrolidinium trifluoroacetate
[bmp] [TfA] 255.28 31
13 1-Butyl-1-methylpyrrolidinium trifluoromethanesulfonate
[bmpyr] [CF3SO3] 291.33 3
14 N-Butyl-3-methylpyridinium dicyanamide
[bmpy] [DCA] 216.29 16
15 N-Butyl-3-methylpyridinium methylsulfate
[bmpy] [MSO4] 261.34 NA
16 (2-Hydroxyethyl) trimethylammonium dimethylphosphate
[EtOHNMe3]
[Me2PO4] 229.21 40

74
The results of this study are presented in two main sections. Section 4.1 shows the
results of the synthesis and characterization of some of the DESs summarized in Table
4.1 while Section 4.2 presents the results of the assessment of the solubilities of sodium
salts in ILs and DESs as electrolytic solvents for the potential production of sodium
metal by electrolysis. Section 4.2 also reports the application of the non-random two
liquid (NRTL) activity coefficients model to predict the solubilities of sodium salts in
some of the ILs and DESs.
4.1 Synthesis and Characterization of Selected DESs
Some of the DESs synthesized in this work were characterized for their physical
properties. This is to obtain a clear view of their significant behaviours if they were to
be used for application in chemical processes.
It has been shown in Section 3.1 that it is possible to synthesize different DESs
from the same salt and HBD combination by varying the salt:HBD mole ratio. The
effect of the mole ratio on the physical properties of DESs was investigated. The results
confirmed that the physical properties of the synthesized DESs are dependent on the
salt:HBD mole ratio.
4.1.1 Melting Temperatures
The melting temperatures were measured for DESs 5, 8, 12 and 15. These DESs
were all synthesized from ZnCl2 which was used as the complexing agent. The
measured melting temperatures are listed in Table 4.3 and plotted as a function of molar
ratio in Figure 4.1.

75
Table 4.3: Melting temperatures Tm (K) for DESs 5, 8, 12 and 15.
DES5 1:1 1:2 1:3 1:4 Tm 314.77 325.33 320.37 318.97 DES8 1:1 1:2 1:3 1:4 Tm 313.39 307.56 310.47 312.26 DES12 1:2 1:3 1:4 1:5 Tm 341.5 338.98 340.27 345.29 DES15 1:2 1:3 1:4 1:5 Tm 340.95 343.01 341.55 344.99
Figure 4.1 shows that the melting point of the DES is dependent on the salt:HBD
mole ratio. The minimum melting point for each DES occurs at different salt:HBD
mole ratio.
It is obvious that the DESs based on phosphonium salts have higher melting points
than those based on ammonium salts. This is agreement with results reported by
Shahbaz et al. (2012a and 2012b). It has been shown that, in general, the phosphonium-
based DESs possess melting temperatures are higher than those of the ammonium-based
DESs. For instance, the ammonium-based DESs reported by Shahbaz, et al. (2012a and
2012b) were of melting temperatures lower than 323 K while the phosphonium-based
ones were of melting temperatures more than 333 K.
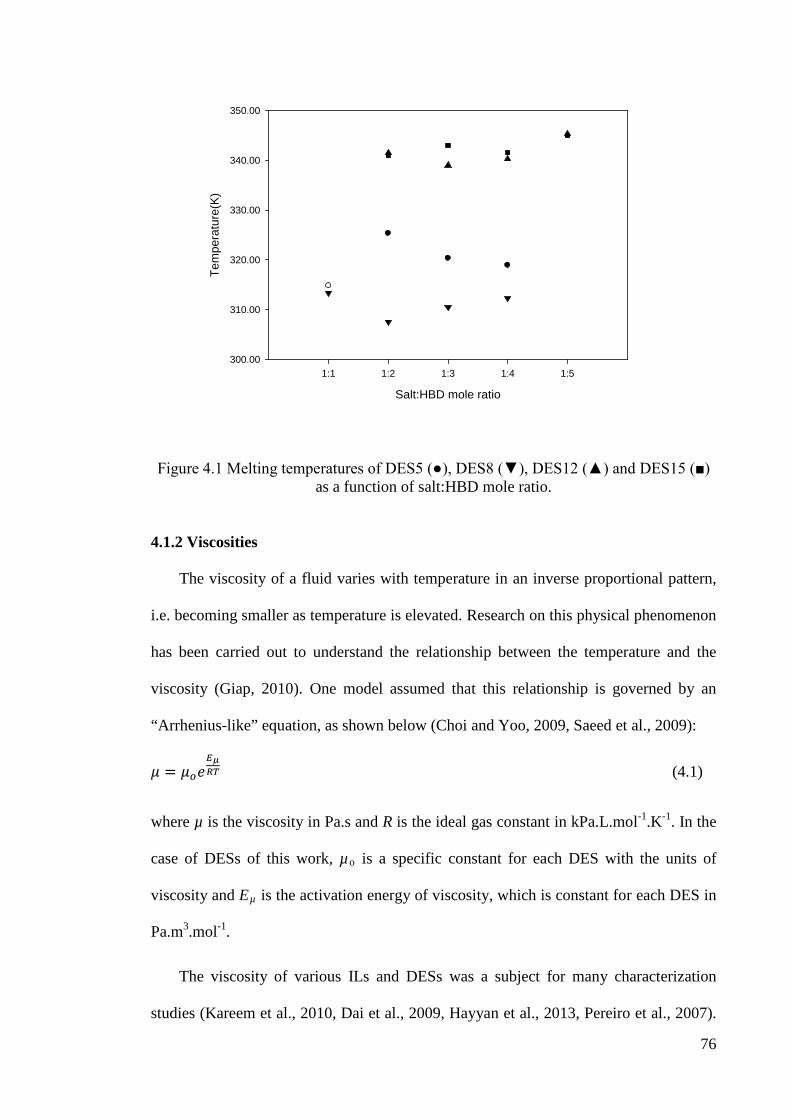
76
Salt:HBD mole ratio
1:1 1:2 1:3 1:4 1:5
Tem
pera
ture
(K)
300.00
310.00
320.00
330.00
340.00
350.00
Figure 4.1 Melting temperatures of DES5 (●), DES8 (▼), DES12 (▲) and DES15 (■) as a function of salt:HBD mole ratio.
4.1.2 Viscosities
The viscosity of a fluid varies with temperature in an inverse proportional pattern,
i.e. becoming smaller as temperature is elevated. Research on this physical phenomenon
has been carried out to understand the relationship between the temperature and the
viscosity (Giap, 2010). One model assumed that this relationship is governed by an
“Arrhenius-like” equation, as shown below (Choi and Yoo, 2009, Saeed et al., 2009):
𝜇 = 𝜇𝑜𝑒𝐸𝜇𝑅𝑇 (4.1)
where µ is the viscosity in Pa.s and R is the ideal gas constant in kPa.L.mol-1.K-1. In the
case of DESs of this work, µo is a specific constant for each DES with the units of
viscosity and Eµ is the activation energy of viscosity, which is constant for each DES in
Pa.m3.mol-1.
The viscosity of various ILs and DESs was a subject for many characterization
studies (Kareem et al., 2010, Dai et al., 2009, Hayyan et al., 2013, Pereiro et al., 2007).

77
This is due to the need for such data in the references and literature if a certain process
utilizing ILs or DESs is to be designed.
In the present work, the viscosity of selected DESs was measured experimentally at
temperatures between 343.15 and 368.15 K and presented in Table 4.4. The
experimental values of the viscosity were plotted as a function of the temperature,
Figures 4.2 – 4.5. Individual series of viscosity values for each DES were fitted by
Equation 4.1 above. Although the values of the constants µo and Eµ are different for
each DES, all the series were fitted with high accuracy, as can be seen in Figures 4.2 –
4.5. The values of µo and Eµ are listed in Table 4.5.
Table 4.4: Experimental results for viscosity (Pa.S) of DESs 5, 8, 12, and 15 at different molar ratios and temperatures.
T/K DES5 (1:1)
DES5 (1:2)
DES5 (1:3)
DES8 (1:2)
DES8 (1:3)
DES8 (1:4)
343.15 0.8278 13.9887 3.4654 0.5053 0.9954 2.2885 348.15 0.6648 9.5433 2.5171 0.3891 0.7679 1.5433 353.15 0.522 7.1962 1.8269 0.3116 0.5956 1.1122 358.15 0.396 5.6353 1.3993 0.2445 0.4687 0.8376 363.15 0.3168 4.0271 1.2456 0.1828 0.3612 0.6068 368.15 0.2842 3.0392 1.2148 0.1423 0.2916 0.4601
T/K DES12 (1:2)
DES12 (1:3)
DES12 (1:4)
DES15 (1:2)
DES15 (1:3)
DES15 (1:4)
343.15 76.8437 19.7389 23.8818 44.0712 66.0198 49.64 348.15 39.4883 12.3299 16.6789 31.6102 55.2216 38.6791 353.15 25.484 8.7249 10.0123 20.5574 31.335 25.7027 358.15 20.0837 8.013 8.9119 13.2642 19.4016 18.1887 363.15 15.5391 7.1931 7.2456 10.9159 10.5504 11.5157 368.15 7.9785 6.8769 6.9125 9.0304 5.3145 6.4118

78
Table 4.5: Values of µo and Eµ for the fitting by Equation 4.1.
DES Ratio µo (Pa.S) Eµ (Pa.m3.mol-1) 5 1:1 4.16×10-08 4.80×10+04 5 1:2 2.37×10-09 6.41×10+04 5 1:3 2.79×10-08 5.31×10+04 8 1:2 7.25×10-09 5.15×10+04 8 1:3 1.29×10-08 5.18×10+04 8 1:4 6.55×10⁻¹¹ 6.92×10+04 12 1:2 5.88×10⁻¹⁴ 9.92×10+04 12 1:3 9.43×10-08 5.44×10+04 12 1:4 3.97×10-09 6.42×10+04 15 1:2 2.28×10⁻¹⁰ 7.42×10+04 15 1:3 1.24×10⁻¹¹ 8.38×10+04 15 1:4 4.19×10⁻¹⁰ 7.29×10+04
As can be seen in Figure 4.2, the viscosity of DES5 1:2 has a large value at low
temperatures in comparison to DES5 1:1 and 1:3. However, it decreases sharply with
increasing temperature and reaches a value of around 3.03 Pa.s at 368.15 K. Both DES5
1:1 and 1:3 show lower viscosities than DES5 1:2 at all measured temperatures.In
addition, DES5 1:2 has a melting temperature of 325.33 K which is higher than both
DES5 1:1 and 1:3, i.e. 314.77 K and 320.37 K, respectively.
T-1 (K-1)
0.00270 0.00275 0.00280 0.00285 0.00290
µ (P
a.s)
0
2
4
6
8
10
12
14
Figure 4.2 Viscosity μ of DES5 1:1 (●), 1:2 (■) and 1:3 (▲) as a function of inversed temperature T-1. Curves represent fitting by Equation 4.1.

79
Figure 4.3 depicts the profiles of viscosity for DES8 1:2, 1:3 and 1:4. The increased
mole percentage of ZnCl2 from 66% in DES8 1:2 to 80% in DES8 1:4 has a clear and
uniform effect on the viscosity. It increases from around 0.5 Pa.s for DES8 1:2 at
343.15 K to 2.28 Pa.s for DES8 1:4 at the same temperature. Thus, the relationship
between the mole percentage of ZnCl2 in DES8 1:2, 1:3, and 1:4 and the viscosity is a
direct proportional relationship. At higher temperatures, the same observation applies,
whereby DES8 1:4 possesses a higher viscosity than DES8 1:2 and 1:3.
T-1 (K-1)
0.00270 0.00275 0.00280 0.00285 0.00290
µ (P
a.s)
0.0
0.5
1.0
1.5
2.0
2.5
Figure 4.3 Viscosity μ of DES8 1:2 (●), 1:3 (■) and 1:4 (▲) as a function of inversed
temperature, T-1. Curves represent fitting by Equation 4.1.
Viscosity profiles for DES12 and DES15 are shown in Figure 4.4 and Figure 4.5,
respectively. DES12 1:3 was found that possessed lower viscosity than that of 1:2 and
1:4, it means that by approaching to the eutectic ratio of salt:metal halide viscosity
decreases to its minimum point. For instance, it decreases from 7.98 Pa.s for 1:2 under
368.15K to 6.88 Pa.s at ratio of 1:3 and then increases to 6.91 Pa.s at that of 1:4 under
same operating temperature. Significantly, the same trend was observed in table 4.3 for
the melting point of DES12 1:3.

80
T-1 (K-1)
0.00270 0.00275 0.00280 0.00285 0.00290
µ (P
a.s)
0
20
40
60
80
Figure 4.4 Viscosity μ of DES12 1:2 (●), 1:3 (■) and 1:4 (▲) as a function of inversed temperature, T-1. Curves represent fitting by Equation 4.1.
T-1 (K-1)
0.00270 0.00275 0.00280 0.00285 0.00290
µ (P
a.s)
0
10
20
30
40
50
60
70
Figure 4.5 Viscosity μ of DES15 1:2 (●), 1:3 (■) and 1:4 (▲) as a function of inversed temperature, T-1. Curves represent fitting by Equation 4.1.
Figure 4.6 shows a comparison between the viscosity of DESs 5, 8, 12, and 15
when the salt:HBD is 1:2, and this is to illustrate the difference in viscosities between
phosphonium and ammonium-based DESs. It can be seen that phosphonium-based
DESs, i.e. DES12 and DES15, possess relatively higher viscosities than ammonium-

81
based DESs, i.e. DES5 and DES8. The difference is very big in some cases, reaching up
to 80 folds at low temperatures. This finding reduces the search for potential solvents
for the extraction of sodium metal from its common salts to a fewer number of DESs.
This is because the viscosity of the successful DES candidate at the proposed moderate
temperatures should be within an acceptable range.
Τ−1 (Κ−1)
0.00270 0.00275 0.00280 0.00285 0.00290
µ (P
a.s)
0
20
40
60
80
Figure 4.6 Viscosity μ of DES5 1:2 (●), DES8 1:2 (■), DES12 1:2 (▲), DES15 1:2 (▼) as a function of inversed temperature, T-1. Curves represent fitting by Equation 4.1.
4.1.3 Electrical Conductivity
As the intended use of the DESs of the present study is as solvents for electrolytic
production of sodium metal, the electrical conductivity σ is thus an important physical
property that, together with other factors, can decide the eligibility of a solvent to serve
for the intended task.
σ is measured from a temperature above the melting temperature of each DES.
Table 4.6 to 4.10 presents the experimental result of measured electrical conductivity
for some of the DESs listed in Table 4.1. The conductivity is found to have a consistent
trend of increasing with increasing temperature for DESs. This is an expected behaviour
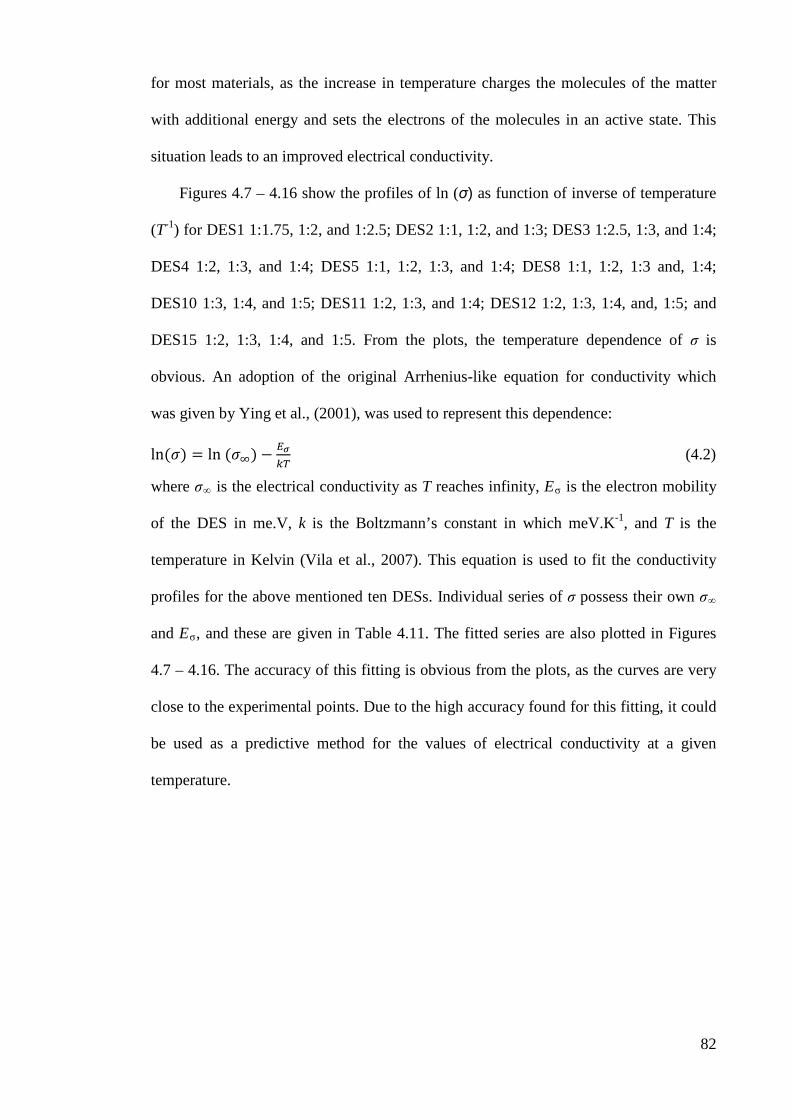
82
for most materials, as the increase in temperature charges the molecules of the matter
with additional energy and sets the electrons of the molecules in an active state. This
situation leads to an improved electrical conductivity.
Figures 4.7 – 4.16 show the profiles of ln (σ) as function of inverse of temperature
(T-1) for DES1 1:1.75, 1:2, and 1:2.5; DES2 1:1, 1:2, and 1:3; DES3 1:2.5, 1:3, and 1:4;
DES4 1:2, 1:3, and 1:4; DES5 1:1, 1:2, 1:3, and 1:4; DES8 1:1, 1:2, 1:3 and, 1:4;
DES10 1:3, 1:4, and 1:5; DES11 1:2, 1:3, and 1:4; DES12 1:2, 1:3, 1:4, and, 1:5; and
DES15 1:2, 1:3, 1:4, and 1:5. From the plots, the temperature dependence of σ is
obvious. An adoption of the original Arrhenius-like equation for conductivity which
was given by Ying et al., (2001), was used to represent this dependence:
ln(𝜎) = ln (𝜎∞) − 𝐸𝜎𝑘𝑇
(4.2)
where σ∞ is the electrical conductivity as T reaches infinity, Eσ is the electron mobility
of the DES in me.V, k is the Boltzmann’s constant in which meV.K-1, and T is the
temperature in Kelvin (Vila et al., 2007). This equation is used to fit the conductivity
profiles for the above mentioned ten DESs. Individual series of σ possess their own σ∞
and Eσ, and these are given in Table 4.11. The fitted series are also plotted in Figures
4.7 – 4.16. The accuracy of this fitting is obvious from the plots, as the curves are very
close to the experimental points. Due to the high accuracy found for this fitting, it could
be used as a predictive method for the values of electrical conductivity at a given
temperature.

83
Table 4.6: Experimental results of electrical conductivity (mS cm-1) for DESs 1 and 2 at different molar ratios.
T/K DES1 (1:1.75)
DES1 (1:2)
DES1 (1:2.5)
DES2 (1:1)
DES2 (1:2)
DES2 (1:3)
298.15 6.801 7.332 8.317 1.929 1.749 1.463 303.15 9.138 10.191 10.665 2.191 1.951 1.553 308.15 10.857 11.407 12.070 3.161 2.549 2.035 313.15 12.935 13.553 14.133 3.680 3.004 2.570 318.15 14.794 15.895 16.558 4.603 3.991 3.112 323.15 16.335 17.185 17.977 5.864 5.120 3.816 328.15 18.393 20.227 21.257 6.668 6.046 4.811 333.15 20.102 22.991 24.247 7.805 7.187 5.757 338.15 21.773 24.200 25.152 8.980 8.160 6.717 343.15 23.474 25.599 26.275 9.863 8.955 7.805 348.15 24.750 27.065 27.799 11.548 10.629 9.286 353.15 26.043 28.072 28.690 12.954 12.191 10.800
T-1(K-1)
0.0028 0.0029 0.0030 0.0031 0.0032 0.0033 0.0034
ln(σ
)
1.8
2.0
2.2
2.4
2.6
2.8
3.0
3.2
3.4
3.6
Figure 4.7 Electrical conductivity σ of DES1 1:1.75 (●), 1:2 (■), and 1:2.5 (▲) as a function of the inversed temperature. Curves represent fitting by Equation 4.2.
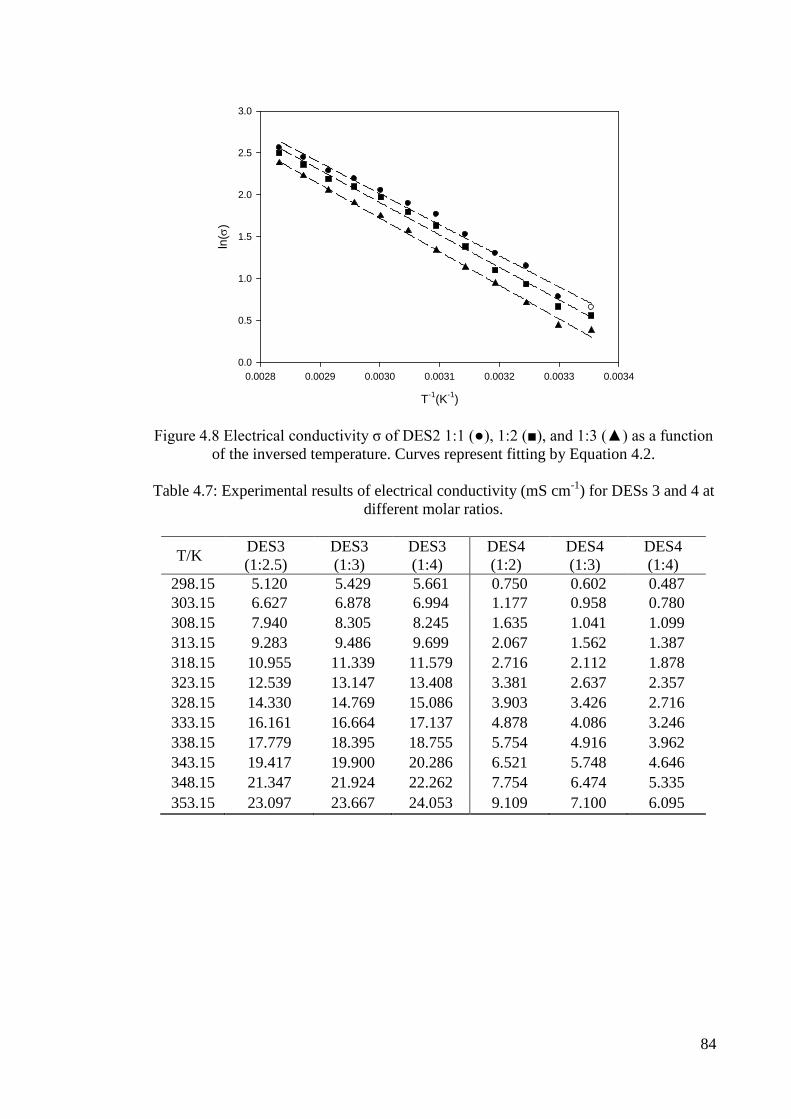
84
T-1(K-1)
0.0028 0.0029 0.0030 0.0031 0.0032 0.0033 0.0034
ln(σ
)
0.0
0.5
1.0
1.5
2.0
2.5
3.0
Figure 4.8 Electrical conductivity σ of DES2 1:1 (●), 1:2 (■), and 1:3 (▲) as a function of the inversed temperature. Curves represent fitting by Equation 4.2.
Table 4.7: Experimental results of electrical conductivity (mS cm-1) for DESs 3 and 4 at
different molar ratios.
T/K DES3 (1:2.5)
DES3 (1:3)
DES3 (1:4)
DES4 (1:2)
DES4 (1:3)
DES4 (1:4)
298.15 5.120 5.429 5.661 0.750 0.602 0.487 303.15 6.627 6.878 6.994 1.177 0.958 0.780 308.15 7.940 8.305 8.245 1.635 1.041 1.099 313.15 9.283 9.486 9.699 2.067 1.562 1.387 318.15 10.955 11.339 11.579 2.716 2.112 1.878 323.15 12.539 13.147 13.408 3.381 2.637 2.357 328.15 14.330 14.769 15.086 3.903 3.426 2.716 333.15 16.161 16.664 17.137 4.878 4.086 3.246 338.15 17.779 18.395 18.755 5.754 4.916 3.962 343.15 19.417 19.900 20.286 6.521 5.748 4.646 348.15 21.347 21.924 22.262 7.754 6.474 5.335 353.15 23.097 23.667 24.053 9.109 7.100 6.095
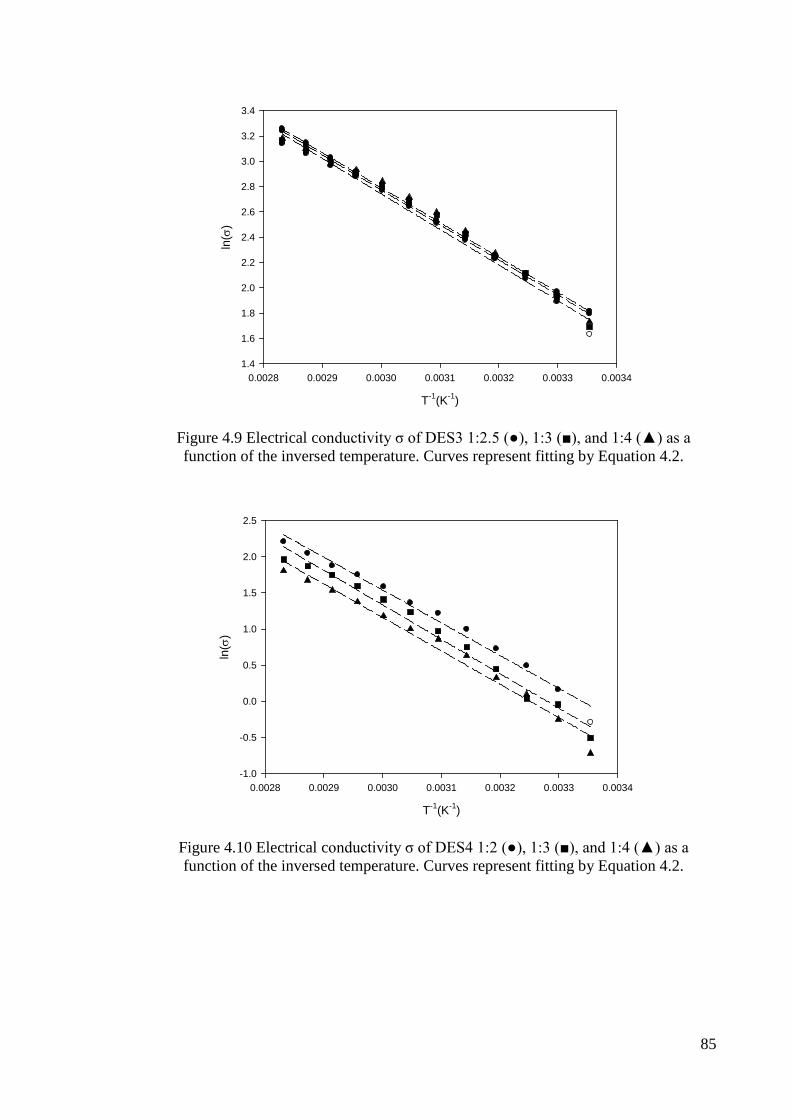
85
T-1(K-1)
0.0028 0.0029 0.0030 0.0031 0.0032 0.0033 0.0034
ln(σ
)
1.4
1.6
1.8
2.0
2.2
2.4
2.6
2.8
3.0
3.2
3.4
Figure 4.9 Electrical conductivity σ of DES3 1:2.5 (●), 1:3 (■), and 1:4 (▲) as a function of the inversed temperature. Curves represent fitting by Equation 4.2.
T-1(K-1)
0.0028 0.0029 0.0030 0.0031 0.0032 0.0033 0.0034
ln(σ
)
-1.0
-0.5
0.0
0.5
1.0
1.5
2.0
2.5
Figure 4.10 Electrical conductivity σ of DES4 1:2 (●), 1:3 (■), and 1:4 (▲) as a function of the inversed temperature. Curves represent fitting by Equation 4.2.

86
Table 4.8: Experimental results of electrical conductivity (mS cm-1) for DESs 5 and 8 at different molar ratios.
T/K DES5 (1:1)
DES5 (1:2)
DES5 (1:3)
DES5 (1:4)
DES8 (1:1)
DES8 (1:2)
DES8 (1:3)
DES8 (1:4)
328.15 0.574 0.481 0.325 0.212 0.512 0.376 0.345 0.316 348.15 1.548 1.418 1.216 0.959 1.852 1.717 1.180 0.929 373.15 2.403 2.235 1.861 1.116 3.267 2.877 2.468 2.060 393.15 3.518 3.348 2.730 1.948 4.360 3.845 3.453 2.770 408.15 4.779 4.631 3.780 2.270 5.200 4.723 4.105 3.170
T-1(K-1)
0.0024 0.0025 0.0026 0.0027 0.0028 0.0029 0.0030 0.0031
ln(σ
)
-2.0
-1.5
-1.0
-0.5
0.0
0.5
1.0
1.5
2.0
Figure 4.11 Electrical conductivity σ of DES5 1:1 (●), 1:2 (■), 1:3 (▲), and 1:4 (▼) as a function of the inversed temperature. Curves represent fitting by Equation 4.2.

87
T-1(K-1)
0.0024 0.0025 0.0026 0.0027 0.0028 0.0029 0.0030 0.0031
ln(σ
)
-1.5
-1.0
-0.5
0.0
0.5
1.0
1.5
2.0
Figure 4.12 Electrical conductivity σ of DES8 1:1 (●), 1:2 (■), 1:3 (▲), and 1:4 (▼) as a function of the inversed temperature. Curves represent fitting by Equation 4.2.
Table 4.9: Experimental results of electrical conductivity (mS cm-1) for DESs 10 and 11 at different molar ratios.
T/K DES10 (1:3)
DES10 (1:4)
DES10 (1:5)
DES11 (1:2)
DES11 (1:3)
DES11 (1:4)
298.15 1.092 1.557 1.942 0.062 0.103 0.116 303.15 1.598 2.193 2.570 0.124 0.172 0.198 308.15 1.914 2.649 3.103 0.186 0.319 0.370 313.15 2.502 3.246 3.845 0.277 0.394 0.410 318.15 2.964 3.858 4.437 0.405 0.549 0.607 323.15 3.265 4.405 5.072 0.496 0.719 0.816 328.15 4.307 5.395 6.279 0.701 0.927 0.965 333.15 5.129 6.221 7.110 0.858 1.124 1.233 338.15 5.797 7.423 8.169 1.160 1.487 1.608 343.15 6.723 8.192 9.496 1.493 1.778 1.971 348.15 7.372 9.074 10.31 1.811 2.196 2.874 353.15 8.114 10.027 11.196 2.154 2.599 3.594

88
T-1(K-1)
0.0028 0.0029 0.0030 0.0031 0.0032 0.0033 0.0034
ln(σ
)
0.0
0.5
1.0
1.5
2.0
2.5
3.0
Figure 4.13 Electrical Conductivity σ of DES10 1:3 (●), 1:4 (■), and 1:5 (▲) as a function of the inversed temperature. Curves represent fitting by Equation 4.2.
T-1(K-1)
0.0028 0.0029 0.0030 0.0031 0.0032 0.0033 0.0034
ln(σ
)
-3
-2
-1
0
1
2
Figure 4.14 Electrical conductivity σ of DES11 1:2 (●), 1:3 (■), and 1:4 (▲) as a function of the inversed temperature. Curves represent fitting by Equation 4.2.

89
Table 4.10: Experimental results of electrical conductivity (mS cm-1) for DESs 12 and 15 at different molar ratios.
T/K DES12 (1:2)
DES12 (1:3)
DES12 (1:4)
DES12 (1:5)
DES15 (1:2)
DES15 (1:3)
DES15 (1:4
DES15 (1:5)
353.15 0.101 0.124 0.152 0.175 0.330 0.363 0.417 0.465 363.15 0.257 0.377 0.493 0.601 0.406 0.440 0.518 0.597 373.15 0.387 0.550 0.733 0.860 0.471 0.524 0.608 0.680 393.15 0.650 0.840 1.086 1.302 0.602 0.716 0.822 0.964 408.15 0.930 1.150 1.379 1.707 0.768 0.911 1.081 1.351
T-1(K-1)
0.0024 0.0025 0.0026 0.0027 0.0028 0.0029
ln(σ
)
-2.5
-2.0
-1.5
-1.0
-0.5
0.0
0.5
1.0
Figure 4.15 Electrical conductivity σ of DES12 1:2 (●), 1:3 (■), 1:4 (▲), and 1:5 (▼) as a function of the inversed temp. Curves represent fitting by Equation 4.2.

90
T-1 (K-1)
0.0024 0.0025 0.0026 0.0027 0.0028 0.0029
ln (σ
)
5.6
5.8
6.0
6.2
6.4
6.6
6.8
7.0
7.2
7.4
Figure 4.16 Electrical conductivity σ of DES15 1:2 (●), 1:3 (■), 1:4 (▲), and 1:5 (▼)
as a function of the inversed temp. Curves represent fitting by Equation 4.2.
It can be observed from Figures 4.7 – 4.16 that the electrical conductivity for most
ammonium based DESs is higher than that for the corresponding phosphonium based
DESs. The maximum conductivity achieved in this research was for DES1 1:2.5 at
353.15 K which is 28.69 mS.cm-1. As expected the electrical conductivity of DESs
increased with increasing the salt concentration in the mixture. This can be attributed to
the increase of the number of charge-carriers in the solution. This behavior can be seen
in Tables 4.6, 4.7 and 4.8 for ammonium based DESs with glycerol or zinc chloride as
complexing agent, i.e. DESs 2, 4, 5, and 8. On the other hand, DESs 1 and 3 which are
composed of ammonium salt and ethylene glycol together with the phosphonium based
DESs, i.e. DESs 10, 11, 12, and 15, showed an opposite trend. At higher salt
concentrations in the DESs mixtures, the electrical conductivity was found to be
decreasing. This decrease could be due to the strong influence of ion pairs, ion triplets,
and higher ion aggregations that reduces the overall mobility and number of the
effective charge carriers.

91
Table 4.11: Values of σ∞ and Eσ for the fitting by Equation 4.2.
DES Ratio σ∞(ms.cm-1) Eσ(meV) 1 1:1.75 2.91×10+04 2.10×10+02 1 1:2 3.63×10+04 2.14×10+02 1 1:2.5 2.69×10+04 2.04×10+02 2 1:1 5.08×10+04 3.20×10+02 2 1:2 7.44×10+05 3.34×10+02 2 1:3 9.46×10+05 3.46×10+02 3 1:2.5 7.16×10+04 2.42×10+02 3 1:3 6.48×10+04 2.38×10+02 3 1:4 6.42×10+04 2.37×10+02 4 1:2 3.77×10+06 3.90×10+02 4 1:3 6.13×10+06 4.11×10+02 4 1:4 3.33×10+06 3.98×10+02 5 1:1 1.82×10+04 2.88×10+02 5 1:2 3.03×10+04 4.62×10+02 5 1:3 4.52×10+04 3.27×10+02 5 1:4 1.93×10+04 3.13×10+02 8 1:1 5.36×10+04 3.18×10+02 8 1:2 9.29×10+04 3.40×10+02 8 1:3 1.01×10+05 3.49×10+02 8 1:4 4.75×10+04 3.31×10+02 10 1:3 3.80×10+04 3.24×10+02 10 1:4 2.06×10+04 3.00×10+02 10 1:5 1.53×10+04 2.87×10+02 11 1:2 2.45×10+08 5.59×10+02 11 1:3 5.42×10+07 5.08×10+02 11 1:4 1.20×10+08 5.27×10+02 12 1:2 5.68×10+05 4.63×10+02 12 1:3 4.93×10+05 4.50×10+02 12 1:4 5.08×10+05 4.43×10+02 12 1:5 8.55×10+05 4.54×10+02 15 1:2 1.38×10+02 1.83×10+02 15 1:3 3.14×10+02 2.06×10+02 15 1:4 4.03×10+02 2.09×10+02 15 1:5 9.34×10+02 2.31×10+02
In general, the conductivities of the ammonium-based DESs are higher than those
of the phosphonium-based DESs. Together with the finding that ammonium-based
DESs possessed lower melting temperatures and lower viscosities than the
phosphonium-based DESs, it is more evident now that the production of sodium metal
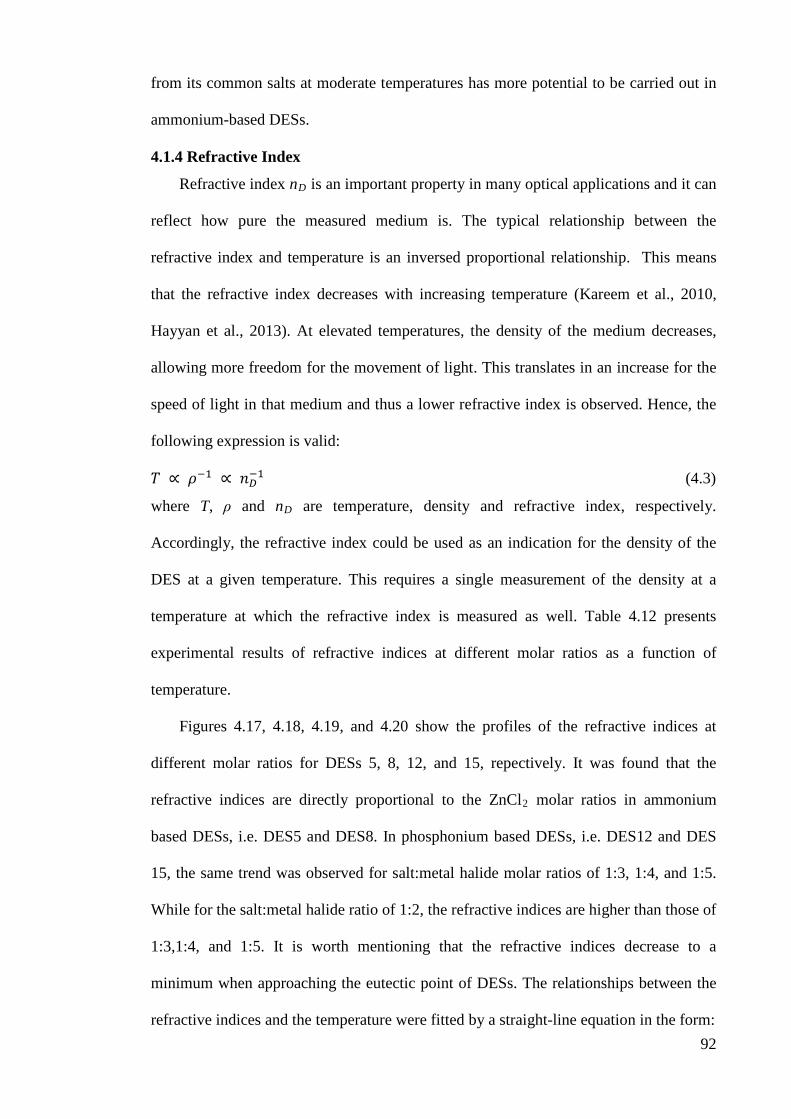
92
from its common salts at moderate temperatures has more potential to be carried out in
ammonium-based DESs.
4.1.4 Refractive Index
Refractive index nD is an important property in many optical applications and it can
reflect how pure the measured medium is. The typical relationship between the
refractive index and temperature is an inversed proportional relationship. This means
that the refractive index decreases with increasing temperature (Kareem et al., 2010,
Hayyan et al., 2013). At elevated temperatures, the density of the medium decreases,
allowing more freedom for the movement of light. This translates in an increase for the
speed of light in that medium and thus a lower refractive index is observed. Hence, the
following expression is valid:
𝑇 ∝ 𝜌−1 ∝ 𝑛𝐷−1 (4.3)
where T, ρ and nD are temperature, density and refractive index, respectively.
Accordingly, the refractive index could be used as an indication for the density of the
DES at a given temperature. This requires a single measurement of the density at a
temperature at which the refractive index is measured as well. Table 4.12 presents
experimental results of refractive indices at different molar ratios as a function of
temperature.
Figures 4.17, 4.18, 4.19, and 4.20 show the profiles of the refractive indices at
different molar ratios for DESs 5, 8, 12, and 15, repectively. It was found that the
refractive indices are directly proportional to the ZnCl2 molar ratios in ammonium
based DESs, i.e. DES5 and DES8. In phosphonium based DESs, i.e. DES12 and DES
15, the same trend was observed for salt:metal halide molar ratios of 1:3, 1:4, and 1:5.
While for the salt:metal halide ratio of 1:2, the refractive indices are higher than those of
1:3,1:4, and 1:5. It is worth mentioning that the refractive indices decrease to a
minimum when approaching the eutectic point of DESs. The relationships between the
refractive indices and the temperature were fitted by a straight-line equation in the form:

93
𝑛𝐷 = 𝑎 + 𝑏𝑇(𝐾) (4.4)
where a and b are fitting parameters which are different for each individual DES.
Table 4.12: Experimental refractive indices nD of DESs 5, 8, 12, and 15 at different molar ratios.
T/K DES5 T/K DES5 T/K DES5 T/K DES5 (1:1) (1:2) (1:3) (1:4)
339.15 1.5161 336.15 1.5371 333.15 1.5533 333.15 1.5683 340.15 1.5156 340.15 1.5358 339.15 1.5518 339.15 1.5668 346.15 1.5143 348.15 1.5337 344.15 1.5505 344.15 1.5655 351.15 1.5131 353.15 1.5325 349.15 1.5492 349.15 1.5642 359.15 1.5112 357.15 1.5312 353.15 1.5482 353.15 1.5632 362.15 1.5105 361.15 1.5301 358.15 1.5469 358.15 1.5619
362.15 1.5459 362.15 1.5609 T/K DES8 T/K DES8 T/K DES8 T/K DES8
(1:1) (1:2) (1:3) (1:4) 338.15 1.5106 338.15 1.513 331.15 1.5221 323.15 1.5304 348.15 1.5073 348.15 1.5103 338.15 1.5202 329.15 1.5292 353.15 1.5057 353.15 1.5092 348.15 1.5179 333.15 1.5279 358.15 1.5041 357.15 1.5082 358.15 1.5154 339.15 1.5264 363.15 1.5024 362.15 1.5073 362.15 1.5145 343.15 1.5255
348.15 1.5244
353.15 1.5229
359.15 1.5213 T/K DES12 T/K DES12 T/K DES12 T/K DES12
(1:2) (1:3) (1:4) (1:5) 348.15 1.5525 343.15 1.5205 343.15 1.5365 343.15 1.5412 353.15 1.5508 348.15 1.5185 348.15 1.5337 348.15 1.5384 358.15 1.5492 353.15 1.5169 353.15 1.5329 353.15 1.5369 362.15 1.5475 358.15 1.5153 358.15 1.5306 358.15 1.5353
362.15 1.5136 362.15 1.5291 362.15 1.5335 T/K DES15 T/K DES15 T/K DES15 T/K DES15
(1:2) (1:3) (1:4) (1:5) 343.15 1.5390 331.15 1.5068 331.15 1.5221 343.15 1.5355 348.15 1.5373 338.15 1.5050 338.15 1.5202 348.15 1.5338 353.15 1.5362 348.15 1.5027 348.15 1.5179 353.15 1.5327 358.15 1.5349 358.15 1.5002 358.15 1.5154 358.15 1.5314 362.15 1.5341 362.15 1.5001 362.15 1.5145 362.15 1.5306
Equation 4.4 was used to fit the refractive index values in Table 4.12. Table 4.13
shows the values of a and b for the fitted values.
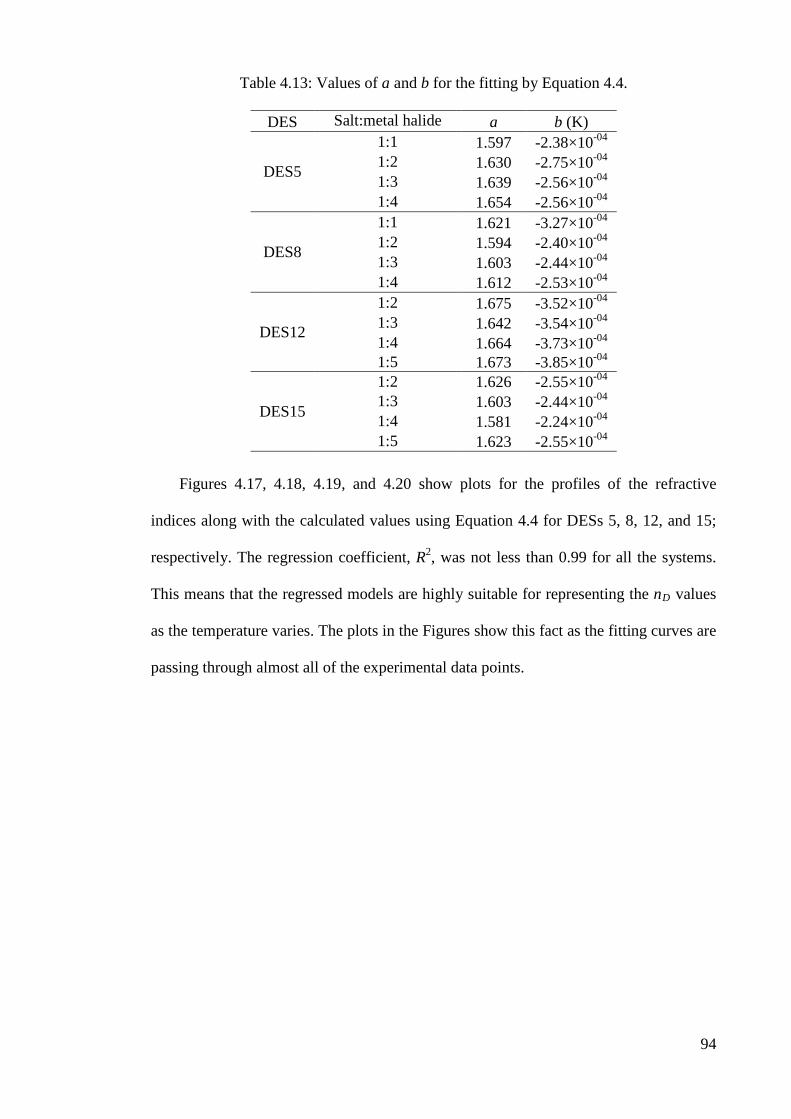
94
Table 4.13: Values of a and b for the fitting by Equation 4.4.
DES Salt:metal halide a b (K)
DES5
1:1 1.597 -2.38×10-04 1:2 1.630 -2.75×10-04 1:3 1.639 -2.56×10-04 1:4 1.654 -2.56×10-04
DES8
1:1 1.621 -3.27×10-04 1:2 1.594 -2.40×10-04 1:3 1.603 -2.44×10-04 1:4 1.612 -2.53×10-04
DES12
1:2 1.675 -3.52×10-04 1:3 1.642 -3.54×10-04 1:4 1.664 -3.73×10-04 1:5 1.673 -3.85×10-04
DES15
1:2 1.626 -2.55×10-04 1:3 1.603 -2.44×10-04 1:4 1.581 -2.24×10-04 1:5 1.623 -2.55×10-04
Figures 4.17, 4.18, 4.19, and 4.20 show plots for the profiles of the refractive
indices along with the calculated values using Equation 4.4 for DESs 5, 8, 12, and 15;
respectively. The regression coefficient, R2, was not less than 0.99 for all the systems.
This means that the regressed models are highly suitable for representing the nD values
as the temperature varies. The plots in the Figures show this fact as the fitting curves are
passing through almost all of the experimental data points.
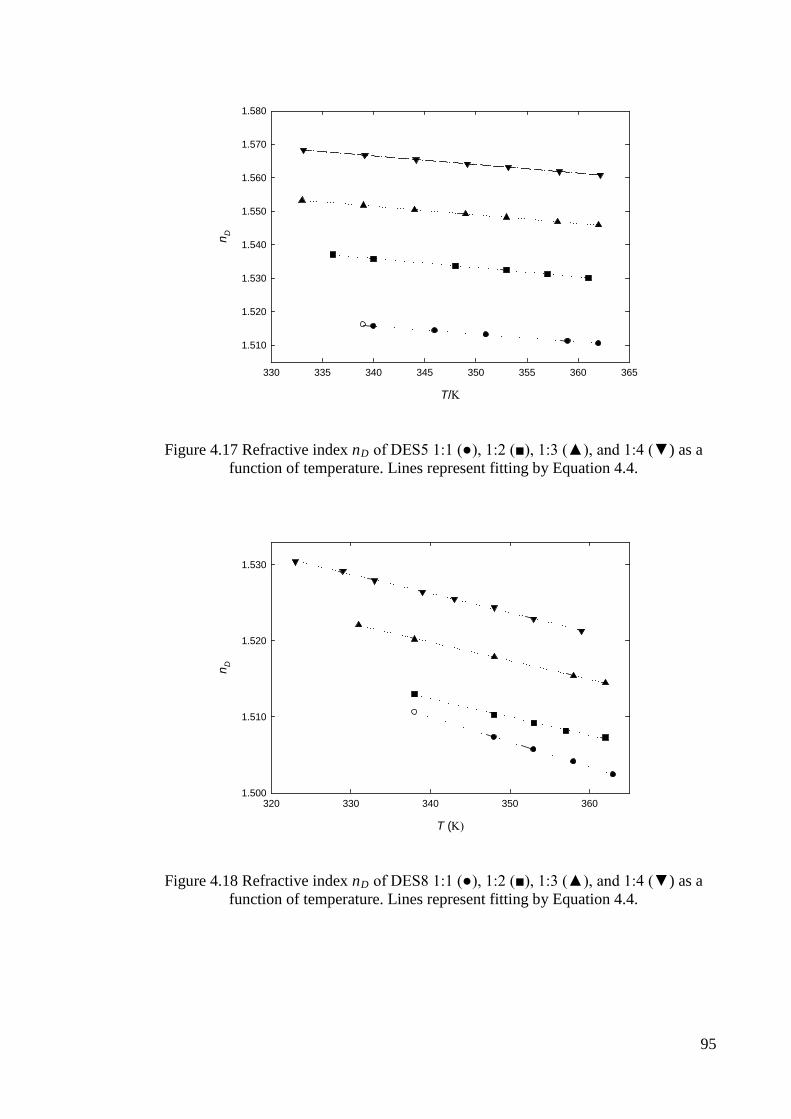
95
T/Κ
330 335 340 345 350 355 360 365
n D
1.510
1.520
1.530
1.540
1.550
1.560
1.570
1.580
Figure 4.17 Refractive index nD of DES5 1:1 (●), 1:2 (■), 1:3 (▲), and 1:4 (▼) as a function of temperature. Lines represent fitting by Equation 4.4.
T (Κ)
320 330 340 350 360
n D
1.500
1.510
1.520
1.530
Figure 4.18 Refractive index nD of DES8 1:1 (●), 1:2 (■), 1:3 (▲), and 1:4 (▼) as a function of temperature. Lines represent fitting by Equation 4.4.

96
T (Κ)
345 350 355 360
n D
1.510
1.520
1.530
1.540
1.550
Figure 4.19 Refractive index nD of DES12 1:2 (●), 1:3 (■), 1:4 (▲), and 1:5 (▼) as a function of temperature. Lines represent fitting by Equation 4.4.
T/Κ
330 335 340 345 350 355 360 365
n D
1.500
1.510
1.520
1.530
1.540
Figure 4.20 Refractive index nD of DES15 1:2 (●), 1:3 (■), 1:4 (▲), and 1:5 (▼) as a function of temperature. Lines represent fitting by Equation 4.4.
4.2 Solubility of Different Sodium Salts in ILs and DESs
Three important factors must be taken into account when choosing the proper
solvent for the production of sodium metal electrochemically. These are: i) the high
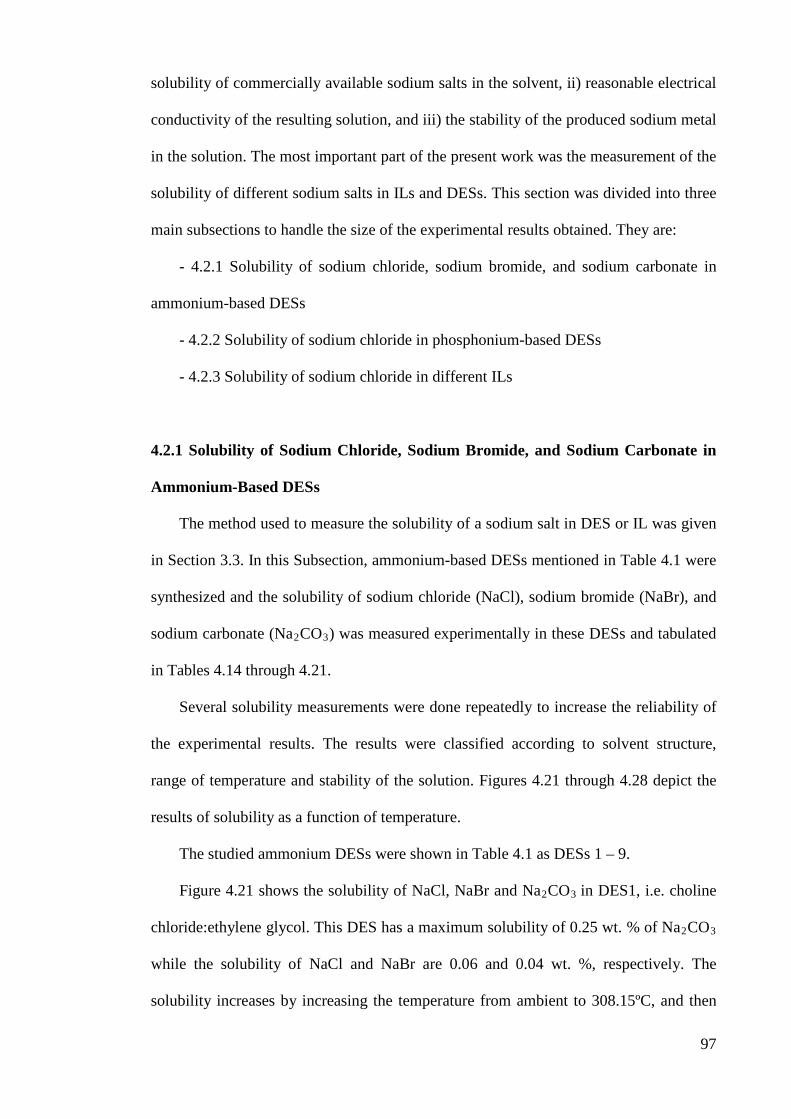
97
solubility of commercially available sodium salts in the solvent, ii) reasonable electrical
conductivity of the resulting solution, and iii) the stability of the produced sodium metal
in the solution. The most important part of the present work was the measurement of the
solubility of different sodium salts in ILs and DESs. This section was divided into three
main subsections to handle the size of the experimental results obtained. They are:
- 4.2.1 Solubility of sodium chloride, sodium bromide, and sodium carbonate in
ammonium-based DESs
- 4.2.2 Solubility of sodium chloride in phosphonium-based DESs
- 4.2.3 Solubility of sodium chloride in different ILs
4.2.1 Solubility of Sodium Chloride, Sodium Bromide, and Sodium Carbonate in
Ammonium-Based DESs
The method used to measure the solubility of a sodium salt in DES or IL was given
in Section 3.3. In this Subsection, ammonium-based DESs mentioned in Table 4.1 were
synthesized and the solubility of sodium chloride (NaCl), sodium bromide (NaBr), and
sodium carbonate (Na2CO3) was measured experimentally in these DESs and tabulated
in Tables 4.14 through 4.21.
Several solubility measurements were done repeatedly to increase the reliability of
the experimental results. The results were classified according to solvent structure,
range of temperature and stability of the solution. Figures 4.21 through 4.28 depict the
results of solubility as a function of temperature.
The studied ammonium DESs were shown in Table 4.1 as DESs 1 – 9.
Figure 4.21 shows the solubility of NaCl, NaBr and Na2CO3 in DES1, i.e. choline
chloride:ethylene glycol. This DES has a maximum solubility of 0.25 wt. % of Na2CO3
while the solubility of NaCl and NaBr are 0.06 and 0.04 wt. %, respectively. The
solubility increases by increasing the temperature from ambient to 308.15ºC, and then

98
slowly increasing to a temperature of 333.15 K. The slight decrease in solubility noticed
at 50oC for a number of cases can be neglected and considered as experimental error.
This is because it happened in certain cases but not in all. At temperatures higher than
333.15 K the DES started to lose ethylene glycol and thus became unstable. There is no
clear trend in the solubility of all three salts in DES1 with the change of salt:HBD molar
ratio.
Table 4.14: Solubility(wt%) of sodium chloride, sodium carbonate, and sodium bromide in DES1 at different temperatures.
T/K 1:1.75 1:2 1:2.25 1:2.5
NaCl
298.15 5.076×10-03 5.224×10-03 4.386×10-03 5.424×10-03 308.15 3.390×10-02 4.630×10-02 5.230×10-02 6.660×10-02 323.15 3.350×10-02 4.180×10-02 5.130×10-02 5.670×10-02 333.15 4.020×10-02 4.770×10-02 5.650×10-02 6.600×10-02
Na2CO3 298.15 3.090×10-02 1.570×10-02 1.250E-02 1.490E-02
308.15 2.159×10-02 1.621×10-02 1.469E-01 1.825E-01 323.15 2.246×10-02 1.504×10-02 1.442E-01 1.548E-01 333.15 2.486×10-02 1.755×10-02 1.620E-01 1.789E-01
NaBr 298.15 4.061E-03 4.701×10-02 3.114×10-02 1.190×10-02
308.15 2.710E-02 3.980×10-02 3.710×10-02 1.478×10-02 323.15 2.680E-02 3.520×10-02 3.640×10-02 1.176×10-02 333.15 3.220E-02 4.720×10-02 4.010×10-02 1.414×10-02
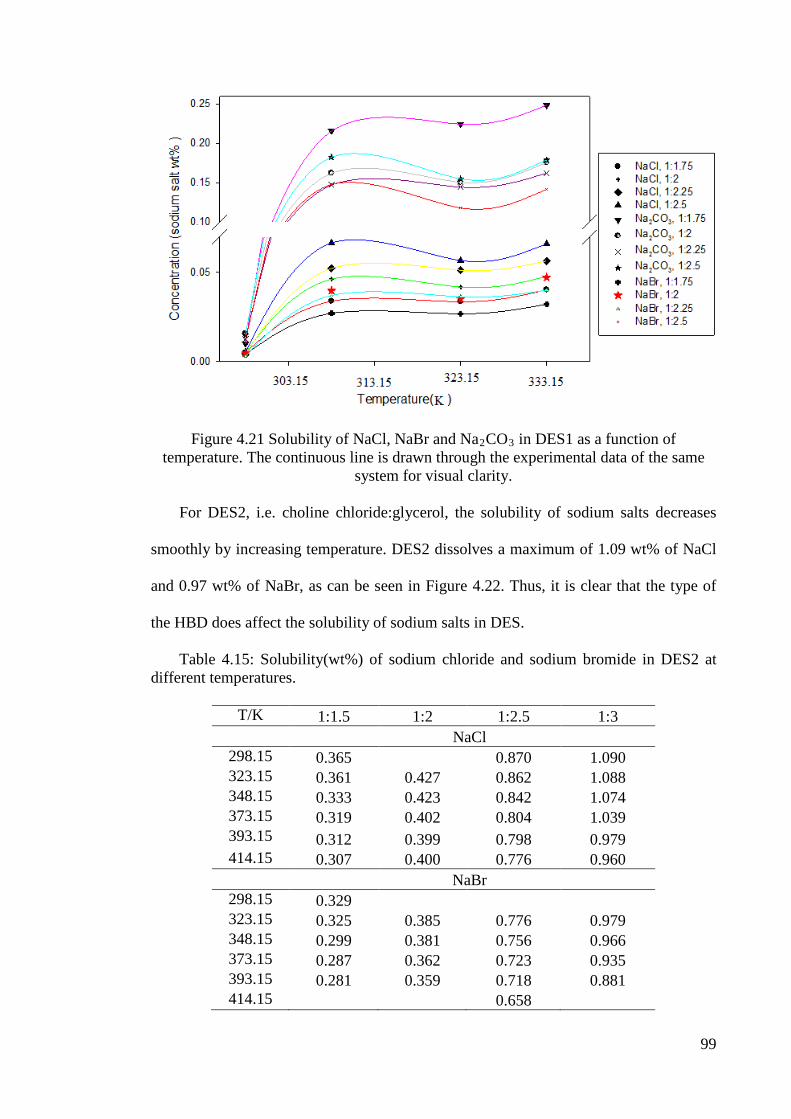
99
Figure 4.21 Solubility of NaCl, NaBr and Na2CO3 in DES1 as a function of temperature. The continuous line is drawn through the experimental data of the same
system for visual clarity.
For DES2, i.e. choline chloride:glycerol, the solubility of sodium salts decreases
smoothly by increasing temperature. DES2 dissolves a maximum of 1.09 wt% of NaCl
and 0.97 wt% of NaBr, as can be seen in Figure 4.22. Thus, it is clear that the type of
the HBD does affect the solubility of sodium salts in DES.
Table 4.15: Solubility(wt%) of sodium chloride and sodium bromide in DES2 at different temperatures.
T/K 1:1.5 1:2 1:2.5 1:3
NaCl 298.15 0.365
0.870 1.090
323.15 0.361 0.427 0.862 1.088 348.15 0.333 0.423 0.842 1.074 373.15 0.319 0.402 0.804 1.039 393.15 0.312 0.399 0.798 0.979 414.15 0.307 0.400 0.776 0.960
NaBr 298.15 0.329
323.15 0.325 0.385 0.776 0.979 348.15 0.299 0.381 0.756 0.966 373.15 0.287 0.362 0.723 0.935 393.15 0.281 0.359 0.718 0.881 414.15
0.658

100
Figure 4.22 Solubility profiles of NaCl and NaBr in DES2 as a function of temperature. NaCl series, for salt:HBD ratios 1:1.5 (●), 1:2 (○), 1:2.5 (♦) and 1:3 (◊). NaBr series,
for salt:HBD ratios 1:1.5 (▼), 1:2 (), 1:2.5 (▲) and 1:3 (Δ).
In order to investigate the effect of the salt used in the synthesis of the DES on the
solubility of sodium chloride, choline chloride was replaced by N,N-
diethylethanolammonium chloride with ethylene glycol as HBD, and this is designated
DES3. The maximum solubility of NaCl at 328.15 K was approximately 0.55 wt%.
This is higher than that for DES1, under the same conditions. The maximum solubility
of NaCl in DES3 was 1.15 wt% at 25ºC for the salt:HBD molar ratio of 1:4.
Surprisingly, the solubility of NaCl in DES3 decreased with an increase of temperature
and increased with an increase of the HBD molar ratio in the DES from 2.5 to 4, as
illustrated in Figure 4.23. The use of N,N- diethylethanolammonium chloride increased
the stability of the DES to much higher temperatures which enabled the measurement of
the solubility at temperatures up to 423.15 K.

101
Table 4.16: Solubility of sodium chloride in DES3 at different temperatures.
T/K 1:2.5 1:3 1:4 1:4.5
NaCl
298.15 0.442 0.529 1.044 1.153 323.15 0.399 0.524 0.980 1.066 348.15 0.366 0.509 0.950 1.061 373.15 0.319 0.494 0.860 0.989 398.15 0.278 0.442 0.804 0.886 423.15 0.213 0.407 0.700 0.800
Figure 4.23 Solubility profiles of NaCl in DES3 as a function of temperature. NaCl series, for salt:HBD ratios 1:2.5 (●), 1:3 (○), 1:4 (♦) and 1:4.5 (◊).
The solubility of NaCl in DES4 was 2.08 and 2.53 wt% at 298.15 K and 423.15 K,
respectively, as shown in Figure 4.24.
Table 4.17: Solubility of sodium chloride in DES4 at different temperatures.
T/K 1:2.5 1:3 1:4
NaCl
298.15 1.050 1.141 2.047 323.15 1.097 1.198 2.228 348.15 1.181 1.264 2.361 373.15 1.200 1.326 2.402 398.15 1.270 1.374 2.451 423.15 1.314 1.425 2.529
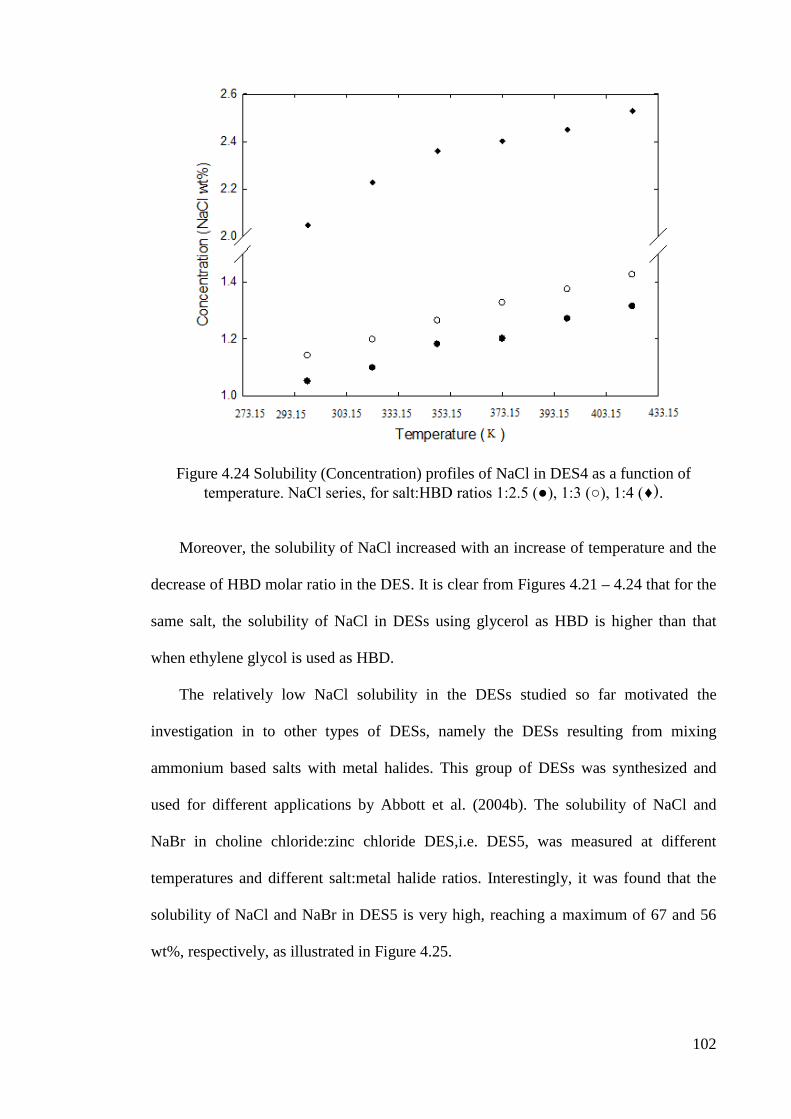
102
Figure 4.24 Solubility (Concentration) profiles of NaCl in DES4 as a function of temperature. NaCl series, for salt:HBD ratios 1:2.5 (●), 1:3 (○), 1:4 (♦).
Moreover, the solubility of NaCl increased with an increase of temperature and the
decrease of HBD molar ratio in the DES. It is clear from Figures 4.21 – 4.24 that for the
same salt, the solubility of NaCl in DESs using glycerol as HBD is higher than that
when ethylene glycol is used as HBD.
The relatively low NaCl solubility in the DESs studied so far motivated the
investigation in to other types of DESs, namely the DESs resulting from mixing
ammonium based salts with metal halides. This group of DESs was synthesized and
used for different applications by Abbott et al. (2004b). The solubility of NaCl and
NaBr in choline chloride:zinc chloride DES,i.e. DES5, was measured at different
temperatures and different salt:metal halide ratios. Interestingly, it was found that the
solubility of NaCl and NaBr in DES5 is very high, reaching a maximum of 67 and 56
wt%, respectively, as illustrated in Figure 4.25.
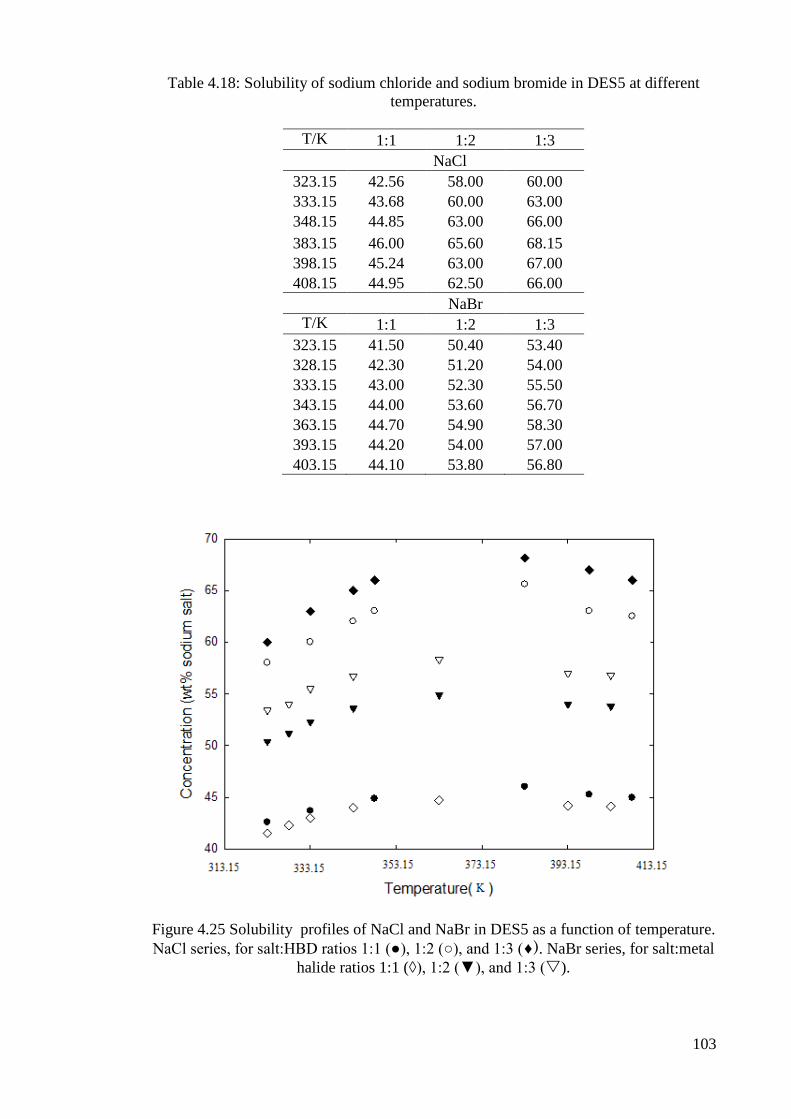
103
Table 4.18: Solubility of sodium chloride and sodium bromide in DES5 at different temperatures.
T/K 1:1 1:2 1:3
NaCl 323.15 42.56 58.00 60.00
333.15 43.68 60.00 63.00 348.15 44.85 63.00 66.00 383.15 46.00 65.60 68.15 398.15 45.24 63.00 67.00 408.15 44.95 62.50 66.00
NaBr
T/K 1:1 1:2 1:3 323.15 41.50 50.40 53.40 328.15 42.30 51.20 54.00 333.15 43.00 52.30 55.50 343.15 44.00 53.60 56.70 363.15 44.70 54.90 58.30 393.15 44.20 54.00 57.00 403.15 44.10 53.80 56.80
Figure 4.25 Solubility profiles of NaCl and NaBr in DES5 as a function of temperature. NaCl series, for salt:HBD ratios 1:1 (●), 1:2 (○), and 1:3 (♦). NaBr series, for salt:metal
halide ratios 1:1 (◊), 1:2 (▼), and 1:3 ().

104
Again, the solubility of NaBr is less than that of NaCl under the same conditions for all
ratios and temperatures. It is to be noted that the solubility of both NaCl and NaBr
increased with the increase of metal halide molar ratio. On the other hand, the solubility
increased with the increase of temperature up to a maximum temperature, and then it
started to decrease slowly. Special analytical techniques are to be employed in order to
understand this behaviour. Such techniques include the analysis by Fourier Transform
Infrared (FTIR), Nuclear Magnetic Resonance (NMR) and X-ray Diffraction (XRD).
The high solubility in the DES synthesised from an ammonium salt and a metal
halide instead of a typical HBD is very promising.
These significant finding led to the extension of the research into the utilization of
another metal halide, namely tin chloride, and the investigation into the solubility of
different sodium salts in the resulting DESs. DES6 in Table 4.1 is the result of mixing
choline chloride with tin chloride. Following the procedure described earlier, different
molar ratios were investigated. In Figure 4.26, the solubility of NaCl in DESs 5, 6 and 7
at 333.15 K is shown. From this, it can be inferred that the solubility of NaCl in tin
chloride-based DES, which is 2.07 wt %, is much lower than that in zinc chloride-based
DES. Both ZnCl2 and SnCl2 were used with choline chloride in the synthesis of DES7.
NaCl solubility in this DES at 333.15 K is included in Figure 4.26. It is approximately
4.27 wt%, which is again not as good as DES5. Thus, further investigation of NaCl’s
solubility at different temperatures in this DES was not carried out.
Table 4.19. Comparison of solubility of sodium chloride in DESs 5, 6, and 7 at 333.15
K.
DES and ratio Solubility DES5, 1:1 43.68 DES5, 1:2 60.00 DES5, 1:3 63.00 DES6, 1:3 2.08
DES7, 1:1:1 4.27

105
DES5,1:1 DES5,1:2 DES5,1:3 DES6,1:3 DES7,1:1:1
Con
cent
ratio
n (N
aCl w
t%)
0
2
4
40
50
60
70
Figure 4.26: Comparison of solubility (Concentration) of NaCl in DES5, 6 and 7 at 333.15 K.
Due to the high NaCl solubility in DES5, another ammonium salt, i.e. N,N-
diethylethanolammonium chloride, was chosen to synthesize a novel DES with zinc
chloride. This new DES was abbreviated as DES8. As in DES5, NaCl solubility profiles
with temperature showed two regions of increase and decrease, from 323.15 K to 358.15
K and from 358.15 K to 398.15 K, respectively, as illustrated in Figure 4.27. The
solubility of NaCl in DES8 has a maximum value of approximately 80 wt%. The NaCl
solubility in this DES increased when the metal halide’s molar ratio in this DES
increased from 1 to 3. However, the solubility decreased when the metal halide’s molar
ratio was further increased to 4. On the other hand, by approaching to the eutectic ratio
in DES8, solubility of NaCl in DES increased to its maximum point.
Following the study on the effect of metal halide on the solubility of NaCl, zinc
chloride was replaced by iron (II) chloride to give a new DES,i.e. DES9. Figure 4.28
shows the variation in NaCl solubility with temperature in DES9. A maximum
solubility of 10.8 wt% at 368.15 K was observed. On the other hand, for DES8 (1:3)
with the same salt, i.e. N,N-diethylethanolammonium chloride, but using zinc chloride

106
as the metal halide, 80 wt% of solubility was observed. Thus, no further investigation
was carried out on other salt:metal halide ratios of DES9.
Table 4.20: Solubility of sodium chloride in DES8 at different temperatures.
T/K 1:1 1:2 1:3 1:4 323.15 67.00 76.00 77.70 50.42 333.15 67.60 76.70 78.40 50.80 348.15 68.10 77.20 79.30 51.10 358.15 68.80 77.25 80.00 51.20 363.15 68.20 76.80 79.30 51.10 383.15 67.96 74.97 78.60 51.00 403.15 67.30 74.30 77.90 50.87
Figure 4.27 Solubility (Concentration) profiles of NaCl in DES8 as a function of temperature. NaCl series, for salt:metal halide ratios 1:1 (●), 1:2 (○), 1:3 (▲) and 1:4
(Δ).
Table 4.21. Solubility of sodium chloride in DES9 at different temperatures.
T(K) 1:3 317.15 3.57 328.15 4.72 350.15 10.21 368.15 10.40

107
Figure 4.28 Solubility profile of NaCl in DES9 (salt:metal halide molar ratio 1:3) as a function of temperature.
4.2.1.1 Stability of Sodium Metal in DESs 1 – 9
As expected, sodium metal reacted with DESs containing ethylene glycol and
glycerol as HBDs, i.e. DES1 to DES4. This is due to the presence of the hydroxyl group
in these HBDs, and the fact that sodium metal in its pure state reacts instantly with
oxygen, hydroxyl or halides (Banks, 1990). However, DESs synthesized from metal
halides, i.e. DES5 to DES9, were stable and did not react with the sodium metal. Even
though a halide group existed, it seems that the DES’s structure held it strongly and
prevented it from reacting. These results narrow down the search for a potential DES to
conduct the task of sodium metal production.
4.2.1.2 Solubility Modelling
The basic equation for predicting the saturation mole fraction of a solid in a liquid
is given by the general equation (Prausnitz et al., 1999, Sandler, 1999):
𝑙𝑛(𝑥1𝛾1) = −∆𝐻𝑓𝑢𝑠(𝑇𝑚)𝑅𝑇
�1 − 𝑇𝑇𝑚� − 1
𝑅𝑇 ∫ ∆𝐶𝑃𝑇𝑇𝑚
𝑑𝑇 + 1𝑅 ∫
∆𝐶𝑃𝑇
𝑇𝑇𝑚
𝑑𝑇 (4.5)

108
The subscript 1 denotes the solid solute, x1 and γ1 its molar composition (solubility at
equilibrium) and activity coefficient in the mixture, respectively. Tm is the melting
temperature of the solid. T is the temperature of the system at equilibrium. ΔHfus and
ΔCp are the respective enthalpy and heat capacity changes from the solid to the liquid
state of the solute.
Without introducing appreciable error, we can assume that ΔCp is independent of
temperature. Thus, equation 4.5 becomes:
𝑙𝑛(𝑥1) = − 𝑙𝑛 𝛾1 − �∆𝐻𝑓𝑢𝑠(𝑇𝑚)𝑅𝑇
�1 − 𝑇𝑇𝑚� + ∆𝐶𝑃
𝑅𝑇�1 − 𝑇𝑚
𝑇+ 𝑙𝑛 �𝑇𝑚
𝑇��� (4.6)
This equation can be used based on the assumption of simple eutectic mixtures with
complete miscibility in the liquid and immiscibility in the solid phases. However, due to
the lack of suitable data representing the difference in heat capacity (ΔCp) between the
solute in the two states, the simplified version of the solubility without the ΔCp term
was applied:
𝑙𝑛 𝑥1 = − 𝑙𝑛 𝛾1 − �∆𝐻𝑓𝑢𝑠(𝑇𝑟)𝑅𝑇
�1 − 𝑇𝑇𝑟�� (4.7)
where Tr is reduction
The expected error resulting from neglecting ΔCp usually depends on the
compound under consideration. For conventional molecular compounds, the error does
not exceed 2%.
If the liquid mixture is ideal, γ1 = 1 and the solubility can be computed from the
thermodynamic data (ΔHfus and ΔCp) for the solid species near the melting point. For
non-ideal solutions, γ1 must be estimated from either experimental data or liquid
solution models, such as NRTL or UNIFAC model.
The latent heat of fusion of pure sodium chloride and its melting temperature are
∆Hfus = 28.3 kJ/mol and Tm = 1073.95 K, respectively (Yamada et al, 1993).

109
The Non-Random Two Liquid (NRTL) model (Renon and Prausnitz, 1968) was
used to calculate the activity coefficient at equilibrium. This model has three
parameters, τij, τji and αij, for each pair of components in the multi-component mixture.
The model development was achieved by utilizing the Simulis® thermodynamics
environment which is a thermo-physical properties calculation server, provided by
ProSim (www.prosim.net, 2013). The deep eutectic solvent was considered as a pseudo
component. In the present work, we proposed the hypothesis that τij = τji and the non-
randomness parameter referred to as αij was taken equal to 0.20, a commonly used
value. The binary interaction parameters τij were estimated from the N experimental
data points at each temperature for NaCl with DES2, DES3, DES4 and DES5,
respectively. An iterative procedure was used for each temperature by minimizing the
squared relative error (criterion) between the calculated and the experimental
solubilities:
𝐶𝑟𝑖𝑡𝑒𝑟𝑖𝑜𝑛 = 1𝑁∑ �𝑥1
𝑒𝑥𝑝−𝑥1𝑐𝑎𝑙
𝑥1𝑒𝑥𝑝�2
𝑁 (4.8)
Linear temperature dependence was obtained for the binary interaction parameters
expressed by the following correlation:
𝜏𝑖𝑗 = 𝜏𝑖𝑗0 + 𝜏𝑖𝑗𝑇 . (𝑇 − 273.15) 𝑇/𝐾 (4.9)
The optimized parameters τij0 and τijT for each DES and the different molar ratios
are listed in Table 4.22. A comparison of the calculated values from the model with
experimental data is presented in Figure 4.29 for NaCl solubility in DES2, DES3, DES4
and DES5. The calculated solubilities by the model show a good agreement with
experimental measured solubilities.
It must be noted that the modeling procedure has been tested and validated for NaCl
with a number of DESs, but it could be easily applied to fit NaBr and Na2CO3
solubilities with other DESs, provided that the number of experimental data is
representative.

110
Tabble 4.22: NRTL binary interaction parameters between NaCl and DES2 to DES5 for different molar ratios (i ≡ NaCl and j ≡ DES).
τij0 τijT τij0 τijT τij0 τijT τij0 τijT DES2
1:1.5 1:2 1:2.5 1:3 -623.9 3.194 -647.3 2.767 -764.9 2.446 -829.6 2.368
DES3 1:2.5 1:3 1:4 1:4.5
-668.5 3.472 -698.9 2.987 -816.2 2.636 -849.5 2.569 DES4
1:2.5 1:3 1:4 - -785.3 1.709 -822.7 1.601 -1063.6 1.267 - -
DES5 1:1 1:2 1:3 -
-3718.9 -4.531 -4542.7 -10.282 -4847.4 -12.939 - -
DES 2
DES3
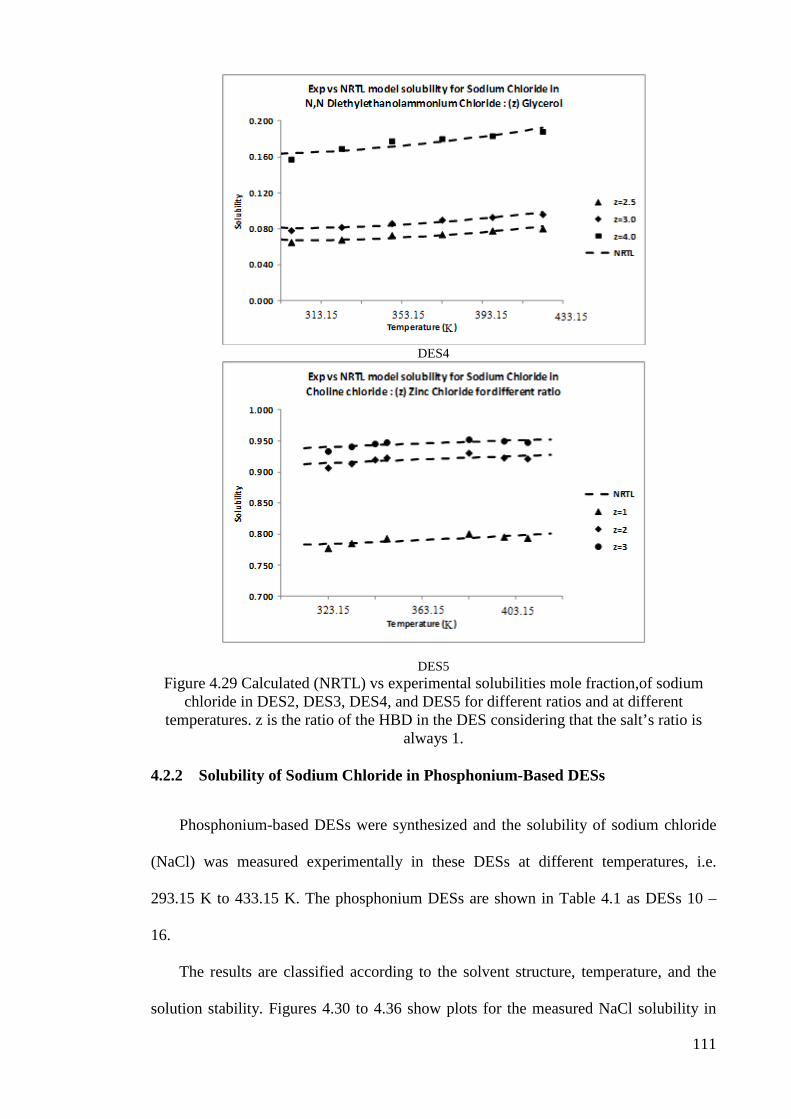
111
DES4
DES5 Figure 4.29 Calculated (NRTL) vs experimental solubilities mole fraction,of sodium
chloride in DES2, DES3, DES4, and DES5 for different ratios and at different temperatures. z is the ratio of the HBD in the DES considering that the salt’s ratio is
always 1.
4.2.2 Solubility of Sodium Chloride in Phosphonium-Based DESs
Phosphonium-based DESs were synthesized and the solubility of sodium chloride
(NaCl) was measured experimentally in these DESs at different temperatures, i.e.
293.15 K to 433.15 K. The phosphonium DESs are shown in Table 4.1 as DESs 10 –
16.
The results are classified according to the solvent structure, temperature, and the
solution stability. Figures 4.30 to 4.36 show plots for the measured NaCl solubility in
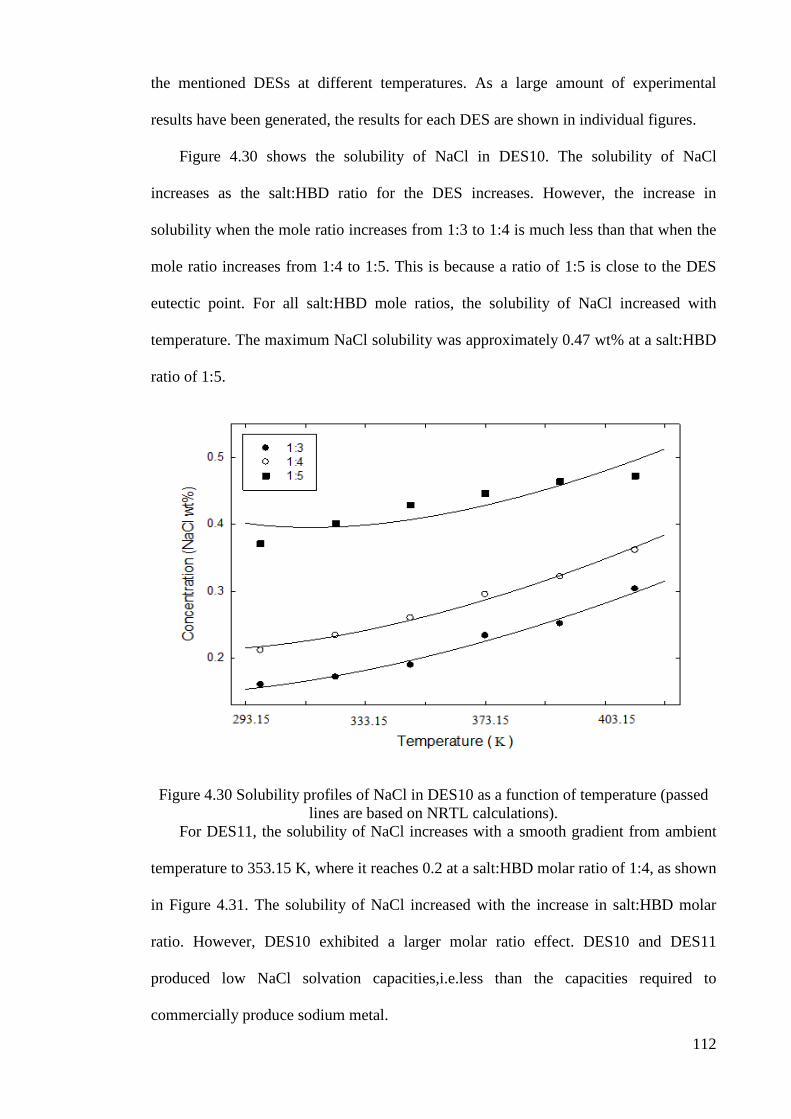
112
the mentioned DESs at different temperatures. As a large amount of experimental
results have been generated, the results for each DES are shown in individual figures.
Figure 4.30 shows the solubility of NaCl in DES10. The solubility of NaCl
increases as the salt:HBD ratio for the DES increases. However, the increase in
solubility when the mole ratio increases from 1:3 to 1:4 is much less than that when the
mole ratio increases from 1:4 to 1:5. This is because a ratio of 1:5 is close to the DES
eutectic point. For all salt:HBD mole ratios, the solubility of NaCl increased with
temperature. The maximum NaCl solubility was approximately 0.47 wt% at a salt:HBD
ratio of 1:5.
Figure 4.30 Solubility profiles of NaCl in DES10 as a function of temperature (passed lines are based on NRTL calculations).
For DES11, the solubility of NaCl increases with a smooth gradient from ambient
temperature to 353.15 K, where it reaches 0.2 at a salt:HBD molar ratio of 1:4, as shown
in Figure 4.31. The solubility of NaCl increased with the increase in salt:HBD molar
ratio. However, DES10 exhibited a larger molar ratio effect. DES10 and DES11
produced low NaCl solvation capacities,i.e.less than the capacities required to
commercially produce sodium metal.

113
Figure 4.31 Solubility profiles of NaCl in DES11 as a function of temperature (passed line is based on NRTL calculations).
The low NaCl solubility in these DESs could be attributed to the low
electronegativity of the DESs due to the use of neutral HBD as well as the presence of
alkyl groups in the neutral moleclules of HBDs which negatively affected the solubility
term. This prompted the investigation of NaCl solubility in other types of DESs.
Using metal halides as complexing agents instead of HBDs produces a unique type
of DES. Although metal halides cannot share hydrogen, they form a complex with
phosphonium salts and yield a different type of DES. This is the first time ever that this
type of DES was synthesised. Abbott et al. (2004b) produced a similar type of DES by
using ammonium salts instead of phosphonium salts. Zinc chloride (ZnCl2), zinc
bromide (ZnBr2), and iron(III) chloride (FeCl3) were used to synthesize DES12,
DES13, DES14, DES15, and DES16.
The solubility of NaCl in DES12 under different temperatures and salt:metal halide
ratios is shown in Figure 4.32. The solubility of NaCl in DES12 is higher than in
DES10 and DES11, reaching a maximum of 88.5 wt% at 383.15 K. The solubility
increased with temperature, reaching a maximum at 383.15 K. Figure 4.31 shows that
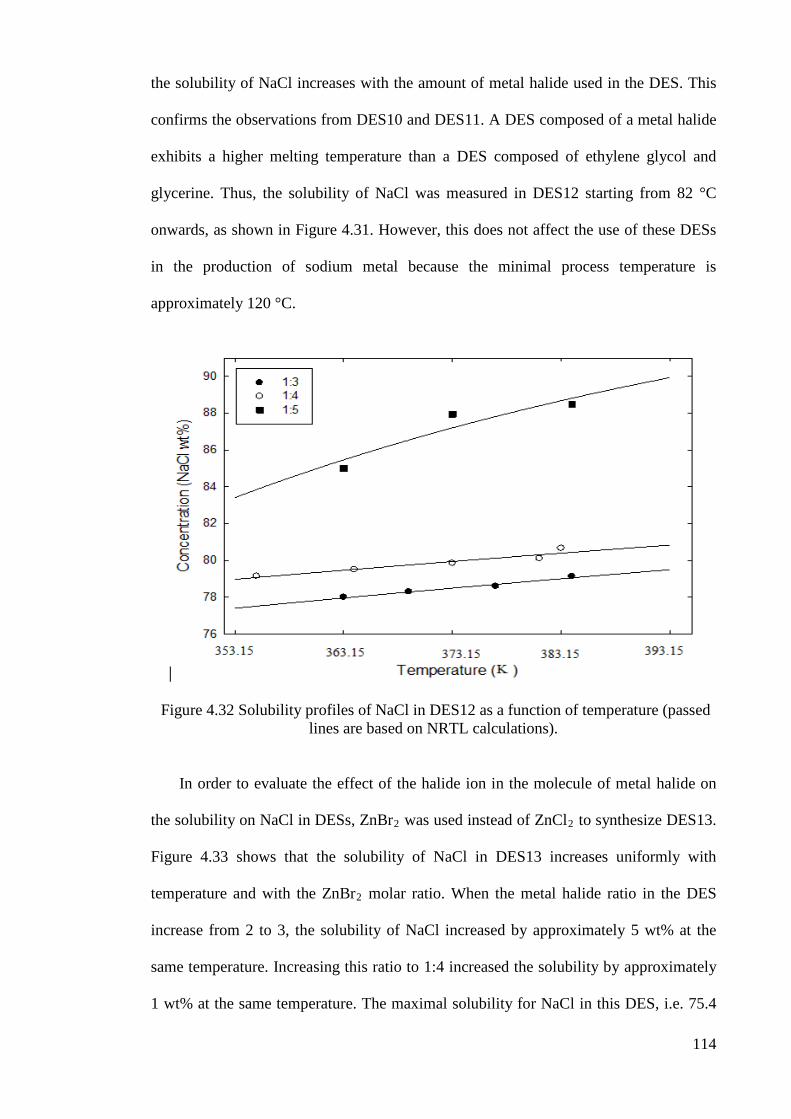
114
the solubility of NaCl increases with the amount of metal halide used in the DES. This
confirms the observations from DES10 and DES11. A DES composed of a metal halide
exhibits a higher melting temperature than a DES composed of ethylene glycol and
glycerine. Thus, the solubility of NaCl was measured in DES12 starting from 82 °C
onwards, as shown in Figure 4.31. However, this does not affect the use of these DESs
in the production of sodium metal because the minimal process temperature is
approximately 120 °C.
Figure 4.32 Solubility profiles of NaCl in DES12 as a function of temperature (passed lines are based on NRTL calculations).
In order to evaluate the effect of the halide ion in the molecule of metal halide on
the solubility on NaCl in DESs, ZnBr2 was used instead of ZnCl2 to synthesize DES13.
Figure 4.33 shows that the solubility of NaCl in DES13 increases uniformly with
temperature and with the ZnBr2 molar ratio. When the metal halide ratio in the DES
increase from 2 to 3, the solubility of NaCl increased by approximately 5 wt% at the
same temperature. Increasing this ratio to 1:4 increased the solubility by approximately
1 wt% at the same temperature. The maximal solubility for NaCl in this DES, i.e. 75.4
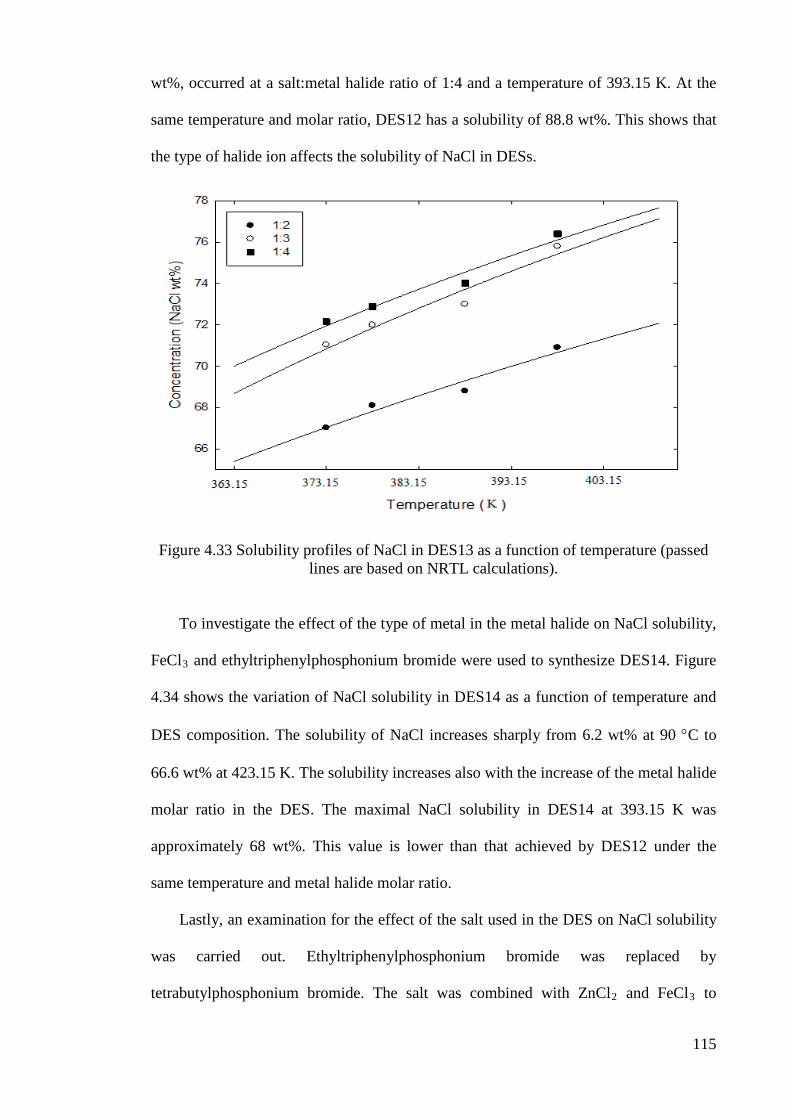
115
wt%, occurred at a salt:metal halide ratio of 1:4 and a temperature of 393.15 K. At the
same temperature and molar ratio, DES12 has a solubility of 88.8 wt%. This shows that
the type of halide ion affects the solubility of NaCl in DESs.
Figure 4.33 Solubility profiles of NaCl in DES13 as a function of temperature (passed lines are based on NRTL calculations).
To investigate the effect of the type of metal in the metal halide on NaCl solubility,
FeCl3 and ethyltriphenylphosphonium bromide were used to synthesize DES14. Figure
4.34 shows the variation of NaCl solubility in DES14 as a function of temperature and
DES composition. The solubility of NaCl increases sharply from 6.2 wt% at 90 °C to
66.6 wt% at 423.15 K. The solubility increases also with the increase of the metal halide
molar ratio in the DES. The maximal NaCl solubility in DES14 at 393.15 K was
approximately 68 wt%. This value is lower than that achieved by DES12 under the
same temperature and metal halide molar ratio.
Lastly, an examination for the effect of the salt used in the DES on NaCl solubility
was carried out. Ethyltriphenylphosphonium bromide was replaced by
tetrabutylphosphonium bromide. The salt was combined with ZnCl2 and FeCl3 to

116
synthesize DES15 and DES16, respectively. Figures 4.35 and 4.36 show the solubility
profiles of NaCl as a function of temperature in DES15 and DES16, respectively. As
expected, NaCl solubility increases with temperature and the metal halide ratio. DES15
and DES16 have lower NaCl solubilities than DES12 and DES14 at the same
temperature. DES15 has a higher NaCl solubility than DES16 under the same
conditions. This is similar to the findings for DES12 and DES14.
Figure 4.34 Solubility profiles of NaCl in DES14 as a function of temperature (passed lines are based on NRTL calculations).
Figure 4.35 Solubility profiles of NaCl in DES15 as a function of temperature (passed lines are based on NRTL calculations).
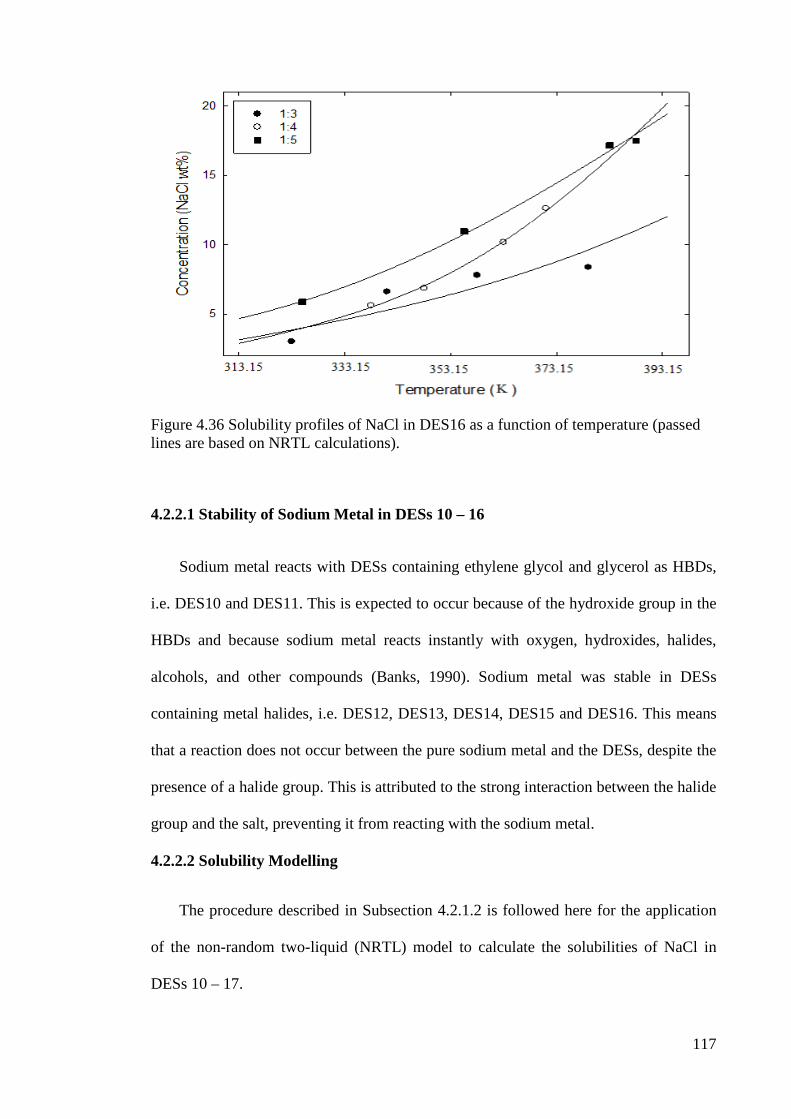
117
Figure 4.36 Solubility profiles of NaCl in DES16 as a function of temperature (passed lines are based on NRTL calculations).
4.2.2.1 Stability of Sodium Metal in DESs 10 – 16
Sodium metal reacts with DESs containing ethylene glycol and glycerol as HBDs,
i.e. DES10 and DES11. This is expected to occur because of the hydroxide group in the
HBDs and because sodium metal reacts instantly with oxygen, hydroxides, halides,
alcohols, and other compounds (Banks, 1990). Sodium metal was stable in DESs
containing metal halides, i.e. DES12, DES13, DES14, DES15 and DES16. This means
that a reaction does not occur between the pure sodium metal and the DESs, despite the
presence of a halide group. This is attributed to the strong interaction between the halide
group and the salt, preventing it from reacting with the sodium metal.
4.2.2.2 Solubility Modelling
The procedure described in Subsection 4.2.1.2 is followed here for the application
of the non-random two-liquid (NRTL) model to calculate the solubilities of NaCl in
DESs 10 – 17.

118
Table 4.23 shows the optimized parameters τij0 and τijT for each DES and different
molar ratios. For DES11, the unique interaction parameters, τij0 = 269.15 and τijT =
2.076, were regressed to fit the solubilities obtained in the DES regardless of the HBD
molar ratio. The calculated solubilities are plotted in Figures 4.30 – 4.36 as curves.
Excellent agreement between the experimental and calculated solubilities are obtained.
DES10 and DES15 exhibited a relationship between the binary interaction
parameters and the HBD or metal halide mole fraction in the DES. The remaining DESs
did not exhibit any clear trends.
Tables 4.24 – 4.30 show comparisons between the calculated solubilities by the
NRTL model and the experimental values with the percentage differences between the
values. The percentages were lower than 10% in most of the cases, indicating high
agreement between the calculated and experimental solubilities, except for the case of
DES16 where the percentages reached a maximum of 27.7% for 1:3 molar ratio.
Table 4.23: NRTL binary interaction parameters between NaCl and DES10, DES12 –
DES16 for different molar ratios (i ≡ DES and j ≡ NaCl).
DES10 τij0 τijT DES14 τij0 τijT 1:3 -423.3 2.964 1:3 6286.7 -76.059 1:4 -450.8 3.017 1:4 5925.4 -75.935 1:5 -517.6 3.147 1:5 3083.2 -57.074
DES12 τij0 τijT DES15 τij0 τijT 1:2 -4504.1 -12.378 1:3 -3431.3 -12.471 1:3 -4523.9 -12.075 1:4 -3565.2 -11.996 1:4 -3371.6 -30.060 1:5 -3649.9 -11.970
DES13 τij0 τijT DES16 τij0 τijT 1:2 -3677.1 -16.176 1:3 -576.1 -6.044 1:3 -3411.5 -20.541 1:4 147.1 -16.677 1:4 -3530.7 -19.687 1:5 -202.6 -14.970

119
Table 4.24: Comparison of NRTL and experimental solubilities of NaCl in DES10 at different molar ratios.
1:3 1:4 1:5
T/K exp. cal. Differ.(%) exp. cal. Differ.(%) exp. cal. Differ.(%)
298.15 0.160 0.156 2.56 0.212 0.217 2.74 0.371 0.399 7.55
323.15 0.172 0.173 0.99 0.234 0.233 0.47 0.402 0.396 1.37
348.15 0.190 0.197 3.69 0.260 0.257 1.27 0.429 0.407 5.08
473.15 0.234 0.225 3.55 0.295 0.287 2.61 0.446 0.428 3.95
498.15 0.252 0.259 3.14 0.322 0.324 0.56 0.464 0.458 1.19
523.15 0.303 0.298 1.65 0.361 0.366 1.36 0.472 0.496 4.95
Table 4.25: Comparison of NRTL and experimental solubilities of NaCl in DES11 at 1:3.5 molar ratio.
1:3.5
T/K exp. cal. Differ.(%)
298.15 0.026 0.025 3.846
308.15 0.037 0.039 3.876
333.15 0.112 0.103 8.438
353.15 0.190 0.198 3.991

120
Table 4.26: Comparison of NRTL and experimental solubilities of NaCl in DES12 at different molar ratios.
1:2 1:3 1:4 T(K) exp. cal. Differ.(%) T(K) exp. cal. Differ.(%) T(K) exp. cal. Differ.(%)
363.15 78 77.97 0.043 355.15 79.15 79.079 0.089 363.15 85 85.47 0.551 369.15 78.3 78.29 0.130 364.15 79.5 79.52 0.025 373.15 87.95 87.21 0.236 377.15 78.6 78.71 0.136 373.15 79.85 79.946 0.120 384.15 88.5 88.82 0.355 384.15 79.13 79.06 0.087 381.15 80.1 80.311 0.264
383.15 80.66 80.401 0.321
Table 4.27: Comparison of NRTL and experimental solubilities of NaCl in DES13 at different molar ratios.
1:3 1:4 1:5 T(°C) exp. cal. Differ.(%) exp. cal. Differ.(%) exp. cal. Differ.(%)
373.15 67.02 67.04 0.030 71.03 70.84 0.267 72.16 71.94 0.305
378.15 68.1 67.82 0.411 72 71.84 0.222 72.88 72.85 0.041
388.15 68.8 69.3 0.727 73 73.72 0.986 74.02 74.56 0.730
398.15 70.9 70.67 0.324 75.8 75.43 0.488 76.4 76.11 0.380
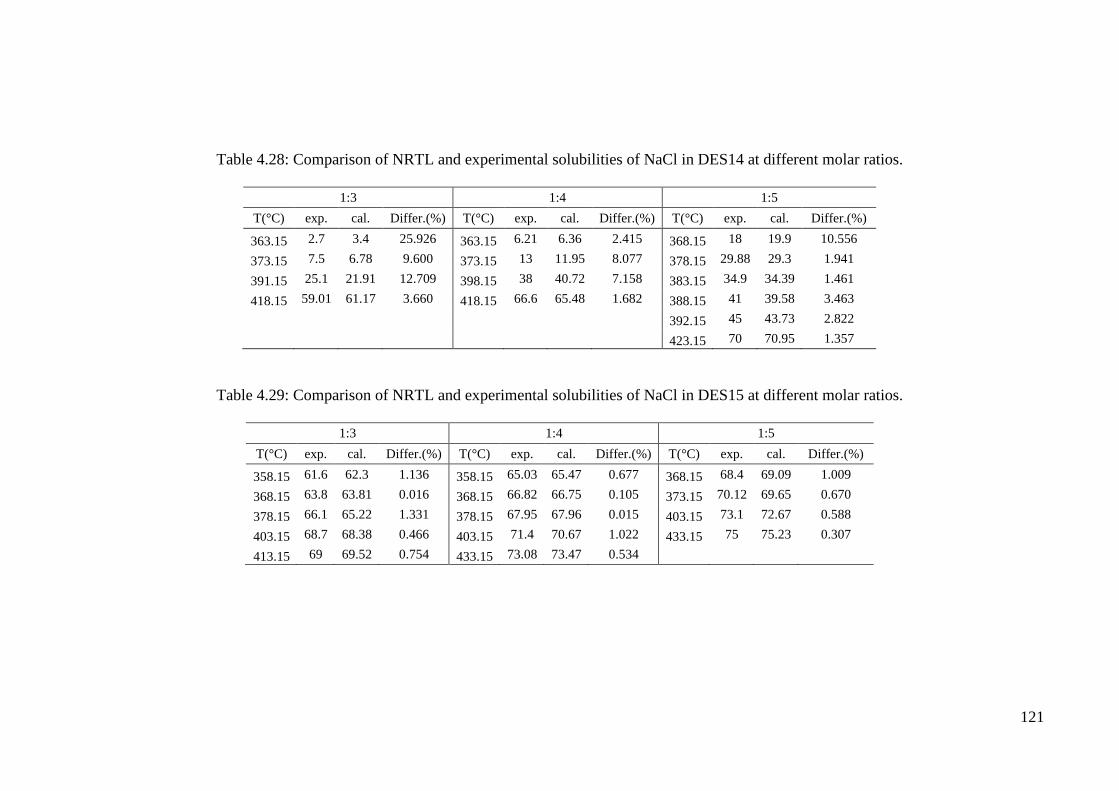
121
Table 4.28: Comparison of NRTL and experimental solubilities of NaCl in DES14 at different molar ratios.
1:3 1:4 1:5 T(°C) exp. cal. Differ.(%) T(°C) exp. cal. Differ.(%) T(°C) exp. cal. Differ.(%)
363.15 2.7 3.4 25.926 363.15 6.21 6.36 2.415 368.15 18 19.9 10.556
373.15 7.5 6.78 9.600 373.15 13 11.95 8.077 378.15 29.88 29.3 1.941
391.15 25.1 21.91 12.709 398.15 38 40.72 7.158 383.15 34.9 34.39 1.461
418.15 59.01 61.17 3.660 418.15 66.6 65.48 1.682 388.15 41 39.58 3.463
392.15 45 43.73 2.822
423.15 70 70.95 1.357
Table 4.29: Comparison of NRTL and experimental solubilities of NaCl in DES15 at different molar ratios.
1:3 1:4 1:5 T(°C) exp. cal. Differ.(%) T(°C) exp. cal. Differ.(%) T(°C) exp. cal. Differ.(%)
358.15 61.6 62.3 1.136 358.15 65.03 65.47 0.677 368.15 68.4 69.09 1.009
368.15 63.8 63.81 0.016 368.15 66.82 66.75 0.105 373.15 70.12 69.65 0.670
378.15 66.1 65.22 1.331 378.15 67.95 67.96 0.015 403.15 73.1 72.67 0.588
403.15 68.7 68.38 0.466 403.15 71.4 70.67 1.022 433.15 75 75.23 0.307
413.15 69 69.52 0.754 433.15 73.08 73.47 0.534

122
Table 4.30: Comparison of NRTL and experimental solubilities of NaCl in DES16 at different molar ratios.
1:3 1:4 1:5 T(°C) exp. cal. Differ.(%) T(°C) exp. cal. Differ.(%) T(°C) exp. cal. Differ.(%)
323.15 3.03 3.87 27.723 338.15 5.61 5.51 1.783 325.15 5.88 5.95 1.190
341.15 6.61 5.29 19.970 348.15 6.88 7.05 2.471 355.65 10.96 10.76 1.825
358.15 7.8 6.95 10.897 363.15 10.18 10.26 0.786 383.15 17.16 16.78 2.214
379.15 8.37 9.64 15.173 371.15 12.62 12.45 1.347 388.15 17.5 17.98 2.743
377.15 17.25 14.29 17.159

123
4.2.3 Solubility of Sodium Chloride in Different ILs
Table 4.2 summarized the names and chemical structures of the sixteen ILs
investigated. Experimental solubilities of NaCl in these ILs are listed in Table 4.31 and
illustrated in Figures 4.37 to 4.40.
Table 4.31: Experimental solubilities of NaCl in studied ILs.
[emim][EtSO4] [emim][MeSO3] [emim][DMP] [edmi][Cl] T / K s / wt% T / K s / wt% T / K s / wt% T / K s / wt%
298.15 0.56 298.15 0.33 303.15 0.67 378.15 0.2
333.15 0.74 333.15 0.52 323.15 2.55 389.15 0.22
358.15 1.11 358.15 0.71 342.15 2.97 398.15 0.26
378.15 1.27 378.15 1.31 359.15 3.66 408.15 0.33
383.15 1.30 383.15 2.18 368.15 3.73 298.15 2.34 378.15 4.67 388.15 6.28 398.15 8.96 [bmim][Cl] [bmim][DCA] [bmim][TfO] [bmim][BF4]
T / K s / wt% T / K s / wt% T / K s / wt% T / K s / wt%
348.15 0.07 303.15 0.37 298.15 0.02 303.15 0.05
383.15 0.10 333.15 0.38 333.15 0.03 333.15 0.07
396.15 0.14 363.15 0.40 358.15 0.04 363.15 0.09
408.15 0.16 393.15 0.45 378.15 0.05 393.15 0.11
423.15 0.22 423.15 0.50 383.15 0.05 423.15 0.14 [bmim][Tf2N] [C8mim][Cl] [bmp][DCA] [bmp][TfA]
T / K s / wt% T / K s / wt% T / K s / wt% T / K s / wt%
298.15 0.02 363.15 1.28 298.15 0.22 303.15 0.59
323.15 0.02 373.15 1.96 318.15 0.26 333.15 0.62
353.15 0.03 383.15 2.63 348.15 0.30 363.15 0.68
385.15 0.03 393.15 3.38 393.15 0.39 393.15 0.71
390.15 0.03 403.15 3.94 423.15 0.74
403.15 0.05 363.15 [bmpyr][CF3SO3] [bmpy][DCA] [bmpy][MSO4] [EtOHNMe3][Me2PO4]
T / K s / wt% T / K s / wt% T / K s / wt% T / K s / wt%
303.15 0.08 303.15 0.71 298.15 0.27 298.15 1.21
333.15 0.08 333.15 0.74 318.15 0.35 313.15 1.70
363.15 0.08 363.15 0.81 345.35 0.42 333.15 1.81
393.15 0.09 393.15 0.86 373.15 0.53 348.15 2.06
423.15 0.09 423.15 0.89 363.15 2.37
379.15 3.34
Figure 4.37 shows the results of NaCl solubility in several imidazolium-based ILs at
different temperatures. The solubility of NaCl in the ILs increased with temperature, and

124
different ILs showed different solubility profile trends. The IL structure affected these
trends. For instance, IL2, IL3, and IL10 exhibited a sharp increase in NaCl solubility
with increasing temperature whereas IL4, IL5, IL8, and IL9 exhibited the lowest NaCl
solubilities of the imidazolium ILs. The NaCl solubility in these ILs did not exceed 0.05
wt% at all temperatures. One of the factors that affect NaCl solubility is the type of
anion of the IL. IL3 which composes a dimethylphosphate anion provided the highest
NaCl solubility of 8.96 wt% at 398.15 K. These findings confirm the data available in
the literature (AlNashef, 2001). AlNashef (2001) examined the solubility of NaCl in
dimethylimidazolium dimethylphosphate, concluding that its solubility increases with
temperature, similar to the results illustrated in Figure 4.37.
Figure 4.37 Experimental solubility (Concentration) of NaCl in imidazolium-based ILs. (∆) IL1, (ᴏ) IL2, (□) IL3, () IL4, () IL5, (▲) IL6, () IL7, (■)IL8, () IL9, ()
IL10.
The results from this study and from AlNashef show that the dimethylphosphate
anion significantly increases the solubility of NaCl in ILs. Substituents on the
imidazolium cation can also affect the solubility of NaCl in ILs. This is reflected by IL5
and IL10. The IL5 cation has a butyl group and produces a NaCl solubility of 0.098 wt%
at 110 °C. IL10 has an octyl group instead of the butyl group and produces a NaCl

125
solubility of 2.629 wt% at 383.15 K. It can be explained by the strength of C/H bond in
IL10 which is more than in IL5 (Yu et al., 2008); Therefore, it significantly affects the
Cl- ion from NaCl. The mutual electro negativity item in IL10 is more obvious than in
IL5.
The effect of changing the anion on NaCl solubility in imidazolium-based ILs was
also investigated. The ethylsulfate anion in IL1 was replaced by a methanesulfonate
anion in IL2 and a dimethylphosphate anion in IL3. The NaCl solubilities in these ILs
were compared at 358.15 K. The solubility increased from approximately 1.102 wt% in
IL1 and 0.982 wt% in IL2 to 3.66 wt% in IL3. Figure 4.30 shows that imidazolium-
based ILs with a 1-butyl-3-methyl group in the cation resulted in low solubility, i.e. less
than 0.5 wt%.
Figure 4.38 shows an assessment of NaCl solubility in pyrrolidinium-based ILs. It
shows that solubility is directly proportional to temperature.
Figure 4.38 Experimental solubility (Concentration) of NaCl in pyrrolidinium-based ILs. (∆) IL11, (ᴏ) IL12, (□) IL13.
To determine the effects of anions on NaCl solubility, the dicyanamide anion in
IL11 was replaced with a triflouroacetate and trifluoromethanesulfonate anions in IL12
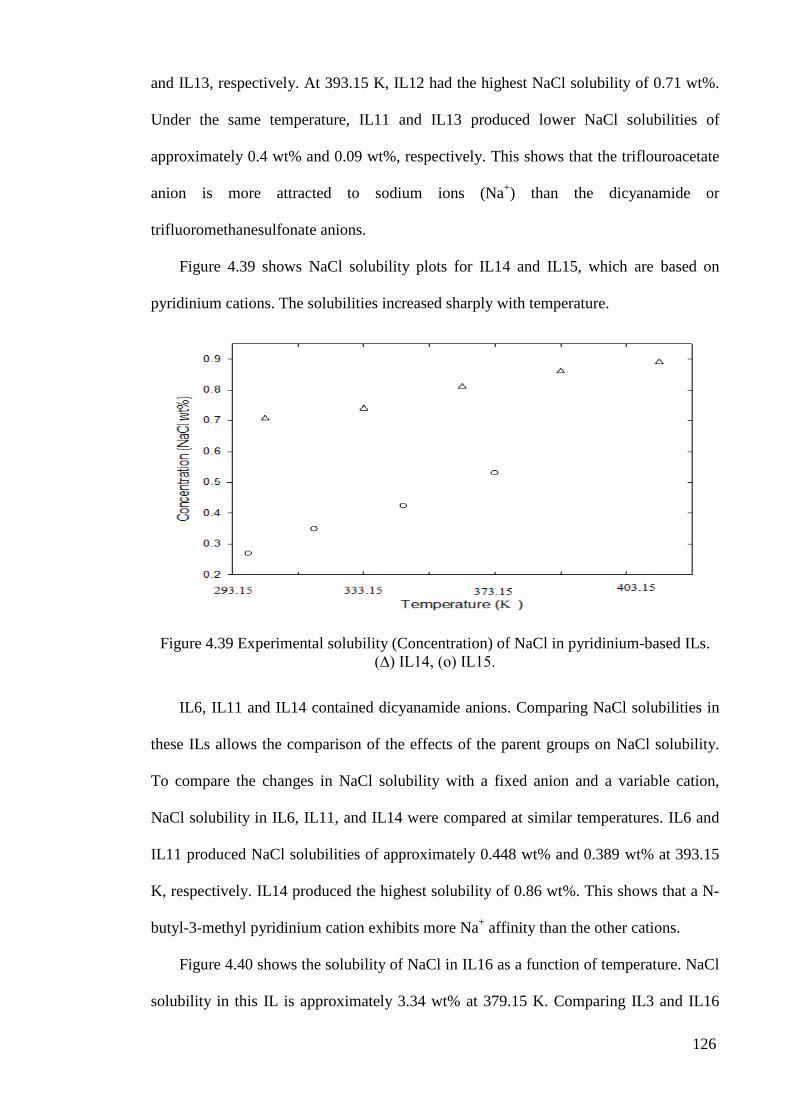
126
and IL13, respectively. At 393.15 K, IL12 had the highest NaCl solubility of 0.71 wt%.
Under the same temperature, IL11 and IL13 produced lower NaCl solubilities of
approximately 0.4 wt% and 0.09 wt%, respectively. This shows that the triflouroacetate
anion is more attracted to sodium ions (Na+) than the dicyanamide or
trifluoromethanesulfonate anions.
Figure 4.39 shows NaCl solubility plots for IL14 and IL15, which are based on
pyridinium cations. The solubilities increased sharply with temperature.
Figure 4.39 Experimental solubility (Concentration) of NaCl in pyridinium-based ILs. (∆) IL14, (ᴏ) IL15.
IL6, IL11 and IL14 contained dicyanamide anions. Comparing NaCl solubilities in
these ILs allows the comparison of the effects of the parent groups on NaCl solubility.
To compare the changes in NaCl solubility with a fixed anion and a variable cation,
NaCl solubility in IL6, IL11, and IL14 were compared at similar temperatures. IL6 and
IL11 produced NaCl solubilities of approximately 0.448 wt% and 0.389 wt% at 393.15
K, respectively. IL14 produced the highest solubility of 0.86 wt%. This shows that a N-
butyl-3-methyl pyridinium cation exhibits more Na+ affinity than the other cations.
Figure 4.40 shows the solubility of NaCl in IL16 as a function of temperature. NaCl
solubility in this IL is approximately 3.34 wt% at 379.15 K. Comparing IL3 and IL16

127
which are both having the dimethylphosphate anion, it is noticed that NaCl solubility in
IL3 is higher than that in IL16. However, the difference in solubility is not significant.
This may be attributed to the difference in the cation. It can therefore be concluded that
the presence of dimethylphosphate anion in the IL increases its ability to dissolve NaCl.
It is to be noted that the highest NaCl solubility achieved was in IL3 which has the
dimethylphosphate anion with imidazolium-based cation.
Figure 4.40 Experimental solubility of NaCl in IL16 (∆).
4.2.3.1 Solubility Modelling
Solubility modelling in ILs is different from the one shown for DESs. Taking the same
equation presented in Subsection 4.2.1.2, the basic equation for calculating the
saturation mole fraction of a solid in a liquid is:
𝑙𝑛(𝑥1𝛾1) = −∆𝐻𝑓𝑢𝑠(𝑇𝑚)𝑅𝑇
�1 − 𝑇𝑇𝑚� − 1
𝑅𝑇 ∫ ∆𝐶𝑃𝑇𝑇𝑚
𝑑𝑇 + 1𝑅 ∫
∆𝐶𝑃𝑇
𝑇𝑇𝑚
𝑑𝑇 (4.5)
where subscript 1 is the solid solute; x1 and γ1 are its molar composition (solubility at
equilibrium) and activity coefficient in the mixture, respectively. Tm is the melting point
temperature; T is the temperature of the system at equilibrium; and ∆Hfus and ∆𝐶𝑃 are the
enthalpy and heat capacity changes when the solute changes from a solid to a liquid
state, respectively.

128
Two approximations were made without introducing appreciable error. The first
assumption is that ∆𝐶𝑃 is independent of temperature. Therefore, Equation (4.5) is
simplified to:
𝑙𝑛(𝑥1𝛾1) = −�∆𝐻𝑓𝑢𝑠(𝑇𝑚)𝑅𝑇
�1 − 𝑇𝑇𝑚� + ∆𝐶𝑃
𝑅𝑇�1 − 𝑇𝑚
𝑇+ 𝑙𝑛 �𝑇𝑚
𝑇��� (4.10)
Because the melting temperature Tm at any pressure and the triple point temperature
Tr are only slightly different for most solids, Equation (4.10) can be rewritten as
Equation (4.11) below:
𝑙𝑛 𝑥1 = − 𝑙𝑛 𝛾1 − �∆𝐻𝑓𝑢𝑠(𝑇𝑟)𝑅𝑇
�1 − 𝑇𝑇𝑟� + ∆𝐶𝑃
𝑅𝑇�1 − 𝑇𝑟
𝑇+ 𝑙𝑛 �𝑇𝑟
𝑇��� (4.11)
• If the liquid mixture is ideal, 𝛾1 = 1 and the solubility can be calculated by using the
thermodynamic data , ∆𝐻𝑓𝑢𝑠 and ∆𝐶𝑃, for the solid species near the melting point.
• For non-ideal solutions, 𝛾1 must be estimated from either experimental data or liquid
solution models, such as the UNIFAC model.
This equation may be used, assuming that the ILs exhibit full miscibility in the
liquid phase and immiscibility in the solid phase. Due to the lack of appropriate data
representing the difference in ∆CP between the heat capacities of the solute in the solid
and liquid states for systems containing ILs, especially in systems where the IL
represents the solid phase, the simple solubility version without the ∆CP term was used
in Equation 4.12:
𝑙𝑛 𝑥1 = − 𝑙𝑛 𝛾1 − �∆𝐻𝑓𝑢𝑠(𝑇𝑟)𝑅𝑇
�1 − 𝑇𝑇𝑟�� (4.12)
The expected error from ignoring ∆CP usually depends on the substance. For normal
molecular compounds, this error does not exceed 2%.
The latent heat from pure sodium chloride fusion and its melting temperature are
∆Hfus = 28.3 kJ/mol and Tm = 1073.95 K, respectively (Yamada et al., 1993).

129
The non-random 2-liquid (NRTL) model is an activity coefficient model frequently
used in chemical engineering to calculate phase equilibria (Renon and Prausnitz, 1968).
This model presumes that, within a liquid solution, local compositions account for the
short-range order and non-random molecular orientations resulting from molecular size
and intermolecular force differences.
The NRTL equation is expressed for a multi-component system in terms of activity
coefficients in Equation 4.13:
𝑙𝑛𝛾𝑖 =∑ 𝜏𝑗𝑖𝐺𝑗𝑖𝑥𝑗𝑗
∑ 𝐺𝑗𝑖𝑥𝑗𝑗+ ∑ 𝐺𝑖𝑗𝑥𝑗
∑ 𝐺𝑘𝑗𝑥𝑘𝑘�𝜏𝑖𝑗 −
∑ 𝜏𝑘𝑗𝐺𝑘𝑗𝑥𝑘𝑘
∑ 𝐺𝑘𝑗𝑥𝑘𝑘�𝑗 (4.13)
with: 𝑙𝑛𝐺𝑖𝑗 = −𝛼𝑖𝑗𝜏𝑖𝑗, 𝛼𝑖𝑗 = 𝛼𝑗𝑖, 𝜏𝑖𝑖 = 0
Equation 4.13 includes three parameters, i.e.τij, τji, and αij, for each pair of
components in the multi-component mixture. Therefore, modifying the NRTL equation
for a binary system produces Equation 4.14:
𝑙𝑛𝛾1 = 𝑥22 �𝜏21 �𝐺21
𝑥1+𝑥2𝐺21�2
+ 𝜏12𝐺12(𝑥2+𝑥1𝐺12)2� (4.14)
The model was developed within the Simulis® Thermodynamics environment, a
thermo physical property calculation server created by ProSim and available as an MS-
Excel add-in (www.prosim.net, 2013).
The non-randomness parameter α12 was set to 0.2. Then, the binary interaction
parameters τij and τji were estimated temperature from the Na+ experimental data points.
An iterative process was used at each temperature. The quadratic relative criterion
between the calculated and experimental solubilities was minimized using Equation 4.8:
𝐶𝑟𝑖𝑡𝑒𝑟𝑖𝑜𝑛 = 1𝑁∑ �𝑥1
𝑒𝑥𝑝−𝑥1𝑐𝑎𝑙
𝑥1𝑒𝑥𝑝�2
𝑁 (4.8)
This methodology was applied to estimate the binary interaction parameters τ12 for
only the ionic liquids showing NaCl solubility greater than 1 wt%, i.e. IL1, IL2, IL3,
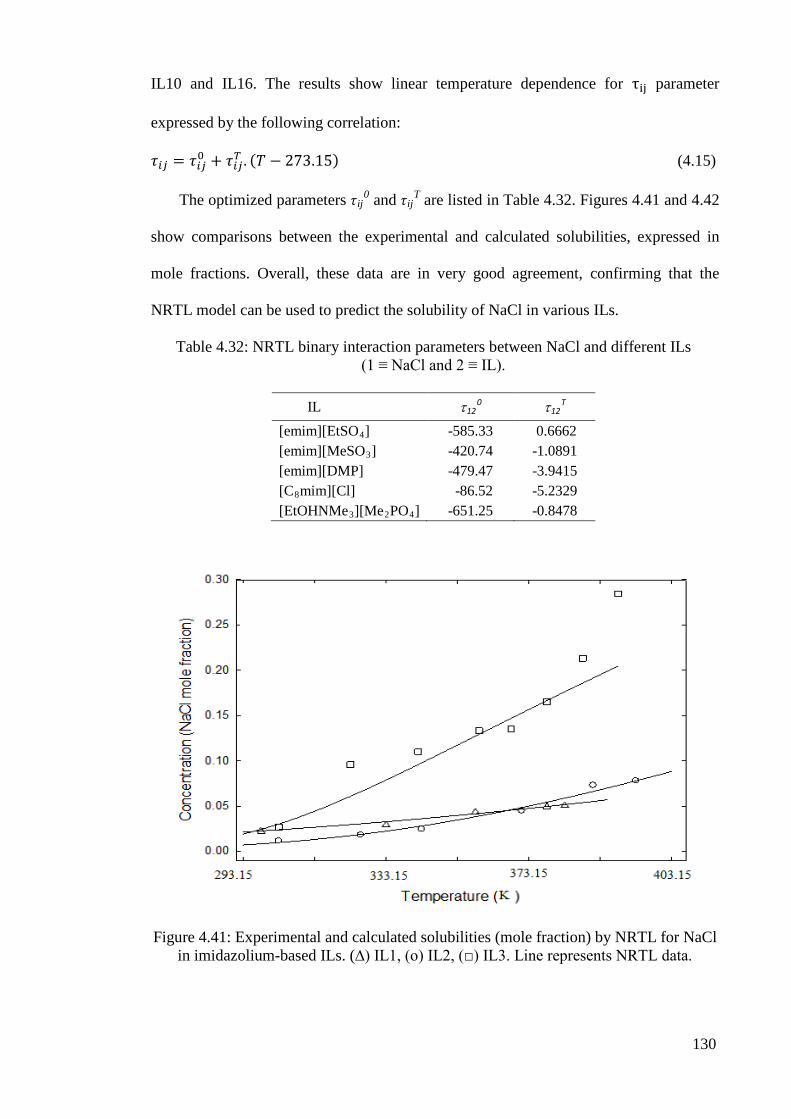
130
IL10 and IL16. The results show linear temperature dependence for τij parameter
expressed by the following correlation:
𝜏𝑖𝑗 = 𝜏𝑖𝑗0 + 𝜏𝑖𝑗𝑇 . (𝑇 − 273.15) (4.15)
The optimized parameters τij0 and τij
T are listed in Table 4.32. Figures 4.41 and 4.42
show comparisons between the experimental and calculated solubilities, expressed in
mole fractions. Overall, these data are in very good agreement, confirming that the
NRTL model can be used to predict the solubility of NaCl in various ILs.
Table 4.32: NRTL binary interaction parameters between NaCl and different ILs (1 ≡ NaCl and 2 ≡ IL).
IL τ12
0 τ12T
[emim][EtSO4] -585.33 0.6662 [emim][MeSO3] -420.74 -1.0891 [emim][DMP] -479.47 -3.9415 [C8mim][Cl] -86.52 -5.2329 [EtOHNMe3][Me2PO4] -651.25 -0.8478
Figure 4.41: Experimental and calculated solubilities (mole fraction) by NRTL for NaCl in imidazolium-based ILs. (∆) IL1, (ᴏ) IL2, (□) IL3. Line represents NRTL data.

131
Figure 4.42: Experimental and calculated solubilities (mole fraction) by NRTL for NaCl in (∆) IL10, (□) IL16. Lines represent NRTL data.
The experimental and calculated data for IL1, IL2, IL4, and IL5 are in good
agreement, with the exception of the data for IL3. However, this does not affect the
overall suitability of the developed model.
4.3 Electrical Conductivity of Sodium Chloride Saturated in DESs
Electrical conductivity is one of the essential factors of electrolytes since it
determines the level of ohmic drop in cyclic voltammetric analysis (Faridbod et al.,
2011). Thus, measuring ionic mobility of saturated solutions of sodium chloride in DESs
is highly important to evaluate the electrolytic behaviour of DESs. The electrical
conductivity of saturated NaCl solutions in DESs 1 - 5, 8, 10 - 12, and 15 was measured
within a range of temperatures. Experimental measurements were done repeatedly to
increase the reliability of the obtained values. The results were classified according to
solvent structure, range of temperature and stability of the solution. Experimental results

132
are tabulated in Tables 4.33 through 4.37. Similar to the electrical conductivity of blank
DESs, the electrical conductivity of NaCl solutions in DESs was found to be directly
proportional to the temperature. Additionally, it depended significantly on the salt, HBD
or metal halide used to synthesize a DES.
Figures 4.43 through 4.52 show the profiles of ln (σ) versus the inverse of
temperature for NaCl solutions in DESs at different salt:HBD or metal halide ratios and
under different temperatures.
Similar to the electrical conductivity of blank DESs, the electrical conductivity of
NaCl solutions in DESs were fitted using the same equation used to fit the conductivity
profiles in Section 4.1.3, i.e. Equation 4.2. The values of σ∞ and Eσ for each solution are
given in Table 4.38. The fitted series were also plotted in Figures 4.43 – 4.52. The fitting
showed a high accuracy when plotted, as it showed a high proximity to the experimental
points.
The addition of NaCl to blank DESs until saturation was expected to increase the
electrical conductivity of each DES used. This was ascertained by measuring the
conductivity of saturated solutions and comparing them to that of blank DESs. An
enhancement was obviously noticed in the values of conductivity when compared at the
same temperatures. However, in some saturated solutions when the salt concentration
was high in the DES, the electrical conductivity decreased when the DES became a
saturated solution of NaCl. This was true for DESs 1, 10, 11, and 12. This reduction is
caused by the strong influence of ion pairs and ion triplets, together with the higher ion
aggregations, which all reduce the overall mobility of ions and the number of effective
charge carriers.
The electrical conductivity of ammonium based DESs was increased by a
magnitude bigger than the magnitude in which it was increased in phosphonium based
DESs. This can be seen when the values in Tables 4.6 - 4.10, blank DES, and Tables

133
4.33 - 4.37, NaCl solutions in DESs, are compared. For instance, the conductivity of
DES8(1:1) increased sharply from 4.36 mS.cm-1 for blank DES to 11.81 mS.cm-1 when
the DES became a saturated solution under 398.15 K. However, the conductivity of
DES12(1:2) slightly increased from 0.257 mS.cm-1 to 0.360 mS.cm-1 under 363.15 K in
saturated NaCl solution.
Considering the practical range of electrical conductivity in electrochemical
processes, the electrical conductivity of selected DESs for the present work ought to be
higher than 0.1 mS.cm-1 (Faridbod et al., 2011). In this study, all measured electrical
conductivities of DESs were found to be in the aforesaid range of electrical conductivity,
except for DES15 at 1:4 and 1:5 molar ratios of salt:metal halide under temperatures
below 373.15 K and 368.15 K, respectively.
Table 4.33: Experimental electrical conductivity (mS cm-1) of saturated NaCl in DESs 1 and 2 at different molar ratios.
T/K DES 1 (1:1.75)
DES1 (1:2)
DES1 (1:2.5)
DES2 (1:1)
DES2 (1:2)
DES2 (1:3)
298.15 8.500 8.925 9.996 1.701 1.405 1.264 308.15 11.300 11.865 13.289 2.614 2.160 1.944 318.15 14.120 14.826 16.605 4.453 3.680 3.312 328.15 17.500 18.375 20.580 7.889 6.520 5.868 338.15 20.464 21.487 24.070 14.387 11.890 10.701 348.15 23.018 24.168 27.069 20.546 16.980 15.282

134
T-1(K-1)
0.0028 0.0029 0.0030 0.0031 0.0032 0.0033 0.0034
ln(σ
)
2.0
2.2
2.4
2.6
2.8
3.0
3.2
3.4
3.6
Figure 4.43 Electrical conductivity σ of saturated NaCl in DES1 1:1.75 (●), 1:2 (■), and 1:2.5 (▲) as a function of the inversed temperature. Curves represent fitting by
Equation 4.2.
T-1(K-1)
0.0028 0.0029 0.0030 0.0031 0.0032 0.0033 0.0034
ln(σ
)
0.0
0.5
1.0
1.5
2.0
2.5
3.0
3.5
Figure 4.44 Electrical conductivity σ of saturated NaCl in DES2 1:1 (●), 1:2 (■), and 1:3 (▲) as a function of the inversed temperature. Curves represent fitting by
Equation 4.2.

135
Table 4.34: Experimental electrical conductivity (mS cm-1) of saturated NaCl in DESs 3 and 4 at different molar ratios.
T/K DES3 (1:2.5)
DES3 (1:3)
DES3 (1:4)
DES4 (1:2)
DES4 (1:3)
DES4 (1:4)
298.15 6.360 5.490 5.460 0.707 0.587 0.547 308.15 8.640 7.937 7.260 1.504 1.093 0.995 318.15 11.000 10.324 9.980 2.700 2.050 1.780 328.15 15.750 14.370 13.200 5.300 4.400 3.500 338.15 17.073 16.840 15.847 7.930 5.500 4.910 348.15 20.634 19.641 19.100 11.380 9.830 8.950
K-1(T-1)
0.0028 0.0029 0.0030 0.0031 0.0032 0.0033 0.0034
ln(σ
)
1.6
1.8
2.0
2.2
2.4
2.6
2.8
3.0
3.2
Figure 4.45 Electrical conductivity σ of saturated NaCl in DES3 1:2.5 (●), 1:3 (■), and 1:4 (▲) as a function of the inversed temperature. Curves represent fitting by Equation
4.2.

136
K-1(T-1)
0.0028 0.0029 0.0030 0.0031 0.0032 0.0033 0.0034
ln(σ
)
-1.0
-0.5
0.0
0.5
1.0
1.5
2.0
2.5
3.0
Figure 4.46 Electrical conductivity σ of saturated NaCl in DES4 1:2 (●), 1:3 (■), and 1:4 (▲) as a function of the inversed temperature. Curves represent fitting by Equation
4.2.
Table 4.35: Experimental electrical conductivity (mS cm-1) of saturated NaCl in DESs 5 and 8 at different molar ratios.
T/K DES5 (1:1)
DES5 (1:2)
DES5 (1:3)
DES5 (1:4)
DES8 (1:1)
DES8 (1:2)
DES8 (1:3)
DES8 (1:4)
363.15 0.924 0.912 0.770 0.580 3.760 2.850 0.207 0.980 368.15 1.308 1.207 0.890 0.730 4.490 3.905 0.650 1.560 373.15 1.628 1.572 1.300 1.100 6.200 5.400 0.854 2.900 378.15 2.080 2.018 1.575 1.400 7.070 6.100 1.097 4.200 383.15 2.550 2.561 1.831 1.798 8.580 7.200 1.823 5.600 388.15 3.940 3.219 2.618 2.246 10.400 9.010 2.180 6.400 393.15 4.640 4.011 3.206 2.900 11.810 10.800 2.960 7.500 398.15 4.810 4.961 4.050 3.700 14.880 12.600 3.560 9.300 403.15 6.180 6.093 5.110 4.500 16.100 13.500 4.800 10.200

137
T-1(K-1)
0.00245 0.00250 0.00255 0.00260 0.00265 0.00270 0.00275 0.00280
ln(σ
)
-1.0
-0.5
0.0
0.5
1.0
1.5
2.0
2.5
Figure 4.47 Electrical conductivity σ of saturated NaCl in DES5 1:1 (●), 1:2 (■), 1:3 (▲), and 1:4 (▼) as a function of the inversed temperature. Curves represent fitting by
Equation 4.2.
T-1(K-1)
0.00245 0.00250 0.00255 0.00260 0.00265 0.00270 0.00275 0.00280
ln(σ
)
-2
-1
0
1
2
3
4
Figure 4.48 Electrical conductivity σ of saturated NaCl in DES8 1:1 (●), 1:2 (■), 1:3 (▲), and 1:4 (▼) as a function of the inversed temperature. Curves represent fitting by
Equation 4.2.

138
Table 4.36: Experimental electrical conductivity (mS.cm-1) of saturated NaCl in DESs 10 and 11 at different molar ratios.
T/K DES10 (1:3)
DES10 (1:4)
DES10 (1:5)
DES11 (1:2)
DES11 (1:3)
DES11 (1:4)
303.15 1.454 2.351 2.920 0.120 0.132 0.185 313.15 1.887 3.155 3.531 0.266 0.340 0.390 323.15 2.920 4.300 5.250 0.462 0.502 0.566 333.15 4.390 5.420 6.730 0.725 0.855 1.067
T-1(K-1)
0.00295 0.00300 0.00305 0.00310 0.00315 0.00320 0.00325 0.00330 0.00335
ln(σ
)
0.2
0.4
0.6
0.8
1.0
1.2
1.4
1.6
1.8
2.0
Figure 4.49 Electrical Conductivity σ of saturated NaCl in DES10 1:3 (●), 1:4 (■), and 1:5 (▲) as a function of the inversed temperature. Curves represent fitting by Equation
4.2.

139
T-1(K-1)
0.00295 0.00300 0.00305 0.00310 0.00315 0.00320 0.00325 0.00330 0.00335
ln(σ
)
-2.5
-2.0
-1.5
-1.0
-0.5
0.0
0.5
Figure 4.50 Electrical conductivity σ of saturated NaCl in DES11 1:2 (●), 1:3 (■), and 1:4 (▲) as a function of the inversed temperature. Curves represent fitting by Equation
4.2.
Table 4.37: Experimental electrical conductivity (mS cm-1) of saturated NaCl in DESs 12 and 15 at different molar ratios.
T/K DES12 (1:2)
DES12 (1:3)
DES12 (1:4)
DES12 (1:5)
DES15 (1:2)
DES15 (1:3)
DES15 (1:4)
DES15 (1:5)
363.15 0.297 0.365 0.410 0.534 0.416 0.320 0.059 0.047 368.15 0.360 0.442 0.498 0.647 0.503 0.387 0.081 0.065 373.15 0.425 0.522 0.588 7.645 0.524 0.403 0.103 0.082 378.15 0.448 0.551 0.619 0.805 0.588 0.452 0.166 0.133 383.15 0.525 0.645 0.726 0.944 0.651 0.501 0.197 0.158 388.15 0.598 0.735 0.827 1.075 0.806 0.620 0.267 0.214 393.15 0.705 0.867 0.975 1.268 0.940 0.723 0.324 0.259 398.15 0.780 0.959 1.079 1.403 1.037 0.798 0.399 0.319 403.15 0.930 1.143 1.286 1.672 1.294 0.995 0.460 0.368

140
T-1(K-1)
0.00245 0.00250 0.00255 0.00260 0.00265 0.00270 0.00275 0.00280
ln(σ
)
-1.4
-1.2
-1.0
-0.8
-0.6
-0.4
-0.2
0.0
0.2
0.4
0.6
0.8
Figure 4.51 Electrical conductivity σ of saturated NaCl in DES12 1:2 (●), 1:3 (■), 1:4 (▲), and 1:5 (▼) as a function of the inversed temp. Curves represent fitting by
Equation 4.2.
T-1(K-1)
0.00245 0.00250 0.00255 0.00260 0.00265 0.00270 0.00275 0.00280
ln(σ
)
-3.5
-3.0
-2.5
-2.0
-1.5
-1.0
-0.5
0.0
0.5
Figure 4.52 Electrical conductivity σ of saturated NaCl in DES15 1:2 (●), 1:3 (■), 1:4 (▲), and 1:5 (▼) as a function of the inversed temp. Curves represent fitting by
Equation 4.2.

141
Table 4.38: Values of σ∞ and Eσ for the fitting by Equation 4.2 in the system of NaCl(saturated)/DES.
DES Ratio σ∞ (ms.cm-1) Eσ (meV)
1 1:1.75 9.52×10+3 1.79×10+2 1 1:2 1.00×10+4 1.80×10+2 1 1:2.5 1.12×10+4 1.81×10+2 2 1:1 1.06×10+8 1.06×10+2 2 1:2 8.77×10+7 4.63×10+2 2 1:3 7.93×10+7 4.64×10+2 3 1:2.5 2.61×10+4 2.12×10+2 3 1:3 4.57×10+4 2.30×10+2 3 1:4 3.97×10+4 2.27×10+2 4 1:2 2.38×10+8 5.09×10+2 4 1:3 2.05×10+8 5.04×10+2 4 1:4 1.39×10+8 4.97×10+2 5 1:1 2.11×10+8 6.00×10+2 5 1:2 1.80×10+8 5.95×10+2 5 1:3 1.93×10+8 6.06×10+2 5 1:4 6.61×10+8 6.51×10+2 8 1:1 1.18×10+7 4.67×10+2 8 1:2 1.77×10+7 4.86×10+2 8 1:3 5.88×10+11 8.81×10+2 8 1:4 1.41×10+10 7.22×10+2 10 1:3 3.55×10+5 3.25×10+2 10 1:4 2.80×10+4 2.45×10+2 10 1:5 4.34×10+4 2.52×10+2 11 1:2 5.48×10+7 5.19×10+2 11 1:3 7.78×10+7 5.24×10+2 11 1:4 2.72×10+7 4.90×10+2 12 1:2 1.80×10+4 3.44×10+2 12 1:3 2.24×10+4 2.44×10+2 12 1:4 2.50×10+4 2.44×10+2 12 1:5 3.25×10+4 3.44×10+2 15 1:2 2.36×10+4 3.43×10+2 15 1:3 1.81×10+4 3.43×10+2 15 1:4 1.01×10+8 6.63×10+2 15 1:5 8.10×10+7 6.63×10+2
4.4 The Electrochemical Potential Windows of ZnCl2 Based DESs
It was shown throughout this chapter that zinc chloride based DESs are potential
candidates for the production of sodium metal. This is mainly because of the high NaCl

142
solubility and their high electrical conductivity. Additionally, experiments in our labs
showed that pure sodium metal was stable in these DESs.
Another important property of the solvent to be used in electrochemical processes is
the electrochemical window. The electrochemical window can be defined as the
potential range within which the material is stable. In this work, the electrochemical
windows of these DESs were measured using cyclic voltammetry.
Table 4.39 gives a summary of the findings for each DES at different experimental
conditions.
Table 4.39: Electrochemical windows obtained at Pt counter electrode, glassy carbon working electrode, and a silver wire quasi reference electrode for DESs 5, 8, 12, and 15.
DES Salt:metal halide molar ratio
Temperature (oC)
Anodic Limit (V)
Cathodic Limit (V)
Electrochemical window (V)
DES 5
1:1 100 1.69 -0.97 2.66 110 2.13 -1.06 3.19 130 2.47 -1.27 3.74
1:3 100 1.3 -0.95 2.25 110 1.37 -1.02 2.39 130 1.65 -1.36 3.01
DES 8
1:1 100 1.33 -0.69 2.02 110 1.37 -0.74 2.11 130 1.4 -0.97 2.37
1:2 100 1.32 -0.48 1.8 110 1.21 -0.66 1.87 130 1.41 -0.6 2.01
1:3 100 1.26 -0.41 1.67 110 1.34 -0.51 1.85 130 1.38 -0.57 1.95
DES12
1:2 100 1.87 -1.06 2.93 110 1.91 -1.09 3.00 130 1.93 -1.11 3.04
1:3 100 1.51 -0.8 2.31 110 1.6 -0.82 2.42 130 1.64 -0.84 2.48
DES15
1:2 100 1.6 -1.17 2.77 110 1.73 -1.24 2.97 130 1.8 -1.26 3.06
1:3 100 1.17 -1.07 2.24 110 1.23 -1.08 2.31 130 1.31 -1.13 2.44

143
Figures 4.53 through 4.64 depict the electrochemical windows and cyclic
voltammetries of saturated solutions of sodium in DESs at different molar ratios and
temperatures. This is achieved by using a glassy carbon (GC) electrode with a diameter
of 3 mm as working electrode, a silver (Ag) wire as reference electrode, and a platinum
(Pt) electrode as counter electrode at a scan rate of 100 mV s-1.
The electrochemical windows of DES5 for ratios of 1:1 and 1:3 in the temperature
range of 100 oC to 130 oC were plotted in Figures 4.53 and 4.54. The effect of increasing
the concentration of ZnCl2 as the complexing agent in the DES was evaluated together
with the effect of varying the temperature. It was found that the electrochemical
windows of DES5 are strong functions of temperature. For instance, in DES5(1:1), the
electrochemical window increased sharply from 2.66 V at 100 oC to 3.19 V and 3.74 V
at 110 oC and 130 oC, respectively. In addition, the same trend was obtained for
DES5(1:3). The electrochemical window increased from 2.25V at 100 oC to 2.39V and
3.01V at 110 oC and 130 oC, respectively. In contrast, the electrical electrochemical
window of DES5 decreased significantly by increasing the molar ratio of ZnCl2 in the
DES. The maximum electrochemical window of DES5 (1:1) at 130 oC was 3.74 V while
it was 3.01 V for the molar ratio 1:3 under the same temperature.
Figure 4.55 depicted the cyclic voltammetry of saturated sodium in DES5 at130 oC
as the minimum temperature which attained a electrochemical window of 3.74 V. The
sodium reduction potential peak was detected at -0.40 V vs. Ag reference electrode.

144
E/V
-2 -1 0 1 2 3
I/µΑ
-80
-60
-40
-20
0
20
40
60
80
DES5(1:1), 100oCDES5(1:1), 110oCDES5(1:1), 130oC
Figure 4.53: Electrochemical window of DES5 (1:1) as a function of temperature on a GC (3 mm) working electrode/ Ag reference electrode/ Pt counter electrode at scan rate
of 100 mV s-1.
E/V
-2 -1 0 1 2
I/µA
-150
-100
-50
0
50
100
150
DES5(1:3),100oCDES5(1:3),110oCDES5(1:3),130oC
Figure 4.54: Electrochemical window of DES5 (1:3) as a function of temperature on a GC (3 mm) working electrode/ Ag reference electrode/ Pt counter electrode at scan rate
of 100mV s-1.

145
E/V
-2 -1 0 1 2 3
I/µA
-150
-100
-50
0
50
100
150
Na peak in DES5(1:1),130oC
DES5(1:1),130οC
Figure 4.55: Cyclic voltammetry for the reduction of saturated sodium chloride in DES5 (1:1) at 130oC on a GC (3 mm) working electrode/ Ag reference electrode/ Pt counter
electrode at scan rate of 100mV s-1.
To evaluate the effect of the salt on the electrochemical window, choline chloride as
salt in DES5 was replaced by N,N diethylethanolammonium chloride in DES8. It is
clearly shown in Figures 4.56, 4.57, and 4.58 that for the same salt and complexing
agent in DES8 but at different molar ratios, the electrochemical windows were
influenced noticeably by the concentration of ZnCl2 and temperature. By changing the
molar ratio of DES8 from 1:1 to 1:2 and then to 1:3 at 130 oC, the electrochemical
window declined from 2.37 V to 2.01 V and 1.95 V, respectively. However, it was
found that the electrochemical windows of DES8 for each molar ratio depended
significantly on the operating temperature similar to DES5. On the contrary, the
electrochemical window in DES8 increased by increasing the temperature. Table 4.39
and Figure 4.56 shows that in DES8 with molar ratio of 1:1, the electrochemical window
grow from 2.02 V under 100 oC to 2.11 V under 110 oC, and afterward it reaches to its
maximum potential at 2.37 V under 130oC. The same trend of electrochemical windows
are presented in Figures 4.57 and 4.58 for DES8 with the molar ratios 1:2 and 1:3.
Reduction of sodium ion: Na+/Na
Oxidation of sodium: Na/Na+

146
E/V
-1 0 1 2
I/µA
-100
-50
0
50
100
DES8(1:1),100oCDES8(1:1),110oCDES8(1:1),130oC
Figure 4.56: Electrochemical window of DES8(1:1) as a function of temperature on a GC (3 mm) working electrode/ Ag reference electrode/ Pt counter electrode at scan rate
of 100 mV s-1.
E/V
-1.0 -0.5 0.0 0.5 1.0 1.5 2.0
I/µA
-80
-60
-40
-20
0
20
40
60
80
DES8(1:2),100oCDES8(1:2),110oCDES8(1:2),130oC
Figure 4.57: Electrochemical window of DES8(1:2) as a function of temperature on a GC (3 mm) working electrode/ Ag reference electrode/ Pt counter electrode at scan rate
of 100 mV s-1.
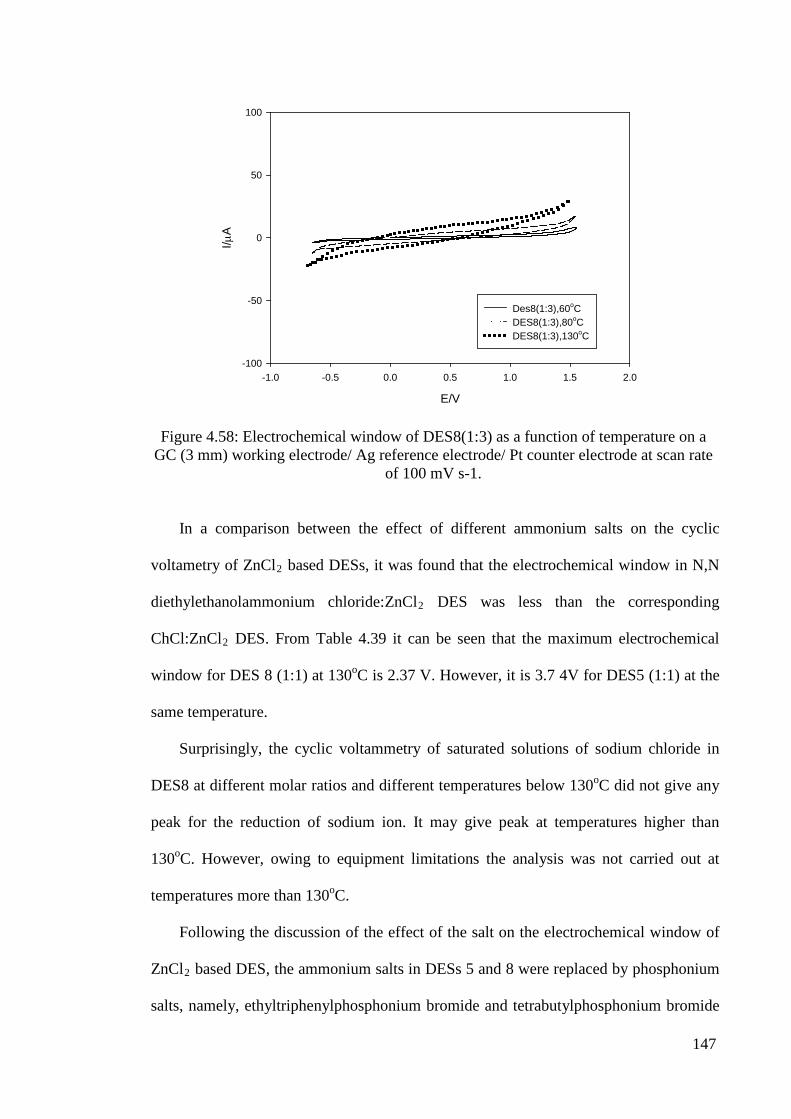
147
E/V
-1.0 -0.5 0.0 0.5 1.0 1.5 2.0
I/µA
-100
-50
0
50
100
Des8(1:3),60oCDES8(1:3),80oCDES8(1:3),130oC
Figure 4.58: Electrochemical window of DES8(1:3) as a function of temperature on a GC (3 mm) working electrode/ Ag reference electrode/ Pt counter electrode at scan rate
of 100 mV s-1.
In a comparison between the effect of different ammonium salts on the cyclic
voltametry of ZnCl2 based DESs, it was found that the electrochemical window in N,N
diethylethanolammonium chloride:ZnCl2 DES was less than the corresponding
ChCl:ZnCl2 DES. From Table 4.39 it can be seen that the maximum electrochemical
window for DES 8 (1:1) at 130oC is 2.37 V. However, it is 3.7 4V for DES5 (1:1) at the
same temperature.
Surprisingly, the cyclic voltammetry of saturated solutions of sodium chloride in
DES8 at different molar ratios and different temperatures below 130oC did not give any
peak for the reduction of sodium ion. It may give peak at temperatures higher than
130oC. However, owing to equipment limitations the analysis was not carried out at
temperatures more than 130oC.
Following the discussion of the effect of the salt on the electrochemical window of
ZnCl2 based DES, the ammonium salts in DESs 5 and 8 were replaced by phosphonium
salts, namely, ethyltriphenylphosphonium bromide and tetrabutylphosphonium bromide

148
for DESs 12 and 15, respectively. The electrical electrochemical windows of
ethyltriphenylphosphonium bromide:ZnCl2, DES12, at two molar ratios of
salt:complexing agent, 1:2 and 1:3, are plotted in Figures 4.59 and 4.60, respectively.
Similar to the electrical windows of the ammonium based DESs, i.e. DES5 and DES8,
the electrical windows of DES12 are influenced directly by the temperature change. The
obtained electrochemical window for DES12 with a mole ratio of 1:2, Figure 4.59 and
Table 4.39, increased from 2.93 V at 100 oC to 3 V and 3.04V at 110 oC and 130 oC,
respectively. Additionally, the same trend was attained in the cyclic voltammetry test for
DES12 using a 1:3 ratio, as observed in Figure 4.60 and Table 4.39. The detected
electrochemical window at 100 oC was 2.31V, which increased to 2.42 V and 2.48 V at
110 oC and 130 oC, respectively. Furthermore, the electrochemical windows of this DES
decreased sharply by decreasing the molar ratio of ethyltriphenylphosphonium
bromide:ZnCl2. For instance, from Table 4.39, the maximum electrochemical window
for DES12 with a molar ratio of 1:2 is 3.04 V at 130 oC in comparison with a
electrochemical window of 2.48 V for the same DES at a molar ratio of 1:3 and under
the same temperature.
Figure 4.61 shows the cyclic voltammetry of saturated solution of sodium chloride
in DES12 at 100 oC as the minimum temperature, which had the electrochemical
window of 2.93 V. The sodium reduction potential peaked at -0.35 V vs. Ag reference
electrode.

149
E/V
-1.5 -1.0 -0.5 0.0 0.5 1.0 1.5 2.0 2.5
I/µA
-80
-60
-40
-20
0
20
40
60
80
DES12(1:2),100oCDES12(1:2),110oCDES12(1:2),130oC
Figure 4.59: Electrochemical window of DES12 (1:2) as a function of temperature on a GC (3 mm) working electrode/ Ag reference electrode/ Pt counter electrode at scan rate
of 100 mV s-1.
E/V
-1.5 -1.0 -0.5 0.0 0.5 1.0 1.5 2.0
I/µA
-100
-50
0
50
100
DES12(1:3),100oCDES12(1:3),110oCDES12(1:3),130oC
Figure 4.60: Electrochemical window of DES12 (1:3) as a function of temperature on a GC (3 mm) working electrode/ Ag reference electrode/ Pt counter electrode at scan rate
of 100 mV s-1.

150
E/V
-2 -1 0 1 2 3
I/µA
-40
-20
0
20
40
DES12(1:2),100οC,NaClDES12(1:2),100οC
Figure 4.61: Cyclic voltammetry for the reduction of saturated sodium in DES12 (1:2) at 100 oC on a GC (3 mm) working electrode/ Ag reference electrode/ Pt counter
electrode at scan rate of 100 mV s-1.
Cyclic voltammetry analysis for electrochemical windows of DES15 are shown in
Figures 4.62 and 4.63. The electrical electrochemical windows of DES 15(1:2 and 1:3)
decline by the increase in ZnCl2 molar composition in the DES and increase slightly as
the temperature increases. For instance, in Table 4.39, the detected electrochemical
window for DES 15 (1:2) was 3.06V at 130 oC while it was 2.44 V for DES 15(1:3)
under the same operating temperature. In Table 4.39 and Figure 4.62, the
electrochemical window of DES15 (1:2) is 2.77 V at 100oC and increases to 2.97 V at
110 oC and finally reached to 3.06V under 130 oC. Similarly, Figure 4.63 shows that the
electrochemical windows of DES15 (1:3) increase from 2.24 V at 100 oC to 2.31 V and
2.44 V at 110 oC and 130 oC, respectively. The maximum detected electrochemical
window for DES15 was 3.06 V at 130 oC and 1:2 molar ratio.
Figure 4.64 depicts the cyclic voltammetry of saturated solution of sodium chloride
in DES15 at 130 oC . The reduction potential peaks at -0.42 V vs. Ag reference
electrode.
Reduction of sodium ion: Na+/Na
Oxidation of sodium: Na/Na+

151
E/V
-2 -1 0 1 2
I/µA
-80
-60
-40
-20
0
20
40
60
80
DES15(1:2),100οCDES15(1:2),110οCDES15(1:2),130οC
Figure 4.62: Electrochemical window of DES15 (1:2) as a function of temperature on a GC (3 mm) working electrode/ Ag reference electrode/ Pt counter electrode at scan rate
of 100 mV s-1.
E/V
-1.5 -1.0 -0.5 0.0 0.5 1.0 1.5
I/µA
-100
-50
0
50
100
DES15(1:3),100oCDES15(1:3),110oCDES15(1:3),130oC
Figure 4.63 Electrochemical window of DES15 (1:3) as a function of temperature on a GC (3 mm) working electrode/ Ag reference electrode/ Pt counter electrode at scan rate
of 100 mV s-1.

152
E/V
-2 -1 0 1 2
I/µA
-80
-60
-40
-20
0
20
40
60
80
Na peak in DES15(1:2),130oCDES15(1:2),130oC
Figure 4.64: Cyclic voltammetry for the reduction of saturated sodium in DES15(1:2) under 130oC on a GC (3 mm) working electrode/ Ag reference electrode/ Pt counter
electrode at scan rate of 100 mV s-1.
It can be concluded that the electrical windows in the studied ammonium based
DESs, i.e. DES5 and DES8, were more affected by the change in temperature in
comparison with the phosphonium based DESs, i.e. DES12 and 15. For instance, for
DES5(1:1), the electrochemical window increased from 2.66V at 100 oC to 3.19V and
3.74V at 110 oC and 130 oC, respectively. While it increased slightly for DES12(1:2)
from 2.93V at 100 oC to 3V and 3.04V at 120 oC and 130 oC, respectively.
As a conclusion from this electrochemical study, DES5(1:1) at 130 oC possessed the
widest electrochemical window among the studied DESs, which was 3.74 V.
ZnCl2-DESs with high solubility for NaCl in DESs, high electrical conductivity of
NaCl in DESs as well as stability of sodium metal in DESs were selected for this
application.
Reduction of sodium ion: Na+/Na
Oxidation of sodium: Na/Na+

153
CHAPTER V
CONCLUSIONS
The present study investigated the suitability of selected ILs and DESs to serve as
electrolytes for the production of sodium metal by electrolysis of common sodium salts.
Sixteen ILs and sixteen DESs at various salt:HBD or metal halide molar ratios were
utilized in this study, and the results obtained are promising. A number of conclusions
can be drawn from this study.
5.1 A Simple and Efficient Method Can be Used for the Synthesis of DESs
DESs were simply produced by mixing a salt and a HBD or a metal halide. The
procedure was straight forward and did not require sophisticated equipment. The
components of the DES were mixed while the mixing vessel was heated, and this
resulted in the formation of a DES. All the mass of the starting materials were utilized
in the formation of a DES without a side product, meaning a 100% yield. The purity of
the resulting DES depended totally on the purity of the mixed components.
5.2 Different Conditions are Needed for the Synthesis of DESs of Different
Combinations
Different ammonium and phosphonium salts were utilized to synthesize the sixteen
DESs. By combining these salts with different HBDs and metal halides, and by varying
the molar ratios of these combinations, a large variety of DESs was produced.
The important parameters that determine the successful synthesis of a DES are the
mixing time, mixing type and mixing temperature. These parameters are of importance
for the synthesis of various DESs.

154
5.3 Physical Properties of DESs are Temperature and Component Dependent
The physical properties, such as electrical conductivity, viscosity and refractive
index, are temperature-dependent. The variation of the temperature affected the
measured physical properties either linearly or exponentially. Some of the DESs
possessed good electrical conductivities, especially the DESs synthesized from ZnCl2 as
complexing agent. In addition, DESs of ammonium salts and ZnCl2 have low viscosities
which is very important in industrial applications.
Additionally, they depended also on the salt of the DES. In general, the DESs
synthesized from phosphonium-based salts had melting temperatures above 338 K,
while those synthesized from ammonium-based salts had melting temperatures below
326 K. The ammonium-based DESs also had lower viscosities than those of the
phosphonium-based DESs. In certain cases, the viscosities of phosphonium-based DESs
were 90 folds higher than that of the corresponding ammonium DESs under the same
conditions. Moreover, the DESs synthesized from ammonium salts showed higher
electrical conductivities than those made from phosphonium salts.
5.4 Solubility of Sodium Salts in ILs or DESs Depended on Various
Parameters
In most cases, the solubility of sodium salt increased as the temperature increased
and the salt:HBD or metal halide mole ratios decreased. The chemical structure of the
DES has a significant effect on the solubility of sodium salts. The solubility of sodium
salts in DESs that have ethylene glycol or glycerol as HBD, i.e. neutral molecules, was
very small. On the other hand, the solubility of sodium salts in DESs containing
ammonium salts and metal halides was very high. This is especially observed for a DES
synthesized using ZnCl2 as complexing agent.

155
When ILs were analyzed, it was found that both the anion and the cation of a IL
affect the solubility of NaCl in the IL. The solubility of NaCl was measured in 16 ILs at
different temperatures. Similar to solubility in DESs, the solubility of NaCl in ILs was
found to be directly proportional to the temperature. Imidazolium-based ILs had higher
NaCl solubilities than pyridinium, pyrrolidinium, and ammonium-based ILs.
5.5 NRTL Activity Coefficients Model Can be Applied Successfully for the
Studied Systems
NRTL model was applied successfully to correlate the solubilities of NaCl in some
of the tested DESs and ILs. The experimental and predicted values showed very good
agreement in most cases. This indicates that the NRTL model can be successfully
applied to correlate the solubility of salts in DES or IL.
5.6 ZnCl2 –based DESs Had a High Potential for Being Electrolytes for
Sodium Production
Sodium metal was stable in ZnCl2-based DESs. The cyclic voltammetry study on
saturated NaCl solutions in these DES showed a reduction peak through a quasi-
reversible reaction. This peak confirmed the suitability of these DESs to be electrolytes
for NaCl decomposition.

156
CHAPTER VI
RECOMMENDATIONS FOR FUTURE WORK
The recommendations for future work are as follows:
1- DESs of the present work can be applied in electrolysis cell so as to produce sodium
metal under 130 oC.
2- Pilot plant-scale experiments can be carried out to assess the applicability of the studied
systems in the batch process.
3- The parameters of the process can be optimized to achieve better productivity. Such
parameters are the temperature of the separation and the salt:HBD mole ratio.
4- In addition to the production of sodium metal, DESs of the present work can also be
applied for the production of zinc from zinc halides.

157
Bibliography
Abbott, A. P., Barron, J. C., Frisch, G., Ryder, K. S., Silva, A. F. (2011b). The effect of
additives on zinc electrodeposition from deep eutectic solvents. Electrochimica Acta. 56, 5272–5279.
Abbott, A. P., Bell, T. J., Handa, S., Stoddart, B. (2006a). Cationic functionalisation of cellulose using a choline based ionic liquid analogue. Green Chemistry. 8, 784-786
Abbott, A. P., Boothby, D., Capper, G., Davies, D. L., Rasheed, R. K. (2004a). Deep eutectic solvents formed between choline chloride and carboxylic acids: Versatile alternatives to ionic liquids. Journal of American Chemical Society. 126 (29), 9142–9147.
Abbott, A. P., Capper, G., Davies, D. L., McKenzie, K. J., Obi, S. U. J. (2006a). Solubility of metal oxides in deep eutectic solvents based on choline chloride. Journal of Chemical and Engineering Data. 51, 1280–1282.
Abbott, A. P., Capper, G., Davies, D. L., Munro, H., Rasheed, R. K., Tambyrajah, V. (2003b). Ionic liquids as green solvents: progress and prospects. ACS Symposium Series, American Chemical Society: Washington D.C. 439−452.
Abbott, A. P., Capper, G., Davies, D. L., Rasheed R. (2004b). Ionic liquids based upon metal halide/substituted quaternary ammonium salt mixtures. Inorganic Chemistry. 43, 3447–3452.
Abbott, A. P., Capper, G., Davies, D. L., Rasheed, R. K., Tambyrajah, V. (2003a). Novel solvent properties of choline chloride/urea mixtures. Chemical Communications. 70–71.
Abbott, A. P., Capper, G., Davies, D. L., Rasheed, R. K., Tambyrajah, V. (2001). Novel ambient temperature ionic liquids for zinc and zinc alloy electrodeposition. Transactions of the Institute of Metal Finishing. 79, 204−206.
Abbott, A. P., Capper, G., Glidle, A., Ryder, K. S. (2006b). Electropolishing of stainless steels in a choline chloride based ionic liquid: an electrochemical study with surface characterisation using SEM and atomic force microscopy. Physical Chemistry and Chemical Physics. 8, 4214–4221.
Abbott, A. P., Capper, G., McKenzie, K. J., Ryder, K. S. (2006c). Voltammetric and impedance studies of the electropolishing of type 316 stainless steel in a choline chloride based ionic liquid. Electrochimica Acta. 51, 4420–4425.
Abbott, A. P., Capper, G., McKenzie, K. J., Ryder, K. S. (2007a). Electrodeposition of zinc–tin alloys from deep eutectic solvents based on choline chloride. Journal of Electroanalytical Chemistry. 599 (2), 288–294.
Abbott, A. P., Cullis, P. M., Gibson, M. J., Harris, R. C., Raven, E. (2007c). Extraction of glycerol from biodiesel into a eutectic based ionic liquid. Green Chemistry. 9, 868–872.

158
Abbott, A. P., Eardley, A. C. (1999). Solvent properties of liquid and supercritical hydroflurocarbons. Journal of Physical Chemistry. 103, 2504-2509.
Abbott, A. P., El Taib, K., Frisch, G., McKenzie, K. J., Ryder, K. S. (2009). Electrodeposition of copper composites from deep eutectic solvents based on choline chloride. Physical Chemistry and Chemical Physics. 11, 4269–4277.
Abbott, A. P., Griffith, J., Nandhra, S., O'Connor, C., Postlethwaite, S., Ryder, K. S., Smith, E. L. (2008). Sustained electroless deposition of metallic silver from a choline chloride-based ionic liquid. Surface & Coatings Technology. 202 (10), 2033–2039.
Abbott, A. P., Harris, R. C., Ryder, K. S., Agostino, C. D, Gladden, L. F., Mantle, M. D. (2011a). Glycerol eutectics as sustainable solvent systems. Green Chemistry. 13, 82–90.
Abbott, A. P., Nandhra, S., Postlethwaite, S., Smith, E. L., Ryder, K. S. (2007b). Electroless deposition of metallic silver from a choline chloride-based ionic liquid: a study using acoustic impedance spectroscopy, SEM and atomic force microscopy. Physical Chemistry and Chemical Physics. 9, 3735–3743.
Abu-lebdeh, Y., Davidosn, I. (2013). Nanotechnology for lithium-ion batteries. Springer, New York. ISSN 1571-5744. ISBN 978-4614-4604-0.
Akella, A.K., Sharma, M.P., Saini, R.P. (2007). Optimum utilization of renewable energy sources in a remote area. Renewable and Sustainable Energy Reviews. 11, 894–908.
Aki, S. N. V. K., Brennecke, J. F., Samanta, A. (2001). How polar are room temperature ionic liquids? Chemical Communications. 413–414.
AlNashef, I. M. (2010). Solubility and electrical conductivity of common sodium salts in selected ionic liquids. Advanced Materials Research. 233–235, 2760–2764.
Anastas, P. T. Green Solvents Set II, Volumes 4–6, Boxed Set. (2010). Wiley-VCH Verlag GmbH. ISBN 9783527325924.
Anastas, P. T., Zimmerman, J. B. (2003). Design through the twelve principles of green engineering. Environmental Science and Technology. 37 (5), 94A-101A.
Aquilina, G., Bories, G., Chesson, A. (2011). Scientific opinion on safety and efficacy of choline chloride as a feed additive for all animal species. European Food Safety Authority Journal. 9 (9), 2353–2367.
Arce, A., Earle, M. J., Rodríguez, H., Seddon, K. R. (2007). Separation of aromatic hydrocarbons from alkanes using the ionic liquid 1-ethyl-3-methylimidazolium bis{(trifluoromethyl) sulfonyl}amide. Green Chemistry. 9, 70–74.
Armand, M., Endres, F., MacFarlane, D. R., Ohno, H., Scrosati, B. (2009). Ionic-liquid materials for the electrochemical challenges of the future. Nature Materials. 8, 621–629.
Awwad, A. M., AlDujaili, A. H. (2001). Density, refractive index, permittivity, and related properties for N-formylmorpholine + ethyl acetate and + butanone at 298.15 K. Journal of Chemical and Engineering Data. 46 (6), 1349–1350.

159
Azizi, N., Gholibeglo, E., Babapour, M., Ghafuri, H., Bolourtchian, S., M. (2012) Deep eutectic solvent promoted highly efficient synthesis of N, N’-diarylamidines and formamides. Comptes Rendus Chimie. 15, 768-773.
Balducci, A., Bradi, U., Caporali, S., Mastragostino, M., Soavi, F. (2004). Ionic liquids for hybrid supercapacitors. Electrochemistry Communications. 6 (6), 566–570.
Banks, A. (1990). Sodium. Journal of Chemical Education. 67 (12), 1046.
Bao, W. L., Wang, Z. M., Li, Y. X. (2003). Synthesis of chiral ionic liquids from natural amino acids. Journal of Organic Chemistry. 68, 591–593.
Barrosse-Antle, L. E., Bond, A. M., Compton, R. G., O’Mahony, A. M., Rogers, E. I., Silvester, D. S. (2010). Voltammetry in room temperature ionic liquids: comparisons and contrasts with conventional electrochemical solvents. Chemistry An Asian Journal. 5, 202–230.
Buzzeo, M. C., Hardacre, C., Compton, R. G. (2004). Use of room temperature ionic liquids in gas sensor design. Analytical Chemistry. 76 (15), 4583–4588.
Cai, Q., Xian, Y., Li, H., Yang-ming, T., Jin, T. (2001). Studies on a sulfur dioxide electrochemical sensor with ionic liquid as electrolyte. Journal of East China Normal University. 3, 57–60.
Carmichael, A. J., Seddon, K. R. (2000). Polarity study of some 1-alkyl-3-methylimidazolium ambient-temperature ionic liquids with thesolvatochromic dye, Nile red. Journal of Physical and Organic Chemistry. 13, 591–595.
Carriazo, D., Serrano, M. C., Gutiérrez, M. C., Ferrer, M. L., del Monte, F. (2012). Deep-eutectic solvents playing multiple roles in the synthesis of polymers and related materials. Chemical Society Reviews. 41, 4996–5014.
Chandran, K., Nithya, R., Sankaran, K., Gopalan, A., Ganesan, V. (2006). Synthesis and characterization of sodium alkoxides. Bullitin of Material Science. 29 (2), 173–179.
Chen C. (2001). Synthesis and characterization of new cathode materials for lithium ion batteries. Thesis, Binghamton University, New York.
Chen, Z., Zhu, W., Zheng, Z., Zou, X. (2010). One-pot a-nucleophilic fluorination of acetophenones in a deep eutectic solvent. Journal of Fluorine Chemistry. 131 (3), 340–344.
Choi, H. M., Yoo, B. (2009). Steady and dynamic shear rheology of sweet potato starch-xanthan gum mixtures. Food Chemistry. 116 (3), 638–643.
Citron, M. L., Gabel, C., Stroud, C., Stroud, C. (1977). Experimental study of power broadening in a two-level atom. Physical Review A. 16 (4), 1507.
Clare, B. R., Bayley, P. M., Best, A. S., Forsyth, M., MacFarlane, D. R. (2008). Purification or contamination? The effect of sorbents on ionic liquids. Chemical Communications. 2689–2691.
Coll, C., Labrador, R. H., Manez, R. M., Soto, J., Sancenon, F., Segui, M. J., Sanchez, E. (2005). Ionic liquids promote selective responses towards the highly

160
hydrophilic anion sulfate in PVC membrane ion-selective electrodes. Chemical Communications. 3033–3035.
Cooper, E. I., O’Sullivan, E. J. M. (1992). Proceedings of the eighth international symposium of molten salts, Physical and high temperature materials division proceedings. Electrochemical Society. 386–396.
Dai, Y., van Spronsen, J., Witkamp, G. J., Verpoorte, R., Choi, Y. H. (2013). Natural deep eutectic solvents as new potential media for green technology. Analytica Chimica Acta. 66, 61–68.
Davies, J. A. (1996). Synthetic coordination chemistry: Principles and practice. World Scientific. ISBN 978-981-02-2084-6.
Dawodu, O. F., Meisen, A. (1996). Degradation of aqueous diethanolamine solutions by carbon disulfide. Gas Separation & Purification. 10 (1), 1 – 11.
Ding, J., Zhou, D., Spinks, G., Wallace, G., Forsyth, S., Forsyth, M., MacFarlane, D. (2003). Use of ionic liquids as electrolytes in electromechanical actuator systems based on inherently conducting polymers. Chemistry of Materials. 15, 2392–2398.
Durand, E., Lecomte, J., Barea, B., Piombo, G., Dubreucq, E., Villeneuve, P. (2012) Evaluation of deep eutectic solvents as new media for Candida antarctica B lipase catalyzed reactions. Process Biochemistry. 47, 2081-2089.
Earle, M. J., Seddon, K. R. (2000). Ionic liquids. Green solvents for the future. Pure and Applied Chemistry. 72 (7), 1391–1398.
Eggeman, T. (2007). Sodium and sodium alloys. Kirk-Othmer encyclopedia of chemical technology. John Wiley & Sons. ISBN: doi:10.1002/0471238961.1915040912051311.a01.pub2.
Endres, F. (2002). Ionic liquids: solvents for the electrodeposition of metals and semiconductors. A European Journal of Chemical Physics and Physical Chemistry. 3 (2), 144–154.
Endres, F. (2004). Ionic liquids: promising solvents for electrochemistry. Zeitschrift für Physikalische Chemie. 218, 255–283.
Fanning, T. H. (2007). Sodium as a fast reactor coolant. U.S. Nuclear Regulatory Commission. Topical Seminar Series on Sodium Fast Reactors.
Faridbod, M. R. G. F., Norouzi, P., Riahi, S., Rashedi, H. Application of room temperature ionic liquids in electrochemical sensors and biosensors, ionic liquids: applications and perspectives. (2011). Intech Publications. ISBN 978-953-307-248-7.
Forsyth, S. A., Pringle, J. M., MacFarlane, D. R. (2004). Ionic liquids-an overview. Australian Journal of Chemistry. 57, 113–119
Frackowiak, E., Lota, G., Pernak, J. (2005). Room-temperature phosphonium ionic liquids for supercapacitor application. Applied Physics Letters. 86, 164104–164106.
161
Galiński, M., Lewandowski, A., Stępniak, I. (2006). Ionic liquids as electrolytes. Electrochimica Acta. 51 (26) 5567 – 5580.
Gan, Q., Rooney, D., Zou, Y. (2006). Supported ionic liquid membranes in nanopore structure for gas separation and transport studies. Desalination. 199, 535–537.
Ganjali, M. R., Khoshsafar, H., Shirzadmehr, A., Javanbakht, M., Faridbod, F. (2009). Improvement of carbon paste ion selective electrode response by using room temperature ionic liquids (RTILs) and multi-walled carbon nanotubes (MWCNTs). International Journal of Electrochemical Science. 4 (3), 435–443.
Gatti, M., Tokatly, I., Rubio, A. (2010). Sodium: A charge-transfer insulator at high pressures. Physical Review Letters. 104 (21), 216–404.
George, A., Tran, K., Morgan, T. J., Benke, P. I., Berrueco, C., Lorent, E., Wu, B. C., Keasling, J. D., Simmonsa, B. A., Holmes, B. M. (2011). The effect of ionic liquid cation and anion combinations on the macromolecular structure of lignins. Green Chemistry. 13, 3375–3385
Giap, S. G. E. (2010). The hidden property of arrhenius-type relationship: viscosity as a function of temperature. Journal of Physical Science, 21 (1), 29–39.
Gorke, J., Srienc, F., Kazlauskas, R. (2010). Toward advanced ionic liquids. Polar, enzyme-frienddly solvents for biocatalysis, Biotechnology and Bioprocess Engineering. 15, 40–53.
Gray, M. L., Champagne K. J., Fauth, D., Baltrus, J. P., Pennline, H. (2008). Performance of immobilized tertiary amine solid sorbents for the capture of carbon dioxide. International Journal of Greenhouse Gas Control. 2 (1), 3 – 8.
Greaves, T. L., Drummond, C. J. (2008). Protic ionic liquids: properties and applications. Chemical Reviews. 108, 206–237.
Greenlee, K. W., Henne, A. L., Fernelius, W. C. (1946). Sodium amide. Inorganic Syntheses. 2, 128–135.
Greenwood, N. N., Earnshaw, A. (1997). Chemistry of the elements. (2nd ed.). Butterworth–Heinemann. 819–824. ISBN 0750633654.
Hagiwara, R., Ito, Y. (2000). Room temperature ionic liquids of alkylimidazolium cations and fluoroanions. Journal of Fluorine Chemistry. 105, 221–227.
Hale, G. M., Querry, M. R. (1973). Optical constants of water in the 200-nm to 200-µm wavelength region. Applied Optics. 12, (3) 555–563.
Handy, T. S. (2011). Applications of ionic liquids in science and technology. Intech publications. ISBN 978-953-307-605-8.
Hayward, T. (2010). British petroleum statistical review of world energy.
Hayyan, A., Mjalli, F. S., AlNashef, I. M, Al-Wahaibi, T., Al-Wahaibi, Y. M., Hashim, M. A. (2012). Fruit sugar-based deep eutectic solvents and their physical properties. Thermochimica Acta. 541, 70– 75.
162
Hayyan, A., Mjalli, F. S., AlNashef, I. M., Al-Wahaibi, Y. M., Al-Wahaibi, T., Hashim, M. A. (2013). Glucose-based deep eutectic solvents: physical properties. Journal of Molecular Liquids. 178, 137 – 141.
Holbrey, J. D., Reichert, W. M., Reddy, R. G., Rogers, R. D. (2003). Heat capacities of ionic liquids and their applications as thermal fluids. ACS Symposium Series: Ionic Liquids as Green Solvents. 856, 121–133.
Holleman, A. F., Wiberg, E. (2001). Inorganic chemistry. Academic Press: San Diego. ISBN-10:0123526515.
Hou, Y., Gu, Y., Zhang, S., Yang, F., Ding, H., Shan, Y. (2008). Novel binary eutectic mixtures based on imidazole. Journal of Molecular Liquids. 143, 154–159.
Houshmand, A., Shafeeyan, M. S., Arami-Niya, A., Daud, W. M. A. W. (2013). Anchoring a halogenated amine on the surface of a microporous activated carbon for carbon dioxide capture. Journal of the Taiwan Institute of Chemical Engineers. http://dx.doi.org/10.1016/j.jtice.2013.01.014
http://www.prosim.net
Huang, J-F., Chen, P-Y., Sun, I.-W., Wang, S. P. (2001). NMR evidence of hydrogen bond in 1-ethyl-3-methylimidazolium-tetrafluoroborate room temperature ionic liquid, Spectroscopy Letters. 34, 591–603.
IAEA. (2007). Liquid metal cooled reactors: Experience in design and operation. IAEA-TECDOC-1569, VIENNA, ISBN 978–92–0–107907–7, ISSN 1011–4289.
Ilgen, F., Ott, D., Kralish, D., Reil, C., Palmberger, A., König, B. (2009). Conversion of carbohydrates into 5-hydroxymethylfurfural in highly concentrated low melting mixtures. Green Chemistry. 11, 1948–1954.
Irvin, D. J., Stenger-Smith, J. D. (2007). Electrochemical supercapacitors based on poly(xylyl viologen). Polymer Preprints. 48, 150-XXX.
Johnson, K. E. (2007). What’s an Ionic Liquid? The electrochemical society interface. 16,38–40.
Ju, Y. J., Lien, C. H., Chang K. H., Hu, C. C., Wong, D. S. H. (2012). Deep eutectic solvent-based ionic liquid electrolytes for electrical double-layer capacitors. Journal of the Chinese Chemical Society. DOI: 10.1002/jccs.201100698
Kareem, M. A., Mjalli, F. S., Hashim, M. A., AlNashef, I. M. (2010). Phosphonium-based ionic liquids analogues and their physical properties. Journal of Chemical and Engineering Data. 55, 4632–4637.
Kareem, M. A., Mjalli, F. S., Hashim, M. A., AlNashef, I. M. (2012a). Liquid-liquid equilibria for the ternary system (phosphonium based deep eutectic solvent-benzene-hexane) at different temperatures: a new solvent introduced. Fluid Phase Equilibria. 314, 52–59.
Kareem, M. A., Mjalli, F. S., Hashim, M. A., Hadj-Kali, M. K. O., Bagh, F. S. G., AlNashef, I. M. (2012b). Phase equilibria of toluene/heptane with tetrabutylphosphonium bromide based deep eutectic solvents for the potential

163
use in the separation of aromatics from naphtha. Fluid Phase Equilibria. 333, 47–54.
Ke, C., Li, J., Li, X., Shao, Z., Yi, B. (2012). Protic ionic liquids: an alternative proton-conducting electrolyte for high temperature proton exchange membrane fuel cells. RSC Advances, 2, 8953–8956.
Keppler, S. J., Messing, T. A., Proulx, K. B., Jain, D. K. (2003). Molten salt electrolysis of alkali metals. U.S. Patent 6,669,836B2.
Keskin, S., Kayrak-Talay, D., Akman, U., Hortaçsu, Ö. (2007). A review of ionic liquids towards supercritical fluid applications. Journal of Supercritical Fluids. 43, 150–180.
Kim, T. Y., Lee, H. W., Stoller, M., Dreyer, D. R., Bielawski, C. W., Ruoff, R. S., Suh, K. S. (2011). High-performance supercapacitors based on poly(ionic liquid)-modified graphene electrodes. ACS Nano. 5 (1), 436–442.
Klemm, D., Heublein, B., Fink, H. P., Bohn, A. (2005). Cellulose: fascinating biopolymer and sustainable raw material. Angewandte Chemie International Edition. 44, 3358–3393.
Kölle, P., Dronskowski, R. (2004). Synthesis, crystal structures and electrical conductivities of the ionic liquid compounds butyl dimethylimidazolium tetrafluoroborate, hexafluoroborate and hexafluoroantimonate. European Journal of Inorganic Chemistry. 2313–2320.
Kroschwitz, J. I. (1995). Kirk-Othmer encyclopedia of chemical technology. John Wiley & Sons (New York). ISBN: 9780471238966.
Lewandowski, A., Swiderska-Mocek, A. (2009). Ionic liquids as electrolytes for Li-ion batteries—An overview of electrochemical studies. Journal of Power Sources. 194 (2), 601–609.
Li, X., Hou, M., Han, B., Wang, X., Zou, L. (2008). Solubility of CO2 in a choline chloride + urea eutectic mixture. Journal of Chemical and Engineering Data. 53, 548–550.
Lindberg, D., Revenga, M. F., Widersten, M. (2010). Deep eutectic solvents (DESs) are viable cosolvents for enzyme-catalyzed epoxide hydrolysis. Journal of Biotechnology. 147, 169-171.
Mavrovic, I., Shirley, R., Coleman, G. (2010). Urea, Kirk-Othmer encyclopedia of chemical technology, John Wiley & Sons (New York). ISBN:13-978-0-9827779-7-8
Morrison, H. G., Sun, C. C., Neervannan, S. (2009). Characterization of thermal behavior of deep eutectic solvents and their potential as drug solubilization vehicles. International Journal of Pharmaceutics. 378, 136–139.
Namisnyk, A. M. (2003). A survey of electrochemical supercapacitor technology. Project paper, University of Sydney.
Noda, A., Susan, M. A. B. H., Kudo, K., Mitsushima, S., Hayamizu, K., Watanabe, M. (2003). Brønsted acid−base ionic liquids as proton-conducting nonaqueous electrolytes. The Journal of Physical Chemistry B. 107 (17), 4024–4033.

164
Palmieri, V., Mondin, G., Rampazzo, V., Rizzetto, D., Rupp, V., Stivanello, S., Deambrosis, S., Rossi, A. A. (2009). Niobium electropolishing by ionic liquids: What are the naked facts? Proceedings of SRF2009, Berlin, Germany, Cavity preparation and production. 463–465.
Pandey, S. (2006). Analytical applications of room-temperature ionic liquids: A review of recent efforts. Analytica Chimica Acta. 556, 38–45
Paterson, D. S., Chance, M. (1966). Production of sodium, U.S. patent 3,257,297.
Pearson, D. R., Aranoff, S. L., Okun, D. T., Lane, C. R., Williamson, I. A., Pinkert, D. A. (2008). Sodium metal from France. US International Trade Commission. Investigation No. 731-TA-1135.
Peng, B., Zhu, J., Liu, X., Qina, Y. (2008). Potentiometric response of ion-selective membranes with ionic liquids as ion-exchanger and plasticizer. Sensors and Actuators B. 133, 308–314.
Pereiro, A. B.,Legido, J. L., Rodriguez, A. (2007). Physical properties of ionic liquids based on 1-alkyl-3-methylimidazolium cation and hexafluorophosphate as anion and temperature dependence. The Journal of Chemical Thermodynamics. 39 (8), 1168–1175.
Pesaran, A. A., Markel, T., Tataria, H. S., Howell, D. (2007). Battery requirements for plug-in hybrid electric vehicles - analysis and rationale. 23rd International Electric Vehicle Symposium. Califronia.
Petkovic, M., Seddon, K. R., Rebelo, L. P. N., Pereira, C. S. (2011). Ionic liquids: a pathway to environmental acceptability. Chemical Society Reviews. 40, 1383–1403
Plechkova, N. V., Seddon, K. R. (2007). Applications of ionic liquids in the chemical industry. Chemical Society Reviews. 37, 123–150.
Prausnitz, J. M., Lichtenthaler, R. N., de Azevedo, E. G. (1999). Molecular thermodynamics of fluid-phase equilibria. 3rd Edition. Prentice Hall, London, UK. International. ISBN-10: 0139777458.
Pringle, J. M., Forsyth, M., MacFarlane, D. R., Wagner, K., Hall, S. B., Officer, D. L. (2005). The Influence of the monomer and the ionic liquid on the electrochemical preparation of polythiophene. Polymer. 46, 2047–2058.
Reinhardt, D., Ilgen, F., Kralisch, D., Konig B., Kreisel, G. (2008). Evaluating the greenness of alternative reaction media. Green Chemistry. 10, 1170–1181.
Ramesh, S., Shanti, R., Morris E. (2012). Studies on the plasticization efficiency of deep eutectic solvent in suppressing the crystallinity of corn starch based polymer electrolytes. Carbohydrate Polymers, 87, 701-706.
Renfrow Jr, W. B., Hauser, C. R. (1939). Sodium triphenylmethyl. Organic Syntheses. 2, 607.

165
Renon, H., Prausnitz, J. M. (1968). Local compositions in thermodynamic excess functions for liquid mixtures. Journal of American Institute of Chemical Engineers. 14 (3), 135–144.
Rui, C. (2010). Recovery of ionic liquids from lignocellulosic samples. Thesis. Central Ostrobothnia Universtiy of Applied Sceinces.
Saeed, R., Uddin, F., Masood, S., Asif, N. (2009). Viscosities of ammonium salts in water and ethanol + water systems at different temperatures. Journal of Molecular Liquids. 146 (3), 112–115.
Sandler, S. L. (1999). Chemical and engineering thermodynamics, 3rd Edition. John Wiley & sons. ISBN 10: 0471017744.
Santos, L. M. N. B. F., Lopes, J. N. C., Coutinho, J. A. P., Esperança, J. M. S. S., Gomes, L. R., Marrucho, I. M., Rebelo, L. P. N. (2007). Ionic liquids: first direct determination of their cohesive energy. Journal of the American Chemical Society. 129, 284–285.
Saravanan, G., Mohan, S. (2011). Electrodeposition of Fe-Ni-Cr alloy from deep eutectic system containing choline chloride and ethylene glycol. International Journal of Electrochemical Science. 6, 1468 – 1478.
Schach, M. O., Schneider, R., Schramm, H., Repke, J. U. (2010). Techno-economic analysis of postcombustion processes for the capture of carbon dioxide from power plant flue gas. Industrial Engineering Chemistry and Research. 49 (5), 2363 – 2370.
Seddon, K. R., Stark, A., Torres, M. J. (2000). Influence of chloride, water, and organic solvents on the physical properties of ionic liquids. Pure and Applied Chemistry. 72, 2275–2287.
Shahbaz, K., Baroutian, S., Mjalli, F. S., Hashim, M. A., AlNashef, I. M. (2012b). Prediction of glycerol removal from biodiesel using ammonium and phosphunium based deep eutectic solvents using artificial intelligence techniques. Chemometrics and Intelligent Laboratory Systems. doi:10.1016/j.chemolab.2012.06.005
Shahbaz, K., Baroutian, S., Mjalli, F. S., Hashim, M. A., AlNashef, I. M. (2012c). Densities of ammonium and phosphonium based deep eutectic solvents: Prediction using artificial intelligence and group contribution techniques. Thermochimica Acta. 527, 59–66.
Shahbaz, K., Ghareh Bagh, F. S., Mjalli, F. S., AlNashef, I. M., Hashim, M. A. (2013). Prediction of refractive index and density of deep eutectic solvents using atomic contributions. Fluid Phase Equilibria. 354, 304–311.
Shahbaz, K., Mjalli, F. S., Hashim, M. A., AlNashef, I. M. (2010). Using deep eutectic solvents for the removal of glycerol from palm-oil based biodiesel. Journal of Applied Sciences. 10 (24), 3349–3354.
166
Shahbaz, K., Mjalli, F. S., Hashim, M. A., AlNashef, I. M. (2011a). Eutectic solvents for the removal of residual palm oil-based biodiesel catalyst. Separation and Purification Technology. 81, 216–222.
Shahbaz, K., Mjalli, F. S., Hashim, M. A., AlNashef, I. M. (2011b). Using deep eutectic solvents based on methyltriphenylphosphunium bromide for the removal of glycerol from palm-oil-based biodiesel. Energy & Fuels. 25, 2671–2678.
Shahbaz, K., Mjalli, F. S., Hashim, M. A., AlNashef, I. M. (2011c). Prediction of deep eutectic solvents densities at different temperatures. Thermochimica Acta. 515, 67–72.
Shahbaz, K., Mjalli, F. S., Hashim, M. A., AlNashef, I. M. (2012a). Prediction of the surface tension of deep eutectic solvents. Fluid Phase Equilibria. 319, 48–54.
Sheldon, R. A., Lau, R. M., Sorgedrager, F., Rantwijk, K. V., Seddon, K. R. (2002). Biocatalysis in ionic liquids. Green Chemistry. 4, 147–151.
Shvedene, N. V., Borovskaya, S. V., Sviridov, V. V., Plentnev, I. V. (2005). Measuring the solubilities of ionic liquids in water using ion-selective electrodes. Analytical and Bioanalytical Chemistry. 381, 427-430.
Singh, V. V., Nigam, A., Batra, A., Boopati, M., Singh, B., Vijayaraghavan, R. (2012). Applications of ionic liquids in electrochemical sensors and biosensors. International Journal of Electrochemistry. 1–19.
Song, F., Zhao, Y., Cao, Y., Ding, J., Bu, Y., Zhong, Q. (2013). Capture of carbon dioxide from flue gases by amine-functionalized TiO2 nanotubes. Applied Surface Science. 268, 124 – 128.
Stenger-Smith, J. D., Irvin, J. A. (2009). Ionic liquids for energy storage applications. Material Matters. 4.4, 103.
Stenger-Smith, J. D., Webber, C. K., Anderson, N., Chafin, A. P., Zong, K., Reynolds, J. R. (2002). Poly(3,4-alkylenedioxythiophene)-based supercapacitors using ionic liquids as supporting electrolytes. Journal of the Electrochemical Society. 149 (8), A973–A977.
Streeter, V. L., Wylie, E. B., Bedford K. W. (1998). Fluid Mechanics. McGraw-Hill, New York, USA. ISBN 0-07-062537-9.
Swatloski, R. P., Holbrey, J. D., Rogers, R. D. (2003). Ionic liquids are not always green: hydrolysis of 1-butyl-3-methylimidazolium hexafluorophosphate. Green Chemistry. 5 (4), 361–363.
Thayer, A. M. (2008). Having the mettle for sodium markets. Chemical Engineering News. 86 (43), 20–21.
Thompson, J. S., Blank, H. M., Simmons, W. J., Bergmann, O. R. (2004). Low temperature alkali metal electrolysis. U.S. Patent 6,730,210B2.
Tsuda, T., Hussey, C. L. (2007). Electrochemical applications of room-temperature ionic liquids. The Electrochemical Society, Interface. 42–49

167
Vila, J., Franjo, C., Pico, J. M., Varela, L. M., Cabeza, O. (2007). Temperature behavior of the electrical conductivity of emim-based ionic liquids in liquid and solid states. Portugaliae Electrochimica Acta.25, 163–172
Wallace, T. (1953). The castner sodium process. Chemistry and Industry. 876–882.
Wang, J. (2007). Properties and applications of ionic liquids. China Textile Press. 13, 56–62.
Wasserscheid, P., Hal, R. V., Bösmann, A. (2002). 1-n-butyl-3-methylimidazolium ([bmim]) octylsulfate—an even ‘greener’ ionic liquid. Green Chemistry. 4, 400–404.
Wasserscheid, P., Keim, W. (2000). Ionic liquids—new “Solutions” for transition metal catalysis. Angewandte Chemie International Edition. 39, 3773-3789.
Weaver, K. D., Kim, H. J., Sun, J., MacFarlane D. R., Elliott, G. D. (2010). Green Chemistry. 12, 507–513.
Wells, A. F. (1984). Structural Inorganic Chemistry, Oxford: Clarendon Press. ISBN 0-19-855370-6.
Welton, T. (1999). Room temperature ionic liquids: Solvents for synthesis and catalysis. Chemical Reviews. 99, 2071–2084.
Wibowo, R., Aldous, L., Rogers, E. I., Jones, S. E., W., Compton, R. G. (2010). A study of the Na/Na+ redox couple in some room temperature ionic liquids. Journal of Physical Chemistry C. 114, 3618–3626.
Wildman, S. A., Crippen, G. M. (1999). Prediction of physicochemical parameters by atomic contributions. Journal of Chemical Information and Computer Sciences. 39, 868-873.
Wilkes, J. S., Levisky, J. A., Wilson, R. A., Hussey, C. L. (1982). Dialkylimidazolium chloroaluminate melts: a new class of room-temperature ionic liquids for electrochemistry, spectroscopy and synthesis. Inorganic Chemistry. 21, 1263–1264.
Wilkes, J. S., Zaworotko, M. J. (1992). Air and water stable 1-ethyl-3-methylimidazolium based ionic liquids. Journal of the Chemical Society, Chemical Communications. 965–967.
Yamada, M., Tago, M., Fukusako, S., Horibe, A. (1993). Melting point and supercooling characteristics of molten salt. Thermochimica Acta. 218, 401–411.
Yu, Y. H., Lu, X. M., Zhou, Q., Dong, K., Yao, H. W., Zhang. S. J. (2008). Biodegradable naphthenic acid ionic liquids: synthesis, characterization, and quantitative structure– biodegradation relationship. Chemistry - A European Journal. 14, 11174-11182.
Zakeeruddin, S. M., Graetzel, M. (2009). Solvent-free ionic liquid electrolytes for mesoscopic dye-sensitized solar cells. Advanced Functional Materials. 19 (14), 2187–2202.

168
Zhang, J., Bond, A. M. (2005). Practical considerations associated with voltammetric studies in room temperature ionic liquids. Analyst. 130, 1132–1147.
Zhang, Q., De Oliveira, V. K., Royer, S., Jérôme, F. (2012). Deep eutectic solvents: syntheses, properties and applications. Chemical Society Reviews. 41 (21), 7108-7146.
Zhao, H., Baker, G. A. (2013). Ionic liquids and deep eutectic solvents for biodiesel synthesis: a review. Journal of Chemical Technology and Biotechnology. 88 (1), 3–12.
Zheng, Y. H., Li, Z. F., Feng, S. F., Lucas, M., Wu, G. L., Li, Y., Li, C. H., Jiang, G. M. (2010). Biomass energy utilization in rural areas may contribute to alleviating energy crisis and global warming: A case study in a typical agro-village of Shandong, China. Renewable and Sustainable Energy Reviews. 14, 3132–3139.
Zhou, T., Chen, L. Ye, Y., Chen, L., Qi, Z., Freund, H., Sundmarcher, K. (2012). An overview of mutual solubility of ionic liquids and water predicted by COSMO-RS. Industrial Engineering and Chemistry Research. 51 (17), 6256–6264.

169
Appendix A
Research Outputs
Conferences
• Solubility and electrical conductivity of sodium chloride in selected ionic liquids.
The 8th Asia Pacific Conference on Sustainable Energy & Environmental
Technologies (APCSEET), Adelaide, Australia. 2011. F. Saadat Ghareh Bagh,
Farouq S. Mjalli, Mohd Ali Hashim, Inas M. Al-Nashef.
• Solubility of selected sodium salts in ionic liquids. 1st International Conference
on Ionic Liquids in Separation and Purification Technology, Sitges, Spain. 2011.
F. Saadat Ghareh Bagh, Farouq S. Mjalli, Mohd Ali Hashim, Inas M. Al-
Nashef.
• Solubility of Sodium Chloride in Benign Solvents. International Congress on
Green Process Engineering (GPE), Kuala Lumpur, Malaysia. 2011. F. Saadat
Ghareh Bagh, Farouq S. Mjalli, Mohd Ali hashim, Inas M. Al-Nashef.
• Solubility and Electrical Conductivity of Common Sodium Salts in Selected
Ionic Liquid (SHUSER), Kuala Lumpur, Malaysia. 2011. Inas M. AlNashef,
Farouq S. Mjalli, Mohd Ali Hashim, Maan Hayyan, F. Saadat.
• Application of Ionic Liquids as Green Solvents in Sodium Metal Production
from Common Salts, F. Saadat Ghareh Bagh, Farouq S. Mjalli, Mohd Ali
Hashim, Inas M. Al-Nashef. (ICERT 2012) 3rd international conference on
environmental research and technology, Penang, Malaysia.
• Solubility and Conductivity of Sodium Chloride in Benign Solvents, F. Saadat
Ghareh Bagh, Farouq S. Mjalli, Mohd Ali Hashim, Inas M. Al-
Nashef.(ICPEAM2012) International Conference on Process Engineering and

170
Advanced Materials, Kuala Lumpur, Malaysia.
• Reducing energy consumption in ethylene production by green solvents’
utilization. Mukhtar A. Kareem, Farouq S. Mjalli, Mohd Ali Hashim, Inas M.
AlNashef, Fatemeh S. Ghareh Bagh. 3rd international conference on
environmental research and technology (ICERT 2012), Penang, Malaysia.
• Application of deep eutectic solvents based on ethylene glycol and sulfplane for
the extraction of toluene from toluene/heptane mixtures. Mukhtar A. Kareem,
Farouq S. Mjalli, Mohd Ali Hashim, Inas M. AlNashef, Fatemeh S. Ghareh
Bagh. 2nd international conference on process engineering and advanced
materials (ICPEAM 2012), Kuala Lumpur, Malaysia.
• A Novel Electrolyte for Separation of Sodium Salt: A Study for Sodium
Solubility in Deep Eutectic Solvents, F. Saadat Ghareh Bagh, Farouq S.
Mjalli, Mohd Ali Hashim, Inas M. Al-Nashef, (Chemeca 2012), Quality of life
through chemical engineering, Wellington, New Zealand.
Journal Papers
• Solubility of Sodium Salts in Ammonium-based Deep Eutectic Solvents. Journal
of Chemical and Engineering Data. 2013, 58, 2154 − 2162. Fatemeh Saadat
Ghareh Bagh, Farouq S. Mjalli, Mohd Ali Hashim, Mohamed K.O. Hadj-Kali,
Inas M. Alnashef.
• Electrical conductivity of ammonium and phosphunium based deep eutectic
solvents: Measurements and artificial intelligence-based prediction. Fluid Phase
Equilibria. 2013, 356, 30 − 37. F.S. Ghareh Bagh, K. Shahbaz, F.S. Mjalli, I.M.
AlNashef, M.A. Hashim.
• Solubility of sodium chloride in ionic liquids. Fatemeh Saadat Ghareh Bagh,
Farouq S. Mjalli, Mohd Ali Hashim, Mohamed K. O. Hadj-Kali, Inas M.

171
AlNashef. Industrial Engineering and Chemical Research. 2013, 52, 11488 −
11493.
• Prediction of refractive index and density of deep eutectic solvents using atomic
contributions. Fluid Phase Equilibria. 2013, 354, 304 − 311. K. Shahbaz, F.S.
Ghareh Bagh, F.S. Mjalli, I.M. AlNashef, M.A. Hashim.
Patent
• Mohd. Ali Hashim, Farouq S. Mjalli, Inas M. Al-Nashef, F. Saadat Ghareh
Bagh, Mukhtar A. Kareem. Electrolysis process for producing Sodium metal
at a low operating temperature. Application No: PI 2012700369, Applicant:
Universiti Malaya. (Applied through University of Mlaya in Patent Cooperation
Treaty (PCT) International Application/ Overseas Patent)
Under Review Papers
• Solubility of sodium chloride in phosphonium based deep eutectic solvents.
Journal of Fluid Phase Equilibria. Fatemeh Saadat Ghareh Bagh, Farouq S.
Mjalli, Mohd Ali Hashim, Inas M. Al-Nashef, Mohamed Kamel Omar Hadj-
Kali.
• Physical and electrochemical properties of ZnCl2 based DESs. Finalizing to
submit to Journal of Chemical and Engineering Data. Fatemeh Saadat Ghareh
Bagh, Farouq S. Mjalli, Mohd Ali Hashim, Inas M. Al-Nashef.
Awards
• Selected as Bright Spark student under Bright Spark Unit/University of
Malaya, 2011-2013.