· npv17118 2 contents page no: introduction • about brailsford parish • parish statistics...
TRANSCRIPT

NPV17118
1
Brailsford Parish
Neighbourhood Plan 2013-2033 Submission Version
NPV17118
2
Contents Page No:
Introduction • About Brailsford Parish• Parish Statistics
Policy Context • National Considerations• Local Considerations• Parish Considerations
The Neighbourhood Plan • How this Plan was Made• Vision and Parish Objectives Statement• Policy Areas
Policy Area 1: Housing
Policy Area 2: Traffic Management and Accessibility
Policy Area 3: Green and Open Spaces
Policy Area 4: The Local Landscape and Wildlife
8
24
26
30
34
42
45
NPV17118
3
Policy Area 5: Community Wellbeing - Improving Amenities
Annex Design Policies Statement
Appendices Appendix 1: Report of PTB Traffic Management Services Appendix 2: Rationale for Designation of Local Green Space Appendix 3: The Brailsford & Ednaston Village Institute
Illustrations Plan 1: Location of Brailsford Parish in Derbyshire Dales District Plan 2: Brailsford - Civil Parish Boundary Map Plan 3: Brailsford Village and Conservation Area Plan 4: Extended Brailsford Village Development Boundary Plan 5: Statutory Historic Designations – Brailsford ParishPlan 6: Brailsford Parish - Green Space Plan 7: Brailsford Parish - ‘Public’ Open Space
54
66
59
NPV17118
4
Plan 8: Map of Brailsford Parish Showing Local Wildlife Sites
Plan 9: Landscape Character Types – Brailsford Parish
Plan 10: Brailsford Parish - Areas of Multiple Environmental Sensitivity (AMES)
Plan 11: Brailsford Parish – CPRE Dark Skies Mapping Plan 12: Habitat Map for Brailsford Parish Plan 13: Brailsford Parish -Agricultural Land
Classification

NPV17118
5
Plan 1: Location of Brailsford Parish in Derbyshire Dales District
NPV17118
6
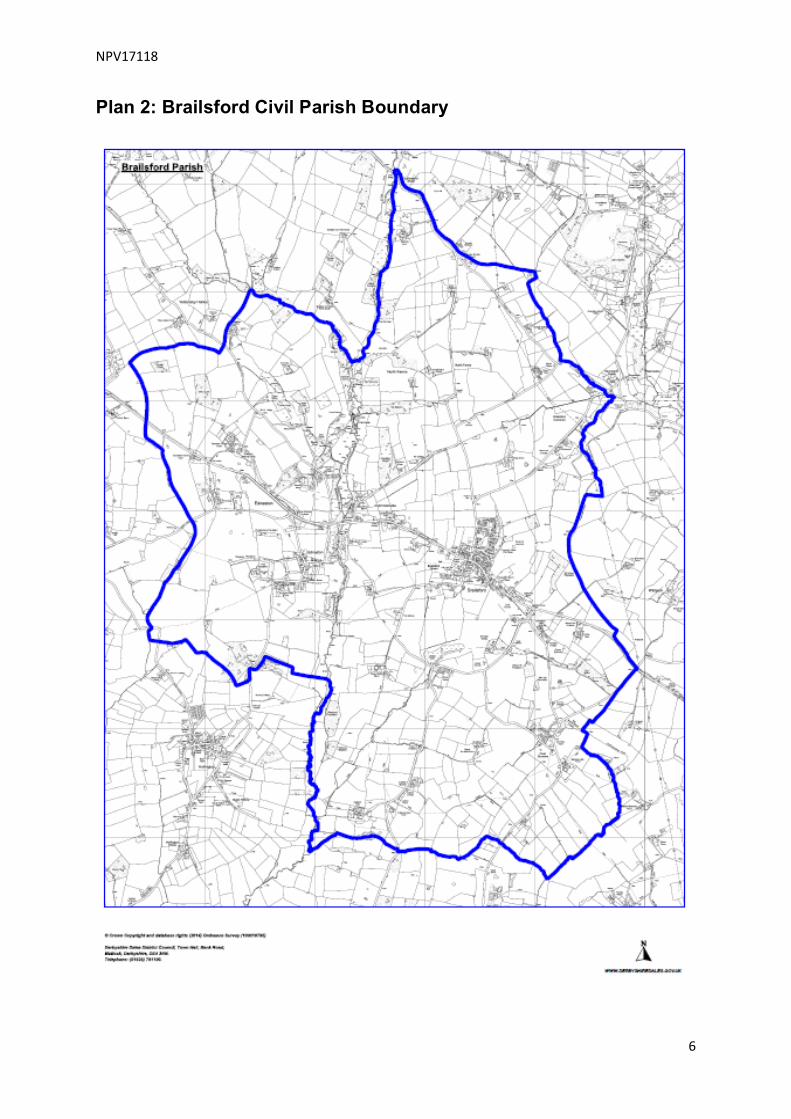
Plan 2: Brailsford Civil Parish Boundary

NPV17118
7
Plan 3: Brailsford Village Conservation Area
NPV17118
8
Introduction This Neighbourhood Plan sets out a vision for the Parish of Brailsford and the settlements of Brailsford & Ednaston until 2033. Brailsford Parish was designated as an official Neighbourhood Plan area on 7 April 2015. In accordance with Regulation 15 of the Neighbourhood Planning (General) Regulations 2012 the designated area is shown in Plan 1. The Neighbourhood Plan has been prepared in accordance with the statutory requirements and processes set out in the Town and Country Planning Act 1990 (as amended by the Localism Act 2011); Planning and Compulsory Purchase Act 2004; and the Neighbourhood Planning Regulations 2012. If adopted at referendum, this Plan will stand alongside the Derbyshire Dales Local Plan. Once adopted it will form part of the statutory development plan and will therefore be used in the determination of planning applications across the Plan area. This Plan supports the principles of sustainable development – that is the balance of environmental, social and economic principles that form the basis of the NPPF (National Planning Policy Framework)1. The NPPF quotes the UK Sustainable Development Strategy ‘Securing the Future’2 as setting out five ‘guiding principles’ of sustainable development:
• living within the planet’s environmental limits • ensuring a strong, healthy and just society • achieving a sustainable economy • promoting good governance • using sound science responsibly.
These principles form the basis of this Plan. Achieving organic growth across the Parish through the application of sustainable development principles is important to the residents of the Parish who wish to retain the quality of life offered by coherent village environments and small settlements within a rural setting. About Brailsford Parish Brailsford Parish, the selected Neighbourhood Plan area, is located in the southwest of the district of Derbyshire Dales and is situated on the main road between Derby and Ashbourne. It lies in the affluent of the River Dove. Settlements have been established in the Parish since Saxon times with Brailsford village identified in the Domesday Book. The Parish formed part of the hundred of Appletree. It was traditionally an agricultural area recognised mainly for its location on a major coaching route and described in 1835 as having ‘no manufactures, nor any extensive trade existing here’3. According to the 2011 Census4 the Parish covers an area of 2,237ha. 1 CLG: National Planning Policy Framework. March 2012 2 HM Government. Securing the Future. UK Sustainable Development Strategy. 2005 3 Pigot and Co's Commercial Directory for Derbyshire, 1835: 4 ONS: 2011 Census

NPV17118
9
The Parish consists of the villages of Brailsford & the hamlets of Ednaston, Culland and Over Burrows (see Plan 1), which complete its original four historic ‘manors’. It lies within NCA5 profile 68: Needwood & South Derbyshire Claylands and according to the 2011 Census is categorised by the Office of National Statistics as “Accessible Countryside” with Brailsford & Ednaston described as : “A village surrounded by inhabited Countryside”
Landscape Surrounding Brailsford Village: Hugh Stevenson Brailsford & Ednaston are linked by the Grade II listed 12th century All Saints Church, which stands equidistant between the two villages. The church is surrounded by rolling farmland and can still be accessed by the original cart track, now used as a bridleway.
All Saints Church: Hugh Stevenson In the 1831 census the Parish was recorded as having 780 residents. It has had limited growth, mainly in the settlements of Brailsford and Ednaston - in 2011 the ONS census recorded 1181 residents – and it has remained predominantly a rural area with agriculture as its dominant sector. This rurality is reflected by the population density of only 0.5 person per hectare. The Parish has 35 Listed Buildings identified in the Historic England Heritage Buildings List6. There are five country homes: Ednaston Lodge built in 1873 around an 18th century core and used recently as a Nursing Home: and four 20th century buildings - Brailsford Hall built in 1905 in Jacobean style; Culland Hall and Ednaston Hall constructed in the 1930s; and the Grade I listed Ednaston Manor built by Sir Edwin Lutyens in 1911.
5 Natural England: National Character Assessment Profiles 2014 6 www.britishlisteduildings.co.uk/england/derbyshire .
NPV17118
10
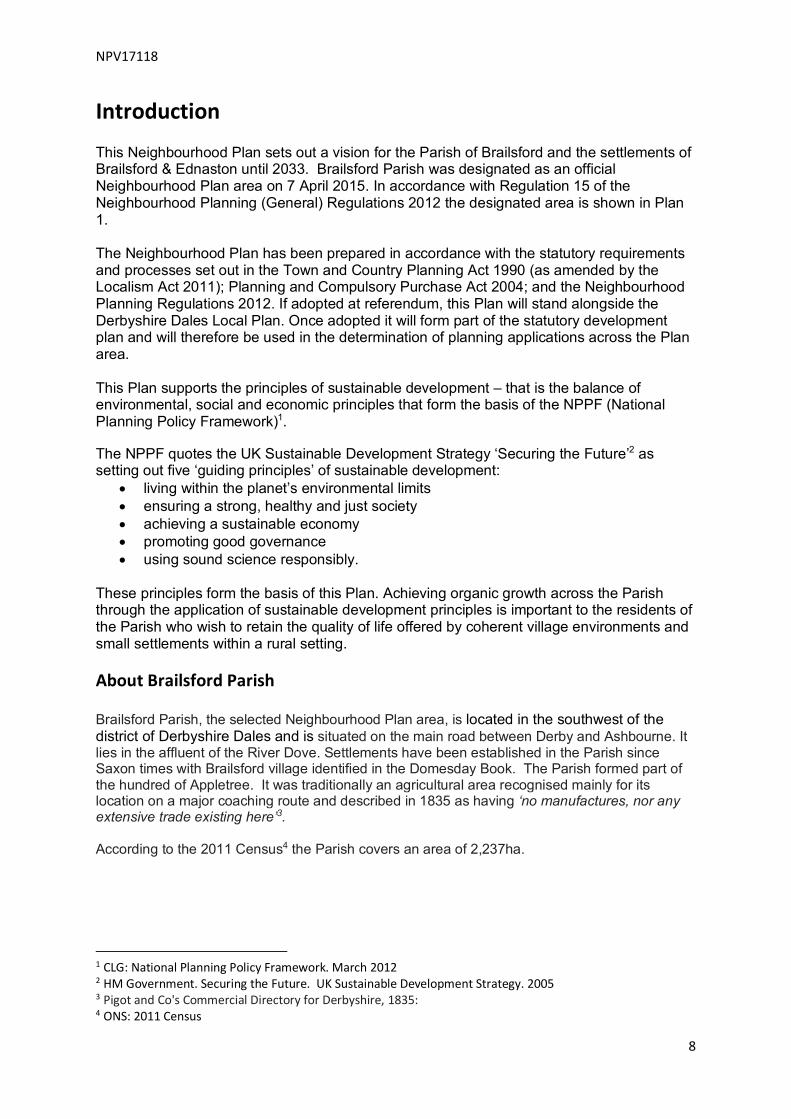
Brailsford Hall: Hugh Stevenson
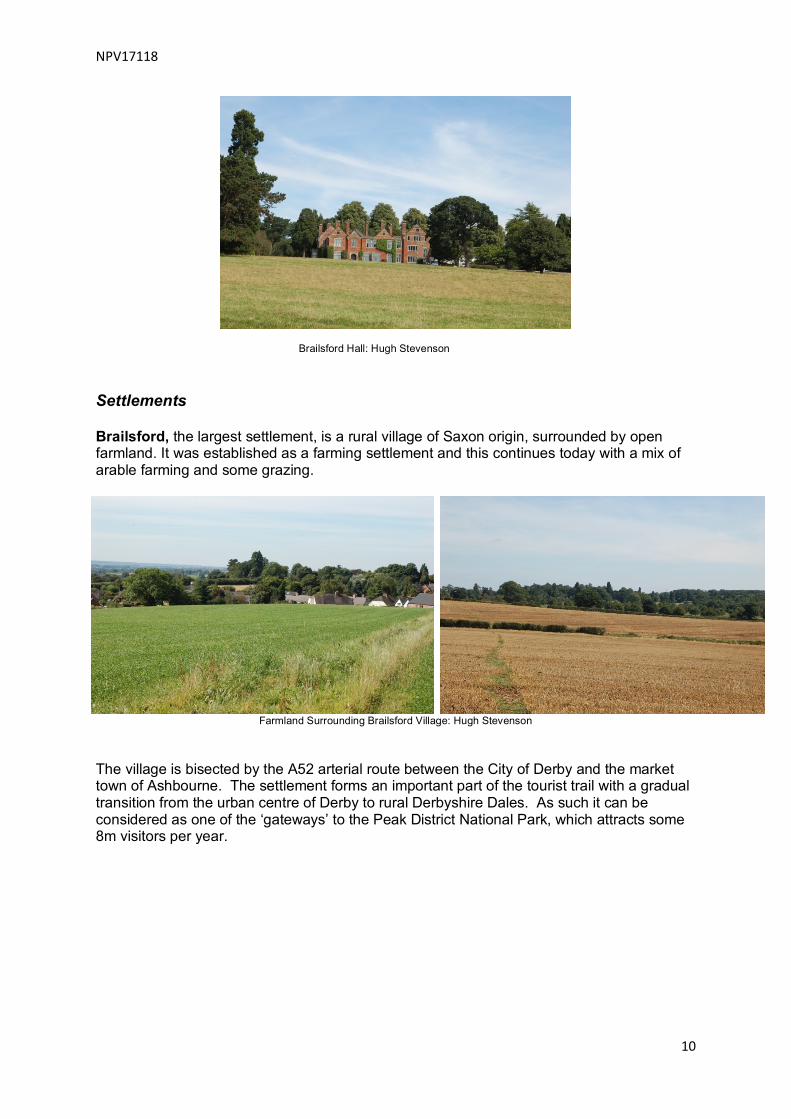
Settlements Brailsford, the largest settlement, is a rural village of Saxon origin, surrounded by open farmland. It was established as a farming settlement and this continues today with a mix of arable farming and some grazing.
Farmland Surrounding Brailsford Village: Hugh Stevenson The village is bisected by the A52 arterial route between the City of Derby and the market town of Ashbourne. The settlement forms an important part of the tourist trail with a gradual transition from the urban centre of Derby to rural Derbyshire Dales. As such it can be considered as one of the ‘gateways’ to the Peak District National Park, which attracts some 8m visitors per year.
NPV17118
11
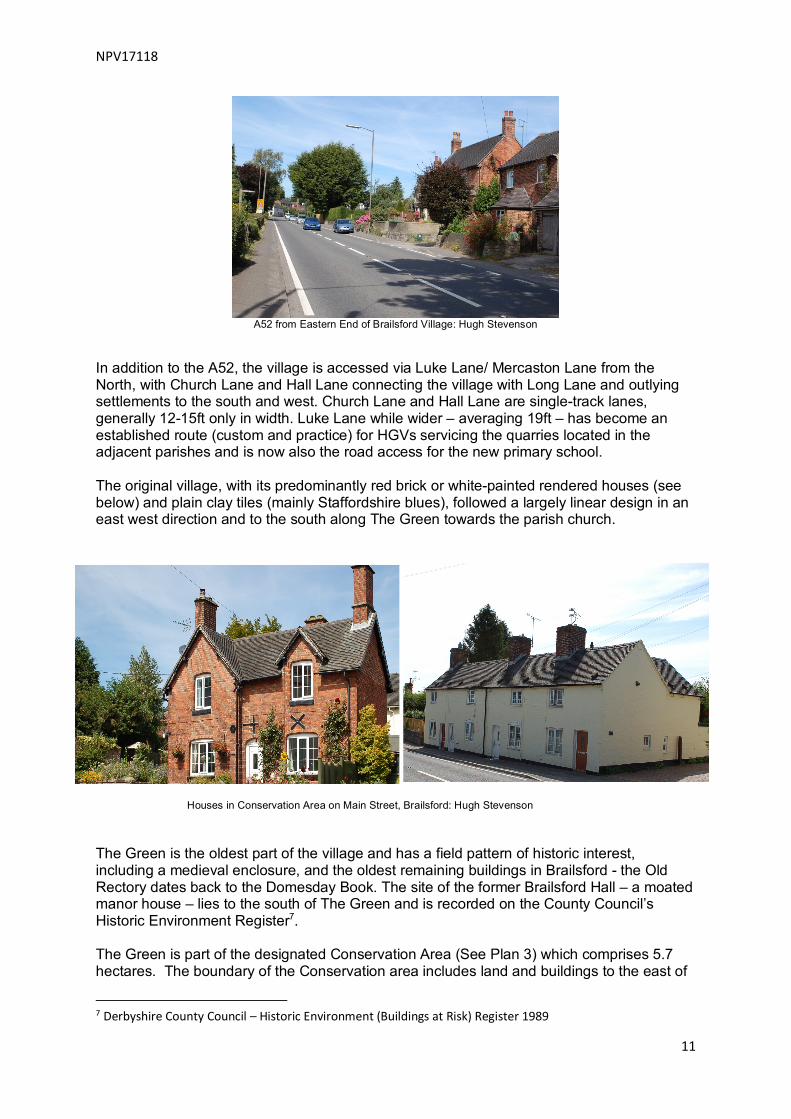
A52 from Eastern End of Brailsford Village: Hugh Stevenson
In addition to the A52, the village is accessed via Luke Lane/ Mercaston Lane from the North, with Church Lane and Hall Lane connecting the village with Long Lane and outlying settlements to the south and west. Church Lane and Hall Lane are single-track lanes, generally 12-15ft only in width. Luke Lane while wider – averaging 19ft – has become an established route (custom and practice) for HGVs servicing the quarries located in the adjacent parishes and is now also the road access for the new primary school. The original village, with its predominantly red brick or white-painted rendered houses (see below) and plain clay tiles (mainly Staffordshire blues), followed a largely linear design in an east west direction and to the south along The Green towards the parish church.
Houses in Conservation Area on Main Street, Brailsford: Hugh Stevenson The Green is the oldest part of the village and has a field pattern of historic interest, including a medieval enclosure, and the oldest remaining buildings in Brailsford - the Old Rectory dates back to the Domesday Book. The site of the former Brailsford Hall – a moated manor house – lies to the south of The Green and is recorded on the County Council’s Historic Environment Register7. The Green is part of the designated Conservation Area (See Plan 3) which comprises 5.7 hectares. The boundary of the Conservation area includes land and buildings to the east of
7 Derbyshire County Council – Historic Environment (Buildings at Risk) Register 1989
NPV17118
12
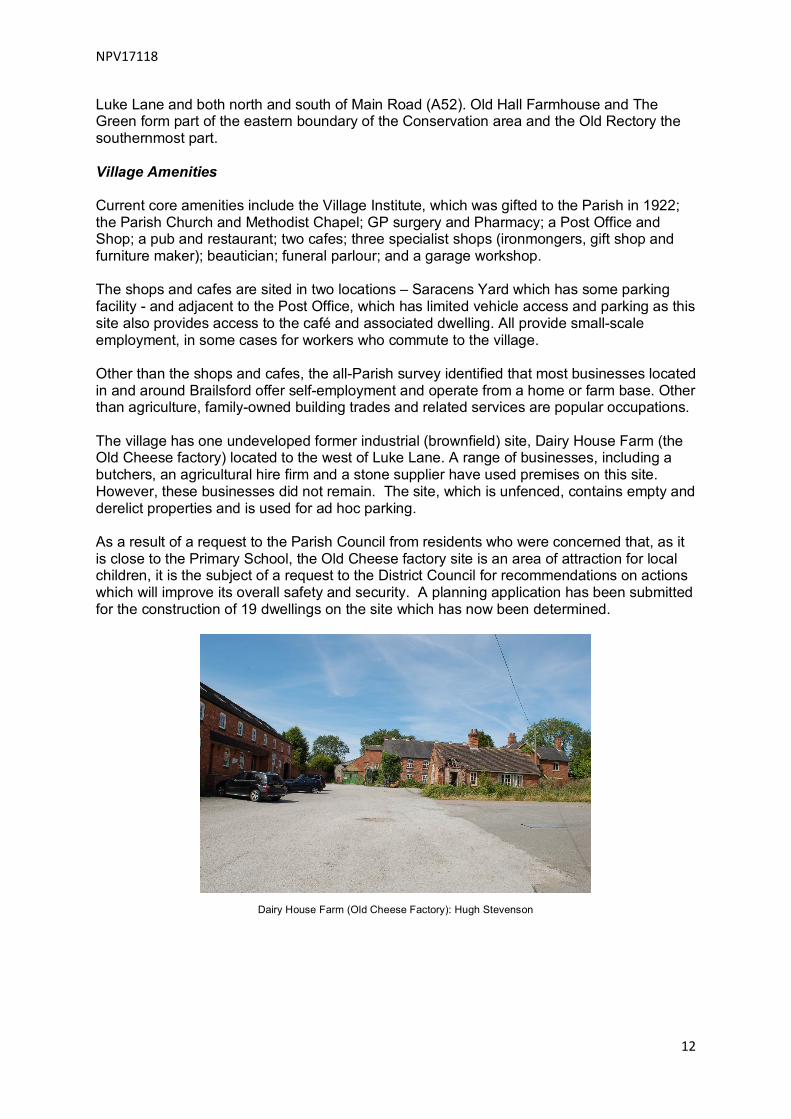
Luke Lane and both north and south of Main Road (A52). Old Hall Farmhouse and The Green form part of the eastern boundary of the Conservation area and the Old Rectory the southernmost part. Village Amenities Current core amenities include the Village Institute, which was gifted to the Parish in 1922; the Parish Church and Methodist Chapel; GP surgery and Pharmacy; a Post Office and Shop; a pub and restaurant; two cafes; three specialist shops (ironmongers, gift shop and furniture maker); beautician; funeral parlour; and a garage workshop. The shops and cafes are sited in two locations – Saracens Yard which has some parking facility - and adjacent to the Post Office, which has limited vehicle access and parking as this site also provides access to the café and associated dwelling. All provide small-scale employment, in some cases for workers who commute to the village. Other than the shops and cafes, the all-Parish survey identified that most businesses located in and around Brailsford offer self-employment and operate from a home or farm base. Other than agriculture, family-owned building trades and related services are popular occupations. The village has one undeveloped former industrial (brownfield) site, Dairy House Farm (the Old Cheese factory) located to the west of Luke Lane. A range of businesses, including a butchers, an agricultural hire firm and a stone supplier have used premises on this site. However, these businesses did not remain. The site, which is unfenced, contains empty and derelict properties and is used for ad hoc parking. As a result of a request to the Parish Council from residents who were concerned that, as it is close to the Primary School, the Old Cheese factory site is an area of attraction for local children, it is the subject of a request to the District Council for recommendations on actions which will improve its overall safety and security. A planning application has been submitted for the construction of 19 dwellings on the site which has now been determined.
Dairy House Farm (Old Cheese Factory): Hugh Stevenson

NPV17118
13
Village Growth Expansion of the village took place to the north, mainly during the 1970s and early 1980s, when small groupings of houses were built on The Plain, largely following the red brick and plain tile style.
1970s Development on the Plain, Brailsford: Hugh Stevenson No further large-scale development occurred until 2015-16 when work began on the construction of 50 additional dwellings on a site west of Luke Lane. This new estate was approved to finance the construction of a new primary school – a requirement from the Local Education Authority and supported by the District Council. The site, at the western end of the village, was selected after a public consultation on the options tabled by the District Council. At the time of approval for the new development, the existing village had a population of c 470 in some 260 properties. Approvals prior to 2016 (including Luke Lane) added some 75 additional houses. Allocations identified in the Derbyshire Dales Local Plan, which identifies Brailsford Village as a Tier 3 Settlement, allow for the construction of 114 additional houses on three sites to the north and west of the Village; a further 4.6 ha of development. A recent decision by the Planning Inspectorate on an Appeal made by a developer has increased the total by an additional 43 homes. In total this represents a c80% increase in village size; all at its western end. For clarity it should be noted that in the Derbyshire Dales Local Plan a Tier 3 Settlement is described as a village which possesses a limited level of some facilities and services that, together with improved local employment, provide the best opportunities outside the first and second tier settlements for greater self-containment. They will provide for reduced levels of development in comparison to higher order settlements in order to safeguard and, where possible, improve their role consistent with maintaining and enhancing key environmental attributes The previous village development boundary has been amended to accommodate these new homes. The revised village boundary as identified in the Derbyshire Dales Local Plan is shown on Plan 4 and has been taken into account in the development of the Neighbourhood Plan.

NPV17118
14
Plan 4: Proposed Settlement Development Boundary – Brailsford 2017
Source: Derbyshire Dales District Council
Brailsford Village runs into Commonside, which joins with Ednaston at its western end. Commonside includes the historic village mill site on Mill Lane. The Brailsford Brook crosses the A52 at the west end of Commonside and forms the boundary between the two main settlements. Ednaston, which is the second village, and more correctly described as a hamlet, lies on the other side of the Brailsford Brook. The catchment for Ednaston covers a wide area and incorporates properties on Painters Lane (A52), including Ednaston Manor and the Ruck o Stones designed by Lutyens; Yeldersley Lane, and parts of Derby Lane (to Shirley) and Hollington Lane. In the Derbyshire Dales Local Plan Ednaston is classified as a Tier 5 settlement (Policy S3), i.e. one which has ‘a lack of basic facilities to meet day to day requirements. However, there could be scope for very limited development within the physical confines of the settlement where this is limited to infill and consolidation of the existing built framework, or where there are opportunities for the redevelopment of brownfield sites, which will result in a positive environmental improvement, or where development constitutes exception sites for affordable housing’. No new building, other than the extension of existing properties or the conversion of disused agricultural buildings to residential, has taken place in Ednaston since the 1980s. The predominate traditional building style follows that of Brailsford with red brick and plain clay tiles as shown.

NPV17118
15
Hollington Lane, Ednaston with Grade II Listed Ednaston House on the Right: Hugh Stevenson Ednaston can be accessed from the A52 via Yeldersley Lane (which has restricted vehicle access) and Derby Road (Shirley/Hollington lanes). Hollington Lane runs through the centre of the village (as shown above) linking to Hollington and settlements in the southern Derbyshire Dales. There are no footpaths or pavements in the village centre. Ednaston has its own pub and restaurant, The Yew Tree Inn, which is designated as an Asset of Community Value; the amenity area of the Millennium Wood; and a recognised architectural property in the form of the Grade I listed Ednaston Manor, built by Sir Edwin Lutyens, with its surrounding Grade II Registered Historic Park and Garden8. There are three other Grade II listed properties including Ednaston House (see above).
Yew Tree Pub, Ednaston: Hugh Stevenson Ednaston has three employment sites. A small Industrial Site is located off Hollington Lane on the edge of the village, which includes a concrete products fabrication plant; the Mercaston Tree Company adjacent to the A52; and a small business park, also adjacent to the A52, which offers studio space and small business units in converted farm buildings.
8 Register of Parks and Gardens of Special Historic Interest

NPV17118
16
St Mary's Nursing Home, located in the former Ednaston Lodge on the village outskirts, was one of the Parish’s most significant employers but has recently closed with the loss of 55 jobs. It is now the subject of application for change of use to office accommodation. Over Burrows and Culland: Over Burrows is a hamlet that lies east of the village of Brailsford. Surrounded by farmland it consists of a series of dwellings that run along a road (Burrows Lane) which joins the historic Roman road, Long Lane. The hamlet of Culland lies south of the village of Brailsford. It consists of two working farms and eight houses in total. There have been various houses at Culland Hall since the 13th century; the most recent was built in the 1930s. On this site, there are Grade II listed stables dating from 1649. Culland Manor and Culland Mount Farm are also fine examples of 19th century architecture. The rich grassland in this area was used primarily for dairy farming. However, more recently the farming has become predominately arable and sheep. Parish Statistics This data taken from the 2011 ONS Census has been examined to enable the adoption of a ‘baseline’ for the Neighbourhood Plan, to help with the interpretation of data gathered from the All Parish survey, and to assist with the setting of priorities for the future of the Parish and its settlements. It should be noted that the census ‘parish’ (EO4002732) appears to have a minor variance from the Brailsford Parish boundary as defined for the Neighbourhood Plan area (see Plan.1). Community The Parish is categorised by the Office of National Statistics (ONS) as Countryside: Village Life5. Residents: 1181 Households: 475 Residents in individual households 1085 Residents in communal living: 30 Average household size: 2.35 At 2.35 this household size is slightly above the average for Derbyshire Dales and Derbyshire as a whole, which is 2.31. The gender split in the Parish as recorded by the 2011 census shows a higher percentage of females as below: Males: 47% Females: 53%

NPV17118
17
Figure 1: Population Density
Source: Rural Community Profile for Brailsford Parish (ACRE, OCSI and Rural Action Derbyshire)9
The continuing rural nature of the area is reflected by the population density of only 0.5 person per hectare compared with three people per hectare in Derbyshire as a whole, and 4.1 per hectare in England. The population by age is shown in the graph below (Fig. 2). While the percentage of children (defined as aged under 16) is largely similar to Derbyshire and England as a whole, the working age population is significantly lower at 57% than across Derbyshire and England at 64% and 65% respectively. Figure 2: Age Structure of the Parish
Source: Rural Community Profile for Brailsford Parish (ACRE, OCSI and Rural Action Derbyshire)
The percentage of residents aged 65+ is significantly higher at 25.4% - 7 points higher than Derbyshire as a whole, which is similar to the England total for this age range. However, the percentage of single pensioner households in Brailsford at 12.2% is equivalent to the England average at 12.4%.
9 Action with Communities in Rural England (ACRE) Rural evidence project with OCSI (Oxford Centre for Social Inclusion) and Rural Action Derbyshire: Rural Community Profile for Brailsford Parish. October 2013

NPV17118
18
The number of residents from the Black and Minority Ethnic (BME) category or those born outside the UK is very low at 2.2% and 3.4% respectively falling well below the England average of 20.2% and 13.4% respectively Housing The Census data shows that the Parish consists of the following accommodation types: % House or bungalow detached 55 House or bungalow semi-detached 26 Terraced 16 Flat/Maisonette/Apartments 3 These figures demonstrate that the Parish has a significantly higher proportion of detached properties - 14 points - than in Derbyshire Dales, 22 points higher than in Derbyshire and 32 points higher than for England as a whole. The prevailing tenure in the Parish is owner occupied (76%) with the second largest grouping private rental at 18%. There are very few Local Authority or Housing Association rental properties - totaling less than 5%. While the level of private rentals is equivalent to the England average, the availability of Local Authority or Housing Association rentals in the Parish is much lower (11 points below the Derbyshire average). Figure 3: Breakdown of Housing Tenures
Source: Rural Community Profile for Brailsford Parish (ACRE, OCSI and Rural Action Derbyshire)
Economy Figure 4 illustrates the range of educational attainment of residents of the Parish based on the 2011 Census data.

NPV17118
19
Figure 4: Educational Attainment Brailsford Parish – 2011 Census
Source: Derbyshire County Council 2011 census
This data shows that Brailsford residents have significantly higher level of qualification (38% Level 4 - degree or diploma) than those in Derbyshire Dales generally and in Derbyshire, with only 15% of the population with no qualifications compared to >20% in Derbyshire Dales and 25% in Derbyshire as a whole. The England average for higher qualifications is recorded as 27% of the population with 23% of the population with no qualifications. Educational attainment is also reflected in the predominant categories of employment as shown in Figure 5. Figure 5: Occupations in Brailsford Parish
Source: Rural Community Profile for Brailsford Parish (ACRE, OCSI and Rural Action Derbyshire)
Fifty three per cent of Brailsford residents are employed in managerial or professional roles compared with 37% and 41% in Derbyshire and England respectively, including London and the SE Counties. The predominant employment sectors are manufacturing, health and social

NPV17118
20
care and retail: all have limited opportunity to provide local employment, i.e. in the Parish thus indicating a high level of commuting to nearby Ashbourne (c 4 miles) or to main employment centres such as Derby, Nottingham, Birmingham, Manchester or Sheffield as Para 2.25 and Figure 4 of the Local Plan explain. This employment data represents a contrast to the possible opportunities identified by the Parish survey, which had agriculture (farming) as the highest potential for new jobs at 34%. Realistically agriculture has very limited employment opportunities as it is much more mechanised than historically, and often supplemented by one or two local contractors. Figure 6: Parish Survey: Preferred Employment Opportunities
Source: Brailsford Parish Survey 2015
Employment is high with 68% or residents classified as economically active and only 4% receiving any form of benefit compared with an England average of 10%. The categories of employment are shown in Figure 7. Figure 7: Employment Rates- 2011 Census Data
Source: Rural Community Profile for Brailsford Parish (ACRE, OCSI and Rural Action Derbyshire)
The fulltime employment rate is lower in the Parish than the England and Derbyshire averages at 34% and 39 % respectively but the number of self-employed is almost twice the England average at 18%. It should be noted that more residents work in the private sector than the England average. This data identifies the type of employment opportunity expected or sought by residents of the Parish and is unlikely to be met locally except by self-employment or the establishment of home-based micro-businesses. Responses to the Parish survey identified that self-

NPV17118
21
employment was highly represented but many local businesses were providing skilled trades, particularly in the construction sector. The following graph (Fig.8) shows that the travel time to employment centres and to key amenities such as a secondary school or a further education centre is more than twice the time required across Derbyshire Dales or 2.5 times the England average. Figure 8: Travel Time to Work
Source: Rural Community Profile for Brailsford Parish (ACRE, OCSI and Rural Action Derbyshire)
Access to public transport is limited to an hourly bus service running along the A52 between the centres of Ashbourne and Derby, from 0700h to 1900h, with an even more limited evening and Sunday service. The majority of journeys are therefore made by private car and the 2011 Census identified the following data for Car/Van availability per household: Figure 9: Car Ownership
Source: Rural Community Profile for Brailsford Parish (ACRE, OCSI and Rural Action Derbyshire)
Only 7% of households in the Parish have no access to a car or van compared with the England average of 25%, 14% in Derbyshire Dales and 20% in Derbyshire. By contrast forty percent of households in Brailsford Parish have two cars compared to 30% in Derbyshire

NPV17118
22
Dales and 29% in England as a whole; and 4% of households have four or more cars compared with 1% in England. These higher statistics reflect the rural nature of the Parish with limited public transport but may also be indicative of the level of commuting taking place. Heritage Brailsford Parish contains the Brailsford Village Conservation Area which was designated in July 1996 (See Plan 3), one listed monument located on The Green, 35 listed buildings, and five country homes including the Grade I listed Ednaston Manor as shown on Fig.10 below. Plan 5: Statutory Historic Designations – Brailsford Parish
The Parish remains predominantly an agricultural area with its history reflected in the well-supported annual Brailsford and Ednaston Ploughing and Hedgecutting Match which remains an important fixture in the farming calendar. Environment Some 75% of those responding to the Parish survey identified the rural environment and associated quality of life as their reason for residence in the Parish. The NCA3 places the Parish within NCA 68: Needwood and Southern Derbyshire Claylands – a ‘pastoral landscape’ dominated by mixed farming and features a dispersed pattern of villages and other settlements providing a range of ecosystems services – the benefits that people derive from the natural environment - with the area as a whole having a high Tranquillity rating in the CPRE Map of Tranquillity10. The NCA definitions also illustrate that the Parish contains some of the S4111 priority habitats and species, namely agricultural field margins and boundaries (hedgerows) and the presence of Great Crested Newts. According to the Derbyshire Landscape Descriptions12 the Parish has two types of landscape prevalent: 10 CPRE: Tranquillity Maps 2006 11 Natural Environment and Rural Communities Act (NERC) 2006
NPV17118
23
• Settled Plateau Farmlands • Estate Farmlands
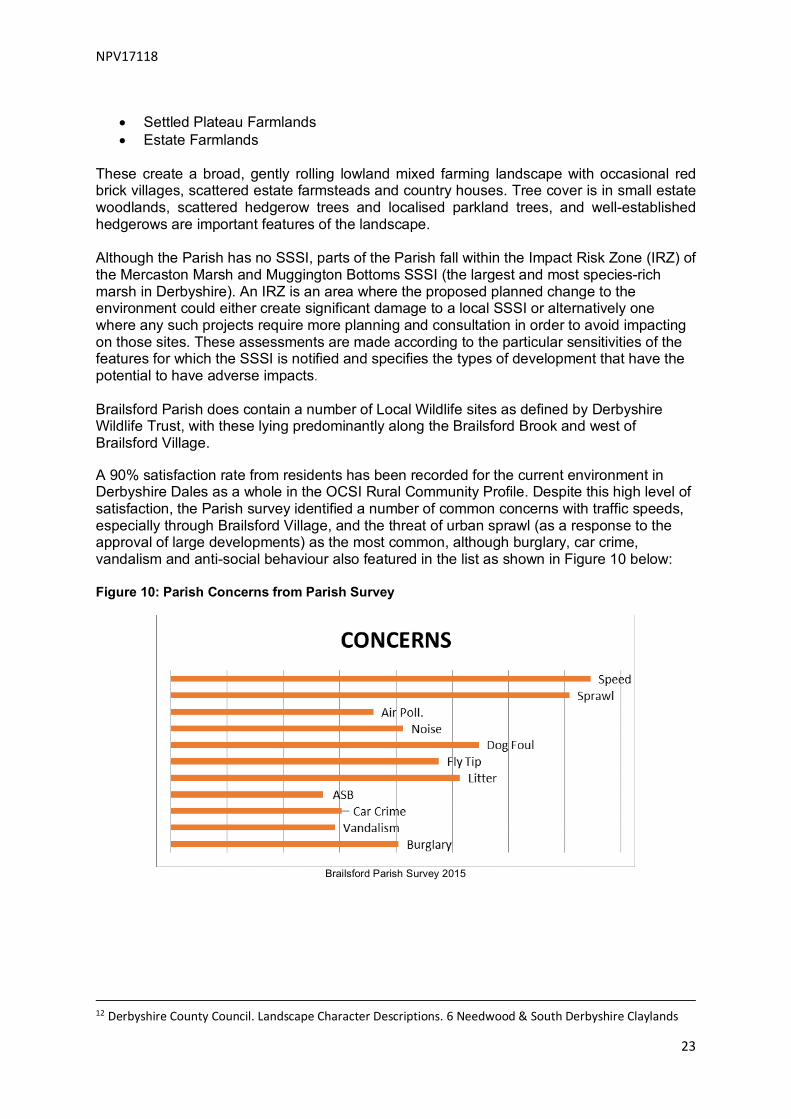
These create a broad, gently rolling lowland mixed farming landscape with occasional red brick villages, scattered estate farmsteads and country houses. Tree cover is in small estate woodlands, scattered hedgerow trees and localised parkland trees, and well-established hedgerows are important features of the landscape. Although the Parish has no SSSI, parts of the Parish fall within the Impact Risk Zone (IRZ) of the Mercaston Marsh and Muggington Bottoms SSSI (the largest and most species-rich marsh in Derbyshire). An IRZ is an area where the proposed planned change to the environment could either create significant damage to a local SSSI or alternatively one where any such projects require more planning and consultation in order to avoid impacting on those sites. These assessments are made according to the particular sensitivities of the features for which the SSSI is notified and specifies the types of development that have the potential to have adverse impacts. Brailsford Parish does contain a number of Local Wildlife sites as defined by Derbyshire Wildlife Trust, with these lying predominantly along the Brailsford Brook and west of Brailsford Village. A 90% satisfaction rate from residents has been recorded for the current environment in Derbyshire Dales as a whole in the OCSI Rural Community Profile. Despite this high level of satisfaction, the Parish survey identified a number of common concerns with traffic speeds, especially through Brailsford Village, and the threat of urban sprawl (as a response to the approval of large developments) as the most common, although burglary, car crime, vandalism and anti-social behaviour also featured in the list as shown in Figure 10 below: Figure 10: Parish Concerns from Parish Survey
Brailsford Parish Survey 2015
12 Derbyshire County Council. Landscape Character Descriptions. 6 Needwood & South Derbyshire Claylands

NPV17118
24
Policy Context This Neighbourhood Plan has been produced taking account of the primary legislative documentation, both national and local, and general guidance available to support the development of a Neighbourhood Plan as set out below. A full Basic Conditions statement has been prepared. The following provides a summary of the context against which the Neighbourhood Plan has been produced. National Considerations Neighbourhood Plans have been introduced as a result of the Localism Act 2011. The Government’s intention was to give local people the opportunity to decide what goes on in their neighbourhood but there are a number of constraints; the first of these being that all Neighbourhood Plans must conform to the framework given by higher-level planning policy. Therefore, the Brailsford Parish Neighbourhood Plan must have regard to the requirements of the NPPF (National Planning Policy Framework 2012). Consideration has therefore been given to the relevant key clauses of the NPPF in determining the policies set out in this Plan. District Considerations The Neighbourhood Plan must also be in general conformity with the strategic policies of the development plan for the area, including any saved policies of the Derbyshire Dales District Council Local Plan 2005, and the Derbyshire Dales Local Plan 2013-2033 and its associated evidence base. The approved Derbyshire Dales Local Plan accommodates the construction of some 5680 new homes over the plan period 2013-2033 – the requirement revised down from the 6400 identified by the Housing Needs Assessment in the Post EIP modifications (August 2017). Although Derbyshire Dales encompasses a large swathe of the Peak District National Park, the Park’s current policy limits new development within its boundaries so the majority of new homes will be located in the remaining parts of the District, including southern Derbyshire Dales and the Brailsford Parish. As the area of the Derbyshire Dales outside the National Park contains only three major settlements – its market towns – Ashbourne, Matlock and Wirksworth, the District Council has devised a Settlement Hierarchy to help it apportion the required numbers of new homes required to be accommodated in the Local Plan. The village of Brailsford is categorised as a Tier 3 settlement13 considered to have sufficient amenity to meet the needs of significant new development while maintaining the sustainable development principles set out in a strategic objective for the Plan (SO2)14. Ednaston is classified as a Tier 5 settlement. Parish Considerations The starting point for the development of the Neighbourhood Plan was an all Parish survey conducted in the early summer of 2015 (See Consultation Statement). The work was initiated by the Parish Council with the survey developed by a small group of residents, all volunteers, working with Parish Councillors. It was distributed to every household in the 13 Derbyshire Dales District Council: Derbyshire Dales Local Plan Submission August 2016 Policy S3 Settlement Hierarchy 14 Derbyshire Dales District Council: Derbyshire Dales Local Plan Submission August 2016. Strategic Objectives
NPV17118
25
Parish by post, and, in order to ensure a good response rate, each pack was delivered with an SAE to expedite survey returns. The survey covered all aspects of village life. In considering any further need for housing development, it recognised that Brailsford Village had already accepted the construction of an estate of 50 new homes, located on the western edge of the village. The size of this development was predicated by a decision taken at County and District level that funds were needed for the construction of a new village primary school and that these would be committed by the developer under a S106 agreement. A return rate of 55% was achieved for the survey. The responses were analysed and a summary statement issued by the Parish Council via the village website and at a public meeting when c 80 residents were given the opportunity to discuss the main findings. This consultation procedure is consistent with the requirements of the Localism Act, and the requirements of Regulation 14 of the Neighbourhood Planning (General) Regulations 2012. An example of the questionnaire and a summary of the results of the survey are included as Appendices1 and 2 in the Consultation Statement. The Key Issues identified from the survey were as follows:
• Village Environment, Integrity and Cohesion • Volume and Form of New Housing Provision • Traffic Management and Pedestrian Safety • Access to Public Open Space and Recreational Areas • Protection and Enhancement of Prevailing Landscape Characteristics and
Biodiversity • Protection and Enhancement of Infrastructure and Community Facilities
These Parish Issues are consistent with the relevant Key Issues (KI) identified by the District Council in the Derbyshire Dales Local Plan, namely: KI 1: Protecting and Enhancing the Character and Distinctiveness of the Landscape, Towns and Villages in the Plan Area KI 3: Addressing the Challenges of Climate Change KI 4: Meeting Housing Needs KI 5: Managing Travel Demand and Improving Accessibility KI 6: Protecting and Enhancing Community Infrastructure, Connectivity and Local Services KI 7: Protecting and Improving Leisure and Recreation Opportunities for Residents and Visitors KI9: Maintaining and Strengthening the vitality and Viability of Town and Village Centres. Neighbourhood Plan development has been influenced by the need to develop measures which reflect the issues identified by the Parish Survey and their alignment with Saved Policies retained from the adopted Local Plan 2005; work undertaken by the District Council to prepare the Derbyshire Dales Local Plan 2013-2033, including the SHLAA (Strategic Housing Land Assessment) 2015; the related Landscape Character Assessment15; and the approval of detailed planning applications for additional housing These approvals allow for new build of primarily 3, 4 or 5 bed-roomed homes and not the starter homes or bungalows prioritised in the responses to the Parish Survey and residents consultations (see Figure 12).
15 Wardell Armstrong. Landscape Character Assessment. 2015
NPV17118
26
The Neighbourhood Plan How this Plan was Made The Neighbourhood Plan has been formulated from the views and opinions expressed in the responses to the All Parish Questionnaire, at a series of public consultation events hosted by the Parish Council throughout 2015-17, the residents’ group formed in 2015, and developed by an expanded Neighbourhood Plan Development Group (supporting the Parish Council) which has met over the period Autumn 2015 – Summer 2017. Findings from these activities have been underpinned by external research, consultation with a range of stakeholders and a literature review. Background data relating to the current status of the Parish has been drawn from the 2011 National Census; a Census Summary Statement prepared by Derbyshire County Council; relevant ONS Statistics; the ACRE, OCSI and Rural Action Derbyshire Rural Community Profile for Brailsford; and Natural England’s National Character Area (NCA) profile. The process was started in April 2014 with a Public Meeting. Four further Public Meetings took place considering traffic and transport, public open space and play facilities and general amenities. A Neighbourhood Plan Development Group was formed in September 2014. The following key actions were then taken: October 2014 Formal request to DDDC for the designation of a Neighbourhood
Plan area from the Parish Council as Qualifying Body Discussions with a Neighbouring Parish Creation of a dedicated webpage on the Parish Council website
November 2014 Preparation of a Parish Survey Questionnaire April 2015 Neighbourhood Plan Area approved Survey Questionnaire distributed July 2015 Public Meeting to consider survey results November 2015 Meeting with DDDC representatives January- March 2016 Independent Traffic Assessment and Survey Consultations with key statutory bodies
NP Development Group Meetings April 2016 Public Meeting to consider draft Plan
NP Development Group Meetings May 2016 Input from Planning Consultant Meeting with DDDC
NP Development Group Meetings June 2016 Public Consultation on development site selection Discussions with potential developers July 2016 Public Consultation on site selection responses and traffic issues August 2016 Input from Design Consultancy and Rural Action Derbyshire
NP Development Group Meetings September 2016 Pre-submission meeting with a DDDC representative November 2016 Parish Council approves Plan and agree Pre-submission timetable December 2016 Preliminary Consultation with Stakeholders January 2017 Redrafting and Revisions Final Public Consultation publicising the inputs from the consultation March 2017 Pre-Submission Regulation 14 Consultation which was completed on
21 April 2017. May-June 2017 Health check and review of consultation comments July 2017 Approval by Parish Council for Formal Submission September 2017 Submission to Derbyshire Dales District Council for SEA

27
Further response from Derbyshire Dales District Council
Review of Council comments and additional work undertaken to ensure progress to external audit and local referendum
NPV17118
October 2017 November/ December 2017
05 February 2018 Resubmission
Full details are set out in the Consultation Statement.
Functioning of the Neighbourhood Plan Development Group (NPDG)
The NPDG was formed from volunteers identified at the Public Meetings and members of the Parish Council.
It has functioned as a full committee with a Chairman, with meetings minuted and minutes published. The Group received administrative support from the Parish Clerk and had access to the Parish Council website and notice boards as dissemination tools. An email group was established to facilitate communication.
The NPDG established a wider dissemination group as a virtual network and maintained regular liaison with an Action Group established in Brailsford village – Action Team Brailsford (ATB). ATB also provided a dissemination vehicle providing regular door-to-door distribution of updates and the use of social media through a Facebook page and Twitter account.
Funding
Funding for the preparation of the Neighbourhood Plan has been made available by:
• Two successful applications to the Locality fund (http://mycommunity.org.uk/take-action/neighbourhood-planning/) by the Parish Council
• Community funding received via a Just Giving account owned by the Parish Council.A separate financial statement has been maintained for this fund and is reportedregularly to the Parish Council and an external supervisor recruited from the localcommunity
External Professional Support
External professional support has been obtained from:
Two Planning Consultancies Neighbourhood Plan Consultancy Specialist Traffic Consultancy Design Consultancy
Other Sources
In addition to the All Parish Questionnaire, the Neighbourhood Group has drawn upon evidence from a range of published sources and stakeholder activity, including housing needs surveys undertaken in the Parish by the District Council (affordable housing) and the Peak District Rural Housing Association.
Vision and Parish Objectives Statement
The achievement of sustainable development in Brailsford Parish means a community which:

NPV17118
28
• Conserves the integrity of the village environment and the cohesion of its
communities by setting a level of development (and its form) within the Parish consistent with the rural environment in which the Parish is located
• Minimises encroachment onto surrounding green fields and supports the retention of the agricultural economy wherever possible
• Protects and enhances the landscape and associated biodiversity • Recognises the potential challenge and impact of climate change on the built and
natural environment, including CO2 emissions and flooding, and provides built-in resilience through appropriate design and use of natural infrastructure where possible
• Supports local employment opportunity consistent with maintaining and enhancing the rural environment
• Promotes sustainable transport by promoting public transport, community transport schemes and assisting with the development of sustainable travel plans
• Protects and enhances local amenity and services. Objectives The Parish Survey and associated consultations identified the following objectives for the future of the Parish, which must be considered when planning any further development: Priority 1: Sustaining the village integrity and cohesion in both Brailsford & Ednaston by carefully designing and managing any further expansion. Priority 2: Maintaining, complementing and enhancing the natural environment and retaining the rural identity of the Parish as a whole. Priority 3: Supporting development which meets the housing needs of local people by providing affordable homes and specially designed accommodation enabling older residents to downsize while staying within the community, and within close contact to family or friends that can provide personal care and so reducing the pressure on Social Care Services. Priority 4: Wherever possible recommending that new housing should be built as infill and in small groupings or clusters of houses, attractive as investments to local builders and not solely through the approval of housing estates. Priority 5: Providing high design standards in any future development which ensures that:
o any new building retains local distinctiveness or is complementary to a recognised vernacular style based on the use of local materials and conforming to the design criteria included in the Design Policies Statement (see Annex)
o creates appropriate green infrastructure, including both individual garden space and communal areas.
Priority 6: Encouraging measures which help minimise additional traffic movements, such as effective travel planning, and applying rigorous traffic management and road safety standards, including speed control mechanisms across the Parish and adequate offroad parking. Priority 7: Protecting, retaining and enhancing existing public open space and play areas. Priority 8: Retaining and enhancing village amenities and services and, in particular the PO, Shop and Village Institute which provides a community hub for the village. Priority 9: Increasing sports and leisure provision in the Parish especially for the young. With this Vision and associated objectives our community will specifically support the principles of:
• living within environmental limits

NPV17118
29
• ensuring a healthy society • using sound science (to identify the appropriate evidence base).
The Parish Council (the qualifying body) will treat the Neighbourhood Plan as an Action Plan, which will shape its policies, activities and local spending. As such, the Parish Council will be taking forward a case that any future S106 agreements (or Community Infrastructure Levy (CIL) funds) arising from permitted new development should be used to help deliver the Neighbourhood Plan’s ambitions. Where the ambitions lie outside the direct remit of planning and land use policy, the Neighbourhood Plan will be used to support applications for support to other public bodies and alternative funding streams. The Neighbourhood Plan policies have been separated into different themes (Objectives) relating to the priorities set by residents. These are described below:
Policy Areas
Our Plan comprises five policy areas:
• Housing • Traffic management and Accessibility • Green and Open Spaces • The Local Landscape and Wildlife • Community Wellbeing - Improving Amenities
Each section sets out the agreed policies and related requirements for the delivery of a high quality environment for all residents.
NPV17118
30
Policy Area 1: Housing
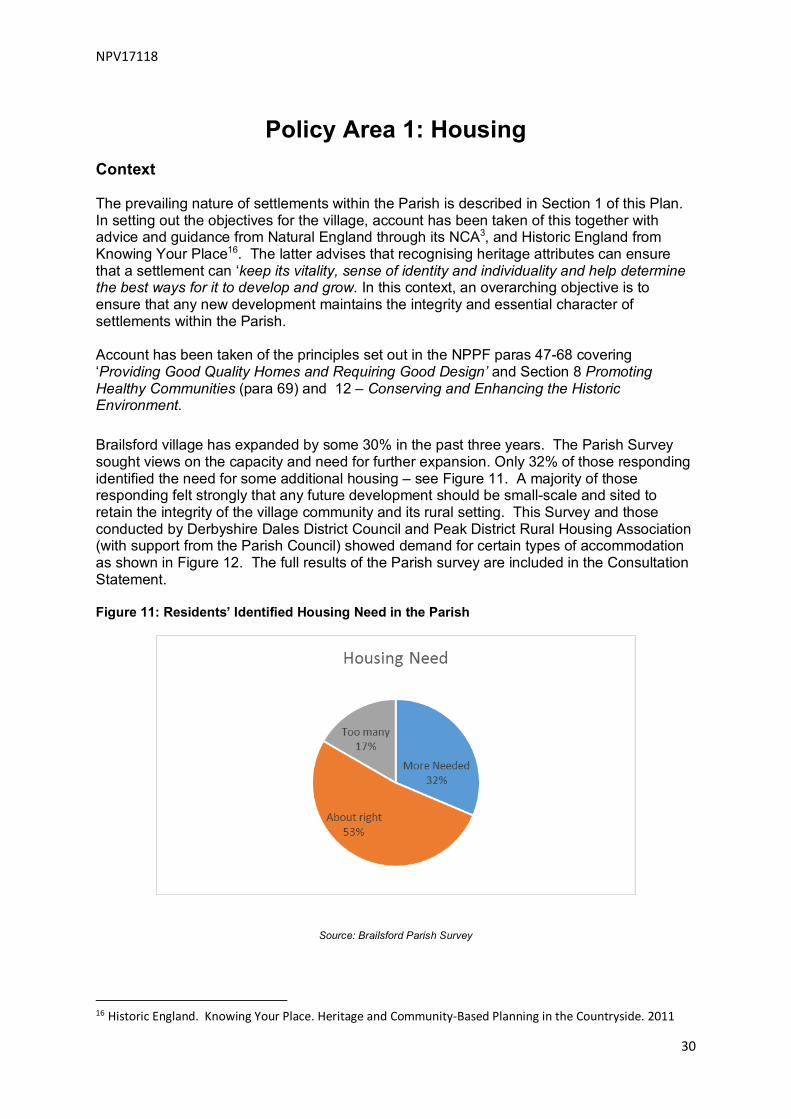
Context The prevailing nature of settlements within the Parish is described in Section 1 of this Plan. In setting out the objectives for the village, account has been taken of this together with advice and guidance from Natural England through its NCA3, and Historic England from Knowing Your Place16. The latter advises that recognising heritage attributes can ensure that a settlement can ‘keep its vitality, sense of identity and individuality and help determine the best ways for it to develop and grow. In this context, an overarching objective is to ensure that any new development maintains the integrity and essential character of settlements within the Parish. Account has been taken of the principles set out in the NPPF paras 47-68 covering ‘Providing Good Quality Homes and Requiring Good Design’ and Section 8 Promoting Healthy Communities (para 69) and 12 – Conserving and Enhancing the Historic Environment. Brailsford village has expanded by some 30% in the past three years. The Parish Survey sought views on the capacity and need for further expansion. Only 32% of those responding identified the need for some additional housing – see Figure 11. A majority of those responding felt strongly that any future development should be small-scale and sited to retain the integrity of the village community and its rural setting. This Survey and those conducted by Derbyshire Dales District Council and Peak District Rural Housing Association (with support from the Parish Council) showed demand for certain types of accommodation as shown in Figure 12. The full results of the Parish survey are included in the Consultation Statement. Figure 11: Residents’ Identified Housing Need in the Parish
Source: Brailsford Parish Survey
16 Historic England. Knowing Your Place. Heritage and Community-Based Planning in the Countryside. 2011

NPV17118
31
Figure 12 shows the types of housing believed by residents to be required: Figure 12: Residents’ Priority Housing Types
Source: Brailsford Parish Survey
As Figure 12 identifies, customised retirement homes and bungalows were the most popular option chosen for any additional housing plans, reflecting the demographic of the village. Housing: Our Policies Reasons for these Policies
The community wishes to retain the integrity, shape and characteristics of the village as described in Section 1 by minimising the use of greenfield sites; adopting designs and materials that are consistent with the location; and encouraging the creation of complementary development reflecting the historic character of the Parish’s settlements rather than recent uniform and urban style developments such as those shown below.
New Estate Development in Brailsford Village: Hugh Stevenson

NPV17118
32
Recognising that Brailsford Village, along with other rural settlements, will have development allocations which aim to meet the wider District Housing need as well as local requirements, residents are seeking a phased programme of future development, thus supporting the full integration of these new properties into the village environment, and encouraging the development of associated services and amenities to accommodate them. In particular they support small-scale development which meets particular local (and District) need such as the requirement for purpose-built bungalows for older residents who wish to downsize, therefore releasing family housing; and the construction of affordable starter homes for young people and those wishing to get onto the ‘housing ladder’. There is also a desire to ensure that any development is linked to local economic opportunity by encouraging the use of local tradesmen and craftspeople in any future construction. The Neighbourhood Plan therefore seeks to ensure that all new development is designed to align with local need as identified in the All Parish Questionnaire and external surveys conducted by Derbyshire Dales District Council (demand for affordable housing) and Peak District Rural Housing Association (bungalows designed for older people). It will do this through: Policy H1: Housing developments within the Parish, and as proposed by the Derbyshire Dales Local Plan, should be designed as small-scale clusters, with a mix of housing styles and forms, and provide a range of housing types, including affordable homes, two and three bedroom dwellings, and bungalows which meet the needs of the elderly and people with disabilities. Policy H2: Housing infill, development on brownfield sites within the settlement boundary as proposed in the draft Derbyshire Dales Local Plan, and the conversion of existing buildings within the Parish to residential use will be supported where these are small-scale and contribute positively to local character, do not create significant traffic impact on roads in and around the Parish, and where these help to meet local housing needs. Policy H3: The construction of individual new homes or modifications to existing properties will be supported where the scale and design is appropriate to the environment and suitable complementary building materials are used to maintain local distinctiveness. Policy H4: Small development sites, which can accommodate self-build or the construction of individual homes to be provided by local builders and craftspeople, thereby creating local employment opportunity will be supported. Policy H5: Large-scale development located within or adjacent to the conservation area which is deemed likely to create loss of significance or substantial harm (as set out in NPPF 134) will not be supported.
Policy H6: All new development should meet the following criteria set out in more detail in the Design Principles Statement (Annex):
• Is appropriate in terms of its scale, character and location consistent with maintaining the integrity of the village environment and the distinctive qualities of the landscape prevailing in the Parish
• Creates no significant impact on the surrounding rural landscape, views, vistas, habitats and biodiversity, and should maintain the appropriate balance of settlement size with the natural environment
• Is consistent with the current Derbyshire Dales Flood Risk Policy

NPV17118
33
• Ensures that design and build is consistent with the characteristic architecture of the area, with the use of building materials in keeping with the setting and rural environment
• Considers the conservation of heritage assets and their settings in a manner appropriate to their significance
• Keeps street furniture/streetscape and lighting to a minimum and is consistent and compatible with the prevailing environment, including the maintenance of dark skies
• Ensures that construction includes the highest standards of energy, waste and water efficiency using appropriate materials and equipment to support this
• Considers people and place, and that the approved design includes gardens of an appropriate scale to the property, green space and landscaping which reflects the prevailing ecology, and easily accessible and manageable communal areas.
• Allows for individual plots to include off road parking for at least two vehicles and garaging which can accommodate a mix of vehicle sizes.
• Allows, wherever possible, that construction contracts are let to increase local employment, and use local builders and tradespeople, including opportunities for training local young people.

NPV17118
34
Policy Area 2: Traffic Management and Accessibility
Context Requirements of Published Policy Paragraphs 29-41 of the NPPF focus on Sustainable Transport and state that planning applications and decisions should ensure that:
• the opportunities for sustainable transport modes have been taken up depending on the nature and location of the site, to reduce the need for major transport infrastructure
• safe and suitable access to the site can be achieved for all people • improvements can be undertaken within the transport network that cost effectively
limit the significant impacts of the development. Derbyshire County Council’s Third Local Transport Plan17 published in 2011 sets out a range of policies relating to new development, including a number which clearly refer to the need for improved spatial planning and for developer contribution to reduce the road safety and traffic impact in the locality of new development. These requirements together with the outputs from the Parish Survey form the basis for the proposals relating to traffic management and accessibility set out in this Plan. Parish Concerns The need for road safety enhancements and improved traffic management has been considered a major issue for the Parish over many years. Specific concerns identified in the Parish Survey included:
• The speed of vehicles entering and leaving the Parish and in particular in Brailsford and Ednaston villages
• The speed limit (50mph) through Commonside where there is a major bend and a number of hidden entrances to private property creating danger from vehicles slowing down to perform both left and right turns
• Lack of common car parking and the dangers caused by on-street parking, especially on the Main Road, Luke Lane and The Green in Brailsford: the latter resulting from traffic created by visits to the GP surgery
• The impact of HGV traffic through the villages, especially that turning onto Luke Lane, and along the narrow country lanes which cross the Parish
• The turning circle required for HGVs using the Luke Lane/A52 junction • The prevailing status of footpaths and pavements, the limited safe provision for
pedestrians and cyclists and the associated risks to pedestrian and cyclist safety thus reducing the intention of residents to reduce car travel
17 Derbyshire County Council Third Local Transport Plan 2011-2026
NPV17118
35
• Lack of external parking and a satisfactory arrangement for Drop Off facilities for parents at the new school site
• The irregularity of the current public transport with a bus route covering only the A52. • Perceived high level of accidents, including fatalities, on the A52.
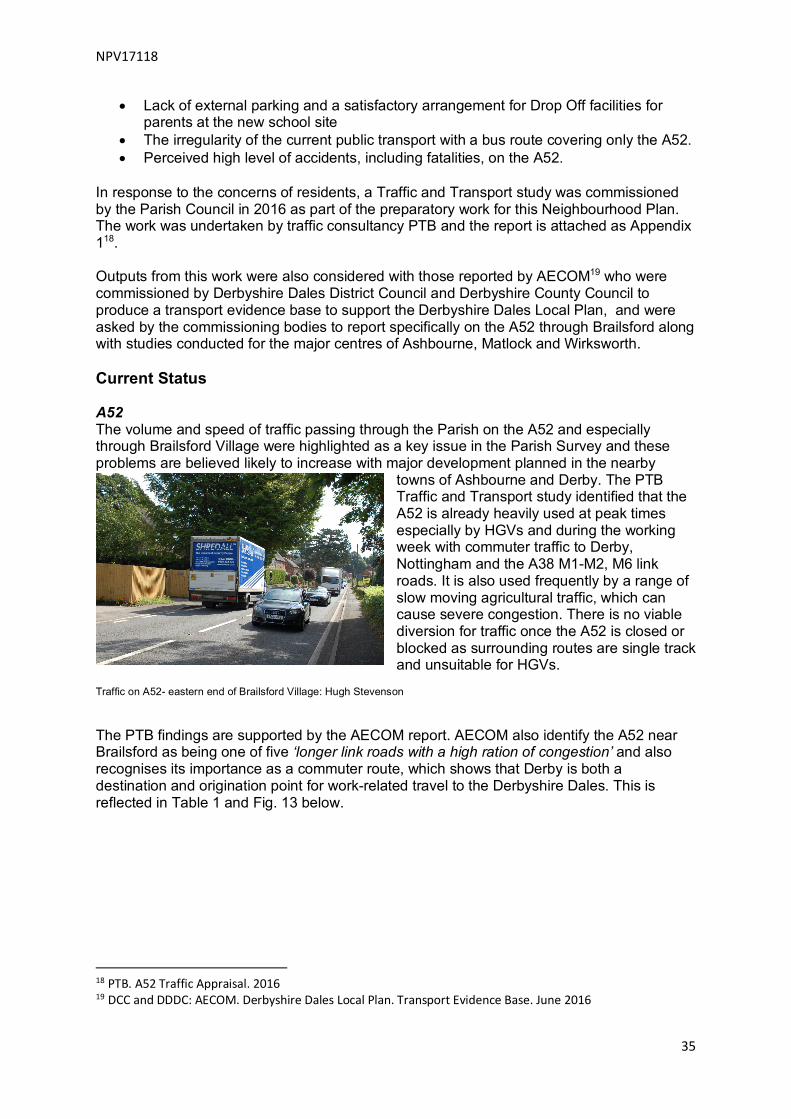
In response to the concerns of residents, a Traffic and Transport study was commissioned by the Parish Council in 2016 as part of the preparatory work for this Neighbourhood Plan. The work was undertaken by traffic consultancy PTB and the report is attached as Appendix 118. Outputs from this work were also considered with those reported by AECOM19 who were commissioned by Derbyshire Dales District Council and Derbyshire County Council to produce a transport evidence base to support the Derbyshire Dales Local Plan, and were asked by the commissioning bodies to report specifically on the A52 through Brailsford along with studies conducted for the major centres of Ashbourne, Matlock and Wirksworth. Current Status A52 The volume and speed of traffic passing through the Parish on the A52 and especially through Brailsford Village were highlighted as a key issue in the Parish Survey and these problems are believed likely to increase with major development planned in the nearby
towns of Ashbourne and Derby. The PTB Traffic and Transport study identified that the A52 is already heavily used at peak times especially by HGVs and during the working week with commuter traffic to Derby, Nottingham and the A38 M1-M2, M6 link roads. It is also used frequently by a range of slow moving agricultural traffic, which can cause severe congestion. There is no viable diversion for traffic once the A52 is closed or blocked as surrounding routes are single track and unsuitable for HGVs.
Traffic on A52- eastern end of Brailsford Village: Hugh Stevenson The PTB findings are supported by the AECOM report. AECOM also identify the A52 near Brailsford as being one of five ‘longer link roads with a high ration of congestion’ and also recognises its importance as a commuter route, which shows that Derby is both a destination and origination point for work-related travel to the Derbyshire Dales. This is reflected in Table 1 and Fig. 13 below.
18 PTB. A52 Traffic Appraisal. 2016 19 DCC and DDDC: AECOM. Derbyshire Dales Local Plan. Transport Evidence Base. June 2016

NPV17118
36
Table 1: Derbyshire Dales Travel to Work Commuter Movements (Employment Land Review 2008)
Source: AECOM Transport Evidence Base June 20
Figure 13: Commuting Destinations for Derbyshire Dales Residents
Source: AECOM Report (2011 Census) Figure 13 illustrates that in addition to the destination of Derby the A52 could be used as the commuter route for accessing South Derbyshire, East Staffordshire, Amber Valley and the City of Nottingham. There is perceived to be a high accident rate, including a number of recent fatalities on the A52 as it crosses the Parish. These include known incidents in Brailsford Village, Commonside (three fatalities) and in Ednaston, which were identified in the public consultations. The traffic report prepared for DDDC by AECOM specifically recognises the A52 Painters Lane/Derby Lane junction in Ednaston as a road safety ‘black spot’ based on the available STATS19 data system20 recording accidents with reported personal injury. In preparing the proposals for this Plan account was taken of the UK Government Road Accidents and Safety Statistics Data report21 which states that ‘the STATS19 data are therefore not a complete record of all injury accidents and this should be borne in mind when using and analysing the data. 20 ADLS: STATS19 Road Accident Data Set 21 UK Government Road Accidents and Safety Statistics Report. 2016

NPV17118
37
Car Use and Public Transport Census statistics show that car ownership levels in the Parish are high and well above local and national averages (see Figure 6) reflecting both the rural location and limited availability of public transport. The 2011 Census shows that in Brailsford Parish, 51% of households have two or more cars or vans and only 9% have no vehicle at all. In contrast, nationally, only 32% of all households have two or more cars and vans, and 26% have no vehicle at all (some three times more than locally). The Parish Survey results indicated that, based on those responding, 2/3 of residents rarely use public transport and this result has to be weighted against the proportion of responses from Brailsford village where access to the regular bus service along the A52 is relatively good. The general reason for lack of usage was the frequency and inflexibility of the current service. However, the results also showed that usage of scheduled public transport would be higher if there was some form of regular public transport in and around outlying parts of the Parish to connect with the scheduled service route. While increased investment in public transport is required for a modal shift to more sustainable transport methods, investment in rural transport is being reduced, with Derbyshire County Council considering an end to subsidies for some scheduled rural bus services along with reduced investment in community transport. In Brailsford Parish, community transport provides a limited accessible transport service for those with mobility problems who cannot use regular public transport. For Brailsford Parish reductions in bus subsidies could mean the loss of early morning and late afternoon/evening services for the Swift. However, information received from the Derbyshire Dales District Council (preliminary consultation) has indicated that there may be an opportunity for enhanced services funded through s106 agreements. Footpaths and Pavements
Highway maintenance budgets have also been significantly reduced resulting in less maintenance to footpaths and pavements. Where these footpaths exist (mainly in Brailsford and the approaches to the village) they are overgrown and much reduced in width. Lack of communal parking in and around the villages results in on street (and pavement) parking, which increases the danger to pedestrians, as well as causing road congestion.
Main Road Brailsford: Hugh Stevenson Current Traffic Flows The PTB study identified and reported the following:
NPV17118
38
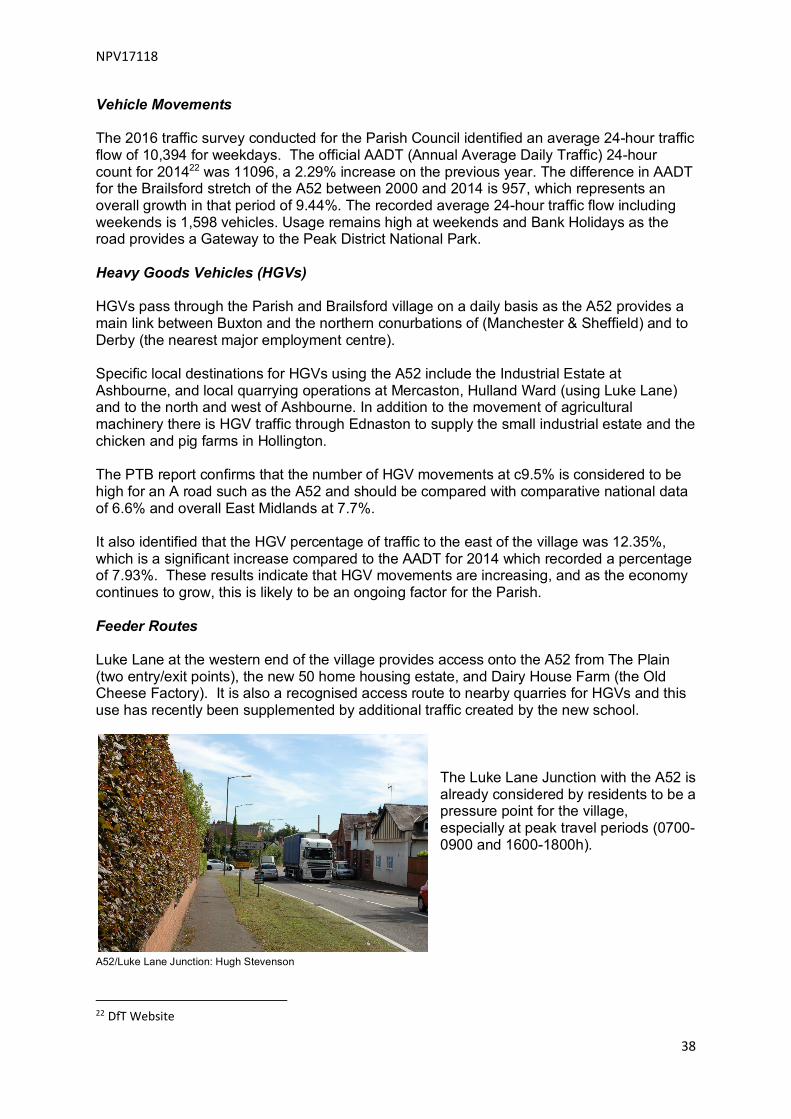
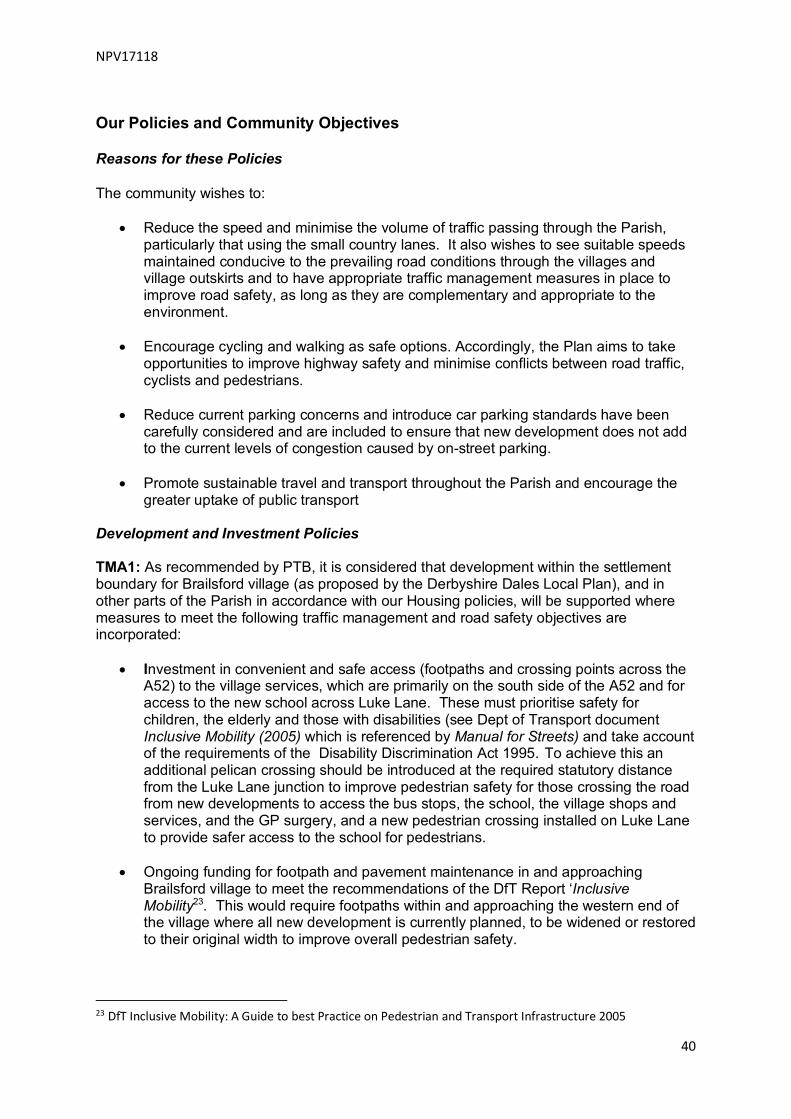
Vehicle Movements The 2016 traffic survey conducted for the Parish Council identified an average 24-hour traffic flow of 10,394 for weekdays. The official AADT (Annual Average Daily Traffic) 24-hour count for 201422 was 11096, a 2.29% increase on the previous year. The difference in AADT for the Brailsford stretch of the A52 between 2000 and 2014 is 957, which represents an overall growth in that period of 9.44%. The recorded average 24-hour traffic flow including weekends is 1,598 vehicles. Usage remains high at weekends and Bank Holidays as the road provides a Gateway to the Peak District National Park. Heavy Goods Vehicles (HGVs) HGVs pass through the Parish and Brailsford village on a daily basis as the A52 provides a main link between Buxton and the northern conurbations of (Manchester & Sheffield) and to Derby (the nearest major employment centre). Specific local destinations for HGVs using the A52 include the Industrial Estate at Ashbourne, and local quarrying operations at Mercaston, Hulland Ward (using Luke Lane) and to the north and west of Ashbourne. In addition to the movement of agricultural machinery there is HGV traffic through Ednaston to supply the small industrial estate and the chicken and pig farms in Hollington. The PTB report confirms that the number of HGV movements at c9.5% is considered to be high for an A road such as the A52 and should be compared with comparative national data of 6.6% and overall East Midlands at 7.7%. It also identified that the HGV percentage of traffic to the east of the village was 12.35%, which is a significant increase compared to the AADT for 2014 which recorded a percentage of 7.93%. These results indicate that HGV movements are increasing, and as the economy continues to grow, this is likely to be an ongoing factor for the Parish. Feeder Routes Luke Lane at the western end of the village provides access onto the A52 from The Plain (two entry/exit points), the new 50 home housing estate, and Dairy House Farm (the Old Cheese Factory). It is also a recognised access route to nearby quarries for HGVs and this use has recently been supplemented by additional traffic created by the new school.
The Luke Lane Junction with the A52 is already considered by residents to be a pressure point for the village, especially at peak travel periods (0700-0900 and 1600-1800h).
A52/Luke Lane Junction: Hugh Stevenson
22 DfT Website
NPV17118
39
While the 2016 PTB Traffic Appraisal identified that the junction was operating below capacity under current conditions, the modelling of conditions likely to pertain should all possible development take place at sites identified by the draft Local Plan has indicated that the junction would be at least at capacity or exceeding it if the proposed new developments are built. Congestion at the Luke Lane junction with the A52 can be exacerbated by its proximity to the junction of The Green and the A52. The majority of traffic uses The Green to access the GP surgery. As this has limited off street parking, on street parking approaching the junction (which has limited visibility) is also an issue here. There is only one footpath along the Green for part of its length only, and this increases the danger to pedestrians walking to the GP surgery. The PTB Traffic Report identified that The Green currently has a short-term traffic problem at peak hours for the surgery but otherwise has relatively low flows. Again, traffic volumes and parking are likely to be increased as a result of potential new development and greater use of the GP surgery and its facilities from across the Parish and surrounding districts as it currently has a catchment area which extends beyond the Brailsford Parish boundary. Future Volumes Modelling undertaken for the PTB Traffic report shows that if traffic growth remained similar over the next 10-year period, with no other changes, this would result in an increase per day of c1000 additional vehicles along the A52. However, the volume of commuter traffic could be expected to increase by a further 1200 car movements per weekday as a result of the 1000+ new homes in Ashbourne expected in the draft Derbyshire Dales Local Plan period (based on DfT estimate of 0.6 movements per home). This could be supplemented in Brailsford at peak times by some 180 car journeys relating to the proposed new developments, and additional HGV movements relating to the allocation of employment land at Ashbourne, Matlock and Wirksworth in the same time scale, as the A52 is a feeder route from the A38 and through Ashbourne to these locations. Major housing developments at Kirk Langley, Radbourne and Mackworth, east of Brailsford could also generate additional traffic on the route to Ashbourne, and will almost certainly result in significant congestion at the Markeaton Island when added to the increased volumes travelling from Ashbourne to Derby.
These issues were also identified in the AECOM report which concluded that it would be necessary to provide ‘some potential road improvement measures for the A52’ to provide a route treatment on the A52 through Brailsford to provide a better sense of being within a village centre than currently appears to the motorist passing through (although this would be to the detriment of trips using the A52 as a through route, e.g. between Derby and Ashbourne). The recommendations included:
• gateway features (to Brailsford Village) • replacement of the Luke Lane junction with a mini-roundabout • installation of further pedestrian crossing facilities (in the form of pelican crossings).
Although unlikely to influence the growth in traffic movements on the A52 directly, the Neighbourhood Plan takes account of the recommendations of these two recent traffic studies and sets out measures to support new ways of managing the traffic in and around the Parish to mitigate the problems identified.
NPV17118
40
Our Policies and Community Objectives Reasons for these Policies The community wishes to:
• Reduce the speed and minimise the volume of traffic passing through the Parish, particularly that using the small country lanes. It also wishes to see suitable speeds maintained conducive to the prevailing road conditions through the villages and village outskirts and to have appropriate traffic management measures in place to improve road safety, as long as they are complementary and appropriate to the environment.
• Encourage cycling and walking as safe options. Accordingly, the Plan aims to take
opportunities to improve highway safety and minimise conflicts between road traffic, cyclists and pedestrians.
• Reduce current parking concerns and introduce car parking standards have been
carefully considered and are included to ensure that new development does not add to the current levels of congestion caused by on-street parking.
• Promote sustainable travel and transport throughout the Parish and encourage the
greater uptake of public transport Development and Investment Policies TMA1: As recommended by PTB, it is considered that development within the settlement boundary for Brailsford village (as proposed by the Derbyshire Dales Local Plan), and in other parts of the Parish in accordance with our Housing policies, will be supported where measures to meet the following traffic management and road safety objectives are incorporated:
• Investment in convenient and safe access (footpaths and crossing points across the A52) to the village services, which are primarily on the south side of the A52 and for access to the new school across Luke Lane. These must prioritise safety for children, the elderly and those with disabilities (see Dept of Transport document Inclusive Mobility (2005) which is referenced by Manual for Streets) and take account of the requirements of the Disability Discrimination Act 1995. To achieve this an additional pelican crossing should be introduced at the required statutory distance from the Luke Lane junction to improve pedestrian safety for those crossing the road from new developments to access the bus stops, the school, the village shops and services, and the GP surgery, and a new pedestrian crossing installed on Luke Lane to provide safer access to the school for pedestrians.
• Ongoing funding for footpath and pavement maintenance in and approaching
Brailsford village to meet the recommendations of the DfT Report ‘Inclusive Mobility23. This would require footpaths within and approaching the western end of the village where all new development is currently planned, to be widened or restored to their original width to improve overall pedestrian safety.
23 DfT Inclusive Mobility: A Guide to best Practice on Pedestrian and Transport Infrastructure 2005

NPV17118
41
• New maintained cycle ways and footpaths to improve safe non-vehicular movement around the Parish and provide additional recreational facility.
• Making land available for additional communal car parking to improve access to
services and amenities in the village including the GP surgery and in the vicinity of the new school. These should include the provision of electrical charge points in support of future sustainable travel needs.
TMA2: All Planning applications should include achievable sustainable travel plans which allocate a consideration of funding for additional public transport services (bus routes) within the Parish, including accessible transport for those with mobility issues, and demand responsive services to connect to the main A52 bus route. Community Objectives In addition, developments which provide support and/or funding which can assist with the delivery of the following Community aims will be supported: TMA3: Additional gateway features at both the eastern and western entries to the village to assist with the reduction of speeds through Brailsford village. This could take the form of new speed reduction warning strips at the western end and the installation of physical ‘gates’ on both the west and east approaches TMA4: Regular reviews of warning signage in and around the village to confirm relevance and effectiveness and to include regular cleaning warning chevrons and markers and an on-going maintenance and replacement plan. TMA5: For the overall improvement of safety along the A52 and for the residents of Ednaston, the implementation of an improved right hand turning lane and warning signage at the A52/Ednaston/Shirley Lane junction – known as Derby Lane - a known accident black spot. TMA6: Encourage the reduction of unnecessary HGV movements in Brailsford village and the Parish as a whole, using advocacy to find support for the introduction of weight restrictions (except for exempted agricultural vehicles) on the country lane network, such as Luke Lane, Hall Lane, The Green, Yeldersley Lane and Over Burrows, crossing the Parish. Input and support from the County Highways Authority to these measures has been sought.

NPV17118
42
Policy Area 3: Green and Open Spaces
Open space, including gardens, allotments, recreational space, open fields, woodlands and pathways are important to us all. Natural and semi-natural open space is highly valued by local residents, not just for its recreational value but also for its landscape character, quiet enjoyment and biodiversity. The Neighbourhood Plan is keen to make sure our children have access to high quality outdoor play, in line with the NPPF recommendations and that all residents have access to high quality public open space and recreational areas.
As Plan 6 identifies, Brailsford Parish includes green or recreational space in the form of the privately-owned Golf Club and cricket ground; dedicated playing fields at the new Primary School; the Playing Field on The Plain currently owned by Derbyshire County Council; and the established allotments but these are not generally accessible to the Public. The Parish is also crossed by a network of public footpaths, which are generally well-maintained.
Plan 6: Existing Green Space
Source: Derbyshire Dales District Council: Local Plan
However, despite their rural setting, the only truly open space in the settlements of Brailsford and Ednaston are by custom and practice (although not in public ownership),– the Playing Field on The Plain in Brailsford (shown on Plan 6), and three allocated areas managed by

NPV17118
43
the Parish Council – the children’s play area on The Plain (attached to the Playing Field), a common area at the top of Alley Walk, and land surrounding the Village Institute – see Plan 7.
Plan 7: Existing ‘Public’ Open Space
Source: Brailsford Parish Council
The largest area of accessible space (1.17 acres) is the Playing Field on The Plain in the centre of the village. This area provides a children’s playground managed by the Parish
Council on an area under lease from Derbyshire County Council, and the Playing Field currently owned by DCC. Before the opening of the new Primary School the latter provided a sports field for the School but was also available for community use. The Parish Council provided funding for a new set of football nets to support this ‘community’ facility.
Brailsford: Children’s Play Area and Playing field: Hugh Stevenson
NPV17118
44
The ‘Playing Field’ is considered to be of ‘local significance’ and has been identified as one of the top three valuable assets in the Parish. Some 90% of respondents in a survey conducted by the Parish Council supported its retention as public open space and the Parish Survey results showed that it was regularly used by children and their families.
In response to this the Parish Council has been successful in obtaining a designation of Asset of Community Value for the site. The aim is now to have the whole site formally designated as Local Green Space as identified as a potential outcome in the NPPF paras 77-78, and this is one of the objectives of this Neighbourhood Plan. More detail relating to the suitability of the site for designation is set out in Appendix 2.
Our Policies and Community Objectives
Reasons for these policies
Our policies aim to support and add weight to the policies proposed in the Derbyshire Dales Local Plan by designating the Playing Field on The Plain as Local Green Space, owned and managed for the community by the Parish Council, to safeguard it and protect it from inappropriate development. It is considered that the current ‘Playing Field’ meets the criteria set out in NPPF guidance for special protection under the designation of Local Green Space (see Appendix 2).
In addition, the Plan seeks to guard against the unnecessary loss of existing green space, including the allotments, and aims to ensure increased provision within the village, to enhance the health, wellbeing and social cohesion of the community.
It also aims to ensure that any new development respects the existing rights of way network and enhances existing provision by creating new links wherever possible, thus ensuring that development provides benefits that will accrue to new residents, existing residents and the environment alike.
Policy GSL1: Built development will not be supported if proposed on any existing green and open spaces within the Parish, or if it would have an adverse effect on the openness or special character of existing spaces. Green spaces include the Playing Field on The Plain, the land surrounding the Institute, the allotments, the cricket field and golf course.
Policy GSL2: As part of this Neighbourhood Plan an application will be made for the formal designation of the existing Playing Field and Children’s Play Area as Local Green Space (See Appendix 3). Support for improvements to these areas including additional play facilities for the Children’s Play Area will be encouraged.
Policy GSL3: The creation of green spaces in the heart of housing developments in the form of managed grassed space, community gardens or play areas with long term finance allocated for their maintenance will be encouraged.
Policy GSL4: The provision of open spaces within new developments will be encouraged especially where these provide for public access and improve connectivity by establishing new rights of way or making accessible links to the wider footpath network and valued amenity green spaces to enhance the existing green infrastructure, with appropriate signage to encourage safe access and use of the network.
Policy GSL5: New developments which include the construction of new cycle-ways and bridleways with linkages to established surrounding Greenways where possible will be supported.

NPV17118
45
Policy Area 4: Local Landscape & Wildlife Context Responses to the All-Parish Survey identified that the local environment and prevailing landscape features are important aspects to residents in supporting a high quality of life and promoting wellbeing. The 2002 Guidance on Landscape Character Assessment24 defined ‘landscape’ as “Landscape is about the relationship between people and place. It provides the setting for our day-to-day lives. The term does not mean just special or designated landscapes and it does not only apply to the countryside. Landscape can mean a small patch of urban wasteland as much as a mountain range, and an urban park as much as an expanse of lowland plain. It results from the way that different components of our environment – both natural (the influences of geology, soils, climate, flora and fauna) and cultural (the historic and current impact of land use, settlement, enclosure and other human interventions) – interact together and perceived by us. People’s perceptions turn land into the concept of landscape.” As shown in Section 1, Brailsford is a rural Parish in which agriculture remains predominant, and is also one in which many rural activities and traditions are retained. The Parish has a distinctive landscape, as evidenced in the NCA and as quantified below. Landscape Sensitivity and Landscape Capacity have therefore been considered in relation to development in the preparation of this Plan. For this purpose the definitions of Landscape Sensitivity and Capacity have been based on those set out by the Countryside Agency in 200425 which used the following definitions. Landscape Sensitivity is recognised as ‘the sensitivity of the landscape to a particular type of change or development’ and can be defined as ‘embracing a combination of:
• the sensitivity of the landscape resource (in terms of both its character as a whole and the individual elements contributing to character)
• the visual sensitivity of the landscape, assessed in terms of a combination of factors such as views, visibility, the number and nature of people perceiving the landscape, and the scope to mitigate visual impact’.
Landscape Capacity is ‘an assessment of the ability of a landscape to accommodate different amounts of change or development of a specific type and should reflect:
• the inherent sensitivity of the landscape itself, but more specifically its sensitivity to the particular type of development. Thus, Landscape Capacity will reflect both the sensitivity of the landscape resource and its visual sensitivity
• the value attached to the landscape or to specific elements in it’. These definitions, which were also used by Wardell Armstrong in producing the Derbyshire Dales Landscape Sensitivity Assessment26, provide background for the policies defined in 24 Natural England: Guidance on Landscape Character Assessment. 2002 25 Countryside Agency. Landscape Topic Paper 6. 2004 26 Wardell Armstrong. Derbyshire Dales Landscape Sensitivity Assessment. 2015

NPV17118
46
this Plan. The following national policies and local landscape definitions have also been considered in the formulation of the Neighbourhood Plan NPPF. Paragraph 17 of the NPPF sets out 12 core principles for development including that: Plans and decisions should take into account the different roles and character of different areas, and recognise the intrinsic character and beauty of the countryside – to ensure that development is suitable for the local context” NPPF Paras 109-125 set out a series of requirements related to Conserving and Enhancing the Natural Environment, including • Minimising the impact on biodiversity and providing net gains where possible • Promoting the preservation, restoration and re-creation of priority habitats, ecological
networks and the protection and recovery of priority species populations, linked to national and local targets.
• the protection of ecosystems services and minimising the impacts of pollution, including light pollution on ‘local amenity, intrinsically dark landscapes and nature conservation’ (Para 125).
The NPPF also states consideration must be given to preserving the best and most versatile agricultural land. National Character Areas (NCA) NCA profiles are guidance documents which can help communities to inform their decision-making about the places that they live in and care for. The definitions and objectives for the relevant local profile have been taken into account in the production of this Plan. The NCA places the Parish within NCA 68: Needwood and Southern Derbyshire Claylands. NCA 68 is described as ‘predominately a rolling plateau that slopes from the southern edge of the Peak District to the valley of the River Trent in the south-west. The extensively hedged and pastoral landscape is dominated by mixed farming and features a dispersed pattern of villages and other settlements. Hedgerow trees also contribute to the wooded character of this NCA. NCA 68 is considered ‘to have a good network of rights of way and other trails and paths, and along with the ease of access from the surrounding conurbations of Derby and Burton-upon-Trent, means that the area is important for recreation. Future challenges for the area include management of flooding, maintaining the character of the farmed landscape and settlements, safeguarding water quality, and expansion of woodlands and the restoration of existing wood pasture and parkland’

NPV17118
47
Lowland Derbyshire Biodiversity Action Plan (BAP)27
This Plan, developed by the Lowland Derbyshire Biodiversity Action Partnership, seeks to conserve and enhance Lowland Derbyshire's existing wildlife and to redress past losses through habitat conservation, restoration, recreation and targeted action for priority species.
Brailsford Parish falls within Action Area 5 – Claylands. The BAP identifies that twenty seven of 28 priority bird species have been identified within the Claylands and nine of eleven priority mammals, along with the Great Crested Newt from the priority amphibians.
The primary habitat objective within the Claylands Action Area is the maintenance, restoration and expansion of wetlands, hedgerows, grassland and parkland habitat, with a secondary objective to increase the connectivity of semi-natural habitats and to create larger habitat complexes using priority habitats wherever possible. New habitats, linking and extending existing networks will be key to achieving this objective.
Local Wildlife Sites
The Parish contains a number of defined Local Wildlife Sites as shown on Plan 8 below:
Plan 8: Map of Brailsford Parish Showing Local Wildlife Sites
As the Plan shows, the defined Local Wildlife sites lie predominantly along the Brailsford Brook where Commonside joins Brailsford to Ednaston. Sites at Wood Lane and the
27 Lowland Derbyshire Biodiversity Partnership. Lowland Derbyshire Biodiversity Action Plan 2011-2020
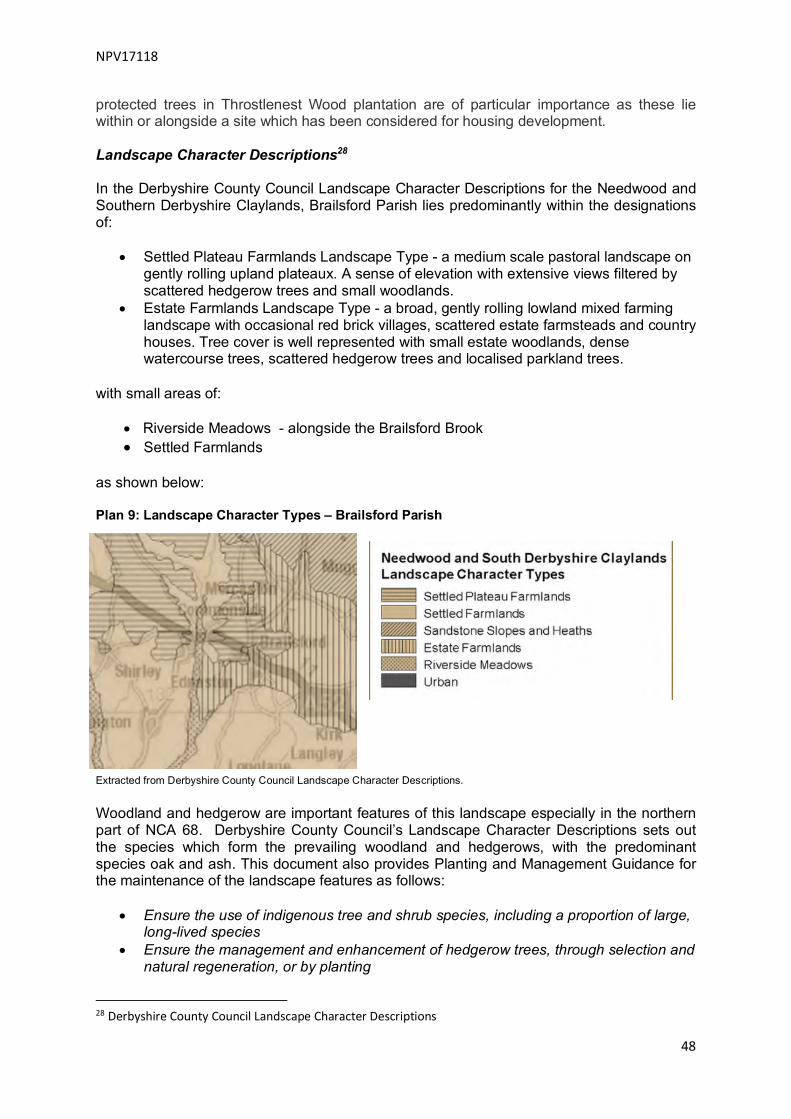
NPV17118
48
protected trees in Throstlenest Wood plantation are of particular importance as these lie within or alongside a site which has been considered for housing development. Landscape Character Descriptions28 In the Derbyshire County Council Landscape Character Descriptions for the Needwood and Southern Derbyshire Claylands, Brailsford Parish lies predominantly within the designations of:
• Settled Plateau Farmlands Landscape Type - a medium scale pastoral landscape on gently rolling upland plateaux. A sense of elevation with extensive views filtered by scattered hedgerow trees and small woodlands.
• Estate Farmlands Landscape Type - a broad, gently rolling lowland mixed farming landscape with occasional red brick villages, scattered estate farmsteads and country houses. Tree cover is well represented with small estate woodlands, dense watercourse trees, scattered hedgerow trees and localised parkland trees.
Soils and Land-Use with small areas of:
• Riverside Meadows - alongside the Brailsford Brook • Settled Farmlands
as shown below: Plan 9: Landscape Character Types – Brailsford Parish
Extracted from Derbyshire County Council Landscape Character Descriptions. Woodland and hedgerow are important features of this landscape especially in the northern part of NCA 68. Derbyshire County Council’s Landscape Character Descriptions sets out the species which form the prevailing woodland and hedgerows, with the predominant species oak and ash. This document also provides Planting and Management Guidance for the maintenance of the landscape features as follows:
• Ensure the use of indigenous tree and shrub species, including a proportion of large, long-lived species
• Ensure the management and enhancement of hedgerow trees, through selection and natural regeneration, or by planting
28 Derbyshire County Council Landscape Character Descriptions
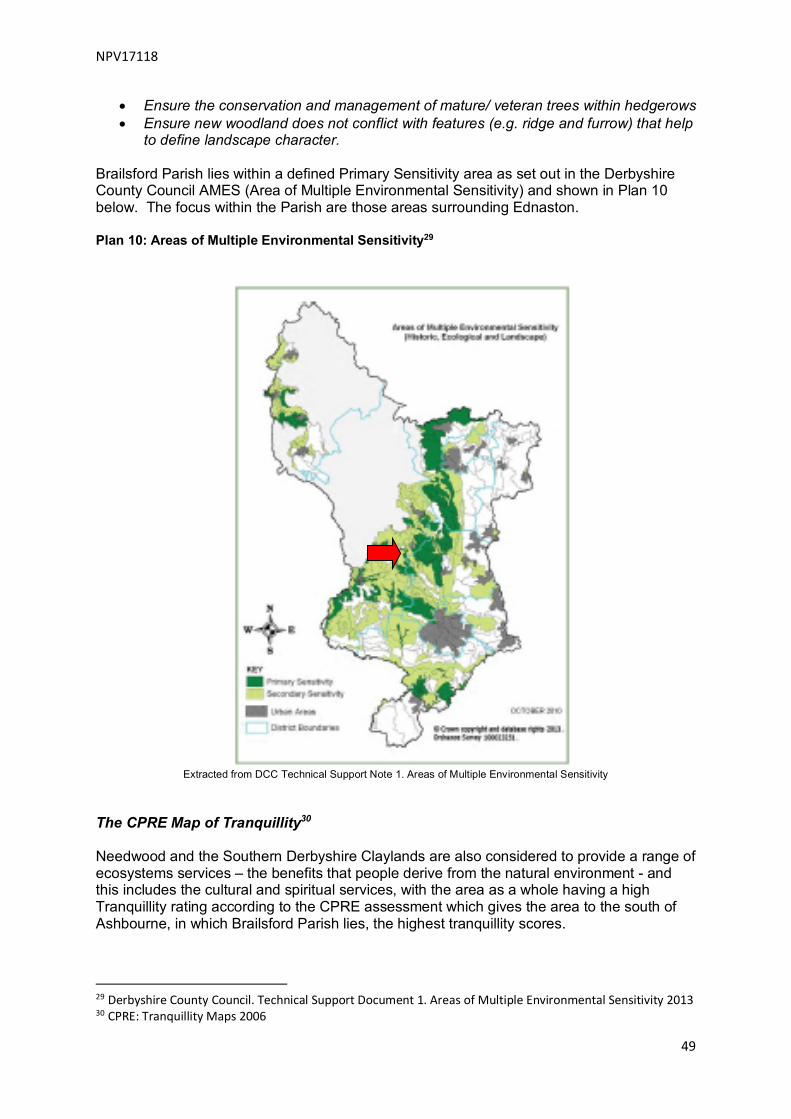
NPV17118
49
• Ensure the conservation and management of mature/ veteran trees within hedgerows • Ensure new woodland does not conflict with features (e.g. ridge and furrow) that help
to define landscape character. Brailsford Parish lies within a defined Primary Sensitivity area as set out in the Derbyshire County Council AMES (Area of Multiple Environmental Sensitivity) and shown in Plan 10 below. The focus within the Parish are those areas surrounding Ednaston. Plan 10: Areas of Multiple Environmental Sensitivity29
Extracted from DCC Technical Support Note 1. Areas of Multiple Environmental Sensitivity
The CPRE Map of Tranquillity30 Needwood and the Southern Derbyshire Claylands are also considered to provide a range of ecosystems services – the benefits that people derive from the natural environment - and this includes the cultural and spiritual services, with the area as a whole having a high Tranquillity rating according to the CPRE assessment which gives the area to the south of Ashbourne, in which Brailsford Parish lies, the highest tranquillity scores.
29 Derbyshire County Council. Technical Support Document 1. Areas of Multiple Environmental Sensitivity 2013 30 CPRE: Tranquillity Maps 2006

NPV17118
50
Conversely the CPRE Intrusion Map31 shows that an increase in the level of ‘intrusion’ from ‘urban development, noise (primarily traffic noise), and other sources of visual and auditory intrusion’ has increased from 17% in the 1960s to 45% in 2007. This change is predominantly linked with the main transport corridors such as the A52 and its current level of usage. It was noted however in the preparation of the Plan that the DCC Tranquillity rating for the Parish is moderate32 As recognised in the NPPF para 125, light pollution (artificial light which shines where it is neither wanted or needed) and especially skyglow – the pink or orange glow created mainly by street lighting which surrounds towns, cities and larger settlements in the night sky – from development is causing impact in rural areas. Recent research is beginning to show, that this can potentially affect human health, the life cycles of birds and mammals, and reduce nocturnal insect populations33. In addition, a report issued by DCLG indicated that in 2013-1434 Local Authorities were estimated to have spent £616 million on street lighting with these lights accounting for between 15-30% of a council’s carbon emissions. The CPRE Light Pollution and Dark Skies mapping35 shows that NCA 68 is rated as number 106 for Dark Skies in the 159 areas rated across England. Forty four percent of the NCA68 area is rated darkest with less than 1 nanowatt/cm2/sr. While the map shows that the settlement of Brailsford has higher ratings, these are still below average and a significant proportion of Brailsford Parish, including Ednaston, falls into the categories rated darkest. Plan11: Extract from CPRE Nightblight Interactive Maps Showing Brailsford Parish
31 CPRE: Developing an Intrusion Map of England. 2007 32 Derbyshire County Council. TN02 Tranquillity. 2013 33 Rich & Longcore. Ecological Consequences of Artificial Night Light, Travis Longmore 2006 34 Department for Communities and Local Government ‘Local authority revenue expenditure and financing England: 2013 to 2014 budget’ 35 Nightblight.cpre.org.uk

NPV17118
51
In addition, account has been taken of the following: Statutory Designations The Parish is within the Impact Risk Zone of the Mercaston Marsh and Muggington Bottoms SSSI (the largest and most species-rich marsh in Derbyshire) which lies some 3 km north east of Brailsford village. The NCA definitions illustrate that the Parish contains some of the S41 priority habitats and species, namely traditional agricultural field margins and boundaries (hedgerows) and the presence of Great Crested Newts. The Parish contains the following habitats which are identified in Fig. 10 below: Ancient and Semi-Natural Woodland Ancient Replanted Woodland Priority Habitat Inventory – Deciduous Woodland (England) Priority Habitat Inventory – Traditional Orchard (England) Priority Habitat Inventory – Woodpasture and Parkland (England) Priority Habitat Inventory – Lowland Fens (England) Priority Habitat Inventory Lowland Dry Grassland (England) Good quality semi-improved grasslands (Non Priority) Plan 11: Habitat Map for Brailsford Parish
Extracted from Magic36
36 www,.magic.co.uk
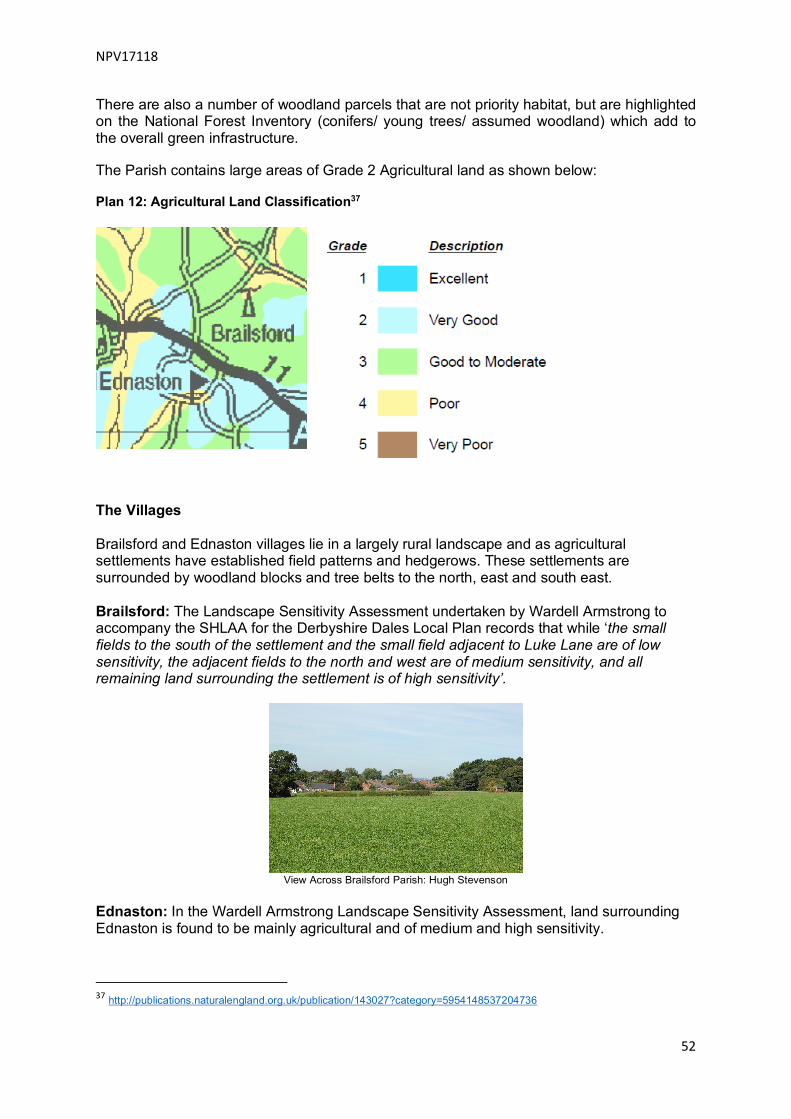
NPV17118
52
There are also a number of woodland parcels that are not priority habitat, but are highlighted on the National Forest Inventory (conifers/ young trees/ assumed woodland) which add to the overall green infrastructure. The Parish contains large areas of Grade 2 Agricultural land as shown below: Plan 12: Agricultural Land Classification37
The Villages Brailsford and Ednaston villages lie in a largely rural landscape and as agricultural settlements have established field patterns and hedgerows. These settlements are surrounded by woodland blocks and tree belts to the north, east and south east. Brailsford: The Landscape Sensitivity Assessment undertaken by Wardell Armstrong to accompany the SHLAA for the Derbyshire Dales Local Plan records that while ‘the small fields to the south of the settlement and the small field adjacent to Luke Lane are of low sensitivity, the adjacent fields to the north and west are of medium sensitivity, and all remaining land surrounding the settlement is of high sensitivity’.
View Across Brailsford Parish: Hugh Stevenson
Ednaston: In the Wardell Armstrong Landscape Sensitivity Assessment, land surrounding Ednaston is found to be mainly agricultural and of medium and high sensitivity.
37 http://publications.naturalengland.org.uk/publication/143027?category=5954148537204736

NPV17118
53
It is also recognised that Brailsford is one of the ‘Gateways’ to the Peak District National Park and as such has been reflected in our policy determination. Our Policies
Reasons for these policies
The Parish Survey identified that residents of the Parish value its rural setting, and the maintenance of the integrity of the settlements within it, and consider that it adds significantly to their quality of life, health and wellbeing.
Brailsford Parish lies within an area of Priority Sensitivity under the Derbyshire County Council Areas of Multiple Environmental Sensitivity process. The protection of the greenfield sites which make up the traditional landscape and the associated biodiversity with no net loss; and the continuation of effective agricultural operations are therefore key requirements of this Plan. The continuation of local agricultural operations to support essential national food security and provide healthy local food is of increasing importance as the local provenance of food and the connection between people and the source of their food gains wider recognition.
Our policies are designed to complement and enhance those set out in the draft Derbyshire Dales Local Pan and to:
• Protect and enhance the local environment • Improve biodiversity and use development as an opportunity to support wildlife
conservation, increase the range and populations of species and the quality and extent of wildlife habitats
• Ensure the efficient use of land and material resources • Maintain important hedgerows, trees and woodland so that natural features are
protected for their landscape and wildlife benefits • Allow more local people and visitors to enjoy the landscape.
Policy LW1: Developments proposed for areas of high landscape sensitivity, and those which affect the prevailing vistas, and/or are visually prominent, will not be supported..
Policy LW2: Schemes which require the removal of features of high nature conservation or landscape value, including mature trees, species-rich hedgerows, ponds and existing areas of woodland will not be supported. Developments which demonstrate that they have been designed to retain these features or propose new planting in accordance with DEFRA Countryside Stewardship TER1: Planting standard hedgerow trees or any subsequent government advice or requirement and comply with the guidance given in the Landscape Character Descriptions, including the planting of predominant native and disease resistant species, will be supported.
Policy LW3: All new areas of open, amenity or recreational green space and flood attenuation ponds required as part of new developments should be designed to encourage nature conservation and biodiversity, with suitable long-term maintenance plans put in place by the developer to ensure their safe retention.
Policy LW4: Reduced lighting or low level lighting systems should be encouraged where lighting is an essential requirement for safety to ensure that these do not cause unnecessary light pollution in this rural setting, which would be potentially damaging to local fauna and reduce the existing local ‘dark sky’ amenity established by the CPRE mapping.

NPV17118
54
Policy Area 5: Community Wellbeing – Provision of Local Facilities and
Amenities Context The NPPF makes clear statements about the importance of community facilities in Promoting Health Communities paragraphs 69-70.
‘69. The planning system can play an important role in facilitating social interaction and creating healthy, inclusive communities. Local planning authorities should create a shared vision with communities of the residential environment and facilities they wish to see. To support this, local planning authorities should aim to involve all sections of the community in the development of Local Plans and in planning decisions, and should facilitate neighbourhood planning. Planning policies and decisions, in turn, should aim to achieve places, which promote:
• opportunities for meetings between members of the community who might not otherwise come into contact with each other, including through mixed-use developments, strong neighbourhood centres and active street frontages which bring together those who work, live and play in the vicinity;
• safe and accessible environments where crime and disorder, and the fear of crime, do not undermine quality of life or community cohesion; and
• safe and accessible developments, containing clear and legible pedestrian routes, and high quality public space, which encourage the active and continual use of public areas.
70.To deliver the social, recreational and cultural facilities and services the community needs, planning policies and decisions should:
• plan positively for the provision and use of shared space, community facilities (such as local shops, meeting places, sports venues, cultural buildings, public houses and places of worship) and other local services to enhance the sustainability of communities and residential environments;
• guard against the unnecessary loss of valued facilities and services, particularly where this would reduce the community’s ability to meet its day-to-day needs;
• ensure that established shops, facilities and services are able to develop and modernise in a way that is sustainable, and retained for the benefit of the community; and
• ensure an integrated approach to considering the location of housing, economic uses and community facilities and service’.
Current Facilities The Parish amenities currently include a Post Office and Village Shop, GP Surgery and Pharmacy, the Village Institute (Community Centre); Church, Methodist Chapel; Garage; two
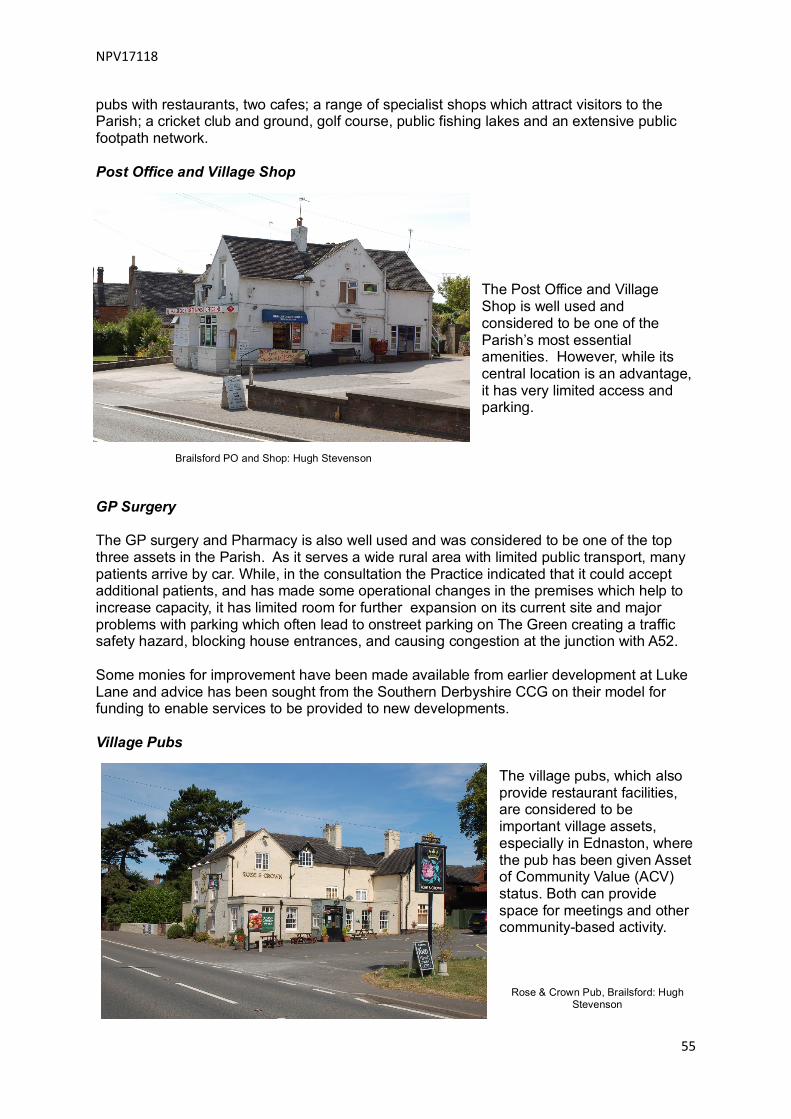
NPV17118
55
pubs with restaurants, two cafes; a range of specialist shops which attract visitors to the Parish; a cricket club and ground, golf course, public fishing lakes and an extensive public footpath network. Post Office and Village Shop
The Post Office and Village Shop is well used and considered to be one of the Parish’s most essential amenities. However, while its central location is an advantage, it has very limited access and parking.
Brailsford PO and Shop: Hugh Stevenson GP Surgery The GP surgery and Pharmacy is also well used and was considered to be one of the top three assets in the Parish. As it serves a wide rural area with limited public transport, many patients arrive by car. While, in the consultation the Practice indicated that it could accept additional patients, and has made some operational changes in the premises which help to increase capacity, it has limited room for further expansion on its current site and major problems with parking which often lead to onstreet parking on The Green creating a traffic safety hazard, blocking house entrances, and causing congestion at the junction with A52. Some monies for improvement have been made available from earlier development at Luke Lane and advice has been sought from the Southern Derbyshire CCG on their model for funding to enable services to be provided to new developments. Village Pubs
The village pubs, which also provide restaurant facilities, are considered to be important village assets, especially in Ednaston, where the pub has been given Asset of Community Value (ACV) status. Both can provide space for meetings and other community-based activity.
Rose & Crown Pub, Brailsford: Hugh Stevenson
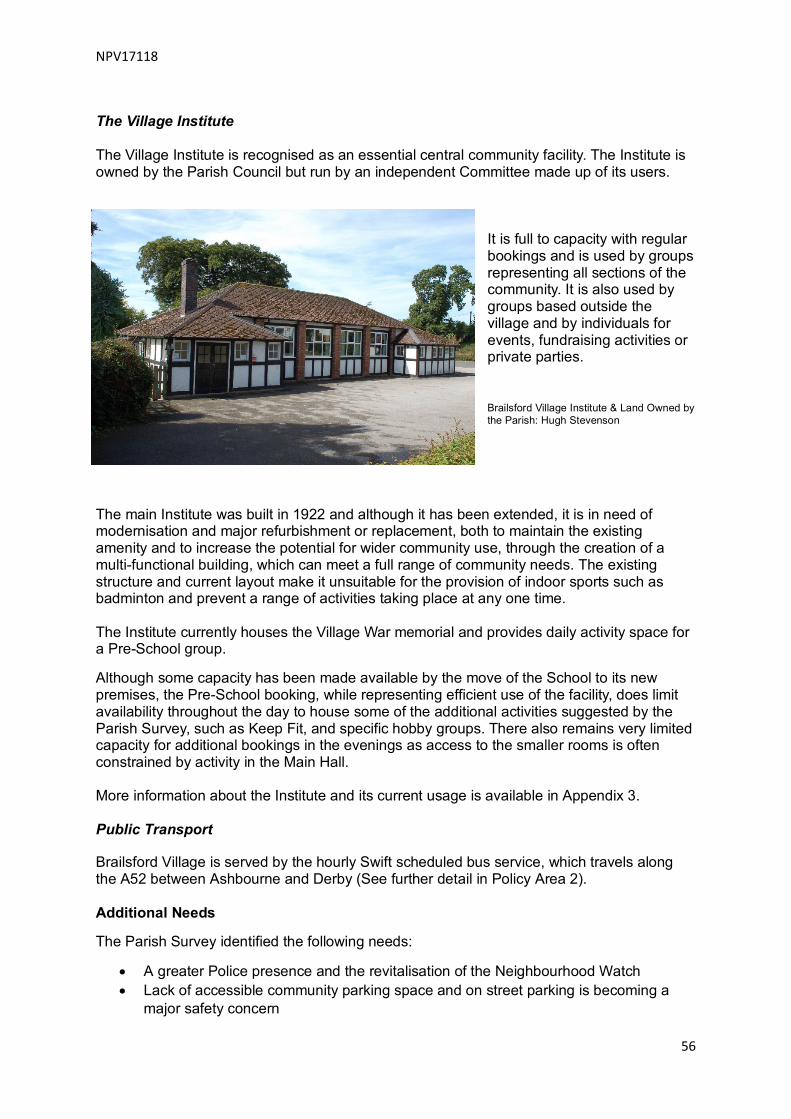
NPV17118
56
The Village Institute The Village Institute is recognised as an essential central community facility. The Institute is owned by the Parish Council but run by an independent Committee made up of its users.
It is full to capacity with regular bookings and is used by groups representing all sections of the community. It is also used by groups based outside the village and by individuals for events, fundraising activities or private parties. Brailsford Village Institute & Land Owned by the Parish: Hugh Stevenson
The main Institute was built in 1922 and although it has been extended, it is in need of modernisation and major refurbishment or replacement, both to maintain the existing amenity and to increase the potential for wider community use, through the creation of a multi-functional building, which can meet a full range of community needs. The existing structure and current layout make it unsuitable for the provision of indoor sports such as badminton and prevent a range of activities taking place at any one time. The Institute currently houses the Village War memorial and provides daily activity space for a Pre-School group. Although some capacity has been made available by the move of the School to its new premises, the Pre-School booking, while representing efficient use of the facility, does limit availability throughout the day to house some of the additional activities suggested by the Parish Survey, such as Keep Fit, and specific hobby groups. There also remains very limited capacity for additional bookings in the evenings as access to the smaller rooms is often constrained by activity in the Main Hall. More information about the Institute and its current usage is available in Appendix 3. Public Transport
Brailsford Village is served by the hourly Swift scheduled bus service, which travels along the A52 between Ashbourne and Derby (See further detail in Policy Area 2).
Additional Needs
The Parish Survey identified the following needs:
• A greater Police presence and the revitalisation of the Neighbourhood Watch • Lack of accessible community parking space and on street parking is becoming a
major safety concern

NPV17118
57
• A wider range of accredited, professional childcare facilities in the Parish • Improved measures to prevent littering (especially along the A52) and dog fouling
around public open space such as the children’s play area on The Plain • Improvement to and the extension of the Children’s’ Play Area • Wider range of facilities for young people • More outdoor sports facilities (tennis courts, bowls) • Greater access to more local adult educational facilities and hobby groups.
Our Policies and Community Objectives Reasons for our policies The NPPF provides a clear framework for the promotion, retention and development of local services and community facilities in villages, such as local shops, meeting places, sports venues, cultural buildings, public houses and places of worship.
Brailsford Parish, and in particular Brailsford village, has been fortunate in retaining some community facilities and services. However, a number of shops – hardware, butchers, bakers and farm shop have been lost and one of the pubs threatened with closure. Residents have evidenced their support for local services in the Parish survey, identified that there should be no further loss or reduction of the service offered by the current amenities, and have identified those new facilities, which would prove attractive. This Neighbourhood Plan aims to deliver the aims set out in the NPPF by introducing policies which protect existing community facilities and services central to the wellbeing of the community; improve those facilities and services, which are currently under-resourced; and support the development of new community facilities, which will benefit local people and promote social inclusion and community cohesion. In particular, it will encourage the introduction of new facilities and amenities, which have been identified by residents as lacking. Policy CW1: Development which could result in the loss of a community facility, such as a major change of use, e.g. from community use such as a pub to retail or domestic use will not be supported. Policy CW2: Development proposals which could result in the over subscription of facilities and services, such as the GP Surgery, will not be supported unless:
• It can be demonstrated that suitable alternate provision exists in the immediate area to serve the community; or
• Suitable alternative provision is included in the development proposal itself. Policy CW3: Small-scale development and development in proposals within the settlement boundary proposed by the Local Plan will be supported where they can provide and identify investment for the following:
• Refurbishment of the Village institute, including improved and extended space to enable a wider range of activities to take place, including sports such as badminton, table tennis and judo, Adult Education, yoga/Pilates and peripatetic community services
• Land allocation and the provision of additional community parking facilities,
especially to support the GP surgery, PO and Shop

NPV17118
58
• Additional facilities, especially those identified by local people such as:
o Youth Club facilities o Improved and extended children’s play area o Extended outdoor sports provision – the maintenance of the existing
football pitch, land for a tennis court and/or outdoor bowls o Sustained maintenance of public footpaths and more accessible cycle
ways o Retention and extension of the allotments.
Policy CW4: New small-scale development or the conversion of redundant buildings which provide additional facilities in the Parish such as new retail outlets or small business units, including the provision of live-work space, to encourage employment will be supported. Community Objectives Policy CW5: Investment in the provision of an effective high-speed broadband network to any new housing development will be encouraged.
Policy CW6: Improved communication with the local Police force, a better understanding of Police policy on the availability of Officer support in relation to rural villages, and enhanced investment in the Neighbourhood Watch scheme will be sought.
Policy CW7: Investments in systems which prevent littering and reduce dog fouling will be supported.
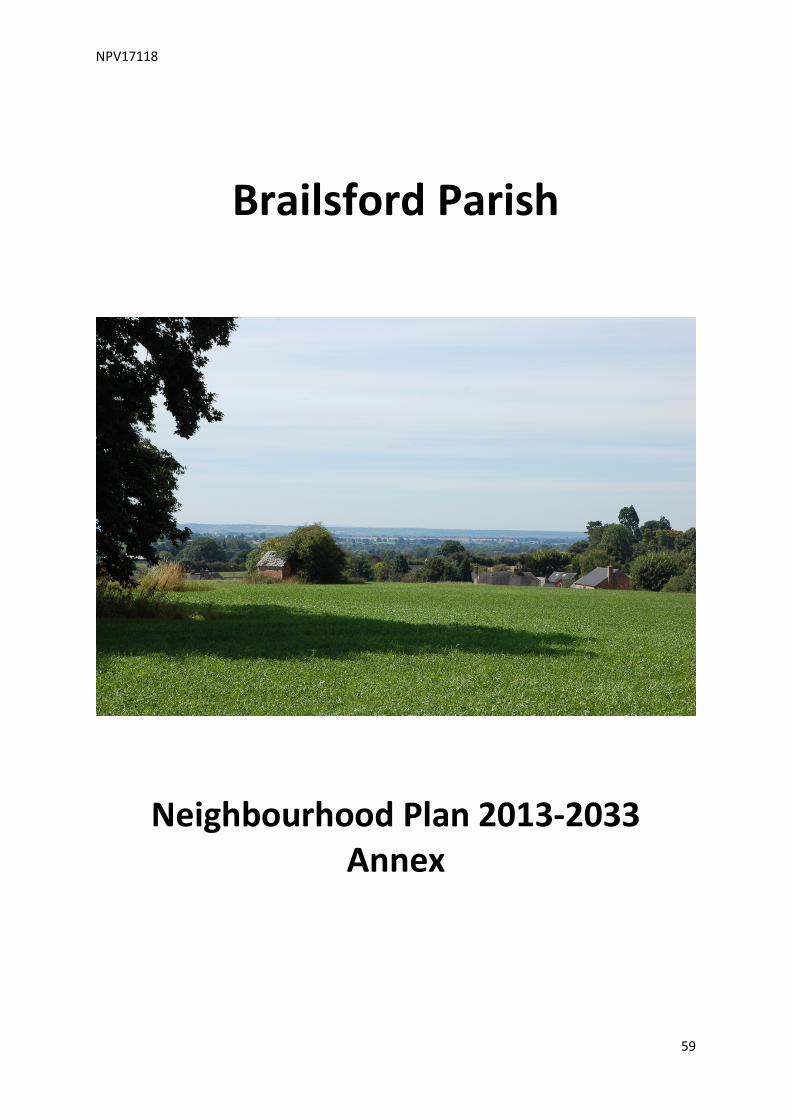
NPV17118
59
Brailsford Parish
Neighbourhood Plan 2013-2033 Annex

NPV17118
60
Brailsford Parish - Design Principles Statement This Policy has been produced by Urban Vision – Enterprise CIC
Purpose • To ensure new housing development is well designed, sustainable and supported by
necessary infrastructure.
• To ensure that new housing development is built close to existing housing areas, avoids sprawl into the countryside and creates a suitable transition from the built to rural environment.
• To ensure that all new developments in the parish of Brailsford contribute to the distinctive built character of their settings.
Rationale and Context The design policies in the Brailsford Parish Neighbourhood Development Plan are based on:
• evidence gathered from existing publications, • public consultation • local and national strategic planning guidance and policy.
With regard to the Local Plan policies, these polices have been informed by:
• Adopted Derbyshire Dales Local Plan 2005 • Derbyshire Dales Local Plan Saved Polices November 2008 • The Derbyshire Dales Local Plan 2016-2033 Pre-Submission Draft Plan August 2016
Strategic policies have been considered with respect to the adopted plan and saved policies. The plan and its evidence base have been considered as part of the evidence base for the Neighbourhood Plan.
Both Brailsford and Ednaston are villages with a definite rural character. Brailsford has a distinctive historic core identified in the conservation area described as: “land and buildings to the East of Luke Lane, both North and South of Main Road. Old Hall Farmhouse and The Green form part of the eastern boundary and to the southernmost part of the Conservation Area is the Old Rectory.”
The key views are significant given the topography of the settlement set in a prominent hill top setting, with far reaching views across South Derbyshire. Future development should have regard for these particularly respecting the settling and rooflines along Church Lane and The Green.
Ednaston is the second largest settlement within this rural parish and identified in the local plan as an infill and consolidation village, fifth tier. Fifth Tier villages are described as having:

NPV17118
61
“a lack of basic facilities to meet day to day requirements. However, there could be scope for very limited development within the physical confines of the settlement where this is limited to infill and consolidation of the existing built framework or where there are opportunities for the redevelopment of brownfield sites, which will result in a positive environmental improvement. The overall scale of development accommodated in these villages will however, be expected to be commensurate to the size of the settlement and reflect its position in the settlement hierarchy.”
New development should be designed to enhance the existing character and to create quality of place. Through community engagement, key design issues were identified as:
• Concern over flooding and building further on the open countryside. • Design, scale and materials of new development. The recent development of
Saracens Court was cited as a good example of appropriate development. • Key views and vistas in to and out of the main Brailsford settlement. • Ensuring that the ‘sense of community’ is maintained through the structure of new
housing developments to enable neighbours to interact. ‘Pockets’ of development not large scale estates.
• Negative impact of the A52. • Frontages, to ensure that new development maintains the sense of space and
openness with road, pavement, verge, boundary treatment, garden, house. • Maximise links and footpaths to enhance circular walks around the village to improve
health and well-being. • ‘Green’ appearance with hedgerows and trees, all native species. • Edge of village locations have access to open fields. • Convenience of facilities. • Space around the house, good size gardens. • During periods of excessive rainfall, key road junctions and residential routes
become flooded and can make key arterial routes impassable for a period.
To protect and enhance the rural character of Brailsford and Ednaston, new development must have regard to the character of the area. Good design is not about copying the style of neighbouring buildings, but creating safe, convenient, well-functioning places that are a creative response to the existing character of the area.
The National Planning Policy Framework confirms that good design is indivisible from good planning. It recognises that well-designed buildings and places improve the quality of people’s lives and that it is a core planning principle always to secure good design. Neighbourhood plans should develop robust and comprehensive policies that set out the quality of development that will be expected for the area. Such policies should be based on stated objectives for the future of the area and an understanding and evaluation of its defining characteristics.
The Derbyshire Dales Local Plan Saved Polices November 2008 Policies SF4 Development in the countryside; and H9 Design and appearance of new housing all address the design some board urban design principals. However policy SF5 Design and appearance of development specifically itemises broad key design characteristics including:
“(a) the scale, density, massing, height, layout, access, materials of construction and landscaping preserves or enhances the quality and local distinctiveness of its surroundings
(b) it reinforces the sense of place engendered by the presence of distinctive local

NPV17118
62
building styles and materials
(c) it is well related to surrounding properties and land uses
(d) it minimises the risk and fear of crime and disorder
(e) it gives priority to pedestrians and cyclists over the movement and parking of vehicles
(f) it maximises the energy efficiency of built development.”
The Adopted Derbyshire Dales Local Plan 2005 in the housing section identifies that all “new housing and residential environments should be well designed.” It goes on to state that it promotes “good design in new housing developments in order to create attractive, high quality living environments in which people would choose to live.”
The adopted local plan also goes on to identify that, “good design can promote sustainable development by continuing to make it an attractive place to live, work and visit.”
The Derbyshire Dales Local Plan 2016-2033 Pre-Submission Draft August 2016 provides a framework for securing high quality design in new development. It recognises the need to conserve and enhance the historic environment in the light of pressure for growth and change, and it promotes high quality and locally distinctive design, which responds to the character of local areas. This is important not only in the historic centre of Brailsford village conservation area, but also in rural settings where the design of new buildings is vital in preserving the rural character of the area. The Derbyshire Dales Local Plan seeks to ensure high quality and locally distinctive design and this is one of the strategic objectives of the Local Plan. The Local Plan policy 'Delivering High Quality Development' provides a framework for achieving good design in new development.
The design policies of the neighbourhood plan seek to provide a more detailed and more specific design requirement to ensure that new development in Brailsford Parish achieves its potential as far as is possible in each case.
Policies Policy D1: Design of New Development New development must deliver good quality, sustainable design. In order to achieve this all new development must:
1. Respond to the existing built form in terms of enclosure and definition of streets and spaces, including degree of set-back;
2. Be of an appropriate height, scale and density to complement existing character;
3. Be integrated with its surroundings by linking to existing paths and being designed for pedestrian convenience;
4. Provide convenient and safe access to surrounding community facilities predominately located on the south side of the A52;
5. Respond to local landscape and landscape features, including trees, plants, wildlife habitats, site orientation and microclimate;
6. Provide buildings, landscaping and planting to create a place with a

NPV17118
63
locally inspired or distinctive character, based on analysis of the site and context;
7. Make use of views and landmarks visible from within and from outside the site in order to organize the layout of the development and make it legible for visitors;
8. Provide streets that encourage low vehicle speeds and which can function as safe, social spaces;
9. Integrate car parking within landscaping so that it does not dominate the street;
10. Provide clear separation between public and private spaces, avoiding placing high fences against the highway.
11. Provide convenient, well-screened storage space for bins, recycling and bicycles.
12. Include materials which complement those used in the surrounding area; 13. Include high quality boundary treatments to reflect the rural character. 14. On the edge of the countryside, take account of the transition between
built area and open landscape, particularly in the built form, landscaping and boundary treatments;
15. Outside lighting sources should have a minimum impact on the environment, wildlife and minimise light pollution, to preserve our dark skies;
16. Provide sufficient parking, including some properties that cater for multiple-car families.
Application of the Policy Good design is not just a matter of appearance, but also about the functionality of the development and its relationship to its surroundings. Good design is not about copying past styles, or preventing innovative modern design. The aim is to create site-specific creative design, reflecting the materials and character which responds to the site and its setting.
This policy seeks to ensure that new development is sustainable, focusing on urban design, movement, character, green space and landscape, wildlife and ecology, surveillance and safety.
Development should be less dense towards the edges of the settlement, recognising the need for a sensitive transition between built settlement and rural area. Landscape design and boundary treatments are also important in achieving a sensitive transition.
Separation of private and public space may be achieved through the layout of development, which should seek to avoid placing rear gardens (and high fences) adjacent to the highway and boundaries with the open countryside.
The Design and Access Statement submitted with planning applications for new development should show how the design of the proposed development responds to each of the principles set out in this policy.
Clearly the way this policy is applied will depend on the nature of the development such as the size and scale, and whether new roads are proposed.
We strongly encourage all schemes to incorporate sustainable construction and energy generation. This could include rainwater harvesting, solar panels and heat pumps.

NPV17118
64
Recognising the increase in width of modern vehicles we will encourage developers to build wider than standard single and double width garages to accommodate a variety of width vehicles.
Policy D2: Flooding Mitigation of flooding must be an integral part of design and layout for any development sites by:
• Including well-designed sustainable urban drainage systems, to complement existing landscape character.
• Demonstrating how development mitigates against existing flooding problems shown in plan reference “Areas of flood risk” page 82.
Application of the Policy Through the consultation with the community, the issue of flooding has been raised. During periods of excessive rainfall, key road junctions and residential routes become flooded and can make key arterial routes impassable for a period.
As part of the evidence base the community have identified, photographed and plotted precisely the critical locations where this re-occurs on a regular basis. This is a significant consideration for the parish, particularly due to the topography of the parish.
Policy D3: Hedgerows and Trees Development proposals must retain existing hedgerows and trees or, if removal is unavoidable, a replacement of equivalent hedgerow and trees will be provided, either as part of the development or elsewhere within the Parish. Any replacement hedgerow and trees will be of same native species and type, unless otherwise agreed.
Application of the Policy Meeting this policy aims to ensure that environmental and landscape design within and around new developments should reflect the existing rural character of the Parish and enhance or maintain the quality and quantity of green space.
Where possible, new developments should incorporate new hedgerows as part of their landscaping scheme, reflecting the local characteristics of Brailsford and Ednaston.
Policy D4: Key Rural Views in Brailsford Development affecting Brailsford Conservation Area and its setting must preserve or
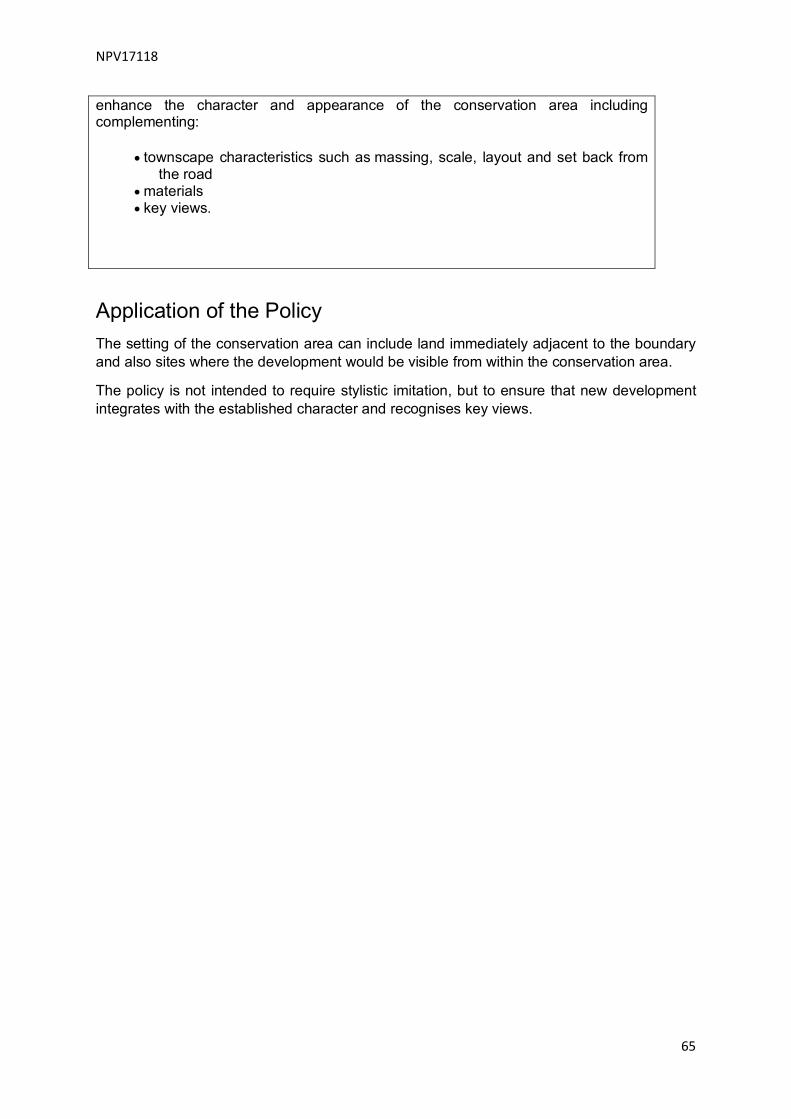
NPV17118
65
enhance the character and appearance of the conservation area including complementing:
• townscape characteristics such as massing, scale, layout and set back from the road
• materials • key views.
Application of the Policy The setting of the conservation area can include land immediately adjacent to the boundary and also sites where the development would be visible from within the conservation area.
The policy is not intended to require stylistic imitation, but to ensure that new development integrates with the established character and recognises key views.
NPV17118
66
Brailsford Parish
Neighbourhood Plan 2013-2033 Appendices

NPV17118
67
Appendix 1 Report by PTB Traffic Management Services
Brailsford Parish Council
Brailsford
A52 Appraisal
PTB Transport Planning Ltd Radclyffe House
66/68 Hagley Road Edgbaston
Birmingham West Midlands
B16 8PF
T/F. 0121 454 5530 W. www.ptbtransport.co.uk
Prepared by JP
Authorised by JP
Rev A
Date 29 July 2016
T16512 Brailsford Parish Council
CONTENTS
1.0 INTRODUCTION 1
1.1 Background 1
1.2 Structure of the report 1
1.3 Limitations of this report 1
2.0 HIGHWAY NETWORK AND EXISTING CONDITIONS 3
2.1 Highway Network 3
2.2 Existing Conditions 6
3.0 TRAFFIC COUNT AND SPEED DATA 9
3.1 Surveys 9
3.2 Traffic Count Data 9
3.3 Traffic Speed Data 13
4.0 HIGHWAY SAFETY 16
4.1 Personal Injury Accident Data 16
4.2 Unrecorded Accidents and ‘Near Misses’ 18
5.0 COMMITTED AND FUTURE DEVELOPMENT IMPACTS 19
5.1 Committed Developments 19
5.2 Future Developments 19
5.3 Development Impacts 20
6.0 POTENTIAL IMPROVEMENTS AND RECOMMENDATIONS 24
6.1 Traffic Calming 24
6.2 Entry Features 24
6.3 Footway Improvements 26
6.4 Vehicle Activated Signs 26
6.5 Pedestrian Crossings 29
6.6 Recommendations 29

T16512 Brailsford Parish Council
Table 1 – A52 AADF Data (two-way traffic volumes) 1 0
Table 2 – PIAs in/around Brailsford – 1 st Sept 2010 to 31 st Aug 2015 16
Table 3 – A52 AADF Data (two-way traffic volumes) a nd Accidents 17
Table 4 – PICADY Analysis – A52/Luke Lane Priority Junction 22

T16512 Brailsford Parish Council
PTB Transport Planning Ltd - 1 - T16512 Transport Appraisal Rev A - Email.docx
1.0 INTRODUCTION
1.1 Background
1.1.1 PTB Transport Planning Ltd has been commissioned by Brailsford Parish Council to provide an assessment of the A52 through Brailsford village.
1.1.2 Our understanding, from the brief provided, is that the primary concerns of Brailsford Parish Council and local residents (following a survey undertaken by the Parish Council) are as follows:
• The speed of vehicles through the village, within the 30mph zone;
• The speed of vehicles approaching the village from Ashbourne, particularly through Commonside;
• The safety of residents and other road users; and
• Traffic management arrangements on the A52, particularly at the junction with Luke Lane and Green Lane.
1.2 Structure of the report
1.2.1 This report is intended to consider the above concerns and relate them to traffic/speed data and Personal Injury Accident (PIA) data obtained within Brailsford village (and on the approaches to the village).
1.2.2 We will also consider those concerns in relation to an appraisal of the highway network, observations of current operation (particularly during peak hours), and future traffic flow forecasts incorporating growth arising from committed and potential future developments.
1.2.3 Following this introduction, the report is set out as follows:
• Chapter 2 – Highway Network and Existing Conditions;
• Chapter 3 – Traffic Count and Speed Data;
• Chapter 4 – Highway Safety;
• Chapter 5 – Committed and Future Development Impacts; and
• Chapter 6 – Potential Improvements and Recommendations.
1.3 Limitations of this report
1.3.1 This report has been undertaken at the request of Brailsford Parish Council, thus should not be entrusted to any third party without written permission from PTB Transport Planning Ltd. However, should any information contained within this report be used by any unauthorised third party, it is done so entirely at their own risk and shall not be the responsibility of PTB Transport Planning Ltd.

T16512 Brailsford Parish Council
PTB Transport Planning Ltd - 2 - T16512 Transport Appraisal Rev A - Email.docx
1.3.2 This report has been compiled using data from a number of external sources (such as mapping and traffic count information); whilst these sources are considered to be trustworthy, PTB Transport Planning Ltd is not responsible for the accuracy of the data provided.

T16512 Brailsford Parish Council
PTB Transport Planning Ltd - 3 - T16512 Transport Appraisal Rev A - Email.docx
2.0 HIGHWAY NETWORK AND EXISTING CONDITIONS
2.1 Highway Network
2.1.1 The A52 Main Road is a single carriageway road that varies in width between 6.5m and 7.5m with edge of carriageway white lines generally set some 0.4m from the kerb edge.
2.1.2 The A52 bisects Brailsford village centre and, as a distributor road, carries significant levels of through-traffic on a daily basis (further details are provided in Chapter 3).
2.1.3 The existing footways along each side of the A52 vary in width considerably throughout the village, ranging from 1.0m in width up to 2.5m in width in places (and wider still outside the Rose & Crown Public House).
2.1.4 However, a significant amount of the footway throughout the village is affected by soil creep, which reduces the width available for pedestrians to walk within quite considerably.
2.1.5 Luke Lane and The Green meet the A52 at individual priority junctions some 45m apart (centreline to centreline).
2.1.6 Luke Lane is a single carriageway road that varies in width between 5.5m and 6.5m, with footway provision along much of its length, including new provision associated with the committed Miller Homes development site and Brailsford Church of England Primary School site. The existing footway width varies but is generally above 1.5m, with the new provision at 1.8m.
2.1.7 Visibility at the A52 junction with Luke Lane is adequate in both directions at the stop line, as it is on the outside of the bend from the east and there is a significant verge depth available to the west.
2.1.8 The Green is a single carriageway road of some 5.0m in width, with a single footway of around 1.8m in width which narrows at the junction with the A52 to 1.2m width and further still at a pinch point on the junction radius.
2.1.9 Although this is not ideal for pedestrians, traffic flows along The Green are low, and observations suggest that vehicle speeds are also low; in effect, The Green operates similar to a ‘quiet lane’ where pedestrians could walk within the carriageway quite safely if they chose to do so.
2.1.10 Visibility at the A52 junction with The Green is adequate in both directions at the stop line, but is more restricted on the approach to the junction due to a property boundary wall to the east and existing hedging to the west.
2.1.11 Within the settlement, the A52, Luke Lane and The Green are subject to a 30mph speed limit; to the north of the village, Luke Lane (and then Mercaston Lane) becomes a national speed limit road (60mph), whilst to the east and west of the village the A52 is subject to a 50mph speed limit.
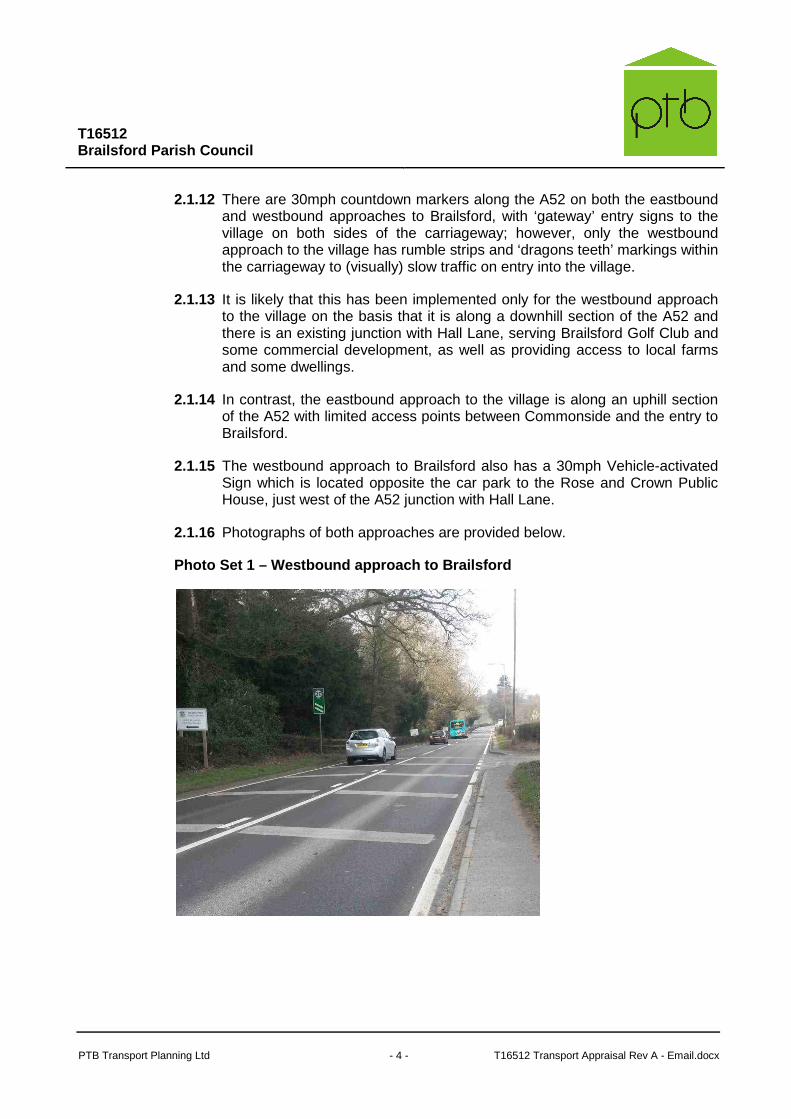
T16512 Brailsford Parish Council
PTB Transport Planning Ltd - 4 - T16512 Transport Appraisal Rev A - Email.docx
2.1.12 There are 30mph countdown markers along the A52 on both the eastbound and westbound approaches to Brailsford, with ‘gateway’ entry signs to the village on both sides of the carriageway; however, only the westbound approach to the village has rumble strips and ‘dragons teeth’ markings within the carriageway to (visually) slow traffic on entry into the village.
2.1.13 It is likely that this has been implemented only for the westbound approach to the village on the basis that it is along a downhill section of the A52 and there is an existing junction with Hall Lane, serving Brailsford Golf Club and some commercial development, as well as providing access to local farms and some dwellings.
2.1.14 In contrast, the eastbound approach to the village is along an uphill section of the A52 with limited access points between Commonside and the entry to Brailsford.
2.1.15 The westbound approach to Brailsford also has a 30mph Vehicle-activated Sign which is located opposite the car park to the Rose and Crown Public House, just west of the A52 junction with Hall Lane.
2.1.16 Photographs of both approaches are provided below.
Photo Set 1 – Westbound approach to Brailsford
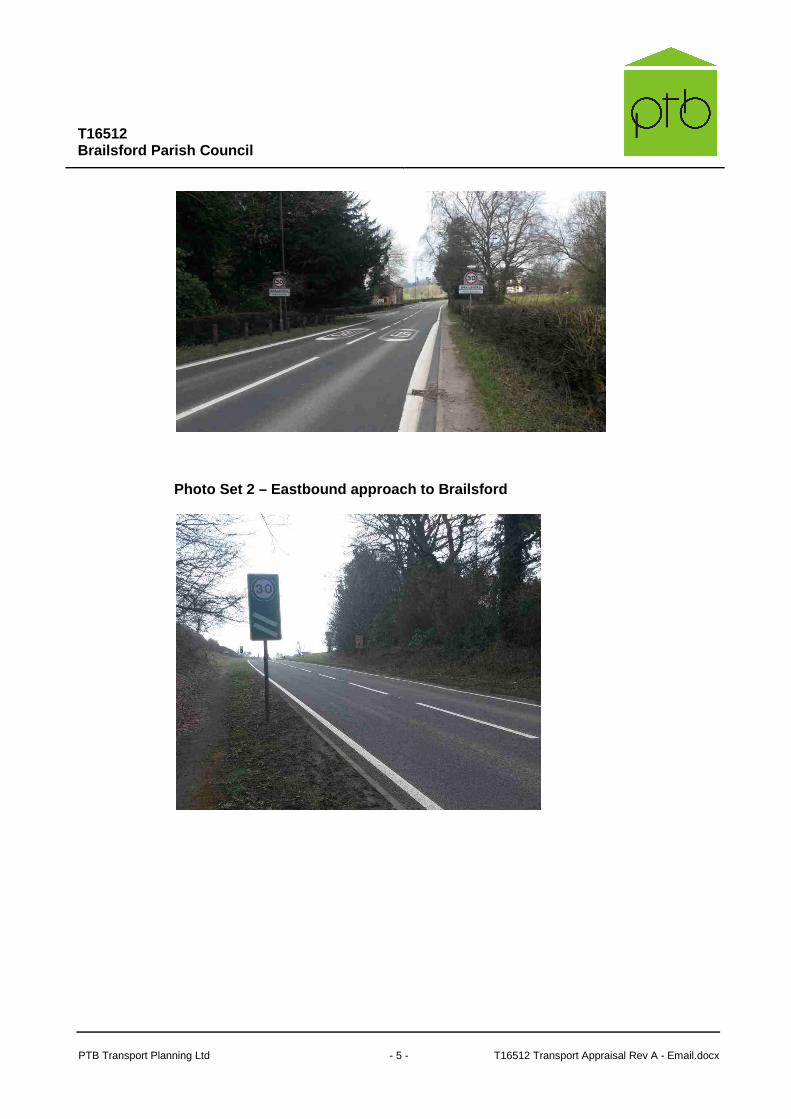
T16512 Brailsford Parish Council
PTB Transport Planning Ltd - 5 - T16512 Transport Appraisal Rev A - Email.docx
Photo Set 2 – Eastbound approach to Brailsford

T16512 Brailsford Parish Council
PTB Transport Planning Ltd - 6 - T16512 Transport Appraisal Rev A - Email.docx
2.1.17 It is worth noting that our observations of the highway network at several different times of day appear to suggest that the Vehicle-activated Sign to the east of the village is not working, as we didn’t observe any activations of the 30mph symbol. We have contacted the Local Highway Authority (LHA) to advise them of this and requested information regarding the activation of such signage, e.g. whether it is related to specific times of day.
2.1.18 Further consideration of the approaches to the village is given in Chapter 6; however, site observations confirmed that the reflective marker posts on both approaches are in poor condition and, in some cases, are no longer in an upright position or have been dislodged from their original position completely.
2.2 Existing Conditions
2.2.1 We have undertaken several morning and evening peak period and off-peak site visits in order to ascertain existing network traffic conditions and to undertake measurements along the roads and footways within Brailsford.
2.2.2 We have also commissioned several independent traffic and speed surveys within Brailsford, details of which are provided in Chapter 3.
2.2.3 Our own observations of the traffic conditions during peak periods have primarily concentrated on the A52 junctions with Luke Lane and The Green, given that the brief specifically identified these junctions.
2.2.4 It should be noted that our observations have been undertaken during the construction period for the consented Miller Homes development site and the Brailsford Church of England Primary School site; therefore, additional HGV traffic is present on the highway network, and in particular at the junction of the A52 with Luke Lane.
2.2.5 As indicated in section 2.1, the A52 bisects Brailsford village and carries a significant amount of through-traffic during peak hours and on a daily basis.

T16512 Brailsford Parish Council
PTB Transport Planning Ltd - 7 - T16512 Transport Appraisal Rev A - Email.docx
2.2.6 The level of HGV traffic on the A52 is noticeable (further details are provided in Chapter 3) and traffic tends to platoon behind larger vehicles as they travel through the centre of the village.
2.2.7 The Luke Lane approach to the A52 queues intermittently throughout the peak periods, with delays averaging around 20 seconds per vehicle throughout the period and queues averaging one or two vehicles; typically, queues would extend to three or four vehicles for a short period before clearing quickly.
2.2.8 On average, HGVs were observed to take significantly longer than cars to exit Luke Lane onto the A52 (as would be expected due to the difference in acceleration and turning characteristics), thus there were queues observed that extended to six or seven vehicles; however, once the HGV negotiated the junction, the remaining vehicles tended to clear relatively easily.
2.2.9 There were also several occasions within the peak periods where the junction approach from Luke Lane was clear of any queueing vehicles.
2.2.10 In terms of right-turning traffic into Luke Lane, due to the high traffic flow on the A52, any large vehicle waiting to turn right will cause a queue to form behind which we observed can extend significantly at times (in excess of 10 vehicles on some occasions). However, these were very short-lived and intermittent in nature during the periods observed.
2.2.11 The approach to the A52 from The Green was observed to be operating well within capacity during the peak periods, primarily because of the limited level of traffic that uses the junction; conflicts at the stop line can occur when a vehicle attempts to enter The Green whilst a vehicle is exiting, however these are rare and do not significantly affect the capacity of the junction, even during peak periods.
2.2.12 In terms of pedestrian provision and conditions, as detailed in section 2.1 there are several locations across the village where footway provision is heavily compromised by soil creep.
2.2.13 The photographs in Appendix A highlight the numerous areas where soil creep is evident.
2.2.14 Figure 2.1 shows the currently available footway widths and the locations where soil creep impacts on the available pedestrian widths along the A52 through Brailsford.
2.2.15 It should be noted that the colour coding on the figures is our interpretation of footway width standards from relevant guidance; this includes Figure 6.8 of Manual for Streets (MfS), the DfT ‘Inclusive Mobility’ guidance document and guidance contained within the 6Cs document.

T16512 Brailsford Parish Council
PTB Transport Planning Ltd - 8 - T16512 Transport Appraisal Rev A - Email.docx
2.2.16 Those documents, taken together, tend to indicate that a footway width in excess of 1.8m will allow comfortable movement for all expected pedestrian users, a 1.5m-1.8m width is comfortable for two pedestrian users to pass one another (including a pedestrian and a wheelchair), a 1.2m-1.4m width will allow access for a pedestrian with child, whilst a 0.9-1.1m width in the minimum acceptable (over short distances) and allows access for a single wheelchair user.
2.2.17 Figure 2.1 shows that although most of the available footway width within Brailsford village would be considered to be generally acceptable, there are significant sections (in particular on the approaches to the village) that are heavily affected by creep, which reduced the available footway width significantly.
2.2.18 Further details regarding potential improvements are provided in Chapter 6.

T16512 Brailsford Parish Council
PTB Transport Planning Ltd - 9 - T16512 Transport Appraisal Rev A - Email.docx
3.0 TRAFFIC COUNT AND SPEED DATA
3.1 Surveys
3.1.1 In order to further inform our study of traffic conditions on the A52 and within Brailsford, traffic survey data has been obtained as follows:
• Seven-day ATC speed survey on the A52 to west of Brailsford at Commonside – 23rd to 29th February 2016;
• Seven-day ATC speed survey on the A52 to west of Brailsford at existing entry to/exit from village (speed limit change) – 23rd to 29th February 2016;
• Manual classified peak hour turning count at the A52/Luke Lane/The Green junction – Tuesday 22nd March 2016;
• Seven-day ATC speed survey on the A52 to east of Brailsford at existing entry to/exit from village (speed limit change) – 23rd to 29th February 2016;
• Hand-held Radar speed survey to the east and west of the A52/Luke Lane/The Green junction – Tuesday 1st March 2016; and
• Historic Annual Average Daily Flow (AADF) data from the DfT website, on the A52 to the east of Brailsford village – for the period 2000 to 2014.
3.1.2 All of the traffic data obtained is provided as Appendix B to this report; detailed analysis of the data is provided below.
3.2 Traffic Count Data
A52 Main Road/Ashbourne Road
3.2.1 The historic AADF data provides an opportunity to consider the long-term traffic flow fluctuations on the A52; the data is taken from manual 12-hour counts undertaken to the east of Brailsford village (in the vicinity of the existing parking layby). These are then converted to AADFs using the relevant factors.
3.2.2 Table 1 overleaf details the AADF for the period 2000 to 2015.

T16512 Brailsford Parish Council
PTB Transport Planning Ltd - 10 - T16512 Transport Appraisal Rev A - Email.docx
Table 1 – A52 AADF Data (two-way traffic volumes)
Year AADF % Change (on previous year)
% HGVs (includes buses)
2000 10,139 N/A 9.49
2001 10,201 +0.61 9.37
2002 10,644 +4.34 9.09
2003 10,848 +1.92 8.75
2004 10,869 +0.19 8.72
2005 10,878 +0.08 8.44
2006 11,535 +6.04 8.55
2007 11,499 -0.31 9.22
2008 11,141 -3.11 9.28
2009 10,969 -1.54 8.55
2010 10,833 -1.24 8.58
2011 11,149 +2.92 7.43
2012 10,932 -1.95 7.43
2013 10,848 -0.77 7.35
2014 11,096 +2.29 7.39
2015 11,109 +0.12 7.54 Source: DfT Traffic Counts website
3.2.3 Table 1 demonstrates that traffic flows on the A52 have fluctuated both upwards and downwards in the 14 year period between 2000 and 2015.
3.2.4 It is highly likely that the drop in AADF between 2008 and 2010 is representative of the economic recession in the UK at that time, and that subsequent drops in 2012 and 2013 are likely a result of further difficult economic conditions post-recovery from the recession.
3.2.5 The difference in AADF between 2000 and 2015 is 970, which represents overall growth on the A52 in that period of 9.57%.
3.2.6 The data also shows that the percentage of HGVs (which includes buses) has fallen from 9.49% in 2000 to 7.54% in 2015.
3.2.7 As indicated in section 3.1, we have also commissioned independent ATC surveys to the east of Brailsford, at the existing entry to/exit from the village; therefore, only a short distance to the west of the permanent ATC location from which the above DfT data is obtained.
3.2.8 The ATC data obtained recently indicates that average 24-hour traffic flows (including weekends) at the eastern edge of Brailsford are 5,744 westbound and 5,854 eastbound; therefore, two-way the average daily flow is 11,598.
3.2.9 Whilst a direct comparison with the values in Table 1 isn’t entirely appropriate, given that the latest data can only provide a single weekly

T16512 Brailsford Parish Council
PTB Transport Planning Ltd - 11 - T16512 Transport Appraisal Rev A - Email.docx
average; it does give an approximation of the likely flow that would be recorded for 2016 as AADF, on the basis that February is a relevant and approximately neutral month for traffic flows.
3.2.10 The recent ATC data also indicates that the HGV percentage to the east of the village is 12.35%, which is a significant increase compared to the AADF HGV data in Table 1.
3.2.11 Without data for 2016, or a more significant dataset across several different months for 2016, it is difficult to establish with certainty that the week observed is representative of ‘normal’ conditions on the A52.
3.2.12 The data for the two additional ATC surveys that were commissioned (to the west of the village at the entry/exit, and further west in Commonside) supports the data from the eastern ATC survey.
3.2.13 At the western entry to/exit from the village, the average 24-hour traffic flow observed was 10,394 with an HGV percentage of 12.9%; whilst further west in Commonside, the average 24-hour traffic flow observed was 10,437 with an HGV percentage of 12.6%.
3.2.14 As February is a neutral month in respect of traffic surveys, and should therefore be representative of ‘normal’ traffic conditions, this potentially shows that there has been a significant increase in the proportion of HGVs using the A52 through Brailsford.
3.2.15 However, it is also worth noting that the surveys will include construction traffic to/from the Miller Homes and Brailsford School sites.
3.2.16 For comparison purposes, it is worth noting that we have previously undertaken analysis for a development site in Baldwins Gate (Staffordshire) which took access from the A53, a similar distributor road bisecting a village.
3.2.17 The observed average 24-hour traffic flow on the A53 in June 2013, taken from a 7-day ATC survey, was 11,785 with an HGV percentage of 4.6%; clearly, a very similar traffic flow but with significantly different HGV content.
3.2.18 Further data obtained from the DfT National Road Traffic Survey statistics indicates that in Q4 2015, the percentage of HGVs on rural A-roads across Great Britain was 6.58%; whilst for the East Midlands, data from November 2015 indicates that percentage of HGVs across all roads (including trunk roads) was 7.66%.
3.2.19 Therefore, the ATC data obtained in February 2016 tends to indicate that the level of HGV traffic passing through Brailsford is significantly higher than would normally be expected for a road of this type in this location.
3.2.20 The peak hour turning count at the junctions of the A52 with Luke Lane and The Green indicates that the percentage of HGVs on the A52 during the
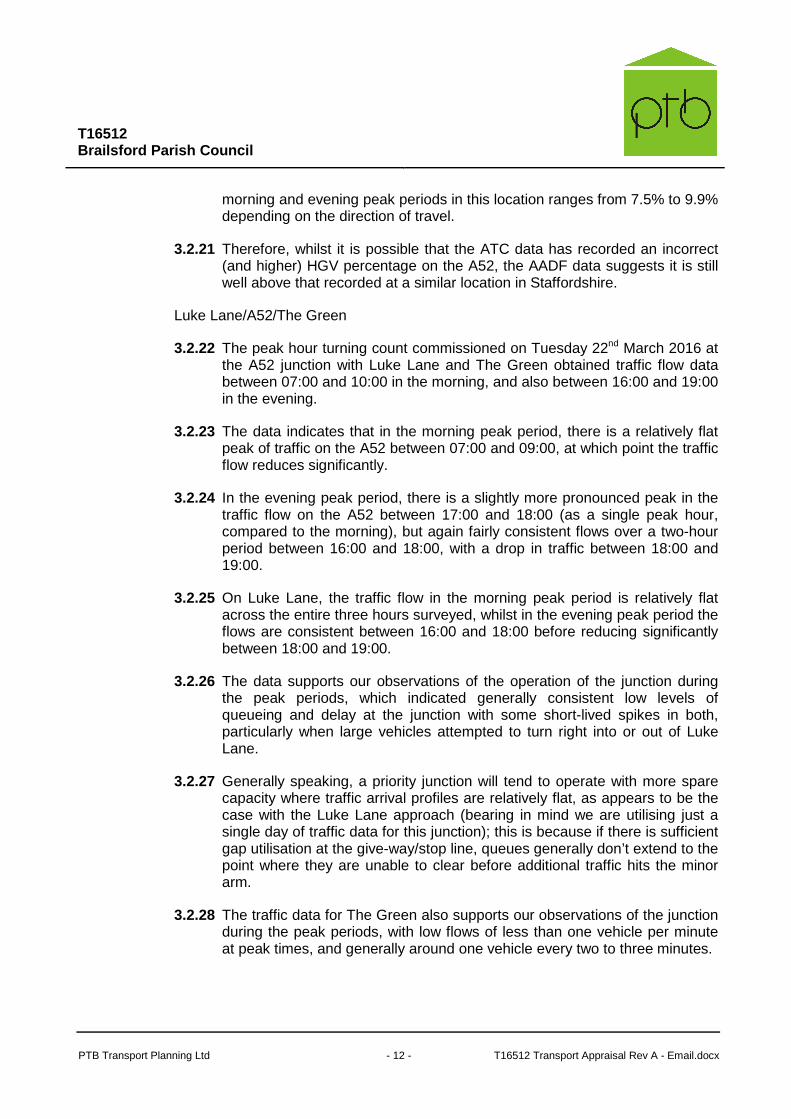
T16512 Brailsford Parish Council
PTB Transport Planning Ltd - 12 - T16512 Transport Appraisal Rev A - Email.docx
morning and evening peak periods in this location ranges from 7.5% to 9.9% depending on the direction of travel.
3.2.21 Therefore, whilst it is possible that the ATC data has recorded an incorrect (and higher) HGV percentage on the A52, the AADF data suggests it is still well above that recorded at a similar location in Staffordshire.
Luke Lane/A52/The Green
3.2.22 The peak hour turning count commissioned on Tuesday 22nd March 2016 at the A52 junction with Luke Lane and The Green obtained traffic flow data between 07:00 and 10:00 in the morning, and also between 16:00 and 19:00 in the evening.
3.2.23 The data indicates that in the morning peak period, there is a relatively flat peak of traffic on the A52 between 07:00 and 09:00, at which point the traffic flow reduces significantly.
3.2.24 In the evening peak period, there is a slightly more pronounced peak in the traffic flow on the A52 between 17:00 and 18:00 (as a single peak hour, compared to the morning), but again fairly consistent flows over a two-hour period between 16:00 and 18:00, with a drop in traffic between 18:00 and 19:00.
3.2.25 On Luke Lane, the traffic flow in the morning peak period is relatively flat across the entire three hours surveyed, whilst in the evening peak period the flows are consistent between 16:00 and 18:00 before reducing significantly between 18:00 and 19:00.
3.2.26 The data supports our observations of the operation of the junction during the peak periods, which indicated generally consistent low levels of queueing and delay at the junction with some short-lived spikes in both, particularly when large vehicles attempted to turn right into or out of Luke Lane.
3.2.27 Generally speaking, a priority junction will tend to operate with more spare capacity where traffic arrival profiles are relatively flat, as appears to be the case with the Luke Lane approach (bearing in mind we are utilising just a single day of traffic data for this junction); this is because if there is sufficient gap utilisation at the give-way/stop line, queues generally don’t extend to the point where they are unable to clear before additional traffic hits the minor arm.
3.2.28 The traffic data for The Green also supports our observations of the junction during the peak periods, with low flows of less than one vehicle per minute at peak times, and generally around one vehicle every two to three minutes.

T16512 Brailsford Parish Council
PTB Transport Planning Ltd - 13 - T16512 Transport Appraisal Rev A - Email.docx
3.2.29 The traffic flows along The Green are slightly higher between 09:00 and 10:00 in the morning, and between 16:00-17:00 in the afternoon; this is likely to be a result of the operation of Brailsford Medical Centre.
3.2.30 The peak hour turning flows at the junction are shown on Figure 3.1.
3.3 Traffic Speed Data
3.3.1 As stated in Chapter 1, our understanding from the brief is that two of the primary concerns of both Brailsford Parish Council and local residents across Brailsford Village, relate to the speed of traffic approaching the village and the speed of traffic within the village itself.
3.3.2 In order to seek to clarify this, and to potentially address any subsequent issues that arise, seven-day ATC speed surveys were undertaken on the A52 to the east of the village, to the west of the village, and through Commonside.
3.3.3 In addition, hand-held radar surveys were undertaken within the village to the east and west of the A52 junction with Luke Lane/The Green.
3.3.4 The locations of these surveys are included with the traffic and speed data in Appendix B; the results of the speed analysis are summarised as Appendix C to this report.
3.3.5 In terms of methodology, TA 22/81 ‘Vehicle Speed Measurement on National Roads’ is national guidance that should be followed to undertake the appropriate speed calculation exercise.
3.3.6 Appendix 4 of that guidance provides a general checklist for speed measurements and states that a set of readings must include a minimum of 200 vehicles; that the preferred times for readings are 10:00-12:00 and 14:00-16:00; and that generally, a speed assessment should be made outside of peak periods on weekdays, and during “free flow” conditions.
3.3.7 The speeds calculated for speed limit purposes should be ‘dry weather’ 85th percentile speeds, whilst for carriageway alignment and/or junction improvements (or new junctions), the speeds calculated should be ‘wet weather’ 85th percentile speeds.
3.3.8 In order to determine the latter, if speed data is obtained during generally dry weather conditions, a deduction of 4kph (2.5mph) is made to speed data from single carriageway roads, with a deduction of 8kph (5mph) made to data from dual carriageway roads.
3.3.9 Our analysis in Appendix C includes traffic flows and speeds for the above time periods (as per guidance), but also shows an assessment taking into account the entire week’s worth of count data, for comparison purposes only.

T16512 Brailsford Parish Council
PTB Transport Planning Ltd - 14 - T16512 Transport Appraisal Rev A - Email.docx
3.3.10 It should be noted that for the period surveyed, the road conditions were generally dry; weather data for the nearest weather station (Battersea Park Way, Derby) is also provided in Appendix C. The hand-held radar survey states that the road surface was dry at the time of the survey and this is supported by the weather data.
3.3.11 To the west of the village, through Commonside, the speed limit is 50mph; the calculated wet weather speeds in this location are as follows:
• TA22/81 – 85th percentile westbound = 49.1mph, eastbound = 48.0mph;
• 7-day – 85th percentile westbound = 49.5mph; eastbound = 49.5mph;
• 7-day – Average westbound = c.45mph; eastbound = c.44.5mph.
3.3.12 At the western entry to/exit from the village, the speed limit changes between 30mph and 50mph; the calculated wet weather speeds in this location are as follows:
• TA22/81 – 85th percentile westbound = 40.8mph, eastbound = 36.7mph;
• 7-day – 85th percentile westbound = 42.5mph; eastbound = 39.5mph;
• 7-day – Average westbound = c.37mph; eastbound = c.32mph.
3.3.13 At the eastern entry to/exit from the village, the speed limit changes between 30mph and 50mph; the calculated wet weather speeds in this location are as follows:
• TA22/81 – 85th percentile westbound = 32.3mph, eastbound = 33.3mph;
• 7-day – 85th percentile westbound = 33.5mph; eastbound = 34.5mph;
• 7-day – Average westbound = c.29mph; eastbound = c.30.5mph.
3.3.14 Within the village, the speed limit is 30mph; the calculated wet weather speeds in this location are as follows:
• West of Luke Lane:
o 85th percentile westbound = 34.5mph, eastbound = 32.5mph;
o Average westbound = 30.5mph; eastbound = 28.5mph.
• East of Luke Lane:
o 85th percentile westbound = 34.5mph, eastbound = 32.5mph;
o Average westbound = 30.1mph; eastbound = 28.1mph.
3.3.15 Typically, 85th percentile speeds along a road will be higher than the posted speed limit.

T16512 Brailsford Parish Council
PTB Transport Planning Ltd - 15 - T16512 Transport Appraisal Rev A - Email.docx
3.3.16 In this instance, through Commonside, they are very slightly below the speed limit and average speeds are 10% below the speed limit.
3.3.17 At the western entry to/exit from Brailsford village, the 85th percentile speeds are typical of what might be expected; whilst at the eastern entry to/exit from Brailsford village, the 85th percentile speeds are slightly below what might be expected.
3.3.18 The average speeds in both locations are at or below the prevailing speed limit for the relevant direction of traffic flow.
3.3.19 Within the village, the 85th percentile speeds in each direction are slightly below what might be expected, whilst average speeds in each direction are at or below the posted speed limit.
3.3.20 Therefore, the results of the speed surveys indicate that there is not a speeding issue along the A52 within, or on the approaches to, Brailsford village.
3.3.21 In terms of the difference in traffic speeds between the western and eastern entries to/exits from the village, it is possible that the additional rumble strips and ’dragons teeth’ road markings to the east of the village reduce traffic speed more significantly than on the approach to the west of the village.
3.3.22 In addition, the eastern entry to/exit from the village is much more visually enclosed, by existing hedgerow and trees, than on the western side of the village where there is a significant width of open verge along the southern side of the A52 and, even on the northern side of the A52, the footway is set back from the carriageway behind another narrower section of verge.
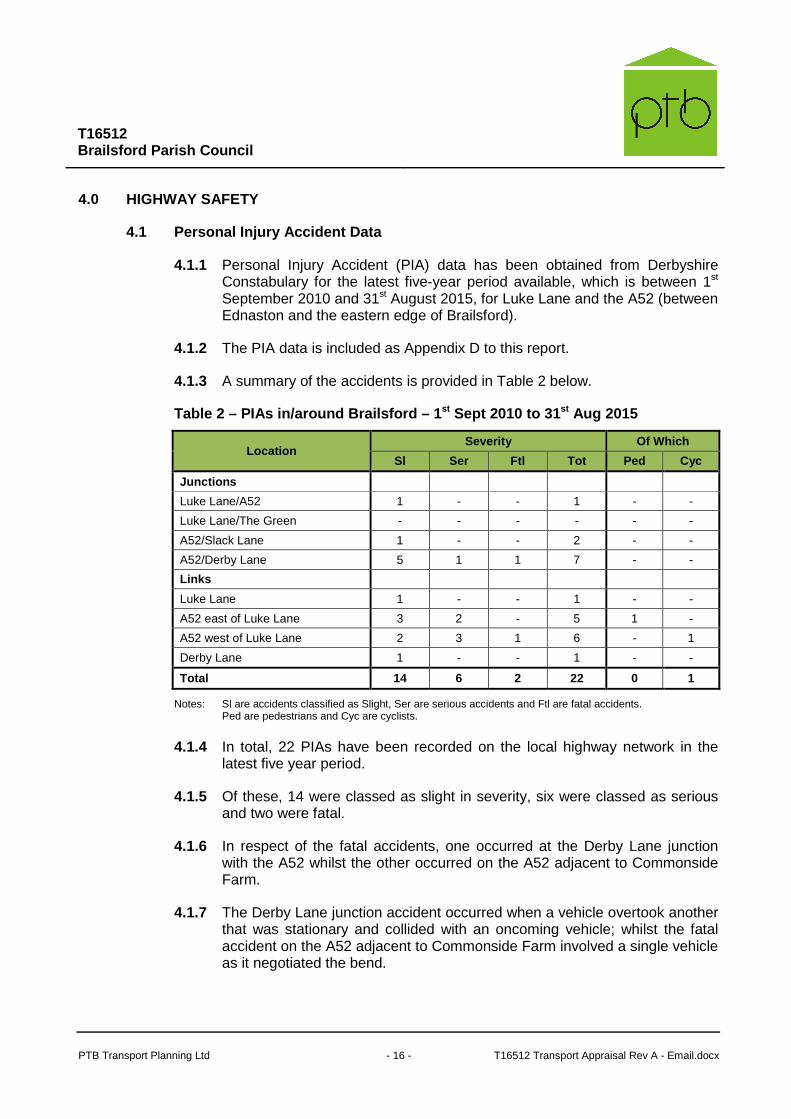
T16512 Brailsford Parish Council
PTB Transport Planning Ltd - 16 - T16512 Transport Appraisal Rev A - Email.docx
4.0 HIGHWAY SAFETY
4.1 Personal Injury Accident Data
4.1.1 Personal Injury Accident (PIA) data has been obtained from Derbyshire Constabulary for the latest five-year period available, which is between 1st September 2010 and 31st August 2015, for Luke Lane and the A52 (between Ednaston and the eastern edge of Brailsford).
4.1.2 The PIA data is included as Appendix D to this report.
4.1.3 A summary of the accidents is provided in Table 2 below.
Table 2 – PIAs in/around Brailsford – 1 st Sept 2010 to 31 st Aug 2015
Location Severity Of Which
Sl Ser Ftl Tot Ped Cyc
Junctions
Luke Lane/A52 1 - - 1 - -
Luke Lane/The Green - - - - - -
A52/Slack Lane 1 - - 2 - -
A52/Derby Lane 5 1 1 7 - -
Links
Luke Lane 1 - - 1 - -
A52 east of Luke Lane 3 2 - 5 1 -
A52 west of Luke Lane 2 3 1 6 - 1
Derby Lane 1 - - 1 - -
Total 14 6 2 22 0 1
Notes: Sl are accidents classified as Slight, Ser are serious accidents and Ftl are fatal accidents. Ped are pedestrians and Cyc are cyclists.
4.1.4 In total, 22 PIAs have been recorded on the local highway network in the latest five year period.
4.1.5 Of these, 14 were classed as slight in severity, six were classed as serious and two were fatal.
4.1.6 In respect of the fatal accidents, one occurred at the Derby Lane junction with the A52 whilst the other occurred on the A52 adjacent to Commonside Farm.
4.1.7 The Derby Lane junction accident occurred when a vehicle overtook another that was stationary and collided with an oncoming vehicle; whilst the fatal accident on the A52 adjacent to Commonside Farm involved a single vehicle as it negotiated the bend.
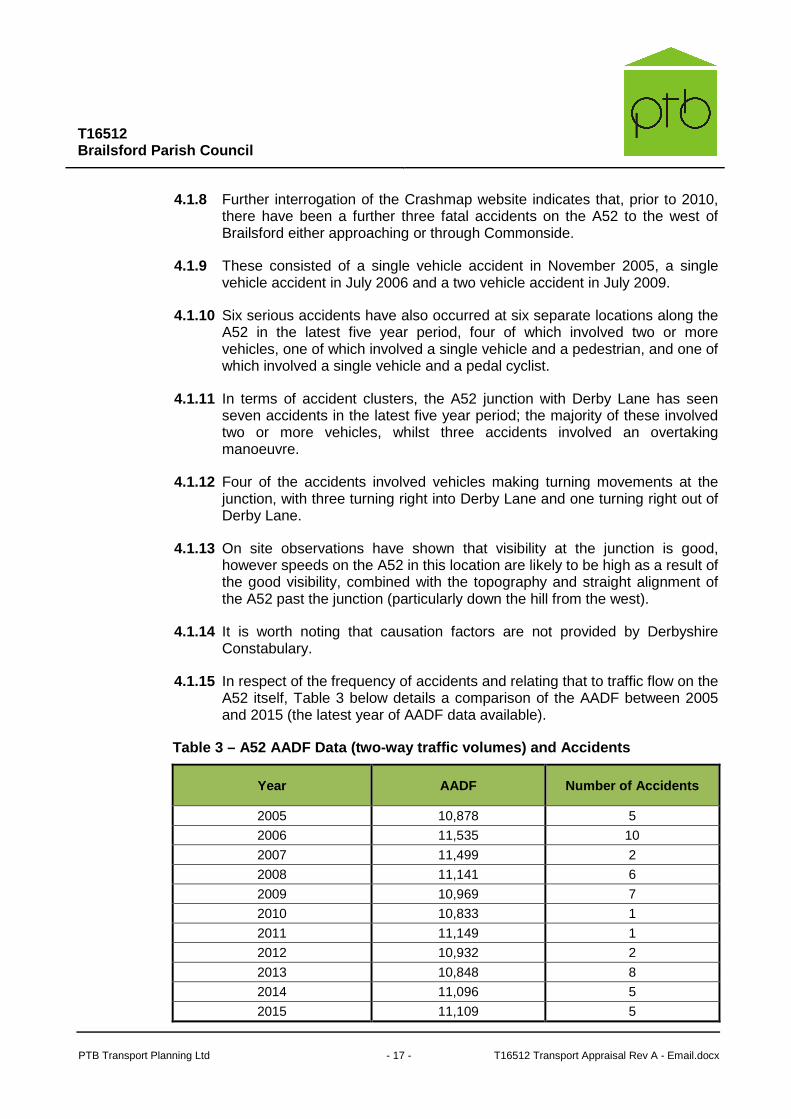
T16512 Brailsford Parish Council
PTB Transport Planning Ltd - 17 - T16512 Transport Appraisal Rev A - Email.docx
4.1.8 Further interrogation of the Crashmap website indicates that, prior to 2010, there have been a further three fatal accidents on the A52 to the west of Brailsford either approaching or through Commonside.
4.1.9 These consisted of a single vehicle accident in November 2005, a single vehicle accident in July 2006 and a two vehicle accident in July 2009.
4.1.10 Six serious accidents have also occurred at six separate locations along the A52 in the latest five year period, four of which involved two or more vehicles, one of which involved a single vehicle and a pedestrian, and one of which involved a single vehicle and a pedal cyclist.
4.1.11 In terms of accident clusters, the A52 junction with Derby Lane has seen seven accidents in the latest five year period; the majority of these involved two or more vehicles, whilst three accidents involved an overtaking manoeuvre.
4.1.12 Four of the accidents involved vehicles making turning movements at the junction, with three turning right into Derby Lane and one turning right out of Derby Lane.
4.1.13 On site observations have shown that visibility at the junction is good, however speeds on the A52 in this location are likely to be high as a result of the good visibility, combined with the topography and straight alignment of the A52 past the junction (particularly down the hill from the west).
4.1.14 It is worth noting that causation factors are not provided by Derbyshire Constabulary.
4.1.15 In respect of the frequency of accidents and relating that to traffic flow on the A52 itself, Table 3 below details a comparison of the AADF between 2005 and 2015 (the latest year of AADF data available).
Table 3 – A52 AADF Data (two-way traffic volumes) a nd Accidents
Year AADF Number of Accidents
2005 10,878 5
2006 11,535 10
2007 11,499 2
2008 11,141 6
2009 10,969 7
2010 10,833 1
2011 11,149 1
2012 10,932 2
2013 10,848 8
2014 11,096 5
2015 11,109 5

T16512 Brailsford Parish Council
PTB Transport Planning Ltd - 18 - T16512 Transport Appraisal Rev A - Email.docx
4.1.16 Although it is widely accepted that only the latest three or five years of accident data is required for analysis, the comparison in Table 3 suggests that there is no direct correlation between increased traffic flows on the A52 and an increase in the number of accidents on the A52 in and around Brailsford since 2005.
4.1.17 It might normally be expected that as traffic flows rise, accident rates will also rise; however, there are also likely to be other factors at play here, including the provision of traffic-calming signage, lining and other measures along the A52 that could have materially affected the accident rates in and around Brailsford.
4.2 Unrecorded Accidents and ‘Near Misses’
4.2.1 It is recognised that there are likely to be unrecorded ‘collision only’ accidents in and around Brailsford, plus a number of ‘near misses’ that residents may experience from time to time.
4.2.2 However, it is not possible to take account of these formally in any analysis; any technical assessment of accident records and how these relate to highway safety on any road or junction must relate to recorded injury incidents in order to provide an effective and comparable assessment across all locations.
4.2.3 This was highlighted in the Appeal Decision for the (previously mentioned) Baldwins Gate site on the A53 in Staffordshire, where the Appeal Inspector stated in paragraph 45:
“The A53 through Baldwin’s Gate is a primary route, albeit not a trunk road. It is heavily trafficked but the accident record does not appear to be unusually high for a village of this type. Residents pointed to a number of unrecorded traffic incidents and the ensuing disruption which they caused but to take undue account of ‘unofficial’ statistics would not allow a fair comparison to be made nationally.”

T16512 Brailsford Parish Council
PTB Transport Planning Ltd - 19 - T16512 Transport Appraisal Rev A - Email.docx
5.0 COMMITTED AND FUTURE DEVELOPMENT IMPACTS
5.1 Committed Developments
5.1.1 In terms of committed developments, there are two sites within Brailsford that are technically committed in planning terms; these are the Miller Homes residential development (50 dwellings) and the relocation of Brailsford C of E school, both of which are on the western side of Luke Lane.
5.1.2 In terms of traffic flows, these can be taken from the TA report submitted for both sites.
5.1.3 The residential development of 50 dwellings is predicted to generate some 35 AM peak hour and 37 PM peak hour vehicle movements (two-way); whilst the school is predicted to generate some 92 AM peak hour and 9 PM peak hour vehicle movements (two-way).
5.1.4 The vast majority of these trips would impact on the Luke Lane junction with the A52.
5.1.5 The traffic flows associated with these developments are shown on Figures 5.1 and 5.2.
5.2 Future Developments
5.2.1 Although not technically committed at this stage, a planning application has been submitted and is yet to be determined for 367 residential dwellings, a mixed use centre (community facilities/local retail units) and 8 hectares of employment land on the Ashbourne Airfield site.
5.2.2 In terms of traffic flows, these can again be taken from the TA report submitted for the site; the proposal would increase traffic flows along the A52 during the morning and evening peak hours by 130 vehicles in the AM peak hour and 77 vehicles in the PM peak hour (two-way).
5.2.3 The traffic flows associated with the Ashbourne Airfield site are shown on Figure 5.3
5.2.4 In addition to the above, it is understood that further residential development is likely to come forward off Luke Lane in the near future, with potentially an additional 30 dwellings to the rear of the school, plus 75 dwellings to the east of Luke Lane.
5.2.5 Brailsford PC has also advised that Gladman have consulted them on an additional 75 dwellings, with access to be taken directly from the A52 to the west of the village.
5.2.6 The traffic flows associated with all of these developments are shown on Figures 5.4 to 5.6; it should be noted that the traffic generation and distribution associated with these potential residential sites have been based
T16512 Brailsford Parish Council
PTB Transport Planning Ltd - 20 - T16512 Transport Appraisal Rev A - Email.docx
on the agreed parameters from the approved Miller Homes and School assessments.
5.3 Development Impacts
5.3.1 As indicated in Chapter 2, observations of the A52 junctions with Luke Lane and The Green indicate that the junction currently operates within capacity during the morning and evening peak hours.
5.3.2 On average, low levels of queueing and delay were observed, with some spikes in queues and delays that primarily result from right-turning HGV traffic on both the A52 and Luke Lane.
5.3.3 In terms of the likely impact of the above developments, the TA report for the Miller Homes residential development and the relocated primary school indicated that there would be spare capacity in the junction in the 2018 design year with both developments operational.
5.3.4 This report considers the impact of these developments for a design year of 2021 and applies appropriate background traffic growth to the 2016 flows, as shown on Figure 5.7; the traffic flows with the additional development in place are shown on Figure 5.8.
5.3.5 It should be noted that it is generally accepted that a Ratio of Flow to Capacity (RFC) of around 0.85 is considered to represent a junction operating within capacity and an RFC of 1.00 or above is considered to represent a junction operating at (or over) capacity.
5.3.6 However, the RFC is not the only consideration; junction queues and delays are also considered to be important.
5.3.7 Prior to setting out the results of the capacity analysis at the A52/Luke Lane junction, it should be noted that we would expect the junction to operate within capacity in 2021, but much closer to operational capacity, for the reasons given below.
5.3.8 Firstly, the profiles of traffic along both the A52 and Luke Lane during the peak hours are relatively flat and would not be expected to change, other than for the school development which would likely compress the arrivals and departures (for that element) into a half-hour period in the morning peak hour – please note that we have modelled this profile for the school directly.
5.3.9 As indicated earlier in this report, the flatter the traffic profile, the more likely it is that a priority junction will operate within capacity as any queues that do form tend to clear before additional traffic hits the junction and is required to give-way (subject to total traffic flow on the main road, as this affects gap availability and gap acceptance).
5.3.10 The second reason relates to the modelling of junctions, as they work on ‘mean’ (or average) values – traffic flows, queues, delays, etc. – but

T16512 Brailsford Parish Council
PTB Transport Planning Ltd - 21 - T16512 Transport Appraisal Rev A - Email.docx
generally using only a single day of ‘neutral’ traffic flow data, as per national guidance.
5.3.11 This is particularly important when relating the modelling results to conditions observed on-street during the peak periods and is summarised in an extract below by the software developers (TRL) as follows (please note that this technical response relates to queue observations):
“Measuring queues seems to be the obvious way of checking a model, because queue lengths are one of the main outputs from the programs. In fact some traffic engineers, and their customers, insist on such checks being carried out. If so, they should understand the implications of what they are doing. Apart from the practical difficulties of measuring mean queues over successive time intervals there are also mathematical problems to consider. During peak periods (when the flow/capacity ratios are high) there is a large daily variation in queue lengths even if the average flow for each time segment does not vary from day to day. To take a typical example, a mean queue of 26 pcu would be derived from queues which varied between 5 pcu and 50 pcu from day to day. In fact, on 1 day in 20 the queue would be outside even this large envelope of possible values.
So you can see that many days of queue measurements would have to be taken to obtain a reliable estimate of mean queues. The junction model predictions are based on an infinite number of days!”
(Extract taken from https://trlsoftware.co.uk/support/knowledgebase/articles/131)
5.3.12 As a result, it would be expected that the operation of the Luke Lane junction would show a small amount of spare capacity during peak periods, on average; clearly, under such a scenario, this would include periods when the junction would operate over capacity and periods when there would be a more significant amount of spare capacity in the junction.
5.3.13 In terms of the modelling, this is set out in detail in Appendix E, with Table 4 (overleaf) detailing the results.

T16512 Brailsford Parish Council
PTB Transport Planning Ltd - 22 - T16512 Transport Appraisal Rev A - Email.docx
Table 4 – PICADY Analysis – A52/Luke Lane Priority Junction
Approach Arm AM peak PM peak
RFC Queue Delay RFC Queue Delay
2016 Base
Luke Lane 0.52 1 18 0.39 1 14
A52 (E) Right-turn 0.26 1 7 0.38 1 7
2021 Base
Luke Lane 0.58 1 21 0.44 1 15
A52 (E) Right-turn 0.30 1 7 0.45 2 8
2021 Base + Expected Development
Luke Lane 0.84 5 61 0.61 2 25
A52 (E) Right-turn 0.41 2 8 0.69 5 13
RFC – Ratio of Flow to Capacity, Mean Max Queue – Passenger Car Unit (PCU), Delay – Seconds per PCU
5.3.14 As expected, the modelling of the junction shows that there is some spare capacity in the AM peak hour, with Luke Lane indicating an RFC of 0.84 and delay of 61 seconds per PCU.
5.3.15 There is more spare capacity in the PM peak hour, with an RFC of 0.61 and delay of 25 seconds per PCU on Luke Lane; whilst the A52 right-turn shows an RFC of 0.69 and delay of 13 seconds per PCU.
5.3.16 It is important to note that the final scenario is with all of the expected development (as identified in section 5.2) in place and the associated traffic on the highway network.
5.3.17 In terms of incremental impacts, each development would introduce a small amount of additional queueing and delay to the junction; however, Table 4 shows the cumulative impact of the developments, if they were all to come forward within the next five years.
5.3.18 It is also worth bearing in mind that the relevant test when considering the transport impacts of an individual development is Paragraph 32 of the NPPF, which states:
“32. All developments that generate significant amounts of movement should be supported by a Transport Statement or Transport Assessment. Plans and decisions should take account of whether:
• the opportunities for sustainable transport modes have been taken up
depending on the nature and location of the site, to reduce the need for major transport infrastructure;
• safe and suitable access to the site can be achieved for all people; and • improvements can be undertaken within the transport network that cost
effectively limit the significant impacts of the development. Development

T16512 Brailsford Parish Council
PTB Transport Planning Ltd - 23 - T16512 Transport Appraisal Rev A - Email.docx
should only be prevented or refused on transport grounds where the residual cumulative impacts of development are severe.”
5.3.19 Given that the Luke Lane junction shows, on average, a small amount of spare capacity when modelled, it is likely that the residual cumulative impact of each individual committed/expected development would not be considered to be “severe” in this instance.
T16512 Brailsford Parish Council
PTB Transport Planning Ltd - 24 - T16512 Transport Appraisal Rev A - Email.docx
6.0 POTENTIAL IMPROVEMENTS AND RECOMMENDATIONS
6.1 Traffic Calming
6.1.1 As detailed in Chapter 3, the traffic speeds on the approach to Brailsford and through the village itself are not excessive given the prevailing speed limits.
6.1.2 Therefore, the implementation of a traffic calming scheme to address an existing speeding issue would not be justified.
6.1.3 Further to this, it is our view that the LHA would not accept traffic calming measures along the A52 (either vertical or horizontal) due to the nature of the road as a distributor route; given the significant daily volumes of traffic (including HGVs), this would be highly likely to create significant long-term maintenance issues.
6.1.4 Even if LHA support could be achieved, a traffic calming scheme through the village would materially impact on the lives of existing residents in terms of environmental impacts, such as noise, vibration and pollution. Therefore, it is unlikely to be favourably received once the wider impacts of such a scheme are taken into account.
6.1.5 In terms of highway safety, although the data in Chapter 4 demonstrates that there have been a number of accidents along the A52 to the east and west of Brailsford Village, there have only been a limited number within the built-up area/30mph zone; as such, it is not considered necessary to address a highway safety issue through the implementation of a traffic calming scheme.
6.2 Entry Features
6.2.1 As stated in Chapter 2, the existing ‘gateway’ entry features for Brailsford Village are not consistent in terms of their provision, with only the eastern feature having rumble strips and ‘dragons teeth’ road markings on the approach alongside the countdown markers to the change in the speed limit.
6.2.2 In both locations, the reflective marker posts are in poor condition and, in some cases, are no longer in an upright position or have been dislodged from their original position completely.
6.2.3 Therefore, we would recommend that the gateways are improved to provide a more visible and appropriate entry into the village from both sides; this would generally involve replacing/upgrading all of the reflective marker posts, providing new/upgraded road surface markings such as the speed roundels and potentially different coloured surfacing, plus replacement rumble strips.
6.2.4 To the west of the village, we would recommend that new rumble strips and ‘dragons teeth’ road markings are provided alongside the countdown markers to provide consistency across both approaches to the village; there
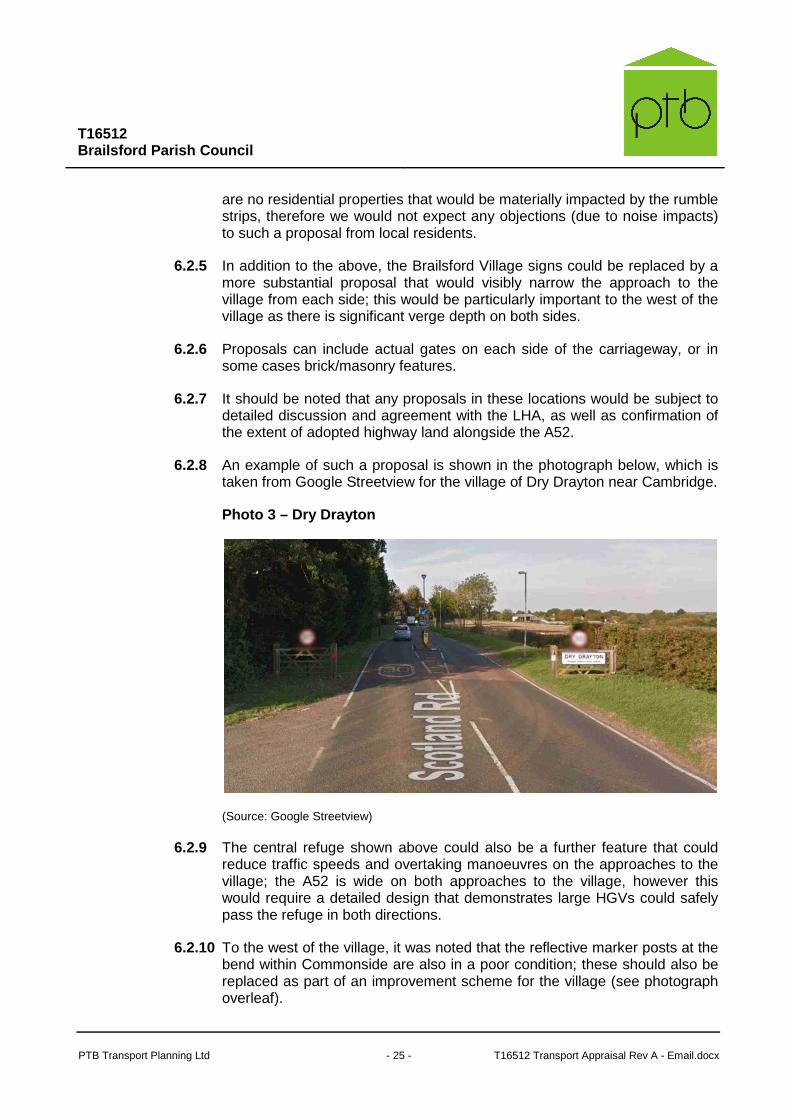
T16512 Brailsford Parish Council
PTB Transport Planning Ltd - 25 - T16512 Transport Appraisal Rev A - Email.docx
are no residential properties that would be materially impacted by the rumble strips, therefore we would not expect any objections (due to noise impacts) to such a proposal from local residents.
6.2.5 In addition to the above, the Brailsford Village signs could be replaced by a more substantial proposal that would visibly narrow the approach to the village from each side; this would be particularly important to the west of the village as there is significant verge depth on both sides.
6.2.6 Proposals can include actual gates on each side of the carriageway, or in some cases brick/masonry features.
6.2.7 It should be noted that any proposals in these locations would be subject to detailed discussion and agreement with the LHA, as well as confirmation of the extent of adopted highway land alongside the A52.
6.2.8 An example of such a proposal is shown in the photograph below, which is taken from Google Streetview for the village of Dry Drayton near Cambridge.
Photo 3 – Dry Drayton
(Source: Google Streetview)
6.2.9 The central refuge shown above could also be a further feature that could reduce traffic speeds and overtaking manoeuvres on the approaches to the village; the A52 is wide on both approaches to the village, however this would require a detailed design that demonstrates large HGVs could safely pass the refuge in both directions.
6.2.10 To the west of the village, it was noted that the reflective marker posts at the bend within Commonside are also in a poor condition; these should also be replaced as part of an improvement scheme for the village (see photograph overleaf).
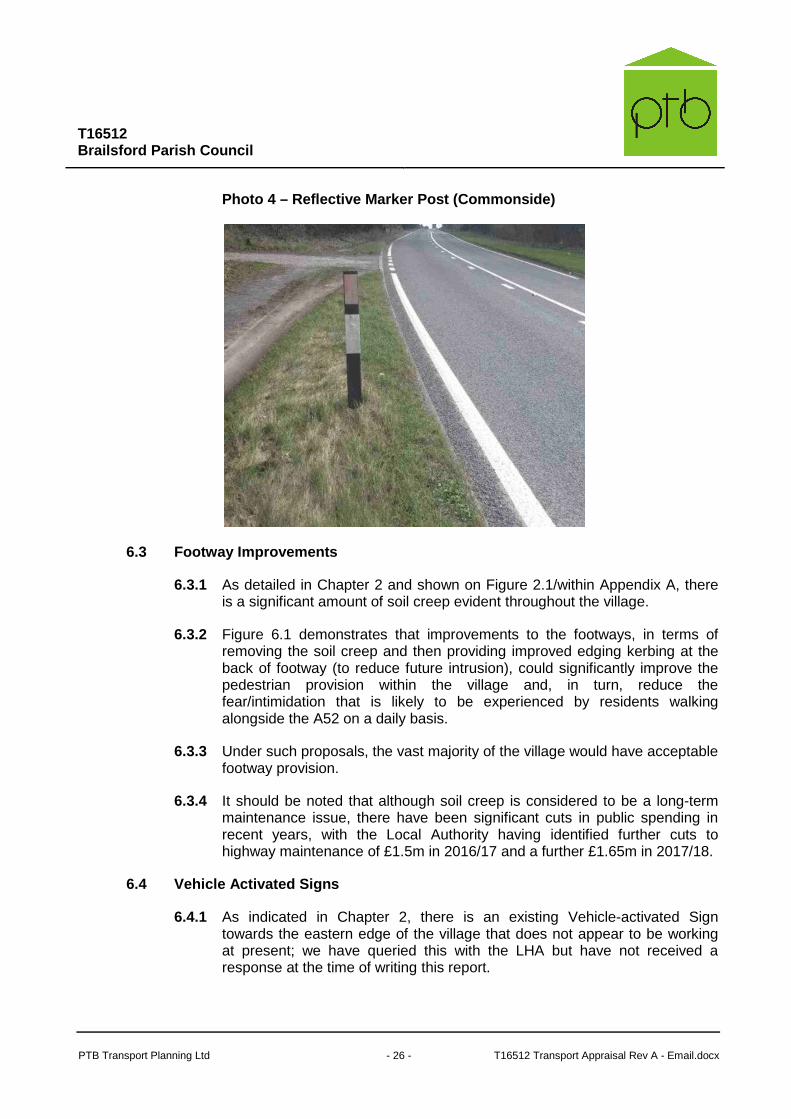
T16512 Brailsford Parish Council
PTB Transport Planning Ltd - 26 - T16512 Transport Appraisal Rev A - Email.docx
Photo 4 – Reflective Marker Post (Commonside)
6.3 Footway Improvements
6.3.1 As detailed in Chapter 2 and shown on Figure 2.1/within Appendix A, there is a significant amount of soil creep evident throughout the village.
6.3.2 Figure 6.1 demonstrates that improvements to the footways, in terms of removing the soil creep and then providing improved edging kerbing at the back of footway (to reduce future intrusion), could significantly improve the pedestrian provision within the village and, in turn, reduce the fear/intimidation that is likely to be experienced by residents walking alongside the A52 on a daily basis.
6.3.3 Under such proposals, the vast majority of the village would have acceptable footway provision.
6.3.4 It should be noted that although soil creep is considered to be a long-term maintenance issue, there have been significant cuts in public spending in recent years, with the Local Authority having identified further cuts to highway maintenance of £1.5m in 2016/17 and a further £1.65m in 2017/18.
6.4 Vehicle Activated Signs
6.4.1 As indicated in Chapter 2, there is an existing Vehicle-activated Sign towards the eastern edge of the village that does not appear to be working at present; we have queried this with the LHA but have not received a response at the time of writing this report.
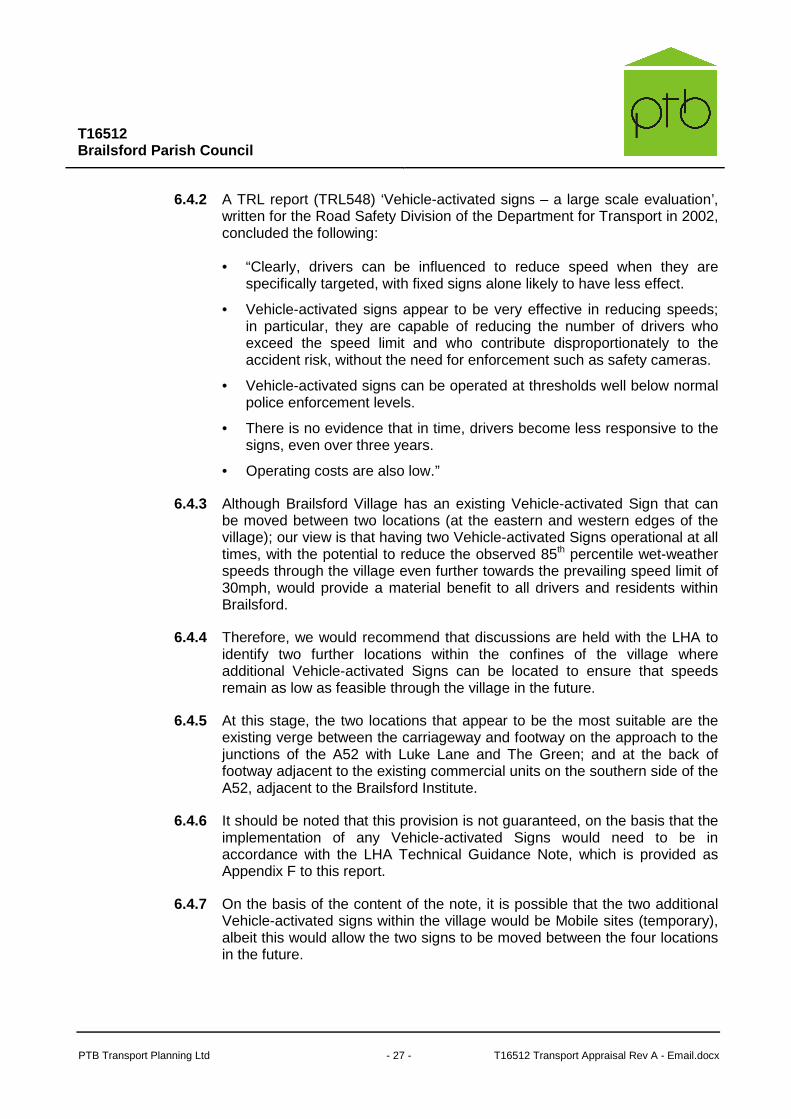
T16512 Brailsford Parish Council
PTB Transport Planning Ltd - 27 - T16512 Transport Appraisal Rev A - Email.docx
6.4.2 A TRL report (TRL548) ‘Vehicle-activated signs – a large scale evaluation’, written for the Road Safety Division of the Department for Transport in 2002, concluded the following:
• “Clearly, drivers can be influenced to reduce speed when they are specifically targeted, with fixed signs alone likely to have less effect.
• Vehicle-activated signs appear to be very effective in reducing speeds; in particular, they are capable of reducing the number of drivers who exceed the speed limit and who contribute disproportionately to the accident risk, without the need for enforcement such as safety cameras.
• Vehicle-activated signs can be operated at thresholds well below normal police enforcement levels.
• There is no evidence that in time, drivers become less responsive to the signs, even over three years.
• Operating costs are also low.”
6.4.3 Although Brailsford Village has an existing Vehicle-activated Sign that can be moved between two locations (at the eastern and western edges of the village); our view is that having two Vehicle-activated Signs operational at all times, with the potential to reduce the observed 85th percentile wet-weather speeds through the village even further towards the prevailing speed limit of 30mph, would provide a material benefit to all drivers and residents within Brailsford.
6.4.4 Therefore, we would recommend that discussions are held with the LHA to identify two further locations within the confines of the village where additional Vehicle-activated Signs can be located to ensure that speeds remain as low as feasible through the village in the future.
6.4.5 At this stage, the two locations that appear to be the most suitable are the existing verge between the carriageway and footway on the approach to the junctions of the A52 with Luke Lane and The Green; and at the back of footway adjacent to the existing commercial units on the southern side of the A52, adjacent to the Brailsford Institute.
6.4.6 It should be noted that this provision is not guaranteed, on the basis that the implementation of any Vehicle-activated Signs would need to be in accordance with the LHA Technical Guidance Note, which is provided as Appendix F to this report.
6.4.7 On the basis of the content of the note, it is possible that the two additional Vehicle-activated signs within the village would be Mobile sites (temporary), albeit this would allow the two signs to be moved between the four locations in the future.

T16512 Brailsford Parish Council
PTB Transport Planning Ltd - 28 - T16512 Transport Appraisal Rev A - Email.docx
6.4.8 Further discussions with the LHA could also determine whether an exception could be made to facilitate a permanent site within the village, should post-implementation surveys indicate a significant benefit.
6.4.9 Notwithstanding the above, in our view the accident data on the A52 provides a strong case for permanent Vehicle-activated Signs on the bend through Commonside, and also at the junction of the A52 with Derby Lane.
6.4.10 The bend through Commonside has seen six PIAs in the previous five years, including two serious accidents and one fatal accident; although technically this would not meet the LHA guidance in Appendix F (which requires six injury collisions in the previous three years), our view is that the severity of accidents here would justify a request for permanent ‘hazard warning’ Vehicle-activated Signs on both the eastbound and westbound approaches to the bend.
6.4.11 We would recommend that the westbound sign replaces the existing road warning sign TSGD 512 (‘Bend Ahead’) so as to reduce duplication and clutter, whilst also giving the new Vehicle-activated sign more prominence.
6.4.12 At the A52 junction with Derby Lane, there have been seven PIAs between August 2013 and May 2015, including a serious and a fatal accident; therefore, this location meets the criteria detailed in Appendix F.
6.4.13 However, whilst we would ordinarily recommend making a request for permanent ‘hazard warning’ Vehicle-activated Signs on both the south-eastbound and north-westbound approaches to the junction, in accordance with TSGD 506.1 (‘Side road ahead’); it should be noted that following recent correspondence with the LHA in respect of the A52 and safety along its entire length, the LHA has advised that they have received funding to implement an improvement scheme at the A52/Derby Lane junction.
6.4.14 The email correspondence is provided as Appendix G to this report and confirms that £200,000 of funding was secured in April to widen the junction, incorporate a right-turn lane facility, plus other associated improvements.
6.4.15 The LHA has also recognised that the relocation of statutory undertakers equipment may increase the cost, and therefore may impact on the budget available to deliver a junction improvement here.
6.4.16 Taking into account the above, it is therefore unlikely that a Vehicle-activated Sign proposal would be implemented in this location in the near future; however, there are two further possibilities that could be explored.
6.4.17 Firstly, funding for a Vehicle-activated Sign scheme could be requested to be held for a later date (e.g. a bond over a ten-year period, for example), should the improvement scheme not have the desired effects in terms of the safety of the A52/Derby Lane junction (as also suggested by the LHA).

T16512 Brailsford Parish Council
PTB Transport Planning Ltd - 29 - T16512 Transport Appraisal Rev A - Email.docx
6.4.18 The second option is to request that developers enter into discussions with the LHA in respect of the proposed junction improvement at the A52/Derby Lane, and (subject to being fairly and reasonably related to the development) discuss meeting any funding shortfall to deliver the LHA’s desired junction layout.
6.4.19 The LHA has acknowledged that there is the potential for the £200,000 funding to be lower than the cost of implementing the most suitable and desirable junction in this location; it would therefore be a sensible approach to discuss these proposals with developers in the area in order to achieve the best solution long-term.
6.4.20 As detailed in Appendix F, if in future any new Vehicle-activated signs were determined to be low priority for installation at the County Council’s expense, the installation and long-term maintenance can be funded by outside parties (such as the Parish Council, or via a request for developer contributions).
6.5 Pedestrian Crossings
6.5.1 Although there is an existing signalised pedestrian crossing within the village (next to the entrance to the existing primary school), given that the school is moving to Luke Lane it is considered that a further pedestrian crossing location could be identified within the village to assist with movements across the A52.
6.5.2 It is likely, subject to detailed design considerations and confirmation in respect of forward visibility and any conflicts with private driveways/access points, that a suitable pedestrian crossing facility could be delivered in the vicinity of the Luke Lane junction with the A52.
6.5.3 Our view is that this is likely to be the most appropriate location for a new pedestrian crossing facility within the village, both for schoolchildren and also future residents on Luke Lane crossing to/from the local facilities to the south of the village.
6.5.4 In addition, depending on the eventual location of the pedestrian crossing, with appropriate road markings at the Luke Lane junction (such as ‘Keep Clear’ box junction markings) there is the potential for the crossing facility to improve the operation of the Luke Lane approach to the A52 during peak periods when the crossing is called, as it will provide an additional gap for right-turning vehicles to exit Luke Lane onto the A52.
6.6 Recommendations
6.6.1 Figures 6.1 and 6.2 show the overall scheme of potential improvements for Brailsford.
6.6.2 We would consider it both fair and reasonable to request that such highway improvement proposals are delivered via developer contributions, or
T16512 Brailsford Parish Council
PTB Transport Planning Ltd - 30 - T16512 Transport Appraisal Rev A - Email.docx
developer-led scheme designs and implementation. They are fairly related to the likely impacts of new development coming forward within Brailsford.
6.6.3 Indeed, given public spending cuts over the next few years, this is likely to be the most suitable and appropriate way of delivering these proposals.
6.6.4 It is important to note that the proposals would be subject to detailed discussion with the local authority (both the Planning Authority and the LHA).
6.6.5 It should also be noted that they could be delivered either via a suitably-worded condition and then Section 278 agreement design and implementation (by the developer); or via a Section 106 agreement, with the LHA designing and implementing the works via an agreed cost mechanism.

T16512 Brailsford Parish Council
PTB Transport Planning Ltd T16512 Transport Appraisal Rev A - Email.docx
FIGURES

Figure
Project No
Project
Title
Brailsford
T16512
2.1
Footway Assessment
Date 5th April 2016
Key
Reproduced by permission of Ordnance Survey on behalf of HMSO.© Crown copyright and database right 2016.All rights reserved. Ordnance Survey Licence number 100046404.
General Footway Width
>1.8m
1.5m to 1.8m1.2m to 1.4m0.9m to 1.1m<0.9m
SC
SC Soil Creep
SC
SC
SCSC
SC
SC
SC
SC
SC
SC
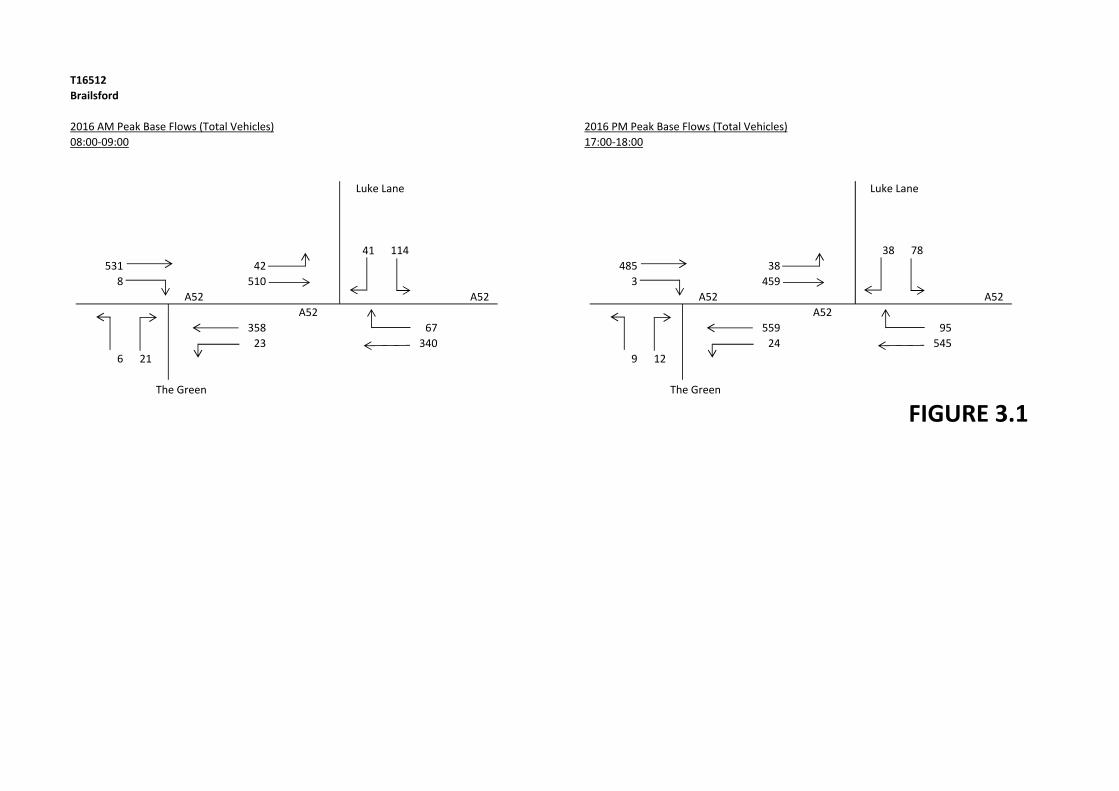
T16512
Brailsford
2016 AM Peak Base Flows (Total Vehicles) 2016 PM Peak Base Flows (Total Vehicles)
08:00-09:00 17:00-18:00
Luke Lane Luke Lane
41 114 38 78
531 42 485 38
8 510 3 459
A52 A52 A52 A52
A52 A52
358 67 559 95
23 340 24 545
6 21 9 12
The Green The Green
FIGURE 3.1FIGURE 3.1

T16512
Brailsford
Miller Homes - 50 dwellings Miller Homes - 50 dwellings
08:00-09:00 17:00-18:00
Luke Lane Luke Lane
6 17 5 8
4 4 7 7
A52 A52 A52 A52
A52 A52
6 8 5 17
The Green The Green
FIGURE 5.1FIGURE 5.1

T16512
Brailsford
Miller Homes - School Miller Homes - School
08:00-09:00 17:00-18:00
Luke Lane Luke Lane
34 4 4 1
44 44 3 3
A52 A52 A52 A52
A52 A52
34 5 4 1
The Green The Green
FIGURE 5.2FIGURE 5.2

T16512
Brailsford
Ashbourne Airfield Ashbourne Airfield
08:00-09:00 17:00-18:00
Luke Lane Luke Lane
51 38
51 38
A52 A52 A52 A52
A52 A52
79 39
79 39
The Green The Green
FIGURE 5.3FIGURE 5.3

T16512
Brailsford
Luke Lane - 30 dwellings Luke Lane - 30 dwellings
08:00-09:00 17:00-18:00
Luke Lane Luke Lane
4 10 3 5
2 2 4 4
A52 A52 A52 A52
A52 A52
4 5 3 10
The Green The Green
FIGURE 5.4FIGURE 5.4

T16512
Brailsford
Luke Lane - 75 dwellings Luke Lane - 75 dwellings
08:00-09:00 17:00-18:00
Luke Lane Luke Lane
10 24 5 14
5 5 10 10
A52 A52 A52 A52
A52 A52
9 12 5 26
1
The Green The Green
FIGURE 5.5FIGURE 5.5
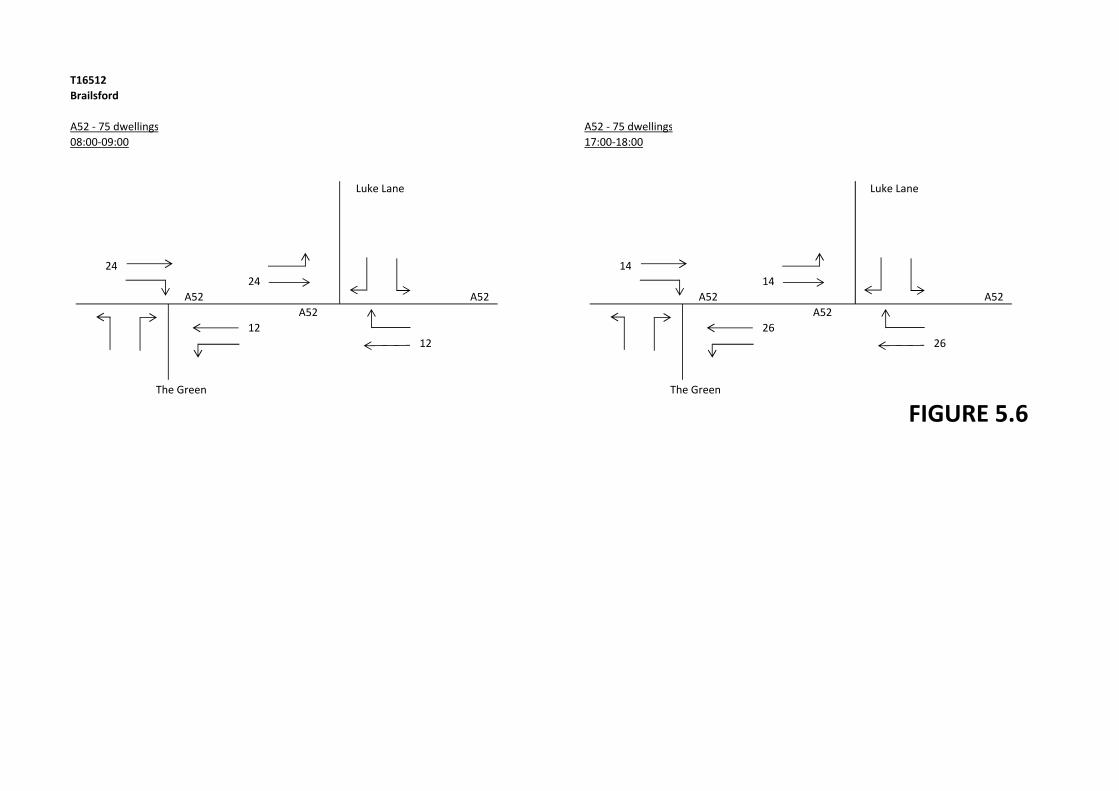
T16512
Brailsford
A52 - 75 dwellings A52 - 75 dwellings
08:00-09:00 17:00-18:00
Luke Lane Luke Lane
24 14
24 14
A52 A52 A52 A52
A52 A52
12 26
12 26
The Green The Green
FIGURE 5.6FIGURE 5.6

T16512
Brailsford
2021 AM Peak Base Flows (PCUs) 2021 PM Peak Base Flows (PCUs)
08:00-09:00 17:00-18:00
Luke Lane Luke Lane
51 130 43 89
623 50 551 42
9 596 3 521
A52 A52 A52 A52
A52 A52
435 79 649 113
27 411 26 632
8 23 10 13
The Green The Green
FIGURE 5.7FIGURE 5.7

T16512
Brailsford
2021 AM Peak Base + Expected Development (PCUs) 2021 PM Peak Base + Expected Development (PCUs)
08:00-09:00 17:00-18:00
Luke Lane Luke Lane
105 185 60 117
753 105 627 66
9 671 3 573
A52 A52 A52 A52
A52 A52
579 109 731 167
28 502 26 697
8 23 10 13
The Green The Green
FIGURE 5.8FIGURE 5.8
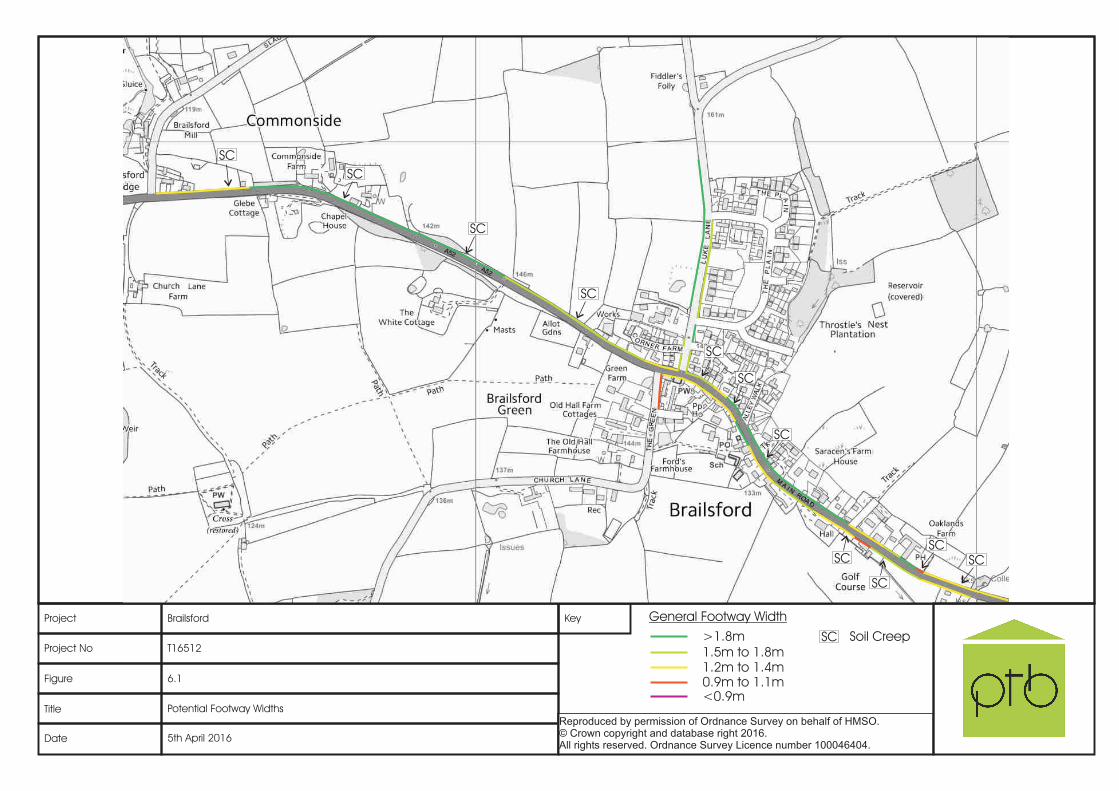
Figure
Project No
Project
Title
Brailsford
T16512
6.1
Potential Footway Widths
Date 5th April 2016
Key
Reproduced by permission of Ordnance Survey on behalf of HMSO.© Crown copyright and database right 2016.All rights reserved. Ordnance Survey Licence number 100046404.
General Footway Width
>1.8m
1.5m to 1.8m1.2m to 1.4m0.9m to 1.1m<0.9m
SC
SC Soil Creep
SC
SC
SCSC
SC
SC
SC
SC
SC
SC

Figure
Project No
Project
Title
Brailsford
T16512
6.2
Potential Highway Improvements
Date 5th April 2016
Key
Reproduced by permission of Ordnance Survey on behalf of HMSO.© Crown copyright and database right 2016.All rights reserved. Ordnance Survey Licence number 100046404.
Replace Reflective
Marker Posts
Provide new gateway
entry feature into Brailsford
Provide new rumble strips
and ‘dragons teeth’ road markings
Provide new gateway
entry feature into Brailsford
Potential new Temporary VAS
locations within village
Potential new Permanent VAS
location through Commonside
(Bend Warning Sign)
Potential new Permanent VAS
location on approach to Derby
Lane Junction with A52
(Priority Junction Warning Sign)
Potential new Pedestrian
crossing location within village

T16512 Brailsford Parish Council
PTB Transport Planning Ltd T16512 Transport Appraisal Rev A - Email.docx
APPENDIX A - PHOTOGRAPHS (SOIL CREEP)

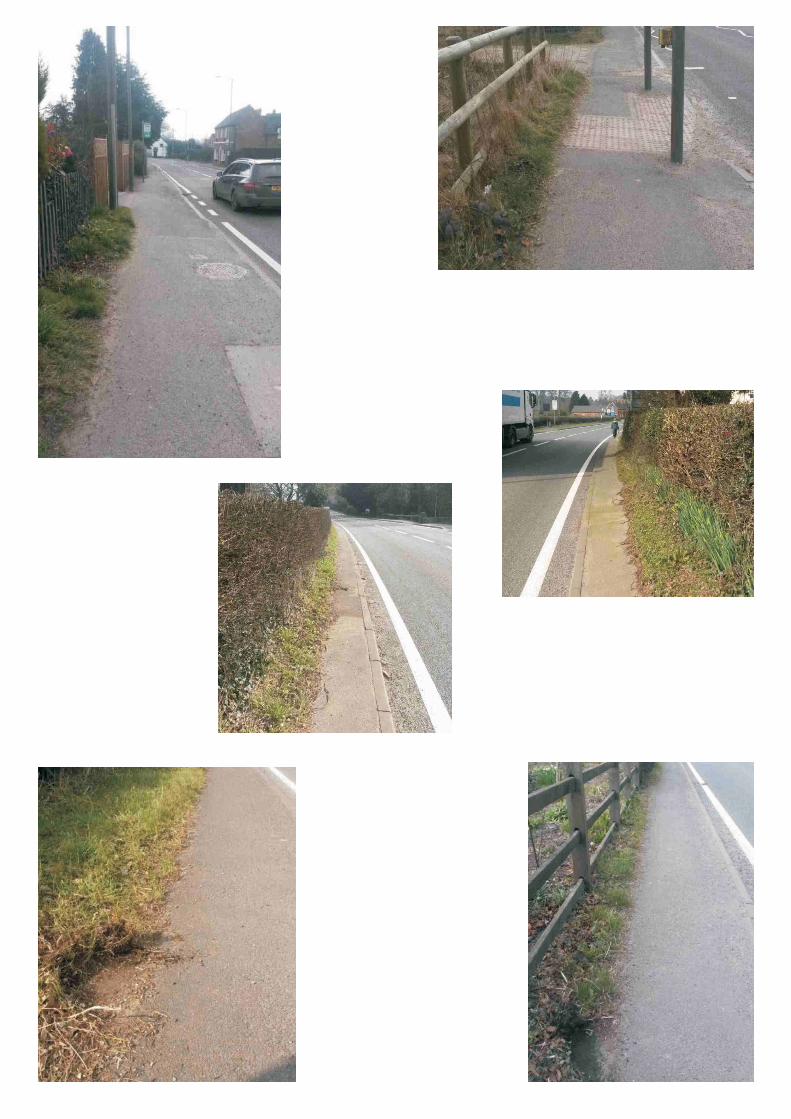

T16512 Brailsford Parish Council
PTB Transport Planning Ltd T16512 Transport Appraisal Rev A - Email.docx
APPENDIX B - TRAFFIC AND SPEED DATA

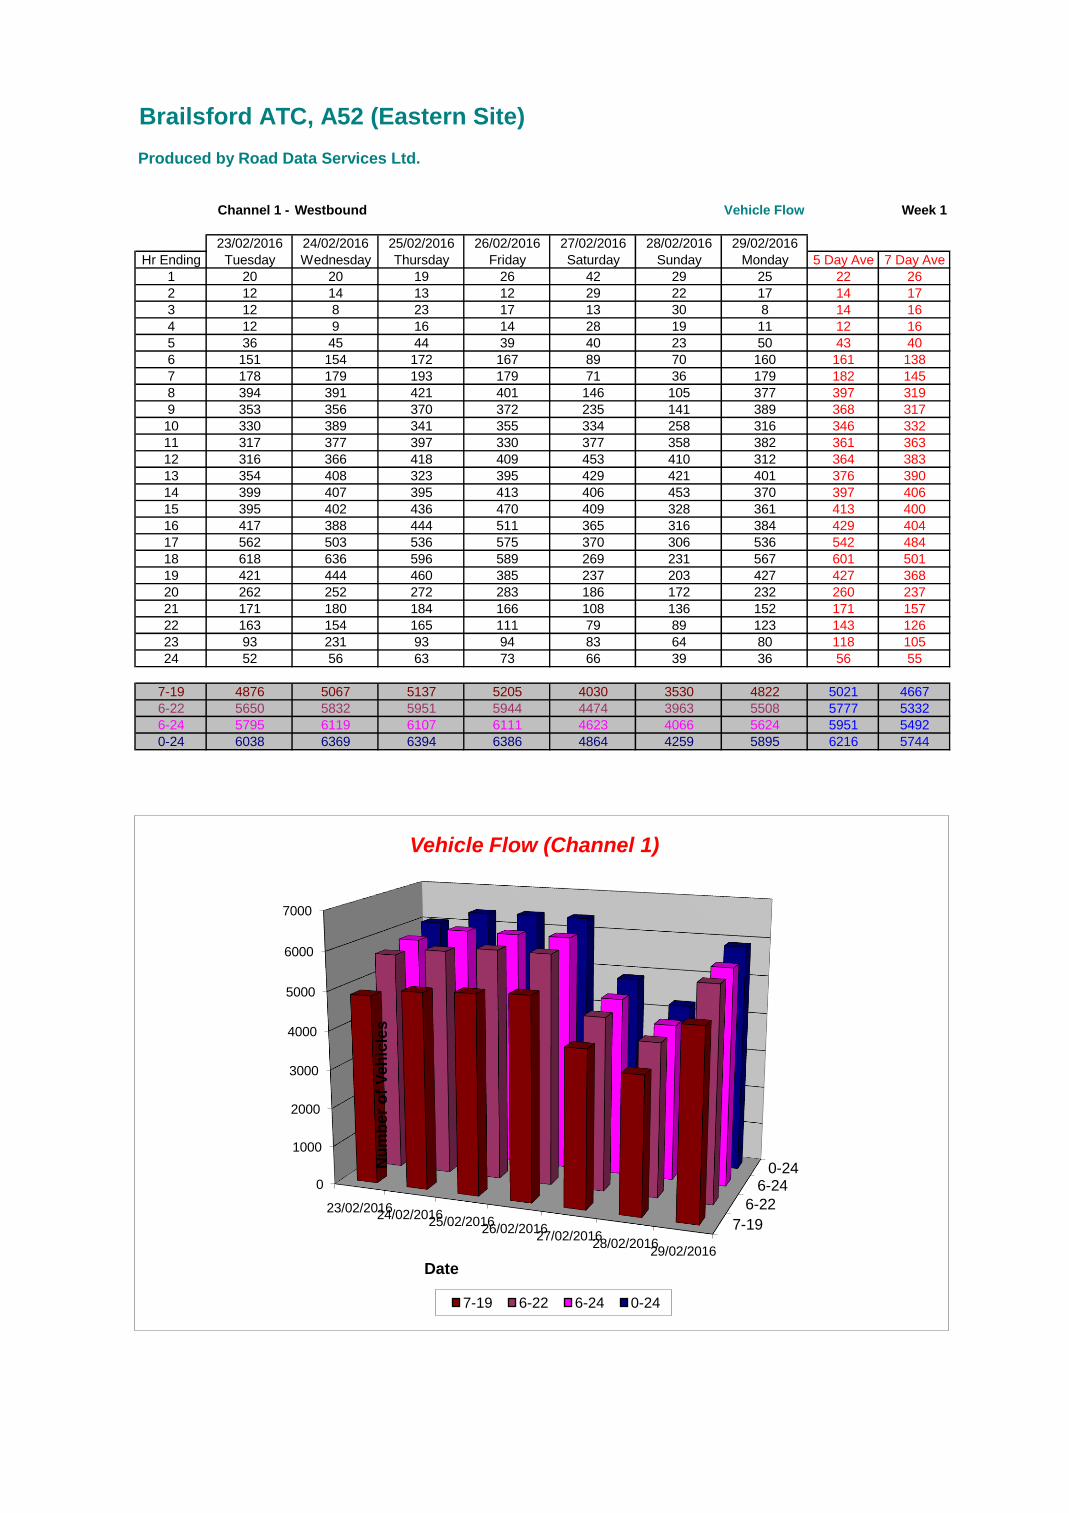
Brailsford ATC, A52 (Eastern Site)
Produced by Road Data Services Ltd.
Channel 1 - Westbound Vehicle Flow Week 1
23/02/2016 24/02/2016 25/02/2016 26/02/2016 27/02/2016 28/02/2016 29/02/2016
Hr Ending Tuesday Wednesday Thursday Friday Saturday Sunday Monday 5 Day Ave 7 Day Ave
1 20 20 19 26 42 29 25 22 26
2 12 14 13 12 29 22 17 14 17
3 12 8 23 17 13 30 8 14 16
4 12 9 16 14 28 19 11 12 16
5 36 45 44 39 40 23 50 43 40
6 151 154 172 167 89 70 160 161 138
7 178 179 193 179 71 36 179 182 145
8 394 391 421 401 146 105 377 397 319
9 353 356 370 372 235 141 389 368 317
10 330 389 341 355 334 258 316 346 332
11 317 377 397 330 377 358 382 361 363
12 316 366 418 409 453 410 312 364 383
13 354 408 323 395 429 421 401 376 390
14 399 407 395 413 406 453 370 397 406
15 395 402 436 470 409 328 361 413 400
16 417 388 444 511 365 316 384 429 404
17 562 503 536 575 370 306 536 542 484
18 618 636 596 589 269 231 567 601 501
19 421 444 460 385 237 203 427 427 368
20 262 252 272 283 186 172 232 260 237
21 171 180 184 166 108 136 152 171 157
22 163 154 165 111 79 89 123 143 126
23 93 231 93 94 83 64 80 118 105
24 52 56 63 73 66 39 36 56 55
7-19 4876 5067 5137 5205 4030 3530 4822 5021 4667
6-22 5650 5832 5951 5944 4474 3963 5508 5777 5332
6-24 5795 6119 6107 6111 4623 4066 5624 5951 5492
0-24 6038 6369 6394 6386 4864 4259 5895 6216 5744
7-19
6-22
6-24 0-24
0
1000
2000
3000
4000
5000
6000
7000
23/02/2016 24/02/2016
25/02/2016 26/02/2016
27/02/2016 28/02/2016
29/02/2016
Nu
mb
er
of
Veh
icle
s
Date
Vehicle Flow (Channel 1)
7-19 6-22 6-24 0-24

Brailsford ATC, A52 (Eastern Site)
Produced by Road Data Services Ltd.
Channel 1 - Westbound Average Speed Week 1
23/02/2016 24/02/2016 25/02/2016 26/02/2016 27/02/2016 28/02/2016 29/02/2016
Hr Ending Tuesday Wednesday Thursday Friday Saturday Sunday Monday
1 34.4 40.8 41.4 35.9 34.5 39.3 36.3 -
2 38.0 37.5 35.5 35.8 34.7 38.0 31.9 -
3 32.8 33.1 37.0 38.4 45.0 39.4 46.8 -
4 40.8 37.4 37.6 35.5 36.4 50.9 43.3 -
5 33.0 37.0 37.0 36.6 38.1 40.1 39.6 -
6 36.6 36.1 37.3 37.6 40.8 41.0 38.1 -
7 33.4 35.0 34.6 33.2 35.1 35.5 35.0 -
8 31.8 31.7 32.6 32.2 34.4 35.1 31.5 -
9 30.1 31.4 31.0 30.6 32.2 32.1 31.4 -
10 31.6 30.7 31.6 31.0 30.9 32.1 31.9 -
11 31.2 30.8 31.0 31.1 29.9 31.1 31.6 -
12 31.0 31.0 30.7 30.1 30.7 31.2 31.9 -
13 31.7 31.1 30.9 30.0 30.8 31.1 31.0 -
14 30.9 31.2 31.4 30.4 30.5 30.3 30.4 -
15 31.1 30.6 30.7 30.2 30.5 31.7 31.1 -
16 30.9 31.0 30.1 29.7 30.8 31.6 29.9 -
17 30.5 30.7 29.7 30.9 30.0 31.5 30.0 -
18 30.4 30.2 30.5 30.9 31.7 32.5 31.0 -
19 31.6 30.9 31.9 32.2 32.1 31.4 31.6 -
20 32.1 33.5 31.9 33.6 32.5 33.5 33.5 -
21 33.6 33.6 33.4 32.8 35.1 34.2 33.6 -
22 33.0 34.4 32.7 33.8 33.7 34.9 34.2 -
23 34.2 32.6 33.5 34.6 34.3 36.8 35.3 -
24 36.7 36.9 36.3 34.6 36.5 35.2 36.3 -
10-12 31.1 30.9 30.9 30.6 30.3 31.1 31.7 -
14-16 31.0 30.8 30.4 29.9 30.6 31.7 30.5 -
0-24 31.6 31.6 31.6 31.4 31.7 32.3 31.8 -
7 Day Ave 31.7
Channel 1 - Westbound 85th Percentile
23/02/2016 24/02/2016 25/02/2016 26/02/2016 27/02/2016 28/02/2016 29/02/2016
Hr Ending Tuesday Wednesday Thursday Friday Saturday Sunday Monday
1 39.3 49.5 48.3 44.3 42.0 48.0 42.2 -
2 48.4 41.4 41.6 41.5 42.8 43.9 35.0 -
3 38.7 38.9 41.7 43.6 51.0 51.7 51.9 -
4 50.4 42.0 48.8 36.5 43.0 61.9 52.0 -
5 35.8 44.8 46.0 43.3 46.0 54.3 47.0 -
6 42.5 42.1 44.4 46.0 52.0 48.7 46.0 -
7 38.0 40.3 41.0 38.0 43.0 42.0 40.3 -
8 36.0 36.0 37.0 37.0 42.0 41.0 36.0 -
9 35.0 35.0 35.0 35.0 36.0 37.0 35.0 -
10 35.0 35.0 36.0 35.0 35.0 35.0 36.0 -
11 36.0 35.0 35.0 35.0 34.0 35.0 35.0 -
12 35.0 35.0 35.0 34.0 35.0 35.0 36.0 -
13 36.0 35.0 35.0 34.0 35.0 35.0 35.0 -
14 35.0 35.0 35.0 35.0 35.0 34.0 35.0 -
15 35.0 35.0 35.0 34.0 35.0 36.0 35.0 -
16 35.0 35.0 34.0 34.0 35.0 36.0 34.0 -
17 35.0 35.0 35.0 35.0 35.0 35.0 34.0 -
18 35.0 35.0 35.0 35.0 37.0 37.0 35.0 -
19 36.0 35.0 36.0 35.4 36.0 37.0 35.1 -
20 35.0 39.0 36.0 38.0 36.0 39.0 38.0 -
21 39.0 38.0 37.6 37.0 40.0 40.8 39.0 -
22 37.7 40.0 36.0 39.0 39.0 41.6 39.0 -
23 41.0 38.0 38.0 41.0 39.7 46.0 40.2 -
24 46.0 49.5 43.8 41.0 43.3 41.0 47.0 -
10-12 36.0 35.0 35.0 35.0 34.0 35.0 35.0 -
14-16 35.0 35.0 35.0 34.0 35.0 36.0 35.0 -
0-24 36.0 36.0 36.0 36.0 36.0 37.0 36.0 -
7 Day Ave 36.0

Brailsford ATC, A52 (Eastern Site)
Produced by Road Data Services Ltd.
Channel 1 - Westbound Speed Summary Week 1
23/02/2016 24/02/2016 25/02/2016 26/02/2016 27/02/2016 28/02/2016 29/02/2016
Speed (MPH) Tuesday Wednesday Thursday Friday Saturday Sunday Monday
0-25 363 387 454 458 345 181 321
26-40 5380 5651 5624 5569 4202 3745 5225
41-55 282 312 298 344 292 306 332
56- 13 19 18 15 25 27 17
TOTAL 6038 6369 6394 6386 4864 4259 5895
0%
10%
20%
30%
40%
50%
60%
70%
80%
90%
100%
23/02/2016 24/02/2016 25/02/2016 26/02/2016 27/02/2016 28/02/2016 29/02/2016 Date
Speed Summary (MPH)
0-25 26-40 41-55 56-

Brailsford ATC, A52 (Eastern Site)
Produced by Road Data Services Ltd.
Channel 1 - Westbound Vehicle Class Week 1
Classes Car / LGV / OGV1 / Bus OGV2 TOTAL
Day / Time Caravan - 1 - 2,3,5,6,7,12 - 4,8,9,10,11,13 - 1-13
23/02/2016
7-19 4182 548 146 4876
6-22 4884 596 170 5650
6-24 5011 608 176 5795
0-24 5209 632 197 6038
24/02/2016
7-19 4344 565 158 5067
6-22 5029 623 180 5832
6-24 5286 645 188 6119
0-24 5489 669 211 6369
25/02/2016
7-19 4403 572 162 5137
6-22 5132 635 184 5951
6-24 5271 643 193 6107
0-24 5519 668 207 6394
26/02/2016
7-19 4502 537 166 5205
6-22 5176 586 182 5944
6-24 5331 595 185 6111
0-24 5549 625 212 6386
27/02/2016
7-19 3728 267 35 4030
6-22 4127 302 45 4474
6-24 4263 313 47 4623
0-24 4465 341 58 4864
28/02/2016
7-19 3351 151 28 3530
6-22 3764 166 33 3963
6-24 3861 171 34 4066
0-24 4033 186 40 4259
29/02/2016
7-19 4124 528 170 4822
6-22 4763 558 187 5508
6-24 4869 565 190 5624
0-24 5118 583 194 5895
Average
7-19 4091 453 124 4667
6-22 4696 495 140 5332
6-24 4842 506 145 5492
0-24 5055 529 160 5744
88%
9% 3%
Total Vehicle Class Distribution

Brailsford ATC, A52 (Eastern Site)
Produced by Road Data Services Ltd.
Channel 2 - Eastbound Vehicle Flow Week 1
23/02/2016 24/02/2016 25/02/2016 26/02/2016 27/02/2016 28/02/2016 29/02/2016
Hr Ending Tuesday Wednesday Thursday Friday Saturday Sunday Monday 5 Day Ave 7 Day Ave
1 26 31 25 36 26 47 15 27 29
2 29 38 30 30 40 21 18 29 29
3 7 7 7 15 15 26 11 9 13
4 16 14 21 16 20 22 16 17 18
5 32 28 33 28 17 16 33 31 27
6 100 77 104 86 42 27 109 95 78
7 322 342 334 308 77 57 333 328 253
8 672 690 633 567 156 74 711 655 500
9 659 689 600 545 261 110 607 620 496
10 427 516 480 451 378 268 438 462 423
11 333 356 339 415 420 335 375 364 368
12 327 344 371 379 385 375 358 356 363
13 348 341 362 374 394 409 335 352 366
14 369 373 358 403 389 365 377 376 376
15 419 402 391 473 366 427 400 417 411
16 418 479 476 450 326 464 380 441 428
17 489 483 486 471 426 461 434 473 464
18 484 528 529 451 316 351 481 495 449
19 312 389 320 312 264 271 276 322 306
20 169 178 178 167 131 165 145 167 162
21 110 92 132 139 98 124 98 114 113
22 66 75 96 66 66 88 81 77 77
23 85 63 75 73 77 37 72 74 69
24 20 34 50 47 54 16 37 38 37
7-19 5257 5590 5345 5291 4081 3910 5172 5331 4949
6-22 5924 6277 6085 5971 4453 4344 5829 6017 5555
6-24 6029 6374 6210 6091 4584 4397 5938 6128 5660
0-24 6239 6569 6430 6302 4744 4556 6140 6336 5854
7-19
6-22
6-24 0-24
0
1000
2000
3000
4000
5000
6000
7000
23/02/2016 24/02/2016
25/02/2016 26/02/2016
27/02/2016 28/02/2016
29/02/2016
Nu
mb
er
of
Veh
icle
s
Date
Vehicle Flow (Channel 2)
7-19 6-22 6-24 0-24
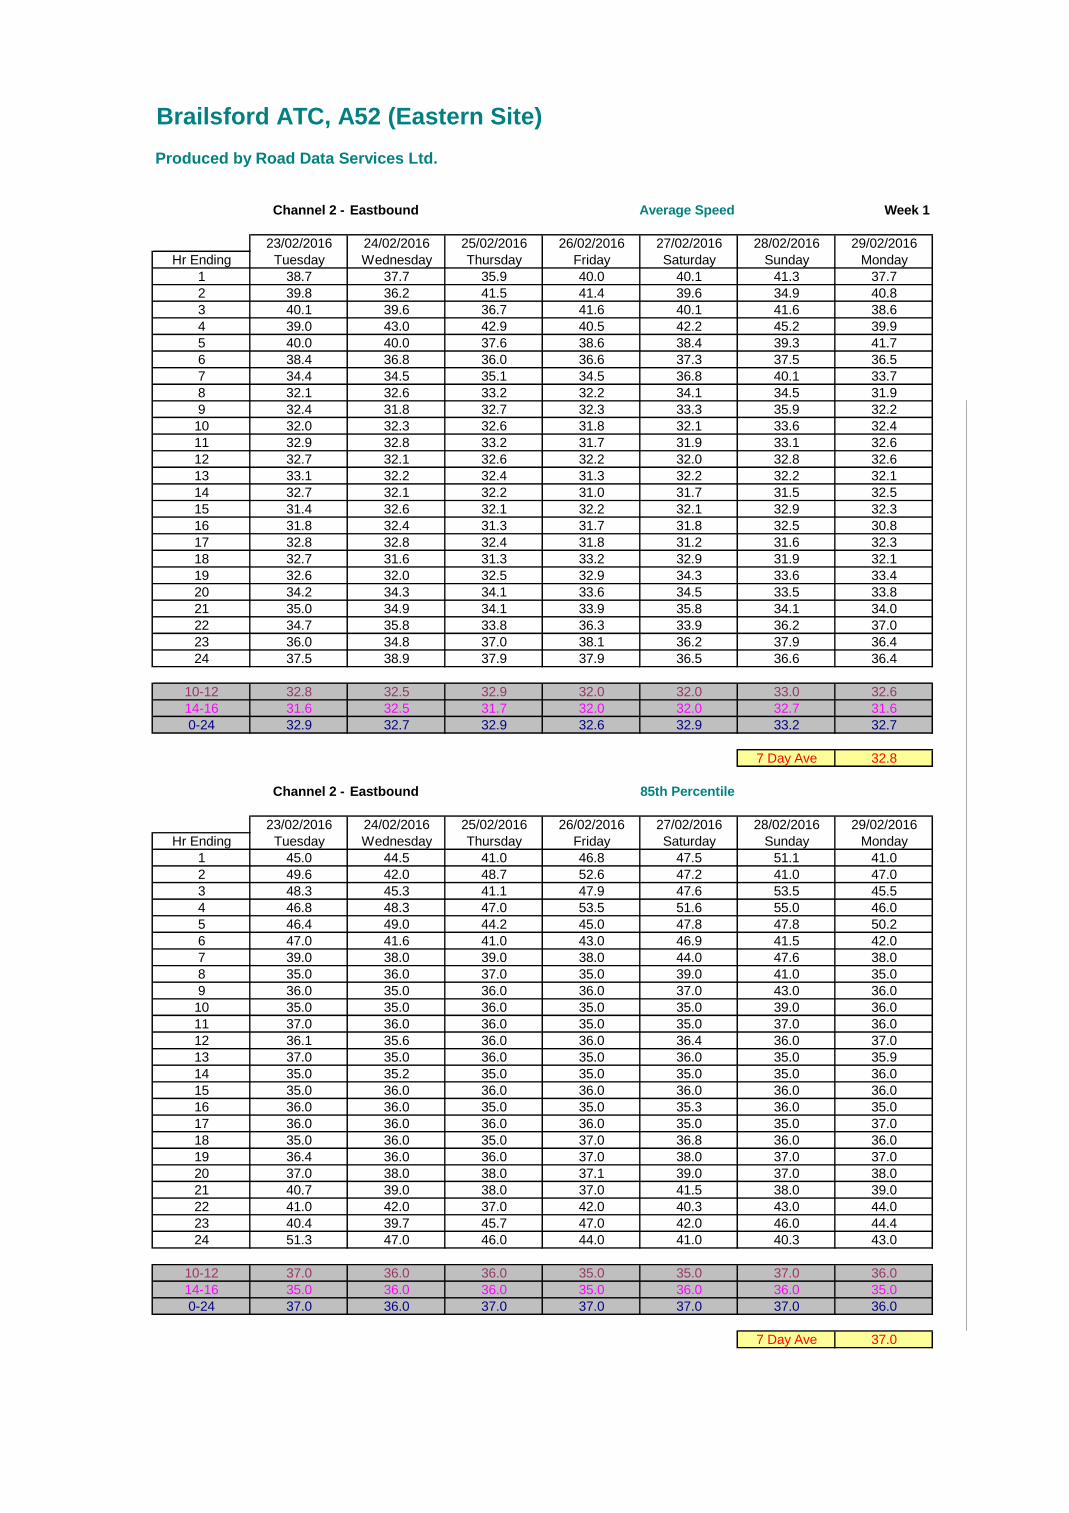
Brailsford ATC, A52 (Eastern Site)
Produced by Road Data Services Ltd.
Channel 2 - Eastbound Average Speed Week 1
23/02/2016 24/02/2016 25/02/2016 26/02/2016 27/02/2016 28/02/2016 29/02/2016
Hr Ending Tuesday Wednesday Thursday Friday Saturday Sunday Monday
1 38.7 37.7 35.9 40.0 40.1 41.3 37.7 -
2 39.8 36.2 41.5 41.4 39.6 34.9 40.8 -
3 40.1 39.6 36.7 41.6 40.1 41.6 38.6 -
4 39.0 43.0 42.9 40.5 42.2 45.2 39.9 -
5 40.0 40.0 37.6 38.6 38.4 39.3 41.7 -
6 38.4 36.8 36.0 36.6 37.3 37.5 36.5 -
7 34.4 34.5 35.1 34.5 36.8 40.1 33.7 -
8 32.1 32.6 33.2 32.2 34.1 34.5 31.9 -
9 32.4 31.8 32.7 32.3 33.3 35.9 32.2 -
10 32.0 32.3 32.6 31.8 32.1 33.6 32.4 -
11 32.9 32.8 33.2 31.7 31.9 33.1 32.6 -
12 32.7 32.1 32.6 32.2 32.0 32.8 32.6 -
13 33.1 32.2 32.4 31.3 32.2 32.2 32.1 -
14 32.7 32.1 32.2 31.0 31.7 31.5 32.5 -
15 31.4 32.6 32.1 32.2 32.1 32.9 32.3 -
16 31.8 32.4 31.3 31.7 31.8 32.5 30.8 -
17 32.8 32.8 32.4 31.8 31.2 31.6 32.3 -
18 32.7 31.6 31.3 33.2 32.9 31.9 32.1 -
19 32.6 32.0 32.5 32.9 34.3 33.6 33.4 -
20 34.2 34.3 34.1 33.6 34.5 33.5 33.8 -
21 35.0 34.9 34.1 33.9 35.8 34.1 34.0 -
22 34.7 35.8 33.8 36.3 33.9 36.2 37.0 -
23 36.0 34.8 37.0 38.1 36.2 37.9 36.4 -
24 37.5 38.9 37.9 37.9 36.5 36.6 36.4 -
10-12 32.8 32.5 32.9 32.0 32.0 33.0 32.6 -
14-16 31.6 32.5 31.7 32.0 32.0 32.7 31.6 -
0-24 32.9 32.7 32.9 32.6 32.9 33.2 32.7 -
7 Day Ave 32.8
Channel 2 - Eastbound 85th Percentile
23/02/2016 24/02/2016 25/02/2016 26/02/2016 27/02/2016 28/02/2016 29/02/2016
Hr Ending Tuesday Wednesday Thursday Friday Saturday Sunday Monday
1 45.0 44.5 41.0 46.8 47.5 51.1 41.0 -
2 49.6 42.0 48.7 52.6 47.2 41.0 47.0 -
3 48.3 45.3 41.1 47.9 47.6 53.5 45.5 -
4 46.8 48.3 47.0 53.5 51.6 55.0 46.0 -
5 46.4 49.0 44.2 45.0 47.8 47.8 50.2 -
6 47.0 41.6 41.0 43.0 46.9 41.5 42.0 -
7 39.0 38.0 39.0 38.0 44.0 47.6 38.0 -
8 35.0 36.0 37.0 35.0 39.0 41.0 35.0 -
9 36.0 35.0 36.0 36.0 37.0 43.0 36.0 -
10 35.0 35.0 36.0 35.0 35.0 39.0 36.0 -
11 37.0 36.0 36.0 35.0 35.0 37.0 36.0 -
12 36.1 35.6 36.0 36.0 36.4 36.0 37.0 -
13 37.0 35.0 36.0 35.0 36.0 35.0 35.9 -
14 35.0 35.2 35.0 35.0 35.0 35.0 36.0 -
15 35.0 36.0 36.0 36.0 36.0 36.0 36.0 -
16 36.0 36.0 35.0 35.0 35.3 36.0 35.0 -
17 36.0 36.0 36.0 36.0 35.0 35.0 37.0 -
18 35.0 36.0 35.0 37.0 36.8 36.0 36.0 -
19 36.4 36.0 36.0 37.0 38.0 37.0 37.0 -
20 37.0 38.0 38.0 37.1 39.0 37.0 38.0 -
21 40.7 39.0 38.0 37.0 41.5 38.0 39.0 -
22 41.0 42.0 37.0 42.0 40.3 43.0 44.0 -
23 40.4 39.7 45.7 47.0 42.0 46.0 44.4 -
24 51.3 47.0 46.0 44.0 41.0 40.3 43.0 -
10-12 37.0 36.0 36.0 35.0 35.0 37.0 36.0 -
14-16 35.0 36.0 36.0 35.0 36.0 36.0 35.0 -
0-24 37.0 36.0 37.0 37.0 37.0 37.0 36.0 -
7 Day Ave 37.0

Brailsford ATC, A52 (Eastern Site)
Produced by Road Data Services Ltd.
Channel 2 - Eastbound Speed Summary Week 1
23/02/2016 24/02/2016 25/02/2016 26/02/2016 27/02/2016 28/02/2016 29/02/2016
Speed (MPH) Tuesday Wednesday Thursday Friday Saturday Sunday Monday
0-25 188 210 208 224 143 114 213
26-40 5719 6021 5843 5712 4290 4102 5611
41-55 316 324 357 344 292 322 302
56- 16 14 22 22 19 18 14
TOTAL 6239 6569 6430 6302 4744 4556 6140
0%
10%
20%
30%
40%
50%
60%
70%
80%
90%
100%
23/02/2016 24/02/2016 25/02/2016 26/02/2016 27/02/2016 28/02/2016 29/02/2016 Date
Speed Summary (MPH)
0-25 26-40 41-55 56-
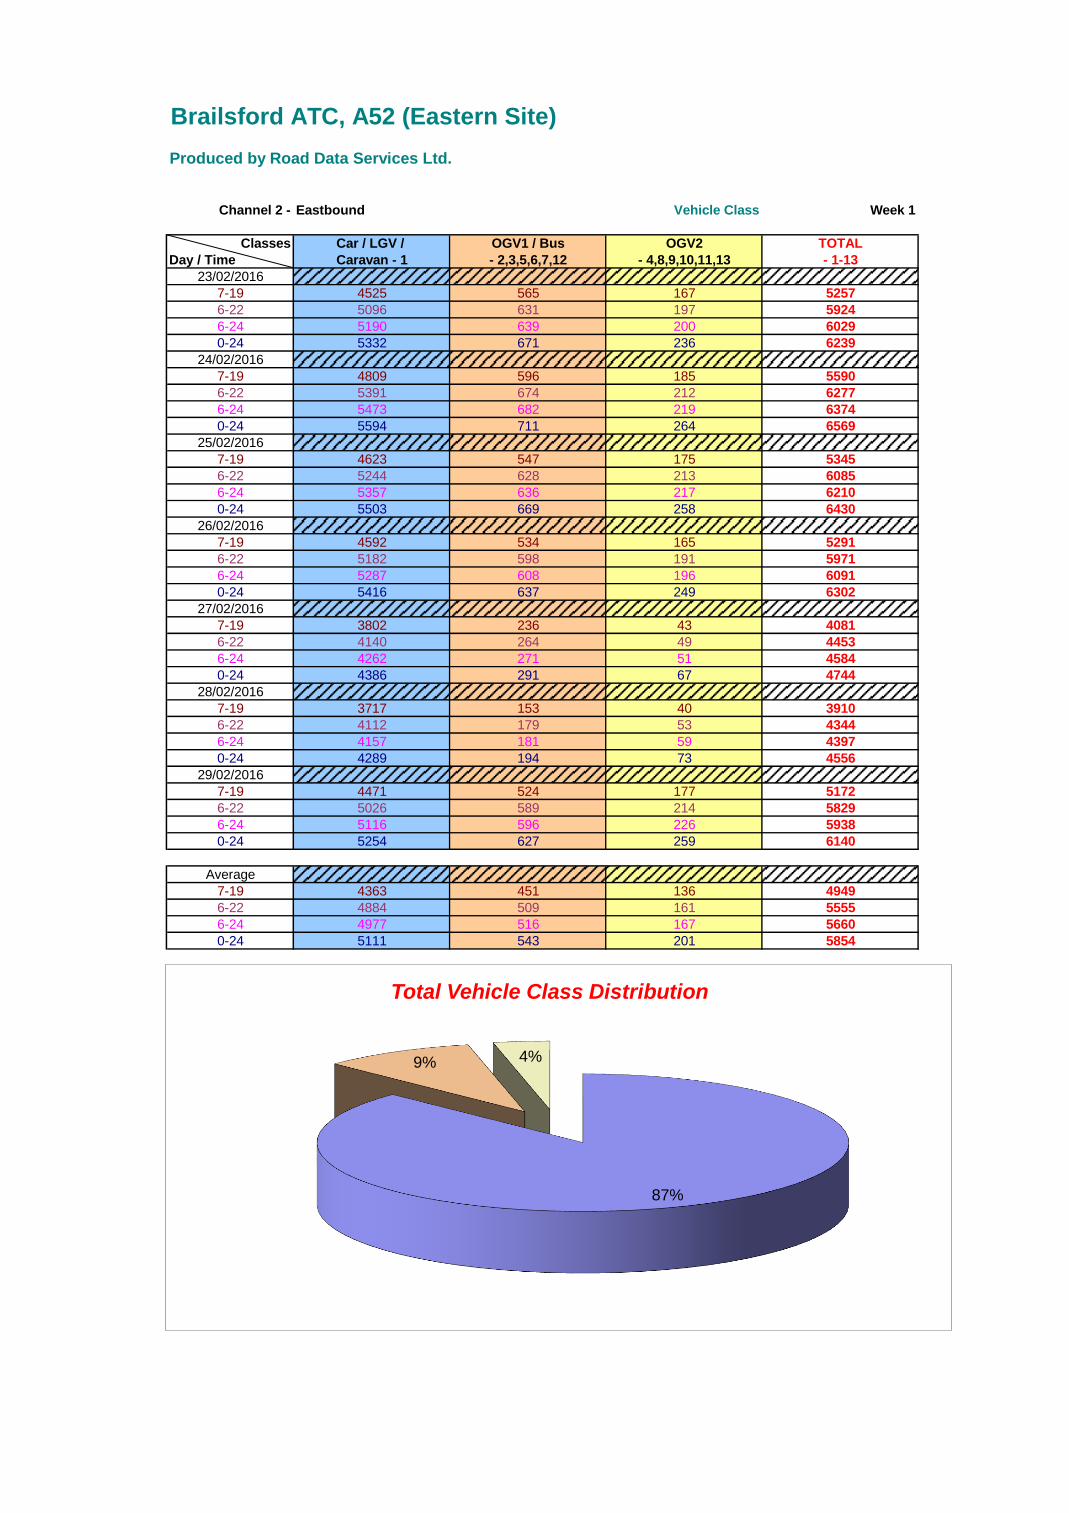
Brailsford ATC, A52 (Eastern Site)
Produced by Road Data Services Ltd.
Channel 2 - Eastbound Vehicle Class Week 1
Classes Car / LGV / OGV1 / Bus OGV2 TOTAL
Day / Time Caravan - 1 - 2,3,5,6,7,12 - 4,8,9,10,11,13 - 1-13
23/02/2016
7-19 4525 565 167 5257
6-22 5096 631 197 5924
6-24 5190 639 200 6029
0-24 5332 671 236 6239
24/02/2016
7-19 4809 596 185 5590
6-22 5391 674 212 6277
6-24 5473 682 219 6374
0-24 5594 711 264 6569
25/02/2016
7-19 4623 547 175 5345
6-22 5244 628 213 6085
6-24 5357 636 217 6210
0-24 5503 669 258 6430
26/02/2016
7-19 4592 534 165 5291
6-22 5182 598 191 5971
6-24 5287 608 196 6091
0-24 5416 637 249 6302
27/02/2016
7-19 3802 236 43 4081
6-22 4140 264 49 4453
6-24 4262 271 51 4584
0-24 4386 291 67 4744
28/02/2016
7-19 3717 153 40 3910
6-22 4112 179 53 4344
6-24 4157 181 59 4397
0-24 4289 194 73 4556
29/02/2016
7-19 4471 524 177 5172
6-22 5026 589 214 5829
6-24 5116 596 226 5938
0-24 5254 627 259 6140
Average
7-19 4363 451 136 4949
6-22 4884 509 161 5555
6-24 4977 516 167 5660
0-24 5111 543 201 5854
87%
9% 4%
Total Vehicle Class Distribution

Brailsford ATC, A52 (Middle Site)
Produced by Road Data Services Ltd.
Channel 1 - Westbound Vehicle Flow Week 1
23/02/2016 24/02/2016 25/02/2016 26/02/2016 27/02/2016 28/02/2016 29/02/2016
Hr Ending Tuesday Wednesday Thursday Friday Saturday Sunday Monday 5 Day Ave 7 Day Ave
1 14 19 17 27 30 28 17 19 22
2 12 13 10 11 28 18 18 13 16
3 9 7 19 14 13 25 6 11 13
4 14 10 14 14 27 18 6 12 15
5 30 38 38 29 29 20 35 34 31
6 123 118 115 129 77 69 133 124 109
7 160 158 158 147 56 31 141 153 122
8 304 319 322 310 139 97 291 309 255
9 302 304 315 279 206 138 304 301 264
10 313 311 300 301 300 257 303 306 298
11 303 359 339 306 352 355 341 330 336
12 305 345 377 366 411 389 293 337 355
13 324 351 306 345 393 368 346 334 348
14 308 362 324 392 380 413 331 343 359
15 333 349 373 394 379 311 311 352 350
16 381 356 410 487 317 270 348 396 367
17 475 466 488 515 335 274 464 482 431
18 567 545 490 526 245 206 468 519 435
19 313 381 409 364 204 172 376 369 317
20 238 243 248 254 172 139 216 240 216
21 149 157 159 144 93 126 155 153 140
22 138 135 150 104 70 83 122 130 115
23 81 193 72 71 73 54 61 96 86
24 48 50 61 56 53 26 34 50 47
7-19 4228 4448 4453 4585 3661 3250 4176 4378 4114
6-22 4913 5141 5168 5234 4052 3629 4810 5053 4707
6-24 5042 5384 5301 5361 4178 3709 4905 5199 4840
0-24 5244 5589 5514 5585 4382 3887 5120 5410 5046
7-19
6-22
6-24 0-24
0
1000
2000
3000
4000
5000
6000
23/02/2016 24/02/2016
25/02/2016 26/02/2016
27/02/2016 28/02/2016
29/02/2016
Nu
mb
er
of
Veh
icle
s
Date
Vehicle Flow (Channel 1)
7-19 6-22 6-24 0-24

Brailsford ATC, A52 (Middle Site)
Produced by Road Data Services Ltd.
Channel 1 - Westbound Average Speed Week 1
23/02/2016 24/02/2016 25/02/2016 26/02/2016 27/02/2016 28/02/2016 29/02/2016
Hr Ending Tuesday Wednesday Thursday Friday Saturday Sunday Monday
1 42.9 43.3 42.3 44.8 44.7 46.1 42.0 -
2 40.9 43.0 40.4 39.0 41.7 44.5 41.7 -
3 38.4 40.7 42.8 44.7 50.3 45.3 48.3 -
4 41.1 39.2 41.6 40.1 42.0 51.5 42.2 -
5 41.8 41.5 43.5 41.8 43.6 42.8 42.8 -
6 42.0 43.5 44.4 43.9 45.9 45.6 43.6 -
7 40.7 41.3 40.9 39.7 42.8 39.6 40.8 -
8 39.4 39.7 41.0 40.0 40.6 41.5 39.5 -
9 38.6 40.3 38.4 39.4 39.8 39.4 40.0 -
10 38.3 39.9 40.6 37.9 38.5 39.2 39.9 -
11 37.5 38.1 39.0 38.0 38.2 38.7 36.6 -
12 36.9 37.7 38.4 37.9 38.5 38.5 37.7 -
13 39.3 38.7 38.0 38.6 39.0 39.2 38.6 -
14 39.5 38.3 38.5 38.3 38.2 37.2 38.5 -
15 39.0 38.5 38.7 39.0 37.9 39.1 38.1 -
16 39.2 39.8 38.5 38.1 39.7 38.7 38.9 -
17 39.1 39.2 37.9 39.3 38.9 39.0 38.7 -
18 39.1 39.6 38.5 38.6 39.9 39.5 39.9 -
19 39.8 39.3 39.4 39.3 40.7 39.5 39.9 -
20 40.6 41.0 40.5 40.3 41.3 41.4 40.8 -
21 40.7 40.0 40.8 41.9 42.7 41.2 39.9 -
22 41.3 43.4 40.7 41.5 41.3 43.0 41.1 -
23 42.3 41.4 42.6 42.8 43.9 44.0 43.5 -
24 41.3 41.8 43.4 42.9 43.8 41.1 41.1 -
10-12 37.2 37.9 38.7 38.0 38.3 38.6 37.1 -
14-16 39.1 39.1 38.6 38.5 38.7 38.9 38.5 -
0-24 39.3 39.6 39.4 39.2 39.6 39.5 39.4 -
7 Day Ave 39.4
Channel 1 - Westbound 85th Percentile
23/02/2016 24/02/2016 25/02/2016 26/02/2016 27/02/2016 28/02/2016 29/02/2016
Hr Ending Tuesday Wednesday Thursday Friday Saturday Sunday Monday
1 52.1 52.3 47.6 51.4 52.0 53.9 47.0 -
2 47.8 52.6 45.7 43.5 48.0 50.5 48.5 -
3 46.8 48.2 49.0 52.2 58.2 52.0 54.0 -
4 48.1 45.3 46.1 47.0 49.1 56.0 48.5 -
5 49.0 48.9 53.9 51.8 48.8 52.0 51.0 -
6 48.0 49.0 52.9 51.0 52.0 53.0 51.0 -
7 46.0 48.0 46.0 47.0 49.3 47.0 48.0 -
8 44.0 45.0 47.0 45.0 46.0 46.0 44.5 -
9 44.0 45.0 44.0 44.0 46.0 46.0 44.0 -
10 43.0 45.0 46.0 43.0 43.0 44.0 45.0 -
11 42.0 43.0 45.0 43.0 43.0 43.0 43.0 -
12 41.0 43.0 43.0 43.0 43.0 43.0 43.0 -
13 44.0 44.0 43.0 43.0 43.0 44.0 44.0 -
14 44.0 43.0 43.0 44.0 43.0 42.0 43.0 -
15 43.0 43.0 43.0 44.0 43.0 45.0 43.0 -
16 44.0 45.0 44.0 43.0 44.0 44.0 44.0 -
17 44.0 45.0 43.0 44.0 45.0 44.0 44.0 -
18 44.0 45.0 43.0 44.0 45.0 44.0 45.0 -
19 44.2 44.0 45.0 44.0 46.6 46.0 46.0 -
20 46.0 47.0 46.0 46.0 47.0 47.3 46.8 -
21 46.8 45.0 46.3 47.6 49.0 47.3 45.9 -
22 46.0 49.0 46.0 47.0 48.0 51.0 46.0 -
23 47.0 47.0 48.0 51.0 50.0 53.1 52.0 -
24 49.0 51.0 50.0 49.0 48.2 48.0 47.0 -
10-12 42.0 43.0 45.0 43.0 43.0 43.0 43.0 -
14-16 43.1 44.0 44.0 44.0 43.0 44.0 43.0 -
0-24 44.0 45.0 45.0 45.0 45.0 45.0 45.0 -
7 Day Ave 45.0

Brailsford ATC, A52 (Middle Site)
Produced by Road Data Services Ltd.
Channel 1 - Westbound Speed Summary Week 1
23/02/2016 24/02/2016 25/02/2016 26/02/2016 27/02/2016 28/02/2016 29/02/2016
Speed (MPH) Tuesday Wednesday Thursday Friday Saturday Sunday Monday
0-25 24 30 47 26 17 30 46
26-40 3121 3165 3238 3387 2580 2282 2996
41-55 2056 2349 2190 2131 1725 1519 2042
56- 43 45 39 41 60 56 36
TOTAL 5244 5589 5514 5585 4382 3887 5120
0%
10%
20%
30%
40%
50%
60%
70%
80%
90%
100%
23/02/2016 24/02/2016 25/02/2016 26/02/2016 27/02/2016 28/02/2016 29/02/2016 Date
Speed Summary (MPH)
0-25 26-40 41-55 56-
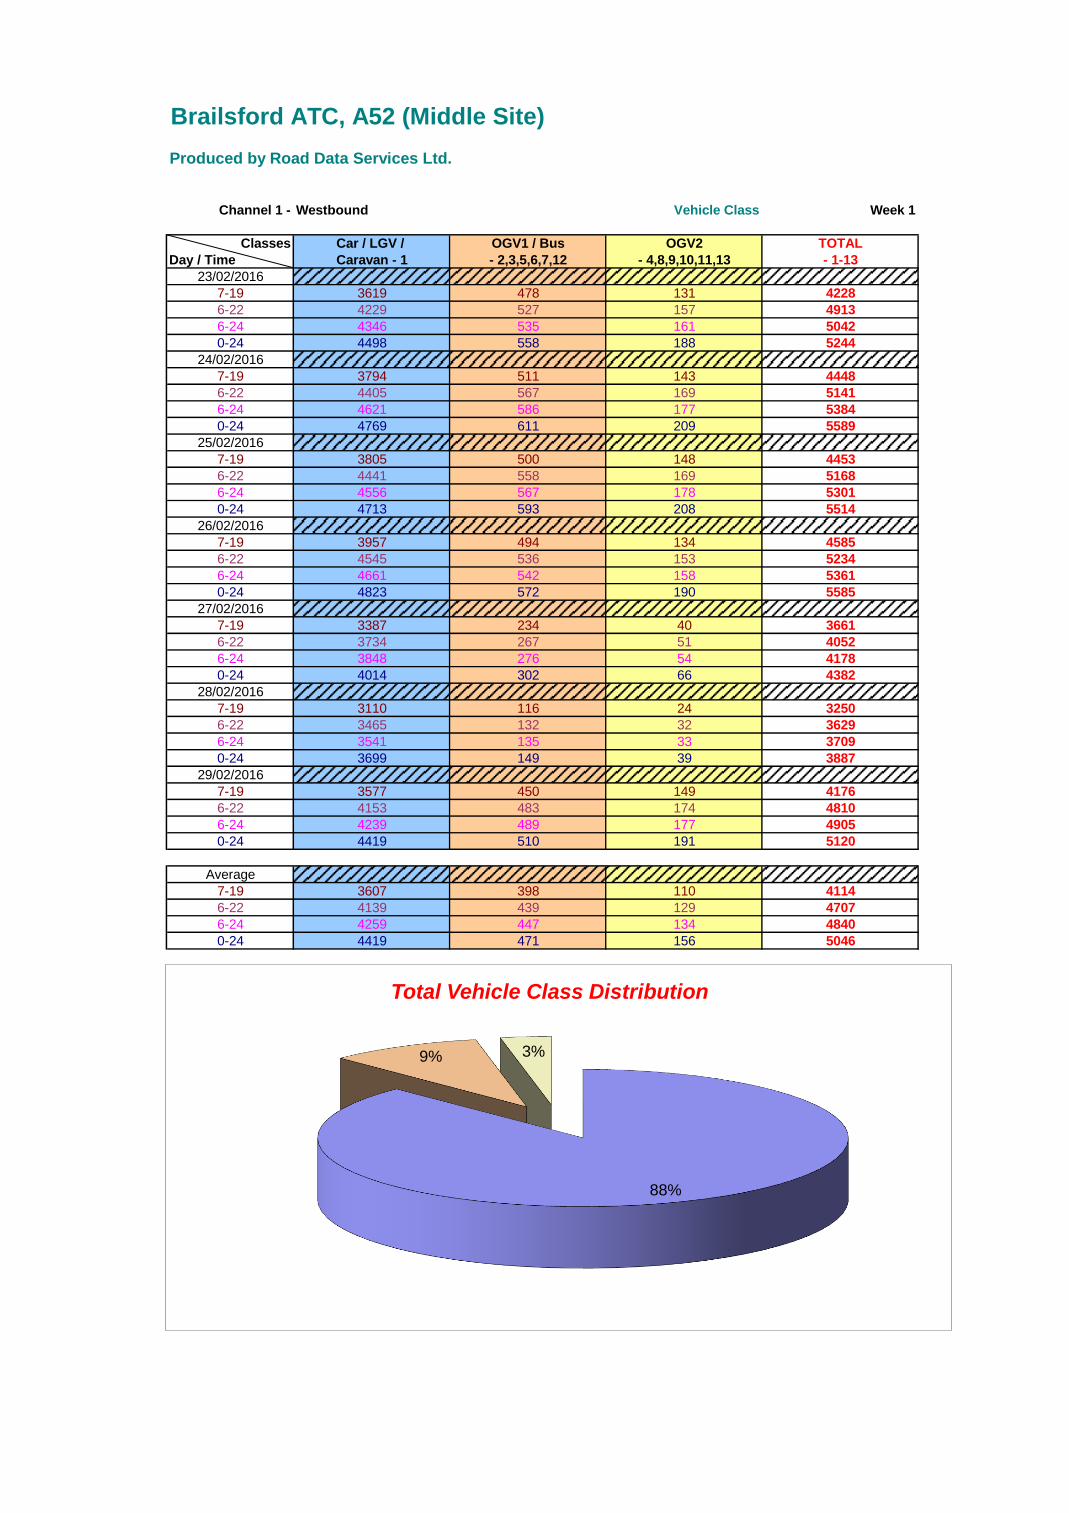
Brailsford ATC, A52 (Middle Site)
Produced by Road Data Services Ltd.
Channel 1 - Westbound Vehicle Class Week 1
Classes Car / LGV / OGV1 / Bus OGV2 TOTAL
Day / Time Caravan - 1 - 2,3,5,6,7,12 - 4,8,9,10,11,13 - 1-13
23/02/2016
7-19 3619 478 131 4228
6-22 4229 527 157 4913
6-24 4346 535 161 5042
0-24 4498 558 188 5244
24/02/2016
7-19 3794 511 143 4448
6-22 4405 567 169 5141
6-24 4621 586 177 5384
0-24 4769 611 209 5589
25/02/2016
7-19 3805 500 148 4453
6-22 4441 558 169 5168
6-24 4556 567 178 5301
0-24 4713 593 208 5514
26/02/2016
7-19 3957 494 134 4585
6-22 4545 536 153 5234
6-24 4661 542 158 5361
0-24 4823 572 190 5585
27/02/2016
7-19 3387 234 40 3661
6-22 3734 267 51 4052
6-24 3848 276 54 4178
0-24 4014 302 66 4382
28/02/2016
7-19 3110 116 24 3250
6-22 3465 132 32 3629
6-24 3541 135 33 3709
0-24 3699 149 39 3887
29/02/2016
7-19 3577 450 149 4176
6-22 4153 483 174 4810
6-24 4239 489 177 4905
0-24 4419 510 191 5120
Average
7-19 3607 398 110 4114
6-22 4139 439 129 4707
6-24 4259 447 134 4840
0-24 4419 471 156 5046
88%
9% 3%
Total Vehicle Class Distribution

Brailsford ATC, A52 (Middle Site)
Produced by Road Data Services Ltd.
Channel 2 - Eastbound Vehicle Flow Week 1
23/02/2016 24/02/2016 25/02/2016 26/02/2016 27/02/2016 28/02/2016 29/02/2016
Hr Ending Tuesday Wednesday Thursday Friday Saturday Sunday Monday 5 Day Ave 7 Day Ave
1 16 20 13 24 24 47 11 17 22
2 25 39 27 32 37 23 18 28 29
3 8 6 7 14 15 23 13 10 12
4 16 13 18 16 24 25 13 15 18
5 26 25 25 27 22 13 33 27 24
6 95 72 99 95 40 30 132 99 80
7 271 309 292 286 74 55 296 291 226
8 569 608 570 519 144 71 592 572 439
9 553 589 519 471 238 103 533 533 429
10 467 460 374 373 330 241 354 406 371
11 312 346 318 367 392 320 344 337 343
12 311 316 352 322 360 338 336 327 334
13 304 330 342 345 380 369 312 327 340
14 313 335 355 358 354 343 336 339 342
15 378 353 350 418 317 386 358 371 366
16 365 394 399 404 308 444 312 375 375
17 421 412 435 404 407 415 387 412 412
18 533 511 521 438 294 317 443 489 437
19 379 354 282 308 253 268 261 317 301
20 172 154 173 155 118 171 161 163 158
21 104 102 137 128 97 109 96 113 110
22 69 65 84 70 59 89 76 73 73
23 81 68 73 73 75 45 78 75 70
24 22 36 45 42 56 15 40 37 37
7-19 4905 5008 4817 4727 3777 3615 4568 4805 4488
6-22 5521 5638 5503 5366 4125 4039 5197 5445 5056
6-24 5624 5742 5621 5481 4256 4099 5315 5557 5163
0-24 5810 5917 5810 5689 4418 4260 5535 5752 5348
7-19
6-22
6-24 0-24
0
1000
2000
3000
4000
5000
6000
23/02/2016 24/02/2016
25/02/2016 26/02/2016
27/02/2016 28/02/2016
29/02/2016
Nu
mb
er
of
Veh
icle
s
Date
Vehicle Flow (Channel 2)
7-19 6-22 6-24 0-24

Brailsford ATC, A52 (Middle Site)
Produced by Road Data Services Ltd.
Channel 2 - Eastbound Average Speed Week 1
23/02/2016 24/02/2016 25/02/2016 26/02/2016 27/02/2016 28/02/2016 29/02/2016
Hr Ending Tuesday Wednesday Thursday Friday Saturday Sunday Monday
1 45.3 40.5 36.1 44.8 40.8 42.7 40.6 -
2 43.9 40.9 41.6 39.7 45.4 41.4 41.8 -
3 41.0 46.0 40.6 43.6 41.1 45.5 42.5 -
4 37.4 41.4 47.3 40.9 44.6 46.2 45.7 -
5 44.7 39.5 41.9 37.4 41.2 45.9 44.6 -
6 41.5 39.1 38.6 37.2 42.5 37.0 40.3 -
7 38.0 36.5 36.2 35.4 41.8 41.6 36.2 -
8 35.5 34.9 35.3 32.6 39.4 39.7 35.4 -
9 35.0 33.8 34.2 31.8 37.4 41.3 33.9 -
10 35.2 31.6 35.2 32.2 35.0 37.3 33.8 -
11 35.4 35.0 33.4 31.5 35.8 36.1 33.6 -
12 35.6 34.6 33.2 32.1 36.1 36.7 35.0 -
13 36.6 35.1 33.1 31.9 34.5 35.5 34.1 -
14 34.5 34.6 31.4 32.0 34.6 34.6 35.0 -
15 34.4 34.6 33.4 30.7 35.1 35.3 32.8 -
16 35.3 34.7 30.8 32.7 34.1 34.5 35.5 -
17 36.0 36.0 31.3 31.3 33.6 33.7 36.2 -
18 35.3 34.0 30.5 34.0 36.0 35.5 35.8 -
19 35.5 34.6 32.4 35.8 38.4 36.2 36.2 -
20 36.4 37.3 34.6 38.8 39.6 36.8 38.2 -
21 38.5 38.9 36.8 38.5 39.8 38.5 39.5 -
22 38.3 37.1 36.3 41.0 38.4 39.4 40.2 -
23 41.5 38.3 39.2 42.8 40.0 41.5 38.5 -
24 41.0 43.7 40.0 40.9 40.2 39.6 38.8 -
10-12 35.5 34.8 33.3 31.8 35.9 36.4 34.3 -
14-16 34.8 34.7 32.0 31.7 34.6 34.8 34.1 -
0-24 35.9 35.0 33.6 33.4 36.3 36.3 35.4 -
7 Day Ave 35.0
Channel 2 - Eastbound 85th Percentile
23/02/2016 24/02/2016 25/02/2016 26/02/2016 27/02/2016 28/02/2016 29/02/2016
Hr Ending Tuesday Wednesday Thursday Friday Saturday Sunday Monday
1 51.3 50.2 41.4 52.6 50.8 52.3 45.5 -
2 53.0 52.3 49.4 46.4 55.6 49.0 54.0 -
3 45.0 50.5 48.5 52.3 51.9 55.5 47.6 -
4 48.5 48.0 57.6 46.0 50.6 55.0 50.6 -
5 54.5 48.0 51.0 44.0 45.9 57.6 52.6 -
6 51.0 47.4 48.0 46.9 51.2 40.7 47.0 -
7 45.0 44.8 43.0 42.0 49.0 48.0 44.0 -
8 41.0 40.0 40.0 39.0 47.6 48.0 41.0 -
9 41.0 40.0 40.0 37.0 43.0 49.0 40.0 -
10 42.0 39.0 40.0 38.0 43.0 44.0 40.0 -
11 43.0 40.0 40.0 37.0 42.0 43.0 40.0 -
12 42.0 40.0 39.0 37.0 43.0 42.0 40.0 -
13 42.0 40.0 39.0 36.4 40.0 41.0 40.0 -
14 41.0 41.0 37.0 38.0 40.0 40.7 40.0 -
15 40.0 40.0 39.0 35.0 40.0 42.0 39.0 -
16 40.4 40.0 36.0 38.0 40.0 40.0 41.4 -
17 43.0 42.0 37.9 39.0 40.0 40.0 43.0 -
18 42.0 40.0 35.0 40.0 43.0 42.0 41.0 -
19 44.0 41.0 39.0 43.0 45.0 42.0 43.0 -
20 44.0 44.0 40.2 47.0 46.5 43.0 46.0 -
21 46.0 47.0 44.0 47.0 46.6 46.0 48.0 -
22 47.0 45.0 43.0 49.0 47.0 48.0 48.0 -
23 48.0 46.0 46.0 53.2 46.0 51.4 46.0 -
24 49.9 51.0 47.4 49.9 46.0 44.9 44.2 -
10-12 43.0 40.0 40.0 37.0 42.0 43.0 40.0 -
14-16 40.0 40.0 39.0 37.0 40.0 40.0 40.0 -
0-24 43.0 41.0 40.0 40.0 43.0 43.0 42.0 -
7 Day Ave 42.0
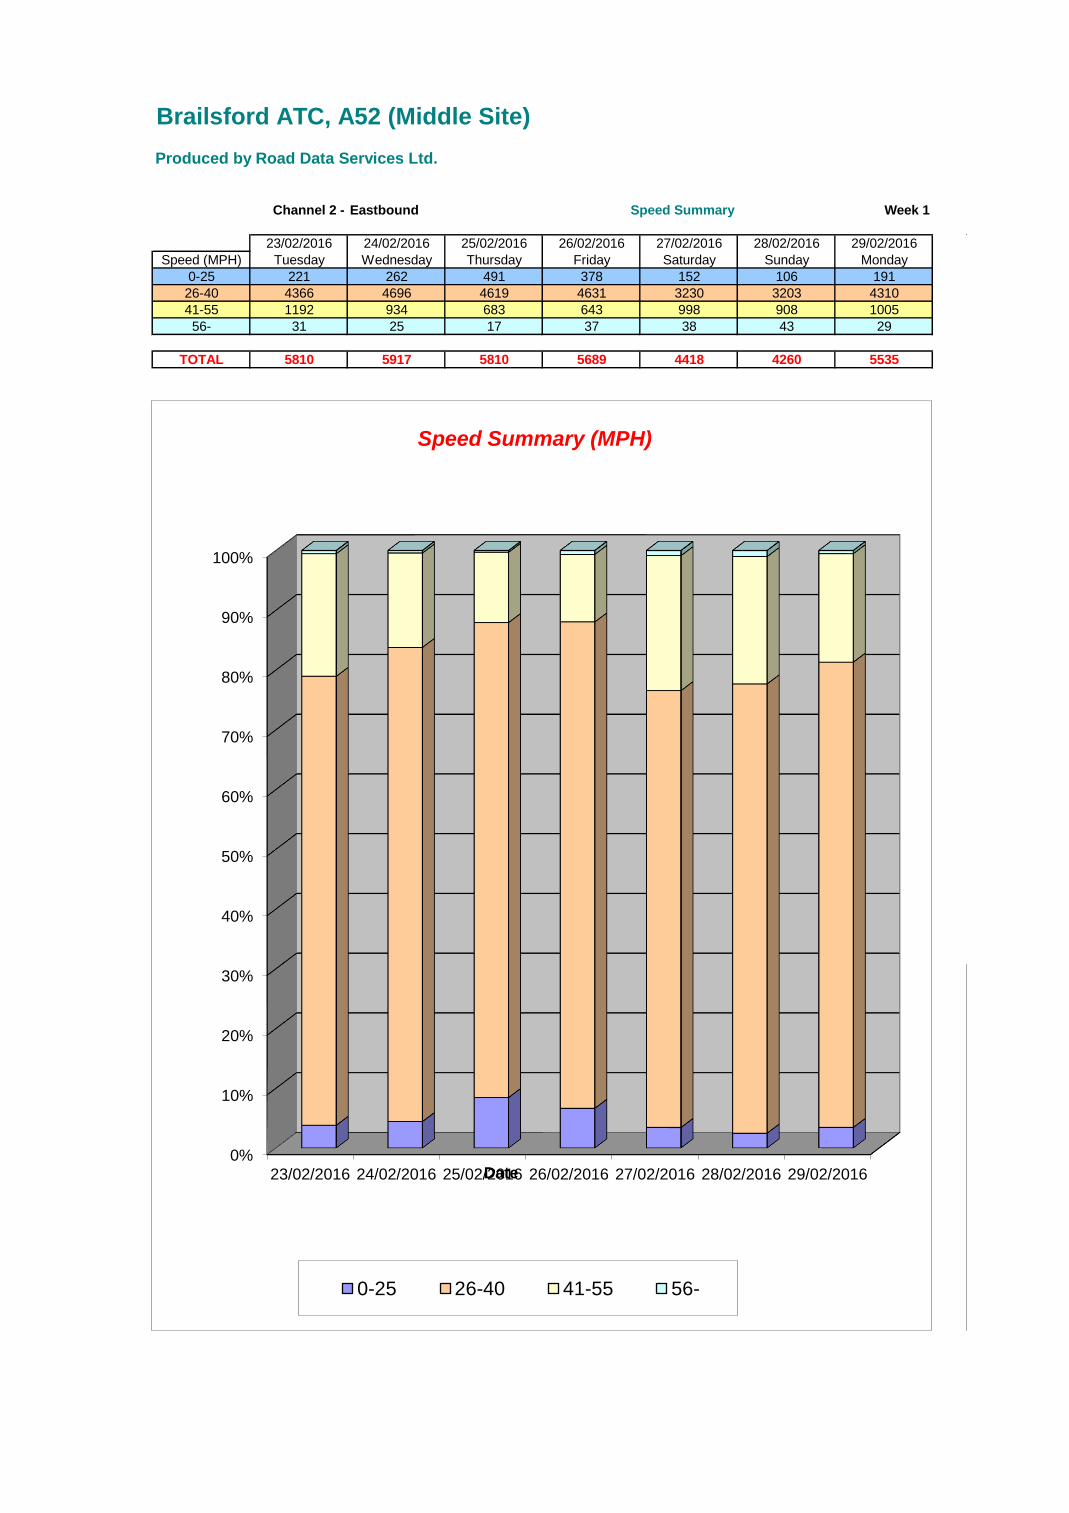
Brailsford ATC, A52 (Middle Site)
Produced by Road Data Services Ltd.
Channel 2 - Eastbound Speed Summary Week 1
23/02/2016 24/02/2016 25/02/2016 26/02/2016 27/02/2016 28/02/2016 29/02/2016
Speed (MPH) Tuesday Wednesday Thursday Friday Saturday Sunday Monday
0-25 221 262 491 378 152 106 191
26-40 4366 4696 4619 4631 3230 3203 4310
41-55 1192 934 683 643 998 908 1005
56- 31 25 17 37 38 43 29
TOTAL 5810 5917 5810 5689 4418 4260 5535
0%
10%
20%
30%
40%
50%
60%
70%
80%
90%
100%
23/02/2016 24/02/2016 25/02/2016 26/02/2016 27/02/2016 28/02/2016 29/02/2016 Date
Speed Summary (MPH)
0-25 26-40 41-55 56-

Brailsford ATC, A52 (Middle Site)
Produced by Road Data Services Ltd.
Channel 2 - Eastbound Vehicle Class Week 1
Classes Car / LGV / OGV1 / Bus OGV2 TOTAL
Day / Time Caravan - 1 - 2,3,5,6,7,12 - 4,8,9,10,11,13 - 1-13
23/02/2016
7-19 4183 558 164 4905
6-22 4699 631 191 5521
6-24 4791 639 194 5624
0-24 4919 666 225 5810
24/02/2016
7-19 4274 560 174 5008
6-22 4791 646 201 5638
6-24 4878 655 209 5742
0-24 4982 683 252 5917
25/02/2016
7-19 4127 535 155 4817
6-22 4700 613 190 5503
6-24 4806 619 196 5621
0-24 4923 651 236 5810
26/02/2016
7-19 4055 528 144 4727
6-22 4608 597 161 5366
6-24 4709 605 167 5481
0-24 4844 636 209 5689
27/02/2016
7-19 3450 276 51 3777
6-22 3768 301 56 4125
6-24 3891 308 57 4256
0-24 4027 327 64 4418
28/02/2016
7-19 3401 171 43 3615
6-22 3796 196 47 4039
6-24 3851 198 50 4099
0-24 3990 209 61 4260
29/02/2016
7-19 3906 498 164 4568
6-22 4444 565 188 5197
6-24 4543 573 199 5315
0-24 4730 598 207 5535
Average
7-19 3914 447 128 4488
6-22 4401 507 148 5056
6-24 4496 514 153 5163
0-24 4631 539 179 5348
87%
10% 3%
Total Vehicle Class Distribution
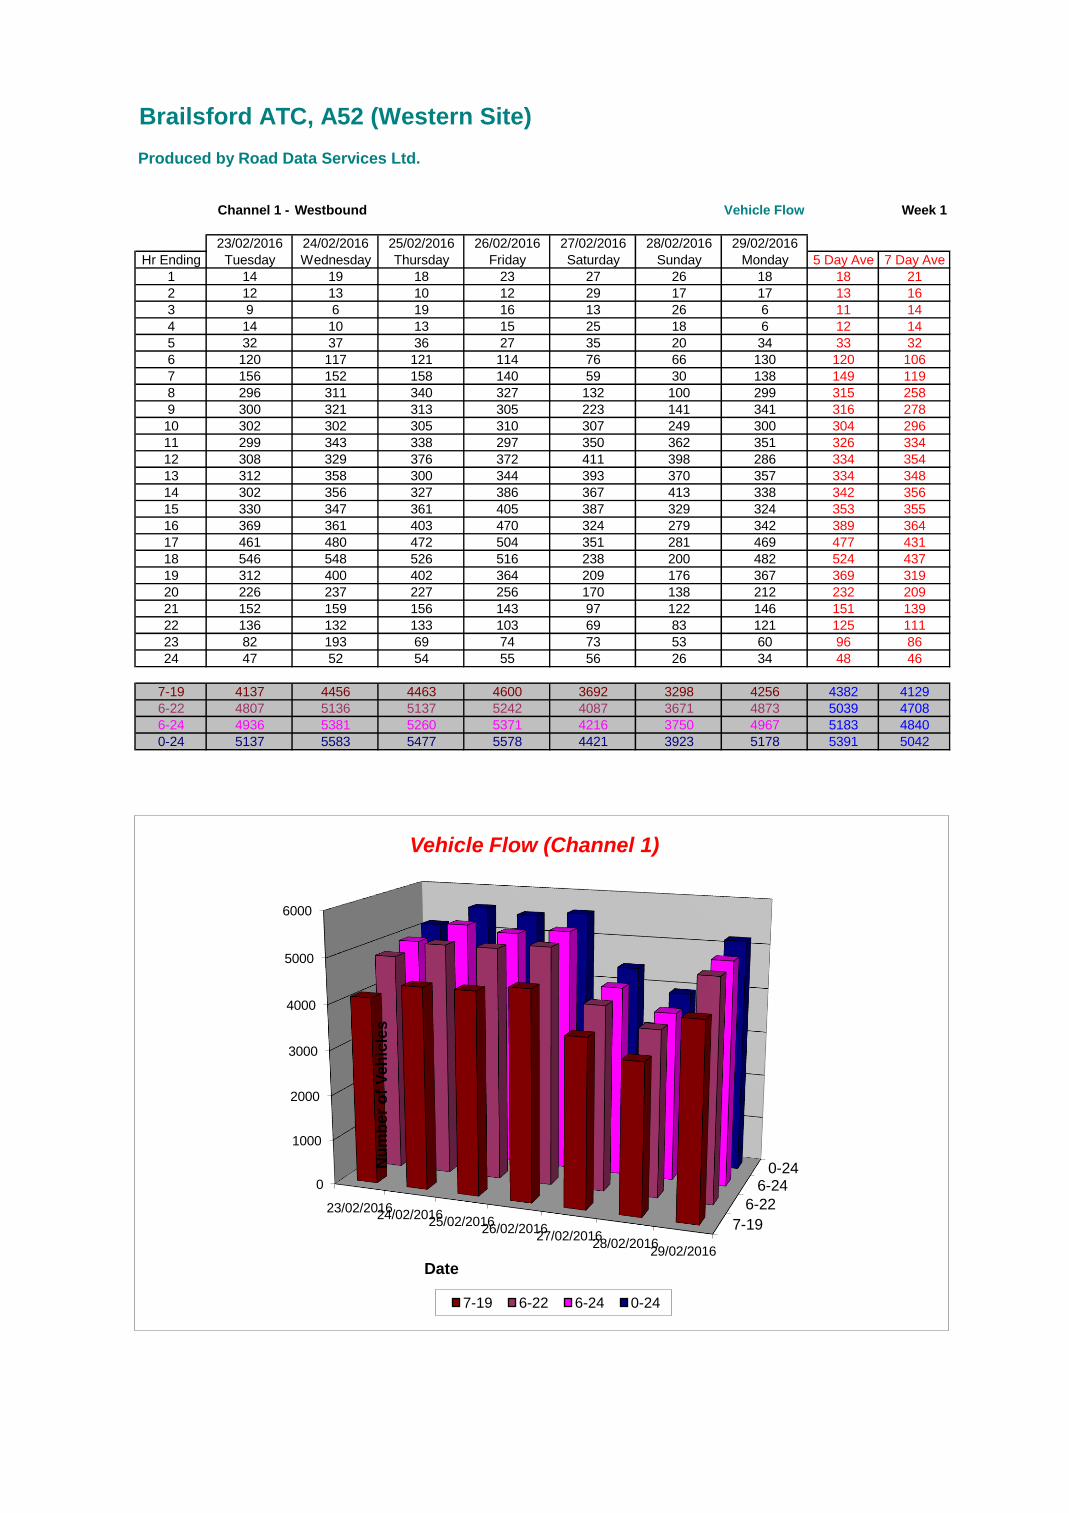
Brailsford ATC, A52 (Western Site)
Produced by Road Data Services Ltd.
Channel 1 - Westbound Vehicle Flow Week 1
23/02/2016 24/02/2016 25/02/2016 26/02/2016 27/02/2016 28/02/2016 29/02/2016
Hr Ending Tuesday Wednesday Thursday Friday Saturday Sunday Monday 5 Day Ave 7 Day Ave
1 14 19 18 23 27 26 18 18 21
2 12 13 10 12 29 17 17 13 16
3 9 6 19 16 13 26 6 11 14
4 14 10 13 15 25 18 6 12 14
5 32 37 36 27 35 20 34 33 32
6 120 117 121 114 76 66 130 120 106
7 156 152 158 140 59 30 138 149 119
8 296 311 340 327 132 100 299 315 258
9 300 321 313 305 223 141 341 316 278
10 302 302 305 310 307 249 300 304 296
11 299 343 338 297 350 362 351 326 334
12 308 329 376 372 411 398 286 334 354
13 312 358 300 344 393 370 357 334 348
14 302 356 327 386 367 413 338 342 356
15 330 347 361 405 387 329 324 353 355
16 369 361 403 470 324 279 342 389 364
17 461 480 472 504 351 281 469 477 431
18 546 548 526 516 238 200 482 524 437
19 312 400 402 364 209 176 367 369 319
20 226 237 227 256 170 138 212 232 209
21 152 159 156 143 97 122 146 151 139
22 136 132 133 103 69 83 121 125 111
23 82 193 69 74 73 53 60 96 86
24 47 52 54 55 56 26 34 48 46
7-19 4137 4456 4463 4600 3692 3298 4256 4382 4129
6-22 4807 5136 5137 5242 4087 3671 4873 5039 4708
6-24 4936 5381 5260 5371 4216 3750 4967 5183 4840
0-24 5137 5583 5477 5578 4421 3923 5178 5391 5042
7-19
6-22
6-24 0-24
0
1000
2000
3000
4000
5000
6000
23/02/2016 24/02/2016
25/02/2016 26/02/2016
27/02/2016 28/02/2016
29/02/2016
Nu
mb
er
of
Veh
icle
s
Date
Vehicle Flow (Channel 1)
7-19 6-22 6-24 0-24
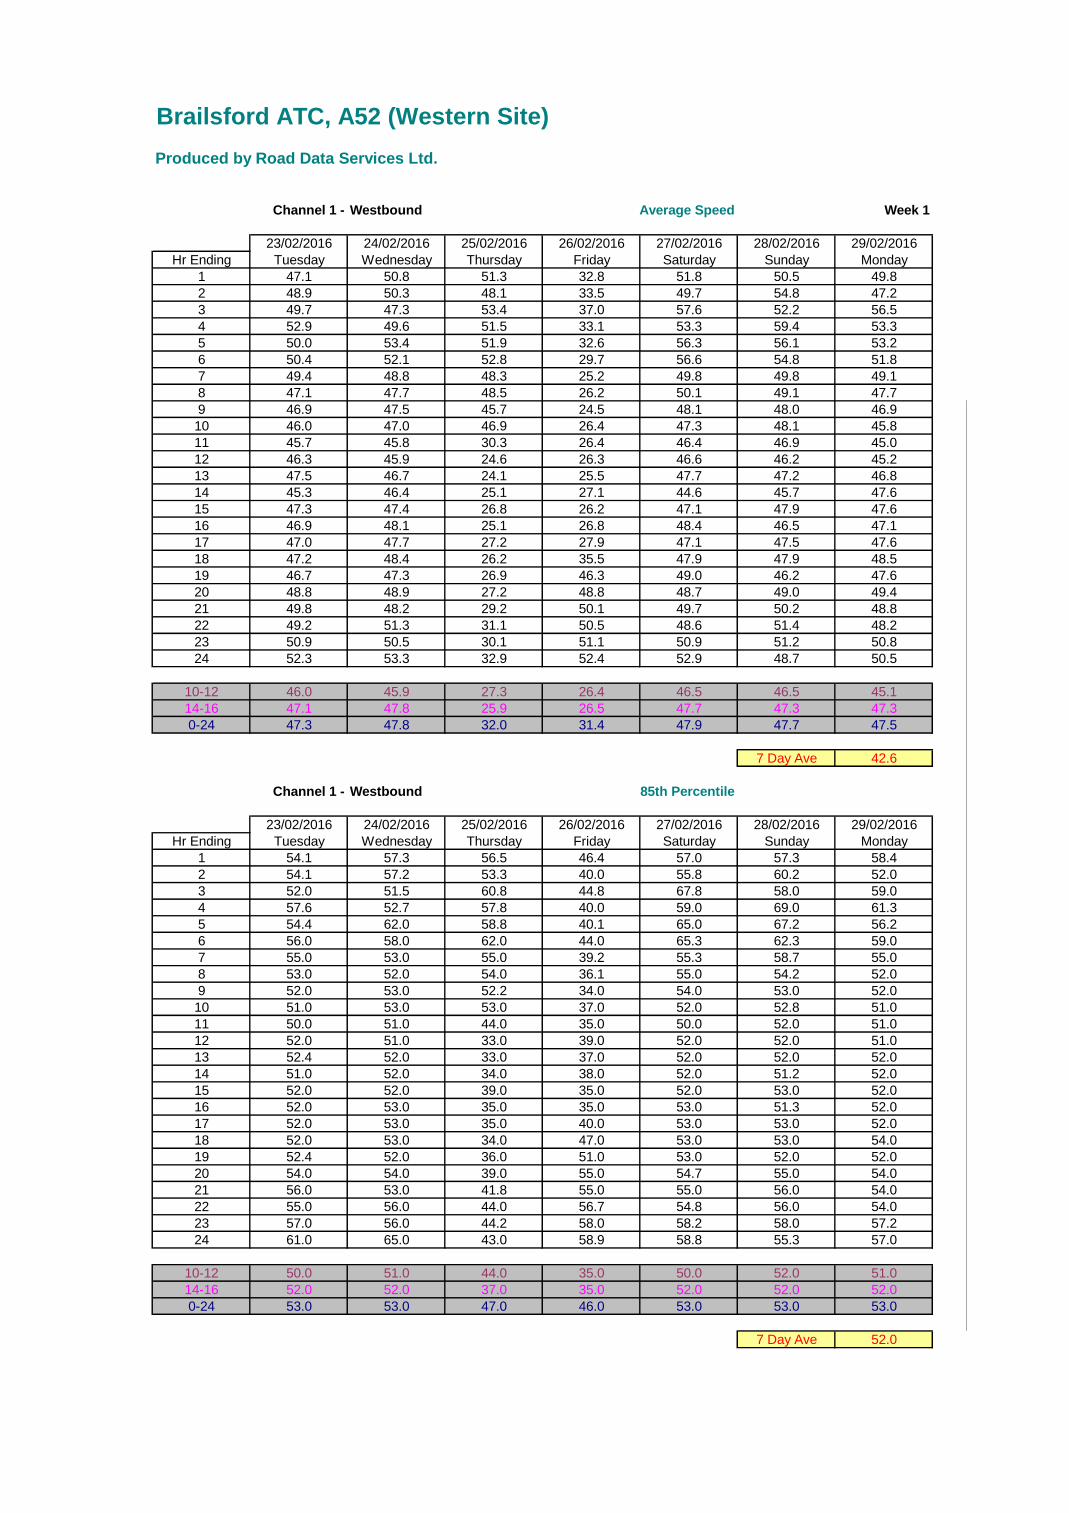
Brailsford ATC, A52 (Western Site)
Produced by Road Data Services Ltd.
Channel 1 - Westbound Average Speed Week 1
23/02/2016 24/02/2016 25/02/2016 26/02/2016 27/02/2016 28/02/2016 29/02/2016
Hr Ending Tuesday Wednesday Thursday Friday Saturday Sunday Monday
1 47.1 50.8 51.3 32.8 51.8 50.5 49.8 -
2 48.9 50.3 48.1 33.5 49.7 54.8 47.2 -
3 49.7 47.3 53.4 37.0 57.6 52.2 56.5 -
4 52.9 49.6 51.5 33.1 53.3 59.4 53.3 -
5 50.0 53.4 51.9 32.6 56.3 56.1 53.2 -
6 50.4 52.1 52.8 29.7 56.6 54.8 51.8 -
7 49.4 48.8 48.3 25.2 49.8 49.8 49.1 -
8 47.1 47.7 48.5 26.2 50.1 49.1 47.7 -
9 46.9 47.5 45.7 24.5 48.1 48.0 46.9 -
10 46.0 47.0 46.9 26.4 47.3 48.1 45.8 -
11 45.7 45.8 30.3 26.4 46.4 46.9 45.0 -
12 46.3 45.9 24.6 26.3 46.6 46.2 45.2 -
13 47.5 46.7 24.1 25.5 47.7 47.2 46.8 -
14 45.3 46.4 25.1 27.1 44.6 45.7 47.6 -
15 47.3 47.4 26.8 26.2 47.1 47.9 47.6 -
16 46.9 48.1 25.1 26.8 48.4 46.5 47.1 -
17 47.0 47.7 27.2 27.9 47.1 47.5 47.6 -
18 47.2 48.4 26.2 35.5 47.9 47.9 48.5 -
19 46.7 47.3 26.9 46.3 49.0 46.2 47.6 -
20 48.8 48.9 27.2 48.8 48.7 49.0 49.4 -
21 49.8 48.2 29.2 50.1 49.7 50.2 48.8 -
22 49.2 51.3 31.1 50.5 48.6 51.4 48.2 -
23 50.9 50.5 30.1 51.1 50.9 51.2 50.8 -
24 52.3 53.3 32.9 52.4 52.9 48.7 50.5 -
10-12 46.0 45.9 27.3 26.4 46.5 46.5 45.1 -
14-16 47.1 47.8 25.9 26.5 47.7 47.3 47.3 -
0-24 47.3 47.8 32.0 31.4 47.9 47.7 47.5 -
7 Day Ave 42.6
Channel 1 - Westbound 85th Percentile
23/02/2016 24/02/2016 25/02/2016 26/02/2016 27/02/2016 28/02/2016 29/02/2016
Hr Ending Tuesday Wednesday Thursday Friday Saturday Sunday Monday
1 54.1 57.3 56.5 46.4 57.0 57.3 58.4 -
2 54.1 57.2 53.3 40.0 55.8 60.2 52.0 -
3 52.0 51.5 60.8 44.8 67.8 58.0 59.0 -
4 57.6 52.7 57.8 40.0 59.0 69.0 61.3 -
5 54.4 62.0 58.8 40.1 65.0 67.2 56.2 -
6 56.0 58.0 62.0 44.0 65.3 62.3 59.0 -
7 55.0 53.0 55.0 39.2 55.3 58.7 55.0 -
8 53.0 52.0 54.0 36.1 55.0 54.2 52.0 -
9 52.0 53.0 52.2 34.0 54.0 53.0 52.0 -
10 51.0 53.0 53.0 37.0 52.0 52.8 51.0 -
11 50.0 51.0 44.0 35.0 50.0 52.0 51.0 -
12 52.0 51.0 33.0 39.0 52.0 52.0 51.0 -
13 52.4 52.0 33.0 37.0 52.0 52.0 52.0 -
14 51.0 52.0 34.0 38.0 52.0 51.2 52.0 -
15 52.0 52.0 39.0 35.0 52.0 53.0 52.0 -
16 52.0 53.0 35.0 35.0 53.0 51.3 52.0 -
17 52.0 53.0 35.0 40.0 53.0 53.0 52.0 -
18 52.0 53.0 34.0 47.0 53.0 53.0 54.0 -
19 52.4 52.0 36.0 51.0 53.0 52.0 52.0 -
20 54.0 54.0 39.0 55.0 54.7 55.0 54.0 -
21 56.0 53.0 41.8 55.0 55.0 56.0 54.0 -
22 55.0 56.0 44.0 56.7 54.8 56.0 54.0 -
23 57.0 56.0 44.2 58.0 58.2 58.0 57.2 -
24 61.0 65.0 43.0 58.9 58.8 55.3 57.0 -
10-12 50.0 51.0 44.0 35.0 50.0 52.0 51.0 -
14-16 52.0 52.0 37.0 35.0 52.0 52.0 52.0 -
0-24 53.0 53.0 47.0 46.0 53.0 53.0 53.0 -
7 Day Ave 52.0

Brailsford ATC, A52 (Western Site)
Produced by Road Data Services Ltd.
Channel 1 - Westbound Speed Summary Week 1
23/02/2016 24/02/2016 25/02/2016 26/02/2016 27/02/2016 28/02/2016 29/02/2016
Speed (MPH) Tuesday Wednesday Thursday Friday Saturday Sunday Monday
0-25 13 22 2110 2286 26 15 31
26-40 375 333 1807 1798 291 304 331
41-55 4445 4780 1410 1366 3712 3258 4449
56- 304 448 150 128 392 346 367
TOTAL 5137 5583 5477 5578 4421 3923 5178
0%
10%
20%
30%
40%
50%
60%
70%
80%
90%
100%
23/02/2016 24/02/2016 25/02/2016 26/02/2016 27/02/2016 28/02/2016 29/02/2016 Date
Speed Summary (MPH)
0-25 26-40 41-55 56-

Brailsford ATC, A52 (Western Site)
Produced by Road Data Services Ltd.
Channel 1 - Westbound Vehicle Class Week 1
Classes Car / LGV / OGV1 / Bus OGV2 TOTAL
Day / Time Caravan - 1 - 2,3,5,6,7,12 - 4,8,9,10,11,13 - 1-13
23/02/2016
7-19 3516 496 125 4137
6-22 4114 547 146 4807
6-24 4231 555 150 4936
0-24 4382 582 173 5137
24/02/2016
7-19 3774 552 130 4456
6-22 4375 610 151 5136
6-24 4593 630 158 5381
0-24 4738 656 189 5583
25/02/2016
7-19 3881 467 115 4463
6-22 4495 513 129 5137
6-24 4602 519 139 5260
0-24 4766 543 168 5477
26/02/2016
7-19 4083 418 99 4600
6-22 4677 452 113 5242
6-24 4797 458 116 5371
0-24 4959 477 142 5578
27/02/2016
7-19 3389 262 41 3692
6-22 3740 297 50 4087
6-24 3858 306 52 4216
0-24 4023 334 64 4421
28/02/2016
7-19 3124 148 26 3298
6-22 3468 167 36 3671
6-24 3545 168 37 3750
0-24 3698 182 43 3923
29/02/2016
7-19 3596 517 143 4256
6-22 4155 553 165 4873
6-24 4239 559 169 4967
0-24 4418 581 179 5178
Average
7-19 3623 409 97 4129
6-22 4146 448 113 4708
6-24 4266 456 117 4840
0-24 4426 479 137 5042
88%
9% 3%
Total Vehicle Class Distribution

Brailsford ATC, A52 (Western Site)
Produced by Road Data Services Ltd.
Channel 2 - Eastbound Vehicle Flow Week 1
23/02/2016 24/02/2016 25/02/2016 26/02/2016 27/02/2016 28/02/2016 29/02/2016
Hr Ending Tuesday Wednesday Thursday Friday Saturday Sunday Monday 5 Day Ave 7 Day Ave
1 11 25 16 26 26 45 12 18 23
2 29 40 30 31 36 24 20 30 30
3 8 6 9 16 15 26 10 10 13
4 16 15 18 18 26 26 14 16 19
5 32 34 34 31 16 13 38 34 28
6 102 107 127 84 43 28 129 110 89
7 295 351 329 278 76 55 287 308 239
8 567 608 582 509 149 70 589 571 439
9 551 588 521 471 241 112 548 536 433
10 466 472 400 373 341 246 355 413 379
11 314 350 306 345 399 320 344 332 340
12 310 353 346 323 369 353 341 335 342
13 300 335 312 313 393 365 313 315 333
14 324 337 349 344 356 348 337 338 342
15 396 370 325 390 332 382 356 367 364
16 360 398 393 389 310 448 319 372 374
17 413 426 433 391 417 417 389 410 412
18 524 522 512 410 310 325 441 482 435
19 377 350 282 322 254 262 270 320 302
20 178 158 166 159 120 173 164 165 160
21 111 101 135 128 97 116 105 116 113
22 69 67 92 72 60 83 78 76 74
23 82 74 72 74 74 45 81 77 72
24 23 39 46 48 58 15 43 40 39
7-19 4902 5109 4761 4580 3871 3648 4602 4791 4496
6-22 5555 5786 5483 5217 4224 4075 5236 5455 5082
6-24 5660 5899 5601 5339 4356 4135 5360 5572 5193
0-24 5858 6126 5835 5545 4518 4297 5583 5789 5395
7-19
6-22
6-24 0-24
0
1000
2000
3000
4000
5000
6000
7000
23/02/2016 24/02/2016
25/02/2016 26/02/2016
27/02/2016 28/02/2016
29/02/2016
Nu
mb
er
of
Veh
icle
s
Date
Vehicle Flow (Channel 2)
7-19 6-22 6-24 0-24

Brailsford ATC, A52 (Western Site)
Produced by Road Data Services Ltd.
Channel 2 - Eastbound Average Speed Week 1
23/02/2016 24/02/2016 25/02/2016 26/02/2016 27/02/2016 28/02/2016 29/02/2016
Hr Ending Tuesday Wednesday Thursday Friday Saturday Sunday Monday
1 51.5 50.2 47.1 39.9 51.5 50.5 51.7 -
2 55.7 51.5 53.8 41.4 57.3 53.2 55.1 -
3 52.8 52.3 56.4 44.8 48.5 54.7 53.2 -
4 50.6 51.9 53.3 37.6 52.9 55.7 53.9 -
5 54.2 51.8 54.4 37.3 49.6 50.7 53.3 -
6 52.2 51.9 49.5 35.5 52.7 48.8 51.6 -
7 48.5 47.5 48.7 36.0 53.8 52.3 48.7 -
8 47.3 47.1 47.5 33.3 50.8 51.0 46.9 -
9 45.8 47.1 46.7 32.5 49.1 50.5 46.8 -
10 46.1 44.2 46.5 32.4 47.2 48.7 46.4 -
11 46.1 47.7 34.6 32.3 47.4 47.4 44.1 -
12 46.5 46.2 31.0 32.8 47.5 47.8 46.3 -
13 47.2 46.8 33.6 32.9 46.7 47.5 47.3 -
14 46.8 46.0 29.8 33.5 46.0 45.8 46.2 -
15 44.9 46.4 32.1 32.6 47.2 46.6 45.1 -
16 44.8 46.5 30.6 33.7 47.0 45.1 46.9 -
17 45.9 46.9 33.4 32.1 46.2 45.4 46.9 -
18 46.8 46.0 33.5 37.7 47.6 46.8 47.6 -
19 47.8 47.7 32.5 47.6 49.6 48.1 48.2 -
20 47.9 49.5 33.2 50.5 51.5 48.5 49.6 -
21 50.5 50.5 36.4 49.7 50.7 51.6 51.7 -
22 48.5 49.1 38.0 52.8 50.1 51.0 51.7 -
23 52.3 50.3 37.8 53.3 50.2 51.0 50.5 -
24 53.6 53.5 37.3 51.0 52.2 51.2 49.3 -
10-12 46.3 46.9 32.7 32.5 47.4 47.6 45.2 -
14-16 44.9 46.5 31.3 33.1 47.1 45.8 46.0 -
0-24 46.9 47.0 38.1 36.0 48.0 47.5 47.3 -
7 Day Ave 44.2
Channel 2 - Eastbound 85th Percentile
23/02/2016 24/02/2016 25/02/2016 26/02/2016 27/02/2016 28/02/2016 29/02/2016
Hr Ending Tuesday Wednesday Thursday Friday Saturday Sunday Monday
1 57.0 56.2 52.0 46.8 56.5 58.4 61.0 -
2 65.0 57.9 62.7 49.5 66.0 67.0 64.2 -
3 57.9 61.5 67.8 52.5 56.9 64.0 61.9 -
4 59.8 57.8 60.1 46.4 58.3 61.3 59.6 -
5 63.8 57.1 62.1 44.5 58.3 61.2 61.5 -
6 57.0 59.1 56.0 45.0 60.7 55.0 59.8 -
7 54.0 54.0 54.0 45.0 62.0 60.9 55.0 -
8 50.0 51.0 52.0 39.0 57.0 57.0 51.0 -
9 50.0 51.0 52.0 39.0 55.0 59.0 52.0 -
10 50.0 51.0 51.0 38.0 53.0 55.0 50.0 -
11 51.0 52.0 44.0 39.0 53.3 53.0 50.0 -
12 51.0 50.2 38.0 40.0 53.0 53.0 50.0 -
13 52.0 50.0 39.0 39.0 52.0 53.0 51.0 -
14 51.0 50.0 36.0 39.6 50.8 52.0 51.0 -
15 50.0 50.0 39.0 39.0 52.0 50.0 50.0 -
16 50.0 51.0 35.0 39.0 51.7 50.0 51.0 -
17 51.0 52.0 39.0 39.0 50.0 50.0 52.0 -
18 52.0 50.0 39.0 45.0 52.0 53.0 53.0 -
19 54.0 53.0 37.0 54.0 55.0 54.0 54.0 -
20 56.0 54.0 40.0 57.3 59.0 55.0 55.6 -
21 56.0 56.0 43.0 57.0 58.0 59.5 62.0 -
22 55.8 56.0 45.0 60.1 60.2 60.0 61.0 -
23 58.0 58.0 43.4 66.0 57.0 59.4 58.0 -
24 63.8 58.3 45.0 59.0 59.5 57.9 54.7 -
10-12 51.0 52.0 44.0 39.0 53.3 53.0 50.0 -
14-16 50.0 50.0 37.0 39.0 52.0 50.0 50.0 -
0-24 52.0 52.0 49.0 45.0 54.0 53.0 53.0 -
7 Day Ave 52.0
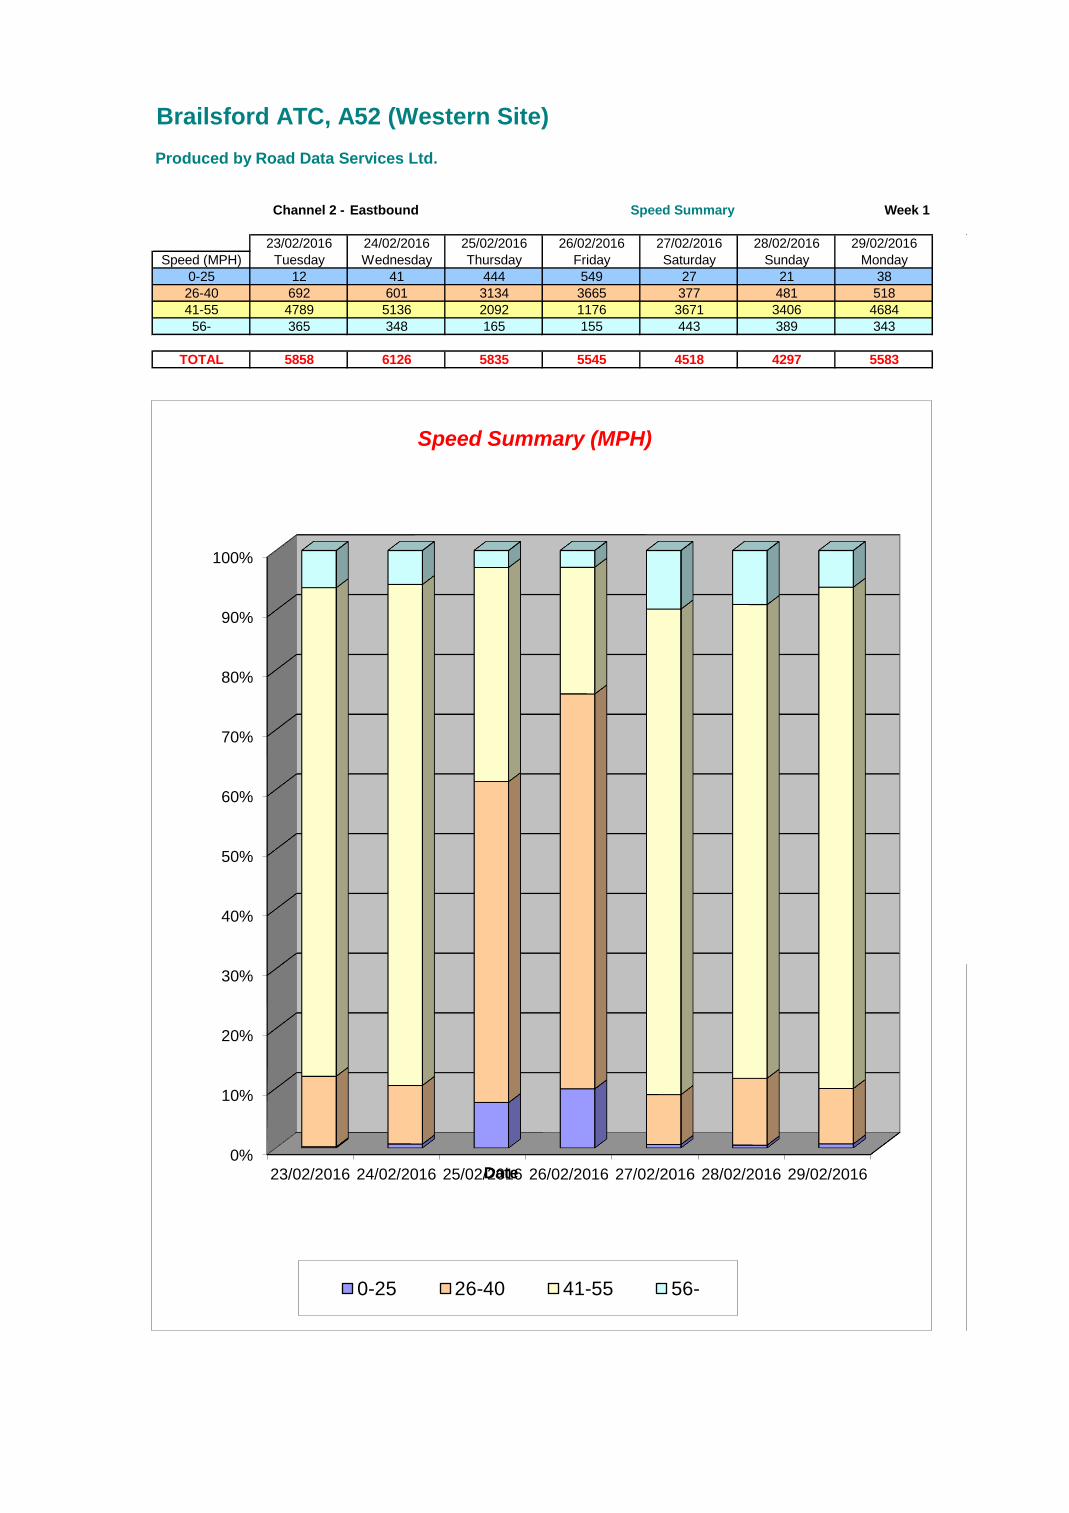
Brailsford ATC, A52 (Western Site)
Produced by Road Data Services Ltd.
Channel 2 - Eastbound Speed Summary Week 1
23/02/2016 24/02/2016 25/02/2016 26/02/2016 27/02/2016 28/02/2016 29/02/2016
Speed (MPH) Tuesday Wednesday Thursday Friday Saturday Sunday Monday
0-25 12 41 444 549 27 21 38
26-40 692 601 3134 3665 377 481 518
41-55 4789 5136 2092 1176 3671 3406 4684
56- 365 348 165 155 443 389 343
TOTAL 5858 6126 5835 5545 4518 4297 5583
0%
10%
20%
30%
40%
50%
60%
70%
80%
90%
100%
23/02/2016 24/02/2016 25/02/2016 26/02/2016 27/02/2016 28/02/2016 29/02/2016 Date
Speed Summary (MPH)
0-25 26-40 41-55 56-

Brailsford ATC, A52 (Western Site)
Produced by Road Data Services Ltd.
Channel 2 - Eastbound Vehicle Class Week 1
Classes Car / LGV / OGV1 / Bus OGV2 TOTAL
Day / Time Caravan - 1 - 2,3,5,6,7,12 - 4,8,9,10,11,13 - 1-13
23/02/2016
7-19 4160 585 157 4902
6-22 4717 655 183 5555
6-24 4815 660 185 5660
0-24 4948 692 218 5858
24/02/2016
7-19 4387 564 158 5109
6-22 4974 637 175 5786
6-24 5075 646 178 5899
0-24 5251 671 204 6126
25/02/2016
7-19 4080 539 142 4761
6-22 4691 618 174 5483
6-24 4798 624 179 5601
0-24 4972 655 208 5835
26/02/2016
7-19 3907 519 154 4580
6-22 4452 589 176 5217
6-24 4563 597 179 5339
0-24 4702 628 215 5545
27/02/2016
7-19 3567 270 34 3871
6-22 3891 295 38 4224
6-24 4012 304 40 4356
0-24 4145 323 50 4518
28/02/2016
7-19 3451 160 37 3648
6-22 3845 184 46 4075
6-24 3899 187 49 4135
0-24 4040 199 58 4297
29/02/2016
7-19 3969 496 137 4602
6-22 4519 558 159 5236
6-24 4623 566 171 5360
0-24 4810 591 182 5583
Average
7-19 3932 448 117 4496
6-22 4441 505 136 5082
6-24 4541 512 140 5193
0-24 4695 537 162 5395
87%
10% 3%
Total Vehicle Class Distribution
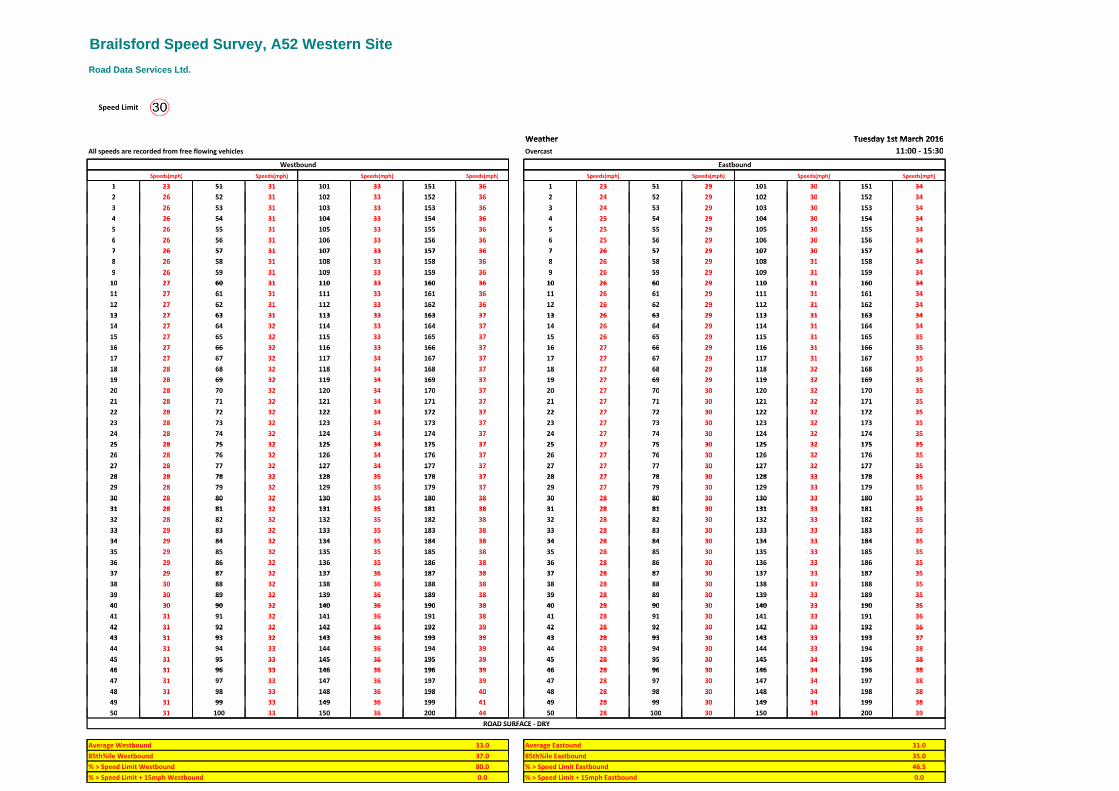
Brailsford Speed Survey, A52 Western SiteBrailsford Speed Survey, A52 Western SiteBrailsford Speed Survey, A52 Western Site
Road Data Services Ltd.Road Data Services Ltd.Road Data Services Ltd.
Speed LimitSpeed Limit
Weather Tuesday 1st March 2016 Weather Tuesday 1st March 2016
All speeds are recorded from free flowing vehicles Overcast 11:00 - 15:30All speeds are recorded from free flowing vehicles Overcast 11:00 - 15:30All speeds are recorded from free flowing vehicles Overcast 11:00 - 15:30
Westbound EastboundWestbound Eastbound
Speeds(mph) Speeds(mph) Speeds(mph) Speeds(mph) Speeds(mph) Speeds(mph) Speeds(mph) Speeds(mph)Speeds(mph) Speeds(mph) Speeds(mph) Speeds(mph) Speeds(mph) Speeds(mph) Speeds(mph) Speeds(mph)
1 23 51 31 101 33 151 36 1 23 51 29 101 30 151 341 23 51 31 101 33 151 36 1 23 51 29 101 30 151 34
2 26 52 31 102 33 152 36 2 24 52 29 102 30 152 342 26 52 31 102 33 152 36 2 24 52 29 102 30 152 34
3 26 53 31 103 33 153 36 3 24 53 29 103 30 153 343 26 53 31 103 33 153 36 3 24 53 29 103 30 153 343 26 53 31 103 33 153 36 3 24 53 29 103 30 153 34
4 26 54 31 104 33 154 36 4 25 54 29 104 30 154 344 26 54 31 104 33 154 36 4 25 54 29 104 30 154 34
5 26 55 31 105 33 155 36 5 25 55 29 105 30 155 345 26 55 31 105 33 155 36 5 25 55 29 105 30 155 34
6 26 56 31 106 33 156 36 6 25 56 29 106 30 156 346 26 56 31 106 33 156 36 6 25 56 29 106 30 156 346 26 56 31 106 33 156 36 6 25 56 29 106 30 156 34
7 26 57 31 107 33 157 36 7 26 57 29 107 30 157 347 26 57 31 107 33 157 36 7 26 57 29 107 30 157 34
8 26 58 31 108 33 158 36 8 26 58 29 108 31 158 348 26 58 31 108 33 158 36 8 26 58 29 108 31 158 34
9 26 59 31 109 33 159 36 9 26 59 29 109 31 159 349 26 59 31 109 33 159 36 9 26 59 29 109 31 159 349 26 59 31 109 33 159 36 9 26 59 29 109 31 159 34
10 27 60 31 110 33 160 36 10 26 60 29 110 31 160 3410 27 60 31 110 33 160 36 10 26 60 29 110 31 160 34
11 27 61 31 111 33 161 36 11 26 61 29 111 31 161 3411 27 61 31 111 33 161 36 11 26 61 29 111 31 161 34
12 27 62 31 112 33 162 36 12 26 62 29 112 31 162 3412 27 62 31 112 33 162 36 12 26 62 29 112 31 162 3412 27 62 31 112 33 162 36 12 26 62 29 112 31 162 34
13 27 63 31 113 33 163 37 13 26 63 29 113 31 163 3413 27 63 31 113 33 163 37 13 26 63 29 113 31 163 34
14 27 64 32 114 33 164 37 14 26 64 29 114 31 164 3414 27 64 32 114 33 164 37 14 26 64 29 114 31 164 34
15 27 65 32 115 33 165 37 15 26 65 29 115 31 165 3515 27 65 32 115 33 165 37 15 26 65 29 115 31 165 3515 27 65 32 115 33 165 37 15 26 65 29 115 31 165 35
16 27 66 32 116 33 166 37 16 27 66 29 116 31 166 3516 27 66 32 116 33 166 37 16 27 66 29 116 31 166 35
17 27 67 32 117 34 167 37 17 27 67 29 117 31 167 3517 27 67 32 117 34 167 37 17 27 67 29 117 31 167 35
18 28 68 32 118 34 168 37 18 27 68 29 118 32 168 3518 28 68 32 118 34 168 37 18 27 68 29 118 32 168 3518 28 68 32 118 34 168 37 18 27 68 29 118 32 168 35
19 28 69 32 119 34 169 37 19 27 69 29 119 32 169 3519 28 69 32 119 34 169 37 19 27 69 29 119 32 169 35
20 28 70 32 120 34 170 37 20 27 70 30 120 32 170 3520 28 70 32 120 34 170 37 20 27 70 30 120 32 170 35
21 28 71 32 121 34 171 37 21 27 71 30 121 32 171 3521 28 71 32 121 34 171 37 21 27 71 30 121 32 171 3521 28 71 32 121 34 171 37 21 27 71 30 121 32 171 35
22 28 72 32 122 34 172 37 22 27 72 30 122 32 172 3522 28 72 32 122 34 172 37 22 27 72 30 122 32 172 35
23 28 73 32 123 34 173 37 23 27 73 30 123 32 173 3523 28 73 32 123 34 173 37 23 27 73 30 123 32 173 35
24 28 74 32 124 34 174 37 24 27 74 30 124 32 174 3524 28 74 32 124 34 174 37 24 27 74 30 124 32 174 3524 28 74 32 124 34 174 37 24 27 74 30 124 32 174 35
25 28 75 32 125 34 175 37 25 27 75 30 125 32 175 3525 28 75 32 125 34 175 37 25 27 75 30 125 32 175 35
26 28 76 32 126 34 176 37 26 27 76 30 126 32 176 3526 28 76 32 126 34 176 37 26 27 76 30 126 32 176 35
27 28 77 32 127 34 177 37 27 27 77 30 127 32 177 3527 28 77 32 127 34 177 37 27 27 77 30 127 32 177 35
28 28 78 32 128 35 178 37 28 27 78 30 128 33 178 3528 28 78 32 128 35 178 37 28 27 78 30 128 33 178 35
29 28 79 32 129 35 179 37 29 27 79 30 129 33 179 3529 28 79 32 129 35 179 37 29 27 79 30 129 33 179 35
30 28 80 32 130 35 180 38 30 28 80 30 130 33 180 3530 28 80 32 130 35 180 38 30 28 80 30 130 33 180 35
31 28 81 32 131 35 181 38 31 28 81 30 131 33 181 3531 28 81 32 131 35 181 38 31 28 81 30 131 33 181 35
32 28 82 32 132 35 182 38 32 28 82 30 132 33 182 3532 28 82 32 132 35 182 38 32 28 82 30 132 33 182 3532 28 82 32 132 35 182 38 32 28 82 30 132 33 182 35
33 29 83 32 133 35 183 38 33 28 83 30 133 33 183 3533 29 83 32 133 35 183 38 33 28 83 30 133 33 183 35
34 29 84 32 134 35 184 38 34 28 84 30 134 33 184 3534 29 84 32 134 35 184 38 34 28 84 30 134 33 184 35
35 29 85 32 135 35 185 38 35 28 85 30 135 33 185 3535 29 85 32 135 35 185 38 35 28 85 30 135 33 185 3535 29 85 32 135 35 185 38 35 28 85 30 135 33 185 35
36 29 86 32 136 35 186 38 36 28 86 30 136 33 186 3536 29 86 32 136 35 186 38 36 28 86 30 136 33 186 35
37 29 87 32 137 36 187 38 37 28 87 30 137 33 187 3537 29 87 32 137 36 187 38 37 28 87 30 137 33 187 35
38 30 88 32 138 36 188 38 38 28 88 30 138 33 188 3538 30 88 32 138 36 188 38 38 28 88 30 138 33 188 3538 30 88 32 138 36 188 38 38 28 88 30 138 33 188 35
39 30 89 32 139 36 189 38 39 28 89 30 139 33 189 3539 30 89 32 139 36 189 38 39 28 89 30 139 33 189 35
40 30 90 32 140 36 190 38 40 28 90 30 140 33 190 3540 30 90 32 140 36 190 38 40 28 90 30 140 33 190 35
41 31 91 32 141 36 191 38 41 28 91 30 141 33 191 3641 31 91 32 141 36 191 38 41 28 91 30 141 33 191 3641 31 91 32 141 36 191 38 41 28 91 30 141 33 191 36
42 31 92 32 142 36 192 39 42 28 92 30 142 33 192 3642 31 92 32 142 36 192 39 42 28 92 30 142 33 192 36
43 31 93 32 143 36 193 39 43 28 93 30 143 33 193 3743 31 93 32 143 36 193 39 43 28 93 30 143 33 193 37
44 31 94 33 144 36 194 39 44 28 94 30 144 33 194 3844 31 94 33 144 36 194 39 44 28 94 30 144 33 194 3844 31 94 33 144 36 194 39 44 28 94 30 144 33 194 38
45 31 95 33 145 36 195 39 45 28 95 30 145 34 195 3845 31 95 33 145 36 195 39 45 28 95 30 145 34 195 38
46 31 96 33 146 36 196 39 46 28 96 30 146 34 196 3846 31 96 33 146 36 196 39 46 28 96 30 146 34 196 38
47 31 97 33 147 36 197 39 47 28 97 30 147 34 197 3847 31 97 33 147 36 197 39 47 28 97 30 147 34 197 3847 31 97 33 147 36 197 39 47 28 97 30 147 34 197 38
48 31 98 33 148 36 198 40 48 28 98 30 148 34 198 3848 31 98 33 148 36 198 40 48 28 98 30 148 34 198 38
49 31 99 33 149 36 199 41 49 28 99 30 149 34 199 3849 31 99 33 149 36 199 41 49 28 99 30 149 34 199 38
50 31 100 33 150 36 200 44 50 28 100 30 150 34 200 3950 31 100 33 150 36 200 44 50 28 100 30 150 34 200 3950 31 100 33 150 36 200 44 50 28 100 30 150 34 200 39
ROAD SURFACE - DRYROAD SURFACE - DRY
Average Westbound 33.0 Average Eastound 31.0Average Westbound 33.0 Average Eastound 31.0Average Westbound 33.0 Average Eastound 31.0
85th%ile Westbound 37.0 85th%ile Eastbound 35.085th%ile Westbound 37.0 85th%ile Eastbound 35.0
% > Speed Limit Westbound 80.0 % > Speed Limit Eastbound 46.5% > Speed Limit Westbound 80.0 % > Speed Limit Eastbound 46.5
% > Speed Limit + 15mph Westbound 0.0 % > Speed Limit + 15mph Eastbound 0.0% > Speed Limit + 15mph Westbound 0.0 % > Speed Limit + 15mph Eastbound 0.0% > Speed Limit + 15mph Westbound 0.0 % > Speed Limit + 15mph Eastbound 0.0

Brailsford Speed Survey, A52 Eastern SiteBrailsford Speed Survey, A52 Eastern SiteBrailsford Speed Survey, A52 Eastern Site
Road Data Services Ltd.Road Data Services Ltd.Road Data Services Ltd.
Speed LimitSpeed Limit
Weather Tuesday 1st March 2016 Weather Tuesday 1st March 2016
All speeds are recorded from free flowing vehicles Overcast 11:30 - 15:30All speeds are recorded from free flowing vehicles Overcast 11:30 - 15:30All speeds are recorded from free flowing vehicles Overcast 11:30 - 15:30
Westbound EastboundWestbound Eastbound
Speeds(mph) Speeds(mph) Speeds(mph) Speeds(mph) Speeds(mph) Speeds(mph) Speeds(mph) Speeds(mph)Speeds(mph) Speeds(mph) Speeds(mph) Speeds(mph) Speeds(mph) Speeds(mph) Speeds(mph) Speeds(mph)
1 19 51 31 101 33 151 36 1 20 51 28 101 30 151 341 19 51 31 101 33 151 36 1 20 51 28 101 30 151 34
2 22 52 31 102 33 152 36 2 22 52 28 102 30 152 342 22 52 31 102 33 152 36 2 22 52 28 102 30 152 34
3 22 53 31 103 33 153 36 3 22 53 28 103 30 153 343 22 53 31 103 33 153 36 3 22 53 28 103 30 153 343 22 53 31 103 33 153 36 3 22 53 28 103 30 153 34
4 24 54 31 104 33 154 36 4 22 54 28 104 30 154 344 24 54 31 104 33 154 36 4 22 54 28 104 30 154 34
5 24 55 31 105 33 155 36 5 23 55 28 105 30 155 345 24 55 31 105 33 155 36 5 23 55 28 105 30 155 34
6 25 56 31 106 33 156 36 6 23 56 28 106 30 156 346 25 56 31 106 33 156 36 6 23 56 28 106 30 156 346 25 56 31 106 33 156 36 6 23 56 28 106 30 156 34
7 25 57 31 107 33 157 36 7 23 57 28 107 30 157 347 25 57 31 107 33 157 36 7 23 57 28 107 30 157 34
8 26 58 31 108 33 158 36 8 23 58 28 108 30 158 348 26 58 31 108 33 158 36 8 23 58 28 108 30 158 34
9 26 59 31 109 33 159 36 9 24 59 28 109 31 159 349 26 59 31 109 33 159 36 9 24 59 28 109 31 159 349 26 59 31 109 33 159 36 9 24 59 28 109 31 159 34
10 26 60 31 110 33 160 36 10 24 60 29 110 31 160 3410 26 60 31 110 33 160 36 10 24 60 29 110 31 160 34
11 26 61 31 111 33 161 36 11 24 61 29 111 31 161 3411 26 61 31 111 33 161 36 11 24 61 29 111 31 161 34
12 26 62 31 112 33 162 36 12 25 62 29 112 31 162 3412 26 62 31 112 33 162 36 12 25 62 29 112 31 162 3412 26 62 31 112 33 162 36 12 25 62 29 112 31 162 34
13 26 63 31 113 33 163 36 13 25 63 29 113 31 163 3413 26 63 31 113 33 163 36 13 25 63 29 113 31 163 34
14 26 64 31 114 33 164 36 14 25 64 29 114 31 164 3414 26 64 31 114 33 164 36 14 25 64 29 114 31 164 34
15 26 65 31 115 33 165 36 15 26 65 29 115 31 165 3415 26 65 31 115 33 165 36 15 26 65 29 115 31 165 3415 26 65 31 115 33 165 36 15 26 65 29 115 31 165 34
16 27 66 31 116 33 166 36 16 26 66 29 116 32 166 3416 27 66 31 116 33 166 36 16 26 66 29 116 32 166 34
17 27 67 31 117 33 167 37 17 26 67 29 117 32 167 3417 27 67 31 117 33 167 37 17 26 67 29 117 32 167 34
18 27 68 31 118 34 168 37 18 26 68 29 118 32 168 3518 27 68 31 118 34 168 37 18 26 68 29 118 32 168 3518 27 68 31 118 34 168 37 18 26 68 29 118 32 168 35
19 27 69 31 119 34 169 37 19 26 69 29 119 32 169 3519 27 69 31 119 34 169 37 19 26 69 29 119 32 169 35
20 27 70 31 120 34 170 37 20 26 70 29 120 32 170 3520 27 70 31 120 34 170 37 20 26 70 29 120 32 170 35
21 27 71 31 121 34 171 37 21 26 71 29 121 32 171 3521 27 71 31 121 34 171 37 21 26 71 29 121 32 171 3521 27 71 31 121 34 171 37 21 26 71 29 121 32 171 35
22 27 72 31 122 34 172 37 22 26 72 29 122 32 172 3522 27 72 31 122 34 172 37 22 26 72 29 122 32 172 35
23 27 73 31 123 34 173 37 23 26 73 29 123 32 173 3523 27 73 31 123 34 173 37 23 26 73 29 123 32 173 35
24 27 74 31 124 34 174 37 24 26 74 29 124 32 174 3524 27 74 31 124 34 174 37 24 26 74 29 124 32 174 3524 27 74 31 124 34 174 37 24 26 74 29 124 32 174 35
25 28 75 31 125 34 175 37 25 26 75 30 125 32 175 3525 28 75 31 125 34 175 37 25 26 75 30 125 32 175 35
26 28 76 31 126 34 176 37 26 26 76 30 126 32 176 3526 28 76 31 126 34 176 37 26 26 76 30 126 32 176 35
27 28 77 32 127 34 177 37 27 26 77 30 127 32 177 3527 28 77 32 127 34 177 37 27 26 77 30 127 32 177 35
28 28 78 32 128 34 178 37 28 26 78 30 128 32 178 3528 28 78 32 128 34 178 37 28 26 78 30 128 32 178 35
29 28 79 32 129 34 179 37 29 27 79 30 129 32 179 3529 28 79 32 129 34 179 37 29 27 79 30 129 32 179 35
30 28 80 32 130 34 180 37 30 27 80 30 130 32 180 3530 28 80 32 130 34 180 37 30 27 80 30 130 32 180 35
31 28 81 32 131 34 181 37 31 27 81 30 131 33 181 3531 28 81 32 131 34 181 37 31 27 81 30 131 33 181 35
32 28 82 32 132 34 182 37 32 27 82 30 132 33 182 3532 28 82 32 132 34 182 37 32 27 82 30 132 33 182 3532 28 82 32 132 34 182 37 32 27 82 30 132 33 182 35
33 28 83 32 133 34 183 37 33 27 83 30 133 33 183 3533 28 83 32 133 34 183 37 33 27 83 30 133 33 183 35
34 28 84 32 134 34 184 38 34 27 84 30 134 33 184 3534 28 84 32 134 34 184 38 34 27 84 30 134 33 184 35
35 29 85 32 135 34 185 38 35 27 85 30 135 33 185 3535 29 85 32 135 34 185 38 35 27 85 30 135 33 185 3535 29 85 32 135 34 185 38 35 27 85 30 135 33 185 35
36 29 86 32 136 34 186 38 36 27 86 30 136 33 186 3636 29 86 32 136 34 186 38 36 27 86 30 136 33 186 36
37 29 87 32 137 34 187 38 37 27 87 30 137 33 187 3637 29 87 32 137 34 187 38 37 27 87 30 137 33 187 36
38 29 88 32 138 34 188 38 38 27 88 30 138 33 188 3638 29 88 32 138 34 188 38 38 27 88 30 138 33 188 3638 29 88 32 138 34 188 38 38 27 88 30 138 33 188 36
39 29 89 32 139 34 189 38 39 27 89 30 139 33 189 3639 29 89 32 139 34 189 38 39 27 89 30 139 33 189 36
40 30 90 32 140 34 190 38 40 27 90 30 140 33 190 3640 30 90 32 140 34 190 38 40 27 90 30 140 33 190 36
41 30 91 32 141 34 191 38 41 27 91 30 141 33 191 3741 30 91 32 141 34 191 38 41 27 91 30 141 33 191 3741 30 91 32 141 34 191 38 41 27 91 30 141 33 191 37
42 30 92 32 142 35 192 38 42 27 92 30 142 33 192 3742 30 92 32 142 35 192 38 42 27 92 30 142 33 192 37
43 31 93 32 143 35 193 38 43 28 93 30 143 33 193 3743 31 93 32 143 35 193 38 43 28 93 30 143 33 193 37
44 31 94 32 144 35 194 39 44 28 94 30 144 33 194 3744 31 94 32 144 35 194 39 44 28 94 30 144 33 194 3744 31 94 32 144 35 194 39 44 28 94 30 144 33 194 37
45 31 95 33 145 35 195 39 45 28 95 30 145 33 195 3745 31 95 33 145 35 195 39 45 28 95 30 145 33 195 37
46 31 96 33 146 35 196 39 46 28 96 30 146 33 196 3746 31 96 33 146 35 196 39 46 28 96 30 146 33 196 37
47 31 97 33 147 35 197 40 47 28 97 30 147 33 197 3747 31 97 33 147 35 197 40 47 28 97 30 147 33 197 3747 31 97 33 147 35 197 40 47 28 97 30 147 33 197 37
48 31 98 33 148 36 198 40 48 28 98 30 148 34 198 3748 31 98 33 148 36 198 40 48 28 98 30 148 34 198 37
49 31 99 33 149 36 199 42 49 28 99 30 149 34 199 3849 31 99 33 149 36 199 42 49 28 99 30 149 34 199 38
50 31 100 33 150 36 200 42 50 28 100 30 150 34 200 3850 31 100 33 150 36 200 42 50 28 100 30 150 34 200 3850 31 100 33 150 36 200 42 50 28 100 30 150 34 200 38
ROAD SURFACE - DRYROAD SURFACE - DRY
Average Westbound 32.6 Average Eastound 30.6Average Westbound 32.6 Average Eastound 30.6Average Westbound 32.6 Average Eastound 30.6
85th%ile Westbound 37.0 85th%ile Eastbound 35.085th%ile Westbound 37.0 85th%ile Eastbound 35.0
% > Speed Limit Westbound 79.0 % > Speed Limit Eastbound 46.0% > Speed Limit Westbound 79.0 % > Speed Limit Eastbound 46.0
% > Speed Limit + 15mph Westbound 0.0 % > Speed Limit + 15mph Eastbound 0.0% > Speed Limit + 15mph Westbound 0.0 % > Speed Limit + 15mph Eastbound 0.0% > Speed Limit + 15mph Westbound 0.0 % > Speed Limit + 15mph Eastbound 0.0

T16512 Brailsford Parish Council
PTB Transport Planning Ltd T16512 Transport Appraisal Rev A - Email.docx
APPENDIX C - SPEED ANALYSIS

Battersea Park Way IDERBY93 About this PWS | Report
Forecast for Derby, UK > 52.923 -1.525 > 95 m
PWS viewed 7 times since March 1, 2016
5.8 °C
Feels Like 5.8 °C
6:43 AM 7:37 PM
Waning Gibbous | 62% Illuminated
Current Conditions
Wind from --
--
Dew Point:6 °C
Humidity:100%
Precip Rate:0 mm/hr
Precip Accum:0 mm
Pressure:1002.59 hPa
UV:3
Solar:--
Soil Moisture:--
Soil Temp:--
Leaf Wetness:--
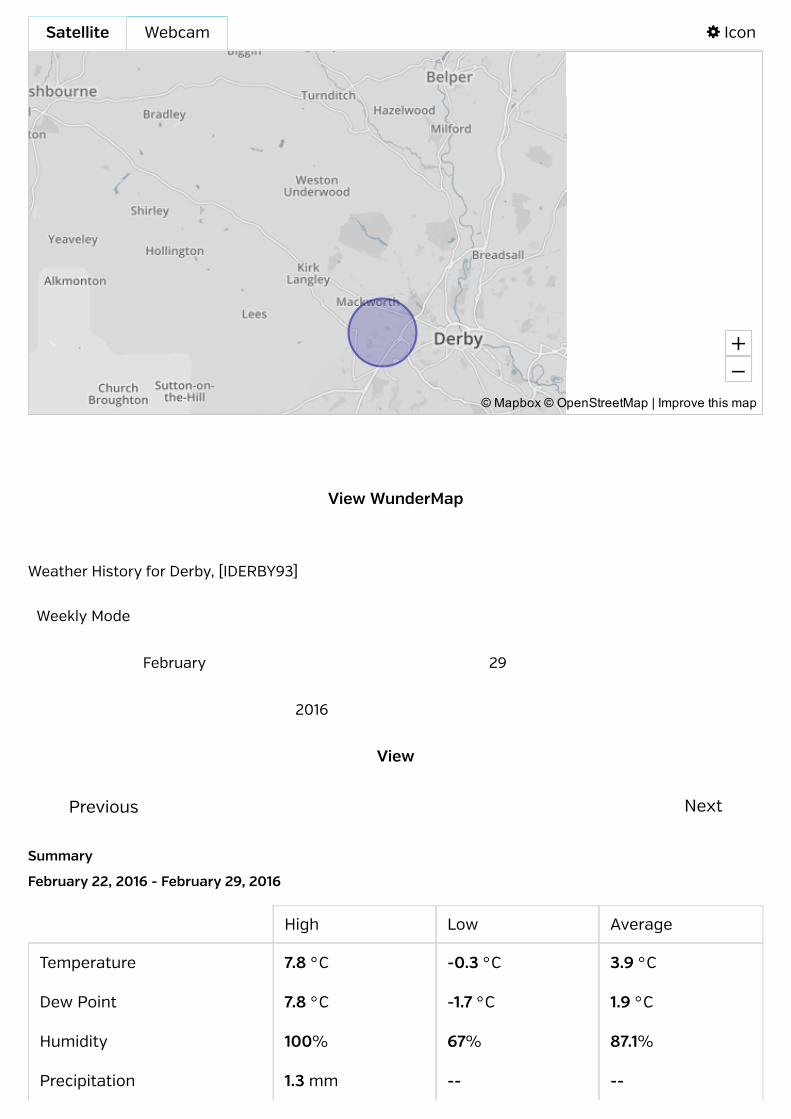
Next Previous
Weather History for Derby, [IDERBY93]
Weekly Mode
February 29
2016
Satellite Webcam
View WunderMap
Icon
+–
© Mapbox © OpenStreetMap | Improve this map
View
High Low Average
Temperature 7.8 °C -0.3 °C 3.9 °C
Dew Point 7.8 °C -1.7 °C 1.9 °C
Humidity 100% 67% 87.1%
Precipitation 1.3 mm -- --
Summary
February 22, 2016 - February 29, 2016

High Low Average
Wind Speed 0 km/h -- 0 km/h
Wind Gust 0 km/h -- --
Wind Direction -- -- North
Pressure 1023.9 hPa 1000.2 hPa --
Feb 22 Temperature DewPoint
Humidity Wind Speed Gust Pressure Precip.Rate.
Precip.Accum.
12:01AM
7.8 °C 7.8 °C 100 % -- -- kph--kph
1000.2hPa
0 mm 0 mm
12:41AM
7.5 °C 7.5 °C 100 % -- -- kph--kph
1000.6hPa
0 mm 0 mm
1:21 AM 7.1 °C 7.1 °C 100 % -- -- kph--kph
1000.9hPa
0 mm 0 mm
2:02AM
6.8 °C 6.8 °C 100 % -- -- kph--kph
1001.2hPa
0 mm 0 mm
2:42AM
6.8 °C 6.8 °C 100 % -- -- kph--kph
1001.2hPa
0 mm 0 mm
3:33AM
6.6 °C 6.6 °C 100 % -- -- kph--kph
1001.6hPa
0 mm 0 mm
4:13 AM 6.4 °C 6.4 °C 100 % -- -- kph--kph
1001.6hPa
0 mm 0 mm
4:53AM
6.3 °C 6.3 °C 100 % -- -- kph--kph
1001.9hPa
0 mm 0 mm
5:34AM
6.3 °C 6.3 °C 100 % -- -- kph--kph
1002.3hPa
0 mm 0 mm
6:14 AM 6.2 °C 6.2 °C 100 % -- -- kph--kph
1002.3hPa
0 mm 0 mm
6:54AM
5.9 °C 5.9 °C 100 % -- -- kph--kph
1002.3hPa
0 mm 0 mm
7:35 AM 5.7 °C 5.7 °C 100 % -- -- kph--kph
1002.6hPa
0 mm 0 mm
8:16 AM 5.7 °C 5.7 °C 100 % -- -- kph--kph
1002.9hPa
0 mm 0 mm
Graphs Table
Weather History Table
February 22, 2016 - February 29, 2016
Download

9:06AM
5.7 °C 5.7 °C 100 % -- -- kph--kph
1003.3hPa
0 mm 0 mm
9:46AM
6.1 °C 6.1 °C 100 % -- -- kph--kph
1003.3hPa
0 mm 0 mm
10:27AM
6 °C 6 °C 100 % -- -- kph--kph
1003.9hPa
0 mm 0 mm
10:57AM
6 °C 6 °C 100 % -- -- kph--kph
1003.6hPa
0 mm 0 mm
11:57AM
6.7 °C 6.7 °C 100 % -- -- kph--kph
1003.9hPa
0 mm 0 mm
12:38PM
6.6 °C 6.6 °C 100 % -- -- kph--kph
1003.6hPa
0 mm 0 mm
1:18 PM 6.8 °C 6.8 °C 100 % -- -- kph--kph
1003.6hPa
0 mm 0 mm
1:48 PM 7.3 °C 6.3 °C 93 % -- -- kph--kph
1003.6hPa
0 mm 0 mm
2:29PM
7.5 °C 6.4 °C 93 % -- -- kph--kph
1003.9hPa
0 mm 0 mm
3:17 PM 7.5 °C 7.1 °C 97 % -- -- kph--kph
1003.9hPa
0 mm 0 mm
4:07PM
7.2 °C 7.1 °C 99 % -- -- kph--kph
1003.6hPa
0 mm 0 mm
4:29PM
7 °C 7 °C 100 % -- -- kph--kph
1003.9hPa
0 mm 0 mm
5:10 PM 6.6 °C 6.6 °C 100 % -- -- kph--kph
1004.3hPa
0 mm 0 mm
5:50PM
6.1 °C 6.1 °C 100 % -- -- kph--kph
1005hPa
0 mm 0 mm
6:41 PM 5.7 °C 5.7 °C 100 % -- -- kph--kph
1005hPa
0 mm 0 mm
7:21 PM 5.4 °C 5.4 °C 100 % -- -- kph--kph
1006hPa
0 mm 0 mm
8:42PM
5.3 °C 5.3 °C 100 % -- -- kph--kph
1006.3hPa
0 mm 0 mm
9:26PM
5.2 °C 5.2 °C 100 % -- -- kph--kph
1006.3hPa
0 mm 0 mm
10:16PM
5.2 °C 5.2 °C 100 % -- -- kph--kph
1006.3hPa
0 mm 0 mm
10:57PM
5 °C 5 °C 100 % -- -- kph--kph
1007hPa
0 mm 0 mm
11:37PM
4.6 °C 4.6 °C 100 % -- -- kph--kph
1007hPa
0 mm 0 mm
Dew Precip. Precip.
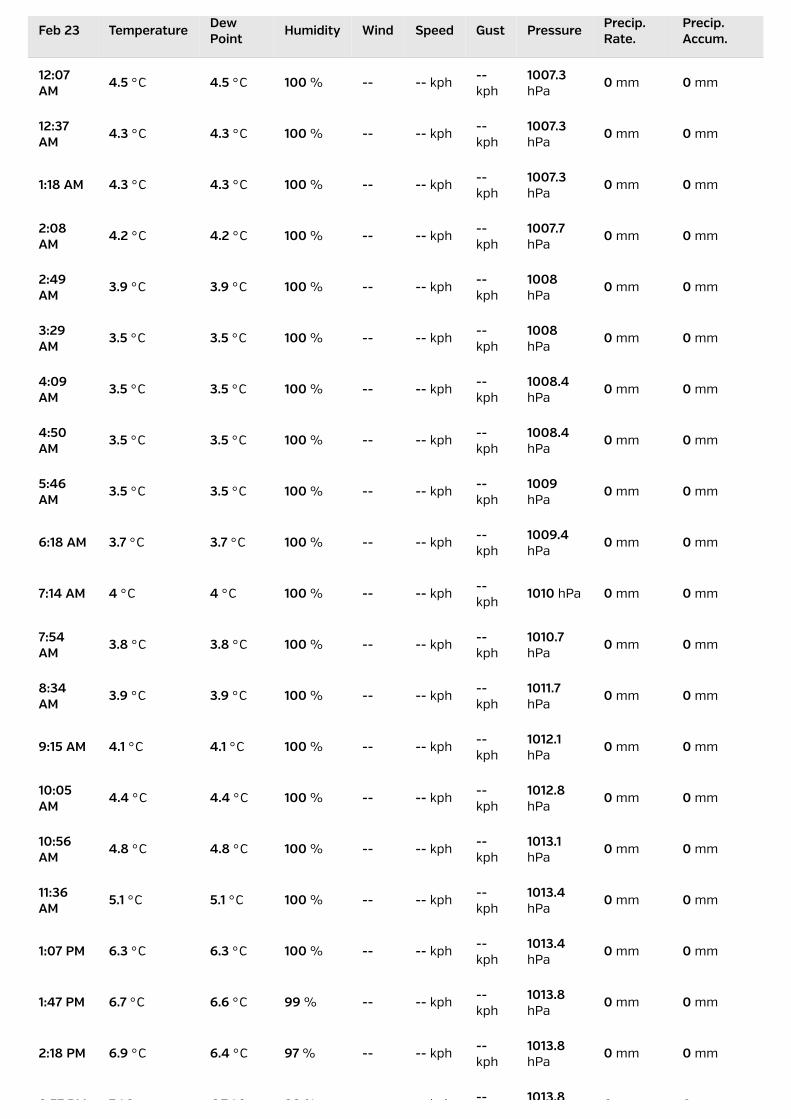
Feb 23 Temperature DewPoint
Humidity Wind Speed Gust Pressure Precip.Rate.
Precip.Accum.
12:07AM
4.5 °C 4.5 °C 100 % -- -- kph--kph
1007.3hPa
0 mm 0 mm
12:37AM
4.3 °C 4.3 °C 100 % -- -- kph--kph
1007.3hPa
0 mm 0 mm
1:18 AM 4.3 °C 4.3 °C 100 % -- -- kph--kph
1007.3hPa
0 mm 0 mm
2:08AM
4.2 °C 4.2 °C 100 % -- -- kph--kph
1007.7hPa
0 mm 0 mm
2:49AM
3.9 °C 3.9 °C 100 % -- -- kph--kph
1008hPa
0 mm 0 mm
3:29AM
3.5 °C 3.5 °C 100 % -- -- kph--kph
1008hPa
0 mm 0 mm
4:09AM
3.5 °C 3.5 °C 100 % -- -- kph--kph
1008.4hPa
0 mm 0 mm
4:50AM
3.5 °C 3.5 °C 100 % -- -- kph--kph
1008.4hPa
0 mm 0 mm
5:46AM
3.5 °C 3.5 °C 100 % -- -- kph--kph
1009hPa
0 mm 0 mm
6:18 AM 3.7 °C 3.7 °C 100 % -- -- kph--kph
1009.4hPa
0 mm 0 mm
7:14 AM 4 °C 4 °C 100 % -- -- kph--kph
1010 hPa 0 mm 0 mm
7:54AM
3.8 °C 3.8 °C 100 % -- -- kph--kph
1010.7hPa
0 mm 0 mm
8:34AM
3.9 °C 3.9 °C 100 % -- -- kph--kph
1011.7hPa
0 mm 0 mm
9:15 AM 4.1 °C 4.1 °C 100 % -- -- kph--kph
1012.1hPa
0 mm 0 mm
10:05AM
4.4 °C 4.4 °C 100 % -- -- kph--kph
1012.8hPa
0 mm 0 mm
10:56AM
4.8 °C 4.8 °C 100 % -- -- kph--kph
1013.1hPa
0 mm 0 mm
11:36AM
5.1 °C 5.1 °C 100 % -- -- kph--kph
1013.4hPa
0 mm 0 mm
1:07 PM 6.3 °C 6.3 °C 100 % -- -- kph--kph
1013.4hPa
0 mm 0 mm
1:47 PM 6.7 °C 6.6 °C 99 % -- -- kph--kph
1013.8hPa
0 mm 0 mm
2:18 PM 6.9 °C 6.4 °C 97 % -- -- kph--kph
1013.8hPa
0 mm 0 mm
2:57 PM 7 °C 6.7 °C 98 % -- -- kph-- 1013.8 0 mm 0 mm

2:57 PM 7 °C 6.7 °C 98 % -- -- kph--kph
1013.8hPa
0 mm 0 mm
3:36PM
6.7 °C 6.1 °C 96 % -- -- kph--kph
1014.1hPa
0 mm 0 mm
4:17 PM 6.4 °C 5.7 °C 95 % -- -- kph--kph
1014.4hPa
0 mm 0 mm
4:57 PM 6 °C 5.3 °C 95 % -- -- kph--kph
1014.8hPa
0 mm 0 mm
5:29PM
5.6 °C 4.9 °C 95 % -- -- kph--kph
1015.1hPa
0 mm 0 mm
6:00PM
5.2 °C 4.2 °C 93 % -- -- kph--kph
1015.5hPa
0 mm 0 mm
6:40PM
4.7 °C 3.7 °C 93 % -- -- kph--kph
1015.8hPa
0 mm 0 mm
7:20PM
4.3 °C 3.7 °C 96 % -- -- kph--kph
1015.8hPa
0 mm 0 mm
8:11 PM 3.7 °C 3.3 °C 97 % -- -- kph--kph
1015.8hPa
0 mm 0 mm
8:51 PM 3.4 °C 2.9 °C 97 % -- -- kph--kph
1015.8hPa
0 mm 0 mm
9:32PM
2.9 °C 2.4 °C 97 % -- -- kph--kph
1016.1hPa
0 mm 0 mm
10:12PM
2.6 °C 2.2 °C 97 % -- -- kph--kph
1016.1hPa
0 mm 0 mm
11:08PM
2.2 °C 1.8 °C 97 % -- -- kph--kph
1015.8hPa
0 mm 0 mm
11:47PM
1.9 °C 1.3 °C 96 % -- -- kph--kph
1015.8hPa
0 mm 0 mm
Feb 24 Temperature DewPoint
Humidity Wind Speed Gust Pressure Precip.Rate.
Precip.Accum.
12:27AM
1.5 °C 0.7 °C 94 % -- -- kph--kph
1016.1hPa
0 mm 0 mm
12:57AM
1.2 °C 0.3 °C 94 % -- -- kph--kph
1016.1hPa
0 mm 0 mm
1:19 AM 0.9 °C 0.1 °C 94 % -- -- kph--kph
1016.1hPa
0 mm 0 mm
2:00AM
0.7 °C 0 °C 95 % -- -- kph--kph
1015.5hPa
0 mm 0 mm
2:40AM
0.6 °C -0.3 °C 94 % -- -- kph--kph
1015.5hPa
0 mm 0 mm
3:21 AM 0.2 °C -0.7 °C 94 % -- -- kph--kph
1015.1hPa
0 mm 0 mm
4:01 AM 0.1 °C -0.6 °C 95 % -- -- kph--kph
1015.1hPa
0 mm 0 mm
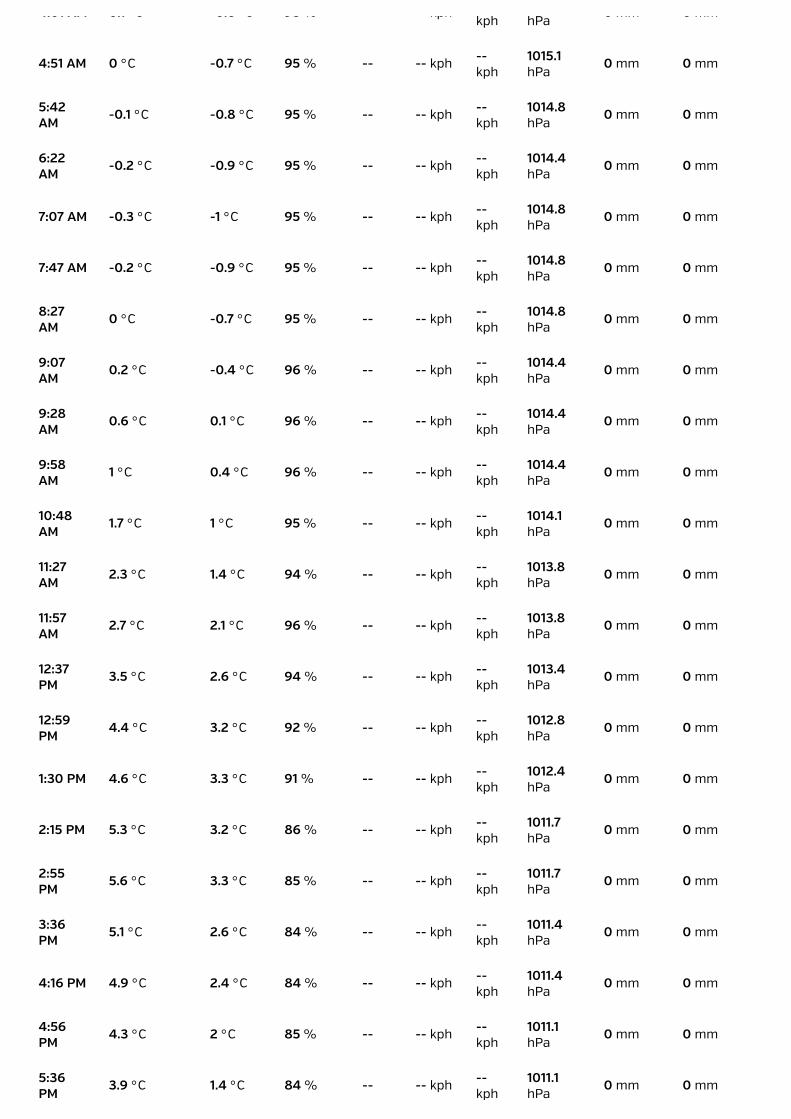
4:01 AM 0.1 °C -0.6 °C 95 % -- -- kphkph hPa
0 mm 0 mm
4:51 AM 0 °C -0.7 °C 95 % -- -- kph--kph
1015.1hPa
0 mm 0 mm
5:42AM
-0.1 °C -0.8 °C 95 % -- -- kph--kph
1014.8hPa
0 mm 0 mm
6:22AM
-0.2 °C -0.9 °C 95 % -- -- kph--kph
1014.4hPa
0 mm 0 mm
7:07 AM -0.3 °C -1 °C 95 % -- -- kph--kph
1014.8hPa
0 mm 0 mm
7:47 AM -0.2 °C -0.9 °C 95 % -- -- kph--kph
1014.8hPa
0 mm 0 mm
8:27AM
0 °C -0.7 °C 95 % -- -- kph--kph
1014.8hPa
0 mm 0 mm
9:07AM
0.2 °C -0.4 °C 96 % -- -- kph--kph
1014.4hPa
0 mm 0 mm
9:28AM
0.6 °C 0.1 °C 96 % -- -- kph--kph
1014.4hPa
0 mm 0 mm
9:58AM
1 °C 0.4 °C 96 % -- -- kph--kph
1014.4hPa
0 mm 0 mm
10:48AM
1.7 °C 1 °C 95 % -- -- kph--kph
1014.1hPa
0 mm 0 mm
11:27AM
2.3 °C 1.4 °C 94 % -- -- kph--kph
1013.8hPa
0 mm 0 mm
11:57AM
2.7 °C 2.1 °C 96 % -- -- kph--kph
1013.8hPa
0 mm 0 mm
12:37PM
3.5 °C 2.6 °C 94 % -- -- kph--kph
1013.4hPa
0 mm 0 mm
12:59PM
4.4 °C 3.2 °C 92 % -- -- kph--kph
1012.8hPa
0 mm 0 mm
1:30 PM 4.6 °C 3.3 °C 91 % -- -- kph--kph
1012.4hPa
0 mm 0 mm
2:15 PM 5.3 °C 3.2 °C 86 % -- -- kph--kph
1011.7hPa
0 mm 0 mm
2:55PM
5.6 °C 3.3 °C 85 % -- -- kph--kph
1011.7hPa
0 mm 0 mm
3:36PM
5.1 °C 2.6 °C 84 % -- -- kph--kph
1011.4hPa
0 mm 0 mm
4:16 PM 4.9 °C 2.4 °C 84 % -- -- kph--kph
1011.4hPa
0 mm 0 mm
4:56PM
4.3 °C 2 °C 85 % -- -- kph--kph
1011.1hPa
0 mm 0 mm
5:36PM
3.9 °C 1.4 °C 84 % -- -- kph--kph
1011.1hPa
0 mm 0 mm
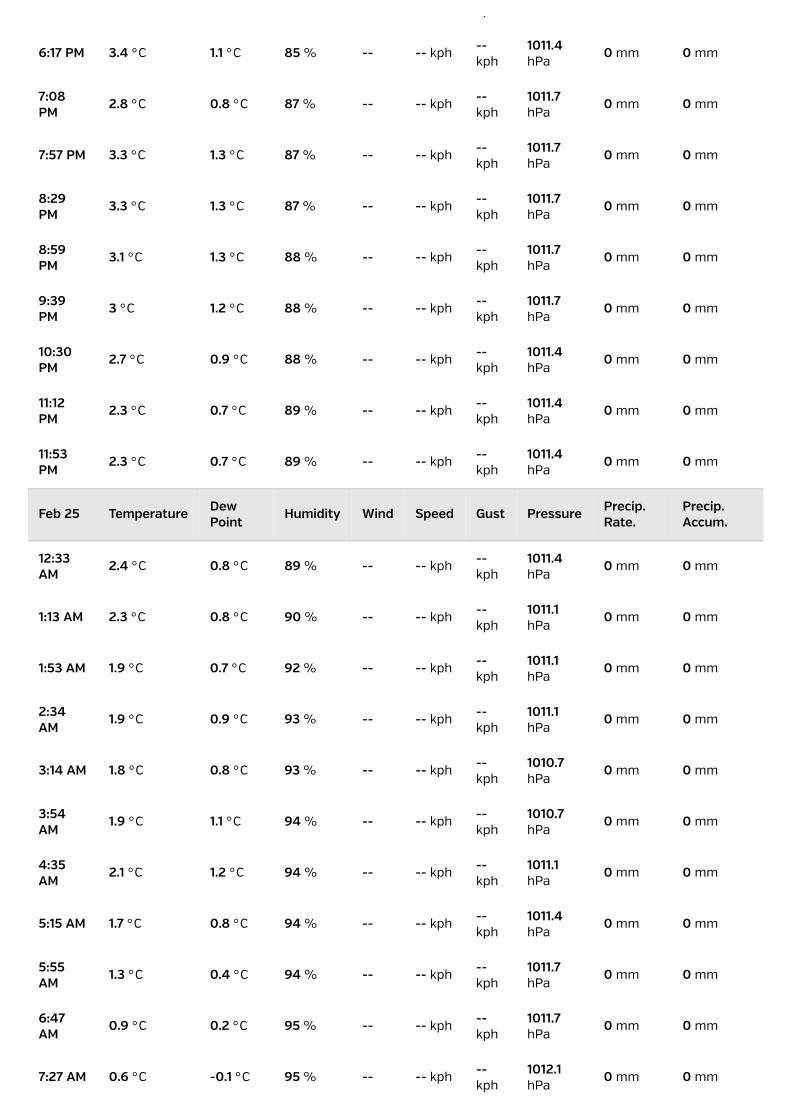
PM kph hPa
6:17 PM 3.4 °C 1.1 °C 85 % -- -- kph--kph
1011.4hPa
0 mm 0 mm
7:08PM
2.8 °C 0.8 °C 87 % -- -- kph--kph
1011.7hPa
0 mm 0 mm
7:57 PM 3.3 °C 1.3 °C 87 % -- -- kph--kph
1011.7hPa
0 mm 0 mm
8:29PM
3.3 °C 1.3 °C 87 % -- -- kph--kph
1011.7hPa
0 mm 0 mm
8:59PM
3.1 °C 1.3 °C 88 % -- -- kph--kph
1011.7hPa
0 mm 0 mm
9:39PM
3 °C 1.2 °C 88 % -- -- kph--kph
1011.7hPa
0 mm 0 mm
10:30PM
2.7 °C 0.9 °C 88 % -- -- kph--kph
1011.4hPa
0 mm 0 mm
11:12PM
2.3 °C 0.7 °C 89 % -- -- kph--kph
1011.4hPa
0 mm 0 mm
11:53PM
2.3 °C 0.7 °C 89 % -- -- kph--kph
1011.4hPa
0 mm 0 mm
Feb 25 Temperature DewPoint
Humidity Wind Speed Gust Pressure Precip.Rate.
Precip.Accum.
12:33AM
2.4 °C 0.8 °C 89 % -- -- kph--kph
1011.4hPa
0 mm 0 mm
1:13 AM 2.3 °C 0.8 °C 90 % -- -- kph--kph
1011.1hPa
0 mm 0 mm
1:53 AM 1.9 °C 0.7 °C 92 % -- -- kph--kph
1011.1hPa
0 mm 0 mm
2:34AM
1.9 °C 0.9 °C 93 % -- -- kph--kph
1011.1hPa
0 mm 0 mm
3:14 AM 1.8 °C 0.8 °C 93 % -- -- kph--kph
1010.7hPa
0 mm 0 mm
3:54AM
1.9 °C 1.1 °C 94 % -- -- kph--kph
1010.7hPa
0 mm 0 mm
4:35AM
2.1 °C 1.2 °C 94 % -- -- kph--kph
1011.1hPa
0 mm 0 mm
5:15 AM 1.7 °C 0.8 °C 94 % -- -- kph--kph
1011.4hPa
0 mm 0 mm
5:55AM
1.3 °C 0.4 °C 94 % -- -- kph--kph
1011.7hPa
0 mm 0 mm
6:47AM
0.9 °C 0.2 °C 95 % -- -- kph--kph
1011.7hPa
0 mm 0 mm
7:27 AM 0.6 °C -0.1 °C 95 % -- -- kph--kph
1012.1hPa
0 mm 0 mm
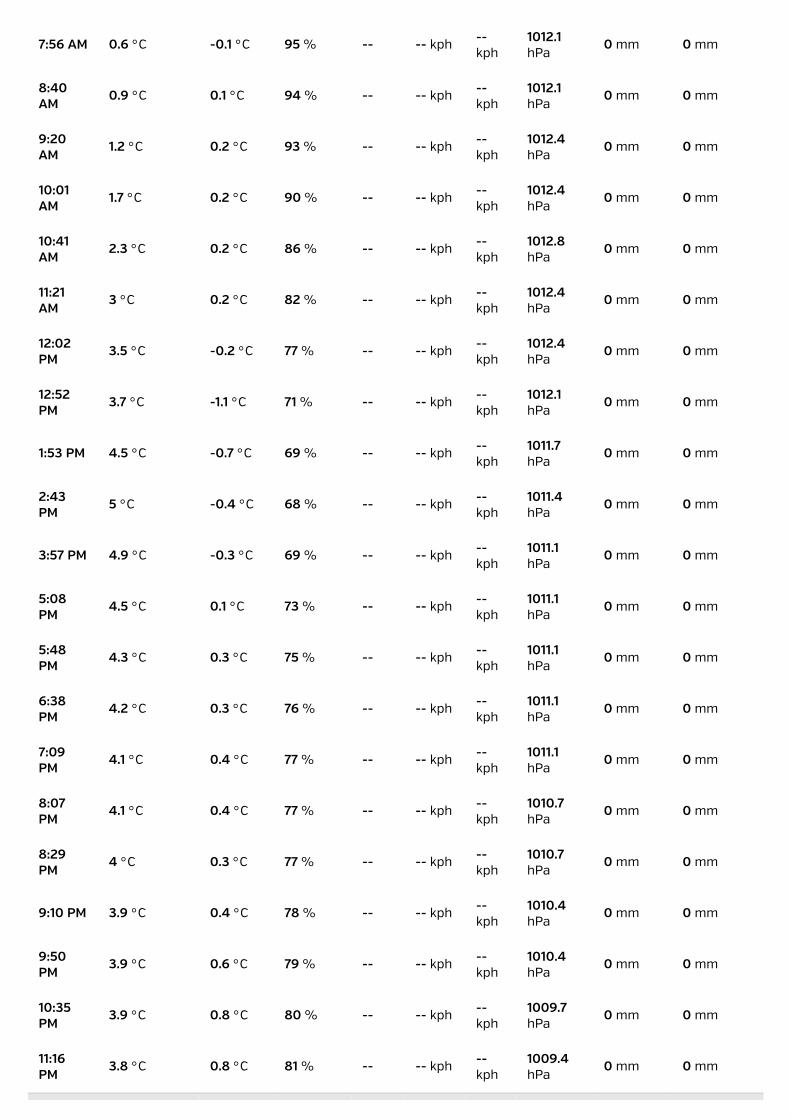
7:56 AM 0.6 °C -0.1 °C 95 % -- -- kph--kph
1012.1hPa
0 mm 0 mm
8:40AM
0.9 °C 0.1 °C 94 % -- -- kph--kph
1012.1hPa
0 mm 0 mm
9:20AM
1.2 °C 0.2 °C 93 % -- -- kph--kph
1012.4hPa
0 mm 0 mm
10:01AM
1.7 °C 0.2 °C 90 % -- -- kph--kph
1012.4hPa
0 mm 0 mm
10:41AM
2.3 °C 0.2 °C 86 % -- -- kph--kph
1012.8hPa
0 mm 0 mm
11:21AM
3 °C 0.2 °C 82 % -- -- kph--kph
1012.4hPa
0 mm 0 mm
12:02PM
3.5 °C -0.2 °C 77 % -- -- kph--kph
1012.4hPa
0 mm 0 mm
12:52PM
3.7 °C -1.1 °C 71 % -- -- kph--kph
1012.1hPa
0 mm 0 mm
1:53 PM 4.5 °C -0.7 °C 69 % -- -- kph--kph
1011.7hPa
0 mm 0 mm
2:43PM
5 °C -0.4 °C 68 % -- -- kph--kph
1011.4hPa
0 mm 0 mm
3:57 PM 4.9 °C -0.3 °C 69 % -- -- kph--kph
1011.1hPa
0 mm 0 mm
5:08PM
4.5 °C 0.1 °C 73 % -- -- kph--kph
1011.1hPa
0 mm 0 mm
5:48PM
4.3 °C 0.3 °C 75 % -- -- kph--kph
1011.1hPa
0 mm 0 mm
6:38PM
4.2 °C 0.3 °C 76 % -- -- kph--kph
1011.1hPa
0 mm 0 mm
7:09PM
4.1 °C 0.4 °C 77 % -- -- kph--kph
1011.1hPa
0 mm 0 mm
8:07PM
4.1 °C 0.4 °C 77 % -- -- kph--kph
1010.7hPa
0 mm 0 mm
8:29PM
4 °C 0.3 °C 77 % -- -- kph--kph
1010.7hPa
0 mm 0 mm
9:10 PM 3.9 °C 0.4 °C 78 % -- -- kph--kph
1010.4hPa
0 mm 0 mm
9:50PM
3.9 °C 0.6 °C 79 % -- -- kph--kph
1010.4hPa
0 mm 0 mm
10:35PM
3.9 °C 0.8 °C 80 % -- -- kph--kph
1009.7hPa
0 mm 0 mm
11:16PM
3.8 °C 0.8 °C 81 % -- -- kph--kph
1009.4hPa
0 mm 0 mm
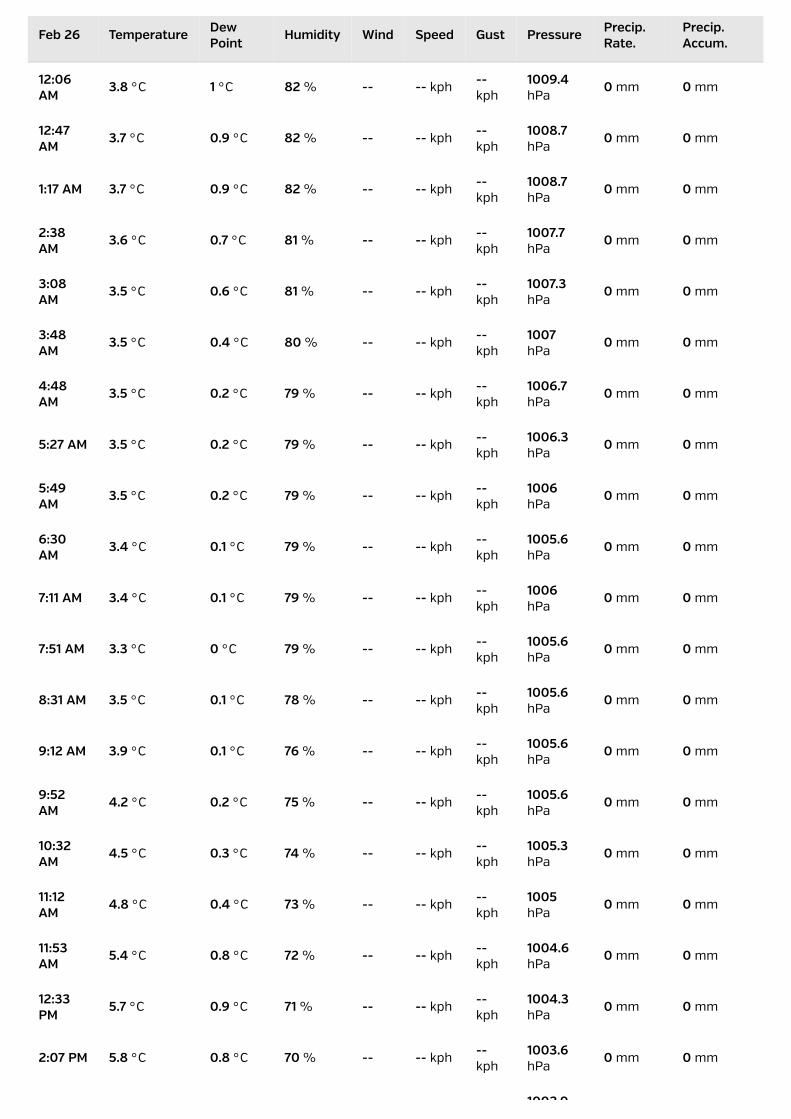
Feb 26 Temperature DewPoint
Humidity Wind Speed Gust Pressure Precip.Rate.
Precip.Accum.
12:06AM
3.8 °C 1 °C 82 % -- -- kph--kph
1009.4hPa
0 mm 0 mm
12:47AM
3.7 °C 0.9 °C 82 % -- -- kph--kph
1008.7hPa
0 mm 0 mm
1:17 AM 3.7 °C 0.9 °C 82 % -- -- kph--kph
1008.7hPa
0 mm 0 mm
2:38AM
3.6 °C 0.7 °C 81 % -- -- kph--kph
1007.7hPa
0 mm 0 mm
3:08AM
3.5 °C 0.6 °C 81 % -- -- kph--kph
1007.3hPa
0 mm 0 mm
3:48AM
3.5 °C 0.4 °C 80 % -- -- kph--kph
1007hPa
0 mm 0 mm
4:48AM
3.5 °C 0.2 °C 79 % -- -- kph--kph
1006.7hPa
0 mm 0 mm
5:27 AM 3.5 °C 0.2 °C 79 % -- -- kph--kph
1006.3hPa
0 mm 0 mm
5:49AM
3.5 °C 0.2 °C 79 % -- -- kph--kph
1006hPa
0 mm 0 mm
6:30AM
3.4 °C 0.1 °C 79 % -- -- kph--kph
1005.6hPa
0 mm 0 mm
7:11 AM 3.4 °C 0.1 °C 79 % -- -- kph--kph
1006hPa
0 mm 0 mm
7:51 AM 3.3 °C 0 °C 79 % -- -- kph--kph
1005.6hPa
0 mm 0 mm
8:31 AM 3.5 °C 0.1 °C 78 % -- -- kph--kph
1005.6hPa
0 mm 0 mm
9:12 AM 3.9 °C 0.1 °C 76 % -- -- kph--kph
1005.6hPa
0 mm 0 mm
9:52AM
4.2 °C 0.2 °C 75 % -- -- kph--kph
1005.6hPa
0 mm 0 mm
10:32AM
4.5 °C 0.3 °C 74 % -- -- kph--kph
1005.3hPa
0 mm 0 mm
11:12AM
4.8 °C 0.4 °C 73 % -- -- kph--kph
1005hPa
0 mm 0 mm
11:53AM
5.4 °C 0.8 °C 72 % -- -- kph--kph
1004.6hPa
0 mm 0 mm
12:33PM
5.7 °C 0.9 °C 71 % -- -- kph--kph
1004.3hPa
0 mm 0 mm
2:07 PM 5.8 °C 0.8 °C 70 % -- -- kph--kph
1003.6hPa
0 mm 0 mm
-- 1002.9
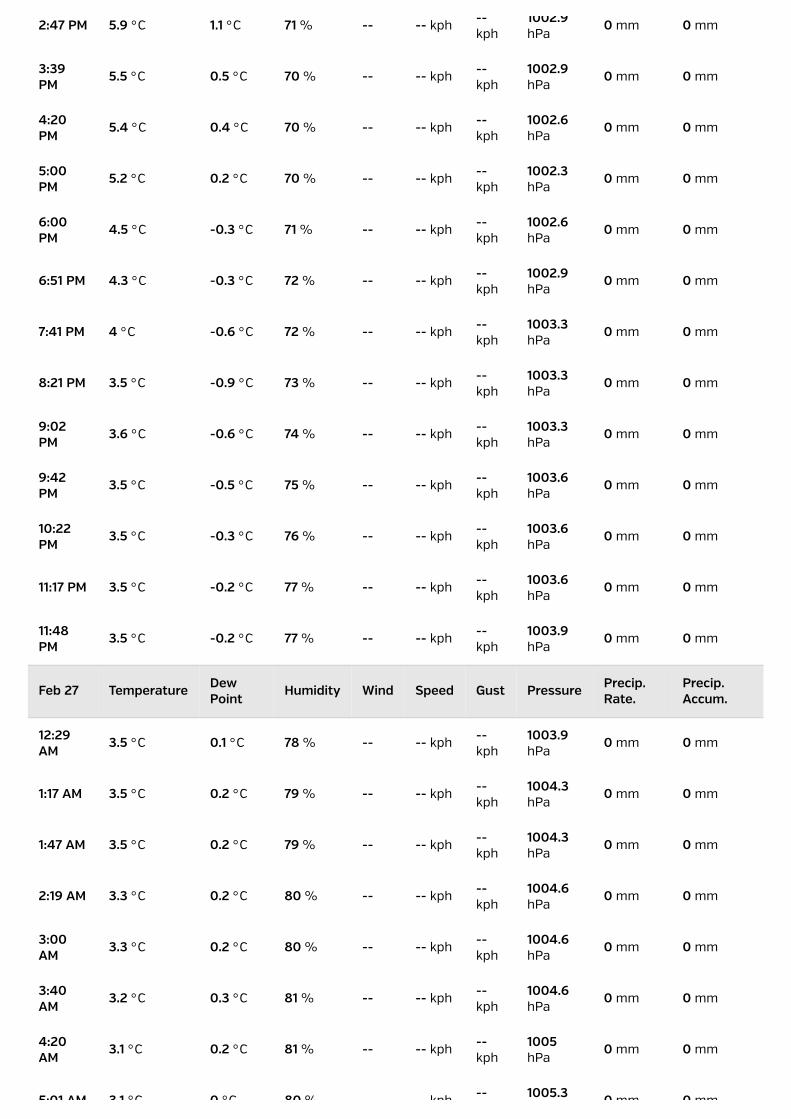
2:47 PM 5.9 °C 1.1 °C 71 % -- -- kph--kph
1002.9hPa
0 mm 0 mm
3:39PM
5.5 °C 0.5 °C 70 % -- -- kph--kph
1002.9hPa
0 mm 0 mm
4:20PM
5.4 °C 0.4 °C 70 % -- -- kph--kph
1002.6hPa
0 mm 0 mm
5:00PM
5.2 °C 0.2 °C 70 % -- -- kph--kph
1002.3hPa
0 mm 0 mm
6:00PM
4.5 °C -0.3 °C 71 % -- -- kph--kph
1002.6hPa
0 mm 0 mm
6:51 PM 4.3 °C -0.3 °C 72 % -- -- kph--kph
1002.9hPa
0 mm 0 mm
7:41 PM 4 °C -0.6 °C 72 % -- -- kph--kph
1003.3hPa
0 mm 0 mm
8:21 PM 3.5 °C -0.9 °C 73 % -- -- kph--kph
1003.3hPa
0 mm 0 mm
9:02PM
3.6 °C -0.6 °C 74 % -- -- kph--kph
1003.3hPa
0 mm 0 mm
9:42PM
3.5 °C -0.5 °C 75 % -- -- kph--kph
1003.6hPa
0 mm 0 mm
10:22PM
3.5 °C -0.3 °C 76 % -- -- kph--kph
1003.6hPa
0 mm 0 mm
11:17 PM 3.5 °C -0.2 °C 77 % -- -- kph--kph
1003.6hPa
0 mm 0 mm
11:48PM
3.5 °C -0.2 °C 77 % -- -- kph--kph
1003.9hPa
0 mm 0 mm
Feb 27 Temperature DewPoint
Humidity Wind Speed Gust Pressure Precip.Rate.
Precip.Accum.
12:29AM
3.5 °C 0.1 °C 78 % -- -- kph--kph
1003.9hPa
0 mm 0 mm
1:17 AM 3.5 °C 0.2 °C 79 % -- -- kph--kph
1004.3hPa
0 mm 0 mm
1:47 AM 3.5 °C 0.2 °C 79 % -- -- kph--kph
1004.3hPa
0 mm 0 mm
2:19 AM 3.3 °C 0.2 °C 80 % -- -- kph--kph
1004.6hPa
0 mm 0 mm
3:00AM
3.3 °C 0.2 °C 80 % -- -- kph--kph
1004.6hPa
0 mm 0 mm
3:40AM
3.2 °C 0.3 °C 81 % -- -- kph--kph
1004.6hPa
0 mm 0 mm
4:20AM
3.1 °C 0.2 °C 81 % -- -- kph--kph
1005hPa
0 mm 0 mm
5:01 AM 3.1 °C 0 °C 80 % -- -- kph-- 1005.3 0 mm 0 mm

5:01 AM 3.1 °C 0 °C 80 % -- -- kph--kph
1005.3hPa
0 mm 0 mm
5:43AM
2.8 °C -0.3 °C 80 % -- -- kph--kph
1005.6hPa
0 mm 0 mm
6:47AM
2.2 °C -0.6 °C 82 % -- -- kph--kph
1006.3hPa
0 mm 0 mm
7:09AM
2 °C -0.6 °C 83 % -- -- kph--kph
1006.7hPa
0 mm 0 mm
8:00AM
2.1 °C -0.5 °C 83 % -- -- kph--kph
1007hPa
0 mm 0 mm
8:40AM
2.6 °C 0 °C 83 % -- -- kph--kph
1008hPa
0 mm 0 mm
10:31AM
3.8 °C 1 °C 82 % -- -- kph--kph
1008.7hPa
0 mm 0 mm
11:11 AM 4.6 °C 1.6 °C 81 % -- -- kph--kph
1008.7hPa
0 mm 0 mm
11:51AM
5 °C 1.7 °C 79 % -- -- kph--kph
1009hPa
0 mm 0 mm
12:42PM
5.8 °C 1.9 °C 76 % -- -- kph--kph
1009hPa
0 mm 0 mm
1:22 PM 6.2 °C 1.9 °C 74 % -- -- kph--kph
1009hPa
0 mm 0 mm
2:02PM
6.4 °C 2.1 °C 74 % -- -- kph--kph
1009hPa
0 mm 0 mm
2:43PM
6.6 °C 2.1 °C 73 % -- -- kph--kph
1009.4hPa
0 mm 0 mm
3:23PM
6.2 °C 1.6 °C 72 % -- -- kph--kph
1009.4hPa
0 mm 0 mm
4:14 PM 5.6 °C 1.6 °C 75 % -- -- kph--kph
1010 hPa 0 mm 0 mm
5:04PM
5.3 °C 1.4 °C 76 % -- -- kph--kph
1010.4hPa
0 mm 0 mm
5:44PM
5 °C 1.5 °C 78 % -- -- kph--kph
1010.7hPa
0 mm 0 mm
6:45PM
4.6 °C 1.6 °C 81 % -- -- kph--kph
1011.7hPa
0 mm 0 mm
7:25 PM 4.4 °C 1.6 °C 82 % -- -- kph--kph
1012.1hPa
0 mm 0 mm
8:06PM
4 °C 1.4 °C 83 % -- -- kph--kph
1012.4hPa
0 mm 0 mm
8:46PM
4 °C 1.6 °C 84 % -- -- kph--kph
1012.8hPa
0 mm 0 mm
9:26PM
4.2 °C 1.6 °C 83 % -- -- kph--kph
1013.4hPa
0 mm 0 mm
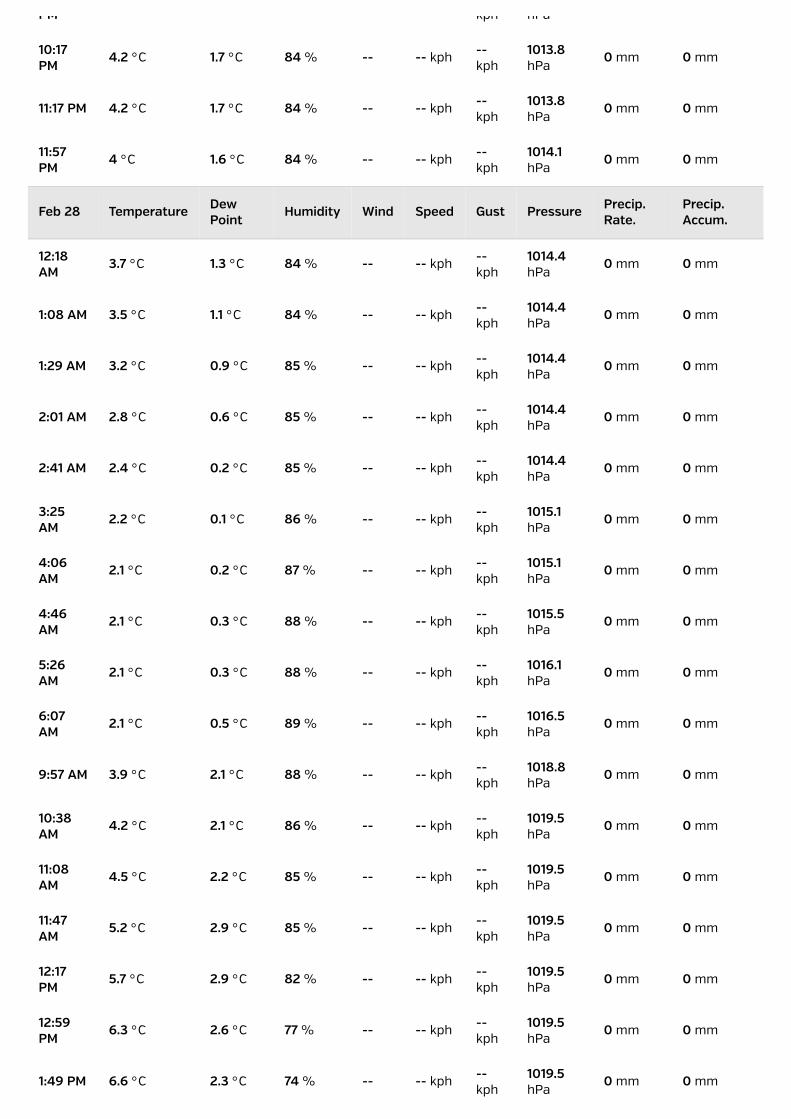
PM kph hPa
10:17PM
4.2 °C 1.7 °C 84 % -- -- kph--kph
1013.8hPa
0 mm 0 mm
11:17 PM 4.2 °C 1.7 °C 84 % -- -- kph--kph
1013.8hPa
0 mm 0 mm
11:57PM
4 °C 1.6 °C 84 % -- -- kph--kph
1014.1hPa
0 mm 0 mm
Feb 28 Temperature DewPoint
Humidity Wind Speed Gust Pressure Precip.Rate.
Precip.Accum.
12:18AM
3.7 °C 1.3 °C 84 % -- -- kph--kph
1014.4hPa
0 mm 0 mm
1:08 AM 3.5 °C 1.1 °C 84 % -- -- kph--kph
1014.4hPa
0 mm 0 mm
1:29 AM 3.2 °C 0.9 °C 85 % -- -- kph--kph
1014.4hPa
0 mm 0 mm
2:01 AM 2.8 °C 0.6 °C 85 % -- -- kph--kph
1014.4hPa
0 mm 0 mm
2:41 AM 2.4 °C 0.2 °C 85 % -- -- kph--kph
1014.4hPa
0 mm 0 mm
3:25AM
2.2 °C 0.1 °C 86 % -- -- kph--kph
1015.1hPa
0 mm 0 mm
4:06AM
2.1 °C 0.2 °C 87 % -- -- kph--kph
1015.1hPa
0 mm 0 mm
4:46AM
2.1 °C 0.3 °C 88 % -- -- kph--kph
1015.5hPa
0 mm 0 mm
5:26AM
2.1 °C 0.3 °C 88 % -- -- kph--kph
1016.1hPa
0 mm 0 mm
6:07AM
2.1 °C 0.5 °C 89 % -- -- kph--kph
1016.5hPa
0 mm 0 mm
9:57 AM 3.9 °C 2.1 °C 88 % -- -- kph--kph
1018.8hPa
0 mm 0 mm
10:38AM
4.2 °C 2.1 °C 86 % -- -- kph--kph
1019.5hPa
0 mm 0 mm
11:08AM
4.5 °C 2.2 °C 85 % -- -- kph--kph
1019.5hPa
0 mm 0 mm
11:47AM
5.2 °C 2.9 °C 85 % -- -- kph--kph
1019.5hPa
0 mm 0 mm
12:17PM
5.7 °C 2.9 °C 82 % -- -- kph--kph
1019.5hPa
0 mm 0 mm
12:59PM
6.3 °C 2.6 °C 77 % -- -- kph--kph
1019.5hPa
0 mm 0 mm
1:49 PM 6.6 °C 2.3 °C 74 % -- -- kph--kph
1019.5hPa
0 mm 0 mm
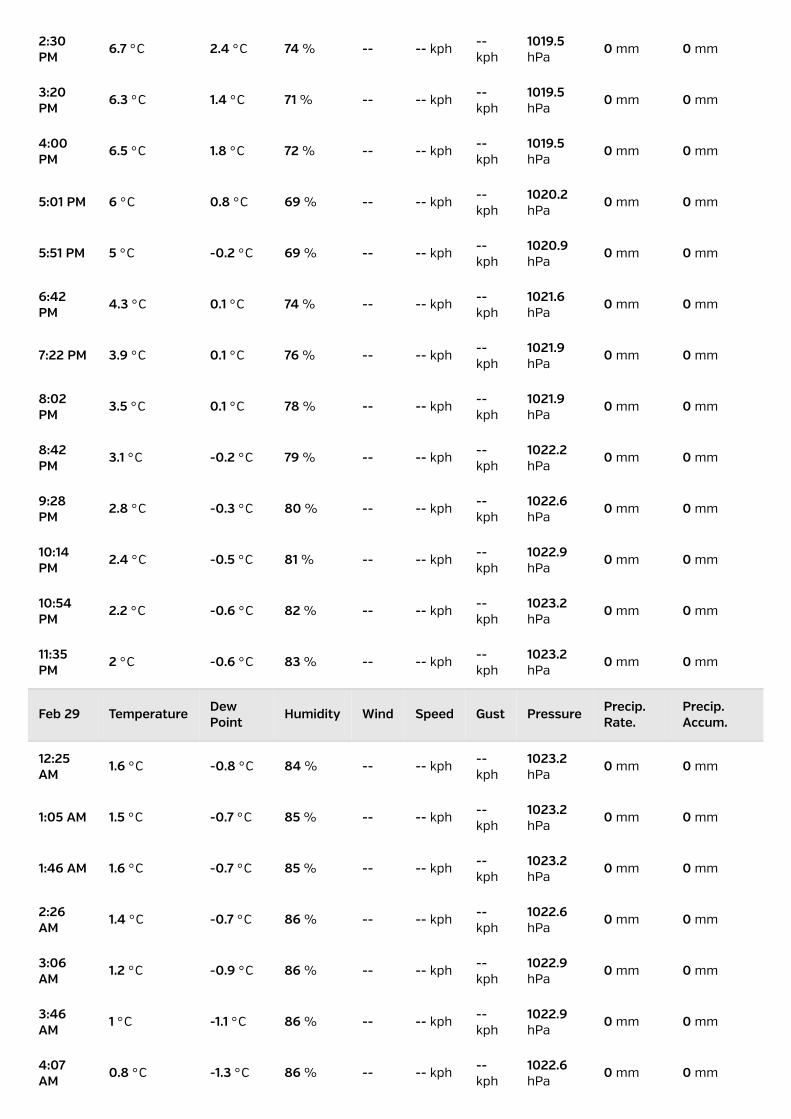
2:30PM
6.7 °C 2.4 °C 74 % -- -- kph--kph
1019.5hPa
0 mm 0 mm
3:20PM
6.3 °C 1.4 °C 71 % -- -- kph--kph
1019.5hPa
0 mm 0 mm
4:00PM
6.5 °C 1.8 °C 72 % -- -- kph--kph
1019.5hPa
0 mm 0 mm
5:01 PM 6 °C 0.8 °C 69 % -- -- kph--kph
1020.2hPa
0 mm 0 mm
5:51 PM 5 °C -0.2 °C 69 % -- -- kph--kph
1020.9hPa
0 mm 0 mm
6:42PM
4.3 °C 0.1 °C 74 % -- -- kph--kph
1021.6hPa
0 mm 0 mm
7:22 PM 3.9 °C 0.1 °C 76 % -- -- kph--kph
1021.9hPa
0 mm 0 mm
8:02PM
3.5 °C 0.1 °C 78 % -- -- kph--kph
1021.9hPa
0 mm 0 mm
8:42PM
3.1 °C -0.2 °C 79 % -- -- kph--kph
1022.2hPa
0 mm 0 mm
9:28PM
2.8 °C -0.3 °C 80 % -- -- kph--kph
1022.6hPa
0 mm 0 mm
10:14PM
2.4 °C -0.5 °C 81 % -- -- kph--kph
1022.9hPa
0 mm 0 mm
10:54PM
2.2 °C -0.6 °C 82 % -- -- kph--kph
1023.2hPa
0 mm 0 mm
11:35PM
2 °C -0.6 °C 83 % -- -- kph--kph
1023.2hPa
0 mm 0 mm
Feb 29 Temperature DewPoint
Humidity Wind Speed Gust Pressure Precip.Rate.
Precip.Accum.
12:25AM
1.6 °C -0.8 °C 84 % -- -- kph--kph
1023.2hPa
0 mm 0 mm
1:05 AM 1.5 °C -0.7 °C 85 % -- -- kph--kph
1023.2hPa
0 mm 0 mm
1:46 AM 1.6 °C -0.7 °C 85 % -- -- kph--kph
1023.2hPa
0 mm 0 mm
2:26AM
1.4 °C -0.7 °C 86 % -- -- kph--kph
1022.6hPa
0 mm 0 mm
3:06AM
1.2 °C -0.9 °C 86 % -- -- kph--kph
1022.9hPa
0 mm 0 mm
3:46AM
1 °C -1.1 °C 86 % -- -- kph--kph
1022.9hPa
0 mm 0 mm
4:07AM
0.8 °C -1.3 °C 86 % -- -- kph--kph
1022.6hPa
0 mm 0 mm
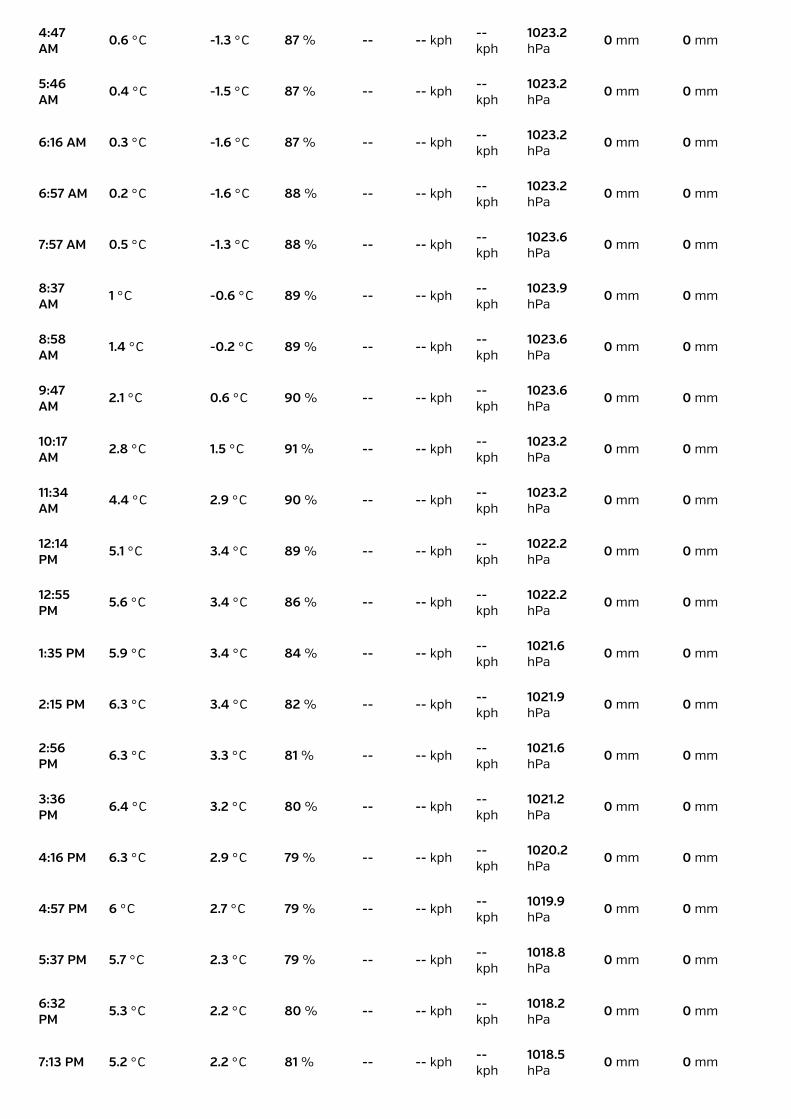
4:47AM
0.6 °C -1.3 °C 87 % -- -- kph--kph
1023.2hPa
0 mm 0 mm
5:46AM
0.4 °C -1.5 °C 87 % -- -- kph--kph
1023.2hPa
0 mm 0 mm
6:16 AM 0.3 °C -1.6 °C 87 % -- -- kph--kph
1023.2hPa
0 mm 0 mm
6:57 AM 0.2 °C -1.6 °C 88 % -- -- kph--kph
1023.2hPa
0 mm 0 mm
7:57 AM 0.5 °C -1.3 °C 88 % -- -- kph--kph
1023.6hPa
0 mm 0 mm
8:37AM
1 °C -0.6 °C 89 % -- -- kph--kph
1023.9hPa
0 mm 0 mm
8:58AM
1.4 °C -0.2 °C 89 % -- -- kph--kph
1023.6hPa
0 mm 0 mm
9:47AM
2.1 °C 0.6 °C 90 % -- -- kph--kph
1023.6hPa
0 mm 0 mm
10:17AM
2.8 °C 1.5 °C 91 % -- -- kph--kph
1023.2hPa
0 mm 0 mm
11:34AM
4.4 °C 2.9 °C 90 % -- -- kph--kph
1023.2hPa
0 mm 0 mm
12:14PM
5.1 °C 3.4 °C 89 % -- -- kph--kph
1022.2hPa
0 mm 0 mm
12:55PM
5.6 °C 3.4 °C 86 % -- -- kph--kph
1022.2hPa
0 mm 0 mm
1:35 PM 5.9 °C 3.4 °C 84 % -- -- kph--kph
1021.6hPa
0 mm 0 mm
2:15 PM 6.3 °C 3.4 °C 82 % -- -- kph--kph
1021.9hPa
0 mm 0 mm
2:56PM
6.3 °C 3.3 °C 81 % -- -- kph--kph
1021.6hPa
0 mm 0 mm
3:36PM
6.4 °C 3.2 °C 80 % -- -- kph--kph
1021.2hPa
0 mm 0 mm
4:16 PM 6.3 °C 2.9 °C 79 % -- -- kph--kph
1020.2hPa
0 mm 0 mm
4:57 PM 6 °C 2.7 °C 79 % -- -- kph--kph
1019.9hPa
0 mm 0 mm
5:37 PM 5.7 °C 2.3 °C 79 % -- -- kph--kph
1018.8hPa
0 mm 0 mm
6:32PM
5.3 °C 2.2 °C 80 % -- -- kph--kph
1018.2hPa
0 mm 0 mm
7:13 PM 5.2 °C 2.2 °C 81 % -- -- kph--kph
1018.5hPa
0 mm 0 mm
-- 1017.8
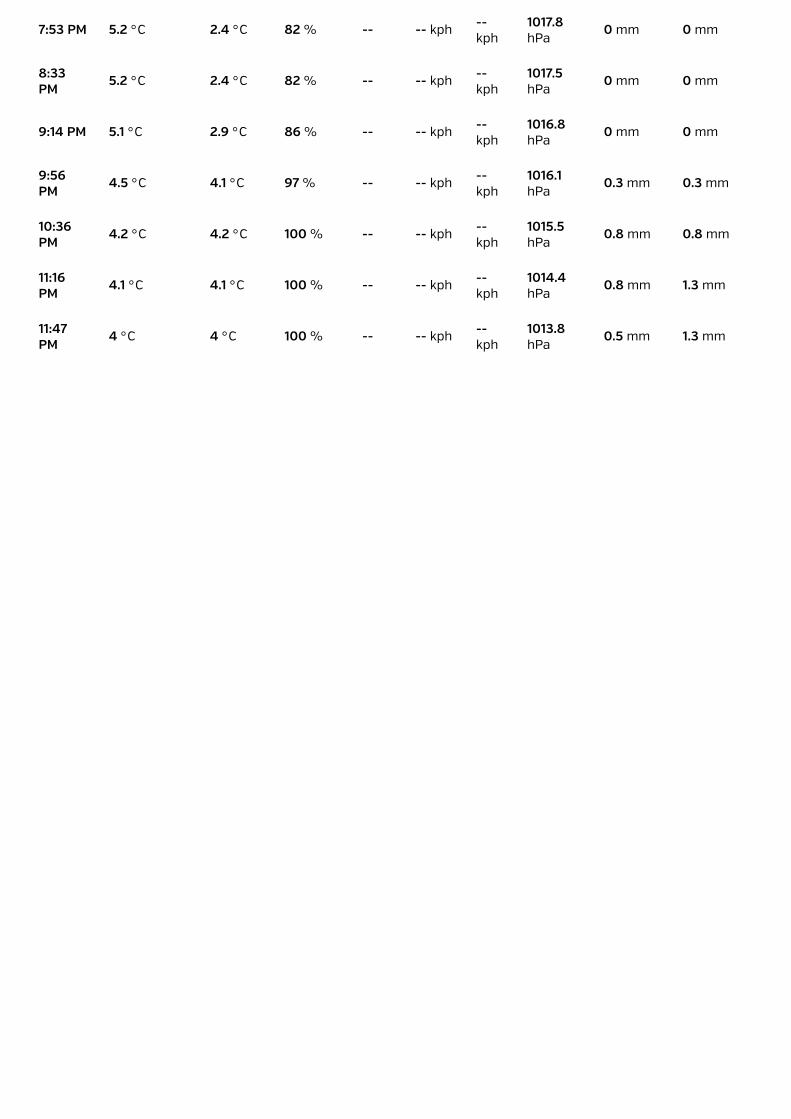
7:53 PM 5.2 °C 2.4 °C 82 % -- -- kph--kph
1017.8hPa
0 mm 0 mm
8:33PM
5.2 °C 2.4 °C 82 % -- -- kph--kph
1017.5hPa
0 mm 0 mm
9:14 PM 5.1 °C 2.9 °C 86 % -- -- kph--kph
1016.8hPa
0 mm 0 mm
9:56PM
4.5 °C 4.1 °C 97 % -- -- kph--kph
1016.1hPa
0.3 mm 0.3 mm
10:36PM
4.2 °C 4.2 °C 100 % -- -- kph--kph
1015.5hPa
0.8 mm 0.8 mm
11:16PM
4.1 °C 4.1 °C 100 % -- -- kph--kph
1014.4hPa
0.8 mm 1.3 mm
11:47PM
4 °C 4 °C 100 % -- -- kph--kph
1013.8hPa
0.5 mm 1.3 mm

T16512
Brailsford PC
A52 Speed Survey (Western Site)
(Weekday 10am-12pm/2pm-4pm)
Speed Limit 50mph (at Commonside)
Direction Volume Speed Total Direction Volume Speed Total
Westbound 299 50.0 14950.0 Eastbound 314 51.0 16014.0
308 52.0 16016.0 310 51.0 15810.0
330 52.0 17160.0 396 50.0 19800.0
369 52.0 19188.0 360 50.0 18000.0
343 51.0 17493.0 350 52.0 18200.0
329 51.0 16779.0 353 50.2 17720.6
347 52.0 18044.0 370 50.0 18500.0
361 53.0 19133.0 398 51.0 20298.0
351 51.0 17901.0 344 50.0 17200.0
286 51.0 14586.0 341 50.0 17050.0
324 52.0 16848.0 356 50.0 17800.0
342 52.0 17784.0 319 51.0 16269.0
Total 3989 205882.0 Total 4211 212661.6
(Note: Thursday 25/02 and Friday 26/02 data not used due to apparent errors in speed data from 10am on 25/02 through to 7pm on 26/02, when speeds were significantly lower)
Weighted 85th Percentile Speed = 51.6 Weighted 85th Percentile Speed = 50.5
Wet Weather Reduction 2.5 Wet Weather Reduction 2.5
Wet Weather 85th Percentile Speed = 49.1 Wet Weather 85th Percentile Speed = 48.0
7-day - Westbound 7-day - Eastbound
Weighted 85th Percentile Speed = 52.0 Weighted 85th Percentile Speed = 52.0
Wet Weather Reduction 2.5 Wet Weather Reduction 2.5
Wet Weather 85th Percentile Speed = 49.5 Wet Weather 85th Percentile Speed = 49.5
Average Weekday Westbound Speeds are c. 45mph Average Weekday Eastbound Speeds are c. 44.5mph
(Wet Weather 24 hours) (Wet Weather 24 hours)
ALL SPEEDS SHOWN ARE MPH

T16512
Brailsford PC
A52 Speed Survey (Middle Site)
(Weekday 10am-12pm/2pm-4pm)
Speed Limit
Direction Volume Speed Total Direction Volume Speed Total
Westbound 303 42.0 12726.0 Eastbound 312 43.0 13416.0
305 41.0 12505.0 311 42.0 13062.0
333 43.0 14319.0 378 40.0 15120.0
381 44.0 16764.0 365 40.4 14746.0
359 43.0 15437.0 346 40.0 13840.0
345 43.0 14835.0 316 40.0 12640.0
349 43.0 15007.0 353 40.0 14120.0
356 45.0 16020.0 394 40.0 15760.0
339 45.0 15255.0 318 40.0 12720.0
377 43.0 16211.0 352 39.0 13728.0
373 43.0 16039.0 350 39.0 13650.0
410 44.0 18040.0 399 36.0 14364.0
306 43.0 13158.0 367 37.0 13579.0
366 43.0 15738.0 322 37.0 11914.0
394 44.0 17336.0 418 35.0 14630.0
487 43.0 20941.0 404 38.0 15352.0
341 43.0 14663.0 344 40.0 13760.0
293 43.0 12599.0 336 40.0 13440.0
311 43.0 13373.0 358 39.0 13962.0
348 44.0 15312.0 312 41.4 12916.8
Total 7076 306278.0 Total 7055 276719.8
Weighted 85th Percentile Speed = 43.3 Weighted 85th Percentile Speed = 39.2
Wet Weather Reduction 2.5 Wet Weather Reduction 2.5
Wet Weather 85th Percentile Speed = 40.8 Wet Weather 85th Percentile Speed = 36.7
7-day - Westbound 7-day - Eastbound
Weighted 85th Percentile Speed = 45.0 Weighted 85th Percentile Speed = 42.0
Wet Weather Reduction 2.5 Wet Weather Reduction 2.5
Wet Weather 85th Percentile Speed = 42.5 Wet Weather 85th Percentile Speed = 39.5
Average Weekday Westbound Speeds are c. 37mph Average Weekday Eastbound Speeds are c. 32mph
(Wet Weather 24 hours) (Wet Weather 24 hours)
ALL SPEEDS SHOWN ARE MPH
30/50mph (at entry/exit to Village)
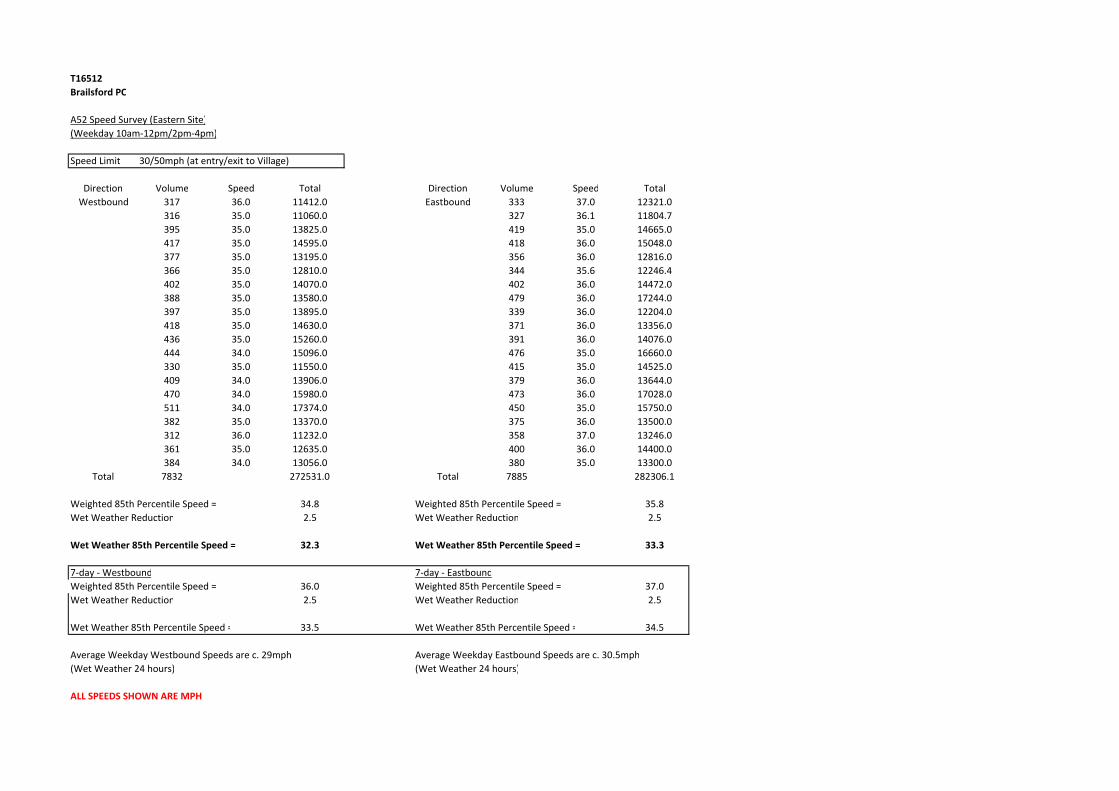
T16512
Brailsford PC
A52 Speed Survey (Eastern Site)
(Weekday 10am-12pm/2pm-4pm)
Speed Limit
Direction Volume Speed Total Direction Volume Speed Total
Westbound 317 36.0 11412.0 Eastbound 333 37.0 12321.0
316 35.0 11060.0 327 36.1 11804.7
395 35.0 13825.0 419 35.0 14665.0
417 35.0 14595.0 418 36.0 15048.0
377 35.0 13195.0 356 36.0 12816.0
366 35.0 12810.0 344 35.6 12246.4
402 35.0 14070.0 402 36.0 14472.0
388 35.0 13580.0 479 36.0 17244.0
397 35.0 13895.0 339 36.0 12204.0
418 35.0 14630.0 371 36.0 13356.0
436 35.0 15260.0 391 36.0 14076.0
444 34.0 15096.0 476 35.0 16660.0
330 35.0 11550.0 415 35.0 14525.0
409 34.0 13906.0 379 36.0 13644.0
470 34.0 15980.0 473 36.0 17028.0
511 34.0 17374.0 450 35.0 15750.0
382 35.0 13370.0 375 36.0 13500.0
312 36.0 11232.0 358 37.0 13246.0
361 35.0 12635.0 400 36.0 14400.0
384 34.0 13056.0 380 35.0 13300.0
Total 7832 272531.0 Total 7885 282306.1
Weighted 85th Percentile Speed = 34.8 Weighted 85th Percentile Speed = 35.8
Wet Weather Reduction 2.5 Wet Weather Reduction 2.5
Wet Weather 85th Percentile Speed = 32.3 Wet Weather 85th Percentile Speed = 33.3
7-day - Westbound 7-day - Eastbound
Weighted 85th Percentile Speed = 36.0 Weighted 85th Percentile Speed = 37.0
Wet Weather Reduction 2.5 Wet Weather Reduction 2.5
Wet Weather 85th Percentile Speed = 33.5 Wet Weather 85th Percentile Speed = 34.5
Average Weekday Westbound Speeds are c. 29mph Average Weekday Eastbound Speeds are c. 30.5mph
(Wet Weather 24 hours) (Wet Weather 24 hours)
ALL SPEEDS SHOWN ARE MPH
30/50mph (at entry/exit to Village)

T16512
Brailsford PC
A52 Speed Survey (Centre of Brailsford to West of Luke Lane) A52 Speed Survey (Centre of Brailsford to East of Luke Lane)
(Weekday 11am-3.30pm) (Weekday 11.30am-3.30pm)
Speed Limit 30mph Speed Limit 30mph
Direction 85th Dry Speed Wet Weather Reduction 85th Wet Speed Direction 85th Dry Speed Wet Weather Reduction 85th Wet Speed
Westbound 37.0 2.5 34.5 Westbound 37.0 2.5 34.5
Eastbound 35.0 2.5 32.5 Eastbound 35.0 2.5 32.5
Direction Average Dry Speed Wet Weather Reduction Average Wet Speed Direction Average Dry Speed Wet Weather Reduction Average Wet Speed
Westbound 33.0 2.5 30.5 Westbound 32.6 2.5 30.1
Eastbound 31.0 2.5 28.5 Eastbound 30.6 2.5 28.1
ALL SPEEDS SHOWN ARE MPH
T16512 Brailsford Parish Council
PTB Transport Planning Ltd T16512 Transport Appraisal Rev A - Email.docx
APPENDIX D - ACCIDENT DATA

DRAWING No.
DRAWN BY
DATE
SCALE
Colour coding by SEVERITY
Fatal (2)
Serious (6)
Slight (14)
Other (0)
Selected Range of Accidents between dates 01/09/2010 and 31/08/2015Selected using Manual Selection
Brailsford
01/02/2016
1 : 14170
Alison Morse
© Crown copyright and database rights Derbyshire Constabulary Licence No. 100021015 2011

TRAFFMAP INTERMEDIATE ACCIDENT REPORT Run on:01/ 02/2016
AccsMap - Accident Analysis System
(60) months
Notes:
Selected using Build Query :
Selection:
toDetails of Personal Injury Accidents for Period - 31/08/201501/09/2010
Police Ref. Location Description
Road No.
Grid Ref.
Day
Date
Time
D/L
R.S.C
Weather
Speed
Vehicles
Veh No / Type / Manv / Dir / Class
Casualties
Sex / Age / Sev
Account of
Accident
2nd Road No.
B000387/10 BRAILSFORD A52 PAINTERS LANE
800 MTRS N/W BRAILSFORD
424,839
341,829
1Veh Goods < 3.5t Going ahead SE NWto
2 38Veh Car Stopping SE NW Dri M Slightto
3Veh Car Stopping SE NWto
52R1: A
E
N
Wet/Damp
Fine without high winds
17/11/2010
0734hrs
50 mph
Wednesday
LC sk
B000338/11 BRAILSFORD A52 MAIN RD LOC N/V
425,620
341,309
1 65Veh Car Going ahead LH bend N SE Dri F Slightto
2Veh Other M/veh Going ahead RH bend SE Nto
52R1: A
E
N
Wet/Damp
Fine without high winds
Darkness: street lights present a
07/10/2011
2044hrs
30 mph
Friday
B000670/12 BRAILSFORD A52 PAINTERS LANE
AT COMMONSIDE LOC N/V
424,873
341,815
1Veh Car O/take m/veh o/side SE NW Dri M Seriousto
2 18Veh Car Going ahead NW SE Dri F Slightto
3Veh Car Going ahead SE NWto
4 45Veh Car Going ahead NW SE Dri F Slightto
52R1: A
E
N
Dry
Unknown
04/05/2012
1015hrs
50 mph
Friday
B002565/12 EDNASTON A52 PAINTERS LANE J/W
DERBY LANE
423,762
341,987
1 19Veh Car Going ahead NW SE Dri F Slightto
2 31Veh Car Wait go ahead held
up
NW SE Dri F Slightto
3 28Veh Car Wait go ahead held
up
NW SE Dri F Slightto
52R1: A
E
N
Wet/Damp
Fine without high winds
18/12/2012
0823hrs
50 mph
Tuesday
R2: C 160
B000698/13 BRAILSFORD A52 LOC N/V
425,034
341,735
1Veh Car Stopping NW SEto
2 52Veh Car Wait go ahead held
up
NW SE Dri M Slightto
2 19Veh Car Wait go ahead held
up
NW SE FSP F Slightto
2 19Veh Car Wait go ahead held
up
NW SE RSP F Slightto
52R1: A
E
N
Dry
Fine without high winds
07/04/2013
1515hrs
50 mph
Sunday
1Derbyshire ConstabularyRegistered to:

TRAFFMAP INTERMEDIATE ACCIDENT REPORT Run on:01/ 02/2016
AccsMap - Accident Analysis System
(60) months
Notes:
Selected using Build Query :
Selection:
toDetails of Personal Injury Accidents for Period - 31/08/201501/09/2010
Police Ref. Location Description
Road No.
Grid Ref.
Day
Date
Time
D/L
R.S.C
Weather
Speed
Vehicles
Veh No / Type / Manv / Dir / Class
Casualties
Sex / Age / Sev
Account of
Accident
2nd Road No.
B000670/13 BRAILSFORD A52 MAIN RD ON
BEND NR ROSE & CROWN PH
425,886
341,136
1 69Veh Car Going ahead LH bend N SE Dri F Slightto
2 22Veh Car Going ahead RH bend SE N Dri M Seriousto
2 23Veh Car Going ahead RH bend SE N FSP F Seriousto
52R1: A
E
N
Dry
Fine without high winds
21/04/2013
1547hrs
30 mph
Sunday
B000714/13 BRAILSFORD A52 MAIN RD J/W
ROSE & CROWN PH CAR PARK
425,872
341,144
1Veh Car Going ahead S Nto
2 24Veh Car Wait go ahead held
up
S N Dri F Slightto
3Veh Car Wait to turn right S Nto
52R1: A
E
N
Dry
Fine without high winds
28/04/2013
1430hrs
30 mph
Sunday
R2: U
0000513/13 Brailsford A52 Main Road
425,584
341,344
1 28Veh Car Stopping NW SE Dri M Slightto
1 55Veh Car Stopping NW SE FSP M Slightto
2Veh Other M/veh Parked 0 0to
52R1: A
E
N
Wet/Damp
Raining without high winds
28/05/2013
1356hrs
30 mph
Tuesday
0001386/13 Brailsford A52 Painters Lane at j/w UC,
Mill Lane
424,362
341,887
1Veh Car Going ahead E Wto
2 40Veh Car Wait to turn right E N FSP F Slightto
52R1: A
E
N
Dry
Unknown
07/07/2013
1030hrs
50 mph
Sunday
R2: U
0001730/13 SHIRLEY Common A52 PAINTERS
LANE at j/w C160, DERBY LANE
423,767
341,985
2Veh Car O/take m/veh o/side NW SEto
3Veh Goods > 7.5t Change lane to left NW Eto
1 34Veh Car Wait to turn right NW SW Dri F Slightto
52R1: A
E
N
Dry
Fine without high winds
03/08/2013
0827hrs
50 mph
Saturday
R2: C 160
2Derbyshire ConstabularyRegistered to:
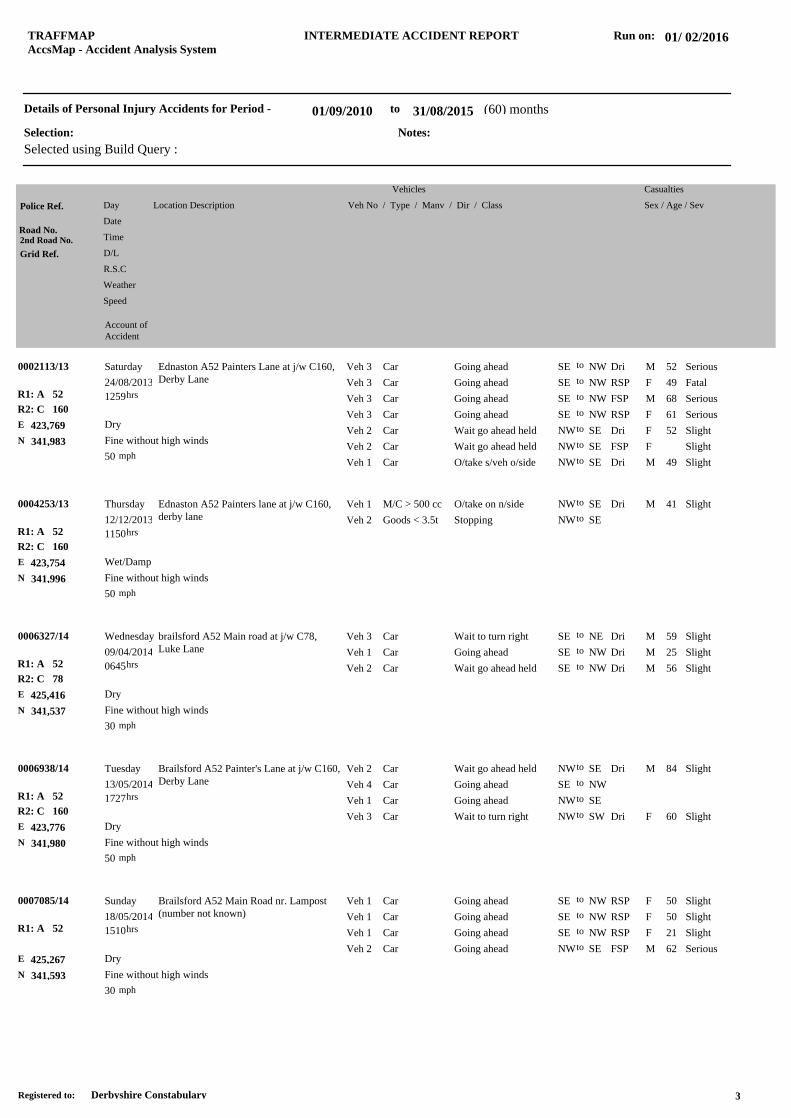
TRAFFMAP INTERMEDIATE ACCIDENT REPORT Run on:01/ 02/2016
AccsMap - Accident Analysis System
(60) months
Notes:
Selected using Build Query :
Selection:
toDetails of Personal Injury Accidents for Period - 31/08/201501/09/2010
Police Ref. Location Description
Road No.
Grid Ref.
Day
Date
Time
D/L
R.S.C
Weather
Speed
Vehicles
Veh No / Type / Manv / Dir / Class
Casualties
Sex / Age / Sev
Account of
Accident
2nd Road No.
0002113/13 Ednaston A52 Painters Lane at j/w C160,
Derby Lane
423,769
341,983
3 52Veh Car Going ahead SE NW Dri M Seriousto
3 49Veh Car Going ahead SE NW RSP F Fatalto
3 68Veh Car Going ahead SE NW FSP M Seriousto
3 61Veh Car Going ahead SE NW RSP F Seriousto
2 52Veh Car Wait go ahead held
up
NW SE Dri F Slightto
2Veh Car Wait go ahead held
up
NW SE FSP F Slightto
1 49Veh Car O/take s/veh o/side NW SE Dri M Slightto
52R1: A
E
N
Dry
Fine without high winds
24/08/2013
1259hrs
50 mph
Saturday
R2: C 160
0004253/13 Ednaston A52 Painters lane at j/w C160,
derby lane
423,754
341,996
1 41Veh M/C > 500 cc O/take on n/side NW SE Dri M Slightto
2Veh Goods < 3.5t Stopping NW SEto
52R1: A
E
N
Wet/Damp
Fine without high winds
12/12/2013
1150hrs
50 mph
Thursday
R2: C 160
0006327/14 brailsford A52 Main road at j/w C78,
Luke Lane
425,416
341,537
3 59Veh Car Wait to turn right SE NE Dri M Slightto
1 25Veh Car Going ahead SE NW Dri M Slightto
2 56Veh Car Wait go ahead held
up
SE NW Dri M Slightto
52R1: A
E
N
Dry
Fine without high winds
09/04/2014
0645hrs
30 mph
Wednesday
R2: C 78
0006938/14 Brailsford A52 Painter's Lane at j/w C160,
Derby Lane
423,776
341,980
2 84Veh Car Wait go ahead held
up
NW SE Dri M Slightto
4Veh Car Going ahead SE NWto
1Veh Car Going ahead NW SEto
3 60Veh Car Wait to turn right NW SW Dri F Slightto
52R1: A
E
N
Dry
Fine without high winds
13/05/2014
1727hrs
50 mph
Tuesday
R2: C 160
0007085/14 Brailsford A52 Main Road nr. Lampost
(number not known)
425,267
341,593
1 50Veh Car Going ahead SE NW RSP F Slightto
1 50Veh Car Going ahead SE NW RSP F Slightto
1 21Veh Car Going ahead SE NW RSP F Slightto
2 62Veh Car Going ahead NW SE FSP M Seriousto
52R1: A
E
N
Dry
Fine without high winds
18/05/2014
1510hrs
30 mph
Sunday
3Derbyshire ConstabularyRegistered to:

TRAFFMAP INTERMEDIATE ACCIDENT REPORT Run on:01/ 02/2016
AccsMap - Accident Analysis System
(60) months
Notes:
Selected using Build Query :
Selection:
toDetails of Personal Injury Accidents for Period - 31/08/201501/09/2010
Police Ref. Location Description
Road No.
Grid Ref.
Day
Date
Time
D/L
R.S.C
Weather
Speed
Vehicles
Veh No / Type / Manv / Dir / Class
Casualties
Sex / Age / Sev
Account of
Accident
2nd Road No.
0007364/14 Brailsford A52 Painters Lane
424,504
341,902
2 44Veh Pedal cycle Going ahead W E Dri M Seriousto
1Veh Car Going ahead W Eto
52R1: A
E
N
Dry
Fine without high winds
Darkness: no street lighting
05/06/2014
2215hrs
50 mph
Thursday
0010127/14 Ednaston A52 Painter's Lane at j/w C160,
Derby Lane
423,777
341,980
2Veh Car Turning right NW SWto
1 24Veh Car Going ahead NW SE Dri M Slightto
52R1: A
E
N
Dry
Fine without high winds
Darkness: no street lighting
30/10/2014
1756hrs
50 mph
Thursday
R2: C 160
0011474/15 BRAILSFORD A52
425,562
341,376
1 70Veh Car Going ahead SE NW Ped F Seriousto
52R1: A
E
N
Dry
Fine without high winds
Darkness: street lights present a
02/01/2015
1627hrs
30 mph
Friday
0012602/15 brailsford A52 Painters Lane at j/w C160,
derby lane
423,774
341,981
2 19Veh Car Going ahead SE NW Dri F Slightto
1 80Veh Car Turning right SW SE Dri M Seriousto
52R1: A
E
N
Dry
Fine without high winds
04/03/2015
1742hrs
50 mph
Wednesday
R2: C 160
0013801/15 Ednaston C160 Derby Lane
423,640
341,925
2Veh Car Going ahead RH bend E NWto
1 41Veh Car Going ahead LH bend NW E Dri F Slightto
160R1: C
E
N
Dry
Fine without high winds
12/05/2015
1841hrs
60 mph
Tuesday
4Derbyshire ConstabularyRegistered to:

TRAFFMAP INTERMEDIATE ACCIDENT REPORT Run on:01/ 02/2016
AccsMap - Accident Analysis System
(60) months
Notes:
Selected using Build Query :
Selection:
toDetails of Personal Injury Accidents for Period - 31/08/201501/09/2010
Police Ref. Location Description
Road No.
Grid Ref.
Day
Date
Time
D/L
R.S.C
Weather
Speed
Vehicles
Veh No / Type / Manv / Dir / Class
Casualties
Sex / Age / Sev
Account of
Accident
2nd Road No.
0013978/15 Brailsford C78 Luke Lane
425,462
341,793
1Veh Car U turn S S Ped F Slightto
78R1: C
E
N
Dry
Fine without high winds
21/05/2015
1150hrs
30 mph
Thursday
0015274/15 BRAILSFORD A52 PAINTERS LANE
424,604
341,907
1 19Veh Car Going ahead LH bend SE W Dri M Fatalto
52R1: A
E
N
Dry
Fine without high winds
09/08/2015
0610hrs
50 mph
Sunday
5Derbyshire ConstabularyRegistered to:

T16512 Brailsford Parish Council
PTB Transport Planning Ltd T16512 Transport Appraisal Rev A - Email.docx
APPENDIX E - JUNCTIONS 8 OUTPUT – PICADY MODELLING

Filename: T16512 Luke Lane.arc8 Path: G:\General\Projects\T16512 Brailsford PC\Junction Assessments\Picady Report generation date: 26/04/2016 15:10:29
» Existing Situation - 2016 Base, AM » Existing Situation - 2016 Base, PM » Existing Situation - 2021 Base, AM » Existing Situation - 2021 Base, PM » Existing Situation - 2021 Base + Expected Development, AM » Existing Situation - 2021 Base + Expected Development, PM
Summary of junction performance
Values shown are the maximum values over all time segments. Delay is the maximum value of average delay per arriving vehicle.
"D1 - 2016 Base, AM " model duration: 08:00 - 09:00
"D2 - 2016 Base, PM" model duration: 17:00 - 18:00
"D3 - 2021 Base, AM" model duration: 08:00 - 09:00
"D4 - 2021 Base, PM" model duration: 17:00 - 18:00
"D9 - 2021 Base + Expected Development, AM" model duration: 08:00 - 09:00
"D10 - 2021 Base + Expected Development, PM" model duration: 17:00 - 18:00
Run using Junctions 8.0.6.541 at 26/04/2016 15:10:26
Junctions 8PICADY 8 - Priority Intersection Module
Version: 8.0.6.541 [19821,26/11/2015]
© Copyright TRL Limited, 2016
For sales and distribution information, program advice and maintenance, contact TRL:
Tel: +44 (0)1344 770758 email: [email protected] Web: http://www.trlsoftware.co.uk
The users of this computer program for the solution of an engineering problem are in no way relieved of their responsibility for the correctness of the solution
AM PM
Queue (PCU) Delay (s) RFC LOS Queue (PCU) Delay (s) RFC LOS
Existing Situation - 2016 Base
Stream B-AC 1.10 18.04 0.52 C 0.65 13.50 0.39 B
Stream C-AB 0.71 7.03 0.26 A 1.26 7.35 0.38 A
Stream C-A - - - - - - - -
Stream A-B - - - - - - - -
Stream A-C - - - - - - - -
Existing Situation - 2021 Base
Stream B-AC 1.39 21.13 0.58 C 0.80 15.46 0.44 C
Stream C-AB 0.88 7.15 0.30 A 1.67 7.95 0.45 A
Stream C-A - - - - - - - -
Stream A-B - - - - - - - -
Stream A-C - - - - - - - -
Existing Situation - 2021 Base + Expected Development
Stream B-AC 4.69 60.65 0.84 F 1.52 24.90 0.61 C
Stream C-AB 1.50 7.83 0.41 A 4.50 13.46 0.69 B
Stream C-A - - - - - - - -
Stream A-B - - - - - - - -
Stream A-C - - - - - - - -
Generated on 26/04/2016 15:10:43 using Junctions 8 (8.0.6.541)
1

File summary
Analysis Options
Units
Existing Situation - 2016 Base, AM
Data Errors and Warnings No errors or warnings
Analysis Set Details
Demand Set Details
Junction Network
Junctions
Title A52-Luke Lane Junction
Location Brailsford
Site Number
Date 25/04/2016
Version
Status (new file)
Identifier
Client Brailsford PC
Jobnumber T16512
Enumerator James Parker
Description
Vehicle Length (m)
Do Queue Variations
Calculate Residual Capacity
Residual Capacity Criteria Type
RFC Threshold
Average Delay Threshold (s)
Queue Threshold (PCU)
5.75 N/A 0.85 36.00 20.00
Distance Units Speed Units Traffic Units Input Traffic Units Results Flow Units Average Delay Units Total Delay Units Rate Of Delay Units
m kph PCU PCU perTimeSegment s -Min perMin
NameRoundabout
Capacity ModelDescription
Include In Report
Use Specific Demand Set(s)
Specific Demand Set
(s)Locked
Network Flow Scaling Factor
(%)
Network Capacity Scaling Factor (%)
Reason For Scaling Factors
Existing
SituationN/A ü 100.000 100.000
NameScenario
Name
Time Period Name
DescriptionTraffic Profile Type
Model Start Time
(HH:mm)
Model Finish Time
(HH:mm)
Model Time
Period Length (min)
Time Segment Length (min)
Results For
Central Hour Only
Single Time
Segment Only
LockedRun
AutomaticallyUse
RelationshipRelationship
2016
Base,
AM
2016
BaseAM DIRECT 08:00 09:00 60 15 ü
Junction Name Junction Type Major Road Direction Arm Order Do Geometric Delay Junction Delay (s) Junction LOS
1 (untitled) T-Junction Two-way A,B,C 12.90 B
Generated on 26/04/2016 15:10:43 using Junctions 8 (8.0.6.541)
2

Junction Network Options
Arms
Arms
Major Arm Geometry
Geometries for Arm C are measured opposite Arm B. Geometries for Arm A (if relevant) are measured opposite Arm D.
Minor Arm Geometry
Slope / Intercept / Capacity
Priority Intersection Slopes and Intercepts
The slopes and intercepts shown above do NOT include any corrections or adjustments.
Streams may be combined, in which case capacity will be adjusted.
Values are shown for the first time segment only; they may differ for subsequent time segments.
Traffic Flows
Demand Set Data Options
Driving Side Lighting
Left Normal/unknown
Arm Arm Name Description Arm Type
A A A52 W Major
B B Luke Lane Minor
C C A52 E Major
ArmWidth of
carriageway (m)Has kerbed central
reserveWidth of kerbed central
reserve (m)Has right turn bay
Width For Right Turn (m)
Visibility For Right Turn (m)
Blocks?Blocking Queue
(PCU)
C 7.00 0.00 2.20 100.00 ü 0.00
ArmMinor Arm Type
Lane Width
(m)
Lane Width
(Left) (m)
Lane Width
(Right) (m)
Width at give-way
(m)
Width at 5m (m)
Width at 10m (m)
Width at 15m (m)
Width at 20m (m)
Estimate Flare
Length
Flare Length (PCU)
Visibility To Left (m)
Visibility To Right (m)
BOne
lane3.40 30 21
Junction StreamIntercept
(PCU/TS)
Slope
for
A-B
Slope
for
A-C
Slope
for
C-A
Slope
for
C-B
1 B-A 129.389 0.090 0.228 0.143 0.326
1 B-C 165.668 0.097 0.246 - -
1 C-B 157.969 0.234 0.234 - -
Default Vehicle
Mix
Vehicle Mix Varies Over Time
Vehicle Mix Varies Over Turn
Vehicle Mix Varies Over Entry
Vehicle Mix Source
PCU Factor
for a HV (PCU)
Default Turning
Proportions
Estimate from
entry/exit counts
Turning Proportions
Vary Over Time
Turning Proportions
Vary Over Turn
Turning Proportions
Vary Over Entry
ü üHV
Percentages2.00 ü ü ü
Generated on 26/04/2016 15:10:43 using Junctions 8 (8.0.6.541)
3
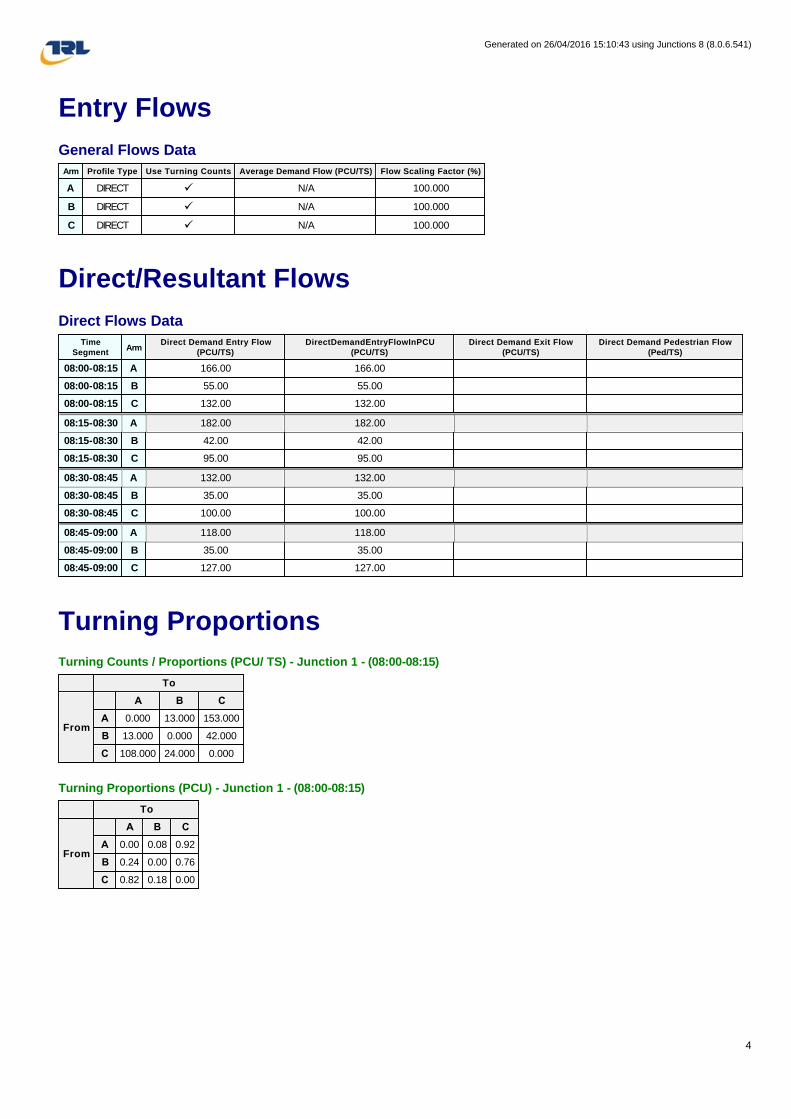
Entry Flows
General Flows Data
Direct/Resultant Flows
Direct Flows Data
Turning Proportions
Turning Counts / Proportions (PCU/ TS) - Junction 1 - (08:00-08:15)
Turning Proportions (PCU) - Junction 1 - (08:00-08:15)
Arm Profile Type Use Turning Counts Average Demand Flow (PCU/TS) Flow Scaling Factor (%)
A DIRECT ü N/A 100.000
B DIRECT ü N/A 100.000
C DIRECT ü N/A 100.000
Time Segment
ArmDirect Demand Entry Flow
(PCU/TS)DirectDemandEntryFlowInPCU
(PCU/TS)Direct Demand Exit Flow
(PCU/TS)Direct Demand Pedestrian Flow
(Ped/TS)
08:00-08:15 A 166.00 166.00
08:00-08:15 B 55.00 55.00
08:00-08:15 C 132.00 132.00
08:15-08:30 A 182.00 182.00
08:15-08:30 B 42.00 42.00
08:15-08:30 C 95.00 95.00
08:30-08:45 A 132.00 132.00
08:30-08:45 B 35.00 35.00
08:30-08:45 C 100.00 100.00
08:45-09:00 A 118.00 118.00
08:45-09:00 B 35.00 35.00
08:45-09:00 C 127.00 127.00
To
From
A B C
A 0.000 13.000 153.000
B 13.000 0.000 42.000
C 108.000 24.000 0.000
To
From
A B C
A 0.00 0.08 0.92
B 0.24 0.00 0.76
C 0.82 0.18 0.00
Generated on 26/04/2016 15:10:43 using Junctions 8 (8.0.6.541)
4

Turning Counts / Proportions (PCU/ TS) - Junction 1 - (08:15-08:30)
Turning Proportions (PCU) - Junction 1 - (08:15-08:30)
Turning Counts / Proportions (PCU/ TS) - Junction 1 - (08:30-08:45)
Turning Proportions (PCU) - Junction 1 - (08:30-08:45)
Turning Counts / Proportions (PCU/ TS) - Junction 1 - (08:45-09:00)
Turning Proportions (PCU) - Junction 1 - (08:45-09:00)
To
From
A B C
A 0.000 18.000 164.000
B 13.000 0.000 29.000
C 78.000 17.000 0.000
To
From
A B C
A 0.00 0.10 0.90
B 0.31 0.00 0.69
C 0.82 0.18 0.00
To
From
A B C
A 0.000 8.000 124.000
B 10.000 0.000 25.000
C 85.000 15.000 0.000
To
From
A B C
A 0.00 0.06 0.94
B 0.29 0.00 0.71
C 0.85 0.15 0.00
To
From
A B C
A 0.000 7.000 111.000
B 11.000 0.000 24.000
C 110.000 17.000 0.000
To
From
A B C
A 0.00 0.06 0.94
B 0.31 0.00 0.69
C 0.87 0.13 0.00
Generated on 26/04/2016 15:10:43 using Junctions 8 (8.0.6.541)
5

Vehicle Mix
Average PCU Per Vehicle - Junction 1 (for whole period)
Heavy Vehicle Percentages - Junction 1 (for whole period)
Results
Results Summary for whole modelled period
Main Results for each time segment
Main results: (08:00-08:15)
To
From
A B C
A 1.000 1.095 1.082
B 1.146 1.000 1.053
C 1.121 1.090 1.000
To
From
A B C
A 0.0 9.5 8.2
B 14.6 0.0 5.3
C 12.1 9.0 0.0
StreamMax RFC
Max Delay
(s)
Max Queue (PCU)
Max LOS
Average Demand (PCU/TS)
Total Junction Arrivals (PCU)
Total Queueing
Delay (PCU-min)
Average Queueing Delay (s)
Rate Of Queueing Delay (PCU-min/min)
Inclusive Total Queueing Delay
(PCU-min)
Inclusive Average
Queueing Delay (s)
B-AC 0.52 18.04 1.10 C 41.75 167.00 42.12 15.13 0.70 42.13 15.14
C-AB 0.26 7.03 0.71 A 36.56 146.24 28.34 11.63 0.47 28.35 11.63
C-A - - - - 76.94 307.76 - - - - -
A-B - - - - 11.50 46.00 - - - - -
A-C - - - - 138.00 552.00 - - - - -
StreamTotal Demand
(PCU/TS)Junction Arrivals
(PCU)Entry Flow (PCU/TS)
Pedestrian Demand (Ped/TS)
Capacity (PCU/TS)
RFCStart Queue
(PCU)End Queue
(PCU)Delay
(s)LOS
B-AC 55.00 55.00 53.90 0.00 106.44 0.517 0.00 1.10 18.041 C
C-AB 52.41 52.41 51.70 0.00 198.31 0.264 0.00 0.71 6.790 A
C-A 79.59 79.59 79.59 0.00 - - - - - -
A-B 13.00 13.00 13.00 0.00 - - - - - -
A-C 153.00 153.00 153.00 0.00 - - - - - -
Generated on 26/04/2016 15:10:43 using Junctions 8 (8.0.6.541)
6

Main results: (08:15-08:30)
Main results: (08:30-08:45)
Main results: (08:45-09:00)
Queueing Delay Results for each time segment
Queueing Delay results: (08:00-08:15)
Queueing Delay results: (08:15-08:30)
StreamTotal Demand
(PCU/TS)Junction Arrivals
(PCU)Entry Flow (PCU/TS)
Pedestrian Demand (Ped/TS)
Capacity (PCU/TS)
RFCStart Queue
(PCU)End Queue
(PCU)Delay
(s)LOS
B-AC 42.00 42.00 42.33 0.00 102.20 0.411 1.10 0.77 16.234 C
C-AB 30.98 30.98 31.27 0.00 173.39 0.179 0.71 0.42 7.033 A
C-A 64.02 64.02 64.02 0.00 - - - - - -
A-B 18.00 18.00 18.00 0.00 - - - - - -
A-C 164.00 164.00 164.00 0.00 - - - - - -
StreamTotal Demand
(PCU/TS)Junction Arrivals
(PCU)Entry Flow (PCU/TS)
Pedestrian Demand (Ped/TS)
Capacity (PCU/TS)
RFCStart Queue
(PCU)End Queue
(PCU)Delay
(s)LOS
B-AC 35.00 35.00 35.28 0.00 114.31 0.306 0.77 0.49 12.338 B
C-AB 27.33 27.33 27.42 0.00 187.86 0.145 0.42 0.34 6.207 A
C-A 72.67 72.67 72.67 0.00 - - - - - -
A-B 8.00 8.00 8.00 0.00 - - - - - -
A-C 124.00 124.00 124.00 0.00 - - - - - -
StreamTotal Demand
(PCU/TS)Junction Arrivals
(PCU)Entry Flow (PCU/TS)
Pedestrian Demand (Ped/TS)
Capacity (PCU/TS)
RFCStart Queue
(PCU)End Queue
(PCU)Delay
(s)LOS
B-AC 35.00 35.00 35.00 0.00 113.56 0.308 0.49 0.48 12.361 B
C-AB 35.52 35.52 35.43 0.00 207.71 0.171 0.34 0.43 5.783 A
C-A 91.48 91.48 91.48 0.00 - - - - - -
A-B 7.00 7.00 7.00 0.00 - - - - - -
A-C 111.00 111.00 111.00 0.00 - - - - - -
StreamQueueing Total Delay (PCU-
min)Queueing Rate Of Delay (PCU-
min/min)Average Delay Per Arriving
Vehicle (s)Unsignalised Level Of
ServiceSignalised Level Of
Service
B-AC 15.03 1.00 18.041 C B
C-AB 10.45 0.70 6.790 A A
C-A - - - - -
A-B - - - - -
A-C - - - - -
StreamQueueing Total Delay (PCU-
min)Queueing Rate Of Delay (PCU-
min/min)Average Delay Per Arriving
Vehicle (s)Unsignalised Level Of
ServiceSignalised Level Of
Service
B-AC 12.18 0.81 16.234 C B
C-AB 6.38 0.43 7.033 A A
C-A - - - - -
A-B - - - - -
A-C - - - - -
Generated on 26/04/2016 15:10:43 using Junctions 8 (8.0.6.541)
7

Queueing Delay results: (08:30-08:45)
Queueing Delay results: (08:45-09:00)
Existing Situation - 2016 Base, PM
Data Errors and Warnings No errors or warnings
Analysis Set Details
Demand Set Details
Junction Network
Junctions
Junction Network Options
StreamQueueing Total Delay (PCU-
min)Queueing Rate Of Delay (PCU-
min/min)Average Delay Per Arriving
Vehicle (s)Unsignalised Level Of
ServiceSignalised Level Of
Service
B-AC 7.63 0.51 12.338 B B
C-AB 5.02 0.33 6.207 A A
C-A - - - - -
A-B - - - - -
A-C - - - - -
StreamQueueing Total Delay (PCU-
min)Queueing Rate Of Delay (PCU-
min/min)Average Delay Per Arriving
Vehicle (s)Unsignalised Level Of
ServiceSignalised Level Of
Service
B-AC 7.28 0.49 12.361 B B
C-AB 6.49 0.43 5.783 A A
C-A - - - - -
A-B - - - - -
A-C - - - - -
NameRoundabout
Capacity ModelDescription
Include In Report
Use Specific Demand Set(s)
Specific Demand Set
(s)Locked
Network Flow Scaling Factor
(%)
Network Capacity Scaling Factor (%)
Reason For Scaling Factors
Existing
SituationN/A ü 100.000 100.000
NameScenario
Name
Time Period Name
DescriptionTraffic Profile Type
Model Start Time
(HH:mm)
Model Finish Time
(HH:mm)
Model Time
Period Length (min)
Time Segment Length (min)
Results For
Central Hour Only
Single Time
Segment Only
LockedRun
AutomaticallyUse
RelationshipRelationship
2016
Base,
PM
2016
BasePM DIRECT 17:00 18:00 60 15 ü
Junction Name Junction Type Major Road Direction Arm Order Do Geometric Delay Junction Delay (s) Junction LOS
1 (untitled) T-Junction Two-way A,B,C 9.20 A
Driving Side Lighting
Left Normal/unknown
Generated on 26/04/2016 15:10:43 using Junctions 8 (8.0.6.541)
8
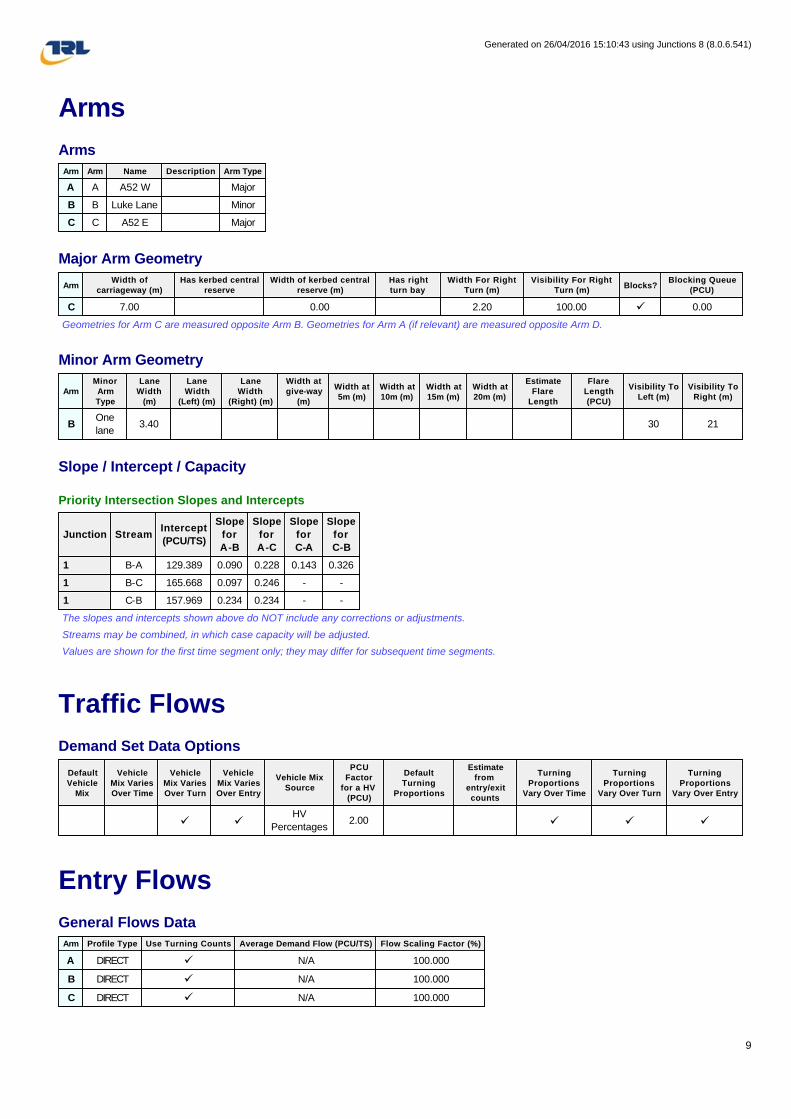
Arms
Arms
Major Arm Geometry
Geometries for Arm C are measured opposite Arm B. Geometries for Arm A (if relevant) are measured opposite Arm D.
Minor Arm Geometry
Slope / Intercept / Capacity
Priority Intersection Slopes and Intercepts
The slopes and intercepts shown above do NOT include any corrections or adjustments.
Streams may be combined, in which case capacity will be adjusted.
Values are shown for the first time segment only; they may differ for subsequent time segments.
Traffic Flows
Demand Set Data Options
Entry Flows
General Flows Data
Arm Arm Name Description Arm Type
A A A52 W Major
B B Luke Lane Minor
C C A52 E Major
ArmWidth of
carriageway (m)Has kerbed central
reserveWidth of kerbed central
reserve (m)Has right turn bay
Width For Right Turn (m)
Visibility For Right Turn (m)
Blocks?Blocking Queue
(PCU)
C 7.00 0.00 2.20 100.00 ü 0.00
ArmMinor Arm Type
Lane Width
(m)
Lane Width
(Left) (m)
Lane Width
(Right) (m)
Width at give-way
(m)
Width at 5m (m)
Width at 10m (m)
Width at 15m (m)
Width at 20m (m)
Estimate Flare
Length
Flare Length (PCU)
Visibility To Left (m)
Visibility To Right (m)
BOne
lane3.40 30 21
Junction StreamIntercept
(PCU/TS)
Slope
for
A-B
Slope
for
A-C
Slope
for
C-A
Slope
for
C-B
1 B-A 129.389 0.090 0.228 0.143 0.326
1 B-C 165.668 0.097 0.246 - -
1 C-B 157.969 0.234 0.234 - -
Default Vehicle
Mix
Vehicle Mix Varies Over Time
Vehicle Mix Varies Over Turn
Vehicle Mix Varies Over Entry
Vehicle Mix Source
PCU Factor
for a HV (PCU)
Default Turning
Proportions
Estimate from
entry/exit counts
Turning Proportions
Vary Over Time
Turning Proportions
Vary Over Turn
Turning Proportions
Vary Over Entry
ü üHV
Percentages2.00 ü ü ü
Arm Profile Type Use Turning Counts Average Demand Flow (PCU/TS) Flow Scaling Factor (%)
A DIRECT ü N/A 100.000
B DIRECT ü N/A 100.000
C DIRECT ü N/A 100.000
Generated on 26/04/2016 15:10:43 using Junctions 8 (8.0.6.541)
9

Direct/Resultant Flows
Direct Flows Data
Turning Proportions
Turning Counts / Proportions (PCU/ TS) - Junction 1 - (17:00-17:15)
Turning Proportions (PCU) - Junction 1 - (17:00-17:15)
Turning Counts / Proportions (PCU/ TS) - Junction 1 - (17:15-17:30)
Turning Proportions (PCU) - Junction 1 - (17:15-17:30)
Time Segment
ArmDirect Demand Entry Flow
(PCU/TS)DirectDemandEntryFlowInPCU
(PCU/TS)Direct Demand Exit Flow
(PCU/TS)Direct Demand Pedestrian Flow
(Ped/TS)
17:00-17:15 A 132.00 132.00
17:00-17:15 B 44.00 44.00
17:00-17:15 C 185.00 185.00
17:15-17:30 A 161.00 161.00
17:15-17:30 B 32.00 32.00
17:15-17:30 C 163.00 163.00
17:30-17:45 A 123.00 123.00
17:30-17:45 B 24.00 24.00
17:30-17:45 C 191.00 191.00
17:45-18:00 A 104.00 104.00
17:45-18:00 B 22.00 22.00
17:45-18:00 C 148.00 148.00
To
From
A B C
A 0.000 12.000 120.000
B 9.000 0.000 35.000
C 162.000 23.000 0.000
To
From
A B C
A 0.00 0.09 0.91
B 0.20 0.00 0.80
C 0.88 0.12 0.00
To
From
A B C
A 0.000 9.000 152.000
B 8.000 0.000 24.000
C 130.000 33.000 0.000
To
From
A B C
A 0.00 0.06 0.94
B 0.25 0.00 0.75
C 0.80 0.20 0.00
Generated on 26/04/2016 15:10:43 using Junctions 8 (8.0.6.541)
10

Turning Counts / Proportions (PCU/ TS) - Junction 1 - (17:30-17:45)
Turning Proportions (PCU) - Junction 1 - (17:30-17:45)
Turning Counts / Proportions (PCU/ TS) - Junction 1 - (17:45-18:00)
Turning Proportions (PCU) - Junction 1 - (17:45-18:00)
Vehicle Mix
Average PCU Per Vehicle - Junction 1 (for whole period)
Heavy Vehicle Percentages - Junction 1 (for whole period)
To
From
A B C
A 0.000 7.000 116.000
B 10.000 0.000 14.000
C 160.000 31.000 0.000
To
From
A B C
A 0.00 0.06 0.94
B 0.42 0.00 0.58
C 0.84 0.16 0.00
To
From
A B C
A 0.000 11.000 93.000
B 13.000 0.000 9.000
C 131.000 17.000 0.000
To
From
A B C
A 0.00 0.11 0.89
B 0.59 0.00 0.41
C 0.89 0.11 0.00
To
From
A B C
A 1.000 1.026 1.048
B 1.053 1.000 1.051
C 1.070 1.095 1.000
To
From
A B C
A 0.0 2.6 4.8
B 5.3 0.0 5.1
C 7.0 9.5 0.0
Generated on 26/04/2016 15:10:43 using Junctions 8 (8.0.6.541)
11

Results
Results Summary for whole modelled period
Main Results for each time segment
Main results: (17:00-17:15)
Main results: (17:15-17:30)
Main results: (17:30-17:45)
StreamMax RFC
Max Delay
(s)
Max Queue (PCU)
Max LOS
Average Demand (PCU/TS)
Total Junction Arrivals (PCU)
Total Queueing
Delay (PCU-min)
Average Queueing Delay (s)
Rate Of Queueing Delay (PCU-min/min)
Inclusive Total Queueing Delay
(PCU-min)
Inclusive Average
Queueing Delay (s)
B-AC 0.39 13.50 0.65 B 30.50 122.00 26.83 13.20 0.45 26.84 13.20
C-AB 0.38 7.35 1.26 A 70.50 282.00 58.42 12.43 0.97 58.43 12.43
C-A - - - - 101.25 405.00 - - - - -
A-B - - - - 9.75 39.00 - - - - -
A-C - - - - 120.25 481.00 - - - - -
StreamTotal Demand
(PCU/TS)Junction Arrivals
(PCU)Entry Flow (PCU/TS)
Pedestrian Demand (Ped/TS)
Capacity (PCU/TS)
RFCStart Queue
(PCU)End Queue
(PCU)Delay
(s)LOS
B-AC 44.00 44.00 43.35 0.00 113.60 0.387 0.00 0.65 13.353 B
C-AB 67.31 67.31 66.43 0.00 242.06 0.278 0.00 0.88 5.529 A
C-A 117.69 117.69 117.69 0.00 - - - - - -
A-B 12.00 12.00 12.00 0.00 - - - - - -
A-C 120.00 120.00 120.00 0.00 - - - - - -
StreamTotal Demand
(PCU/TS)Junction Arrivals
(PCU)Entry Flow (PCU/TS)
Pedestrian Demand (Ped/TS)
Capacity (PCU/TS)
RFCStart Queue
(PCU)End Queue
(PCU)Delay
(s)LOS
B-AC 32.00 32.00 32.16 0.00 102.45 0.312 0.65 0.49 13.496 B
C-AB 82.93 82.93 82.59 0.00 215.47 0.385 0.88 1.22 7.346 A
C-A 80.07 80.07 80.07 0.00 - - - - - -
A-B 9.00 9.00 9.00 0.00 - - - - - -
A-C 152.00 152.00 152.00 0.00 - - - - - -
StreamTotal Demand
(PCU/TS)Junction Arrivals
(PCU)Entry Flow (PCU/TS)
Pedestrian Demand (Ped/TS)
Capacity (PCU/TS)
RFCStart Queue
(PCU)End Queue
(PCU)Delay
(s)LOS
B-AC 24.00 24.00 24.14 0.00 97.22 0.247 0.49 0.35 12.974 B
C-AB 90.98 90.98 90.94 0.00 243.34 0.374 1.22 1.26 6.425 A
C-A 100.02 100.02 100.02 0.00 - - - - - -
A-B 7.00 7.00 7.00 0.00 - - - - - -
A-C 116.00 116.00 116.00 0.00 - - - - - -
Generated on 26/04/2016 15:10:43 using Junctions 8 (8.0.6.541)
12

Main results: (17:45-18:00)
Queueing Delay Results for each time segment
Queueing Delay results: (17:00-17:15)
Queueing Delay results: (17:15-17:30)
Queueing Delay results: (17:30-17:45)
Queueing Delay results: (17:45-18:00)
StreamTotal Demand
(PCU/TS)Junction Arrivals
(PCU)Entry Flow (PCU/TS)
Pedestrian Demand (Ped/TS)
Capacity (PCU/TS)
RFCStart Queue
(PCU)End Queue
(PCU)Delay
(s)LOS
B-AC 22.00 22.00 22.05 0.00 99.76 0.221 0.35 0.30 12.192 B
C-AB 40.78 40.78 41.55 0.00 225.82 0.181 1.26 0.49 5.303 A
C-A 107.22 107.22 107.22 0.00 - - - - - -
A-B 11.00 11.00 11.00 0.00 - - - - - -
A-C 93.00 93.00 93.00 0.00 - - - - - -
StreamQueueing Total Delay (PCU-
min)Queueing Rate Of Delay (PCU-
min/min)Average Delay Per Arriving
Vehicle (s)Unsignalised Level Of
ServiceSignalised Level Of
Service
B-AC 9.10 0.61 13.353 B B
C-AB 12.88 0.86 5.529 A A
C-A - - - - -
A-B - - - - -
A-C - - - - -
StreamQueueing Total Delay (PCU-
min)Queueing Rate Of Delay (PCU-
min/min)Average Delay Per Arriving
Vehicle (s)Unsignalised Level Of
ServiceSignalised Level Of
Service
B-AC 7.61 0.51 13.496 B B
C-AB 18.52 1.23 7.346 A A
C-A - - - - -
A-B - - - - -
A-C - - - - -
StreamQueueing Total Delay (PCU-
min)Queueing Rate Of Delay (PCU-
min/min)Average Delay Per Arriving
Vehicle (s)Unsignalised Level Of
ServiceSignalised Level Of
Service
B-AC 5.48 0.37 12.974 B B
C-AB 19.27 1.28 6.425 A A
C-A - - - - -
A-B - - - - -
A-C - - - - -
StreamQueueing Total Delay (PCU-
min)Queueing Rate Of Delay (PCU-
min/min)Average Delay Per Arriving
Vehicle (s)Unsignalised Level Of
ServiceSignalised Level Of
Service
B-AC 4.65 0.31 12.192 B B
C-AB 7.74 0.52 5.303 A A
C-A - - - - -
A-B - - - - -
A-C - - - - -
Generated on 26/04/2016 15:10:43 using Junctions 8 (8.0.6.541)
13
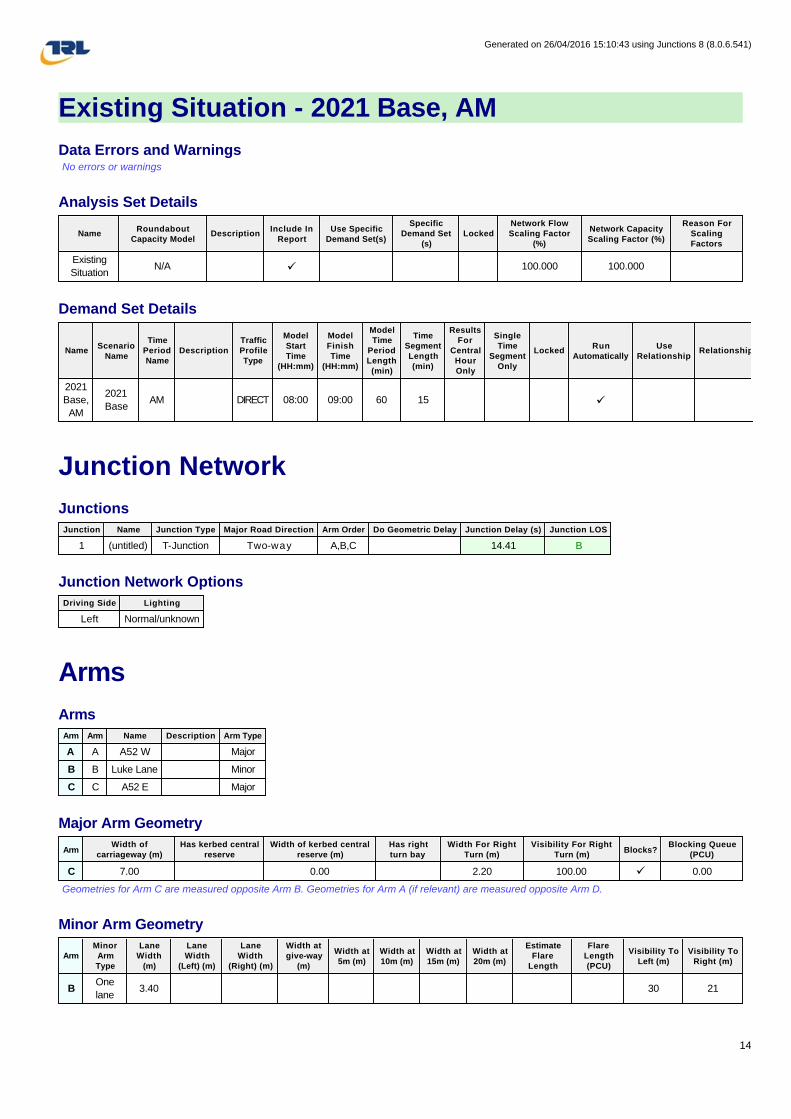
Existing Situation - 2021 Base, AM
Data Errors and Warnings No errors or warnings
Analysis Set Details
Demand Set Details
Junction Network
Junctions
Junction Network Options
Arms
Arms
Major Arm Geometry
Geometries for Arm C are measured opposite Arm B. Geometries for Arm A (if relevant) are measured opposite Arm D.
Minor Arm Geometry
NameRoundabout
Capacity ModelDescription
Include In Report
Use Specific Demand Set(s)
Specific Demand Set
(s)Locked
Network Flow Scaling Factor
(%)
Network Capacity Scaling Factor (%)
Reason For Scaling Factors
Existing
SituationN/A ü 100.000 100.000
NameScenario
Name
Time Period Name
DescriptionTraffic Profile Type
Model Start Time
(HH:mm)
Model Finish Time
(HH:mm)
Model Time
Period Length (min)
Time Segment Length (min)
Results For
Central Hour Only
Single Time
Segment Only
LockedRun
AutomaticallyUse
RelationshipRelationship
2021
Base,
AM
2021
BaseAM DIRECT 08:00 09:00 60 15 ü
Junction Name Junction Type Major Road Direction Arm Order Do Geometric Delay Junction Delay (s) Junction LOS
1 (untitled) T-Junction Two-way A,B,C 14.41 B
Driving Side Lighting
Left Normal/unknown
Arm Arm Name Description Arm Type
A A A52 W Major
B B Luke Lane Minor
C C A52 E Major
ArmWidth of
carriageway (m)Has kerbed central
reserveWidth of kerbed central
reserve (m)Has right turn bay
Width For Right Turn (m)
Visibility For Right Turn (m)
Blocks?Blocking Queue
(PCU)
C 7.00 0.00 2.20 100.00 ü 0.00
ArmMinor Arm Type
Lane Width
(m)
Lane Width
(Left) (m)
Lane Width
(Right) (m)
Width at give-way
(m)
Width at 5m (m)
Width at 10m (m)
Width at 15m (m)
Width at 20m (m)
Estimate Flare
Length
Flare Length (PCU)
Visibility To Left (m)
Visibility To Right (m)
BOne
lane3.40 30 21
Generated on 26/04/2016 15:10:43 using Junctions 8 (8.0.6.541)
14

Slope / Intercept / Capacity
Priority Intersection Slopes and Intercepts
The slopes and intercepts shown above do NOT include any corrections or adjustments.
Streams may be combined, in which case capacity will be adjusted.
Values are shown for the first time segment only; they may differ for subsequent time segments.
Traffic Flows
Demand Set Data Options
Entry Flows
General Flows Data
Direct/Resultant Flows
Direct Flows Data
Junction StreamIntercept
(PCU/TS)
Slope
for
A-B
Slope
for
A-C
Slope
for
C-A
Slope
for
C-B
1 B-A 129.389 0.090 0.228 0.143 0.326
1 B-C 165.668 0.097 0.246 - -
1 C-B 157.969 0.234 0.234 - -
Default Vehicle
Mix
Vehicle Mix Varies Over Time
Vehicle Mix Varies Over Turn
Vehicle Mix Varies Over Entry
Vehicle Mix Source
PCU Factor
for a HV (PCU)
Default Turning
Proportions
Estimate from
entry/exit counts
Turning Proportions
Vary Over Time
Turning Proportions
Vary Over Turn
Turning Proportions
Vary Over Entry
ü üHV
Percentages2.00 ü ü ü
Arm Profile Type Use Turning Counts Average Demand Flow (PCU/TS) Flow Scaling Factor (%)
A DIRECT ü N/A 100.000
B DIRECT ü N/A 100.000
C DIRECT ü N/A 100.000
Time Segment
ArmDirect Demand Entry Flow
(PCU/TS)DirectDemandEntryFlowInPCU
(PCU/TS)Direct Demand Exit Flow
(PCU/TS)Direct Demand Pedestrian Flow
(Ped/TS)
08:00-08:15 A 179.00 179.00
08:00-08:15 B 59.00 59.00
08:00-08:15 C 143.00 143.00
08:15-08:30 A 196.00 196.00
08:15-08:30 B 45.00 45.00
08:15-08:30 C 102.00 102.00
08:30-08:45 A 143.00 143.00
08:30-08:45 B 38.00 38.00
08:30-08:45 C 108.00 108.00
08:45-09:00 A 128.00 128.00
08:45-09:00 B 38.00 38.00
08:45-09:00 C 137.00 137.00
Generated on 26/04/2016 15:10:43 using Junctions 8 (8.0.6.541)
15

Turning Proportions
Turning Counts / Proportions (PCU/ TS) - Junction 1 - (08:00-08:15)
Turning Proportions (PCU) - Junction 1 - (08:00-08:15)
Turning Counts / Proportions (PCU/ TS) - Junction 1 - (08:15-08:30)
Turning Proportions (PCU) - Junction 1 - (08:15-08:30)
Turning Counts / Proportions (PCU/ TS) - Junction 1 - (08:30-08:45)
Turning Proportions (PCU) - Junction 1 - (08:30-08:45)
To
From
A B C
A 0.000 14.000 165.000
B 14.000 0.000 45.000
C 117.000 26.000 0.000
To
From
A B C
A 0.00 0.08 0.92
B 0.24 0.00 0.76
C 0.82 0.18 0.00
To
From
A B C
A 0.000 19.000 177.000
B 14.000 0.000 31.000
C 84.000 18.000 0.000
To
From
A B C
A 0.00 0.10 0.90
B 0.31 0.00 0.69
C 0.82 0.18 0.00
To
From
A B C
A 0.000 9.000 134.000
B 11.000 0.000 27.000
C 92.000 16.000 0.000
To
From
A B C
A 0.00 0.06 0.94
B 0.29 0.00 0.71
C 0.85 0.15 0.00
Generated on 26/04/2016 15:10:43 using Junctions 8 (8.0.6.541)
16
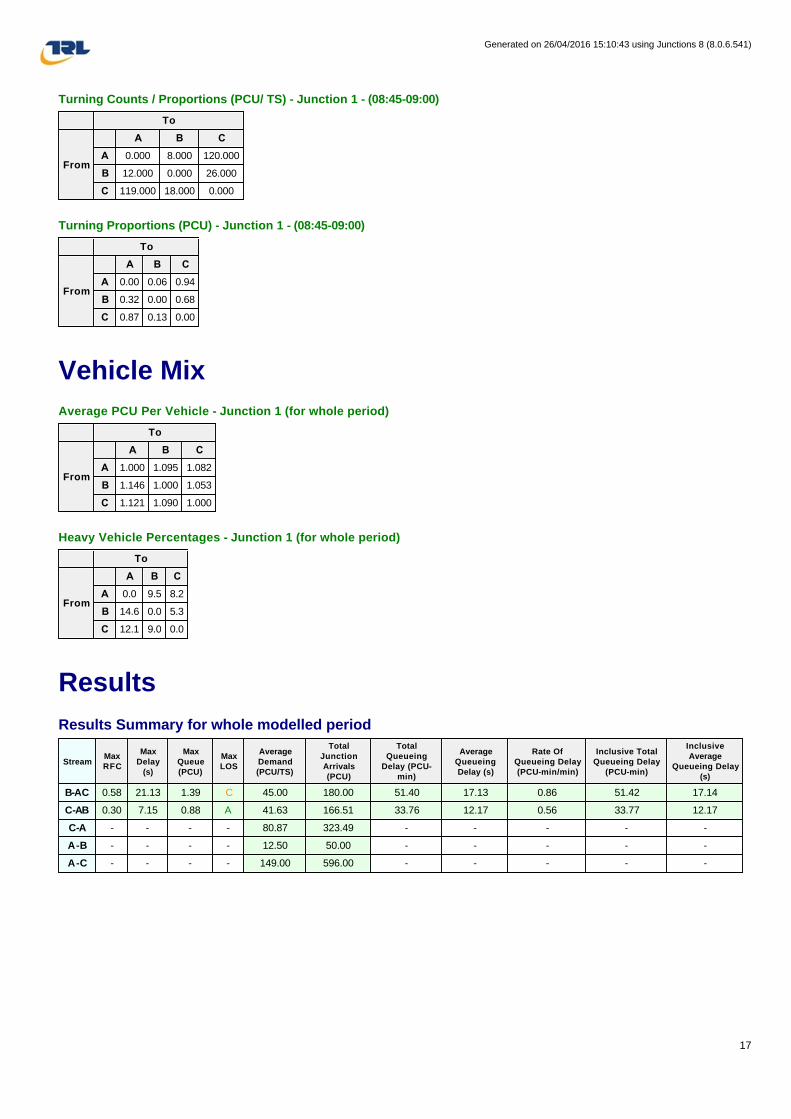
Turning Counts / Proportions (PCU/ TS) - Junction 1 - (08:45-09:00)
Turning Proportions (PCU) - Junction 1 - (08:45-09:00)
Vehicle Mix
Average PCU Per Vehicle - Junction 1 (for whole period)
Heavy Vehicle Percentages - Junction 1 (for whole period)
Results
Results Summary for whole modelled period
To
From
A B C
A 0.000 8.000 120.000
B 12.000 0.000 26.000
C 119.000 18.000 0.000
To
From
A B C
A 0.00 0.06 0.94
B 0.32 0.00 0.68
C 0.87 0.13 0.00
To
From
A B C
A 1.000 1.095 1.082
B 1.146 1.000 1.053
C 1.121 1.090 1.000
To
From
A B C
A 0.0 9.5 8.2
B 14.6 0.0 5.3
C 12.1 9.0 0.0
StreamMax RFC
Max Delay
(s)
Max Queue (PCU)
Max LOS
Average Demand (PCU/TS)
Total Junction Arrivals (PCU)
Total Queueing
Delay (PCU-min)
Average Queueing Delay (s)
Rate Of Queueing Delay (PCU-min/min)
Inclusive Total Queueing Delay
(PCU-min)
Inclusive Average
Queueing Delay (s)
B-AC 0.58 21.13 1.39 C 45.00 180.00 51.40 17.13 0.86 51.42 17.14
C-AB 0.30 7.15 0.88 A 41.63 166.51 33.76 12.17 0.56 33.77 12.17
C-A - - - - 80.87 323.49 - - - - -
A-B - - - - 12.50 50.00 - - - - -
A-C - - - - 149.00 596.00 - - - - -
Generated on 26/04/2016 15:10:43 using Junctions 8 (8.0.6.541)
17

Main Results for each time segment
Main results: (08:00-08:15)
Main results: (08:15-08:30)
Main results: (08:30-08:45)
Main results: (08:45-09:00)
Queueing Delay Results for each time segment
Queueing Delay results: (08:00-08:15)
StreamTotal Demand
(PCU/TS)Junction Arrivals
(PCU)Entry Flow (PCU/TS)
Pedestrian Demand (Ped/TS)
Capacity (PCU/TS)
RFCStart Queue
(PCU)End Queue
(PCU)Delay
(s)LOS
B-AC 59.00 59.00 57.61 0.00 102.08 0.578 0.00 1.39 21.133 C
C-AB 61.05 61.05 60.17 0.00 202.58 0.301 0.00 0.88 6.998 A
C-A 81.95 81.95 81.95 0.00 - - - - - -
A-B 14.00 14.00 14.00 0.00 - - - - - -
A-C 165.00 165.00 165.00 0.00 - - - - - -
StreamTotal Demand
(PCU/TS)Junction Arrivals
(PCU)Entry Flow (PCU/TS)
Pedestrian Demand (Ped/TS)
Capacity (PCU/TS)
RFCStart Queue
(PCU)End Queue
(PCU)Delay
(s)LOS
B-AC 45.00 45.00 45.45 0.00 98.01 0.459 1.39 0.94 18.541 C
C-AB 34.66 34.66 35.04 0.00 175.19 0.198 0.88 0.49 7.148 A
C-A 67.34 67.34 67.34 0.00 - - - - - -
A-B 19.00 19.00 19.00 0.00 - - - - - -
A-C 177.00 177.00 177.00 0.00 - - - - - -
StreamTotal Demand
(PCU/TS)Junction Arrivals
(PCU)Entry Flow (PCU/TS)
Pedestrian Demand (Ped/TS)
Capacity (PCU/TS)
RFCStart Queue
(PCU)End Queue
(PCU)Delay
(s)LOS
B-AC 38.00 38.00 38.37 0.00 110.74 0.343 0.94 0.58 13.497 B
C-AB 30.77 30.77 30.87 0.00 190.75 0.161 0.49 0.39 6.235 A
C-A 77.23 77.23 77.23 0.00 - - - - - -
A-B 9.00 9.00 9.00 0.00 - - - - - -
A-C 134.00 134.00 134.00 0.00 - - - - - -
StreamTotal Demand
(PCU/TS)Junction Arrivals
(PCU)Entry Flow (PCU/TS)
Pedestrian Demand (Ped/TS)
Capacity (PCU/TS)
RFCStart Queue
(PCU)End Queue
(PCU)Delay
(s)LOS
B-AC 38.00 38.00 38.00 0.00 110.09 0.345 0.58 0.57 13.473 B
C-AB 40.04 40.04 39.93 0.00 212.11 0.189 0.39 0.50 5.791 A
C-A 96.96 96.96 96.96 0.00 - - - - - -
A-B 8.00 8.00 8.00 0.00 - - - - - -
A-C 120.00 120.00 120.00 0.00 - - - - - -
StreamQueueing Total Delay (PCU-
min)Queueing Rate Of Delay (PCU-
min/min)Average Delay Per Arriving
Vehicle (s)Unsignalised Level Of
ServiceSignalised Level Of
Service
B-AC 18.63 1.24 21.133 C C
C-AB 12.85 0.86 6.998 A A
C-A - - - - -
A-B - - - - -
A-C - - - - -
Generated on 26/04/2016 15:10:43 using Junctions 8 (8.0.6.541)
18

Queueing Delay results: (08:15-08:30)
Queueing Delay results: (08:30-08:45)
Queueing Delay results: (08:45-09:00)
Existing Situation - 2021 Base, PM
Data Errors and Warnings No errors or warnings
Analysis Set Details
Demand Set Details
StreamQueueing Total Delay (PCU-
min)Queueing Rate Of Delay (PCU-
min/min)Average Delay Per Arriving
Vehicle (s)Unsignalised Level Of
ServiceSignalised Level Of
Service
B-AC 15.03 1.00 18.541 C B
C-AB 7.51 0.50 7.148 A A
C-A - - - - -
A-B - - - - -
A-C - - - - -
StreamQueueing Total Delay (PCU-
min)Queueing Rate Of Delay (PCU-
min/min)Average Delay Per Arriving
Vehicle (s)Unsignalised Level Of
ServiceSignalised Level Of
Service
B-AC 9.10 0.61 13.497 B B
C-AB 5.85 0.39 6.235 A A
C-A - - - - -
A-B - - - - -
A-C - - - - -
StreamQueueing Total Delay (PCU-
min)Queueing Rate Of Delay (PCU-
min/min)Average Delay Per Arriving
Vehicle (s)Unsignalised Level Of
ServiceSignalised Level Of
Service
B-AC 8.63 0.58 13.473 B B
C-AB 7.55 0.50 5.791 A A
C-A - - - - -
A-B - - - - -
A-C - - - - -
NameRoundabout
Capacity ModelDescription
Include In Report
Use Specific Demand Set(s)
Specific Demand Set
(s)Locked
Network Flow Scaling Factor
(%)
Network Capacity Scaling Factor (%)
Reason For Scaling Factors
Existing
SituationN/A ü 100.000 100.000
NameScenario
Name
Time Period Name
DescriptionTraffic Profile Type
Model Start Time
(HH:mm)
Model Finish Time
(HH:mm)
Model Time
Period Length (min)
Time Segment Length (min)
Results For
Central Hour Only
Single Time
Segment Only
LockedRun
AutomaticallyUse
RelationshipRelationship
2021
Base,
PM
2021
BasePM DIRECT 17:00 18:00 60 15 ü
Generated on 26/04/2016 15:10:43 using Junctions 8 (8.0.6.541)
19
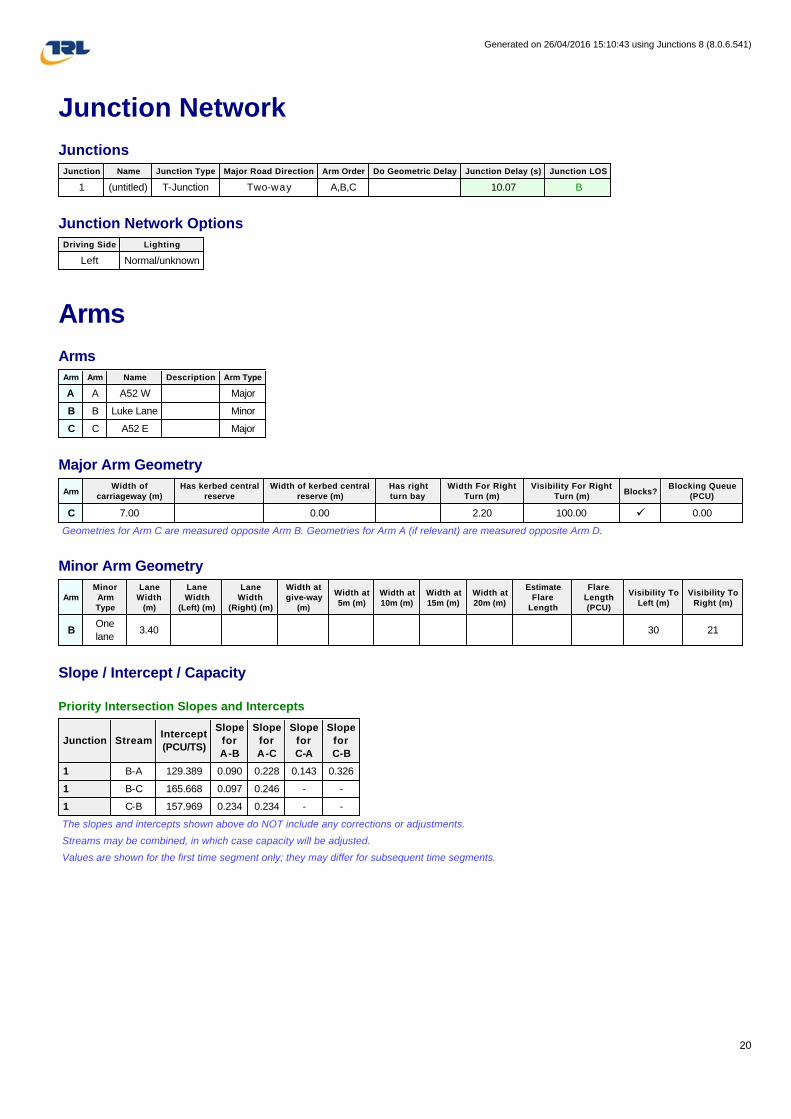
Junction Network
Junctions
Junction Network Options
Arms
Arms
Major Arm Geometry
Geometries for Arm C are measured opposite Arm B. Geometries for Arm A (if relevant) are measured opposite Arm D.
Minor Arm Geometry
Slope / Intercept / Capacity
Priority Intersection Slopes and Intercepts
The slopes and intercepts shown above do NOT include any corrections or adjustments.
Streams may be combined, in which case capacity will be adjusted.
Values are shown for the first time segment only; they may differ for subsequent time segments.
Junction Name Junction Type Major Road Direction Arm Order Do Geometric Delay Junction Delay (s) Junction LOS
1 (untitled) T-Junction Two-way A,B,C 10.07 B
Driving Side Lighting
Left Normal/unknown
Arm Arm Name Description Arm Type
A A A52 W Major
B B Luke Lane Minor
C C A52 E Major
ArmWidth of
carriageway (m)Has kerbed central
reserveWidth of kerbed central
reserve (m)Has right turn bay
Width For Right Turn (m)
Visibility For Right Turn (m)
Blocks?Blocking Queue
(PCU)
C 7.00 0.00 2.20 100.00 ü 0.00
ArmMinor Arm Type
Lane Width
(m)
Lane Width
(Left) (m)
Lane Width
(Right) (m)
Width at give-way
(m)
Width at 5m (m)
Width at 10m (m)
Width at 15m (m)
Width at 20m (m)
Estimate Flare
Length
Flare Length (PCU)
Visibility To Left (m)
Visibility To Right (m)
BOne
lane3.40 30 21
Junction StreamIntercept
(PCU/TS)
Slope
for
A-B
Slope
for
A-C
Slope
for
C-A
Slope
for
C-B
1 B-A 129.389 0.090 0.228 0.143 0.326
1 B-C 165.668 0.097 0.246 - -
1 C-B 157.969 0.234 0.234 - -
Generated on 26/04/2016 15:10:43 using Junctions 8 (8.0.6.541)
20

Traffic Flows
Demand Set Data Options
Entry Flows
General Flows Data
Direct/Resultant Flows
Direct Flows Data
Turning Proportions
Turning Counts / Proportions (PCU/ TS) - Junction 1 - (17:00-17:15)
Default Vehicle
Mix
Vehicle Mix Varies Over Time
Vehicle Mix Varies Over Turn
Vehicle Mix Varies Over Entry
Vehicle Mix Source
PCU Factor
for a HV (PCU)
Default Turning
Proportions
Estimate from
entry/exit counts
Turning Proportions
Vary Over Time
Turning Proportions
Vary Over Turn
Turning Proportions
Vary Over Entry
ü üHV
Percentages2.00 ü ü ü
Arm Profile Type Use Turning Counts Average Demand Flow (PCU/TS) Flow Scaling Factor (%)
A DIRECT ü N/A 100.000
B DIRECT ü N/A 100.000
C DIRECT ü N/A 100.000
Time Segment
ArmDirect Demand Entry Flow
(PCU/TS)DirectDemandEntryFlowInPCU
(PCU/TS)Direct Demand Exit Flow
(PCU/TS)Direct Demand Pedestrian Flow
(Ped/TS)
17:00-17:15 A 143.00 143.00
17:00-17:15 B 48.00 48.00
17:00-17:15 C 201.00 201.00
17:15-17:30 A 175.00 175.00
17:15-17:30 B 35.00 35.00
17:15-17:30 C 177.00 177.00
17:30-17:45 A 134.00 134.00
17:30-17:45 B 26.00 26.00
17:30-17:45 C 207.00 207.00
17:45-18:00 A 113.00 113.00
17:45-18:00 B 24.00 24.00
17:45-18:00 C 160.00 160.00
To
From
A B C
A 0.000 13.000 130.000
B 10.000 0.000 38.000
C 176.000 25.000 0.000
Generated on 26/04/2016 15:10:43 using Junctions 8 (8.0.6.541)
21
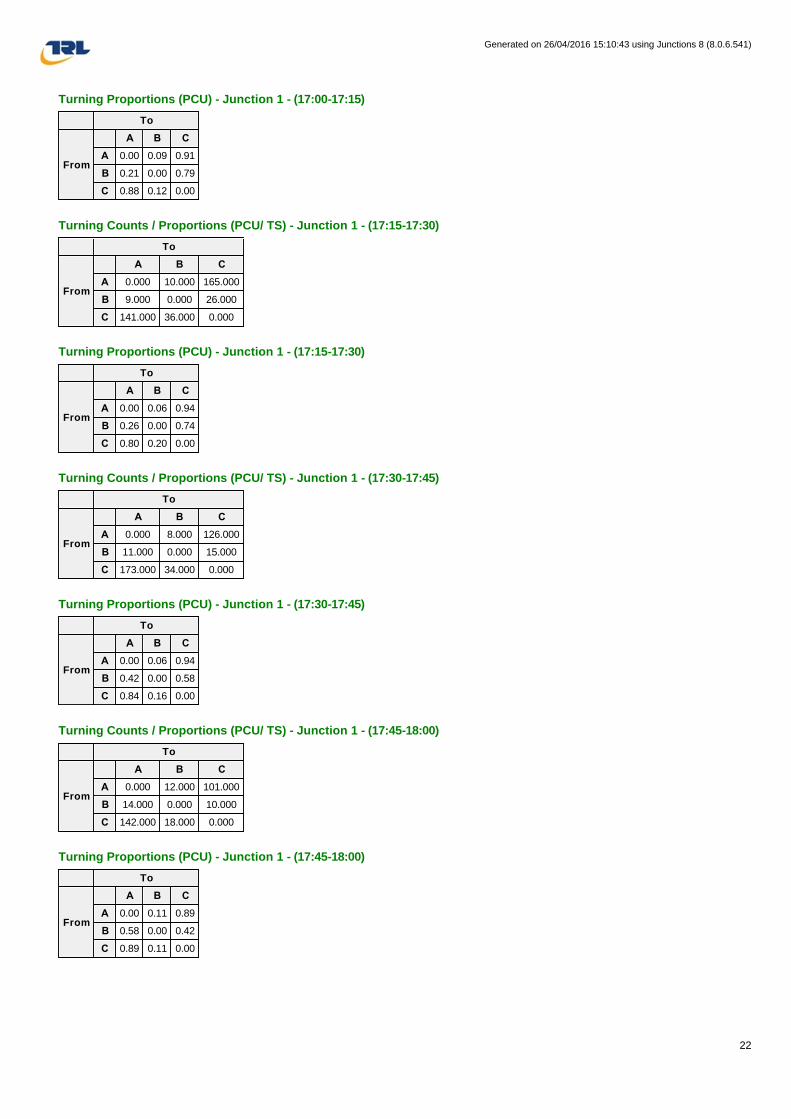
Turning Proportions (PCU) - Junction 1 - (17:00-17:15)
Turning Counts / Proportions (PCU/ TS) - Junction 1 - (17:15-17:30)
Turning Proportions (PCU) - Junction 1 - (17:15-17:30)
Turning Counts / Proportions (PCU/ TS) - Junction 1 - (17:30-17:45)
Turning Proportions (PCU) - Junction 1 - (17:30-17:45)
Turning Counts / Proportions (PCU/ TS) - Junction 1 - (17:45-18:00)
Turning Proportions (PCU) - Junction 1 - (17:45-18:00)
To
From
A B C
A 0.00 0.09 0.91
B 0.21 0.00 0.79
C 0.88 0.12 0.00
To
From
A B C
A 0.000 10.000 165.000
B 9.000 0.000 26.000
C 141.000 36.000 0.000
To
From
A B C
A 0.00 0.06 0.94
B 0.26 0.00 0.74
C 0.80 0.20 0.00
To
From
A B C
A 0.000 8.000 126.000
B 11.000 0.000 15.000
C 173.000 34.000 0.000
To
From
A B C
A 0.00 0.06 0.94
B 0.42 0.00 0.58
C 0.84 0.16 0.00
To
From
A B C
A 0.000 12.000 101.000
B 14.000 0.000 10.000
C 142.000 18.000 0.000
To
From
A B C
A 0.00 0.11 0.89
B 0.58 0.00 0.42
C 0.89 0.11 0.00
Generated on 26/04/2016 15:10:43 using Junctions 8 (8.0.6.541)
22
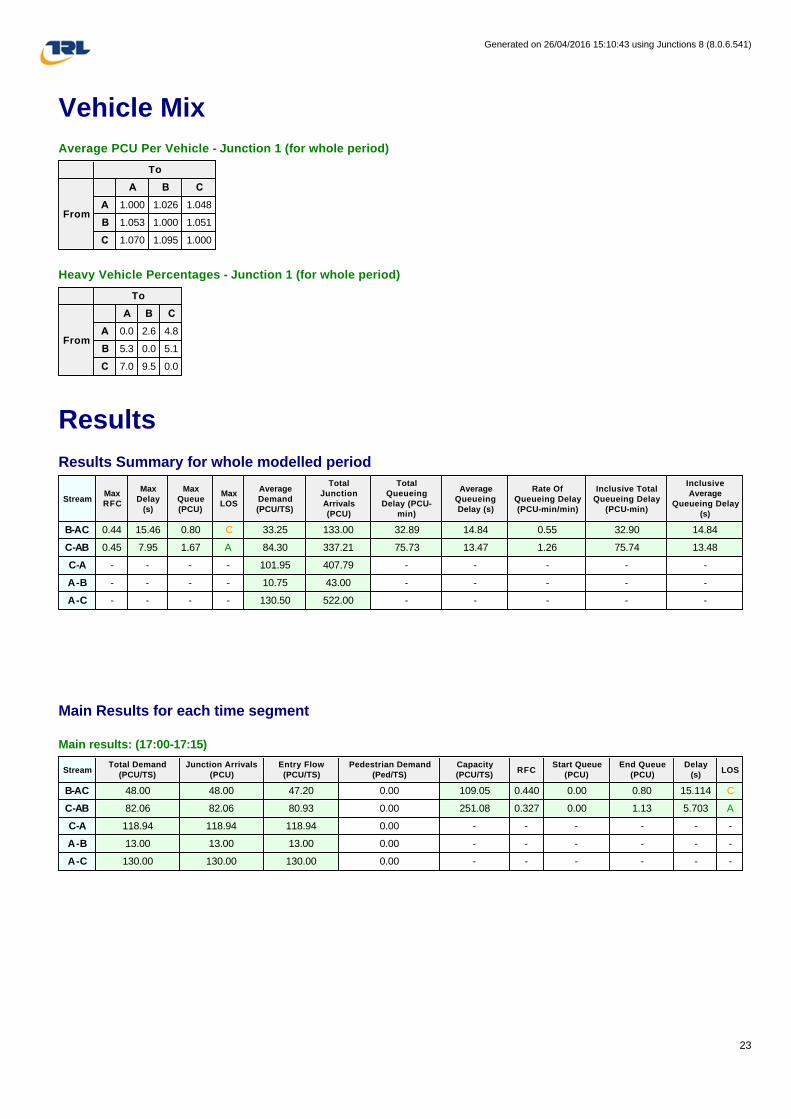
Vehicle Mix
Average PCU Per Vehicle - Junction 1 (for whole period)
Heavy Vehicle Percentages - Junction 1 (for whole period)
Results
Results Summary for whole modelled period
Main Results for each time segment
Main results: (17:00-17:15)
To
From
A B C
A 1.000 1.026 1.048
B 1.053 1.000 1.051
C 1.070 1.095 1.000
To
From
A B C
A 0.0 2.6 4.8
B 5.3 0.0 5.1
C 7.0 9.5 0.0
StreamMax RFC
Max Delay
(s)
Max Queue (PCU)
Max LOS
Average Demand (PCU/TS)
Total Junction Arrivals (PCU)
Total Queueing
Delay (PCU-min)
Average Queueing Delay (s)
Rate Of Queueing Delay (PCU-min/min)
Inclusive Total Queueing Delay
(PCU-min)
Inclusive Average
Queueing Delay (s)
B-AC 0.44 15.46 0.80 C 33.25 133.00 32.89 14.84 0.55 32.90 14.84
C-AB 0.45 7.95 1.67 A 84.30 337.21 75.73 13.47 1.26 75.74 13.48
C-A - - - - 101.95 407.79 - - - - -
A-B - - - - 10.75 43.00 - - - - -
A-C - - - - 130.50 522.00 - - - - -
StreamTotal Demand
(PCU/TS)Junction Arrivals
(PCU)Entry Flow (PCU/TS)
Pedestrian Demand (Ped/TS)
Capacity (PCU/TS)
RFCStart Queue
(PCU)End Queue
(PCU)Delay
(s)LOS
B-AC 48.00 48.00 47.20 0.00 109.05 0.440 0.00 0.80 15.114 C
C-AB 82.06 82.06 80.93 0.00 251.08 0.327 0.00 1.13 5.703 A
C-A 118.94 118.94 118.94 0.00 - - - - - -
A-B 13.00 13.00 13.00 0.00 - - - - - -
A-C 130.00 130.00 130.00 0.00 - - - - - -
Generated on 26/04/2016 15:10:43 using Junctions 8 (8.0.6.541)
23
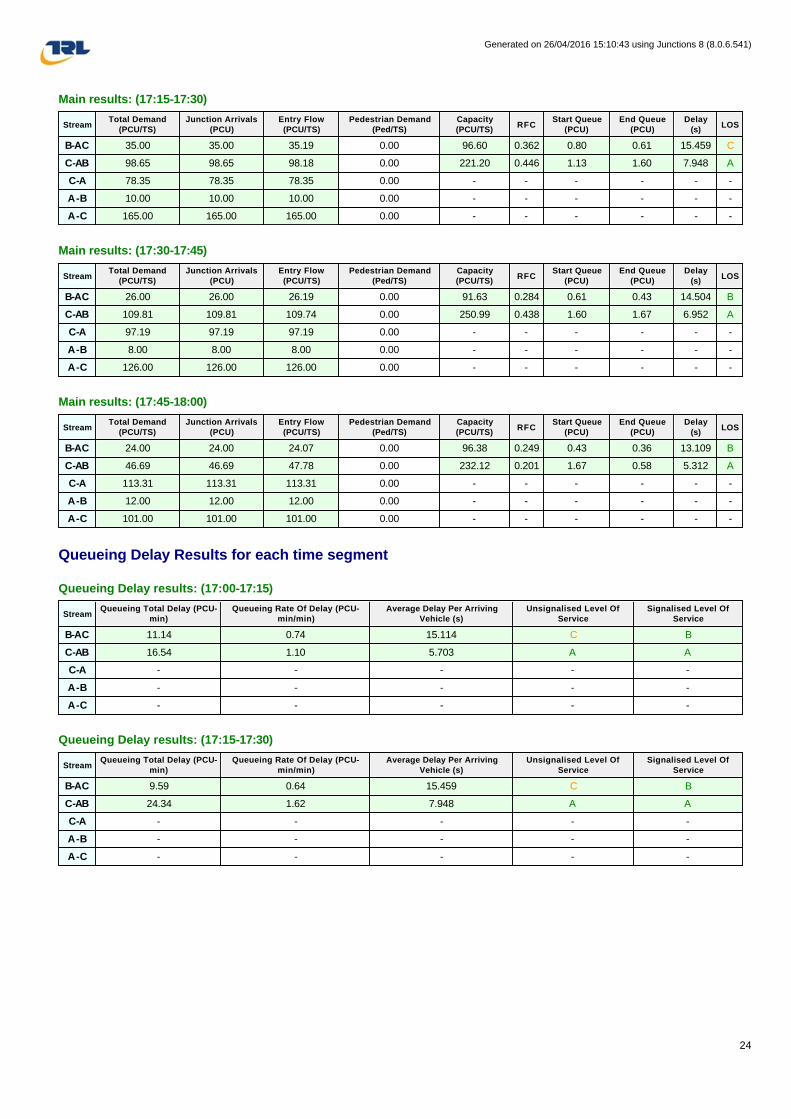
Main results: (17:15-17:30)
Main results: (17:30-17:45)
Main results: (17:45-18:00)
Queueing Delay Results for each time segment
Queueing Delay results: (17:00-17:15)
Queueing Delay results: (17:15-17:30)
StreamTotal Demand
(PCU/TS)Junction Arrivals
(PCU)Entry Flow (PCU/TS)
Pedestrian Demand (Ped/TS)
Capacity (PCU/TS)
RFCStart Queue
(PCU)End Queue
(PCU)Delay
(s)LOS
B-AC 35.00 35.00 35.19 0.00 96.60 0.362 0.80 0.61 15.459 C
C-AB 98.65 98.65 98.18 0.00 221.20 0.446 1.13 1.60 7.948 A
C-A 78.35 78.35 78.35 0.00 - - - - - -
A-B 10.00 10.00 10.00 0.00 - - - - - -
A-C 165.00 165.00 165.00 0.00 - - - - - -
StreamTotal Demand
(PCU/TS)Junction Arrivals
(PCU)Entry Flow (PCU/TS)
Pedestrian Demand (Ped/TS)
Capacity (PCU/TS)
RFCStart Queue
(PCU)End Queue
(PCU)Delay
(s)LOS
B-AC 26.00 26.00 26.19 0.00 91.63 0.284 0.61 0.43 14.504 B
C-AB 109.81 109.81 109.74 0.00 250.99 0.438 1.60 1.67 6.952 A
C-A 97.19 97.19 97.19 0.00 - - - - - -
A-B 8.00 8.00 8.00 0.00 - - - - - -
A-C 126.00 126.00 126.00 0.00 - - - - - -
StreamTotal Demand
(PCU/TS)Junction Arrivals
(PCU)Entry Flow (PCU/TS)
Pedestrian Demand (Ped/TS)
Capacity (PCU/TS)
RFCStart Queue
(PCU)End Queue
(PCU)Delay
(s)LOS
B-AC 24.00 24.00 24.07 0.00 96.38 0.249 0.43 0.36 13.109 B
C-AB 46.69 46.69 47.78 0.00 232.12 0.201 1.67 0.58 5.312 A
C-A 113.31 113.31 113.31 0.00 - - - - - -
A-B 12.00 12.00 12.00 0.00 - - - - - -
A-C 101.00 101.00 101.00 0.00 - - - - - -
StreamQueueing Total Delay (PCU-
min)Queueing Rate Of Delay (PCU-
min/min)Average Delay Per Arriving
Vehicle (s)Unsignalised Level Of
ServiceSignalised Level Of
Service
B-AC 11.14 0.74 15.114 C B
C-AB 16.54 1.10 5.703 A A
C-A - - - - -
A-B - - - - -
A-C - - - - -
StreamQueueing Total Delay (PCU-
min)Queueing Rate Of Delay (PCU-
min/min)Average Delay Per Arriving
Vehicle (s)Unsignalised Level Of
ServiceSignalised Level Of
Service
B-AC 9.59 0.64 15.459 C B
C-AB 24.34 1.62 7.948 A A
C-A - - - - -
A-B - - - - -
A-C - - - - -
Generated on 26/04/2016 15:10:43 using Junctions 8 (8.0.6.541)
24
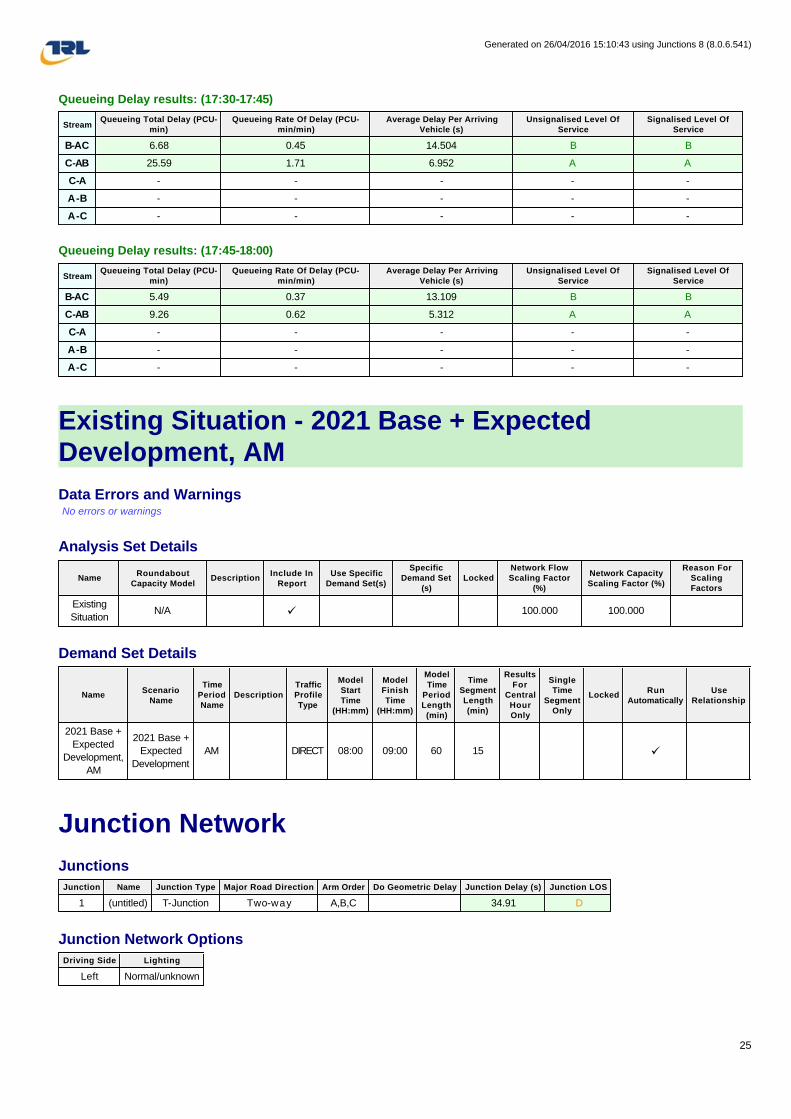
Queueing Delay results: (17:30-17:45)
Queueing Delay results: (17:45-18:00)
Existing Situation - 2021 Base + Expected Development, AM
Data Errors and Warnings No errors or warnings
Analysis Set Details
Demand Set Details
Junction Network
Junctions
Junction Network Options
StreamQueueing Total Delay (PCU-
min)Queueing Rate Of Delay (PCU-
min/min)Average Delay Per Arriving
Vehicle (s)Unsignalised Level Of
ServiceSignalised Level Of
Service
B-AC 6.68 0.45 14.504 B B
C-AB 25.59 1.71 6.952 A A
C-A - - - - -
A-B - - - - -
A-C - - - - -
StreamQueueing Total Delay (PCU-
min)Queueing Rate Of Delay (PCU-
min/min)Average Delay Per Arriving
Vehicle (s)Unsignalised Level Of
ServiceSignalised Level Of
Service
B-AC 5.49 0.37 13.109 B B
C-AB 9.26 0.62 5.312 A A
C-A - - - - -
A-B - - - - -
A-C - - - - -
NameRoundabout
Capacity ModelDescription
Include In Report
Use Specific Demand Set(s)
Specific Demand Set
(s)Locked
Network Flow Scaling Factor
(%)
Network Capacity Scaling Factor (%)
Reason For Scaling Factors
Existing
SituationN/A ü 100.000 100.000
NameScenario
Name
Time Period Name
DescriptionTraffic Profile Type
Model Start Time
(HH:mm)
Model Finish Time
(HH:mm)
Model Time
Period Length (min)
Time Segment Length (min)
Results For
Central Hour Only
Single Time
Segment Only
LockedRun
AutomaticallyUse
Relationship
2021 Base +
Expected
Development,
AM
2021 Base +
Expected
Development
AM DIRECT 08:00 09:00 60 15 ü
Junction Name Junction Type Major Road Direction Arm Order Do Geometric Delay Junction Delay (s) Junction LOS
1 (untitled) T-Junction Two-way A,B,C 34.91 D
Driving Side Lighting
Left Normal/unknown
Generated on 26/04/2016 15:10:43 using Junctions 8 (8.0.6.541)
25

Arms
Arms
Major Arm Geometry
Geometries for Arm C are measured opposite Arm B. Geometries for Arm A (if relevant) are measured opposite Arm D.
Minor Arm Geometry
Slope / Intercept / Capacity
Priority Intersection Slopes and Intercepts
The slopes and intercepts shown above do NOT include any corrections or adjustments.
Streams may be combined, in which case capacity will be adjusted.
Values are shown for the first time segment only; they may differ for subsequent time segments.
Traffic Flows
Demand Set Data Options
Entry Flows
General Flows Data
Arm Arm Name Description Arm Type
A A A52 W Major
B B Luke Lane Minor
C C A52 E Major
ArmWidth of
carriageway (m)Has kerbed central
reserveWidth of kerbed central
reserve (m)Has right turn bay
Width For Right Turn (m)
Visibility For Right Turn (m)
Blocks?Blocking Queue
(PCU)
C 7.00 0.00 2.20 100.00 ü 0.00
ArmMinor Arm Type
Lane Width
(m)
Lane Width
(Left) (m)
Lane Width
(Right) (m)
Width at give-way
(m)
Width at 5m (m)
Width at 10m (m)
Width at 15m (m)
Width at 20m (m)
Estimate Flare
Length
Flare Length (PCU)
Visibility To Left (m)
Visibility To Right (m)
BOne
lane3.40 30 21
Junction StreamIntercept
(PCU/TS)
Slope
for
A-B
Slope
for
A-C
Slope
for
C-A
Slope
for
C-B
1 B-A 129.389 0.090 0.228 0.143 0.326
1 B-C 165.668 0.097 0.246 - -
1 C-B 157.969 0.234 0.234 - -
Default Vehicle
Mix
Vehicle Mix Varies Over Time
Vehicle Mix Varies Over Turn
Vehicle Mix Varies Over Entry
Vehicle Mix Source
PCU Factor
for a HV (PCU)
Default Turning
Proportions
Estimate from
entry/exit counts
Turning Proportions
Vary Over Time
Turning Proportions
Vary Over Turn
Turning Proportions
Vary Over Entry
ü üHV
Percentages2.00 ü ü ü
Arm Profile Type Use Turning Counts Average Demand Flow (PCU/TS) Flow Scaling Factor (%)
A DIRECT ü N/A 100.000
B DIRECT ü N/A 100.000
C DIRECT ü N/A 100.000
Generated on 26/04/2016 15:10:43 using Junctions 8 (8.0.6.541)
26

Direct/Resultant Flows
Direct Flows Data
Turning Proportions
Turning Counts / Proportions (PCU/ TS) - Junction 1 - (08:00-08:15)
Turning Proportions (PCU) - Junction 1 - (08:00-08:15)
Turning Counts / Proportions (PCU/ TS) - Junction 1 - (08:15-08:30)
Turning Proportions (PCU) - Junction 1 - (08:15-08:30)
Time Segment
ArmDirect Demand Entry Flow
(PCU/TS)DirectDemandEntryFlowInPCU
(PCU/TS)Direct Demand Exit Flow
(PCU/TS)Direct Demand Pedestrian Flow
(Ped/TS)
08:00-08:15 A 201.00 201.00
08:00-08:15 B 78.00 78.00
08:00-08:15 C 171.00 171.00
08:15-08:30 A 219.00 219.00
08:15-08:30 B 64.00 64.00
08:15-08:30 C 131.00 131.00
08:30-08:45 A 187.00 187.00
08:30-08:45 B 75.00 75.00
08:30-08:45 C 139.00 139.00
08:45-09:00 A 172.00 172.00
08:45-09:00 B 75.00 75.00
08:45-09:00 C 168.00 168.00
To
From
A B C
A 0.000 17.000 184.000
B 19.000 0.000 59.000
C 139.000 32.000 0.000
To
From
A B C
A 0.00 0.08 0.92
B 0.24 0.00 0.76
C 0.81 0.19 0.00
To
From
A B C
A 0.000 23.000 196.000
B 19.000 0.000 45.000
C 107.000 24.000 0.000
To
From
A B C
A 0.00 0.11 0.89
B 0.30 0.00 0.70
C 0.82 0.18 0.00
Generated on 26/04/2016 15:10:43 using Junctions 8 (8.0.6.541)
27
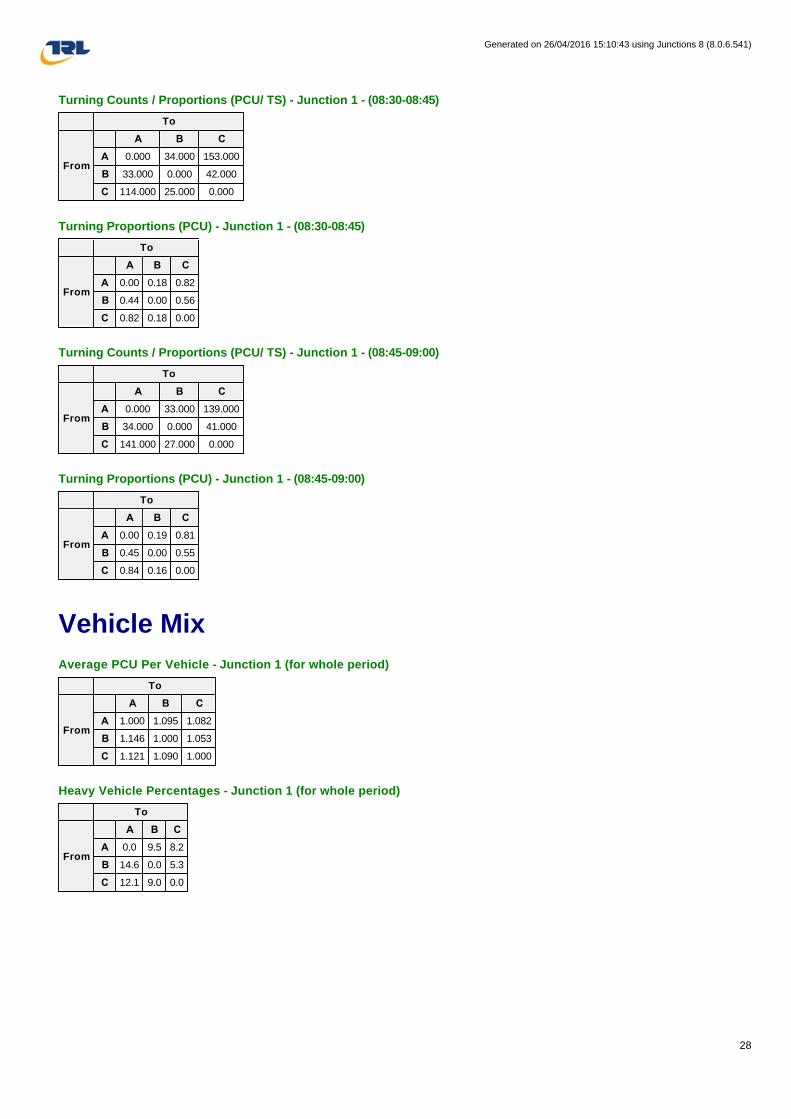
Turning Counts / Proportions (PCU/ TS) - Junction 1 - (08:30-08:45)
Turning Proportions (PCU) - Junction 1 - (08:30-08:45)
Turning Counts / Proportions (PCU/ TS) - Junction 1 - (08:45-09:00)
Turning Proportions (PCU) - Junction 1 - (08:45-09:00)
Vehicle Mix
Average PCU Per Vehicle - Junction 1 (for whole period)
Heavy Vehicle Percentages - Junction 1 (for whole period)
To
From
A B C
A 0.000 34.000 153.000
B 33.000 0.000 42.000
C 114.000 25.000 0.000
To
From
A B C
A 0.00 0.18 0.82
B 0.44 0.00 0.56
C 0.82 0.18 0.00
To
From
A B C
A 0.000 33.000 139.000
B 34.000 0.000 41.000
C 141.000 27.000 0.000
To
From
A B C
A 0.00 0.19 0.81
B 0.45 0.00 0.55
C 0.84 0.16 0.00
To
From
A B C
A 1.000 1.095 1.082
B 1.146 1.000 1.053
C 1.121 1.090 1.000
To
From
A B C
A 0.0 9.5 8.2
B 14.6 0.0 5.3
C 12.1 9.0 0.0
Generated on 26/04/2016 15:10:43 using Junctions 8 (8.0.6.541)
28

Results
Results Summary for whole modelled period
Main Results for each time segment
Main results: (08:00-08:15)
Main results: (08:15-08:30)
Main results: (08:30-08:45)
StreamMax RFC
Max Delay
(s)
Max Queue (PCU)
Max LOS
Average Demand (PCU/TS)
Total Junction Arrivals (PCU)
Total Queueing
Delay (PCU-min)
Average Queueing Delay (s)
Rate Of Queueing Delay (PCU-min/min)
Inclusive Total Queueing Delay
(PCU-min)
Inclusive Average
Queueing Delay (s)
B-AC 0.84 60.65 4.69 F 73.00 292.00 217.61 44.71 3.63 219.45 45.09
C-AB 0.41 7.83 1.50 A 69.41 277.63 65.30 14.11 1.09 65.34 14.12
C-A - - - - 82.84 331.37 - - - - -
A-B - - - - 26.75 107.00 - - - - -
A-C - - - - 168.00 672.00 - - - - -
StreamTotal Demand
(PCU/TS)Junction Arrivals
(PCU)Entry Flow (PCU/TS)
Pedestrian Demand (Ped/TS)
Capacity (PCU/TS)
RFCStart Queue
(PCU)End Queue
(PCU)Delay
(s)LOS
B-AC 78.00 78.00 73.86 0.00 93.04 0.838 0.00 4.14 43.985 E
C-AB 88.94 88.94 87.44 0.00 214.98 0.414 0.00 1.50 7.828 A
C-A 82.06 82.06 82.06 0.00 - - - - - -
A-B 17.00 17.00 17.00 0.00 - - - - - -
A-C 184.00 184.00 184.00 0.00 - - - - - -
StreamTotal Demand
(PCU/TS)Junction Arrivals
(PCU)Entry Flow (PCU/TS)
Pedestrian Demand (Ped/TS)
Capacity (PCU/TS)
RFCStart Queue
(PCU)End Queue
(PCU)Delay
(s)LOS
B-AC 64.00 64.00 65.24 0.00 90.19 0.710 4.14 2.90 40.383 E
C-AB 56.13 56.13 56.72 0.00 188.84 0.297 1.50 0.91 7.638 A
C-A 74.87 74.87 74.87 0.00 - - - - - -
A-B 23.00 23.00 23.00 0.00 - - - - - -
A-C 196.00 196.00 196.00 0.00 - - - - - -
StreamTotal Demand
(PCU/TS)Junction Arrivals
(PCU)Entry Flow (PCU/TS)
Pedestrian Demand (Ped/TS)
Capacity (PCU/TS)
RFCStart Queue
(PCU)End Queue
(PCU)Delay
(s)LOS
B-AC 75.00 75.00 73.80 0.00 90.58 0.828 2.90 4.10 52.624 F
C-AB 58.68 58.68 58.70 0.00 199.38 0.294 0.91 0.89 7.131 A
C-A 80.32 80.32 80.32 0.00 - - - - - -
A-B 34.00 34.00 34.00 0.00 - - - - - -
A-C 153.00 153.00 153.00 0.00 - - - - - -
Generated on 26/04/2016 15:10:43 using Junctions 8 (8.0.6.541)
29
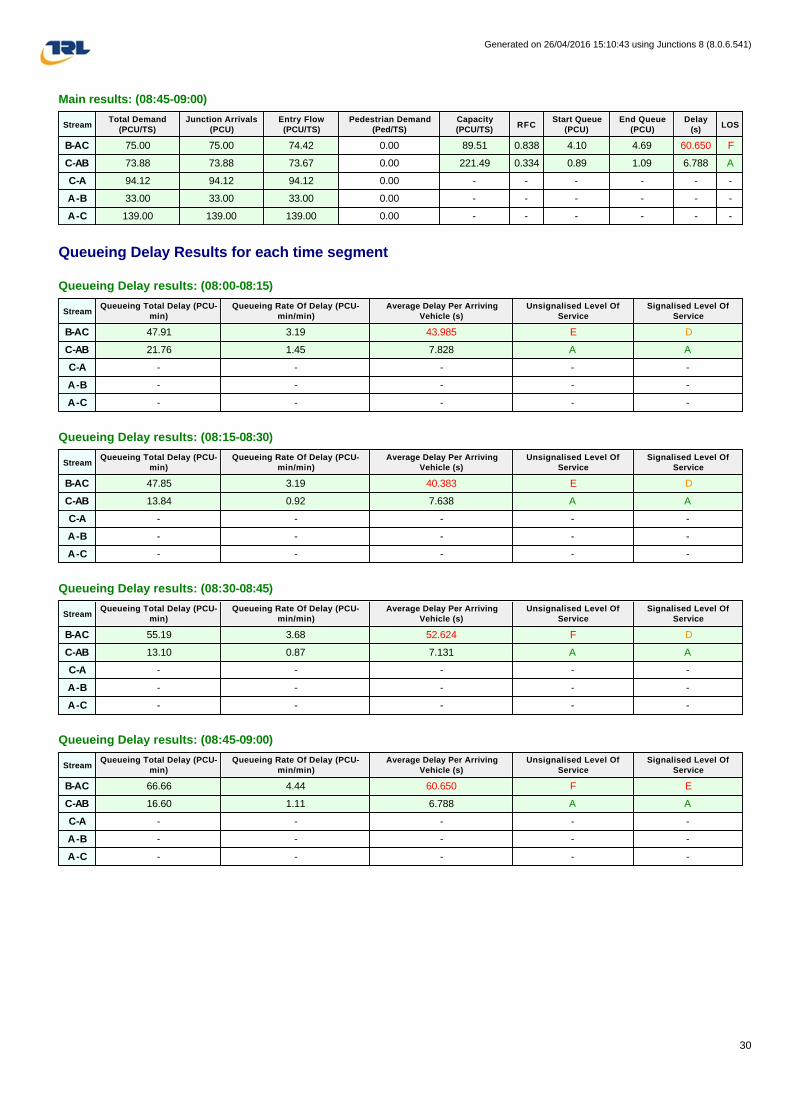
Main results: (08:45-09:00)
Queueing Delay Results for each time segment
Queueing Delay results: (08:00-08:15)
Queueing Delay results: (08:15-08:30)
Queueing Delay results: (08:30-08:45)
Queueing Delay results: (08:45-09:00)
StreamTotal Demand
(PCU/TS)Junction Arrivals
(PCU)Entry Flow (PCU/TS)
Pedestrian Demand (Ped/TS)
Capacity (PCU/TS)
RFCStart Queue
(PCU)End Queue
(PCU)Delay
(s)LOS
B-AC 75.00 75.00 74.42 0.00 89.51 0.838 4.10 4.69 60.650 F
C-AB 73.88 73.88 73.67 0.00 221.49 0.334 0.89 1.09 6.788 A
C-A 94.12 94.12 94.12 0.00 - - - - - -
A-B 33.00 33.00 33.00 0.00 - - - - - -
A-C 139.00 139.00 139.00 0.00 - - - - - -
StreamQueueing Total Delay (PCU-
min)Queueing Rate Of Delay (PCU-
min/min)Average Delay Per Arriving
Vehicle (s)Unsignalised Level Of
ServiceSignalised Level Of
Service
B-AC 47.91 3.19 43.985 E D
C-AB 21.76 1.45 7.828 A A
C-A - - - - -
A-B - - - - -
A-C - - - - -
StreamQueueing Total Delay (PCU-
min)Queueing Rate Of Delay (PCU-
min/min)Average Delay Per Arriving
Vehicle (s)Unsignalised Level Of
ServiceSignalised Level Of
Service
B-AC 47.85 3.19 40.383 E D
C-AB 13.84 0.92 7.638 A A
C-A - - - - -
A-B - - - - -
A-C - - - - -
StreamQueueing Total Delay (PCU-
min)Queueing Rate Of Delay (PCU-
min/min)Average Delay Per Arriving
Vehicle (s)Unsignalised Level Of
ServiceSignalised Level Of
Service
B-AC 55.19 3.68 52.624 F D
C-AB 13.10 0.87 7.131 A A
C-A - - - - -
A-B - - - - -
A-C - - - - -
StreamQueueing Total Delay (PCU-
min)Queueing Rate Of Delay (PCU-
min/min)Average Delay Per Arriving
Vehicle (s)Unsignalised Level Of
ServiceSignalised Level Of
Service
B-AC 66.66 4.44 60.650 F E
C-AB 16.60 1.11 6.788 A A
C-A - - - - -
A-B - - - - -
A-C - - - - -
Generated on 26/04/2016 15:10:43 using Junctions 8 (8.0.6.541)
30
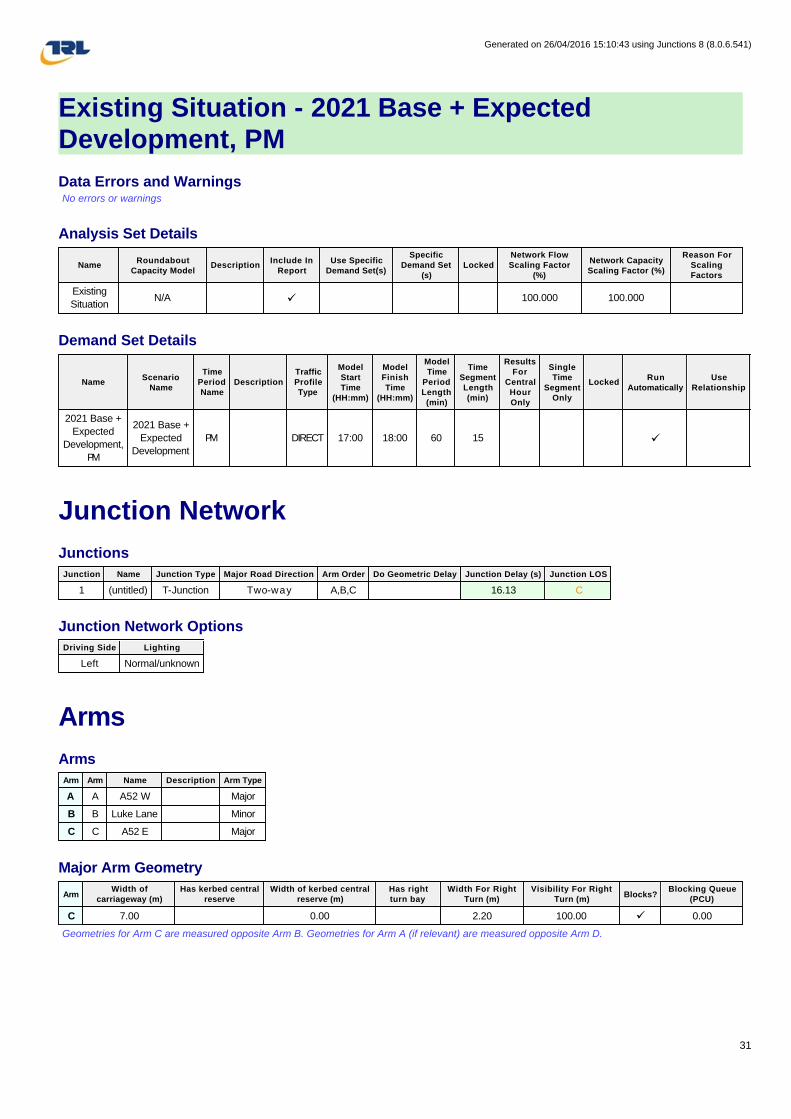
Existing Situation - 2021 Base + Expected Development, PM
Data Errors and Warnings No errors or warnings
Analysis Set Details
Demand Set Details
Junction Network
Junctions
Junction Network Options
Arms
Arms
Major Arm Geometry
Geometries for Arm C are measured opposite Arm B. Geometries for Arm A (if relevant) are measured opposite Arm D.
NameRoundabout
Capacity ModelDescription
Include In Report
Use Specific Demand Set(s)
Specific Demand Set
(s)Locked
Network Flow Scaling Factor
(%)
Network Capacity Scaling Factor (%)
Reason For Scaling Factors
Existing
SituationN/A ü 100.000 100.000
NameScenario
Name
Time Period Name
DescriptionTraffic Profile Type
Model Start Time
(HH:mm)
Model Finish Time
(HH:mm)
Model Time
Period Length (min)
Time Segment Length (min)
Results For
Central Hour Only
Single Time
Segment Only
LockedRun
AutomaticallyUse
Relationship
2021 Base +
Expected
Development,
PM
2021 Base +
Expected
Development
PM DIRECT 17:00 18:00 60 15 ü
Junction Name Junction Type Major Road Direction Arm Order Do Geometric Delay Junction Delay (s) Junction LOS
1 (untitled) T-Junction Two-way A,B,C 16.13 C
Driving Side Lighting
Left Normal/unknown
Arm Arm Name Description Arm Type
A A A52 W Major
B B Luke Lane Minor
C C A52 E Major
ArmWidth of
carriageway (m)Has kerbed central
reserveWidth of kerbed central
reserve (m)Has right turn bay
Width For Right Turn (m)
Visibility For Right Turn (m)
Blocks?Blocking Queue
(PCU)
C 7.00 0.00 2.20 100.00 ü 0.00
Generated on 26/04/2016 15:10:43 using Junctions 8 (8.0.6.541)
31
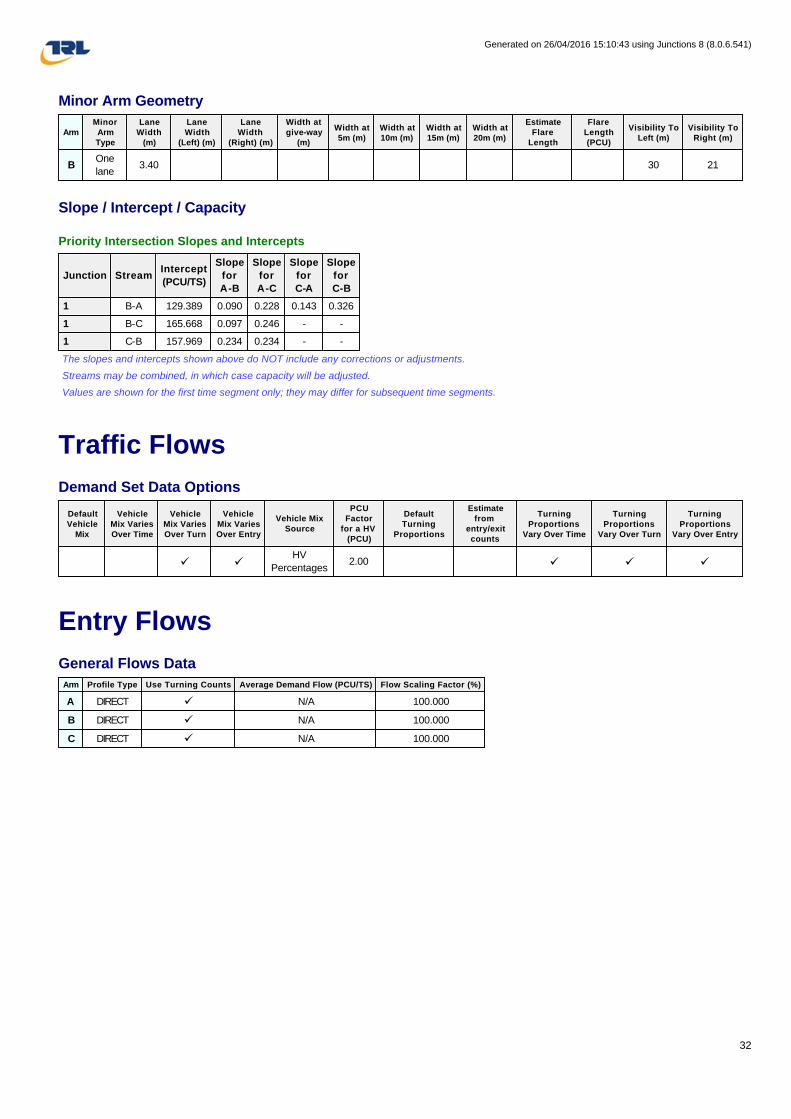
Minor Arm Geometry
Slope / Intercept / Capacity
Priority Intersection Slopes and Intercepts
The slopes and intercepts shown above do NOT include any corrections or adjustments.
Streams may be combined, in which case capacity will be adjusted.
Values are shown for the first time segment only; they may differ for subsequent time segments.
Traffic Flows
Demand Set Data Options
Entry Flows
General Flows Data
ArmMinor Arm Type
Lane Width
(m)
Lane Width
(Left) (m)
Lane Width
(Right) (m)
Width at give-way
(m)
Width at 5m (m)
Width at 10m (m)
Width at 15m (m)
Width at 20m (m)
Estimate Flare
Length
Flare Length (PCU)
Visibility To Left (m)
Visibility To Right (m)
BOne
lane3.40 30 21
Junction StreamIntercept
(PCU/TS)
Slope
for
A-B
Slope
for
A-C
Slope
for
C-A
Slope
for
C-B
1 B-A 129.389 0.090 0.228 0.143 0.326
1 B-C 165.668 0.097 0.246 - -
1 C-B 157.969 0.234 0.234 - -
Default Vehicle
Mix
Vehicle Mix Varies Over Time
Vehicle Mix Varies Over Turn
Vehicle Mix Varies Over Entry
Vehicle Mix Source
PCU Factor
for a HV (PCU)
Default Turning
Proportions
Estimate from
entry/exit counts
Turning Proportions
Vary Over Time
Turning Proportions
Vary Over Turn
Turning Proportions
Vary Over Entry
ü üHV
Percentages2.00 ü ü ü
Arm Profile Type Use Turning Counts Average Demand Flow (PCU/TS) Flow Scaling Factor (%)
A DIRECT ü N/A 100.000
B DIRECT ü N/A 100.000
C DIRECT ü N/A 100.000
Generated on 26/04/2016 15:10:43 using Junctions 8 (8.0.6.541)
32
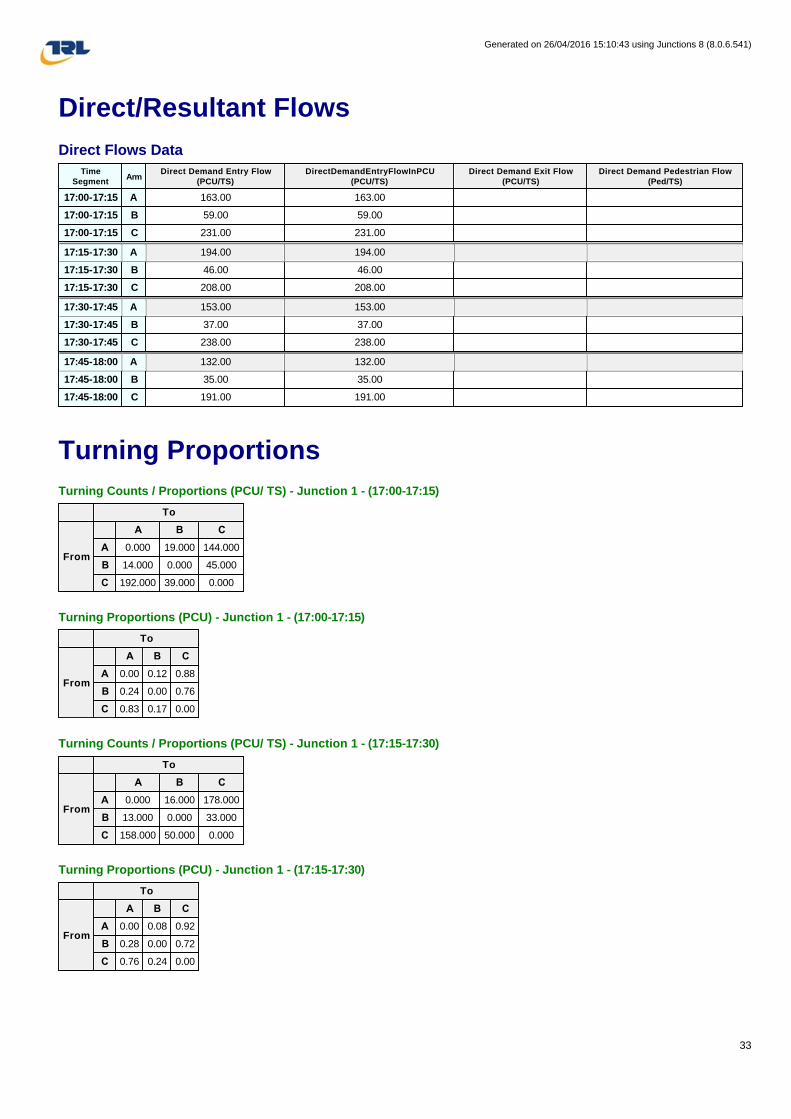
Direct/Resultant Flows
Direct Flows Data
Turning Proportions
Turning Counts / Proportions (PCU/ TS) - Junction 1 - (17:00-17:15)
Turning Proportions (PCU) - Junction 1 - (17:00-17:15)
Turning Counts / Proportions (PCU/ TS) - Junction 1 - (17:15-17:30)
Turning Proportions (PCU) - Junction 1 - (17:15-17:30)
Time Segment
ArmDirect Demand Entry Flow
(PCU/TS)DirectDemandEntryFlowInPCU
(PCU/TS)Direct Demand Exit Flow
(PCU/TS)Direct Demand Pedestrian Flow
(Ped/TS)
17:00-17:15 A 163.00 163.00
17:00-17:15 B 59.00 59.00
17:00-17:15 C 231.00 231.00
17:15-17:30 A 194.00 194.00
17:15-17:30 B 46.00 46.00
17:15-17:30 C 208.00 208.00
17:30-17:45 A 153.00 153.00
17:30-17:45 B 37.00 37.00
17:30-17:45 C 238.00 238.00
17:45-18:00 A 132.00 132.00
17:45-18:00 B 35.00 35.00
17:45-18:00 C 191.00 191.00
To
From
A B C
A 0.000 19.000 144.000
B 14.000 0.000 45.000
C 192.000 39.000 0.000
To
From
A B C
A 0.00 0.12 0.88
B 0.24 0.00 0.76
C 0.83 0.17 0.00
To
From
A B C
A 0.000 16.000 178.000
B 13.000 0.000 33.000
C 158.000 50.000 0.000
To
From
A B C
A 0.00 0.08 0.92
B 0.28 0.00 0.72
C 0.76 0.24 0.00
Generated on 26/04/2016 15:10:43 using Junctions 8 (8.0.6.541)
33

Turning Counts / Proportions (PCU/ TS) - Junction 1 - (17:30-17:45)
Turning Proportions (PCU) - Junction 1 - (17:30-17:45)
Turning Counts / Proportions (PCU/ TS) - Junction 1 - (17:45-18:00)
Turning Proportions (PCU) - Junction 1 - (17:45-18:00)
Vehicle Mix
Average PCU Per Vehicle - Junction 1 (for whole period)
Heavy Vehicle Percentages - Junction 1 (for whole period)
To
From
A B C
A 0.000 14.000 139.000
B 15.000 0.000 22.000
C 190.000 48.000 0.000
To
From
A B C
A 0.00 0.09 0.91
B 0.41 0.00 0.59
C 0.80 0.20 0.00
To
From
A B C
A 0.000 18.000 114.000
B 19.000 0.000 16.000
C 159.000 32.000 0.000
To
From
A B C
A 0.00 0.14 0.86
B 0.54 0.00 0.46
C 0.83 0.17 0.00
To
From
A B C
A 1.000 1.026 1.048
B 1.053 1.000 1.051
C 1.070 1.095 1.000
To
From
A B C
A 0.0 2.6 4.8
B 5.3 0.0 5.1
C 7.0 9.5 0.0
Generated on 26/04/2016 15:10:43 using Junctions 8 (8.0.6.541)
34
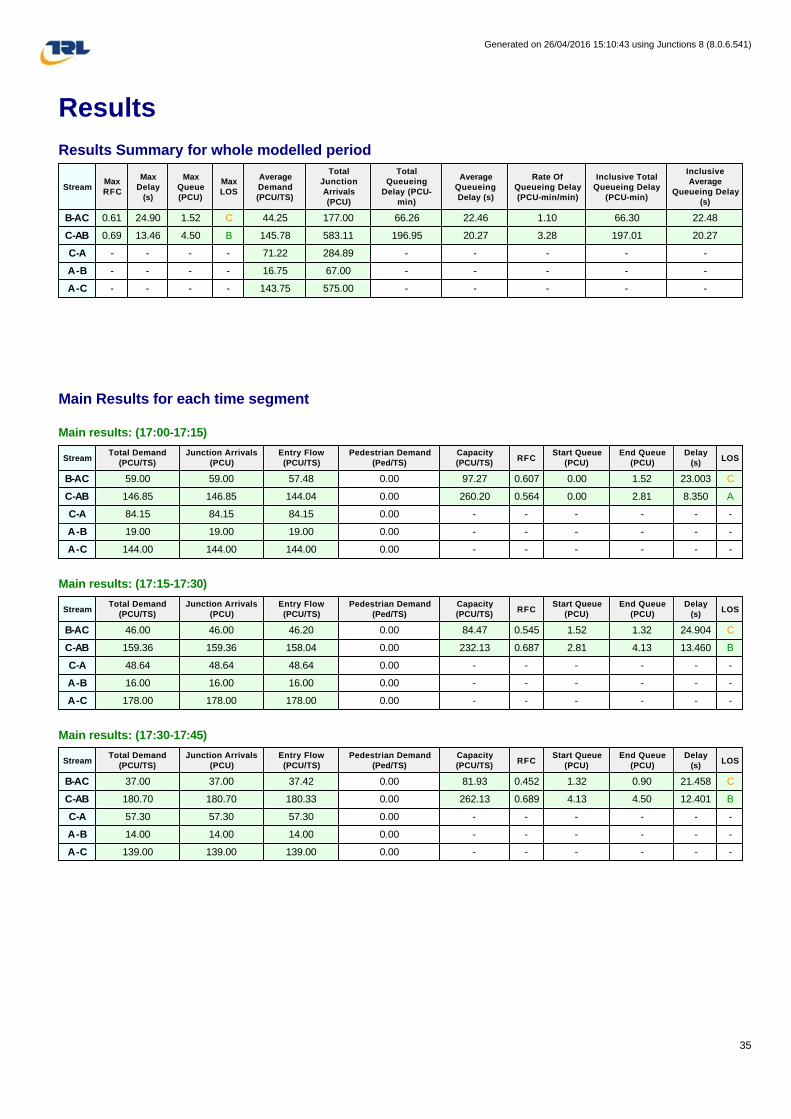
Results
Results Summary for whole modelled period
Main Results for each time segment
Main results: (17:00-17:15)
Main results: (17:15-17:30)
Main results: (17:30-17:45)
StreamMax RFC
Max Delay
(s)
Max Queue (PCU)
Max LOS
Average Demand (PCU/TS)
Total Junction Arrivals (PCU)
Total Queueing
Delay (PCU-min)
Average Queueing Delay (s)
Rate Of Queueing Delay (PCU-min/min)
Inclusive Total Queueing Delay
(PCU-min)
Inclusive Average
Queueing Delay (s)
B-AC 0.61 24.90 1.52 C 44.25 177.00 66.26 22.46 1.10 66.30 22.48
C-AB 0.69 13.46 4.50 B 145.78 583.11 196.95 20.27 3.28 197.01 20.27
C-A - - - - 71.22 284.89 - - - - -
A-B - - - - 16.75 67.00 - - - - -
A-C - - - - 143.75 575.00 - - - - -
StreamTotal Demand
(PCU/TS)Junction Arrivals
(PCU)Entry Flow (PCU/TS)
Pedestrian Demand (Ped/TS)
Capacity (PCU/TS)
RFCStart Queue
(PCU)End Queue
(PCU)Delay
(s)LOS
B-AC 59.00 59.00 57.48 0.00 97.27 0.607 0.00 1.52 23.003 C
C-AB 146.85 146.85 144.04 0.00 260.20 0.564 0.00 2.81 8.350 A
C-A 84.15 84.15 84.15 0.00 - - - - - -
A-B 19.00 19.00 19.00 0.00 - - - - - -
A-C 144.00 144.00 144.00 0.00 - - - - - -
StreamTotal Demand
(PCU/TS)Junction Arrivals
(PCU)Entry Flow (PCU/TS)
Pedestrian Demand (Ped/TS)
Capacity (PCU/TS)
RFCStart Queue
(PCU)End Queue
(PCU)Delay
(s)LOS
B-AC 46.00 46.00 46.20 0.00 84.47 0.545 1.52 1.32 24.904 C
C-AB 159.36 159.36 158.04 0.00 232.13 0.687 2.81 4.13 13.460 B
C-A 48.64 48.64 48.64 0.00 - - - - - -
A-B 16.00 16.00 16.00 0.00 - - - - - -
A-C 178.00 178.00 178.00 0.00 - - - - - -
StreamTotal Demand
(PCU/TS)Junction Arrivals
(PCU)Entry Flow (PCU/TS)
Pedestrian Demand (Ped/TS)
Capacity (PCU/TS)
RFCStart Queue
(PCU)End Queue
(PCU)Delay
(s)LOS
B-AC 37.00 37.00 37.42 0.00 81.93 0.452 1.32 0.90 21.458 C
C-AB 180.70 180.70 180.33 0.00 262.13 0.689 4.13 4.50 12.401 B
C-A 57.30 57.30 57.30 0.00 - - - - - -
A-B 14.00 14.00 14.00 0.00 - - - - - -
A-C 139.00 139.00 139.00 0.00 - - - - - -
Generated on 26/04/2016 15:10:43 using Junctions 8 (8.0.6.541)
35

Main results: (17:45-18:00)
Queueing Delay Results for each time segment
Queueing Delay results: (17:00-17:15)
Queueing Delay results: (17:15-17:30)
Queueing Delay results: (17:30-17:45)
Queueing Delay results: (17:45-18:00)
StreamTotal Demand
(PCU/TS)Junction Arrivals
(PCU)Entry Flow (PCU/TS)
Pedestrian Demand (Ped/TS)
Capacity (PCU/TS)
RFCStart Queue
(PCU)End Queue
(PCU)Delay
(s)LOS
B-AC 35.00 35.00 35.19 0.00 88.06 0.397 0.90 0.71 17.970 C
C-AB 96.20 96.20 99.26 0.00 243.08 0.396 4.50 1.44 6.944 A
C-A 94.80 94.80 94.80 0.00 - - - - - -
A-B 18.00 18.00 18.00 0.00 - - - - - -
A-C 114.00 114.00 114.00 0.00 - - - - - -
StreamQueueing Total Delay (PCU-
min)Queueing Rate Of Delay (PCU-
min/min)Average Delay Per Arriving
Vehicle (s)Unsignalised Level Of
ServiceSignalised Level Of
Service
B-AC 20.13 1.34 23.003 C C
C-AB 40.11 2.67 8.350 A A
C-A - - - - -
A-B - - - - -
A-C - - - - -
StreamQueueing Total Delay (PCU-
min)Queueing Rate Of Delay (PCU-
min/min)Average Delay Per Arriving
Vehicle (s)Unsignalised Level Of
ServiceSignalised Level Of
Service
B-AC 20.55 1.37 24.904 C C
C-AB 63.08 4.21 13.460 B B
C-A - - - - -
A-B - - - - -
A-C - - - - -
StreamQueueing Total Delay (PCU-
min)Queueing Rate Of Delay (PCU-
min/min)Average Delay Per Arriving
Vehicle (s)Unsignalised Level Of
ServiceSignalised Level Of
Service
B-AC 14.39 0.96 21.458 C C
C-AB 69.95 4.66 12.401 B B
C-A - - - - -
A-B - - - - -
A-C - - - - -
StreamQueueing Total Delay (PCU-
min)Queueing Rate Of Delay (PCU-
min/min)Average Delay Per Arriving
Vehicle (s)Unsignalised Level Of
ServiceSignalised Level Of
Service
B-AC 11.19 0.75 17.970 C B
C-AB 23.81 1.59 6.944 A A
C-A - - - - -
A-B - - - - -
A-C - - - - -
Generated on 26/04/2016 15:10:43 using Junctions 8 (8.0.6.541)
36

T16512 Brailsford Parish Council
PTB Transport Planning Ltd T16512 Transport Appraisal Rev A - Email.docx
APPENDIX F - TECHNICAL GUIDANCE NOTE ON VEHICLE-ACTIVATED SIGNS

H:H9\H&T658 15 May 2012
1
Agenda Item No. 4.8
DERBYSHIRE COUNTY COUNCIL MEETING OF CABINET MEMBER – HIGHWAYS AND TRANSPORT
15 May 2012
Report of the Strategic Director – Environmental Services
TECHNICAL GUIDANCE NOTE ON VEHICLE ACTIVATED
SIGNS (1) Purpose of the Report To seek the Cabinet Member’s approval to technical guidance to provide clarity on the use of Vehicle Activated Signs (VAS) within Derbyshire. (2) Information and Analysis The reduction of casualties from road collisions continues to be a priority at national and local level. Despite a trend of gradual improvement, these remain a significant problem and, although there was a reduction of 17% from 2010, 330 people were killed or seriously injured on Derbyshire’s roads in 2011. In order to ensure that casualty numbers continue to reduce, the County Council works directly and through the Derby and Derbyshire Road Safety Partnership on a range of interventions involving engineering measures, education, training and publicity. VASs, which display a warning message triggered by the characteristics of an approaching vehicle (such as its speed), are a valuable road safety engineering tool. They have been developed to address the problems of exceeding speed limits, to encourage drivers to approach hazards, such as bends or junctions, at a safe speed, and to provide hazard warnings where conventional signing has not been effective. Analysis of existing sites within Derbyshire shows that, where VASs have been installed as a response to known collision problems, they have resulted in immediate and ongoing improvements in the casualty record. Their use at targeted sites is therefore well founded. Derbyshire still has relatively few VASs with approximately 50 in place and, at the current level of use, there is no reason to believe that the effectiveness of the signage will reduce significantly over time. However, there is a concern that an increase in usage will reduce the overall effectiveness of VASs as road users become more familiar with them. VASs are popular with local communities and many requests are received from parish/town councils for their installation as a solution to known or

H:H9\H&T658 15 May 2012
2
perceived road safety problems. Their relatively low cost has led to an increase over time in parishes requesting permission to install, and to fund, their own signs where County Council funding cannot be justified. Whilst this desire for VASs is understandable, and will be reflected as far as possible in County Council programmes, the use of VASs in these circumstances has the potential to lead both to the proliferation of signage and to reduced effectiveness. It is therefore considered that a protocol is needed which can be used both to determine the priorities for County Council investment in VAS and to inform other bodies about where signs will be deployed and where installation is likely to be refused. Attached, as Appendix 1 to this report, is a proposed Technical Guidance Note which sets out the circumstances under which VASs are likely to be approved and installed, and the type of sign suitable for different circumstances. Importantly, it also sets out requirements for ongoing monitoring and, where appropriate, removal. If approved, this guidance will assist interested parties to understand the applicability of VASs to their local road safety concerns. It will also assist officers in responding to these concerns and in considering the suitability of VASs as a local solution. (3) Financial Considerations VASs, where funded by the County Council, are provided through Highways and Transport Capital Programmes, as approved through Environmental Services Department Service Plans. In preparing this report the relevance of the following factors has been considered: legal, prevention of crime and disorder, equality and diversity, human resources, environmental, health, property and transport considerations. (4) Key Decision No. (5) Call-In Is it required that call-in be waived in respect of the decisions proposed in the report? No. (6) Background Papers Analysis of the effectiveness of VASs in Derbyshire is available from the Environmental Services Department. Officer contact details - Jim Seymour, extension 38557. (7) OFFICER’S RECOMMENDATION That the Cabinet Member approves the Technical Guidance Note on Vehicle Activated Signs which forms Appendix 1 of this report.
Ian Stephenson Strategic Director – Environmental Services

H:H9\H&T658 15 May 2012
3
Draft Derbyshire County Council Technical Guidance Note on Vehicle Activated Signs 1. Introduction The intention of this guidance is to supplement the County Council’s Local Transport Plan Investment Protocol (October 2011). This, through Policy IP83, dictates that infrastructure, which creates a net increase for the authority to maintain, should be used sparingly, and in policy IP42 it identifies Vehicle Activated Signs (VAS) specifically, as falling into this category, but with detailed policy to be developed. This guidance puts in place the more detailed procedures to be followed in considering the installation of permanent, temporary or mobile VAS. It will be reviewed as and when required by any revision of the Investment Protocol. 2. Technical Guidance 1) Permanent and Temporary VAS - Inclusion in County Council Programmes
a) VAS should be considered at sites that have a collision history associated with inappropriate speed, or a hazard, that has not been satisfactorily remedied by standard signing. Other signing means must have been tried and have failed; the site must have been subject to a recent speed survey to determine justification for a VAS installation.
b) VAS displaying a speed limit should be located at sites which have a history of a minimum of 6 injury collisions within 1km over the previous 3 years, and where speed has been a factor in all or some.
c) VAS displaying a speed limit should be located at sites where the results of traffic surveys show the 85th percentile1 speed is at least 10% over limit +2mph measured over 7 days.
d) Hazard warning VAS should be located at sites which have a history of a minimum of 6 injury collisions within 1km over the previous 3 years, and where the hazard has been the cause.
e) Requests for VAS that meet these criteria should be prioritised on the basis of a
calculated estimate of casualty reduction benefits.
f) The flexibility of temporary VAS means they are the preferred option but the decision on which type of VAS to be used should be made on a case by case basis. To retain effectiveness, temporary VAS should remain on site for no longer than 3 months, and should not be redeployed at the same site within 6 months.
g) Any proposal for VAS to be funded through County Council programmes but which
does not meet the above criteria must be justified through an Exception Report in Service Plan preparation processes for permanent installations or via a Cabinet Member report for temporary installations.
(1) 85th percentile is the speed at which up to 85 per cent of the traffic is travelling.
H:H9\H&T658 15 May 2012
4
2) Installation and Monitoring Criteria a) VAS warning of a hazard should be set to operate at the 50th percentile2 speed
measured before installation. However, discretion may be used to change this depending on the road conditions.
b) VAS displaying a speed limit should normally be set to operate at the speed limit + 2mph. However, discretion may be used to change this depending on the road conditions.
c) The section of road in advance of the VAS must be straight over a reasonable distance to maximise visibility to the sign.
d) There should be little or no vegetation or street furniture that will block the view of the sign or affect the working of the radar equipment.
e) There must be sufficient footway or roadside verge to install the sign. There must be reasonable access to a power supply.
f) The sign should, wherever possible, not be intrusive to nearby residential properties and early consultation should be sought to establish residents’ views. If the sign is proposed within the Peak District National Park, early consultation with the National Park Authority should be sought.
g) VAS displaying a speed limit should be located between 100 and 200 metres beyond the start of the posted speed limit sign, except in urban areas with street lighting where a 30mph speed limit operates and where repeater signs are not allowed.
h) VAS warning of a hazard should be located between 50 and 100 metres in advance of that hazard.
i) Permanent VAS should be routinely inspected every six months and provided with
regular maintenance, such as cleaning the sign face, removing any obstructing foliage and ensuring that the vehicle detection system is functioning correctly.
j) All VAS installations should be monitored for effectiveness by regular analysis of speed data and collision records. Any that are considered ineffective should be removed.
3) Permanent and Temporary VAS - Funding by Borough, District or Parish/Town
Councils Where a local council has requested a VAS which meets criteria for inclusion in the County Council’s programmes but is a low priority for installation at the County Council’s expense, then the local council may fund the installation. It must undertake to be responsible for all costs, including long-term maintenance for the life of the installation, and removal if required. All selection, installation and monitoring criteria above will apply, with the exception of criteria 1) e) and g). 4) Mobile VAS Mobile VAS may be deployed in locations which would not meet the criteria for permanent or temporary sites. Decisions on where they may be deployed, and the length of deployment, should be taken through established selection and consultation procedures of the sign’s owner, either the County Council or Derby and Derbyshire Road Safety Partnership. The owner may seek contributions to costs from the local council requesting the installation. In no circumstances should mobile VAS be deployed for longer than the three month limit applying to temporary installations.
(2) 50th percentile is the speed at which up to 50 per cent of the traffic is travelling.

T16512 Brailsford Parish Council
PTB Transport Planning Ltd T16512 Transport Appraisal Rev A - Email.docx
APPENDIX G - LHA EMAIL CORRESPONDENCE
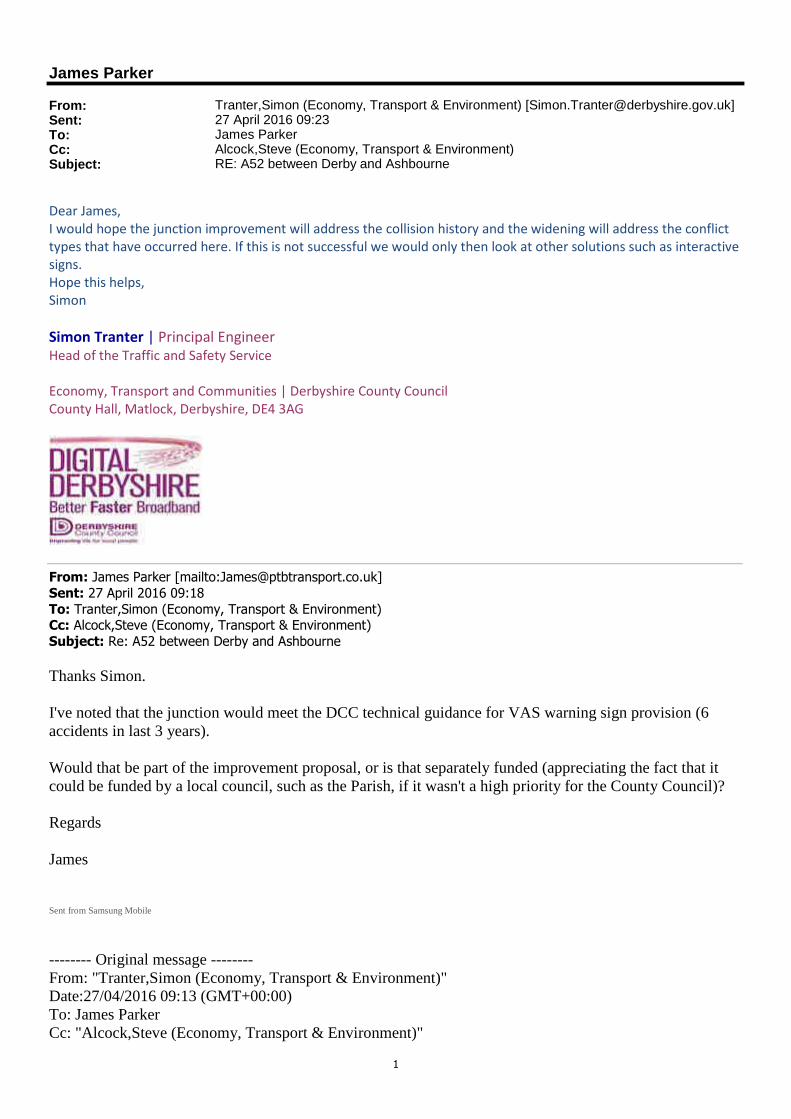
1
James Parker
From: Tranter,Simon (Economy, Transport & Environment) [[email protected]]Sent: 27 April 2016 09:23To: James ParkerCc: Alcock,Steve (Economy, Transport & Environment)Subject: RE: A52 between Derby and Ashbourne
Dear James,
I would hope the junction improvement will address the collision history and the widening will address the conflict
types that have occurred here. If this is not successful we would only then look at other solutions such as interactive
signs.
Hope this helps,
Simon
Simon Tranter | Principal Engineer
Head of the Traffic and Safety Service
Economy, Transport and Communities | Derbyshire County Council
County Hall, Matlock, Derbyshire, DE4 3AG
From: James Parker [mailto:[email protected]]
Sent: 27 April 2016 09:18
To: Tranter,Simon (Economy, Transport & Environment)
Cc: Alcock,Steve (Economy, Transport & Environment)
Subject: Re: A52 between Derby and Ashbourne
Thanks Simon.
I've noted that the junction would meet the DCC technical guidance for VAS warning sign provision (6 accidents in last 3 years).
Would that be part of the improvement proposal, or is that separately funded (appreciating the fact that it could be funded by a local council, such as the Parish, if it wasn't a high priority for the County Council)?
Regards James Sent from Samsung Mobile
-------- Original message --------
From: "Tranter,Simon (Economy, Transport & Environment)" Date:27/04/2016 09:13 (GMT+00:00)
To: James Parker
Cc: "Alcock,Steve (Economy, Transport & Environment)"

2
Subject: RE: A52 between Derby and Ashbourne
Dear James,
Yes it’s the one with two laybys positioned on the Ashbourne side of the junction and the side road is Derby Lane.
We don’t have any drawings yet as it’s still early days. The only worry about a scheme is perhaps the need to
relocate statutory undertakers equipment which is always expensive. I have asked our design team to make these
investigations and enquiries soon so we know what can be achieved with the budget available.
Hope this helps,
Regards,
Simon
Simon Tranter | Principal Engineer
Head of the Traffic and Safety Service
Economy, Transport and Communities | Derbyshire County Council
County Hall, Matlock, Derbyshire, DE4 3AG
From: James Parker [mailto:[email protected]]
Sent: 27 April 2016 08:28
To: Tranter,Simon (Economy, Transport & Environment)
Cc: Alcock,Steve (Economy, Transport & Environment); ETE Netmanadmin (Economy, Transport & Environment)
Subject: Re: A52 between Derby and Ashbourne
Apologies Simon but is the junction you refer to, the one with Derby Lane?
(I had also noted that the recent accident record was not good here)
Sent from Samsung Mobile
-------- Original message --------
From: "Tranter,Simon (Economy, Transport & Environment)" Date:27/04/2016 08:14 (GMT+00:00)
To: James Parker
Cc: "Alcock,Steve (Economy, Transport & Environment)" , "ETE Netmanadmin (Economy, Transport & Environment)" Subject: RE: A52 between Derby and Ashbourne
Dear James,
There have been numerous road safety measures along the A52 over the years and I share the parishes desire to
keep the route as safe as possible as I do with every road in Derbyshire. As you’ll appreciate putting signs up is not
always the answer and does often have a damaging effect upon the street scene and the environment. Bearing this
in mind, the County Council has an environmental signing code of practice which means we give very careful
thought to all our signing nowadays but saying that we would not hesitate to provide signing if we felt that its
positively contributed to road safety and there were budgets available for the works. I would have to be convinced
that putting up the signs you’ve mentioned actually make a difference to the safety along the route. The ones I have
seen around are usually done in association with speed cameras along routes and in my opinion drivers will only

3
slow down for the cameras but not for the signs. The only criteria would be the Traffic Signs and General Directions
2016 and the associated guidance in the relevant Traffic Signs Manual and of course Derbyshire’s own
environmental signing code of practice which is a DCC policy document.
For your information, a recent trawl of injury collisions along the route has identified a problem at the Painters Lane
junction with the A52 near Ednaston. This was therefore put forward as a safety scheme and I am pleased to say
funding was secured earlier this month for £200,000 to widened the junction and incorporate a right turn facility
and other associated improvements to the junction.
I hope this helps,
Regards,
Simon
Simon Tranter | Principal Engineer
Head of the Traffic and Safety Service
Economy, Transport and Communities | Derbyshire County Council
County Hall, Matlock, Derbyshire, DE4 3AG
Admin – add to confirm – reply email sent status
From: James Parker [mailto:[email protected]]
Sent: 26 April 2016 14:15
To: Tranter,Simon (Economy, Transport & Environment)
Subject: A52 between Derby and Ashbourne
Dear Simon,
I’ve been given your name by one of your colleagues in the DDRSP.
I am currently commissioned by Brailsford Parish Council to look at their village and the operation of the A52,
including safety statistics/PIAs etc.
During my discussions with them recently, they enquired as to the process to get route safety signs put in place
along the length of the A52 (as they have concerns about the entire length, not just the part that passes through
Brailsford, Ednaston and Commonside) – they are thinking along the lines of the signs that state “X number of
accidents in last 3 years” (or similar to this).
Could you clarify the criteria by which such a signage scheme is identified and implemented? I’m simply looking to
inform them what the process would be and why this could (or could not) apply to the A52 at this stage.
I look forward to hearing from you in due course.
Regards,
James Parker
Director

4
PTB Transport Planning Ltd
DDI. 0121 661 4870
M. 07792 970487
W. www.ptbtransport.co.uk
The information contained herein is strictly confidential and intended solely for the addressee. It may contain privileged and confidential
information and if you are not the intended recipient, you must not copy, distribute or take any action in reliance on it. Please contact the
sender immediately on +44 (0) 121 454 5530, or via return of email if you believe you have received this message in error. Please note that we cannot guarantee that this email and/or any attachments are free of viruses; virus scanning is recommended and is the
responsibility of the recipient. PTB Transport Planning Ltd is registered in England and Wales (No. 5930870).
This email or email thread section has been classified CONTROLLED - This email requires controlled access by Council personnel and / or intended recipient(s) only. This email may contain business or personal information.
Think before you print! Save energy and paper. Do you really need to print this email? Derbyshire County Council works to improve the lives of local people by delivering high quality services. You can find out more about us by visiting 'www.derbyshire.gov.uk'. If you want to work for us go to our job pages on 'www.derbyshire.gov.uk/jobs'. You can register for e-mail alerts, download job packs and apply on-line.
Please Note This email is confidential, may be legally privileged and may contain personal views that are not the views of Derbyshire County Council. It is intended solely for the addressee. If this email was sent to you in error please notify us by replying to the email. Once you have done this please delete the email and do not disclose, copy, distribute, or rely on it. Under the Data Protection Act 1998 and the Freedom of Information Act 2000 the contents of this email may be disclosed. Derbyshire County Council reserves the right to monitor both sent and received emails.
This email or email thread section has been classified CONTROLLED - This email requires controlled access by Council personnel and / or intended recipient(s) only. This email may contain business or personal information.
Think before you print! Save energy and paper. Do you really need to print this email? Derbyshire County Council works to improve the lives of local people by delivering high quality services. You can find out more about us by visiting 'www.derbyshire.gov.uk'. If you want to work for us go to our job pages on 'www.derbyshire.gov.uk/jobs'. You can register for e-mail alerts, download job packs and apply on-line.
Please Note This email is confidential, may be legally privileged and may contain personal views that are not the views of Derbyshire County Council. It is intended solely for the addressee. If this email was sent to you in error

5
please notify us by replying to the email. Once you have done this please delete the email and do not disclose, copy, distribute, or rely on it. Under the Data Protection Act 1998 and the Freedom of Information Act 2000 the contents of this email may be disclosed. Derbyshire County Council reserves the right to monitor both sent and received emails.
This email or email thread section has been classified CONTROLLED - This email requires controlled access by Council personnel and / or intended recipient(s) only. This email may contain business or personal information.
Think before you print! Save energy and paper. Do you really need to print this email? Derbyshire County Council works to improve the lives of local people by delivering high quality services. You can find out more about us by visiting 'www.derbyshire.gov.uk'. If you want to work for us go to our job pages on 'www.derbyshire.gov.uk/jobs'. You can register for e-mail alerts, download job packs and apply on-line.
Please Note This email is confidential, may be legally privileged and may contain personal views that are not the views of Derbyshire County Council. It is intended solely for the addressee. If this email was sent to you in error please notify us by replying to the email. Once you have done this please delete the email and do not disclose, copy, distribute, or rely on it. Under the Data Protection Act 1998 and the Freedom of Information Act 2000 the contents of this email may be disclosed. Derbyshire County Council reserves the right to monitor both sent and received emails.
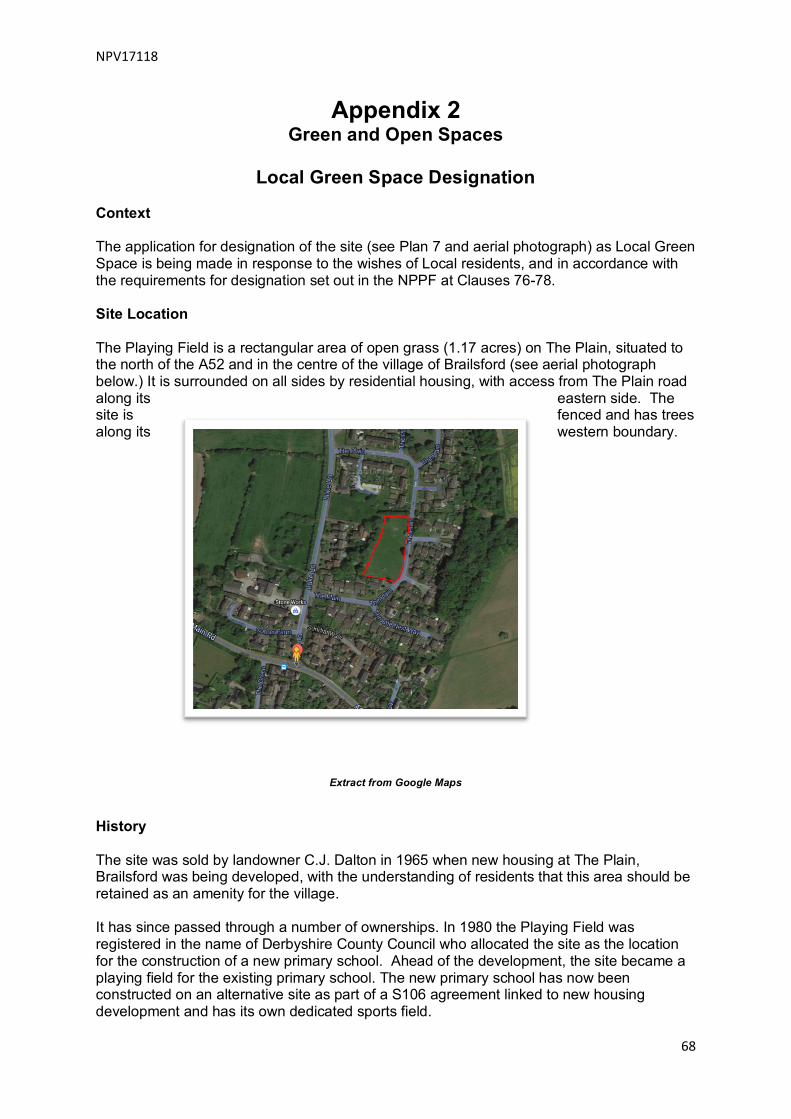
NPV17118
68
Appendix 2 Green and Open Spaces
Local Green Space Designation
Context The application for designation of the site (see Plan 7 and aerial photograph) as Local Green Space is being made in response to the wishes of Local residents, and in accordance with the requirements for designation set out in the NPPF at Clauses 76-78. Site Location The Playing Field is a rectangular area of open grass (1.17 acres) on The Plain, situated to the north of the A52 and in the centre of the village of Brailsford (see aerial photograph below.) It is surrounded on all sides by residential housing, with access from The Plain road along its eastern side. The site is fenced and has trees along its western boundary.
Extract from Google Maps History The site was sold by landowner C.J. Dalton in 1965 when new housing at The Plain, Brailsford was being developed, with the understanding of residents that this area should be retained as an amenity for the village. It has since passed through a number of ownerships. In 1980 the Playing Field was registered in the name of Derbyshire County Council who allocated the site as the location for the construction of a new primary school. Ahead of the development, the site became a playing field for the existing primary school. The new primary school has now been constructed on an alternative site as part of a S106 agreement linked to new housing development and has its own dedicated sports field.

NPV17118
69
Children’s Play equipment was installed on part of the site at its northern end by the Parish Council in c1982 under an informal arrangement with the County Council. A formal lease between the County Council and the Parish Council for 5 years was agreed in 2011 at a fee of £200 p.a. Under this arrangement the Parish Council maintains this part of the site, including grass cutting, arranging regular inspections of the play equipment, and undertaking the required repair and maintenance. The adjacent site has been in constant use as a public playing field ever since it was acquired by Derbyshire County Council. The facilities include a set of goal posts towards the bottom of the field, and a basketball net. The Parish Council has made funds available for this equipment to be replaced as required. Evidence Since its designation as a playing field and the establishment of the Play area this site has become the only accessible open space in Brailsford and is extremely popular with families. Residents’ surveys conducted in 2012 and 2013 identified it as one of the three top village amenities (with the PO/Village store and GP surgery). The site was earmarked for housing in 2013 but met with a high level of objection and the plan was subsequently withdrawn. An application was made by the Parish Council for the land to be designated an Asset of Community Value and this was granted in 2014. Its status as a popular village amenity was confirmed by the all-Parish survey conducted by the Parish Council for the Neighbourhood Plan in 2015. In January 2016 as part of the further evidence gathering for the Neighbourhood Plan a door-to-door survey was conducted in Brailsford to confirm the survey response and to establish residents’ views about the future of the playing field. The Primary school was also asked for responses from the children. A total of 118 survey forms were completed, and 19 letters and emails were also received, which unanimously indicate the local community’s strength of feeling about retaining this area as an open space for the village. Its popularity is due to:
o Its central location which makes it easily accessible to residents. o Its location is key for safety reasons – the site is off a relatively quiet side road
and being overlooked by houses has an innate level of supervision. o It functions as an informal meeting place for all ages and has been used for
both formal and spontaneous sport’s days and football games for many years. o As a recreational space it has considerable health and social benefits for the
community. Compliance with NPPF statements (Clauses 76-78) The NPPF sets out a series of caveats which need to be met before a Local Designation can be confirmed. These are identified in the Table below along with the local position.

NPV17118
70
NPPF Requirement Local Status
green space is in reasonably close proximity to the community it serves;
The Playing Field is located in the centre of the village, adjacent to the main residential area and within 0.5miles of the remainder of the village
green area is demonstrably special to a local community and holds a particular local significance, for example because of its beauty, historic significance, recreational value (including as a playing field), tranquillity or richness of its wildlife
Surveys have demonstrated the continued popularity of the village’s only public open space and its continued use by three generations of residents as a playing field and for wider recreational purposes
the green area concerned is local in character and is not an extensive tract of land.
The Playing Field, including the Children’s Play Area comprises 1.17 acres in the centre of the village and surrounded by housing. It is therefore not an extensive tract of land
The Parish Council believes that there is sufficient evidence to support the designation as Local Green space.
In November 2016, the County Council opened a discussion with the Parish Council to consider the free transfer of the land to the Parish Council subject to agreement that all liabilities were equally transferred. These discussions are ongoing.

NPV17118
71
Appendix 3 The Brailsford & Ednaston Institute
Background The Brailsford and Ednaston Village Institute is central to community life. It was established following a donation to the Parish for the benefit of its residents in 1922. The Institute is also the site of village memorial for those who gave their lives during World Wars I and II and dedication services are held annually. The Institute is an independent community facility owned by the residents. While it is owned by the Parish Council its management is delegated to a fully constituted Institute Committee with its membership comprised of users and local residents. The Parish Council holds two places on the Management Committee. The institute comprises a building and surrounding land ( ha) but not the car park which is leased on annual basis for a peppercorn rent (£1) from a local landowner. In 2010 the Parish Council sought to acquire the car park but the then owner was not willing to support a transfer. Although the land is leased the Institute Committee is responsible for its upkeep and raised funding to have it resurfaced in 2012. When the deed of transfer was made in 1922 it contained a caveat that if the building and land ceased to be used for public purpose, then the landowner who donated the site would be able to repurchase at agricultural land value. The estate from which the donation was made has since been sold, A further transfer of land was made to the Institute by the new landowner in 2012 with the original caveat retained. Usage The Institute is well used by local organisations and community groups. Usage includes:
• Play group for mothers, babies and toddlers • Pre-school for children aged from 2 to 4 who also occupy the outdoor space and paid
for the safety fencing • Scouts including the full range of ages from Beavers to Explorers (ages 5 to 18) • Rainbows and Brownies (ages 5 to 10) • Dance lessons for children over the age of 4 • Keep fit for the over fifties • Folk Dance Group which is open to all • Craft Guild which is open to all • Osmaston Wind Band which is open to any musician.
It also houses the village defibrillator. The Institute hall is used for the annual pantomime which is run entirely by people from the local community and provides a major fund raising activity; it is used for plays and concerts run by the Institute Committee, and for family events such as the Fete and Ceilidh held to celebrate the Queen’s Diamond Jubilee. In bad weather when the church is inaccessible it is also used for services. Prior to the completion of the new Primary School the Institute was also used by the School

NPV17118
72
for its PE time on a daily basis during term time. When the new school opened some additional time became available for other users: some allocation has gone to the pre-School Group. Although the School no longer uses the Institute, with the resultant loss of fee, there remains very little time available to host new events and bookings. Also the current building is not suitable for the range of indoor sports pursuits identified by residents in the Parish Survey. Current Status All maintennce of the Institute is manged by the Committee, largely from its own funding raised from user fees and grants. Some financial support is provided by the Parish Council, which acts as Custodial Trustee, for specific projects such as the replacement of the fire safety doors. The Committee has successfully applied for several Lottery Awards for All and Community Fund grants from the District Council. These have all been used for maintenance, including a kitchen refurbishment. However, the building is badly in need of a major refurbishment, in particular the floor, roof and toilets. In 2012 roof and floor works were costed at c£70k. An application for grant funding for this work was not successful. Any major refurbishment would be beyond the means of the funding directly available to the Committee, although the Parish Council is holding funds which could be donated as match for this purpose. Results of the Parish Survey Responses to the Parish Survey conducted as part of the evidence gathering for the preparation of the Neighbourhood Plan identified the Institute as one of the most valued assets in the Parish, although its use by all residents was somewhat limited; primarily because it cannot provide facilities to meet identified needs. The survey also provided an opportunity for residents to say whether, if finance was available, they would prefer a refurbishment or a total rebuild. The responses were equal with some making a strong case to retain the current building because of its ‘history’, although with the exception of the war memorial it is of no heritage significance. The Institute Committee has conducted its own survey which returned a very small sample, but which was in favour of a rebuild. Future Plans At the request of the Parish Council the Institute Committee is in the process of preparing a business plan for the future of the Institute: this will include commissioning an architectural review to determine what type of refurbishment/redesign would be possible and the associated cost. The cost of the survey will be met by the Parish Council.