© oecd/iea - 2006 international energy agency world energy outlook 2006 scenarios for the world and...
TRANSCRIPT

© OECD/IEA - 2006
INTERNATIONAL ENERGY AGENCY
World Energy World Energy Outlook 2006Outlook 2006
Scenarios for the World and the European Union
Presentation to European Wind Energy Conference
Milan, Italy, 7-10 May 2007

© OECD/IEA - 2006
World Primary Energy Demand
Global demand grows by more than half over the next quarter of a century, with coal use rising most in absolute terms
Oil
Coal
Gas
BiomassNuclear
Other renewables
0
2 000
4 000
6 000
8 000
10 000
12 000
14 000
16 000
18 000
1970 1980 1990 2000 2010 2020 2030
Mto
e

© OECD/IEA - 2006
Reference Scenario:
World Incremental Electricity Generation by Fuel
Most of the additional demand for electricity is expected to be met by coal, which remains the world’s largest source of
electricity to 2030
- 500
0
500
1 000
1 500
2 000
2 500
3 000
3 500
4 000
4 500
2004-2015 2015-2030
TWh
Oil Nuclear Other renewables Hydro Gas Coal

© OECD/IEA - 2006
Annual Increase in Coal Demand
Global coal demand in the recent years has grown much faster than previously – mainly driven by China
milli
on to
nnes
-100
0
100
200
300
400
500
1995 1996 1997 1998 1999 2000 2001 2002 2003 2004 2005
China Rest of the world

© OECD/IEA - 2006
Reference Scenario:
Incremental Coal-fired ElectricityGeneration by Region
7 785 TWh
Over three-quarters of the increase in coal-fired generation is in developing Asia, based on ample coal
reserves
High gas prices boost the role of coal in the OECD
55%
15%
7%
14%
6% 3%
ChinaIndiaRest of developing AsiaOECD North AmericaRest of OECDOther countries
© OECD/IEA - 2006
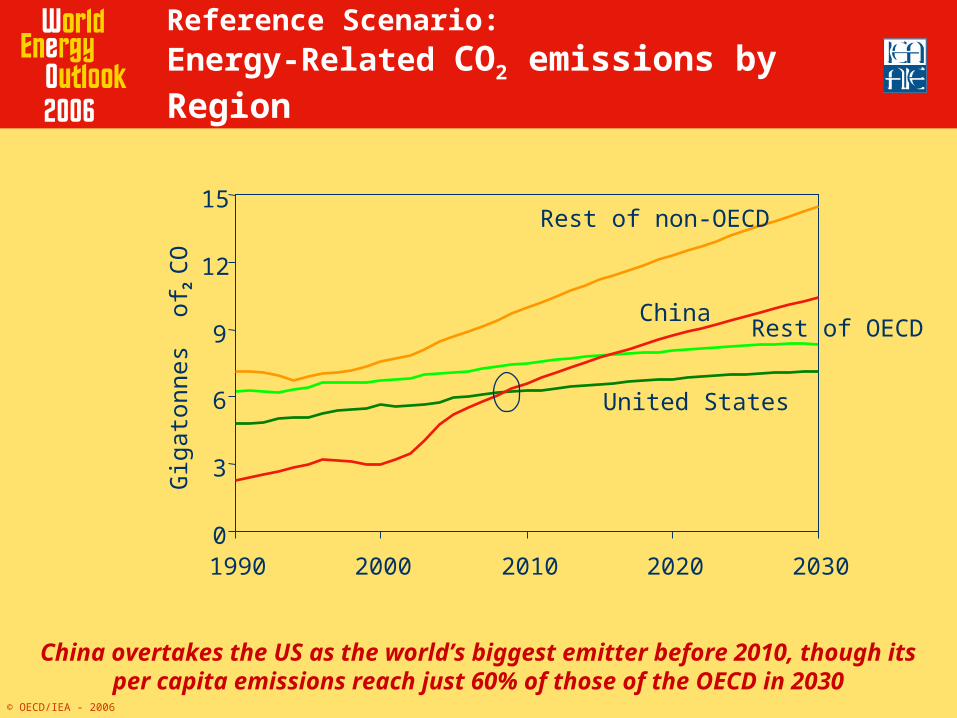
Reference Scenario:Energy-Related CO2 emissions by Region
China overtakes the US as the world’s biggest emitter before 2010, though its per capita emissions reach just 60% of those of
the OECD in 2030
0
3
6
9
12
15
1990 2000 2010 2020 2030
Gig
aton
nes
of C
O 2
United States
China
Rest of non-OECD
Rest of OECD

© OECD/IEA - 2006
Reference Scenario: Energy-Related CO2 Emissions by Fuel
Half of the projected increase in emissions come from new power stations, mainly using coal & mainly located in China &
India
Increase of 14.3 Gt (55%)
0
10
20
30
40
50
1990 2004 2010 2015 2030
billio
n to
nnes
Coal Oil Gas

© OECD/IEA - 2006
INTERNATIONAL ENERGY AGENCY
Alternative Policy Alternative Policy Scenario Scenario

© OECD/IEA - 2006
The Alternative Policy Scenario: Mapping a New Energy Future
The Alternative Policy Scenario analyses impact of government policies under consideration
1 400+ different policies worldwide analysed to Improve efficiency in energy production & use Increase reliance on non-fossil fuels Bolster output of oil & gas in net importing countries
By 2030 energy demand is reduced by 10% - equivalent China’s current consumption – and in 2015 savings are close to Japan’s consumption
By 2030, CO2 emissions are 6.3 Gt lower

© OECD/IEA - 2006
Improved end-use efficiency accounts for over two-thirds of avoided emissions in 2030 in the APS
Alternative Policy Scenario
Reference Scenario
Increased nuclear (10%)Increased renewables (12%)Power sector efficiency & fuel (13%) Electricity end-use efficiency (29%)
Fossil-fuel end-use efficiency (36%)
26
30
34
38
42
2004 2010 2015 2020 2025 2030
Gt o
f CO
2
The Alternative Policy Scenario: Key Policies for CO2 Reduction

© OECD/IEA - 2006
Alternative Policy Scenario:
Shares of non-Hydro Renewable Energy in Power Generation by Region
0% 5% 10% 15% 20% 25%
OECD Europe
Other developing Asia
OECD North America
World
Africa
OECD Pacific
Brazil
China
India
Transition economies
2030 2004
Most of the growth in non-hydro renewables use occurs in OECD Europe, where incentives are the strongest

© OECD/IEA - 2006
Renewed Interest in Hydropower?
The remaining hydropower potential is still large in developing countries
World Hydropower Potential

© OECD/IEA - 2006
Private Investment in Power Infrastructure in Developing Countries, 1990-2004
0
10 000
20 000
30 000
40 000
50 000
60 000
1990 1992 1994 1996 1998 2000 2002 2004
milli
on d
olla
rs (2
005)
Private investment in electricity in developing countries is still a fraction of the 1997 peak…

© OECD/IEA - 2006
World Outlook for Power Generation Renewables (GW installed)
0
100
200
300
400
500
2004 2030 APS
GW
Wind Onshore Wind Offshore Bioenergy Solar PVSolar Thermal Tide/Wave Geothermal
The installed capacity of non hydro renewables increases, helping to curb emissions growth

© OECD/IEA - 2006
Alternative Policy Scenario:
Capital Costs of Renewables-BasedTechnologies
The capital costs of renewables fall over time, with wind power the most competitive for new plant
0 1 000 2 000 3 000 4 000 5 000 6 000
Co-firing
Wind onshore
Wind offshore
Geothermal
Solar thermal
Medium-scale CHP plant
Tide and wave
Solar photovoltaic
Biowaste
dollars (2005) per kW
2030 2004

© OECD/IEA - 2006
Alternative Policy Scenario:
CO2 Emissions per kWh of Electricity Generated
Emissions per unit of electricity fall faster than ever in APS
400
450
500
550
600
650
700
750
1970 1980 1990 2000 2010 2020 2030
gram
mes
of C
O 2 p
er k
Wh
Reference Scenario Alternative Policy Scenario
© OECD/IEA - 2006
INTERNATIONAL ENERGY AGENCY
Focus on the European Focus on the European Union Union

© OECD/IEA - 2006
Focus on European Union: Primary Fuel Mix
Renewable energy and nuclear power are much higher in the APS
0%
10%
20%
30%
40%
50%
60%
70%
80%
90%
100%
2004 Reference Scenarioin 2030
APS in 2030
Coal Oil Gas Nuclear Renewables

© OECD/IEA - 2006
Focus on European Union : Power Generation Capacity Increases
Capacity additions until 2030 are larger than current installed capacity. By 2015 more than a quarter of today’s coal fired
plants will be retired.
0
200
400
600
800
1 000
1 200
1 400
2005 2010 2015 2020 2025 2030
MW
Existing Additions
© OECD/IEA - 2006
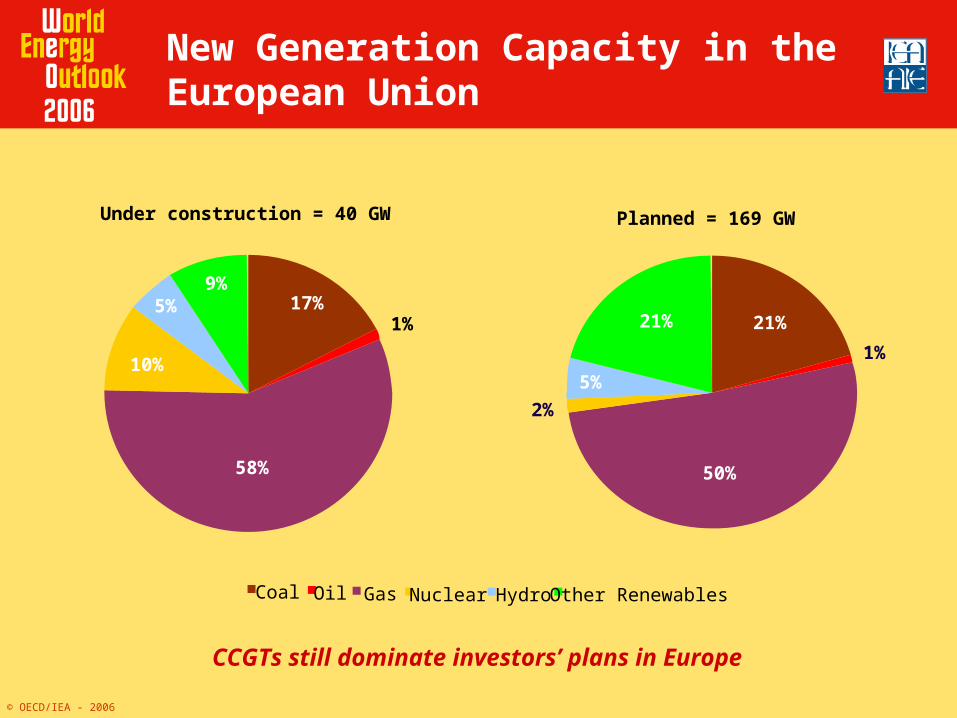
New Generation Capacity in the European Union
CCGTs still dominate investors’ plans in Europe
Under construction = 40 GW
17%1%
58%
10%
5%9%
Coal Oil Gas Nuclear Hydro Other Renewables
21%
1%
50%
2%
5%
21%
Planned = 169 GW

© OECD/IEA - 2006
Focus on European Union: Share of Nuclear & Renewables
2004 2015 2030
The share of carbon free power generation will increase from 46% today to 58% in APS in 2030, while it declines to 41% in the
Reference Scenario
0%
5%
10%
15%
20%
25%
30%
35%
40%
45%
50%
2004
Nuclear in Reference Scenario Renewables in Reference ScenarioAdditional Share of Nuclear in APS Additional Share of Renewables in APS

© OECD/IEA - 2006
EU25 Outlook for Power Generation – non hydro Renewables (GW installed)
Wind power installed capacity increases sixfold between 2004 and 2030
0
50
100
150
200
2004 2030 APS
GW
Wind Onshore Wind Offshore Bioenergy Solar PVSolar Thermal Tide/Wave Geothermal

© OECD/IEA - 2006
Focus on European Union : Energy-Related CO2 emissions
% of Reference Scenario
4% 18%
CO2 emissions are much lower in the Alternative Policy Scenario
3 000
3 200
3 400
3 600
3 800
4 000
4 200
4 400
4 600
1990 1995 2000 2005 2010 2015 2020 2025 2030
Mt o
f CO 2
Reference Scenario Alternative Policy Scenario

© OECD/IEA - 2006
Focus on European Union: CO2 Emissions Reduction, 2030
Efficiency improvements account for most of the emissions reduction in APS
750 Mt of CO2End-use fuel-
efficiency measures , 31%
End-use electricity-efficiency
measures, 25%
Fuel switching and improved
efficiency on the supply side, 12%
Renewables and biofuels, 12%
Nuclear, 20%

© OECD/IEA - 2006
Focus on European Union: Electricity Investment, 2005-2030
Investment needs are $139 billion lower over the projection period
-500
-400
-300
-200
-100
0
100
200
300bi
llion
dol
lars
(200
5)
Additional demand-side investment Avoided supply-side investment Net change in electricity investment

© OECD/IEA - 2006
Some concluding thoughts…
On current trends, the global energy system will remain vulnerable, dirty & expensive
Numbers speak for themselves : no sustainable/meaningful solution without having China and India on board
Policies to promote energy efficiency, renewables & nuclear can make a significant difference
Economic cost of these policies would be more than outweighed by the economic benefits
Urgent government action is needed to incentivise investment in cleaner & more secure energy
The next ten years will lock in technology for up to 60 years China and India - growing at breakneck speed fueled by
energy OECD power plants – significant portion reaching to retirement