* outcomes: part 1 – es20-as1 – assess the impact of air quality on human and environmental...
TRANSCRIPT
*Outcomes:Part 1 – ES20-AS1 –
Assess the impact of air quality on human
and environmental health and the need for
regulations and mitigating
technologies.Part 2 – ES20-AS2 –
Analyze current and potential future effect
of global climate change on Earth and
humans, including the need for adaptation
and mitigation strategies
ES 20 – Unit 2Atmospheric Systems
*Part 1 - ES20-AS1 – Assess the
impact of air quality on human and environmental health and the need for
regulations and mitigating technologies.
AIR QUALITY
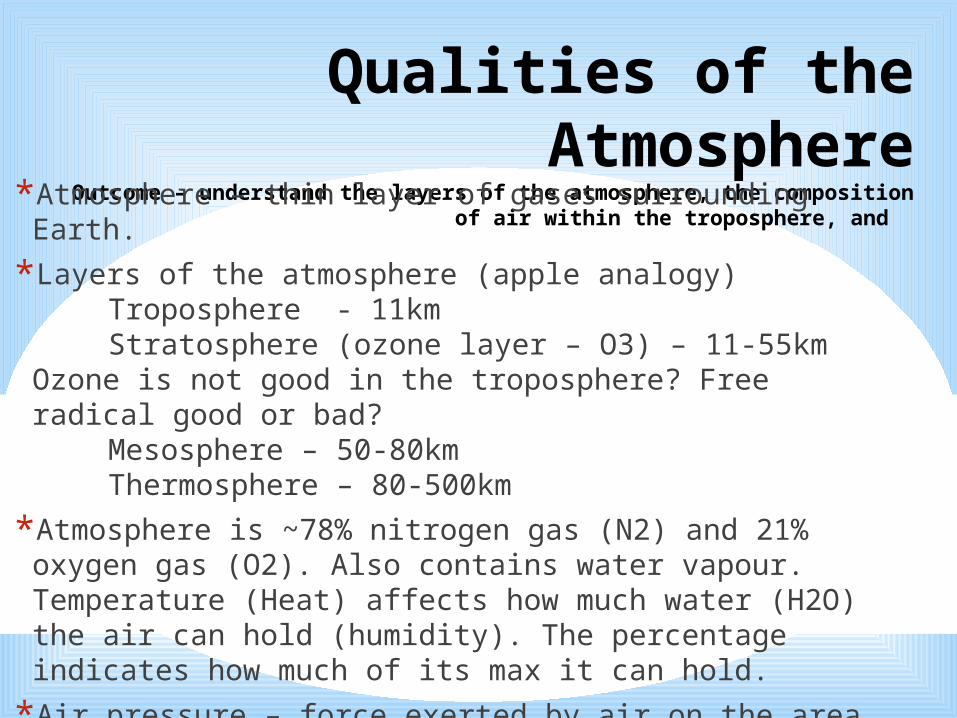
Qualities of the Atmosphere
Outcome – understand the layers of the atmosphere, the composition of air within the troposphere, and
*Atmosphere – thin layer of gases surrounding Earth.
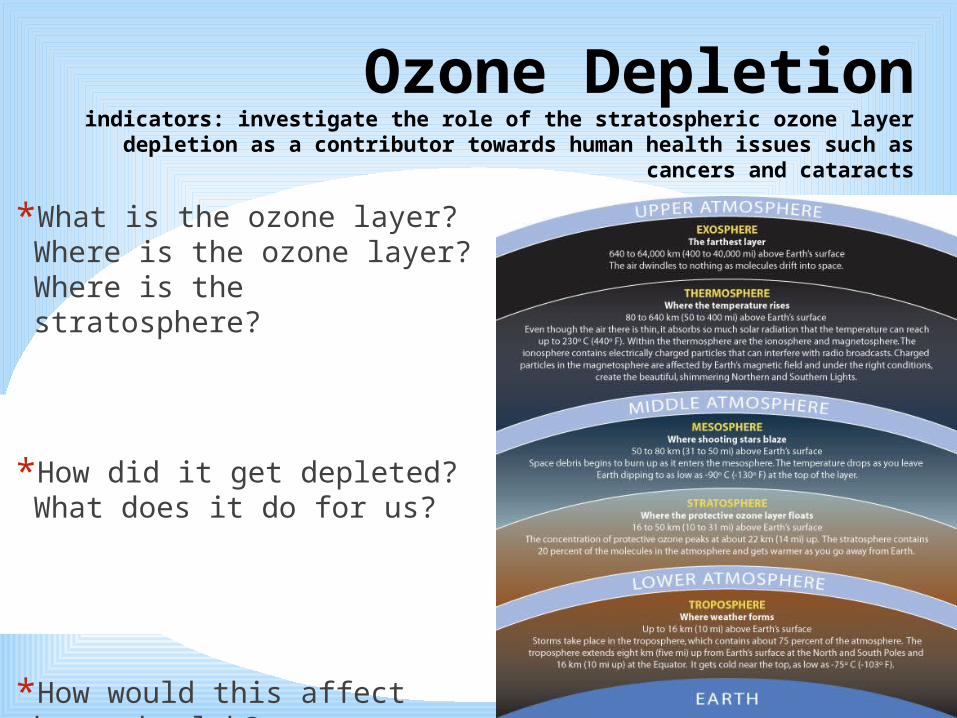
*Layers of the atmosphere (apple analogy) Troposphere - 11km Stratosphere (ozone layer – O3) – 11-55kmOzone is not good in the troposphere? Free radical good or bad? Mesosphere – 50-80km
Thermosphere – 80-500km
*Atmosphere is ~78% nitrogen gas (N2) and 21% oxygen gas (O2). Also contains water vapour. Temperature (Heat) affects how much water (H2O) the air can hold (humidity). The percentage indicates how much of its max it can hold.
*Air pressure – force exerted by air on the area below it. (Higher above sea level = less pressure) Stack o’ book analogy.
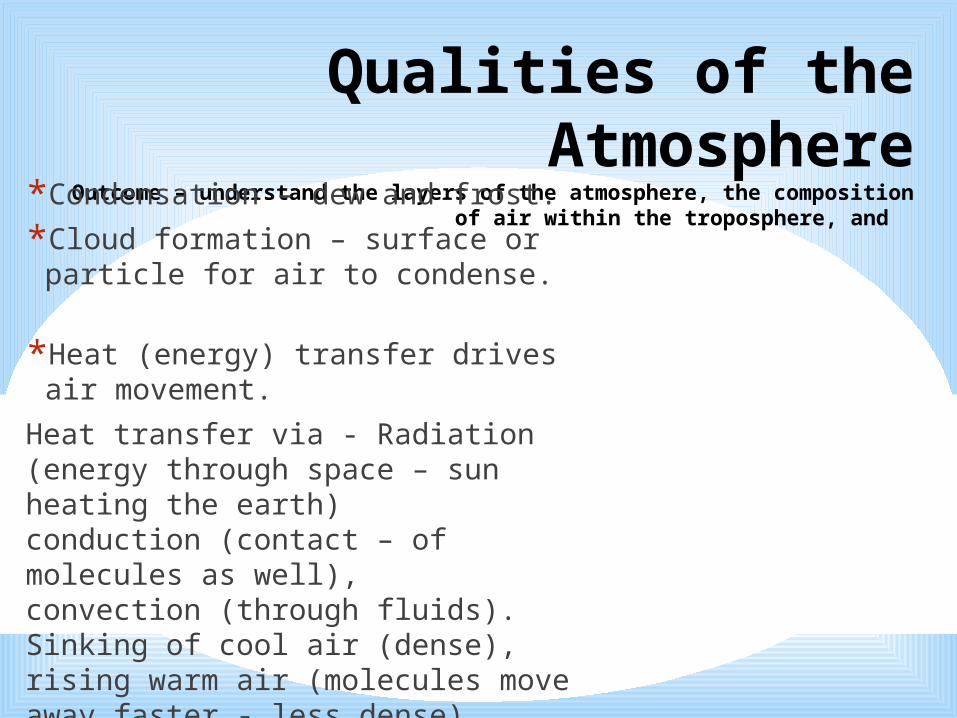
Qualities of the Atmosphere
Outcome – understand the layers of the atmosphere, the composition of air within the troposphere, and
*Condensation – dew and frost.
*Cloud formation – surface or particle for air to condense.
*Heat (energy) transfer drives air movement.
Heat transfer via - Radiation (energy through space – sun heating the earth) conduction (contact – of molecules as well), convection (through fluids). Sinking of cool air (dense), rising warm air (molecules move away faster - less dense).
* Air mass is a large body of air with a similar property of temp, pressure, and humidity). Boundary between them are fronts (warm and cold).Warm, moist air hits cold, dry air (dry skin in winter?)
Humans and Air Qualityindicators: pose questions regarding how human activities and
technologies have influenced air quality (e.g. is air pollution necessary? Where is most polluted and why? What are some local
sources of air pollution?
*Pollution – introduction of contaminants (which negatively affects or impedes the regular or healthy functioning of what it was introduced to). Where are the most polluted places on earth?http://list25.com/the-25-most-polluted-places-on-earth/
*Is air pollution necessary/natural?We exhale a pollutant so yes kind of!But maybe we can make it not so pronounced.
*Local sources of air pollution?Cars, mines, refinery
*Check SK or another locationCanada – www.airhealth.ca/
- http://www.lung.ca/protect-protegez/pollution-pollution/indoor-interieur/school-ecole_e.php
States - http://www.airnow.gov/ - http://www.stateoftheair.org/#
Fun fact – Toronto has a “congestion charge”.
*What is the ozone layer? Where is the ozone layer? Where is the stratosphere?
*How did it get depleted? What does it do for us?
*How would this affect human health?
Ozone Depletionindicators: investigate the role of the stratospheric ozone layer depletion as a contributor towards human health issues such as
cancers and cataracts
*Are you at risk? http://www.lung.ca/protect-protegez/pollution-pollution/indoor-interieur/home-chezvous_e.php
Indoor Air Qualityindicators: examine how contaminants such as radon, carbon monoxide, mold, volatile organic compounds, allergens, and
particulates affect indoor air quality
*Air Pollutant/contaminant – release of damaging materials into the atmosphere or air. - radon – floor level gas causing lung cancer. - carbon monoxide – odourless gas that deprives cells of oxygen by binding with hemoglobin in the blood. - mold/allergens – dander, pollen, and allergens made possible by moisture indoors (keep humidity below 50%) – cough, sneezing, congestion, respiratory, eye irritation - volatile organic compounds – carbon-containing chemicals fumes such as methane, propane, benzene, and butane found in cleaning products – can cause cancer and can react to produce ozone in the troposphere. - particulates – soot, dust, tiny bits of metals, damage lungs and affect breathing
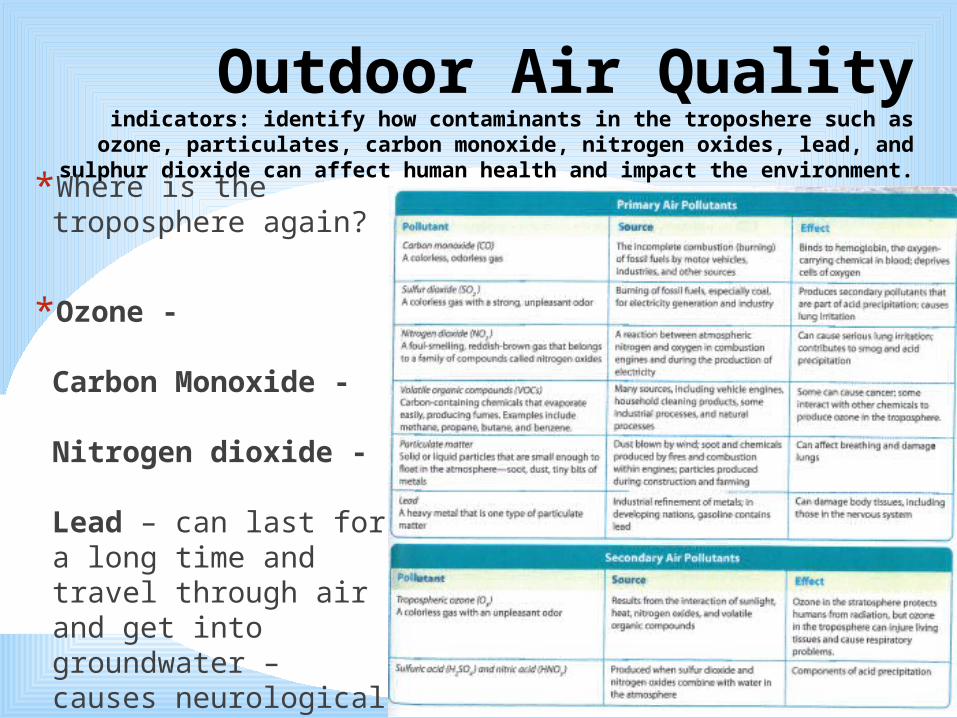
Outdoor Air Qualityindicators: identify how contaminants in the troposhere such as
ozone, particulates, carbon monoxide, nitrogen oxides, lead, and sulphur dioxide can affect human health and impact the environment.*Where is the
troposphere again?
*Ozone -
Carbon Monoxide -
Nitrogen dioxide -
Lead – can last for a long time and travel through air and get into groundwater – causes neurological problems dominantly in children.
Sulphur Dioxide – irritates lungs and contributes to acid precipitation
*How do they affect humanhealth and the environment?
*Acid deposition (deposit) – acid rain which reacts and affects water quality. – eyes burning when soap gets in them example.
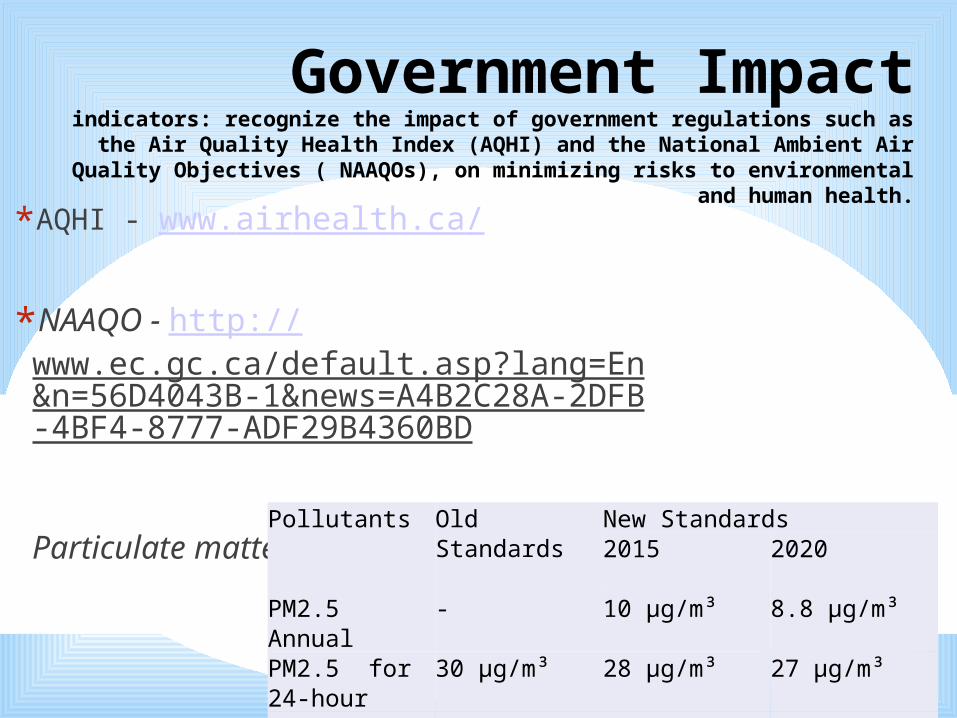
Government Impactindicators: recognize the impact of government regulations such as
the Air Quality Health Index (AQHI) and the National Ambient Air Quality Objectives ( NAAQOs), on minimizing risks to environmental
and human health.*AQHI - www.airhealth.ca/
*NAAQO - http://www.ec.gc.ca/default.asp?lang=En&n=56D4043B-1&news=A4B2C28A-2DFB-4BF4-8777-ADF29B4360BD
Particulate matter?Pollutants Old Standards
New Standards2015 2020
PM2.5 Annual - 10 µg/m³ 8.8 µg/m³PM2.5 for 24-hour
30 µg/m³ 28 µg/m³ 27 µg/m³
Ozone for 8-hour
65 parts per billion
63 parts per billion
62 parts per billion
*Perform experiment.
Assessing Air Qualityindicators: design and carry out a process for collecting and analyzing
data to assess air quality.
*How can we create a process to find out our air quality?
Reducing Contaminantsindicators: examine scientific principles of technologies such as air
scrubbers, baghouse filters, electrostatic precipitators, and catalytic converters that have been developed to reduce contaminants in motor
vehicle and industrial emissions.
*In small groups you will be given one of the following technologies to research (use your phones):
Air ScrubberBaghouse FilterElectrostatic PrecipitatorCatalytic Converter
Then answer the following:What is it? What is it used with? When was it developed?What contaminant does it reduce (and what would this contaminants normally cause)?How does it reduce contaminants?
You will present this information to the class.
Improving air qualityindicators: investigate processes designed to manage and improve
indoor air quality in residential, commercial, and industrial buildings and structures in order to minimize damage to human health.
*In small groups you will be given one of the following locations and asked to research processes that manage and improve air quality within them (use your phones):
ResidentialCommercialIndustrial
Then answer the following:What is it? What is it used with? When was it developed?What contaminant does it reduce (and what would this contaminants normally cause)?How does it reduce contaminants?
You will present this information to the class.
Human Population Density vs Air Quality
indicators: Develop a generalization about the relationship between human population density and air qualityGraphing – create a graph using the information below,
then combine the graphs on excel showing whether or not there is any correlation between human population
Prediction?
Based on this Canada is more likely to have better or worse air quality?
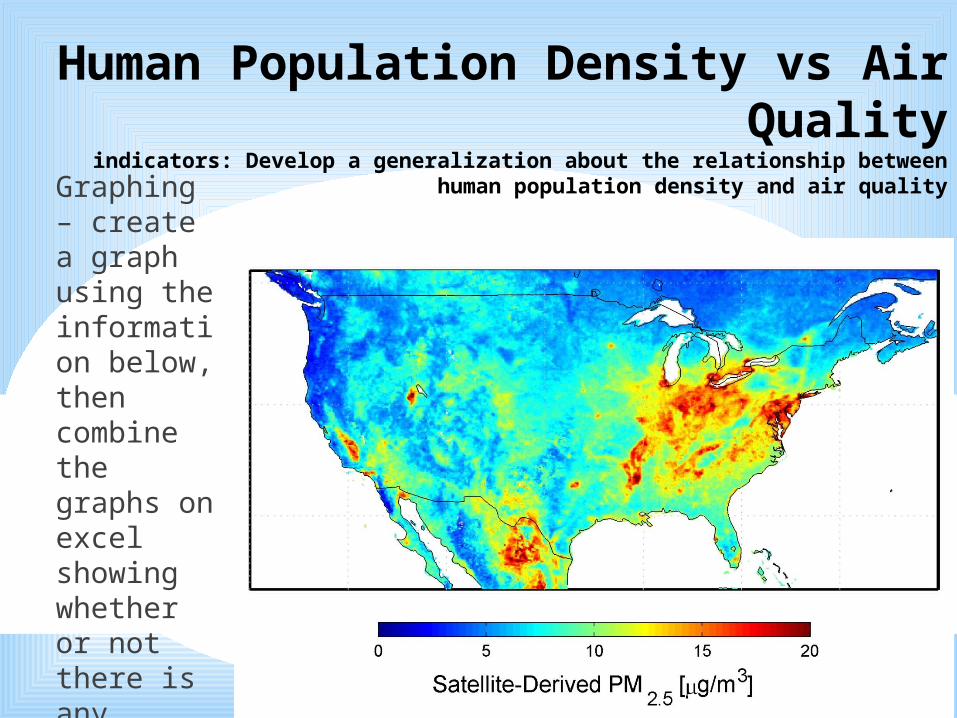
Human Population Density vs Air Quality
indicators: Develop a generalization about the relationship between human population density and air qualityGraphing –
create a graph using the information below, then combine the graphs on excel showing whether or not there is any correlation between human population
Prediction?
Based on this Canada is more likely to have better or worse air quality?
*Part 2 - ES20-AS2 – Analyze
current and potential future effect of global climate change on Earth and humans, including the need for adaptation and
mitigation strategies
CLIMATE CHANGE
Anthropogenic Effects on the Environment
indicators: provide examples on how environmental science contributes to human understanding of the anthropogenic effects on the environment.
Anthropogenic Effect -
Reading skill – when have we heard “anthro” before?
Brainstorm – how might environmental science aid in our understanding of humanity's impact (think about what we've discussed thus far in Part 1).
Increasing Global Temperaturesindicators: explore, on a variety of spatial and temporal scales, major
physical, biological, and social indicators of increasing global temperatures.
Does our world naturally heat and cool?
TED Talk – evidence for and against global warming.
Unifying against Climate Changeindicators: examine the role of policies, summits, models, and organizations,
such as the Canadian Centre for Climate Modeling and Analysis (CCCma), Intergovernmental Panel on Climate Change (IPCC), and Prairie Adaptation
Research Collaborative (PARC), in obtaining a high degree of consensus among scientists regarding anthropogenic climate change.
Do 15.3 – Montreal Protocol, Clean Air Act
Techniques to Create Climate Models
indicators: recognize how techniques such as satellite imagery, ice core samples, and dendrology are used to build climate models that predict
future effects of climate changes with varying degrees of probability and reliability.
Satellite Imagery
Ice Core Samples
Dendrology
Climate Change in SKindicators: explain the economic impact of climate change on agriculture,
energy, forestry, transportation, and/or tourism in Saskatchewan.
Satellite Imagery
Ice Core Samples
Dendrology
Mitigating Climate Changeindicators: examine how policy makers use scientific information, including climate model predictions, to develop adaptation and mitigation strategies
to respond to the effects of climate change.
Satellite Imagery
Ice Core Samples
Dendrology
Climate Change Indications Worldwide
indicators: recognize differences in vulnerability to climate change impacts and rates of change at northern versus equatorial latitiudes, specifically
recognizing the Arctic as an indicator region, and the impact on traditional lifestyles.
Satellite Imagery
Ice Core Samples
Dendrology
Climate Change Indications Worldwide
indicators: Hypothesize how life on Earth might respond to changing global climate given different scenarios change such as sea level rise, extreme
weather events, water shortages, increased spread of disease, and flooding.
Compose a three-part paragraph illustrating a climate change-caused event and how you believe humanity would respond to it. Provide an educated idea on how we may overcome it or how we would fall victim to it.