plenuminvest.dk - plenum - invest &...
TRANSCRIPT
Mobile Marketing Statistics 2015January 15, 2015Mobile marketing analytics
Share this:
1K+Click to share on Twitter (Opens in new window)1K+ Click to share on Google+ (Opens in new window) 1K+Click to share on LinkedIn (Opens in new window)1K+ 2K+Share on Facebook (Opens in new window)2K+
By Danyl Bosomworth
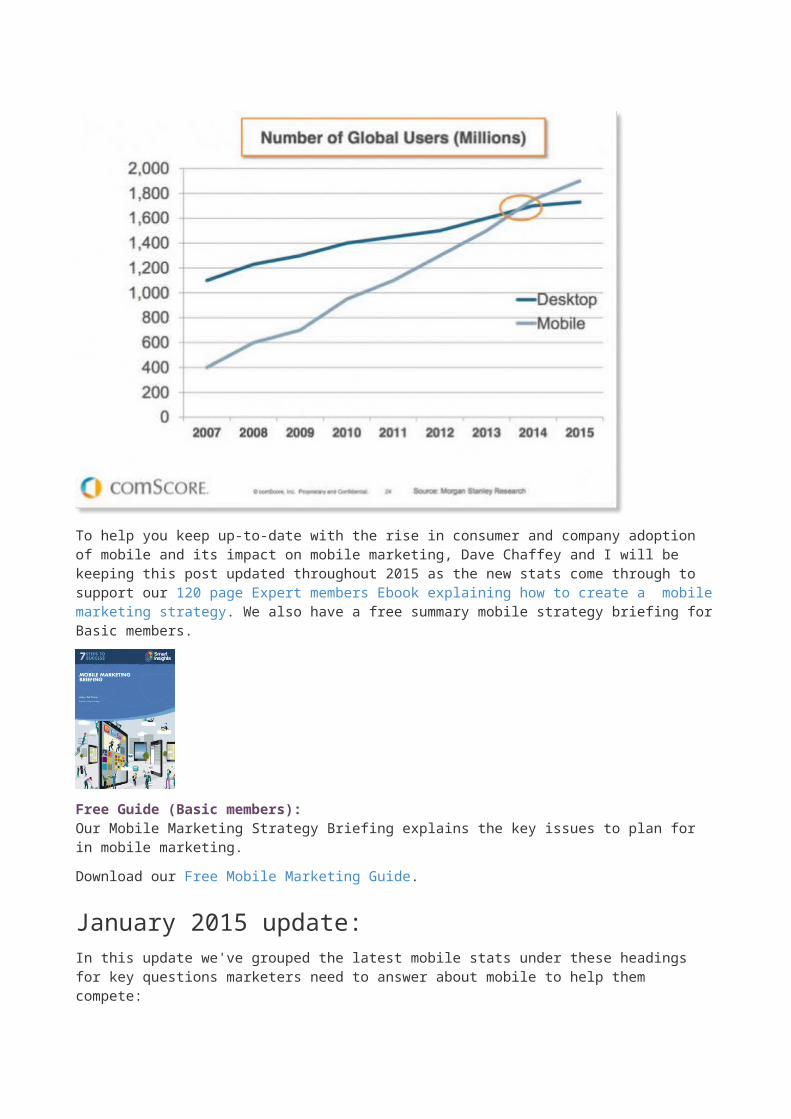
Statistics on mobile usage and adoption to inform your mobile marketing strategy"Mobile to overtake fixed Internet access by 2014" was the huge headline summarising the bold prediction from 2008 by Mary Meeker, an analyst at Kleiner Perkins Caufield Byers who reviews technology trends annually in May (see latest KPCB mobile technology trends).
Well, we're now past the mobile Tipping Point as this report from comScore shows. So it's no longer a case of asking whether mobile marketing important, we know it is! It's now a question of using the statistics to understand how consumers behave when using different types of mobile devices and what their preferences are.
To help you keep up-to-date with the rise in consumer and company adoption of mobile and its impact on mobile marketing, Dave Chaffey and I will be keeping this post updated throughout 2015 as the new stats come through to support our 120 page Expert members Ebook explaining how to create a mobile marketing strategy. We also have a free summary mobile strategy briefing for Basic members.
Free Guide (Basic members):Our Mobile Marketing Strategy Briefing explains the key issues to plan for in mobile marketing.
Download our Free Mobile Marketing Guide.
January 2015 update:In this update we've grouped the latest mobile stats under these headings for key questions marketers need to answer about mobile to help them compete:
Q1. Percentage of consumers using mobile devices Q2. How do consumers research products using mobile search and review sites? Q3. Mobile media time - app vs mobile site usage? Q4. Mobile device conversion rates and visit share for Ecommerce sites?
OK, let's go!
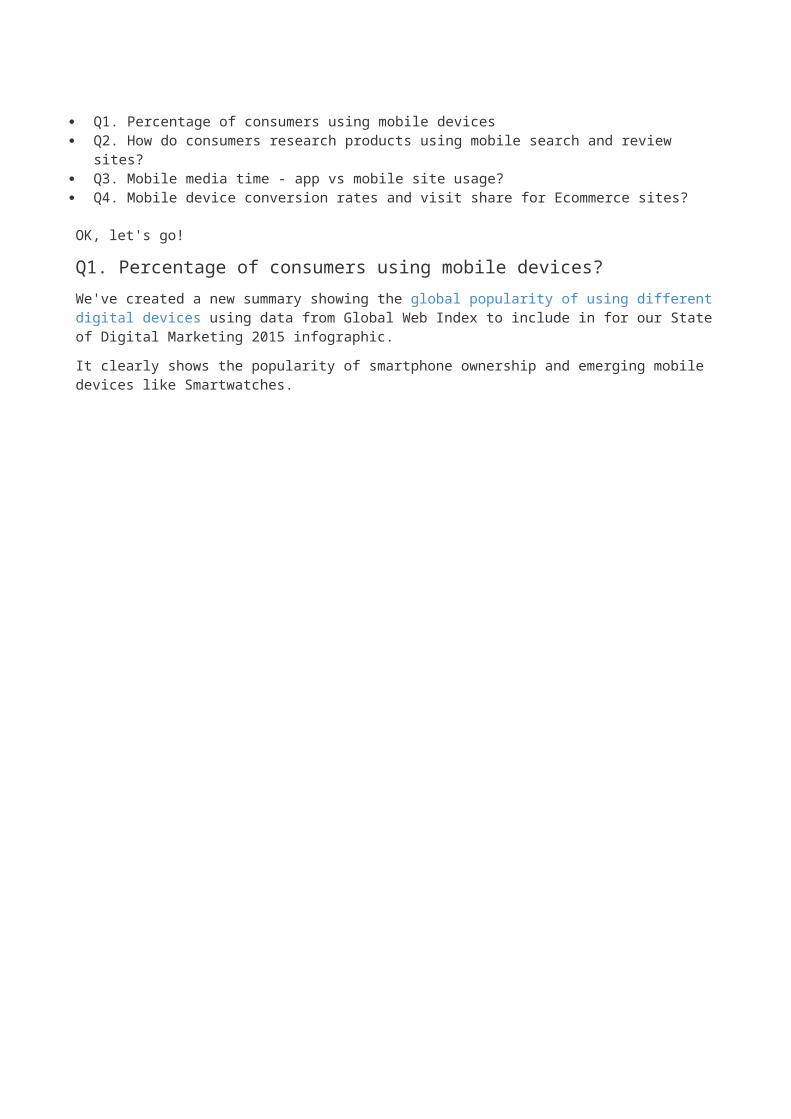
Q1. Percentage of consumers using mobile devices?We've created a new summary showing the global popularity of using different digital devices using data from Global Web Index to include in for our State of Digital Marketing 2015 infographic.
It clearly shows the popularity of smartphone ownership and emerging mobile devices like Smartwatches.
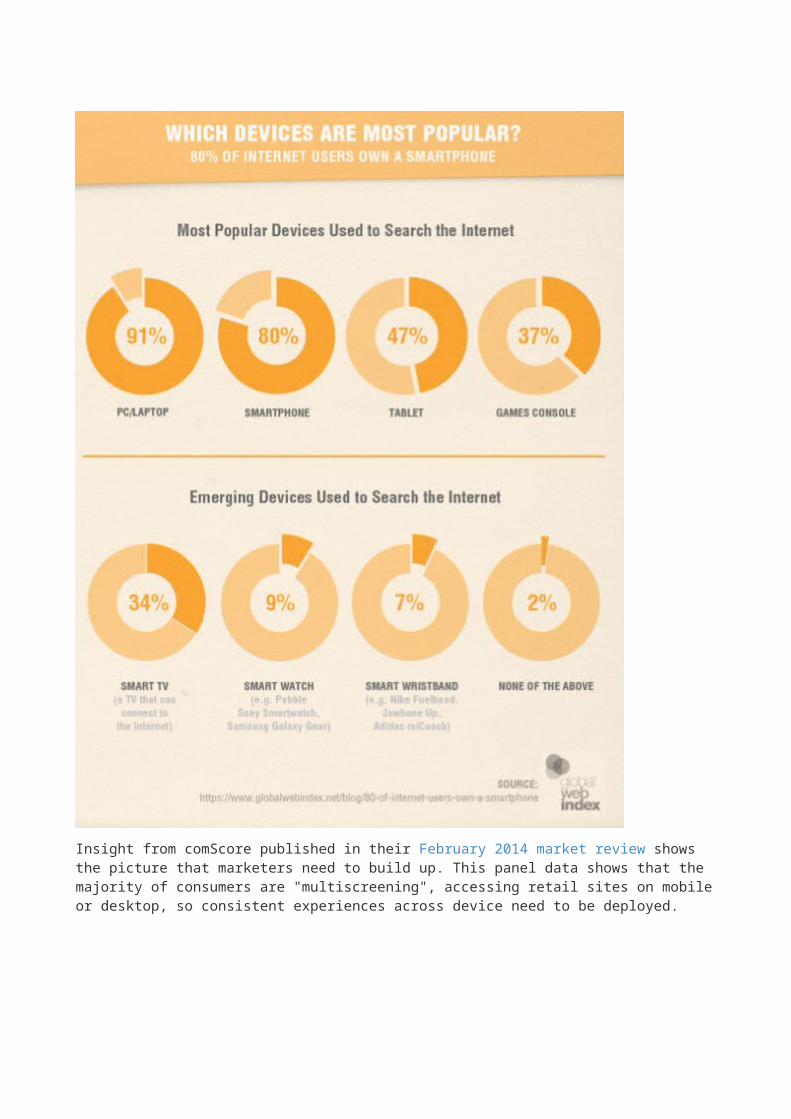
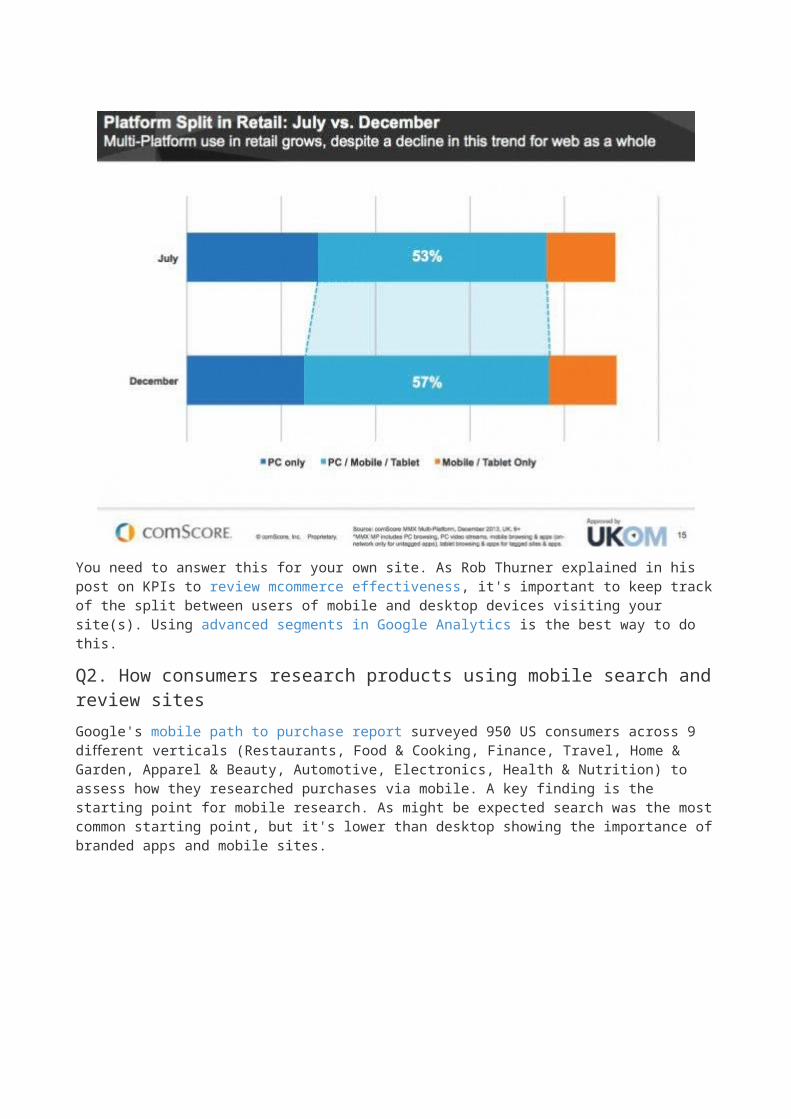
Insight from comScore published in their February 2014 market review shows the picture that marketers need to build up. This panel data shows that the majority of consumers are "multiscreening", accessing retail sites on mobile or desktop, so consistent experiences across device need to be deployed.
You need to answer this for your own site. As Rob Thurner explained in his post on KPIs to review mcommerce effectiveness, it's important to keep track of the split between users of mobile and desktop devices visiting your site(s). Using advanced segments in Google Analytics is the best way to do this.
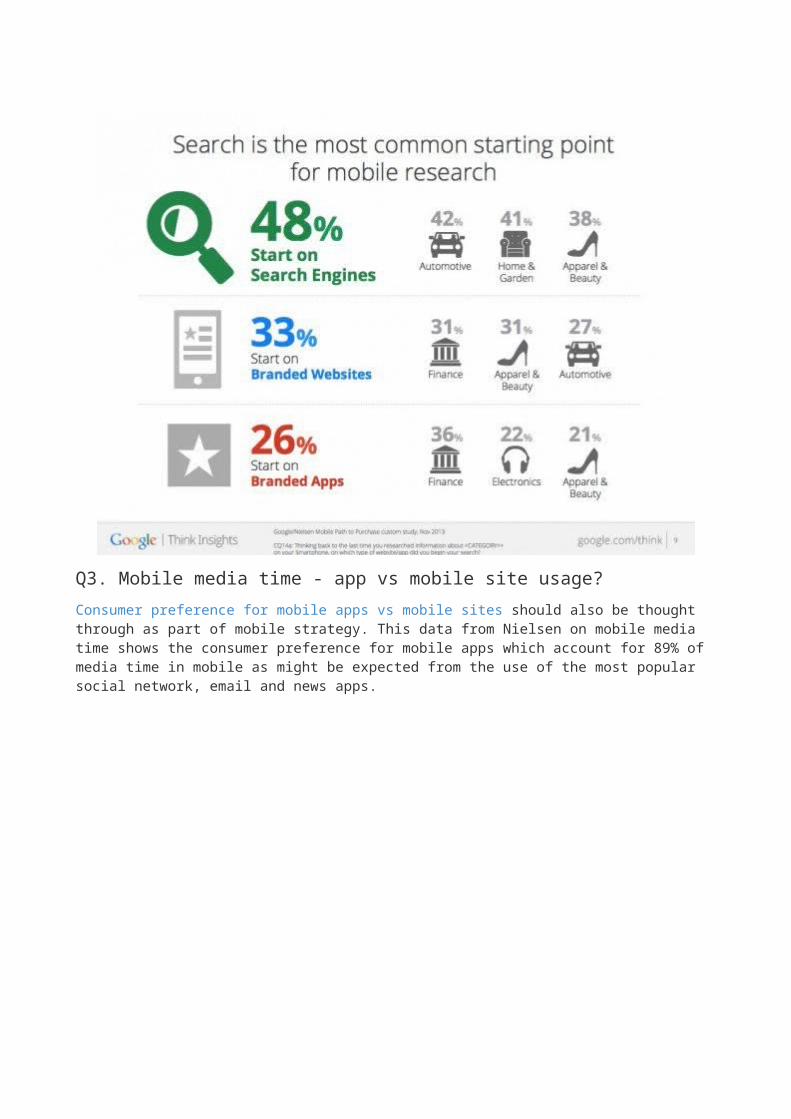
Q2. How consumers research products using mobile search and review sitesGoogle's mobile path to purchase report surveyed 950 US consumers across 9 different verticals (Restaurants, Food & Cooking, Finance, Travel, Home & Garden, Apparel & Beauty, Automotive, Electronics, Health & Nutrition) to assess how they researched purchases via mobile. A key finding is the starting point for mobile research. As might be expected search was the most common starting point, but it's lower than desktop showing the importance of branded apps and mobile sites.
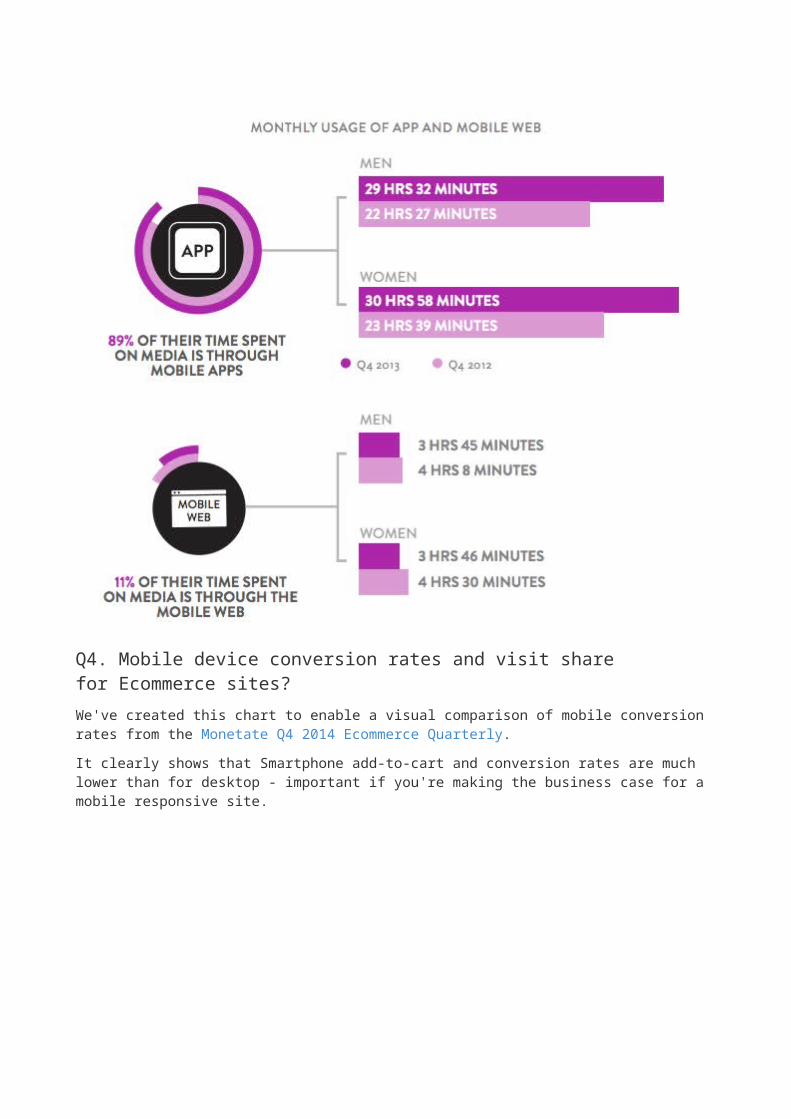
Q3. Mobile media time - app vs mobile site usage?Consumer preference for mobile apps vs mobile sites should also be thought through as part of mobile strategy. This data from Nielsen on mobile media time shows the consumer preference for mobile apps which account for 89% of media time in mobile as might be expected from the use of the most popular social network, email and news apps.
Q4. Mobile device conversion rates and visit share for Ecommerce sites?We've created this chart to enable a visual comparison of mobile conversion rates from the Monetate Q4 2014 Ecommerce Quarterly.
It clearly shows that Smartphone add-to-cart and conversion rates are much lower than for desktop - important if you're making the business case for a mobile responsive site.
This source is useful since it's a regular survey showing the growth in use of mobile site visitors. enables you to drill down to see usage by device type, for example iPad is still the dominant tablet, but Kindle Fire and Android tablets now account for over 10% of tablets. You can see that tablet and smartphone use nearly doubled in the year based on 500 million plus visits for these retail clients (see link above for methodology). Mobile share is now around 27% on average.
We have a separate compilation of Ecommerce conversion stats if you're creating a business case for mobile optimised sites as explained in our mobile marketing strategy guide, this data is also valuable since it shows the variation in conversion rate by mobile type.
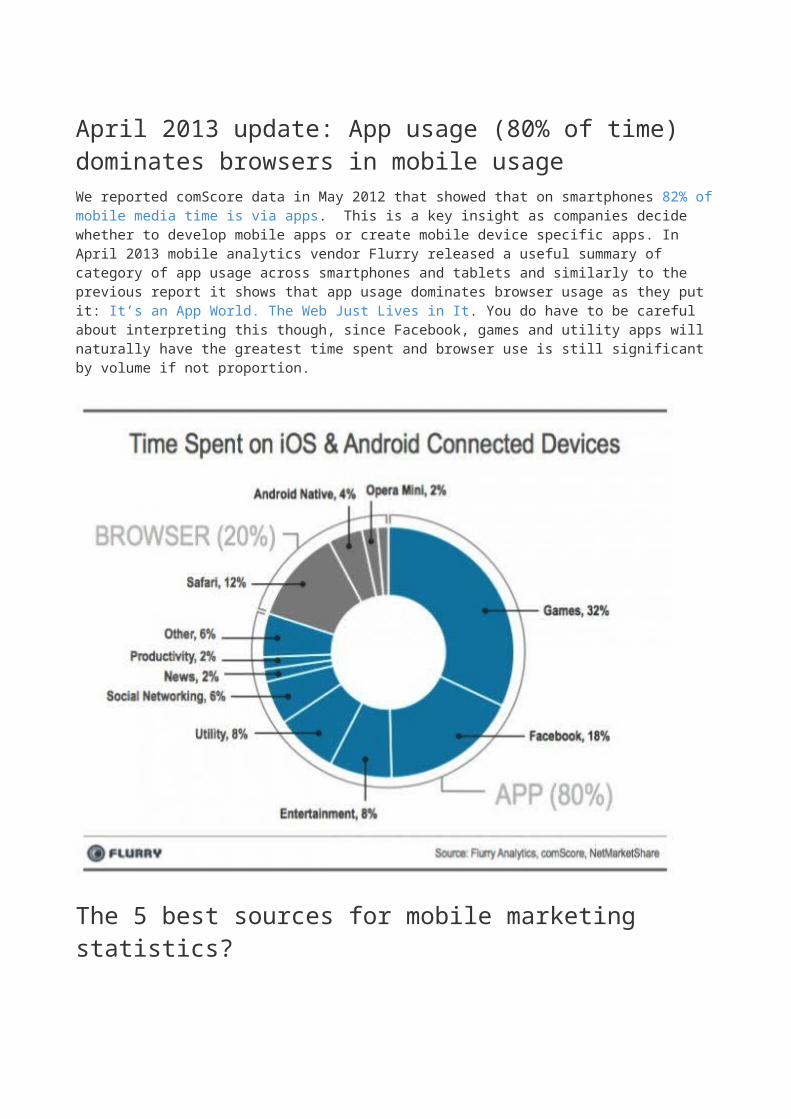
April 2013 update: App usage (80% of time) dominates browsers in mobile usageWe reported comScore data in May 2012 that showed that on smartphones 82% of mobile media time is via apps. This is a key insight as companies decide whether to develop mobile apps or create mobile device specific apps. In April 2013 mobile analytics vendor Flurry released a useful summary of

category of app usage across smartphones and tablets and similarly to the previous report it shows that app usage dominates browser usage as they put it: It’s an App World. The Web Just Lives in It. You do have to be careful about interpreting this though, since Facebook, games and utility apps will naturally have the greatest time spent and browser use is still significant by volume if not proportion.
The 5 best sources for mobile marketing statistics?This update to this post features some of the latest updates on mobile statistics from 2014 and highlight some of the best sources to make the business case for investment in mobile marketing in your presentations and business cases to colleagues or clients.
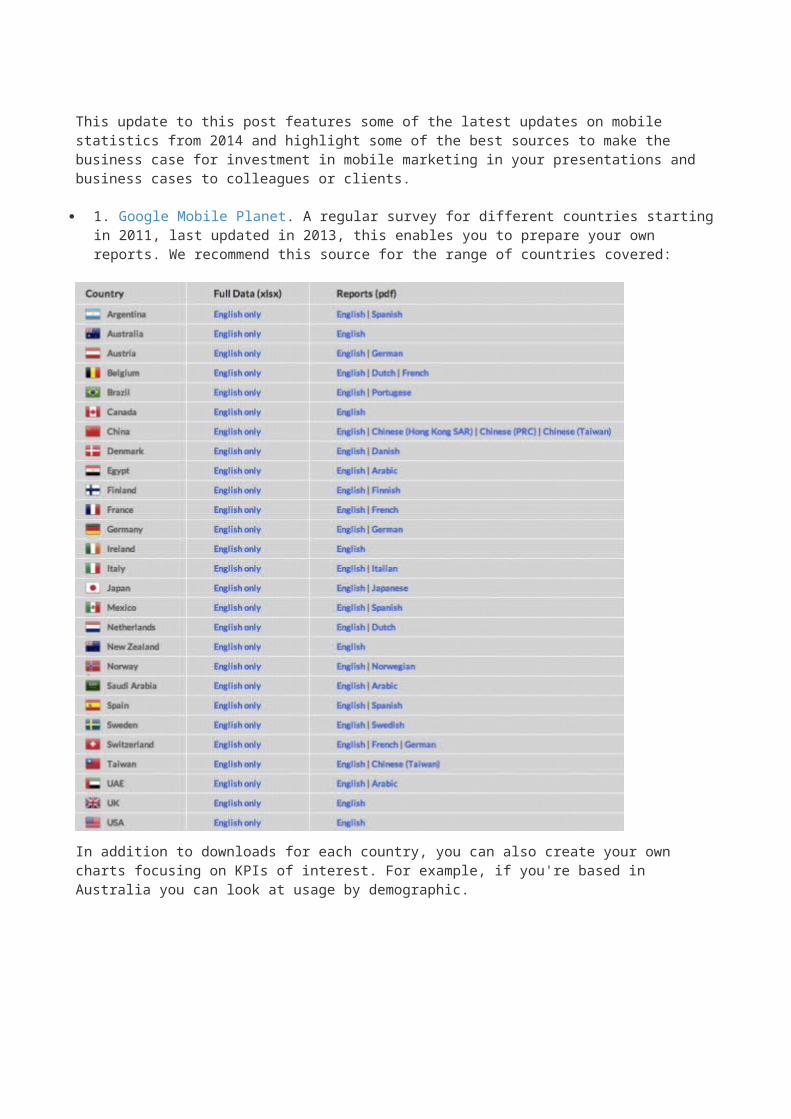
1. Google Mobile Planet. A regular survey for different countries starting in 2011, last updated in 2013, this enables you to prepare your own reports. We recommend this source for the range of countries covered:
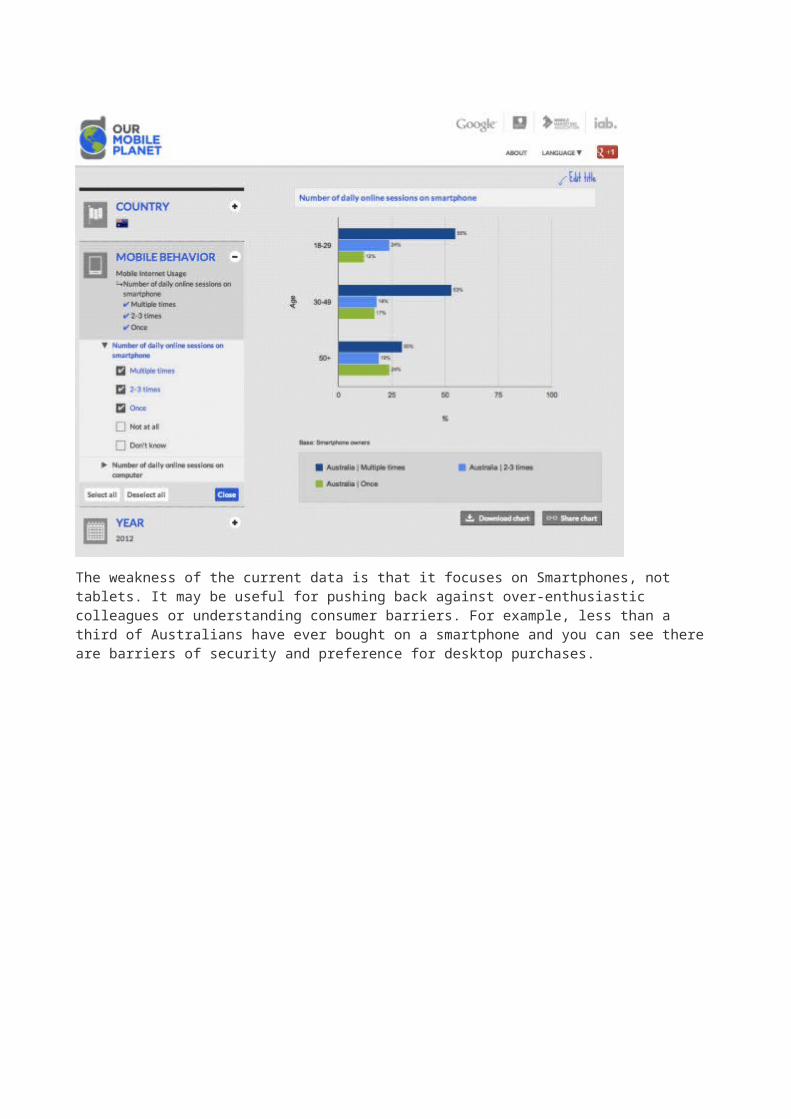
In addition to downloads for each country, you can also create your own charts focusing on KPIs of interest. For example, if you're based in Australia you can look at usage by demographic.
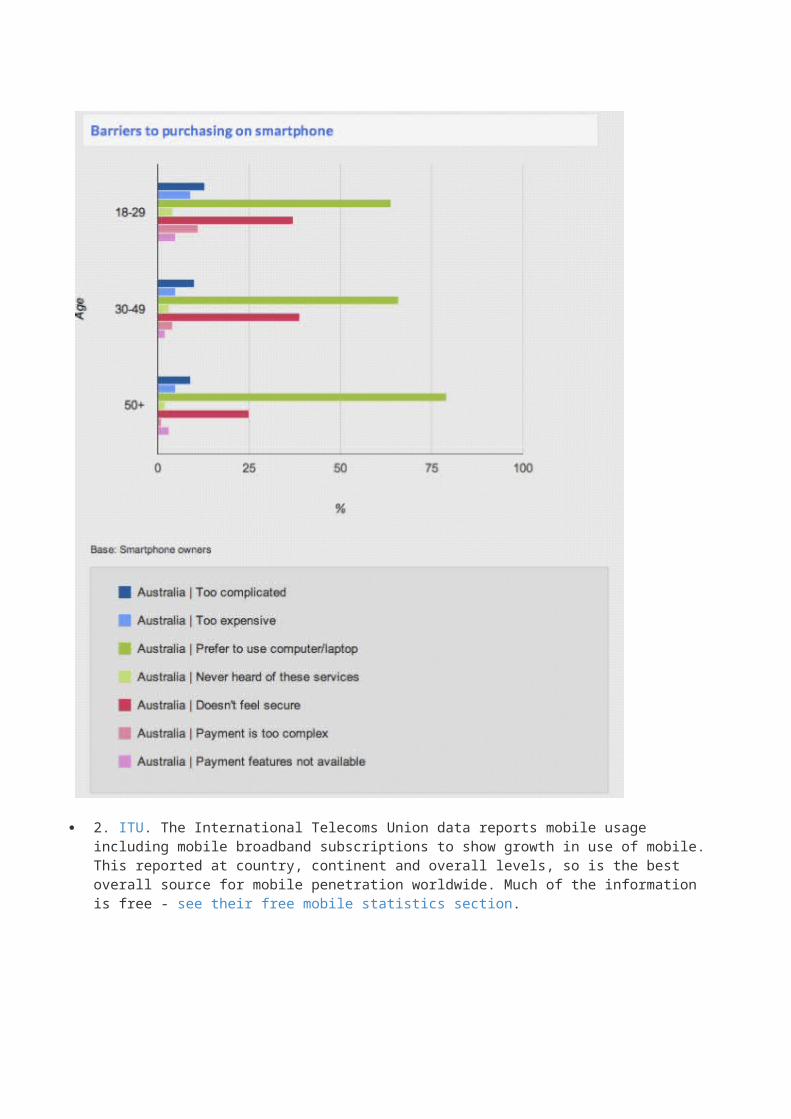
The weakness of the current data is that it focuses on Smartphones, not tablets. It may be useful for pushing back against over-enthusiastic colleagues or understanding consumer barriers. For example, less than a third of Australians have ever bought on a smartphone and you can see there are barriers of security and preference for desktop purchases.
2. ITU. The International Telecoms Union data reports mobile usage including mobile broadband subscriptions to show growth in use of mobile. This reported at country, continent and overall levels, so is the best overall source for mobile penetration worldwide. Much of the information is free - see their free mobile statistics section.
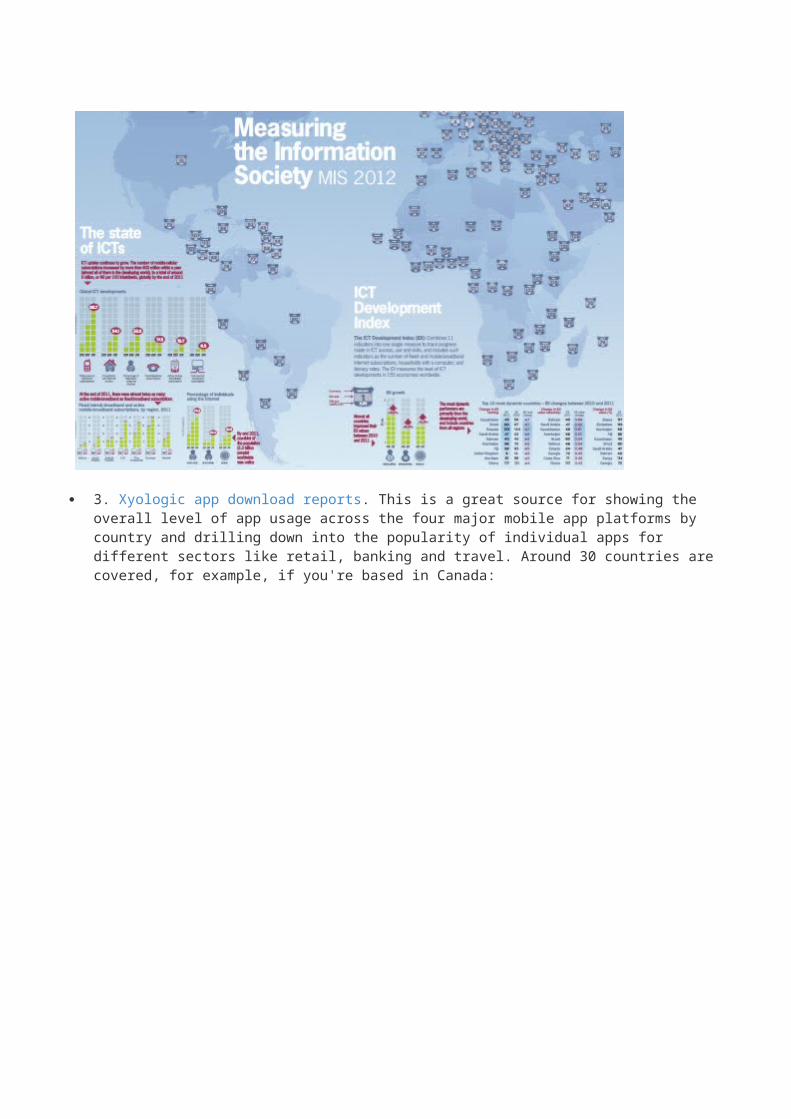
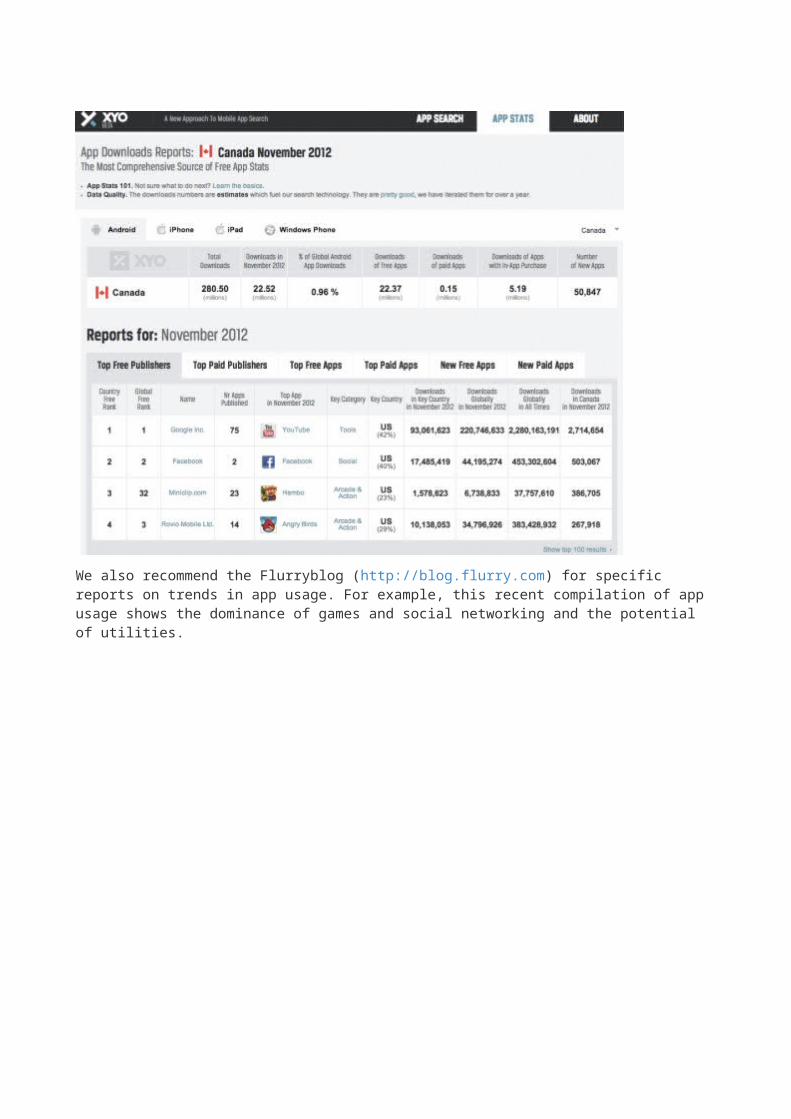
3. Xyologic app download reports. This is a great source for showing the overall level of app usage across the four major mobile app platforms by country and drilling down into the popularity of individual apps for different sectors like retail, banking and travel. Around 30 countries are covered, for example, if you're based in Canada:
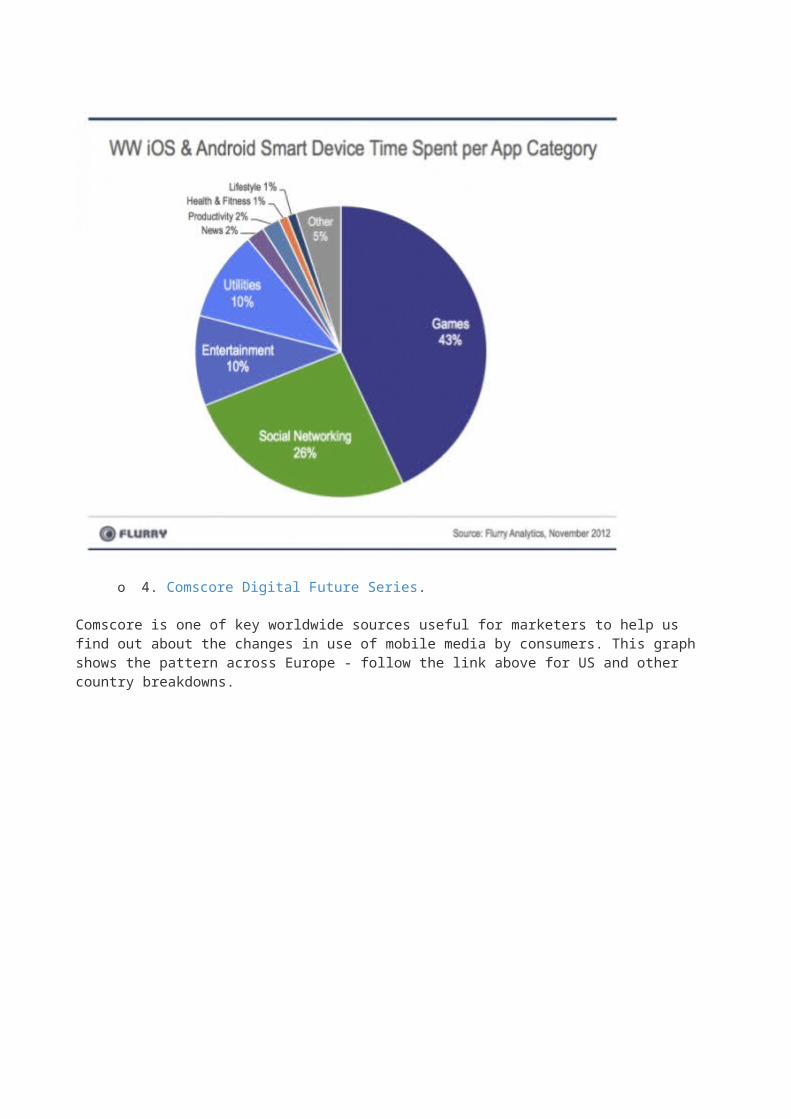
We also recommend the Flurryblog (http://blog.flurry.com) for specific reports on trends in app usage. For example, this recent compilation of app usage shows the dominance of games and social networking and the potential of utilities.
o 4. Comscore Digital Future Series.
Comscore is one of key worldwide sources useful for marketers to help us find out about the changes in use of mobile media by consumers. This graph shows the pattern across Europe - follow the link above for US and other country breakdowns.
The report shows much lower levels of adoption in other European countries though - not even a fifth in most. So extrapolating UK behaviour to other countries would seem to be a mistake with the mobile figure still key.
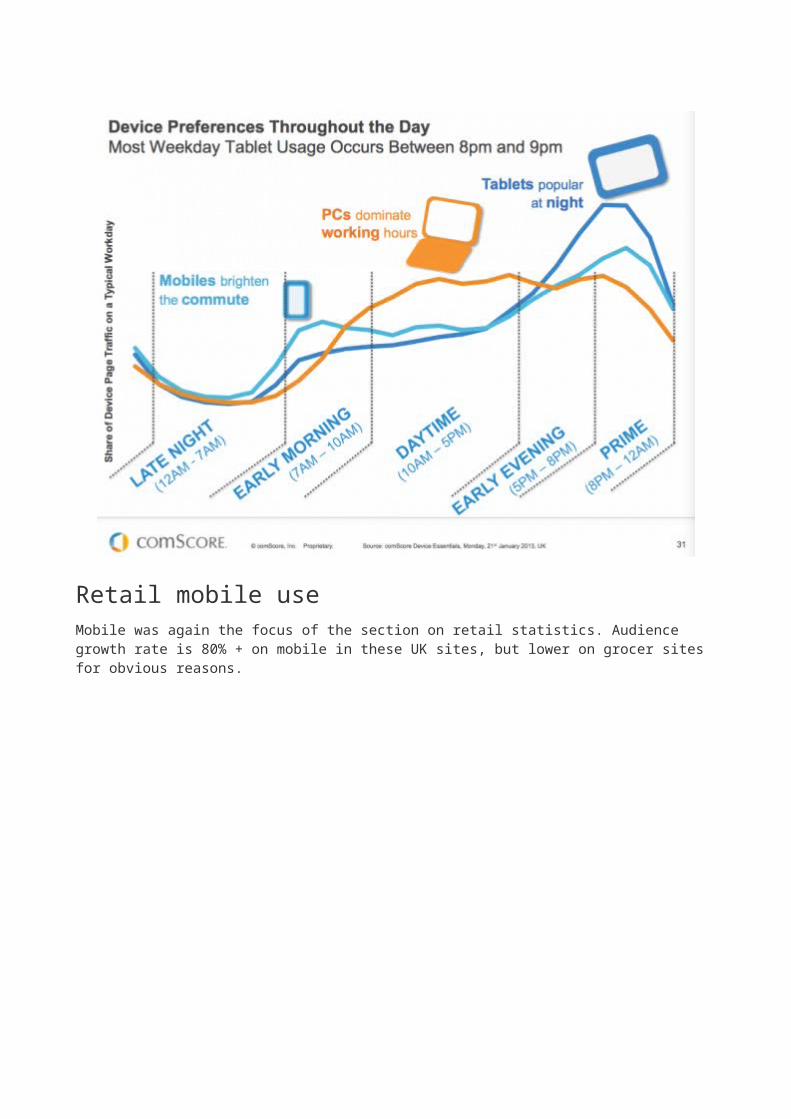
The report also has useful summary of dayparts of different device behaviour, similar to others published.

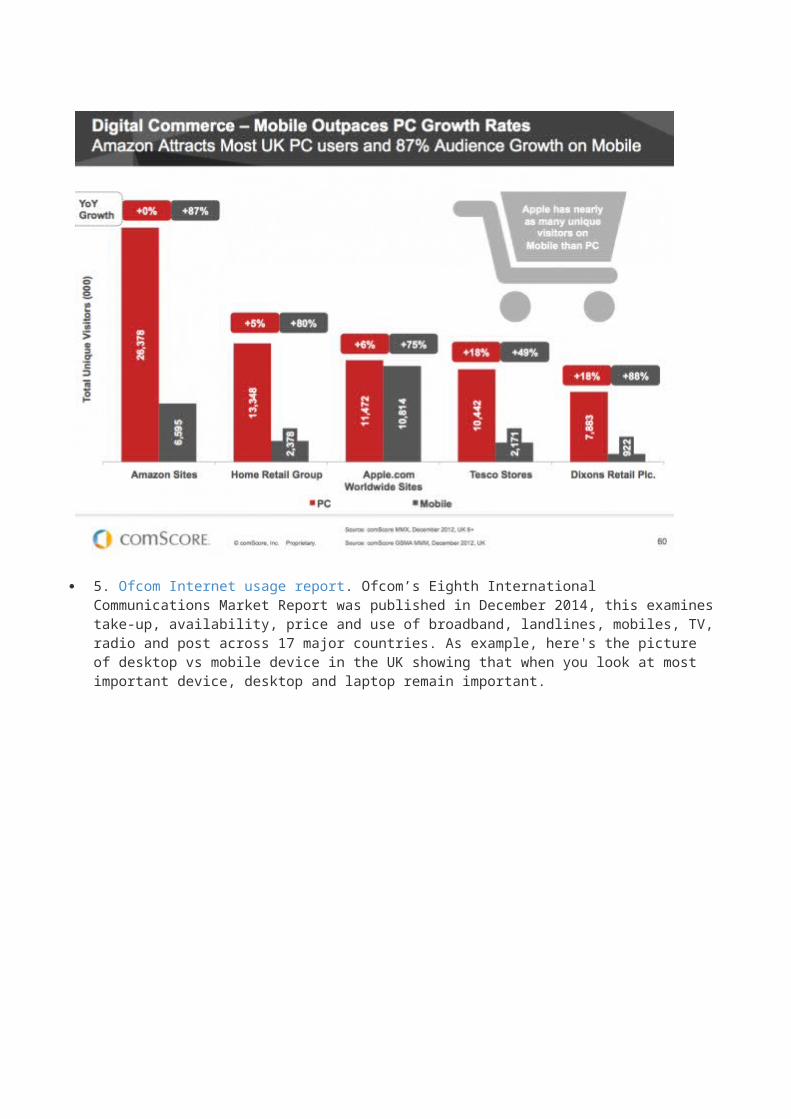
Retail mobile useMobile was again the focus of the section on retail statistics. Audience growth rate is 80% + on mobile in these UK sites, but lower on grocer sites for obvious reasons.
5. Ofcom Internet usage report. Ofcom’s Eighth International Communications Market Report was published in December 2014, this examines take-up, availability, price and use of broadband, landlines, mobiles, TV, radio and post across 17 major countries. As example, here's the picture of desktop vs mobile device in the UK showing that when you look at most important device, desktop and laptop remain important.
We hope this compilation of statistics about mobile usage and effectiveness continues to be useful - please share if it is and we'll continue to update it in 2015.
If you want a single source of the latest stats across the whole of digital marketing, for Expert members, we compile a regularly updated set of usage statistics to use in presentations - it's updated each quarter so all the latest stats are categorised in a single place for including in presentations.
Recommended Guide: Online usage statistics compilationOur "one-stop" download includes the latest stats to include in presentations to make the case for digital investment.
Download our Online marketing statistics compilation.