66 | q2 • galaxie, the star’s fortnightly entertainment magazine, was voted the ‘entertainment...
TRANSCRIPT

66 |
Q2
• Galaxie, The Star’s fortnightly entertainment magazine, was voted the ‘Entertainment Magazine of the Year’ in a survey carried out by Advertising + Marketing (A+M). The Galaxie & Youth Carnival held in Penang, was organised for the third year in a row with throngs of people descending to Penang Times Square to join in the fun, games and activities.
• Star Outstanding Business Awards 2011 (SOBA 2011) returned for the 2nd year to pay tribute to up-and-coming local non-listed companies and SMEs striving to carve a niche in the business world. SOBA forums were also organised to guide participants on their journey to success, recognition and outstanding achievement. The forums were held at Johor Bahru, Penang, Kuching and Kuala Lumpur.
Galaxie & Youth Carnival Penang 2011
40th anniversary edition of The Star
Star Outstanding Business Awards 2011 (SOBA 2011)
2011 Highlights (Cont’d)

67|
• More than 14,200 people took part in Ipoh Starwalk 2011, which was held in conjunction with Ipoh City’s 23rd anniversary. Participants were able to take in some of the heritage sites as the new route passed historical landmarks such as an ancient Sikh temple, a Methodist church and an army camp dating back to the colonial days.
• It was a double celebration with the launch of the new Metro Perak pullout, together with the opening of The Star’s Ipoh office in Lorong Chung Thye Phin.
Ipoh Starwalk 2011
Opening of The Star Office in Ipoh, Perak
Launch of Gooroo
2011 Highlights (Cont’d)
Q2 (cont’d)
• The Star launched a new education website, gooroo.my, to provide home-based learning for children and secondary school students.
• The Star celebrated its 40th year in publication with a refreshed offering, focused on journalism of hope and with a fresh new look for many of its sections as well as new columnists offering their own perspective on different issues of interest.

68 |
Q3
• Star Publications (Malaysia) Berhad makes a maiden venture into TV broadcast via a 51% stake in LI TV Holdings Limited, owner and operator of Life Inspired, a high-definition (HD) pan-regional lifestyle TV channel.
• The Star received the Green Media Award from Japan-based International Green Purchasing Network. It was the first time the non-governmental organisation conferred such an award. Its chairman, Prof. Ryoichi Yamamoto described The Star’s environmental performance as impressive.
• Malaysians joined in the celebration of the The Star’s 40th Anniversary as we presented, In Perfect Harmony, an original musical production from Dama orchestra. The production chronicled the changing Malaysian lifestyles and trends over the years via music and dance. All shows were packed to the brim as audiences were taken for a musical journey through time.
• The Bengkel Kecemerlangan Kuntum UPSR 2011 held in 2011 was a hit. Students at the school clamoured to answer questions posed by trainers on the four core subjects – Bahasa Malaysia, English, Science and Mathematics. About 200 students from the Klang Valley attended the Petaling Jaya workshop. The Kuntum UPSR workshop was on a three-city tour, which started in Petaling Jaya then Penang and Pahang. An average of about 150 to 200 students participated in each workshop.
‘In Perfect Harmony’ Musical
Final show of ‘In Perfect Harmony’
LI TV media preview session
2011 Highlights (Cont’d)

69|
Q3 (cont’d)
• Some 20,000 participants turned up for Penang Starwalk 2011, which was the highest number of people since its inception. The event featured a new heritage route, in conjunction with The Star’s 40th anniversary celebrations, as well as a charity walk themed ‘Walk With Us’ that saw the participation of those being cared for by seven charities.
• To kickstart the celebration of its 40th anniversary, The Star featured articles from the past 40 years, bringing readers back down memory lane with stories ranging from sports to entertainment and headlining news. These articles could be seen amongst the pages of the newspaper each day for the month of September and readers were also given opportunity to download The Star’s first issue on PDF from the 40th anniversary microsite.
• Protect Our Pockets initiative was launched to highlight key issues faced by Malaysians in relation to the rising cost of living. The roundtable discussion featured eight panellists who discussed various topics surrounding this issue during the three-hour discussion. The outcome of the discussion was a list of resolutions that was presented to the Prime Minister by The Star’s Group Chief Editor, Datuk Seri Wong Chun Wai.
• The Mag Inc 2011 – a competition for students – received a total of 55,000 entries this year. Meanwhile, the number of participants in the contest increased by almost 170,000 students, which was a 38% rise, compared with last year’s contest figures. The Newspaper-in-Education (NiE) contest was organised by The Star and Pizza Hut, in collaboration with the Ministry of Education and was themed ‘Speak Out!’.
Penang Starwalk 2011
Mag Inc 2011
2011 Highlights (Cont’d)

70 |
Q4
• The Star embarked on a campaign – Preserve Our Heritage – to raise awareness for the need to preserve historical areas, sites and buildings for future generations. To kickstart the campaign, we pooled together a group of 50 artists of various disciplines to paint a mural on a shop-house located at Jalan Sultan. The mural has now become an attraction in the area.
• The Star Outstanding Business Awards 2011 (SOBA 2011) awards ceremony was held at the Royale Chulan Kuala Lumpur. 27 awards in 11 categories were presented out of 115 entries received from 83 companies.
• The Star Bid & Win promotion comprised of four series, where each series lasted for two weeks. Eight prizes were offered for bidding in each series. The promotion was part of The Star’s 40th anniversary celebrations. UOB and Peugeot were partners in the promotion. The prizes put up for bidding were worth more than RM300,000.
• Hotshots, a coffee table book that documented images of historical moments over the four decades by The Star’s photographers, was launched by Information, Communications and Culture Minister Dato’ Seri Utama Dr Rais Yatim. The publication of the book was in conjunction with The Star’s 40th anniversary celebrations.
Preserve Our Heritage The Star Bid & Win Contest
2011 Highlights (Cont’d)

71|
Q4 (cont’d)
• The Star’s new English radio station CapitalFM was launched on the airwaves with a new identity and personality, targeted predominantly at women. With a tagline ‘Women – The New Capital’, the station aims to reach out to urban and contemporary women through engaging topics and a varied range of adult contemporary music.
• The Star took home 3 awards during the Asian Digital Media Awards 2011. The Star’s Youth brand, R.AGE, won best Social Media. The Star iPad application won gold for ‘Best in Tablet Publishing’ and a bronze medal was awarded for the video ‘Disappearing Underwater Rainforest’ in Best in Online category.
• In a strategic move to reach out to the Mandarin-speaking community, the Company announced a proposed acquisition on 1 December 2011 to acquire 83.61% stake in publisher Red Tomato Media Sdn Bhd for RM1.49 million. Red Tomato is a free Chinese weekly tabloid. The acquisition expands the Group’s footprint in the media industry and complements its portfolio of media entities. It is also the Group’s first venture into the free newspaper model, and the acquisition was successfully completed in early January 2012.
CapitalFM presents their deejays Asian Digital Media Awards 2011
2011 Highlights (Cont’d)

72 | Subsidiaries
Our multi-lingual radio stations under the Star Radio Group umbrella continue to achieve new milestones in 2011 in terms of listenership, Advertising Expenditure (AdEx), reach and financial performance.
Listenership-wise, the Star Radio Group grew 13% year-on-year as per Nielsen’s second survey results of 2011. Our Chinese station, 988FM, maintained its stronghold of over 1.5 million listeners whilst SuriaFM, our Malay station, achieved a new record as the fastest growing station among the Malay Radio market with over 2.3 million listeners, a 22% growth year on year. Our English station, RedFM’s listenership grew by 36% to 296,000.
MESSAGE FROM
RedFM, CapitalFM, 988FM and SuriaFM
RedFM’s year-long exciting contests continue to garner support from ardent listeners which include RedFM’s ‘International Concerts Flyaways’, which offers exclusive prizes of sending winners to Justin Bieber’s concert in Miami, USA; Taylor Swift in Manchester and Rihanna’s concert in Sydney, Australia as well as RedFM’s ‘Runaway DJs’ hitting the streets and getting listeners hooked on the radio in search of the DJs.
According to Nielsen Media Research AdEx in 2011, the Star Radio Group had an outstanding AdEx growth of 20%, four times higher than the overall radio industry’s growth of only 5%. Our AdEx market share grew to reach 21%, up 2% from 2010.
From our stronghold in Peninsular Malaysia, 2011 also saw the expansion of our airtime presence reaching the shores of East Malaysia with SuriaFM setting up a new radio studio at 1Borneo, Sabah’s largest shopping mall.
Reflecting the Star Radio Group’s outstanding business achievements, our financial performance also stepped up a notch in 2011, achieving higher revenues and improved profitability.
988FM achieved the Top spot in terms of AdEx in 2011 which demonstrates strong Advertising support as Advertisers’ confidences were bolstered by our reach to the high spending and decision making groups in all major cities.
RedFM DJs

73|
SuriaFM bulldozed its way with ground events with the highlight of the year, Konsert Kemuncak SuriaFM 2011 held in Putrajaya for the second year running which attracted a crowd of over 30,000. SuriaFM also organised nationwide road tours for ‘Band Kampus Terbaik 2011’, ‘Goreng Tour’ and ‘Bazaar Ramadhan tour’ as part of survey promotions.
988FM DJs
CapitalFM DJs
SuriaFM DJs
Adding on to our trophy chamber, 988FM’s Korean programme shone in 2011 resulting in Star Rfm being awarded the Best Media Partner 2011 by Korea Tourism Organisation. SuriaFM’s DJ Lin had a double-honour at Anugerah Seri Angkasa 2011 Awards by triumphing in the ‘DJ Radio Wanita Terbaik’ and ‘Rancangan Interaktif Radio Terbaik’ categories.
One of the major highlights for 2011 included the relocation of the Star Radio Group’s offices and studios to a new premise at Tropicana City Office Tower in the heart of Petaling Jaya. The more avant-garde office ambiance certainly enhanced the working environment and heightened productivity.
2011 culminated on an eminent note with the latest addition to our Group, CapitalFM with its tagline ‘Women - The New Capital’, being Malaysia’s first women’s radio station making its debut in December 2011. The station is targeted at urban women from the age 25 to 35 in Klang Valley and aims to act as a sounding board as well as a platform for introducing topics addressing emotional and intellectual needs of women.
Going forward, the Star Radio Group, with enhanced integration aims to reach uncharted waters, achieve new milestones and add dynamism to The Star media group by combining synergistically with the print and digital operations.
Subsidiaries (Cont’d)

74 |
2011 has been an exciting year for LI, Life Inspired, a year of many firsts for us, as we continue to promote inspirational living through our content – Food, Home, Wellness, Travel and Style.
We launched our first original production, ‘Quest For Stars’, debunking the myths behind the Michelin Guide in Hong Kong and Macau. Soon after, we launched our second original series, The Maverick Chef, featuring Chef Alvin Leung on a molecular gastronomy adventure across Asia, the world’s first.
Our network celebrated a new investor, Star Publications (Malaysia) Berhad, on board. The continued expansion of LI and rollout of more original productions were accelerated, and our channel is providing more Asian content, packaging, faces and brands than ever before. We established our local and regional sales offices, selling regional advertising in eight countries, as well as production bureaus in five markets.
Our regional expansion continued with the launch on kbro, Taiwan’s leading cable platform; Chunghwa Telecom MOD, Taiwan’s leading IPTV platform; and bbTV, the IP-TV arm of Hong Kong Broadband Network in Hong Kong. The landings increased our subscriber base to over 900,000 in Taiwan alone.
We launched our Faces of LI – four personalities from around the region – Jason Godfrey of Hong Kong, Hannah Al Rashid of Indonesia, Angelique Teo of Singapore, and David Yee of Malaysia – as the hosts for our two-minute vignettes called ‘The Link’ that captures the essence of inspirational living, featuring the latest lifestyle trends across Asia and beyond.
Having only started our broadcast in the region in August 2009, we have come a long way to establish our presence in five countries and 12 cable and satellite platforms in Hong Kong, Singapore, Indonesia, Malaysia and Taiwan – all within two years since the channel first launched.
In 2012, we intend to launch in more exciting markets, solidify our digital platforms and create more exciting content, with ‘EdVentures in Asia’, where Korean celebrity chef Edward Kwon travels and ‘Koreanizes’ each Asian country’s local dishes. Set to launch is also ‘Body Blaze’, a workout programme taking exercising outdoors, featuring Malaysia’s best scenic wonders. High Definition (HD) is definitely the way forward; as Asia’s first lifestyle channel in HD and the first HD channel in Malaysia, we have first-mover advantage.
I would like to thank all of the people at Life Inspired, Star Publications (Malaysia)Berhad and ASTRO who are dedicated and focused on delivering results for success. Our progress in 2011 established a solid foundation from which to move us forward.
MESSAGE FROM
ANNE CHAN, GENERAL MANAGER, LIFE INSPIRED
LI Anniversary & launch of the Faces of LI event at Sultan Lounge, Mandarin Oriental
Chef Alvin Leung of The Maverick Chef
Subsidiaries (Cont’d)

75|
Red Tomato is the only free Chinese weekly newspaper in the country. Since its launch in 2009, Red Tomato is published every Friday and distributed in Klang Valley and the Northern region of Malaysia. Following the acquisition of the company by Star Publications (Malaysia) Berhad, we subsequently underwent an editorial revamp. Our distribution is now at 200,000 copies nationwide, covering all major market centres and urban areas.
Red Tomato aims to provide insightful and relevant information on current trends and issues. With 70% of our readers under the age of 40, our editorial content is presented in a lively manner, featuring topics on lifestyle, fashion, gadgets, health and beauty, personality, money matters, business, current issues and a list of other subjects of interest.
At present, Red Tomato is distributed at condominiums, commercial and office building, transportation hubs, banks, petrol kiosks, higher learning institutions and road shows – locations where our readers have direct access to our papers.
As an effective and efficient medium for public communication and commercial, Red Tomato is now the free Chinese weekly of choice.
MESSAGE FROM
GAN CHIN KEW, MANAGING DIRECTOR, RED TOMATO
The new look of Red Tomato
Subsidiaries (Cont’d)

76 |
MESSAGE FROM
KO CHEE WAH, GROUP MANAGING DIRECTOR, CITYNEON HOLDINGS LIMITED
Our Middle East operations (with headquarters in Bahrain), which traditionally has always contributed significantly to our Group’s overall performance, was severely affected by the political turmoil that raged across the countries in that region for the whole of financial year (FY) 2011. Businesses were brought to a standstill, and some of our major projects were either postponed or cancelled. Our Group took proactive steps to compensate for this setback by trying to boost growth in other regions and sectors. However, with the completion of the Universal Studios in Sentosa, thematics works in this location have tapered off. There were also no major world-scale events like the 2010 World Expo in Shanghai and Youth Olympics Games in FY2011. The performance of our Exhibitions and Sports sectors were similarly affected.
For the Middle East, we will continue to operate from our base in Bahrain, but will fan out and explore more opportunities in the Gulf region, especially those that have not been affected by any political upheavals or regime changes. These include countries like United Arab Emirates, Oman and Qatar. In Asia, we will continue to invest in the growth of our Interior Architecture business as an alternative growth platform. This sector registered a 141% growth in FY2011 (from S$6.11 million in FY2010 to S$14.73 million in FY2011), and we expect this to continue to grow in FY2012. We will also continue to invest in and grow our Sports Infrastructures business in the coming year. The outlook for our Meeting, Incentive, Convention and Exhibition (MICE) business remains challenging as the United States of America is still in the midst of recovering from its last recession, while the European Union countries are struggling with the onset of their sovereign debt problems. Competition remains very keen with downward pressure on prices and margins. Nonetheless, we are committed to defend our market share in this sector.
Republic of Singapore Air Force Open House 2011
International Air Travel Association Annual General Meeting 2011
Sino - Singapore GuangZhou Knowledge City SmartCity visualisation
Ministry of Community, Youth & Sports Volunteers Award Ceremony
Transformers Attractions, Universal Studios Singapore
Subsidiaries (Cont’d)

77|
MESSAGE FROM
ROSHAN THIRAN, CHIEF EXECUTIVE OFFICER, LEADERONOMICS SDN BHD
Leaderonomics is a unique social enterprise with a core mission of transforming nations through leadership development. A ‘cradle-to-grave’ leadership solution provider with a vision to grow people into leaders, build affectionate communities and to transform the nation, we have grown to become the model social enterprise in the country.
With a vision centred on helping everyone build their leadership capabilities and helping them grow into community leaders that make a difference in the world, Leaderonomics also reflects the Group’s commitment to volunteerism, giving and inspiring people.
Leaderonomics’ 3 core areas – Corporate, Media and Community Service – all work in tandem, complementing each other in funding, content creation and providing leadership development, contributing to its core mission of growing people into leaders.
CORPORATE SERVICES
In 2011, Leaderonomics had double digit growth in its corporate services by providing world-class training and development programmes, assessment services, talent acceleration programmes and specialised consulting services. With its unique experiential and action-learning approach, Leaderonomics grew its client base to multinational organisations outside of Malaysia. In 2011, Leaderonomics began offering assessment services. Leaderonomics also became a pioneer in the Asia market with its unique Talent Acceleration programme (TAP) designed for hi-potentials in organisations.
MEDIA
Much of the content on leadership is text-based and in 2011, Leaderonomics began investing in converting text-based leadership material to video, audio and interactive-text, enabling leadership material to be accessible to all communities, including the youth. Leaderonomics plans to launch a full-blown LeadershipTV channel by 2013.
COMMUNITY
Leaderonomics embraces the responsibility to our community and are passionate about working in, for and with the communities we belong to.
2011 saw the set-up of the Leaderonomics University division. The Youth division, continued their growth in the signature DIODE Youth Leadership Camps but also expanded and built DropZone, a kids-at-risk community centre and pioneered leadership clubs in schools in 2011.
The Leaderonomics Team at “Life at Leaderonomics” event
Youths at the DIODE leadership camps having fun kayaking
The DIODE camp in December 2011 with the theme “Don’t be a Hero - BE A LEADER”
Subsidiaries (Cont’d)
Success is ensuredwhen you have the courage to move forwardno matter what happens.
78

79
Financial Statements
80 - 84 Directors’ Report
85 Statement by Directors
85 Statutory Declaration
86 - 87 Independent Auditors’ Report
88 - 89 Statements of Financial Position
90 Statements of Comprehensive Income
91 - 93 Statements of Changes in Equity
94 - 96 Statements of Cash Flows
97 - 202 Notes to the Financial Statements

80 |
The Directors have pleasure in submitting their report and the audited financial statements of the Group and of the Company for the financial year ended 31 December 2011.
PRINCIPAL ACTIVITIES
The principal activities of the Company are the publication, printing and distribution of newspapers and magazines. The principal activities of the subsidiaries are set out in Note 10 to the financial statements. There have been no significant changes in the nature of these activities during the financial year.
RESULTS OF OPERATIONS
Group Company RM’000 RM’000
Net profit for the financial year 185,312 177,597
Attributable to: Owners of the parent 186,665 177,597 Non-controlling interests (1,353) -
185,312 177,597
DIVIDENDS
Dividends paid and declared since the end of the previous financial year were as follows:
(a) A second interim dividend of 6.0 sen per ordinary share, single tier, and a special interim dividend of 3.0 sen per ordinary share, tax exempt, which amounted to RM44,309,604 and RM22,154,802 respectively in respect of the financial year ended 31 December 2010 were paid on 19 April 2011.
(b) A first interim dividend of 6.0 sen per ordinary share, single tier, and a special interim dividend of 3.0 sen per ordinary share, tax exempt, which amounted to RM44,309,604 and RM22,154,802 respectively in respect of the financial year ended 31 December 2011 were paid on 18 October 2011.
Subsequent to the financial year, on 27 February 2012, the Directors declared a second interim dividend of 6.0 sen per ordinary share, single tier, and a special interim dividend of 3.0 sen per ordinary share, tax exempt, which amounted to RM44,309,604 and RM22,154,802 respectively in respect of the financial year ended 31 December 2011. The dividends are payable on 18 April 2012 to the shareholders whose names appear in the Record of Depositors at the close of business on 30 March 2012.
The Directors do not recommend the payment of any final dividend in respect of the current financial year.
Directors’ Report

81|
RESERVES AND PROVISIONS
There were no material transfers to or from reserves or provisions during the financial year.
ISSUE OF SHARES AND DEBENTURES
There were no issues of new shares or debentures during the financial year.
OPTIONS GRANTED OVER UNISSUED SHARES
No options were granted to any person to take up unissued shares of the Company during the financial year.
SHARE BUY-BACK
The shareholders of the Company, at an Extraordinary General Meeting held on 18 May 2005, approved the Company’s proposal to repurchase up to 10% of its own shares (“Share Buy-Back”). The authority granted by the shareholders has been renewed at each subsequent Annual General Meeting. The Directors of the Company are committed to enhance the value of the Company to its shareholders and believe that the Share Buy-Back is in the best interest of the Company and its shareholders.
No share was repurchased from the open market by the Company during the financial year.
DIRECTORS
The Directors who have held office since the date of the last report are:
Tan Sri Datuk Seri Dr Fong Chan Onn (appointed on 26 May 2011)Datuk Vincent Lee Fook LongMr Ho Kay TatTan Sri Datuk Seri Kamal Mohamed Hashim Datuk Seri Wong Chun WaiDatin Linda Ngiam Pick Ngoh Mr Lee Siang Korn @ Lee Siang ChinDato’ Wira Syed Abdul Jabbar bin Syed HassanDato’ Dr Mohd Aminuddin bin Mohd RouseDato’ Yip Kum FookMr Lew Weng Ho (appointed on 26 May 2011)Mr Kuah Hun Liang (retired on 26 May 2011) Mr Foo San Kan (resigned on 26 May 2011)
Directors’ Report (Cont’d)

82 |
DIRECTORS’ INTERESTS
The Directors holding office at the end of the financial year and their beneficial interests in ordinary shares of the Company and of its related corporations during the financial year as recorded in the Register of Directors’ Shareholding kept by the Company under Section 134 of the Companies Act, 1965 were as follows:
Number of ordinary shares of RM1.00 each Balance Balance as at as at 1.1.2011 Bought Sold 31.12.2011 Direct interests in the CompanyDatuk Vincent Lee Fook Long 168,300 60,000 - 228,300Datin Linda Ngiam Pick Ngoh 591,000 200,000 (92,000) 699,000Tan Sri Datuk Seri Kamal Mohamed Hashim 100,000 - - 100,000Datuk Seri Wong Chun Wai 4,000 6,000 - 10,000 Indirect interests in the Company Datin Linda Ngiam Pick Ngoh 400,000 87,000 (200,000) 287,000Tan Sri Datuk Seri Kamal Mohamed Hashim 900,000 - - 900,000
None of the other Directors holding office at the end of the financial year held any interest in the ordinary shares or options over ordinary shares of the Company and of its related corporations during the financial year.
DIRECTORS’ BENEFITS
Since the end of the previous financial year, none of the Directors have received or become entitled to receive any benefit (other than those benefits included in the aggregate amount of emoluments received or due and receivable by the Directors as shown in the financial statements) by reason of a contract made by the Company or a related corporation with the Director or with a firm of which the Director is a member, or with a company in which the Director has a substantial financial interest other than the remuneration received by certain Directors as directors/executives of the subsidiaries.
There were no arrangements during and at the end of the financial year, to which the Company is a party, which had the object of enabling the Directors of the Company to acquire benefits by means of the acquisition of shares in or debentures of the Company or any other body corporate.
Directors’ Report (Cont’d)

83|
OTHER STATUTORY INFORMATION REGARDING THE GROUP AND THE COMPANY
(I) AS AT THE END OF THE FINANCIAL YEAR
(a) Before the statements of comprehensive income and statements of financial position of the Group and of the Company were made out, the Directors took reasonable steps:
(i) to ascertain that proper action had been taken in relation to the writing off of bad debts and the making of provision for doubtful debts and have satisfied themselves that all known bad debts had been written off and that adequate provision had been made for doubtful debts; and
(ii) to ensure that any current assets other than debts, which were unlikely to realise their book values in the ordinary course of business had been written down to their estimated realisable values.
(b) In the opinion of the Directors, the results of operations of the Group and of the Company during the financial year have not been substantially affected by any item, transaction or event of a material and unusual nature.
(II) FROM THE END OF THE FINANCIAL YEAR TO THE DATE OF THIS REPORT
(c) The Directors are not aware of any circumstances:
(i) which would render the amounts written off for bad debts or the amount of provision for doubtful debts in the financial statements of the Group and of the Company inadequate to any material extent; and
(ii) which would render the values attributed to current assets in the financial statements of the Group and of the Company misleading; and
(iii) which have arisen which would render adherence to the existing method of valuation of assets or liabilities of the Group and of the Company misleading or inappropriate.
(d) In the opinion of the Directors:
(i) there has not arisen any item, transaction or event of a material and unusual nature which is likely to affect substantially the results of operations of the Group and of the Company for the financial year in which this report is made; and
(ii) no contingent or other liability has become enforceable, or is likely to become enforceable, within the period of twelve (12) months after the end of the financial year which will or may affect the ability of the Group and of the Company to meet their obligations as and when they fall due.
(III) AS AT THE DATE OF THIS REPORT
(e) There are no charges on the assets of the Group and of the Company which have arisen since the end of the financial year to secure the liabilities of any other person.
(f) There are no contingent liabilities of the Group and of the Company which have arisen since the end of the financial year.
(g) The Directors are not aware of any circumstances not otherwise dealt with in this report or the financial statements which would render any amount stated in the financial statements of the Group and of the Company misleading.
Directors’ Report (Cont’d)

84 |
SIGNIFICANT EVENTS DURING THE FINANCIAL YEAR
The significant events during the financial year are disclosed in Note 41 to the financial statements.
SIGNIFICANT EVENTS SUBSEQUENT TO THE END OF THE REPORTING PERIOD
Significant events subsequent to the end of the reporting period are disclosed in Note 42 to the financial statements.
AUDITORS
The auditors, BDO, have expressed their willingness to continue in office.
Signed on behalf of the Board in accordance with a resolution of the Directors.
Datuk Vincent Lee Fook Long Mr Ho Kay TatDirector Director
Petaling Jaya 15 March 2012
Directors’ Report (Cont’d)
85|
In the opinion of the Directors, the financial statements set out on pages 88 to 202 have been drawn up in accordance with applicable approved Financial Reporting Standards and the provisions of the Companies Act, 1965 in Malaysia so as to give a true and fair view of the financial position of the Group and of the Company as at 31 December 2011 and of their financial performance and cash flows of the Group and of the Company for the financial year then ended.
On behalf of the Board,
Datuk Vincent Lee Fook Long Mr Ho Kay TatDirector Director
Petaling Jaya 15 March 2012
I, Ragesh Rajendran, being the officer primarily responsible for the financial management of Star Publications (Malaysia) Berhad, do solemnly and sincerely declare that the financial statements set out on pages 88 to 202 are, to the best of my knowledge and belief, correct and I make this solemn declaration conscientiously believing the same to be true and by virtue of the provisions of the Statutory Declarations Act, 1960.
Subscribed and solemnly )declared by the abovenamed at )Petaling Jaya this )15 March 2012 ) RAGESH RAJENDRAN
Before me:SOONG FOONG CHEE(No. B158)Commissioner for Oaths
Statement by Directors
Statutory Declaration

86 |
REPORT ON THE FINANCIAL STATEMENTS
We have audited the financial statements of Star Publications (Malaysia) Berhad, which comprise the statements of financial position as at 31 December 2011 of the Group and of the Company, and the statements of comprehensive income, statements of changes in equity and statements of cash flows of the Group and of the Company for the financial year then ended, and a summary of significant accounting policies and other explanatory information, as set out on pages 88 to 201.
DIRECTORS’ RESPONSIBILITY FOR THE FINANCIAL STATEMENTS
The Directors of the Company are responsible for the preparation of financial statements that give a true and fair view in accordance with Financial Reporting Standards and the Companies Act, 1965 in Malaysia, and for such internal control as the Directors determine are necessary to enable the preparation of financial statements that are free from material misstatement, whether due to fraud or error.
AUDITORS’ RESPONSIBILITY
Our responsibility is to express an opinion on these financial statements based on our audit. We conducted our audit in accordance with approved standards on auditing in Malaysia. Those standards require that we comply with ethical requirements and plan and perform the audit to obtain reasonable assurance about whether the financial statements are free from material misstatement.
An audit involves performing procedures to obtain audit evidence about the amounts and disclosures in the financial statements. The procedures selected depend on our judgement, including the assessment of risks of material misstatement of the financial statements, whether due to fraud or error. In making those risk assessments, we consider internal control relevant to the entity’s preparation of the financial statements that give a true and fair view in order to design audit procedures that are appropriate in the circumstances, but not for the purpose of expressing an opinion on the effectiveness of the entity’s internal control. An audit also includes evaluating the appropriateness of accounting policies used and the reasonableness of accounting estimates made by the Directors, as well as evaluating the overall presentation of the financial statements.
We believe that the audit evidence we have obtained is sufficient and appropriate to provide a basis for our audit opinion.
OPINION
In our opinion, the financial statements have been properly drawn up in accordance with applicable approved Financial Reporting Standards and the provisions of the Companies Act, 1965 in Malaysia so as to give a true and fair view of the financial position of the Group and of the Company as of 31 December 2011 and of their financial performance and cash flows of the Group and of the Company for the financial year then ended.
Independent Auditors’ Report To The Members Of Star Publications (Malaysia) Berhad

87|
REPORT ON OTHER LEGAL AND REGULATORY REQUIREMENTS
In accordance with the requirements of the Companies Act, 1965 in Malaysia, we also report the following:
(a) In our opinion, the accounting and other records and the registers required by the Act to be kept by the Company and its subsidiaries of which we have acted as auditors have been properly kept in accordance with the provisions of the Act.
(b) We have considered the financial statements and the auditors’ reports of all the subsidiaries of which we have not acted as auditors, which are indicated in Note 10 to the financial statements.
(c) We are satisfied that the financial statements of the subsidiaries that have been consolidated with the Company’s financial statements are in form and content appropriate and proper for the purposes of the preparation of the financial statements of the Group and we have received satisfactory information and explanations required by us for those purposes.
(d) The audit reports on the financial statements of the subsidiaries did not contain any qualification or any adverse comment made under Section 174(3) of the Act.
OTHER REPORTING RESPONSIBILITIES
The supplementary information set out in Note 43 to the financial statements is disclosed to meet the requirement of Bursa Malaysia Securities Berhad and is not part of the financial statements. The Directors are responsible for the preparation of the supplementary information in accordance with Guidance on Special Matter No. 1, Determination of Realised and Unrealised Profits or Losses in the Context of Disclosure Pursuant to Bursa Malaysia Securities Berhad Listing Requirements, as issued by the Malaysian Institute of Accountants (“MIA Guidance”) and the directive of Bursa Malaysia Securities Berhad. In our opinion, the supplementary information is prepared, in all material respects, in accordance with the MIA Guidance and the directive of Bursa Malaysia Securities Berhad.
OTHER MATTERS
This report is made solely to the members of the Company, as a body, in accordance with Section 174 of the Companies Act, 1965 in Malaysia and for no other purpose. We do not assume responsibility to any other person for the content of this report.
BDOAF: 0206Chartered Accountants
Ooi Thiam Poh2495/01/14 (J)Chartered Accountant Kuala Lumpur15 March 2012
Independent Auditors’ ReportTo The Members Of Star Publications (Malaysia) Berhad (Cont’d)
88 |
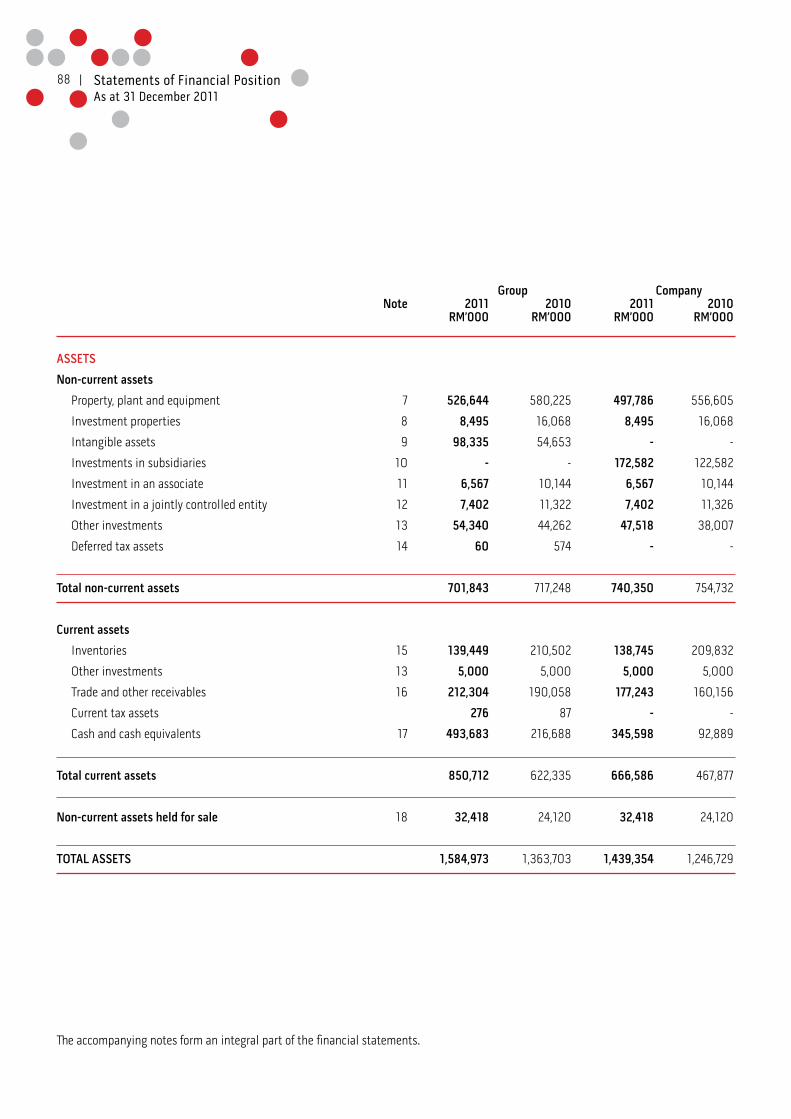
Group Company Note 2011 2010 2011 2010 RM’000 RM’000 RM’000 RM’000
ASSETS
Non-current assets
Property, plant and equipment 7 526,644 580,225 497,786 556,605
Investment properties 8 8,495 16,068 8,495 16,068
Intangible assets 9 98,335 54,653 - -
Investments in subsidiaries 10 - - 172,582 122,582
Investment in an associate 11 6,567 10,144 6,567 10,144
Investment in a jointly controlled entity 12 7,402 11,322 7,402 11,326
Other investments 13 54,340 44,262 47,518 38,007
Deferred tax assets 14 60 574 - -
Total non-current assets 701,843 717,248 740,350 754,732
Current assets
Inventories 15 139,449 210,502 138,745 209,832
Other investments 13 5,000 5,000 5,000 5,000
Trade and other receivables 16 212,304 190,058 177,243 160,156
Current tax assets 276 87 - -
Cash and cash equivalents 17 493,683 216,688 345,598 92,889
Total current assets 850,712 622,335 666,586 467,877
Non-current assets held for sale 18 32,418 24,120 32,418 24,120
TOTAL ASSETS 1,584,973 1,363,703 1,439,354 1,246,729
The accompanying notes form an integral part of the financial statements.
Statements of Financial Position As at 31 December 2011

89|
Group Company Note 2011 2010 2011 2010 RM’000 RM’000 RM’000 RM’000
EQUITY AND LIABILITIES
Equity attributable to owners of the parent
Share capital 19 738,564 738,564 738,564 738,564
Treasury shares 19 (225) (225) (225) (225)
Reserves 20 327,320 269,883 275,625 230,958
1,065,659 1,008,222 1,013,964 969,297
Non-controlling interests 40,195 27,335 - -
TOTAL EQUITY 1,105,854 1,035,557 1,013,964 969,297
Non-current liabilities
Medium Term Notes 21 200,000 - 200,000 -
Borrowings 22 7,194 42,066 - -
Deferred tax liabilities 14 72,570 79,026 71,028 78,435
Total non-current liabilities 279,764 121,092 271,028 78,435
Current liabilities
Trade and other payables 24 132,431 138,855 142,832 135,395
Borrowings 22 55,335 2,698 - -
Commercial Paper 21 - 50,367 - 50,367
Current tax payable 11,589 15,134 11,530 13,235
Total current liabilities 199,355 207,054 154,362 198,997
TOTAL LIABILITIES 479,119 328,146 425,390 277,432
TOTAL EQUITY AND LIABILITIES 1,584,973 1,363,703 1,439,354 1,246,729
The accompanying notes form an integral part of the financial statements.
Statements of Financial Position As at 31 December 2011 (Cont’d)

90 | Statements of Comprehensive Income For The Financial Year Ended 31 December 2011
Group Company
Note 2011 2010 2011 2010
RM’000 RM’000 RM’000 RM’000
Revenue 25 1,067,668 1,061,700 820,002 802,279
Cost of sales and services 26 (404,882) (412,441) (271,032) (266,305)
Gross profit 662,786 649,259 548,970 535,974
Other income 26,885 29,242 20,434 60,673
Distribution costs (178,222) (170,269) (157,061) (152,888)
Administrative and other expenses (247,331) (236,183) (163,001) (167,654)
Finance costs 27 (9,044) (6,901) (11,190) (5,324)
255,074 265,148 238,152 270,781
Share of losses of an associate 11 (687) (1,767) - -
Share of losses of jointly controlled entity/entities 12 (3,856) (4,574) - -
Profit before tax 28 250,531 258,807 238,152 270,781
Tax expense 29 (65,219) (68,639) (60,555) (63,670)
Profit for the financial year 185,312 190,168 177,597 207,111
Other comprehensive income:
Fair value gains on available-for-sale financial assets 133 100 - -
Foreign currency translations 4,630 (5,663) - -
Other comprehensive income, net of tax 4,763 (5,563) - -
Total comprehensive income 190,075 184,605 177,597 207,111
Profit attributable to:
Owners of the parent 186,665 184,941 177,597 207,111
Non-controlling interests (1,353) 5,227 - -
185,312 190,168 177,597 207,111
Total comprehensive income attributable to:
Owners of the parent 190,064 180,991 177,597 207,111
Non-controlling interests 11 3,614 - -
190,075 184,605 177,597 207,111
Earnings per ordinary share attributable to
equity holders of the Company (sen)
- Basic 30 25.28 25.04
The accompanying notes form an integral part of the financial statements.

91| Statements of Changes in Equity For The Financial Year Ended 31 December 2011
The accompanying notes form an integral part of the financial statements.
Attributable to equity holders of the Company Foreign Total Available exchange Share attributable Non Share Treasury -for-sale translation option Retained to owners of -controlling TotalGroup capital shares reserve reserve reserve earnings the parent interests equity RM’000 RM’000 RM’000 RM’000 RM’000 RM’000 RM’000 RM’000 RM’000 Balance as at 31 December 2009 738,564 (225) - 24,771 149 490,847 1,254,106 28,778 1,282,884 Effects on the adoption of FRS 139 - - - - - 141 141 - 141 Restated balance as at 1 January 2010 738,564 (225) - 24,771 149 490,988 1,254,247 28,778 1,283,025 Total comprehensive income - - 100 (4,050) - 184,941 180,991 3,614 184,605 Transactions with owners Additional investment in a subsidiary - - - - - - - (2,848) (2,848) Share options granted under Employee Share Option Scheme (“ESOS”) of a subsidiary (Note 20) - - - - 387 - 387 221 608 Dividends paid to non-controlling interests of a subsidiary - - - - - - - (2,430) (2,430) Dividends (Note 31) - - - - - (427,403) (427,403) - (427,403) Total transactions with owners - - - - 387 (427,403) (427,016) (5,057) (432,073) Balance as at 31 December 2010 738,564 (225) 100 20,721 536 248,526 1,008,222 27,335 1,035,557
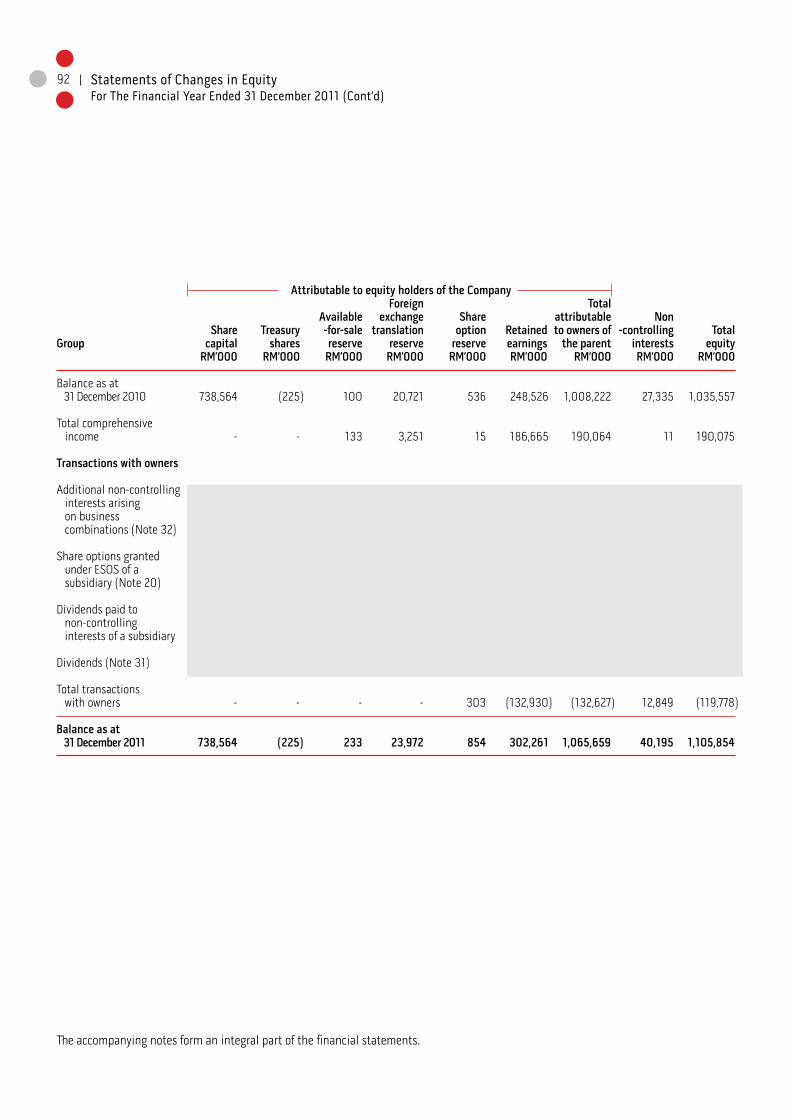
92 |
Attributable to equity holders of the Company Foreign Total Available exchange Share attributable Non Share Treasury -for-sale translation option Retained to owners of -controlling TotalGroup capital shares reserve reserve reserve earnings the parent interests equity RM’000 RM’000 RM’000 RM’000 RM’000 RM’000 RM’000 RM’000 RM’000 Balance as at 31 December 2010 738,564 (225) 100 20,721 536 248,526 1,008,222 27,335 1,035,557 Total comprehensive income - - 133 3,251 15 186,665 190,064 11 190,075 Transactions with owners Additional non-controlling interests arising on business combinations (Note 32) - - - - - - - 13,978 13,978 Share options granted under ESOS of a subsidiary (Note 20) - - - - 303 - 303 174 477 Dividends paid to non-controlling interests of a subsidiary - - - - - - - (1,303) (1,303) Dividends (Note 31) - - - - - (132,930) (132,930) - (132,930) Total transactions with owners - - - - 303 (132,930) (132,627) 12,849 (119,778) Balance as at 31 December 2011 738,564 (225) 233 23,972 854 302,261 1,065,659 40,195 1,105,854
Statements of Changes in Equity For The Financial Year Ended 31 December 2011 (Cont’d)
The accompanying notes form an integral part of the financial statements.

93|
Share Capital Treasury Retained capital reserve shares earnings TotalCompany RM’000 RM’000 RM’000 RM’000 RM’000
Balance as at 31 December 2009 738,564 1,722 (225) 449,353 1,189,414
Effects on the adoption of FRS 139 - - - 175 175
Restated balance as at 1 January 2010 738,564 1,722 (225) 449,528 1,189,589
Total comprehensive income - - - 207,111 207,111
Dividends (Note 31) - - - (427,403) (427,403)
Balance as at 31 December 2010 738,564 1,722 (225) 229,236 969,297
Total comprehensive income - - - 177,597 177,597
Dividends (Note 31) - - - (132,930) (132,930)
Balance as at 31 December 2011 738,564 1,722 (225) 273,903 1,013,964
Statements of Changes in Equity For The Financial Year Ended 31 December 2011 (Cont’d)
The accompanying notes form an integral part of the financial statements.

94 |
Group Company Note 2011 2010 2011 2010 RM’000 RM’000 RM’000 RM’000
CASH FLOWS FROM OPERATING ACTIVITIES
Profit before tax 250,531 258,807 238,152 270,781
Adjustments for:
Allowance for credit losses:
- third parties 16(h) 2,447 2,023 876 52
- subsidiaries 28 - - 708 2,446
Allowance for credit losses no longer required 16(h) (1,155) (714) (127) (573)
Amortisation of radio licence 9(b) 1,312 425 - -
Amortisation of television programmes rights 9(c) 547 - - -
Amortisation of club membership 9(d) 269 269 - -
Bad debts written off 5 170 2 -
Depreciation of investment properties 8 375 610 375 610
Depreciation of property, plant and equipment 7 46,466 47,625 40,058 42,137
Dividend income - - - (39,455)
Fair value gain on other investments 28 (307) (1,486) (307) (1,486)
Impairment losses on:
- goodwill on consolidation 9(a) - 602 - -
- investment in an associate 11 2,890 - 3,577 2,095
- investment in a jointly controlled entity 12 64 - 3,924 8,680
Interest expenses 27 9,044 6,901 11,190 5,324
Interest income 28 (11,283) (13,533) (8,528) (7,742)
Investment income 28 (2,772) (3,741) (2,772) (3,741)
Gain on disposal of investment properties (162) - (162) -
Gain on disposal of non-current assets held for sale (1,383) - (1,383) -
Loss on disposal of investment in a jointly controlled entity 33 - 42 - 64
Net loss/(gain) on disposal of property, plant and equipment 572 (164) 569 (179)
Property, plant and equipment written off 1,197 1,254 275 1,197
Provision for unutilised staff leave 24(f) 943 541 - 347
Share of losses in an associate 687 1,767 - -
Share of losses in jointly controlled entity/entities 3,856 4,574 - -
Share options granted under ESOS 477 608 - -
Unrealised loss on foreign exchange transactions - - 1,059 2,424
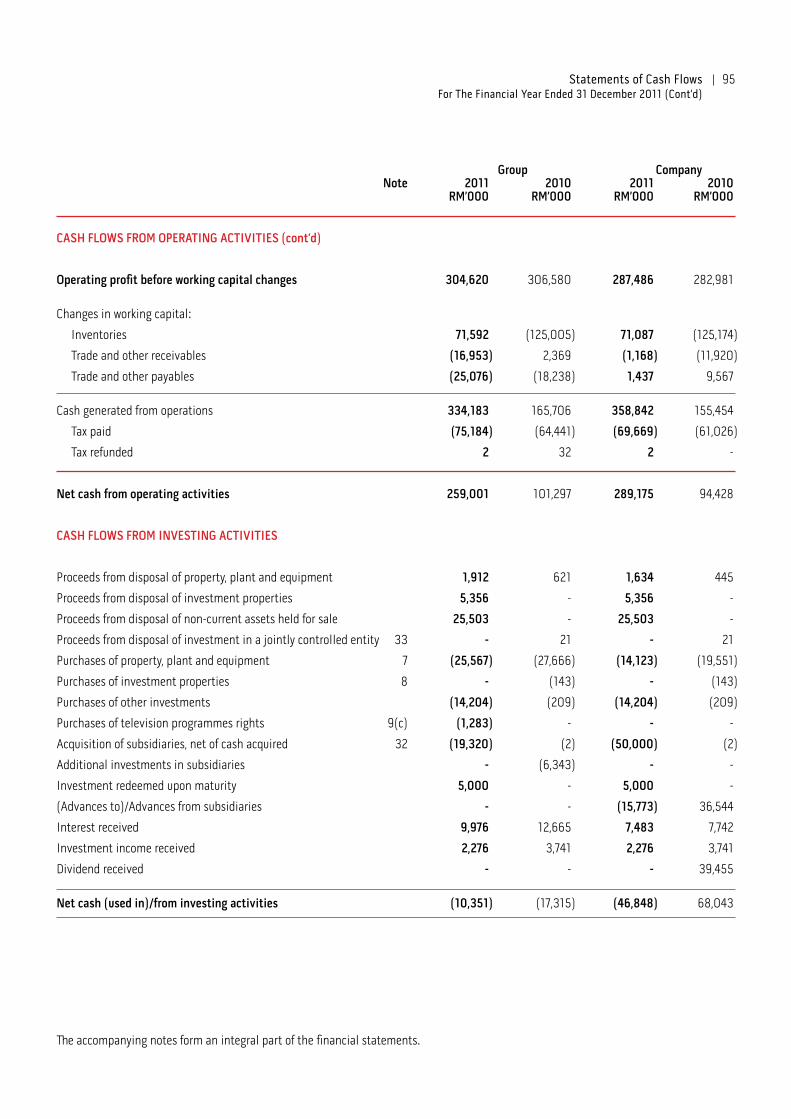
Operating profit before working capital changes 304,620 306,580 287,486 282,981
Statements of Cash Flows For The Financial Year Ended 31 December 2011
The accompanying notes form an integral part of the financial statements.
95|
Group Company Note 2011 2010 2011 2010 RM’000 RM’000 RM’000 RM’000
CASH FLOWS FROM OPERATING ACTIVITIES (cont’d)
Operating profit before working capital changes 304,620 306,580 287,486 282,981
Changes in working capital:
Inventories 71,592 (125,005) 71,087 (125,174)
Trade and other receivables (16,953) 2,369 (1,168) (11,920)
Trade and other payables (25,076) (18,238) 1,437 9,567
Cash generated from operations 334,183 165,706 358,842 155,454
Tax paid (75,184) (64,441) (69,669) (61,026)
Tax refunded 2 32 2 -
Net cash from operating activities 259,001 101,297 289,175 94,428
CASH FLOWS FROM INVESTING ACTIVITIES
Proceeds from disposal of property, plant and equipment 1,912 621 1,634 445
Proceeds from disposal of investment properties 5,356 - 5,356 -
Proceeds from disposal of non-current assets held for sale 25,503 - 25,503 -
Proceeds from disposal of investment in a jointly controlled entity 33 - 21 - 21
Purchases of property, plant and equipment 7 (25,567) (27,666) (14,123) (19,551)
Purchases of investment properties 8 - (143) - (143)
Purchases of other investments (14,204) (209) (14,204) (209)
Purchases of television programmes rights 9(c) (1,283) - - -
Acquisition of subsidiaries, net of cash acquired 32 (19,320) (2) (50,000) (2)
Additional investments in subsidiaries - (6,343) - -
Investment redeemed upon maturity 5,000 - 5,000 -
(Advances to)/Advances from subsidiaries - - (15,773) 36,544
Interest received 9,976 12,665 7,483 7,742
Investment income received 2,276 3,741 2,276 3,741
Dividend received - - - 39,455
Net cash (used in)/from investing activities (10,351) (17,315) (46,848) 68,043
Statements of Cash Flows For The Financial Year Ended 31 December 2011 (Cont’d)
The accompanying notes form an integral part of the financial statements.

96 |
Group Company Note 2011 2010 2011 2010 RM’000 RM’000 RM’000 RM’000
CASH FLOWS FROM FINANCING ACTIVITIES
Repayments for hire purchase and finance lease liabilities (1,040) (967) - -
Repayments of bank loan (12,892) (18,701) - -
Redemption of Medium Term Notes - (250,000) - (250,000)
Drawdown of bank loan 30,803 16,276 - -
Proceeds from issuance of Commercial Paper - 50,102 - 50,102
Redemption of Commercial Paper (52,000) - (52,000) -
Issuance of Medium Term Notes 200,000 - 200,000 -
Interest paid (6,112) (6,636) (4,688) (5,059)
Dividends paid (132,930) (427,403) (132,930) (427,403)
Dividends paid by a subsidiary to non-controlling interests (2,330) (1,403) - -
Net cash from/(used in) financing activities 23,499 (638,732) 10,382 (632,360)
Net increase/(decrease) in cash and cash equivalents 272,149 (554,750) 252,709 (469,889)
Effects of exchange rate fluctuations on cash and cash equivalents 4,846 (1,791) - -
Cash and cash equivalents as at beginning of financial year 216,688 773,229 92,889 562,778
Cash and cash equivalents as at end of financial year 17 493,683 216,688 345,598 92,889
Statements of Cash Flows For The Financial Year Ended 31 December 2011 (Cont’d)
The accompanying notes form an integral part of the financial statements.

97| Notes To The Financial Statements 31 December 2011
1. CORPORATE INFORMATION
The Company is a public limited liability company, incorporated and domiciled in Malaysia, and is listed on the Main Market of Bursa Malaysia Securities Berhad.
The registered office and principal place of business of the Company is located at Level 15, Menara Star, 15, Jalan 16/11, 46350 Petaling Jaya.
The financial statements are presented in Ringgit Malaysia (“RM”), which is also the Company’s functional currency. All financial information presented in RM has been rounded to the nearest thousand, unless otherwise stated.
The financial statements were authorised for issuance in accordance with a resolution by the Board of Directors on 15 March 2012.
2. PRINCIPAL ACTIVITIES
The principal activities of the Company are the publication, printing and distribution of newspapers and magazines. The principal activities of the subsidiaries are set out in Note 10 to the financial statements. There have been no significant changes in the nature of these activities during the financial year.
3. BASIS OF PREPARATION
The financial statements of the Group and of the Company set out on pages 88 to 201 have been prepared in accordance with applicable approved Financial Reporting Standards (“FRSs”) and the provisions of the Companies Act, 1965 in Malaysia. However, Note 43 to the financial statements set out on page 202 has been prepared in accordance with Guidance on Special Matter No. 1, Determination of Realised and Unrealised Profits or Losses in the Context of Disclosure Pursuant to Bursa Malaysia Securities Berhad Listing Requirements, as issued by the Malaysian Institute of Accountants (“MIA Guidance”) and the directive of Bursa Malaysia Securities Berhad.
4. SIGNIFICANT ACCOUNTING POLICIES
4.1 Basis of accounting
The financial statements of the Group and of the Company have been prepared under the historical cost convention except as otherwise stated in the financial statements.
The preparation of financial statements requires the Directors to make estimates and assumptions that affect the reported amounts of assets, liabilities, revenue and expenses and disclosure of contingent assets and contingent liabilities. In addition, the Directors are also required to exercise their judgement in the process of applying the Group’s accounting policies. The areas involving such judgements, estimates and assumptions are disclosed in Note 6 to the financial statements. Although these estimates and assumptions are based on the Directors’ best knowledge of events and actions, actual results could differ from those estimates.

98 |
4. SIGNIFICANT ACCOUNTING POLICIES (cont’d)
4.2 Basis of consolidation
The consolidated financial statements incorporate the financial statements of the Company and all its subsidiaries. Subsidiaries are entities (including special purposes entities) over which the Company has the power to govern the financial and operating policies, generally accompanied by a shareholding giving rise to the majority of the voting rights, so as to obtain benefits from their activities.
Subsidiaries are consolidated from the date on which control is transferred to the Group up to the effective date on which control ceases, as appropriate.
Intragroup balances, transactions, income and expenses are eliminated on consolidation. Unrealised gains arising from transactions with associates and joint ventures are eliminated against the investment to the extent of the Group’s interest in the investee. Unrealised losses are eliminated in the same way as unrealised gains, but only to the extent that there is no impairment.
The financial statements of the subsidiaries are prepared for the same reporting period as that of the Company, using consistent accounting policies. Where necessary, accounting policies of subsidiaries are changed to ensure consistency with the policies adopted by the other entities in the Group.
Non-controlling interests represents the equity in subsidiaries that are not attributable, directly or indirectly, to owners of the Company, and is presented separately in the consolidated statement of comprehensive income and within equity in the consolidated statement of financial position, separately from equity attributable to owners of the Company. Profit or loss and each component of other comprehensive income are attributed to the owners of the parent and to the non-controlling interests. Total comprehensive income is attributed to non-controlling interests even if this results in the non-controlling interests having a deficit balance.
Components of non-controlling interests in the acquiree that are present ownership interests and entitle their holders to a proportionate share of the entity’s net assets in the event of liquidation may be initially measured at either fair value or at the present ownership instruments’ proportionate share in the recognised amounts of the acquiree’s identifiable net assets. All other components of non-controlling interests shall be measured at their acquisition-date fair values, unless another measurement basis is required by FRSs. The choice of measurement basis is made on a combination-by-combination basis. Subsequent to initial recognition, the carrying amount of non-controlling interests is the amount of those interests at initial recognition plus the non-controlling interests’ share of subsequent changes in equity.
The Group has applied the revised FRS 3 Business Combinations in accounting for business combinations from 1 January 2011 onwards. The change in accounting policy has been applied prospectively in accordance with the transitional provisions provided by the Standard.
Changes in the Company’s ownership interest in a subsidiary that do not result in a loss of control are accounted for as equity transactions. In such circumstances, the carrying amounts of the controlling and non-controlling interests are adjusted to reflect the changes in their relative interests in the subsidiary. Any difference between the amount by which the non-controlling interest is adjusted and the fair value of consideration paid or received is recognised directly in equity and attributed to owners of the parent.
Notes To The Financial Statements31 December 2011 (Cont’d)

99|
4. SIGNIFICANT ACCOUNTING POLICIES (cont’d)
4.2 Basis of consolidation (cont’d)
When the Group loses control of a subsidiary, the profit or loss on disposal is calculated as the difference between:(i) the aggregate of the fair value of the consideration received and the fair value of any retained interest; and
(ii) the previous carrying amount of the assets (including goodwill), and liabilities of the subsidiary and any non-controlling interests.
Amounts previously recognised in other comprehensive income in relation to the subsidiary are accounted for (i.e. reclassified to profit or loss or transferred directly to retained earnings) in the same manner as would be required if the relevant assets or liabilities were disposed of. The fair value of any investments retained in the former subsidiary at the date when control is lost is regarded as the fair value on initial recognition for subsequent accounting under FRS 139 Financial Instruments: Recognition and Measurement or, where applicable, the cost on initial recognition of an investment in associate or jointly controlled entity.
4.3 Business combinations
Business combinations from 1 January 2011 onwards
Business combinations are accounted for by applying the acquisition method of accounting.
Identifiable assets acquired, liabilities and contingent liabilities assumed in a business combination are measured at their fair value at the acquisition date, except that:
(a) deferred tax assets or liabilities and liabilities or assets related to employee benefit arrangements are recognised and measured in accordance with FRS 112 Income Taxes and FRS 119 Employee Benefits respectively;
(b) liabilities or equity instruments related to share-based payment transactions of the acquiree or the replacement by the Group of an acquiree’s share-based payment transactions are measured in accordance with FRS 2 Share-based Payment at the acquisition date; and
(c) assets (or disposal groups) that are classified as held for sale in accordance with FRS 5 Non-current Assets Held for Sale and Discontinued Operations are measured in accordance with that Standard.
Acquisition-related costs are recognised as expenses in the periods in which the costs are incurred and the services are received.
Any contingent consideration payable is recognised at fair value at the acquisition date. Measurement period adjustments to contingent consideration are dealt with as follows:
(a) If the contingent consideration is classified as equity, it is not remeasured and settlement is accounted for within equity.
(b) Subsequent changes to contingent consideration classified as an asset or liability that is a financial instrument within the scope of FRS 139 are recognised either in profit or loss or in other comprehensive income in accordance with FRS 139. All other subsequent changes are recognised in profit or loss.
Notes To The Financial Statements 31 December 2011 (Cont’d)

100 |
4. SIGNIFICANT ACCOUNTING POLICIES (cont’d)
4.3 Business combinations (cont’d)
Business combinations from 1 January 2011 onwards (cont’d)
In a business combination achieved in stages, previously held equity interests in the acquiree are re-measured to fair value at the acquisition date and any corresponding gain or loss is recognised in profit or loss.
During the financial year, the Group elected to recognise non-controlling interest in the acquiree on the date of acquisition at the non-controlling interest’s proportionate share of the acquiree’s net identifiable assets for each individual business combination.
Any excess of the sum of the fair value of the consideration transferred in the business combination, the amount of non-controlling interest in the acquiree (if any), and the fair value of the Group’s previously held equity interest in the acquiree (if any), over the net fair value of the acquiree’s identifiable assets and liabilities is recorded as goodwill in the statement of financial position. The accounting policy for goodwill is set out in Note 4.7.1. In instances where the latter amount exceeds the former, the excess is recognised as a gain on bargain purchase in profit or loss on the acquisition date.
Business combinations before 1 January 2011
Under the purchase method of accounting, the cost of business combination is measured at the aggregate of fair values at the date of exchange, of assets given, liabilities incurred or assumed, and equity instruments issued plus any costs directly attributable to the business combination.
At the acquisition date, the cost of business combination is allocated to identifiable assets acquired, liabilities assumed and contingent liabilities in the business combination which are measured initially at their fair values at the acquisition date. The excess of the cost of a business combination over the Group’s interest in the net fair value of the identifiable assets, liabilities and contingent liabilities is recognised as goodwill (see Note 4.7.1 to the financial statements on goodwill). If the cost of business combination is less than the interest in the net fair value of the identifiable assets, liabilities and contingent liabilities, the Group will:
(a) reassess the identification and measurement of the acquiree’s identifiable assets, liabilities and contingent liabilities and the measurement of the cost of the business combination; and
(b) recognise immediately in profit or loss any excess remaining after that reassessment.
When a business combination includes more than one exchange transaction, any adjustment to the fair values of the subsidiary’s identifiable assets, liabilities and contingent liabilities relating to previously held interests of the Group is accounted for as a revaluation.
4.4 Property, plant and equipment and depreciation
All items of property, plant and equipment are initially measured at cost. Cost includes expenditure that is directly attributable to the acquisition of the asset.
Subsequent costs are included in the asset’s carrying amount or recognised as a separate asset, as appropriate, only when the cost is incurred and it is probable that the future economic benefits associated with the asset will flow to the Group and the cost of the asset can be measured reliably. The carrying amount of parts that are replaced is derecognised. The costs of the day-to-day servicing of property, plant and equipment are recognised in profit or loss as incurred. Cost also comprises the initial estimate of dismantling and removing the asset and restoring the site on which it is located for which the Group is obligated to incur when the asset is acquired, if applicable.
Notes To The Financial Statements31 December 2011 (Cont’d)

101|
4. SIGNIFICANT ACCOUNTING POLICIES (cont’d)
4.4 Property, plant and equipment and depreciation (cont’d)
Each part of an item of property, plant and equipment with a cost that is significant in relation to the total cost of the asset and which has a different useful life, is depreciated separately.
After initial recognition, property, plant and equipment except for certain leasehold land and leasehold building, are stated at cost less any accumulated depreciation and any accumulated impairment losses.
As disclosed in Note 7(a), certain leasehold land and leasehold building are stated at valuation, which is the fair value at the date of revaluation in 1983 less any subsequent accumulated depreciation and subsequent accumulated impairment losses. The Group does not adopt a policy of regular valuations. The revalued assets have been retained on the basis of their previous valuation and considered as deemed cost in accordance with the transitional provisions of International Accounting Standard 16 (Revised) Property, Plant and Equipment, issued by the Malaysian Accounting Standards Board, which allows the Group to retain the carrying amount on the basis of the previous revaluation without the need for regular revaluation. The transitional provisions will remain in force until and unless the Group adopts a revaluation policy in place of a cost policy where FRS 116 would require revaluations to be carried out at regular intervals.
Depreciation is calculated to write off the cost of the assets to their residual values on a straight line basis over their estimated useful lives. The principal depreciation periods and annual rates are as follows:
Buildings 30 years to 50 yearsLong term leasehold land 62 years to 888 yearsPlant and machinery 5.56% - 25%Furniture, fittings and equipment, renovation and motor vehicles 10% - 50%Exhibition services assets 10%
Freehold land has unlimited useful life and is not depreciated. Construction-in-progress represents plant and buildings under construction and renovation-in-progress and is stated at cost. Construction-in-progress is not depreciated until such time when the asset is available for use.
At the end of each reporting period, the carrying amount of an item of property, plant and equipment is assessed for impairment when events or changes in circumstances indicate that its carrying amount may not be recoverable. A write down is made if the carrying amount exceeds the recoverable amount (see Note 4.11 to the financial statements on impairment of non-financial assets).
The residual values, useful lives and depreciation method are reviewed at the end of each reporting period to ensure that the amount, method and period of depreciation are consistent with previous estimates and the expected pattern of consumption of the future economic benefits embodied in the items of property, plant and equipment. If expectations differ from previous estimates, the changes are accounted for as a change in an accounting estimate.
The carrying amount of an item of property, plant and equipment is derecognised on disposal or when no future economic benefits are expected from its use or disposal. The difference between the net disposal proceeds, if any, and the carrying amount is included in profit or loss and the revaluation surplus related to those assets, if any, is transferred directly to retained earnings.
Notes To The Financial Statements 31 December 2011 (Cont’d)

102 |
4. SIGNIFICANT ACCOUNTING POLICIES (cont’d)
4.5 Investment properties
Investment properties are properties which are held to earn rental yields or for capital appreciation or for both and are not occupied by the Group. Investment properties are initially measured at cost, which includes transaction costs. After initial recognition, investment properties are stated at cost less accumulated depreciation and accumulated impairment losses, if any.
Depreciation is charged to profit or loss on a straight line basis over the estimated useful lives of the investment properties. The estimated useful lives of the buildings are within 30 years to 50 years.
Investment properties are derecognised when either they have been disposed of or when they are permanently withdrawn from use and no future economic benefit is expected from their disposal. The gains or losses arising from the retirement or disposal of investment property is determined as the difference between the net disposal proceeds, if any, and the carrying amount of the asset and is recognised in profit or loss in the period of the retirement or disposal.
4.6 Leases and hire purchase
4.6.1 Finance leases and hire purchase
Assets acquired under finance leases and hire purchase which transfer substantially all the risks and rewards of ownership to the Group are recognised initially at amounts equal to the fair value of the leased assets or, if lower, the present value of minimum lease payments, each determined at the inception of the lease. The discount rate used in calculating the present value of the minimum lease payments is the interest rate implicit in the leases, if this is practicable to determine; if not, the Group’s incremental borrowing rate is used. Any initial direct costs incurred by the Group are added to the amount recognised as an asset. The assets are capitalised as property, plant and equipment and the corresponding obligations are treated as liabilities. The property, plant and equipment capitalised are depreciated on the same basis as owned assets.
The minimum lease payments are apportioned between finance charges and the reduction of the outstanding liability. The finance charges are recognised in profit or loss over the period of the lease term so as to produce a constant periodic rate of interest on the remaining lease and hire purchase liabilities.
4.6.2 Operating leases
A lease is classified as an operating lease if it does not transfer substantially all the risks and rewards incidental to ownership.
Lease payments under operating leases are recognised as an expense on a straight line basis over the lease term.
Notes To The Financial Statements31 December 2011 (Cont’d)

103|
4. SIGNIFICANT ACCOUNTING POLICIES (cont’d)
4.6 Leases and hire purchase (cont’d)
4.6.3 Leases of land and buildings
For leases of land and buildings, the land and buildings elements are considered separately for the purpose of lease classification and these leases are classified as operating or finance leases in the same way as leases of other assets.
The minimum lease payments, including any lump-sum upfront payments made to acquire the interest in the land and buildings, are allocated between the land and the buildings elements in proportion to the relative fair values of the leasehold interests in the land element and the buildings element of the lease at the inception of the lease.
For a lease of land and buildings in which the amount that would initially be recognised for the land element is immaterial, the land and buildings are treated as a single unit for the purpose of lease classification and is accordingly classified as a finance or operating lease. In such a case, the economic life of the buildings is regarded as the economic life of the entire leased asset.
4.7 Intangible assets
4.7.1 Goodwill
Goodwill recognised in a business combination is an asset at the acquisition date and is initially measured at cost being the excess of the sum of the consideration transferred, the amount of any non-controlling interest in the acquiree and the fair value of the acquirer’s previously held equity interest (if any) in the entity over net of the acquisition-date amounts of the identifiable assets acquired and the liabilities assumed. If, after reassessment, the Group’s interest in the fair value of the acquiree’s identifiable net assets exceeds the sum of the consideration transferred, the amount of any non-controlling interest in the acquiree and the fair value of the acquirer’s previously held equity interest in the acquiree (if any), the excess is recognised immediately in profit or loss as a bargain purchase gain.
After initial recognition, goodwill is measured at cost less accumulated impairment losses, if any. Goodwill is not amortised but instead tested for impairment annually or more frequently if events or changes in circumstances indicate that the carrying amount may be impaired. Gains and losses on the disposal of an entity include the carrying amount of goodwill relating to the entity sold.
Goodwill arising on acquisition of an associate is the excess of the cost of investment over the Group’s share of the net fair value of net assets of the associates’ identifiable assets and liabilities at the date of acquisition.
Goodwill relating to the associate is included in the carrying amount of the investment and is not amortised. The excess of the Group’s share of the net fair value of the associate’s identifiable assets and liabilities over the cost of investment is included as income in the determination of the Group’s share of the associate’s profit or loss in the period in which the investment is acquired.
Notes To The Financial Statements 31 December 2011 (Cont’d)

104 |
4. SIGNIFICANT ACCOUNTING POLICIES (cont’d)
4.7 Intangible assets (cont’d)
4.7.2 Other intangible assets
Other intangible assets are recognised only when the identifiability, control and future economic benefit probability criteria are met.
The Group recognises at the acquisition date separately from goodwill, an intangible asset of the acquiree, irrespective of whether the asset had been recognised by the acquiree before the business combination. In-process research and development projects acquired in such combinations are recognised as an asset even if subsequent expenditure is written off because the criteria specified in the policy for research and development is not met.
Intangible assets are initially measured at cost. The cost of intangible assets recognised in a business combination is their fair values as at the date of acquisition.
After initial recognition, intangible assets are carried at cost less any accumulated amortisation and any accumulated impairment losses. The useful lives of intangible assets are assessed to be either finite or indefinite. Intangible assets with finite lives are amortised on a straight line basis over their estimated economic useful lives and are assessed for any indication that the asset may be impaired. If any such indication exists, the entity shall estimate the recoverable amount of the asset. The amortisation period and the amortisation method for an intangible asset with a finite useful life are reviewed at least at each financial year end. The amortisation expense on intangible assets with finite lives is recognised in profit or loss and is included within the other operating expenses line item.
An intangible asset has an indefinite useful life when based on the analysis of all the relevant factors, there is no foreseeable limit to the period over which the asset is expected to generate net cash inflows to the Group. Intangible assets with indefinite useful lives are tested for impairment annually and wherever there is an indication that the carrying amount may be impaired. Such intangible assets are not amortised. Their useful lives are reviewed at each period end to determine whether events and circumstances continue to support the indefinite useful life assessment for the asset. If they do not, the change in the useful life assessment from indefinite to finite is accounted for as a change in accounting estimate in accordance with FRS 108 Accounting Policies, Changes in Accounting Estimates and Errors.
Expenditure on an intangible item that is initially recognised as an expense is not recognised as part of the cost of an intangible asset at a later date.
An intangible asset is derecognised on disposal or when no future economic benefits are expected from its use. The gain or loss arising from the derecognition is determined as the difference between the net disposal proceeds, if any, and the carrying amount of the asset and is recognised in profit or loss when the asset is derecognised.
Radio licences
Radio licences acquired have finite useful lives of five (5) years and are shown at cost less accumulated amortisation and any accumulated impairment losses. Amortisation is calculated using the straight line method to allocate the cost of the licences over their estimated useful lives.
Notes To The Financial Statements31 December 2011 (Cont’d)
105|
4. SIGNIFICANT ACCOUNTING POLICIES (cont’d)
4.7 Intangible assets (cont’d)
4.7.2 Other intangible assets (cont’d)
Television programmes rights
Television programmes rights acquired have finite useful lives and are shown at cost less accumulated amortisation and any accumulated impairment losses. Amortisation is calculated using the straight line method to allocate the cost of television programmes rights over their estimated useful lives of one (1) to five (5) years.
Club membership
Club membership of the Group is amortised over its estimated useful life of three (3) years using the straight line method. The club membership is stated at cost less accumulated amortisation and any impairment losses.
4.8 Investments
(a) Subsidiaries
A subsidiary is an entity in which the Group and the Company have the power to control the financial and operating policies so as to obtain benefits from its activities. The existence and effect of potential voting rights that are currently exercisable or convertible are considered when assessing whether the Group has such power over another entity.
An investment in subsidiary, which is eliminated on consolidation, is stated in the Company’s separate financial statements at cost less accumulated impairment losses, if any. Investments accounted for at cost shall be accounted for in accordance with FRS 5 Non-current Assets Held for Sale and Discontinued Operations when they are classified as held for sale (or included in a disposal group that is classified as held for sale) in accordance with FRS 5.
When control of a subsidiary is lost as a result of a transaction, event or other circumstance, the Group would derecognise all assets, liabilities and non-controlling interests at their carrying amounts and recognise the fair value of the consideration received. Any retained interest in the former subsidiary is recognised at its fair value at the date control is lost. The resulting difference is recognised as a gain or loss in profit or loss.
(b) Associate
An associate is an entity over which the Group and the Company have significant influence and that is neither a subsidiary nor an interest in a joint venture. Significant influence is the power to participate in the financial and operating policy decisions of the investee but is not control or joint control over those policies.
In the Company’s separate financial statements, an investment in associate is stated at cost less accumulated impairment losses, if any.
An investment in associate is accounted for in the consolidated financial statements using the equity method of accounting. The investment in associate in the consolidated statement of financial position is initially recognised at cost and adjusted thereafter for the post acquisition change in the Group’s share of net assets of the investment.
Notes To The Financial Statements 31 December 2011 (Cont’d)

106 |
4. SIGNIFICANT ACCOUNTING POLICIES (cont’d)
4.8 Investments (cont’d)
(b) Associate (cont’d)
The interest in the associate is the carrying amount of the investment in the associate under the equity method together with any long term interest that, in substance, form part of the Group’s net interest in the associate.
The Group’s share of the profit or loss of the associate during the financial year is included in the consolidated financial statements, after adjustments to align the accounting policies with those of the Group, from the date that significant influence commences until the date that significant influence ceases. Distributions received from the associate reduce the carrying amount of the investment. Adjustments to the carrying amount may also be necessary for changes in the Group’s proportionate interest in the associate arising from changes in the associate’s equity that have not been recognised in the associate’s profit or loss. Such changes include those arising from the revaluation of property, plant and equipment and from foreign exchange translation differences. The Group’s share of those changes is recognised directly in equity of the Group.
Unrealised gains and losses on transactions between the Group and the associate are eliminated to the extent of the Group’s interest in the associate, unless the transaction provides evidence on impairment of the asset transferred.
When the Group’s share of losses in the associate equals to or exceeds its interest in the associate, the carrying amount of that interest is reduced to nil and the Group does not recognise further losses unless it has incurred legal or constructive obligations or made payments on its behalf.
The most recent available financial statements of the associate are used by the Group in applying the equity method. When the end of the reporting periods of the financial statements are not coterminous, the share of results is arrived at using the latest audited financial statements for which the difference in end of the reporting periods is no more than three (3) months. Adjustments are made for the effects of any significant transactions or events that occur between the intervening periods.
Upon disposal of an investment in associate, the difference between the net disposal proceeds and its carrying amount is included in profit or loss.
(c) Jointly controlled entity
A jointly controlled entity is a joint venture that involves the establishment of a corporation, partnership or other entities over which there is a contractually agreed sharing of joint control over the economic activity of the entity. Joint control exists when the strategic financial and operational decisions relating to the activity require the unanimous consent of all the parties sharing control.
In the Company’s separate financial statements, an investment in jointly controlled entity is stated at cost less impairment losses, if any.
Notes To The Financial Statements31 December 2011 (Cont’d)
107|
4. SIGNIFICANT ACCOUNTING POLICIES (cont’d)
4.8 Investments (cont’d)
(c) Jointly controlled entity (cont’d)
The investment in a jointly controlled entity is accounted for in the consolidated financial statements using the equity method of accounting. The Group’s share of the profit or loss of the jointly controlled entity during the financial year is included in the consolidated financial statements, after adjustments to align the accounting policies with those of the Group, from the date that joint control commences until the date that joint control ceases. When necessary, in applying the equity method, adjustments are made to the financial statements of the jointly controlled entity to ensure consistency of accounting policies with those of the Group.
Unrealised gains on transactions between the Group and its jointly controlled entity are eliminated to the extent of the Group’s interest in the jointly controlled entity; unrealised losses are also eliminated unless the transaction provides evidence on impairment of the asset transferred.
Adjustments to the carrying amount may also be necessary for changes in the Group’s proportionate interest in the jointly controlled entity arising from changes in the jointly controlled entity’s equity that have not been recognised in the jointly controlled entity’s profit or loss. Such changes include those arising from the revaluation of property, plant and equipment and from foreign exchange translation differences. The Group’s share of those changes is recognised directly in equity of the Group.
Upon disposal of such an investment, the difference between the net disposal proceeds and its carrying amount is included in profit or loss.
4.9 Inventories
Inventories are stated at the lower of cost and net realisable value. Cost is determined using the following methods:
Cost of newsprint of the Group and of the Company is determined on a weighted average basis while cost of other raw materials and consumables of the Group is determined on a first-in-first-out basis.
Cost of newsprint comprises all costs of purchase plus the cost of bringing the inventories to their present location and condition. The cost of other raw materials and consumables comprise direct materials, direct labour costs and the overheads cost.
Net realisable value is the estimated selling price in the ordinary course of business, less the estimated costs of completion and the estimated costs necessary to make the sale.
4.10 Amounts due from/to customers for contract work
Contract costs comprise costs related directly to the specific contract and those that are attributable to the contract activity in general and can be allocated to the contract and such other costs that are specifically chargeable to the customer under the terms of the contract.
When the total costs incurred on contracts plus recognised profits (less recognised losses) exceeds progress billings, the balance is classified as amount due from customers for contract work. When progress billings exceed costs incurred plus recognised profits (less recognised losses), the balance is classified as amount due to customers for contract work.
Notes To The Financial Statements 31 December 2011 (Cont’d)

108 |
4. SIGNIFICANT ACCOUNTING POLICIES (cont’d)
4.11 Impairment of non-financial assets
The carrying amounts of assets, except for financial assets (excluding investments in subsidiaries, associate and jointly controlled entity), inventories, assets arising from contract work, deferred tax assets and non-current assets held for sale, are reviewed at the end of each reporting period to determine whether there is any indication of impairment. If any such indication exists, the asset’s recoverable amount is estimated.
Goodwill and intangible assets that have an indefinite useful life are tested annually for impairment or more frequently if events or changes in circumstances indicate that the goodwill or intangible assets might be impaired.
The recoverable amount of an asset is estimated for an individual asset. Where it is not possible to estimate the recoverable amount of the individual asset, the impairment test is carried out on the cash-generating unit (“CGU”) to which the asset belongs. Goodwill acquired in a business combination is from the acquisition date, allocated to each of the Group’s CGU or groups of CGU that are expected to benefit from the synergies of the combination giving rise to the goodwill irrespective of whether other assets or liabilities of the acquiree are assigned to those units or groups of units.
Goodwill acquired in a business combination shall be tested for impairment as part of the impairment testing of CGU to which it relates. The CGU to which goodwill is allocated shall represent the lowest level within the Group at which the goodwill is monitored for internal management purposes and not larger than an operating segment determined in accordance with FRS 8.
The recoverable amount of an asset or CGU is the higher of its fair value less cost to sell and its value-in-use.
In estimating value-in-use, the estimated future cash inflows and outflows to be derived from continuing use of the asset and from its ultimate disposal are discounted to their present value using a pre-tax discount rate that reflects current market assessments of the time value of money and the risks specific to the asset for which the future cash flow estimates have not been adjusted. An impairment loss is recognised in profit or loss when the carrying amount of the asset or the CGU, including the goodwill or intangible assets, exceeds the recoverable amount of the asset or the CGU. The total impairment loss is allocated, first, to reduce the carrying amount of any goodwill allocated to the CGU and then to the other assets of the CGU on a pro-rata basis of the carrying amount of each asset in the CGU.
The impairment loss is recognised in profit or loss immediately except for the impairment on a revalued asset where the impairment loss is recognised directly against the revaluation reserve to the extent of the surplus credited from the previous revaluation for the same asset with the excess of the impairment loss charged to profit or loss.
An impairment loss on goodwill is not reversed in subsequent periods. An impairment loss on other assets is reversed if, and only if, there has been a change in the estimates used to determine the assets’ recoverable amount since the last impairment loss was recognised.
Notes To The Financial Statements31 December 2011 (Cont’d)

109|
4. SIGNIFICANT ACCOUNTING POLICIES (cont’d)
4.11 Impairment of non-financial assets (cont’d)
An impairment loss is reversed only to the extent that the asset’s carrying amount does not exceed the carrying amount that would have been determined, net of depreciation or amortisation, if no impairment loss had been recognised.
Such reversals are recognised as income immediately in profit or loss except for the reversal of an impairment loss on a revalued asset where the reversal of the impairment loss is treated as a revaluation increase and credited to the revaluation reserve account of the same asset. However, to the extent that an impairment loss on the same revalued asset was previously recognised in profit or loss, a reversal of that impairment loss is also recognised in profit or loss.
4.12 Provisions
Provisions are recognised when there is a present obligation, legal or constructive, as a result of a past event, when it is probable that an outflow of resources embodying economic benefits will be required to settle the obligation and a reliable estimate can be made of the amount of the obligation.
Where the effect of the time value of money is material, the amount of a provision will be discounted to its present value at a pre-tax rate that reflects current market assessments of the time value of money and the risks specific to the liability.
Provisions are reviewed at the end of each reporting period and adjusted to reflect the current best estimate. If it is no longer probable that an outflow of resources embodying economic benefits will be required to settle the obligation, the provision will be reversed.
Provisions are not recognised for future operating losses. If the Group has a contract that is onerous, the present obligation under the contract shall be recognised and measured as a provision.
4.13 Financial instruments
A financial instrument is any contract that gives rise to a financial asset of one enterprise and a financial liability or equity instrument of another enterprise.
A financial asset is any asset that is cash, an equity instrument of another enterprise, a contractual right to receive cash or another financial asset from another enterprise, or a contractual right to exchange financial assets or financial liabilities with another enterprise under conditions that are potentially favourable to the Group.
A financial liability is any liability that is a contractual obligation to deliver cash or another financial asset to another enterprise, or a contractual obligation to exchange financial assets or financial liabilities with another enterprise under conditions that are potentially unfavourable to the Group.
Notes To The Financial Statements 31 December 2011 (Cont’d)

110 |
4. SIGNIFICANT ACCOUNTING POLICIES (cont’d)
4.13 Financial instruments (cont’d)
Financial instruments are recognised on the statements of financial position when the Group has become a party to the contractual provisions of the instruments. At initial recognition, a financial instrument is recognised at fair value plus, in the case of a financial instrument not at fair value through profit or loss, transaction costs that are directly attributable to the acquisition or issuance of the financial instrument.
An embedded derivative is separated from the host contract and accounted for as a derivative if, and only if the economic characteristics and risks of the embedded derivative is not closely related to the economic characteristics and risks of the host contract, a separate instrument with the same terms as the embedded derivative meets the definition of a derivative, and the hybrid instrument is not measured at fair value through profit or loss.
(a) Financial assets
A financial asset is classified into the following four categories after initial recognition for the purpose of subsequent measurement.
(i) Financial assets at fair value through profit or loss
Financial assets at fair value through profit or loss comprise financial assets that are held for trading (i.e. financial assets acquired principally for the purpose of resale in the near term), derivatives (both, freestanding and embedded) and financial assets that were specifically designated into this classification upon initial recognition.
Subsequent to initial recognition, financial assets classified as fair value through profit or loss are measured at fair value. Any gains or losses arising from changes in the fair value of financial assets classified as fair value through profit or loss are recognised in profit or loss. Net gains or losses on financial assets classified as fair value through profit or loss exclude foreign exchange gains and losses, interest and dividend income. Such income is recognised separately in profit or loss as components of other income or other operating losses.
However, derivatives that are linked to and must be settled by delivery of unquoted equity instruments that do not have a quoted market price in an active market are recognised at cost.
(ii) Held-to-maturity investments
Financial assets classified as held-to-maturity comprise non-derivative financial assets with fixed or determinable payments and fixed maturity that the Group has the positive intention and ability to hold to maturity.
Subsequent to initial recognition, financial assets classified as held-to-maturity are measured at amortised cost using the effective interest method. Gains or losses on financial assets classified as held-to-maturity are recognised in profit or loss when the financial assets are derecognised or impaired, and through the amortisation process.
Notes To The Financial Statements31 December 2011 (Cont’d)

111|
4. SIGNIFICANT ACCOUNTING POLICIES (cont’d)
4.13 Financial instruments (cont’d)
(a) Financial assets (cont’d)
(iii) Loans and receivables
Financial assets classified as loans and receivables comprise non-derivative financial assets with fixed or determinable payments that are not quoted in an active market.
Subsequent to initial recognition, financial assets classified as loans and receivables are measured at amortised cost using the effective interest method. Gains or losses on financial assets classified as loans and receivables are recognised in profit or loss when the financial assets are derecognised or impaired, and through the amortisation process.
(iv) Available-for-sale financial assets
Financial assets classified as available-for-sale comprise non-derivative financial assets that are designated as available-for-sale or are not classified as loans and receivables, held-to-maturity investments or financial assets at fair value through profit or loss.
Subsequent to initial recognition, financial assets classified as available-for-sale are measured at fair value. Any gains or losses arising from changes in the fair value of financial assets classified as available-for-sale are recognised directly in other comprehensive income, except for impairment losses and foreign exchange gains and losses, until the financial asset is derecognised, at which time the cumulative gains or losses previously recognised in other comprehensive income are recognised in profit or loss. However, interest calculated using the effective interest method is recognised in profit or loss whilst dividends on available-for-sale equity instruments are recognised in profit or loss when the Group’s right to receive payment is established.
Cash and cash equivalents include cash and bank balances, bank overdrafts, deposits and other short term, highly liquid investments with original maturities of three (3) months or less, which are readily convertible to cash and are subject to insignificant risk of changes in value.
A financial asset is derecognised when the contractual right to receive cash flows from the financial asset has expired. On derecognition of a financial asset in its entirety, the difference between the carrying amount and the sum of consideration received (including any new asset obtained less any new liability assumed) and any cumulative gain or loss that had been recognised directly in other comprehensive income shall be recognised in profit or loss.
A regular way purchase or sale is a purchase or sale of a financial asset under a contract whose terms require delivery of the asset within the time frame established generally by regulation or marketplace convention. A regular way purchase or sale of financial assets shall be recognised and derecognised, as applicable, using trade date accounting.
Notes To The Financial Statements 31 December 2011 (Cont’d)

112 |
4. SIGNIFICANT ACCOUNTING POLICIES (cont’d)
4.13 Financial instruments (cont’d)
(b) Financial liabilities
Financial instruments are classified as liabilities or equity in accordance with the substance of the contractual arrangement. A financial liability is classified into the following two categories after initial recognition for the purpose of subsequent measurement:
(i) Financial liabilities at fair value through profit or loss
Financial liabilities at fair value through profit or loss comprise financial liabilities that are held for trading, derivatives (both, freestanding and embedded) and financial liabilities that were specifically designated into this classification upon initial recognition.
Subsequent to initial recognition, financial liabilities classified as fair value through profit or loss are measured at fair value. Any gains or losses arising from changes in the fair value of financial liabilities classified as fair value through profit or loss are recognised in profit or loss. Net gains or losses on financial liabilities classified as fair value through profit or loss exclude foreign exchange gains and losses, interest and dividend income. Such income is recognised separately in profit or loss as components of other income or other operating losses.
(ii) Other financial liabilities
Financial liabilities classified as other financial liabilities comprise non-derivative financial liabilities that are neither held for trading nor initially designated as fair value through profit or loss.
Subsequent to initial recognition, other financial liabilities are measured at amortised cost using the effective interest method. Gains or losses on other financial liabilities are recognised in profit or loss when the financial liabilities are derecognised and through the amortisation process.
A financial liability is derecognised when, and only when, it is extinguished, i.e. when the obligation specified in the contract is discharged or cancelled or expires. An exchange between an existing borrower and lender of debt instruments with substantially different terms are accounted for as an extinguishment of the original financial liability and the recognition of a new financial liability. Similarly, a substantial modification of the terms of an existing financial liability is accounted for as an extinguishment of the original financial liability and the recognition of a new financial liability.
The difference between the carrying amount of a financial liability extinguished or transferred to another party and the consideration paid, including any non-cash assets transferred or liabilities assumed, is recognised in profit or loss.
A financial guarantee contract is a contract that requires the issuer to make specified payments to reimburse the holder for a loss it incurs because a specified debtor fails to make payment when due in accordance with the original or modified terms of a debt instrument.
Notes To The Financial Statements31 December 2011 (Cont’d)

113|
4. SIGNIFICANT ACCOUNTING POLICIES (cont’d)
4.13 Financial instruments (cont’d)
(b) Financial liabilities (cont’d)
The Group designates corporate guarantees given to banks for credit facilities granted to subsidiaries as insurance contracts as defined in FRS 4 Insurance Contracts. The Group recognises these insurance contracts as recognised insurance liabilities when there is a present obligation, legal or constructive, as a result of a past event, when it is probable that an outflow of resources embodying economic benefits will be required to settle the obligation and a reliable estimate can be made of the amount of the obligation.
At the end of every reporting period, the Group shall assess whether its recognised insurance liabilities are adequate, using current estimates of future cash flows under its insurance contracts. If this assessment shows that the carrying amount of the insurance liabilities is inadequate, the entire deficiency shall be recognised in profit or loss.
Recognised insurance liabilities are only removed from the statement of financial position when, and only when, it is extinguished via a discharge, cancellation or expiration.
(c) Equity
An equity instrument is any contract that evidences a residual interest in the assets of the Group and the Company after deducting all of its liabilities. Ordinary shares are classified as equity instruments.
Ordinary shares are recorded at the nominal value and proceeds in excess of the nominal value of shares issued, if any, are accounted for as share premium. Both ordinary share capital and share premium are classified as equity. Transaction costs of an equity transaction are accounted for as a deduction from equity, net of any related income tax benefit.
Interim dividends to shareholders are recognised in equity in the period in which they are declared. Final dividends are recognised upon the approval of shareholders in a general meeting.
The Group measures a liability to distribute non-cash assets as a dividend to the owners of the Company at the fair value of the assets to be distributed. The carrying amount of the dividend is remeasured at each reporting date and at the settlement date, with any changes recognised directly in equity as adjustments to the amount of the distribution. On settlement of the transaction, the Group recognises the difference, if any, between the carrying amount of the assets distributed and the carrying amount of the liability in profit or loss.
If the Company reacquires its own equity instruments, the consideration paid, including any attributable transaction costs, is deducted from equity as treasury shares until they are cancelled. No gain or loss is recognised in profit or loss on the purchase, sale, issue or cancellation of the Company’s own equity instruments. Where such shares are issued by resale, the difference between the sales consideration and the carrying amount is shown as a movement in equity.
Notes To The Financial Statements 31 December 2011 (Cont’d)

114 |
4. SIGNIFICANT ACCOUNTING POLICIES (cont’d)
4.14 Impairment of financial assets
The Group assesses whether there is any objective evidence that a financial asset is impaired at the end of each reporting period.
(a) Held-to-maturity investments and loans and receivables
The Group collectively considers factors such as the probability of bankruptcy or significant financial difficulties of the receivable or investee, and default or significant delay in payments to determine whether there is objective evidence that an impairment loss on held-to-maturity investments and loans and receivables has occurred. Other objective evidence of impairment include historical collection rates determined on an individual basis and observable changes in national or local economic conditions that are directly correlated with the historical default rates of receivables.
If any such objective evidence exists, the amount of impairment loss is measured as the difference between the financial asset’s carrying amount and the present value of estimated future cash flows discounted at the financial asset’s original effective interest rate. The impairment loss is recognised in profit or loss.
The carrying amount of held-to-maturity investments is directly reduced by the impairment loss whilst the carrying amount of loans and receivables are reduced through the use of an allowance account.
If in a subsequent period, the amount of the impairment loss decreases and it objectively relates to an event occurring after the impairment was recognised, the previously recognised impairment loss is reversed to the extent that the carrying amount of the asset does not exceed its amortised cost at the reversal date. The amount of impairment reversed is recognised in profit or loss.
(b) Available-for-sale financial assets
The Group collectively considers factors such as significant or prolonged decline in fair value below cost, significant financial difficulties of the issuer or obligor, and the disappearance of an active trading market as objective evidence that available-for-sale financial assets are impaired.
If any such objective evidence exists, an amount comprising the difference between the financial asset’s cost (net of any principal payment and amortisation) and current fair value, less any impairment loss previously recognised in profit or loss, is transferred from equity to profit or loss.
Impairment losses on available-for-sale equity investments are not reversed in profit or loss in subsequent periods. Instead, any increase in the fair value subsequent to the impairment loss is recognised in other comprehensive income.
Impairment losses on available-for-sale debt investments are subsequently reversed to profit or loss if the increase in the fair value of the investment can be objectively related to an event occurring after the recognition of the impairment loss in profit or loss.
Notes To The Financial Statements31 December 2011 (Cont’d)

115|
4. SIGNIFICANT ACCOUNTING POLICIES (cont’d)
4.15 Borrowing costs
Borrowing costs that are directly attributable to the acquisition, construction or production of a qualified asset is capitalised as part of the cost of the asset until when substantially all the activities necessary to prepare the asset for its intended use or sale are complete, after which such expense is charged to profit or loss. A qualifying asset is an asset that necessarily takes a substantial period of time to get ready for its intended use or sale. Capitalisation of borrowing cost is suspended during extended periods in which active development is interrupted.
The amount of borrowing costs eligible for capitalisation is the actual borrowing costs incurred on the borrowing during the period less any investment income on the temporary investment of the borrowing.
All other borrowing costs are recognised in profit or loss in the period in which they are incurred.
4.16 Contingent liabilities and contingent assets
A contingent liability is a possible obligation that arises from past events whose existence will be confirmed by the occurrence or non-occurrence of one or more uncertain future events beyond the control of the Group or a present obligation that is not recognised because it is not probable that an outflow of resources will be required to settle the obligation. A contingent liability also arises in extremely rare cases where there is a liability that cannot be recognised because it cannot be measured reliably. The Group does not recognise a contingent liability but discloses its existence in the financial statements.
A contingent asset is a possible asset that arises from past events whose existence will be confirmed by the occurrence or non-occurrence of one or more uncertain future events beyond the control of the Group. The Group does not recognise a contingent asset but discloses its existence where the inflows of economic benefits are probable, but not virtually certain.
In the acquisition of subsidiaries by the Group under business combinations, contingent liabilities assumed are measured initially at their fair value at the acquisition date, irrespective of the extent of any non-controlling interest.
4.17 Employee benefits
4.17.1 Short term employee benefits
Wages, salaries, social security contributions, paid annual leave, paid sick leave, bonuses and non-monetary benefits are recognised as an expense in the financial year when employees have rendered their services to the Group and the Company.
Short term accumulating compensated absences such as paid annual leave are recognised as an expense when employees render services that increase their entitlement to future compensated absences. Short term non-accumulating compensated absences such as sick leave are recognised when the absences occur.
Bonuses are recognised as an expense when there is a present, legal or constructive obligation to make such payments, as a result of past events and when a reliable estimate can be made of the amount of the obligation.
Notes To The Financial Statements 31 December 2011 (Cont’d)

116 |
4. SIGNIFICANT ACCOUNTING POLICIES (cont’d)
4.17 Employee benefits (cont’d)
4.17.2 Defined contribution plans
The Company and its subsidiaries incorporated in Malaysia make contributions to a statutory provident fund and foreign subsidiaries make contributions to their respective countries’ statutory pension schemes. The contributions are recognised as a liability after deducting any contributions already paid and as an expense in the period in which the employees render their services.
4.17.3 Share-based payments
A subsidiary within the Group, Cityneon Holdings Limited (“Cityneon”), a company incorporated in Singapore and listed on the Main Board of Singapore Exchange Securities Trading Limited, has an Employee Share Option Scheme (“ESOS”). The ESOS is administered by its Remuneration and Share Option Committee and offered to the employees of Cityneon and its subsidiaries.
The equity-settled share-based compensation plan allows the employees of Cityneon and its subsidiaries to acquire ordinary shares of Cityneon at predetermined prices. The total fair value of share options granted to employees is recognised as an expense with a corresponding increase in the share options reserve within equity over the vesting period and taking into account the probability that the options will vest.
The fair value of share options is measured at grant date, taking into account, if any, the market vesting conditions upon which the options were granted but excluding the impact of any non-market vesting conditions. Non-market vesting conditions are included in assumptions about the number of options that are expected to become exercisable on the vesting date.
At the end of each reporting period, Cityneon revises its estimates of the number of options that are expected to become exercisable on vesting date. It recognises the impact of the revision of original estimates, if any, in profit or loss, and a corresponding adjustment to equity over the remaining vesting period.
The equity amount is recognised in the Group’s share options reserve until the options are exercised, whereupon the proceeds received (net of any directly attributable transaction costs) and the related balance previously recognised in the capital – share options reserve are credited to the equity of Cityneon. At Group level, share options of Cityneon which are exercised but do not result in a loss of control by the Group, are accounted for as equity transactions.
The share options reserve is credited to retained earnings of the Group upon expiry of the share options.
4.17.4 Retirement benefits
Retirement benefits relate to benefits given to senior management, which represent cost accrued based on the number of years of service and last drawn salaries.
Notes To The Financial Statements31 December 2011 (Cont’d)

117|
4. SIGNIFICANT ACCOUNTING POLICIES (cont’d)
4.18 Income taxes
Income taxes include all domestic and foreign taxes on taxable profit. Taxes in the statements of comprehensive income comprise current tax and deferred tax.
4.18.1 Current tax
Current tax is the amount of income taxes payable or receivable in respect of the taxable profit or loss for a period.
Current tax for the current and prior periods is measured at the amount expected to be recovered from or paid to the taxation authorities. The tax rates and tax laws used to compute the amount are those that have been enacted or substantively enacted at the end of the reporting period.
4.18.2 Deferred tax
Deferred tax is recognised in full using the liability method on temporary differences arising between the carrying amount of an asset or liability in the statements of financial position and its tax base.
Deferred tax is recognised for all temporary differences, unless the deferred tax arises from goodwill or the initial recognition of an asset or liability in a transaction which is not a business combination and at the time of transaction, affects neither accounting profit nor taxable profit.
A deferred tax asset is recognised only to the extent that it is probable that taxable profits will be available against which the deductible temporary differences, unused tax losses and unused tax credits can be utilised. The carrying amount of a deferred tax asset is reviewed at the end of each reporting period. If it is no longer probable that sufficient taxable profits will be available to allow the benefit of part or all of that deferred tax asset to be utilised, the carrying amount of the deferred tax asset will be reduced accordingly. When it becomes probable that sufficient taxable profits will be available, such reductions will be reversed to the extent of the taxable profits.
Deferred tax assets and liabilities are offset when there is a legally enforceable right to set off current tax assets against current tax liabilities and when the deferred income taxes relate to the same taxation authority on either:
(i) the same taxable entity; or
(ii) different taxable entities which intend either to settle current tax liabilities and assets on a net basis, or to realise the assets and settle the liabilities simultaneously, in each future period in which significant amounts of deferred tax liabilities or assets are expected to be settled or recovered.
Deferred tax will be recognised as income or expense and included in profit or loss for the period unless the tax relates to items that are credited or charged, in the same or a different period, directly to equity, in which case the deferred tax will be charged or credited directly to equity.
Deferred tax assets and liabilities are measured at the tax rates that are expected to apply in the year when the asset is realised or the liability is settled, based on tax rates and tax laws that have been enacted or substantively enacted by the end of the reporting period.
Notes To The Financial Statements 31 December 2011 (Cont’d)

118 |
4. SIGNIFICANT ACCOUNTING POLICIES (cont’d)
4.19 Foreign currencies
4.19.1 Functional and presentation currency
Items included in the financial statements of each of the Group’s entities are measured using the currency of the primary economic environment in which the entity operates (“the functional currency”). The consolidated financial statements are presented in Ringgit Malaysia, which is the Company’s functional and presentation currency.
4.19.2 Foreign currency translations and balances
Transactions in foreign currencies are converted into the functional currency of each company in the Group at rates of exchange ruling at the transaction dates. Monetary assets and liabilities in foreign currencies at the end of the reporting period are translated into the functional currency of each company in the Group at rates of exchange ruling at that date unless hedged by forward foreign exchange contracts, in which case the rates specified in such forward contracts are used. All exchange differences arising from the settlement of foreign currency transactions and from the translation of foreign currency monetary assets and liabilities are included in profit or loss in the period in which they arise. Non-monetary items initially denominated in foreign currencies, which are carried at historical cost are translated using the historical rate as of the date of acquisition and non-monetary items which are carried at fair value are translated using the exchange rate that existed when the values were determined for presentation currency purposes.
4.19.3 Foreign operations
Financial statements of foreign operations are translated at financial year end exchange rates with respect to their assets and liabilities, and at exchange rates at the dates of the transactions with respect to the statements of comprehensive income. All resulting translation differences are recognised as a separate component of equity.
In the consolidated financial statements, exchange differences arising from the translation of a net investment in foreign operations are taken to equity. When a foreign operation is partially disposed of or sold, exchange differences that were recorded in equity are recognised in profit or loss as part of the gain or loss on disposal.
Exchange differences arising on a monetary item that forms part of the net investment of the Company in a foreign operation shall be recognised in profit or loss in the separate financial statements of the Company or the foreign operation, as appropriate. In the consolidated financial statements, such exchange differences shall be recognised initially as a separate component of equity and recognised in profit or loss upon disposal of the net investment.
Goodwill and fair value adjustments to the assets and liabilities arising from the acquisition of a foreign operation are treated as assets and liabilities of the acquired entity and translated at the exchange rate ruling at the end of the reporting period.
Notes To The Financial Statements31 December 2011 (Cont’d)

119|
4. SIGNIFICANT ACCOUNTING POLICIES (cont’d)
4.20 Revenue recognition
Revenue is measured at the fair value of the consideration received or receivable net of discounts and rebates.
Revenue is recognised to the extent that it is probable that the economic benefits associated with the transaction will flow to the Group, and the amount of revenue and the cost incurred or to be incurred in respect of the transaction can be reliably measured and specific recognition criteria have been met for each of the Group’s activities as follows:
(a) Sale of goods
Revenue from sale of goods represents the invoiced value arising from the publication, printing and distribution of newspapers, magazines and online advertisements (net of returns and service tax).
Revenue from sale of goods is recognised when the significant risks and rewards of ownership of the goods have been transferred to the customers and where the Group retains no continuing managerial involvement over the goods, which coincides with the delivery of goods and services and acceptance by customers.
(b) Services
Revenue from services represents the invoiced value arising from the broadcasting of commercials on radio (net of service tax), subscription fees and distribution of television channel and films and broadcasting of commercials on television channel (net of service tax) and provision of services on training and consultancy (net of service tax).
(c) Projects
Revenue and expenses from contract works of event management, exhibition services and thematic are recognised based on the percentage of completion method. Percentage of completion is measured by the percentage of contract costs incurred to date against the total estimated costs for each contract. Changes in job performance, job conditions and estimated profitability, including those arising from final contract settlements may result in revisions to costs and revenues and are recognised in the period in which the revisions are determined.
When it is probable that total contract costs will exceed total contract revenue, the expected loss is recognised as an expense immediately.
When the outcome of a contract cannot be estimated reliably, revenue is recognised only to the extent of contract costs incurred that it is probable will be recoverable and contract costs are recognised as an expense in the period in which they are incurred.
(d) Interest income
Interest income is recognised as it accrues, using the effective interest method.
Notes To The Financial Statements 31 December 2011 (Cont’d)

120 |
4. SIGNIFICANT ACCOUNTING POLICIES (cont’d)
4.20 Revenue recognition (cont’d)
(e) Dividend income
Dividend income is recognised when the shareholder’s right to receive payment is established.
(f) Rental income
Rental income is accounted for on a straight line basis over the lease term of an ongoing lease. The aggregate cost of incentives provided to the lessee is recognised as a reduction of rental income over the lease term on a straight line basis.
4.21 Non-current assets held for sale
Non-current assets are classified as held for sale if their carrying amounts will be recovered principally through a sale transaction rather than through continuing use. For this to be the case, the assets must be available for immediate sale in their present condition subject only to terms that are usual and customary for sales of such assets and their sale must be highly probable.
The sale is expected to qualify for recognition as a completed sale within one (1) year from the date of classification. However, an extension of the period required to complete the sale does not preclude the assets from being classified as held for sale if the delay is caused by events or circumstances beyond the control of the Group and there is sufficient evidence that the Group remains committed to its plan to sell the assets.
Immediately before the initial classification as held for sale, the carrying amounts of the non-current assets are measured in accordance with applicable FRSs. On initial classification as held for sale, non-current assets are measured at the lower of carrying amount before the initial classification as held for sale and fair value less costs to sell. The differences, if any, are recognised in profit or loss as impairment loss.
Non-current assets held for sale are classified as current assets in the statements of financial position and are stated at the lower of their carrying amounts immediately before initial classification and fair value less costs to sell and are not depreciated. Any cumulative income or expense recognised directly in equity relating to the non-current assets classified as held for sale is presented separately.
If the Group has classified an asset as held for sale but subsequently the criteria for classification is no longer met, the Group ceases to classify the asset as held for sale. The Group measures a non-current asset that ceases to be classified as held for sale at the lower of:
(i) its carrying amount before the asset was classified as held for sale, adjusted for any depreciation, amortisation or revaluations that would have been recognised had the asset not been classified as held for sale; and
(ii) its recoverable amount at the date of the subsequent decision not to sell.
Notes To The Financial Statements31 December 2011 (Cont’d)

121|
4. SIGNIFICANT ACCOUNTING POLICIES (cont’d)
4.22 Operating segments
Operating segments are defined as components of the Group that:
(a) engages in business activities from which it may earn revenues and incur expenses (including revenues and expenses relating to transactions with other components of the Group);
(b) whose operating results are regularly reviewed by the Group’s chief operating decision maker (i.e. the Group’s Managing Director and Chief Executive Officer) in making decisions about resources to be allocated to the segment and assessing its performance; and
(c) for which discrete financial information is available.
An operating segment may engage in business activities for which it has yet to earn revenues.
The Group reports separately information about each operating segment that meets any of the following quantitative thresholds:
(a) Its reported revenue, including both sales to external customers and intersegment sales or transfers, is ten (10) per cent or more of the combined revenue, internal and external, of all operating segments.
(b) The absolute amount of its reported profit or loss is ten (10) per cent or more of the greater, in absolute amount of:
(i) the combined reported profit of all operating segments that did not report a loss; and
(ii) the combined reported loss of all operating segments that reported a loss.
(c) Its assets are ten (10) per cent or more of the combined assets of all operating segments.
Operating segments that do not meet any of the quantitative thresholds may be considered reportable, and separately disclosed, if the management believes that information about the segment would be useful to users of the financial statements.
Total external revenue reported by operating segments shall constitute at least seventy five (75) per cent of the Group’s revenue. Operating segments identified as reportable segments in the current financial year in accordance with the quantitative thresholds would result in a restatement of prior period segment data for comparative purposes.
4.23 Earnings per share
Basic
Basic earnings per ordinary share for the financial year is calculated by dividing the profit for the financial year attributable to equity holders of the parent by the weighted average number of ordinary shares outstanding during the financial year.
Notes To The Financial Statements 31 December 2011 (Cont’d)

122 |
5. ADOPTION OF NEW FRSs AND AMENDMENT TO FRSs
5.1 New/Revised FRSs, Amendments to FRSs and IC Interpretations adopted during the current financial year
The followings are new/revised FRSs, Amendments to FRSs and IC Interpretations adopted during the current financial year: Effective for financial periods beginning onNew/Revised FRSs, Amendments to FRSs and IC Interpretations or after
Amendments to FRS 132 Financial Instruments: Presentation: 1 March 2010 Classification of Rights IssueIC Interpretation 12 Service Concession Arrangements 1 July 2010FRS 1 First-time Adoption of Financial 1 July 2010 Reporting Standards (revised) FRS 3 Business Combinations (revised) 1 July 2010FRS 127 Consolidated and Separate 1 July 2010 Financial Statements (revised) Amendments to FRS 2 Share-based Payments 1 July 2010Amendments to FRS 5 Non-current Assets Held for Sale 1 July 2010 and Discontinued Operations Amendments to FRS 138 Intangible Assets 1 July 2010Amendments to IC Interpretation 9 Reassessment of Embedded Derivatives 1 July 2010IC Interpretation 16 Hedges of a Net Investment in a Foreign Operation 1 July 2010IC Interpretation 17 Distributions of Non-cash Assets to Owners 1 July 2010Amendments to FRS 1 First-time Adoption of Financial Reporting Standards: 1 January 2011 Limited Exemption from Comparative FRS 7 Disclosures for First-time Adopters Amendments to FRS 7 Improving Disclosures about Financial Instruments 1 January 2011Amendments to FRS 2 Group Cash-settled Share-based Payment Transactions 1 January 2011IC Interpretation 4 Determining whether an Arrangement contains a Lease 1 January 2011IC Interpretation 18 Transfers of Assets from Customers 1 January 2011Amendments to FRS 1 Additional Exemptions for First-time Adopters 1 January 2011Amendments to FRS 3 Business Combinations 1 January 2011Amendments to FRS 7 Financial Instruments: Disclosures 1 January 2011Amendments to FRS 101 Presentation of Financial Statements 1 January 2011Amendments to FRS 121 The Effects of Changes in Foreign Exchange Rates 1 January 2011Amendments to FRS 128 Investments in Associates 1 January 2011Amendments to FRS 131 Interests in Joint Ventures 1 January 2011Amendments to FRS 132 Financial Instruments: Presentation 1 January 2011Amendments to FRS 134 Interim Financial Reporting 1 January 2011Amendments to FRS 139 Financial Instruments: Recognition and Measurement 1 January 2011Amendments to IC Interpretation 13 Customer Loyalty Programmes 1 January 2011
Notes To The Financial Statements31 December 2011 (Cont’d)

123|
5. ADOPTION OF NEW FRSs AND AMENDMENT TO FRSs (cont’d)
5.1 New/Revised FRSs, Amendments to FRSs and IC Interpretations adopted during the current financial year (cont’d)
Adoption of the standards and interpretations are deemed to have no material impact to the financial statements of the Group and the Company for the financial year except for the following:
Revised FRS 3 Business Combinations
This Standard supersedes the existing FRS 3 and now includes business combinations involving mutual entities and those achieved by way of contract alone. Any non-controlling interest in an acquiree shall be measured at fair value or at the non-controlling interest’s proportionate share of the acquiree’s net identifiable assets.
The time limit on the adjustment to goodwill due to the arrival of new information on the crystallisation of deferred tax benefits shall be restricted to the measurement period resulting from the arrival of the new information. Contingent liabilities acquired arising from present obligations shall be recognised, regardless of the probability of outflow of economic resources.
Acquisition-related costs shall be accounted for as expenses in the periods in which the costs are incurred and the services are received. Consideration transferred in a business combination, including contingent consideration, shall be measured and recognised at fair value at acquisition date. Any changes in the amount of consideration to be paid will no longer be adjusted against goodwill but recognised in profit or loss.
In business combinations achieved in stages, the acquirer shall remeasure its previously held equity interest at fair value and recognise the resulting gain or loss in profit or loss.
The revised FRS 3 has been applied prospectively in accordance with its transitional provisions. Assets and liabilities that arose from business combinations whose acquisition dates were before 1 July 2010 are not adjusted.
During the financial year, the newly acquired subsidiaries were accounted for in accordance with this new Standard as disclosed in Note 32 to the financial statements.
5.2 New Malaysian Financial Reporting Standards (“MFRSs”) that have been issued, but not yet effective and not yet adopted, for annual periods beginning on or after 1 January 2012
On 19 November 2011, the Malaysian Accounting Standards Board (“MASB”) announced the issuance of the new MFRS framework that is applicable to entities other than private entities.
The Group is expected to apply the MFRS framework for the financial year ending 31 December 2012.
This would result in the Group preparing an opening MFRS statement of financial position as at 1 January 2011, which adjusts for differences between the classification and measurement bases in the existing FRS framework versus that in the new MFRS framework. This would also result in a restatement of the annual and quarterly financial performance for the financial year ended 31 December 2011 and quarter ended 31 March 2011 in accordance with MFRS which would form the MFRS comparatives for the financial year ending 31 December 2012 and quarter ending 31 March 2012 respectively.
Notes To The Financial Statements 31 December 2011 (Cont’d)

124 |
5. ADOPTION OF NEW FRSs AND AMENDMENT TO FRSs (cont’d)
5.2 New Malaysian Financial Reporting Standards (“MFRSs”) that have been issued, but not yet effective and not yet adopted, for annual periods beginning on or after 1 January 2012 (cont’d)
The MFRSs, Amendments to MFRSs and IC Interpretations expected to be adopted are as follows:
Effective for financial periods beginning onMFRSs, Amendments to MFRSs and IC Interpretations or after
MFRS 1 First-time Adoption of Financial Reporting Standards 1 January 2012MFRS 2 Share-based Payment 1 January 2012MFRS 3 Business Combinations 1 January 2012MFRS 4 Insurance Contracts 1 January 2012MFRS 5 Non-current Assets Held for Sale and Discontinued Operations 1 January 2012MFRS 6 Exploration for and Evaluation of Mineral Resources 1 January 2012MFRS 7 Financial Instruments: Disclosures 1 January 2012MFRS 8 Operating Segments 1 January 2012MFRS 9 Financial Instruments 1 January 2015MFRS 10 Consolidated Financial Statements 1 January 2013MFRS 11 Joint Arrangements 1 January 2013MFRS 12 Disclosure of Interests in Other Entities 1 January 2013MFRS 13 Fair Value Measurement 1 January 2013MFRS 101 Presentation of Financial Statements 1 January 2012Amendments Presentation of Items of Other Comprehensive Income 1 July 2012 to MFRS 101 MFRS 102 Inventories 1 January 2012MFRS 107 Statement of Cash Flows 1 January 2012MFRS 108 Accounting Policies, Changes in Accounting Estimates and Errors 1 January 2012MFRS 110 Events After the Reporting Period 1 January 2012MFRS 111 Construction Contracts 1 January 2012MFRS 112 Income Taxes 1 January 2012MFRS 116 Property, Plant and Equipment 1 January 2012MFRS 117 Leases 1 January 2012MFRS 118 Revenue 1 January 2012MFRS 119 Employee Benefits 1 January 2012MFRS 119 Employee Benefits (revised) 1 January 2013MFRS 120 Accounting for Government Grants and Disclosure 1 January 2012 of Government Assistance MFRS 121 The Effects of Changes in Foreign Exchange Rates 1 January 2012MFRS 123 Borrowing Costs 1 January 2012
Notes To The Financial Statements31 December 2011 (Cont’d)

125|
5. ADOPTION OF NEW FRSs AND AMENDMENT TO FRSs (cont’d)
5.2 New Malaysian Financial Reporting Standards (“MFRSs”) that have been issued, but not yet effective and not yet adopted, for annual periods beginning on or after 1 January 2012 (cont’d)
The MFRSs, Amendments to MFRSs and IC Interpretations expected to be adopted are as follows: (cont’d)
Effective for financial periods beginning onMFRSs, Amendments to MFRSs and IC Interpretations or after
MFRS 124 Related Party Disclosures 1 January 2012MFRS 126 Accounting and Reporting by Retirement Benefit Plans 1 January 2012 MFRS 127 Consolidated and Separate Financial Statements 1 January 2012MFRS 127 Separate Financial Statements 1 January 2013 MFRS 128 Investments in Associates 1 January 2012MFRS 128 Investments in Associates and Joint Ventures 1 January 2013MFRS 129 Financial Reporting in Hyperinflationary Economies 1 January 2012MFRS 131 Interests in Joint Ventures 1 January 2012MFRS 132 Financial Instruments: Presentation 1 January 2012MFRS 133 Earnings Per Share 1 January 2012MFRS 134 Interim Financial Reporting 1 January 2012MFRS 136 Impairment of Assets 1 January 2012MFRS 137 Provisions, Contingent Liabilities and Contingent Assets 1 January 2012MFRS 138 Intangible Assets 1 January 2012MFRS 139 Financial Instruments: Recognition and Measurement 1 January 2012MFRS 140 Investment Property 1 January 2012MFRS 141 Agriculture 1 January 2012Improvements to MFRSs 1 January 2012 Amendments Disclosures – Offsetting Financial Assets and Financial Liabilities 1 January 2013 to MFRS 7 Amendments Offsetting Financial Assets and Financial Liabilities 1 January 2014 to MFRS 132 Mandatory Effective Date of MFRS 9 and Transition Disclosures 1 March 2012IC Interpretation 1 Changes in Existing Decommissioning, Restoration and Similar Liabilities 1 January 2012IC Interpretation 2 Members’ Shares in Co-operative Entities and Similar Instruments 1 January 2012IC Interpretation 4 Determining Whether an Arrangement Contains a Lease 1 January 2012IC Interpretation 5 Rights to Interests Arising from Decommissioning, Restoration and 1 January 2012 Environmental Rehabilitation Funds IC Interpretation 6 Liabilities Arising from Participating in a Specific Market-Waste 1 January 2012 Electrical and Electronic Equipment IC Interpretation 7 Applying the Restatement Approach under MFRS 129 1 January 2012 Financial Reporting in Hyperinflationary Economies
Notes To The Financial Statements 31 December 2011 (Cont’d)

126 |
5. ADOPTION OF NEW FRSs AND AMENDMENT TO FRSs (cont’d)
5.2 New Malaysian Financial Reporting Standards (“MFRSs”) that have been issued, but not yet effective and not yet adopted, for annual periods beginning on or after 1 January 2012 (cont’d)
The MFRSs, Amendments to MFRSs and IC Interpretations expected to be adopted are as follows: (cont’d)
Effective for financial periods beginning onMFRSs, Amendments to MFRSs and IC Interpretations or after
IC Interpretation 9 Reassessment of Embedded Derivatives 1 January 2012IC Interpretation 10 Interim Financial Reporting and Impairment 1 January 2012IC Interpretation 12 Service Concession Arrangements 1 January 2012IC Interpretation 13 Customer Loyalty Programmes 1 January 2012IC Interpretation 14 MFRS 119 - The Limit on a Defined Benefit Asset, 1 January 2012 Minimum Funding Requirements and their Interaction IC Interpretation 15 Agreements for the Construction of Real Estate 1 January 2012IC Interpretation 16 Hedges of a Net Investment in a Foreign Operation 1 January 2012IC Interpretation 17 Distributions of Non-cash Assets to Owners 1 January 2012IC Interpretation 18 Transfers of Assets from Customers 1 January 2012IC Interpretation 19 Extinguishing Financial Liabilities with Equity Instruments 1 January 2012IC Interpretation 20 Stripping Costs in the Production Phase of a Surface Mine 1 January 2013IC Interpretation 107 Introduction of the Euro 1 January 2012IC Interpretation 110 Government Assistance - No Specific Relation to Operating Activities 1 January 2012IC Interpretation 112 Consolidation - Special Purpose Entities 1 January 2012IC Interpretation 113 Jointly Controlled Entities - Non-Monetary Contributions by Venturers 1 January 2012IC Interpretation 115 Operating Leases - Incentives 1 January 2012IC Interpretation 125 Income Taxes - Changes in the Tax Status 1 January 2012 of an Entity or its Shareholders IC Interpretation 129 Evaluating the Substance of Transactions Involving 1 January 2012 the Legal Form of a Lease IC Interpretation 131 Revenue - Barter Transactions Involving Advertising Services 1 January 2012IC Interpretation 132 Intangible Assets - Web Site Costs 1 January 2012
Currently, the Group does not expect any material impact on its financial position and performance arising from the adoption of the above MFRSs, Amendments to MFRSs and IC Interpretations. However, the financial impact may change or additional impacts may be identified, prior to the completion of the Group’s first MFRS based financial statements.
Notes To The Financial Statements31 December 2011 (Cont’d)

127|
5. ADOPTION OF NEW FRSs AND AMENDMENT TO FRSs (cont’d)
5.3 New MFRSs that have been issued, but only effective for annual periods beginning on or after 1 July 2012 and 1 January 2013
The MFRSs, Amendments to MFRSs and IC Interpretations expected to be adopted are as follows:
Effective for financial periods beginning onMFRSs, Amendments to MFRSs and IC Interpretations or after
Amendments Presentation of Items of Other Comprehensive Income 1 July 2012 to FRS 101 MFRS 10 Consolidated Financial Statements 1 January 2013MFRS 11 Joint Arrangements 1 January 2013MFRS 12 Disclosure of Interests in Other Entities 1 January 2013MFRS 13 Fair Value Measurements 1 January 2013MFRS 127 Separate Financial Statements (revised) 1 January 2013MFRS 128 Investments in Associates and Joint Ventures (revised) 1 January 2013MFRS 119 Employee Benefits (revised) 1 January 2013IC Interpretation 20 Stripping Costs in the Production Phase of a Surface Mine 1 January 2013Amendments Disclosures - Offsetting Financial Assets and Financial Liabilities 1 January 2013 to MFRS 7 Amendments Offsetting Financial Assets and Financial Liabilities 1 January 2014 to MFRS 132 MFRS 9 Financial Instruments 1 January 2015Mandatory Effective Date of MFRS 9 and Transition Disclosures 1 January 2015
The Group is in the process of assessing the impact of implementing these MFRSs, Amendments to MFRSs and IC Interpretations.
6. SIGNIFICANT ACCOUNTING ESTIMATES AND JUDGEMENTS
6.1 Critical judgements made in applying accounting policies
The following are judgements made by management in the process of applying the Group’s accounting policies that have the most significant effect on the amounts recognised in the financial statements.
(a) Classification between investment properties and property, plant and equipment
The Group has developed certain criteria based on FRS 140 Investment Property in making judgement whether a property qualifies as an investment property. Investment property is a property held to earn rentals or for capital appreciation or both.
Notes To The Financial Statements 31 December 2011 (Cont’d)

128 |
6. SIGNIFICANT ACCOUNTING ESTIMATES AND JUDGEMENTS (cont’d)
6.1 Critical judgements made in applying accounting policies (cont’d)
The following are judgements made by management in the process of applying the Group’s accounting policies that have the most significant effect on the amounts recognised in the financial statements. (cont’d)
(a) Classification between investment properties and property, plant and equipment (cont’d)
Some properties comprise a portion that is held to earn rentals or for capital appreciation and another portion that is held for use in the production or supply of goods or services or for administrative purposes. If these portions could be sold separately (or leased out separately under a finance lease), the Group would account for the portions separately. If the portions could not be sold separately, the property is an investment property only if an insignificant portion is held for use in the production or supply of goods or services or for administrative purposes. Judgement is made on an individual property basis to determine whether ancillary services are so significant that a property does not qualify as investment property.
(b) Operating lease commitments - the Group as lessor
The Group has entered into commercial property leases on its investment property portfolio. The Group has determined that it retains all the significant risks and rewards of ownership of these properties which are leased out as operating leases.
(c) Non-current assets held for sale
Certain non-current assets have been classified as non-current assets held for sale as the management has committed to a plan to sell the assets as at the end of the reporting period. Barring any unforeseen circumstances, the Group expects the sale of the assets to be completed within the next twelve (12) months.
(d) Contingent liabilities
The determination and treatment of contingent liabilities is based on the Directors’ and management’s view of the expected outcome of the contingencies, after consulting legal counsel for litigation cases and internal and external experts to the Group for matters in the ordinary course of the business.
6.2 Key sources of estimation uncertainty
The following are key assumptions concerning the future and other key sources of estimation uncertainty at the end of the reporting period that have a significant risk of causing a material adjustment to the carrying amounts of assets and liabilities within the next financial year.
(a) Impairment of goodwill on consolidation
The Group determines whether goodwill on consolidation is impaired at least on an annual basis. This requires an estimation of the value-in-use of the subsidiaries to which goodwill is allocated. Estimating a value-in-use amount requires management to make an estimate of the expected future cash flows from the subsidiaries and also to choose a suitable discount rate in order to calculate the present value of those cash flows.
Notes To The Financial Statements31 December 2011 (Cont’d)
129|
6. SIGNIFICANT ACCOUNTING ESTIMATES AND JUDGEMENTS (cont’d)
6.2 Key sources of estimation uncertainty (cont’d)
The following are key assumptions concerning the future and other key sources of estimation uncertainty at the end of the reporting period that have a significant risk of causing a material adjustment to the carrying amounts of assets and liabilities within the next financial year. (cont’d)
(a) Impairment of goodwill on consolidation (cont’d)
The calculation of the value-in-use amount is most sensitive to the following assumptions:
(i) Budgeted gross margins. Gross margins are based on historical averages achieved in the preceding five (5) financial years, adjusted to reflect anticipated efficiency and productivity improvements.
(ii) Growth rates. The forecasted growth rates are based on published industry data and do not exceed the sustainable long-term average growth rate for the relevant industries.
(iii) Pre-tax discount rates. The discount rates reflect current market assessment of specific risks of the subsidiaries. These discount rates have consistently been used by management as the benchmark rates in project appraisals of the subsidiaries.
Further details are disclosed in Note 9(a) to the financial statements.
(b) Useful lives of property, plant and equipment
The Group estimates the useful lives of property, plant and equipment at the time the assets are acquired based on historical experience, the expected usage, wear and tear of the assets, and technical obsolescence arising from changes in the market demands or service output of the assets. The estimated useful lives of property, plant and equipment are reviewed periodically and are updated if expectations differ from previous estimates due to changes in factors mentioned above. Changes in these factors could impact the useful lives and the residual values of the assets; therefore future depreciation charges could be revised.
(c) Income taxes
The Group is subject to income taxes in a few jurisdictions. Significant judgement is required in determining the capital allowances and deductibility of certain expenses during the estimation of the provision for income taxes. Where the final tax outcome of these matters is different from the amounts that were initially recorded, such differences will impact the income tax and deferred income tax provisions in the period in which such determination is made.
(d) Deferred tax assets
Deferred tax assets are recognised for all unused tax losses and unabsorbed capital allowances to the extent that it is probable that taxable profits will be available against which the losses and capital allowances can be utilised. Significant management judgement is required to determine the amount of deferred tax assets that can be recognised, based upon the likely timing and level of future taxable profits together with future tax planning strategies.
(e) Allowance for credit losses
The Group makes allowance for credit losses based on an assessment of the recoverability of receivables. Allowances are applied to receivables where events or changes in circumstances indicate that the carrying amounts may not be recoverable. The management specifically analyses historical bad debts, customer concentration, customer creditworthiness, current economic trends and changes in customer payment terms when making a judgement to evaluate the adequacy of allowances for credit losses. Where expectations differ from the original estimates, the differences will impact the carrying amount of receivables.
Notes To The Financial Statements 31 December 2011 (Cont’d)

130 |
6. SIGNIFICANT ACCOUNTING ESTIMATES AND JUDGEMENTS (cont’d)
6.2 Key sources of estimation uncertainty (cont’d)
The following are key assumptions concerning the future and other key sources of estimation uncertainty at the end of the reporting period that have a significant risk of causing a material adjustment to the carrying amounts of assets and liabilities within the next financial year. (cont’d)
(f) Construction contracts
The Group recognises contract revenue by reference to the stage of completion of the contract activity at the end of the financial year and when the outcome of a construction contract can be estimated reliably. The stage of completion is measured by reference to the proportion that contract costs incurred for work performed to date against the estimated total contract costs. Significant assumptions are required to estimate the total contract cost and the recoverable variation works that will affect the stage of completion. The estimates are made based on past experience and knowledge of the work specialists. The carrying amounts of assets and liabilities arising from construction at the end of the financial year are disclosed in Notes 16 and 24 to the financial statements.
(g) Revenue and expenses recognition of projects/contracts arising from exhibition services and event management
The Group recognises exhibition services and event management revenue and expenses in profit or loss using the percentage of completion method. The stage of completion is determined by the proportion of contract costs incurred for work performed to date against total estimated costs.
Significant judgements are required in determining the stage of completion, the extent of the contract costs incurred, the estimated total exhibition services and event management revenue and costs, as well as the recoverability of these exhibition and event management projects. In making the judgement, the Group evaluates based on past experience.
(h) Fair values of borrowings
The fair values of borrowings are estimated by discounting future contractual cash flows at the current market interest rates available to the Group for similar financial instruments. It is assumed that the effective interest rates approximate the current market interest rates available to the Group based on similar size and business risk.
(i) Impairment of assets
The Group determines whether an asset is impaired by evaluating the extent to which the recoverable amount of an asset is less than its carrying amount. This evaluation is subject to factors such as market performance, economic and political situation of the country.
Recoverable amount is measured at the higher of the fair value less cost to sell for that asset and its value- in-use. The value-in-use is the net present value of the projected future cash flows derived from that asset discounted at an appropriate discount rate. For such discounted cash flow method, it involves the use of estimated future results and a set of assumptions to reflect its income and cash flows. Judgement has been used to determine the discount rate for the cash flows and the future growth of the business.
Notes To The Financial Statements31 December 2011 (Cont’d)

131|
7. PROPERTY, PLANT AND EQUIPMENT Furniture, fittings and equipment, Plant and renovations buildings Exhibition Freehold Freehold Leasehold Leasehold Plant and and motor under services Group land buildings land buildings machinery vehicles construction assets Total 2011 RM’000 RM’000 RM’000 RM’000 RM’000 RM’000 RM’000 RM’000 RM’000
Cost/Deemed cost
At 1 January - at cost 46,447 126,918 38,866 16,374 584,830 149,931 4,296 17,414 985,076
- at deemed cost - - 1,600 800 - - - - 2,400
Additions - - 130 6 5,146 18,481 1,554 357 25,674
Acquisition of subsidiaries (Note 32) - - - - 836 261 - - 1,097
Disposals - - - - (7,591) (9,053) - (36) (16,680)
Reclassified as non-current assets held for sale (Note 18) - - (35,795) - - - (685) - (36,480)
Write off - - - - (1,290) (6,880) - (171) (8,341)
Exchange adjustments - - - - 18 774 - 399 1,191
Reclassification - - - 4,696 419 50 (5,165) - -
At 31 December 46,447 126,918 4,801 21,876 582,368 153,564 - 17,963 953,937
Accumulated depreciation
At 1 January - 22,206 6,951 4,032 240,421 122,294 - 10,284 406,188
Charge for the financial year - 2,537 244 409 28,690 13,391 - 1,195 46,466
Disposals - - - - (6,928) (7,051) - (34) (14,013)
Reclassified as non-current assets held for sale (Note 18) - - (6,066) - - - - - (6,066)
Write off - - - - (513) (6,508) - (123) (7,144)
Exchange adjustments - - - - 14 713 - 255 982
At 31 December - 24,743 1,129 4,441 261,684 122,839 - 11,577 426,413
Accumulated impairment
At 1 January - - - - 1,063 - - - 1,063
Disposals - - - - (183) - - - (183)
At 31 December - - - - 880 - - - 880
Carrying amount
At 31 December - at cost 46,447 102,175 2,703 17,435 319,804 30,725 - 6,386 525,675
- at deemed cost - - 969 - - - - - 969
46,447 102,175 3,672 17,435 319,804 30,725 - 6,386 526,644
Notes To The Financial Statements 31 December 2011 (Cont’d)

132 |
7. PROPERTY, PLANT AND EQUIPMENT (cont’d) Furniture, fittings and equipment, Plant and renovations buildings Exhibition Freehold Freehold Leasehold Leasehold Plant and and motor under services Group land buildings land buildings machinery vehicles construction assets Total 2010 RM’000 RM’000 RM’000 RM’000 RM’000 RM’000 RM’000 RM’000 RM’000
Cost/Deemed cost
At 1 January - at cost 46,447 126,918 48,721 19,689 585,528 150,244 1,255 13,073 991,875
- at deemed cost - - 1,600 800 - - - - 2,400
Additions - - 9,000 - 633 9,228 3,231 5,574 27,666
Disposals - - - - (320) (2,423) - (396) (3,139)
Reclassified as non-current assets held for sale (Note 18) - - (18,855) (3,315) - - - - (22,170)
Write off - - - - (1,185) (6,578) - (194) (7,957)
Exchange adjustments - - - - (16) (540) - (643) (1,199)
Reclassification - - - - 190 - (190) - -
At 31 December 46,447 126,918 40,466 17,174 584,830 149,931 4,296 17,414 987,476
Accumulated depreciation
At 1 January - 19,668 7,520 3,946 212,553 116,782 - 9,956 370,425
Charge for the financial year - 2,538 613 512 29,200 13,534 - 1,228 47,625
Disposals - - - - (320) (2,080) - (282) (2,682)
Reclassified as non-current assets held for sale (Note 18) - - (1,182) (426) - - - - (1,608)
Write off - - - - (1,000) (5,562) - (141) (6,703)
Exchange adjustments - - - - (12) (380) - (477) (869)
At 31 December - 22,206 6,951 4,032 240,421 122,294 - 10,284 406,188
Accumulated impairment
At 1 January/31 December - - - - 1,063 - - - 1,063
Carrying amount
At 31 December - at cost 46,447 104,712 32,524 13,142 343,346 27,637 4,296 7,130 579,234
- at deemed cost - - 991 - - - - - 991
46,447 104,712 33,515 13,142 343,346 27,637 4,296 7,130 580,225
Notes To The Financial Statements31 December 2011 (Cont’d)

133|
7. PROPERTY, PLANT AND EQUIPMENT (cont’d) Furniture, fittings and equipment, Plant and renovations buildings Freehold Freehold Leasehold Leasehold Plant and and motor under Company land buildings land buildings machinery vehicles construction Total 2011 RM’000 RM’000 RM’000 RM’000 RM’000 RM’000 RM’000 RM’000
Cost/Deemed cost
At 1 January - at cost 46,447 126,918 38,866 16,374 556,211 120,125 4,296 909,237
- at deemed cost - - 1,600 800 - - - 2,400
Additions - - 130 6 1,907 10,526 1,554 14,123
Disposals - - - - (4,240) (6,061) - (10,301)
Transfer to subsidiaries - - - - - (3) - (3)
Transfer from subsidiary - - - - - 12 - 12
Reclassified as non-current assets held for sale (Note 18) - - (35,795) - - - (685) (36,480)
Write off - - - - (230) (4,275) - (4,505)
Reclassification - - - 4,696 419 50 (5,165) -
At 31 December 46,447 126,918 4,801 21,876 554,067 120,374 - 874,483
Accumulated depreciation
At 1 January - 22,206 6,951 4,032 223,036 98,807 - 355,032
Charge for the financial year - 2,537 244 409 26,909 9,959 - 40,058
Disposals - - - - (3,800) (4,298) - (8,098)
Transfer to subsidiaries - - - - - (3) - (3)
Transfer from subsidiary - - - - - 4 - 4
Reclassified as non-current assets held for sale (Note 18) - - (6,066) - - - - (6,066)
Write off - - - - (85) (4,145) - (4,230)
At 31 December - 24,743 1,129 4,441 246,060 100,324 - 376,697
Carrying amount
At 31 December - at cost 46,447 102,175 2,703 17,435 308,007 20,050 - 496,817
- at deemed cost - - 969 - - - - 969
46,447 102,175 3,672 17,435 308,007 20,050 - 497,786
Notes To The Financial Statements 31 December 2011 (Cont’d)

134 |
7. PROPERTY, PLANT AND EQUIPMENT (cont’d) Furniture, fittings and equipment, Plant and renovations buildings Freehold Freehold Leasehold Leasehold Plant and and motor under Company land buildings land buildings machinery vehicles construction Total 2010 RM’000 RM’000 RM’000 RM’000 RM’000 RM’000 RM’000 RM’000
Cost/Deemed cost
At 1 January - at cost 46,447 126,918 48,721 19,689 557,201 121,812 1,065 921,853
- at deemed cost - - 1,600 800 - - - 2,400
Additions - - 9,000 - 369 6,951 3,231 19,551
Disposals - - - - (174) (2,140) - (2,314)
Transfer to subsidiaries - - - - - (18) - (18)
Reclassified as non-current assets held for sale (Note 18) - - (18,855) (3,315) - - - (22,170)
Write off - - - - (1,185) (6,480) - (7,665)
At 31 December 46,447 126,918 40,466 17,174 556,211 120,125 4,296 911,637
Accumulated depreciation
At 1 January - 19,668 7,520 3,946 196,515 95,384 - 323,033
Charge for the financial year - 2,538 613 512 27,695 10,779 - 42,137
Disposals - - - - (174) (1,874) - (2,048)
Transfer to subsidiaries - - - - - (14) - (14)
Reclassified as non-current assets held for sale (Note 18) - - (1,182) (426) - - - (1,608)
Write off - - - - (1,000) (5,468) - (6,468)
At 31 December - 22,206 6,951 4,032 223,036 98,807 - 355,032
Carrying amount
At 31 December - at cost 46,447 104,712 32,524 13,142 333,175 21,318 4,296 555,614
- at deemed cost - - 991 - - - - 991
46,447 104,712 33,515 13,142 333,175 21,318 4,296 556,605
Notes To The Financial Statements31 December 2011 (Cont’d)
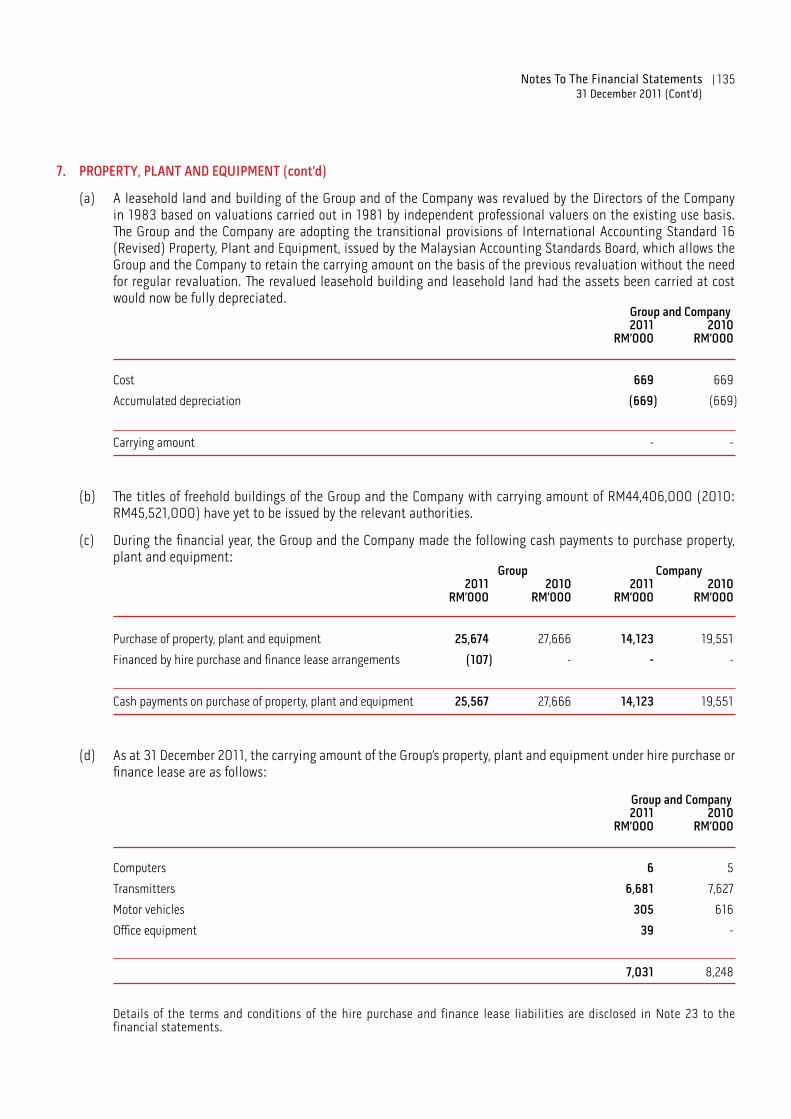
135|
7. PROPERTY, PLANT AND EQUIPMENT (cont’d)
(a) A leasehold land and building of the Group and of the Company was revalued by the Directors of the Company in 1983 based on valuations carried out in 1981 by independent professional valuers on the existing use basis. The Group and the Company are adopting the transitional provisions of International Accounting Standard 16 (Revised) Property, Plant and Equipment, issued by the Malaysian Accounting Standards Board, which allows the Group and the Company to retain the carrying amount on the basis of the previous revaluation without the need for regular revaluation. The revalued leasehold building and leasehold land had the assets been carried at cost would now be fully depreciated.
Group and Company 2011 2010 RM’000 RM’000
Cost 669 669
Accumulated depreciation (669) (669)
Carrying amount - -
(b) The titles of freehold buildings of the Group and the Company with carrying amount of RM44,406,000 (2010: RM45,521,000) have yet to be issued by the relevant authorities.
(c) During the financial year, the Group and the Company made the following cash payments to purchase property, plant and equipment:
Group Company 2011 2010 2011 2010 RM’000 RM’000 RM’000 RM’000
Purchase of property, plant and equipment 25,674 27,666 14,123 19,551
Financed by hire purchase and finance lease arrangements (107) - - -
Cash payments on purchase of property, plant and equipment 25,567 27,666 14,123 19,551
(d) As at 31 December 2011, the carrying amount of the Group’s property, plant and equipment under hire purchase or finance lease are as follows:
Group and Company 2011 2010 RM’000 RM’000
Computers 6 5
Transmitters 6,681 7,627
Motor vehicles 305 616
Office equipment 39 -
7,031 8,248
Details of the terms and conditions of the hire purchase and finance lease liabilities are disclosed in Note 23 to the financial statements.
Notes To The Financial Statements 31 December 2011 (Cont’d)

136 |
7. PROPERTY, PLANT AND EQUIPMENT (cont’d)
(e) As at the end of the financial year, the carrying amount of motor vehicles which were registered in the name of certain Directors of a subsidiary who are holding the motor vehicles in trust for the Group amounted to SGD117,000 (2010: SGD234,000) or equivalent to RM289,000 (2010: RM567,000).
The title of a freehold building of the Group and the Company with a carrying amount of RM3,019,000 (2010: RM3,088,000) has yet to be issued by the relevant authority.
The fair value is determined by the Directors based on information obtained from property agencies and valuation performed by independent professional valuers.
The following are recognised in the statements of comprehensive income in respect of investment properties:
Group and Company 2011 2010 RM’000 RM’000
Rental income 682 1,983Direct operating expenses incurred on: - income generating investment properties 94 231- non-income generating investment properties 5 7
8. INVESTMENT PROPERTIES Group and Company 2011 2010Buildings RM’000 RM’000
Cost Balance as at 1 January 20,883 24,364Additions during the financial year - 143Disposals (5,318) -Reclassified as non-current assets held for sale (Note 18) (5,713) (3,624)
Balance as at 31 December 9,852 20,883
Accumulated depreciation Balance as at 1 January 4,815 4,271Depreciation charge for the financial year 375 610Disposals (124) -Reclassified as non-current assets held for sale (Note 18) (3,709) (66)
Balance as at 31 December 1,357 4,815
Carrying amount 8,495 16,068
Fair value 18,770 27,570
Notes To The Financial Statements31 December 2011 (Cont’d)
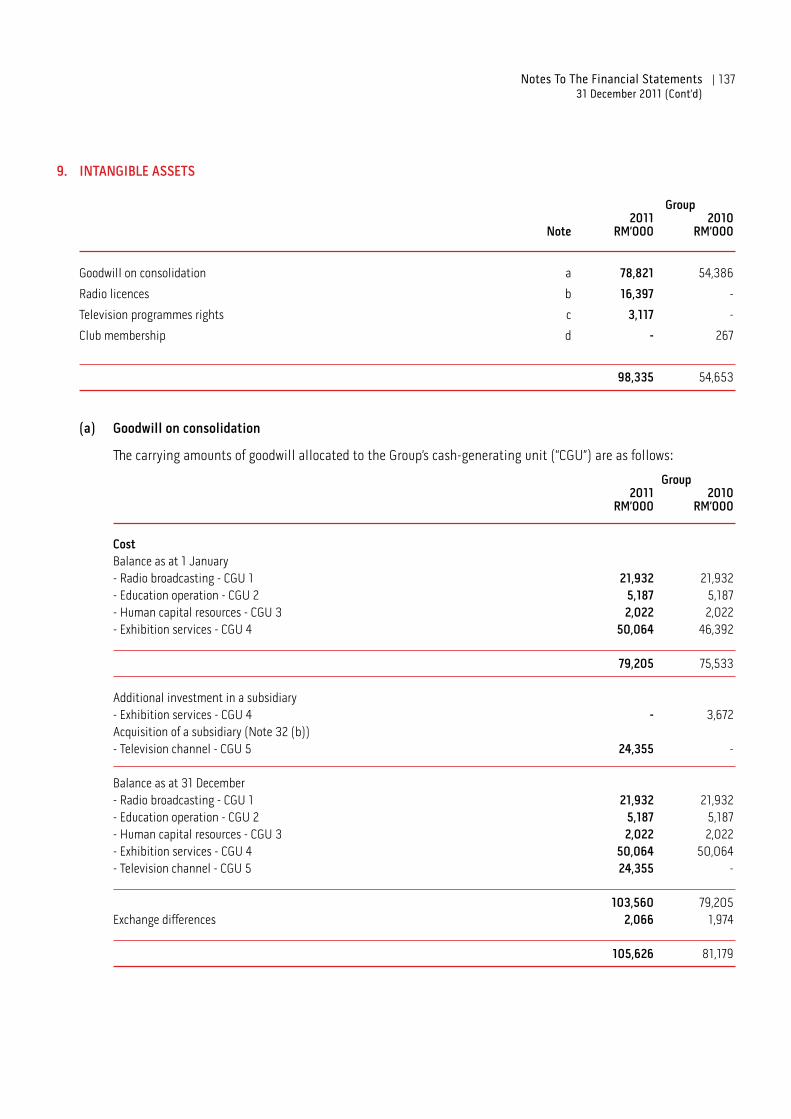
137|
9. INTANGIBLE ASSETS Group 2011 2010 Note RM’000 RM’000
Goodwill on consolidation a 78,821 54,386
Radio licences b 16,397 -
Television programmes rights c 3,117 -
Club membership d - 267
98,335 54,653
(a) Goodwill on consolidation
The carrying amounts of goodwill allocated to the Group’s cash-generating unit (“CGU”) are as follows:
Group 2011 2010 RM’000 RM’000
Cost
Balance as at 1 January- Radio broadcasting - CGU 1 21,932 21,932- Education operation - CGU 2 5,187 5,187- Human capital resources - CGU 3 2,022 2,022- Exhibition services - CGU 4 50,064 46,392
79,205 75,533
Additional investment in a subsidiary - Exhibition services - CGU 4 - 3,672Acquisition of a subsidiary (Note 32 (b)) - Television channel - CGU 5 24,355 - Balance as at 31 December - Radio broadcasting - CGU 1 21,932 21,932- Education operation - CGU 2 5,187 5,187- Human capital resources - CGU 3 2,022 2,022- Exhibition services - CGU 4 50,064 50,064- Television channel - CGU 5 24,355 - 103,560 79,205Exchange differences 2,066 1,974 105,626 81,179
Notes To The Financial Statements 31 December 2011 (Cont’d)

138 |
9. INTANGIBLE ASSETS (cont’d)
(a) Goodwill on consolidation (cont’d)
The carrying amounts of goodwill allocated to the Group’s cash-generating unit (“CGU”) are as follows: (cont’d)
Group 2011 2010 RM’000 RM’000
Accumulated impairment lossesBalance as at 1 January - Education operation - CGU 2 5,187 5,187- Human capital resources - CGU 3 1,300 1,300- Exhibition services - CGU 4 20,103 19,501 26,590 25,988
Impairment losses recognised during the year - Exhibition services - CGU 4 - 602 Balance as at 31 December - Education operation - CGU 2 5,187 5,187- Human capital resources - CGU 3 1,300 1,300- Exhibition services - CGU 4 20,103 20,103 26,590 26,590Exchange differences 215 203 26,805 26,793 Carrying amount 78,821 54,386 Carrying amount as at 31 December represents- Radio broadcasting - CGU 1 21,932 21,932- Human capital resources - CGU 3 722 722- Exhibition services - CGU 4 29,961 29,961- Television channel - CGU 5 24,355 -Exchange differences 1,851 1,771 78,821 54,386
Notes To The Financial Statements31 December 2011 (Cont’d)

139|
9. INTANGIBLE ASSETS (cont’d)
(a) Goodwill on consolidation (cont’d)
Impairment test on CGU 1
The recoverable amount of CGU 1 was determined from value-in-use calculation. Based on the calculation, there was no impairment loss allocated to CGU 1 as the recoverable amount of CGU 1 was determined to be higher than its carrying amount as at the end of the reporting period.
Value-in-use of CGU 1 was determined by discounting the future cash flows generated from the continuing use of CGU 1 and was based on the following assumptions:
(i) Pre-tax cash flow projections based on the most recent financial budgets approved by the Directors covering a five-year period. Revenue is projected to grow at rate of 12% over the next five years with gradual improvement in the pre-tax margin.
(ii) Terminal value computed based on the present value of cash flows in the fifth year without incorporating any growth rate.
(iii) The radio licence will be renewed upon expiry at no significant costs.
(iv) Pre-tax discount rate of 7.88% was applied in determining the recoverable amount of CGU 1. The discount rate was estimated based on the Group’s weighted average cost of capital.
Impairment test on CGU 2
The Group had ceased the education operation since year 2007. The full impairment on CGU 2 amounting to RM5,187,000 was recognised in prior years.
Impairment test on CGU 3
The recoverable amount of CGU 3 was determined from value-in-use calculation. Based on the calculation, there was no further impairment loss allocated to CGU 3 as the recoverable amount of CGU 3 was determined to be higher than its carrying amount as at the end of the reporting period.
Value-in-use of CGU 3 was determined by discounting the future cash flows generated from the continuing use of CGU 3 and was based on the following assumptions:
(i) Pre-tax cash flow projections based on the most recent financial budgets approved by the Directors covering a five-year period. Revenue is projected to grow at rates ranging from 6% to 7% over the next five years with gradual improvement in the pre-tax margin.
(ii) Terminal value computed based on the present value of cash flows in the fifth year without incorporating any growth rate.
(iii) Pre-tax discount rate of 7.88% was applied in determining the recoverable amount of CGU 3. The discount rate was estimated based on the Group’s weighted average cost of capital.
Notes To The Financial Statements 31 December 2011 (Cont’d)

140 |
9. INTANGIBLE ASSETS (cont’d)
(a) Goodwill on consolidation (cont’d)
Impairment test on CGU 4
The recoverable amount of CGU 4 was determined from value-in-use calculation. Based on the calculation, there was no further impairment loss allocated to CGU 4 as the recoverable amount of CGU 4 was determined to be higher than its carrying amount as at the end of the reporting period.
Value-in-use of CGU 4 was determined by discounting the future cash flows generated from the continuing use of CGU 4 and was based on the following assumptions:
(i) Pre-tax cash flow projections based on the most recent financial budgets approved by the Directors covering a five-year period. Revenue is projected to grow at rate of 3% over the next five years with gradual improvement in the pre-tax margin.
(ii) Terminal value computed based on the present value of cash flows in the fifth year without incorporating any growth rate.
(iii) Pre-tax discount rate of 7.88% was applied in determining the recoverable amount of CGU 4. The discount rate was estimated based on the Group’s weighted average cost of capital.
Impairment test on CGU 5
The recoverable amount of CGU 5 was determined from value-in-use calculation. Based on the calculation, there was no impairment loss allocated to CGU 5 as the recoverable amount of CGU 5 was determined to be higher than its carrying amount as at the end of the reporting period.
Value-in-use of CGU 5 was determined by discounting the future cash flows generated from the continuing use of CGU 5 and was based on the following assumptions:
(i) Pre-tax cash flow projections based on the most recent financial budgets approved by the Directors covering a five-year period. Revenue is projected to grow at rates ranging from 9% to 31% over the next five years with gradual improvement in the pre-tax margin.
(ii) Terminal value computed based on the present value of cash flows in the fifth year without incorporating any growth rate.
(iii) Pre-tax discount rate of 7.88% was applied in determining the recoverable amount of CGU 5. The discount rate was estimated based on the Group’s weighted average cost of capital.
With regard to the assessment of value-in-use of CGU 1, 3, 4 and 5, management believes that no reasonably possible change in any of the above key assumptions would cause the carrying values of the units to materially exceed their recoverable amounts.
Notes To The Financial Statements31 December 2011 (Cont’d)

141|
9. INTANGIBLE ASSETS (cont’d)
(b) Radio licences
Group 2011 2010 RM’000 RM’000
CostBalance as at 1 January 7,483 7,483Acquisition of a subsidiary (Note 32(a)) 17,709 - Balance as at 31 December 25,192 7,483 Accumulated amortisation Balance as at 1 January 7,483 7,058Charge for the financial year 1,312 425 Balance as at 31 December 8,795 7,483 Carrying amount 16,397 -
(c) Television programmes rights
Group 2011 2010 RM’000 RM’000
CostBalance as at 1 January - -Acquisition of a subsidiary (Note 32(b)) 2,254 -Additions 1,283 -Exchange differences 144 - Balance as at 31 December 3,681 - Accumulated amortisation Balance as at 1 January - -Charge for the financial year 547 -Exchange differences 17 - Balance as at 31 December 564 - Carrying amount 3,117 -
Notes To The Financial Statements 31 December 2011 (Cont’d)

142 |
9. INTANGIBLE ASSETS (cont’d)
(d) Club membership
Group 2011 2010 RM’000 RM’000
CostBalance as at 1 January 807 807Exchange differences (3) (8) Balance as at 31 December 804 799 Accumulated amortisation Balance as at 1 January 539 270Charge for the financial year 269 269 Balance as at 31 December 808 539Exchange differences (4) (7) 804 532
Carrying amount - 267
The club membership rights are held in trust by the Directors of a subsidiary.
10. INVESTMENTS IN SUBSIDIARIES
Company 2011 2010 RM’000 RM’000
Unquoted shares - at cost 189,167 139,167Less: Accumulated impairment losses (16,585) (16,585) 172,582 122,582
Notes To The Financial Statements31 December 2011 (Cont’d)

143|
10. INVESTMENTS IN SUBSIDIARIES (cont’d)The subsidiaries are as follows: Interest in equity held by Country of Company Subsidiary Name of Company incorporation 2011 2010 2011 2010 Principal activities Star Papyrus Printing Sdn. Bhd. Malaysia 100% 100% - - Inactive Star Publications Singapore 100% 100% - - Advertising and (Singapore) Pte. Ltd.(1) commission agent Excel Corporation Australia 100% 100% - - Investment of assets held (Australia) Pty. Ltd.(1) Star Commercial Malaysia 100% 100% - - Investment holding Publications Sdn. Bhd. Asian Center For Media Malaysia 100% 100% - - Provision of educational Studies Sdn. Bhd. research Rimakmur Sdn. Bhd. Malaysia 70% 70% - - Operating a wireless radio broadcasting station Impian Ikon (M) Sdn. Bhd. Malaysia 100% 100% - - Investment holding Laviani Pte. Ltd.(1) Singapore 100% 100% - - Investment holding Star MediaWorks Sdn. Bhd. Malaysia 100% 100% - - Investment holding Acacia Forecast (M) Sdn. Bhd. Malaysia 100% 100% - - Inactive Capital FM Sdn. Bhd.* Malaysia 80% - - - Operating a wireless radio broadcasting station Li TV Holdings Limited(1)* Hong Kong 51% - - - Investment holding Subsidiaries of Star MediaWorks Sdn. Bhd.
StarProperty Sdn. Bhd. Malaysia - - 100% 100% Online advertising I.Star Sdn. Bhd. Malaysia - - 100% 100% Internet research and development JustJobs Sdn. Bhd. Malaysia - - 100% 100% Online advertising
Notes To The Financial Statements 31 December 2011 (Cont’d)

144 |
10. INVESTMENTS IN SUBSIDIARIES (cont’d)The subsidiaries are as follows: (cont’d) Interest in equity held by Country of Company Subsidiary Name of Company incorporation 2011 2010 2011 2010 Principal activities Subsidiaries of I.Star Sdn. Bhd.
Star Online Sdn. Bhd. Malaysia - - 100% 100% Inactive I.Star Ideas Factory Sdn. Bhd. Malaysia - - 100% 100% Inactive Subsidiary of Star Commercial Publications Sdn. Bhd.
Star Rfm Sdn. Bhd. Malaysia - - 100% 100% Operating a wireless radio broadcasting station Subsidiary of Excel Corporation (Australia) Pty. Ltd.
AIUS Pty. Ltd.(1) Australia - - 100% 100% Inactive Subsidiary of Impian Ikon (M) Sdn. Bhd.
Leaderonomics Sdn. Bhd. Malaysia - - 51% 51% Provision of human capital development services including training and consultancy Subsidiary of Leaderonomics Sdn. Bhd.
Leaderonomics Media Sdn. Bhd.* Malaysia - - 100% - Produce, develop, distribute, market and deal with materials and contents related to leadership programmes or any business of human capital development including training of any form and consultancy of all kinds Subsidiary of Laviani Pte. Ltd.
Cityneon Holdings Limited(1) Singapore - - 64% 64% Investment holding
Notes To The Financial Statements31 December 2011 (Cont’d)
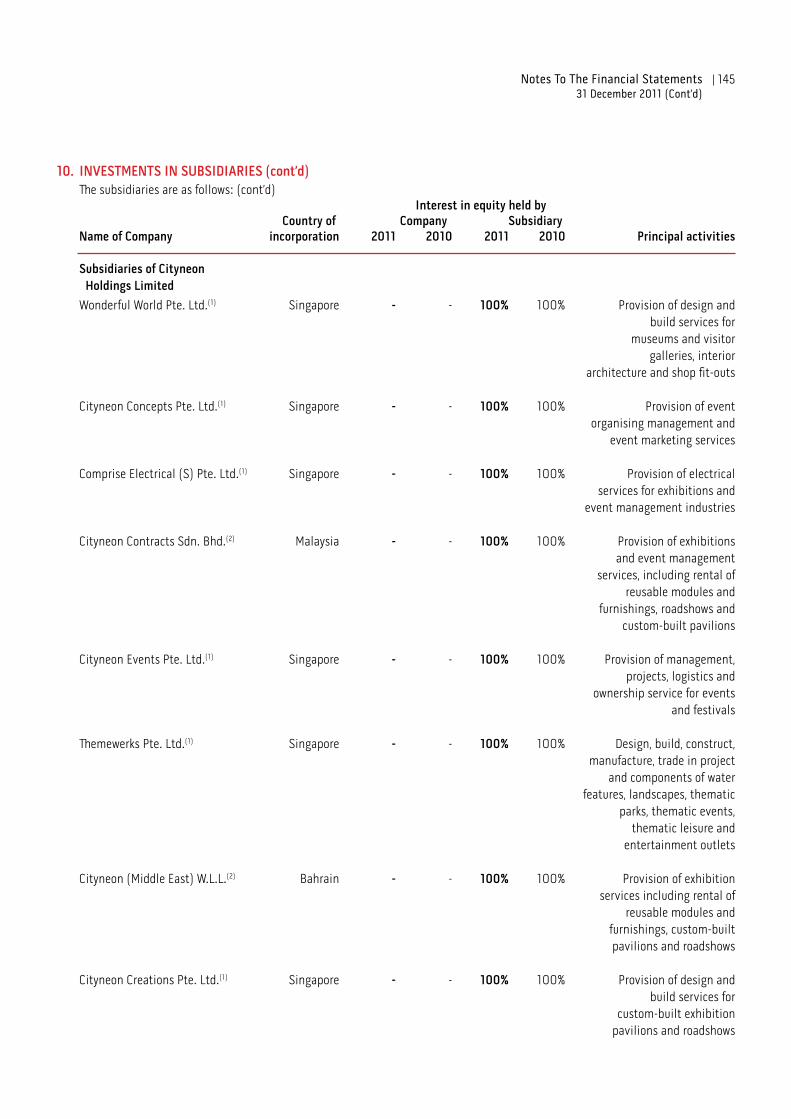
145|
10. INVESTMENTS IN SUBSIDIARIES (cont’d)The subsidiaries are as follows: (cont’d) Interest in equity held by Country of Company Subsidiary Name of Company incorporation 2011 2010 2011 2010 Principal activities Subsidiaries of Cityneon Holdings Limited
Wonderful World Pte. Ltd.(1) Singapore - - 100% 100% Provision of design and build services for museums and visitor galleries, interior architecture and shop fit-outs Cityneon Concepts Pte. Ltd.(1) Singapore - - 100% 100% Provision of event organising management and event marketing services Comprise Electrical (S) Pte. Ltd.(1) Singapore - - 100% 100% Provision of electrical services for exhibitions and event management industries Cityneon Contracts Sdn. Bhd.(2) Malaysia - - 100% 100% Provision of exhibitions and event management services, including rental of reusable modules and furnishings, roadshows and custom-built pavilions Cityneon Events Pte. Ltd.(1) Singapore - - 100% 100% Provision of management, projects, logistics and ownership service for events and festivals Themewerks Pte. Ltd.(1) Singapore - - 100% 100% Design, build, construct, manufacture, trade in project and components of water features, landscapes, thematic parks, thematic events, thematic leisure and entertainment outlets Cityneon (Middle East) W.L.L.(2) Bahrain - - 100% 100% Provision of exhibition services including rental of reusable modules and furnishings, custom-built pavilions and roadshows Cityneon Creations Pte. Ltd.(1) Singapore - - 100% 100% Provision of design and build services for custom-built exhibition pavilions and roadshows
Notes To The Financial Statements 31 December 2011 (Cont’d)

146 |
10. INVESTMENTS IN SUBSIDIARIES (cont’d)The subsidiaries are as follows: (cont’d) Interest in equity held by Country of Company Subsidiary Name of Company incorporation 2011 2010 2011 2010 Principal activities Subsidiaries of Cityneon Holdings Limited (cont’d)
Cityneon Exhibition Services Vietnam - - 100% 100% Providing on interior and (Vietnam) Co. Ltd.(1) exterior decoration for offices, commercial buildings, shop, museums and theme parks PT. Wonderful World Marketing Indonesia - - 100% 100% Provision of management Services Indonesia(2) consultancy, consultancy services on thematic, interior and project management and consultancy services on tourism Cityneon Management Singapore - - 100% 100% Provision of management, Services Pte. Ltd.(1) human resource and general office administrative services Cityneon Exhibition Singapore - - 100% 100% Provision of exhibition services Services Pte. Ltd.(1) including rental of reusable modules, furnishings and furnitures Cityneon Vietnam Vietnam - - 100% - Provision of project Company Limited(1) management services (other than for construction) and to engage in the installation, assembly, building completion and finishing works Cityneon Shelter Events China - - 100% - Home and abroad exhibitions (Shenzhen) Pte. Ltd.(1) information consultation, economic information and enterprise management consultation (excluding securities, insurance, fund, financing employment agency service and other restricted projects), exhibition and event activities display design management, enterprise image and marketing management, stage design management, exhibition etiquette consultant, showroom display design management service
Notes To The Financial Statements31 December 2011 (Cont’d)

147|
10. INVESTMENTS IN SUBSIDIARIES (cont’d)The subsidiaries are as follows: (cont’d) Interest in equity held by Country of Company Subsidiary Name of Company incorporation 2011 2010 2011 2010 Principal activities Subsidiaries of Cityneon Exhibition Services Pte. Ltd. E-Graphics Displays Pte. Ltd.(1) Singapore - - 60% 60% Designer and production of environmental graphic materials including banners, posters, billboards and general signages for event and exhibition venues Shanghai Cityneon China - - 100% 100% Designer and provider of Exhibition Services Co., Ltd.(2) services for trade fairs, exhibitions and displays Subsidiary of Cityneon (Middle East) W.L.L. C.N. Overseas Services W.L.L.(2) Bahrain - - 100% 100% Provision of design and build services for custom-built exhibition pavilions and roadshows Subsidiary of Themewerks Pte. Ltd. Artscapes Themewerks Pte. Ltd.(1) Singapore - - 65% 65% Design, build, construct, manufacture, trade in projects and components of water features, landscapes, thematic parks, thematic events, thematic leisure and entertainment outlets Subsidiaries of Li TV Holdings Limited Li TV Asia Sdn. Bhd. Malaysia - - 100% - Agent for distribution of television channel and films and sale of television channel airtime Li TV Asia Pte. Ltd.(1) Singapore - - 100% - Provision of technical operation and broadcasting support for high definition television channel Li TV International Limited(1) Hong Kong - - 100% - Operating a regional pay/cable television channel
(1) Audited by member firms of BDO International.
(2) Not audited by BDO or member firms of BDO International.
* Further information on the acquisitions is detailed in Note 32.
Notes To The Financial Statements 31 December 2011 (Cont’d)
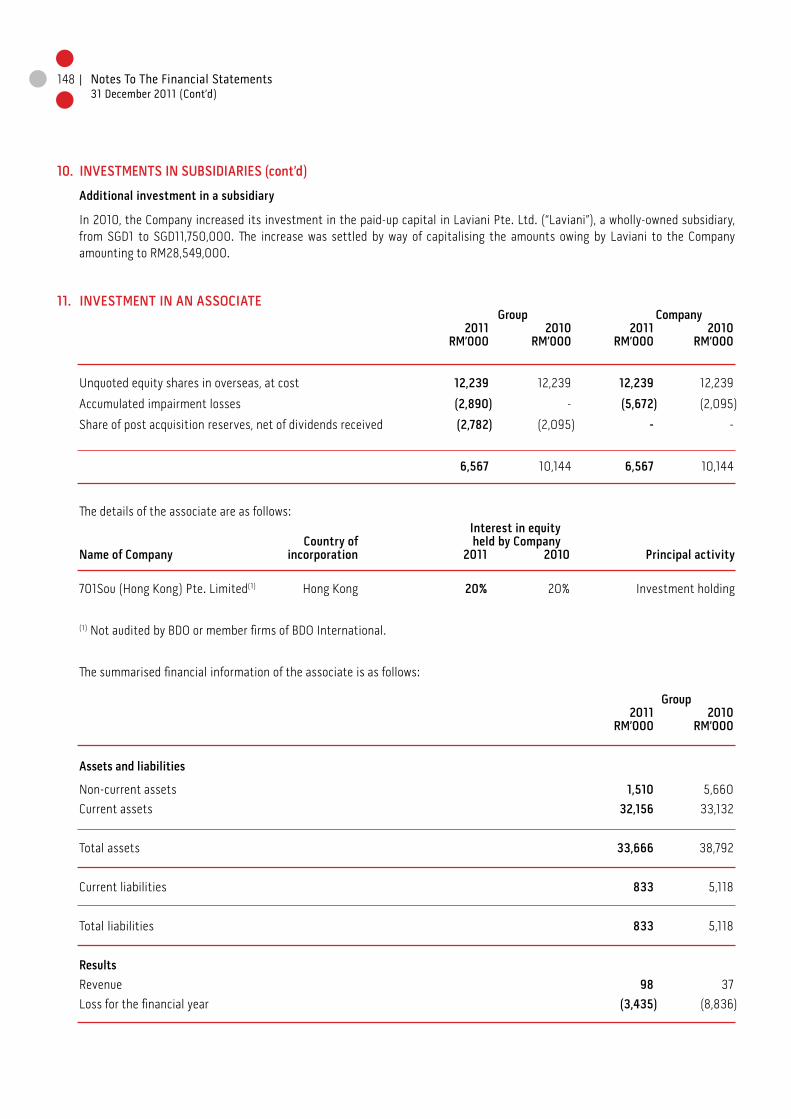
148 |
10. INVESTMENTS IN SUBSIDIARIES (cont’d)
Additional investment in a subsidiary
In 2010, the Company increased its investment in the paid-up capital in Laviani Pte. Ltd. (“Laviani”), a wholly-owned subsidiary, from SGD1 to SGD11,750,000. The increase was settled by way of capitalising the amounts owing by Laviani to the Company amounting to RM28,549,000.
11. INVESTMENT IN AN ASSOCIATE Group Company 2011 2010 2011 2010 RM’000 RM’000 RM’000 RM’000
Unquoted equity shares in overseas, at cost 12,239 12,239 12,239 12,239
Accumulated impairment losses (2,890) - (5,672) (2,095)
Share of post acquisition reserves, net of dividends received (2,782) (2,095) - -
6,567 10,144 6,567 10,144
The details of the associate are as follows: Interest in equity Country of held by Company Name of Company incorporation 2011 2010 Principal activity
701Sou (Hong Kong) Pte. Limited(1) Hong Kong 20% 20% Investment holding
(1) Not audited by BDO or member firms of BDO International.
The summarised financial information of the associate is as follows:
Group 2011 2010 RM’000 RM’000
Assets and liabilities
Non-current assets 1,510 5,660
Current assets 32,156 33,132
Total assets 33,666 38,792
Current liabilities 833 5,118
Total liabilities 833 5,118
Results
Revenue 98 37
Loss for the financial year (3,435) (8,836)
Notes To The Financial Statements31 December 2011 (Cont’d)
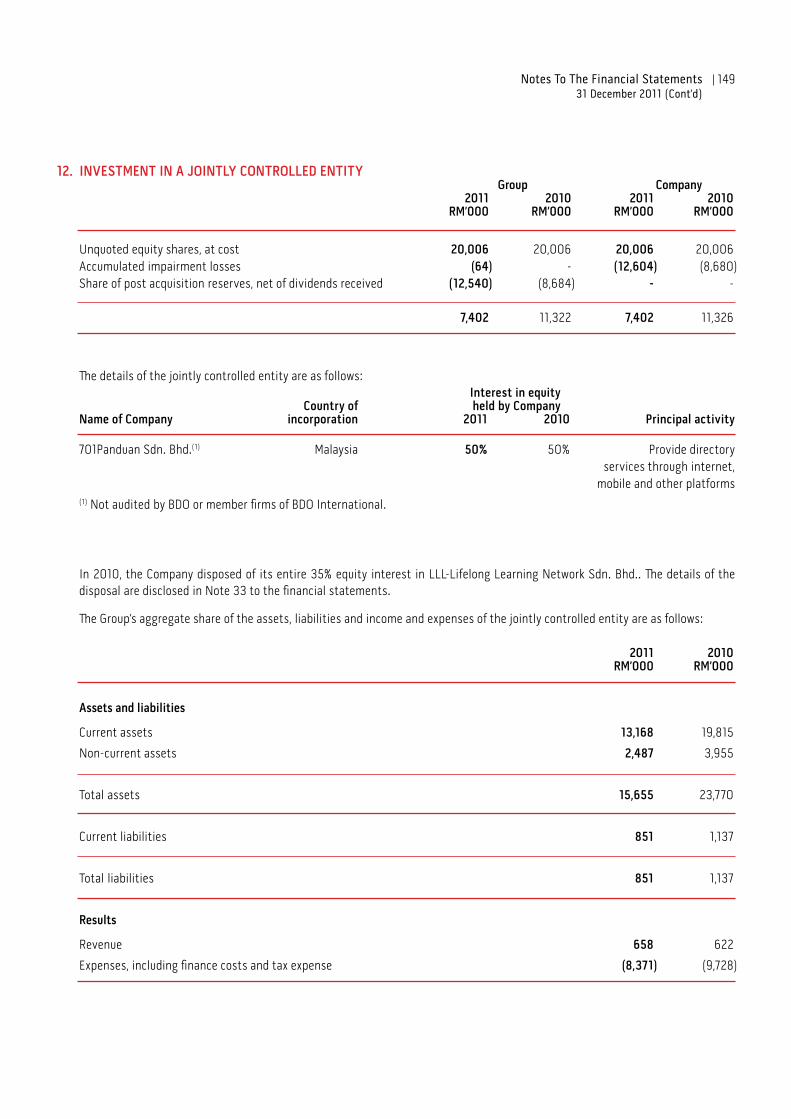
149| Notes To The Financial Statements 31 December 2011 (Cont’d)
12. INVESTMENT IN A JOINTLY CONTROLLED ENTITY Group Company 2011 2010 2011 2010 RM’000 RM’000 RM’000 RM’000
Unquoted equity shares, at cost 20,006 20,006 20,006 20,006Accumulated impairment losses (64) - (12,604) (8,680) Share of post acquisition reserves, net of dividends received (12,540) (8,684) - - 7,402 11,322 7,402 11,326
The details of the jointly controlled entity are as follows: Interest in equity Country of held by Company Name of Company incorporation 2011 2010 Principal activity 701Panduan Sdn. Bhd.(1) Malaysia 50% 50% Provide directory services through internet, mobile and other platforms(1) Not audited by BDO or member firms of BDO International.
In 2010, the Company disposed of its entire 35% equity interest in LLL-Lifelong Learning Network Sdn. Bhd.. The details of the disposal are disclosed in Note 33 to the financial statements.
The Group’s aggregate share of the assets, liabilities and income and expenses of the jointly controlled entity are as follows:
2011 2010 RM’000 RM’000
Assets and liabilities
Current assets 13,168 19,815
Non-current assets 2,487 3,955
Total assets 15,655 23,770
Current liabilities 851 1,137
Total liabilities 851 1,137
Results
Revenue 658 622
Expenses, including finance costs and tax expense (8,371) (9,728)
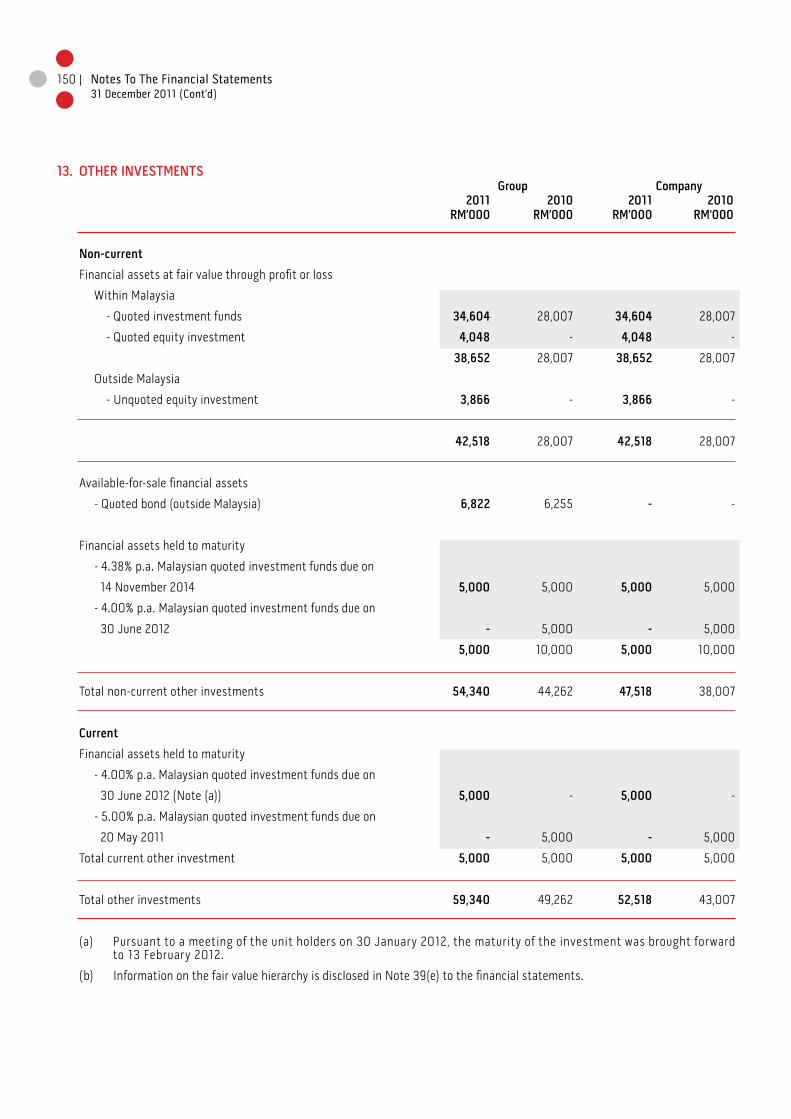
150 |
13. OTHER INVESTMENTS Group Company 2011 2010 2011 2010 RM’000 RM’000 RM’000 RM’000
Non-current
Financial assets at fair value through profit or loss
Within Malaysia
- Quoted investment funds 34,604 28,007 34,604 28,007
- Quoted equity investment 4,048 - 4,048 -
38,652 28,007 38,652 28,007
Outside Malaysia
- Unquoted equity investment 3,866 - 3,866 -
42,518 28,007 42,518 28,007
Available-for-sale financial assets
- Quoted bond (outside Malaysia) 6,822 6,255 - -
Financial assets held to maturity
- 4.38% p.a. Malaysian quoted investment funds due on
14 November 2014 5,000 5,000 5,000 5,000
- 4.00% p.a. Malaysian quoted investment funds due on
30 June 2012 - 5,000 - 5,000
5,000 10,000 5,000 10,000
Total non-current other investments 54,340 44,262 47,518 38,007
Current
Financial assets held to maturity
- 4.00% p.a. Malaysian quoted investment funds due on
30 June 2012 (Note (a)) 5,000 - 5,000 -
- 5.00% p.a. Malaysian quoted investment funds due on
20 May 2011 - 5,000 - 5,000
Total current other investment 5,000 5,000 5,000 5,000
Total other investments 59,340 49,262 52,518 43,007
(a) Pursuant to a meeting of the unit holders on 30 January 2012, the maturity of the investment was brought forward to 13 February 2012.
(b) Information on the fair value hierarchy is disclosed in Note 39(e) to the financial statements.
Notes To The Financial Statements31 December 2011 (Cont’d)

151| Notes To The Financial Statements 31 December 2011 (Cont’d)
14. DEFERRED TAX
(a) The deferred tax assets and liabilities are made up of the following: Group Company
2011 2010 2011 2010 RM’000 RM’000 RM’000 RM’000
Balance as at 1 January 78,452 80,508 78,435 80,523
Recognised in profit or loss (Note 29) (6,054) (2,047) (7,407) (2,088)
Recognised in other comprehensive income 102 - - -
Exchange differences 10 (9) - -
Balance as at 31 December 72,510 78,452 71,028 78,435
Presented after appropriate offsetting:
- Deferred tax assets, net (60) (574) - -
- Deferred tax liabilities, net 72,570 79,026 71,028 78,435
72,510 78,452 71,028 78,435
(b) The components and movements of deferred tax liabilities and assets during the financial year prior to offsetting are as follows:
Deferred tax liabilities of the Group Property, Other plant and temporary Set-off equipment differences of tax Total RM’000 RM’000 RM’000 RM’000
At 1 January 2011 88,881 - (9,855) 79,026
Recognised in profit or loss (5,700) 1,109 (1,981) (6,572)
Recognised in other comprehensive income - 102 - 102
Exchange differences (15) 29 - 14
At 31 December 2011 83,166 1,240 (11,836) 72,570
At 1 January 2010 89,119 - (7,979) 81,140
Recognised in profit or loss (229) - (1,876) (2,105)
Exchange differences (9) - - (9)
At 31 December 2010 88,881 - (9,855) 79,026

152 |
14. DEFERRED TAX (cont’d)
(b) The components and movements of deferred tax liabilities and assets during the financial year prior to offsetting are as follows: (cont’d)
Deferred tax assets of the Group Unused tax losses and unabsorbed Accrual Other capital for temporary Set-off allowances staff costs differences of tax Total RM’000 RM’000 RM’000 RM’000 RM’000
At 1 January 2011 (50) (9,540) (839) 9,855 (574)
Recognised in profit or loss 50 238 (1,751) 1,981 518
Exchange differences * - (4) - (4)
At 31 December 2011 - (9,302) (2,594) 11,836 (60)
At 1 January 2010 (165) (7,692) (754) 7,979 (632)
Recognised in profit or loss 115 (1,848) (85) 1,876 58
Exchange differences * - * - *
At 31 December 2010 (50) (9,540) (839) 9,855 (574)
* Less than RM1,000
Deferred tax liabilities of the Company Property, plant and Set-off equipment of tax Total RM’000 RM’000 RM’000
At 1 January 2011 88,284 (9,849) 78,435
Recognised in profit or loss (6,700) (707) (7,407)
At 31 December 2011 81,584 (10,556) 71,028
At 1 January 2010 88,389 (7,866) 80,523
Recognised in profit or loss (105) (1,983) (2,088)
At 31 December 2010 88,284 (9,849) 78,435
Notes To The Financial Statements31 December 2011 (Cont’d)

153| Notes To The Financial Statements 31 December 2011 (Cont’d)
14. DEFERRED TAX (cont’d)
(b) The components and movements of deferred tax liabilities and assets during the financial year prior to offsetting are as follows: (cont’d)
Deferred tax assets of the Company Accrual Other for temporary Set-off staff costs differences of tax Total RM’000 RM’000 RM’000 RM’000
At 1 January 2011 (9,179) (670) 9,849 -
Recognised in profit or loss 359 (1,066) 707 -
At 31 December 2011 (8,820) (1,736) 10,556 -
At 1 January 2010 (7,416) (450) 7,866 -
Recognised in profit or loss (1,763) (220) 1,983 -
At 31 December 2010 (9,179) (670) 9,849 -
(c) The amount of temporary differences for which no deferred tax assets have been recognised in the statements of financial position are as follows:
Group 2011 2010 RM’000 RM’000
Other temporary differences 1,375 797
Unabsorbed capital allowances 6,317 4,845
Unused tax losses
- No expiry date 40,032 34,701
- Expires by 31 December 2011 - 473
- Expires by 31 December 2012 139 135
- Expires by 31 December 2013 124 121
- Expires by 31 December 2014 480 467
- Expires by 31 December 2016 567 -
49,034 41,539
Deferred tax assets of certain subsidiaries have not been recognised in respect of these items as it is not probable that taxable profits of the subsidiaries will be available against which the temporary differences can be utilised.
The amount and availability of these items to be carried forward up to the periods as disclosed above are subject to the agreement of the respective local tax authorities.

154 |
15. INVENTORIES Group Company 2011 2010 2011 2010 RM’000 RM’000 RM’000 RM’000
At cost
Newsprint 138,711 209,797 138,711 209,797
Other raw materials and consumables 738 705 34 35
139,449 210,502 138,745 209,832
Cost of inventories of the Group and of the Company recognised as an expense during the financial year amounted to RM143,779,000 (2010: RM146,901,000) and RM141,269,000 (2010: RM145,615,000).
16. TRADE AND OTHER RECEIVABLES Group Company 2011 2010 2011 2010 Note RM’000 RM’000 RM’000 RM’000
CurrentTrade
Third parties a 158,039 162,186 108,566 110,444Subsidiaries - - 159 496Amount due from contract customers b 24,652 13,007 - - g 182,691 175,193 108,725 110,940Less: Allowance for credit losses - Third parties c, h (12,979) (12,681) (8,480) (8,182) 169,712 162,512 100,245 102,758 Non-trade
Third parties 22,664 13,191 1,217 854Amounts owing by subsidiaries d - - 106,680 90,843 22,664 13,191 107,897 91,697Less: Allowance for credit losses - Third parties (52) (148) - - - Subsidiaries - - (42,050) (41,342) 22,612 13,043 65,847 50,355Sundry deposits and other receivables 7,653 5,904 2,614 2,203Prepayments e 12,327 8,599 8,537 4,840 42,592 27,546 76,998 57,398 f, i 212,304 190,058 177,243 160,156
Notes To The Financial Statements31 December 2011 (Cont’d)

155| Notes To The Financial Statements 31 December 2011 (Cont’d)
16. TRADE AND OTHER RECEIVABLES (cont’d)
(a) The credit terms of trade receivables range from payment in advance to credit period of 90 days (2010: 90 days). Trade receivables are recognised at their original invoice amount which represent their fair values on initial recognition.
(b) AMOUNTS DUE FROM/(TO) CUSTOMERS FOR CONTRACT WORKS
Group 2011 2010 RM’000 RM’000
Aggregate costs incurred to date 131,133 102,781
Add: Attributable profits 26,894 15,615
158,027 118,396
Less: Progress billings (137,098) (107,100)
20,929 11,296
Represented by:
Amount due from customers for contract works 24,652 13,007
Amount due to customers for contract works (Note 24) (3,723) (1,711)
20,929 11,296
As at 31 December 2011, retention monies held by customers for contract works amounted to RM2,822,000 (2010: RM5,874,000).
(c) The allowance for credit losses of the Group and the Company is net of bad debts written off amounting to RM1,053,000 (2010: RM306,000) and RM451,000 (2010: RM50,000) respectively.
(d) Amounts owing by subsidiaries are in respect of advances, which are unsecured, interest-free and payable upon demand in cash and cash equivalents except for RM9,890,000 (2010: RM9,682,000) which is repayable by 31 December 2012 (2010: 31 December 2011) and is subject to interest at 3.80% (2010: 5.00%) per annum.
(e) Included in prepayments of the Group and the Company are deposits amounting to RM1,082,000 (2010: RM1,388,000) paid to suppliers for the acquisition of plant and machinery and software.
(f) Information on financial risks of trade and other receivables are disclosed in Note 40 to the financial statements.

156 |
16. TRADE AND OTHER RECEIVABLES (cont’d)
(g) The ageing analysis of trade receivables of the Group and of the Company are as follows:
Group Company 2011 2010 2011 2010 RM’000 RM’000 RM’000 RM’000
Neither past due nor impaired 151,566 147,923 94,538 100,005 Past due, not impaired > 90 days 12,305 10,884 2,979 1,209 > 120 days 4,230 2,654 1,515 752 > 180 days 1,611 1,051 1,213 792 18,146 14,589 5,707 2,753Past due and impaired 12,979 12,681 8,480 8,182 182,691 175,193 108,725 110,940
Receivables that are past due and impaired
Trade receivables of the Group and of the Company that are past due and impaired at the end of the reporting period are as follows:
Group Company Individually impaired Individually impaired 2011 2010 2011 2010
Group RM’000 RM’000 RM’000 RM’000
Trade receivables, gross 12,979 12,681 8,480 8,182Less: Allowance for credit losses (12,979) (12,681) (8,480) (8,182) - - - -
(h) The reconciliation of movement in the allowance for credit losses are as follows:
Group Company 2011 2010 2011 2010 RM’000 RM’000 RM’000 RM’000
At 1 January 12,681 11,703 8,182 8,753Charge for the financial year (Note 28) 2,447 2,023 876 52Acquisition of a subsidiary 49 - - -Write off (1,053) (306) (451) (50) Allowance for credit losses no longer required (Note 28) (1,155) (714) (127) (573) Exchange differences 10 (25) - - At 31 December 12,979 12,681 8,480 8,182
Notes To The Financial Statements31 December 2011 (Cont’d)
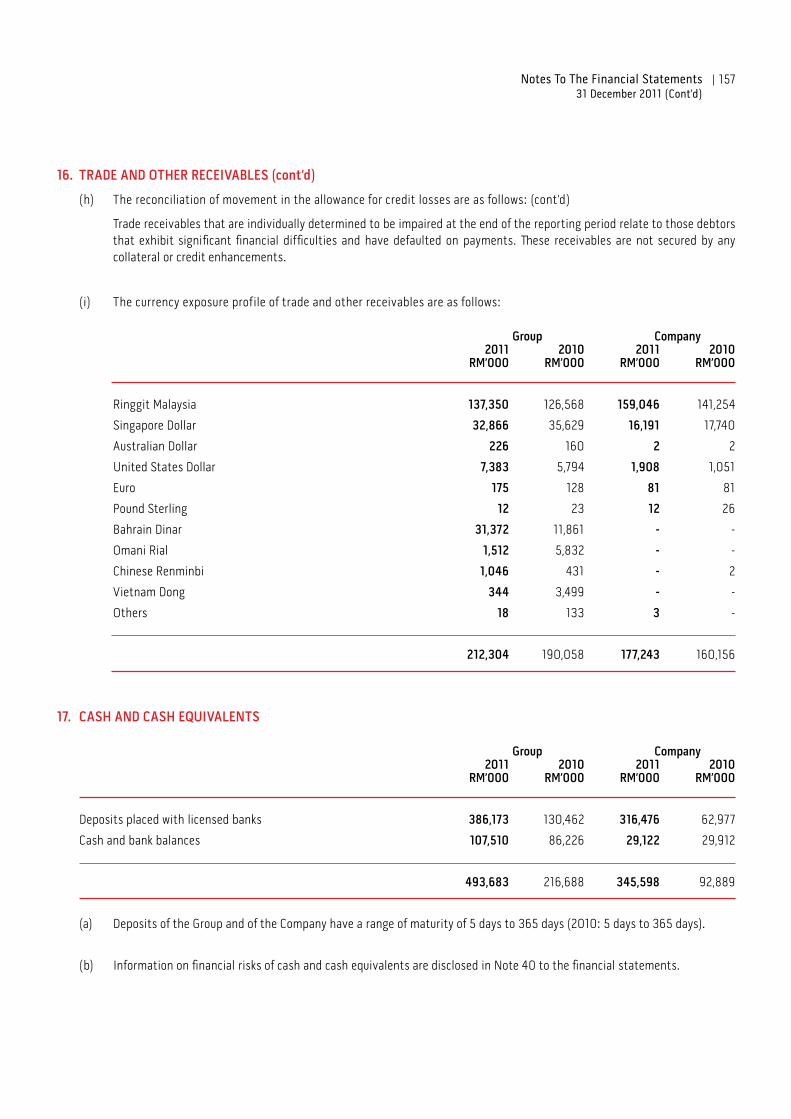
157| Notes To The Financial Statements 31 December 2011 (Cont’d)
16. TRADE AND OTHER RECEIVABLES (cont’d)
(h) The reconciliation of movement in the allowance for credit losses are as follows: (cont’d)
Trade receivables that are individually determined to be impaired at the end of the reporting period relate to those debtors that exhibit significant financial difficulties and have defaulted on payments. These receivables are not secured by any collateral or credit enhancements.
(i) The currency exposure profile of trade and other receivables are as follows:
Group Company 2011 2010 2011 2010 RM’000 RM’000 RM’000 RM’000
Ringgit Malaysia 137,350 126,568 159,046 141,254
Singapore Dollar 32,866 35,629 16,191 17,740
Australian Dollar 226 160 2 2
United States Dollar 7,383 5,794 1,908 1,051
Euro 175 128 81 81
Pound Sterling 12 23 12 26
Bahrain Dinar 31,372 11,861 - -
Omani Rial 1,512 5,832 - -
Chinese Renminbi 1,046 431 - 2
Vietnam Dong 344 3,499 - -
Others 18 133 3 -
212,304 190,058 177,243 160,156
17. CASH AND CASH EQUIVALENTS
Group Company 2011 2010 2011 2010 RM’000 RM’000 RM’000 RM’000
Deposits placed with licensed banks 386,173 130,462 316,476 62,977
Cash and bank balances 107,510 86,226 29,122 29,912
493,683 216,688 345,598 92,889
(a) Deposits of the Group and of the Company have a range of maturity of 5 days to 365 days (2010: 5 days to 365 days).
(b) Information on financial risks of cash and cash equivalents are disclosed in Note 40 to the financial statements.

158 |
17. CASH AND CASH EQUIVALENTS (cont’d)
(c) The currency exposure profile of cash and cash equivalents are as follows: Group Company 2011 2010 2011 2010 RM’000 RM’000 RM’000 RM’000
Ringgit Malaysia 391,958 130,226 345,538 92,803
Singapore Dollar 31,662 29,906 - 20
Australian Dollar 30,569 28,599 - -
United States Dollar 24,799 6,550 50 56
Pound Sterling 5 5 5 5
Euro 295 544 - -
Bahrain Dinar 13,304 19,758 - -
Omani Rial * 68 - -
Chinese Renminbi 780 414 5 5
Others 311 618 - -
493,683 216,688 345,598 92,889
* Less than RM1,000
18. NON-CURRENT ASSETS HELD FOR SALE
Group and Company 2011 2010 RM’000 RM’000
Reclassified from:
Leasehold land (Note 7) 29,729 17,673
Leasehold buildings (Note 7) - 2,889
Plant and buildings under construction (Note 7) 685 -
Investment property (Note 8) 2,004 3,558
32,418 24,120
The non-current assets held for sale in 2011 are in respect of a leasehold land, plant and buildings under construction and an investment property. The disposals have yet to be completed pending the fulfilment of certain Conditions Precedent stated in the Sale and Purchase Agreement.
The disposal of the non-current assets held for sale in 2010 was subsequently completed during the financial year.
Notes To The Financial Statements31 December 2011 (Cont’d)

159| Notes To The Financial Statements 31 December 2011 (Cont’d)
19. SHARE CAPITAL AND TREASURY SHARES Group and Company 2011 2010 Number Number of shares of shares ’000 RM’000 ’000 RM’000
Ordinary shares of RM1.00 each:
Authorised 1,000,000 1,000,000 1,000,000 1,000,000
Issued and fully paid 738,564 738,564 738,564 738,564
The owners of the parent are entitled to receive dividends as and when declared by the Company and are entitled to one vote per ordinary share at meetings of the Company. All ordinary shares rank pari passu with regard to the Company’s residual assets.
Treasury shares
The shareholders of the Company, at an Extraordinary General Meeting held on 18 May 2005, approved the Company ’s proposal to repurchase up to 10% of its own shares (“Share Buy-Back”). The authority granted by the shareholders has been renewed at each subsequent Annual General Meeting. The Directors of the Company are committed to enhance the value of the Company to its shareholders and believe that the Share Buy-Back is in the best interest of the Company and its shareholders.
In 2009, the Company repurchased a total of 70,200 ordinary shares of its issued shares listed on the Main Market of Bursa Malaysia Securities Berhad from the open market at an average price of RM3.18 per ordinary share. The total consideration paid was RM224,706, including transaction costs of RM1,205. The repurchase transactions were financed by internally generated funds and the shares repurchased were retained as treasury shares.
Of the total 738,563,602 issued and fully paid ordinary shares of RM1.00 each as at 31 December 2011, there are 70,200 ordinary shares of RM1.00 each with a cumulative total consideration amounting to RM224,706 held as treasury shares by the Company. The number of outstanding shares in issue after the Share Buy-Back is 738,493,402 ordinary shares of RM1.00 each as at 31 December 2011.
None of the treasury shares held were resold or cancelled during the financial year. Treasury shares have no rights to voting, dividends or participation in other distribution.

160 |
20. RESERVES Group Company 2011 2010 2011 2010 RM’000 RM’000 RM’000 RM’000
Non-distributable
Available-for-sale reserve 233 100 - -
Share option reserve 854 536 - -
Capital reserve - - 1,722 1,722
Foreign exchange translation reserve 23,972 20,721 - -
25,059 21,357 1,722 1,722
Distributable
Retained earnings 302,261 248,526 273,903 229,236
327,320 269,883 275,625 230,958
(a) Available-for-sale reserve
Gains or losses arising from financial assets classified as available-for-sale.
(b) Share option reserve
The Group’s share option reserve is in respect of the equity-settled options granted to employees of the Cityneon Group. This reserve is made up of the cumulative value of services received from the Cityneon Group’s employees recorded on grant date of share options.
(c) Capital reserve
The Company’s capital reserve represents the surplus on revaluation of certain leasehold land and building in 1983.
(d) Foreign exchange translation reserve
The foreign exchange translation reserve is used to record foreign currency exchange differences arising from the translation of the financial statements of foreign operations whose functional currencies are different from that of the Group’s presentation currency. It is also used to record the exchange differences arising from monetary items which form part of the Group’s net investment in foreign operations, where the monetary item is denominated in either the functional currency of the reporting entity or the foreign operation.
(e) Retained earnings
Effective 1 January 2008, the Company is given the option to make an irrevocable election to move to a single tier system or continue to use its tax credit under Section 108 of the Income Tax Act, 1967 for the purpose of dividend distribution until the tax credit is fully utilised or latest by 31 December 2013.
Dividend payments out of the Company’s retained earnings shall not be subject to any tax at the level of its shareholders. The Company has a balance in the Section 108 account to frank the distribution of dividends to its shareholders up to RM103,400 out of its retained earnings.
Notes To The Financial Statements31 December 2011 (Cont’d)
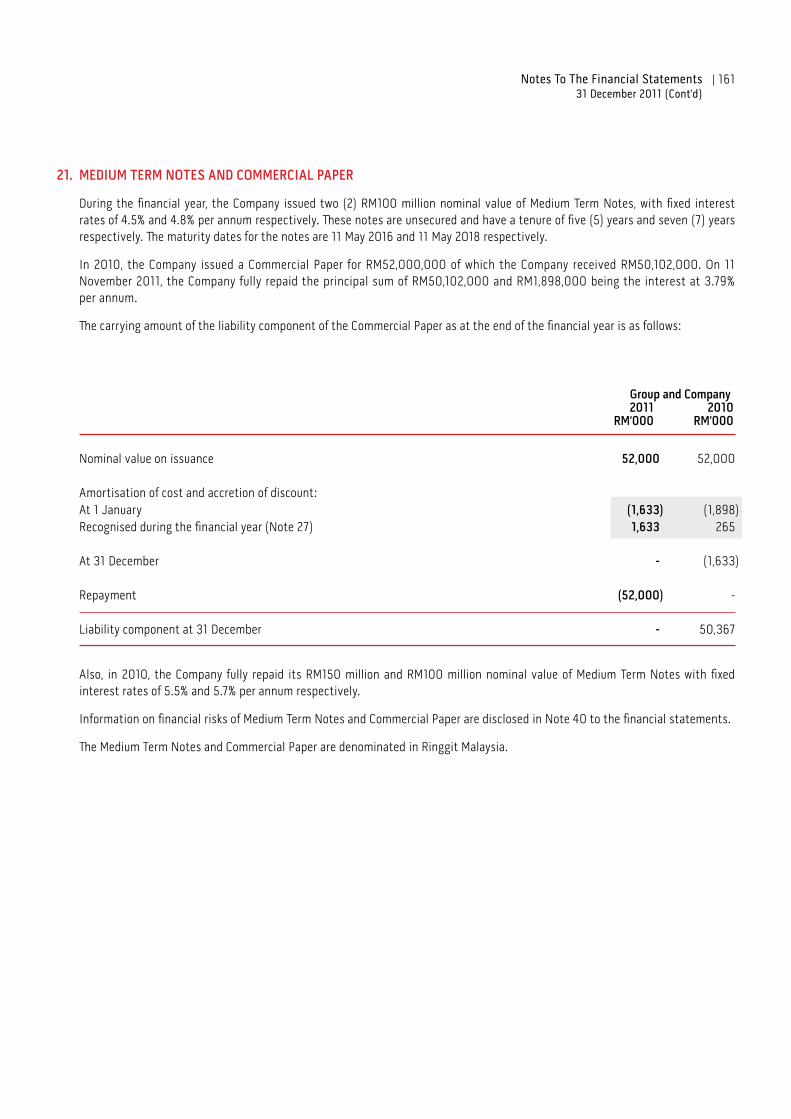
161| Notes To The Financial Statements 31 December 2011 (Cont’d)
21. MEDIUM TERM NOTES AND COMMERCIAL PAPER
During the financial year, the Company issued two (2) RM100 million nominal value of Medium Term Notes, with fixed interest rates of 4.5% and 4.8% per annum respectively. These notes are unsecured and have a tenure of five (5) years and seven (7) years respectively. The maturity dates for the notes are 11 May 2016 and 11 May 2018 respectively.
In 2010, the Company issued a Commercial Paper for RM52,000,000 of which the Company received RM50,102,000. On 11 November 2011, the Company fully repaid the principal sum of RM50,102,000 and RM1,898,000 being the interest at 3.79% per annum.
The carrying amount of the liability component of the Commercial Paper as at the end of the financial year is as follows:
Group and Company 2011 2010 RM’000 RM’000
Nominal value on issuance 52,000 52,000 Amortisation of cost and accretion of discount: At 1 January (1,633) (1,898) Recognised during the financial year (Note 27) 1,633 265 At 31 December - (1,633) Repayment (52,000) - Liability component at 31 December - 50,367
Also, in 2010, the Company fully repaid its RM150 million and RM100 million nominal value of Medium Term Notes with fixed interest rates of 5.5% and 5.7% per annum respectively.
Information on financial risks of Medium Term Notes and Commercial Paper are disclosed in Note 40 to the financial statements.
The Medium Term Notes and Commercial Paper are denominated in Ringgit Malaysia.

162 |
22. BORROWINGS Group 2011 2010
RM’000 RM’000
Current liabilities
Bank loans (secured) 54,298 1,735Hire purchase and finance lease liabilities (Note 23) 1,037 963 55,335 2,698
Non-current liabilities
Bank loans (secured) - 33,887Hire purchase and finance lease liabilities (Note 23) 7,194 8,179 7,194 42,066
Total borrowings
Bank loans (secured) 54,298 35,622Hire purchase and finance lease liabilities (Note 23) 8,231 9,142
62,529 44,764
(a) The borrowings are repayable over the following periods:
Year Carrying Within 1-2 2-5 Over 5 of amount 1 year years years years maturity RM’000 RM’000 RM’000 RM’000 RM’000
Group 2011
Bank loans (secured) 2014 54,298 50,177 2,473 1,648 -Hire purchase and finance lease liabilities 2019 8,231 1,037 1,037 3,522 2,635 62,529 51,214 3,510 5,170 2,635
Notes To The Financial Statements31 December 2011 (Cont’d)

163|
22. BORROWINGS (cont’d)
(a) The borrowings are repayable over the following periods: (cont’d)
Year Carrying Within 1-2 2-5 Over 5 of amount 1 year years years years maturity RM’000 RM’000 RM’000 RM’000 RM’000
Group 2010
Bank loan (secured) 2012 35,622 1,735 33,887 - -Hire purchase and finance lease liabilities 2019 9,142 963 1,001 3,303 3,875 44,764 2,698 34,888 3,303 3,875
(b) Included in the bank loans of the Group is long term bank loan amounting to RM6,593,000 (2010: RM Nil) which contains a repayment on demand clause which gives the lender the unconditional right to call the loan at any time. The long term bank loan has been classified as current liabilities.
(c) The currency exposure profiles of borrowings are as follows:
Group 2011 2010
RM’000 RM’000
Ringgit Malaysia 7,320 8,112
Singapore Dollar 55,209 36,652
62,529 44,764
(d) One of the secured bank loans of RM34,615,000 (2010: RM33,887,000) of the Group is secured by a negative pledge over all the present and future assets of Laviani Pte. Ltd., including quoted shares of Cityneon Holdings Limited held by Laviani Pte. Ltd.. The Company also provides a guarantee and indemnity of SGD14,000,000 covering interest accruing and all monies payable under the facility.
The other secured bank loans of RM19,683,000 (2010: RM1,735,000) of the Group are guaranteed by its subsidiaries.
(e) Information on financial risks of borrowings are disclosed in Note 40 to the financial statements.
Notes To The Financial Statements 31 December 2011 (Cont’d)
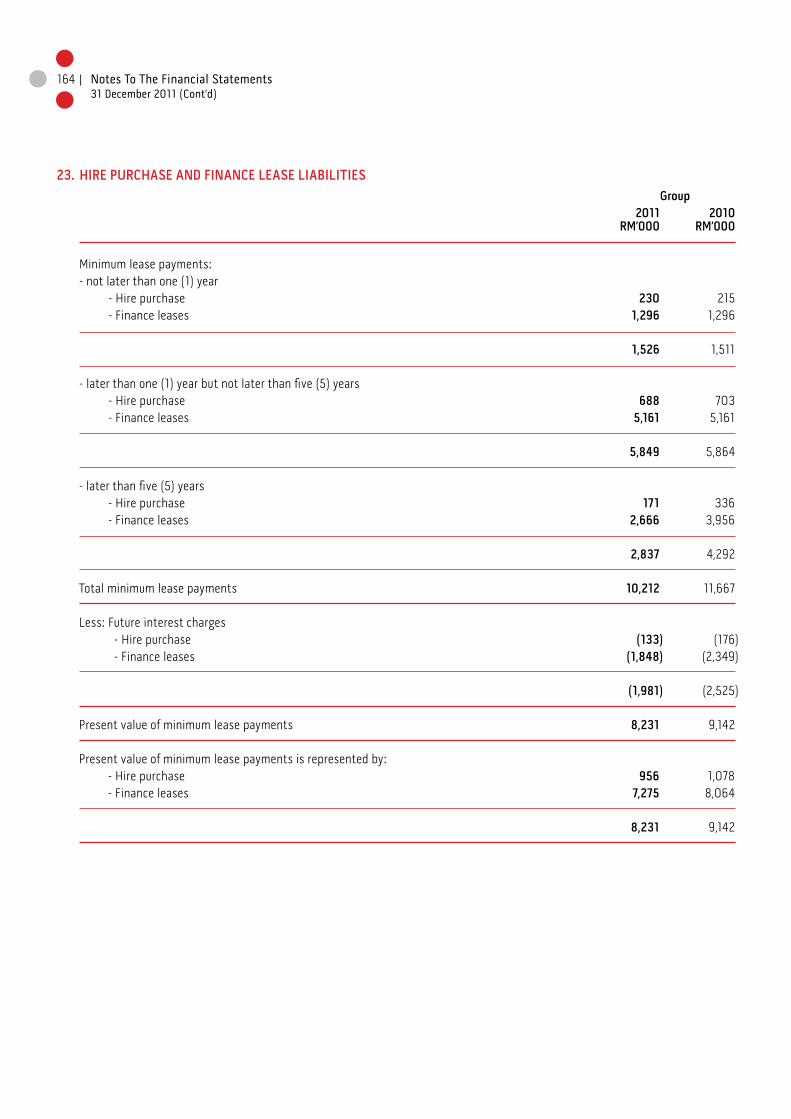
164 |
23. HIRE PURCHASE AND FINANCE LEASE LIABILITIES Group 2011 2010
RM’000 RM’000
Minimum lease payments: - not later than one (1) year - Hire purchase 230 215 - Finance leases 1,296 1,296 1,526 1,511
- later than one (1) year but not later than five (5) years - Hire purchase 688 703 - Finance leases 5,161 5,161 5,849 5,864 - later than five (5) years - Hire purchase 171 336 - Finance leases 2,666 3,956 2,837 4,292 Total minimum lease payments 10,212 11,667 Less: Future interest charges - Hire purchase (133) (176) - Finance leases (1,848) (2,349) (1,981) (2,525) Present value of minimum lease payments 8,231 9,142 Present value of minimum lease payments is represented by: - Hire purchase 956 1,078 - Finance leases 7,275 8,064 8,231 9,142
Notes To The Financial Statements31 December 2011 (Cont’d)

165| Notes To The Financial Statements 31 December 2011 (Cont’d)
23. HIRE PURCHASE AND FINANCE LEASE LIABILITIES (cont’d) Group 2011 2010
RM’000 RM’000
Repayable as follows:
Current liabilities
- not later than one (1) year
- Hire purchase 190 168
- Finance leases 847 795
Total current liabilities 1,037 963
Non-current liabilities
- later than one (1) year and not later than five (5) years
- Hire purchase 599 589
- Finance leases 3,960 3,715
4,559 4,304
- later than five (5) years
- Hire purchase 167 320
- Finance leases 2,468 3,555
2,635 3,875
Total non-current liabilities 7,194 8,179
8,231 9,142
Lease terms range from one (1) to ten (10) years with options to purchase at the end of the lease term. Lease terms do not contain restrictions concerning dividends or additional debt. However, certain lease terms entered into by subsidiaries include restriction on further leasing.
Information on financial risks of hire purchase and finance lease liabilities are disclosed in Note 40 to the financial statements.

166 |
24. TRADE AND OTHER PAYABLES Group Company 2011 2010 2011 2010 RM’000 RM’000 RM’000 RM’000
Trade payables
Third parties 20,734 15,931 2,143 1,812
Subsidiaries - - 2,106 3,582
Amount due to contract customers (Note 16(b)) 3,723 1,711 - -
24,457 17,642 4,249 5,394
Other payables
Amounts owing to subsidiaries - - 55,784 51,084
Other payables 19,031 16,765 10,006 7,369
Deposits from agents, subscribers and customers 4,517 3,992 4,262 3,769
Accruals 80,332 96,868 65,969 65,113
Provision 4,094 3,588 2,562 2,666
107,974 121,213 138,583 130,001
132,431 138,855 142,832 135,395
(a) Trade payables are non-interest bearing and the normal trade credit terms granted to the Group and the Company range from one (1) month to four (4) months (2010: 1 to 4 months).
(b) Amounts owing to subsidiaries are unsecured, interest-free and payable upon demand in cash and cash equivalents, except for RM52,250,000 (2010: RM Nil) which is repayable by 31 December 2012 and is subject to interest at 7.33% per annum.
(c) Included in other payables of the Group are amounts owing to Directors of certain subsidiaries amounting to RM3,737,000 (2010: RM424,000) and dividend payable to the shareholders of a subsidiary amounting to RM Nil (2010: RM1,027,000).
(d) Information on financial risks of trade and other payables are disclosed in Note 40 to the financial statements.
(e) Included in the accruals of the Group and the Company are payroll related accruals amounting to RM52,851,000 (2010: RM59,026,000) and RM44,906,000 (2010: RM45,279,000) respectively.
(f) The provision is in respect of unutilised staff leave carried forward which is detailed as follows: Group Company 2011 2010 2011 2010 RM’000 RM’000 RM’000 RM’000
Balance as at 1 January 3,588 3,503 2,666 2,517
Provision during the financial year 1,007 692 - 347
Utilised during the financial year (469) (436) (104) (198)
Overprovision in prior years (64) (151) - -
Exchange differences 32 (20) - -
Balance as at 31 December 4,094 3,588 2,562 2,666
Notes To The Financial Statements31 December 2011 (Cont’d)

167| Notes To The Financial Statements 31 December 2011 (Cont’d)
24. TRADE AND OTHER PAYABLES (cont’d)
(g) The currency exposure profile of trade and other payables are as follows: Group Company 2011 2010 2011 2010 RM’000 RM’000 RM’000 RM’000
Ringgit Malaysia 98,583 91,183 88,494 85,711
Singapore Dollar 20,345 30,827 1,901 1,186
Australian Dollar 71 82 52,256 48,444
Hong Kong Dollar - - 103 -
United States Dollar 2,365 2,222 60 54
Euro 2,465 27 18 *
Bahrain Dinar 6,650 12,536 - -
Chinese Renminbi 1,186 1,397 - -
Others 766 581 - -
132,431 138,855 142,832 135,395
* Less than RM1,000
25. REVENUE Group Company 2011 2010 2011 2010 RM’000 RM’000 RM’000 RM’000
Publication, printing and distribution of newspapers and magazines 819,228 800,468 820,002 802,279
Broadcasting 57,312 45,133 - -
Event management, exhibition services and thematic 183,073 212,092 - -
Subscription and distribution 2,102 - - -
Others 5,953 4,007 - -
1,067,668 1,061,700 820,002 802,279
26. COST OF SALES AND SERVICES Group Company 2011 2010 2011 2010 RM’000 RM’000 RM’000 RM’000
Publication, printing and distribution of newspapers and magazines 271,032 266,305 271,032 266,305
Event management, exhibition services and thematic 131,508 144,956 - -
Subscription and distribution 554 - - -
Others 1,788 1,180 - -
404,882 412,441 271,032 266,305

168 |
27. FINANCE COSTS Group Company 2011 2010 2011 2010 RM’000 RM’000 RM’000 RM’000
Interest expenses:
- Medium Term Note 5,988 5,059 5,988 5,059
- Commercial Paper (Note 21) 1,633 265 1,633 265
- Finance leases 550 607 - -
- Bank loans 851 970 - -
- Advances from subsidiary - - 3,569 -
- Others 22 * - -
9,044 6,901 11,190 5,324
* Less than RM1,000
28. PROFIT BEFORE TAX Profit before tax is arrived at: Group Company 2011 2010 2011 2010 Note RM’000 RM’000 RM’000 RM’000
After charging:
Auditors’ remuneration:
- Statutory 748 587 176 162
- Non-statutory 53 58 10 58
Amortisation of radio licence included in
administrative and other expenses 9(b) 1,312 425 - -
Amortisation of television programmes rights 9(c) 547 - - -
Amortisation of club membership 9(d) 269 269 - -
Allowance for credit losses:
- third parties 16(h) 2,447 2,023 876 52
- subsidiaries - - 708 2,446
Bad debts written off 5 170 2 -
Depreciation of property, plant and equipment 7 46,466 47,625 40,058 42,137
Depreciation of investment properties 8 375 610 375 610
Directors’ remuneration payable to
- Directors of the Company
- fees 698 550 698 550
- other emoluments 14,167 12,783 14,167 12,783
- Directors of subsidiaries
- fees 859 307 - -
- other emoluments 6,645 8,756 - -
Notes To The Financial Statements31 December 2011 (Cont’d)

169| Notes To The Financial Statements 31 December 2011 (Cont’d)
28. PROFIT BEFORE TAX (cont’d) Profit before tax is arrived at: (cont’d) Group Company 2011 2010 2011 2010 Note RM’000 RM’000 RM’000 RM’000
After charging: (cont’d)
Foreign exchange losses- realised 740 1,913 - 134
- unrealised - - 1,059 2,424
Impairment losses included in administrative and other expenses on:- goodwill 9(a) - 602 - -
- investment in an associate 11 2,890 - 3,577 2,095
- investment in a jointly controlled entity 12 64 - 3,924 8,680
Loss on disposal of property, plant and equipment 578 15 569 -
Loss on disposal of investment in a jointly controlled entity - 42 - 64
Operating lease rental 122 124 122 124
Property, plant and equipment written off 1,197 1,254 275 1,197
Provision for unutilised staff leave 24(f) 943 541 - 347
Rental of premises 5,196 5,186 681 748
Rental of warehouse 1,911 - - -
Retirement benefits paid 2,340 - 2,340 -
And crediting:
Allowance for credit losses no longer required 16(h) 1,155 714 127 573
Bad debts recovered 250 - - -
Dividend income - - - 39,455
Fair value gain on other investments 307 1,486 307 1,486
Foreign exchange gain
- realised 195 - 195 -
Gain on disposal of: - property, plant and equipment 6 179 - 179
- non-current assets held for sale 1,383 - 1,383 -
- investment properties 162 - 162 -
Interest income 11,283 13,533 8,528 7,742
Investment income 2,772 3,741 2,772 3,741
Rental income: - investment properties 689 1,983 689 1,983
- others 241 339 - -
The estimated monetary value of benefits-in-kind not included in the above received by Directors of the Company was RM1,142,000 (2010: RM1,019,000) for the Group and the Company.
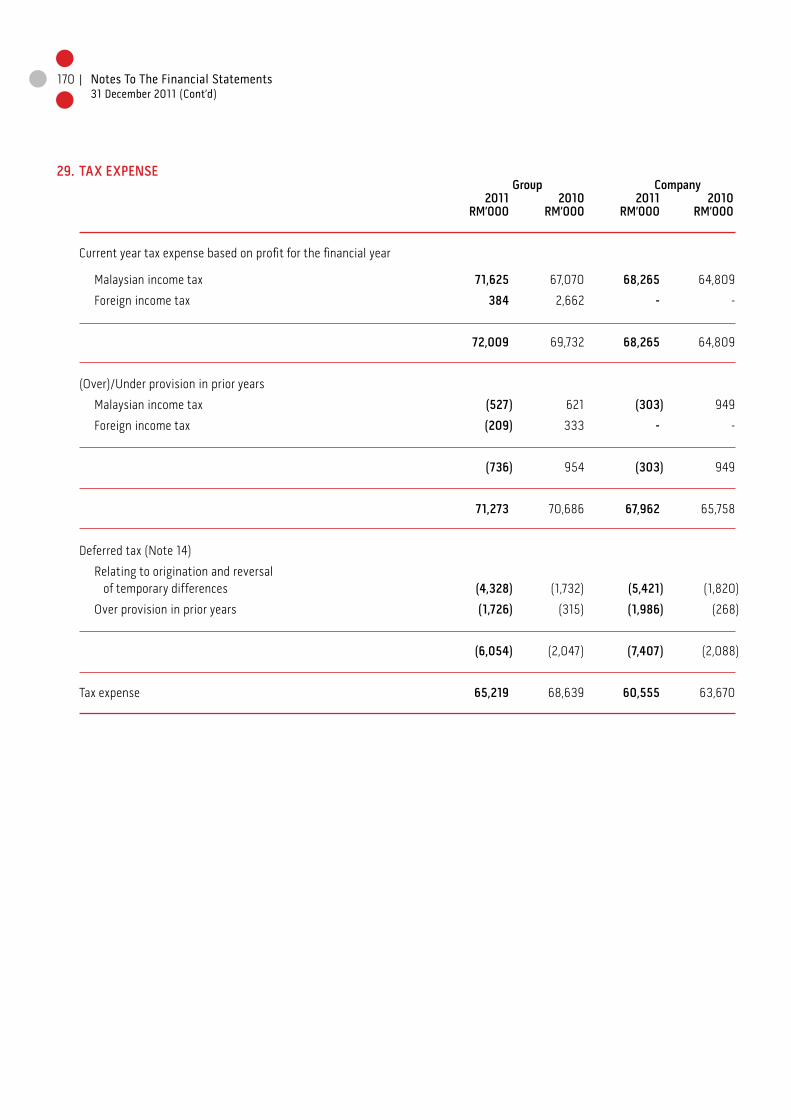
170 |
29. TAX EXPENSE Group Company 2011 2010 2011 2010 RM’000 RM’000 RM’000 RM’000
Current year tax expense based on profit for the financial year
Malaysian income tax 71,625 67,070 68,265 64,809
Foreign income tax 384 2,662 - -
72,009 69,732 68,265 64,809
(Over)/Under provision in prior years
Malaysian income tax (527) 621 (303) 949
Foreign income tax (209) 333 - -
(736) 954 (303) 949
71,273 70,686 67,962 65,758
Deferred tax (Note 14)
Relating to origination and reversal of temporary differences (4,328) (1,732) (5,421) (1,820)
Over provision in prior years (1,726) (315) (1,986) (268)
(6,054) (2,047) (7,407) (2,088)
Tax expense 65,219 68,639 60,555 63,670
Notes To The Financial Statements31 December 2011 (Cont’d)

171| Notes To The Financial Statements 31 December 2011 (Cont’d)
29. TAX EXPENSE (cont’d) The numerical reconciliation between the average effective tax and the tax based on applicable tax rate are as follows:
Group Company 2011 2010 2011 2010 RM’000 RM’000 RM’000 RM’000
Profit before tax 250,531 258,807 238,152 270,781 Taxation at Malaysian statutory rate of 25% (2010: 25%) 62,633 64,702 59,538 67,695Expenses not deductible for tax purposes 5,872 5,699 4,449 6,093Income not subject to tax (1,209) (1,403) (1,143) (10,799) Deferred tax assets not recognised 1,930 1,200 - -Tax incentives (346) (14) - -Utilisation of previously unrecognised deferred tax assets (56) (18) - -Difference in tax rates in foreign jurisdiction (1,143) (2,166) - - 67,681 68,000 62,844 62,989
(Over)/Under provision in prior years - corporate tax (736) 954 (303) 949 - deferred tax (1,726) (315) (1,986) (268) Tax expense 65,219 68,639 60,555 63,670
The Malaysian income tax is calculated at the statutory tax rate of 25% (2010: 25%) of the estimated taxable profits for the fiscal year.
Tax expense for other taxation authorities are calculated at the rates prevailing in those respective jurisdictions.
30. EARNINGS PER ORDINARY SHAREBasic earnings per ordinary share
The basic earnings per ordinary share for the financial year is calculated by dividing the profit for the financial year attributable to equity holders of the parent by the weighted average number of ordinary shares outstanding during the financial year.
2011 2010
Profit attributable to equity holders of the parent (RM’000) 186,665 184,941 Weighted average number of ordinary shares in issue (’000) 738,564 738,564Weighted average number of treasury shares held (’000) (70) (70) Adjusted weighted average number of ordinary shares applicable to basic earnings per share (’000) 738,494 738,494 Basic earnings per ordinary share (sen) 25.28 25.04
Diluted earnings per ordinary share
Diluted earnings per ordinary share is not presented as there is no dilutive potential ordinary shares.
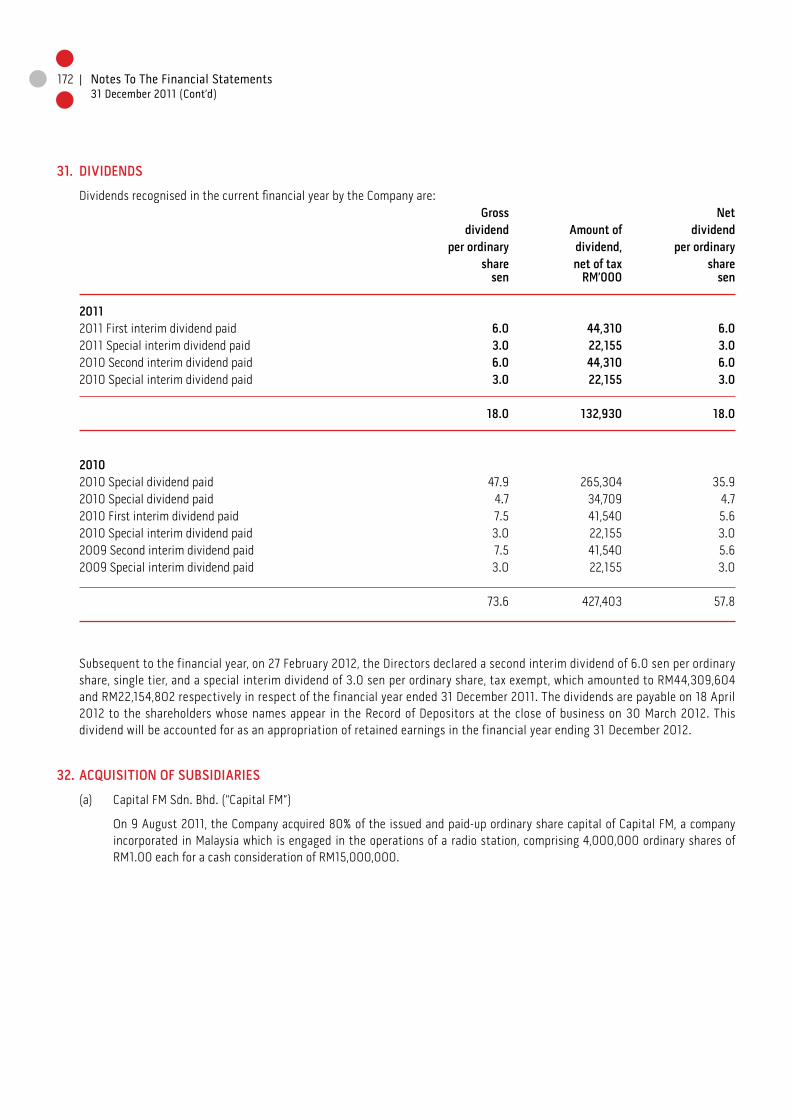
172 |
31. DIVIDENDS
Dividends recognised in the current financial year by the Company are: Gross Net dividend Amount of dividend per ordinary dividend, per ordinary share net of tax share sen RM’000 sen
20112011 First interim dividend paid 6.0 44,310 6.02011 Special interim dividend paid 3.0 22,155 3.02010 Second interim dividend paid 6.0 44,310 6.02010 Special interim dividend paid 3.0 22,155 3.0 18.0 132,930 18.0
2010 2010 Special dividend paid 47.9 265,304 35.92010 Special dividend paid 4.7 34,709 4.72010 First interim dividend paid 7.5 41,540 5.62010 Special interim dividend paid 3.0 22,155 3.02009 Second interim dividend paid 7.5 41,540 5.62009 Special interim dividend paid 3.0 22,155 3.0 73.6 427,403 57.8
Subsequent to the financial year, on 27 February 2012, the Directors declared a second interim dividend of 6.0 sen per ordinary share, single tier, and a special interim dividend of 3.0 sen per ordinary share, tax exempt, which amounted to RM44,309,604 and RM22,154,802 respectively in respect of the financial year ended 31 December 2011. The dividends are payable on 18 April 2012 to the shareholders whose names appear in the Record of Depositors at the close of business on 30 March 2012. This dividend will be accounted for as an appropriation of retained earnings in the financial year ending 31 December 2012.
32. ACQUISITION OF SUBSIDIARIES
(a) Capital FM Sdn. Bhd. (“Capital FM”)
On 9 August 2011, the Company acquired 80% of the issued and paid-up ordinary share capital of Capital FM, a company incorporated in Malaysia which is engaged in the operations of a radio station, comprising 4,000,000 ordinary shares of RM1.00 each for a cash consideration of RM15,000,000.
Notes To The Financial Statements31 December 2011 (Cont’d)
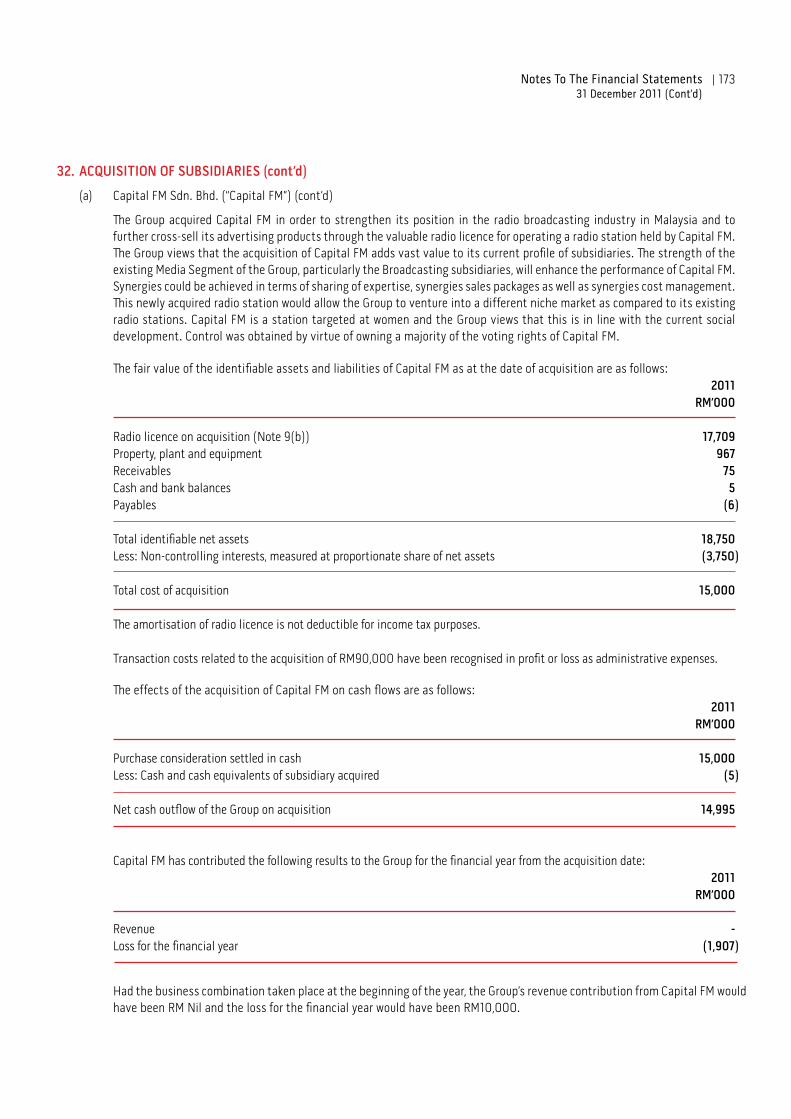
173| Notes To The Financial Statements 31 December 2011 (Cont’d)
32. ACQUISITION OF SUBSIDIARIES (cont’d)
(a) Capital FM Sdn. Bhd. (“Capital FM”) (cont’d)
The Group acquired Capital FM in order to strengthen its position in the radio broadcasting industry in Malaysia and to further cross-sell its advertising products through the valuable radio licence for operating a radio station held by Capital FM. The Group views that the acquisition of Capital FM adds vast value to its current profile of subsidiaries. The strength of the existing Media Segment of the Group, particularly the Broadcasting subsidiaries, will enhance the performance of Capital FM. Synergies could be achieved in terms of sharing of expertise, synergies sales packages as well as synergies cost management. This newly acquired radio station would allow the Group to venture into a different niche market as compared to its existing radio stations. Capital FM is a station targeted at women and the Group views that this is in line with the current social development. Control was obtained by virtue of owning a majority of the voting rights of Capital FM.
The fair value of the identifiable assets and liabilities of Capital FM as at the date of acquisition are as follows: 2011 RM’000
Radio licence on acquisition (Note 9(b)) 17,709Property, plant and equipment 967Receivables 75Cash and bank balances 5Payables (6) Total identifiable net assets 18,750Less: Non-controlling interests, measured at proportionate share of net assets (3,750) Total cost of acquisition 15,000 The amortisation of radio licence is not deductible for income tax purposes.
Transaction costs related to the acquisition of RM90,000 have been recognised in profit or loss as administrative expenses.
The effects of the acquisition of Capital FM on cash flows are as follows: 2011 RM’000
Purchase consideration settled in cash 15,000Less: Cash and cash equivalents of subsidiary acquired (5)
Net cash outflow of the Group on acquisition 14,995
Capital FM has contributed the following results to the Group for the financial year from the acquisition date: 2011 RM’000
Revenue -Loss for the financial year (1,907)
Had the business combination taken place at the beginning of the year, the Group’s revenue contribution from Capital FM would have been RM Nil and the loss for the financial year would have been RM10,000.

174 | Notes To The Financial Statements31 December 2011 (Cont’d)
32. ACQUISITION OF SUBSIDIARIES (cont’d)
(b) Li TV Holdings Limited (“Li TV”)
On 22 August 2011, the Company acquired 51% of the enlarged issued and paid-up ordinary share capital of Li TV, an investment holding company incorporated in Hong Kong with its subsidiaries principally engaged in the business of provision of technical operation and broadcasting support for high definition lifestyle television channel named “LI”, that broadcasts pan-regionally across Asia, comprising 3,400,000 ordinary shares of USD1.00 each for a cash consideration of RM35,000,000.
The Group acquired Li TV in order to pave the way towards multi-media offerings as well as to create more opportunities to cross-sell its advertising products. Control was obtained by virtue of owning a majority of the voting rights of Li TV.
The fair value of the identifiable assets and liabilities of Li TV as at the date of acquisition are as follows: 2011 RM’000
Property, plant and equipment 130Television programmes rights (Note 9(c)) 2,254Inventories 493Receivables 1,038Cash and bank balances 30,675Payables (13,717) Total identifiable net assets 20,873Less: Non-controlling interests, measured at proportionate share of net assets (10,228) Goodwill arising from acquisition (Note 9(a)) 24,355 Total cost of acquisition 35,000
Goodwill of RM24,355,000 is derived from the synergies between the principal activities of the subsidiaries acquired and the existing Group. These subsidiaries are engaged in the provision of technical operations and broadcasting support for the high definition television channel, operation of pay or cable television channel, distribution of films and sales of television channel airtime. The principal activities of these newly acquired subsidiaries would be able to bring operational synergies to the Group and further enhance its significance in the Media Industry. It enables the Group to offer more value added service to its existing customers and provide better opportunity to tap on new customers. By having extensive media coverage, the management trusts that this would help the Group in achieving improved financial performance. The existing expertise of the Group in Print and New Media Segment as well as the expertise in Broadcasting Segment would also help in providing publicity and helps the performance of these newly acquired subsidiaries. The management believes that the acquisition would benefit both way. The Group’s Media strength would help unleash the potential of the subsidiaries in the media industry. Meanwhile, the inclusion of these subsidiaries to the Group enables the Group to offer more media coverage and achieve a higher degree of media market penetration.
Transaction costs related to the acquisition of RM176,000 have been recognised in profit or loss as administrative expenses.

175| Notes To The Financial Statements 31 December 2011 (Cont’d)
32. ACQUISITION OF SUBSIDIARIES (cont’d)
(b) Li TV Holdings Limited (“Li TV”) (cont’d)
(c) Leaderonomics Media Sdn. Bhd. (“LMSB”)
On 29 December 2011, Leaderonomics Sdn. Bhd., a 51% owned subsidiary of the Company, incorporated LMSB, a company with an authorised and paid-up share capital of 2 ordinary shares of RM1.00 each. The total cash consideration paid was RM2.00.
Had the business combination taken place at the beginning of the year, the Group’s revenue contribution from Li TV would have been RM3,752,000 and the loss for the financial year would have been RM6,287,000.
The effects of the acquisition of Li TV on cash flows are as follows: 2011 RM’000
Purchase consideration settled in cash 35,000Cash and cash equivalents of subsidiaries acquired (30,675) Net cash outflow of the Group on acquisition 4,325
Li TV has contributed the following results to the Group for the financial year from the acquisition date:
2011 RM’000
Revenue 2,102Loss for the financial year (2,371)
The fair value of the identifiable assets and liabilities of LMSB as at the date of incorporation are as follows: 2011 RM’000
Cash/Total cost of acquisition *
* represents RM2.00
The effects of the incorporation of LMSB on cash flows are as follows: 2011 RM’000
Incorporation expenses settled in cash *Cash and cash equivalents of subsidiary incorporated * Net cash outflow of the Group on incorporation -
* represents RM2.00

176 | Notes To The Financial Statements31 December 2011 (Cont’d)
32. ACQUISITION OF SUBSIDIARIES (cont’d)
(c) Leaderonomics Media Sdn. Bhd. (“LMSB”) (cont’d)
LMSB has contributed the following results to the Group for the financial year from the incorporation date: 2011 RM’000
Revenue -Loss for the financial year (7)
(d) Acacia Forecast (M) Sdn. Bhd. (“AFSB”)
In 2010, the Company acquired the entire issued and paid-up ordinary share capital of AFSB, a company incorporated in Malaysia, which comprised of 2 ordinary shares of RM1.00 each for a cash consideration of RM2.00.
In 2010, the acquisition of AFSB has contributed the following results to the Group: 2010 RM’000
Revenue -Loss for the financial year (2)
If the acquisition had occurred on 1 January 2010, AFSB’s contribution to the Group’s result would have been the same as above.
The summary of the effects on acquisition of the subsidiary in 2010 was as follows: 2010 Fair value Acquiree’s recognised carrying on acquisition amount RM’000 RM’000
Receivables 2 2Cash * * Total cost of acquisition 2 2
The cash outflow on acquisition is as follows: 2010 RM’000
Purchase consideration settled in cash 2Cash and cash equivalents of subsidiary acquired * Net cash outflow of the Group on acquisition 2
* represents RM2.00

177|
33. DISPOSAL OF A JOINTLY CONTROLLED ENTITY
In 2010, the Company disposed of its entire 35% equity interest in one of its jointly controlled entities, LLL-Lifelong Learning Network Sdn. Bhd. for a cash consideration of RM21,000. The loss on disposal of the said jointly controlled entity is as follows:
34. RELATED PARTIES TRANSACTIONS
(a) Identities of related parties
Parties are considered to be related to the Group if the Group has the ability, directly or indirectly, to control the party or exercise significant influence over the party in making financial and operating decisions, or vice versa, or where the Group and the party are subject to common control or common significant influence. Related parties may be individuals or other entities.
The Company has controlling related party relationship with its direct and indirect subsidiaries.
Related parties of the Group include:
(i) Direct and indirect subsidiaries as disclosed in Note 10 to the financial statements;
(ii) Associate as disclosed in Note 11 to the financial statements;
(iii) Jointly controlled entity as disclosed in Note 12 to the financial statements;
(iv) Companies in which certain Directors have financial interests; and
(v) Key management personnel who are defined as those persons having authority and responsibility for planning, directing and controlling the activities of the Group either directly or indirectly. The key management personnel include all the Directors of the Company, and certain members of the senior management of the Group.
Notes To The Financial Statements 31 December 2011 (Cont’d)
2010Group RM’000
Cost of investment 350Share of post acquisition reserves (287)
63Proceeds from disposal (21) Loss on disposal 42
2010Company RM’000
Cost of investment 350Impairment loss (265)
85Proceeds from disposal (21) Loss on disposal 64

178 | Notes To The Financial Statements31 December 2011 (Cont’d)
34. RELATED PARTIES TRANSACTIONS (cont’d)
(b) In addition to the transactions detailed elsewhere in the financial statements, the Group and the Company had the following transactions with related parties during the financial year:
Group Company 2011 2010 2011 2010 RM’000 RM’000 RM’000 RM’000
Subsidiaries
Sales of advertisement space - - 773 1,812
Purchase of airtime - - 466 2,607
Advertisement commission paid/payable - - 1,447 1,637
Purchase of property, plant and equipment - - 578 2
Event fees - - 351 781
Disposal of property, plant and equipment - - 8 6
Training fees paid/payable - - 871 496
Interest received/receivable - - 353 477
Management fees - - 305 285
Jointly controlled entity
Sales of advertisement space - 1 - 1
Group Company 2011 2010 2011 2010 RM’000 RM’000 RM’000 RM’000
Company in which certain Director has financial interests Sales of advertisement space - 1,996 - 1,996
The related party transactions described above were carried out on terms and conditions not materially different from those obtainable from transactions with unrelated parties.
Balances of the above transactions with subsidiaries are as disclosed in Notes 16 and 24 to the financial statements.
(c) Compensation of key management personnel
Key management personnel are those persons having the authority and responsibility for planning, directing and controlling the activities of the entity, directly and indirectly, including any director (whether executive or otherwise) of the Group.

179| Notes To The Financial Statements 31 December 2011 (Cont’d)
34. RELATED PARTIES TRANSACTIONS (cont’d)(c) Compensation of key management personnel (cont’d)
The remuneration of the Directors and other key management personnel during the financial year was as follows:
Group and Company 2011 2010 RM’000 RM’000
Short term employee benefits 14,429 13,437
Contributions to defined contribution plans 1,580 1,507
Other long term employee benefits 2,340 -
18,349 14,944
35. CONTINGENT LIABILITIES
Group
There are several libel suits, which involve claims against the Group and the Company of which the outcome and probable compensation, if any, are currently indeterminable. However, after consulting with their legal counsel for litigation cases and internal and external experts to the Group and the Company for matters in the ordinary course of the business, the Directors and the management do not expect the amounts of liabilities, if any, to be material to the financial statements.
The subsidiary, Cityneon Group, has given tender bonds and guarantees through banks to its landlord for office rental deposit amounting to RM1,489,000 (2010: RM1,383,000) and to its customers and suppliers for the tender of projects, guarantee on performance and usage of exhibition venues amounting to RM24,089,000 (2010: RM14,914,000). The tender bonds and guarantees are secured by bank guarantees amounting to RM694,000 (2010: RM1,746,000).
36. COMMITMENTS
(a) Operating lease commitments
The Group as a lesseeComputer equipment and office buildings under various operating leases in 2011 and 2010 are as follows:
Group 2011 2010 RM’000 RM’000
Not later than one (1) year 3,247 2,242
Later than one (1) year and not later than five (5) years 10,890 8,609
14,137 10,851

180 | Notes To The Financial Statements31 December 2011 (Cont’d)
36. COMMITMENTS (cont’d)
(b) Capital commitments Group Company 2011 2010 2011 2010 RM’000 RM’000 RM’000 RM’000
Authorised capital expenditure not provided
for in the financial statements
- contracted 11,342 12,422 11,342 12,422
- not contracted 47,947 7,726 47,947 7,726
59,289 20,148 59,289 20,148
Analysed as follows:
- Building - 1,296 - 1,296
- Plant and equipment 47,947 8,852 47,947 8,852
- Investment 11,342 10,000 11,342 10,000
59,289 20,148 59,289 20,148
37. EMPLOYEE BENEFITS Group Company 2011 2010 2011 2010 RM’000 RM’000 RM’000 RM’000
Salaries and wages 197,660 183,088 138,619 133,329Defined contribution retirement plans 23,422 21,430 18,461 17,279Others 25,116 18,794 22,636 17,151 246,198 223,312 179,716 167,759
Included in employee benefits of the Group and of the Company are Executive Directors’ remuneration amounting to RM20,812,000 (2010: RM21,539,000) and RM14,167,000 (2010: RM12,783,000) respectively.

181| Notes To The Financial Statements 31 December 2011 (Cont’d)
38. OPERATING SEGMENTS
Star Publications (Malaysia) Berhad and its subsidiaries in Malaysia are principally engaged in publication of print and electronic media while its subsidiaries in Singapore are principally engaged in the provision of event organising management and provision of design, build and construction of exhibition related services and its subsidiaries in Hong Kong are principally engaged in the provision of technical operations and broadcasting support for the high definition television channel, operation of pay or cable television channel, distribution of films and sales of television channel airtime.
The Group has arrived at four (4) reportable segments that are organised and managed separately according to the nature of products and services, specific expertise and technologies requirements, which requires different business and marketing strategies. The reportable segments are summarised as follows:
(i) Print and new media
Publication, printing and distribution of newspapers and magazines and advertising in print and electronic media.
(ii) Broadcasting
Operations of wireless broadcasting stations.
(iii) Event, exhibition, interior and thematic
Provision of event organising management, provision of design, build and construction of exhibitions, landscapes, water features, pavilions, thematic leisure and entertainment outlets, including rental of reuseable modules, furnishings and furnitures.
(iv) Television channel
Provision of technical operations and broadcasting support for the high definition television channel, operation of pay or cable television channel, distribution of films and sales of television channel airtime.
Other operating segments that do not constitute reportable segments comprise operations related to the provision of human capital development including training and consultancy, investment holding and investment of assets held.
The accounting policies of operating segments are the same as those described in the summary of significant accounting policies.
The Group evaluates performance on the basis of profit or loss from operations before tax not including non-recurring losses, such as restructuring costs and goodwill impairment, and also excluding the effects of share-based payments and retirement benefit obligations.
Inter-segment revenue is priced along the same lines as sales to external customers and is eliminated in the consolidated financial statements. These policies have been applied consistently throughout the current and previous financial years.

182 |
38. OPERATING SEGMENTS (cont’d)
The following table provides an analysis of the Group’s revenue, results, assets, liabilities and other information by business segments:
Event, exhibition, interior Print and and Television new media Broadcasting thematic channel Others Elimination Consolidated2011 RM’000 RM’000 RM’000 RM’000 RM’000 RM’000 RM’000 Revenue Sales to external customer 821,619 57,312 183,073 2,102 3,562 - 1,067,668Inter-segment sales 2,489 465 6,102 - 871 (9,927) - Total revenue 824,108 57,777 189,175 2,102 4,433 (9,927) 1,067,668 Results Segment results 244,612 8,769 203 (2,371) (1,150) - 250,063Finance costs 7,621 (504) (205) - (714) - (9,044) Interest income 8,175 757 439 - 1,912 - 11,283Investment income 2,772 - - - - - 2,772Share of loss in an associate (687) - - - - - (687) Share of loss in a jointly controlled entity (3,856) - - - - - (3,856) Profit before tax 250,531Tax expense (65,219) Profit for the financial year 185,312 Assets Segment assets 1,191,180 114,901 162,862 49,991 52,070 - 1,571,004Investment in an associate 6,567 - - - - - 6,567Investment in a jointly controlled entity 7,402 - - - - - 7,402 Total assets 1,584,973 Liabilities Segment liabilities 368,993 14,897 54,190 5,707 35,332 - 479,119
Other segment information Capital expenditure 14,144 9,177 2,098 21 234 - 25,674Depreciation 40,765 2,818 3,162 9 87 - 46,841Amortisation - 1,312 269 547 - - 2,128Impairment loss on investment in an associate 2,890 - - - - - 2,890Impairment loss on investment in a jointly controlled entity 64 - - - - - 64Non-cash expenses other than depreciation and amortisation 1,722 2,147 1,253 31 11 - 5,164
Notes To The Financial Statements31 December 2011 (Cont’d)

183| Notes To The Financial Statements 31 December 2011 (Cont’d)
38. OPERATING SEGMENTS (cont’d)
The following table provides an analysis of the Group’s revenue, results, assets, liabilities and other information by business segments: (cont’d) Event, exhibition, interior Print and and new media Broadcasting thematic Others Elimination Consolidated2010 RM’000 RM’000 RM’000 RM’000 RM’000 RM’000 Revenue Sales to external customer 801,797 45,133 212,092 2,678 - 1,061,700Inter-segment sales 3,778 3,111 964 495 (8,348) - Total revenue 805,575 48,244 213,056 3,173 (8,348) 1,061,700 Results Segment results 240,578 2,386 12,588 (777) - 254,775Finance costs (5,324) (553) (309) (715) - (6,901) Interest income 7,742 191 344 5,256 - 13,533Investment income 3,741 - - - - 3,741Share of loss in an associate (1,767) - - - - (1,767) Share of losses in jointly controlled entities (4,574) - - - - (4,574) Profit before tax 258,807Tax expense (68,639) Profit for the financial year 190,168 Assets Segment assets 1,054,899 79,811 160,546 46,981 - 1,342,237Investment in an associate 10,144 - - - - 10,144Investment in jointly controlled entities 11,322 - - - - 11,322 Total assets 1,363,703 Liabilities Segment liabilities 223,304 17,069 52,700 35,073 - 328,146
Other segment information Capital expenditure 20,371 451 6,965 22 - 27,809Depreciation 43,038 2,007 3,126 64 - 48,235Amortisation - 425 269 - - 694Impairment losses on goodwill - - 602 - - 602Non-cash expenses other than depreciation and amortisation 1,596 1,170 1,248 16 - 4,030

184 |
38. OPERATING SEGMENTS (cont’d)
Geographical information
The Group operates mainly in Malaysia and Singapore. In presenting information on the basis of geographical areas, segment revenue is based on the geographical location from which the sales transactions originated.
Segment assets are based on the geographical location of the Group’s assets.
Segment revenue and segment assets information based on geographical information are as follows:
Revenue Segment assets 2011 2010 2011 2010 RM’000 RM’000 RM’000 RM’000
Malaysia 893,419 853,496 1,358,522 1,164,974Singapore 112,718 95,399 109,948 105,664Others 61,531 112,805 116,503 93,065 1,067,668 1,061,700 1,584,973 1,363,703
39. FINANCIAL INSTRUMENTS
(a) Capital management
The primary objective of the Group’s capital management is to ensure that entities of the Group would be able to continue as going concerns while maximising the return to shareholders through the optimisation of the debt and equity balance.
The Group reviews its capital structure on an annual basis and the Directors consider the cost of capital and the risks associated with each class of the capital. The Group manages its capital structure actively and makes adjustments to address changes in the economic environment, regulatory requirements and risk characteristics in the business operations of the Group. These initiatives include dividend payments, share buy-back, issuance of new debts, redemption of debts and other adjustments in light of economic conditions.
The Group monitors capital using a gearing ratio, which is net debt divided by total capital. The Group includes within net debt, loans and borrowings, less cash and bank balances. Capital represents equity attributable to the owners of the parent.
There are no changes made on the capital management, policies and procedures of the Group and the Company during the financial year.
Group Company 2011 2010 2011 2010 RM’000 RM’000 RM’000 RM’000
Loans and borrowings 262,529 95,131 200,000 50,367
Less: Cash and bank balances (Note 17) (107,510) (86,226) (29,122) (29,912)
Net debt 155,019 8,905 170,878 20,455
Total capital 1,105,854 1,035,557 1,013,964 969,297
Gearing ratio 14.0% 0.9% 16.9% 2.1%
Notes To The Financial Statements31 December 2011 (Cont’d)

185| Notes To The Financial Statements 31 December 2011 (Cont’d)
39. FINANCIAL INSTRUMENTS (cont’d)
(b) Financial instruments
Categories of financial instruments
Fair value Loans and through Available- Held to receivables profit or loss for-sale maturity Total Note RM’000 RM’000 RM’000 RM’000 RM’000 Group2011
Financial assets Other investments 13 - 42,518 6,822 10,000 59,340Trade and other receivables 16 212,304 - - - 212,304 212,304 42,518 6,822 10,000 271,644Cash and cash equivalents 17 493,683 - - - 493,683 705,987 42,518 6,822 10,000 765,327
Fair value Other through financial profit or liabilities loss Total Note RM’000 RM’000 RM’000
Group 2011 Financial liabilities Borrowings 262,529 - 262,529Trade and other payables 24 132,431 - 132,431 394,960 - 394,960

186 |
39. FINANCIAL INSTRUMENTS (cont’d)
(b) Financial instruments (cont’d)
Categories of financial instruments (cont’d)
Fair value Loans and through Available- Held to receivables profit or loss for-sale maturity Total Note RM’000 RM’000 RM’000 RM’000 RM’000 Group2010
Financial assets Other investments 13 - 28,007 6,255 15,000 49,262Trade and other receivables 16 190,058 - - - 190,058 190,058 28,007 6,255 15,000 239,320Cash and cash equivalents 17 216,688 - - - 216,688 406,746 28,007 6,255 15,000 456,008
Fair value Other through financial profit or liabilities loss Total Note RM’000 RM’000 RM’000
Group 2010 Financial liabilities Borrowings 95,131 - 95,131Trade and other payables 24 138,855 - 138,855
233,986 - 233,986
Notes To The Financial Statements31 December 2011 (Cont’d)

187| Notes To The Financial Statements 31 December 2011 (Cont’d)
39. FINANCIAL INSTRUMENTS (cont’d)
(b) Financial instruments (cont’d)
Categories of financial instruments (cont’d)
Fair value Loans and through Held to receivables profit or loss maturity Total Note RM’000 RM’000 RM’000 RM’000 Company2011
Financial assets Other investments 13 - 42,518 10,000 52,518Trade and other receivables 16 177,243 - - 177,243 177,243 42,518 10,000 229,761Cash and cash equivalents 17 345,598 - - 345,598 522,841 42,518 10,000 575,359
Fair value Other through financial profit or liabilities loss Total Note RM’000 RM’000 RM’000
Company 2011 Financial liabilities Borrowings 21 200,000 - 200,000Trade and other payables 24 142,832 - 142,832 342,832 - 342,832
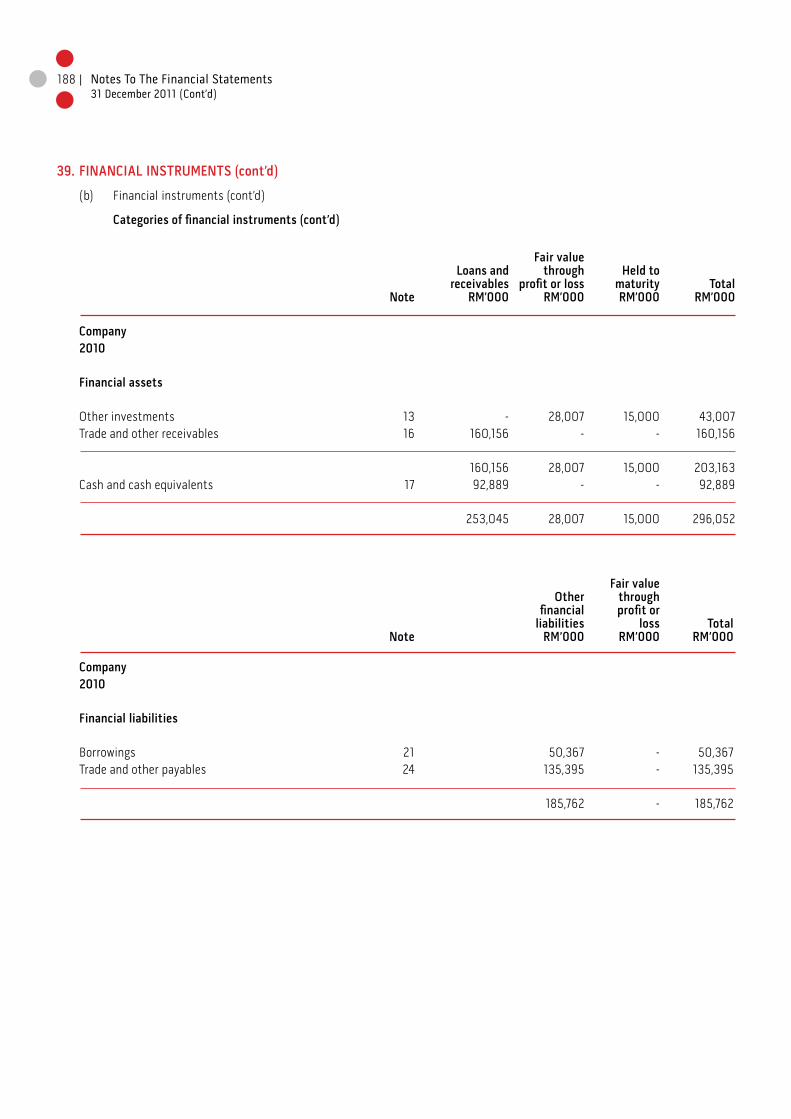
188 |
39. FINANCIAL INSTRUMENTS (cont’d)
(b) Financial instruments (cont’d)
Categories of financial instruments (cont’d)
Fair value Loans and through Held to receivables profit or loss maturity Total Note RM’000 RM’000 RM’000 RM’000 Company2010
Financial assets Other investments 13 - 28,007 15,000 43,007Trade and other receivables 16 160,156 - - 160,156 160,156 28,007 15,000 203,163Cash and cash equivalents 17 92,889 - - 92,889 253,045 28,007 15,000 296,052
Fair value Other through financial profit or liabilities loss Total Note RM’000 RM’000 RM’000
Company 2010 Financial liabilities Borrowings 21 50,367 - 50,367Trade and other payables 24 135,395 - 135,395 185,762 - 185,762
Notes To The Financial Statements31 December 2011 (Cont’d)

189| Notes To The Financial Statements 31 December 2011 (Cont’d)
39. FINANCIAL INSTRUMENTS (cont’d)(c) Fair values of financial instruments
The fair values of financial instruments that are not carried at fair value and whose carrying amounts do not approximate its fair values are as follows:
Group Company Carrying Fair Carrying Fair amount value amount value RM’000 RM’000 RM’000 RM’000
2011 Recognised Financial assets 4.38% p.a. Malaysian quoted investment funds due on 14 November 2014 5,000 5,112 5,000 5,112 4.00% p.a. Malaysian quoted investment funds due on 30 June 2012 5,000 5,178 5,000 5,178 Unrecognised Contingent liabilities - Litigation - 2,169 - 2,169- Fair value on bank guarantee - - - #
2010 Recognised Financial assets 4.38% p.a. Malaysian quoted investment funds due on 14 November 2014 5,000 5,106 5,000 5,1064.00% p.a. Malaysian quoted investment funds due on 30 June 2012 5,000 5,339 5,000 5,3395.00% p.a. Malaysian quoted investment funds due on 20 May 2011 5,000 5,002 5,000 5,002 Unrecognised Contingent liabilities - Litigation - 2,343 - 2,343- Fair value on bank guarantee - - - #
# The Directors are of the view that the chances of the financial institutions to call upon the corporate guarantees are remote.
190 |
39. FINANCIAL INSTRUMENTS (cont’d)
(d) Methods and assumptions used to estimate fair value
The fair values of financial assets and financial liabilities are determined as follows:
i. Financial instruments that are not carried at fair value and whose carrying amounts are a reasonable approximation of fair value
The carrying amounts of financial assets and liabilities, such as trade and other receivables, trade and other payables, short-term borrowings, Medium Term Notes, Commercial Paper and hire purchase and finance lease liabilities are reasonable approximation of fair value, either due to their short-term nature or that they are floating rate instruments that are re-priced to market interest rates on or near the end of the reporting period.
The carrying amounts of the current portion of loans and borrowings are reasonable approximation of fair values due to the insignificant impact of discounting.
The fair value of these borrowings has been determined using discounted cash flows technique. The discount rates used are based on the current market information and rates applicable to financial instruments with similar yield, credit quality and maturity characteristics. Estimated future cash flows are influenced by factors such as economic conditions (including country specific risks), concentrations in specific industries, types of instruments or currencies, market liquidity and financial conditions of counter parties. Discount rates are influenced by risk-free interest rates and credit risk.
ii. Quoted shares, investment funds and bonds
The fair value of quoted investments in Malaysia is determined by reference to the exchange quoted market bid prices at the close of the business at the end of the reporting period.
iii. Unquoted shares
The fair value of unquoted equity investment outside Malaysia has been estimated using discounted cash flows technique based on various assumptions, including economic conditions (including country specific risks), concentrations in specific industries, types of instruments or currencies, market liquidity and financial conditions of counter parties. Discount rates are influenced by risk-free interest rates and credit risk. Management believes that the estimated fair values resulting from the valuation technique are reasonable and the most appropriate at the end of the reporting period.
(e) Fair value hierarchy
The following table provides an analysis of financial instruments that are measured subsequent to initial recognition at fair value, grouped into Levels 1 to 3 based on the degree to which the fair value is observable.
Level 1 fair value measurements are those derived from quoted prices (unadjusted) in active markets for identical assets or liabilities.
Level 2 fair value measurements are those derived from inputs other than quoted prices included within Level 1 that are observable for the asset or liability, either directly (i.e. as prices) or indirectly (i.e. derived from prices).
Level 3 fair value measurements are those derived from inputs for the asset or liability that are not based on observable market data (unobservable inputs).
Notes To The Financial Statements31 December 2011 (Cont’d)

191| Notes To The Financial Statements 31 December 2011 (Cont’d)
39. FINANCIAL INSTRUMENTS (cont’d)
(e) Fair value hierarchy (cont’d)
As at 31 December 2011, the Group and the Company held the following financial instruments carried at fair value on the statements of financial position:
Assets measured at fair value 31 December 2011 Level 1 Level 2 Level 3 RM’000 RM’000 RM’000 RM’000
Group Financial assets at fair value through profit or loss - Quoted investment funds 34,604 34,604 - - - Quoted equity investment 4,048 4,048 - - - Unquoted equity investment 3,866 - - 3,866 Available-for-sale financial assets - Quoted bond 6,822 6,822 - - 49,340 45,474 - 3,866
Company Financial assets at fair value through profit or loss - Quoted investment funds 34,604 34,604 - - - Quoted equity investment 4,048 4,048 - - - Unquoted equity investment 3,866 - - 3,866 42,518 38,652 - 3,866
During the reporting period ended 31 December 2011, there were no transfers between Level 1 and Level 2 fair value measurements.

192 |
39. FINANCIAL INSTRUMENTS (cont’d)
(e) Fair value hierarchy (cont’d)
As at 31 December 2010, the Group and the Company held the following financial instruments carried at fair value on the statements of financial position:
Assets measured at fair value 31 December 2010 Level 1 Level 2 Level 3 RM’000 RM’000 RM’000 RM’000
Group Financial assets at fair value through profit or loss - Quoted investment funds 28,007 28,007 - - Available-for-sale financial assets - Quoted bond 6,255 6,255 - - 34,262 34,262 - -
Company Financial assets at fair value through profit or loss - Quoted investment funds 28,007 28,007 - -
During the reporting period ended 31 December 2010, there were no transfers between Level 1 and Level 2 fair value measurements.
Reconciliation of fair value measurements of Level 3 financial instruments
The Group and the Company carry unquoted equity investment as financial assets at fair value through profit or loss classified as Level 3 within the fair value hierarchy.
Financial assets at fair value through profit or loss RM’000
Balance at 1 January 2011 -Purchases 3,866Total gains or losses recognised in profit or loss -
Balance at 31 December 2011 3,866
Notes To The Financial Statements31 December 2011 (Cont’d)

193| Notes To The Financial Statements 31 December 2011 (Cont’d)
39. FINANCIAL INSTRUMENTS (cont’d)
(e) Fair value hierarchy (cont’d)
Reconciliation of fair value measurements of Level 3 financial instruments (cont’d)
There is no gain or loss recognised on measurement of unquoted equity investment in the current financial year.
Although the Group believes that its estimates of fair value are appropriate, the use of different methodologies or assumptions could lead to different measurements of fair value. For fair value measurements in Level 3, changing one or more of the assumptions used to reasonably possible alternative assumptions would have the following effects:
Effect on profit or loss Favourable (Unfavourable) RM’000 RM’000
Unquoted equity investment 201 (201)
40. FINANCIAL RISK MANAGEMENT OBJECTIVES AND POLICIES
The Group’s financial risk management objective is to optimise value creation for shareholders whilst minimising the potential adverse impact arising from fluctuations in foreign currency exchange and interest rates and the unpredictability of the financial markets.
The Group operates within an established risk management framework and clearly defined guidelines that are regularly reviewed by the Board of Directors and does not trade in derivative financial instruments. Financial risk management is carried out through risk review programmes, internal control systems, insurance programmes and adherence to the Group’s financial risk management policies. The Group is exposed mainly to foreign currency risk, liquidity risk, interest rate risk, credit risk and market price risk. Information on the management of the related exposures is detailed below.
(i) Foreign currency risk
Foreign currency risk is the risk that the fair value or future cash flows of a financial instrument will fluctuate because of changes in foreign exchange rates.
The Group and the Company are exposed to foreign currency risk on transactions that are denominated in currencies other than the functional currencies of the operating entities.
The Group and the Company also hold cash and cash equivalents denominated in foreign currencies for working capital purposes. At the end of the reporting period, such foreign currency balances amount to RM101,725,000 (2010: RM86,462,000) for the Group and RM60,000 (2010: RM86,000) for the Company.
The Group is also exposed to foreign currency exchange risk in respect of its overseas investments. The Group does not hedge this exposure with foreign currency borrowings except for a bank loan of RM34,615,000 (2010: RM33,887,000), which is denominated in Singapore Dollar.

194 |
40. FINANCIAL RISK MANAGEMENT OBJECTIVES AND POLICIES (cont’d)
(i) Foreign currency risk (cont’d)
Sensitivity analysis for foreign currency risk
The following table demonstrates the sensitivity of the Group’s profit net of tax to a reasonably possible change in the United States Dollar (“USD”), Euro (“EUR”), Bahrain Dinar (“BHD”), Omani Rial (“OMR”), Singapore Dollar (“SGD”) and Australian Dollar (“AUD”) exchange rates against the respective functional currencies of the Group entities, with all other variables held constant.
2011 2010 Group Company Group Company RM’000 RM’000 RM’000 RM’000 Profit Profit Profit Profit net of tax net of tax net of tax net of tax
USD/RM - strengthen by 3% (2010: 3%) +194 -504 -2,189 -1,956
- weaken by 3% (2010: 3%) -194 +504 +2,189 +1,956
EUR/RM - strengthen by 3% (2010: 3%) +10 - +14 -
- weaken by 3% (2010: 3%) -10 - -14 -
BHD/RM - strengthen by 3% (2010: 3%) +677 - +485 -
- weaken by 3% (2010: 3%) -677 - -485 -
OMR/RM - strengthen by 3% (2010: 3%) +9 - +147 -
- weaken by 3% (2010: 3%) -9 - -147 -
SGD/RM - strengthen by 3% (2010: 3%) +797 +1,017 +402 +402
- weaken by 3% (2010: 3%) -797 -1,017 -402 -402
AUD/RM - strengthen by 3% (2010: 3%) -1,175 -1,175 -1,090 -1,090
- weaken by 3% (2010: 3%) +1,175 +1,175 +1,090 +1,090
(ii) Liquidity and cash flow risk
The Group actively manages its debt maturity profile, operating cash flows and the availability of funding so as to ensure that all operating, investing and financing needs are met. In liquidity risk management strategy, the Group measures and forecasts its cash commitments and maintains a level of cash and cash equivalents deemed adequate to finance the Group’s activities.
The Group is actively managing its operating cash flows to ensure all commitments and funding needs are met. Prudent liquidity risk management implies maintaining sufficient cash and marketable securities, the availability of funding through an adequate amount of committed credit facilities and the ability to close out market positions. Due to the dynamic nature of the underlying businesses, the Group aims at maintaining flexibility in funding by keeping committed credit lines available.
Notes To The Financial Statements31 December 2011 (Cont’d)
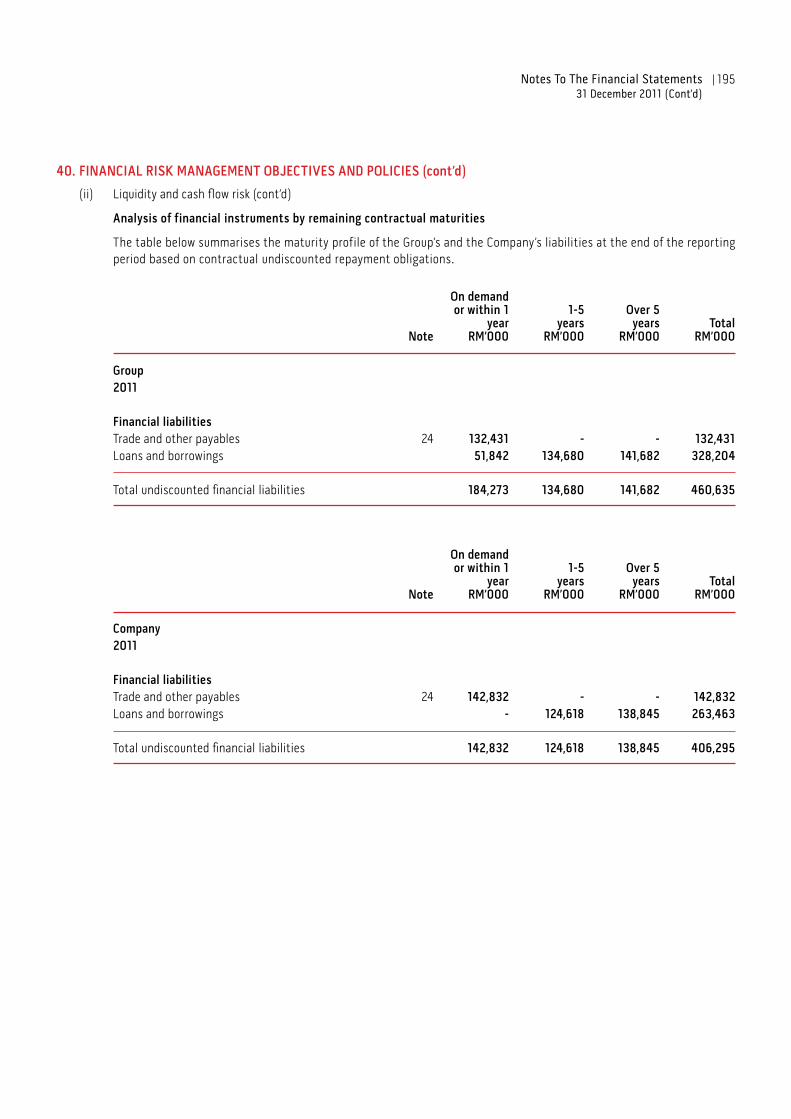
195| Notes To The Financial Statements 31 December 2011 (Cont’d)
40. FINANCIAL RISK MANAGEMENT OBJECTIVES AND POLICIES (cont’d)
(ii) Liquidity and cash flow risk (cont’d)
Analysis of financial instruments by remaining contractual maturities
The table below summarises the maturity profile of the Group’s and the Company’s liabilities at the end of the reporting period based on contractual undiscounted repayment obligations.
On demand or within 1 1-5 Over 5 year years years Total Note RM’000 RM’000 RM’000 RM’000 Group 2011 Financial liabilities Trade and other payables 24 132,431 - - 132,431Loans and borrowings 51,842 134,680 141,682 328,204 Total undiscounted financial liabilities 184,273 134,680 141,682 460,635
On demand or within 1 1-5 Over 5 year years years Total Note RM’000 RM’000 RM’000 RM’000 Company 2011 Financial liabilities Trade and other payables 24 142,832 - - 142,832Loans and borrowings - 124,618 138,845 263,463 Total undiscounted financial liabilities 142,832 124,618 138,845 406,295

196 |
40. FINANCIAL RISK MANAGEMENT OBJECTIVES AND POLICIES (cont’d)
(ii) Liquidity and cash flow risk (cont’d)
On demand or within 1 1-5 Over 5 year years years Total Note RM’000 RM’000 RM’000 RM’000 Group 2010 Financial liabilities Trade and other payables 24 138,855 - - 138,855Loans and borrowings 55,246 39,054 4,292 98,592 Total undiscounted financial liabilities 194,101 39,054 4,292 237,447
On demand or within 1 1-5 Over 5 year years years Total Note RM’000 RM’000 RM’000 RM’000 Company 2010 Financial liabilities Trade and other payables 24 135,395 - - 135,395Loans and borrowings 52,000 - - 52,000 Total undiscounted financial liabilities 187,395 - - 187,395
(iii) Interest rate risk
Interest rate risk is the risk that the fair value or future cash flows of the Group’s and the Company’s financial instruments will fluctuate because of changes in market interest rates.
The Group’s and the Company’s exposure to interest rate risk arises primarily from their loans and borrowings as well as the short term deposits. The Group borrows in the desired currencies at both fixed and floating rates of interest.
Sensitivity analysis for interest rate risk
At 31 December 2011, if interest rates at the date had been 50 basis points lower with all other variables held constant, post-tax profit for the year would have been RM605,000 (2010: RM276,000) lower, arising mainly as a result of lower interest income derived from short term deposits. If interest rates had been 50 basis points higher, with all other variables held constant, post-tax profit would have been RM605,000 (2010: RM276,000) higher, arising mainly as a result of higher interest income derived from short term deposits. Profit is equally sensitive to interest rate decreases and increases. The sensitivity is higher in 2011 than in 2010 because of an increase in placement of short term deposits that have occurred. The assumed movement in basis points for interest rate sensitivity analysis is based on the currently observable market environment.
Notes To The Financial Statements31 December 2011 (Cont’d)

197| Notes To The Financial Statements 31 December 2011 (Cont’d)
40. FINANCIAL RISK MANAGEMENT OBJECTIVES AND POLICIES (cont’d)
(iii) Interest rate risk (cont’d)
The following tables set out the carrying amounts, the weighted average effective interest rates as at the end of the reporting period and the remaining maturities of the Group’s and the Company’s financial instruments that are exposed to interest rate risk:
Weighted average effective interest Within 1 - 2 2 - 3 3 - 4 4 - 5 More than rate 1 year years years years years 5 years Total Group Note % RM’000 RM’000 RM’000 RM’000 RM’000 RM’000 RM’000
As at 31 December 2011
Fixed rates Deposits placed with licensed banks 17 3.43 386,173 - - - - - 386,173Hire purchase and finance lease liabilities 23 6.52 (1,037) (1,037) (1,103) (1,172) (1,247) (2,635) (8,231) Medium Term Notes 21 4.65 - - - - (100,000) (100,000) (200,000) Floating rate Bank loan (secured) 22 2.09 (50,177) (2,473) (1,648) - - - (54,298) As at 31 December 2010 Fixed rates Deposits placed with licensed banks 17 3.17 130,462 - - - - - 130,462Hire purchase and finance lease liabilities 23 6.23 (963) (1,001) (1,034) (1,100) (1,169) (3,875) (9,142) Commercial Paper 21 3.79 (50,367) - - - - - (50,367) Floating rate Bank loan (secured) 22 2.24 (1,735) (33,887) - - - - (35,622)
Weighted average effective interest Within 1 - 2 2 - 3 3 - 4 4 - 5 More than rate 1 year years years years years 5 years Total Company Note % RM’000 RM’000 RM’000 RM’000 RM’000 RM’000 RM’000
As at 31 December 2011
Fixed rates Amount owing by a subsidiary 16(d) 3.80 9,890 - - - - - 9,890Deposits placed with licensed banks 17 3.32 316,476 - - - - - 316,476Medium Term Notes 21 4.65 - - - - (100,000) (100,000) (200,000) Floating rate Amount owing to a subsidiary 24(b) 7.33 (52,250) - - - - - (52,250) As at 31 December 2010 Fixed rates Amount owing by a subsidiary 16(d) 5.00 9,682 - - - - - 9,682Deposits placed with licensed banks 17 2.85 62,977 - - - - - 62,977Commercial Paper 21 3.79 (50,367) - - - - - (50,367)
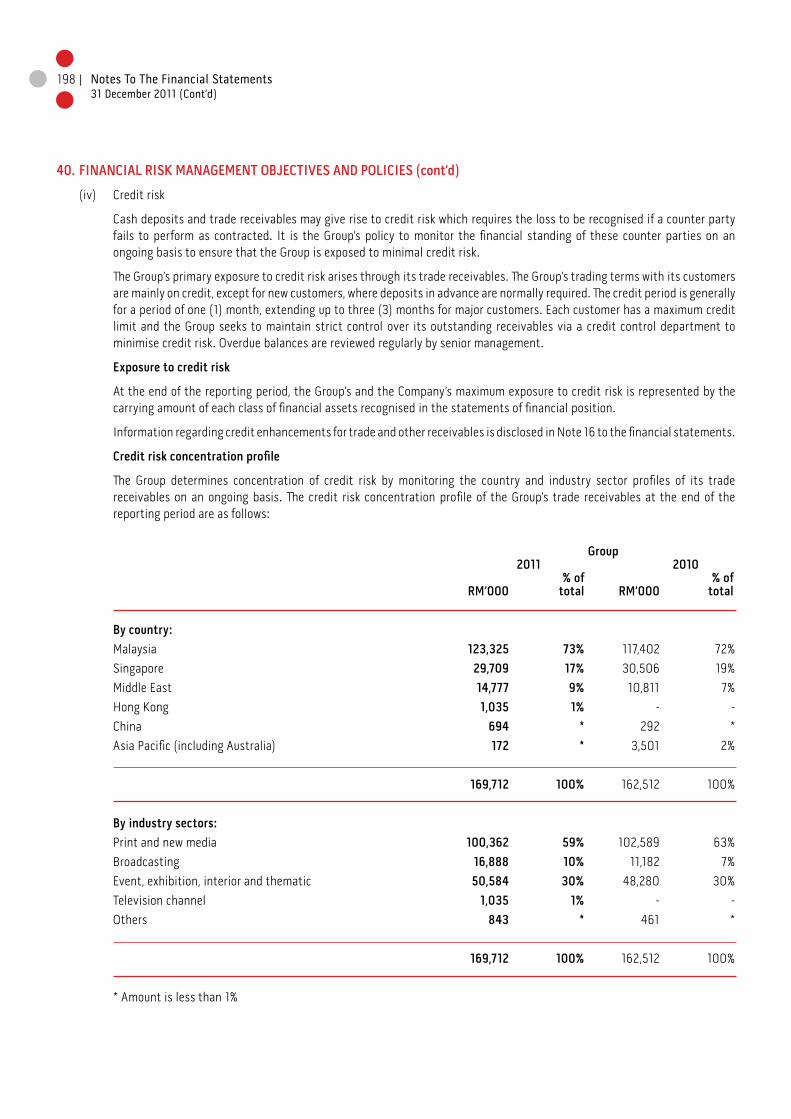
198 |
40. FINANCIAL RISK MANAGEMENT OBJECTIVES AND POLICIES (cont’d)
(iv) Credit risk
Cash deposits and trade receivables may give rise to credit risk which requires the loss to be recognised if a counter party fails to perform as contracted. It is the Group’s policy to monitor the financial standing of these counter parties on an ongoing basis to ensure that the Group is exposed to minimal credit risk.
The Group’s primary exposure to credit risk arises through its trade receivables. The Group’s trading terms with its customers are mainly on credit, except for new customers, where deposits in advance are normally required. The credit period is generally for a period of one (1) month, extending up to three (3) months for major customers. Each customer has a maximum credit limit and the Group seeks to maintain strict control over its outstanding receivables via a credit control department to minimise credit risk. Overdue balances are reviewed regularly by senior management.
Exposure to credit risk
At the end of the reporting period, the Group’s and the Company’s maximum exposure to credit risk is represented by the carrying amount of each class of financial assets recognised in the statements of financial position.
Information regarding credit enhancements for trade and other receivables is disclosed in Note 16 to the financial statements.
Credit risk concentration profile
The Group determines concentration of credit risk by monitoring the country and industry sector profiles of its trade receivables on an ongoing basis. The credit risk concentration profile of the Group’s trade receivables at the end of the reporting period are as follows:
Group 2011 2010 % of % of RM’000 total RM’000 total
By country: Malaysia 123,325 73% 117,402 72%Singapore 29,709 17% 30,506 19%Middle East 14,777 9% 10,811 7%Hong Kong 1,035 1% - -China 694 * 292 *Asia Pacific (including Australia) 172 * 3,501 2% 169,712 100% 162,512 100% By industry sectors: Print and new media 100,362 59% 102,589 63%Broadcasting 16,888 10% 11,182 7%Event, exhibition, interior and thematic 50,584 30% 48,280 30%Television channel 1,035 1% - -Others 843 * 461 * 169,712 100% 162,512 100%
* Amount is less than 1%
Notes To The Financial Statements31 December 2011 (Cont’d)
199| Notes To The Financial Statements 31 December 2011 (Cont’d)
40. FINANCIAL RISK MANAGEMENT OBJECTIVES AND POLICIES (cont’d)
(iv) Credit risk (cont’d)
Credit risk concentration profile (cont’d)
At the end of the reporting period, the Company has no significant concentration of credit risk except for the amounts owing by its subsidiaries constituting 36% (2010: 31%) of total receivables of the Company. The Company does not anticipate the carrying amounts recorded at the end of the reporting period to be significantly different from the values that would eventually be received.
Financial assets that are neither past due nor impaired
Information regarding trade and other receivables that are neither past due nor impaired is disclosed in Note 16 to the financial statements. Deposits with banks and other financial institutions, investment securities and derivatives that are neither past due nor impaired are placed with or entered into with reputable financial institutions or companies with high credit ratings and no history of default.
Financial assets that are either past due or impaired
Information regarding financial assets that are either past due or impaired is disclosed in Note 16 to the financial statements.
(v) Market price risk
Market price risk is the risk that the fair value or future cash flows of the Group’s financial instruments will fluctuate because of changes in market prices (other than interest or exchange rates).
The Group is exposed to equity price risks arising from quoted investments held by the Group. They are held for strategic rather than trading purposes. The Group does not actively trade these investments. These instruments are classified as financial assets designated at fair value through profit or loss, available-for-sale and held to maturity financial assets.
To manage its price risk arising from investments in shares, funds and bonds, the Group diversifies its portfolio in accordance with the limits set by the Group.
Sensitivity analysis for price risk
As the Group and the Company invest in a portfolio of investments with a diversified risk base, the Group and the Company are not significantly exposed to price fluctuations of a single derivative within its portfolio of investments. As a result, the Directors of the Group and the Company are of the view that the effects of a sensitivity analysis on the market price risk for its quoted investments will not have a significant impact on the earnings of the Group and the Company.
41. SIGNIFICANT EVENTS DURING THE FINANCIAL YEAR
(a) On 17 March 2011, Cityneon Holdings Limited (“Cityneon”) incorporated a wholly-owned subsidiary, Cityneon Vietnam Company Limited (“CVL”), in Vietnam. The principal activities are to provide project management services (other than for construction) and to engage in the installation, assembly, building completion and finishing works. CVL has a charter capital equivalent to USD50,000.
(b) On 4 April 2011, the Company announced the proposal to implement a Commercial Papers (“CPs”) programme of up to RM750.0 million in nominal value for 7 years (“CP Programme”) and a Medium Term Notes (“MTNs”) programme of up to RM750.0 million in nominal value for 15 years (“MTN Programme”, together with the Proposed CP Programme, are collectively known as the “Proposed Programmes”). The Proposed Programmes will have a combined limit of up to RM750.0 million.
On 27 April 2011, the Company announced that the Proposed Programmes have been approved by the Securities Commission (“SC”) via SC’s letter dated 26 April 2011. On 11 May 2011, the Company announced that it has made its first issuance of RM200.0 million in nominal value MTNs pursuant to the MTN Programme.

200 |
41. SIGNIFICANT EVENTS DURING THE FINANCIAL YEAR (cont’d)
(c) On 28 April 2011, Cityneon announced the incorporation of a new wholly-owned subsidiary, Cityneon Shelter Events (Shenzhen) Pte. Ltd. (“CSSZ”) in the People’s Republic of China. The principal activities are to provide home and abroad exhibitions information consultation, economic information and enterprise management consultation (excluding securities, insurance, fund, financing employment agency service and other restricted projects), exhibition and event activities display design management, enterprise image and marketing management, stage design management, exhibition etiquette consultant and showroom display management service. CSSZ has a registered capital of USD3,100,000.
(d) On 9 August 2011, the Company announced the completion of the acquisition of 80% equity interest in Capital FM for a cash consideration of RM15,000,000. This acquisition was first announced on 19 May 2011. The principal activity of Capital FM is operation of a radio station. Capital FM has an issued and fully paid-up share capital of RM5,000,000 representing 5,000,000 ordinary shares of RM1.00 each.
(e) On 19 August 2011, the Company announced that it has entered into a Sale and Purchase Agreement (the “SPA”) with JAKS Island Circle Sdn. Bhd. (“JAKS”) for the proposed disposal of a leasehold land located along Jalan 13/6 in Section 13, Petaling Jaya, Selangor Darul Ehsan (“the Land”) for a consideration of RM135 million in cash and in kind, based upon the terms and conditions as contained in the SPA.
Simultaneously, with the execution of the SPA, the Company and JAKS have mutually agreed to enter into a Transition Agreement on 19 August 2011 to suspend all their rights and obligations under the Joint Development Agreement entered on 3 March 2010.
The completion of the proposed disposal is conditional upon the fulfillment of conditions stated in the SPA.
(f) On 22 August 2011, the Company announced that the acquisition of a 51% equity interest in Li TV Holdings Limited (“Li TV”) for a cash consideration of RM35,000,000 was completed and Li TV is effectively a 51% owned subsidiary of the Company. Li TV is an investment holding company with wholly-owned subsidiaries engaged in the provision of technical operations and broadcasting support for the high definition television channel, operation of pay or cable television channel, distribution of films and sales of television channel airtime. The paid-up share capital of Li TV is USD6,666,667.
(g) On 14 December 2011, Cityneon announced that Cityneon Creations Pte. Ltd. (“CCPL”), a wholly-owned subsidiary of Cityneon, has increased its issued shares and paid-up capital by the allotment of an additional 1,100,000 ordinary shares at SGD1.00 each to Cityneon. Following the allotment of shares, the paid-up share capital of CCPL has increased from SGD400,000 to SGD1,500,000. CCPL was incorporated on 10 July 1999 to carry on the design and build services for custom-built exhibition pavilions and roadshows. This investment was funded internally.
(h) On 29 December 2011, Leaderonomics Media Sdn. Bhd. (“LMSB”) was incorporated by a 51% owned subsidiary of the Company, Leaderonomics Sdn. Bhd. (“LSB”). LMSB has an issued and paid-up share capital of RM2 divided into 2 ordinary shares of RM1.00 each. By virtue of the equity interest in LSB, LMSB became a 51% owned subsidiary of the Company. The principal activities of LMSB are produce, develop, distribute, market and deal with materials and contents related to leadership programmes or any business of human capital development including training of any form and consultancy of all kinds.
42. SIGNIFICANT EVENTS SUBSEQUENT TO THE END OF THE REPORTING PERIOD
(a) On 6 January 2012, the Company announced the completion of the proposed acquisition to acquire 2,484,834 fully paid ordinary shares of RM1.00 each, representing 83.61% of the entire issued and paid-up share capital of Red Tomato Media Sdn. Bhd. (“RTMSB”), a company incorporated in Malaysia which is engaged in the trading of publication, mass media and other related activities, for a cash consideration of RM1,490,900. The completion results in RTMSB becoming a subsidiary of the Company.
The Group acquired 83.61% of the equity interest in RTMSB as a strategy to strengthen its presence in the Chinese print media. Control was obtained by virtue of owning a majority of the voting rights of RTMSB.
Notes To The Financial Statements31 December 2011 (Cont’d)

201| Notes To The Financial Statements 31 December 2011 (Cont’d)
42. SIGNIFICANT EVENTS SUBSEQUENT TO THE END OF THE REPORTING PERIOD (cont’d)
(a) (cont’d)
The fair value of the identifiable assets and liabilities of RTMSB as at the date of acquisition are as follows:
Goodwill of RM2,467,000 arising from the acquisition of RTMSB is well justified by the synergies and benefits which could be derived from the subsidiary. The Group currently owns a Chinese broadcasting radio station, namely 988FM and a Chinese business magazine titled Shang Hai. With the inclusion of RTMSB into the organisation, the management believes this would further enhance its Chinese media platform and allows the Group to offer extended and enhanced services to the advertisers. The Group’s current expertise in Chinese print and Chinese broadcasting would help to expand and untap the potential of RTMSB. The vast experience of the current RTMSB team would also add synergy to the business plan for the Chinese media platforms of the Group.
Transaction costs related to the acquisition of RM51,000 have been recognised in profit or loss as administrative expenses.
The effects of the acquisition of RTMSB on cash flows are as follows:
2012 RM’000 Purchase consideration settled in cash 1,491Cash and cash equivalents of subsidiaries acquired 62 Net cash outflow of the Group on acquisition 1,553
RTMSB is expected to contribute the following results to the Group for the financial year from the acquisition date.
(b) On 21 February 2012, LMSB increased its paid-up share capital from RM2 to RM500,000 by the allotment of 499,998 shares at RM1.00 each. The new shares allotted were fully subscribed by LSB, the immediate holding company of LMSB. LMSB remains as the wholly-owned subsidiary of LSB which is a 51% owned subsidiary of the Company.
2012 RM’000 Property, plant and equipment 309Receivables 498Cash and bank balances (62) Payables (1,571) Borrowings (341) Total identifiable net assets (1,167) Less: Non-controlling interests, measured at proportionate share of net assets 191Goodwill arising from acquisition 2,467 Total cost of acquisition 1,491
2012 RM’000
Revenue 1,061Loss for the financial year (868)

202 | Notes To The Financial Statements31 December 2011 (Cont’d)
43. SUPPLEMENTARY INFORMATION ON REALISED AND UNREALISED PROFITS OR LOSSESThe retained earnings as at the end of the reporting period may be analysed as follows:
2011 2010 Group Company Group Company RM’000 RM’000 RM’000 RM’000
Total retained profits of Star Publications (Malaysia) Berhad
and its subsidiaries:
- Realised 339,518 341,902 298,660 306,031
- Unrealised (70,541) (67,999) (76,799) (76,795)
268,977 273,903 221,861 229,236
Total share of retained profits from associate:
- Realised (2,793) - (2,461) -
- Unrealised 11 - 366 -
Total share of retained profits from jointly controlled entity:
- Realised (12,540) - (8,684) -
- Unrealised - - - -
253,655 273,903 211,082 229,236
Consolidation adjustments 48,606 - 37,444 -
Total retained earnings as at 31 December 302,261 273,903 248,526 229,236

203
Approximate Year of age of Net book acquisition/ buildings value LastLocation Tenure Size Description (years) RM’000 revaluation#
15-19, Jalan Masjid Leasehold 22,640 Office block Pre-war 969 1983#
Kapitan Keling, Expiry: 2055 sq. ft. 10200 Pulau Pinang 13, Jalan 13/6, 20,899 199146200 Petaling Jaya Selangor Darul Ehsan Leasehold 24,568 Building on 39 Expiry: 2062 sq. metres Industrial land 11, Jalan 13/6 10,834 199446200 Petaling Jaya Selangor Darul Ehsan 26A, Randolph Avenue Leasehold 1,440 2-storey 51 905 1995London W9 1BL Expiry: 2086 sq. ft. semi-detached United Kingdom house Kawasan Perindustrian Leasehold 172,644 Newsprint 14 9,339 1995Bukit Minyak, Mukim 13 Expiry: 2056 sq. ft. warehouse Daerah Seberang Perai 14100 Bukit Mertajam Pulau Pinang Menara Star Freehold 165,000 17-storey 11 43,525 200115, Jalan 16/11 sq. ft. tower block 46350 Petaling Jaya Selangor Darul Ehsan 2, Jalan U8/88 Freehold 405,979 Industrial land N/A 22,495 1997Section U8 sq. ft. Bukit Jelutong Industrial Park, 40150 Shah Alam 205,117 Printing plant 11 35,650 2001Selangor Darul Ehsan sq. ft. 202, Jalan Sultan Azlan Shah Freehold 12,086 Industrial land N/A 11,954 199711900 Bayan Lepas sq. metres Pulau Pinang 19,472 Regional office 10 21,337 2002 sq. metres and printing plant
List of Properties As at 31 December 2011

204 |
Approximate Year of age of Net book acquisition/ buildings value LastLocation Tenure Size Description (years) RM’000 revaluation#
Lot 9, First Floor Leasehold 1,210 Office block 13 206 1999Block B, Lintas Square Expiry: 2996 sq. ft. 88300 Kota Kinabalu Sabah
Lot No. 6037 (26198) Freehold 8.975 Vacant N/A 2,096 1999Mukim Bentong acres residential land Daerah Bentong Pahang Darul Makmur
GM611 Lot No. 3162 (26196) Freehold 3.766 Vacant N/A Mukim Bentong, acres agriculture land Pahang Darul Makmur 1,079 1999GM612, Lot No. 6036 (26197) Freehold 0.9084 Vacant N/A Mukim Bentong, acres residential land Pahang Darul Makmur Lot No. 60, Leasehold 60,387 Single storey Pre-war 1,587 2002Mukim of Tanah Rata Expiry: 2036 sq. ft. detached house Bintang Cottage, A38 Jalan Pekeliling Padang Golf, Tanah Rata Cameron Highlands Pahang Darul Makmur Unit A 4103 Leasehold 386.41 Top floor of a 8 2,074 2004SOHO Xian Dai Cheng Expiry: 2070 sq. metres 42-storey No. 88, Jian Guo Road, building Chao Yang District Beijing 100022 Peoples’ Republic of China No. 7, Jalan Tiang U8/93 Freehold 108,900 Industrial land N/A 4,380 2004Section U8 sq. ft. Bukit Jelutong Industrial Park 40150 Shah Alam Selangor Darul Ehsan
List of PropertiesAs at 31 December 2011 (Cont’d)

205|
Approximate Year of age of Net book acquisition/ buildings value LastLocation Tenure Size Description (years) RM’000 revaluation#
No. 9, Jalan Tiang U8/93 Freehold 111,078 Industrial land N/A 4,443 2004Section U8 sq. ft. Bukit Jelutong Industrial Park 40150 Shah Alam Selangor Darul Ehsan
10 Anson Road Leasehold 219 19th floor on a 36 2,801 2005#19-14 International Plaza Expiry: 2070 sq. metres 50-storey Singapore 079903 building Neighbourhood Freehold 1,690.72 4-storey 7 3,900 2005Commercial Centre sq. metres shop office GF to 3F, U6, Phase 19 62250 Putrajaya
8 & 10, Lorong Chung Thye Phin Leasehold 1622.53 Commercial land N/A 1,385 200530250 Ipoh Expiry: 2893 sq. metres Perak Darul Ridzuan 1,978 Office building 1 4,642 2011 sq. metres Klang Town Commercial Centre Freehold 445.93 3-storey 5 782 2007No. 35 Lebuh Tapah, Bandar Klang sq. metres shop office 41400 Klang Selangor Darul Ehsan No. 37 Jalan USJ Sentral 3 Freehold 10,080 5-storey 3 2,675 2009USJ Sentral, Persiaran Subang 1 sq. ft. shop office & 47600 Subang Jaya 1 lower ground Selangor Darul Ehsan car park
List of Properties As at 31 December 2011 (Cont’d)

206 |
SHARE CAPITAL
Authorised Share Capital : RM1,000,000,000
Issued & Paid-up Share Capital : RM738,563,602
Class of Shares : Ordinary Shares of RM1.00 each
Voting Rights : One (1) vote per ordinary share
ANALYSIS BY SIZE OF HOLDINGS
NO. OF SHAREHOLDERS/ % OF SHAREHOLDERS/ NO. OF SHARES/ % OF ISSUED SIZE OF HOLDINGS DEPOSITORS DEPOSITORS SECURITIES HELD CAPITAL
1 - 99 80 1.165 1,604 0.000
100 - 1,000 1,726 25.142 1,536,786 0.208
1,001 - 10,000 4,090 59.578 16,825,084 2.279
10,001 - 100,000 811 11.814 25,472,824 3.449
100,001 - 36,924,669 155 2.258 222,568,244 30.138
36,924,670 and above 3 0.043 472,088,860 63.926
Sub Total 6,865 100.000 738,493,402 100.000
Treasury Shares 70,200
Total 738,563,602 100.000
THIRTY LARGEST SHAREHOLDERS / DEPOSITORS AS AT 30 MARCH 2012
Number ofNo. Name shares held Holding Percentage
1. AMSEC Nominees (Tempatan) Sdn Bhd 313,315,760 42.426 Malaysian Chinese Association
2. Citigroup Nominees (Tempatan) Sdn Bhd 85,752,900 11.612 Employees Provident Fund Board
3. AmanahRaya Trustees Berhad 73,020,200 9.888 Skim Amanah Saham Bumiputera
4. Lembaga Tabung Haji 28,642,300 3.878
Analysis of Shareholdings As at 30 March 2012

Number ofNo. Name shares held Holding Percentage
5. AmanahRaya Trustees Berhad 27,750,800 3.758 Amanah Saham Malaysia
6. Valuecap Sdn Bhd 25,680,900 3.477
7. Malaysia Nominees (Tempatan) Sendirian Berhad 19,863,200 2.690 Great Eastern Life Assurance (Malaysia) Berhad (Par 1)
8. AmanahRaya Trustees Berhad 13,973,700 1.892 Amanah Saham Didik
9. HSBC Nominees (Asing) Sdn Bhd 7,503,900 1.016 BNP Paribas Secs Svs Lux for Aberdeen Global
10. Citigroup Nominees (Tempatan) Sdn Bhd 5,654,300 0.766 Exempt an for American International Assurance Berhad
11. Citigroup Nominees (Tempatan) Sdn Bhd 4,032,000 0.546 Employees Provident Fund Board (Aberdeen)
12. Citigroup Nominees (Tempatan) Sdn Bhd 4,000,000 0.542 Kumpulan Wang Persaraan (Diperbadankan) (Aberdeen)
13. Cartaban Nominees (Asing) Sdn Bhd 3,416,800 0.463 Government of Singapore Investment Corporation Pte Ltd for Government of Singapore
14. Malaysia Nominees (Tempatan) Sendirian Berhad 2,867,500 0.388 Great Eastern Life Assurance (Malaysia) Berhad (Par 2)
15. Malaysia Nominees (Tempatan) Sendirian Berhad 2,662,100 0.360 Great Eastern Life Assurance (Malaysia) Berhad (Dr)
16. Malaysia Nominees (Tempatan) Sendirian Berhad 2,607,000 0.353 Great Eastern Life Assurance (Malaysia) Berhad (LGF)
17. Malaysia Nominees (Tempatan) Sendirian Berhad 2,572,500 0.348 Great Eastern Life Assurance (Malaysia) Berhad (LSF)
18. Malaysia Nominees (Tempatan) Sendirian Berhad 2,380,500 0.322 Great Eastern Life Assurance (Malaysia) Berhad (LPF)
19. Koperasi Jayadiri Malaysia Berhad 2,296,000 0.311
20. Citigroup Nominees (Tempatan) Sdn Bhd Employees Provident Fund Board (Mayban Inv) 2,186,300 0.296
Analysis of Shareholdings As at 30 March 2012 (Cont’d)
207|

208 |
Number ofNo. Name shares held Holding Percentage
21. Amanah Raya Berhad Kumpulan Wang Bersama 2,000,000 0.271
22. Citigroup Nominees (Tempatan) Sdn Bhd 2,000,000 0.271 Employees Provident Fund Board (RHB Inv)
23. Lembaga Tabung Angkatan Tentera 2,000,000 0.271
24. HSBC Nominees (Tempatan) Sdn Bhd 1,804,000 0.244 HSBC (M) Trustee Bhd for MAAKL Al-Faid
25. Bank Kerjasama Rakyat Malaysia Berhad 1,792,000 0.243
26. HSBC Nominees (Asing) Sdn Bhd 1,718,000 0.233 Exempt An for BNP Paribas Securities Services (Singapore –SGD)
27. Employees Provident Fund Board 1,500,000 0.203
28. Tengku Nerang Putra 1,466,144 0.199
29. AmanahRaya Trustees Berhad 1,356,400 0.184 Public Islamic Dividend Fund
30. Malaysia Nominees (Tempatan) Sendirian Berhad 1,303,400 0.176 Great Eastern Life Assurance (Malaysia) Berhad (Par 3)
Total 647,118,604 87.627
Analysis of Shareholdings As at 30 March 2012 (Cont’d)

209| Analysis of Shareholdings As at 30 March 2012 (Cont’d)
DIRECTORS’ DIRECT AND INDIRECT SHAREHOLDINGS
(As Per Register of Directors’ Shareholdings)
No. of No. of Shares Held % of Shares Held % of Name Direct Interest Shareholdings Deemed Interest Shareholdings
Tan Sri Datuk Seri Dr Fong Chan Onn - - - -
Datuk Vincent Lee Fook Long 228,300 0.031 - -
Mr Ho Kay Tat - - - -
Tan Sri Datuk Seri Kamal Mohamed Hashim 100,000 0.014 900,000 0.122
Datuk Seri Wong Chun Wai 10,000 0.001 - -
Datin Linda Ngiam Pick Ngoh 679,000 0.092 287,000 0.039
Dato’ Wira Syed Abdul Jabbar bin Syed Hassan - - - -
Dato’ Dr Mohd Aminuddin bin Mohd Rouse - - - -
Mr Lee Siang Chin - - - -
Dato’ Yip Kum Fook - - - -
Mr Lew Weng Ho - - - -
SUBSTANTIAL SHAREHOLDERS
(As Per Register of Substantial Shareholders)
AMSEC Nominees (Tempatan) Sdn Bhd Malaysian Chinese Association 313,315,760 42.426 200,000 0.027
Employees Provident Fund Board 95,471,200 12.928 - -
AmanahRaya Trustees Berhad Skim Amanah Saham Bumiputera 73,020,200 9.888 - -
Oversea-Chinese Banking Corporation Limited (OCBC) - - 38,601,800 5.227
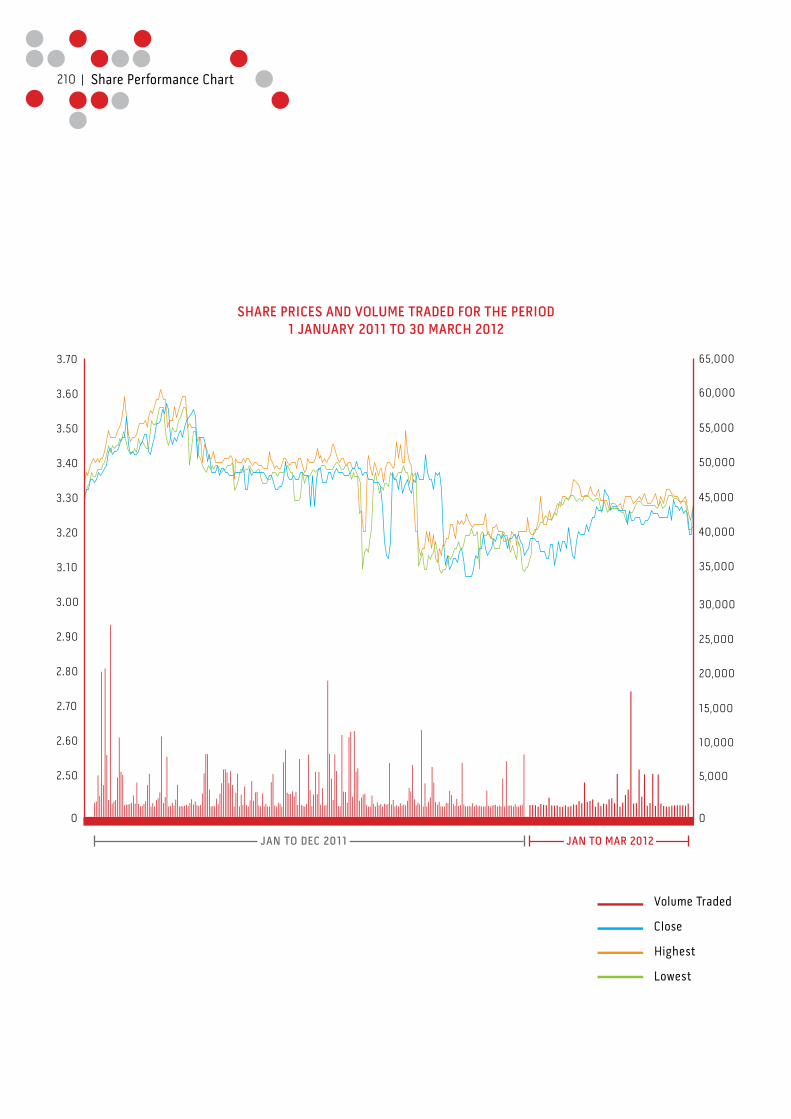
210 |
SHARE PRICES AND VOLUME TRADED FOR THE PERIOD1 JANUARY 2011 TO 30 MARCH 2012
Volume Traded
Close
Highest
Lowest
0
5,000
10,000
15,000
20,000
25,000
30,000
35,000
40,000
45,000
50,000
55,000
60,000
65,000
2.80
2.70
2.60
2.50
2.90
3.00
3.10
3.20
3.30
3.40
3.50
3.60
3.70
JAN TO MAR 2012JAN TO DEC 2011
0
Share Performance Chart

211
17
20
2
4
6810
14
15
16
911
12
7
1
3
5
13
22
21
19
18
17
20
2
4
6810
14
15
16
911
12
7
1
3
5
13
22
21
19
18
PENINSULAR MALAYSIA1. Alor Setar2. Georgetown and Star Northern Hub, Pulau Pinang3. Seberang Jaya4. Ipoh5. Kuala Lumpur6. Menara Star, Petaling Jaya (HQ)7. Star Media Hub, Shah Alam8. Klang
9. Putrajaya10. Seremban11. Melaka12. Muar13. Johor Bahru14. Kuantan15. Kuala Terengganu16. Kota Bharu
SABAH & SARAWAK17. Kuching18. Sibu19. Miri20. Kota Kinabalu
OVERSEAS OFFICES21. Beijing22. Singapore
Corporate Directory

SABAH & SARAWAK
KOTA KINABALU Lot 9, 1st Floor, Block B Lintas Square, Jalan Lintas Luyang, 88300 Kota Kinabalu, Sabah TEL : 088 - 233 380 / 234 380 FAX : 088 - 237 380
KUCHING 4th & Mezzanine Floors, Block E, Jalan Wan Alwi, Queen’s Court, 93350 Kuching, Sarawak TEL : 082 - 457 888 FAX : 082 - 459 371
MIRI Lot 2597, Wisma United Borneo Press, Jalan Piasau, 98000 Miri, Sarawak TEL : 085 - 664 924 FAX : 085 - 664 924
SIBU Lot 53774, Jalan Pengkalan Feri, Upper Lanang, 96000 Sibu, Sarawak TEL : 084 - 217 436 FAX : 084 - 217 436
OVERSEAS OFFICES
SINGAPORE Star Publications (S) Pte Ltd, 100, Beach Road, #22-11/12, Shaw Towers, Singapore 189702 TEL : 02 - 6292 6350 / 6292 7585 FAX : 02 - 6297 2474
CHINA A4103, Soho Xian Dai Cheng, 88, Jianguo Road, Chaoyang District, Beijing 100022, China TEL : 86 - 10 - 85803711 FAX : 86 - 10 - 85803711
212 |
PENINSULAR MALAYSIA
ALOR SETAR 936 (1st Floor), Jalan Sultan Badlishah, 05000 Alor Setar, Kedah Darul Aman TEL : 04 - 731 1864 / 731 0855 FAX : 04 - 733 8767
GEORGETOWN 15, Jalan Masjid Kapitan Keling, 10200 Pulau Pinang TEL : 04 - 262 4361 FAX : 04 - 261 1410
IPOH 8 – 10, Lorong Chung Thye Phin, 30250 Ipoh, Perak Darul Ridzuan TEL : 05 - 253 0402 FAX : 05 - 253 9669, 254 6445
JOHOR BAHRU 65 & 65A, Jalan Maju, Taman Maju Jaya, 80300 Johor Bahru, Johor Darul Ta’zim TEL : 07 - 331 5666 FAX : 07 - 333 3251
KOTA BHARU No. 2854-A, 1st Floor, Jalan Sultanah Zainab, 15000 Kota Bharu, Kelantan Darul Naim TEL : 09 - 747 8500 FAX : 09 - 747 8600
KLANG 35-G, 35-1, 35-2, Lebuh Tapah, Klang Town Commercial Centre, 41400 Klang, Selangor Darul Ehsan TEL : 03 - 3344 8978 FAX : 03 - 3344 4423
KUALA LUMPUR 17, Lorong Ma’arof, Bangsar, 59000 Kuala Lumpur TEL : 03 - 2284 2920 FAX : 03 - 2284 1712
KUALA TERENGGANU No. 137-E (1st Floor), Jalan Sultan Zainal Abidin, 20000 Kuala Terengganu Terengganu Darul Iman TEL : 09 - 622 3280 FAX : 09 - 623 0025
KUANTAN 14, 1st Floor, Jalan Tun Ismail, 25000 Kuantan, Pahang Darul Makmur TEL : 09 - 513 1323 FAX : 09 - 514 6276
MELAKA 4A, 1st Floor, Jalan Hang Tuah, 75300 Melaka TEL : 06 - 282 1909 / 283 6405 FAX : 06 - 283 5352
MUAR 261, Kampung Temiang, Jalan Salleh, 84070 Muar, Johor Darul Ta’zim TEL : 06 - 952 9601 FAX : 06 - 952 9601
PUTRAJAYA T.01-06, Jalan P9E/1, Precint 9, 62250 W.P. Putrajaya TEL : 03 - 8889 5512 / 8889 5513 FAX : 03 - 8889 5516
SEBERANG JAYA 19A (1st Floor), Jalan Todak 3, Pusat Bandar Seberang Jaya, (Bandar Sunway), 13700 Seberang Jaya, Pulau Pinang TEL : 04 - 398 8316 / 8318 / 8550 FAX : 04 - 398 8551
SEREMBAN 49, Jalan Yam Tuan, 70000 Seremban, Negeri Sembilan Darul Khusus TEL : 06 - 762 6984 / 761 2992 FAX : 06 - 761 2577
CORPORATE HEAD QUARTERS
MENARA STAR 15, Jalan 16/11, 46350 Petaling Jaya, Selangor Darul Ehsan, Malaysia TEL : 03-7967 1388 (General Line) 03-7966 8388 (Advertising) 03-7967 2020 (Metro Classified Run-Ons) FAX : 03-7954 6752 EMAIL : [email protected] THE STAR ONLINE : thestar.com.my
STAR MEDIA HUB Lot 2, Jalan Astaka U8/88, Section U8, Bukit Jelutong, 40150 Shah Alam, Selangor Darul Ehsan TEL : 03-7967 1388 FAX : 03-7845 4644
STAR NORTHERN HUB 202, Jalan Sultan Azlan Shah, 11900 Bayan Lepas, Pulau Pinang TEL : 04-647 3388 FAX : 04-647 3371 / 647 3355
STAR PUBLICATIONS (MALAYSIA) BERHAD (10894-D)
Corporate Directory (Cont’d)
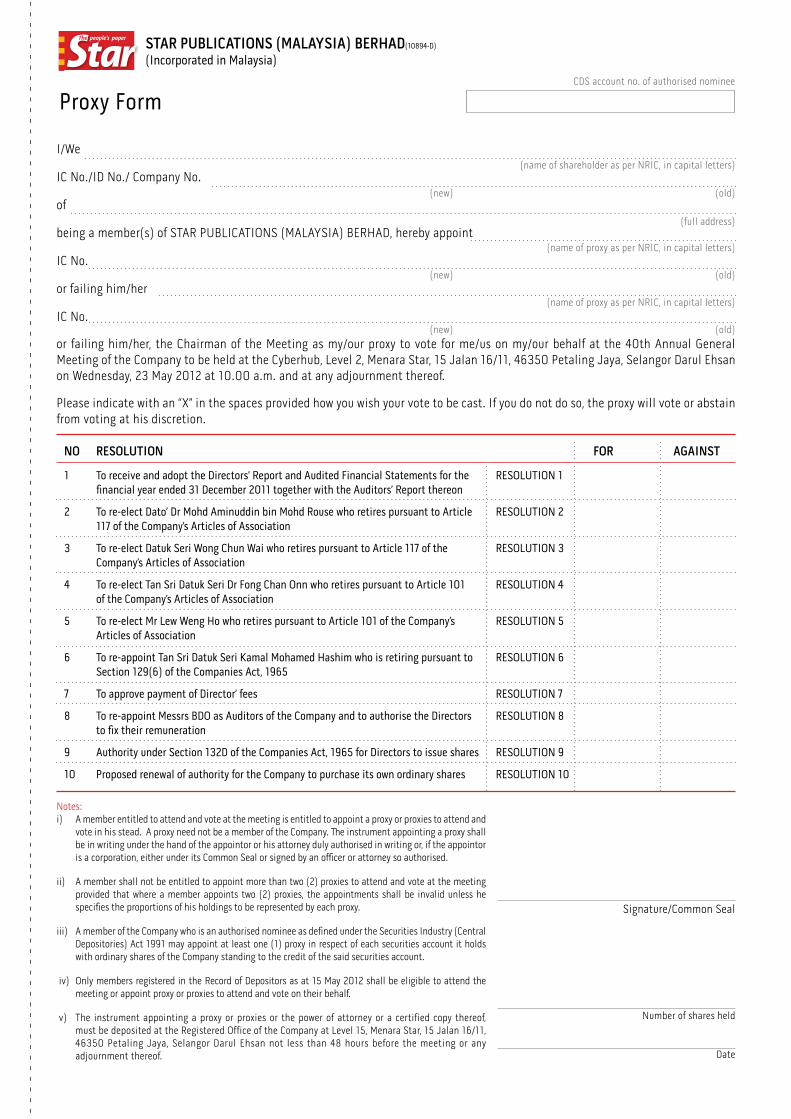
I/We
IC No./ID No./ Company No.
of
being a member(s) of STAR PUBLICATIONS (MALAYSIA) BERHAD, hereby appoint
IC No.
or failing him/her
IC No.
or failing him/her, the Chairman of the Meeting as my/our proxy to vote for me/us on my/our behalf at the 40th Annual General Meeting of the Company to be held at the Cyberhub, Level 2, Menara Star, 15 Jalan 16/11, 46350 Petaling Jaya, Selangor Darul Ehsan on Wednesday, 23 May 2012 at 10.00 a.m. and at any adjournment thereof.
Please indicate with an “X” in the spaces provided how you wish your vote to be cast. If you do not do so, the proxy will vote or abstain from voting at his discretion.
NO RESOLUTION FOR AGAINST
1 To receive and adopt the Directors’ Report and Audited Financial Statements for the financial year ended 31 December 2011 together with the Auditors’ Report thereon
RESOLUTION 1
2 To re-elect Dato’ Dr Mohd Aminuddin bin Mohd Rouse who retires pursuant to Article 117 of the Company’s Articles of Association
RESOLUTION 2
3 To re-elect Datuk Seri Wong Chun Wai who retires pursuant to Article 117 of the Company’s Articles of Association
RESOLUTION 3
4 To re-elect Tan Sri Datuk Seri Dr Fong Chan Onn who retires pursuant to Article 101 of the Company’s Articles of Association
RESOLUTION 4
5 To re-elect Mr Lew Weng Ho who retires pursuant to Article 101 of the Company’s Articles of Association
RESOLUTION 5
6 To re-appoint Tan Sri Datuk Seri Kamal Mohamed Hashim who is retiring pursuant to Section 129(6) of the Companies Act, 1965
RESOLUTION 6
7 To approve payment of Director’ fees RESOLUTION 7
8 To re-appoint Messrs BDO as Auditors of the Company and to authorise the Directors to fix their remuneration
RESOLUTION 8
9 Authority under Section 132D of the Companies Act, 1965 for Directors to issue shares RESOLUTION 9
10 Proposed renewal of authority for the Company to purchase its own ordinary shares RESOLUTION 10
Proxy Form
(name of shareholder as per NRIC, in capital letters)
CDS account no. of authorised nominee
(new)
(new)
(new)
(full address)
(old)
(old)
(old)
(name of proxy as per NRIC, in capital letters)
(name of proxy as per NRIC, in capital letters)
Notes:i) A member entitled to attend and vote at the meeting is entitled to appoint a proxy or proxies to attend and
vote in his stead. A proxy need not be a member of the Company. The instrument appointing a proxy shall be in writing under the hand of the appointor or his attorney duly authorised in writing or, if the appointor is a corporation, either under its Common Seal or signed by an officer or attorney so authorised.
ii) A member shall not be entitled to appoint more than two (2) proxies to attend and vote at the meeting provided that where a member appoints two (2) proxies, the appointments shall be invalid unless he specifies the proportions of his holdings to be represented by each proxy.
iii) A member of the Company who is an authorised nominee as defined under the Securities Industry (Central Depositories) Act 1991 may appoint at least one (1) proxy in respect of each securities account it holds with ordinary shares of the Company standing to the credit of the said securities account.
iv) Only members registered in the Record of Depositors as at 15 May 2012 shall be eligible to attend the meeting or appoint proxy or proxies to attend and vote on their behalf.
v) The instrument appointing a proxy or proxies or the power of attorney or a certified copy thereof, must be deposited at the Registered Office of the Company at Level 15, Menara Star, 15 Jalan 16/11, 46350 Petaling Jaya, Selangor Darul Ehsan not less than 48 hours before the meeting or any adjournment thereof.
Signature/Common Seal
Number of shares held
Date
STAR PUBLICATIONS (MALAYSIA) BERHAD(10894-D) (Incorporated in Malaysia)

fold here
fold here
COMPANY SECRETARY
STAR PUBLICATIONS (MALAYSIA) BERHAD (10894-D)
Level 15, Menara Star15, Jalan 16/11, 46350 Petaling JayaSelangor Darul Ehsan, Malaysia
S TA M P
SUBSIDIARIES
Star Publications (Malaysia) Berhad (10894-D)Menara Star, 15, Jalan 16/11, 46350 Petaling JayaSelangor Darul Ehsan, MalaysiaTel: 03-7967 1388 Fax: 03-7954 6752Website: starpublications.my
CORPORATE HEAD OFFICE
RADIO
NEWSPAPER
DIGITAL
TV
MAGAZINE
BUSINESS EXTENSIONS
THE STAR MEDIA GROUP: