tnpmsupport.persistentsys.com · report status .............80 before you begin ............81...
TRANSCRIPT

IBM Tivoli Netcool Performance Manager 1.4.1Wireless ComponentDocument Revision R2E1
User Guide
���

NoteBefore using this information and the product it supports, read the information in “Notices” on page 293.
© Copyright IBM Corporation 2006, 2015.US Government Users Restricted Rights – Use, duplication or disclosure restricted by GSA ADP Schedule Contractwith IBM Corp.

Contents
About this information . . . . . . . . viiIntended audience . . . . . . . . . . . . viiThe Tivoli Netcool Performance Manager - Wirelesscomponent user publications . . . . . . . . vii
Chapter 1. Introduction . . . . . . . . 1System components . . . . . . . . . . . . 1Web client . . . . . . . . . . . . . . . 2
Chapter 2. Getting started . . . . . . . 5Browser usage . . . . . . . . . . . . . . 5
Multiple windows and tabs . . . . . . . . 5Downloading report results to Excel . . . . . 5Logging on . . . . . . . . . . . . . . 5Web client navigation . . . . . . . . . . 6Documents . . . . . . . . . . . . . . 7Privileges and permissions. . . . . . . . . 7Preferences . . . . . . . . . . . . . . 9Where to start with PM reports . . . . . . . 13
Chapter 3. Viewing report results . . . 19Where to find report results . . . . . . . . . 19Types of report views, downloads, and exports . . 20Report output basics . . . . . . . . . . . 21
Hierarchy of totals . . . . . . . . . . . 21Report views . . . . . . . . . . . . . . 23
Opening a report . . . . . . . . . . . 23Entering user comments . . . . . . . . . 24Saving a report to a new document . . . . . 25Parts of a report . . . . . . . . . . . . 26Table View options . . . . . . . . . . . 27Chart View options . . . . . . . . . . . 29About roll-up levels . . . . . . . . . . 30
Table View . . . . . . . . . . . . . . 33Changing Table View settings . . . . . . . 34
Chart View . . . . . . . . . . . . . . 37Changing chart settings . . . . . . . . . 37Viewing data point hints . . . . . . . . . 41
CSV downloads . . . . . . . . . . . . . 41General guidelines . . . . . . . . . . . 41Components of a CSV file . . . . . . . . 42Downloading a CSV file . . . . . . . . . 42
XML downloads . . . . . . . . . . . . . 43General guidelines . . . . . . . . . . . 43Components of an XML file . . . . . . . . 43Downloading an XML file . . . . . . . . 45
Excel downloads . . . . . . . . . . . . 45General guidelines . . . . . . . . . . . 45Components of an Excel file . . . . . . . . 45Reports in Excel . . . . . . . . . . . . 45Downloading an Excel file . . . . . . . . 46
Chapter 4. MyFavorites pages . . . . . 47Before you begin . . . . . . . . . . . . 47
MyFavorites page overview . . . . . . . . . 48Opening a MyFavorites page . . . . . . . . 48Creating a MyFavorites page . . . . . . . . 50Editing an open MyFavorites page . . . . . . 51Setting a favorite MyFavorites page . . . . . . 52
Chapter 5. Browsing reports and otherdocuments . . . . . . . . . . . . . 53Before you begin . . . . . . . . . . . . 53Document types . . . . . . . . . . . . . 53
Document dependencies . . . . . . . . . 54How documents are organized . . . . . . . . 54
Personal documents and vault pages . . . . . 54The folder tree . . . . . . . . . . . . 54
Document and folder permissions . . . . . . . 55Read and write permissions . . . . . . . . 56Subfolders and permissions . . . . . . . . 57Permission examples . . . . . . . . . . 57About vault viewing . . . . . . . . . . 58
Finding a document or folder in the Browse tab . . 59Navigating the folder tree . . . . . . . . 59Filtering the navigation pane . . . . . . . 60
Running an immediate report . . . . . . . . 60Downloading reports without using the web userinterface . . . . . . . . . . . . . . . 61
Before you begin . . . . . . . . . . . 61Using a URL to download report results. . . . 62
Managing documents and folders . . . . . . . 63Creating a folder . . . . . . . . . . . 63Renaming a document or folder . . . . . . 63Moving a document or folder . . . . . . . 64Deleting a document or folder . . . . . . . 64Saving to a default folder. . . . . . . . . 65Viewing auto-purge settings . . . . . . . . 65
Auto-organizing reports results . . . . . . . . 66Auto-organizing variables . . . . . . . . 67Setting up auto-organizing . . . . . . . . 68
Publishing a document or folder . . . . . . . 69User and group permissions . . . . . . . . 69Publishing a document or folder . . . . . . 70
Viewing and changing permissions . . . . . . 71Copying a published document. . . . . . . . 72Uploading external documents . . . . . . . . 72Exporting reports . . . . . . . . . . . . 73
Email . . . . . . . . . . . . . . . 74Local folder . . . . . . . . . . . . . 75FTP . . . . . . . . . . . . . . . . 75Database table . . . . . . . . . . . . 76
Chapter 6. Monitoring report status . . 77Overview . . . . . . . . . . . . . . . 77
Report generation process . . . . . . . . 77About jobs and tasks . . . . . . . . . . 78Jobs and tasks pages . . . . . . . . . . 78About columns in the Monitor . . . . . . . 79
© Copyright IBM Corp. 2006, 2015 iii

Report status . . . . . . . . . . . . . 80Before you begin . . . . . . . . . . . . 81Finding a report in the Monitor tab . . . . . . 81
Search strategies . . . . . . . . . . . . 81Performing simple searches . . . . . . . . 81Performing advanced searches (Filtering) . . . 82Setting default search settings . . . . . . . 83
Sorting Monitor columns . . . . . . . . . . 83Navigating pages . . . . . . . . . . . . 83Refreshing the Monitor view . . . . . . . . 84Deleting a report . . . . . . . . . . . . 84Viewing report output . . . . . . . . . . . 84Viewing auxiliary report information . . . . . . 84
Viewing report history. . . . . . . . . . 85Viewing log content . . . . . . . . . . 85Viewing status details . . . . . . . . . . 85
Chapter 7. Report definition basics . . 87Entity basics . . . . . . . . . . . . . . 87
Entity types and instances . . . . . . . . 87Entity hierarchy . . . . . . . . . . . . 87Rehoming network elements. . . . . . . . 88
Traffic field basics . . . . . . . . . . . . 88Traffic data . . . . . . . . . . . . . 88Traffic fields . . . . . . . . . . . . . 89Field types . . . . . . . . . . . . . 90Missing data and confidence factors . . . . . 92
How aggregation is applied . . . . . . . . . 93What is aggregation? . . . . . . . . . . 93Aggregation of descendents . . . . . . . . 95
Chapter 8. Report archetypes . . . . . 97Overview of report archetypes . . . . . . . . 97Comprehensive report types . . . . . . . . . 98
Comprehensive granular . . . . . . . . . 98Comprehensive granular with drill-down . . . 99Comprehensive summary with no granularreport type . . . . . . . . . . . . . 101Guidelines for comprehensive report types . . 103
Busy hour report types . . . . . . . . . . 104Busy hour basics . . . . . . . . . . . 104Busy hour report examples . . . . . . . . 105Guidelines for busy hour reports . . . . . . 108
Trending report types. . . . . . . . . . . 110Guidelines for defining forecasting report types 111Discovering why there is null in the result set 112
Ranking report types . . . . . . . . . . . 113Ranking key terms . . . . . . . . . . 113Multiple ranking sets . . . . . . . . . . 114Ranking by time . . . . . . . . . . . 114Ranking by attribute . . . . . . . . . . 114Ordering and duplicates in report results . . . 114Guidelines for ranking report types . . . . . 115
N-High Busy Hour report types . . . . . . . 115N-High Hours report . . . . . . . . . . 115N-High Days report . . . . . . . . . . 117Guidelines for N-High Busy Hour report types 120
Filtered N-High Busy Hour reports . . . . . . 122Key terms for filtered N-High reports . . . . 123How filtered N-High reports are calculated . . 124
Guidelines for Filtered N-High Busy HourReport Types . . . . . . . . . . . . 126
Chapter 9. Working with reportdefinitions and templates . . . . . . 127Report definition overview . . . . . . . . . 127
Report definition parts . . . . . . . . . 127Report definition defaults . . . . . . . . . 129Going beyond the defaults . . . . . . . . . 130
About the Focal Entity type . . . . . . . 130Perspectives . . . . . . . . . . . . . 131Field Selections . . . . . . . . . . . . 133Filtering . . . . . . . . . . . . . . 136Group By and report totals . . . . . . . . 137
Before you begin . . . . . . . . . . . . 140Creating a report definition. . . . . . . . . 140
Selecting a data source . . . . . . . . . 140Selecting a Focal Entity type . . . . . . . 141Selecting fields . . . . . . . . . . . . 144Making a relative Date-Time selection . . . . 148Making a calendar Date-Time selection . . . . 152Building a filter . . . . . . . . . . . 154Selecting Non-Stored Busy Hour options . . . 160Selecting Group By options. . . . . . . . 163Selecting Ranking options . . . . . . . . 165Selecting Filtered N-High options . . . . . 166Selecting the Rehoming option . . . . . . 166Selecting the Confidence Factor option . . . . 168
Creating a report definition by using a template 168Saving a report definition . . . . . . . . . 169Running an Immediate Report. . . . . . . . 170Running a report by using the KPI Browser . . . 172
Reporting period . . . . . . . . . . . 175KPI Browser toolbar . . . . . . . . . . 176
Running a report from the command line . . . . 176Opening a report definition . . . . . . . . 176Editing a report definition . . . . . . . . . 177Deleting a Report Definition . . . . . . . . 178Report definition templates. . . . . . . . . 179
Creating a report definition template . . . . 179Saving a report definition template . . . . . 179Opening a report definition template . . . . 180Editing a report definition template . . . . . 180Deleting a report definition template . . . . 181
Chapter 10. Scheduling a report . . . 183What is a schedule entry? . . . . . . . . . 183Parts of the schedule page . . . . . . . . . 184Creating a schedule . . . . . . . . . . . 185
Creating a schedule entry . . . . . . . . 186Setting up a schedule entry. . . . . . . . 186
Opening a Schedule . . . . . . . . . . . 189Deleting a schedule . . . . . . . . . . . 189
Chapter 11. Alarm Viewer . . . . . . 191View an alarm . . . . . . . . . . . . . 191Filter alarms. . . . . . . . . . . . . . 192
Severity . . . . . . . . . . . . . . 192Object Class . . . . . . . . . . . . . 193
Configure the current alarms display . . . . . 193
iv IBM Tivoli Netcool Performance Manager: User Guide

Acknowledge alarms . . . . . . . . . . . 194Clear alarms from the display . . . . . . . . 194
Chapter 12. Alarm Exporter . . . . . 195Activate or deactivate existing Alarm Exporterrules . . . . . . . . . . . . . . . . 195Access the Target, Target Group and Export Rulefunctions . . . . . . . . . . . . . . . 195Manage Targets. . . . . . . . . . . . . 195
Creating a Target . . . . . . . . . . . 195Updating a Target . . . . . . . . . . . 197Deleting a Target . . . . . . . . . . . 198
Manage Target Groups . . . . . . . . . . 198Create a Target Group . . . . . . . . . 198Update a Target Group . . . . . . . . . 199Delete a Target Group . . . . . . . . . 199
Manage Export Rules. . . . . . . . . . . 199Create an Export Rule . . . . . . . . . 200Update an Export Rule . . . . . . . . . 201Delete an Export Rule . . . . . . . . . 201
Chapter 13. Alarm Manager . . . . . 203The Alarm Template tool . . . . . . . . . 203
Alarm Template Tree view . . . . . . . . 204Alarm Template tabs . . . . . . . . . . 204Create an Alarm Template . . . . . . . . 209Update an Alarm Template . . . . . . . . 210Delete an Alarm Template . . . . . . . . 211
Alarm Definition tool. . . . . . . . . . . 211The Alarm Definition Tree view . . . . . . 212The Document panel . . . . . . . . . . 212Normal view . . . . . . . . . . . . 212Advanced view. . . . . . . . . . . . 213Create an Alarm Definition . . . . . . . . 218Activate an Alarm Definition . . . . . . . 219Deactivate an Alarm Definition . . . . . . 219View the status of an Alarm Definition . . . . 220Update an Alarm Definition . . . . . . . 220Delete an Alarm Definition . . . . . . . . 221
Chapter 14. Tools. . . . . . . . . . 223User administration . . . . . . . . . . . 223Data availability . . . . . . . . . . . . 223
Data availability page . . . . . . . . . 224Data availability views . . . . . . . . . 225Navigating and understanding data availabilityviews . . . . . . . . . . . . . . . 227
Changing your password . . . . . . . . . 230User defined calculations . . . . . . . . . 231License Status . . . . . . . . . . . . . 231Archiver tool usage . . . . . . . . . . . 232Archiving an NC table . . . . . . . . . . 233
Chapter 15. User Defined Calculations 235Who creates UDCs? . . . . . . . . . . . 235
When to create UDCs . . . . . . . . . 235Expressions and aggregation types . . . . . 235Stored Busy Hours . . . . . . . . . . 236Roll-Up values for UDCs . . . . . . . . 236
Expressions in UDCs . . . . . . . . . . . 236
Expression building blocks . . . . . . . . 237Expression syntax . . . . . . . . . . . 237
The User Defined Calculation page . . . . . . 238Opening the User Defined Calculation Page . . . 239Finding a UDC . . . . . . . . . . . . . 240Creating a UDC . . . . . . . . . . . . 240
UCD creation process . . . . . . . . . 241Selecting an initial entity for a UDC . . . . . 241Building and validating expressions . . . . . 242Setting UDC properties . . . . . . . . . 245
Renaming a UDC . . . . . . . . . . . . 246Renaming prerequisites . . . . . . . . . 246How to Rename a UDC . . . . . . . . . 247
Deleting a UDC . . . . . . . . . . . . 247
Chapter 16. UDC expressions andfunction reference . . . . . . . . . 249General expressions . . . . . . . . . . . 249
Elements . . . . . . . . . . . . . . 249Remarks . . . . . . . . . . . . . . 249Examples . . . . . . . . . . . . . . 249Constants . . . . . . . . . . . . . 250Conditions . . . . . . . . . . . . . 251Operators . . . . . . . . . . . . . 251
Arithmetic operators . . . . . . . . . . . 252Logic Operators . . . . . . . . . . . . 253
Sample expressions . . . . . . . . . . 253Remarks . . . . . . . . . . . . . . 254
Functions. . . . . . . . . . . . . . . 254Elements . . . . . . . . . . . . . . 254
Math functions . . . . . . . . . . . . . 254abs . . . . . . . . . . . . . . . . 254ceil . . . . . . . . . . . . . . . . 255exp . . . . . . . . . . . . . . . . 255floor . . . . . . . . . . . . . . . 255log . . . . . . . . . . . . . . . . 256round . . . . . . . . . . . . . . . 256sqr . . . . . . . . . . . . . . . . 256sqrt. . . . . . . . . . . . . . . . 257trunc . . . . . . . . . . . . . . . 257
Special aggregation functions . . . . . . . . 257Logic functions . . . . . . . . . . . . . 258
InGroup . . . . . . . . . . . . . . 258isNull . . . . . . . . . . . . . . . 258nullValue . . . . . . . . . . . . . . 259decode() . . . . . . . . . . . . . . 259Conditional Operator (?). . . . . . . . . 260
Null functions . . . . . . . . . . . . . 260Formatting functions . . . . . . . . . . . 261Conversion functions . . . . . . . . . . . 262Data availability functions . . . . . . . . . 262
DataAvailKPI . . . . . . . . . . . . 262DataAvailBlock . . . . . . . . . . . . 263Period functions . . . . . . . . . . . 264periodEnd . . . . . . . . . . . . . 264periodRange. . . . . . . . . . . . . 264periods . . . . . . . . . . . . . . 264
Traffic functions . . . . . . . . . . . . 265percentFail . . . . . . . . . . . . . 265percentOk . . . . . . . . . . . . . 265thresholdDiv . . . . . . . . . . . . 265
Contents v

Erlang based functions . . . . . . . . . 266circ . . . . . . . . . . . . . . . . 268crit . . . . . . . . . . . . . . . . 268gos . . . . . . . . . . . . . . . . 268gose . . . . . . . . . . . . . . . 269TC4 . . . . . . . . . . . . . . . 269toff . . . . . . . . . . . . . . . . 269Kaufman-Roberts based functions . . . . . 270kaufmanAllC . . . . . . . . . . . . 271kaufmanMinC . . . . . . . . . . . . 271kaufmanPB . . . . . . . . . . . . . 272kaufmanMaxPB . . . . . . . . . . . 272Global constant functions . . . . . . . . 273parameterInt . . . . . . . . . . . . 273parameterFloat . . . . . . . . . . . . 273
Trending functions . . . . . . . . . . . 273Trending UDC expression syntax . . . . . . 274
Setting UDC constants . . . . . . . . . . 277parameter_admin tool overview . . . . . . 277Using the paramater_admin tool . . . . . . 278
Chapter 17. Aggregation types . . . . 279Pegs . . . . . . . . . . . . . . . . 279Complex KPIs . . . . . . . . . . . . . 279Computation for complex KPIs . . . . . . . 280After time aggregation and after entity aggregation 281
SumSum . . . . . . . . . . . . . . 281After time aggregation . . . . . . . . . . 281
SumMin . . . . . . . . . . . . . . 281Before time aggregation . . . . . . . . . . 282
MinSum . . . . . . . . . . . . . . 282MinMin . . . . . . . . . . . . . . 282
Aggregation properties . . . . . . . . . . 282Aggregation properties and complex KPIcomputation. . . . . . . . . . . . . 283
Appendix. Rehoming . . . . . . . . 285Rehoming Example . . . . . . . . . . . 285
Reporting on Rehomed Data - 07:00 . . . . . 285Reporting on Rehomed Data - 08:00 . . . . . 286Reporting on Rehomed Data - 09:00 . . . . . 288Reporting on Rehomed Data - 10:00 . . . . . 289Reporting on Rehomed Data - GroupingConsiderations . . . . . . . . . . . . 291
Notices . . . . . . . . . . . . . . 293Terms and conditions for product documentation 295Trademarks . . . . . . . . . . . . . . 296
Glossary . . . . . . . . . . . . . 297
vi IBM Tivoli Netcool Performance Manager: User Guide

About this information
This information provides instructions and general information on how to use IBMTivoli Netcool Performance Manager software to create and view performanceanalysis reports for a telecommunications network.
Intended audienceThe intended audiences for this information are as follows:v Managers and others who track network performance metricsv Technicians and engineers who use the Tivoli Netcool Performance Manager
software to manage and analyze network performance.In general, the reader of this guide is referred to as "you." By contrast, "we"refers to the Tivoli Netcool Performance Manager development and technicalstaff who support this product.
Required skills and knowledge
Readers need to be familiar with the following:v Operating System:
– Microsoft® Windows®
– Basics of the Microsoft Internet Explorer browser
The Tivoli Netcool Performance Manager - Wireless component userpublications
Tivoli Netcool Performance Manager - Wireless component consists of thefollowing publications:
Table 1. Tivoli Netcool Performance Manager - Wireless component user documentation
Document Description
Release Summary for Tivoli Netcool PerformanceManager
Additional release-specific information not in theguides.
Installing Tivoli Netcool Performance Manager -Wireless Component
Instructions for installing and configuring theTivoli Netcool Performance Manager software.
Upgrading Tivoli Netcool Performance Manager -Wireless Component
Instructions for upgrading Tivoli NetcoolPerformance Manager software.
Administering Tivoli Netcool Performance Manager -Wireless Component
Instructions and general information about how tomaintain and support Tivoli Netcool PerformanceManager
Using Tivoli Netcool Performance Manager - WirelessComponent
Conceptual information and procedures for usingTivoli Netcool Performance Manager software forperformance, trending analysis and performancealarms.
Installing and Using Tivoli Netcool PerformanceManager - Application Studio - Wireless Component
Provides instructions for installation and usage ofthe Tivoli Netcool Performance Manager -Application Studio.
Tivoli Monitoring Integration - Wireless Component Provides instructions for integrating IBM TivoliMonitoring with Tivoli Netcool PerformanceManager.
© Copyright IBM Corp. 2006, 2015 vii

Table 1. Tivoli Netcool Performance Manager - Wireless component userdocumentation (continued)
Document Description
Tivoli Netcool/OMNIbus Web GUI Integration -Wireless Component
Provides instructions for integrating IBM TivoliNetcool/OMNIbus Web GUI with Tivoli NetcoolPerformance Manager.
The documentation is available on the knowledge center at http://www-01.ibm.com/support/knowledgecenter/SSBNJ7/welcome.
viii IBM Tivoli Netcool Performance Manager: User Guide

Chapter 1. Introduction
Tivoli Netcool Performance Manager Wireless component software is a tool thatassists you in managing wireless network infrastructure.
Using the performance management (PM) reporting feature, you can do thefollowing:v Report on key performance indicators (KPIs).v Optimize performance by:
– Monitoring network infrastructure performance.– Isolating, analyzing, and resolving service-affecting problems.
v Plan infrastructure capacity
System componentsThe Tivoli Netcool Performance Manager software loads network data and servesthe data to users through a Tivoli Netcool Performance Manager Web client asshown in the following figure.
Legend:
NetworkData acquisition tools collect statistical information fromtelecommunication network equipment, such as cell sites and switches, thatcomprise the wireless network.
Data sourceThe acquired data is then loaded into an Oracle database. This dataincludes the performance measurements collected from the networkelements and entity model information.
© Copyright IBM Corp. 2006, 2015 1

Server The server serves the acquired data to users on demand.
User communityUsers log into the server to define, run, and view reports, using the pagesof the Tivoli Netcool Performance Manager Web client.
Web clientYou work with performance management reports and alarms by using the pages ofthe Tivoli Netcool Performance Manager Web client. The Web interface is dividedinto tabs and pages, through which you perform your Tivoli Netcool PerformanceManager tasks.
The following table describes the functional tabs and their pages:
Table 2. Functional tabs and pages
Tab Page Description
MyFavorites All pages in tab Displays multiple report results easily.
favorite Displays a single MyFavorites page.
new page Allows you to create a new MyFavoritespage.
manage page Allows you to open a MyFavorites page,and to delete a MyFavorites page.
myfavorites help Shows procedures for commonMyFavorites tasks.
Reporting All pages in tab Contains all the functionality that youneed to create, save, and run a reportdefinition.
define report Contains a wizard-like interface that stepsyou through creating a report definition,or report template. After completing thereport definition, you can run the reportimmediately.
manage report Allows you to open a saved reportdefinition or template. Allows you todelete a report definition or template.
new schedule Allows you to schedule a report to run ata future date.
reporting help Shows procedures for common reportingtasks.
kpi browser Shows report results in graphical format.
manage schedule Allows you to open, modify, or delete asaved schedule.
Alarm All pages in tab Contains all the functionality that youneed to view alarms, create alarmdefinitions, and export alarms.
alarm viewer View each alarm raised in the system.
alarm manager Allows you to define alarm templates anddefinitions.
alarm exporter Allows you to activate/deactivate alarmexport rules. Allows you to create exporttargets.
2 IBM Tivoli Netcool Performance Manager: User Guide

Table 2. Functional tabs and pages (continued)
Tab Page Description
alarm help Allows you to open a saved schedule.
Browse All pages in tab The storage area for all Tivoli® Netcool®
Performance Manager documents.
All the documents related to reportgeneration and viewing are stored in thisarea.
personal documents Contains documents created by you. Youhave full permissions for documentslocated in their personal area.
vault Contains documents that you or otherusers published. Permissions are set bythe user who published the documents.
browse help Shows procedures for common browsetasks.
Monitor All pages in tab Lists all reports that are being generatedor have been recently generated. You usethis area to check the status of a reportthat is in the process of being generated.
jobs Lists reports by the name of the reportgroup.
tasks Lists reports by the name of the individualreport.
monitor help Shows procedures for common monitortasks.
Preferences Single page in tab Allows you to set default behaviors forthe Web client.
Tools Single page in tab Contains numerous tools to assist you inyour tasks.
Chapter 1. Introduction 3

4 IBM Tivoli Netcool Performance Manager: User Guide
Chapter 2. Getting started
Get started with the Tivoli Netcool Performance Manager Web client by providingthe logon procedure and a number of key concepts. It also offers an overview ofthe tasks you are most likely to perform when working with performancemanagement reports.
Browser usageModern browsers such as Internet Explorer and Firefox allow several pages to beopen simultaneously in either several distinct browser windows, or several tabswithin the same browser window.
Multiple windows and tabsDepending on the browser, multiple windows or tabs implicitly share the sameserver session. Aside from the report result viewer, if several windows or tabssharing the same session are used, links and buttons in Tivoli Netcool PerformanceManager may not behave as expected.
Important: It is strongly recommended the browser be operated in a singlebrowser window, with no additional browser tabs or windows to ensure theintegrity of your user session.
Downloading report results to ExcelIf you are using Internet Explorer with prompting for file downloads turned off,you may not be able to download report results to Excel.
To open report results in Excel, Automatic prompting for file downloads must beenabled in your Security settings in Internet Explorer for the appropriate zone.
See your Internet Explorer documentation for instructions on changing yoursettings.
Logging onDescribes the procedure for logging in to the Tivoli Netcool Performance ManagerWeb client through the browser.
About this task
To log onto the Tivoli Netcool Performance Manager Web client, you open yourInternet Explorer browser and point it to a URL. You need the following items,which your administrator should provide:v URL of the Tivoli Netcool Performance Manager serverv Login (user) identificationv Password
Note: The login ID and password are both case sensitive.
To log on to the Tivoli Netcool Performance Manager Web client:
© Copyright IBM Corp. 2006, 2015 5
Procedure1. Start your internet browser and point it to the URL of the Tivoli Netcool
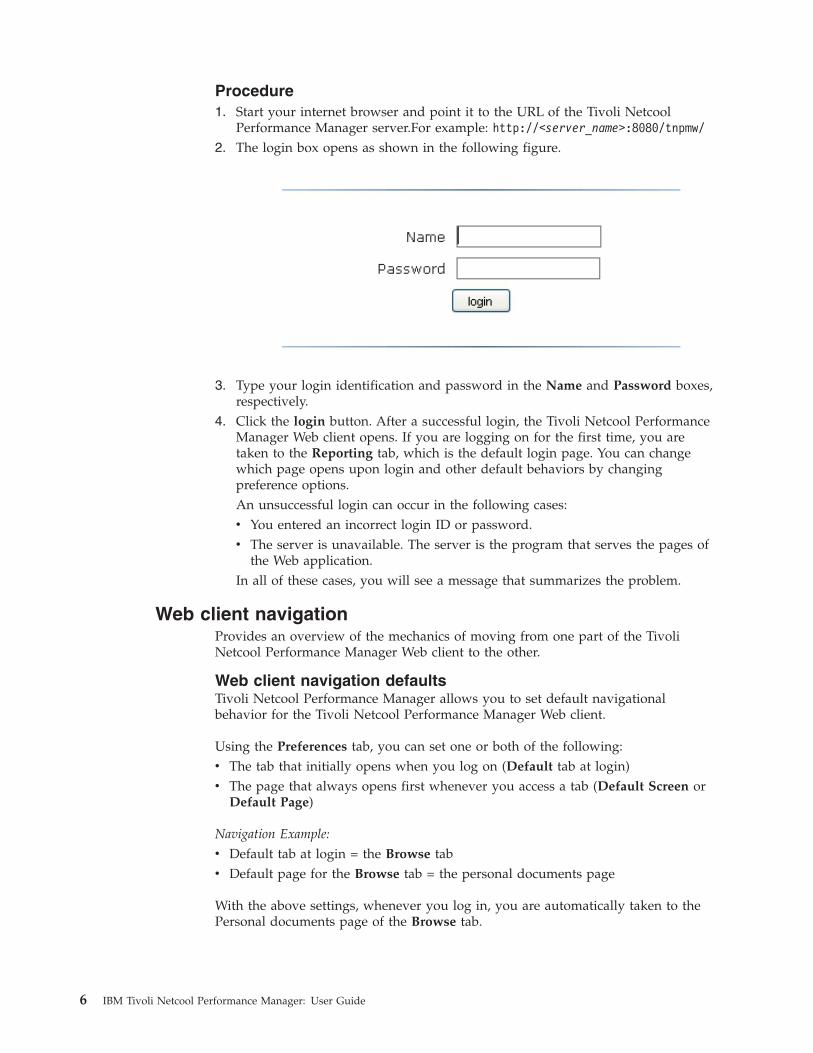
Performance Manager server.For example: http://<server_name>:8080/tnpmw/2. The login box opens as shown in the following figure.
3. Type your login identification and password in the Name and Password boxes,respectively.
4. Click the login button. After a successful login, the Tivoli Netcool PerformanceManager Web client opens. If you are logging on for the first time, you aretaken to the Reporting tab, which is the default login page. You can changewhich page opens upon login and other default behaviors by changingpreference options.An unsuccessful login can occur in the following cases:v You entered an incorrect login ID or password.v The server is unavailable. The server is the program that serves the pages of
the Web application.In all of these cases, you will see a message that summarizes the problem.
Web client navigationProvides an overview of the mechanics of moving from one part of the TivoliNetcool Performance Manager Web client to the other.
Web client navigation defaultsTivoli Netcool Performance Manager allows you to set default navigationalbehavior for the Tivoli Netcool Performance Manager Web client.
Using the Preferences tab, you can set one or both of the following:v The tab that initially opens when you log on (Default tab at login)v The page that always opens first whenever you access a tab (Default Screen or
Default Page)
Navigation Example:
v Default tab at login = the Browse tabv Default page for the Browse tab = the personal documents page
With the above settings, whenever you log in, you are automatically taken to thePersonal documents page of the Browse tab.
6 IBM Tivoli Netcool Performance Manager: User Guide

Navigating the web clientUse the following procedure to navigate from one area of the Tivoli NetcoolPerformance Manager Web client to another.
About this task
This procedure assumes that you have logged in to the Tivoli Netcool PerformanceManager Web client.
To navigate the Web client:
Procedure1. Click the tab with the functionality you want. If the tab has multiple pages, by
default the Help page opens. You can change this default by setting the defaultscreen or default page options in the Preferences tab (see “Setting preferenceoptions” on page 12).
2. If the tab has multiple pages, click the page heading of choice. The selectedpage opens.
DocumentsDocuments are the components that you use to create, schedule, run, and viewlocal performance management reports (such as report definitions, schedule entries,and report output).
Documents can also be external documents; documents that were created usingother software than Tivoli Netcool Performance Manager software and importedinto the Browse tab.
All documents are organized in folders that operate much like the expanding andcollapsing folders in many operating system interfaces.
To work with documents, such as viewing and editing, you need the appropriateset of privileges and permissions. For details, see “Privileges and permissions.”
Privileges and permissionsPrivileges and permissions work together and affect the tasks that you can performusing the Tivoli Netcool Performance Manager Web client.
These two terms are described here:v Privileges - Applies to functionality in tabbed pages of the Web client.v Permissions - The documents and folders in the Web client take read and write
permissions.
Permissions
When a user creates a document or folder (item), the user becomes the owner ofthe item, and as such, has full permissions for that item. Full permissions consistsof the read and write. When the user wants to share the item with other users, theuser publishes it. While publishing the item, the user sets read and writepermissions on the item for the other users.
See “Read and write permissions” on page 56 for the permissions required toperform a specific task.
Chapter 2. Getting started 7
A user can set permissions for individual user or groups of users. See “User andgroup permissions” on page 69.
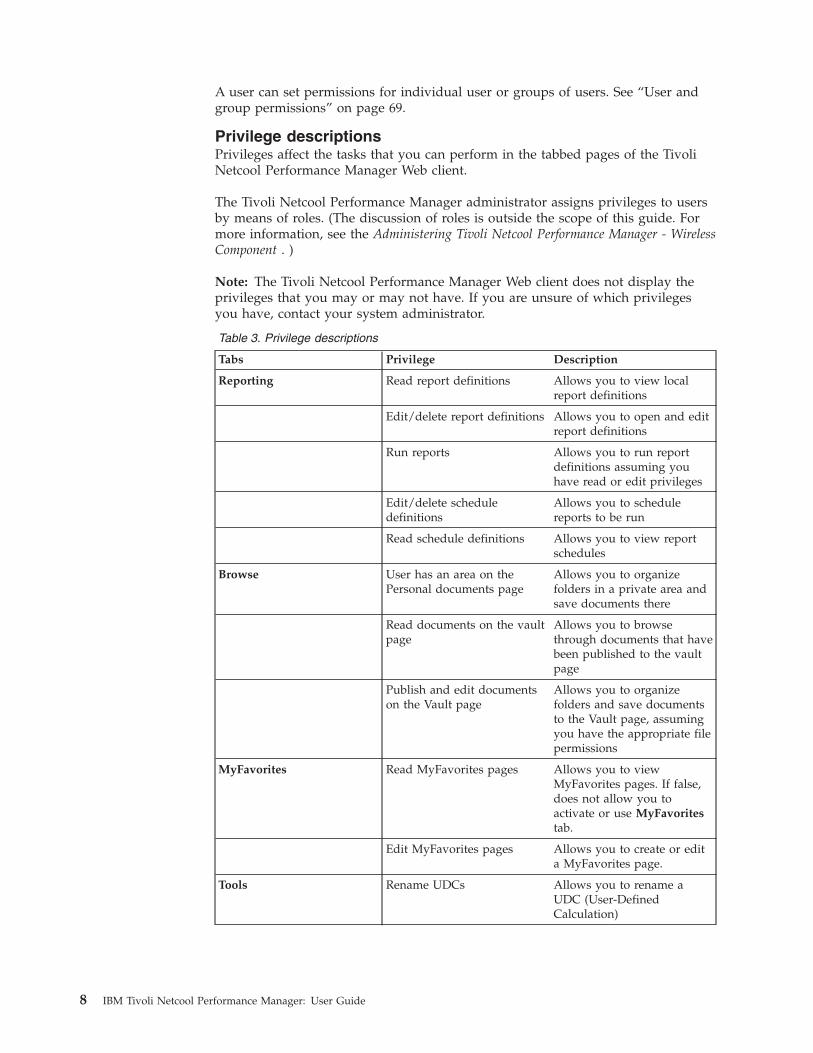
Privilege descriptionsPrivileges affect the tasks that you can perform in the tabbed pages of the TivoliNetcool Performance Manager Web client.
The Tivoli Netcool Performance Manager administrator assigns privileges to usersby means of roles. (The discussion of roles is outside the scope of this guide. Formore information, see the Administering Tivoli Netcool Performance Manager - WirelessComponent . )
Note: The Tivoli Netcool Performance Manager Web client does not display theprivileges that you may or may not have. If you are unsure of which privilegesyou have, contact your system administrator.
Table 3. Privilege descriptions
Tabs Privilege Description
Reporting Read report definitions Allows you to view localreport definitions
Edit/delete report definitions Allows you to open and editreport definitions
Run reports Allows you to run reportdefinitions assuming youhave read or edit privileges
Edit/delete scheduledefinitions
Allows you to schedulereports to be run
Read schedule definitions Allows you to view reportschedules
Browse User has an area on thePersonal documents page
Allows you to organizefolders in a private area andsave documents there
Read documents on the vaultpage
Allows you to browsethrough documents that havebeen published to the vaultpage
Publish and edit documentson the Vault page
Allows you to organizefolders and save documentsto the Vault page, assumingyou have the appropriate filepermissions
MyFavorites Read MyFavorites pages Allows you to viewMyFavorites pages. If false,does not allow you toactivate or use MyFavoritestab.
Edit MyFavorites pages Allows you to create or edita MyFavorites page.
Tools Rename UDCs Allows you to rename aUDC (User-DefinedCalculation)
8 IBM Tivoli Netcool Performance Manager: User Guide

Note: In addition to the privileges listed in the preceding table, there arenumerous administrative privileges. For example, users with these privileges canaccess another user's personal documents, edit documents independent ofpermissions, change document ownership, and so on.
Privileges and permissions togetherTo perform a specific task using the Tivoli Netcool Performance Manager Webclient, you need the appropriate set of privileges and permissions to perform thetask. This concept is illustrated in the following figure.
Example :
Assume you want to edit a document that has been published on the Vault page.To do so, you would need the following set of privileges and permissions:
Privilege Publish and edit documents on the Vault page.
Permissions v Write access to the document
v Write access to the parent folder of the document
PreferencesThe Preferences page allows you to set certain default behaviors for the TivoliNetcool Performance Manager Web client. The following topics explain andprovide instructions for preference options.
Preference option descriptionsThe following table lists the description of each preference and its default, presetvalue. When you log on for the first time, the default, preset values are in effect.
Chapter 2. Getting started 9

Table 4. Preset Preference Defaults
Tab Preference Description Default Value
General Default Tab at login Allows you to set which tabinitially opens when you logon. See “Web clientnavigation defaults” on page6.
Reporting tab
MyFavorites Default MyFavoritesPage
Allows you to set whichpage opens whenever youaccess this tab. See “Webclient navigation defaults” onpage 6.
MyFavorites help
Default MyFavoritesPage Folder
Sets the default folder for theNew Page, Open Page, andDelete Page sub tabs.Whenever you save, open, ordelete a MyFavorites page,the folder you set here is thedefault.
Browse tab / rootof personaldocuments
Favorite Page This option allows you toadd a singleMyFavoritespage to the MyFavorites tabfor immediate viewing.
Blank box
Reporting Default ReportingScreen
Allows you to set whichpage opens whenever youaccess this tab. See “Webclient navigation defaults” onpage 6.
Reporting help
Default ReportDefinition Folder
Sets the default folder for theDefine Report, OpenReport, and Delete Reportsub tabs. Whenever yousave, open, or delete a reportdefinition, the folder you sethere is the default.
Browse tab / rootof personaldocuments
Default ImmediateReport Results Folder
Allows you to specify adefault folder in which tosave immediate reportresults. See “Saving to adefault folder” on page 65.
Browse tab / rootof personaldocuments
Auto-OrganizeReporting Destinations
Enter variables in this box toautomatically organize reportresults. For a list of validvariables, see“Auto-organizing variables”on page 67.
Blank box
Default ScheduledEntry Folder
Sets the default folder for theNew Schedule, OpenSchedule, and DeleteSchedule sub tabs. Wheneveryou save, open, or delete aschedule entry, the folderyou set here is the default.
Browse tab / rootof personaldocuments
10 IBM Tivoli Netcool Performance Manager: User Guide

Table 4. Preset Preference Defaults (continued)
Tab Preference Description Default Value
Default ScheduledReport Results Folder
Allows you to specify adefault folder in which tosave output from scheduledreports. See “Saving to adefault folder” on page 65.
Browse tab / rootof personaldocuments
Browse Default Browse Screen Allows you to set whichpage opens whenever youaccess this tab. See “Webclient navigation defaults” onpage 6.
Browse help
Monitor Default MonitorScreen
Allows you to set whichpage opens whenever youaccess this tab. See “Webclient navigation defaults” onpage 6.
Monitor help
Max Number Per Page This option determines howmany reports are listed on apage.
10
Report Name SearchCase Sensitive
This option affects a searchon a report name. When thisoption is set to Yes , thecapitalization of search termsmust match the capitalizationof the report name.
Example: If the option is setto Yes, the search termCellR* only returns reportnames starting with CellR . Itdoes not return reportsstarting with CellR or Cellr .
No
Sorting Case Sensitive This option affects how thecolumns are sorted. Whenthis option is set to Yes, thecapitalized (upper-case)characters precede lower-casecharacters.
Example:Cellrpt precedescellrpt.
Yes
Tools Default Tools Screen Allows you to set whichpage opens whenever youaccess this tab.
Tools Help
Data Availability MaxNumber Per Page
Allows you to set themaximum number of rows todisplay per page.
20
Chapter 2. Getting started 11

Table 4. Preset Preference Defaults (continued)
Tab Preference Description Default Value
Report Viewer Default Rollup Level This option determineswhich roll-up level isdisplayed when you initiallyopen an HTML view:
Bottom: Displays the lowestaggregated totals for thereport.
Top: Displays the summaryaggregation total for theentire report.
See “About roll-up levels” onpage 30 for an explanation ofthese terms.
Bottom
Default BackgroundColor for Charts
See “Changing the chartbackground color” on page40.
#A4BBE8
Max Number Per Page Sets the number of lines thatthe HTML viewer displayson one page
24 linesNote: 24 linesdisplays a day'sworth of hourlydata on one page
Alarm Default Alarm Screen Allows you to set which tabinitially opens when youaccess this tab. See “Webclient navigation” on page 6for more information.
Alarm help tab
Perspective Perspective Allows you to define adefault Perspective for use inselecting an entity type - forexample, when creating areport. See “Perspectives” onpage 131 for moreinformation on creating aperspective.
n/a
Setting preference optionsUse the following procedure to set preference options.
About this task
To set preference options:
Procedure1. Select the Preferences tab. The Preferences page opens.2. Set the preference options you want.3. After entering new option values, do one of the following:
a. Click the Set button. The page is updated with your selections. The changestake effect immediately.
12 IBM Tivoli Netcool Performance Manager: User Guide

b. Click the Reset button. It will clear any changes you have made and takeyou out of edit mode. If you click the edit button of another option, it willclear any changes you have made in the current option, and put the newoption in edit mode.
Where to start with PM reportsWhere you start depends upon the task you need to accomplish.
The following topics review the more frequent tasks that you might perform whenworking with performance management reports.v “Viewing PM report results”v “Creating a PM report” on page 15v “Publishing PM report results” on page 16v “Editing a PM report definition” on page 17
Viewing PM report resultsDescribes the tasks for finding and viewing private and published reports in theBrowse tab.
About this task
The task flow in the following figure outlines the tasks for finding and viewingprivate and published reports in the Browse tab. A private report is one thatresides on the Personal Documents page, and thus, can only be viewed by itsowner. A published report is one that is located on the Vault page and can beviewed by many, depending upon the permissions.
Note: You can also view the same report results by using the MyFavorites tab. SeeChapter 4, “MyFavorites pages,” on page 47.
Note: It is also possible to view exported report results. See “Exporting reports” onpage 73.
Chapter 2. Getting started 13

Legend:
Task Description
1 Find report results.
What You Need to Know:
v How documents are organized -- The documents are organized in afolder tree, which is similar to a folder structure. See “The folder tree” onpage 54.
v Privileges and permissions -- Privileges and permissions affect what tasksyou can perform, particularly when working with published reportresults. ee “Privileges and permissions” on page 7 and “About vaultviewing” on page 58
What You Need to Do:
Go to the report results. See “Finding a document or folder in the Browsetab” on page 59.
Go to the report results.
2 View report results. You can either view report results in the Tivoli NetcoolPerformance Manager Web client, or you can download the results.
What You Need to Do:
v To open a report see “Opening a report” on page 23.
v To download a report in Excel, see “Downloading an Excel file” on page46.
v To download a report as a CSV file, see “Downloading a CSV file” onpage 42.
v To download a report as an XML file, see “Downloading an XML file” onpage 45.
v To external export reports, see “Exporting reports” on page 73.
14 IBM Tivoli Netcool Performance Manager: User Guide
Creating a PM reportDescribes the tasks for creating a local report.
About this task
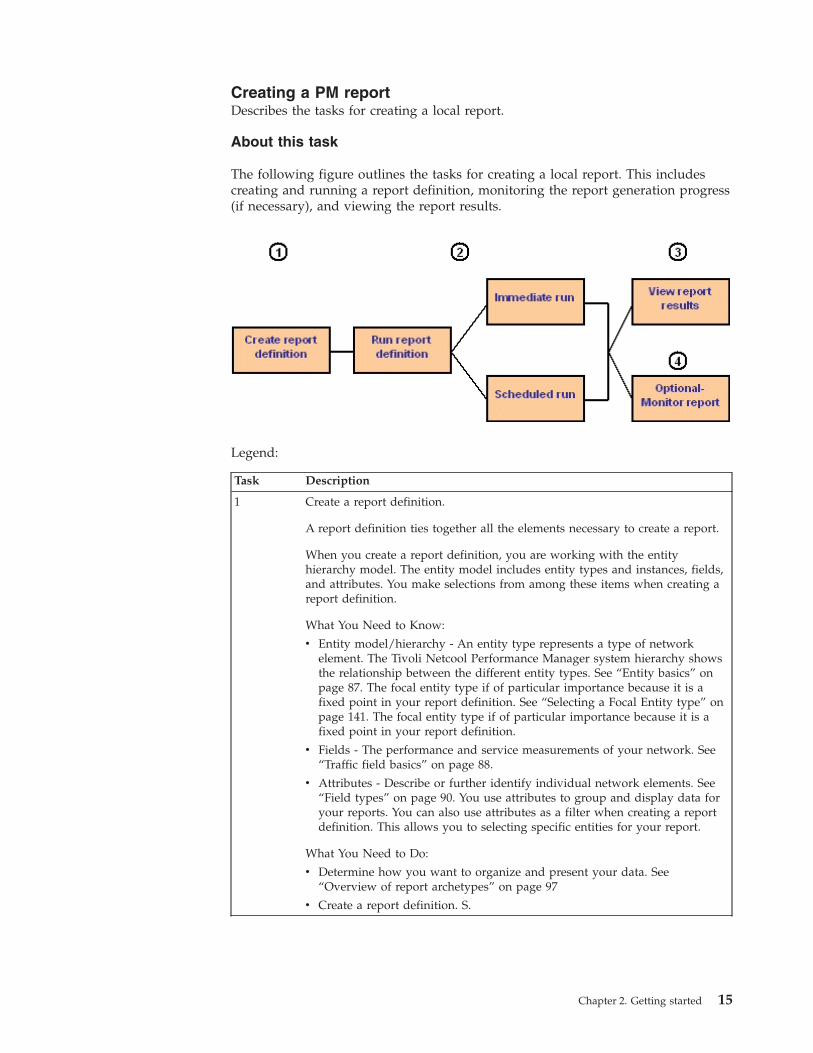
The following figure outlines the tasks for creating a local report. This includescreating and running a report definition, monitoring the report generation progress(if necessary), and viewing the report results.
Legend:
Task Description
1 Create a report definition.
A report definition ties together all the elements necessary to create a report.
When you create a report definition, you are working with the entityhierarchy model. The entity model includes entity types and instances, fields,and attributes. You make selections from among these items when creating areport definition.
What You Need to Know:
v Entity model/hierarchy - An entity type represents a type of networkelement. The Tivoli Netcool Performance Manager system hierarchy showsthe relationship between the different entity types. See “Entity basics” onpage 87. The focal entity type if of particular importance because it is afixed point in your report definition. See “Selecting a Focal Entity type” onpage 141. The focal entity type if of particular importance because it is afixed point in your report definition.
v Fields - The performance and service measurements of your network. See“Traffic field basics” on page 88.
v Attributes - Describe or further identify individual network elements. See“Field types” on page 90. You use attributes to group and display data foryour reports. You can also use attributes as a filter when creating a reportdefinition. This allows you to selecting specific entities for your report.
What You Need to Do:
v Determine how you want to organize and present your data. See“Overview of report archetypes” on page 97
v Create a report definition. S.
Chapter 2. Getting started 15

Task Description
2 Run a report definition.
v You can run a report immediately after you create it, or you can scheduleto run it at a later time. See “Running an Immediate Report” on page 170.You can run and wait for a report, or run the report in the background.
v To schedule the report to run at a future time, see Chapter 10, “Schedulinga report,” on page 183.
3 View the report.
All successfully generated reports are posted to the Browse tab.
What You Need to Know:
How documents are stored - All documents in theTivoli Netcool PerformanceManager Web client, including reports, are stored in a folder tree, whichoperates in a similar manner to the a folder structure. See “The folder tree”on page 54.
What You Need to Do:
Find the report. See “Finding a document or folder in the Browse tab” onpage 59.
4 Optional - Monitor the report.
If the report generation is unsuccessful, the report is posted in the Monitortab with the Failed status. If successful, it is posted to both the Monitor tab(with the Done status) and the Browse tab.
What You Need to Know:
Types of report status -- The reports take on different statuses as they movethrough the report generation process. See “Report status” on page 80.
What You Need to Do:
v Go the Monitor/tasks page, and then find the report. See “Finding a reportin the Monitor tab” on page 81.
v View a report through the Monitor tab. See “Viewing report output” onpage 84.
v If the report failed, you can view report logs and additional information.See “Viewing auxiliary report information” on page 84.
Publishing PM report resultsThe task flow in the following figure shows the tasks for publishing the results ofa report, which includes running a report, saving the report results to the PersonalDocuments area, and then publishing the report results to other users.
About this task
When you publish report results, the report results are moved from the PersonalDocuments page to the Vault page.
Note: When you run a report, you can also save the report results directly to theVault page. When you save directly to the Vault page, the default user and grouppermissions are applied. See “User and group permissions” on page 69.
16 IBM Tivoli Netcool Performance Manager: User Guide

Legend:
Task Description
1 Find the report definition.
See step 1 in “Viewing PM report results” on page 13. Because a reportdefinition and the report output are both documents, the task is the same.
2 Open and run the report definition.
What You Need to Do:
v To open the report definition, see “Opening a report definition” on page 176.
v To run a report, see step 2 in “Running an Immediate Report” on page 170.
3 Publish the report results.
What You Need to Know:
Read and write permissions -- When you publish a document (including reportresults), you grant read and write permissions to users. These permissions affectwhat tasks the users can perform. “Document and folder permissions” on page55.
What You Need to Do:
Publish the report. See “Publishing a document or folder” on page 69.
Editing a PM report definitionThe task flow in the following figure shows the tasks involved for editing apublished (public) report definition and running it.
About this task
Table 5. Legend
Task Description
1 Find the public report definition.
See step 1 in “Viewing PM report results” onpage 13. Because a report definition andreport results are both documents, the taskis the same.
Chapter 2. Getting started 17

Table 5. Legend (continued)
Task Description
2 Copy the report definition to another folder.
3 Open the report definition and edit it.
v To open the report definition, see“Opening a report definition” on page176.
v To edit the report definition, see “Editinga report definition” on page 177.
4 Run the report.
See “Running an immediate report” on page60.
18 IBM Tivoli Netcool Performance Manager: User Guide

Chapter 3. Viewing report results
Tivoli Netcool Performance Manager software offers a wide variety of reportformats that give you different ways to analyze and present report results. Reportresults are viewable from a number of different locations.
The following topics address where you can find and view report results, andways in which to view report results.
It is also possible to view exported report results. See “Exporting reports” on page73 for more information on exporting report results.
Where to find report resultsReport results can be located in a number of places in the Tivoli NetcoolPerformance Manager Web client.
Where you can find and view report results depends on a number of differentfactors:v Whether the report is a private or published documentv Whether the report has been added to a MyFavorites pagev Whether the report is in the process of being generated
The following table summarizes the places where you can find a report based onthe above bulleted factors.
Table 6. Where to Find Reports
Action Place
View report results that have been saved orpublished to the Vault page
Browse tab / Vault page
View report results that belong to you andhave not been published
Browse tab / Personal Documents page
View report results that have been added toa MyFavorites page
MyFavorites tab / Open page
Check the status of a report Monitor tab
To find report results in the:v Browse tab, see “Finding a document or folder in the Browse tab” on page 59v MyFavorites tab, see “Opening a MyFavorites page” on page 48v Monitor tab, see “Finding a report in the Monitor tab” on page 81
If a report result is located in the Browse tab, you can either view the report in theBrowse tab or you can download the report result without using the Tivoli NetcoolPerformance Manager Web client GUI. For more information, see “Downloadingreports without using the web user interface” on page 61.
© Copyright IBM Corp. 2006, 2015 19

Types of report views, downloads, and exportsDescribes how to work with report data in one or more ways.
In general, you work with report data in one of the following ways:v View the report data in the Tivoli Netcool Performance Manager Web client.
In the Tivoli Netcool Performance Manager Web client, you view report data ineither a table or a chart. These views offer various tools that you can use to lookat the data from a number of different perspectives.
v Download the report data.Downloading the report data lets you save the report data on your hard disk(for example, to compare reports over time), perform further analysis, or topublish the report in a different application. You can select from a number ofdifferent download file formats.
v Export the report data.Exporting the report enables you to export report results in a number of formatsusing email, a local folder, FTP or a database table.
The views and download formats available to you are listed in the following table:
Table 7. Report View / Download Types
View/Download Type Description
View Table Displays report data in a table.
For more information, see “Table View” on page 33.
Chart Displays report data in graphical form.
For more information, see “Chart View” on page 37.
Download CSV XMLExcel
Contains tabular data, the individual fields of which areseparated by commas.
For more information, see “CSV downloads” on page 41.
Contains tabular data that is organized by means of XMLelement tags.
For more information, see “XML downloads” on page 43.
Contains tabular data that opens in an Excel spreadsheet.
For more information, see “Excel downloads” on page 45.
ExternalExport
CSV, XLS,XML
Export report results using email, a local folder, FTP or adatabase table. For more information, see “Exporting reports”on page 73.
Note: All views and download formats (except Excel) contain the exact sameinformation for a report. The formats display the same entities, fields, aprogression of aggregated totals, and granular traffic data.
The Excel format, however, is the exception. Whereas the Excel format displays thesame entities and fields as the other formats, it only includes granular traffic data.In other words, it does not display a progression of aggregated (rolled-up) totals.For an explanation of granular data and aggregated totals, see “Report outputbasics” on page 21.
20 IBM Tivoli Netcool Performance Manager: User Guide

Report output basicsReport output summarizes network activity and performance as illustrated in thefollowing example.
The partial report output in figure displays hourly performance data (droppedcalls) for the network entity 10001. The report output of in the figure is only one ofa number of views you can select from. See “Types of report views, downloads,and exports” on page 20.
Report output frequently consists of granular and aggregated traffic data. Granulartraffic data is known as time-series data, where you see data as a series of valuesover time as illustrated in figure.
The Tivoli Netcool Performance Manager system can then aggregate granulartraffic into larger time units (such as hourly and daily) and by network element(such as switch or cell). These totals are also know as the hierarchy of totals (notshown in the above example).
Tivoli Netcool Performance Manager reports can organize and present traffic datain a number of different ways. To view some of the ways data can be organized,see “Overview of report archetypes” on page 97. For more information aboutgranular traffic data, see “Traffic data” on page 88.
Hierarchy of totalsThis section provides information that helps you to read the hierarchy of totals inyour report output.
Many reports contain a progression of aggregated (rolled-up) totals. These totalsare often aggregated by entity IDs (also known as entity attributes) and / or bytime, and are known as the hierarchy of totals .
Note: Tivoli Netcool Performance Manager software uses different aggregationtypes to calculate rolled-up traffic field values, summation being only one.Therefore, you could see totals that are not summed (added). For moreinformation, see “How aggregation is applied” on page 93
About hierarchy of totalsDescribes what hierarchy of totals is all about.
The hierarchy of totals in report output consists of attribute components (optional),time components (optional), and aggregated traffic data. The attribute componentconsists of one or more attributes, such as cell_ID, or cell_ID, and antenna_ID. Thetime component contains one or more time units, such as day , or day and hour .
Chapter 3. Viewing report results 21

The column headings in a report view reflect the hierarchy of totals. For example,you might see something like the following:Day | Hour | Cell_ID | Dropped Calls
The above sample heading consists of a time component (Day and Hour), which isfollowed by the attribute component (Cell_ID). The last column (Dropped Calls)represents the column that contains the traffic data.
Levels of aggregationThe hierarchy of the combined time and attribute components produces theaggregated (rolled-up) totals in the report.
The following table shows all the aggregated totals of the output.
Table 8. Hierarchy of Totals Example
Day Hour Cell_ID Dropped Calls Comment
------ ------ ------ 124 Top summary:Total droppedcalls for all daysand all cells
Sun ------ ------ 68 Total droppedcalls for all ofSunday
Sun 00 ------ 40 Total droppedcalls for Sunday00:00 hour
Sun 00 Cell 001 15 Hourly value
Sun 00 Cell 002 25 Hourly value
Sun 01 ------ 28 Total droppedcalls for Sunday01:00 hour
Sun 01 Cell 001 16 Hourly value
Sun 01 Cell 002 12 Hourly value
Mon 00 ------ 32 Total droppedcalls for Monday00:00 hour
Mon 00 Cell 001 10 Hourly value
Mon 00 Cell 002 22 Hourly value
Mon 01 ------ 24 Total droppedcalls for Monday01:00 hour
Mon 01 Cell 001 10 Hourly value
Mon 01 Cell 002 14 Hourly value
In the above example, you have the following:v A single total that represents all dropped calls (the Top summary)v A downward progression of different levels of aggregation, representing
different totals of dropped calls
22 IBM Tivoli Netcool Performance Manager: User Guide

Note: In this example, Tivoli Netcool Performance Manager software calculatedthe rolled-up totals in the Dropped Calls column, using the sum aggregation type.A different aggregation type would have yielded a different set of totals.
Most report output types, views and downloads, contain the exact same hierarchyof totals for a report. Listed here are the differences:v Whereas many of the download views (such as CSV and XML) show all the
totals simultaneously (as shown in the table).v The Excel download format includes only the granular traffic data. In other
words, it does not display a progression of aggregated (rolled-up) totals. For anexplanation of granular data, see “Report output basics” on page 21.
Report viewsDescribes the various views in which a report can be displayed.
A report is displayed as a Table view and a Chart view. The following topicsprovide an overview and procedures for working with reports views.
Opening a reportExplains the procedure to open a report.
About this task
Use the following procedure to open report results. To open a report, follow thesesteps:
Procedure1. Go to the report results you want to open. You can locate the report results in
For report results located in the:a. Browse tab, see “Finding a document or folder in the Browse tab” on page
59.b. Monitor tab, see “Finding a report in the Monitor tab” on page 81.c. For more information on where report results are located, see “Where to
find report results” on page 19.2. Select the check box of one or more report result names. Then from the Select
Action drop-down list box, select View report. Each selected report resultopens in a separate window. If you are opening the view for the first time, thelowest aggregated totals for the report are displayed. (For an explanation ofaggregation totals in report output, see “Hierarchy of totals” on page 21
Note: When a very large report is run, in rare cases an unresponsive scriptwarning may be given. Click Continue and the report will complete as normal.Changes to the configuration of your browser will prevent the problemoccurring again. For more information, see, the Administering Tivoli NetcoolPerformance Manager - Wireless Component.
Chapter 3. Viewing report results 23

Entering user commentsDescribes the procedure to enter a comment for a report.
About this task
Use the following procedure to enter a comment for a report: To enter usercomments:
Procedure1. Open the report results you want to enter comments for. See “Opening a
report” on page 23 for information on opening a report.2. Select the check box of the report results. Then from the Select Action list,
select View report.3. Scroll down to the User Comments section of the report.
Legend:
Button Description
Expand all comments - Expand the display for allcomments.
Expand this comment - Expand the display for a singlecomment.
Create new comment - Create a new comment.
Edit Comment - Edit or delete an existing comment. Youdelete a comment using the Delete button in Commentdialog. You can only edit or delete your own comments.
Show all/this comment/s in MyFavorites - Display allcomments, or a single comment, in a MyFavorites page.For more information about MyFavorites, see Chapter 4,“MyFavorites pages,” on page 47.
Column Header - Sort the list of comments inascending/descending order by clicking on the followingcolumn headers: Edit Time , User or Topic .
4. Click the Create new comment button to create a new comment. The Create anew comment dialog is displayed.
24 IBM Tivoli Netcool Performance Manager: User Guide

The number of characters you can enter is displayed in the top right of thedialog.
5. From the Topics drop-down list box, select the topic you want to add thecomment to. If you want to create a new topic, click the Add new topic iconnext to the Topics drop-down list box, and enter a name for the new topic inthe text field that is displayed.
6. Enter your comment in the text box. You can enter an html link in yourcomment, if required. You must use the correct html notation. For example, See<a href="http://www.SiteName.com">Site Name</a>. This example will appearas See Site Name, in clickable blue text in the comment in the main reportresults page.
7. Click Save.
Saving a report to a new documentDescribes the procedure to save an open report to a new document.
About this task
Use the following procedure to save an open report to a new document. To save toa new document:
Procedure1. Click the Save as new document button. The page refreshes, and the new
report box opens.2. In the Report Name box, enter the name you want.
Note: The name must be unique. No other documents in the folder can havethe same name.
3. From the first drop-down list box, select to save the document in the PersonalDocuments page or the Vault page.
4. From the folder drop-down list box, select the folder you want. The page isrefreshed, and all the documents in that folder are listed in the box below.
Note: If you are saving to the Vault page, the read and write permissions ofeach folder is shown. Example: (r/w) means that the folder has both read andwrite permissions.
Chapter 3. Viewing report results 25

Parts of a reportThis section describes the primary parts of a report as shown in the followinggraphic.
About this task
Legend:
26 IBM Tivoli Netcool Performance Manager: User Guide

No. Description
1 Rollup level - Allows you to view progressively aggregated or detailed trafficinformation. You select different aggregation totals by either selecting a roll uplevel from the drop-down list box or by clicking the adjacent up and downarrows.
For an explanation of aggregation totals, see “About roll-up levels” on page30.
2 apply settings to report button - Allows you to save any changes you make toa report's settings.
3 save as new document button - Allows you to save the report to a newdocument.
4 Show/Hide Settings - Allows you to show and hide the table's option settings.
5 Show/Hide - Allows you to show and hide the TableView, Chart View andReport Details.
6 Table Viewing area - Contains the output, or data, for the report's table view.
If the report output is long and cannot fit on a single screen, the remainingdata is listed on subsequent subscreens. Navigate through the subscreensusing the right and left arrows, or by entering a page number.
7 Chart Viewing area - Contains the output, or data, for the report's chart view.
8 Report column headers - A dynamic display of the table headers. The availabletable headers depend upon the roll-up level. See “About roll-up levels” onpage 30.
9 Report headings for traffic data - Each traffic heading displays a header thatdescribes the type of traffic data in the column. Placing the mouse pointerover the adjacent icon displays the field name and other descriptiveinformation, as available.
10 Report columns - Contains the output for the table view.
For more information on report output, see “Report output basics” on page 21.
11 Options box - Contains options that affect the table view.
12 Options box - Contains options that affect the chart view.
13 User Comments viewing area - See “Entering user comments” on page 24.
In addition to the different views you can create by selecting roll-up levels, theoptions boxes for tables and charts allows you to create yet additional views of thetraffic data.
Table View optionsTable view options can be used to change Table View settings.
See “Changing Table View settings” on page 34.
Chapter 3. Viewing report results 27

Legend:
No. Section Description
1 Show all key columns - Forces the display of all key columns. By default, all keycolumns are displayed. However, if you rollup to a level above the key, then thiskey column is not shown. For example, if you have a report grouped by BSC_idand Cell_ID they both show up as columns. However if you rollup to BSC_id thecell_id disappears. Selecting the Show all key columns over rides this.
2 Selected Entities - Allows you to select a subset of the entities for the table view.Use Ctrl+Click to select multiple entities. You can also search for and select asubset of entities using the Search box. Type the first characters of the attribute inthe Search box to highlight matching entities. Select the entities you require.
3 Sort by multiple - Allows you to sort up to three columns at the same time,sequencing their data.
4 apply button - Applies any selections in the options box to the view.
28 IBM Tivoli Netcool Performance Manager: User Guide

Chart View optionsChart view options can be used to change Chart View settings.
See “Changing chart settings” on page 37.
“Chart View options” Legend:
No. Section Description
1 View - Allows you to view by either entity instance or field.
2 Chart Type - Allows you to select different types of charts. For a list of charts,see “Selecting a chart type” on page 38.
3 Selected Entities - Allows you to select a subset of the entities for the chartview. Use Ctrl+Click to select multiple entities. You can also search for andselect a subset of entities using the Search box. Type the first characters of theattribute in the Search box to highlight matching entities. Select the entities yourequire.
4 Chart Format - Allows you to format the chart using Cartesian or Polarcoordinates, see “Selecting a format” on page 39.
5 Selected Entities - Allows you to select a subset of the fields for the chartview.
6 Chart size - Allows you to set the size of the chart.
Chapter 3. Viewing report results 29

No. Section Description
7 Show legend - Turns on and off the chart legend.
Show hints - Turns on and off the data point hints.
8 Vertical - Displays the chart vertically.
Horizontal - Displays the chart horizontally.
9 3d Graph - - Displays the chart in 3 dimensions. Only certain graph types canbe displayed in 3D. A 3D graph's orientation can be changed. ClickGraphOrientation to display the Graph Orientation dialog. Use the appropriatearrow button to adjust orientation left-to-right and top-to-bottom, or click inthe dialog to select an orientation point.
10 apply button - Applies any selections in the options box to the chart view.
About roll-up levelsDescribes the Table View and Chart View that display one level of aggregatedtotals at a time.
Both the Table View and Chart View display one level of aggregated totals at atime. (For an explanation of aggregated totals in a report, see “Hierarchy of totals”on page 21.) The following sections cover some of the more important aspects ofroll-up levels.
Progressively aggregated totalsDescribes how the report viewer displays different levels of aggregated totals,starting at the lowest level and ending at the top level.
Both the Table View and Chart View display one level of aggregated totals at atime. For an explanation of aggregated totals in a report, see “Hierarchy of totals”on page 21. The following sections cover some of the more important aspects ofroll-up levels.
Progressively Aggregated Totals:v Lowest-level Aggregated Totals
When you first open a report, the bottom item in the Rollup level list box isselected by default (as illustrated in the following graphic). The bottom item,when selected, displays the lowest-level aggregated totals. The lowest-levelaggregated totals differ from one report to the next.
30 IBM Tivoli Netcool Performance Manager: User Guide

In the figure, the lowest level of aggregated totals in this view displays thehourly performance data for dropped calls (T_HOUR).
v Mid-Level Aggregation TotalsAs you start moving from the bottom rollup up towards the top rollup level (Top summary ), the totals become progressively more aggregated. For example,if you were to select the cell_cell_id, T_Day roll-up level, the viewer wouldaggregate all the hourly data into a single daily total and display the total.
v Top-Level Aggregation TotalsThe Top summary level, when selected, displays a single total as illustrated inthe following graphic. This total is the cumulative total of all the lowest-leveltotals in the report.
Chapter 3. Viewing report results 31

In the figure, the total 687 is the cumulative total of the lowest-level totals asshown in the Mid-Level Aggregation Totals figure.
Roll-up levels and column headingsDescribes the table view.
In the Table View, the column headings you see depend upon the roll-up level.This is illustrated in the following two graphics.
Because the figure above, shows the totals for cell_cell_id,, T_Day and T_Hour,you see all three columns. However, because the figure below shows the totals foronly cell_cell_id and T_Day, you see only those columns, not the T_Hour column.
32 IBM Tivoli Netcool Performance Manager: User Guide

Table ViewA Table View displays report data in a tabular format within the Tivoli NetcoolPerformance Manager Web client. Here are some general guidelines for when touse a table. Tables work well when you want to:v View exact numerical valuesv Make local comparisons
Exact numerical values
The following figure shows the report data for dropped calls.
In the table, you can see the exact number of dropped calls for each hourly timeinterval. This is unlike a chart, where you see only field values in relation to unitson either the x or the y axis.
Local comparisons
Local comparisons allow you to quickly compare field values in one part of thetable with other values that are located relatively nearby. The following figureshows the field value for each cell. With data displayed in this manner, you canmake quick comparisons between the field values for each cell.
To facilitate other local comparisons, you can use the following Table View optionsto:v Look at a subset of entities, instead of all the entities included in the report. See
“The General tab” on page 214.v Compare the report data in two or more windows.v Compare the data of two or more reports. See “Opening a report” on page 23.
Chapter 3. Viewing report results 33

Changing Table View settingsUse the following procedures to change one or more view settings.
About this task
You can customize a Table View by changing one or more settings. Once you savethe new settings, they are used when you re-open the chart.
To change table view settings, follow these steps:1. You can do any of the following:
Procedure1. You can do any of the following tasks:
v View different levels of aggregated totals as necessary. See “Selecting roll-uplevels”
v Show data for a subset of entity instances instead of all entity instances.See“Filtering by entity instances” on page 36
v Sort columns, show columns with null values, or show more columns. See“Sorting columns” on page 35, “Hiding Option settings” on page 37, or“Showing columns with null values” on page 37 respectively.
2. Optional: Click the apply settings to report button. The page refreshes, and thesettings have been saved. If you close the report without saving your settings,when you re-open the report, the report takes the default settings.
Selecting roll-up levelsWhen you open a report for the first time, you see the lowest level of aggregatedtotals for your report.
Before you begin
See “About hierarchy of totals” on page 21 for an explanation of aggregated totalsand “About roll-up levels” on page 30 for how aggregated totals work. Use thefollowing procedure to view other levels of aggregated totals.
About this task
To select a roll-up level for a Table view, follow these steps:
Procedure
Do one of the following:v From the Rollup level list box, click the drop-down list box as illustrated in the
figure below.
34 IBM Tivoli Netcool Performance Manager: User Guide
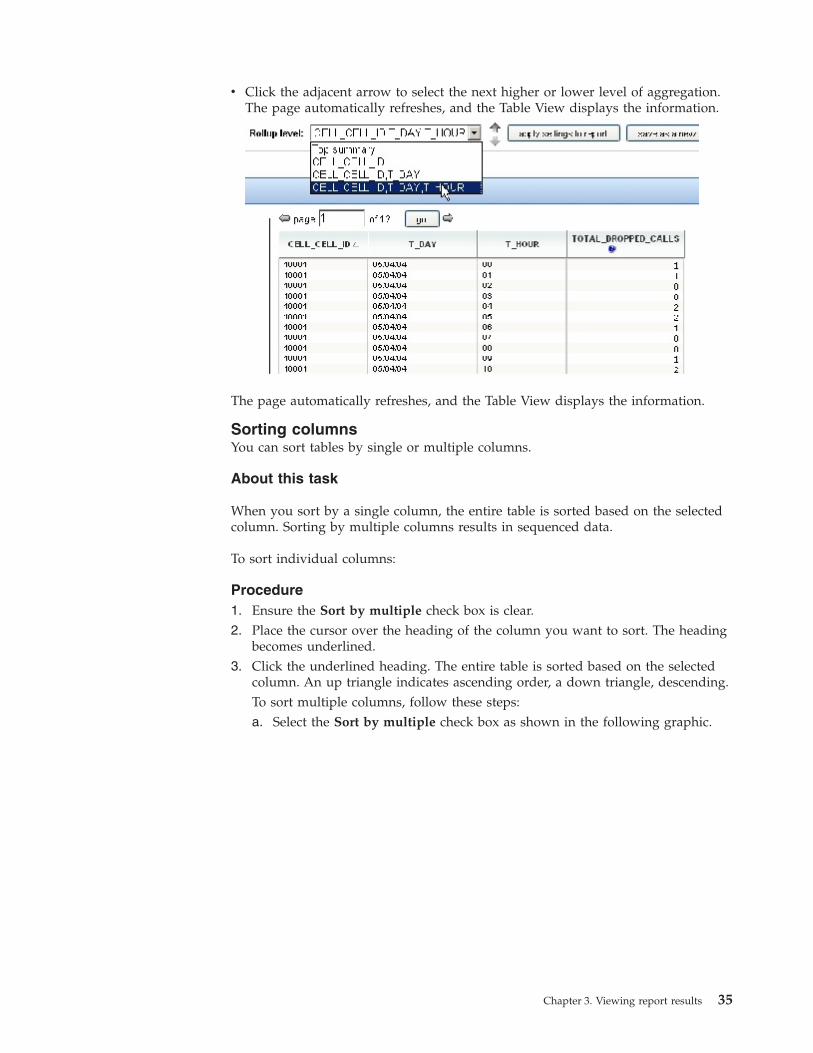
v Click the adjacent arrow to select the next higher or lower level of aggregation.The page automatically refreshes, and the Table View displays the information.
The page automatically refreshes, and the Table View displays the information.
Sorting columnsYou can sort tables by single or multiple columns.
About this task
When you sort by a single column, the entire table is sorted based on the selectedcolumn. Sorting by multiple columns results in sequenced data.
To sort individual columns:
Procedure1. Ensure the Sort by multiple check box is clear.2. Place the cursor over the heading of the column you want to sort. The heading
becomes underlined.3. Click the underlined heading. The entire table is sorted based on the selected
column. An up triangle indicates ascending order, a down triangle, descending.To sort multiple columns, follow these steps:a. Select the Sort by multiple check box as shown in the following graphic.
Chapter 3. Viewing report results 35

b. You can select a primary field and, optionally, secondary and tertiary fields.These fields dictate the sequence of the data.
c. Select your primary field for the sort from the Field 1 drop-down list box.Select the order (ascending or descending) from theOrder 1 drop-down listbox.
d. Optional - Select a secondary and tertiary field, from the Field 2 and Field 3list boxes, respectively.
e. Click the apply button for the sort to take effect.
Filtering by entity instancesUse the following procedure if you are interested in the data of one or more entityinstances at the exclusion of others.
About this task
When you select a subset of entity instances, only the entity instances that youselected are displayed. To filter by entity instances:
Procedure1. Select a subset of the entities from the Selected Entities box. Use Ctrl+Click to
select multiple entities. You can also search for and select a subset of entitiesusing the Search box. Type the first characters of the attribute in the Search boxto select matching entities. Select the entities you require.
2. From the Selected Entities list box, select one or more entity instances. Toselect a single entity instance, click a single item in the list.v To select multiple entity instances, hold down the shift key and click
multiple items. Or, you can select an item, hold down the left-mouse key anddrag down to select a range.
36 IBM Tivoli Netcool Performance Manager: User Guide

v Click the apply button. The columns are updated, showing only the entityinstances that you have selected.
Showing columns with null valuesAbout this task
By default, columns that contain only null characters are not shown in the tabularview. In the context of Tivoli Netcool Performance Manager software, a null valueis not the same as a zero value. A zero value refers to the digit 0; a null valuedisplays nothing.
To show columns with nNull Values:
Procedure1. Select the Show all key columns check box.2. Click the apply button or new chart icon.
Hiding Option settingsIf there are more columns than space in the window, the columns scroll off to theright. Use this procedure to provide additional window space to view the columns.
To hide option settings, follow this step:v At the top of the Table View, click Show/hide settings.
The screen hides the options box making more room for the columns.
Chart ViewThe Chart View displays report data in graphical form within theTivoli NetcoolPerformance Manager web client. The following sections provide an overview andprocedures for working with chart views.
Changing chart settingsUse the following procedures to change one or more chart view settings.
About this task
You can customize the chart view by changing one or more settings. Once yousave the new view settings, they are used when you re-open the report.
To change Chart view settings:
Procedure
Do any of the following tasks:1. Change the level of detail in the chart. See “Changing the roll-up level” on
page 38.2. Select a different chart type. For example, you may want a bar chart instead of
a line chart. See “Selecting a chart type” on page 38.
Chapter 3. Viewing report results 37
3. Chart by entity instance or by field. See “Viewing by entity or field” on page39.
4. Add or remove entity instances and fields from the chart. See “Selecting entitiesand fields” on page 40.
5. Optional: Click the apply settings to report button. The page refreshes, and thesettings have been saved. If you close the report without saving your settings,when you re-open the report, the chart takes the default settings.
Changing the roll-up levelUse this procedure to change the roll-up level to either create a chart with moredetail or a chart with more totals (aggregated data).
To change the roll-up level:v From the Rollup Level drop-down list box, select the level you want.
The page refreshes, updating the chart with the new roll-up level information.
Selecting a chart typeYou can present the results of your report in a number of different chart types.
About this task
You can select from the following:v Bar, Stacked Bar, Superimposed Bar, Stacked 100 Barv Area, Stacked Area, Stacked 100 Areav Line plot, Stacked 100 Line Plotv Stair, Stacked 100 Stairv Stacked Polygonv Stacked Stairv Summed Stairv Scatterv Hilo Arrow, Hilo Stickv Overlaid plot: double-Y axis line and bar charts
Where appropriate, you can select whether to display the chart Horizontally,Vertically and/or in 3 Dimensions.
To change the chart type (for all chart types except Overlaid plot), follow thesesteps:
Procedure1. From the Chart Type drop-down list box, select the chart type you want.2. Click the apply button. The chart is redrawn as the selected chart type.
The chart is redrawn as the selected chart type.To change the chart type to Overlaid plot, follow these steps:a. From the Chart Type drop-down list box, select
Overlaid plot . The page refreshes and the Plot type Axis area becomesavailable as illustrated inthe following figure.
38 IBM Tivoli Netcool Performance Manager: User Guide
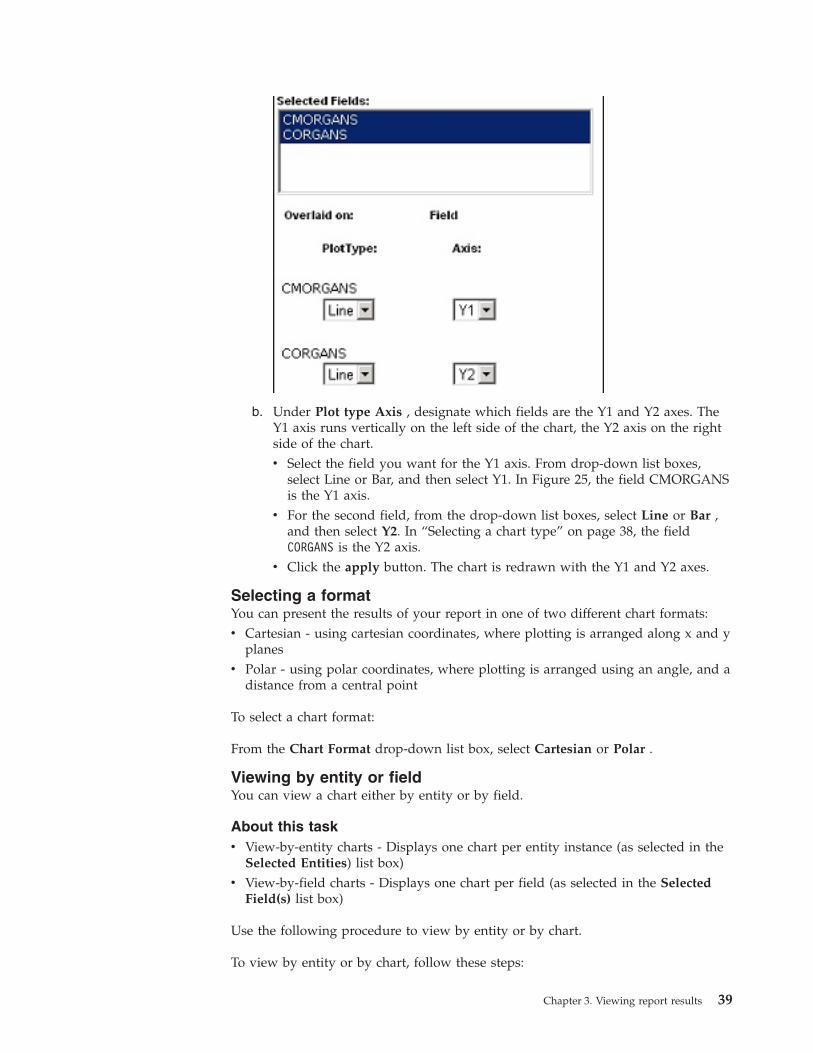
b. Under Plot type Axis , designate which fields are the Y1 and Y2 axes. TheY1 axis runs vertically on the left side of the chart, the Y2 axis on the rightside of the chart.v Select the field you want for the Y1 axis. From drop-down list boxes,
select Line or Bar, and then select Y1. In Figure 25, the field CMORGANSis the Y1 axis.
v For the second field, from the drop-down list boxes, select Line or Bar ,and then select Y2. In “Selecting a chart type” on page 38, the fieldCORGANS is the Y2 axis.
v Click the apply button. The chart is redrawn with the Y1 and Y2 axes.
Selecting a formatYou can present the results of your report in one of two different chart formats:v Cartesian - using cartesian coordinates, where plotting is arranged along x and y
planesv Polar - using polar coordinates, where plotting is arranged using an angle, and a
distance from a central point
To select a chart format:
From the Chart Format drop-down list box, select Cartesian or Polar .
Viewing by entity or fieldYou can view a chart either by entity or by field.
About this taskv View-by-entity charts - Displays one chart per entity instance (as selected in the
Selected Entities) list box)v View-by-field charts - Displays one chart per field (as selected in the Selected
Field(s) list box)
Use the following procedure to view by entity or by chart.
To view by entity or by chart, follow these steps:
Chapter 3. Viewing report results 39

Procedure1. From the View drop-down list box, select either Chart by Entity or Chart by
Field.2. Click the apply button. The screen refreshing and displays the new chart(s).
Note: You can add or delete entities and fields. See “Selecting entities andfields”
Selecting entities and fieldsAbout this task
With a chart view, you can do the following:v Add or remove entity instances.v Add or remove fields.
To select an entity instance1. From the Selected Entities box, select the entity instance or entity instances. To
select multiple items in the list:2. Hold the Ctrl key and make several selections, which can be non-sequential.3. Select an item and pull down on the list, multiple sequential items will be
selected.4. Click the apply button. The chart is updated and shows only the selected entity
instances.
To select a field1. From the Selected Fields box, select the field or fields. To select multiple items
in the list:2. Hold the Ctrl key and make several selections, which can be non-sequential.3. Select an item and pull down on the list, multiple sequential items will be
selected.4. Click the apply button. The chart is updated and shows only the selected
fields.
Changing the chart background colorAbout this task
You can change the color of the chart background from the Preferences tab. Thebackground frames the plot area of the chart and includes the chart labels. Becausethis is a global change, thereafter all charts display the selected color.
To change the chart background color:
Procedure1. Click the Preferences tab.2. Under Reporting, click the Edit button. The options in the Reporting box
become available for editing.3. In the Default background color for charts text box you see the current
background color. It is displayed using the hexadecimal color code.4. To select a color, click the Select button.5. A color palette in a separate window opens.
40 IBM Tivoli Netcool Performance Manager: User Guide
6. To select a color, move the cursor over the block of color and click it. The colorpalette closes, and the hexadecimal code of the selected color is displayed inthe Reporting box.
7. To restore the default background color, click the Restore default color button.8. When you have finished, click the set button.
Viewing data point hintsEach data point on a chart provides the following information:v The identification of the entity or field (depending on whether the view is
by-entity or by-chart (see “Viewing by entity or field” on page 39)v The value of the data point
To view data point hints, follow this step:v Place your cursor over the data point.
A tool tip displays the information about the data point.
CSV downloadsCSV stands for comma separated values (also known as comma delimited format).A CSV file contains data that is separated by commas. The following topicsintroduce and provide instructions for downloading report results in a CSV file.
General guidelinesThe CSV format is a standard format used for data interchange. It is commonlyused to make DOS tables (databases) portable between software applications. Assuch, the CSV files can be imported by many spreadsheet programs and mostdatabases.
In a CSV file produced by the Tivoli Netcool Performance Manager Web client,report results are stored as ASCII text, in which the fields are separated from eachother by commas. The data in each field is surrounded by quotation marks (see“Components of a CSV file” on page 42).
Note: If using the browser Internet Explorer IE7, use the IP address of the serverin the website address, if the server name is used when you click to download areport to CSV, XML or Excel, a window momentarily opens and then closes. Thereis no error message or any other indicators.
Chapter 3. Viewing report results 41
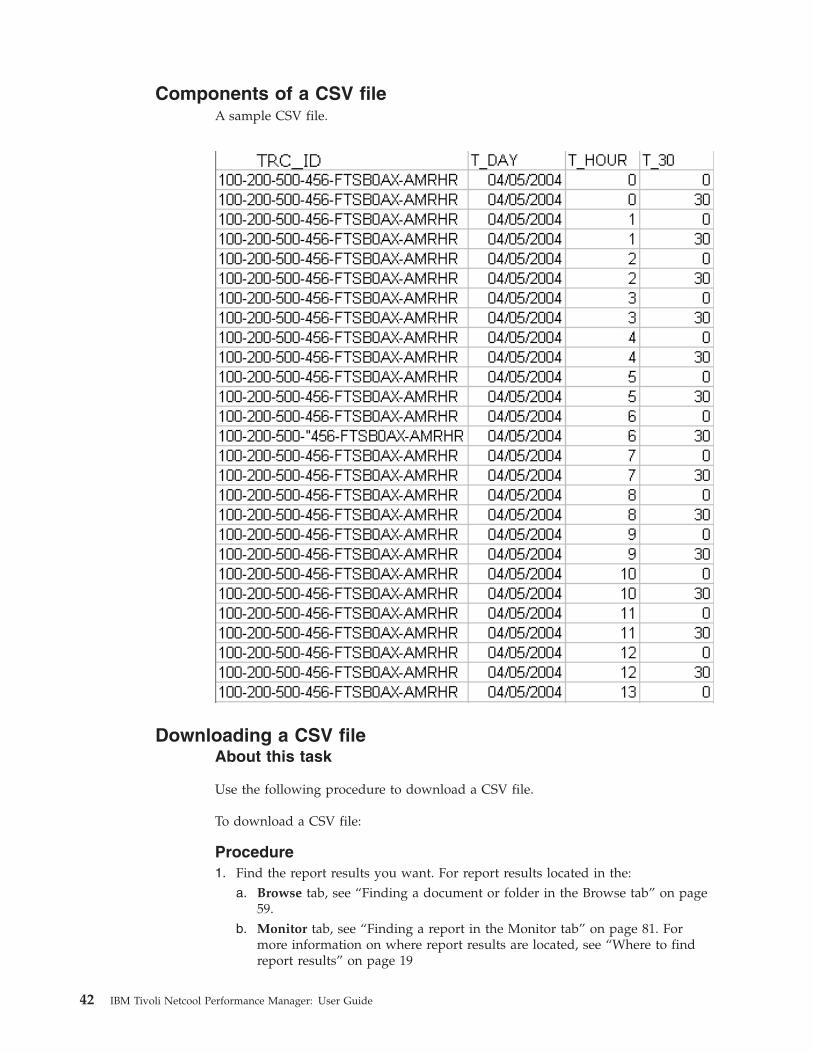
Components of a CSV fileA sample CSV file.
Downloading a CSV fileAbout this task
Use the following procedure to download a CSV file.
To download a CSV file:
Procedure1. Find the report results you want. For report results located in the:
a. Browse tab, see “Finding a document or folder in the Browse tab” on page59.
b. Monitor tab, see “Finding a report in the Monitor tab” on page 81. Formore information on where report results are located, see “Where to findreport results” on page 19
42 IBM Tivoli Netcool Performance Manager: User Guide

2. In either the Browse or Monitor tab, select the check box of one or more reportresult names. Then from the Select Action drop-down list box, select theDownload CSV option. The File Download dialog box opens.
3. Do one of the following tasks:a. Click the Save button to save the file. The Save As dialog box opens in
which you can specific the name and location of the .csv file.b. Click the Open button to open the file in Excel.c. Click the Cancel button to close the File Download dialog box.
XML downloadsXML is the acronym for extensible markup language. An XML (.xml ) file in thecontext of Tivoli Netcool Performance Manager software, contains report data thatis organized by means of XML element tags. The elements tag form a simplehierarchical tree, following XML syntax specifications.
General guidelinesXML, like CSV, is a standard format used for data interchange. Because the XML ofa Tivoli Netcool Performance Manager report adheres to standard XML syntax, youcan use the XML in any XML-compliant application, as well as with other Webtechnologies, such as HTML, CSS (Cascading Style Sheets), and XSLT (ExtensibleStylesheet Language Transformations).
Listed here are some possible uses:v Post the report output on your company Web site by using the XML document
with a cascading style sheet.v Transform the markup vocabulary of theTivoli Netcool Performance Manager
XML document to a markup language of your choice by using XSLT.v Use the XML document with other XML documents
There is no schema or DTD for Tivoli Netcool Performance Manager XMLdocuments.
Components of an XML fileThe XML files for reports are almost the same except for <header> tags asillustrated in the following figure.
Note: The following examples provide cursory information on the XML tags. Toget a complete listing of the element tags you are interested in, create a mockreport with the desired definition settings, run it, download it as XML, and look atthe XML output.
Chapter 3. Viewing report results 43
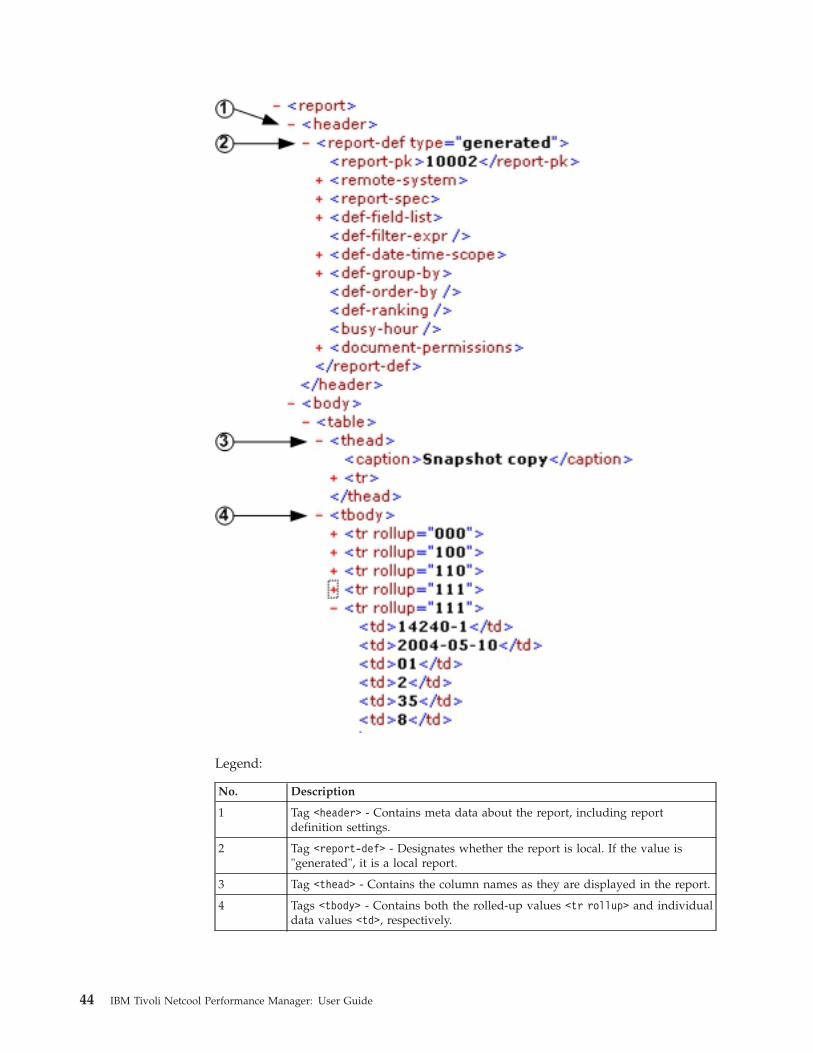
Legend:
No. Description
1 Tag <header> - Contains meta data about the report, including reportdefinition settings.
2 Tag <report-def> - Designates whether the report is local. If the value is"generated", it is a local report.
3 Tag <thead> - Contains the column names as they are displayed in the report.
4 Tags <tbody> - Contains both the rolled-up values <tr rollup> and individualdata values <td>, respectively.
44 IBM Tivoli Netcool Performance Manager: User Guide
Downloading an XML fileAbout this task
Use the following procedure to download an XML file.
To download an XML file, follow these steps:
Procedure1. Find the report results. For the results of a local report, see “Finding a
document or folder in the Browse tab” on page 59 on page.2. Select the check box of one or more report result names. Then from the Select
Action drop-down list box, select the Download XML option. The report isopened in a separate browser window.
3. Use the browser Save As command to save the file.
Excel downloadsExcel is a spreadsheet product that contains a number of analysis tools. The TivoliNetcool Performance Manager Web client allows you to download report results ina format acceptable to Excel. The following topics introduce and provideinstructions for Excel downloads.
General guidelinesWhen you download an Excel file from the Tivoli Netcool Performance ManagerWeb client, the data is saved with the .xls extension, and as such, opens in anExcel spreadsheet.
Note: The worksheet size for Excel is restricted to approximately 65,000 rows. If areport contains more than 65,000 rows of data, it is recommended that you use oneof the other download formats.v A report in Excel format displays only granular traffic data (unlike the other
formats for local reports). In other words, it does not display a progression ofaggregated (rolled-up) totals. For an explanation of granular data andaggregated totals, see “Report output basics” on page 21. For an example reportin Excel format, see “Reports in Excel.”
Components of an Excel fileIllustrates the way in which the data is organized within an Excel spreadsheet.
Reports in ExcelThis section illustrates the way in which the data is organized within an Excelspreadsheet.
Chapter 3. Viewing report results 45

Because the report output is in Excel format, see the sample report “Report outputbasics” on page 21.
Downloading an Excel fileAbout this task
Note: If you are using Internet Explorer with prompting for file downloads turnedoff, you may not be able to download report results to Excel. To open reportresults in Excel, Automatic prompting for file downloads must be enabled in yourSecurity settings in Internet Explorer for the appropriate zone. See your InternetExplorer documentation for instructions on changing your settings.
Use the following procedure to download the results of a report into an Excel file.
To download a Excel file, follow these steps:
Procedure1. Find the report results: For report results located in the:
v Browse tab, see “Finding a document or folder in the Browse tab” on page59.
v Monitor tab, see “Finding a report in the Monitor tab” on page 81.For more information on where report results are located, see “Where to findreport results” on page 19.
2. Select the check box of one or more report result names. Then from the SelectAction drop-down list box, select the Download in Excel option.You are prompted to open the file in an Excel spreadsheet, or to save the file asan Excel (.xls) file.
46 IBM Tivoli Netcool Performance Manager: User Guide

Chapter 4. MyFavorites pages
A MyFavorites page gives you the ability to easily view multiple report results ona single page. A MyFavorites page is another view into the report results that arein the Browse tab. It is a way to organize report results, to look at multiple reportresults from a single page.
A MyFavorites page displays the report results that you decide are most importantto you. You select the report results that appear on a MyFavorites page and createany number of MyFavorites pages. You can select a MyFavorites page and make itthe default page for viewing.
Before you beginTo use the functionality of the MyFavorites tab, you must first have the requisiteprivileges and permissions.v Privileges give you the ability to view MyFavorites pages in the MyFavorites
tab.v Permissions specify read and write abilities that you might have on each
MyFavorites page. When you create or edit a page, permissions also determinewhich report results you can use.
For more information about privileges and permissions, see “Privileges andpermissions” on page 7.
If you are unsure of the privileges you have, contact your system administrator.Document permissions are set by individual document owners, see “Documentand folder permissions” on page 55.
© Copyright IBM Corp. 2006, 2015 47

MyFavorites page overviewThe following figure shows a MyFavorites page and a Selection dialog.
Legend:
No. Description
1 Title bar - Contains the name and title of the open MyFavorites page, andindicates whether manual or automatic Refresh is enabled.
2 Tabs - Used to select which element of a report to view: Graphs, Tables,Comments, All.
3 Refresh and Edit buttons - Used to refresh and edit the currently openMyFavorites page.
4 Hide All, Refresh All buttons - Used to hide and manually refresh reportresults for all items that are displayed in the current tab.
5 Selection - Dialog that is used to select the report Graphs, Tables, andComments to view.
6 Minimize/Restore, Maximize buttons - Used to minimize, restore, or maximizethe size of the Selection dialog.
Opening a MyFavorites pageUse the following procedure to open a MyFavorites page.
About this task
To open a MyFavorites page, follow these steps:
Procedure1. Click the MyFavorites tab, and then click manage page.2. From the first list box, select personal documents or vault.
48 IBM Tivoli Netcool Performance Manager: User Guide

3. From the second list box, select the folder that contains the MyFavorites pageyou want. The bottom box lists all the MyFavorites pages in the folder.
4. In the bottom box, select a MyFavorites page, and click the open page button.The page refreshes, and the selected MyFavorites page opens. You can selectwhether to view graphs, tables, comments, or a combination of all of these. Forexample, to view a graph:v Click the Graph tab to display the Graph Selection dialog.v Select the report and graph you want to view from the Section List and
Graph List. Use the Ctrl key to select more than one item from each List.v Click the Apply button.v The following figure shows a MyFavorites page and a single section for a
graph. A section on a MyFavorites page contains the results of a singlereport.
v Items can be dragged and dropped to rearrange the order sections aredisplayed in.
Legend:
Button Description
Open Report - Opens the full report in a new Window.
Close - Closes the report section.
Hide - Hides a report section.
Refresh - Manually refreshes report results for a reportsection.
Update Report Data on Refresh - Indicates whether reportdata is automatically refreshed at set intervals. OverrideView Settings - Indicates whether view settings can beoverridden. For information about setting refresh options,see “Creating a MyFavorites page” on page 50.
Override View Settings - Indicates whether view settingscan be overridden. See “Creating a MyFavorites page” onpage 50, for information about overriding view settings.
Chapter 4. MyFavorites pages 49

Creating a MyFavorites pageAbout this task
Use the following procedure to create a MyFavorites page. When you are finished,you can either add it as your default page, see, “Setting a favorite MyFavoritespage” on page 52), or open it whenever you want to view the report results on thepage.
Note:
Chart formatting and the display of Overlaid Plot Graphs is not supported. Onlythe first 300 hundred rows of tables will be displayed. A default maximum of fivecharts will be displayed, the order of display will follow the sections that aredefined for the MyFavorites page. The default maximum number of elements thatare displayed in a MyFavorites page is 30. An element can be a graph, a table, or acomment.
These default values can be changed by an administrator. See the AdministeringTivoli Netcool Performance Manager - Wireless Component.
To create a MyFavorites page, follow these steps:
Procedure1. Click the MyFavorites tab, and then click new page. The page is refreshed, and
the Create Page dialog is displayed.2. Enter the page name in the Page Name box.3. Enter a description in the Page Text box. You can enter up to 65,000 characters.
When the MyFavorites page is open, the description is also displayed in theupper left corner of the opened page.
4. From the Interval to refresh list box, select how often you want the page to beautomatically updated. Select None (for manual refreshes) or select how often(in minutes) you want the page to be automatically updated.
5. Save the MyFavorites page to the default folder (shown on the screen), or saveit to another folder. To save to another folder, do the following tasks:a. Click theedit button. The page refreshes, and the edit options become
available.b. From the first list box, select to save the page in either the personal
documents page or the vault page.c. From the folder list box, select the folder that you want to save the page to.
The page is refreshed, and all the documents in that folder are listed in thebox. If you are saving to the vault page, the read and write permissions ofeach folder are shown.
Note: When you save to the vault page, the item is automatically savedwith the default read and write permissions.
d. Click the Set button. The page is refreshed, and the edit options are nolonger displayed.
6. Click the Add Section button to add a report section. The page is refreshed,and the Add Section box is displayed.a. Enter a title for the section in the Section Title text box or click the Use
Selected Results Name check box to use the report results name as thesection title.
50 IBM Tivoli Netcool Performance Manager: User Guide
b. Select the report results:From the Pick Results list box, select Personal Documents or vault. Fromthe second list box, select the subfolder that contains the report results youwant to add to the page. From the list box, select a report result.
c. Optional: By default the Update report data on refresh check box isselected. This option works with the Interval to refresh option in the CreatePage or Edit Page.
d. Optional: To override any changes that are made to the report view, checkthe Override view settings check box.
Note: Graphs are only generated after settings for a report have beenselected and saved. If you choose to override the view settings, then nographs will be available for selection for that section. Overriding viewsettings must be undertaken when you edit a favorites page. See “Editingan open MyFavorites page,” for information about editing a page. Whenyou add report results to a MyFavorites section, it has the same viewsettings that are in use for the report in the Browse tab. View settingsinclude such things as the format (table or chart), roll-up level, selectedentity instances, and fields, and so on. If these settings are changed in theBrowse tab, these changes will be reflected in your MyFavorites page. Youcan prevent this by selecting Override view settings.
e. Click the Add button to add the section.f. If required, repeat Step 6 to add more sections,.
7. In the Create Page dialog, use the appropriate check box and Edit, Delete orMove buttons to edit, delete, and order the sections as required.
8. Click the Save Page button to save the page.
Editing an open MyFavorites pageThis procedure assumes that you are at an open MyFavorites page.
About this task
Use the following procedure to edit an open MyFavorites page and any of itssections.
To edit an open MyFavorites page, follow these steps:
Procedure
Click the edit button on the MyFavorites title bar. The page is refreshed, and theEdit Page box is displayed. You can now change to previously set options. See theoptions that are listed under.
Note: Graphs are only generated after settings for a report have been selected andsaved. If you choose to override the view settings, then no graphs will be availablefor selection for that section.
When you add report results to a MyFavorites section, it has the same viewsettings that are in use for the report in the Browse tab. View settings include suchthings as the format (table or chart), roll-up level, selected entity instances, andfields, and so on. If these settings are changed in the Browse tab, these changeswill be reflected in your MyFavorites page. You can prevent this by selectingOverride view settings. To view the current view settings: check theOverride view
Chapter 4. MyFavorites pages 51

settings check box and click the View settings button.
Setting a favorite MyFavorites pageAbout this task
If you have a MyFavorites page that you constantly view, you can make it yourdefault page. When a MyFavorites page is the default page, it is then availabledirectly from the MyFavorites tab on the favorite page.
To set a favorite MyFavorites page, follow these steps:
Procedure1. Click the Preferences tab. The options in the MyFavorites box become available
for editing.2. In the Favorite Page list box, select the folder which contains the MyFavorites
page you want. The bottom box lists all the MyFavorites pages in the selectedfolder.
3. Select a MyFavorites page from the bottom box.4. When you have finished, click theset button.
You can now access the MyFavorites page by clicking the MyFavorites tab, andthen favorite.
52 IBM Tivoli Netcool Performance Manager: User Guide

Chapter 5. Browsing reports and other documents
The Browse tab contains all the documents that you use to create, schedule, run,and view reports (such as report definitions, report definition templates, scheduleentries, and report output). It also contains non- Tivoli Netcool PerformanceManager documents that are known as external documents.
The Browse tab has two pages; Personal documents and vault. The Personaldocuments page contains documents that you have created but have not shared.The vault page contains documents that have been shared.
Before you beginTo use the functionality of the Browse tab, you must first have the requisiteprivileges and permissions. A combination of the appropriate privileges andpermissions give you the ability to view, edit, and publish documents.
For more information, see “Privileges and permissions” on page 7.
If you are unsure of what privileges you have, contact your system administrator.Document permissions are set by individual document owners. See,“Documentand folder permissions” on page 55.
Document typesIntroduces the different document types and document dependencies.
Documents are the components that you use to create, schedule, run, and viewreports, such as report definitions, schedule entries, report results. Documents canalso be external documents; documents that were created by using other softwarethan Tivoli Netcool Performance Manager software and imported into theBrowsetab.
There are several document types, and each document type is in its own virtualfolder. A virtual folder is automatically created when a document is added topersonal documents or vault pages of the Browse tab. The following graphicdisplays a subfolder that contains the different document types.
The following table lists the different documents types and their descriptions. Thetable is in the same order as the virtual folders in the preceding figure.
© Copyright IBM Corp. 2006, 2015 53

Table 9. Document Types and Descriptions
Document Type Description
ExternalDocument
Document that is created by a non -Tivoli Netcool PerformanceManager program and imported into the Browse tab.
Scheduled Entry Specifies when and how often a report definition is to be run.
Report Definition Settings that determine report content.
Report Template Settings that determine report definition template content.
Pages MyFavorites pages.
Results Output of a generated report.
When you click the virtual folder, the folder expands and lists all of the documentsthat it contains.
Document dependenciesTivoli Netcool Performance Manager tracks the relationship between documents,specifically between a schedule entry and a report definition. This is because theschedule entry contains the name of a report definition. You cannot delete a reportdefinition if one or more schedule entries references it.
How documents are organizedDocuments are either on the personal documents page or the vault page. Withineach page, they are organized in the folder tree.
Personal documents and vault pagesThe personal documents page consists of items that are created only by you. Onlyyou have full permissions for documents and folders included in this page. Otherusers cannot view your personal documents page. To share a folder or a document,you must publish the item to the vault page.
The vault page consists of the documents and folders that you and other usershave published with the intent of sharing. Published items have assignedpermissions, which affect the activities that users can perform.
The folder treeThe folder tree is used to organize and group documents. The following figureillustrates a sample folder tree in the personal documents page. The folder treefunctions the same in the vault page.
54 IBM Tivoli Netcool Performance Manager: User Guide

Legend:
No. Description
1 The top, or root level of the folder tree. In the preceding figure, Joe representsthe user account name.
2 A parent folder. A parent folder can contain subfolders and virtual folders. Inthe preceding figure, the parent folder My Results contains the folderJuly_Results. It also contains the virtual folder Results.
3 A subfolder. A subfolder is nested in (contained by) a parent (higher level)folder. In the preceding figure, the subfolder July_Results is a subfolder of MyResults. A folder one or more levels up is called an ancestor. In this figure, Joeis an ancestor folder of July_Results.
4 A virtual folder. A virtual folder organizes documents by type within the rootand each folder. For example, the document type results has the virtual folderResults, the document type report definitions has the virtual folder ReportDefinitions, and so on.
A virtual folder is not displayed in a folder until a document is saved to it.Then the appropriate virtual folder type is inserted in the folder and displayed.Note: A virtual folder does not take permissions.
Document and folder permissionsRead and write permissions affect whether you can view, edit, or delete apublished item (document or folder) that is owned by another user.
Note: Document and folder permissions work together with application privilegesin granting you the right to perform certain tasks.
To understand how permissions affect what tasks you can perform while on theBrowse tab, review the following topics:v “Read and write permissions” on page 56v “Subfolders and permissions” on page 57v “Permission examples” on page 57v “About vault viewing” on page 58
Chapter 5. Browsing reports and other documents 55

Read and write permissionsThe following table summarizes the actions you or another user can perform whenyou are working with documents and folders.
Table 10. Read / Write Permissions
Task Permission
View the contents of a folder(subfolders and documents)
READ access to the folder.
View (open) a document READ access to the document.
Edit a document See the permissions for "Rename a document."
Run a report READ access to the report definition.Note: If you select a destination folder for the reportresults, and for which you do not have writepermissions, the report results is sent to your personaldocuments area.
Move a document v WRITE access to the document
v WRITE access to source folder
v WRITE access to target folder
Move a folder v WRITE access to folder to be moved
v WRITE access to parent folder of the folder is moved
v WRITE access to target folder
Publish a document to a sharedfolder
See the permissions for "Move a document."
Publish a folder to a sharedfolder
See the permissions for "Move a folder."
Create a subfolder in a sharedfolder
v WRITE access to the parent folder
Rename a document v WRITE access to the document
v WRITE access to the parent folder of the document
Rename a folder v WRITE access to the folder
v WRITE access to the parent folder
Delete a document v WRITE access to the document
v WRITE access to the parent folder of the document
Delete a folder v WRITE access to the folder
v WRITE access to the parent folder
Change permissions for adocument or folder
OWNER of the document or folder
56 IBM Tivoli Netcool Performance Manager: User Guide

Subfolders and permissionsWorking with child folders or subfolders in the vault page is a special case. Youneed the read permission for each of the parent folders that leads to the root. Youmust be able to drill down to the folder hierarchy, and display the contents of eachsuccessive parent folder before you can reach and display the subfolder.
For example, the following figure shows the folder Joe with the subfolderJuly_Results.
Even if you are given the permission to view, edit, or delete documents in theJuly_Results subfolder, you must also have read permission for the parent folderJoe.
Permission examplesThe examples provided here show the more common permissions that you mightgrant. All names in the examples refer to the sample folder tree in the followingfigure.
Example: Publishing a document for viewing
In this example, you are publishing a document to the Cells 1 through 100subfolder, which you own. You are publishing a document for viewing purposesonly. The following table shows the permissions that you need to grant to thetarget user.
Chapter 5. Browsing reports and other documents 57

Table 11. Publishing Permissions for Viewing
Folder Permission Settings for User
Joe (ancestor folder) Read permission
July_Results (parent folder) Read permission
Cells 1 through 100 (target folder) Read permission
Example: Publishing a document for editing
In this example, you are publishing a document to the Cells 1 through 100subfolder, which you own. You are publishing a document for viewing and editingpurposes. The following table owns the permissions that you would grant to thetarget user.
Table 12. Publishing Permissions for Editing
Folder Permission Settings for User
Joe (a parent folder) Read permission
July_Results (parent folder) Read permission
Cells 1 through 100 (target folder) Read and write permissions
Example: Moving a document from one folder to another
In this example, you are moving the document Cell report from the mX folder,which is owned by another user, to the Cells 1 through 100 subfolder, which youown.
For you to successfully move the document, the owner of the mX folder mustgrant you the following permissions that are shown in the following table:
Table 13. : Moving Permissions
Folder Permission Settings for You
mX (source folder) Read and write permission
Cell report (document) Read and write permissions
About vault viewingWhen you display folders in the navigation pane of the vault page, you might notbe able to display the contents of the folders because of permissions. When youhave the requisite permissions to work with a folder, the folder name itself is anactive hyperlink, which you click to open the folder. Generally, this is indicated bya change in the cursor to the image of a hand as it hovers over the link.
58 IBM Tivoli Netcool Performance Manager: User Guide

Finding a document or folder in the Browse tabAbout this task
In the personal documents or the vault page of the Browse tab, you can find adocument or folder by using the following methods:
Procedure1. Navigate the folder tree. The document that you are looking for is in one of the
folders on the server. You must navigate to the folder that contains thedocument of choice.
2. Use the Filter By feature. Filtering helps reduce the total number of documentsyou look at in a folder.
Navigating the folder treeAbout this task
Use the following procedure to view the contents of folder in either the personaldocuments or vault page. Folder contents include Tivoli Netcool PerformanceManager documents (such as report definitions and report results) and other(child) folders. For a description of each Tivoli Netcool Performance Managerdocument type, see “Document types” on page 53.
To navigate the folder tree, follow these steps:
Procedure1. Click the Browse tab, and then click either personal documents or vault. The
folder tree is displayed on the left side of the page.2. When you open the personal documents page or vault page for the first time in
a session, you see only the top folders, including virtual folders, in the foldertree.
3. You can display the contents of a folder, or if the folder is preceded by a plussign (+), more folders.
Task Procedure
Display the contents of a folder in thenavigation pane
Important: If you want to apply an actionto an item in a folder, you must displaythe items in the navigation pane.
Place the cursor over the folder name and thename takes an underline; click while the nameis underlined.
The folder opens, displaying the items of thefolder in the navigation pane.
Display more folders Click the plus sign (+) to the left of the folder.
The child folders and virtual folders are listedto the right of the parent folder.
Chapter 5. Browsing reports and other documents 59

Filtering the navigation paneUse the following procedure to filter the navigation pane in either the personaldocuments or the vault page.
About this task
You can filter by category, time, and owner:v Category - technology type reported on, in the folder or documentv Group - the group the user who published the folder or document is a member
of vault page onlyv Timev Owner (vault page only)
To filter the navigation pane, follow these steps:
Procedure1. Click the Browse tab, and then click either personal documents or vault.2. Open the folder in which you want to perform your search by clicking the
folder. You can also filter starting at the root.3. Filter by categories. From the all categories list box, select the category
(technology type reported on, in the folder or document).4. Filter by groups (vault page only). From the all groups list box, select the
group (the group the user who published the folder or document is a memberof).
5. Filter by owner (vault page only). From the all owners list box, select theowner (the user who published the folder or document).
6. Filter by time. Filter by how old an item is older than) or how young an itemis in last.a. From the older than list box, select either older than or in last.b. In the middle box, type the number of time units. For example, 1 (for one
hour, day, week, or month).c. In the Time box, select a time unit.d. Click Apply. Any folders or documents that match the filter criteria are
listed in the navigation pane. Any folders or documents that match the filtercriteria are listed in the navigation pane.
Running an immediate reportYou can run an immediate report from the personal documents or thenvault pageof the Browse tab.
About this task
You can run the report unchanged or you can change filter options and run thereport.
To run a report, follow these steps:
Procedure1. Locate the report definition that you want to run a report for. See “Finding a
document or folder in the Browse tab” on page 59.
60 IBM Tivoli Netcool Performance Manager: User Guide

2. Click the report definition's Run or Filter & Run button to run the reportdefinition.
Downloading reports without using the web user interfaceAbout this task
If you know the path to a report result in the Browse tab, you can download itdirectly from a browser window, without having to use the web interface. Thisfunctionality is designed to work with scheduled reports where the date andscheduled time for a report for example, 2009-01-27 14:00:00 can be predicted.
Before you beginTo download a report result from a browser window, you must know thefollowing information:v Name or IP address of the serverv Port number of serversv User login namev Passwordv Absolute path of the folder where the document is placed in the Browse tabv Name of the document to downloadv Scheduled time for reportv MIME type of the required format, for example:v text/xml
v application/vnd.ms-excel
v text/plain
v text/csv (comma-separated values) - not a MIME type, but supported fordownload purposes
These items are explained in more detail in the following section “Using a URL todownload report results” on page 62.
Chapter 5. Browsing reports and other documents 61
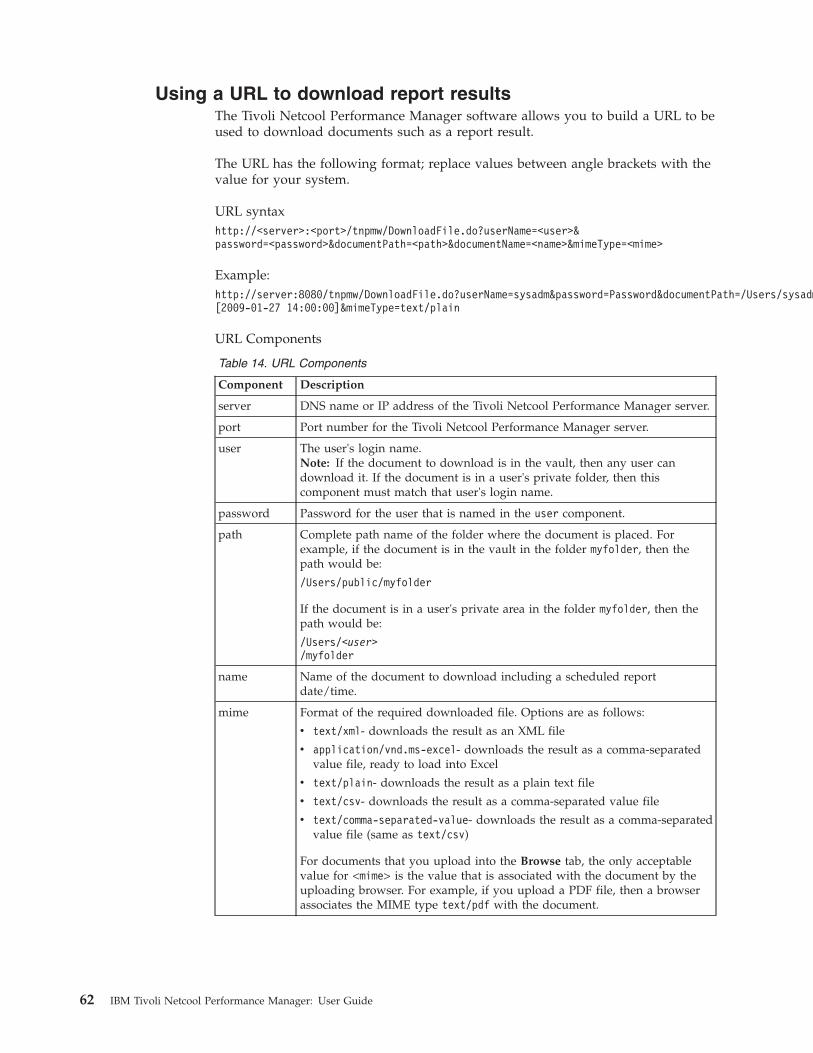
Using a URL to download report resultsThe Tivoli Netcool Performance Manager software allows you to build a URL to beused to download documents such as a report result.
The URL has the following format; replace values between angle brackets with thevalue for your system.
URL syntaxhttp://<server>:<port>/tnpmw/DownloadFile.do?userName=<user>&password=<password>&documentPath=<path>&documentName=<name>&mimeType=<mime>
Example:http://server:8080/tnpmw/DownloadFile.do?userName=sysadm&password=Password&documentPath=/Users/sysadm/&documentName=MS_Download_01[2009-01-27 14:00:00]&mimeType=text/plain
URL Components
Table 14. URL Components
Component Description
server DNS name or IP address of the Tivoli Netcool Performance Manager server.
port Port number for the Tivoli Netcool Performance Manager server.
user The user's login name.Note: If the document to download is in the vault, then any user candownload it. If the document is in a user's private folder, then thiscomponent must match that user's login name.
password Password for the user that is named in the user component.
path Complete path name of the folder where the document is placed. Forexample, if the document is in the vault in the folder myfolder, then thepath would be:
/Users/public/myfolder
If the document is in a user's private area in the folder myfolder, then thepath would be:
/Users/<user>/myfolder
name Name of the document to download including a scheduled reportdate/time.
mime Format of the required downloaded file. Options are as follows:
v text/xml- downloads the result as an XML file
v application/vnd.ms-excel- downloads the result as a comma-separatedvalue file, ready to load into Excel
v text/plain- downloads the result as a plain text file
v text/csv- downloads the result as a comma-separated value file
v text/comma-separated-value- downloads the result as a comma-separatedvalue file (same as text/csv)
For documents that you upload into the Browse tab, the only acceptablevalue for <mime> is the value that is associated with the document by theuploading browser. For example, if you upload a PDF file, then a browserassociates the MIME type text/pdf with the document.
62 IBM Tivoli Netcool Performance Manager: User Guide

Managing documents and foldersInstructions for organizing and managing documents and folders in the personaldocuments page or vault page.
Creating a folderAbout this task
Use the following procedure to create a folder in either the personal documentspage or the vault page. You can create only one folder at a time.
Procedure1. Click the Browse tab, and then click either personal documents or vault.2. Find the parent folder in which you want to create the subfolder and ensure
that the contents are displayed in the navigation pane. See “Finding adocument or folder in the Browse tab” on page 59 for instructions.
3. In the add folder text box, type the name of the folder.
Note: Duplicate subfolder names within a parent folder are not allowed. Forexample, if the parent folder contains the subfolder subfolder_123, you cannotadd another folder named subfolder_123.
4. Click add to create the folder. The new folder is added to the navigation pane.
Renaming a document or folderUse the procedure to rename a document or folder. This procedure can be used inthe personal documents and vault pages.
About this task
You can rename only one item at a time.
Procedure1. Click the Browse tab, and then click either personal documents or vault.2. Find the document or folder and ensure that it is displayed on the navigation
pane. See “Finding a document or folder in the Browse tab” on page 59 forinstructions.
3. Select the check box of the document or folder, and from the Select Action listbox, select Change Name. The name becomes editable.
4. Edit the name. Note the following restrictions:a. Document - Duplicate document names within the parent folder are not
allowed. For example, if the parent folder contains the documentreport_123, you cannot add another folder named report_123.
b. Folder - Duplicate subfolder names within a parent folder are not allowed.For example, if the parent folder contains the subfolder subfolder_123, youcannot add another folder named subfolder_123.
5. To complete the procedure, do one of the following tasks:v Click change name. The new name replaces the previous name.v Click cancel. The item retains its original name.
Chapter 5. Browsing reports and other documents 63

Moving a document or folderUse the following procedure to move a document from one folder to another and afolder from one tree to another.
About this task
You can move the following documents or folders:v A document from one folder to anotherv A folder from one part of the folder tree to another
You can move multiple items at the same time. However, if an error occurs withone of the items, the entire transaction is rolled back (none of the items aremoved), and an error message is displayed.
This procedure can be used in the personal documents and vault pages.
Procedure1. Click the Browse tab, and then click either personal documents or vault.2. Find the document or folder and ensure that it is displayed on the navigation
pane. See “Finding a document or folder in the Browse tab” on page 59 forinstructions.
3. Select the check box of the documents or folders you want to move, and fromthe Select Action list box, select Move Items. The move item box replaces thenavigation pane.
4. From the folder list box, select the parent folder into which you want to movethe item. Note the following restrictions:a. Document - Duplicate document names within the parent folder are not
allowed. For example, if the parent folder contains the documentreport_123, you cannot add another folder named subfolder_123.
b. Folder - Duplicate subfolder names within a parent folder are not allowed.For example, if the parent folder contains the subfolder subfolder_123, youcannot add another folder named subfolder_123.-And- The target parent folder and the folder to be moved cannot haveduplicate names
5. Do one of the following to complete the procedure:a. Click move. The item is moved to the new parent directory.b. Click cancel to exit the move item box without moving the item.
Deleting a document or folderUse the following procedure to delete a document or a folder.
About this task
You can delete multiple items at the same time. However, if an error occurs withone of the items, the entire transaction is rolled back (none of the items aredeleted), and an error message is displayed.
This procedure can be used in the personal documents and vault pages.
Procedure1. Click the Browse tab, and then click either personal documents or vault.
64 IBM Tivoli Netcool Performance Manager: User Guide

2. Find the document or folder and ensure that it is displayed on the navigationpane. See “Finding a document or folder in the Browse tab” on page 59 forinstructions.
3. Select the check box of the documents or folders you want to delete, and fromthe Select Action list box, select Delete Items. The delete item box replaces thenavigation pane.
Note: If you are deleting a folder, it must be empty (cannot have anydocuments of subfolder). You must have the appropriate permissions to deletea folder or document. Some items cannot be deleted. For example, predefinedreport definition templates cannot be deleted.
4. Click delete. The item is removed from the navigation pane.
Saving to a default folderWhen you save a Tivoli Netcool Performance Manager document (such as a reportdefinition or the results of a report), you are presented with a default folder inwhich you can save the document.
You can change the default folder to one of your choosing.
You use the Preferences page to set a new default folder for each document type.For example, you could set the default folder for your MyFavorites pages, reportresults, schedule entries and so on. For instructions, see “Setting preferenceoptions” on page 12.
Viewing auto-purge settingsProcedures for viewing and setting auto-purge settings.
About this task
You can use the auto-purge feature to automatically delete folders and theirdocuments that are older than a specified number of days. Rules for automaticallypurging documents are set at the folder level.
Use the following procedure to view auto-purge settings for a folder.
Procedure1. Click the Browse tab, then click either personal documents or vault pages.2. Select a folder listed on the contents pane as shown in the following graphic:
To select all folders, select the Name check box.3. From the Select action list box, select View Auto Purge Settings . The page
refreshes. The auto-purge page is displayed.
Chapter 5. Browsing reports and other documents 65

Setting auto-purge rulesAbout this task
You can change auto-purge settings for a folder if you are the owner of the folderor if you have administrator permissions. The following procedure assumes theauto-purge page is open (see “Viewing auto-purge settings” on page 65.)
Procedure
Select the folder for which you want to set auto-purge rules and click edit. Thesettings become available for editing as shown in the following graphic:
Legend:
# Description
1 Inherit From Parent check box - If selected, the current folder and itsdescendants inherit the properties from the parent folder. When you select acleared box, the values that are set for Retain Folder on Auto Purge andRetention Period are discarded and replaced with the values from the parentfolder.
2 Retain Folder On Auto Purge check box - If cleared, theRetention Periodfolder is deleted when all the documents in it are purged.
3Retention Period (in days) check box - The number of days that the folder ordocument is retained. If you select the retain forever check box, the followingoccurs:
v The folder is never deleted
v The Retention Period text box is cleared and disabled
Auto-organizing reports resultsUsing the auto-organizing feature, you can automatically create folders to organizeyour report results.
When you run a report definition (immediate or scheduled), you select a folder asthe destination for the report results. However, if you run the same report multipletimes, all the report results go into the same folder. This often makes it difficult tofind precisely the report output you want.
66 IBM Tivoli Netcool Performance Manager: User Guide

You can automatically organize folders for report results by using variables in thereport result name. The variables automatically create folders and report names.See “Auto-organizing variables” for a list of the variables you can use.
Example:
Assume that you have a scheduled report that runs every day and that you wouldlike to organize the report results from each run into separate folders. You mightuse the following variables and forward slashes (the forward slashes indicate childfolders in the auto-organized file structure.)
$YYYY/$MONTH/$DD/$REPORTNAME
After a number of report runs, the resulting folder structure could look somethinglike this:
The 2004, Jan, and 01 folders, and the Cell_A report results name are automaticallygenerated from the variables.
Auto-organizing variablesYou auto-organize your report results by entering variable strings. This sectionprovides a list of variables you can use as well as variable string examples.
Table 15. Auto-Organizing Variables
Type Variable Description
Date and Time $YYYY four-digit year
$MM month
$DD day
$HH24 24 - hour, military time
$MI minute
$SS second
$MONTH full month name
$DAY full day name
$WEEK week number
$YESTERDAY Inserts yesterday's date into the reportname, for example: 2004-07-21.Note: The date is based on when the reportis run.
Chapter 5. Browsing reports and other documents 67

Table 15. Auto-Organizing Variables (continued)
Type Variable Description
$YESTERDAY: n...n You can pair the $YESTERDAY variable withother data and time variables as follows:
$YESTERDAY:YYYY$YESTERDAY:MM$YESTERDAY:DD$YESTERDAY:HH24$YESTERDAY:MI$YESTERDAY:SS$YESTERDAY:MONTH$YESTERDAY:DAY$YESTERDAY:WEEK
Identifiers $USER schedule entry owner
$ID task ID: a unique, sequential number thatthe software assigns
$ENTITY focal entity for the report
$REPORTNAME report name that is entered by the user
Example 1$YYYY/$MONTH/$DD ($DAY)/$ENTITY/$REPORTNAME/$HH24:$MI
If the report definition is run every 15 minutes, the above example could result inthe following:2004/February/25 (Wednesday)/Switch/Dropped Calls/10:452004/February/25 (Wednesday)/Switch/Dropped Calls/11:00
Where the slashes represent different folder levels, and the final item in the pathrepresents the name of the report results.
Example 2$USER_$YYYY$MM$DD_$HH24
If the report definition is run every day, the above example could result in thefollowing set of report result names:joe_20041025_2300joe_20041026_2300
If the report definition is run every day, the above example could result in thefollowing set of report result names:network01_2004-07-21:10:45network01_2004-07-22:10:45
Setting up auto-organizingYou can auto-organize the folders for your report results the following ways:v In the Preferences tab, set preferences. See “Setting preference options” on page
12. Auto-organizing variables in the Preferences tab are global. The variables areautomatically the default whenever you run an immediate report or schedule areport. You can always override the preference settings and use other variables.
v Whenever you run an immediate report, see “Running an immediate report” onpage 60.
v Whenever you create and save a schedule entry, see “Setting up a scheduleentry” on page 186.
68 IBM Tivoli Netcool Performance Manager: User Guide

Publishing a document or folderPublishing moves items (document or folder) from the personal documents page tothe vault page so that other users can work with them. When you publish an item,you set read and write permissions for that item. To do so successfully, you needto understand the following:v How read and write permissions affect a user's ability to view, edit, and delete
documents and folders; and to run report definitions (see “Read and writepermissions” on page 56).
v How permissions work with groups and individual users
User and group permissionsDescribes the terms user and group, and provides the default read and writepermissions for both.
User and group definitions
Permissions work with a user and the user's group:v User - A single user account in the Tivoli Netcool Performance Manager system.
Each user account has a default group to which it belongs.v Group - Contains a set of users who generally share as similar function. Groups
are either system-defined or created by the Tivoli Netcool Performance Managersystem administrator. Listed here are the system-defined groups and theirdescriptions:
v Admin - Has full read and write permissions on all the documents and foldersin the Browse tab.
v Everybody - All users are in this group. The default permission settings are readnone and write none. Use this group to publish a document or folder toeverybody in the system.
v Default Group - When a user is added to the system, the Tivoli NetcoolPerformance Manager administrator assigns a default group to the user. Note,however, that the administrator can assign a user to more than one group.
Default user and group permissions
Default permissions are used when you either publish or save an item (documentor folder) to the vault page.v When you publish an item from the personal documents page to the vault page,
you explicitly set read and write permissions for either a user or a group.v When you save an item (such as a MyFavorites or a report result) to the vault
page, the software implicitly sets the default permissions.
Table 16. Default Group Permissions
User / Group Permissions
Your user account Read and write
Your defaultgroup
Read onlyNote: The exception to this is the Everybody group. If your defaultgroup is Everybody, the permissions are set to read none and writenone for the group. In other words, no other users will be able to viewor edit this item on the vault page.
Chapter 5. Browsing reports and other documents 69

Publishing a document or folderUse the following procedure to publish a document or folder from the personaldocuments page to the vault page.
About this task
Use the following procedure to publish a document or folder from the personaldocuments page to the vault page.
Note: When you publish a document or folder, the item is moved to the vaultpage. After publication the item is no longer available in the personal documentspage.
To publish a document or folder, follow these steps:
Procedure1. Click the Browse tab, and then click personal documents.2. Find the document or folder and ensure that it is displayed on the navigation
pane. (See “Finding a document or folder in the Browse tab” on page 59 forfinding a document or folder.)
3. Select the check box of the documents or folders you want to publish, and fromthe Select Action list box, select Publish Item(s). The publish screen replacesthe navigation pane.
70 IBM Tivoli Netcool Performance Manager: User Guide

Note: You can select to publish multiple items at the same time. However,when you do so, you use the same set of permissions for all selected items.
4. From the group/user list box 1 in the preceding figure), select either Group orUser. The groups and users you can publish to are displayed in a list box (2 inthe preceding figure. For an explanation of the Group, User, and Everybody,see “User and group permissions” on page 69.
5. From the names list box 2 in the preceding figure, select the group or usernames, and then click add. The selected name is listed in the Name section 3 inthe preceding figure.
6. For each individual group or user in the Name section, set the read and/orwrite permissions by clearing or selecting the Read and Write check boxes. See“Read and write permissions” on page 56 for a description of the read andwrite permissions.
7. Select a destination folder in the vault page 4 in the preceding figure.8. To complete this procedure, do one of the following tasks:
a. Click move. The item is moved from the personal documents page to thefolder in the vault page that you selected.
b. Click cancel to keep the item private. The page refreshes, and you exit themove item box.
Viewing and changing permissionsAbout this task
Use the following procedure to view and change the permissions of publisheddocument or folder.
Note: To change the permissions on an item, you must be the owner.
Procedure1. Click the Browse tab, and then click the vault page.2. Find the document or folder and ensure it is displayed on the navigation pane.
See “Finding a document or folder in the Browse tab” on page 59 forinstructions.
3. Select the check box of the documents or folders whose permissions you wantto view or change. And from the Select Action list box, select ViewPermissions. The vault page is replaced with the permissions page.
4. To change permission settings, select the item and click edit. The permissionsbecome editable.Or, to exit the Permissions page, click cancel.
5. From the Group/User list box, select Group or User.6. From the list box, select a group or user, and then click add. The selected name
is listed under Name.7. Set read/write permissions by selecting or clearing the Read and Write check
boxes. See “Document and folder permissions” on page 55 for an explanationof permissions for documents and folders.
8. To save the new permission setting, click save. Otherwise, click cancel.
Chapter 5. Browsing reports and other documents 71

Copying a published documentYou might want to make a copy of a published item for your own use. You cancopy a published item by opening an item and renaming it.
About this task
Note: Only users with the necessary permissions are able to view, rename, or copya published document. Contact your system administrator for more details.
Use the following procedure to make a copy of a document.
To copy a published document, follow these steps:
Procedure1. Click the Browse tab, and then click the vault page.2. Find the document or folder and ensure it is displayed on the navigation pane.
See “Finding a document or folder in the Browse tab” on page 59 forinstructions.
3. Place the cursor over the document of choice until the document namebecomes underlined.
4. Click the document name. The document opens in the editing page applicableto that document type.
5. Rename the document and save it.
Note: The name of the document must be unique. No other documents in thefolder can have the same name.
6. Move the new document to another published directory if necessary. See“Moving a document or folder” on page 64 for the procedure.
Uploading external documentsYou can upload reports or other documents from external sources and place themeither in the vault or in your personal documents folder. These imported files canbe Excel spreadsheets, text files, or any other document you want to import.
About this task
To import external documents into the Tivoli Netcool Performance ManagerBrowse tab, follow these steps:
Procedure1. Click the Browse tab, and then click either personal documents or vault page.2. Select a folder that is listed on the navigation pane, or create a folder as
described in “Creating a folder” on page 63.3. From the Select Action list box, select Upload File(s). The Upload page
displays. You can upload up to five documents at a time.4. For each file you want to upload, enter the full path name of the file. You can
also click Browse to locate the file.5. When you have selected the files that you want to import, click Upload . The
folder that you have selected must now display a virtual folder called ExternalDocuments. When you click this folder, it displays the list of files youuploaded.
72 IBM Tivoli Netcool Performance Manager: User Guide

External documents can take up to 10 seconds to upload. If the ExternalDocuments folder does not appear immediately after you click Upload , youcan refresh your browser page until it does.
Exporting reportsYou can export reports from your personal documents page and the Vault page.
About this task
Note: The External Reporting feature does not handle multiple reports\schedulesthat are created with identical names. Duplicate report results can be exported tothe same locations via database, local, and FTP export. If multiple users happen touse the same report name and same schedule name, then previously exported datawill be overwritten. This can occur in a single user scenario where the user hasreports of the same name in different folders. It can also occur in a multiple userscenario where users happen to use the same names. This issue is only caused bythe name of report/schedule being the same. It is also important to note that thisissue applies to both ad hoc and scheduled external exporting.
Note: A number of properties can be set for external reporting, including FTP,SMTP, and destination folder settings. For more information, see the AdministeringTivoli Netcool Performance Manager - Wireless Component.
You can export report results to:v A database tablev A local locationv A remote location by using FTP and email.
The following table naming conventions are used for reports that are exported to adatabase table:v XP_[REPORT_NAME]_RESv XP_[REPORT_NAME]_[SCHEDULE_NAME]_RES - for reports that are exported
by using a schedule
The following file naming conventions are used for report results that are exportedto local or remote locations in xml, xls and csv formats:v [Report Name]_[Time Stamp].[Format] - for reports that are exported from the
Browse tab personal document and vault pagesv [Report Name]_ [Schedule Name]_[Time Stamp].[Format] - for reports that are
exported by using a schedule
See for schedule “Creating a schedule” on page 185, for information aboutschedules.
To export a report:
Procedure1. Click the Browse tab, and then click personal documents page.2. Select the Results folder that you want to use in the navigation pane.3. Select the report results that you want to export, by checking the appropriate
check boxes. You can export report results one at a time.
Chapter 5. Browsing reports and other documents 73

4. From the Select Action list box, select External Export . The Export Optionsdialog displays.
Select the export options that you want, report results can be exported by usingthese options.
EmailReport results can be exported to email recipients as attachments. Report resultscan be exported in xml, csv, and xls formats. An attachment is created for eachformat.
About this task
To export report results by using email, follow these steps:
Procedure1. Click the Email tab.
Tivoli Netcool Performance Manager users with email addresses are listed inthe box in the top left side of the dialog.
2. If required, select/deselect Tivoli Netcool Performance Manager users asrecipients by using the arrow buttons.Selected Tivoli Netcool Performance Manager recipients are shown in the rightbox. Other recipients can be selected. See Additional Recipients in the tablebelow.
3. Select the remaining export options:
Field Description
Export Format xml csv xls - Report results export format. Select each of theformats you require.
Notification Messageonly
Notification of report results availability inTivoli NetcoolPerformance Manager. No results are exported.
Additional Recipients Email addresses of recipients that are not Tivoli NetcoolPerformance Manager users. Addresses must be separated by acomma and conform to the [email protected] format.
4. Click Submit to export the report results.
74 IBM Tivoli Netcool Performance Manager: User Guide

Local folderReport results can be exported to a local folder. Report results can be exported inxml, csv, and xls formats. A file is created for each format.
About this task
To export report results to a local folder, follow these steps:
Procedure1. Click the Local tab.2. Enter the local export options:
Field Description
Export Format xml csv xls - Report results export format. Select each of theformats you require.
Destination Folder Local destination folder location. Select the root location from theDestination Folder tree. Locally exported report results are copiedin to automatically created subfolder under the specified rootfolder, according to the dates of the reports. For example,appl/var/rg/spool/export/reports/20070712/. The YYYYMMDD dateformat is used.
3. Click Submit to export the report results.
FTPReport results can be exported to a local folder. Report results can be exported inxml, csv, and xls formats. A file is created for each format.
About this task
To export report results via FTP, follow these steps:
Procedure1. Click the FTP tab.2. Enter the FTP export options:
Field Description
Export Format xml csv xls - Report results export format. Select eachof the formats you require.
Anonymous Anonymous FTP export. For anonymous FTP export,the username and password are automatically enteredas: anonymous.
Host The FTP host name.
Port FTP Port number to be used.
Target Folder The FTP server folder location to export the reports to.
User The FTP username.
Password The FTP password.
3. Click Submit to export the report results.
Chapter 5. Browsing reports and other documents 75
Database tableReport results can be exported to a database table.
About this task
The following applies to export target database tables:v A new table is created for each set of exported report results.v The table structure is similar to CSV format, with a timestamp column.v Tables are appended with new data when a report is reexported, existing data is
not appended.v Tables are indexed.v As far as is possible, column names use traffic view naming conventions and
KPI short names.v A data dictionary is provided that matches a report KPI name.v Changes to a report definition are replicated in its corresponding table.
For more information about report results that are exported to database tables, seethe Administering Tivoli Netcool Performance Manager - Wireless Component.
To export report results to a database table, follow these steps:
Procedure1. Click the Database tab.2. Check the Export Format check box.3. Click Submit to export the report results.
76 IBM Tivoli Netcool Performance Manager: User Guide

Chapter 6. Monitoring report status
The Monitor tab lists all the report results that are being generated or have beenrecently generated. Report results in the Monitor are available only for one day.
OverviewThese sections review monitor basics, and provide instructions for finding andviewing information about the reports in the Monitor tab.
Report generation processDescribes the procedure to generate a report after a report has been submitted torun.
The following figure shows the report generation process after a report has beensubmitted to run.
v Reports are submitted to run on the server.v The Tivoli Netcool Performance Manager software treats all reports as report
groups. Each report group is given a group number (job ID), and each reportwithin the group is given a report number (task ID) and a report name. Reportgroups are queued to be run.
v A report group, and so all the reports within the group is run.v If a report within the report group is successfully generated, the report output
becomes available in Monitor tab. If it is a local report, it also becomes availablein the Browse tab.
If report generation is unsuccessful, report status and auxiliary information aboutthe run become available in the Monitor tab.
© Copyright IBM Corp. 2006, 2015 77

About jobs and tasksWhen reports are submitted for a report run, they are given job IDs, tasks IDs, andreport names.
The descriptions for the identification numbers (IDs) and report number are asfollows:v Job ID - The report group numberv Task ID - The report numberv Name - The report group takes a temporary report name, for example: Temp
Report Group(number). Report groups on the server will always have atemporary name because they have one report.
Jobs and tasks pagesYou can find reports on either the jobs page or the tasks page.
The jobs page lists report groups: the report group number (job ID), the number oftasks that are completed in the group, and the temporary report name. The taskspage lists individual reports: the report number (task ID), report group number,(job ID) and the report name.
The following figure is an example of the jobs page.
The jobs page in the preceding figure displays two report groups with multiplereports.
The following figure is an example of the tasks page.
The tasks page displays the task ID and job ID of each report and, moreimportantly, the report name.
Given the type of information that is presented in the jobs and tasks pages, it isrecommended that you use the jobs page for finding report groups with multiplereports, and the tasks page for finding individual reports.
78 IBM Tivoli Netcool Performance Manager: User Guide

About columns in the MonitorYou use the columns in the Monitor tab to find and view information aboutreports and report groups.
Because the jobs page focuses more on report groups and the tasks pages focuseson the individual report, both pages offer moderately different information. Youcan find column descriptions for the jobs and tasks pages in the following twotables.
The following table describes the columns in the jobs page.
Table 17. Jobs Page - Column Descriptions
List Item Description
Job ID Report group number.
Tasks Number of tasks in a report group.
Report Name The name of a report.
ScheduleName
The name of a schedule.
Type v Immediate - The report was run straightway without a schedule.
v Scheduled - The report was run based on a schedule entry.
Owner The user account responsible for scheduling the report, or running thereport as immediate.
Scheduled Date and time when report generation started.
Finished Date and time when report generation ended.
Status Status of the report or report group (see “Report status” on page 80)
StatusMessage
Brief explanation of status. For example, if the report failed, this columnprovides a brief explanation as to why it failed.
The following table describes the columns in the tasks page.
Table 18. Tasks Page - Column Descriptions
List Item Description
Task ID ID number of an individual report.
Job ID The report group number.
Name The name of the report.
Server The name of the server against which the report was run.
Type Indicates the report type.
Owner The user account responsible for scheduling the report, orrunning the report as immediate.
Scheduled Date and time when report generation was scheduled.
Started Date and time when report generation started.
Finished Date and time when report generation ended.
Status Status of the report (see “Report status” on page 80)
Status Message Brief explanation of status. For example, if the report failed, thiscolumn provides a brief explanation as to why it failed.
Chapter 6. Monitoring report status 79

Report statusAs reports are run, they are placed in a queue, and their position in the reportgeneration process is given a status type.
The jobs page has almost double the status types than what you might find on thetasks page. This is because the jobs page must provide status information aboutreport groups and their individual reports.
The following table lists the status types for both the jobs and tasks pages. Thestatus types are listed in order of the report generation process.
Table 19. Descriptions for Status Types
Status Type Jobs Page Tasks Page Description
Scheduled X The initial state forall document groups.
Waiting X If a license is notimmediatelyavailable, the jobswait until a licensecan be allocated.
Active X When a job has alicense, it moves intothe active queue.
Started X X The task managerhas picked up the joband expanded the jobdefinition to create atask for each of thereport definitions inthe report group thatis associated withthat job.
Running X The report hasstarted to run.
Done X X The report has runsuccessfully and hasgenerated output.
Failed X X Jobs/tasks thatattempted to run, butfailed. The resultingreport log is ofteninstructive in thesecases (see “Viewinglog content” on page85).
You can view the status of a report by looking at the Monitor columns.
80 IBM Tivoli Netcool Performance Manager: User Guide

Before you beginTo use the functionality in the Monitoring tab, you must first have the requisiteprivilege to view the status of a report. If you are unsure of the privileges youhave, contact your system administrator.
Finding a report in the Monitor tabThe Monitor tab lists all report results that are being generated or have beengenerated. As such, a great number of report results can be displayed, stretchingacross numerous pages. You can search through the display to find the reportresults you want quickly. This section reviews the different search strategiesavailable to you and the procedures for their use.
Search strategiesThe Monitor tab gives you a number of different ways to find a report output thatrange from simple to advanced. These search methods are the same for the jobsand tasks pages.
Selecting a server
As a mandatory step in the search process, you must select the server on which thereport is located.
Simple search
With a simple search, you can search for a full or partial report result name.Conversely, you can list all available report results and scan the list. See“Performing simple searches” for instructions.
Advanced search
The advanced search offers filtering. If you do not know the name of a reportresult, filtering allows you to reduce the number of reports that are displayed bycreating a subset of all available reports. For example, you can search by owner, byreport status, or by the time the report was created.
See “Performing advanced searches (Filtering)” on page 82 for the procedures.
Saving search settings
After you have a search method that works for you, you can save your searchsettings as the default so that you can use them again. See“Setting default searchsettings” on page 83 for the procedures.
Performing simple searchesWith a simple search, you can search for a report result name. Or, you can list allthe available report results and scan the list.
Procedure1. From the Select a Server list box, select the server on which the report result is
located.2. Ensure that the filter does not show. If it does, click simple search.3. Do one of the following tasks:
Chapter 6. Monitoring report status 81

Task Procedure
List all availablereport results
Click search.
Search for areport name
In the Report Name text box, type the full report name, and then clickthe search button. You can also use the wildcard asterisk (*) to search fornames. Case sensitivity is an option (see “Setting preference options” onpage 12.
The following wildcard examples assume that the case-sensitive option isturned off.
Wildcard Examples:
v R* This example would list all report names that begin with the letterR or r.
v *Cell* This example would list all report names with the word Cellor cell in them.
Performing advanced searches (Filtering)Use the procedure to filter the report results based on a set of filter criteria.
About this task
You can filter by owner, status, or job or report types. You can additionally searchby the time a report was created.
To perform an advanced search, follow these steps:
Procedure1. From the Select a Server list box, select the server on which the report output
is located.2. Ensure that the filter is displayed on the page. If it does not, click advanced
search.3. You can select from one or all of the filter list boxes. For an explanation of
owner, status, or job type for the jobs page.4. To search by time:
a. Filter by the time a report that is arrived in the Monitor, or the age of areport. From the first of the two time boxes, select either in last or olderthan.
b. In the next box, type the number of hours, days, weeks, or months. Thenumber must be a whole number; no decimal points.
Note: If you do not want to not filter by time, type zero (0).c. In the last box, select the time unit (hours, days, and so on).
82 IBM Tivoli Netcool Performance Manager: User Guide

Setting default search settingsUse the following procedure to set your current search settings as default.
About this task
Default search settings include the server, report name, the filtering criteria, andcolumn sorting. You can have a different grouping of search settings for the jobspage and for the tasks page. After you log out and log in, and then return to eitherpage, it runs the default search settings again.
Procedure1. Ensure that you have the selected settings for the server, report name, filtering
criteria, and column sorting.2. Click set as default.
Tip: The reset button resets the filter fields to their default values. However,the saved settings are still kept and are run when you leave the page andreturn to it.
Sorting Monitor columnsYou can sort any of the Monitor columns into ascending or descending lists. Youcan also set the case sensitivity of the columns.
Procedure1. Place the mouse over one of the column headings. The cursor takes the shape
of a hand.2. Click the heading. If the list is initially unsorted, it is listed in ascending order.
Up and down arrows indicate ascending and descending order. If the list isalready sorted, the sort is reversed.
Navigating pagesThe columns within the Monitor tab represent half-pages, which you navigatethrough in order to find the report of choice.
About this task
If there are numerous reports, they are displayed on consecutively numberedpages.
Use the following procedure to move from one (half) page to the next.
Procedure
You can move to another page in one of two ways, which are listed here:
Task Procedure
Move sequentially fromone page to the next
Click either the right or left arrow in the navigation area of thepage. The right arrow moves you to the next page. The leftarrow moves you to the previous page.
Go to a specific page v In the page text box, type the number of the page
v Click go or press the Enter key.
Chapter 6. Monitoring report status 83

Refreshing the Monitor viewThe Monitor view is static; in other words, it is not automatically updated.
About this task
To refresh the Monitor view, which will update the status for all reports, use thefollowing procedure:
Procedure
Click refresh or search.
Deleting a reportUse the following procedure to delete a report or report group from the tasks pageor the jobs page.
Procedure1. Open the tasks page to delete a report, or the jobs page to delete a report group.2. Find the report or report group you want to delete. See “Finding a report in the
Monitor tab” on page 81.3. Select the check box of the reports or report groups.4. Click delete (located by the Select Action list box). The report is removed from
the page.
Viewing report outputAbout this task
After you found a report, and it has successfully generated, you can perform oneof the following actions:
For an explanation of these actions and a set of procedures, see Chapter 3,“Viewing report results,” on page 19.
Procedure1. View in table and chart formats, see“Opening a report” on page 232. Download as a CSV file, see“Downloading a CSV file” on page 423. Download as an XML file, see“Downloading an XML file” on page 454. Download an Excel file, see “Downloading an Excel file” on page 46
Viewing auxiliary report informationIn addition to viewing report output, you can also view auxiliary, orcomplementary report information.
84 IBM Tivoli Netcool Performance Manager: User Guide

Viewing report historyEvery time that you run a report definition, report output is generated and given atask ID number. If you run another report from the same report definition, theoutput is generated again and is given another task ID number, and so on. You canview this multiple report output as report instances, where each task ID numberrepresents a report instance.
About this task
When you select to view the history of a report, the report history view lists all thereport output (or instances) that meet all the following criteria:v Were generated from the same report definitionv Were generated previous to the selected reportv Are currently available in the Monitor tab
For example, assume that you have scheduled a report to be generated every hourfrom the report definition MyReport. In the Monitor tab, if you were to select themost recent report output for MyReport, and were to view the report history, youwould see all the previously generated report outputs (instances) of Report A thatwere still available in the Monitor.
To view report history:
Procedure1. Select the check box of the report instance (output) of choice.2. From the Select Action list box, select View Report History.
Viewing log contentAbout this task
A report log file is written for every job (report group). It is a record of softwareactivities that take place during the generation of the reports that are associatedwith that job. It lists the number of tasks (reports) contained in the job, start, andend times for each task, error messages (if the report generation encountereddifficulties), and other transactional details.
Procedure1. Select the check box of the report or report group choice.2. From the Select Action list box, select Show log file. The contents of the log
file is displayed in a separate window.
Viewing status detailsAbout this task
The status details view offers the following information:v Start timev Finish timev Status message
You can view status details that are associated with a report group or a singlereport. When you view the status details of a report group, you see a separatewindow for each report in the group.
Chapter 6. Monitoring report status 85
Procedure1. Select the check box of the report or report group.2. From the Select Action list box, select Show details. A status window is
opened for each report in a group, or a single window for a single report.
86 IBM Tivoli Netcool Performance Manager: User Guide

Chapter 7. Report definition basics
The Tivoli Netcool Performance Manager report definition includes terms andconcepts that might be new to you. If so, you might want to review the followingconceptual topics.
Entity basicsAn entity represents a type of network element, such as a cell or antenna. When asystem is setup each network element type becomes an entity, and entityhierarchies are established, which determine the relationship between the entities.
The following topics provide additional information on entities:v “Entity types and instances”v “Entity hierarchy”v “Rehoming network elements” on page 88
Entity types and instancesAn entity represents a type of network element. A network element can be anyitem within the wireless network infrastructure (logical or physical). Whereas, anentity represents an abstract category, an entity instance is a manifestation of anentity within that category. This concept is illustrated in the following figure:
The figure displays the entity types; Switch, Cell, and Antenna. These entity typesare the abstract categories and represent the general idea of a switch, cell, andantenna. Switch A, Cell_1, and Antenna_A are the network elements themselves.These entity instances represent actual physical or logical items within a network.
Entity hierarchyAn entity hierarchy shows the relationship between the different entity types. In allhierarchies, you have child entities and parent entities. The parent entity is onethat is directly above another, and, conversely, the child entity is directly below anentity - as illustrated in the following figure:
© Copyright IBM Corp. 2006, 2015 87

The entity type Preprocessor is the parent of Cell. And the Cell entity type is thechild of Preprocessor.
When creating Tivoli Netcool Performance Manager report definitions, you workwith descendants and ancestors within the hierarchy. Descendants are all the entitytypes below a specified level. The entity types; Cell, Antenna, and CPU aredescendants of Preprocessor. Conversely, Preprocessor and Switch are the ancestorsof Cell.
Rehoming network elementsThe Rehoming section of a report definition can be used to include in a report datathat is collected from network elements that have previously been rehomed.Rehoming occurs when there is a change in the relationship between entityinstances. For example, moving a Cell from one BSC to another BSC.
An entity instance can have any number of parents of a given entity type overtime, but can have one parent of that type at any one time. For example, Cell1cannot have BSC1 as a parent between 10AM and 15PM and also BSC2 as a parentbetween 13PM and 17PM.
Traffic field basicsRefers to traffic data and traffic fields (generally referred to as fields):v Traffic data - The performance and service measurement data that has been
acquired from the network elements.v Traffic fields - The performance and service measurements you select for a
report. For example, if you selected the field DroppedCalls for your report, thereport would present the traffic (performance) data for DroppedCalls.
Traffic dataTraffic data contains the actual performance and service data for a period.
Traffic data contains the actual performance and service data for a period, forexample, the number of dropped calls in an hour, the number of successfulhandoffs in a half-hour, the number of successfully completed calls in a 15-minuteperiod.
The data source acquires traffic data from the network elements. The traffic data isthen loaded into the database as illustrated in the following figure:
88 IBM Tivoli Netcool Performance Manager: User Guide

Traffic data is recorded at regular intervals, generally hourly, or subhourly (forexample, 30 minutes or 15 minutes), depending on the system. For this reason,traffic data is also known as time-series data. This concept is illustrated in thefollowing table.
Cell 1 Peg 1
hr 01hr 02hr 03...hr 22hr 23hr 24
102030...204050
Time-series data is a series of values over time. The time-series data in the abovetable shows the field values for Peg1 over time, at an hourly interval.
Each traffic field has a field type and an aggregation type.v Field type - Informs the Tivoli Netcool Performance Manager software whether
a specific calculation must be applied when the report is generated. For example,if the field type is a primitive calculation, the Tivoli Netcool PerformanceManager software executes that calculation upon report generation.
v Aggregation type - Informs the Tivoli Netcool Performance Manager softwarehow to combine (aggregate) fields.
Traffic fieldsTraffic fields represent the performance and service measurements that you use toanalyze parts of your network. For example, if you want to analyze the number ofattempted calls for a given period, you would select the field that represents thatperformance measurement.
The following illustration, shows that the Cell entity in our hypothetical TivoliNetcool Performance Manager system has three fields:
Chapter 7. Report definition basics 89
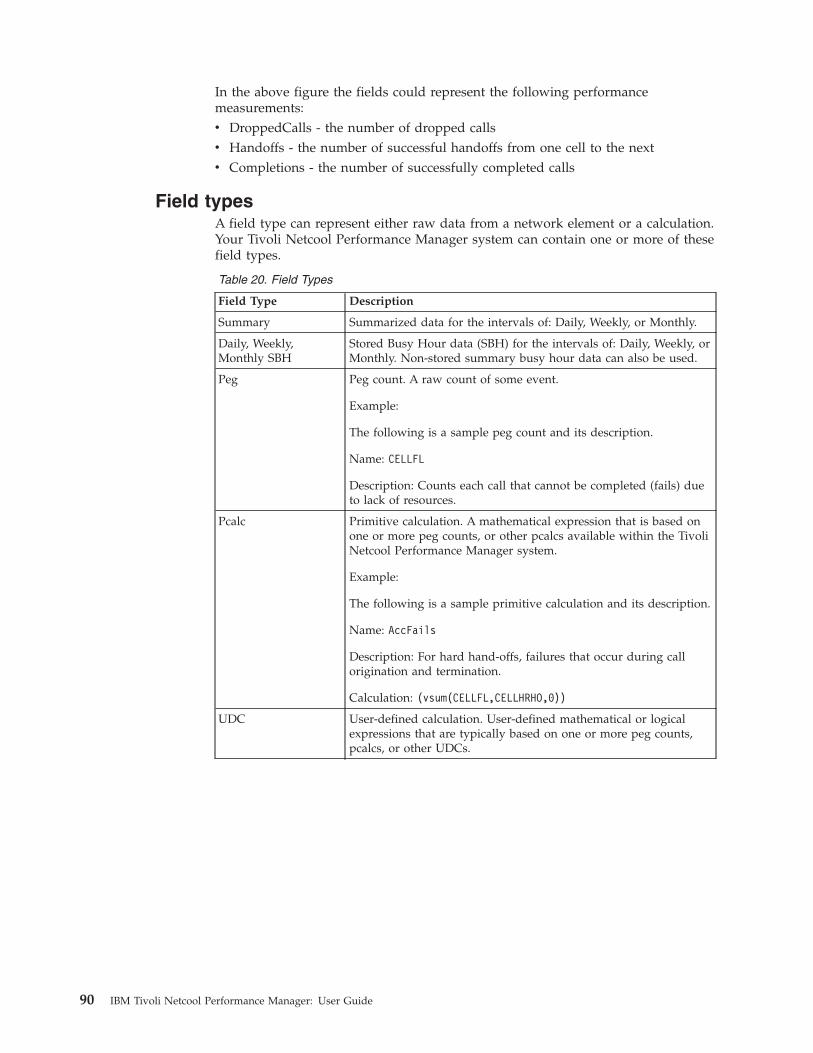
In the above figure the fields could represent the following performancemeasurements:v DroppedCalls - the number of dropped callsv Handoffs - the number of successful handoffs from one cell to the nextv Completions - the number of successfully completed calls
Field typesA field type can represent either raw data from a network element or a calculation.Your Tivoli Netcool Performance Manager system can contain one or more of thesefield types.
Table 20. Field Types
Field Type Description
Summary Summarized data for the intervals of: Daily, Weekly, or Monthly.
Daily, Weekly,Monthly SBH
Stored Busy Hour data (SBH) for the intervals of: Daily, Weekly, orMonthly. Non-stored summary busy hour data can also be used.
Peg Peg count. A raw count of some event.
Example:
The following is a sample peg count and its description.
Name: CELLFL
Description: Counts each call that cannot be completed (fails) dueto lack of resources.
Pcalc Primitive calculation. A mathematical expression that is based onone or more peg counts, or other pcalcs available within the TivoliNetcool Performance Manager system.
Example:
The following is a sample primitive calculation and its description.
Name: AccFails
Description: For hard hand-offs, failures that occur during callorigination and termination.
Calculation: (vsum(CELLFL,CELLHRHO,0))
UDC User-defined calculation. User-defined mathematical or logicalexpressions that are typically based on one or more peg counts,pcalcs, or other UDCs.
90 IBM Tivoli Netcool Performance Manager: User Guide

Table 20. Field Types (continued)
Field Type Description
Attribute NC (Network Configuration) attribute. NC KPI.
Attributes describe or further identity individual network elements(entities). You use attributes to group and display data for yourreports.
There are three basic attribute types:
v Relationship attributes
v Configuration attributes
v Characteristic attributes
Attributes are used to include attribute and configurationinformation in reports, without having to use the Group Byfeature. For example, an attribute such as Cell.defined_channelscould be used in a report so that a user can see how theperformance of particular cells correlates to their configuration.
Attributes are also used to include configuration attributes in UDCexpressions. For example, an expression such asBSC.traffic/sum(Cell.defined_tch) could be used to determine theaverage traffic per defined traffic channel across BSCs. SeeChapter 15, “User Defined Calculations,” on page 235.Note: If an attribute, which is a non-time series KPI, is configuredas non-rehoming, any new value will automatically replace thepreviously stored value. This means that:
v Rerunning a report for the same time period might display anew value if the underlying value has changed since the reportwas last run.
v Running a report over a long period will only ever show onevalue for one such attribute (always the latest one), even if thevalue has changed in the past.
Secondary keys
A primary key is the field in a database that is the primary "key" used to uniquelyidentify a record in a database. A secondary key is an additional key, or alternatekey, which can be used in addition to the primary key to locate specific data.Reports with KPIs based on traffic tables containing secondary keys and with KPIsbased on traffic tables not containing secondary keys, are not supported. For areport with KPIs based on traffic tables having secondary key tables, KPIs must beassociated with the same KPI group.
Field type combinations
Only certain combinations of field types can be used in a report. The followingtable summarizes the combinations that are supported.
Table 21. Field types combinations
Combination Supported Description
Raw and Stored Busy Hour(SBH)
No Pegs and/or Pcalcs, and SBHs.
Summary and SBH Yes Summary and Stored busy hours.
Summary and Raw Yes Summary, and Pegs and/or Pcalcs.
Chapter 7. Report definition basics 91

Table 21. Field types combinations (continued)
Combination Supported Description
Summary Yes Summary.
SBH Yes SBHs.
Raw Yes Pegs and/or Pcalcs.
Attribute Yes Attribute.
Attribute and Raw Yes Attribute and Pegs and/or Pcalcs.
Attribute and SBH. Yes Attribute and SBH.
Attribute and Summary Yes Attribute and Summary.
Attribute, Raw, andSummary.
Yes Attribute and Pegs and/or Pcalcs, andsummary.
Attribute, Summary, andSBH
Yes Attribute, Summary, and SBH.
Missing data and confidence factorsOccasional transmission problems occur between the network elements and theserver which can result in missing traffic data in the database.
For data availability, the following two actions must occur:v The network element must successfully transfer all data files containing the
traffic data to the server, and the server must then successfully load the files intothe database.
v All data files must contain 100% of the expected traffic data. (For example, if acell went offline and did not report data, then the data file with data from thatcell would be incomplete.)
If either of the above actions fail, then traffic data is missing. Missing data candistort the validity of your reports.
To determine whether your report is impacted by missing data, you can include aconfidence factor in a report definition.
To determine which network elements in a report are missing data, or to determinewhether data files have loaded successfully, use the Data Availability tool.
Confidence factors
A confidence factor is a percentage that indicates whether all, most, or only someof the traffic data that is required for a report is available. A summary confidencefactor is given for each subset of KPIs in the report.
Anything under 100 percent means that data was missing. The lower theconfidence factor, the more data that is missing, and the higher the likelihood thatthe validly of your reports is being compromised.
How confidence factors are determined
The following examples show how the confidence factor would be generatedunder two difference sets of conditions. Both of the following examples discusshypothetical Cell reports with one counter/KPI.
92 IBM Tivoli Netcool Performance Manager: User Guide

Example 1:
Conditions: The traffic data is in available in 15-minute reporting periods. Thereport includes one hour of data from 100 cells. Ten (10) of the cells are eachmissing the two (2) 15-minute periods.
Confidence factor: 95%
(1 - (10 cells * 2 15-minute period) / (100 cells * 4 15-minute periods)) * 100
Example 2:
Conditions: The traffic data is available in hourly reporting periods. The reportincludes one day (24 hours) of data from 100 cells. Ten (10) of the cells are eachmissing one (1) hourly period.
Confidence factor: 99.6%
(1 - (10 cells * 1 hour) / (100 cells * 24 hours)) * 100
How aggregation is appliedAggregation in its simplest form represents the summing, or adding, of individualvalues into a single value, such as 10 + 20 = 30. In theTivoli Netcool PerformanceManager software, however, aggregation is more complex. This is because theTivoli Netcool Performance Manager software uses different aggregationalgorithms to calculate rolled-up field values.
The selections that you make in your report definition have a direct impact uponhow data is aggregated for the report output. How aggregation is calculated isdetermined by two primary factors:v The field aggregation typev The context of the aggregation within the report definition.
This section covers the main concepts behind aggregation to assist you inunderstanding how your report definition selections affect the aggregated totals inyour reports.
What is aggregation?Covers the main concepts behind aggregation to assist you in understanding howyour report definition selections affect the aggregated totals in your reports.
In the Tivoli Netcool Performance Manager software, aggregation is the groupingof values and then applying an algebraic expression to the grouped set of values.
Example: Applying an Aggregation Typesum(2,3,4) = 9
In the above example, we have applied the sum aggregation type to the groupedfield values 2, 3 and 4. The grouped field values are also known as the argumentsof the sum function.
TheTivoli Netcool Performance Manager software uses a number of aggregationtypes in addition to sum for calculating aggregation. The aggregation typedetermines how to calculate (aggregate) rolled-up field values over time and over
Chapter 7. Report definition basics 93

element. Aggregating over time occurs when the Group By option in the reportdefinition is set to Attribute and Time, and aggregating over element Time andAttribute. See Chapter 17, “Aggregation types,” on page 279 for a description ofthe different aggregation types.
In the Tivoli Netcool Performance Manager software, aggregation generally occurswhen the grouped field values are roll ups; that is, rolled-up fields. There are anumber of roll-up types: aggregation of descendants, aggregation of time andelement, and aggregation of element and time.
The context of a roll-up determines which arguments are used in the function.
Example of the Importance of Context
This example consists of the following data for the Peg2 field of the Antennaentity, and two algebraic expressions.
Table 22. Sample Cell Report
Entity Instance Peg2
Cell_1Antennahr 01hr 02hr 03
369
Cell_2Antennahr 01hr 02hr 03
171921
A. sum(Cell_1.Antenna.Peg2)B. sum(Cell.Antenna.Peg2)
Expression A would be executed as follows:sum(3,6,9) = 18
In this expression, the arguments consist of the Peg2 values for the antenna ofCell_1. The Peg2 values are rolled up to provide the single total of 18 for Cell_1.
Expression B would be executed as follows:sum(3,6,9,17,19,21) = 75
In this expression, the arguments consist of the Peg2 values for all cell antennas.All the Peg2 values for all the antennas have been rolled up to yield the singletotal of 75 for the entity Cell.
The concept of roll ups and aggregation are further explored in the topic“Aggregation of descendents” on page 95.
94 IBM Tivoli Netcool Performance Manager: User Guide

Aggregation of descendentsAggregation of descendents occurs when you select a field from an entity type thatis at a lower level than the focal entity type.
In this case, the reported value for the selected field will be a roll-up, oraggregation, of the field values from instances of the lower-level entity type.
Example: Aggregation of Descendents Using Sum
A report definition for a hypothetical Tivoli Netcool Performance Manager system,as shown in the figure has as its focal entity type Cell. Aggregation would occur ifyou were to select any of the fields from either of the descendent entities Antennaor CPU entity.
For example, if you select the field Failed from the CPU entity. The field Failedrepresents the number of times a CPU has failed, or gone offline. In this example,the field Failed takes the sum() function. The values of the descendent entity CPUare aggregated as illustrated in the following figure:
The report output would display the aggregation of the Failed field values fromeach of the CPU entity instances:sum(CPU.Failed) = sum(1200,2100) 3300 = 1200 + 2100
Chapter 7. Report definition basics 95

96 IBM Tivoli Netcool Performance Manager: User Guide
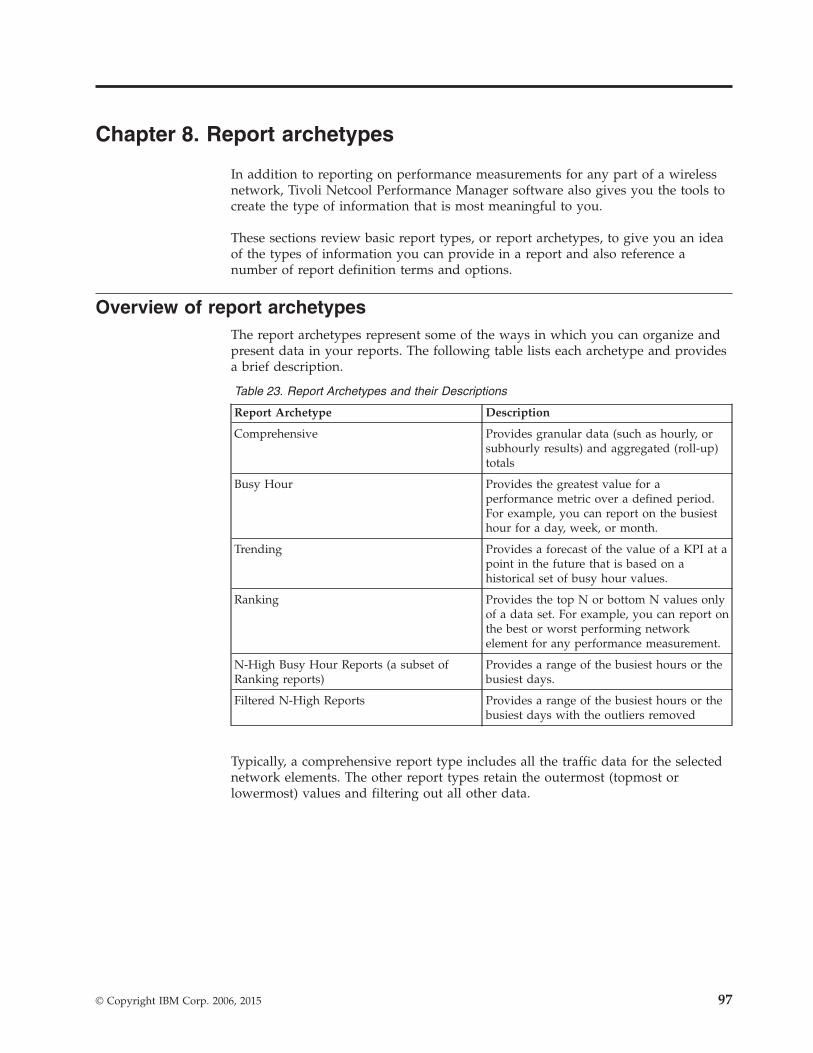
Chapter 8. Report archetypes
In addition to reporting on performance measurements for any part of a wirelessnetwork, Tivoli Netcool Performance Manager software also gives you the tools tocreate the type of information that is most meaningful to you.
These sections review basic report types, or report archetypes, to give you an ideaof the types of information you can provide in a report and also reference anumber of report definition terms and options.
Overview of report archetypesThe report archetypes represent some of the ways in which you can organize andpresent data in your reports. The following table lists each archetype and providesa brief description.
Table 23. Report Archetypes and their Descriptions
Report Archetype Description
Comprehensive Provides granular data (such as hourly, orsubhourly results) and aggregated (roll-up)totals
Busy Hour Provides the greatest value for aperformance metric over a defined period.For example, you can report on the busiesthour for a day, week, or month.
Trending Provides a forecast of the value of a KPI at apoint in the future that is based on ahistorical set of busy hour values.
Ranking Provides the top N or bottom N values onlyof a data set. For example, you can report onthe best or worst performing networkelement for any performance measurement.
N-High Busy Hour Reports (a subset ofRanking reports)
Provides a range of the busiest hours or thebusiest days.
Filtered N-High Reports Provides a range of the busiest hours or thebusiest days with the outliers removed
Typically, a comprehensive report type includes all the traffic data for the selectednetwork elements. The other report types retain the outermost (topmost orlowermost) values and filtering out all other data.
© Copyright IBM Corp. 2006, 2015 97

Comprehensive report typesThe comprehensive report type provides granular traffic data, and aggregated(roll-up) data.v Granular data generally represents the traffic data that is loaded into the
database during regular intervals, which are generally hourly or subhourly.v Aggregated (roll-up) totals are granular data that have been aggregated.
Granular traffic data can be aggregated into larger units of time or athigher-levels of the system hierarchy. (You can also create roll-up totals byselecting a lower-level field. See “Aggregating (Rolling up) fields to the FocalEntity level” on page 135.
The options in the Group By section determine the units of time and the levels ofthe system hierarchy at which traffic data is aggregated. See “Group By and reporttotals” on page 137.
The types of comprehensive reports that are covered in this section are;comprehensive with granular traffic data, granular data with drill-down totals, andsummary totals with no corresponding granular data.
The following sections review and provide examples for each comprehensivereport type, and provide a set of guidelines for creating successful reports.
Comprehensive granularThe comprehensive granular report type that is covered in this section includesgranular traffic data and roll-up totals that are created by the default Group Byoptions.
For more information, see “Report definition defaults” on page 129.
The following table exemplifies the type of information available in acomprehensive granular report by showing simultaneously all the granular dataand aggregated totals of the output. The actual report output will look different.
Table 24. Comprehensive Granular Report Type Example
Cell ID Day Hour Value Comment
------ ------ ------ 140 Top summary:Total for all Cells(001 and 002)
Cell 001 ------ ------ 64 Cell 001 total forall days
Cell 001 Sun ------ 35 Cell 001 total forSun
Cell 001 Sun 00 18 Hourly value
Cell 001 Sun 01 17 Hourly value
Cell 001 Mon ------ 29 Cell 001 total forMon
Cell 001 Mon 00 17 Hourly value
Cell 001 Mon 01 12 Hourly value
Cell 002 ------ ------ 76 Cell 002 total forall days
98 IBM Tivoli Netcool Performance Manager: User Guide

Table 24. Comprehensive Granular Report Type Example (continued)
Cell ID Day Hour Value Comment
Cell 002 Sun ------ 26 Cell 002 total forSun
Cell 002 Sun 00 14 Hourly value
Cell 002 Sun 01 12 Hourly value
Cell 002 Mon ------ 50 Cell 002 total forMon
Cell 002 Mon 00 18 Hourly value
Cell 002 Mon 01 32 Hourly value
The report data in the preceding table presents performance data for two cells (Cell001 and 002). It includes the hourly (granular) data for each cell (for the hours of00:00 and 01:00) as well as a number of aggregated (roll-up) totals as determinedby default Group By options.
Parts of the report definition might look like the following:
Definition Section Guideline
Focal Entity Type Cell
Field Selection Cell.CallOriginations
Group By Attribute and Time: Cell_ID, Day, Hour
Note: You can change the default Group By options, thus organizing performancedata and customizing totals to meet your information needs. For a description ofthe default Group By values, see “Group By defaults” on page 164. For moreexamples, see “Group By and report totals” on page 137.
Comprehensive granular with drill-downThe comprehensive granular with drill-down report type covered in this sectionincludes granular traffic data and drill-down totals.
Drill-down totals are used to view traffic data starting at higher system levels andthen moving down the system hierarchy levels to view the data at lower levels (forexample: Switch to Cell to Antenna).
The following table exemplifies the type of information available in acomprehensive granular with drill-down report by showing simultaneously all thegranular data and aggregated totals of the output. Please note that actual reportoutput will look different.
Table 25. Comprehensive Drill-Down Report Type Example
Switch ID Cell ID Ant ID Day HourAntennaValue Comment
------ ------ ----- ------ ------ 68 Topsummary:Total for allAntennasfor allSwitches(10 and 20)
Chapter 8. Report archetypes 99

Table 25. Comprehensive Drill-Down Report Type Example (continued)
Switch ID Cell ID Ant ID Day HourAntennaValue Comment
10 32 Antennatotal forSwitch 10
10 001 ----- ------ ------ 32 Antennatotals forCell 10-001
10 001 1 ------ ------ 15 Total forantenna10-001-1
10 001 2 ------ ------ 17 Total forantenna10-001-2
10 001 1 Sun ------ 15 Total forantenna10-001-1 forSun
10 001 2 Sun ------ 17 Total forantenna10-001-2 forSun
10 001 1 Sun 00 3 Hourlyvalue forAntenna10-001-1
10 001 1 Sun 01 12 Hourlyvalue forAntenna10-001-1
10 001 2 Sun 00 9 Hourlyvalue forAntenna10-001-2
10 001 2 Sun 01 8 Hourlyvalue forAntenna10-001-2
20 36 Antennatotal forSwitch 20
20 001 ----- ------ ------ 36 Antennatotals forCell 20-001
20 001 1 Sun ------ 17 Total forantenna20-001-1
20 001 2 Sun ------ 19 Total forantenna20-001-2
100 IBM Tivoli Netcool Performance Manager: User Guide

Table 25. Comprehensive Drill-Down Report Type Example (continued)
Switch ID Cell ID Ant ID Day HourAntennaValue Comment
20 001 1 Sun ------ 17 Total forantenna20-001-1 forSun
20 001 2 Sun ------ 19 Total forantenna20-001-2 forSun
20 001 1 Sun 00 5 Hourlyvalue forAntenna20-001-1
20 001 1 Sun 01 12 Hourlyvalue forAntenna20-001-1
20 001 2 Sun 00 9 Hourlyvalue forAntenna20-001-2
20 001 2 Sun 01 10 Hourlyvalue forAntenna20-001-2
The report data in the preceding table presents antenna traffic data for twoswitches (10 and 20). The report output provides totals for each level in thehierarchy (Switch:Cell:Antenna), as well as the granular hourly values for eachantenna in the report.
Parts of the report definition might look like the following:
Definition Section Guideline
Focal Entity Type Antenna
Field Selection Antenna.DroppedCalls
Group By Attribute and Time: Antenna.switch_id,Antenna.cell_id, Antenna.cell_id, Day, Hour
Comprehensive summary with no granular report typeThe comprehensive summary with no granular report type provides only roll-up,or summary, totals.
The following table exemplifies the type of information available in acomprehensive summary with no granular report by showing simultaneously allthe aggregated totals of the output. The actual report output will look different.
Chapter 8. Report archetypes 101

Table 26. Comprehensive Summary Report Type Example
Switch ID Day Hour Antenna Value Comment
------ ------ ------ 5517 Top summary:All switches -rolled-upAntenna totals
28-1 ------ ------ 1274 Switch 28-1:rolled-upantenna totals
28-2 ------ ------ 1637 Switch 28-2:rolled-upantenna totals
28-3 ------ ------ 2606 Switch 28-3:rolled-upantenna totals
28-1 Sun ------ 750 Switch 28-1:rolled-upantenna totalsfor Sun
28-1 Mon ------ 524 Switch 28-1:rolled-upantenna totalsfor Mon
28-2 Sun ------ 907 Switch 28-2:rolled-upantenna totalsfor Sun
28-2 Mon ------ 730 Switch 28-2:rolled-upantenna totalsfor Mon
28-3 Sun ------ 1575 Switch 28-3:rolled-upantenna totalsfor Sun
28-3 Mon ------ 1031 Switch 28-3:rolled-upantenna totalsfor Mon
28-1 Sun 00 372 Switch 28-1:rolled-upantenna totalsfor the hour00:00 on Sun
28-1 Sun 01 378 Switch 28-1:rolled-upantenna totalsfor the hour01:00 on Sun
28-1 Mon 00 246 Switch 28-1:rolled-upantenna totalsfor the hour00:00 on Mon
102 IBM Tivoli Netcool Performance Manager: User Guide
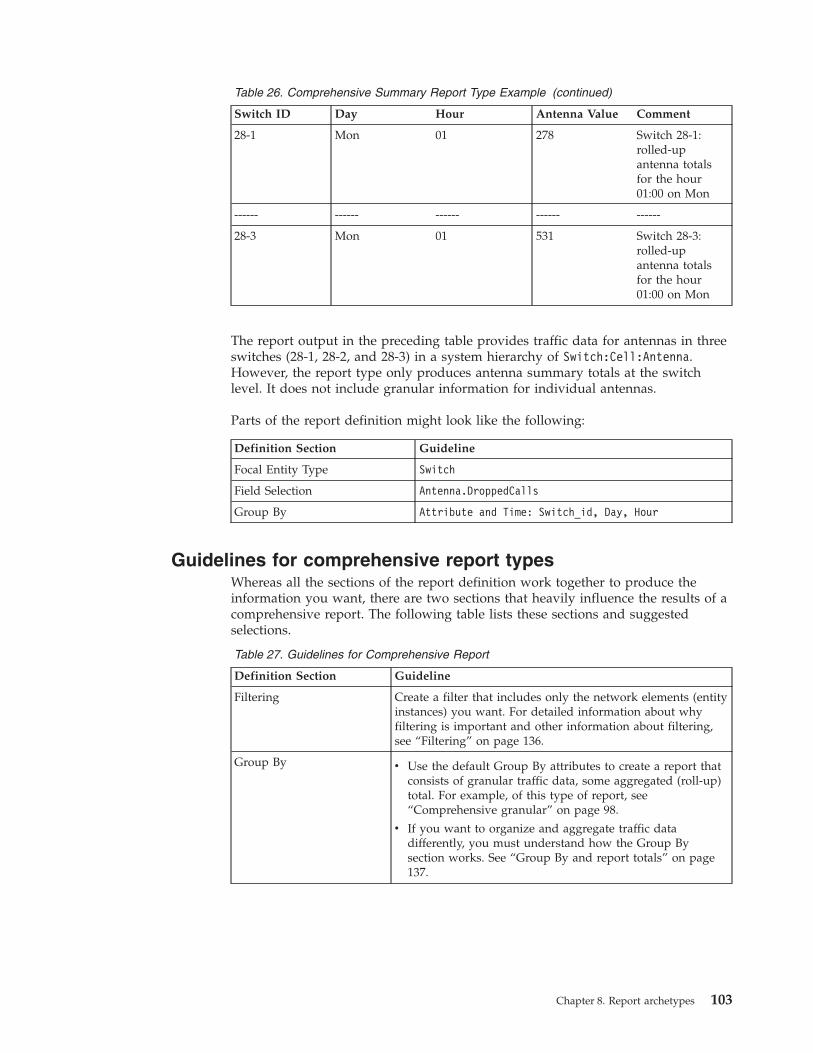
Table 26. Comprehensive Summary Report Type Example (continued)
Switch ID Day Hour Antenna Value Comment
28-1 Mon 01 278 Switch 28-1:rolled-upantenna totalsfor the hour01:00 on Mon
------ ------ ------ ------ ------
28-3 Mon 01 531 Switch 28-3:rolled-upantenna totalsfor the hour01:00 on Mon
The report output in the preceding table provides traffic data for antennas in threeswitches (28-1, 28-2, and 28-3) in a system hierarchy of Switch:Cell:Antenna.However, the report type only produces antenna summary totals at the switchlevel. It does not include granular information for individual antennas.
Parts of the report definition might look like the following:
Definition Section Guideline
Focal Entity Type Switch
Field Selection Antenna.DroppedCalls
Group By Attribute and Time: Switch_id, Day, Hour
Guidelines for comprehensive report typesWhereas all the sections of the report definition work together to produce theinformation you want, there are two sections that heavily influence the results of acomprehensive report. The following table lists these sections and suggestedselections.
Table 27. Guidelines for Comprehensive Report
Definition Section Guideline
Filtering Create a filter that includes only the network elements (entityinstances) you want. For detailed information about whyfiltering is important and other information about filtering,see “Filtering” on page 136.
Group By v Use the default Group By attributes to create a report thatconsists of granular traffic data, some aggregated (roll-up)total. For example, of this type of report, see“Comprehensive granular” on page 98.
v If you want to organize and aggregate traffic datadifferently, you must understand how the Group Bysection works. See “Group By and report totals” on page137.
Chapter 8. Report archetypes 103

Busy hour report typesA busy hour represents the period with the greatest value for a Key PerformanceIndicator (KPI) for a defined period (daily, weekly, or monthly).
When a busy hour is computed, it yields a single busy hour for a day, week, ormonth depending upon the interval.
Note: Whereas the busy hour report yields the busy hour for an entity instance,ranking report types produce the busiest entity. See “Ranking report types” onpage 113.
The busiest hour can be identified by:v A maximum, for example total calls per hour.v A minimum, for example the lowest available bandwidth on a link represents its
busiest time on the network.v An intensity, for example a percentage value of dropped or total calls
Busy hour basicsTraffic engineers often use busy hours to determine necessary network capacity.They must provide enough capacity to support traffic during times of peakdemand. Busy hours are also used to generate long-term trends for projectingtraffic growth.
Traffic engineers often focus on data that is collected during the busiest hoursbecause that is the time when the system is most stressed and therefore most likelyto behave abnormally. The analysis of these abnormalities is important because thebusy hour is the time when the greatest number of customers use the system, andtherefore, experience the problems that arise.
Stored and non-stored busy hoursThe following topic explains the difference between stored and non-stored busyhours.v Stored busy hours - Calculated and updated for a defined period, and stored in
the databaseUsing stored busy hours is the most efficient way to run reports. Busy hourcalculations are complex and involve large amounts of data. Therefore, usingstored busy hours can save time and increase the efficiency and speed of theserver.
v Non-stored busy hours - Calculated at the time the report is generated.One reason why you would use non-stored busy hours instead of stored busyhours is when none of the stored busy hours meet your requirements. Using anon-stored busy hour provides greater flexibility at the cost of greater reportgeneration time.
Note: Calculating non-stored busy hours can place a heavy burden on theserver, significantly increasing the time that it takes to generate a report.
Sliding busy hourA sliding busy hour is a busy hour that is calculated based on the busiest hour ofthe day, across intervals other than hourly boundaries.
104 IBM Tivoli Netcool Performance Manager: User Guide

The default interval for sliding busy hours is 15 minutes. Using this interval that asliding busy hour can start at any 15-minute interval of an hour and extendthereafter for 60 minutes. For example, from 10:15 to 11:15 or 10:30 to 11:30.
Note: Sliding busy hours may be configured on per busy hour basis or globally onyour system depending on individual requirements. Refer to the AdministeringTivoli Netcool Performance Manager - Wireless Component, for more information.
Busy hour determinerA busy hour determiner is the Key Performance Indicator (KPI) used to determinethe busiest hour. KPIs used for busy hour determination typically represent asuitable metric for measuring how busy a system is, generally, by using positiveindicators that answer such questions as:v When does the network have the most traffic?v When are most of the calls initiated?v When are the most calls successfully connected?
Busy hour valueThe busy hour value is the value of a KPI at the hour that is determined as thebusy hour. There are two classes of busy hour values:v The busy hour value of the busy hour determiner which identified the busiest
hour.v The busy hour value of other KPIs which is to be calculated, based on the busy
hour determiner.
Busy hour cluster entityThe cluster entity of a busy hour is the entity at which the busy hour is defined.The busy hour value will be calculated at this level, with the appropriate rollup.
This is similar to the Focal entity used in report definition.
Foreign busy hourA foreign busy hour is a busy hour that is calculated by using a KPI whose entityis a child of the busy hour cluster entity. For example:v Using a Cell KPI rolled up at the MSC level to generate an MSC busy hour, and
then using this MSC busy hour to obtain the busy hour value of a Cell KPI.v Using an MSC KPI to calculate an MSC busy hour, and then using this MSC
busy hour to calculate a Cell busy hour value.
Busy hour report examplesProvides three examples: a stored daily busy hour report, a non-stored daily busyhour report, and the same daily busy hour report with weekly rolled-up values.
Stored daily busy hour reportThe following is a sample stored daily busy hour report. Parts of the reportdefinition might look like the following:
Definition Section Guideline
Focal Entity Type Cell
Field Selection Field Type: Daily SBH
SBH Definition: Cell Call Attempt Busy Hour
Field: sbhd.daily.CallAttmpt
Chapter 8. Report archetypes 105

Definition Section Guideline
Date-Time Selection v Date: 11/16-11/22
v Time: 00:00-24:00
Filtering 001
Group By Attribute and Time: Cell_ID, Day, Hour
The following table displays sample output for the above report definition. Theactual report output will look different.
Table 28. Daily Busy Hour Report
Cell ID Day Hour CallAttmpt Comment
Cell 001 11/16 16 12 Hour 16 is thebusiest hour for11/16
Cell 001 11/17 18 08 Hour 18 is thebusiest hour for11/17
Cell 001 11/18 17 11 Hour 17 is thebusiest hour for11/18
Cell 001 11/19 10 07 Hour 10 is thebusiest hour for11/19
Cell 001 11/20 17 09 Hour 17 is thebusiest hour for11/20
Cell 001 11/21 03 10 Hour 03 is thebusiest hour for11/21
Cell 001 11/22 16 12 Hour 16 is thebusiest hour for11/22
The report data in the preceding table presents the busy hours for Cell 001, 11/16through 11/22. The busy hour computation uses the traffic fieldsbhd.daily.CallAttmpt to determine the busy hour values.
Because the report definition Group By is Day and Hour, the report output includesboth the daily value and its hour.
Non-stored daily busy hour reportThe following is a sample daily busy hour report. Parts of the report definitionmight look like the following:
Definition Section Guideline
Focal Entity Type Cell
Field Selection Cell.CallAttmpt
Date-Time Selection v Date: 11/16-11/22
v Time: 00:00-24:00
Filtering 101
106 IBM Tivoli Netcool Performance Manager: User Guide

Definition Section Guideline
Busy Hour v Non-Stored Busy Hour
v Cluster Entity: Cell
v Criterion field: Cell.CallAttmpt
v Group by: Day
Group By Attribute and Time: Cell_ID, Day, Hour
The following table displays sample output for the above report definition. Theactual report output will look different.
Table 29. Daily Busy Hour Report
Cell ID Day Hour CallAttmpt Comment
Cell 001 11/16 16 12 Hour 16 is thebusiest hour for11/16
Cell 001 11/17 18 08 Hour 18 is thebusiest hour for11/17
Cell 001 11/18 17 11 Hour 17 is thebusiest hour for11/18
Cell 001 11/19 10 07 Hour 10 is thebusiest hour for11/19
Cell 001 11/20 17 09 Hour 17 is thebusiest hour for11/20
Cell 001 11/21 03 10 Hour 03 is thebusiest hour for11/21
Cell 001 11/22 16 12 Hour 16 is thebusiest hour for11/22
The report data in the preceding table presents the busy hours for Cell 001, 11/16through 11/22. The use of a non-stored busy hour means that the busy hour iscalculated when the report is generated. The busy hour determiner for the report isexplained here:v The busy hour is computed at the Cell level because the cluster entity selection
is Cell.v The busy hour computation uses the traffic field Cell.CallAttmpt to determine
the busy hour values.v Because the busy hour Group By value is Day, the frequency of time for which
the busy hour is calculated is daily. Because the report definition Group By isDay and Hour, the report output includes both the daily value and its hour.
Daily busy hour report with weekly rolled-up valuesThe following is the same daily reports from the previous sections, only in thisexample the report definition Group By selection takes the values Week, Day , andHour. The following sample output is the HTML view rolled up at T_Week level:
Chapter 8. Report archetypes 107

Table 30. Daily Busy Hour Report with Weekly Roll-up Values
Cell ID T_Week CallAttmpt
101 46 69
For week 46, all the busy hours have been rolled up to the value 69 .
Note: The busy hour Group by is processed before the report definition Group By.
Guidelines for busy hour reportsWhereas all the sections of the report definition work together to produce theinformation you want, there are a number of sections that may influence theresults of busy hour reports.For more information about creating report definitions,see “Creating a report definition” on page 140.
Guidelines for stored busy hour report typesThe following table lists report definition sections for stored busy hour reports,with some suggested selections.
Table 31. Guidelines for Stored Busy Hour Report Definitions
Definition Section Guideline
Field Selection You can select one or more busy hour definition fields.Determiner and Value KPIs are distinguished by the use ofa d or v in the field name. For example,sbhv.daily.adm_restarts.
You select the busy hour type from the Field Type list box,and the definition from the SBH Definition list box.
You can select different fields from different field types foryour stored busy hour report. Only certain combinations offields are supported.
You must select at least one SBH KPI for the report.
Date-Time Selection timeselection
Select the hours of the day you want included thecalculation.
Date-Time Selection dateselection
The report will return a meaningful result if enoughhistorical stored busy hour data is included in the report.
Ensure that the date range matches the busy hourfrequency. For example, for a monthly busy hour you mustselect at least one month for the date range.
Filtering Attribute, Traffic, and Vendor filters are all supported forstored busy hour reports. Traffic filters contain fields fromthe Field Selection section.
Busy Hour This section relates to non-stored busy hours. Non-storedbusy hours are not supported in stored busy hour reports.
Group By Select the correct time options to ensure that you will seethe precise time of the busy hour.
108 IBM Tivoli Netcool Performance Manager: User Guide
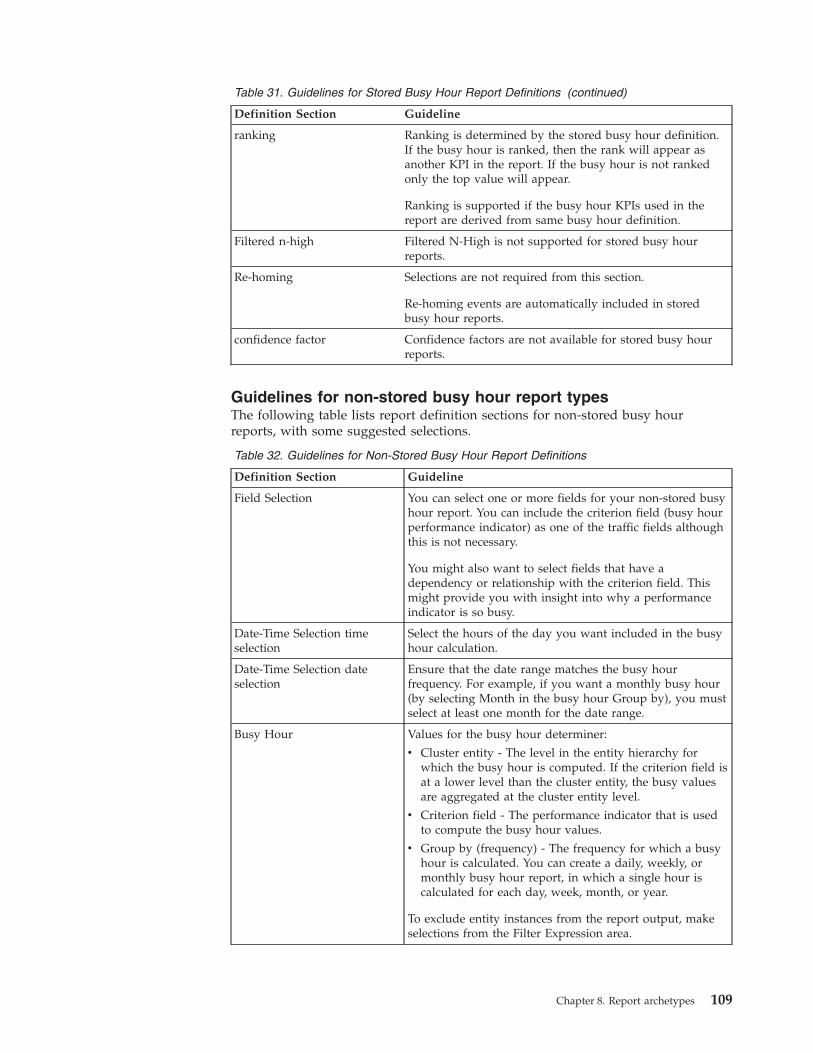
Table 31. Guidelines for Stored Busy Hour Report Definitions (continued)
Definition Section Guideline
ranking Ranking is determined by the stored busy hour definition.If the busy hour is ranked, then the rank will appear asanother KPI in the report. If the busy hour is not rankedonly the top value will appear.
Ranking is supported if the busy hour KPIs used in thereport are derived from same busy hour definition.
Filtered n-high Filtered N-High is not supported for stored busy hourreports.
Re-homing Selections are not required from this section.
Re-homing events are automatically included in storedbusy hour reports.
confidence factor Confidence factors are not available for stored busy hourreports.
Guidelines for non-stored busy hour report typesThe following table lists report definition sections for non-stored busy hourreports, with some suggested selections.
Table 32. Guidelines for Non-Stored Busy Hour Report Definitions
Definition Section Guideline
Field Selection You can select one or more fields for your non-stored busyhour report. You can include the criterion field (busy hourperformance indicator) as one of the traffic fields althoughthis is not necessary.
You might also want to select fields that have adependency or relationship with the criterion field. Thismight provide you with insight into why a performanceindicator is so busy.
Date-Time Selection timeselection
Select the hours of the day you want included in the busyhour calculation.
Date-Time Selection dateselection
Ensure that the date range matches the busy hourfrequency. For example, if you want a monthly busy hour(by selecting Month in the busy hour Group by), you mustselect at least one month for the date range.
Busy Hour Values for the busy hour determiner:
v Cluster entity - The level in the entity hierarchy forwhich the busy hour is computed. If the criterion field isat a lower level than the cluster entity, the busy valuesare aggregated at the cluster entity level.
v Criterion field - The performance indicator that is usedto compute the busy hour values.
v Group by (frequency) - The frequency for which a busyhour is calculated. You can create a daily, weekly, ormonthly busy hour report, in which a single hour iscalculated for each day, week, month, or year.
To exclude entity instances from the report output, makeselections from the Filter Expression area.
Chapter 8. Report archetypes 109

Table 32. Guidelines for Non-Stored Busy Hour Report Definitions (continued)
Definition Section Guideline
Group By Select the correct time options to ensure that you will seethe precise time of the busy hour.
Trending report typesTrending reports are used to forecast the value of a KPI at a point in the futurethat is based on a historical set of busy hour values. Stored busy hour data is usedbecause complete performance data may be kept for a few months.
The system uses historical busy hour values to create a regression line. Using thisregression line future values can be forecast.
Two kinds of trending analysis can be used:v trend - to predict what value a KPI will have at a future point in time. For
example, based on a Cell Traffic Busy Hour, the trend for the percentage ofblocked calls in one month's time can be calculated.
v projectTime - to project when a KPI will reach a particular limit. For example,based on a Cell Traffic Busy Hour, the number of days that the percentage ofblocked calls reaches a threshold can be calculated.
Depending on the data being analyzed the system will use linear, logarithmic, orexponential regression to calculate a trend. The table below shows example dataover five days with the value of a KPI (percentage of dropped calls) at thefollowing busy hour times:
Table 33. Sample Trend Data
Busy Hour Percentage dropped calls
1st Feb 17:00 1
2nd Feb 17:00 3
3rd Feb 17:00 3.5
4th Feb 17:00 5
5th Feb 17:00 4
There is an obvious trend in the data above where the percentage of dropped callsis increasing over time.
By calculating a trend that is based on the busy hour times and values, thepercentage of dropped calls can be determined for a day in the future, for examplethe 15th Feb at 17:00 (10 days from the last date). The projected time until aparticular value is breached can also be calculated, for example how long until thepercentage of dropped calls is 17%. A projected time result is given as a float valuein number of days up to two decimal places. For example, 2.45 days.
Trending supports both increasing and decreasing trends. For example, totalnumber of calls would be an increasing trend. Available channels per Cell as theCell gets busier would be a decreasing trend.
110 IBM Tivoli Netcool Performance Manager: User Guide

Guidelines for defining forecasting report typesSome sections of report definitions are not used for trending reports. The followingtable lists these and other sections, with some suggested selections.
Table 34. Guidelines for Forecasting Reports
Report Definition Section Guideline
Field Selection You can select one or more fields for your forecastingreport. Appropriate fields for forecasting are trend andprojectTime UDCs:
v a trend UDC is used to predict what value a KPI willhave at a future point in time.
v a projectTime UDC is used to determine when a KPIwill breach a particular limit.
Trend and projectTime UDCs are based on busy hours andbusy hour values of a KPI.
Date-Time Selection timeselection
Select the hours of the day you want included thecalculation.
Date-Time Selection dateselection
Relative Date-Time selection. For example, where a trendis based on 10 days of data (defined by the UDC beingused) if today is the 28th of October and today is includedin the report, then:
v Last 2 days - today, yesterday - 28th and 27th ofOctober. The trend is based on 10 days of data: 18th tothe 28th October.
v Next 2 days - today, tomorrow - 28th and 29th ofOctober. The trend is based on 10 days of data: 19th tothe 29th October.
Filtering Attribute, Traffic, and Vendor filters are all supported fortrending reports.
Busy Hour This section relates to non-stored busy hours. Non-storedbusy hours are not supported in trending reports.
Group By Select the correct time options to ensure that you will seethe precise time of the busy hour.
ranking Ranking is supported for trending reports.
Filtered n-high Filtered N-High is not supported for trending reports.
Re-homing Re-homing events are automatically included in trendingreports.
confidence factor Confidence factors are not available for trending reports.
The report will return a meaningful result if enough historical stored busy hourdata is included in the report. The report result must include the minimumnumber of data points (days, weeks, or month's worth of busy hour data) definedby the UDC being used.
Chapter 8. Report archetypes 111
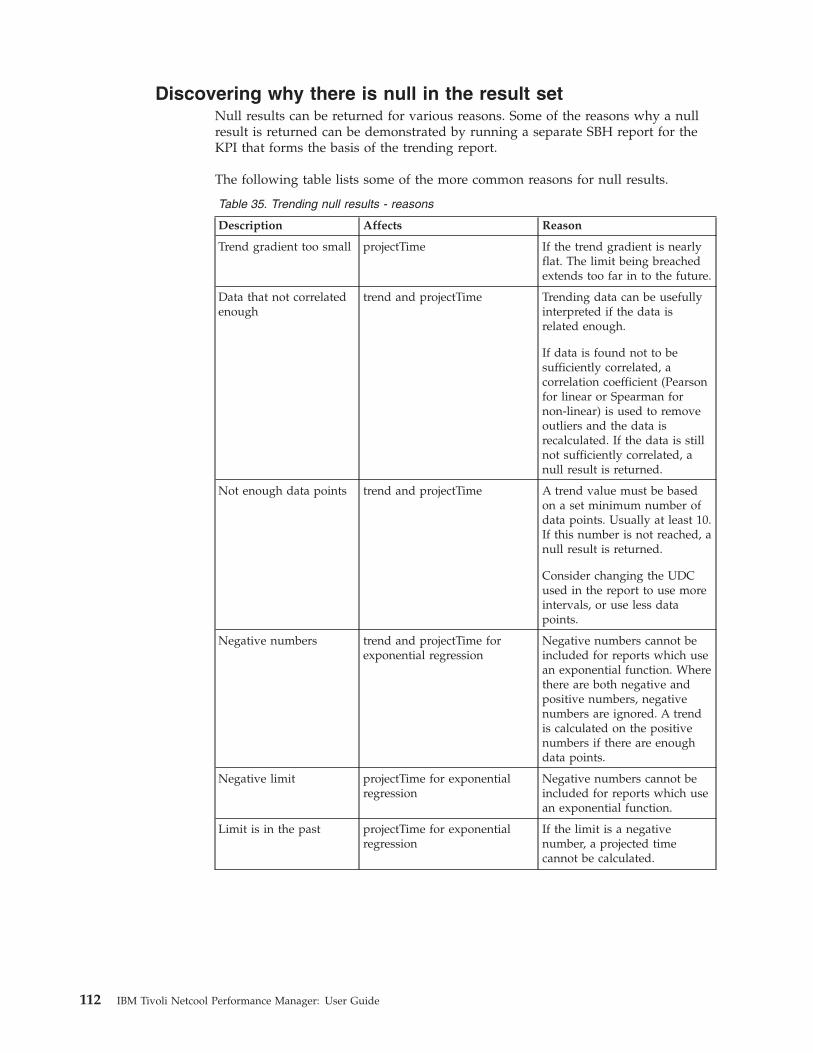
Discovering why there is null in the result setNull results can be returned for various reasons. Some of the reasons why a nullresult is returned can be demonstrated by running a separate SBH report for theKPI that forms the basis of the trending report.
The following table lists some of the more common reasons for null results.
Table 35. Trending null results - reasons
Description Affects Reason
Trend gradient too small projectTime If the trend gradient is nearlyflat. The limit being breachedextends too far in to the future.
Data that not correlatedenough
trend and projectTime Trending data can be usefullyinterpreted if the data isrelated enough.
If data is found not to besufficiently correlated, acorrelation coefficient (Pearsonfor linear or Spearman fornon-linear) is used to removeoutliers and the data isrecalculated. If the data is stillnot sufficiently correlated, anull result is returned.
Not enough data points trend and projectTime A trend value must be basedon a set minimum number ofdata points. Usually at least 10.If this number is not reached, anull result is returned.
Consider changing the UDCused in the report to use moreintervals, or use less datapoints.
Negative numbers trend and projectTime forexponential regression
Negative numbers cannot beincluded for reports which usean exponential function. Wherethere are both negative andpositive numbers, negativenumbers are ignored. A trendis calculated on the positivenumbers if there are enoughdata points.
Negative limit projectTime for exponentialregression
Negative numbers cannot beincluded for reports which usean exponential function.
Limit is in the past projectTime for exponentialregression
If the limit is a negativenumber, a projected timecannot be calculated.
112 IBM Tivoli Netcool Performance Manager: User Guide

Ranking report typesRanking acts as a filter, retaining the top or bottom data values of data set anddiscarding the remaining data. Ranking reports answer the following types ofquestions:v Which are the worst 10 cells in the entire network that is based on percentage
lost calls?v Which are the busiest five cells in each region based on call attempts?v Which are the busiest five cells in each switch based on call attempts?
Note: Whereas ranking can produce the busiest or worst entity instances (such ascells), the busy hour report type yields the busiest hour for entity instances.
Note: A subtype of Ranking reports is the N-High Busy Hour report type. N-HighBusy Hour reports produce a range of the busiest hours and busiest days.
These sections explain the key terms and concepts general Ranking report types.The sections also provide examples for each ranking report type and a set ofguidelines for creating ranking report types.
Ranking key termsThe following section explains the key terms and concepts general Ranking reporttypes.
The Ranking report uses the following parameters to calculate report output. Youset values for these parameters in the Ranking area of the report definition.v TOP / BOTTOM - Selects either the top or bottom values of a data set.v From m to n - Represents the number of top or bottom values to be retained.
Example: TOP from 1 to 3. This example retains the top three data values.
Example: BOTTOM from 2 to 3. This example retains the second and third lowestvalues in the data set.v Ranking field - The traffic field that is used as the basis of ranking. You could,
for example, rank by a traffic field that represents call attempts or the percentageof lost calls.
v By - Allows you to group ranked values by attribute. This attribute is inaddition to the attribute value set in the report Group By section.The options are Nothing and the attributes of entities at or above the focal entity.
v Group by - Allows you to group ranked values by time. This is in addition tothe time value set in the report Group By area.
Note: When you use ranking Group by without attribute group by, the rankingGroup by value determines the final number of ranking sets that you see in areport. For example, see Example: N-High Days Weekly Report With AttributeGrouping.
Chapter 8. Report archetypes 113

Multiple ranking setsRanking reports often result in multiple ranking sets as illustrated in the followingtable:
Cell ID Day Hour Field Value
Cell 109 Mon 00 491
Cell 145 Mon 00 512
Cell 118 Mon 01 26
Cell 168 Mon 01 34
The report definition that produced the output in the above table that is called forthe top two values per hour. As such, you have two ranking sets: one for the hourstarting at 00:00, and the other for the hour starting at 01:00.
You can rank by time and by attribute. Ranking reports use the time and attributesettings you make in both the Ranking and Group By areas in the report definition.
Ranking by timeYou rank by time by using the ranking Group By option. This is in addition to thetime value set in the report definition Group By area.
The Tivoli Netcool Performance Manager software first processes the Rankingsection, which results in the ranking sets. The software then processes the reportGroup By, rolling up (aggregating) the discrete ranking data values.
Ranking by attributeYou can rank by attribute by using the ranking by option. This is in addition to theattribute value set in the report Group By area.
The Tivoli Netcool Performance Manager software first processes the Rankingsection. It creates ranking sets and then groups them by the ranking attribute. Thesoftware then processes the report definition Group By value, rolling up(aggregating) the discrete ranking values.
Ordering and duplicates in report resultsOccasionally, report results might seem to have more values than you requested.For example, instead of the top five values, you may have six. This is due toduplicate result values. Consider the following:
Table 36. Duplicate Results
Values Rank
5 1
8 2
8 2
9 4
10 5
15 6
114 IBM Tivoli Netcool Performance Manager: User Guide

WhenTivoli Netcool Performance Manager software encounters duplicate resultvalues, the duplicates share rank as shown in the table in “Ordering and duplicatesin report results” on page 114. This situation can lead to confusion, especiallywhen many zeros or nulls in the data (which can sometimes dominate the top orbottom of the rank). When you have more values than you expect in the reportresults, look for duplicate values.
Guidelines for ranking report typesWhereas all the sections of the report definition work together to produce theinformation you want, there are a number of sections that heavily influence theresults of a ranking report. The following table lists these sections and suggestedselections.
Table 37. Guidelines for Ranking Reports
Report DefinitionSection Guideline
Field Selection When making field selections, make sure one of them is the fieldthat you want to use as the basis for ranking. Only the fields youselect here are available for selection in the Ranking area.
Group By Ensure that the time and attribute selections you make in theGroup By section work with the time and attribute selections youmake in the Ranking section.
Ranking For information about ranking options, see “Ranking key terms”on page 113.
N-High Busy Hour report typesAn N-High Busy Hour report returns a range of the busiest hours or busiest days.This is in contrast to a Busy Hour report, which returns a single busy hour perday, week, month, or year.
There are two types of the N-High Busy Hour report:v N-High Hours reports - Produces a range of the busiest hoursv N-High Days reports - Produces a range of the busiest days
Note: The N-High Busy Hour report types are a subset of Ranking reports.
N-High Hours reportAn N-High Hours report lists the range of the n busiest hours for a specific timeperiod.
This report type allows you to compare one busy hour with other busy hoursduring the same time frequency. For example, you can compare multiple busyhours for a single day. In other words, this report allows for busy hour analysis.
This section provides examples of N-High Hours reports with and withoutattribute grouping.
Example: N-High Hour Monthly Report With Attribute Grouping
The following is a sample N-High Hour report. It includes two weeks of data andis ranked by month and Cell_ID (using the Ranking attribute group by and timegroup by). Parts of the report definition could look like the following:
Chapter 8. Report archetypes 115
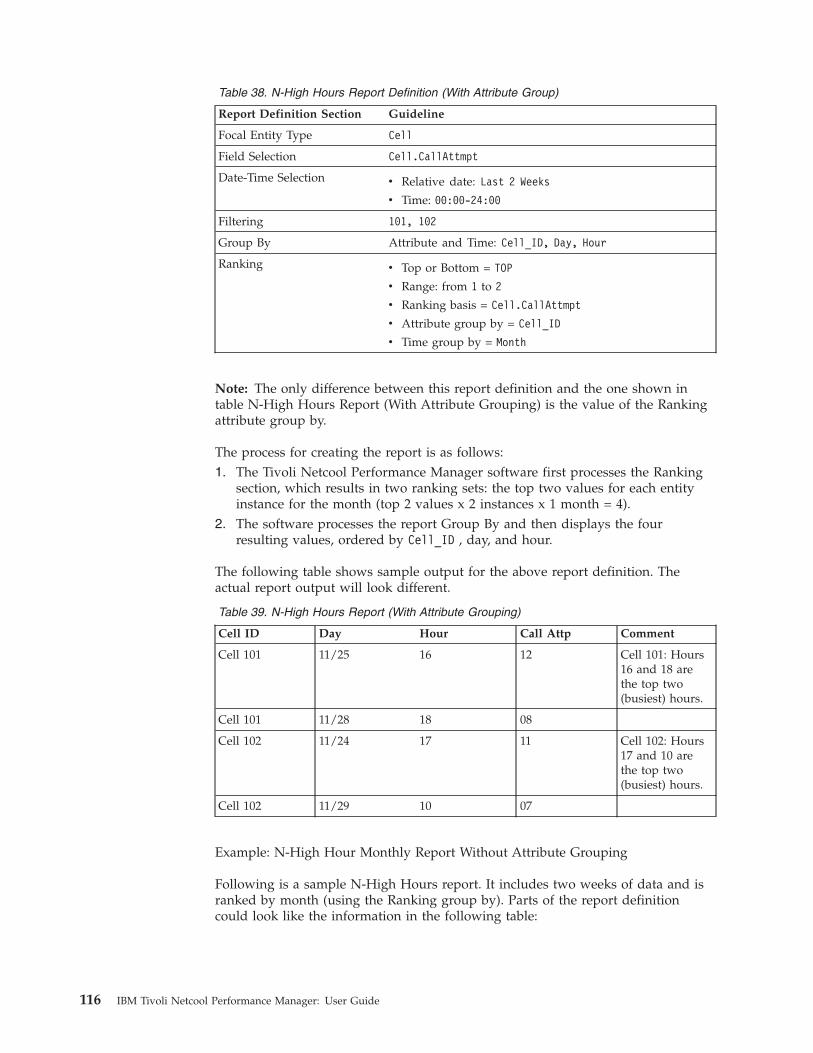
Table 38. N-High Hours Report Definition (With Attribute Group)
Report Definition Section Guideline
Focal Entity Type Cell
Field Selection Cell.CallAttmpt
Date-Time Selection v Relative date: Last 2 Weeks
v Time: 00:00-24:00
Filtering 101, 102
Group By Attribute and Time: Cell_ID, Day, Hour
Ranking v Top or Bottom = TOP
v Range: from 1 to 2
v Ranking basis = Cell.CallAttmpt
v Attribute group by = Cell_ID
v Time group by = Month
Note: The only difference between this report definition and the one shown intable N-High Hours Report (With Attribute Grouping) is the value of the Rankingattribute group by.
The process for creating the report is as follows:1. The Tivoli Netcool Performance Manager software first processes the Ranking
section, which results in two ranking sets: the top two values for each entityinstance for the month (top 2 values x 2 instances x 1 month = 4).
2. The software processes the report Group By and then displays the fourresulting values, ordered by Cell_ID , day, and hour.
The following table shows sample output for the above report definition. Theactual report output will look different.
Table 39. N-High Hours Report (With Attribute Grouping)
Cell ID Day Hour Call Attp Comment
Cell 101 11/25 16 12 Cell 101: Hours16 and 18 arethe top two(busiest) hours.
Cell 101 11/28 18 08
Cell 102 11/24 17 11 Cell 102: Hours17 and 10 arethe top two(busiest) hours.
Cell 102 11/29 10 07
Example: N-High Hour Monthly Report Without Attribute Grouping
Following is a sample N-High Hours report. It includes two weeks of data and isranked by month (using the Ranking group by). Parts of the report definitioncould look like the information in the following table:
116 IBM Tivoli Netcool Performance Manager: User Guide

Table 40. N-High Hours Report Definition (Without Attribute Group)
Report Definition Section Selection
Focal Entity Type Cell
Field Selection Cell.CallAttmpt
Date-Time Selection v Relative date: Last 2 Weeks
v Time: 00:00-24:00
Filtering 101, 102
Group By Attribute and Time: Cell_ID, Day, Hour
Ranking v Top or Bottom = TOP
v Range: from 1 to 2
v Ranking basis = Cell.CallAttmpt
v Attribute group by = Nothing
v Time group by = Month
The process for creating the report is as follows:1. The Tivoli Netcool Performance Manager software first processes the Ranking
section, resulting in one ranking set for the month, which consists of the toptwo (busiest) hours.
Note: If Ranking time Group By were Week instead of Month, then the reportwould have resulted in four values (two ranking sets): one ranking set for eachweek.
2. The software processes the report Group By and then displays the tworesulting values, ordered by Cell_id, day, and hour.
The following table shows sample output for the report definition in the precedingtable. The actual report output will look different.
Table 41. N-High Hours Report Output (Without Attribute Grouping)
Cell ID Day Hour Call Attp Comment
Cell 101 11/25 16 12 Hours 16 and 18of Cell 101 havethe top two(busiest) hours.
Cell 101 11/29 18 08
N-High Days reportN-High Days reports list the range of the n busiest days that are based on thesingle busiest hour of each day. This report type allows you to compare a busy daywith other busy days during the same time frequency. For example, you cancompare multiple busy days for a single week, month, or year. In other words, thisreport allows for busy day analysis.
This section provides example N-High Days reports with and without attributegrouping.
Example: N-High Days Weekly Report With Attribute Grouping
Chapter 8. Report archetypes 117

The following is a sample N-High Days report. It includes two weeks of data andis ranked by week and by attribute (using the Ranking attribute and time groupby). This example uses a non-stored busy hour, a daily stored busy hour busy fieldcould be selected instead. Parts of the report definition could look like thefollowing:
Table 42. N-High Days Report Definition (Without Attribute Group By)
Definition Section Guideline
Focal Entity Type Cell
Field Selection Cell.CallAttmpt
Date-Time Selection v Relative date: Last 2 Weeks
v Time: 00:00-24:00
Filtering 101, 102
Busy Hours v Non-Stored Busy Hour
v Cluster Entity: Cell
v Criterion field: Cell.CallAttmpt
v Group by: Day
Group By Attribute and Time: Cell_ID, Day, Hour
Ranking v Top or Bottom = TOP
v Range: from 1 to 2
v Ranking basis = Cell.CallAttmpt
v Ranking group by = Cell_ID
v Time group by = Week
The process for creating the report is as follows:1. The Tivoli Netcool Performance Manager software first processes the Busy
Hour section, which results in 28 busy hour values: one busy hour per day fortwo entity instances (14 days x 2 instances = 28).
2. Using the data set from the first step, the software then processes the Rankingsection. It yields four (4) values: the top two values for each week that is basedon Cell.CallAttmpt (top 2 values x 2 weeks = 4).
Note: You can select any field as the basis for ranking; you are not restricted tothe field you selected for the busy hour. This allows you to filter and rank theresulting busy hour data set by another field. For example, you could use theperformance measurement for total call attempts as the ranking field todetermine possible relationships or trends.
Note: If Ranking time Group by were Month instead of Week, then the reportwould have resulted in only two values: the top two values for the month.
3. Finally, the software uses the report Group By to group the remaining fourvalues by day.
The following table shows sample output for the report definition in the precedingtable. The actual report output will look different.
118 IBM Tivoli Netcool Performance Manager: User Guide

Table 43. N-High Days Report Output (Without Attribute Grouping)
Cell ID Day Hour Call Attp Comment
Cell 101 11/24 16 12 Hours 16 and 18have the top twovalues for thefirst week.
Cell 101 11/25 18 08
Cell 101 11/28 17 11 Hours 17 and 10and have the toptwo values forthe second week.
Cell 102 11/29 10 07
Example: N-High Days Weekly Report With Attribute Grouping
The following is a sample N-High Days report. It includes two weeks of data andis ranked by week (using the Ranking group by). This example uses a non-storedbusy hour, a daily stored busy hour busy field could be selected instead. Parts ofthe report definition could look like the following:
Table 44. N-High Days Report Definition (With Attribute Group By)
Definition Section Guideline
Focal Entity Type Cell
Field Selection Cell.CallAttmpt
Date-Time Selection v Relative date: Last 2 Weeks
v Time: 00:00-24:00
Filtering 101, 102
Busy Hours v Non-Stored Busy Hour
v Cluster Entity: Cell
v Criterion field: Cell.CallAttmpt
v Group by: Day
Group By Attribute and Time: Cell_ID, Day, Hour
Ranking v Top or Bottom = TOP
v Range: from 1 to 2
v Ranking field = Cell.CallAttmpt
v Attribute group by = Nothing
v Time group by = Week
Note: The only difference between this report definition and the one shown intable N-High Days Weekly Report Without Attribute Grouping is the value of theRanking attribute group by.
The process for creating the report is as follows:1. The Tivoli Netcool Performance Manager software first processes the Busy
Hour section, which results in 28 busy hour values: one busy hour per day fortwo entity instances (14 days x 2 instances = 28).
Chapter 8. Report archetypes 119

2. Using the data set from the first step, the software then processes the Rankingsection. It yields eight (8) values: the top two values for each entity instance foreach week (top 2 values x 2 instances x 2 weeks = 8).
Note: You can select any field as the basis for ranking; you are not restricted tothe field you selected for the busy hour.
3. Finally, the software uses the report Group By to group the remaining fourvalues by day.
The following table shows sample output for the report definition in table. Theactual report output will look different.
Table 45. N-High Days Report (With Attribute Grouping)
Cell ID Day Hour Call Attp Comment
Cell 101 11/24 16 12 Cell 101: Hours16 and 17 arethe top two(busiest) hoursfor the firstweek.
Cell 101 11/25 18 08
Cell 101 11/28 04 15 Cell 101: Hours04 and 06 arethe top two(busiest) hoursfor the secondweek.
Cell 101 11/29 06 11
Cell 102 11/24 17 11 Cell 102: Hours17 and 10 arethe top two(busiest) hoursfor the firstweek.
Cell 102 11/25 10 07
Cell 102 11/28 11 14 Cell 102: Hours11 and 07 are thetop two (busiest)hours for thesecond week.
Cell 102 11/29 07 18
Guidelines for N-High Busy Hour report typesThere are two sets of guidelines: one for N-High Hours, and one for N-High Days.
N-High Hours
Whereas all the sections of the report definition work together to produce theinformation you want, there are a number of sections that heavily influence theresults of an N-High Hours report. An N-High Hours report is a variation of aRanking report. The following table lists these sections and suggests certainselections.
120 IBM Tivoli Netcool Performance Manager: User Guide

Table 46. Guidelines for N-High Hours Reports
Definition Section Guideline
Field Selection Make sure one of the fields is the field that you want to useas the basis for ranking. (For more information, see“Guidelines for ranking report types” on page 115)
Filtering Limit your output to the entities you are most interested in.Filtering shortens the run time of a report.
Group By You need not set anything in the Group By area for anN-High Hours report. You can keep the default.
Ranking v TOP or BOTTOM - Generally for the busiest hours, youselect the TOP option. However, this depends upon thefield you select as the basis of ranking.
v From m to n - allows you to specify the range of hours youare interested in.
v Ranking field - the busiest hours determiner.
v For all other ranking parameters, see “Ranking key terms”on page 113.
N-High Days
Whereas all the sections of the report definition work together to produce theinformation you want, there are a number of sections that heavily influence theresults of an N-High Days report. An N-High Days report is a combination busyhour and ranking report.
The following table lists these sections and suggests certain selections.
Table 47. Guidelines for N-High Days Reports
Definition Section Guideline
Field Selection You can select one or more fields for yourreport.
Make sure one of the fields is the field thatyou want to use as the basis for ranking.(For more information, see “Guidelines forranking report types” on page 115)
Date-Time Selection Selection may depend on whether you areusing busy hours.
Filtering Limit your output to the entities you aremost interested in. Filtering shortens the runtime of a report.
Busy Hour If you are using a non-stored busy hour, see“Guidelines for non-stored busy hour reporttypes” on page 109.
Group By You need not set anything in the Group Byarea for an N-High Days report. You cankeep the default or change it as required.
Chapter 8. Report archetypes 121

Table 47. Guidelines for N-High Days Reports (continued)
Definition Section Guideline
Ranking Ranking field - You can select any field asthe basis for ranking; you are not restrictedto the field you selected for the busy hour.This allows you to filter and rank theresulting busy hour data set by anotherfield. For example, you could use theperformance measurement for total callattempts as the ranking field to determinepossible relationships or trends.
For all other ranking parameters, see“Ranking key terms” on page 113.
Filtered N-High Busy Hour reportsA Filtered N-High Busy Hour report is an N-High Busy Hour report with outliersremoved from the data set.
When to Use a Filtered N-High Busy Hour Report
You generally use Filtered N-High Busy Hour reports to discern long-term trendsin your networks. To produce accurate long-term trending data, Tivoli NetcoolPerformance Manager software allows you to filter outliers from the data set thatmight otherwise skew report results. The following figure illustrates this concept.
The above figure shows a scatter plot with data values for attempted calls (asrepresented by the letter "x"). At the top of the figure, there are two data valuesthat represent an anomalous event. These values are abnormally high incomparison to the other data values. Using a Filtered N-High report, you canexclude these values because they might compromise the quality of the long-termtrending data.
In the above graph, the plotted line represents the mean of the data values,excluding the outliers. Were you to include the outliers, the mean would beskewed upwards.
122 IBM Tivoli Netcool Performance Manager: User Guide

Key terms for filtered N-High reportsThe Filtered N-High report uses a number of values to calculate report output. Youset these values in the Filtered N-High area of the report definition as shown in thefollowing figure.
These values are described in the following table. They are listed in the order theyare used during report calculation.
Legend:
No. Description
1 Count - The number values you want to include in your report perreporting interval. Recommended values are integers from 2 to 20.
The reporting interval for Filtered N-High reports is, generally,determined by Filtered N-High group by. If you are using a stored ornon-stored busy hour, the reporting interval will also be determined bythe busy hour's interval.
If you decide to use the Ranking section, its group by also affects thereporting interval. This is because Ranking options are processed beforeFiltered N-High options.
2 Filtered N-High Group by- Allows you to group the resulting data setby time.
3 Filter field - The field that is used to calculate the mean. The fieldsavailable depend on the entity type selected. You select an entity typefrom the first list box or by using the Browse Entities button.
The program calculates the mean (average) of the Filter field valuesminus any higher values specified in the Filter box (item 4).
4 Filter - Determines which data values are excluded from the mean(average) computation. Recommended values are integers from 1 toCount-1.
5 Factor - Determines the outliers in a data set. Recommended values arefrom 1.0 to 10.0.
Chapter 8. Report archetypes 123

How filtered N-High reports are calculatedThe following example summarizes the process of calculating a Filtered N-Highreport. This example uses a non-stored busy hour. It includes selections from thenon-stored Busy Hour and Filtered N-High sections only (no ranking options). Ituses terms that are introduced in the topic.
The following table describes the process in more detail. In this table, TivoliNetcool Performance Manager software:
Table 48. Process Description for Filtered N-High Reports
Step Description
1 For each reporting period, removes the lowest values from each reportperiod (based on the Count value in the Filtered N-High section).
3 Computes the mean (average) of the Filter field values (based on theFilter field and Filter selections in the Filtered N-High section).
4 Removes outliers by determining how far values are from the mean(based on the Factor selection in the Filtered N-High section).
5 Produces the remaining values in the data set in report output.
Example:
The remaining portion of this section examines the above process in more depthand provides sample data based on the following example:v A daily stored busy field is selected for the report.v Filtered N-High section - Count = 5, Filter field = Filter field, Group by = week,
Filter = 2, and Factor = 1.5.1. Tivoli Netcool Performance Manager software computes the busy hour data
for each reporting periodExample data set:Week 1 Day Time Value Filter FieldJan 4 15:00 115 30Jan 5 16:00 105 35Jan 6 17:00 150 40Jan 7 16:00 100 45Jan 8 15:00 175 50Jan 9 16:00 120 60Jan 10 17:00 110 80Week 2 Day Time Value Filter FieldJan 11 15:00 110 25Jan 12 16:00 120 30Jan 13 17:00 130 35
The above example shows a busy hour data set for two reporting periods:Week 1 and Week 2. Notice the Week 2 includes only three days because it is ahalf week.
2. For each reporting interval, Tivoli Netcool Performance Manager softwareremoves the lowest values until the number of values equals the Countvariable.Example of Values Filtered Out of the data setWeek 1 Time Value Filter FieldJan 5 16:00 105 35Jan 7 16:00 100 45
The above example shows those values that are discarded from the value set.Count is set to five (5), which means that only five values are allowed for
124 IBM Tivoli Netcool Performance Manager: User Guide

each reporting period. For Week 1, the lowest two values 100 and 105 arediscarded. However, because Week 2 has only three (3) values, no values arediscarded.
3. Compute the mean (average) based on the Filter field value. During this step,the program calculates the mean (average) of the Filter field values minusany higher values that might skew the mean.– The program first removes the top x Filter field values from the data set,
where x = Filter variable. Example: Of the five remaining values in thefirst week, the program removes the top two Filter field values, 60 and 80,from the data set.
– The program then calculates the average value for the remaining fieldFilter values.Example: Average value = (30 + 40 + 50/3) = 40
4. Removes the outliers by determining how far some values are from themean. The program removes outliers if: Filter Field value / Averagevalue > Factor value where Average value equals the average value that iscalculated in the previous step.During this step, the program first determines against which individual Filterfield values to apply the above filter, and then it applies the filter.– The program determines against which individual Filter fields values to
apply the filter. This happens in two stages: 1. For each reporting period,Tivoli Netcool Performance Manager software performs this step onlywhen number_busy_hours > ( Count - Filter ).Example: In our example, Count - Filter = 3. Because Week 1 has fivevalues, the program applies the filter to the values in Week 1. However,filtering is not applied to the values in Week 2 because it has three values.
– The program applies the filter to the top x Filter field values, where x =the Filter value. Example: In our example, the top two Filter field valuesin Week 1 are 60 and 80.
– The program performs the calculation. Example: The average Filter fieldvalue is 40. The second highest Filter field value of 60 remains in the dataset. The resulting value of Filter Field /Average is 1.5 (60/40 = 1.5).Because the resulting value is the same as the Factor 1.5, the value 60remains in the report.
– The highest Filter field value of 80 is removed because the result of Filterfield /Average is greater than the Factor value of 1.5 (80/40 = 2.0).
5. The final report contains the following values:Example data set:Week 1 Day Time Value Filter FieldJan 4 15:00 115 30Jan 6 17:00 150 40Jan 8 15:00 175 50Jan 9 16:00 120 60Week 2 Day Time Value Filter FieldJan 11 15:00 110 25Jan 12 16:00 120 30Jan 13 17:00 130 35
Chapter 8. Report archetypes 125

Guidelines for Filtered N-High Busy Hour Report TypesWhereas all the sections of the report definition work together to produce theinformation you want, there are a number of sections that heavily influence theresults of a Filtered N-High Busy Hour report type.
The following table lists these sections and suggests certain selections. In mostcases, you will want to create Filtered N-High reports using stored or non-storedbusy hours; however, this is not required.
Table 49. Guidelines for N-High Reports
Definition Section Guideline
Field Selection You can select one or more fields for your report.
Filtering Limit your output to the entities you are most interested in. Filteringshortens the run time of a report.
Ranking Optional -- The Filtered N-High section of the report definition allowsyou to remove outliers from the data set. You can remove additionaldata values by selecting options in the Ranking section. Please notethat any options selected in the Ranking section are processed beforethe options in the Filtered N-High report section.
Filtered N-High Filtered N-High Group By -- Recommended setting for the Group Byoption is Week .
126 IBM Tivoli Netcool Performance Manager: User Guide

Chapter 9. Working with report definitions and templates
To run a report, you must first create a report definition. When creating a reportdefinition, you can use its defaults to quickly produce a report, or go beyond thedefaults to produce information that might better meet your needs. You can alsouse a report definition template to base your report definition on.
This section introduces report definitions and templates, and discusses defaultsettings and selections, reviews the interrelationship among the report definitionsections, and provides procedures for creating a report and immediately running it.
Report definition overviewThe following sections introduce the report definition and describes its primaryparts.
What is a report definition?
A report definition ties together all the elements necessary to generate a report. Fora report definition, you select:v The network element type (entity type) on which you want to report. For
example: Cell .v The fields, or performance measurements, in which you are interested. For
example: Cell_AttmptCalls.v The days and hours for which you want information. For example: Every
Tuesday for the hours of 6:00A.M. to 9:00A.M.
ou can also exclude specific network elements (entity instances) from the report byfiltering, as well as change the type of information you can include in a report. Formore information, see “Report definition defaults” on page 129.
You can also use a number of advanced reporting features that allow you to tailor,or customize, report output. For advanced reporting features, see “Going beyondthe defaults” on page 130.
After you create a report definition, you can run it immediately or schedule to runit at a later date. You or other users can then view the report results.
Report definition partsThis section describes the primary sections of a report definition, a sample ofwhich is shown in the following graphic.
© Copyright IBM Corp. 2006, 2015 127

Legend:
Step Description
1 Step 1: DataSource Selection - Allows you to select the data source thatcontains the network elements on which you want to report.
2 Step 2: Focal Entity Type - Allows you to select the focal entity type of thereport, which is generally the network element type you want to reporton.
3 Step 3: Field Selections - Allows you to select the performance or servicemeasurements in which you are interested.
For a detailed description, see “Field Selections” on page 133. For how-toinstructions, see “Selecting fields” on page 144.
128 IBM Tivoli Netcool Performance Manager: User Guide
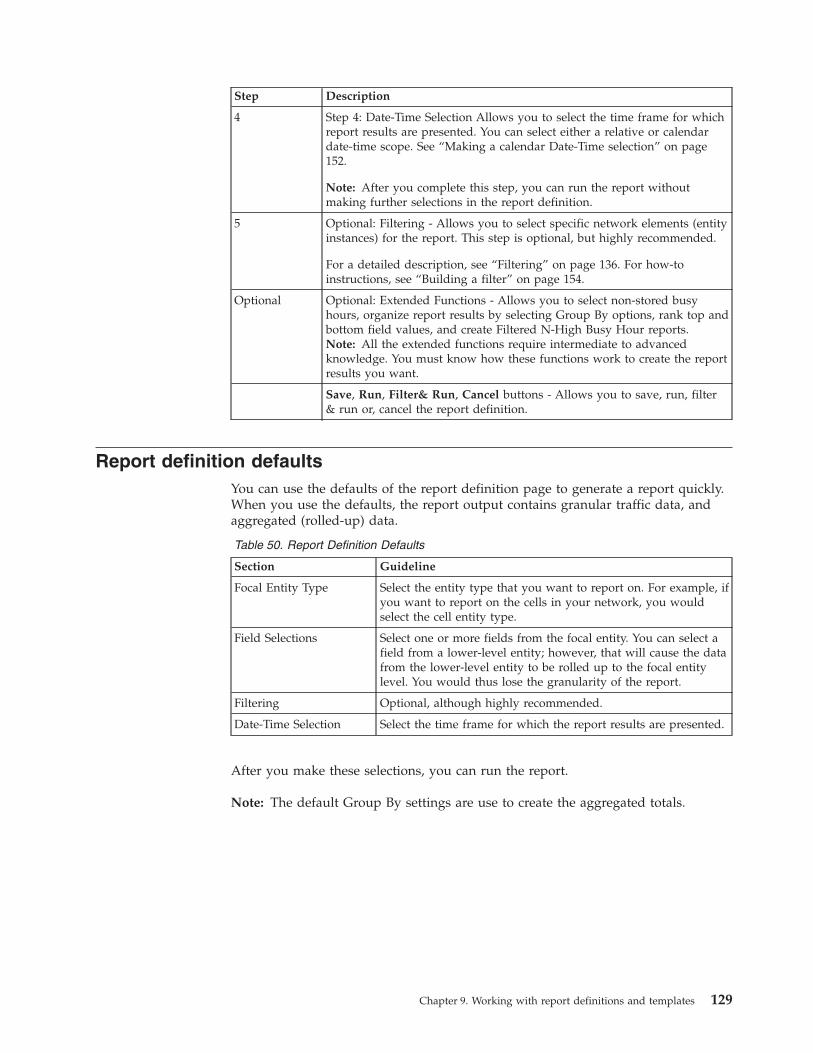
Step Description
4 Step 4: Date-Time Selection Allows you to select the time frame for whichreport results are presented. You can select either a relative or calendardate-time scope. See “Making a calendar Date-Time selection” on page152.
Note: After you complete this step, you can run the report withoutmaking further selections in the report definition.
5 Optional: Filtering - Allows you to select specific network elements (entityinstances) for the report. This step is optional, but highly recommended.
For a detailed description, see “Filtering” on page 136. For how-toinstructions, see “Building a filter” on page 154.
Optional Optional: Extended Functions - Allows you to select non-stored busyhours, organize report results by selecting Group By options, rank top andbottom field values, and create Filtered N-High Busy Hour reports.Note: All the extended functions require intermediate to advancedknowledge. You must know how these functions work to create the reportresults you want.
Save, Run, Filter& Run, Cancel buttons - Allows you to save, run, filter& run or, cancel the report definition.
Report definition defaultsYou can use the defaults of the report definition page to generate a report quickly.When you use the defaults, the report output contains granular traffic data, andaggregated (rolled-up) data.
Table 50. Report Definition Defaults
Section Guideline
Focal Entity Type Select the entity type that you want to report on. For example, ifyou want to report on the cells in your network, you wouldselect the cell entity type.
Field Selections Select one or more fields from the focal entity. You can select afield from a lower-level entity; however, that will cause the datafrom the lower-level entity to be rolled up to the focal entitylevel. You would thus lose the granularity of the report.
Filtering Optional, although highly recommended.
Date-Time Selection Select the time frame for which the report results are presented.
After you make these selections, you can run the report.
Note: The default Group By settings are use to create the aggregated totals.
Chapter 9. Working with report definitions and templates 129

Going beyond the defaultsYou can create a report that produces different information than that produced bythe report definition defaults. For more information, see “Report definitiondefaults” on page 129. When you move beyond the defaults, you must have abetter understanding of the interrelationships among the different sections of thereport definition. The two sections that have the most impact on report results arethe Focal Entity Type and the Group By sections.
This section reviews each key section and its impact on report results.
About the Focal Entity typeFrequently, you can select the focal entity and not be concerned with how thisselection affects the other parts of the report definition. However, for morecomplex reports that go beyond the defaults, you must understand how the focalentity selections affect selections in other parts of the report definition.
When you select a focal entity type, it becomes is a fixed point in your report asillustrated in the following figure:
In the above figure, because Switch is the focal entity type, it is the fixed point inthe report definition and the report is built around it.
The focal entity selection affects your ability to select the traffic fields, entityinstances, and the Group By options you want in your report definition. TheGroup By options are of particular importance because they control report output.
After you have selected a focal entity type, you are restricted to the followingselections in the Field Selections, Filtering, and Group By sections:v Field Selections - Fields that are at or below the focal entity. If you select a field
from an entity at a lower level, the data is rolled-up to the focal entity level. See“Aggregating (Rolling up) fields to the Focal Entity level” on page 135.
v Filtering - Attributes (used for selecting entity instances) that are at or above thefocal entity. See “Filtering by Attributes” on page 136.
v Group By - Attributes (used for creating hierarchy of totals) that are at or abovethe focal entity. See “Group By and report totals” on page 137.
Generally, select the highest-level entity in the system that has all the attributesthat you need for the Filtering and Group By sections of the report definition. Foran example of how this works, see “Creating roll up totals with Group ByAttributes” on page 139. If need be, select a field from a lower-level entity, whichresults in the traffic data being aggregated at the focal entity level.
130 IBM Tivoli Netcool Performance Manager: User Guide

PerspectivesAbout this task
Perspectives are used to organize hierarchically a subset of entity types that arebased on a number of attributes:v Technologyv Vendorv Subsystemv Qualifier
The vendors, technologies, subsystems, and qualifiers that are available depend onthe network configurations that are used in your system. Qualifiers are attributesthat are not necessarily linked to technologies, subsystems, or vendors. They areused to represent other aspects of a network such as geographical organization.
Perspectives are used when you define and maintaining reports. Perspectives aredisplayed in the Hierarchical Entities View. See “Selecting a Focal Entity type” onpage 141.
The following table is a possible representation of entity types that are organizedby:v Technology: GSMv Vendor: Ericsson
GSM Ericsson perspectiveSystemParameter GroupService IndicatorLinkSet SIOSubSystemGlobal Translation Type.Group SwitchSwitching Network TerminalNetwork SynchronizationExtension ModuleData LinkHard DiskNetworkRegionDigital Path
TRCTransceiver GroupTime Slot Handler
The following list is a possible representation of entity types that are organized by:v Qualifier: Coverage area, Geographic area.NetworkRegionGGSNExchange_TerminalROUTE_IFOSI ChannelMGWSGSNRegistration_AreaCellRouting AreaCell
Chapter 9. Working with report definitions and templates 131

Signalling_PointSMSCProcessorHLRSGSNRegistration_AreaCellRouting AreaCell
QOS_Priority_ClassMSCLACCell
To create a Perspective, follow these steps:
Procedure1. Click the Preferences tab, and then click Perspective in the list of Preferences.
A list of perspectives and attributes is displayed.
2. Select the combination of vendors, technologies, subsystems, and qualifiers thatyou want to use to create a perspective.You can use Click+Ctrl and Click+Shft to select more than one attribute in alist.Only entity types with the attributes you select will be included in thePerspective.
3. Enter a name for the Perspective in the Perspective Name field.4. Click Save.
132 IBM Tivoli Netcool Performance Manager: User Guide

Field SelectionsThe Field Selections section of the report definition allows you to select theperformance measurements, or fields, against which you evaluate your wirelessnetwork. It is in the Field Selections section that you select the metrics that are ofinterest to you.
You can combine fields for a report, as well as, aggregate traffic data fromlower-level entities to the focal entity level.
Note: If an attribute field is selected for the report that corresponds to a group byattribute this will result in a duplicate column/field in the definition's reportresults. See “Selecting Group By options” on page 163
Combining performance indicatorsYou can select one or more fields for your report. When you select fields, youmight want to select a combination of fields that work together to indicate thesuccesses or failures of network performance. The following examples present howfields might be combined.
Note: Only certain combinations of field types can be used in a report. See “Fieldtypes” on page 90.
Key performance indicators example
This example selects the following key performance indicators that track thesuccess or failure of cells: call access attempts, established connections, anddropped calls. The system hierarchy is System:Switch:Cell.
The Focal Entity Type and Fields Selection sections in the report definition mightlook something like the following:
Table 51. Key Performance Indicators
Definition Section Selections
Focal Entity Type Cell
Field Selections Cell.Attmpt, Cell.Establish, Cell.DrpClls
The prefix indicates the entity type to which the field belongs; the suffix is theactual field name.
Note: If the focal entity type is at a higher level in the system hierarchy than theselected field, the traffic data is rolled up from the lower-level entity to the focalentity level. See “Aggregating (Rolling up) fields to the Focal Entity level” on page135
Related factors example
This example includes the key performance indicator Cell.CallAttmpt and itsrelated factors. Related factors are those traffic fields that give insight into theperformance of other traffic fields. For this example, the related factors mightinclude traffic fields that measure network congestion, radio signal interference, orhardware and software issues.
The Focal Entity Type and Field Selections sections in the report definition mightlook something like the following:
Chapter 9. Working with report definitions and templates 133
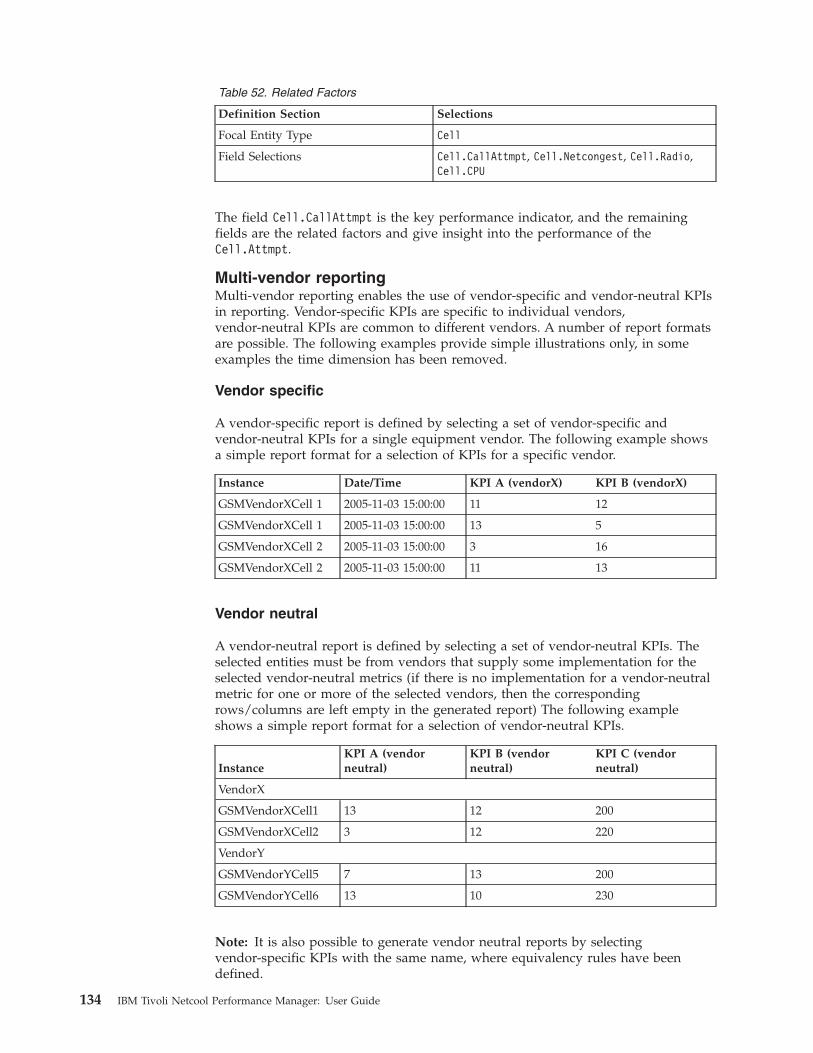
Table 52. Related Factors
Definition Section Selections
Focal Entity Type Cell
Field Selections Cell.CallAttmpt, Cell.Netcongest, Cell.Radio,Cell.CPU
The field Cell.CallAttmpt is the key performance indicator, and the remainingfields are the related factors and give insight into the performance of theCell.Attmpt.
Multi-vendor reportingMulti-vendor reporting enables the use of vendor-specific and vendor-neutral KPIsin reporting. Vendor-specific KPIs are specific to individual vendors,vendor-neutral KPIs are common to different vendors. A number of report formatsare possible. The following examples provide simple illustrations only, in someexamples the time dimension has been removed.
Vendor specific
A vendor-specific report is defined by selecting a set of vendor-specific andvendor-neutral KPIs for a single equipment vendor. The following example showsa simple report format for a selection of KPIs for a specific vendor.
Instance Date/Time KPI A (vendorX) KPI B (vendorX)
GSMVendorXCell 1 2005-11-03 15:00:00 11 12
GSMVendorXCell 1 2005-11-03 15:00:00 13 5
GSMVendorXCell 2 2005-11-03 15:00:00 3 16
GSMVendorXCell 2 2005-11-03 15:00:00 11 13
Vendor neutral
A vendor-neutral report is defined by selecting a set of vendor-neutral KPIs. Theselected entities must be from vendors that supply some implementation for theselected vendor-neutral metrics (if there is no implementation for a vendor-neutralmetric for one or more of the selected vendors, then the correspondingrows/columns are left empty in the generated report) The following exampleshows a simple report format for a selection of vendor-neutral KPIs.
InstanceKPI A (vendorneutral)
KPI B (vendorneutral)
KPI C (vendorneutral)
VendorX
GSMVendorXCell1 13 12 200
GSMVendorXCell2 3 12 220
VendorY
GSMVendorYCell5 7 13 200
GSMVendorYCell6 13 10 230
Note: It is also possible to generate vendor neutral reports by selectingvendor-specific KPIs with the same name, where equivalency rules have beendefined.
134 IBM Tivoli Netcool Performance Manager: User Guide

Multi-vendor
A multi-vendor report is defined by selecting a set of vendor-specific KPIs across atleast two different vendors. The following example shows a simple report formatfor a selection of vendor-specific KPIs for a number of vendors.
Instance KPI A (vendorX) KPI B (vendorY)
VendorX
GSMVendorXCell1 13 -
GSMVendorXCell2 3 -
VendorY
GSMVendorYCell5 - 13
GSMVendorYCell6 - 14
Mixed vendor
A mixed-vendor report is defined by selecting a set of vendor specific andvendor-neutral KPIs. The following example shows a simple report format for aselection of vendor-specific and vendor-neutral KPIs.
Instance KPI A (vendor X) KPI B (vendor Y)KPI C (vendorneutral)
VendorX
GSMVendorXCell1 13 - 200
GSMVendorXCell2 3 - 220
VendorY
GSMVendorYCell5 - 13 200
GSMVendorYCell6 - 10 230
Stored Busy Hour reportsA busy hour represents the period with the greatest value for a Key PerformanceIndicator (KPI) for a defined time (daily, weekly, monthly, or yearly). Because busyhour calculations are complex and involve large amounts of data, they can bestored in the database to be used in reports.
Aggregating (Rolling up) fields to the Focal Entity levelThe focal entity selection affects your ability to select the traffic fields you want inyour report. Specifically, you can only select traffic fields that are at or below thefocal entity.
When you select a field that is at a level lower than the focal entity, the data fromthe lower-level entity is rolled up to the focal entity level.
This example selects a number of performance measurements for cells (systemhierarchy is Switch:Cell) but rolls up the cell data to the focal entity level, whichis the Switch level.
The Focal Entity Type and Field Selections sections in the report definition mightlook something like the following:
Chapter 9. Working with report definitions and templates 135

Definition Section Selections
Focal Entity Type Switch
Field Selections Cell.Attmpt, Cell.Establish, Cell.DrpClls
The report results would provide columns for all the fields; however, their totalswould be rolled up (aggregated) at the Switch level. If you wanted to see the mostgranular traffic data for the cells, you must select Cell as the focal entity.
Note: Each traffic field has an aggregation type, which informs Tivoli NetcoolPerformance Manager software how to calculate rolled-up field values. Summationis only one of the aggregation types. If the traffic field has the sum aggregationtype, the totals in your report output will be summed. However, if the traffic fieldhas a different aggregation type, the software will yield a different set of totals.
FilteringThe Filtering section allows you to select a subset of network elements on which toreport. If you do not use the filter, your report includes all the entity instances ofan entity type.
The following sections review the importance of filtering and the two filters youcan use: the attribute filter and the traffic filter.
Why use filtering?
Although filtering is an optional step in the report definition, it is highlyrecommended for the following reasons:v A report that takes a couple of minutes to run with a filter can take twice as
long to run with unfiltered data. The report generation might even fail or timeout.
v It takes the readers of the report longer to find pertinent information when theymust wade through unfiltered or poorly filtered data.
Filtering by AttributesYou can select specific network elements for your report by filtering by attributevalues. The following example illustrates filtering by attributes.
Filtering by Entity ID example
The following example selects three (3) individual cells for a report by using theentity ID attribute. The system hierarchy is System:Switch:Cell.
Filtering by entity ID might look like the following:Cell.sys_id = 28 ANDCell.switch_id = 3 ANDCell.cell_id IN 190,192,194
The term AND is the Boolean AND operator, and IN represents multiple equal (=)signs between Boolean OR statements. You would interpret the last line as follows:(Cell.cell_id = 190) OR (Cell.cell_id = 192) OR (Cell.cell_id = 194)
The report includes only traffic data from three cells (190, 192, and 194) in Switch 3of System 28.
136 IBM Tivoli Netcool Performance Manager: User Guide
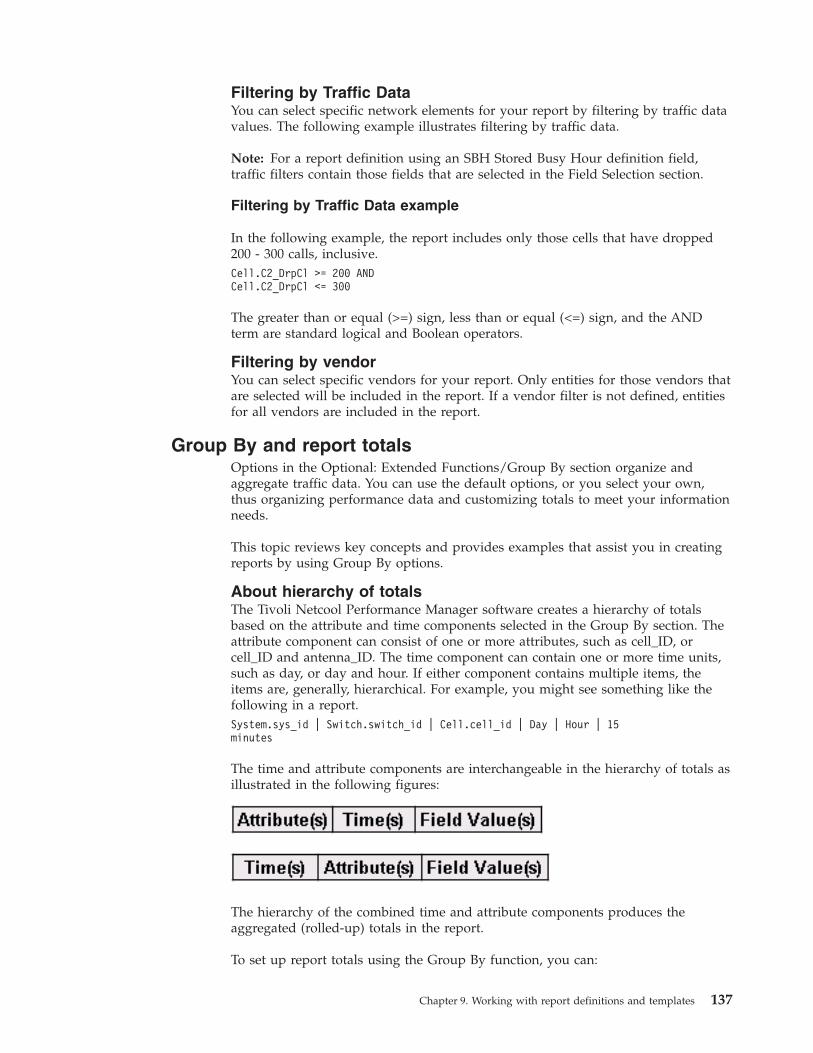
Filtering by Traffic DataYou can select specific network elements for your report by filtering by traffic datavalues. The following example illustrates filtering by traffic data.
Note: For a report definition using an SBH Stored Busy Hour definition field,traffic filters contain those fields that are selected in the Field Selection section.
Filtering by Traffic Data example
In the following example, the report includes only those cells that have dropped200 - 300 calls, inclusive.Cell.C2_DrpCl >= 200 ANDCell.C2_DrpCl <= 300
The greater than or equal (>=) sign, less than or equal (<=) sign, and the ANDterm are standard logical and Boolean operators.
Filtering by vendorYou can select specific vendors for your report. Only entities for those vendors thatare selected will be included in the report. If a vendor filter is not defined, entitiesfor all vendors are included in the report.
Group By and report totalsOptions in the Optional: Extended Functions/Group By section organize andaggregate traffic data. You can use the default options, or you select your own,thus organizing performance data and customizing totals to meet your informationneeds.
This topic reviews key concepts and provides examples that assist you in creatingreports by using Group By options.
About hierarchy of totalsThe Tivoli Netcool Performance Manager software creates a hierarchy of totalsbased on the attribute and time components selected in the Group By section. Theattribute component can consist of one or more attributes, such as cell_ID, orcell_ID and antenna_ID. The time component can contain one or more time units,such as day, or day and hour. If either component contains multiple items, theitems are, generally, hierarchical. For example, you might see something like thefollowing in a report.System.sys_id | Switch.switch_id | Cell.cell_id | Day | Hour | 15minutes
The time and attribute components are interchangeable in the hierarchy of totals asillustrated in the following figures:
The hierarchy of the combined time and attribute components produces theaggregated (rolled-up) totals in the report.
To set up report totals using the Group By function, you can:
Chapter 9. Working with report definitions and templates 137

v Select the order of the time and attribute components (attribute and time, ortime and attribute). For examples, see “Attribute/Time and Time/Attribute.”
v Within the attribute component, select to include one or more attributes. Inaddition, if you select multiple attributes, you determine the order of theattributes. For examples, see “Creating roll up totals with Group By Attributes”on page 139.
v Within the time component, select one or more time units.
Attribute/Time and Time/AttributeTwo Group By options Attribute and Time and Time and Attribute determinewhether the time component of the hierarchy of totals comes before or after theattribute component. The position of the time component in the total hierarchyproduces different roll-up totals. The following table explains the type of outputthat is produced by the options Attribute and Time versus Time and Attribute:
Table 53. Attribute and Time versus Time and Attribute
Group By Option Description
Attribute and Time Provides a daily total for all the selected networkelements (entity instances) aggregated together
Time and Attribute Provides daily totals for individual network element
For an example of report that is based on Time and Attribute, see the followingtable.
Table 54. Time and Attribute Example
Day Hour Cell_ID Cell Value Comment
------ ------ ------ 124 Top summary:Total for all daysand all cells
Sun ------ ------ 68 Total for all ofSunday
Sun 00 ------ 40 Total for Sunday00:00 hours
Sun 00 Cell 001 15 Hourly value
Sun 00 Cell 002 25 Hourly value
Sun 01 ------ 28 Total for Sunday01:00 hours
Sun 01 Cell 001 16 Hourly value
Sun 01 Cell 002 12 Hourly value
Mon 00 ------ 32 Total forMonday 00:00hours
Mon 00 Cell 001 10 Hourly value
Mon 00 Cell 002 22 Hourly value
Mon 01 ------ 24 Total forMonday 01:00hours
Mon 01 Cell 001 10 Hourly value
Mon 01 Cell 002 14 Hourly value
138 IBM Tivoli Netcool Performance Manager: User Guide

In the above example, time precedes the attribute (Cell ID) in the hierarchy oftotals.
Creating roll up totals with Group By AttributesYou can roll up (aggregate) traffic data from a lower-level entity (such as Antenna)to a higher entity level (such as Cell), which produces drill-down and summaryreport results, and other types of report output.
You create roll-up totals by selecting a Group By attribute from an entity that is ata higher-level than the focal entity. However, you must remember that whenselecting a focal entity, you must select a focal entity that also gives you theselections you want in the Field Selections and Filtering sections, ands the GroupBy section.
The following example details the different variables and how they impact whatyou select for the report definition.
Example selections for roll-up totals
This example aggregates (rolls up) traffic data from the Cell level to the Switchlevel (the system hierarchy is System:Switch:Cell) and includes only two cells.
The Focal Entity Type, Filtering, and Group By selections might look similar to thefollowing:
Definition Section Selections
Focal Entity Type Cell
The entity type Cell was selected for the following reasons:
v Cells had to be available for filtering. Selecting Cell as thefocal entity ensured that the Cell entities were availablefor selection in the filter. If we selected the higher-levelSwitch entity, cells would not be available for selection.
v Switch attributes must be available for selection in GroupBy. Selecting Cell as the focal entity ensured that thehigher-level attributes were available for selection.
Filtering Cell.cell_id IN 100,200
This selection ensures that only two cells (100 and 200) areincluded in the report.
Group By Switch_ID
This selection causes the totals for the cells to be aggregated(rolled up) for each switch in the report.
With the above selections, data from the lower-level cell entity is rolled-up to thehigher-level Switch.
Chapter 9. Working with report definitions and templates 139

Before you beginTo use the functionality in the Reporting tab, you must first have the requisiteprivileges and permissions.v Privileges give you the ability to open, read, run, and schedule report
definitions.v Permissions give you the ability to read and edit report definitions, which you
access either from the Reporting tab or Browse tab.
If you are unsure of the privileges you have, contact your system administrator.Document permissions are set by individual document owners (see “Documentand folder permissions” on page 55.
Creating a report definitionThis section contains the instructions for each section of the report definition.
Selecting a data sourceUse the following procedure to select the data source that contains the networkelements (entity instances) you want in your report.
About this task
This procedure assumes the Reporting /define report page is open.
To select a system, follow these steps:
Procedure1. Click the edit button as necessary to open the DataSource Selection section.
The section opens as shown in the following graphic.
2. From the DataSource Selection list box, select a system. The focus of the pageautomatically moves to the next step.
Note: If you change the data source to a server that is running a differentversion of the Tivoli Netcool Performance Manager software after you haveconfigured other options on this page, those other options automatically reset.If you change the data source and both servers are running the same version ofthe Tivoli Netcool Performance Manager software, the other options retain theirsettings. To ensure Tivoli Netcool Performance Manager creates a valid reportwhen you have switched between servers that are running the same version ofthe Tivoli Netcool Performance Manager software, verify that the other optionsare valid for the new server before saving the report definition.To simplify configuration, the remainder of the sections will not refresh if youchange systems.
140 IBM Tivoli Netcool Performance Manager: User Guide

Selecting a Focal Entity typeAbout this task
Generally, the focal entity represents the entity type that you want to report on. Forexample, if you want to report on the cells in your network, you would select thecell entity type.
However, this might not be true for more complex reports, particularly reports thatuse customized Group By options. For more information, see “Going beyond thedefaults” on page 130.
The following procedure assumes the Reporting /define report page is open.
To select a focal entity type, follow these steps:
Procedure1. Click the edit button to open the Focal Entity Type section as necessary. The
section opens as shown in the following graphic:
2. Select an entity type. You select an entity type from:v The Focal Entity Type list box, see “Selecting an entity type from the list
box”Or
v The Hierarchical Entities view dialog, see “Selecting an entity type from theHierarchical Entities View dialog”
Selecting an entity type from the list boxAfter the entity has been selected, the focus of the page automatically moves to thenext step.
Procedure1. Click the Focal Entity Type list box. It displays all entity types in the system.2. From the displayed list, select the focal entity type that you want.
Selecting an entity type from the Hierarchical Entities ViewdialogProcedure1. Click the Browse Entities button.
The Hierarchical Entities View dialog is displayed.
Chapter 9. Working with report definitions and templates 141

The Hierarchical Entities View dialog displays a number of entity hierarchies.The hierarchies that are displayed depend on the network hierarchies that areused in your system.
2. From the Perspective list box, select the hierarchy perspective that you want touse.You can select from a number of different perspectives that have already beendefined. See “Perspectives” on page 131.You can also define your own ad hoc perspective by using the Custom button.See “Using a Custom perspective” on page 143
3. Locate the entity type that you want from the hierarchy(ies) displayed.You can search for an entity by using the Search field. Searches are notcase-sensitive.You can use the asterisk wildcard in a search. The asterisk wildcard is used torepresent one or more alphanumeric characters. For example:To search for the entity type Cell you can type:v C* - this would find all entity types beginning with Cv *l - this would find all entity types ending with lv *c*- this would find all entity types containing c
You can use more than one wildcard in a search. All of the matching entitytypes are displayed in a list. You select the entity type from the list box.
142 IBM Tivoli Netcool Performance Manager: User Guide
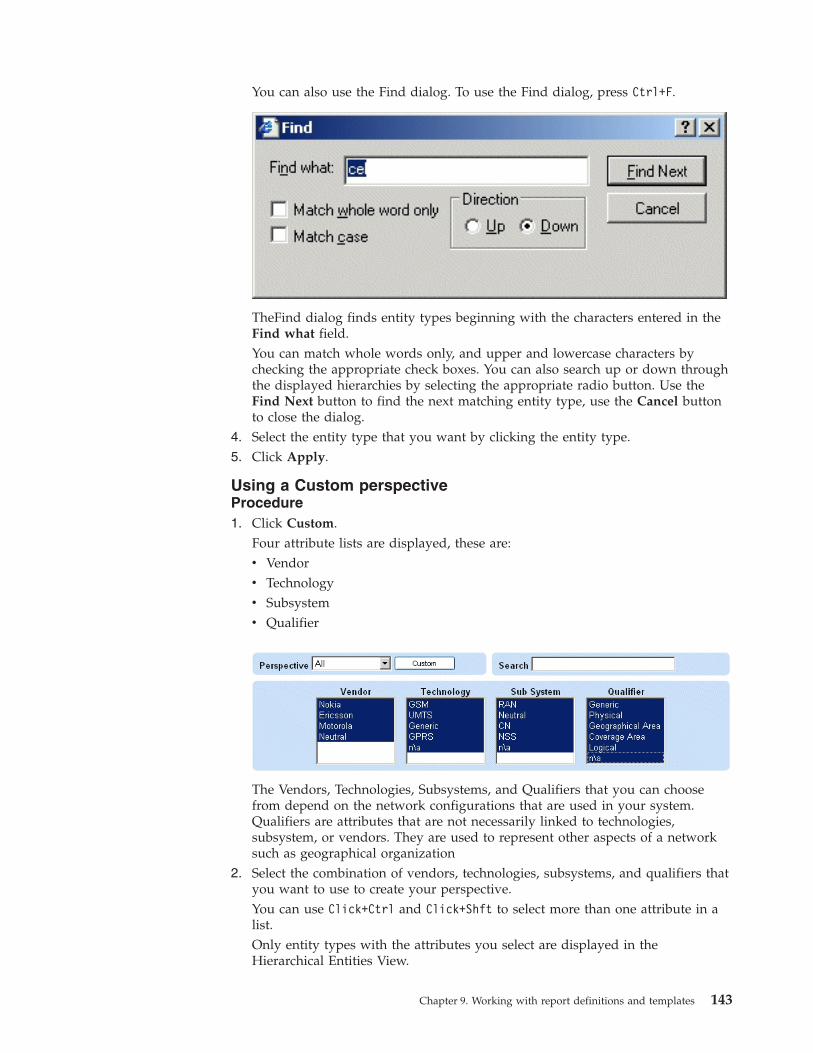
You can also use the Find dialog. To use the Find dialog, press Ctrl+F.
TheFind dialog finds entity types beginning with the characters entered in theFind what field.You can match whole words only, and upper and lowercase characters bychecking the appropriate check boxes. You can also search up or down throughthe displayed hierarchies by selecting the appropriate radio button. Use theFind Next button to find the next matching entity type, use the Cancel buttonto close the dialog.
4. Select the entity type that you want by clicking the entity type.5. Click Apply.
Using a Custom perspectiveProcedure1. Click Custom.
Four attribute lists are displayed, these are:v Vendorv Technologyv Subsystemv Qualifier
The Vendors, Technologies, Subsystems, and Qualifiers that you can choosefrom depend on the network configurations that are used in your system.Qualifiers are attributes that are not necessarily linked to technologies,subsystem, or vendors. They are used to represent other aspects of a networksuch as geographical organization
2. Select the combination of vendors, technologies, subsystems, and qualifiers thatyou want to use to create your perspective.You can use Click+Ctrl and Click+Shft to select more than one attribute in alist.Only entity types with the attributes you select are displayed in theHierarchical Entities View.
Chapter 9. Working with report definitions and templates 143

For example:
3. Locate the entity type that you want.4. Select the entity type that you want by clicking the entity type.5. Click Apply.
Selecting fieldsUse the following procedure to select one or more fields for your report. Fieldsrepresent the performance and service measurements that you use to analyze thecomponents of your network.
You can select fields of the focal entity and lower-level entities. If you select a fieldfrom a lower-level entity, the data from the lower-level entity is rolled up to thefocal entity level. For more information, see “Aggregating (Rolling up) fields to theFocal Entity level” on page 135.
The following procedure assumes the Reporting / define report page is open. TheField Selections section has an abbreviated and expanded form. When you firstopen the section, the abbreviated form is displayed.
Certain field type combinations cannot be supported in the same report definition.For example, Stored Busy Hour (SBH) fields cannot be combined with the rawdata fields, Peg Count and Primitive Calculation.
This section contains procedures for the following:v “Typing field names in the abbreviated form”v “Selecting fields from the expanded form” on page 145
Typing field names in the abbreviated formTo save time, you can simply type in one or more field names and move onto thestep in the report definition.
144 IBM Tivoli Netcool Performance Manager: User Guide

About this task
To type field names in the abbreviated form, follow these steps:
Procedure1. Click the edit button to open the Field Selections section as necessary. The
section opens the abbreviated form as shown in the following graphic.
2. In the Field Selections text box, type the following: the entity to which thefield belongs, a period (.), and the field name. Example: Cell. Call_AttemptTo enter multiple field names, separate the names with either a comma or aspace. Extra spaces are ignored. For example: Cell.Call_Attempt,Cell.Drp_Calls
Selecting fields from the expanded formFrom the field grid in the expanded form, you select fields for a report.
About this task
To select fields from the expanded form, follow these steps:
Procedure1. Click more. The page refreshes, and the expanded form of the Field Selections
section becomes available. The following graphic shows the upper half of thesection.
The Field Type defaults to UDC: User Defined Calculation. The field grid liststhe fields of the focal entity and field type. If there are no UDCs defined for theentity selected a message is displayed.
Note: UDCs created from SBH KPIs are not accessed from the UDC Field Typeunless they are Forecasting (trending) UDCs. UDCs that use SBH KPIs can beaccessed by using the appropriate SBH Field Type and SBH Definition.If you select a different entity or field type, or change any of your otherselection criteria, you must refresh the grid by using Refresh Fields. A messageappears informing you, if this is necessary. If you have selected an SBH fieldtype, you must also select an SBH definition by using the SBH Definition listbox.
Chapter 9. Working with report definitions and templates 145

Certain field type combinations cannot be supported in the same reportdefinition.Column headers - click to list the column contents in ascending or descendingorder.
2. Optional: To select fields from another entity, click the Entity
Note: You can select descendants of the focal entity.3. Optional: To reduce the number of fields in the field pane, use one or more of
the following options:v Technology - Lists only the fields with the selected technology type.v Vendor - Lists only the fields for the selected vendor. Fields can be displayed
for a specific vendor and for all vendors. Vendor neutral fields can also bedisplayed.
v Groups - Standard, User Defined Group or All.Standard lists only fields that use standard field names that are defined by afield's technology pack.User Defined Group lists:v Fields that are members of a user-defined group. Where a field is a member
of more than one group, the field is listed multiple times.v Fields that use user-defined field names, these field names are called aliases.All lists all fieldsv Filter - Lists only fields whose name or source matches the characters that
you enter. You can use the asterisk character as a wildcard.v Extended Search - Works with the Filter field to search the text in the
Heading1, Heading 2, and Description columns of the field.4. To select a field for a report, do one of the following:
v Select a field from the upper field grid and drag it to the lower grid asshown in the following graphic.
v Double-click an item in the field grid. This action automatically copies thefield to the lower grid. To select multiple fields, use Ctrl+Click. To select arange of fields, use Shift+Click.
The selected field is displayed in the lower grid.5. Optional: You can change the order of the fields in the lower grid by dragging
each one to its correct sequence.
Note: If the report output is tabular, the order of the fields in the lower griddictates the column ordering. The first field is the first column, the second field,the second column, and so on.
146 IBM Tivoli Netcool Performance Manager: User Guide

6. Set the type of data availability information to include for a selected field.Select the type from the Data Avail list box.
Note: Data availability is not supported for trending UDCs or SBH KPIs.Data availability types include:
Type Description
Percentile Percentage of data available, computed fromloaded data.
Intervals The number of data intervals that areloaded, computed from loaded data.
Intervals and Percentile Number of intervals and percentage of dataavailable, computed from loaded data.
Raw Percentile Percentage of data available, computed fromperformance data.
Raw Intervals The number of data intervals that areloaded, computed from performance data.
Raw Intervals and Percentile Number of intervals and percentage of dataavailable, computed from performance data.
Data availability types are used to produce a confidence factor for the report.See “Selecting the Confidence Factor option” on page 168
7. To clear a field, select a field in the lower grid and click Delete selected fields.
Field columnsThe following table list the columns that may be displayed for a field.
Table 55. Field columns
Column Description
Group Group to which the field belongs. The group to which the fieldbelongs is defined by the field's technology pack. A field does nothave to be a member of a group.
Name Standard name of the field that is defined by the field'stechnology pack. A field can have a standard name and an alias.
User Defined Group User-defined group to which the field belongs. A field does nothave to be a member of a user-defined group.
Alias Alias is a user-defined name for a field. Aliases are used to givemore meaningful or "friendlier" names to fields. Not all fieldshave aliases.
Description Description of the field.
Source Source of the field. A field's source depends on the type field. See“Field types” on page 90 for information about types of fields.Sources for the following field types can include:
v PCalc - expression.
v UDC - expression.
v Attribute - no expression.
v Peg - database table
v SBH Pegs, database table
A source cannot always be given for a field. For example,summary KPIs.
Chapter 9. Working with report definitions and templates 147

Table 55. Field columns (continued)
Column Description
Technology Technology that is associated with the field. For example, GSM.Not all fields are associated with a technology.
Vendor Vendor that is associated with the field. Not all fields areassociated with a vendor.
Entity Network entity the field is derived from.
Field Type Type of field. See “Field types” on page 90.
Aggregator Aggregation type that is used for field. See Chapter 17,“Aggregation types,” on page 279.
Modified UDCs only. Date the UDC was last modified.
Data type Type of data that are held by the field: string, float, or integer.
Heading 1 UDCs only. Descriptive heading that is used to help searchfor/identify a UDC.
Heading 2 UDCs only. Descriptive heading that is used to help searchfor/identify a UDC.
Owner If the field is a UDC, the creator of the UDC.
Complex If the field is a complex KPI. Complex KPIs (PCALCs and UDCs)are fields-based on more than one counter or expression.
Making a relative Date-Time selectionMake a date-time selection to select the time frame for which report results arepresented. Relative date-time selections are relative to the date on which the reportis run. This is in contrast to a calendar date-time selection, where you select a fixedday or days from the calendar (see “Making a calendar Date-Time selection” onpage 152).
This section explains the parts of the relative Date-Time Selection section andprovides the procedures for selecting a relative date and time.
Parts of Relative Date-Time sectionThis section describes the primary parts of the relative Date-Time Selection sectionas illustrated in the following figure.
Legend:
148 IBM Tivoli Netcool Performance Manager: User Guide

No. Description
1 Relative/Calendar selection - Allows you to make relative or calendardate-time selections.
2 Start of Week - Allows you to specify a different day for the start of theweek for reporting purposes.
3 Times To Apply to Date(s) - Allows you to select the times you want toinclude in your report. You can have multiple time selections.
4 Relative date - Allows you to select the number and type of date periods(relative to the current time period) to include in your report.
For trending reports Last or Next can be selected. For example, where atrend is based on 10 days of data (defined by the UDC being used) iftoday is the 28th of October and today is included in the report, then:
v Last 2 days - today, yesterday - 28th and 27th of October. The trend isbased on 10 days of data: 18th to the 28th October.
v Next 2 days - today, tomorrow - 28th and 29th of October. The trend isbased on 10 days of data: 19th to the 29th October.
5 Include current - Includes the current time period in the report. Forexample, if you select 1 Day(s), the report includes data from today only.
6 Days of the week - Allows you to select the days of the week to include inthe report.
7 Holidays - Allows you to include or exclude holidays from the report.
8 Extend Data Range - If you are excluding days within your date range,such as holidays or weekends, you might want to use this option to extendthe date range beyond them. For more information and examples, see“Selecting a relative date and time.”
Selecting a relative date and timeA relative date-time period consists of a relative date range and one or more timeselections.
About this task
A time selection represents the times of the day for which you want report data.The time units available for time selections depend upon how your Tivoli NetcoolPerformance Manager system is set up. You might be able to select hour, half-hour,or 15-minute intervals.
Example relative date-time period:Last 1 Week(s) 05:00-07:00, 17:00-19:00Mon,Tue,Wed,Thu,Fri,Sat,Sun
The date range in the above example includes one week with the days of Mondaythrough Sunday. The time selections are two hours in the early morning and twohours in the late afternoon. If you were to run this report on Monday, 7/12, thereport would include data for the following: the preceding Monday, 7/5, throughSunday, 7/11; for the hours of 5:00 - 7:00 A.M. and 5:00 - 7:00 P.M.
Note: The Tivoli Netcool Performance Manager Web client provides you with anumber of ways to define a relative date-time period. Ensure that your date-timeselection makes sense for the report. For example, do not select the Holidays onlyoption for a period where no holidays are defined.
Chapter 9. Working with report definitions and templates 149

This procedure assumes the Reporting /define report page is open.
To make a relative date-time selection, follow these steps:
Procedure1. Click edit to open the relative Date-Time Selection section as necessary.2. f you want to change the first day of the week from the default, select a day
from the Start of Week list box.
Note: A week typically starts on a Sunday (the system default start-of-week isset when the Tivoli Netcool Performance Manager system is installed).
3. Add one or more time selections.v Select a starting time box 1v Select an ending time box 2.
v Click add. The time selection and its delete are added to the page 3.v Add more time selections as required. Remove an unwanted time selection
by clicking its accompanying delete button.
Tip: If you want to select all the hours in a day, make sure that there are noother times that are selected, and click the add button. All 24 hours areselected automatically.
4. Select a relative date.A day represents a full day, starting at 00:00; a week usually starts on a Sunday(this is configured when the system is installed); a month is the 1st through thefinal day of the month; and a year is January 1 - December 31st.v Select Last or Next and enter a number (box 1 and then a unit of time (box 2
For example, Last and 2 Day(s) would equal the last two days while Nextand 2 Day(s) would equal the next two days. Next can be used for trendingreports.
v Select theInclude current check box if you want to include the current timeperiod in the report. For example, if you select Last 1 Day(s) and theInclude current check box, the report includes data from today only.However, if you select 1 Day(s) but clear the Include current check box, thereport includes data from yesterday only.
5. Select the days of the week (Monday-Sunday) you want included in the report.
150 IBM Tivoli Netcool Performance Manager: User Guide
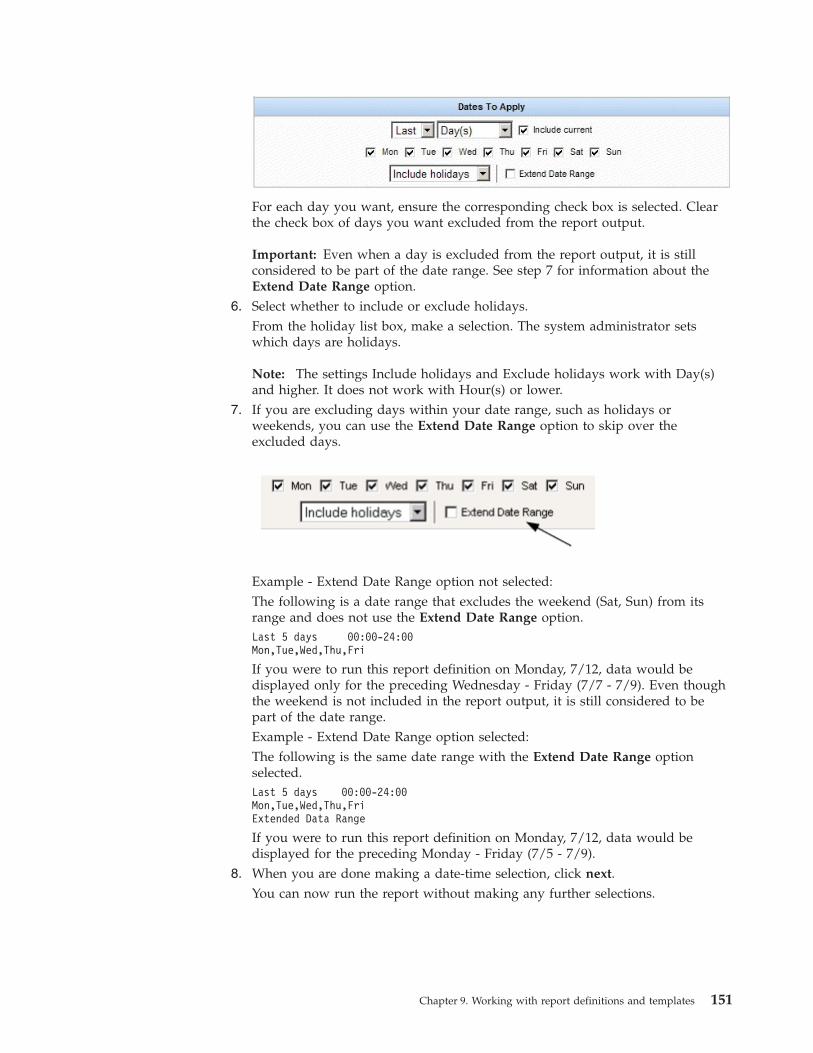
For each day you want, ensure the corresponding check box is selected. Clearthe check box of days you want excluded from the report output.
Important: Even when a day is excluded from the report output, it is stillconsidered to be part of the date range. See step 7 for information about theExtend Date Range option.
6. Select whether to include or exclude holidays.From the holiday list box, make a selection. The system administrator setswhich days are holidays.
Note: The settings Include holidays and Exclude holidays work with Day(s)and higher. It does not work with Hour(s) or lower.
7. If you are excluding days within your date range, such as holidays orweekends, you can use the Extend Date Range option to skip over theexcluded days.
Example - Extend Date Range option not selected:The following is a date range that excludes the weekend (Sat, Sun) from itsrange and does not use the Extend Date Range option.Last 5 days 00:00-24:00Mon,Tue,Wed,Thu,Fri
If you were to run this report definition on Monday, 7/12, data would bedisplayed only for the preceding Wednesday - Friday (7/7 - 7/9). Even thoughthe weekend is not included in the report output, it is still considered to bepart of the date range.Example - Extend Date Range option selected:The following is the same date range with the Extend Date Range optionselected.Last 5 days 00:00-24:00Mon,Tue,Wed,Thu,FriExtended Data Range
If you were to run this report definition on Monday, 7/12, data would bedisplayed for the preceding Monday - Friday (7/5 - 7/9).
8. When you are done making a date-time selection, click next.You can now run the report without making any further selections.
Chapter 9. Working with report definitions and templates 151
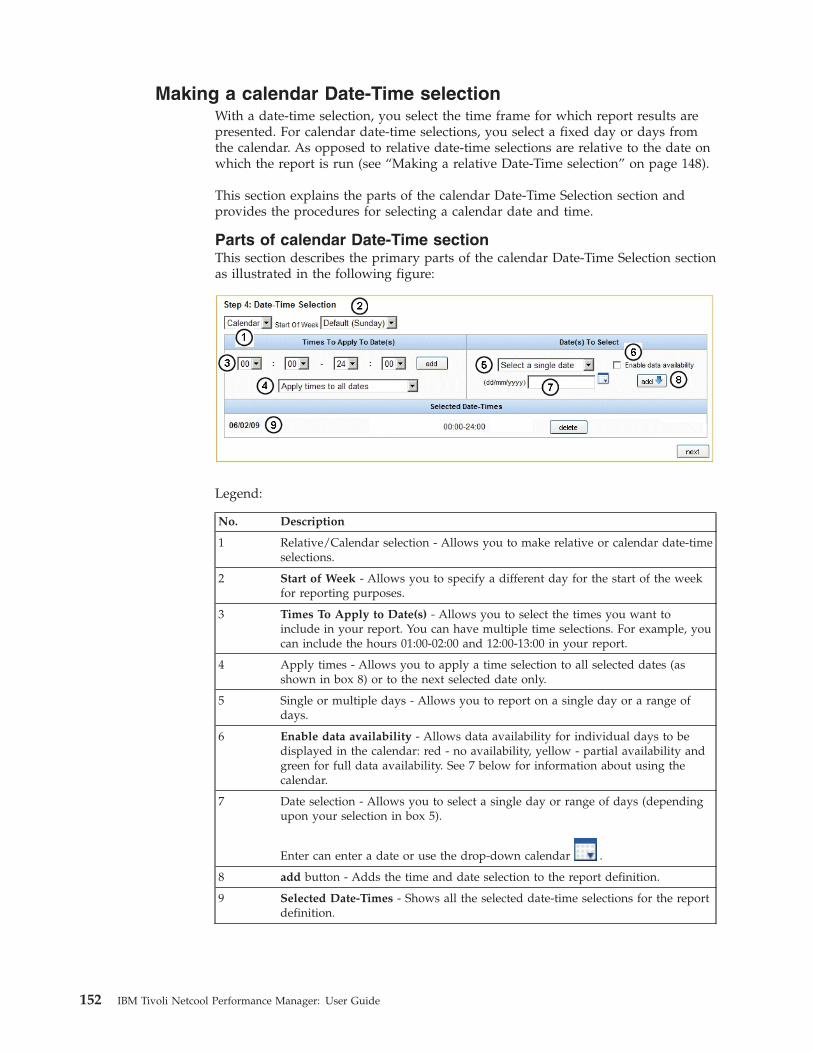
Making a calendar Date-Time selectionWith a date-time selection, you select the time frame for which report results arepresented. For calendar date-time selections, you select a fixed day or days fromthe calendar. As opposed to relative date-time selections are relative to the date onwhich the report is run (see “Making a relative Date-Time selection” on page 148).
This section explains the parts of the calendar Date-Time Selection section andprovides the procedures for selecting a calendar date and time.
Parts of calendar Date-Time sectionThis section describes the primary parts of the calendar Date-Time Selection sectionas illustrated in the following figure:
Legend:
No. Description
1 Relative/Calendar selection - Allows you to make relative or calendar date-timeselections.
2 Start of Week - Allows you to specify a different day for the start of the weekfor reporting purposes.
3 Times To Apply to Date(s) - Allows you to select the times you want toinclude in your report. You can have multiple time selections. For example, youcan include the hours 01:00-02:00 and 12:00-13:00 in your report.
4 Apply times - Allows you to apply a time selection to all selected dates (asshown in box 8) or to the next selected date only.
5 Single or multiple days - Allows you to report on a single day or a range ofdays.
6 Enable data availability - Allows data availability for individual days to bedisplayed in the calendar: red - no availability, yellow - partial availability andgreen for full data availability. See 7 below for information about using thecalendar.
7 Date selection - Allows you to select a single day or range of days (dependingupon your selection in box 5).
Enter can enter a date or use the drop-down calendar .
8 add button - Adds the time and date selection to the report definition.
9 Selected Date-Times - Shows all the selected date-time selections for the reportdefinition.
152 IBM Tivoli Netcool Performance Manager: User Guide

Selecting a calendar Date and TimeAbout this task
A calendar date-time period consists of one or more groupings of calendar daysand time selections.
Example Calendar Date-Time Period06/23/04 00:00-4:00
Using the above grouping, the report will display data for the time slice (hours of)12:00 - 4:00 A.M. on June 23, 2004.07/01/04- 03:00-05:00, 13:00-14:0007/10/04
Using the above grouping, the report output will display data for the time slices of3:00 - 5:00 A.M. and 1:00 - 2:00 P.M for the days July 01 through July 10, 2004.
This procedure assumes the Reporting / define report page is open.
To make a calendar date-time selection:
Procedure1. Click edit if necessary.2. If you want to change the first day of the week from the default, select a day
from the Start Of Week list box.
Note: A week typically starts on a Sunday (the default start-of-week is definedwhen the Tivoli Netcool Performance Manager system is installed).
3. Add a date-time grouping in the Times to Apply To Date(s) area.
a. Select a starting time box 1.b. Select an ending time box 2.c. Click add. The time selection is added to the page 3.d. Add more time selections as required. Remove an unwanted time selection
by clicking its accompanying delete button.
Tip: If you want to select all the hours in a day, click add without makinga time selection, and all 24 hours will be selected automatically.
4. Apply the time selection to all dates or to the next selected date only.5. Select which dates you want to report on.
Chapter 9. Working with report definitions and templates 153

a. Select to report on a single day or a range of days.b. Depending upon your selection, you enter the date for a single day, or the
start and end dates for a date range:
To Select a... Do This...
Single day Type in a day: mm/dd/yy (box 2).- Or - click the calendar icon and select a day.
Range of days v In the first box, type the start date (mm/dd/yy),or click the calendar icon and select a day.
v In the last box, type the end date (mm/dd/yy),or click the calendar icon and select a day.
c. Click add. The selected time-date grouping is added to the report definition.6. To select another date-time ranges, repeat steps 1 - 4. Remove an unwanted
grouping by clicking its accompanying delete button.
Building a filterAbout this task
Build a filter to select specific network elements for your report, excluding allothers.
This section explains the parts of the filter, discusses the order of precedence, andprovides the procedures for building a filter.
Note: Any selections that are made in Step 5 are ignored for non-stored busy hourreports. To filter a non-stored busy hour report, you must complete selections forthe Filter Expression. To filter a non-stored busy hour report you must completeselections for the Filter Expression in the non-stored busy hour, see “SelectingNon-Stored Busy Hour options” on page 160.
Parts of the filter sectionThe Filtering section consists of two parts: an attribute filter, and a traffic filter:v Attribute filter - Allows you to select entity instances by filtering with attribute
values.v Traffic filter - Allows you to select entity instances by filtering with traffic data
values.
Note: For a report definition using a SBH Stored Busy Hour definition field,traffic filters only contain those fields selected in the Field Selection section.v Vendor filter - Allows you to select entity instances by filtering by vendor.
154 IBM Tivoli Netcool Performance Manager: User Guide

The following figure shows the primary parts of the attribute filter.
Legend:
No. Description
1 Attribute selection - You select an attribute by using the first list box orby using the Browse Entities button.
The second list box lists the attributes of the entity type.Note: You can only select entity types at or above the focal entity.
2 Logical operators - Create an expression that yields a true or falsevalue. The operator contains, which is unique, is an abbreviated formof multiple Boolean OR expressions.
3 Attributed values - Specify the individual entity instance or instances.
For example: Cell.cell_id = 100,200
4 more button - Opens the Value Filter box (not shown), which lists allthe values of the attribute selected in 1.
5 Boolean Operator - Links the expressions in the Added Filters areatogether using the AND and OR operators.
6 Boolean Operator - Adds the expression (1 through 5) to the AddedFilters area
7 Added Filters area - Lists the selected expressions and their order ofprecedence. See “Order of Precedence” on page 157.
Provides the following buttons:
v delete - Deletes the selected expression
v and <-> or - Changes the Boolean operator of the selected expression
v move up / move down - Moves the selected expression up or downin the order of precedence.
Chapter 9. Working with report definitions and templates 155

Legend:
No. Description
1 Field selection -- You select an attribute by using the first drop-down listbox or by using the Browse Entities button.
The subsequent drop-down list boxes list attributes of the entity type byVendor, Group and Counter.
Note : You can only select entity types at or below the focal entity.
2 Logical operators -- Create an expression that yields a true or falsevalue. The operator contains , which is unique, is an abbreviated form ofmultiple Boolean OR expressions.
3 Traffic data value -- Specifies the field value or values.
For example: Cell.DrpCl > 100
4 Boolean Operator -- Links the expressions in the Added Filters areatogether using the AND and OR operators.
5 add button -- Adds the expression (1 through 5) to the Added Filters area
6 Added Filters area -- Lists the selected expressions and their order ofprecedence. See “Order of Precedence” on page 157.
Provides the following buttons:
v delete -- Deletes the selected expression
v and <-> or -- Changes the Boolean operator of the selected expression
move up / move down -- Moves the selected expression up or down in theorder of precedence.
156 IBM Tivoli Netcool Performance Manager: User Guide

Legend:
No. Description
1 Attribute selection - The list box lists the available entity types.
The vendors to use in the filter are specified by selecting the appropriatecheck boxes.
2 add button - Adds the selected vendors the Added Filters area.
3 Added Filters area - Lists the selected vendors.
Provides the following buttons:
v delete - Deletes the selected vendor filter.
Order of PrecedenceWhen you link attribute or traffic expressions together using the Boolean operatorsAND or OR, there are implied parentheses. These parentheses affect how thelinked filters are evaluated. The precedence of operations moves from left to rightas illustrated in the following examples.
Example 1A AND B AND C = (A AND B) AND C
Example 2A AND B AND C AND D = ((A AND B) AND C) AND D
Building the FilterUse the procedures in this section to build a filter. A combination of filters can beapplied:v Attribute filter -- Allows you to select entity instances by filtering with attribute
values. For further explanation and examples, seeSee Filtering by Attributes.v Traffic filter -- Allows you to select entity instances by filtering with traffic data
values. For further explanation and examples, see See Filtering by Traffic Data.v Vendor filter -- Allows you to select entity instances by filtering by vendors. For
further explanation and examples, see See Filtering by Vendor.
This procedure assumes the Filtering section is open in the report definition.
To filter by attributes:1. Select the attribute you want to filter by.
Chapter 9. Working with report definitions and templates 157

v Using the first drop-down list box or the Browse Entities button ( 1 in thefigure below, select the entity type that contains the attribute you want.
Note: You can select only entities at or above the focal entity.
v From the second drop-down list box, select an attribute of the selected entitytype.
2. Select an logical operator.
Note: The contains operator is unique. It is an abbreviated form of multipleBoolean OR expressions. Use this when you want to enter multiple attributevalues in the attribute value box.
3. If you know the attribute value or values, do one of the following in theattribute values boxv If you selected the contains operator, type multiple values separated by
commas. Example: 101,102,103v If you selected any other logical operator, type a single value in the text box.
4. If you do not know the exact attribute value, click the more button.The Value Filter text box is displayed and beneath it all the values of theselected attribute are listed as shown in the figure.
v From the attribute list box select one or more items and click the add button( 2 in The selected attribute value(s) is added to the list box.
v Optional -- To make the list more manageable, use the wildcard (*) in theValue Filter text box to create a subset of attribute values. -- In the Value Filterbox, enter a partial attribute value and the asterisk (*). Example: 22-* -- Clickthe apply button or press the Enter key.
5. Select AND or OR as the Boolean operator.6. When you have completed the attribute expression (attribute, operator, attribute
value, and Boolean operator), click theadd button located directly above AddedFilters . The completed expression is added to the Added Filters list.
7. To create another expression and link it to a previously created expression,repeat steps 1 through 6.
To filter by traffic data:1. Select the traffic field you want to filter by.
158 IBM Tivoli Netcool Performance Manager: User Guide
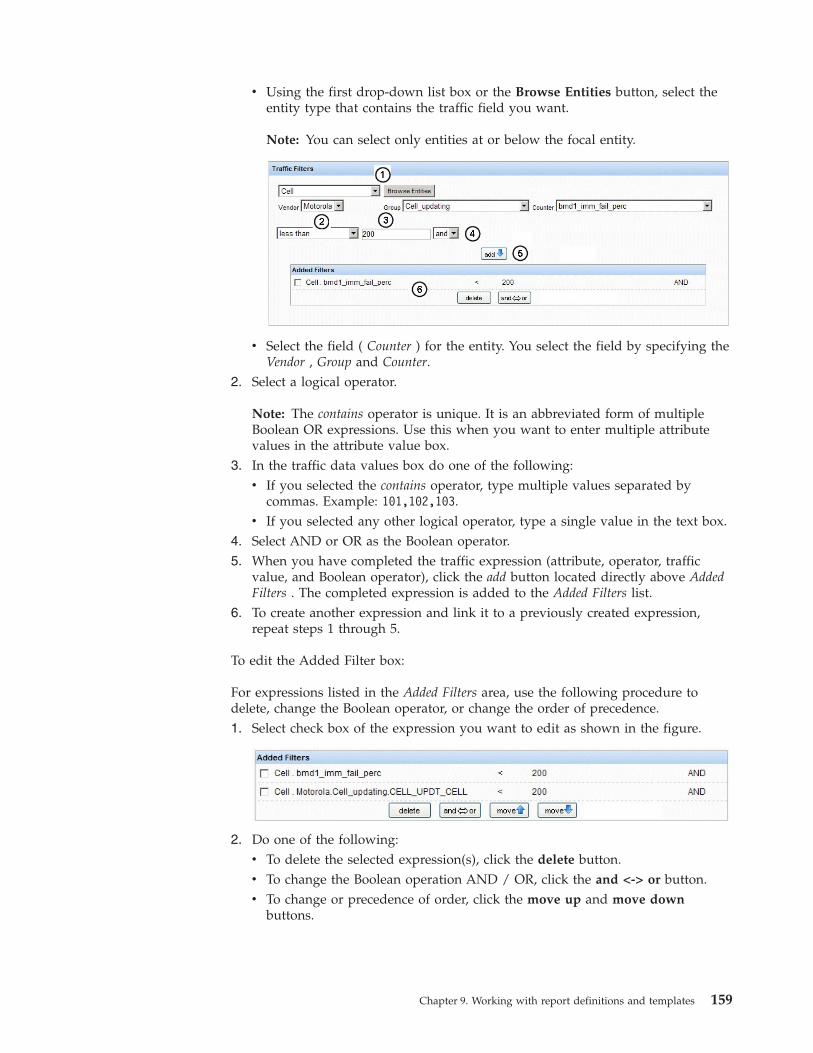
v Using the first drop-down list box or the Browse Entities button, select theentity type that contains the traffic field you want.
Note: You can select only entities at or below the focal entity.
v Select the field ( Counter ) for the entity. You select the field by specifying theVendor , Group and Counter.
2. Select a logical operator.
Note: The contains operator is unique. It is an abbreviated form of multipleBoolean OR expressions. Use this when you want to enter multiple attributevalues in the attribute value box.
3. In the traffic data values box do one of the following:v If you selected the contains operator, type multiple values separated by
commas. Example: 101,102,103.v If you selected any other logical operator, type a single value in the text box.
4. Select AND or OR as the Boolean operator.5. When you have completed the traffic expression (attribute, operator, traffic
value, and Boolean operator), click the add button located directly above AddedFilters . The completed expression is added to the Added Filters list.
6. To create another expression and link it to a previously created expression,repeat steps 1 through 5.
To edit the Added Filter box:
For expressions listed in the Added Filters area, use the following procedure todelete, change the Boolean operator, or change the order of precedence.1. Select check box of the expression you want to edit as shown in the figure.
2. Do one of the following:v To delete the selected expression(s), click the delete button.v To change the Boolean operation AND / OR, click the and <-> or button.v To change or precedence of order, click the move up and move down
buttons.
Chapter 9. Working with report definitions and templates 159

Selecting Non-Stored Busy Hour optionsSelect a non-stored busy hour to produce a report with the greatest value for anyperformance metric for a defined period of time (daily, weekly, monthly, or yearly).
About this task
You might need to adjust other parts of the report definition to work with yourselections in the Busy Hour section.
Note: Non-Stored Busy hours do not require data to be loaded for 100% of thehour. You cannot obtain non-stored busy hour data for a trending or stored busyhour report. Trending UDCs and stored busy hour fields are based on predefinedbusy hours.
Parts of the Busy Hour SectionThis topic explain the parts of the Busy Hour section and provide the proceduresfor selecting a busy hour.
The BUSY HOUR section displays a different set of options depending uponwhether you select to use stored or non-stored busy hours.
The non-stored Busy Hour section consists of two major sections:v Field Selection -- Allows you to select the cluster entity and criterion field
(busy hour performance indicator)v Filter Expressions -- Allows you to select a busy hour filter
Legend:
No. Description
1 Busy Hour -- Allows you to select a non-stored busy hour.
2 Group by -- Allows you to select the frequency of the busy hour report:daily, weekly, monthly, and yearly.
3 Field Selection -- Allows you to select the criterion field (busy hourperformance indicator) either by entering text or by selecting the entityfrom drop-down list boxes.
By Selection is the default value. Options for the By Text option are notshown in this graphic.
160 IBM Tivoli Netcool Performance Manager: User Guide

No. Description
4 Cluster Entity -- Lists the available selections for the cluster entity. Onlythe entities at the focal entity level and above are available.
5 Criterion entity -- Contains the entities from which you can select acriterion field (busy hour performance indicator).
6 Criterion field -- The traffic field (performance indicator) used todetermine busy-ness.
7 Field filter -- Allows you to reduce the number of selections in thecriterion field list box6.
8 Attribute selection for busy hour filtering -- The upper drop-down listbox lists the available entity types. The lower drop-down list box lists theattributes of the selected entity type.Note: You can only select attributes from entities at or above thecriterion entity (item 4). The Filter Expression defined here is used insteadof the Attribute filter defined in Step 5, Building a Filter are ignoredwhen the report is generated. Attribute filtering can only be achieved fora non-stored busy hour report by completing selections for the FilterExpression in this section.
9 Logical operator -- Creates an expression that yields a true or false value.The operator contains , which is unique, is an abbreviated form ofmultiple Boolean OR expressions.
10 Attributed value -- Specifies the individual entity instance or instances.
For example: Cell.cell_id = 100,200
11 more button -- Opens the Value Filter box (not shown), which lists all thevalues of the selected attribute (lower box 8 Figure 77).
12 Boolean Operator -- Links the expressions in the Added Filters areatogether using the AND and OR operators.
13 Added Filters area -- Lists the selected expressions and their order ofprecedence. See See Order of Precedence.
Provides the following buttons:
v delete -- Deletes the selected expression
v and <-> or -- Changes the Boolean operator of the selected expression
v move up / move down -- Moves the selected expression up or down inthe order of precedence.
Selecting a Non-Stored Busy HourUse the following procedure to select a non-stored busy hour for your report.
Note: You cannot obtain non-stored busy hour data for a trending or stored busyhour report. Trending UDCs and stored busy hour fields are based on predefinedbusy hours.
This procedure assumes the Reporting / define report page is open.
To select a non-stored busy hour:1. Under Optional: Extended Functions box edit button, click the edit button of
the Busy Hour box.The Busy Hour section opens. The default option is Non Stored Busy Hour .
2. From the Group by drop-down list box, select the frequency of the report:daily, weekly, monthly, or yearly.
Chapter 9. Working with report definitions and templates 161
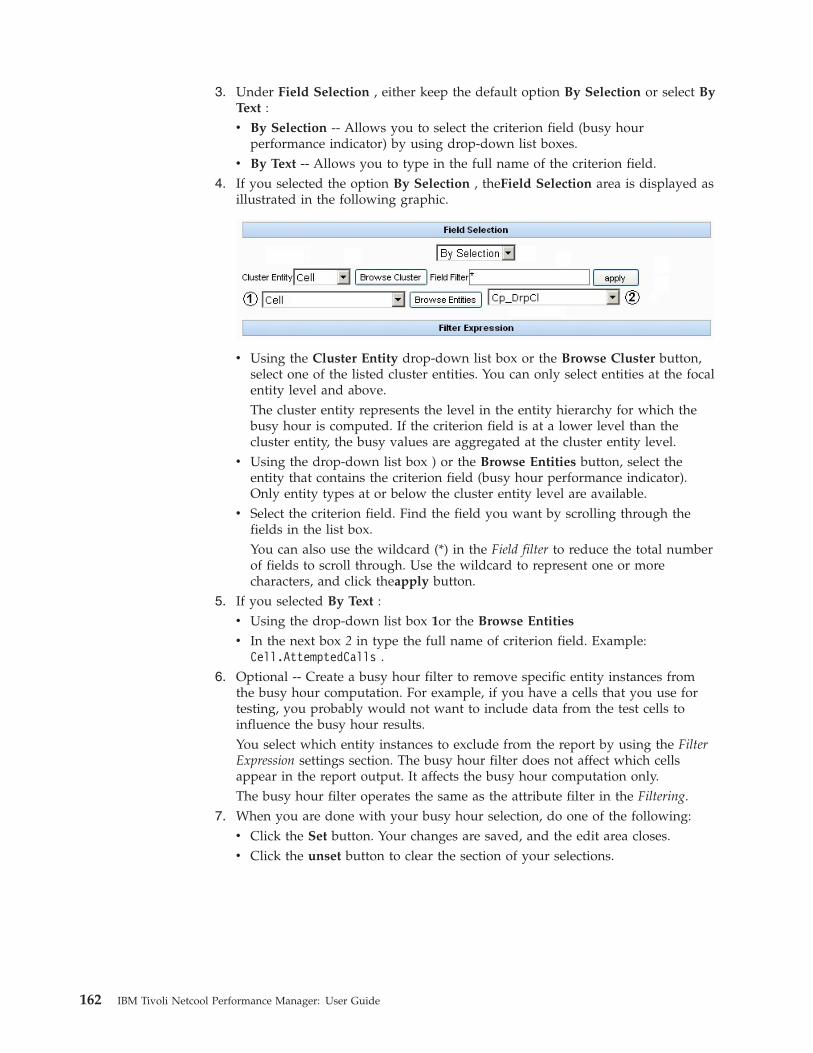
3. Under Field Selection , either keep the default option By Selection or select ByText :v By Selection -- Allows you to select the criterion field (busy hour
performance indicator) by using drop-down list boxes.v By Text -- Allows you to type in the full name of the criterion field.
4. If you selected the option By Selection , theField Selection area is displayed asillustrated in the following graphic.
v Using the Cluster Entity drop-down list box or the Browse Cluster button,select one of the listed cluster entities. You can only select entities at the focalentity level and above.The cluster entity represents the level in the entity hierarchy for which thebusy hour is computed. If the criterion field is at a lower level than thecluster entity, the busy values are aggregated at the cluster entity level.
v Using the drop-down list box ) or the Browse Entities button, select theentity that contains the criterion field (busy hour performance indicator).Only entity types at or below the cluster entity level are available.
v Select the criterion field. Find the field you want by scrolling through thefields in the list box.You can also use the wildcard (*) in the Field filter to reduce the total numberof fields to scroll through. Use the wildcard to represent one or morecharacters, and click theapply button.
5. If you selected By Text :v Using the drop-down list box 1or the Browse Entities
v In the next box 2 in type the full name of criterion field. Example:Cell.AttemptedCalls .
6. Optional -- Create a busy hour filter to remove specific entity instances fromthe busy hour computation. For example, if you have a cells that you use fortesting, you probably would not want to include data from the test cells toinfluence the busy hour results.You select which entity instances to exclude from the report by using the FilterExpression settings section. The busy hour filter does not affect which cellsappear in the report output. It affects the busy hour computation only.The busy hour filter operates the same as the attribute filter in the Filtering.
7. When you are done with your busy hour selection, do one of the following:v Click the Set button. Your changes are saved, and the edit area closes.v Click the unset button to clear the section of your selections.
162 IBM Tivoli Netcool Performance Manager: User Guide

Selecting Group By optionsGroup By options organize and aggregate traffic data in your reports. You can usethe default options or select your own.
Note: If you plan to select your own Group By options, you need to understandhow the Group By options work in relation to the other report definition sections.For more information, see “About the Focal Entity type” on page 130
This section explains the parts of the Group By section, lists the Group By defaultoptions, and provides the procedures for selecting Group By options.
Parts of the Group By sectionThe following figure shows the primary parts of the stored Group By section.
Figure 79: Group By Section
Legend:
No. Description
1 Group By -- Allows you to group traffic data by either attribute and time,or time and attribute.
2 Group by Time -- Allows you to select one or more time units for yourreport.
The Group by Time and Group by Attribute selections work together to createa hierarchy of totals. For more information, see See Attribute/Time andTime/Attribute.
If grouping over two intervals is selected which are not adjacent i.e. weekand hour, then the day will be added to ensure that the day each hourrelates to can be identified in the report results. If the Hour option isunchecked the sub hour cannot be checked, sub-hour intervals are onlymeaningful in relation to hour intervals.
3 Group by Attribute -- Allows you to select one or more attributes for yourreport.
Note: If an attribute KPI has been selected for the report during FieldSelections, that corresponds to a group by attribute, this will result in aduplicate column/field in the definition's report results.
Chapter 9. Working with report definitions and templates 163

No. Description
4 Attribute list box -- Shows the attributes selected in the Group ByAttribute box in the order they will appear in the report results.
Group By defaultsThe following bulleted list shows the default Group By options:v Group By - Attribute and Timev Group by Time - Dayv Group by Attribute - the ID attribute of the focal entity
There is sample output of a report produced using this selection in“Comprehensive granular” on page 98. This sample output also assumes that thereport definition does not employ any of the other extended functions, for examplebusy hours or ranking.
How to Select Group By optionsUse the following procedure to override the Group By defaults.
About this task
This procedure assumes the Reporting /define report page is open.
To select Group By options:1. As necessary, click edit button of the Optional: Extended Functions box, and
then the edit button of the Group By box.2. From the Group By drop-down list box, select to group traffic data by attribute
and time, or time and attribute. (For an explanation, see “Attribute/Time andTime/Attribute” on page 138.)
3. Under Group by Time , select one or more time units for your report byselecting or clearing the check boxes.
Note: The Group by Time and Group by Attribute selections work together tocreate a hierarchy of totals. For and explanation, seeSee About Hierarchy ofTotals.
4. Select the entity type whose attributes you want to group by, using theEntityList drop-down list box or the Browse Entities button.
5. Select one or more attributes from the Group by Attribute box (shown in thefollowing graphic).
164 IBM Tivoli Netcool Performance Manager: User Guide

v Select one or more attributes (box 1 in Figure 80) and click the add button.The selected attributes are displayed in the attribute list box (box 2 in Figure80).
v Set up the hierarchy, or order, of the attributes. Select an attribute (box 2 inFigure 80) and click the up and down move buttons to move the attribute upor down in the list.
v To delete an attribute, select an attribute (box 2 in Figure 80), and click thedelete button.
6. When you are done with your field selection, do one of the following:v Click the Set button. Your changes are saved, and the edit area closes.v Click the unset button to clear the section of your selections.
Selecting Ranking optionsAbout this task
The Ranking section of the report definition is used for basic Ranking reports andN-High Busy Hour reports. This section allows you to retain the top and bottomvalues of the data set, discarding all other values. For an explanation of Rankingreports and N-High Busy Hour reports, including examples, see “Ranking reporttypes” on page 113 and “N-High Busy Hour report types” on page 115,respectively.
Note: Selecting ranking options for a stored busy hour report is not required.Ranking is determined by the stored busy hour definition.
Use the following procedure to create a ranking report. This procedure assumesthe Reporting /define report page is open.
To select ranking options:1. UnderOptional: Extended Functions box, click theedit button of the Ranking
box.The Ranking section opens as shown in the following graphic.
Chapter 9. Working with report definitions and templates 165

2. Select to retain either the TOP or BOTTOM data values box 1.3. Type two integer values, which represent the number of values you want to
retain box 2.Example: TOP from 1 to 3. This example retains the top three values.Example: BOTTOM from 2 to 3. This example retains the second and thirdlowest values.
4. Select the traffic field you want to use as the basis of ranking box 3.5. In the by list box (box 4 select the attribute you want to group by. The options
are Nothing and the attributes of entities at or above the focal entity.6. In the group by list box 4.7. When you are done with your field selection, do one of the following:
v Click theSet button. Your changes are saved, the page refreshes, and the editarea closes.
v Click the edit button of another extended function, or click therun button torun the report. Your changes are automatically saved.
Selecting Filtered N-High options
Note: Filtered N-High options are not supported for trending reports or storedbusy hour reports.
This section of the report definition allows you to create a filtered N-High report.For an explanation of the options shown in the Filtered N-High section, see“Keyterms for filtered N-High reports” on page 123. For an overview of filtered N-Highreports, see “Filtered N-High Busy Hour reports” on page 122.
Selecting the Rehoming optionThe Rehoming section of a report definition is used for the generation of a reportusing data collected from network elements that have previously beenrehomed/reparented. When the rehoming option is not selected only data for thelatest network configuration is included in the report.
Note: Selecting rehoming is not required for trending or stored busy hour reports.Rehoming events are automatically included in these report types.
Note: If an attribute (nc KPI), which is a non-time series KPI, is configured asnon-rehoming, any new value will automatically replace the previously storedvalue. This means that:v Re-running a report for the same time period may display a new value if the
underlying value has changed since the report was last run.v Running a report over a long period of time will only ever show one value for
one such attribute (always the latest one), even if the value has changed in thepast.
One important use for rehomed data is for forecasting. For example, if you want toplan the future capacity of a BSC using CELL traffic information based on thecurrent CELL - BSC relationships, but some of the current child CELLs have onlybeen introduced to the BSC in the recent past, then you may want to run thereport as if current network configuration was the same for the whole reportingperiod. In this case you would want include "rehomed" data: data from when theCELLs were parented under a different BSC during the reporting period.
166 IBM Tivoli Netcool Performance Manager: User Guide

RestrictionsRestrictions that are applied to rehoming in Tivoli Netcool Performance Manager.
About this task
The following restrictions apply to rehoming in Tivoli Netcool PerformanceManager:v Tivoli Netcool Performance Manager supports rehoming only at a single entity
level. Any instance below this level is considered to have been rehomed if itsancestor was rehomed. Multi-level rehoming is not supported: You can rehomeat one specific entity level in a network and not a combination of entity levels.
v Data Availability Tools continue to represent data as it was recorded.
To select the Rehoming option, follow these steps:
Procedure1. Click the edit button to open the Optional: extended Functions section of the
report as necessary. The report section opens as shown in the followinggraphic.
2. Click the Include re-homed data check box to either check or clear the optionfor the report definition.If rehoming is checked, true is displayed in the Optional: extended Functionssection. If rehoming is cleared, false is displayed.
Chapter 9. Working with report definitions and templates 167

Selecting the Confidence Factor optionA confidence factor is indicates whether all, most, or only some of the traffic datarequired is available. A confidence factor can be represented as a percentage or asthe number of intervals loaded, or both.
About this task
As an example of a percentage confidence factor:
A confidence factor of 100 percent means that all the data required was available.Conversely, anything under 100 percent means that data was missing. The lowerthe confidence factor, the more data that is missing, and the higher the likelihoodthat the validly of your reports is being compromised.
Note: A confidence factor cannot be calculated for trending reports or stored busyhour reports.Confidence factors can be calculated from "normalized" data - loaded data, ordirectly from "raw" data - performance data.
To select the Confidence Factor option, follow these steps:
Procedure1. Click the Edit button to open the Optional: extended functions section of the
report as necessary. The report section opens as shown in the followinggraphic.
2. Click the Confidence Factor check box to either select or clear the option forthe report definition.
3. Click the Save button (see “Running an Immediate Report” on page 170).
Creating a report definition by using a templateYou can create a report definition using a report definition template.
About this task
A template defines the datasource, entity type and fields to be used for a reportdefinition. As a minimum you must also define a date time selection to be used forthe report definition.
To create a report definition using a template:1. Open the template, see “Opening a report definition template” on page 180.
The template opens in the define report page, with the datasource, entity typeand fields defined.
2. Click the Edit button in Step 3: Field Selections.3. You can modify the field selections if required, see “Selecting fields” on page
144.4. Click the Next button in Step 3: Field Selections.5. Define a date time selection, see “Making a calendar Date-Time selection” on
page 152.
168 IBM Tivoli Netcool Performance Manager: User Guide

6. Complete the report definition, you can optionally:v Build a filter, see “Building a filter” on page 154v Select busy hour options, see “Selecting Non-Stored Busy Hour options” on
page 160.v Select group by options, see “Selecting Group By options” on page 163.v Select ranking options, see “Selecting Ranking options” on page 165.v Select ranking n-high options, see “Selecting Filtered N-High options” on
page 166.You can run an immediate report, see “Running an Immediate Report” onpage 170.
7. Save the report definition, see “Saving a report definition.”
Saving a report definitionUse the following procedure to save the current settings of a report definition.
About this task
The following procedure assumes you are in the define report page and the reportdefinition settings are ready to be saved.
To save a report definition, follow these steps:
Procedure1. Click the save button. The save report box is displayed on the right side of the
page. If you are saving an existing report, the information you saved it withpreviously is displayed.
2. In the Report Name text box, type the name of the report definition. This is thename that will be listed in the Browse tab for future retrieval.
Note: The name must be unique. No other documents in the folder can havethe same name.
3. In the Description text box, type enter a statement that will help you rememberthe content, or settings, of the report definition.
4. From the Type drop-down list box, select Report Definition.If you wish to save the Report Definition as a template, select Report Template.Only the Data Source, Entity Type and Fields that you have defined will besaved. See “Creating a report definition template” on page 179.
5. Save the report definition to the default folder (as shown on the screen), orsave it to another folder. To save the report definition to another folder, do thefollowing:a. From the first Location list, select to save the report definition in the
personal documents page or the vault page.b. From the first Folder list, select the folder you want to save the page to. The
page is refreshed, and all the documents in that folder are listed in the boxbelow.
Note: If you are saving to the vault page, the read and write permissions ofeach folder is shown. Example: (r/w) means that the folder has both readand write permissions.When you save to the vault page, the report definition is automaticallysaved with the default read and write permissions.
Chapter 9. Working with report definitions and templates 169

6. Select a default folder for the definition's report results:a. From the second Location list, select a default location for the report results:
the personal documents page or the vault page.b. From the second Folder list, select the default folder for report results.
7. Click thesave button.
Running an Immediate ReportUse this procedure to run a report immediately.
About this task
The following procedures assume you have opened the report definition that youwant to run a report for. To open a report, see See Opening a Report Definition.
To schedule the report to run at a future time, see Chapter 10, “Scheduling areport,” on page 183.
You can:v To run an immediate report unchangedv To run an immediate report with changed filtering or dates
To run an immediate report unchanged:1. Click the run button. The report output box is displayed on the right side of
the page.2. In the Name text box, enter the name of the report definition.3. Save the report results to the default folder (as shown under Report results
stored in ), or save it to another folder. To save it to another folder, do thefollowing.
Note: The document name must be unique. No other documents in the foldercan have the same name.v Click the edit button under Report results stored in. The page refreshes, and
the edit options become availablev From the Report results stored in list, select to save the results in the
personal documents page or the vault page.v From the folder list box, select the folder you want. The page is refreshed,
and all the available documents are listed in the box below.
Note: If you are saving to the vault page, the read and write permissions ofeach folder is shown. Example: (r/w) means that the folder has both readand write permissions (see “Document and folder permissions” on page 55).When you save to the vault page, the report results are automatically savedwith default read and write permissions (see “User and group permissions”on page 69).
v Click the set button. The page is refreshed, and the edit options are nolonger displayed.
4. Optional -- Use the auto-organizing feature to automatically organize reportoutput. For an explanation, see “Auto-organizing reports results” on page 66Global auto-organizing variables can be set in the Preferences tab. In this case,you will see the default variables in the Auto-organize report output box.v Click the edit button under Auto-organize report output .
170 IBM Tivoli Netcool Performance Manager: User Guide

v Enter or edit variables. For a list of variables you can use, see“Auto-organizing variables” on page 67.
v When you are done, click the set button.The changes you make override any default auto-organizing variables in thePreferences page.
5. To run the report definition, do one of the following:v Click the run report and wait button - If you select this option, the define
report page is replaced with a confirmation page, informing you that thereport is being generated. When the report is generated, the report results aredisplayed in separate browser window, and you are returned to the definereport page.
v Click the run report in background button - If you select this option, thereport output box is removed from the define report page. A message isdisplayed at the top-left of the page, informing you that the report is beinggenerated in the background and giving the location folder where you canfind the report results.
v Click the cancel button - If you select this option, the report output box isremoved from the define report page.When a report definition is run, the report is queued with other reportswaiting to be generated. For more information about the report generationprocess, see “Report generation process” on page 77.
Note: It is also possible to view exported report results. See “Exportingreports” on page 73
To run an immediate report with changed filtering or dates, follow these steps:1. Click the Filter & run button. The Filter and Run Report dialog is displayed.
The Attribute Filter is set at the attribute's ID, for example Cell ID. You canselect Id , Name or another associated entity to filter on.You can select Vendor and Technology to filter on, use Ctrl+Click to select thevendors and technologies required. A selection for Vendor and Technology ismandatory.You enter attribute values you want to include in the report in the Filter box,for example Cell IDs. You can enter as many values as required. Type the firstcharacters of the attribute in the Filter box to display a list of matching values.Select the values you require.
Click the button to de-select a value.
Chapter 9. Working with report definitions and templates 171

2. Select the dates you want to include in the report. See “Making a calendarDate-Time selection” on page 152 for more information.
3. Click the Run button in the Filter and Run Report dialog to run the report.The report is displayed in a separate window, see “Types of report views,downloads, and exports” on page 20, for more information.
4. To save the report definition from the main Report window, click the Savebutton, see “Saving a report definition” on page 169.
Running a report by using the KPI BrowserThe KPI Browser is used to quickly produce reports for KPIs. It does not supportall of the functionality in a fully defined report.
About this task
To produce a report using the KPI Browser:
Procedure1. Click the Reporting tab to open the Reporting page.2. Click the KPI Browser tab.
The KPI Browser Options dialog is displayed.
3. Select the counters and options you require and run the report.Tooltips are available for different parts of the dialog. For example, detaileddescriptions of KPIs in the KPI Selection box are available as tool tips.See the Administering Tivoli Netcool Performance Manager - Wireless Component, forinformation on configuring tool tips for the KPI Browser.Legend:
172 IBM Tivoli Netcool Performance Manager: User Guide

No. Description
1 Global Filter - Allows you to apply a filter to network resources. You canfilter by Vendor, Technology and Entity. You must make at least oneselection per filter. Use Ctrl + Click to make multiple selections per filter.Only those resources that match the filter will be available for selection.
When filtering by vendor:
v if only Neutral is selected then all network resources for all vendors areavailable.
v if non-neutral vendors are selected then only network resources for thosevendors are available.
v if Neutral is combined with one or more other non-neutral vendors, thennetwork resources for vendor neutral and the selected non-neutralvendors are available.
2 Resource Selection - Allows you to select one or more network resourcesthat match the global filter. For example, cells. You can select up to 20resources.
Select the resources you want to include in the report in the resourceselection box. For example, select Cell IDs. You can select up to 20 resources.To select resources type some matching characters in to the resourceselection box to display a list of matching values. For example, typing Cewill return a list of all cells with IDs that begin with Ce .
You can use wildcards in your entry. Wildcards can be used at the end of anentry, the beginning of an entry, or to contain a string of characters. Forexample for cell IDs:
v Typing cell1* will return a list of all cells with an ID beginning with cell1 .
v Typing *Nok7 will return a list of all cells with an ID ending in Nok7.
v Typing *Nok* will return a list of all cells with IDs that contain the Nok.
Typing only a wildcard or a space will return all values.
Select the values you require. Click for the appropriate value.
The order of a selection can be changed by dragging a selection to adifferent position. The report will reflect the selection order .
Chapter 9. Working with report definitions and templates 173

No. Description
3 Select KPI - Allows you to select one or more KPIs for the report. You canselect up to 20 KPIs.
v Standard or Alias . Select KPIs using the Standard or Alias namingconventions. Standard uses the system's standard KPI naming convention.Alias uses a 'friendlier' user-created naming convention. If Alias is selectedand a KPI has no alias, the KPI is still available for selection. In this case ared square is used to indicate a KPI has no alias. A green circle is used toindicate a KPI has an alias.
v
See the Administering Tivoli Netcool Performance Manager - WirelessComponent, for more information on KPI aliases.
v Field Interval. Select the data type or data interval. Raw , raw data fromthe network resource. Daily Weekly, or Monthly summarized or storedbusy hour data.
v Field Type . Select the field type. Peg , Primitive Calc, or UDC for rawdata. Summary or SBH for Daily Weekly, or Monthly data intervals. See“Traffic fields” on page 89 for more information on field types.
v SBH. For SBH field types. Select the stored busy hour.
v Group . Select the KPI group. Each KPI is a member of a KPI group. Forexample, a group called Traffic may contain a number of TCH transactionKPIs.
v KPI Selection. Select the KPIs you want to include in the report in the KPIselection box. You can select up to 20 KPIs.
v
Type the first characters of the KPI in to the KPI selection box to displaya list of matching values. You can use a wildcard at any point in yourentry. For example, type tch_s* to return a list of KPIs beginning withtch_s, such as tch_seiz_attmps.
You can also use wildcards in your entry. Wildcards can be used at theend of an entry, the beginning of an entry, or to contain a string ofcharacters. For example for cell IDs:
Typing tch* will return a list of all KPIs beginning with tch.
Typing *seiz will return a list of all cells with an ID ending in seiz
Typing *seiz_A* will return a list of all cells with IDs that contain theseiz_A.
Typing only a wildcard or a space will return all values.
Select the KPIs you require. You can de-select a value by clicking forthe appropriate value.
The order of a selection can be changed by dragging a selection to adifferent position. The report will reflect the selection order.Note: When you open the KPI browser in Firefox 17, the following issuesoccur:
v The browser does not display full string of the cell ID.
v You can select only one cell ID at a time.
v The output KPI selection box does not display the complete KPI name.
v After you select cell ID or KPI name, you cannot delete it. You must selectthe entity again to clear the previous selection.
Therefore, it is suggested that you use Internet Explorer to access KPIbrowser.
174 IBM Tivoli Netcool Performance Manager: User Guide

No. Description
4 Time scoping - Period of the report. The Time intervals available aredetermined by the Field Interval that has been selected. The possibleminimum and maximum values for Range are determined by the FieldInterval and the Time selected. See “Reporting period.”
Time - Hour, Day, Week, Month.
Range - 1-336.
Include Current® - Include the current Hour, Day, Week, Month.
Group By - Group report data by time period. Time periods available aredetermined by the Field Interval that has been selected.
v Raw - Hour, (and 15 mins, only if 15 minute intervals are enabled)
v Daily - Hour, Day
v Weekly - Week
v Month - Month
5 Format - The format of the graph.
Graph - Select the type of graph to use in the report.
Order By - Order the report by KPI or network resource.
Run Report - Run the report.
Reporting periodDepending on the type of KPIs in the report different reporting intervals arepossible. The following table describes the intervals that can be used.
Table 56. Reporting intervals
KPI field - sourcetype Options Minimum and Maximum Intervals
Peg or PCalc Last n hours or days. Minimum interval - 1 hour.
Maximum interval - 14 days. Scoping overmore than one day can return a highnumber of rows.
Daily summary, DailyBusy Hour.
Last n days orweeks.
Minimum interval - 1 day.
Maximum interval - 4 weeks.
Weekly summary,Weekly Busy Hour
Last n weeks. Minimum interval - 1 week.
Maximum interval - 8 weeks.
Monthly summary,Monthly Busy Hour
Last n months. Minimum interval - 1 month.
Maximum interval - 12 months.
Hierarchy Depends on theinterval of the otherKPIs included in thereport.
Chapter 9. Working with report definitions and templates 175

KPI Browser toolbarUse the toolbar to adjust the report's display and to print the report.
Legend:
No. Description
1 Menu Dialog - Displays/hides the Report Options dialog.
Enable/Disable 3D graph - Enable or disable the 3D graph view.
Enable/Disable Legend - Hide or display graph legends.
Enable/Disable Tooltips - Hide or display graph Tooltips.
Update Graph Grid Layout - Select the number of graphs to display alongeach of the x and y axis.
Print - Opens a window from which you can print the report.
2 Graph - Change the graph format.
3 Order By - Order the report by network Resource or KPI.
4 KPI/Resource - Depends on the Group By selection. Where a number ofgraphs are displayed, you can locate the graph for a KPI or Resource byselecting the KPI or Resource from the drop-down list box. Alternatively,browse to the next/previous KPI or Resource using the arrow buttons.
Running a report from the command lineYou can also run a report using the report_run command line tool. Ask yoursystem administrator for more information about command line tools.
Instructions for running a report from the command line can be found in theAdministering Tivoli Netcool Performance Manager - Wireless Component.
Opening a report definitionAbout this task
Use this procedure to open a report definition. This procedure offers instructionsfor opening a report definition from either the Reporting tab or the Browse tab.
To open a report definition from the Reporting tab:
Procedure1. Click the Reporting tab, and then click manage report. The folders to which
you have access become available.2. From the Type list, select Report Definition.3. From the Repository list, select:
personal documents for a private document, orvault for a public document
176 IBM Tivoli Netcool Performance Manager: User Guide
4. From the folder list, select the folder that contains the report definition. The listbox below lists all the documents in the folder.
5. Select the report from the list box and click the open report button. The reportdefinition opens in the define report page.To open a report definition from the Browse tab:a. Do one of the following:
v Click the Browse tab, and then click personal documentsfor privatedocuments.
v Click the Browse tab, and then click vault for published documents.b. In the folder tree, find the folder which holds the report definition.c. Click Report Definition . The report definitions are displayed.d. Click the report name. The report definition opens in the define report page.
Editing a report definitionEditing can be as simple as changing a single setting in the report definition.However, editing becomes more complex if the settings you are changing havedependencies elsewhere in the report definition. Because these dependencies areprogrammed into the define report page, the program automatically clears thedependent settings from the report definition.
About this task
You can safely make the following changes, without affecting any other settings inthe report definition:
Table 57. Changes With No Dependencies
Task Reporting Step
Add and / or delete fields (performancemeasurements) from the report
Field SelectionField Selections
Change the time period.
For example, you may want data from thelast three days instead of the last two days.
Date-Time Selection
Expand or reduce the entity instances(network elements) you want in the report.
For example, you may want to see threeadditional cells in your report that are notcurrently included.
Filtering
Note: The optional, extended features are intermediate to advanced features. Youshould understand how these options function before attempting to edit them.
Important: If you edit any other settings in the report definition, all other settingsare lost, and you will need to re-enter them
To edit a report definition, follow these steps:
Procedure1. Open a report definition. See for instructions “Opening a report definition” on
page 176.
Chapter 9. Working with report definitions and templates 177

2. Make your edits. The instructions for making the type of changes listed inTable are in the define report page itself.
3. Save your changes. See “Saving a report definition” on page 169 forinstructions.
Deleting a Report DefinitionAbout this task
Use this procedure to delete a report definition. This procedure offers instructionsfor deleting a report definition from either the Reporting tab or the Browse tab.
Note: You cannot delete a report definition that is part of a schedule. You mustfirst remove the report definition from the schedule, before you can delete it.
To delete a report definition from the Reporting tab
Procedure1. Click the Reporting tab, and then manage report. The folders to which you
have access become available.2. From the Type list, select Report Definition.3. From the Repository list, select:
personal documents for a private document, orvault for a public document
4. From the folder list, select the folder that contains the report definition. The listbox below lists all the documents in the folder.
5. Select the report from the list box and click the delete button. A message boxprompts you to confirm the deletion. Click theyes button to complete thedeletion.Click no to cancel the deletion.To delete a report definition from the Browse tab:a. Do one of the following:
v Click the Browse tab, and then personal documents for privatedocuments.
v Click the Browse tab, and then vault for public documents.b. In the folder tree, find the folder which holds the report definition.c. Click Report Definition . The report definitions are displayed.d. Select the check box of the report definition(s) of choice, and from the
Select Action list box select Delete item(s).e. A message box prompts you to confirm the deletion. Click the delete button
to complete the deletion. Click cancel to cancel the deletion.
178 IBM Tivoli Netcool Performance Manager: User Guide
Report definition templatesA report definition template pre-defines the datasource, entity type and fields to beused for a report definition.
When a template is used to create a report definition, the user must complete theremaining steps in the creation of the report definition. A number of pre-definedtemplates may already exist depending on how your system has been configured.Templates are accessed from the Browse tab. See Chapter 5, “Browsing reports andother documents,” on page 53. You can define any number of new templates.
Creating a report definition templateAbout this task
To define a template, follow these steps:
Procedure1. Select a Datasource, see “Selecting a data source” on page 140.2. Select a Focal Entity Type, see “Selecting a Focal Entity type” on page 141.3. Select Fields, see “Selecting fields” on page 144.4. Save the template, see “Saving a report definition template.”
Saving a report definition templateUse the following procedure to save the current settings of a report definitiontemplate.
About this task
This procedure assumes you are in the Define Report page and the reportdefinition template settings are ready to be saved.
To save a template, follow these steps:
Procedure1. Click the save button. The save template box is displayed on the right side of
the page.2. In the Template Name text box, type the name of the template. This is the
name that will be listed in the Browse tab for future retrieval.
Note: The name must be unique. No other documents in the folder can havethe same name. If you are editing a template the name can remain unchanged.
3. In the Description text box, enter a statement that will help you remember thecontent, or settings, of the report template.
4. Save the report template to the default folder (as shown on the screen), or saveit to another folder. To save the report definition to another folder, do thefollowing:From the Location list, select to save the report template in the personaldocuments page or the vault page.From the Folder list, select the folder you want to save the template to. Thepage is refreshed, and all the documents in that folder are listed in the boxbelow.
Chapter 9. Working with report definitions and templates 179

Note: If you are saving to the vault page, the read and write permissions ofeach folder is shown. Example: (r/w) means that the folder has both read andwrite permissions (see “Document and folder permissions” on page 55.When you save to the vault page, the template is automatically saved with thedefault read and write permissions (see “Read and write permissions” on page56.
5. Click the save button.
Opening a report definition templateUse this procedure to open a report definition template. This procedure offersinstructions for opening a template from either the Reporting tab or the Browsetab.
About this task
To open a template from the Reporting tab, follow these steps:1. Click the Reporting tab, and then click manage report. The folders to which
you have access become available.2. From the Type list, select Report Definition Template.3. From the Repository list:
Select personal documents for a private documentor,Select vault for a public document
4. From the folder list, select the folder that contains the template. The list boxbelow lists all the documents in the folder.
5. Select the template from the list box and click the open button. The templateopens in the define report page.
To open a template from the Browse tab:1. Do one of the following:
Click the Browse tab, and then click personal documents for privatedocumentsor,Click the Browse tab, and then click vault for published documents.
2. In the folder tree, find the folder that holds the template.3. Click Report Templates. The report templates are displayed.4. Click the template name. The template opens in the define report page.
Editing a report definition templateAbout this task
Use this procedure to edit a report definition template.
Note: You cannot edit or delete pre-defined report definition templates.
To edit a template, follow these steps:
Procedure1. Open the template. See “Opening a report definition template.”2. Make your edits, you can make changes to:
180 IBM Tivoli Netcool Performance Manager: User Guide
a. The datasource, see “Selecting a data source” on page 140.b. The focal entity type, see “Selecting a Focal Entity type” on page 141.c. Field selections, see “Selecting fields” on page 144.
3. Save your changes, see “Saving a report definition template” on page 179 forinstructions.
Deleting a report definition templateAbout this task
Use this procedure to delete a report definition template. You can delete a templatefrom either the Reporting tab or the Browse tab.
Note: You cannot edit or delete pre-defined report definition templates.
To delete a template from the Reporting tab:
Procedure1. Click the Reporting tab, and then click manage report . The folders to which
you have access become available.2. From the Type list, select Report Template.3. rom the Repository list, select:
personal documents for a private document or vault for a public document.4. From the folder list, select the folder that contains the template you want to
delete. The list box below lists all the documents in the folder.5. Select the template from the list box and click the delete button. A message box
prompts you to confirm the deletion. Click the yes button to complete thedeletion.To delete a template from the Browse tab:a. Click the Browse tab.b. Click personal documents for a private document, or click vault for a
public document.c. In the folder tree, find the folder which holds the template you want to
delete.d. Check the check box of the report template(s) you want to delete.e. From the Select Action list select Delete Item(s).f. A message box prompts you to confirm the deletion. Click the delete button
to complete the deletion.
Chapter 9. Working with report definitions and templates 181

182 IBM Tivoli Netcool Performance Manager: User Guide
Chapter 10. Scheduling a report
You can schedule to run a report at a predetermined date and time by creating aschedule entry. The following sections provide a definition of a schedule entry, anoverview of the schedule page, and instructions for creating and setting up areport schedule.
You can also run an immediate, or ad-hoc, report. See “Running an ImmediateReport” on page 170.
What is a schedule entry?A schedule entry contains all the settings required to run a report at apredetermined time. With a schedule entry, you can schedule a report run with afixed end date or without an end date. The schedule entry is a document type andas such has its own virtual folder.
© Copyright IBM Corp. 2006, 2015 183
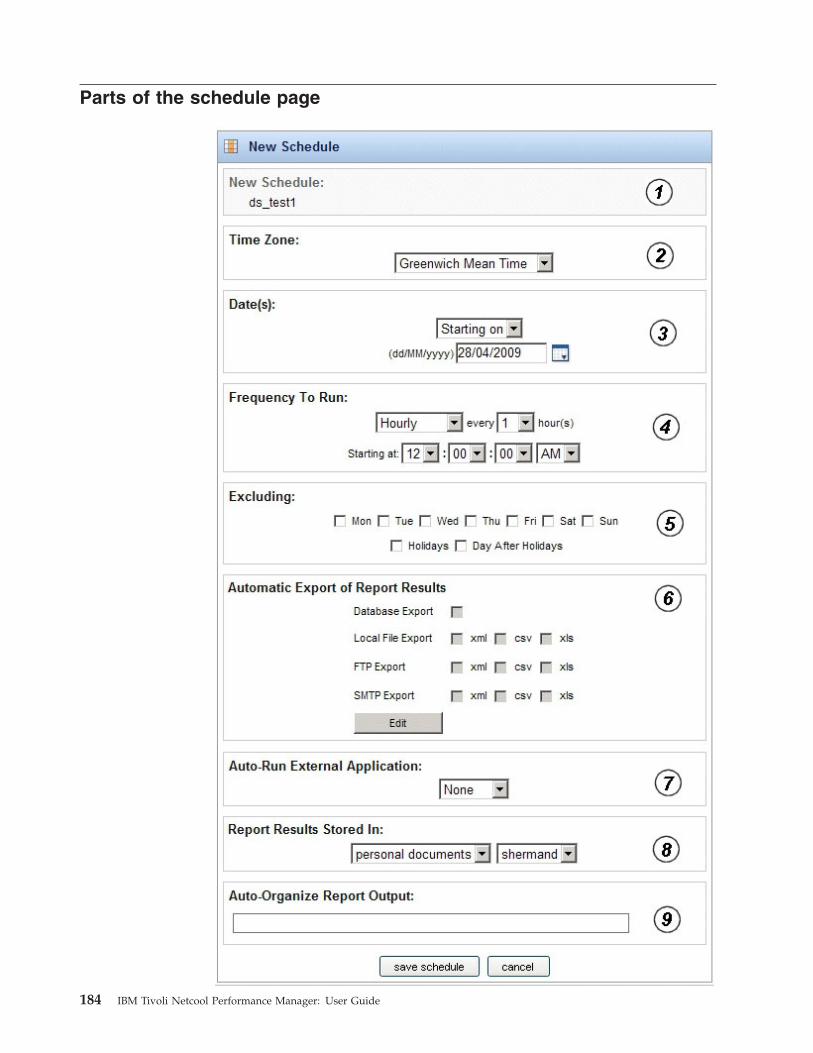
Parts of the schedule page
184 IBM Tivoli Netcool Performance Manager: User Guide
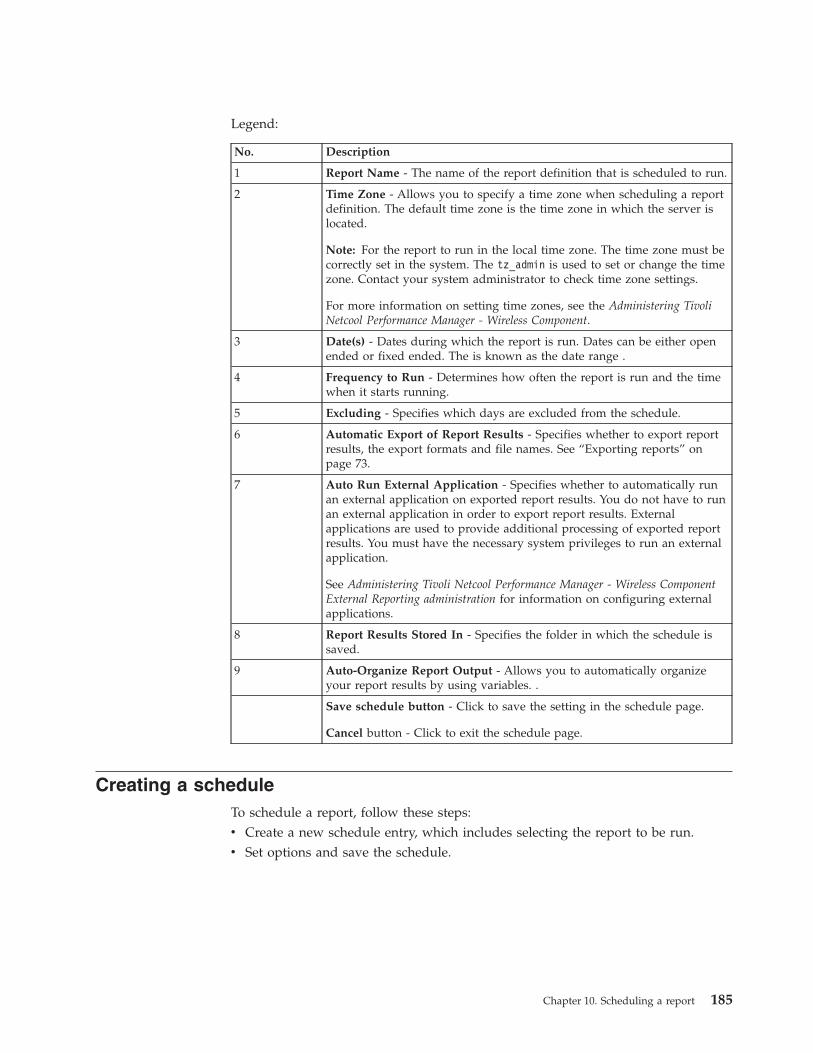
Legend:
No. Description
1 Report Name - The name of the report definition that is scheduled to run.
2 Time Zone - Allows you to specify a time zone when scheduling a reportdefinition. The default time zone is the time zone in which the server islocated.
Note: For the report to run in the local time zone. The time zone must becorrectly set in the system. The tz_admin is used to set or change the timezone. Contact your system administrator to check time zone settings.
For more information on setting time zones, see the Administering TivoliNetcool Performance Manager - Wireless Component.
3 Date(s) - Dates during which the report is run. Dates can be either openended or fixed ended. The is known as the date range .
4 Frequency to Run - Determines how often the report is run and the timewhen it starts running.
5 Excluding - Specifies which days are excluded from the schedule.
6 Automatic Export of Report Results - Specifies whether to export reportresults, the export formats and file names. See “Exporting reports” onpage 73.
7 Auto Run External Application - Specifies whether to automatically runan external application on exported report results. You do not have to runan external application in order to export report results. Externalapplications are used to provide additional processing of exported reportresults. You must have the necessary system privileges to run an externalapplication.
See Administering Tivoli Netcool Performance Manager - Wireless ComponentExternal Reporting administration for information on configuring externalapplications.
8 Report Results Stored In - Specifies the folder in which the schedule issaved.
9 Auto-Organize Report Output - Allows you to automatically organizeyour report results by using variables. .
Save schedule button - Click to save the setting in the schedule page.
Cancel button - Click to exit the schedule page.
Creating a scheduleTo schedule a report, follow these steps:v Create a new schedule entry, which includes selecting the report to be run.v Set options and save the schedule.
Chapter 10. Scheduling a report 185
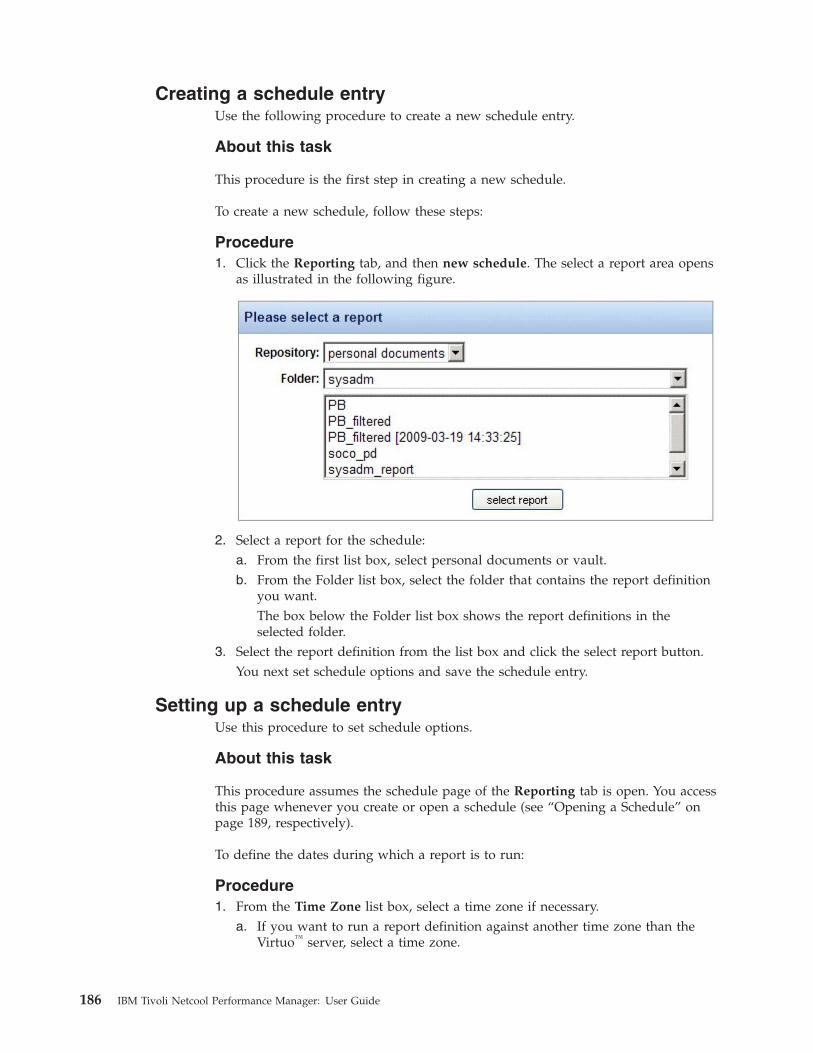
Creating a schedule entryUse the following procedure to create a new schedule entry.
About this task
This procedure is the first step in creating a new schedule.
To create a new schedule, follow these steps:
Procedure1. Click the Reporting tab, and then new schedule. The select a report area opens
as illustrated in the following figure.
2. Select a report for the schedule:a. From the first list box, select personal documents or vault.b. From the Folder list box, select the folder that contains the report definition
you want.The box below the Folder list box shows the report definitions in theselected folder.
3. Select the report definition from the list box and click the select report button.You next set schedule options and save the schedule entry.
Setting up a schedule entryUse this procedure to set schedule options.
About this task
This procedure assumes the schedule page of the Reporting tab is open. You accessthis page whenever you create or open a schedule (see “Opening a Schedule” onpage 189, respectively).
To define the dates during which a report is to run:
Procedure1. From the Time Zone list box, select a time zone if necessary.
a. If you want to run a report definition against another time zone than theVirtuo™ server, select a time zone.
186 IBM Tivoli Netcool Performance Manager: User Guide

Note: The time stamp of the report output is always that of the Virtuoserver regardless of any Time Zone selection. The report will be run at thetime specified for the time zone selected.
b. If you want to use the time zone in which the Virtuo server is located, usethe default time zone.
2. In the Date(s) box, specify whether you want to run a report with or withoutan end date.
3. To run a report without an end date:4. To run a report with an end date:
a. From the Date list box, select date range.b. Enter a starting date
Type a date in the left text box (beneath the Date list.OrClick the calendar icon and select a date
c. Enter an ending date.Type a date in the right text box (beneath the Date list boxOrClick the calendar icon and select a date.
Example scheduleThe following example shows a schedule for a report Rep2 , which will be run onGMT starting 28th April 2009. The report will be run every hour. The report willnot be run on Thursdays.
The output of the report will be saved to the folder /USERS/<USERID>/<SUB-FOLDERS>. For example in the scenario below: /USERS/sysadm/
Chapter 10. Scheduling a report 187

188 IBM Tivoli Netcool Performance Manager: User Guide

Opening a ScheduleUse this procedure to open a schedule from either the Reporting tab or the Browsetab.
About this task
To open a schedule entry from the Reporting tab:1. From the Folder list box, select a folder. The box below lists the schedule
entries in the folder.2. Select a schedule entry and click open schedule .3. Edit the current settings as necessary “Setting up a schedule entry” on page
186).
To open a schedule from the Browse tab:1. Do one of the following:
v Click the Browse tab, and then personal documentsfor your privatedocuments.
v Click the Browse tab, and then vault for published documents.2. In the folder tree, find the folder that contains the schedule entry.3. Ensure that the schedule entry is displayed on the contents pane. See “Finding
a document or folder in the Browse tab” on page 59 for instructions.4. Place the cursor over the schedule name. The name is underlined.5. Click the report name.6. Edit the current settings as necessary “Setting up a schedule entry” on page
186.
Procedure1. Click the Reporting tab, and then open schedule . The select schedule box
opens on the page.2. Under Please select a schedule , select personal documents or vault.
Deleting a scheduleAbout this task
Use this procedure to delete a schedule entry from either the Reporting tab or theBrowse tab.
To delete a schedule entry from the Reporting tab:1. Click the Reporting tab, and then manage schedule. The select schedule box
opens on the page.2. Under Please select a schedule , select personal documents or vault.3. From the Folder list, select a folder. The box below lists the schedule entries in
the folder.4. Select a schedule entry and click delete . You are asked to confirm the deletion.
Click yes to complete the deletion.
To delete a schedule entry from the Browse tab:1. Do one of the following:
Chapter 10. Scheduling a report 189

v Click the Browse tab, and then personal documents for your privatedocuments.
v Click the Browse tab, and then vault for published documents.2. In the folder tree, find the folder that contains the schedule entry.3. Ensure that the schedule entry is displayed in the contents pane. See“Finding a
document or folder in the Browse tab” on page 59 for instructions.4. Select the check box for the schedule entry.5. Select Delete Item(s) from the Select Action list box. You are asked to confirm
the deletion. Click Delete to complete the deletion.
190 IBM Tivoli Netcool Performance Manager: User Guide

Chapter 11. Alarm Viewer
The Alarm Viewer is used to view performance alarms.
There are two enhancements to alarms in Tivoli Netcool Performance ManagerWireless component.v Complex alarmer
Starting from Tivoli Netcool Performance Manager 1.3.2 Fix Pack 3 onwards,Complex alarmer feature is introduced. For more information about theComplex alarmer, see Administering Tivoli Netcool Performance Manager - WirelessComponent.
v Adaptive alarmerA new feature Adaptive alarmer is introduced in 1.4.1 version of Tivoli NetcoolPerformance Manager Wireless component. For more information about theAdaptive alarmer, see Administering Tivoli Netcool Performance Manager - WirelessComponent.
Note: Starting from Tivoli Netcool Performance Manager 1.3.2 Fix Pack 3 onwards,Complex alarmer feature is introduced. For more information about the Complexalarmer, see Administering Tivoli Netcool Performance Manager - Wireless Component.
View an alarmFrom the Alarm Viewer you can view each alarm raised in the system.
About this task
A maximum of 50 alarms are displayed in the Alarms summary window at anyone time with different colors indicating a different level of severity.
The display is refreshed every 3 seconds:
v Click to pause the display and view the 50 current alarms.
v Click to view the previous 50 generated alarms.
v Click to view the next 50 generated alarms.
Note: These button selections can also be made from the Options menu.
The Alarms summary window is organized into rows and columns, each rowrepresenting a different alarm and each column indicating a particular alarmattribute, for example Object Name, Alarm Time, Perceived Severity. The columnheadings displayed in the summary window can be configured in the ColumnVisibility Filter dialog. See “Configure the current alarms display” on page 193.
Acknowledged alarms are indicated by a and unacknowledged alarms by ain the Acknowledge column. Any additional comments are visible.
© Copyright IBM Corp. 2006, 2015 191

Selecting an alarm in the Alarms summary window displays a list of the alarmsproperties. These properties are displayed in the lower window pane.
Filter alarmsYou can filter the alarms displayed in the Alarm Viewer.
About this task
To filter alarms, follow these steps:
Procedure1. From the Options drop-down menu, select Filter.2. Select the filter you want to use:
v “Severity”
v “Object Class” on page 193
SeveritySelect severity levels to filter alarms.
About this task
To filter alarms by selected Severity levels, follow these steps:
Procedure1. Click an Alarm Severity to select it, then use the “Arrow buttons” on page 193
to move the Alarm Severity/Severities into or from the Unselected Severity orSelected Severity list box.
2. Click OK.The severity of a particular alarm is indicated by its color, for example:
Note: It is possible to configure the colors used to denote the different alarmseverities. Contact your System Administrator for further information.
192 IBM Tivoli Netcool Performance Manager: User Guide

Object ClassSelect Object Classes to filter alarms.
About this task
To filter alarms by selected Object Classes, follow these steps:
Procedure1. Click an Object Class to select it, then use the “Arrow buttons” to move the
Object Class/Classes into or from the Unselected Object Class or SelectedObject Class list box.
2. ClickOK.
Arrow buttonsArrow buttons are described in the following table.
About this task
Table 58. Arrow buttons
Button Description
Click this arrow to move all the items listedin the left-hand list box into the right-handlist box.
Click this arrow to move all the items listedin the right-hand list box into the left-handlist box.
Click on an item to select it, then click thisarrow to move it from the left-hand list boxinto the right-hand list box. (Use the Ctrl orShift key to make multiple selections).
Click on an item to select it, then click thisarrow to move it from the right-hand listbox into the left-hand list box. (Use the Ctrlor Shift key to make multiple selections).
Configure the current alarms displayThe following procedure describes the procedure to configure the current alarmsdisplay.
About this task
To configure the current alarms display, follow these steps:
Procedure
From the Options drop-down menu, select Filter, and then clickColumn VisibilityFilter.To select the columns displayed by the Alarm Viewer:1. Click a Column to select it, then use the “Arrow buttons” to move the
Column(s) into or from the Unselected Column orSelected Column list box.2. Click OK.
Chapter 11. Alarm Viewer 193

Acknowledge alarms
Acknowledged alarms are indicated by a in the Current Alarms summarywindow's Acknowledge column.
About this task
To acknowledge an alarm, follow these steps:1. Click an alarm to select it, right-click the alarm, and select Acknowledge from
the displayed menu.
Note: You can use the Ctrl key to make multiple selections.
To acknowledge an alarm and add a comment:1. In the Acknowledge Alarms text field, enter your comments regarding the
alarm or alarms.2. Click Acknowledge .
Comments are visible when the cursor is positioned over the alarm in the CurrentAlarms summary window.1. Click an alarm to select it, right-click the alarm, and select ACKNOWLEDGE
with comment from the displayed menu.2. In the Acknowledge Alarms text field, enter your comment.3. Click Acknowledge.
Clear alarms from the displayAbout this task
To clear alarms displayed by the Alarm Viewer:
Procedure1. In the Current Alarms summary window, click an alarm to select it.
Note: You can use the Ctrl key to make multiple selections.2. Right-click the selected alarm, and then click Clear from the displayed menu.
This can be done only when the selected alarm is acknowledged.3. Click OK.
The alarm is cleared from the Alarm Viewer's display.
194 IBM Tivoli Netcool Performance Manager: User Guide

Chapter 12. Alarm Exporter
The Alarm Exporter is used to activate/deactivate alarm exporter rules and todefine alarm targets.
Activate or deactivate existing Alarm Exporter rulesAbout this task
To activate or deactivate exporter rules:
Procedure1. Open theAlarm Exporter.2. Use the arrow buttons to add or remove rules to/from the Inactive Rules and
Active Rules list boxes.See “Using arrow buttons” on page 201.
Access the Target, Target Group and Export Rule functionsAbout this task
To access these functions, follow these steps:
Procedure1. Open the Alarm Exporter.2. From theTools menu, selectTarget, Target Groups or Rules.
Manage TargetsAn Alarm Target is a destination where a specific type(s) of alarm is directed.
The Target Manager dialog enables you to do the following tasks:v “Creating a Target”v “Updating a Target” on page 197v “Deleting a Target” on page 198
Creating a TargetTo create a Target, follow these steps:1. From the Menu bar, selectTools .2. Then select Targets .
The Target Manager dialog is displayed.3. Click Create .
The Target Editor dialog is displayed.4. Enter the name of the new Target.5. From the Type list, select a specific Target type.6. In the Destination Configuration area, enter the information that corresponds
to your Type selection:v “File” on page 196
© Copyright IBM Corp. 2006, 2015 195

v “Program”v “E-mail”v “SNMP” on page 197
7. Click OK, when you have completed entering information for the selectedTarget type.A message is displayed informing you that the target has been createdsuccessfully.
FileTable 59. File
Field Description
File Path of the file, using:
v An environment variable, for example, $WMCROOT/test/test.ksh.
v The full directory path for the file, for example, /test/test.ksh
v A directory path relative to the directory in which the Alarm Service isstarted (this is the default location), for example, test/test.ksh
Note: The target destination must be located on the server within which the AlarmService is installed. Attempts to specify a destination on a client machine willresult in an error.
ProgramTable 60. Program type
Field Description
Program Path of the program, using:
v An environment variable, for example, $WMCROOT/test/test.ksh.
v The full directory path, for example, /test/test.ksh.
v A directory relative to the directory in which the Alarm Service is started(this is the default location), for example, test/test.ksh.
Note: The target destination must be located on the server within which the AlarmService is installed. Attempts to specify a destination on a client machine willresult in an error.
Note: When a program target is created, it must exist. For example, if you specify,$WMCROOT/test/prog.ksh as your program, then this must exist on the server.
E-mailTable 61. E-mail type
Field Description
To Enter the recipient(s) email addresse(s). The message is sent directly to therecipient(s) entered in this field. You send a message to multiple recipientsby separating their e-mail addresses with a comma (,).
cc Enter the recipient(s) email addresse(s). A copy of the message is sent tothis recipient, and their name is visible to all other recipients. You send amessage to multiple recipients by separating their e-mail addresses with acomma (,).
196 IBM Tivoli Netcool Performance Manager: User Guide

Table 61. E-mail type (continued)
Field Description
bcc Enter the recipient(s) email addresse(s). A copy of the message is sent tothis recipient but their name is not visible to all other recipients. You senda message to multiple recipients by separating their e-mail addresses witha comma (,).
From The sender's e-mail address.
Message Enter the e-mail message.
Template From the drop-down list, select a template.
Note: If the e-mail does not reach its intended recipients, you will receive adelivery failure notification.
SNMPTable 62. SNMP type
Field Description
Manager Enter the host name or IP address of the machine on which theSNMP Manager resides. For example, you can enter the IP addressof the IBM® Netcool machine.
Manager Port Enter the port number where the traps should be sent to. This is aport on the machine where the SNMP Manager resides.Note: For the Manager Port 10162, the SNMP community is always'public'.
SNMP Version You can select either SNMP v1 or SNMP v2c. SNMP v1 supportsbasic communication between the Manager and the Agent.
SNMP v2c supports the enhanced protocol features of SNMPv2without the SNMPv2 security. The "c" indicates SNMPv2c uses theSNMPv1 community string paradigm for security.
SNMP Community Enter the SNMP Community String. The SNMP Community Stringcontrols access for SNMP devices and agents.
Updating a TargetAbout this task
To update a Target, follow these steps:
Procedure1. From the Menu bar, select Tools.2. Select Targets.
The Target Manager dialog is displayed.3. Select the Target you want to modify.4. Click Edit.
TheTarget Editor dialog is displayed.5. Modify the Target details as required.6. Click OK.
Chapter 12. Alarm Exporter 197

Deleting a TargetAbout this task
To delete a target, follow these steps:
Procedure1. From the Menu bar, select Tools.2. Then select Targets.
The Target Manager dialog is displayed.3. Select the Target you want to delete.4. Click Delete.
Note: A target can only be deleted if it is not being used by an Export Rule.An error message is displayed if you attempt to delete a target that is containedin an export rule.
5. Confirm or cancel the action.
Manage Target GroupsAn Alarm Target is a destination where a specific type(s) of alarm is directed.
The Target Group Manager dialog enables you to:v “Create a Target Group”v “Update a Target Group” on page 199v “Delete a Target Group” on page 199
Create a Target GroupAbout this task
To create a Target Group, follow these steps:
Procedure1. From the menu bar, selectTools.2. Select Targets.
The Target Group Manager dialog is displayed.3. Click Create.
The Target Group Editor dialog is displayed.4. Enter the Target Group Name.5. Define the new Target Group by using the arrow buttons to add or remove
Targets from the relevant list box.The targets are moved from Targets Available to Targets Selected.
6. Once you have finished adding the targets, click OK.
198 IBM Tivoli Netcool Performance Manager: User Guide

Update a Target GroupAbout this task
To update a Target Group, follow these steps:
Procedure1. From the Menu bar, selectTools.2. Select Target Group.
The Target Group Manager dialog is displayed.3. Select the Target you wish to modify.4. ClickEdit.
The Target Group Editor dialog is displayed.5. Modify the Target Group details as required.6. ClickOK.
Delete a Target GroupAbout this task
To delete a Target Group, follow these steps:
Procedure1. From the Menu bar, selectTools.2. Select Target Groups.
The Target Group Manager dialog is displayed3. Select the Target Group you want to delete.4. ClickDelete.
Note: A Target Group can only be deleted if it is not being used by an ExportRule.
5. Confirm or cancel the action.
Manage Export RulesAn Export Rule consists of the criteria by which alarms can be selected. You candefine which Target/Target Groups the alarms are exported and specify aparticular output format for the rule.
The Rule Manager dialog enables you to do the following tasks:v “Create an Export Rule” on page 200v “Update an Export Rule” on page 201v “Delete an Export Rule” on page 201
Chapter 12. Alarm Exporter 199

Create an Export RuleAbout this task
To create an Export Rule, follow these steps:
Procedure1. Select Tools from theMenu bar.2. Select Rules.
TheRule Manager dialog is displayed listing existing rules.3. Click theCreate button.
The Rule Manager dialog for defining the rule is displayed.4. Enter a name for the rule in theRule Name field.5. Select the rule's destination from the Output To and Name drop down lists.
The destination can be a target or a target group.6. Select the scope of the rule from the Alarm Types and Specific Problems drop
down lists.All alarms for the alarm types and specific problems selected, are exported tothe rule's target/target groups.
Note: Alarm types and specific problems are defined in the Alarm Manager.
Alarm typesThe All option includes all alarm types.
Procedure
Click the button to specify a selection.The Selection option allows you to specify a selection of alarm types:1. A Rule Manager dialog for scoping is displayed.2. Use the arrow buttons to select the alarm types.3. Click on theOK button to return to the Rule Manager dialog for defining the
rule.
Specific problemsThe All option includes all problems.
Procedure
1. Click the button to specify a selection.The Selection option allows you to specify a selection of specific problems. Allspecific problems selected, are exported to the rule's target/target groups.Specific problems are defined by alarm definitions.A Rule Manager dialog for scoping is displayed.
2. Use the arrow buttons to select the alarm definitionsThe Add button can be used to add specific alarms that do not exist as adefinition within the Alarm Manager.
3. Click the OK button to return to the Rule Manager dialog for defining the rule.4. Select the output format of the rule from the Format list.
Alarm details can be exported in semicolon-delimited or name/value pairformat.
200 IBM Tivoli Netcool Performance Manager: User Guide
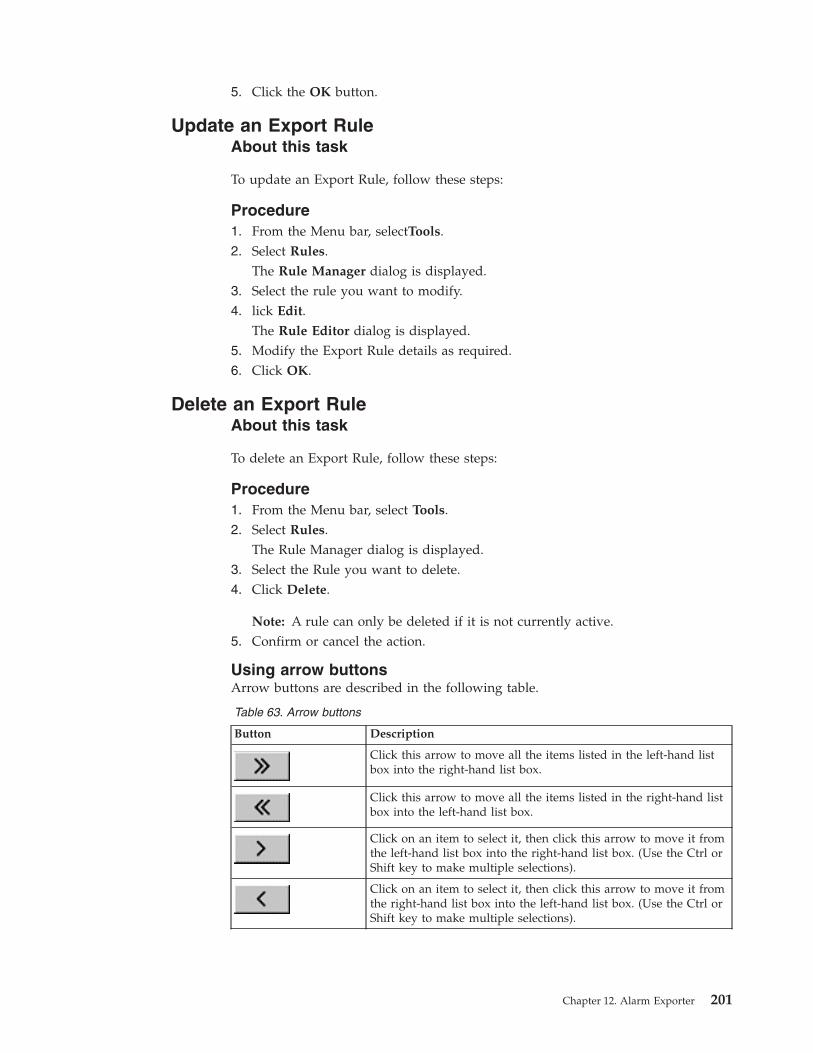
5. Click the OK button.
Update an Export RuleAbout this task
To update an Export Rule, follow these steps:
Procedure1. From the Menu bar, selectTools.2. Select Rules.
The Rule Manager dialog is displayed.3. Select the rule you want to modify.4. lick Edit.
The Rule Editor dialog is displayed.5. Modify the Export Rule details as required.6. Click OK.
Delete an Export RuleAbout this task
To delete an Export Rule, follow these steps:
Procedure1. From the Menu bar, select Tools.2. Select Rules.
The Rule Manager dialog is displayed.3. Select the Rule you want to delete.4. Click Delete.
Note: A rule can only be deleted if it is not currently active.5. Confirm or cancel the action.
Using arrow buttonsArrow buttons are described in the following table.
Table 63. Arrow buttons
Button Description
Click this arrow to move all the items listed in the left-hand listbox into the right-hand list box.
Click this arrow to move all the items listed in the right-hand listbox into the left-hand list box.
Click on an item to select it, then click this arrow to move it fromthe left-hand list box into the right-hand list box. (Use the Ctrl orShift key to make multiple selections).
Click on an item to select it, then click this arrow to move it fromthe right-hand list box into the left-hand list box. (Use the Ctrl orShift key to make multiple selections).
Chapter 12. Alarm Exporter 201

202 IBM Tivoli Netcool Performance Manager: User Guide

Chapter 13. Alarm Manager
Alarms can be generated based on performance data. Alarms are used to informusers, and other modules or components, that abnormal conditions have beendetected in some network elements.
Performance data being collected from the network generates alarms based onconfigurable alarm definitions.
Alarms can be generated according to:v Linear thresholds - comparison with actual valuesv Derivative thresholds - comparison with previous performancev Time-related threshold - number of times an event has occurred
Individual thresholds can also be set for different alarm severity levels.
Note: It is possible to have more than one instance of the Alarm Manager runningat any one time.
Alarms that are raised can be viewed using the Alarm Viewer. See Chapter 11,“Alarm Viewer,” on page 191.
Alarms can be sent to a selected target or group of targets, this may either be aninternal or external target, a file or a pipe. The target or group of targets and theassociated alarm selection criteria is known as the Export Rule. See Chapter 12,“Alarm Exporter,” on page 195.
The Alarm Template toolThe Alarm Template tool allows you to create Alarm Definitions quickly by basingall Alarm Definitions on an Alarm Template.
The Alarm Template may be supplied as part of a technology pack or created by auser with a more detailed knowledge of the network.
The main components of an Alarm Template are as follows:v Mapping information: an Alarm Template must supply the necessary
information to allow the source of an alarm to map the data analyzed to anappropriate alarm standard.
v Network selection criteria: by limiting the number of network elements underconsideration, (for example only the cells in a specific region) you can targetyour analysis to a small subset of the available data.
v A further attribute filter: this allows you to filter the selection criteria evenfurther. For instance, within the network elements selected for consideration,you may wish to filter the cells that do not achieve a specified level of traffic.
v KPI: the Key Performance Indicator is the most important component. The KPIforms the value against which the alarm predicates are evaluated to decidewhether an alarm should be raised.
Depending on your security capabilities, the Alarm Manager allows you to:v “Create an Alarm Template” on page 209
© Copyright IBM Corp. 2006, 2015 203

v “Update an Alarm Template” on page 210v “Delete an Alarm Template” on page 211
Note: Alarm Templates may be supplied as part of a technology pack. You will notbe able to modify these templates.
Alarm Template Tree viewThe Alarm Template Tree is organized into layers, which are hierarchies ofassociated Alarm Templates.
To access the Alarm Template Tree View, click the Templates tab.
v The icon denotes a technology pack.v The icon denotes an alarm context.
v The icon denotes the Alarm Template.
Right-click on an Alarm Template in order to carry out the following actions:v Refresh an Alarm Templatev Delete an Alarm Templatev Save the Alarm Templatev Save the Alarm Template in a different layer
Alarm Template tabsA number of tabs are displayed on the right-hand side of the window, including:
“The General tab”Specifies alarm name, KPI for comparison and other general details.
“The Attribute Filter tab” on page 205Sets filter criteria that must be met within the data for an alarm to beraised.
“The Network Filter tab” on page 206Scopes the Alarm Definition or Alarm Template to individual or groups ofnetwork elements.
“The Constraint tab” on page 207Consists of the constraints that must be satisfied before an alarm can beraised on a set of data.
“The Options tab” on page 208template configuration
“The X.733 tab” on page 208specifies X.733 attributes
The General tab
Note: Note that the General tab is set as the default tab and is the only availabletab prior to the selection of a KPI.
Field Description
Alarm Name The alarm name which maps to the alarm standard specific problemattribute. For example, X.733.
204 IBM Tivoli Netcool Performance Manager: User Guide

Field Description
Alarm Type The type of alarm which maps to the alarm standard event typeattribute. The Alarm Type can be selected from a drop-down menu.
AlarmDescription
The description of the alarm.
Alarm Standard The alarm standard, normally X.733.
Template Version The version of the Alarm Template. Any changes made to an AlarmTemplate are tracked using a version control system.
Alarm KPI The key performance indicator to be compared against the predicates todetermine whether or not an alarm should be raised. The other tabs willnot be available until a KPI is selected.
The Attribute Filter tabThe Attribute Filter tab, allows you to set filter criteria that must be met withinthe data for an alarm to be raised. For example, to raise an alarm on a number ofblocked calls if the total number of calls exceeds a specified threshold.
About this task
To create an Attribute filter:1. If an Attribute filter is currently highlighted, click New. This will allow you to
create a new Attribute filter.2. Enter an expression in the Expression pane .
This expression can be a counter, a traffic table column name or alias, or anetwork ID. However, if the KPI is formed of more than one LIF counters, youmust select the LIF counters instead of KPI Names for all attributes. You canalso enclose the expression in string functions as in the table below.
Table 64. String Functions
Function Description
leftstr( <s> , <n> ) Returns sub-string of string <s> containing the <n> leftmost characters. This is useful, for example, in parsing thenetwork ID.
rightstr( <s> , <n> ) Returns sub-string of string <s> containing the <n> rightmost characters.
substr( <s> , <n> , <m> ) Returns sub-string of string <s> containing the <n>characters (or the rest of the string if <n> is negative)starting from position <m> .
upper( <s> ) Return string <s> in uppercase.
lower( <s> ) Returns string <s> in lowercase.
3. Use the drop-down box to choose an operator. See “Operators” on page 209.4. Provide a Description for the filter.
Note: Enclose the string expressions for the description in quotes, for example,leftstr(TRX,7)="TRX_1-1". In this example, if the 7 leftmost characters of aTRX matches the string "TRX_1-1", then alarms will be triggered for that TRX:TRX_1-1-2, TRX_1-1-3 will trigger
5. Click OK .The filter will now appear in the list in the lower half of the pane.
Chapter 13. Alarm Manager 205

To make an Attribute filter mandatory or optional:1. Select the filter from the list of Attribute filters.2. Select/Clear the Mandatory and/or Active boxes as required.
Checking the Mandatory box will cause the filter to be permanently selectedwithin the Alarm Definition. Unchecking the Mandatory box will mean thatyou can choose to select the filter within the Alarm Definition. Checking theActive box will cause the filter to be available within the Alarm Definition.Unchecking the Active box will cause the filter to be unavailable within theAlarm Definition.The attribute filter will be validated before being added to the overall list.
To update an Attribute filter:1. Select the filter you wish to update from the list of Attribute filters.2. Update the expression in the Expression pane as required.
Use the drop-down box to choose an operator. See “Operators” on page 209.3. Update the Description for the filter as required.4. Click OK.
To delete an Attribute filter:1. Select the filter you wish to delete from the list of Attribute filters.2. Click Delete.
The Network Filter tabThe Network Filter tab, allows you to scope the Alarm Definition or AlarmTemplate to individual or groups of network elements.
About this task
You can therefore specify the network elements for which you want to receivealarms.
Note: If you use a network ID in the Attribute Filter tab, do not specify a NetworkFilter also.
To add an object to the scope of the Alarm Definition or Alarm Template:1. Click Add .2. Enter the name of the Network Element you wish to use as a filter.
For example: 1-2-1-1:1. Click OK to confirm.2. Repeat steps 1-3 to add further objects.
Note: You are limited to a maximum of 10 objects.
To delete an object from the scope of the Alarm Definition or Alarm Template:1. Select the name of the Network Element you wish to delete.2. Click Delete .3. Repeat steps 1-2 to remove further objects.
206 IBM Tivoli Netcool Performance Manager: User Guide

The Constraint tabThe Constraint tab consists of the constraints that must be satisfied before analarm can be raised on a set of data. These constraints reduce the number ofalarms that are raised.
Field Description
Maximum Age ofAlarm Data
This field controls the handling of late arriving data (measured inseconds). Applicable only when Auto Clear is set to True. Forexample, in the case of a loader alarm, an alarm is not raised ifthe difference between the timestamp on the data and the currenttime, is greater than the figure specified in this field. If AutoClear set to False, alarm is always be generated.
Minimum AlarmPredicate Stability
Alarm stability is the time (measured in seconds) within whichthe alarm predicate must evaluate to true before an alarm can beraised.
For example, if the Minimum Alarm Predicate Stability is 3600,then an alarm is raised only if the alarm condition is true for onehour (3600 seconds).
If the Minimum Alarm Predicate Stability is 0, then the alarm israised whenever the alarm condition is true.
Minimum Valid AlarmData Percentage
If the data is lost, this figure represents the minimum percentageof data that is required before the alarm predicate evaluates totrue and an alarm is raised. This is related to the Minimum AlarmPredicate Stability (see above).
For example, if the Minimum Alarm Predicate Stability is 3600and the Minimum Valid Alarm Data Percentage is 50, then thealarm is raised only if the alarm condition is true for 30 minutes(50% of one hour/3600 seconds).
Auto Clear Set to True or False. This is related to the Maximum Age of AlarmData (see above).
If Auto Clear is True, and the alarm is not raised for theMaximum Age of Alarm Data, then the old alarm is automaticallycleared. For example, if Auto Clear is True and the Maximum Ageof Alarm Data is 86400 , then if no alarm is raised for one day(86400 seconds) the alarm is automatically cleared.
The severity of the alarm that is raised is equal to the most severe level that hasremained stable over the entire stability period. The Minimum Alarm PredicateStability represents the period that a value must be in violation for an alarm to bestable, and the Minimum Valid Alarm Data Percentage allows you to specify thatthe value must not be in violation for the entire stability period to be consideredstable.
For example, the data is loaded in intervals of 900 seconds, with a MinimumAlarm Predicate Stability of 3600. The alarm is triggered internally with a severityof Major for 1800 seconds, Minor for 900 seconds, then Major for 900 seconds:v Case 1: Minimum Valid Alarm Data Percentage = 100%
At the end of Minimum Alarm Predicate Stability time, the alarm is triggeredwith Minor severity. This is because the alarm condition was of Minor or greaterseverity for 100% of the Minimum Alarm Predicate Stability time.
v Case 2: Minimum Valid Alarm Data Percentage = 75%
Chapter 13. Alarm Manager 207
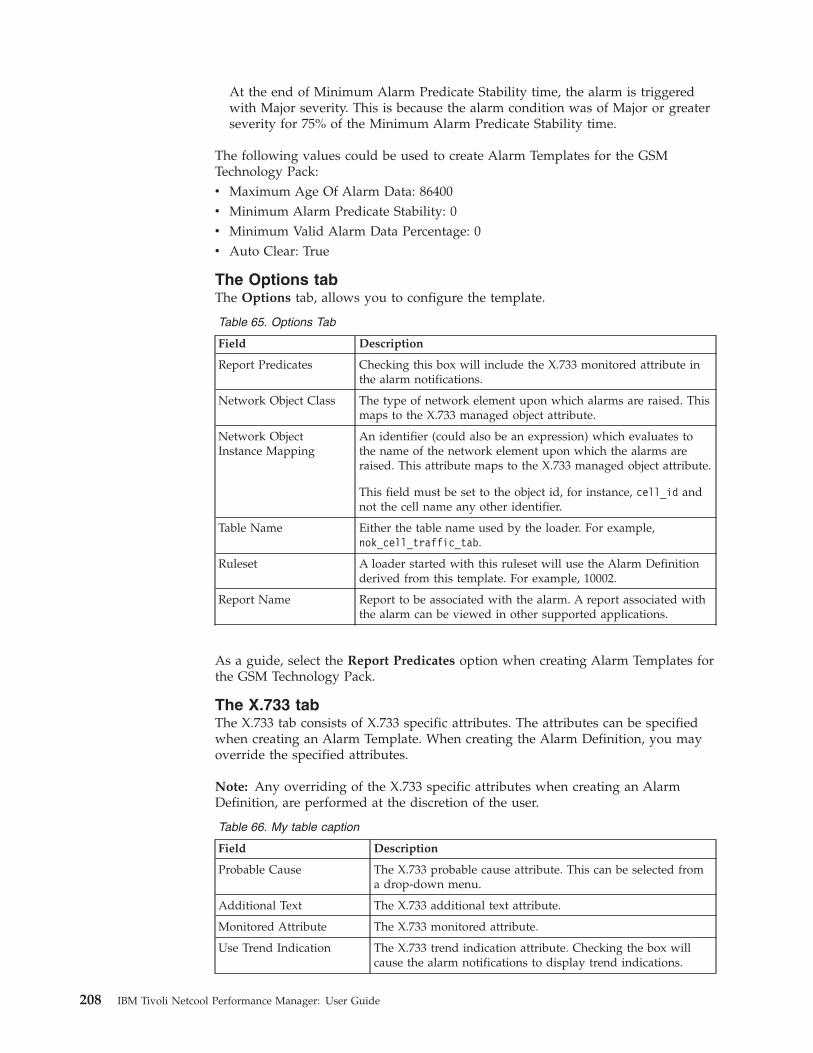
At the end of Minimum Alarm Predicate Stability time, the alarm is triggeredwith Major severity. This is because the alarm condition was of Major or greaterseverity for 75% of the Minimum Alarm Predicate Stability time.
The following values could be used to create Alarm Templates for the GSMTechnology Pack:v Maximum Age Of Alarm Data: 86400v Minimum Alarm Predicate Stability: 0v Minimum Valid Alarm Data Percentage: 0v Auto Clear: True
The Options tabThe Options tab, allows you to configure the template.
Table 65. Options Tab
Field Description
Report Predicates Checking this box will include the X.733 monitored attribute inthe alarm notifications.
Network Object Class The type of network element upon which alarms are raised. Thismaps to the X.733 managed object attribute.
Network ObjectInstance Mapping
An identifier (could also be an expression) which evaluates tothe name of the network element upon which the alarms areraised. This attribute maps to the X.733 managed object attribute.
This field must be set to the object id, for instance, cell_id andnot the cell name any other identifier.
Table Name Either the table name used by the loader. For example,nok_cell_traffic_tab.
Ruleset A loader started with this ruleset will use the Alarm Definitionderived from this template. For example, 10002.
Report Name Report to be associated with the alarm. A report associated withthe alarm can be viewed in other supported applications.
As a guide, select the Report Predicates option when creating Alarm Templates forthe GSM Technology Pack.
The X.733 tabThe X.733 tab consists of X.733 specific attributes. The attributes can be specifiedwhen creating an Alarm Template. When creating the Alarm Definition, you mayoverride the specified attributes.
Note: Any overriding of the X.733 specific attributes when creating an AlarmDefinition, are performed at the discretion of the user.
Table 66. My table caption
Field Description
Probable Cause The X.733 probable cause attribute. This can be selected froma drop-down menu.
Additional Text The X.733 additional text attribute.
Monitored Attribute The X.733 monitored attribute.
Use Trend Indication The X.733 trend indication attribute. Checking the box willcause the alarm notifications to display trend indications.
208 IBM Tivoli Netcool Performance Manager: User Guide

As a guide, the following values could be used with regard to creating AlarmTemplates for the GSM Technology Pack:v Probable Cause: thresholdCrossedv Use Trend Indication: ticked
OperatorsTable 67. Operators
Operator description
< less than
> greater than
= equal to
!= does not equal
<= less than or equal to
>= greater than or equal to
Create an Alarm TemplateAbout this task
To create an Alarm Template using the Alarm Manager, follow these steps:
Procedure1. From the File menu, select New.
The New Alarm Template dialog will appear. The available layers aredisplayed.
The icon denotes a Technology Pack.The icon denotes an alarm context.
2. Select the layer in which you wish to create the Alarm Template.3. In the Name field, type the name of the Alarm Template.4. Click OK to confirm the creation of the Alarm Template.
The Alarm Template Panel is displayed.5. Define the Alarm Template parameters using the following tabs:
“The General tab” on page 204“The Attribute Filter tab” on page 205“The Network Filter tab” on page 206“The Constraint tab” on page 207“The Options tab” on page 208“The X.733 tab” on page 208
6. Save the Alarm Template within the current layer.
Saving an Alarm TemplateAbout this task
The following procedure will save an Alarm Template within the current layer.
Chapter 13. Alarm Manager 209

Procedure1. Right click on the Alarm Template to bring-up a context menu.2. Select Save from the context menu.
Alternatively, you can save an Alarm Template by clicking the Save icon on thetoolbar, or by selecting Save from the File menu.
Saving an Alarm Template in a different layerAbout this task
Saving an Alarm Template to a different layer will cause the Alarm Template to becopied to the specified layer.
Procedure1. Right click on the Alarm Template.2. Select Save As from the context menu.3. Alternatively, you can save an Alarm Template by selecting Save As from the
File menu.4. In the Save As dialog, select the layer within which you wish to save the
Alarm Template.5. Within the Name field, rename the Alarm Template as required.6. Click OK.
Update an Alarm TemplateAbout this task
By updating an Alarm Template you modify the Alarm Templates currentparameters.
To update an Alarm Template:1. Select an Alarm Template from the Alarm Template Tree.2. Double-click the Alarm Template.3. Update the parameters of the Alarm Template via the following tabs:
“The General tab” on page 204“The Attribute Filter tab” on page 205“The Network Filter tab” on page 206“The Constraint tab” on page 207“The Options tab” on page 208“The X.733 tab” on page 208
4. Either:v Save the Alarm Definition within the current layer,
orv Save the Alarm Definition to a different layer
210 IBM Tivoli Netcool Performance Manager: User Guide

Delete an Alarm TemplateYou can only delete an Alarm Template if there are no Alarm Definitionsassociated with it.
About this task
To delete the current version of an Alarm Template, follow these steps:
Procedure1. Select an Alarm Template from the Alarm Template Tree.2. Right-click the Alarm Template.3. Select Delete.4. To confirm the deletion of the Alarm Template, click Yes.
To delete all versions of the Alarm Template:a. Select an Alarm Template from the Alarm Template Tree.b. Right-click the Alarm Template.c. Select Delete All .d. To confirm the deletion of the Alarm Template, click Yes.
Alarm Definition toolThe Alarm Definition Tool allows you to create Alarm Definitions quickly bybasing all Alarm Definitions on an Alarm Template, see “The Alarm Template tool”on page 203 for information on Alarm Templates. The Alarm Definition builds onan Alarm Template by inheriting the Template's characteristics allowing you toproduce a complete Alarm Definition.
Once the Alarm Definition is complete it can then be activated. Alarms may thenbe raised, according to the associated definition, following an analysis of the data.Alarm definitions may also be deactivated. In which case, alarms will stop beingraised but those alarms already raised will remain visible within the system.
You produce an Alarm Definition from an Alarm Template by completing theassociated alarm predicates, this is done by adding thresholds for each of thestated severity levels.
Depending on your security capabilities, the Alarm Manager allows you to:v “Create an Alarm Definition” on page 218v “Update an Alarm Definition” on page 220v “Delete an Alarm Definition” on page 221v “Activate an Alarm Definition” on page 219v “Deactivate an Alarm Definition” on page 219v “View the status of an Alarm Definition” on page 220
Note: Alarm Definitions may be supplied as part of a technology pack. You willnot be able to modify these definitions.
Chapter 13. Alarm Manager 211

The Alarm Definition Tree viewTo access the Alarm Definition Tree View, click the Definitions tab.
The Alarm Definition Tree is organized into layers, which are hierarchies ofassociated Alarm Definitions.
v The icon denotes a technology pack.v The icon denotes an alarm context.
v The icon denotes the Alarm Definition.
Right-click on an Alarm Definition in order to perform the following actions:v Refresh an Alarm Definitionv Delete an Alarm Definitionv Delete All Alarm Definitionsv Activate the Alarm Definitionv Deactivate the Alarm Definitionv Save the Alarm Definitionv Save the Alarm Definition in a different layer
The Document panelThe Alarm Definition panel is presented as a tabbed pane on the right-hand side ofthe window, with each tab representing a constituent part of the Alarm Definition.
There are two possible views of the Alarm Definition, both of which are availablefrom the View menu:v The “Normal view” - this is the default view.v The “Advanced view” on page 213
Note: Any such overrides of the Alarm Templates are performed at the discretionof the user.
Normal viewAbout this task
To simplify the definition of alarms the Normal View (default view) containsessential information about the Alarm Definition.
To select the Normal View, follow these steps:
Procedure
From theView menu, select Normal.The Normal View is the default view and includes the following tabs:v “The General tab”v “The Alarm Predicate tab” on page 213
The General tabThe General tab is set as the default tab.
212 IBM Tivoli Netcool Performance Manager: User Guide

Note: If the selected Alarm Definition is active, all the fields will be greyed-outand you will not be able to make any changes to the Alarm Definition. In suchcases, you will need to deactivate the Alarm Definition before proceeding.
Table 68. The General tab
Field Description
Alarm Name The alarm name which maps to the alarm standard specific problemattribute. For example, X.733
Alarm Type The type of alarm which maps to the alarm standard event typeattribute. The Alarm Type can be selected from a drop-down menu.
Alarm Description The description of the alarm
Alarm Standard The alarm standard. For example X.733.
Definition Version The version of the Alarm Definition
Template Name The name of the Alarm Template upon which the Alarm Definition isbased
Template Version The version of the Alarm Template upon which the Alarm Definitionis based
The Alarm Predicate tabThis allows you to specify the severity levels for the alarm definition. The KPI isfixed by the template, however you may alter the conditions under which thealarm is raised by setting certain severity values for Critical, Major, Minor, Warningor Clearance. The severity values, known as the Alarm Predicates, must always bedefined.
Table 69. The Alarm Predicate tab
Field Description
KPI The Key Performance Indicator (KPI) is fixed from the Alarm Template andcannot be modified.
Critical Allows you to state the threshold at which an alarm is raised with criticalseverity.
Major Allows you to state the threshold at which an alarm is raised with majorseverity.
Minor Allows you to state the threshold at which an alarm is raised with minorseverity.
Warning Allows you to state the threshold at which an alarm is raised with warningseverity.
Clearance Allows you to state the threshold at which an alarm is raised will be cleared.
Advanced viewWhilst containing essential information about the Alarm Definition, the AdvancedView also allows for overrides of the data within the Alarm Template.
The Advanced View includes the following tabs:v “The General tab” on page 214v “The Alarm Predicate tab” on page 214v “The Attribute Filter tab” on page 215v “The Network Filter tab” on page 215v “The Constraint tab” on page 215
Chapter 13. Alarm Manager 213

v “The Options tab” on page 217v “The X.733 tab” on page 217
To select the Advanced view, from the View menu, selectAdvanced.
The General tabThe General tab is set as the default tab.
Note: If the selected Alarm Definition is active, all the fields will be greyed-outand you will not be able to make any changes to the Alarm Definition. In suchcases, you will need to deactivate the Alarm Definition before proceeding.
Table 70. The General tab
Field Description
AlarmName
The alarm name which maps to the alarm standard specific problemattribute. For example, X.733.
Alarm Type The type of alarm which maps to the alarm standard event type attribute.The Alarm Type can be selected from a drop-down menu.
AlarmDescription
The description of the alarm
AlarmStandard
The alarm standard. For example, X.733.
DefinitionVersion
The version of the Alarm Definition
TemplateName
The name of the Alarm Template upon which the Alarm Definition is based
TemplateVersion
The version of the Alarm Template upon which the Alarm Definition isbased
The Alarm Predicate tabThis allows you to specify the severity levels for the alarm definition. The KPI isfixed by the template, however you may alter the conditions under which thealarm is raised by setting certain severity values for Critical, Major, Minor, Warningor Clearance. The severity values, known as the Alarm Predicates, must always bedefined.
Table 71. The Alarm Predicate tab
Field Description
KPI The Key Performance Indicator (KPI) is fixed from the Alarm Template andcannot be modified.
Critical Allows you to state the threshold at which an alarm is raised with criticalseverity.
Major Allows you to state the threshold at which an alarm is raised with majorseverity.
Minor Allows you to state the threshold at which an alarm is raised with minorseverity.
Warning Allows you to state the threshold at which an alarm is raised with warningseverity.
Clearance Allows you to state the threshold at which an alarm is raised will be cleared.
214 IBM Tivoli Netcool Performance Manager: User Guide

The Attribute Filter tabThe Attribute Filter tab, allows you to activate or deactivate any filter criteria byselecting or clearing the associated check boxes.
Note: Where items are defined as mandatory filters in the Alarm Template, theywill be completely greyed out.
By selecting a filter from the list, you can view the expression that creates the filter.
Select the Active check box for the filter to be available within the AlarmDefinition. Clear the Active check box for the filter to be unavailable within theAlarm Definition.
The Network Filter tabAbout this task
The Network Filter tab, allows you to scope the Alarm Definition or AlarmTemplate to individual or groups of network elements.
To add an object to the scope of the Alarm Definition or Alarm Template, followthese steps:
Procedure1. Click Add.2. Enter the name of the Network Element you wish to use as a filter.3. ClickOK to confirm.4. Repeat steps 1-3 to add further objects.
Note: You are limited to a maximum of 10 objects.To delete an object from the scope of the Alarm Definition or Alarm Template:a. Select thename of the Network Element you wish to delete.b. Click Delete .c. Repeat steps 1-2 to remove further objects
The Constraint tabThe Constraint tab consists of the constraints that must be satisfied before analarm can be raised on a set of data. These constraints reduce the number ofalarms that are raised.
Table 72. The Constraint tab
Field Description
Maximum Age ofAlarm Data
This field controls the handling of late arriving data (measured inseconds). For example, in the case of a loader alarm, an alarm isnot raised if the difference between the time-stamp on the dataand the current time, is greater than the figure specified in thisfield.
Chapter 13. Alarm Manager 215

Table 72. The Constraint tab (continued)
Field Description
Minimum AlarmPredicate Stability
Alarm stability is the time (measured in seconds) within whichthe alarm predicate must evaluate to true before an alarm can beraised.
For example, if the Minimum Alarm Predicate Stability is 3600 ,then an alarm is raised only if the alarm condition is true for onehour (3600 seconds).
If the Minimum Alarm Predicate Stability is 0 , then the alarm israised whenever the alarm condition is true.
Minimum Valid AlarmData Percentage
In the case of data being lost, this figure represents the minimumpercentage of data required before the alarm predicate evaluatesto true and an alarm is raised. This is related to the MinimumAlarm Predicate Stability (see above).
For example, if the Minimum Alarm Predicate Stability is 3600and the Minimum Valid Alarm Data Percentage is 50 , then thealarm is raised only if the alarm condition is true for 30 minutes(50% of one hour/3600 seconds).
Auto Clear Set to True or False. This is related to the Maximum Age of AlarmData (see above).
If Auto Clear is True, and the alarm has not been raised for theMaximum Age of Alarm Data, then the old alarm is automaticallycleared. For example, if Auto Clear is True and the Maximum Ageof Alarm Data is 86400 , then if no alarm is raised for one day(86400 seconds) the alarm is automatically cleared.
The severity of the alarm raised is equal to the most severe level that has remainedstable over the entire stability period. The Minimum Alarm Predicate Stabilityrepresents the period of time that a value must be in violation for an alarm to bestable, and the Minimum Valid Alarm Data Percentage allows you to specify thatthe value does not have to be in violation for the entire stability period in order tobe considered stable.
For example, the data is loaded in intervals of 900 seconds, with a MinimumAlarm Predicate Stability of 3600. The alarm is triggered internally with a severityof Major for 1800 seconds, Minor for 900 seconds, then Major for 900 seconds:v Case 1: Minimum Valid Alarm Data Percentage = 100%
At the end of Minimum Alarm Predicate Stability time, the alarm is triggered withMinor severity. This is because the alarm condition was of Minor or greaterseverity for 100% of the Minimum Alarm Predicate Stability time.v Case 2: Minimum Valid Alarm Data Percentage = 75%
At the end of Minimum Alarm Predicate Stability time, the alarm is triggered withMajor severity. This is because the alarm condition was of Major or greater severityfor 75% of the Minimum Alarm Predicate Stability time.
As a guide, the following values could be used with regard to creating AlarmTemplates for the GSM Tech-Pack:v Maximum Age Of Alarm Data: 86400v Minimum Alarm Predicate Stability: 0
216 IBM Tivoli Netcool Performance Manager: User Guide

v Minimum Valid Alarm Data Percentage: 0v Auto Clear: True
The Options tabThe Options tab, allows you to configure the template.
Table 73. The Options tab
Field Description
Report Predicates Checking this box will include the X.733 monitored attribute in thealarm notifications.
Network ObjectClass
The type of network element upon which alarms are raised. Thismaps to the X.733 managed object attribute.
Network ObjectInstance Mapping
An identifier (could also be an expression) which evaluates to thename of the network element upon which the alarms are raised.This attribute maps to the X.733 managed object attribute.
This field must be set to the object id, for instance, cell_id and notthe cell name any other identifier
Table Name/ BlockName
Either the table name or the input source block name used by theloader.
Ruleset A loader started with this ruleset will use the Alarm Definitionderived from this template.
Report Name Report to be associated with the alarm. A report associated with thealarm can be viewed in other supported applications.
As a guide, select the Report Predicates option when creating Alarm Templates forthe GSM Technology Pack.
The X.733 tabThe X.733 tab consists of X.733 specific attributes. The attributes can be specifiedwhen creating an Alarm Template. When creating the Alarm Definition, you mayoverride the specified attributes.
Note: Any overriding of the X.733 specific attributes when creating an AlarmDefinition, are performed at the discretion of the user.
Table 74. The X.733 tab
Field Description
Probable Cause The X.733 probable cause attribute. This can be selected from adrop-down menu.
Additional Text The X.733 additional text attribute.
MonitoredAttribute
The X.733 monitored attribute.
Use TrendIndication
The X.733 trend indication attribute. Checking the box will cause thealarm notifications to display trend indications.
As a guide, the following values could be used with regard to creating AlarmTemplates for the GSM Technology Pack:v Probable Cause: thresholdCrossedv Use Trend Indication: ticked
Chapter 13. Alarm Manager 217

Create an Alarm DefinitionAlarm Definitions are created from an Alarm Template.
Procedure1. From theFile menu, selectNew.
The Alarm Template Selection dialog will appear. The left-hand pane shows theavailable layers, whilst the right-hand pane shows the Alarm Templatesavailable within the selected layer.
v The icon denotes a technology pack.v The icon denotes an alarm context.
v The icon denotes the Alarm Template.2. Select an Alarm Template from the available layers.
The Name, Version and Description of the Alarm Template are shown.3. Click OK to confirm the selection.
The Alarm Definition Panel will now show the Normal View.4. Either accept the default alarm parameters, or define your own parameters
using the following tabs:“The General tab” on page 214“The Alarm Predicate tab” on page 214“The Attribute Filter tab” on page 215 (Advanced View)“The Network Filter tab” on page 215 (Advanced View)“The Constraint tab” on page 215 (Advanced View)“The Options tab” on page 217 (Advanced View)“The X.733 tab” on page 217 (Advanced View)
5. Either:a. Save the Alarm Definition within the current layer, orb. Save the Alarm Definition to a different layer
Save an Alarm DefinitionAbout this task
To save an Alarm Definition within the current layer, follow these steps:
Procedure1. Right-click the Alarm Definition.2. Select Save from the context menu.
Alternatively, you can save an Alarm Definition by clicking the Save icon onthe toolbar, or by selecting Save from the File menu.Once an Alarm Definition has been saved, it can be activated, allowing alarmsto be raised against the Alarm Definition.
Save an Alarm Definition in a different layerSaving an Alarm Definition to a different layer will cause the Alarm Definition tobe copied to the specified layer.
About this task
To save an alarm definition in a different layer, follow these steps:
218 IBM Tivoli Netcool Performance Manager: User Guide

Procedure1. Right-click on the Alarm Definition.2. Select Save As from the context menu.
Alternatively, you can save an Alarm Definition by selecting Save As from theFile menu.
3. In the Save As dialog, select the layer within which you wish to save theAlarm Definition.
4. In the Name field, rename the Alarm Definition as required.5. Click OK.
Once an Alarm Definition has been saved it can be activated, allowing alarmsto be raised against the Alarm Definition.
Activate an Alarm DefinitionAfter an Alarm Definition has been created it can be activated, allowing alarms tobe raised against the Alarm Definition.
About this task
To activate an Alarm Definition, follow these steps:
Procedure1. Select the Alarm Definition from the Alarm Definition Tree.2. Right-click the Alarm Definition.3. Select Activate to make the Alarm Definition active.
A green tick next to an Alarm Definition indicates that an Alarm Definition iscurrently active.
Deactivate an Alarm DefinitionAn Alarm Definition can be deactivated. In this case alarms will cease to be raisedagainst the Alarm Definition, but those already raised will continue to be visiblewithin the system.
About this task
To deactivate an Alarm Definition, follow these steps:
Procedure1. Select an Alarm Definition from the Alarm Definition Tree.2. Right-click the Alarm Definition.3. Select Deactivate to make the Alarm Definition inactive.
A red cross next to an Alarm Definition indicates that an Alarm Definition iscurrently inactive.
Chapter 13. Alarm Manager 219

View the status of an Alarm DefinitionAbout this task
To view active Alarm Definitions, follow these steps:
Procedure1. From the View menu, select Alarm Definition States.2. Select Active from the Alarm Definition States field.
The active alarms are listed showing the name and version number of theAlarm Definition and the layer to which it belongs.To view inactive Alarm Definitions, follow these steps:a. From the View menu, select Alarm Definition States.b. Select Inactive from the Alarm Definition States. field.
The inactive alarms are listed showing the name and version number of theAlarm Definition and the layer to which it belongs.
Update an Alarm DefinitionBy updating an Alarm Definition you modify the Alarm Definitions currentparameters. You can only update an Alarm Definition if the Alarm Definition iscurrently inactive.
About this task
To update an alarm definition, follow these steps:
Procedure1. Select an Alarm Definition from the Alarm Definition Tree..2. Double-click the Alarm Definition.3. Update the parameters of the Alarm Definition using the following tabs:
“The General tab” on page 214“The Alarm Predicate tab” on page 214“The Attribute Filter tab” on page 215 (Advanced View)“The Network Filter tab” on page 215 (Advanced View)“The Constraint tab” on page 215 (Advanced View)“The Options tab” on page 217 (Advanced View)“The X.733 tab” on page 217 (Advanced View)
4. Either:v Save the Alarm Definition within the current layer,
orv Save the Alarm Definition to a different layer
220 IBM Tivoli Netcool Performance Manager: User Guide

Delete an Alarm DefinitionYou can only delete an Alarm Definition if the Alarm Definition is currentlyinactive.
About this task
To delete the current version of an Alarm Definition, follow these steps:
Procedure1. Select the Alarm Definition from the Alarm Definition Tree.2. Right-click the Alarm Definition.3. Select Delete.4. Click Yes to confirm the deletion of the Alarm Definition.
To delete all versions of the Alarm Definition:a. Select an Alarm Definition from the Alarm Definition Tree. .b. Right-click the Alarm Definition.c. Select Delete All .d. Click Yes to confirm the deletion of the Alarm Definition.
Chapter 13. Alarm Manager 221

222 IBM Tivoli Netcool Performance Manager: User Guide

Chapter 14. Tools
Tivoli Netcool Performance Manager software provides tools that help you withyour reporting tasks. The following topics provide descriptions and procedures forusing some of the tools included with the software.
User administrationWith Tivoli Netcool Performance Manager User Administration tool you canconfigure a wide range of ways for users to access Tivoli Netcool PerformanceManager, using:v usersv groupsv rolesv privileges
Note: Only users with the appropriate privileges can access the UserAdministration tool, system administrators for example. All users can use theAccount Management tool to change their password, see
Information about using this tool is detailed in the Administering Tivoli NetcoolPerformance Manager - Wireless Component.
Data availabilityData availability describes the completeness of data for a report.
The following topics review data availability basics and provide procedures onhow to use the data availability tool.
Why use the Data Availability tool
Occasional transmission problems occur between data servers and the networkelements in the wireless network, which can result in missing traffic data. Missingdata can distort the validity of your reports.
You use the Data Availability tool to determine whether the data for a reportingperiod is complete enough to give meaningful results for your report.
© Copyright IBM Corp. 2006, 2015 223

Data availability page
Data SourceThe data source to be viewed.
View The view used to display availability results, there are three views:v Summary - for more information, see Summary viewv Instance - for more information, see Instance viewv Missing Files - for more information, see Missing Data view
The default view is Summary.
IntervalThe time interval for which data availability is displayed:v min 15v min 30v hourv dayv weekv month.
The default value is Days . The To and From date of the view determinethe number of time intervals in each bar in the results graphs.
From and ToThe date range for the data availability view.
Only Missing DataDisplay only those rows that have data missing. Omits rows with 100%data.
Sort bySort the results by:v Unsorted (default)v Data Typev Missing datav Instance
224 IBM Tivoli Netcool Performance Manager: User Guide

Sorting by data type allows you to display the rows in ascending ordescending order of the data type, or instance ID that names the row,alphabetically or numerically as required. Sorting by missing data allowsyou to display the rows in ascending or descending order based on theamount of data missing.
Rows Number of rows to display per page. This is set in Preferences. for moreinformation, see Preference Option Descriptions.
SearchClick to display the data availability based on the selections made.
Data availability viewsThe data availability tool allows you to see data availability from a number ofdifferent perspectives:v Summaryv Instancev Missing files
Summary viewA Summary view shows you the data availability for entities, the entity isrepresented by a data type.
In the following figure, data is shown for a cell entity as represented by the DataTypes Cell.
For an explanation of entities, see “Entity types and instances” on page 87.
Instance viewAn Instance view shows the data availability for the individual instances of anentity that is selected by an Instance ID, as illustrated in
The Instance view can also be represented in a table, as illustrated in the followingfigure.
Chapter 14. Tools 225

For each entity instance, the table gives the following information:v Data type - data typev Instance ID - entity instance identifier.v Frequency - number of intervals loaded.v Percentage - percentage of data available for period.v Loaded - time that is written to database.v Start Time - period start time.v First Available - first reading available for periodv Period - period.
Missing data viewThe Missing Data view shows data files that fail to load or are partially loaded, asillustrated in the following figure.
For each file, the table gives the following information:v File name - name of file.v File description - description of file.v Failed load time - time load was attempted.v Partially loaded - true or false.
226 IBM Tivoli Netcool Performance Manager: User Guide

Navigating and understanding data availability viewsThe tabs in the Data Availability screen can be used to display the different dataavailability views.
Using Data Availability tabs
Before a view can be displayed the appropriate data availability search must firstbe completed. See “Checking data availability” on page 228.
The following picture shows the Data Availability tabs.
Minimizing graphs and tables
The results for a Data Availability search can be minimized using the Undockbutton. An Undocked view can be restored, minimized or closed using the
appropriate button.
Resetting the search options dialogYou can reset the Search Options dialog to display the settings you last used for aparticular view.
About this task
To reset search options:
Procedure1. Open the view that you want to reset search options for, by clicking the
appropriate tab.
2. Click Reset .
Reporting intervalThe reporting interval is the time segment for which data availability isdetermined.
Data availability can always be shown in monthly, weekly, daily, hourly, andsub-hourly intervals. The following figure shows the time intervals for a singledata type, which is represented by the colored bar. In this example, the barcontains seven (7) time intervals or segments . Each segment displays the dataavailability for 24-hours worth of data.
Chapter 14. Tools 227

You can place your mouse cursor over a segment to view the start and end timefor that segment.
Full, Partial, Not AvailableThe data availability legend contains three color codes that you can use to interpretthe degree of data availability of the system. These are:
Full green colored -- Indicates that data is 100 percent complete for the giventime interval.
Partial yellow colored -- Indicates that some but not all the data is missing for thegiven time interval. You can interpret Partial in one of two ways, asexplained below.
Not Availablered colored -- Indicates that no data is available for the given time interval.
Partial data often represents averaged data availability of lower-level timeintervals. When lower-level time intervals are rolled up into a higher-level timeinterval for example, hourly to daily, the data availability of the lower-level timeintervals are averaged. For example, if a day shows Partial , it could be that certainhours have no data or some data.
Therefore, a rolled-up time interval that has the partial color code could besignalling a more serious data availability problem. You can drill-down into thedata to perform further analysis (see “Analyzing availability results” on page 230).
Conversely, if the time interval represents the lowest time granularity for thesystem (for example, 30 minutes), then Partial simply indicates that some of thedata is missing and you cannot investigate further.
Checking data availabilityUse the following procedures to check data availability.
About this task
To check data availability:
Procedure1. Open the Data Availability screen.
a. Click Tools to open the Tools page.b. From the Tools list, select Data Availability . The Data Availability screen
and Search Options dialog are displayed.In the Search Options dialog:
2. Select the data source from the DataSource list box.3. Select the view from the View list box. for more information about views see,
“Data availability views” on page 225.4. In the Interval list box, select a time interval. You can select an option that is
equal to or one step lower than the time interval of the date range. Forexample, if the date range includes two weeks (14 days), you can select eitherof the options Weeks or Days.
5. Specify the date range (start and end date) for the data availability view:a. In the From text box, enter a date (dd/mm/yyyy), or click the calendar tool
and select a date from it. If required, in the time boxes directly to the rightof the From box, select the starting hour and minutes.
228 IBM Tivoli Netcool Performance Manager: User Guide

b. In the To text box, enter a date (dd/mm/yyyy), or click the calendar tool andselect a date from it. If required, in the time boxes directly to the right ofthe To box, select the ending hour and minutes.
Note: If the date range is not reportable in whole units of the reportinginterval chosen, the view will be rounded up to the next whole interval. Forexample, if the date range is ten days and the reporting interval is a week,the view will represent two weeks, adding four days to the range.
6. Summary and Instance views only: select the entity and data types.
a. Click the entity type in the Entity list.b. Click the data type in the Data Type list.
7. Instance view only, select the instance targets.
Depending on the data type selected, a number of instances are displayed inthe Instances Available list. Only instances in the Instances Available list areincluded in the search.v Select the instances that you want to include in the search, by selecting the
instances in the Instances Available list and clicking the appropriate arrowbutton to move the instances to theInstances Available list.You can set a limit to the number of instances that are displayed by enteringa value in the Filter Instances Available field (box 1 in the image). You canalso filter the Instances that are displayed in the Instances Available list, byentering filter criteria (box 2 in the image. You can use wildcards. Forexample, entering 1*, returns all instances that beginS with 1.
8. Summary and Instance views only, you can select:
Rows Number of rows to display per page. The maximum is set inPreferences, see “Preference option descriptions” on page 9.
Only Missing DataDisplay only those rows that have data that is missing.
Sort bySort the results by:v Unsorted (default)v Sort by Data Type
Chapter 14. Tools 229
v Sort by Missing Data
Sorting by data type displays the rows in ascending or descendingorder of the data source, file, entity, or instance ID that names the row,alphabetically or numerically as required. Sorting by missing datadisplays the rows in ascending or descending order that is based on theamount of data that is missing.
9. Click Search to display the data availability.You can now analyze the results. See “Analyzing availability results.”
Analyzing availability resultsThis procedure assumes that a summary is created or entity instance dataavailability view, and are ready to analyze the resulting view.
About this task
You frequently analyze a data availability view to determine which part of thesystem is either missing data or has partial data. You achieve this by drilling downinto the time intervals of a data source, viewing data availability for progressivelysmaller interval of times and, until you have drilled-down to the lowestgranularity of time, checking the data availability for each individual entityinstances (network elements) within the data source.
To analyze availability results:
Procedure
Drill down to view data availability for smaller time intervals. You drill down intoa view by repeatedly selecting time intervals. Each time that you click a timeinterval, the next lower time interval is displayed.1. Click a time interval of interest. The page refreshes. You see the data
availability for only the selected interval.2. To continue drilling down into the data incrementally, repeat step a.
Changing your passwordYou can change your password at any time by using the account management tool.
About this task
Note that you can change only your password; you cannot change your login ID.
To change your password:
Procedure1. If you did not already, open the Change Password screen.
a. Click Tools to open the Tools page.b. From the Tools list box, select Account Management as illustrated in the
following figure.
230 IBM Tivoli Netcool Performance Manager: User Guide
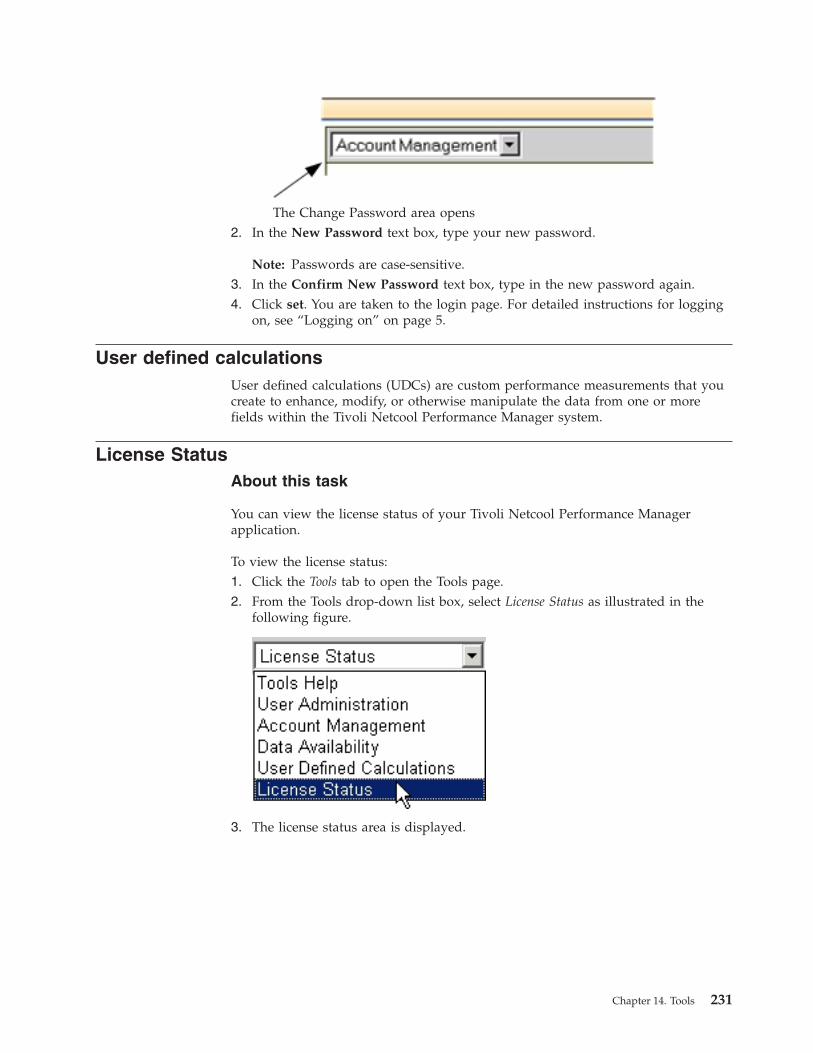
The Change Password area opens2. In the New Password text box, type your new password.
Note: Passwords are case-sensitive.3. In the Confirm New Password text box, type in the new password again.4. Click set. You are taken to the login page. For detailed instructions for logging
on, see “Logging on” on page 5.
User defined calculationsUser defined calculations (UDCs) are custom performance measurements that youcreate to enhance, modify, or otherwise manipulate the data from one or morefields within the Tivoli Netcool Performance Manager system.
License StatusAbout this task
You can view the license status of your Tivoli Netcool Performance Managerapplication.
To view the license status:1. Click the Tools tab to open the Tools page.2. From the Tools drop-down list box, select License Status as illustrated in the
following figure.
3. The license status area is displayed.
Chapter 14. Tools 231

The license status area is displayed.
Archiver tool usageNC tables space continues to grow naturally over time on some systems.
The nc_archiver_admin script runs and cleans the NC tables in a two phases, firstit gathers the network configuration data for deletion and in the second phase itdeletes the data when the loaders are stopped thus minimizing the downtime thatis required while the housekeeping takes place.
The usage information for this script is as follows:nc_archiver_admin -n {all | <nc_table_name>} {-t <date> | -o <number_of_days> } -d <archive_directory> {-c <true | false> } { -f <path>}
Where:
-nThe entity table name that the Network Configuration data is to bearchived from.
-tThe time from which older historical Network Configuration
entries are archived or deleted.Date format used with -t option is MM/dd/YY.For example -t 07/30/99The date specified must not be in the future.
-oNumber of days to keep historical Network Configuration.
entries. All entries older then the specified number of dayswill be archived.
[-c]Whether to commit the entity removal or just output removable entitiesto a file.
If not specified when -d is specified, defaults to false.This option is ignored if -f is specified.
[-d]Specifies the directory where the CSV file is to be written to.
If not specified the data in NC table will be deleted withoutbeing written to CSV output file. This has no effect if -f is
specified
[-f]Path to a csv file of entities to delete. The file can be generated by
running this tool with -c set to false.
-h(elp)Display help information.
232 IBM Tivoli Netcool Performance Manager: User Guide
-uWhether to delete rehomed data from entity table and update the performance tables to use most recent instance of entity data. The -c option
Note: All running loader processes such asnc_cache and alarm_cachemust be stopped before you remove entities with this tool. Loaders and cachesneed not be stopped when commit [-c] is set to false.
Archiving an NC tableNC tables space continues to grow naturally over time on some systems. Thenc_archiver_admin tool is used to archive network configuration data. Typically,the nc_archiver_admin tool archives an NC table that contains data later that 10days.
About this task
The nc_archiver_admin script runs and cleans the NC tables in two phases:1. Initially, the archiver tool gathers the network configuration data for deletion.
The loaders are not stopped at this stage.2. Then, the archiver tool deletes the data. The loaders are stopped at this stage
thus minimizing the downtime that is required while the housekeeping takesplace.
Procedure1. To archive an NC table, run the following command:
nc_archiver_admin -n nc_bsc -o 10 -d nc_archive/ -c false For example,archive the nc_bsc table.The NC instances are not deleted but are exported to a file:<nc_archive>/nc_bsc.csv. The directory is stated with the -d option.
2. Review the nc_bsc.csv file, and then remove NC instances that are not to bearchived from the csv file.
3. Run the following command to remove the NC instances:nc_archiver_admin -n nc_bsc -c true -f ./nc_archive/nc_bsc.csv
Note: All running loader processes must be stopped before you remove theentities with this tool.For more information about the usage of the nc_archiver_admin tool,see“Archiver tool usage” on page 232
Chapter 14. Tools 233

234 IBM Tivoli Netcool Performance Manager: User Guide

Chapter 15. User Defined Calculations
User Defined Calculations (UDCs) are performance measurements that you create.This is in contrast to the other performance measurements that are created at thetime of system setup and not subject to modification.
The following sections introduce key UDC concepts and provide procedures forcreating and editing UDCs.
Who creates UDCs?To successfully create UDCs, you must understand mathematical and algebraicexpressions. To create UDCs, you also need the appropriate permissions. Yoursystem administrator controls user access and permissions.
UDC basics
The following sections review the key concepts that underlie User-DefinedCalculations.
When to create UDCsAs a general guideline, you create a UDC when:v You want to create a performance measurement that is not already on your
system.v You want to build a complex expression (more than one field or operator).
Expressions and aggregation typesThe two most important components of a UDC are the:
ExpressionRepresents the mathematical computation. For more information, seeChapter 16, “UDC expressions and function reference,” on page 249, formore information.
Aggregation typedetermines how data values are aggregated (rolled-up) over time andelement. For more information, see “How aggregation is applied” on page93 and Chapter 17, “Aggregation types,” on page 279, for moreinformation.
Expressions and aggregation types are critical because they affect how TivoliNetcool Performance Manager software calculates the resulting values of the UDC.
Expressions consist of fields, operators, functions, and constants. The aggregationtype informs Tivoli Netcool Performance Manager software how to aggregate overtime and over element.
© Copyright IBM Corp. 2006, 2015 235
Stored Busy HoursYou can use Stored Busy Hours (SBH) KPIs in the creation of a UDC with thefollowing limitations, you cannot:v create a UDC using busy hour KPIs from different busy hour definitionsv create a UDC that uses SBH fields with different intervalsv create a UDC that uses SBH fields from different SBHsv create a UDC that uses SBH fields mixed with a raw KPIv create a UDC that uses SBH fields mixed with a summary KPIv nest SBH UDCs, to create a UDC that uses UDCs created with SBH fields.
Note: These limitations do not apply to the creation of trending UDCs, which canalso use SBH KPIs. If you are creating an SBH UDC, the SBH field is not listed inthe Field Type list. It is listed based on the source SBH definition and interval.
Roll-Up values for UDCsWhen you create a UDC, you can select two entities in succession in the program.The first entity is the entity against which you want to apply the UDC. In thesecond entity, you can select a field from the same or lower level. If you select thefield from a lower level, you can then roll up the values to higher-level entity. Thisassumes that you also select the higher-level entity as the focal entity.
Note: This does not apply to trending UDCs, only SBH KPI fields at the focalentity level can be selected.
Example: You want to roll up cell values to the Switch level. While you create theUDC, you select Switch as your first entity. You then select "Cell" for your secondentity and build an expression with cell-level fields. While you create the reportdefinition, you would select Switch as your focal entity and include the SwitchUDC that you created as one of the fields in the report as illustrated in the givenexample.Switch
Cell
Antenna
Switch.myUDC = (Cell.Field_A * Cell.Field_B)
The report definition is built with a focal entity of Switch and contains the fieldSwitch.myUDC.
Expressions in UDCsAn expression is the mathematical component of a UDC.
This section of the guide covers the following:
Building blocks of an expressioninclude fields, operators, functions, and constants.
Expression syntaxvaries according to the expression type. The more common expressiontypes are arithmetic, conditional, and functional.
236 IBM Tivoli Netcool Performance Manager: User Guide

Expression building blocksExpressions consist of a number of fields, operators, functions, and constants.These items are covered in the sections below.
FieldsWhen you create a UDC, you select an entity with which to associate the UDC.The fields that you can select for an expression depends upon the entity youselected for the UDC.
You can select a field from the same entity level or from the ancestors ordescendants of the entity. You can select from a number of different field types, see“Traffic fields” on page 89
When you select a field for an expression, it takes the following form in the UDCtool:[<entity>]![<field_name>]
Where the exclamation mark (!) indicates the entity in which the field is found.
Example:[Cell]![Drp_Call]
Note: If you are selecting a field that is from the same entity you selected for theUDC, you can use the shorter form, which drops the brackets and exclamationpoint (!): < field_name >. For example: Drp_Call
ConstantsConstants (also referred to as literals) are values that do not change.
OperatorsThe UDC tool offers a variety of operators: unary, binary, logical, arithmetical. SeeChapter 16, “UDC expressions and function reference,” on page 249, for moreinformation on operators.
FunctionsFunctions are predefined formulas that perform calculations by using arguments ina particular order.
See Chapter 16, “UDC expressions and function reference,” on page 249, for moreinformation on operators.
Expression syntaxThe following table lists the syntax of the types of expressions most commonlyused in UDCs:
Table 75. Expression syntax
ExpressionType Syntax
ArithmeticUnary operator expression
Binary expression operator expressionNote: Arithmetic operations can use both unary and binary operators.
Chapter 15. User Defined Calculations 237
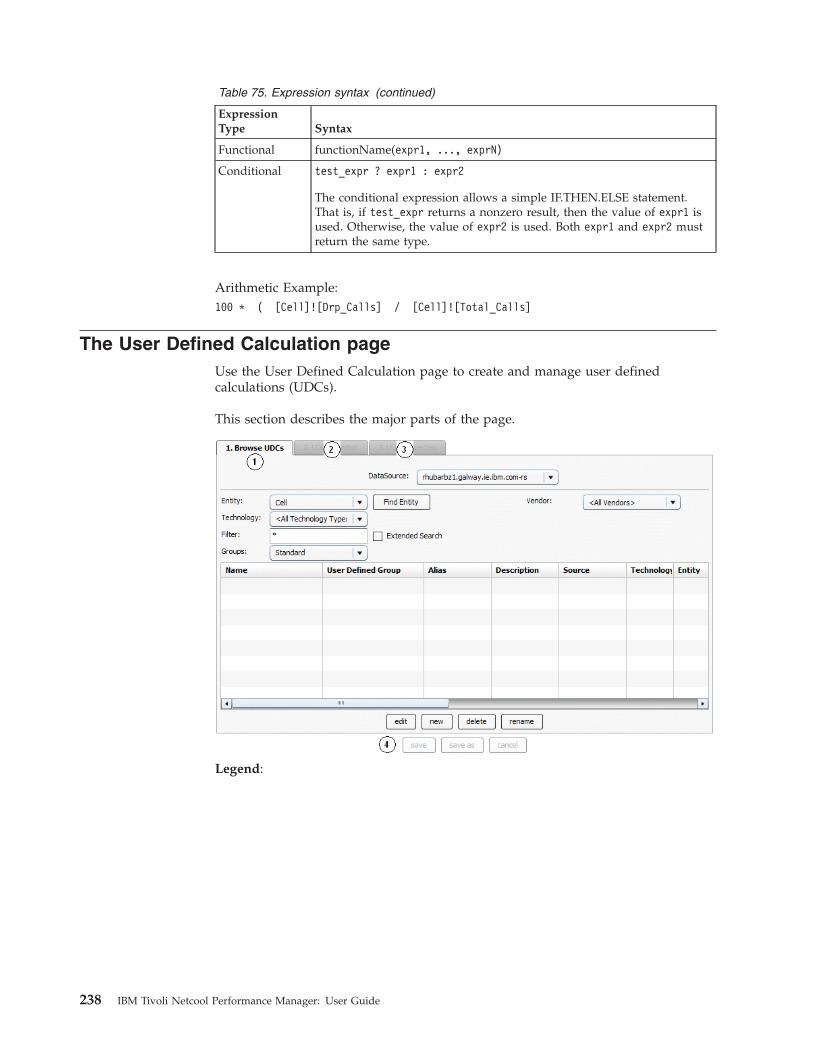
Table 75. Expression syntax (continued)
ExpressionType Syntax
Functional functionName(expr1, ..., exprN)
Conditional test_expr ? expr1 : expr2
The conditional expression allows a simple IF.THEN.ELSE statement.That is, if test_expr returns a nonzero result, then the value of expr1 isused. Otherwise, the value of expr2 is used. Both expr1 and expr2 mustreturn the same type.
Arithmetic Example:100 * ( [Cell]![Drp_Calls] / [Cell]![Total_Calls]
The User Defined Calculation pageUse the User Defined Calculation page to create and manage user definedcalculations (UDCs).
This section describes the major parts of the page.
Legend:
238 IBM Tivoli Netcool Performance Manager: User Guide

No. Description
1 Browse UDCs allows you to:
v View existing UDCs
v Initiate® creating a new UDC
v Select an existing UDC to edit or delete
Buttons on the Browse UDCs tab:
v Find Entity - Click to search for an entity type.
v Edit - Click to edit a UDC.
v New - Click to created a new UDC.
v Delete - Click to deleted a UDC.
v Rename - Click to rename a UDC Note: This button is only available ifyou have certain privileges. See “Renaming prerequisites” on page 246.
2 UDC Definition - Allows you to build and validate an expression for aUDC.
3 UDC Properties - Allows you to do the following for a UDC:
v Enter descriptive information about an expression such as its name
v Set options that affect how Tivoli Netcool Performance Manager softwarehandles data values in the report output. This includes selecting anaggregation type.
4UDC interface buttons
These buttons are available from all three tabs in the UDCinterface.
v Save - Click to save a new or modified UDC.
v Save As - Click to save a UDC as a new UDC.Note: If you want to rename a UDC, use Rename on theBrowse UDCs tab.
v Cancel - Click to clear any changes made to the UDC.
Opening the User Defined Calculation PageThe UDC tool is available from the Tool tab. Use the following procedure foropening the UDC tool.
About this task
To open the User Defined Calculations tool
Procedure1. Click Tools.2. Select User Defined Calculations from Tools list box. The User-Defined
Calculations page appears with the Browse UDCs tab forward. For anexplanation of the tab, see The User Defined Calculation Page.
Chapter 15. User Defined Calculations 239

Finding a UDCUse the following procedure to find a UDC.
About this task
The following procedure assumes that the UDC tool is open, with the BrowseUDCs tab forward (see Opening the User Defined Calculation Page).
To find a UDC:1. From the DataSource list box, select the data source that has the UDC you
want to find.2. Using the Entity drop-down list box or Find Entity, select the entity type with
the UDC you want to view.3. Optional -- To reduce the number of fields returned, use one or more of the
following options:
TechnologyLists only UDCs with the selected technology type.
vendorLists only UDCs for the selected vendor. UDCs can be displayed for aspecific vendor and for all vendors. Vendor neutral UDCs can also bedisplayed.
GroupsStandard, User Defined Group, or All.
Standardlists only UDCs that use standard field names defined by a field'stechnology pack.
User Defined Grouplists only UDCs that are members of a user defined group and UDCsthat use user-defined field names, these field names are called aliases.All lists all UDCs.
Filter Lists only UDCs whose name or source matches the characters that youenter in the box. You can use the asterisk character as a wildcard.
Extended SearchWorks with the Filter box to also search the text in the Heading1,Heading 2, and Description columns of the UDC. All the UDCsassociated with the selected entity are displayed in the grid.
4. To find the UDC you want, scroll through the list, use the Filter box, or clickthe headers to list the column contents in ascending or descending order.
Creating a UDCThis section contains the procedures for creating a UDC.
240 IBM Tivoli Netcool Performance Manager: User Guide

UCD creation processAbout this task
The process for creating a UDC is as follows:
Procedure1. When you create a UDC, you must first select the entity to which you want to
apply the UDC. For example, if you selected the Cell entity, the UDC wouldbecome available at the Cell entity level. For procedures, see Selecting an InitialEntity for a UDC.
2. You next build and validate an expression for the UDC.a. You select an entity that contains the fields that you want to include in the
UDC. You can select the entity that you selected in step 1, or you can selecta lower-level entity and create UDCs with fields from that level.
Note: If you select fields from a lower level, the values roll up to thehigher-level entity. For more information, see Roll-Up Values for UDCs.
b. You then use the fields of the entity you selected along with operators,functions, and constants to build an expression. (For general informationabout expressions, see Expression Building Blocks.)
c. After you complete the expression, you can validate it. Validation checks forthe correct use of expression syntax. For procedures, see Building andValidating Expressions.
3. At the end of the creation process, you name the UDC and set additionalproperties. After you save the UDC, the new UDC is listed as a field under theentity you selected in step 1. For procedures, see Setting UDC Properties.
Selecting an initial entity for a UDCSelect an entity to which you want to apply the UDC.
About this task
The following procedure assumes that the UDC tool is open ( See Opening theUser Defined Calculation Page) and that the Browse UDCs tab is forward.
To select an entity for a UDC:
The next step is Building and Validating Expressions.
Procedure1. From the DataSource list box, select the data source that you want.2. Using the Entity list box or Find Entity, select the entity type that you want to
create a UDC for.
Chapter 15. User Defined Calculations 241

3. Create a new UDC by clicking New at the bottom of the tab. The UDCDefinition tab comes forward. The selected entity is displayed in the UDCDefinition tab (as shown in the following figure), and its fields are listed in thefields grid.
Building and validating expressionsUse the following set of procedures to build and validate an expression for a UDC.
The procedure assumes that UDC Definition is selected.
Building an expressionUse the following procedure to build an expression for your UDC. You can buildan expression by using any of the following items: Fields, operators, functions, andconstants or literals (content that you type).
About this task
Note: There is a limit of 3500 characters that can be used to build an expression. Inthe unusual circumstance of a UDC requiring more than 3500 characters, the UDCmust be broken down in to smaller UDCs or subexpressions that can then be usedin a higher level UDC expression. See Large expressions.
To build an expression:
Procedure1. To add a field to the expression, perform the following steps:
a. Select the entity with the fields you want to include in the expression. Keepthe same entity level or select another entity level by using the Entity listbox or Find Entity. You can use the technology, vendor and field type listboxes to limit the fields that are returned by technology, vendor, and fieldtype.To reduce the number of fields in the field pane, use one or more of thefollowing options:
TechnologyLists only the fields with the selected technology type.
vendorLists only the fields for the selected vendor. Fields can be displayedfor a specific vendor and for all vendors. Vendor neutral fields canalso be displayed.
GroupsStandard, User Defined Group, or All.
StandardLists only fields that use standard field names that are defined by afield's technology pack.
242 IBM Tivoli Netcool Performance Manager: User Guide

User Defined GroupLists only fields that are members of a user-defined group andfields that use user-defined field names, these field names are calledaliases.
All Lists all fields.
Filter Lists only fields whose name or source matches the characters thatyou enter in the box. You can use the asterisk character as awildcard.
Extended SearchWorks with the Filter box to search the text in the Heading 1,Heading 2, and Description columns of the field.
Use Refresh Fields to display the fields for the selected entity and filters.
Note: If you select a field from a lower-level entity, you can roll up theUDC values. For more information, see Roll-Up Values for UDCs.
b. To add a field to the expression, select the field type from the Field Typelist. See “Traffic fields” on page 89, for more information. If you are creatinga trending UDC, you select the expression first and then the field, and thenenter any literals (content that you type). See “Trending functions” onpage 273 for more information.
Note: If you are creating an SBH UDC, the SBH field is not listed in theField Type list. It is listed based on the source SBH definition and interval.
Refresh the fields grid using the Refresh Fields button. Drag the field to theexpression pane (2 in ). You can also select a field by double-clicking it.
If you have selected an SBH field type you must also select the SBHdefinition from SBH Definition list box.
2. To select an operator for the expression, click one of the buttons on theoperator button bar as indicated in the following figure.
Chapter 15. User Defined Calculations 243

3. To select a function for the expression, find and click the function that youwant from the Functions pane. The selected function is displayed in theexpressions pane.
4. To add a constant to the expression, place the mouse cursor in the expressionwhere you want the value and type. The entered values are displayed in theexpression pane.
Validating an expressionUse the following procedure to validate an expression.
About this task
This procedure assumes that an expression is built and that it is displayed in theexpression pane of the UDC Definition tab.
To validate an expression:
Procedure
Click Validate, which is on the UDC Definition tab.
1. If the expression is valid, you see a Validation succeeded message.2. If the expression is invalid, you see an Error message with information on the
error.
Large expressionsAn expression cannot exceed 3500 characters. Large expressions can be divided into a number of sub-expressions. This involves:v Dividing the large UDC expression into logical sub-expressionsv Creating separate UDCs for these sub-expressionsv Creating a top level UDC that uses the sub-expression UDCs
The following is an example of a large UDC with a number of sub-expressionUDCs. The example is provided in a top-down manner. There are two levels ofsub-expressions: the top level UDC CSSR_% uses the first level sub-expression UDC
244 IBM Tivoli Netcool Performance Manager: User Guide

cssr. The sub-expression UDC cssr uses second-level sub-expression UDCs:cssr_1, cssr_2, cssr_3, cssr_4, cssr_5, cssr_6. This hierarchical approachimproves readability and maintenance of the UDC.CSSR_%
NullValue(100 * [Cell]![cssr] ,100)
cssr
[Cell]![cssr_1] * [Cell]![cssr_2] * [Cell]![cssr_3] *[Cell]![cssr_4] * [Cell]![cssr_5] * [Cell]![cssr_6]
cssr_1
1 - ( [Cell]![{Nokia.Resource_Availability.sdcch_cong_time}] /3600)
cssr_2
1 - (IsNull([Cell]![{Nokia.Traffic.sdcch_assign}]) ?"0":([Cell]![{Nokia.Traffic.sdcch_assign}] = "0" ? "0": ([Common_Control_Channel]![{Nokia.Resource_Access.imm_assgn_rej}] -[Cell]![{Nokia.Traffic.sdcch_busy_att}] ) /[Cell]![{Nokia.Traffic.sdcch_assign}]))
cssr_3
1 - ( (1 - Exp(-( [Cell]![imasrs] )/2500)) *(IsNull([Cell]![imasrs]) ? "0":([Cell]![imasrs] = "0" ? "0":[Common_Control_Channel]![{Nokia.Resource_Access.del_ind_msg_rec}]/ [Cell]![imasrs] )))
cssr_4
1 - (IsNull( [Cell]![Assignments]) ? "0":( [Cell]![Assignments] ="0" ? "0": [Cell]![sdfailall] / [Cell]![Assignments]))
cssr_5
1 - ( IsNull([Cell]![{Nokia.Traffic.tch_call_req}]) ?"0":([Cell]![{Nokia.Traffic.tch_call_req}]= 0 ? "0": ([Cell]![{Nokia.Traffic.tch_call_req}] -[Cell]![{Nokia.Traffic.tch_norm_seiz}] - [Cell]![outgostho] ) /[Cell]![{Nokia.Traffic.tch_call_req}]))
cssr_6
1 - (IsNull([Cell]![{Nokia.Traffic.tch_norm_seiz}]) ?"0":([Cell]![{Nokia.Traffic.tch_norm_seiz}] = "0" ? "0": ([Cell]![{Nokia.Traffic.tch_act_fail_call}] /[Cell]![{Nokia.Traffic.tch_norm_seiz}] )))
Setting UDC propertiesAbout this task
When you set UDC properties, you:v Provide descriptive information about the expression you createdv Set options that affect how Tivoli Netcool Performance Manager software
handles data values in the report output
UDC properties are displayed in the report definition or Field Selections sectionand in the Browse UDCs tab. The UDC Properties page is only active when youare editing or creating a UDC.
To set UDC properties:
Procedure1. Click the UDC Properties tab. The UDC Properties page opens.2. Enter a name for the UDC in the Name field.
Chapter 15. User Defined Calculations 245

3. Configure the following fields to provide descriptive information for the UDC.The descriptions appear along with the UDC name in Browse UDCs tab. Theyalso appear in the Field Selections area of the report definition page. It assistsusers in finding a UDC.v Descriptionv Heading Line 1, Heading Line 2
4. Select an aggregation type from the Aggregation Type list box. The defaultvalue is Average. The aggregation type of a UDC determines how data isaggregated over time and over element. For a list of aggregation types andtheir descriptions, see Chapter 17, “Aggregation types,” on page 279
5. Select a data type from theData Type list box. The default is Float.6. If the UDC is complex, check the Complex? check box. When you schedule or
run a report that has a complex UDC, you will receive a warning message anda prompt to continue or cancel the report. A complex UDC is one thatreferences fields that are multiple levels down from the entity you selected forthe UDC. A complex UDC uses a large amount of system resources because theserver must roll-up (aggregate) all the data associated with the lower-levelfields.
7. Select the types of technologies to which this UDC will apply from theTechnology check boxes.
8. When you are finished, do one of the following:a. Click Save. If you are saving a new UDC, the name is listed in the field
pane on the Browse UDCs tab.b. To cancel and start over, click Cancel.
Renaming a UDCRenaming a UDC allows you to change the name of an existing UDC. BecauseUDCs are referenced by other Tivoli Netcool Performance Manager components,the software automatically updates all references to previous name to the newname. For example, if you have a report definition that includes the UDC as afield, the new name of the UDC automatically replaces the previous name.
Renaming prerequisitesAbout this task
To rename a UDC, all the following must be true:v You are the owner of the UDC on the server, or you are administrator of the
server that has the UDC.v You have the Tivoli Netcool Performance Manager privilege Rename UDCs.v The server supports UDC renaming.
When all the above conditions are met, the Rename button is displayed on theUDC tool interface. Otherwise, the button is not displayed.
246 IBM Tivoli Netcool Performance Manager: User Guide

How to Rename a UDCAbout this task
When you rename a UDC, the software first validates the UDC. If the UDC isvalid, the software:v Changes the name on the system and updates all dependent items. That is, the
software updates all templates, busy hours, and other items on the server thatreference the UDC.
v Makes similar updates on the local Virtuo server.v Pushes out the changes to other Virtuo servers that reference the renamed UDC.
The following procedure assumes that the UDC tool is open ( See Opening theUser Defined Calculation Page).
To rename a UDC:
Procedure1. Find and select the UDC you want to rename. (See Finding a UDC for
instructions.)2. Click the Rename button. The Rename UDC dialog box opens.3. Type a new name and click OK.4. You receive a message that the name was successfully changed. Click OK.
Deleting a UDCAbout this task
Delete a UDC when it is no longer needed.
Note: To delete a UDC, you must be set up as a Tivoli Netcool PerformanceManager system administrator or user on the server.
The procedure assumes that the UDC tool is open ( “Opening the User DefinedCalculation Page” on page 239).
Procedure1. Find and select the UDC you want to delete. (See “Finding a UDC” on page
240 for instructions.)2. Click the Delete button. You are prompted to confirm deletion.
a. Click Yes to delete the UDC.b. Click No to cancel.
Note: When you delete a UDC any reference to the UDC becomes invalid.For example, any report definition using the UDC.
Chapter 15. User Defined Calculations 247

248 IBM Tivoli Netcool Performance Manager: User Guide

Chapter 16. UDC expressions and function reference
This section introduces expressions and provides examples of the use ofexpressions, functions and operators in the creation of UDCs.
General expressionsAn expression is a way of calculating a new value or result from existing fields.For example, calculating A/B*100 from 2 pegs A and B.
An expression can be made up of:v Other expressions including Pegs and PCalcs (delivered with a technology pack)v UDCs (User defined expressions).
Important: An expression must contain at least one KPI. Reports without KPIs arenot supported. See “Computation for complex KPIs” on page 280
ElementsExpressions follow the basic concepts of unary, binary, and conditional expressions.
Table 76. Expressions - elements
Element Description
Unary Expression in the form: operator expression.
Binary Expression in the form: expression operator expression.
Conditional Expression in the form: expression ? expression : expression.
Constant Literal Integer, and Float values.
Function Expression in the form: functionName (expr1, ..., exprN)
RemarksThe following case-insensitive tokens are reserved for use as keywords inexpressions:AND OR (INT) (FLOAT)
The following characters are used as operators for punctuation:! - + * / % ^
ExamplesThe table below shows some simple examples of expressions built up from Pegs ina neutral technology pack, including unary, binary, conditional operators andfunctions.
Table 77. Expressions - examples
Expression Description
[Cell]![{Neutral.tch.call_seizure_failures}] Basic example of unaryoperator to negate a KPI.
© Copyright IBM Corp. 2006, 2015 249

Table 77. Expressions - examples (continued)
Expression Description
[Cell]![{Neutral.tch.call_seizure_successes}] /[Cell]![{Neutral.tch.call_seizure_attempts}] *100
Binary expression withconstant: Percentage of tchcall seizure successes.
[Cell]![{Neutral.tch.call_seizure_successes}] > 3000 ?[Cell]![{Neutral.sdcch._%_seizure_failure}] :[Cell]![{Neutral.sdcch._%_seizure_success}]
Logic operator example,using a constant andtechnology pack PCalcs(the percentage fields arebased on A/B*100expressions). Wherecall_seizure_successes isgreater than 3000 select%_seizure_failuresotherwise return%_seizure_successes .
DECODE( [Cell]![{Nok.Traffic.tch_call_req}] , nullInt(),[Cell]![{Neutral.tch.call_seizure_attempts}] ,[Cell]![{Nok.Traffic.tch_call_req}])
Use of DECODE functionto select an alternative KPIwhere a vendor specificKPI is NULL.
IfNok.Traffic.tch_call_reqis NULL
THEN
returnNeutral.tch.call_seizure_attempts
ELSE
returnNok.Traffic.tch_call_req
ConstantsApplies To
General Expressions.
DescriptionConstants (often referred to as literals) are values that do not change. Thereare two types of constants: integer and float.
Syntax[[ Integer | Float ]]
Elements
Table 78. Constants - elements
Element Description
Integer Constant Consists of a sequence of decimal digits.
Float Constant Consists of a sequence of decimal digits and exactlyone period '.'
Examples
250 IBM Tivoli Netcool Performance Manager: User Guide

Table 79. Constants - examples
Integer Constants Float Constants
10 10.2
99999 .234
ConditionsApplies To
General Expressions
DescriptionA condition is a logic expression which returns true or false (1 or 0).Typically, conditions are not used as expressions in isolation but part of alarger expression. For example, selecting alternative KPIs depending onwhether a condition is true or false:
[Cell]![{Neutral.tch.call_seizure_successes}] > 3000 ?[Cell]![{Neutral.sdcch._%_seizure_failure}] :[Cell]![{Neutral.sdcch._%_seizure_success}]
ExampleThe “Logic Operators” on page 253 in the following table show the fullconditional expression support available.
Table 80. Conditions - examples
Expression Result
10 > 20 0
10 < 20 1
OperatorsOperators are used to combine KPIs to create new expressions.
There are two main types of operators:v “Arithmetic operators” on page 252 - The most commonly used operators that
are used to add, divide, subtract, and multiply KPIs to create new expressions.v “Logic Operators” on page 253 - Used in conditional expressions to select the
branches of an expression that is based on whether a condition is true or false.
Applies ToGeneral Expressions.
DescriptionOperators are used in expressions for arithmetic or logical operations.There are two types of operators: unary and binary. Unary operators useone operand in the format:
operand operator
Binary operators use two operands in the format:operand1 operator operand2
Unary operators are right associative; binary operators are left associative. Thismeans that the following expression:a - b - c < -d
Chapter 16. UDC expressions and function reference 251

Should be read as((a - b) - c) < (-d)
Type CastingSome operators can, depending on their operands, cause conversion of theoperand value from one type to another. This process is known as implicitcasting. Most binary operators use a set of standard type conversionswhereby if either operand is of type FLOAT, then the other operand isconverted to a FLOAT. Any variation from this rule is described in therelevant operator section.
SyntaxThe following table summarizes the precedence among operators. Eachoperator in a block shares precedence and is evaluated from left to right.An operator in a higher block has a higher precedence than operators in alower block.
For example:a + b * c ==> a + (b * c)
Because * has a higher precedence than +. Also, a + b - c ==> (a + b) - c
Because + and - have the same precedence and because + is left associative.
Arithmetic operatorsThe sample expressions in the following table shows the usage of basic arithmeticoperators to create some new expressions.
Table 81. Arithmetic Operators - examples
Expression Description
[Cell]![{Neutral.tch.handover_seizure_successes}] +[Cell]![{Neutral.tch.handover_seizure_failures}]
Expression to calculate the totalhandovers based on the sum ofhandover successes and handoverfailures.
[Cell]![{Neutral.tch.seizure_attempts}] -[Cell]![{Neutral.tch.seizure_failures}]
Expression to calculate thesuccessful tch seizures based onseizure attempts less failures.
[Cell]![{Neutral.tch.call_seizure_successes}] /[Cell]![{Neutral.tch.call_seizure_attempts}] *100
Typical example of division andmultiplication operators to createa percentage successful callattempts expression.
[Cell]![{Neutral.tch.call_seizure_successes}] % 100 Modulus operator gives theremainder after dividing seizuresuccesses by 100.
[Cell]![{Neutral.tch.call_seizure_successes}] ^ 2 Raise an expression to a power, inthis example 2. The result is thesquare ofcall_seizure_succcesses .
252 IBM Tivoli Netcool Performance Manager: User Guide

Logic OperatorsThe following table contains full set of logic operators supported.
A number of examples are contained in the following section using some of theselogic operators in conditions.
Table 82. Logic operators
Operator Description Syntax
! Not ! expr
- Unary minus (negation) - expr
== Equality expr == expr
= Equality expr = expr
!= Inequality expr != expr
<> Inequality expr <> expr
< Less than expr < expr
<= Less than or equal to expr <= expr
> Greater than expr > expr
>= Greater than or equal to expr >= expr
?: Conditional Expression expr ? expr : expr
AND Logical AND expr AND expr
&& Logical AND expr && expr
OR Logical OR expr OR expr
|| Logical OR expr || expr
Sample expressionsTable 83. Logic operators - examples
Expression Description
([Cell]![{Neutral.tch.seizure_attempts}]> 2000 AND[Cell]![{Neutral.tch.seizure_successes}]< 1700) ?[Cell]![{Neutral.tch.total_dropped_calls}] :nullInt()
A combination of logic operators to createthe following condition:
Where seizure_attempts is greater than2000 and seizure_successes is less than1700
then returntotal_dropped_call
else returnNULL.
Chapter 16. UDC expressions and function reference 253

RemarksValues of attributes in an Application Gateway object are sometimes NULL. Thatmeans no data was read from the database, ASCII file or other repository source. Ifyou apply an operator to a NULL attribute, the NULL is returned.
You can use the function “isNull” on page 258 to determine if an attribute orexpression has a value.
FunctionsA function is a built-in algorithm that takes zero or more comma-separatedarguments and returns a (possibly NULL ) result.
General ExpressionsThe number and type of the arguments are specific to each function andare described in the following sections for each function. In general, thearguments to a function can be any valid expression, including anotherfunction call.[[function_name (arg1, arg2, ..., argN )]]
ElementsTable 84. Functions - elements
Elements Description
function_name Function names begin with a letter andcontinue with any alphanumeric character orunderscore.
argX Any valid expression. Must match the typerequired by the function.
Math functionsMath functions are an extension of the basic arithmetic operators (+, -, / and *) toperform less common functions on integer or float expressions
The following examples use constants to demonstrate their use. Equallyexpressions or KPIs can be used as any of these function arguments.
absReturns the absolute value of numeric attribute N.NUMBER abs(NUMBERN)
Table 85. abs - examples
Expression Result
abs(10) 10
abs(-10) 10
abs(1.0 * 10) 10.000000
abs(1.0 * -10) 10.000000
254 IBM Tivoli Netcool Performance Manager: User Guide

ceilReturns the smallest integer value not less than N , expressed as a float.FLOAT ceil(NUMBER N)
Table 86. ceil - examples
Expression Result
ceil(1.3) 2.000000
ceil(1.5) 2.000000
ceil(1.7) 2.000000
ceil(-1.3) -1.0000000
ceil(-1.5) -1.0000000
ceil(-1.7) -1.0000000
expCalculates the exponential of N, expressed as a float. Satisfies the equation: exp(N)= exp(1) ^ N
FLOAT exp(NUMBER N)
Table 87. exp - examples
Expression Result
exp(1) 2.718282
exp(1) == exp(1) ^ 1 1
exp(2) == exp(1) ^ 2 1
floorLargest integer value not greater than N, expressed as a float.FLOAT floor(NUMBERN)
Table 88. floor - examples
Expression Result
floor(1.3) 1.000000
floor(1.5) 1.000000
floor(1.7) 1.000000
floor(-1.3) -2.0000000
floor(-1.5) -2.0000000
floor(-1.7) -2.0000000
Chapter 16. UDC expressions and function reference 255

logCalculates the natural logarithm of N expressed as a float. If N <= 0.0, then awarning is output and NULL is returned.FLOAT log(NUMBERN)
Table 89. log - examples
Expression Result
log(1) 0.000000
log(10) 1.000000
log(100) 2.000000
log(1000) 2.000000
log(-1.0) NULL
roundReturns the integer value nearest N in the direction of the current IEEE754 roundingmode, expressed as a float.FLOAT round(NUMBERN)
Table 90. round - examples
Expression Result
round(1.3) 1.000000
round(1.5) 2.000000
round(1.7) 2.000000
round(-1.3) -1.000000
round(-1.5) -2.000000
round(-1.7) -2.000000
sqrCalculates the square of N, expressed as a float. Satisfies the equation: sqr (N) == N^ 2
FLOAT sqr(NUMBERN)
Table 91. sqr - examples
Expression Result
sqr(0) 0.000000
sqr(1) 1.000000
sqr(2) 4.000000
sqr(-2) 4.000000
sqr(10) 100.000000
256 IBM Tivoli Netcool Performance Manager: User Guide

sqrtCalculates the square root of N, expressed as a float. If N is less than 0, then NULL isreturned. Satisfies the equation:sqr(sqrt (N)) == N
FLOAT sqrt(NUMBER N
Table 92. sqrt - examples
Expression Result
sqrt(0) 0.000000
sqrt(1) 1.000000
sqrt(9) 3.000000
sqrt(-1) NULL
sqr(sqrt(100)) 100.000000
truncInteger value of N , expressed as a float. Returns the same value as the expression:
(FLOAT)(INT) N
FLOAT trunc(NUMBERN)
Table 93. trunc - examples
Expression Result
trunc(1.3) 1.000000
trunc(1.5) 1.000000
trunc(1.7) 1.000000
trunc(-1.3) -1.000000
trunc(-1.5) -1.000000
trunc(-1.7) -1.000000
trunc( [Cell]![{Neutral.tch.traffic}]+ .0003)
Special aggregation functionsvsum()
vsum is an extension of the basic "+" operator with special NULL handling.It applies vector summation semantics to a collection of scalar values. If aparticular result is NULL, it is ignored. If at least one result is not-NULL,then the result is not NULL. If all values are NULL, then the result isNULL.
vsum(field, ...)
field One or more fields that are added.
Chapter 16. UDC expressions and function reference 257

Table 94. vsum() - examples
Expression Result
vsum(1, 2, 3, 0) = 6
Not NULL - The zero forces the result tonever be NULL and does not affect thecalculated summation.
vsum(1, 2, 3) = 6
vsum(nullInt(),nullInt(),nullInt()) NULL - All values are NULL therefore theresult is NULL.
vsum([Cell]![{Nok.MS_Speed.speed_class1_samples}],[Cell]![{Nok.MS_Speed.speed_class2_samples}][Cell]![{Nok.MS_Speed.speed_class3_samples}] )
Calculate the total number of MS_Speedsamples for all classes ignoring valueswhere they are null.
If this expression was built as A + B + C, ifC was null then no results would bereturned for A + B.
Logic functions
InGroupThe InGroup operator returns true or false depending on whether an expressionvalue matches any one of a set of test values. For example, INT InGroup(ATTR A,ATTR T1, ...,ATTR Tn)- is the value of A one of the values specified by T1, T2,..., TN.INT InGroup(ATTR A, ATTR T1, ...,ATTR Tn)
Table 95. InGroup - examples
Expression Result
InGroup([Cell]![{Neutral.tch.defined_ch}], 14, 16, 18) ?[Cell]![{Neutral.tch.call_seizure_successes}] :( [Cell]![{Neutral.tch.call_seizure_successes}] * .2)
If Cell.defined_ch (defined channels) is anyone of 14, 16 or 18
THEN
Return seizure_successes
ELSE
Return seizure_successes * .2
isNullisNull is typically used as part of logic expressions to check if a KPI value is null.1 means true whereas 0 means false.INT isNull(ATTRA)
Table 96. isNull - examples
Expression Result
isNull(nullInt()) 1 (division by zero always results in nullwhich is translated into (1) for true.)
IsNull([Cell]![{Neutral.tch.traffic}] ) Returns 1 if Neutral.tch.traffic is null or 0if not null.
258 IBM Tivoli Netcool Performance Manager: User Guide

Table 96. isNull - examples (continued)
Expression Result
IsNull([Cell]![ave_avail_full_tch] +[Cell]![{Nokia.Resource_Availability.ave_non_avail_tch}]) ? "100":(([Cell]![ave_avail_full_tch] +[Cell]![{Nokia.Resource_Availability.ave_non_avail_tch}]) = "0" ?"100" : ( [Cell]![ave_avail_full_tch] / ([Cell]![ave_avail_full_tch] +[Cell]![{Nokia.Resource_Availability.ave_non_avail_tch}] )) * 100 )
This means
if
’[Cell]![ave_avail_full_tch] +[Cell]![{Nokia.Resource_Availability.ave_non_avail_tch}]’
is null then calculation returns 100 else if
’[Cell]![ave_avail_full_tch] +[Cell]![{Nokia.Resource_Availability.ave_non_avail_tch}]’
is zero then calculation returns 100 else thecalculationreturns the calculation of (A/ (B+C))*100
( [Cell]![ave_avail_full_tch] /( [Cell]![ave_avail_full_tch] +
[Cell]![{Nokia.Resource_Availability.ave_non_avail_tch}] ))* 100
nullValueIf attribute A is NULL (for example, has no value, or traverses a null relationship)then V is returned, otherwise A is returned.
The return type of this function is the same as attribute A's type. Attribute V mustbe of the same type as Attribute A.
ATTR nullValue(ATTR A, ATTR V)
Table 97. nullValue - examples
Expression Result
nullValue(10/0, 0) 0
NullValue([Cell]![{Neutral.tch.traffic}],[Cell]![{Neutral.tch.total_dropped_calls}] )
If tch_traffic is NULL then returntotal_dropped_calls .
decode()The decode() function is equivalent to the IF:ELSE IF:ELSE or SWITCH statements. Itis interpreted as IF:THEN:ELSEIF:THEN:ELSE .You can have multiple ELSEIF statements to achieve the required evaluations.
Note: In decode and conditional expressions null is treated differently.Theoretically the result from both the following expressions is expected to be thesame, but null is treated differently in each expression.v Select decode(null, null, 1, 2) from dual - returns 1 because decode assumes null
= null.v Select case when null = null then 1 ELSE 2 end from dual - returns 2 because
this statement assumes null is not equal to null.decode(test_expr, expr1, return1, expr2, ..., exprN, returnN,returnX)
Chapter 16. UDC expressions and function reference 259

Table 98. decode - examples
Expression Result
DECODE( [Cell]![{Nok.Traffic.tch_call_req}], nullInt(),[Cell]![{Neutral.tch.call_seizure_attempts}] ,[Cell]![{Nok.Traffic.tch_call_req}])
Use of DECODE function to select analternative KPI where a vendor specific KPIis NULL.
If Nok.Traffic.tch_call_req is NULL
THEN
return Neutral.tch.call_seizure_attempts
ELSE
return Nok.Traffic.tch_call_req .
Conditional Operator (?)Allows a simple IF.THEN.ELSE statement. That is, if test_exprreturns a nonzero result, then the value of expr1 is used. Otherwise, the value ofexpr2 is used. Bothexpr1 and expr2 must return the same type.
Note: In decode and conditional expressions null is treated differently.Theoretically the result from both the following expressions is expected to be thesame, but null is treated differently in each expression.v Select decode(null, null, 1, 2) from dual - returns 1 because decode assumes null
= null.v Select case when null = null then 1 ELSE 2 end from dual - returns 2 because
this statement assumesnull is not equal to null.
Conditionals can be nested to any depth.[[test_expr ? expr1 : expr2]]
Table 99. Conditional operator - examples
Expression Result
[Cell]![{Neutral.tch.call_seizure_successes}] > 3000 ?[Cell]![{Neutral.sdcch._%_seizure_failure}] :[Cell]![{Neutral.sdcch._%_seizure_success}]
If seizure_successes is greater than3000 then return percentage seizurefailures, otherwise return percentageseizure success.
Null functionsnullFloat
Returns a null value where type FLOAT is required. Typically used as acomparison as part of a conditional logic operator.
FLOAT NullFloat()
260 IBM Tivoli Netcool Performance Manager: User Guide

Table 100. nullFloat - examples
Expression Result
DECODE([Cell]![{Neutral.tch._%_seizure_success}]) nullFloat(),[[Cell]![{Neutral.tch.seizure_successes}],[Cell]![{Neutral.tch.seizure_failures}])
If the KPI percentage seizure success is null
THEN
Return seizure_successes
ELSE
Return seizure_failures
NullInt
Returns a null value where type INT is required.
INT NullInt()
Table 101. NullInt - examples
Expression Result
NullInt
Formatting functionsNumToString
Formats the number N with P decimal places and a minimum field width of Wcharacter. P must take a value in the range [0, 340] and, if specified, W must takea value in the range [0, 20] . If the width of the String is LW characters, the Stringis left-padded with spaces until the String length is W . This function wouldtypically only be used for formatting an expression for output.
STRING NumToString(NUMBER N, INT,P [,INT W ])
Table 102. numToString - examples
Expression Result
numToString(100, 0) 100
numToString(100.456789, 0) 100
numToString (100.456789, 3) 100.457
NumToString([Cell]![{Neutral.tch.traffic}],5, 6)
Chapter 16. UDC expressions and function reference 261

Conversion functionsstringToInt
Converts a string into an integer number (of base 10). The string to convert mustbe in a valid format, otherwise NULL is returned.
INT stringToInt(STRING S)
Table 103. StringToInt
Expression Result
stringToInt("1234") 1234
stringToInt("98659") 98659
Data availability functionsData availability functions are used to report on the amount of data loaded ontothe system. There are two ways of reporting on data availability, either KPI levelstatistics or statistics related to blocks from the data loader.
DataAvailKPIKPI availability on raw
KPI availability reports on the availability of data based on the valuesloaded into traffic tables. It counts the number of values loaded against theexpected amount for a full day. For example, if raw data is being loadedhourly, then a full day would result in 24 non null values for each Cell. If aKPI value is null it will not be counted.
KPI availability on statisticsKPI availability reports on the availability of data based on the blockstatistics loaded by the loader. The data loaded values are counted basedon the blocks loaded. For this to return results the block must bemonitored by the loader for data availabilitystatisticsDataAvailKPI(sourcetype, statsType, fieldName) where:
sourcetype = "raw" or "statistics"
statsType = "percentile" or "interval"
Table 104. DataAvailKPI - examples
Expression Result
DataAvailKPI("raw", "percentile",[Cell]![{Nok.Traffic.tch_ho_seiz}] )
Between 0 and 100. Returns the dataavailability in percentile based on the rawdata loaded into the traffic table.
For example, if the data was loaded hourlyand data was missing for 00:00 -> 12:00 for aparticular Cell, then the availability wouldbe 50% for the day.
262 IBM Tivoli Netcool Performance Manager: User Guide

Table 104. DataAvailKPI - examples (continued)
Expression Result
DataAvailKPI("raw", "interval",[Cell]![{Nok.Traffic.tch_ho_seiz}] )
Returns the data availability interval countbased on the raw data loaded into the traffictable.
For example, if the data was loaded hourlyand data was missing for 00:00 -> 12:00 for aparticular Cell then the availability would be12 (12 periods have been loaded) for theday.
DataAvailBlock
Note: Monitoring of blocks to be reported on must be configured in the dataloader for this function to return any results.
Similar to DataAvailKPI above, DataAvailBlock provides block level statistics basedon the blocks loaded in the data loader. The loader can monitor and store statisticsfor blocks loaded which can then be reported on via these KPIs.
Block availability for a field DataAvailBlock(statsType, blockName) where statsType= "percentile" or "interval" and blockName is the blockName.
DataAvailBlock(statsType, blockName) where: statsType = "percentile" or"interval" blockName = "blockName"
Table 105. DataAvailBlock - examples
Expression Result
DataAvailBlock("percentile","P_NBSC_TRX_AVAIL")
Return the percentage of data loaded forspecified block. For example, if the raw datawas at 15 minute intervals and 1 hour of theday was missing then the block availabilitywould be: 92/96*100 = 95.83% availability.
DataAvailBlock("interval","P_NBSC_TRX_AVAIL")
Return the number of intervals loaded forblock .
P_NBSC_TRX_AVAIL
For example if the raw data was at 15minute intervals and 1 hour of the day wasmissing then the block availability would be92. Percentile statistics for data loading areeasier to understand.
Chapter 16. UDC expressions and function reference 263

Period functionsperiodStart
Returns the percentage ratio of failed attempts to total attempts. Thisfunction returns 0.0 when the denominator is 0.
percentFail(numerator,denominator)
Table 106. percentFail - examples
Expression Result
percentFail(10,100) 10
percentFail([Cell]![Cell_Offered_Traffic],[Cell]![Cell_Critical_Traffic] )
Percentage utilization based on offeredtraffic and critical traffic.
periodEndReturns the percentage ratio of failed attempts to total attempts. This functionreturns 0.0 when the denominator is 0.
percentFail(numerator,denominator)
Table 107. percentFail - examples
Expression Result
percentFail(10,100) 10
percentFail([Cell]![Cell_Offered_Traffic],[Cell]![Cell_Critical_Traffic] )
Percentage utilization based on offeredtraffic and critical traffic.
periodRangeReturns the percentage ratio of failed attempts to total attempts. This functionreturns 0.0 when the denominator is 0.
percentFail(numerator,denominator)
Table 108. percentFail - examples
Expression Result
percentFail(10,100) 10
percentFail([Cell]![Cell_Offered_Traffic],[Cell]![Cell_Critical_Traffic] )
Percentage utilization based on offeredtraffic and critical traffic.
periodsReturns the percentage ratio of failed attempts to total attempts. This functionreturns 0.0 when the denominator is 0.
percentFail(numerator,denominator)
Table 109. percentFail - examples
Expression Result
percentFail(10,100) 10
percentFail([Cell]![Cell_Offered_Traffic],[Cell]![Cell_Critical_Traffic] )
Percentage utilization based on offeredtraffic and critical traffic.
264 IBM Tivoli Netcool Performance Manager: User Guide

Traffic functions
percentFailReturns the percentage ratio of failed attempts to total attempts. This functionreturns 0.0 when the denominator is 0.
percentFail(numerator,denominator)
Table 110. percentFail - examples
Expression Result
percentFail(10,100) 10
percentFail([Cell]![Cell_Offered_Traffic],[Cell]![Cell_Critical_Traffic] )
Percentage utilization based on offeredtraffic and critical traffic.
percentOkReturns the percentage ratio of successful attempts to total attempts. This functionreturns 100.0 when the denominator is 0.
percentOK(numerator,denominator)
Table 111. percentOk - examples
Expression Result
percentOK(10,100) 10
thresholdDivReturns the ratio of two values with thresholding on the denominator. If adenominator element is less then threshold_value then the insertValue isreturned.
This function can be used to screen out low-activity data. For example, thecalculation of an RF loss/Erlangvalue can be dominated by the occasional dropped call in the middle of the nightdue to the low traffic level.Performing the division using thresholdDiv and setting the threshold to areasonable amount of trafficcan mask this problem.
thresholdDiv(numerator, denominator, thresholdValue, insertValue)
Table 112. ThresholdDiv - examples
Expression Result
thresholdDiv(5000, 10010, 10000, 0) 0.4995
Chapter 16. UDC expressions and function reference 265

Erlang based functionsTivoli Netcool Performance Manager provides a number of functions that can beused to analyze traffic data. These functions are based around:v The Erlang B loss function, which models the behavior of contention for a
non-queued limited resourcev The Erlang C function, which models the behavior of contention of a queued
limited resource.
These functions allow the probability of blocking for the resource to be estimated,and thus the traffic offered to a resource and the capacity of an element to becalculated.
The grade of service calculationThe grade of service of a resource can be expressed as the probability oftraffic being offered to the resource meeting a blocking condition. This iscommonly used to assess network resources such as a circuit group or cellTCH. Grade of service is important both as a measure of the actual qualityof service being offered to subscribers, and also as a design parameter, thedesign grade of service. Grade of service is calculated from the perspectiveof the element that is providing the resource. What happens to the servicerequest, the call, depends on the system in question:
In a loss system the call is typically offered to an alternative trunk groupor a different cell or sector. In a queued system the call is queued and maysubsequently receive service from the element.Therefore, care must betaken when making the association between grade of service andsubscriber-visible effects of congestion.
Offered trafficThe first step in calculating grade of service is to estimate the trafficoffered to a resource. The offered traffic can be thought of as the traffic thatwould be carried if the resource had unlimited capacity. In general, theoffered traffic cannot be measured directly because one of the following istrue:v The number of bids for a resource is not known, such as an incoming
circuit group.v If the bids are known, the traffic that would result from them can only
be estimated. For example, a measure of offered traffic could be obtainedfrom bid and mean holding time data.
For a loss system, it is usual to estimate the offered traffic using the ErlangB function to calculate the lost traffic and thus the offered traffic. Thealgorithm uses an iterative approach to solve the equations.
For a queued system, the traffic offered is considered identical to the trafficcarried. As the model assumes that we have an infinite queue, all trafficoffered is ultimately carried, though perhaps after a significant delay.Provided that the measurement period is long relative to the averageholding time, this assumption is reasonable for the purposes of themodel.The toff function is provided for Erlang B that is passed thenumber of circuits and the measured carried traffic. The function returnsthe offered traffic. For example:
toff( 10, 4.3 "B" ) returns the offered traffic when 4.3 Erlangs is carriedon 10 circuits.
Blocking probabilityThe grade of service, or blocking probability, is calculated using the gos
266 IBM Tivoli Netcool Performance Manager: User Guide

function for Erlang B and C. This function is passed the number ofavailable circuits and the offered traffic. For example,
gos({Neutral.tch.defined_ch},{Neutral.tch.offered_b},"B")
The function returns the grade of service expressed as a probabilitybetween 0 and 1. For example, a value of 0.008 implies a blockingprobability of 8 in 1000.
Capacity calculationsThe theoretical maximum capacity of a resource is equal to the number ofcircuits available on the resource. For example, a circuit group of 60 circuitscan potentially carry 60 Erlangs if all circuits are busy. However, it is clearthat in such a situation the amount of blocking would be very high -indeed any traffic offered to the circuit group would have a probability of1 of meeting a block condition.
Consequently, it is normal to define capacity in terms of that level ofoffered traffic that results in a grade of service equal to the design grade ofservice. This is known as the nominal capacity .
The nominal capacity of a resource is the traffic level at which the grade ofservice is equal to some predefined value. This is known as the criticaltraffic level.
Critical trafficTypical values for the design grade of service are around 0.008.
The critical traffic level for a resource can be calculated using the critfunction for Erlang B and C respectively. This function is passed thenumber of available circuits and the design grade of service expressed as aprobability. For example,
crit([Cell]![{Neutral.tch.available_ch}], .02, "B") returns thecritical traffic which could be carried based on a GOS of 0.2. If the numberof circuits is negative, a value of 0 is used
TC4 full availabilityUsing critical traffic to define capacity essentially defines a grade of serviceat a nominal load. Other measures of capacity also attempt to define levelsof service at varying degrees of overload. Once such measure is the 'threecriteria table 4' full availability capacity-known as TC4 .
The TC4 traffic level is defined as that level of offered traffic that provides a gradeof service of:v 0.008 at nominal loadv 0.02 at 10% overloadv 0.05 at 20% overload
The TC4 capacity tends to be less than the critical traffic after approximately 30circuits, as the second and third criteria start to limit the value as the number ofcircuits increase.
The function TC4 is passed the number of available circuits and returns thecapacity figure. For example:
TC4(3, "B" )
This function would generally only be used for capacity of circuit groups, and notfor elements with small numbers of circuits such as cells.
Chapter 16. UDC expressions and function reference 267

circRequired circuits. Returns the smallest integer number of circuits that can deliverthe specified design grade of service for the specified offered traffic, you can usethe Erlang B or Erlang C algorithm.
circ(OFFERED, DGOS, "B")
circ(OFFERED, DGOS, "C")
Table 113. circ - examples
Expression Result
circ(5, 0.7, "B" ) Returns the required number of circuits todeliver a DGOS of 0.7 for an offered trafficvalue of 5. Result is 2.0.
circ({Neutral.tch.offered_c},{Neutral.tch.gos_c} , "C" )
Returns the required number of circuits todeliver a DGOS defined byNeutral.tch.gos_c, for offered traffic that isdefined by Neutral.tch.offered_c.
circ({Neutral.tch.offered_c}, 0.95 ,"C" )
Returns the required number of circuits that itis to deliver a DGOS of 0.95.
critCritical Traffic. Returns the critical traffic value for a number of circuits and designgrade of service, you can use the Erlang B or Erlang C algorithm.
crit(CIRCUITS, DGOS, "B")
crit(CIRCUITS, DGOS, "C")
Table 114. crit - examples
Expression Result
crit(6, 0.6, "B" ) Returns the critical traffic value of13.552001953125, for 6 circuits that arebased on a DGOS of 0.6.
crit({Neutral.tch.defined_ch},{Neutral.tch.gos_b} , "B" )
Returns the critical traffic value for thenumber of circuits that are defined byNeutral.tch.defined_ch, based on aDGOS defined by Neutral.tch.gos_b.
crit([Cell]![{Neutral.tch.available_ch}],.02, "B")
Returns the critical traffic, which iscarried based on a DGOS of 0.2.
gosGrade of service. Returns the grade of service (blocking probability) when traffic isoffered to a number of circuits, you can use the Erlang B or Erlang C algorithm.
gos(number_of_circuits, traffic_offered, "B")
gos(number_of_circuits, traffic_offered, "C")
268 IBM Tivoli Netcool Performance Manager: User Guide

Table 115. gos - examples
Expression Result
gos( 10, 4.3, "B" ) Returns the grade of service for 4.3 Erlangsif offered to 10 circuits, =0.00811999517242912.
gos({Neutral.tch.defined_ch},{Neutral.tch.offered_b } , "B" )
Returns the grade of service for the availablecircuits and offered traffic.
goseGrade of service. Returns the grade of service (blocking probability) when traffic isoffered to a number of circuits, and sources (callers), using the Erlang E algorithm.
gose(number_of_circuits , traffic_offered, number_of_sources)
Table 116. gose - examples
Expression Result
gose( 10, 4.3, 4 ) Returns the grade of service for 10 availablecircuits and 4 sources for 4.3 Erlangs, = null.
TC4The TC4 traffic level is defined as that level of offered traffic that provides a gradeof service of:v 0.008 at nominal loadv 0.02 at 10% overloadv 0.05 at 20% overload
The algorithm that is used is Erlang B.
TC4(circuits, algorithm)
Table 117. TC4 - examples
Expression Result
TC4(3, "B" ) 0.41757
TC4({Neutral.tch.defined_ch}, "B" ) Returns the TC4 traffic level forNeutral.tch.defined_ch.
toffOffered traffic. Returns the offered traffic value for a number of circuits and givencarried traffic you can use the Erlang B algorithm.
The offered traffic value is specified to an accuracy of +-0.001. For example, thevalue 20.37005914658 is specified as 20.371.
toff(circuits, carried, "B")
Chapter 16. UDC expressions and function reference 269

Table 118. toff - examples
Expression Result
toff([Cell]![{Neutral.tch.available_ch}] ,[Cell]![{Neutral.tch.traffic}] , "B")
Calculates offered traffic that is based on theavailable circuits and the carried traffic byNeutral.tch.available_ch andNeutral.tch.traffic, respectively.
Kaufman-Roberts based functionsKaufman-Roberts is a multi-dimensional Erlang method that you use whenmultiple services share a common resource pool.
The Kaufman-Roberts functions compute the blocking probability when the totalcapacity of a link is composed of adifferent number of traffic flows or channels, and each flow or channel is smallerthan the maximum capacity of the link.
Each (channelArrivalRate, channelCapacity)pair that is referred in the function expression describes a single traffic class, type,flow, or channel of traffic. All channelArrivalRate values represent the arrival rateof traffic and are of type DOUBLE.The value for channelArrivalRate must be between zero and one. AllchannelCapacity values represent the traffic class. The traffic class is a numericinteger that reflects the number of basic units of traffic that is used bythe channel and corresponds to the same basic unit represented by the capacity,capacity.Up to six pairs of values for (channelArrivalRate, channelCapacity) are supported.
The sequence (channelArrivalRate1, channelCapacity1,channelArrivalRateK, channelCapacityK) describes the traffic characteristics in thesystem.
The following list details the parameters that are used in the Kaufman-Robertsfunctions:v Probability - represents a probabilityv Capacity - represents a link capacityv Index - an index that specifies the traffic class to operate from the
(channelArrivalRate1,channelCapacity1, ..., channelArrivalRateK,channelCapacityK) set. This value must be less than the number of(channelArrivalRate, channelCapacity) pairs in the function expression minusone (that is k-1).For example, if you have three (channelArrivalRate, channelCapacity) pairs,the index value must be less than two.
If the link capacity is 128 Kbps with channels of 32 Kbps, 48 Kbps, and 80 Kbpsand assuming an arrivalrate of 0.5 for each channel, the link would be described as:
Capacity = 128
channelArrivalRate1, channelCapacity1 = 0.5, 32
channelArrivalRate2, channelCapacity2 = 0.5, 48
270 IBM Tivoli Netcool Performance Manager: User Guide

channelArrivalRate3, channelCapacity3 = 0.5, 80
Using the Kaufman-Roberts functions, calculate the blocking probability of the firstchannel as:KaufmanPB(0, 128, 0.5, 32, 0.5, 48, 0.5, 80)
kaufmanAllCCalculates the minimum capacity for a link where all services have a probability ofblocking less than or equal to probability.
Each (channelArrivalRate, channelCapacity) pair that is referred in the functionexpression describes a single traffic class, type, flow, or channel of traffic. AllchannelArrivalRate values represent the arrival rate of traffic and are of typedouble. The value for channelArrivalRate must be between zero and one. AllchannelCapacity values represent the traffic class. The traffic class is a numericinteger that reflects the number of basic units of traffic that is used by the channeland corresponds to the same basic unitrepresented by the capacity.
ParameterskaufmanAllC(probability, channelArrivalRate1, channelCapacity1,..., channelArrivalRateK, channelCapacityK )
Examples
Table 119. kaufmanAllC - examples
Expression Result
kaufmanAllC( .52, 0.61, 32, 0.6, 48) 80
kaufmanMinCCalculates the minimum capacity for a link where the service identified byserviceIndexhas a probability of blocking less than or equal to probability.
Each (channelArrivalRate, channelCapacity) pair that is referred in the functionexpression describes a singletraffic class, type, flow, or channel of traffic. All channelArrivalRate valuesrepresent the arrival rate of traffic and are of type DOUBLE.The value for channelArrivalRate must be between zero and one. AllchannelCapacity values represent the traffic class.
serviceIndex, is an index that specifies the traffic class to operate from the(channelArrivalRate1, channelCapacity1, ..., channelArrivalRateK,channelCapacityK) set. This value must be less than the number of(channelArrivalRate, channelCapacity) pairs in the function expression, minusone. For example, if you have three (channelArrivalRate, channelCapacity) pairs,the index value must be less than two.
ParameterskaufmanMinC(serviceIndex, probability, channelArrivalRate1,channelCapacity1,..., channelArrivalRateK, channelCapacityK )
Examples
Chapter 16. UDC expressions and function reference 271
Table 120. kaufmanMinC - examples
Expression Result
kaufmanMinC( 0, .5, 0.5, 32, 0.5, 48) 48
kaufmanPBCalculates the probability of blocking of the first channel.
Each (channelArrivalRate, channelCapacity) pair that is referred in the functionexpression describes a single trafficclass, type, flow, or channel of traffic. All channelArrivalRate values represent thearrival rate of traffic and are of type double. The value for channelArrivalRatemust be between zero and one. All channelCapacity values represent the trafficclass.
ParameterskaufmanPB(index, capacity, channelArrivalRate1, channelCapacity1,..., channelArrivalRateK, channelCapacityK )
Examples
Table 121. kaufmanPB - examples
Expression Result
kaufmanPB( 0, 128, 0.5, 32, 0.5, 48) 0.0481809
kaufmanMaxPBCalculates the maximum probability of blocking for all services on a link ofcapacity.
Each (channelArrivalRate, channelCapacity) pair referred in the functionexpression describes a single traffic class, type, flow, or channel of traffic. AllchannelArrivalRate values represent the arrival rate of traffic and are of typedouble. The value for channelArrivalRate must be between zero and one. AllchannelCapacity values represent the traffic class.
ParameterskaufmanMaxPB(capacity, channelArrivalRate1, channelCapacity1, ...,channelArrivalRateK, channelCapacityK )
Examples
Table 122. kaufmanMaxPB - examples
Expression Result
KaufmanMaxPB( 128, .5, 32 ) 0.00157977
272 IBM Tivoli Netcool Performance Manager: User Guide

Global constant functionsThese functions allow you to dynamically insert a global constant into functions inan expression. The values are set using the parameter_admin tool.
parameterIntReturns the integer value of a configuration parameter. The name parameter is astring that represents a pre-configured parameter
ParametersparameterInt(name)
Examples
If parameter_a is configured to a value of 10 in the system using theparameter_admin tool then the value of the expression that is mentioned in thefollowing table is equal to 10.
Table 123. parameterInt - examples
Expression Result
parameterInt("parameter_a") 10
parameterFloatReturns the float value of a configuration parameter. The name parameter is a stringthat represents a pre-configured parameter.
parameterFloat(name)
ExamplesIf parameter_b is configured to a value of 10.5 in the system usingparameter_admin tool then the value of the expression that is mentioned inthe following table is equal to 10.5.
Table 124. parameterFloat - examples
Expression Result
parameterFloat("parameter_b") 10.5
Trending functionsTrending UDCs are used to forecast the value of a KPI at a given point in thefuture based on an historical set of stored busy hour values.
Busy hours and busy hour values for a KPI are used to calculate a regression linefrom a given point in the future. Using this line a report can be defined and valuesreturned for the KPI at the times specified in the report.
There are two kinds of trending functions:
trend Used to predict what value a KPI will have at a future point in time. Forexample, based on a Cell Traffic Busy Hour, the trend for the percentage ofblocked calls in one month's time can be calculated.
projectTimeUsed to project when a KPI will reach a particular limit. For example,based on a Cell Traffic Busy Hour, the number of days until that thepercentage of blocked calls reaches a given threshold can be calculated.
Chapter 16. UDC expressions and function reference 273

This could be used for example to define a report and filter it to return allCells where the %blocking is trending to be greater 2% in the next 14 days.This can be used for capacity planning to identify the Cells to nextexhaust.
Trending UDC expression syntaxThe following syntax for the trend and projectTime functions illustrates thestructure that is used for each function.
trend(trend_sbh_kpi,busy_hour,regression_type,min_datapoints,number_regression_intervals)
projectTime(trend_sbh_kpi,busy_hour,regression_type,min_datapoints,num_regression_intervals,limit)
More than one trending function can be used in the same report. For example,functions, see “Trending UDC expression syntax.”
trend_sbh_kpiStored busy hour KPI field to use. Only stored busy hour KPIs at the focalentity can be used. A stored busy hour KPI is the KPI against whose busyhours the trend is calculated. A stored busy hour KPI is defined with abusy hour interval: the hour with the greatest value for a defined period(daily, weekly, or monthly). Stored busy hour KPIs are predefined. Whenyou create a trending UDC, you select stored busy hour KPIs that hasalready been defined. When you select a stored busy hour KPI field,trend_sbh and busy_hour are entered for the expression.
busy_hourThe busy hour definition that is used to determine the busy hour for theSBH KPI.
regression_typeThe regression algorithm to use: LINEAR, LOGARITHMIC, EXPONENTIAL. Eachregression type uses a method to correlate data. In the case where the dataset for a trending report contains values that must be excluded beforeregression is calculated. These are the values from bursty, erroneous, orbad data in the set.
To ensure that the best possible trend is being calculated these values (outliers) areexcluded by using correlation coefficients.
Table 125. Regression types and correlation coefficients
Regression Type Correlation Coefficient
Linear Pearson
Logarithmic Spearman
Exponential Spearman
A Pearson co-relation is used where there is a linear relationship. For example,where a value increases linearly over time such as total calls or percentagecapacity. A Spearman co-relation is used where the growth of the value over timeis not linear, such as Erlang calculations.
min_datapointInteger. The minimum number of periods for a trend to be valid. Theminimum number of periods represents the minimum number of stored
274 IBM Tivoli Netcool Performance Manager: User Guide

busy hour values that must be available to be calculated. For example, ifthe number of data points is 3 and the busy hour is a daily stored busyhour, then there must be at least three days of stored busy hour dataavailable. A value of 2 or greater must be used.
num_regression_intervalsInteger. The number of periods of the interval to use when you calculatethe trend. The period that is used is determined by the busy hour interval.For example, if the busy hour interval is weeks and the number or periodsto use is 14, then the stored busy hour KPI value is trended over 14 weeks.
limit Float projectTime only. The value to project the trend against. Used tocalculate the number of days between the current trend and the limit. Thisvalue can be represented by a constant, or by a traffic KPI (raw, Pcalc, orUDC). If a UDC is used, it must be defined at the same entity level as thetrending UDC. The following functions are not supported for UDCs usedto specify the limit:v NumToStringv StringToIntv InGroupv IsNullv NullValuev decodev protectv nullIntv nullFloatv DataAvailKPIv DataAvailBlockv projectTimev trend
Examplestrend([Cell]![{Neutral.tch.sbhv.daily._%_blocking}],"Cell_TCH_Traffic_TEC_busy_hour","Linear",21,30). Trend %blockingbased on its value at the busy hour over the last 30 days, with a minimumof 21 data points required. It means that at least 21 busy hours must beavailable to be calculated.projectTime([Cell]![{Neutral.tch.sbhv.daily._%_blocking}], "Cell_TCH_Traffic_TEC_busy_hour", "Linear",20,30, 1.5)Trend over the last 30 days of busy hour data to return the number of daysuntil the limit of 1.5% is breached for %blocking.
Discovering why there is null in the result setWhen you trend reports are run, null results can be returned for variousreasons. Some of the reasons why a null result is returned can bedemonstrated by running a separate SBH report for the KPI that forms thebasis of the trending report. The following table lists some of the morecommon reasons for null results.
Table 126. Trending null results - reasons
Description Affects Reason
Trend gradient too small projectTime If the trend gradient is nearlyflat. The limit that isbreached extends too far into the future.
Chapter 16. UDC expressions and function reference 275

Table 126. Trending null results - reasons (continued)
Description Affects Reason
Data that not correlatedenough
trend and projectTime Trending data can beusefully interpreted only ifthe data is related enough.
If data is found not to besufficiently correlated, acorrelation coefficient(Pearson for linear orSpearman for non-linear) isused to remove outliers andthe data is recalculated. If thedata is still not sufficientlycorrelated, a null result isreturned.
Not enough data points trend and projectTime A trend value must be basedon a set minimum number ofdata points. Usually at least10. If this number is notreached, a null result isreturned.
Consider changing the UDCused in the report to usemore intervals, or use lessdata points. See “Trendingfunctions” on page 273, formore information.
Negative numbers trend and projectTime forexponential regression
Negative numbers cannot beincluded for reports, whichuse an exponential function.Where there are bothnegative and positivenumbers, negative numbersare ignored. A trend iscalculated on the positivenumbers if there are enoughdata points.
Negative limit projectTime for exponentialregression
Negative numbers cannot beincluded for reports whichuse an exponential function.
Limit is in the past projectTime for exponentialregression
If the limit is a negativenumber, a projected timecannot be calculated.
276 IBM Tivoli Netcool Performance Manager: User Guide

Setting UDC constantsThis section describes:v “parameter_admin tool overview”v “Using the paramater_admin tool” on page 278
parameter_admin tool overviewThe parameter_admin tool is command-line tool that is used to set parameterconstants that can be included in UDC expressions. Ask the system administratorabout using command-line tools.
For example, for UDCs you can use the crit traffic function as a parameter can bedefined as the DGOS:
parameter_admin -s DEFAULT_DGOS -t float -v 0.6
The parameter can then be used as required. For example:
crit( [Cell]![{Neutral.tch.available_ch}] , parameterFloat("DEFAULT_DGOS"),"B")
Where parameterFloat returns the float value of DEFAULT_DGOS. See“parameterInt” on page 273.
In this example, if DGOS must be changed, the constant value can be changed andit is changed in all the UDC expressions in which it is used.
Usage Create parameter using the following command:
Usage: -s <name> -t <int/float> -v <value>
-s <name> Mandatory switchused to set (create) a parameter
-t <int/float> Mandatoryparameter type.
-v <value> Mandatoryparameter value.
Retrieve parameter value using the following command:
Usage: -g <name>
-g <name> Mandatory name ofthe parameter to get.
Export parameters values to a file using the following command:
Usage: -e <name>
-e <name> Mandatory name ofthe file to export.
Import parameters values from a file using the following command:
Usage: -i <name>
-i <name> Mandatory name ofthe file to import.
List parameters using the following command:
Usage: parameter_admin -l
-l List all provisioned parameters.
Help:
Usage: parameter_admin -h | -help
Chapter 16. UDC expressions and function reference 277

Using the paramater_admin toolThe parameter_admin tool is used to:v Create a constantv Get a valuev List all valuesv Export parameter valuesv Export parameter valuesv Import parameter values
Create a constantTo create a constant:parameter_admin -s <constant_name> -t <int|float>-v <value>
For example:
parameter_admin -s DEFAULT_DGOS -t float -v 0.6
Get a value
To view the value for a constant:
parameter_admin -g <constant_name>
For example:
parameter_admin -g DEFAULT_DGOS
List all values
To list all constant values:
parameter_admin -l
Export parameter values
To export all parameter values:
parameter_admin -e <filename.csv>
Import parameter values
To import parameter values from a file:
parameter_admin -i <filename.csv>
Example file content:
#parameter_name=parameter_type, parameter_value:
param_1=int, 10
param_2=int, 15
Where type can be int or float and where a parameter value can be aninteger or a floating value.
278 IBM Tivoli Netcool Performance Manager: User Guide

Chapter 17. Aggregation types
Given a set of data a single aggregate value can be calculated for that data. Thereare a number of ways aggregations can be calculated in Tivoli Netcool PerformanceManager, depending on the field and aggregation type that is used. Aggregationtypes and computation of aggregation for complex KPIs are introduced in thissection.
PegsPegs are fields that are based on a raw data count.
The list of possible aggregation types for peg fields is shown in the following table.
Table 127. Peg aggregation types
Name Time AggregatorEntityAggregator Comment
Sum Sum Sum Sum - the sum of allvalues.
Average Average Average Average - the meanaverage value.
Max Max Max Max - the maximumvalue.
Min Min Min Min - the minimum value.
NULL Null Null Null - no aggregation.Used to prevent any kindof aggregation fromoccurring. As a result,reports show no summaryvalues for fields of thisaggregation type.
Count Count Count Count - number ofnon-null values.
Complex KPIsComplex KPIs (PCALCs and UDCs) are fields that are based on more than onecounter or an expression.
The list of possible aggregation types for use with PCALCs , Summary KPIs, andUDCs are listed in the following table.
Table 128. PCALC, Summary, UDC aggregation types
Name Time Aggregator Entity Aggregator
Average Average Average
AvgMax Average Max
AvgMin Average Min
AvgNull Average Null
AvgSum Average Sum
© Copyright IBM Corp. 2006, 2015 279

Table 128. PCALC, Summary, UDC aggregation types (continued)
Name Time Aggregator Entity Aggregator
Count Count Count
Max Max Max
MaxAvg Max Average
MaxMin Max Min
MaxNul Max Null
MaxSum Max Sum
Min Min Min
MinAvg Min Average
MinMax Min Max
MinNull Min Null
MinSum Min Sum
NULL Null Null
NullAvg Null Average
NullMax Null Max
NullMin Null Min
NullSum Null Sum
Sum Sum Sum
SumAvg Sum Average
SumMax Sum Max
SumMin Sum Min
SumNull Sum Null
Computation for complex KPIsWhen time and entity aggregations are involved, there are three different ways tocompute aggregation for complex KPIs:v Before time aggregationv Before entity aggregationv After entity aggregation
The following examples analyze a complex KPI of A/B for the followingaggregation types:v SumSumv SumMinv MinSumv MinMin
As Avg and Sum are handled identically, and Min and Max are handled in thesame way, these four examples are illustrative of all aggregation types. Thefollowing table and sections and detail how these aggregation types are calculated.
Table 129. Complex KPI aggregation example
Entity Timestamp A B A/B A B esum(tsum(A)) /esum(tsum(B))
280 IBM Tivoli Netcool Performance Manager: User Guide

Table 129. Complex KPI aggregation example (continued)
Raw Raw tsum(A) tsum(B) tsum(A)/tsum(B)
tmin(A/B)
Cell1 00:00 80 10 8 120 30 4 2
12:00 40 20 2
Cell2 00:00 40 2 20 60 6 10 5
12:00 20 4 5
EntityAgg
180 36
After time aggregation and after entity aggregationAfter time and after entity aggregation applies to the aggregation types:v Average, AvgSum, AvgNull, Count, Null, NullNull, NullSum, NullAvg, Sum,
SumAvg, SumNull
SumSumIn this example, SumSum(A/B) gets expanded into esum(tsum(A))/esum(tsum(B)).A and B get individually summed across time, then (still individually) acrossentity. The final values are then divided, as shown in the following steps.1. Counters summed across time:
v Cell 1 Counter A 80 + 40 = 120
v Cell 2 Counter A 40 + 20 = 60
v Cell 1 Counter B 10 + 20 = 30
v Cell 2 Counter B 2 + 4 = 6
2. Counters summed across entity:v Counter A 120 + 60 = 180
v Counter B 30 + 6 = 36
3. Computation after time aggregation and after entity aggregation:v 180/36 = 5
After time aggregationAfter time aggregation applies to the following aggregation types:v AvgMin, SumMin, NullMin, AvgMax SumMax, NullMax.
SumMinIn this example, SumMin(A/B) gets expanded into emin(tsum(A)/ tsum(B)). A andB get individually summed across time. The two values then get divided for eachcell, and the minimum of all values is returned:1. Counters summed across time:
v Cell 1 Counter A: 80 + 40 = 120
v Cell 2 Counter A: 40 + 20 = 60
v Cell 1 Counter B: 10 + 20 = 30
v Cell 2 Counter B: 2 + 4 = 6
2. Computation after time aggregation:v Cell 1 120/30 = 4, Cell 2 60/6 = 10. The minimum value = 4.
Chapter 17. Aggregation types 281

Before time aggregationBefore time aggregation applies to the following aggregation types:v MinAvg, MinMax, MinSum, MinNull, Min, MaxAvg, MaxMin, MaxSum,
MaxNull, or Max.
MinSumIn this example, MinSum(A/B) gets expanded into esum(tmin(A/B)). Because thetime aggregation is min, computation happens immediately, before timeaggregation. A and B get divided for each cell/time interval. The lowest value foreach cell is then selected, and all selected values are summarized across cells:1. Computation before time aggregation:
a. A and B divided for each cell/time interval:v Cell 1 at 00:00 A/B: 80/10 = 8
v Cell 1 at 12:00 A/B: 40/20 = 2
v Cell 2 at 00:00 A/B: 40/2 = 20
v Cell 2 at 12:00 A/B: 20/4 = 5
2. Minimum values summarized across cells: Cell 1 = 2 Cell 2 = 5, 2 + 5 = 7
MinMinIn this example, MinMin(A/B) gets expanded into emin(tmin(A/B)). Because thetime aggregation is min, computation happens immediately, before timeaggregation. A and B get divided for each cell/time interval. The lowest value foreach cell is then selected, and then the minimal value across all cells is returned.1. Computation before time aggregation:
a. A and B divided for each cell/time interval:v Cell 1 at 00:00 A/B: 80/10 = 8
v Cell 1 at 12:00 A/B: 40/20 = 2
v Cell 2 at 00:00 A/B: 40/2 = 20
v Cell 2 at 12:00 A/B: 20/4 = 5
b. Minimum values that are selected across cells: Cell 1 = 2 Cell 2 = 5c. Minimum value across all cells returned: 2
Aggregation propertiesThe behavior of time and entity aggregators change depending on the values ofthe properties:v ForceSumSummarisation
v ForceOverrideCounterTimeAggregator
By default these properties are set to False. The following applies if theseproperties are set to True.v ForceSumSummarisation - for complex KPIs with more than one counter or an
expression, all aggregators are ignored and the aggregator SumSum is usedinstead.
v ForceOverrideCounterTimeAggregator - overrides a counter's aggregation. Forcomplex KPIs with only one counter and no expression, the counter aggregatorsare ignored and the KPI's aggregator is used.
282 IBM Tivoli Netcool Performance Manager: User Guide

See the Administering Tivoli Netcool Performance Manager - Wireless Component forinformation about changing the value of these properties.
Aggregation properties and complex KPI computationThe following rules apply by default to the computation of complex KPIs:v If ForceSumSummarisation = false, if the complex KPI's effective time aggregator
is min or max, the complex KPI is computed before time aggregation.v If ForceSumSummarisation = false, if the complex KPI's effective entity
aggregator is min or max, the complex KPI is computed between entity and timeaggregation.
The following table outlines the relationship between these properties, Min Maxaggregation and whether complex KPI calculation occurs before time aggregationor after time aggregation.
Table 130. Relationship between properties, aggregation types, and complex KPI calculation
forceSumSummarization
forceOverrideCounterTimeAggregator
Entityaggregation
Timeaggregation Before Time After Time
False False Min or Max Any AGGRbut not Minor Max
N Y
False True Min or Max Any AGGRbut not Minor Max
N Y
False True All AGGR Min or Max Y N
False False All AGGR Min or Max Y N
True False Min or Max Min or Max N N
True True Min or Max Min or Max N N
True True All AGGR Min or Max N N
For example, the first row of the table must be read as:
If ForesSumSummarisation is false, and ForceOverrideCounterTimeAggregator isfalse computation of a complex KPI occursbetween entity and time aggregation. If the time aggregator is any aggregatorexcept Min or Max and the entity aggregator is Min orMax.
Chapter 17. Aggregation types 283

284 IBM Tivoli Netcool Performance Manager: User Guide

Appendix. Rehoming
This section contains an example of rehoming and expected report results.
Rehoming ExampleThe following rehoming use cases describe the expected results when reporting onrehomed data.
Reporting on Rehomed Data - 07:00Consider the network hierarchy at 07:00 as illustrated in the following figure. Norehoming has taken place.
Table 131. Network Reporting Information 07:00
Report Focal EntityReport Field ofInterest Report Scoping Outcome
BSC BTS None In this report the BTSfield is rolled up toBSC level for eachBSC. BSC1 containsthe rolled upcontributions fromBTS 1 and BTS 2during the reportperiod.
© Copyright IBM Corp. 2006, 2015 285

Table 131. Network Reporting Information 07:00 (continued)
Report Focal EntityReport Field ofInterest Report Scoping Outcome
BTS BTS Cell None In this report the BTSCell field is rolled upto BTS level for eachBTS. BTS 1 containsthe rolled upcontributions from allchild BTS Cellsduring the reportperiod.
BTS Cell BTS Cell All BTS Cells withparent BTS 1
This contains all datafrom the BTS Cellsparented by BTS 1during the reportperiod.
Reporting on Rehomed Data - 08:00At 08:00 the Gatwick BTS is rehomed to BSC 2 from BSC 1 as illustrated in thefollowing figure. Now consider the same reports (time period 00:00 until thecurrent time). Refer to the following figure.
286 IBM Tivoli Netcool Performance Manager: User Guide

Table 132. Network Reporting Information at 08:00
Report Focal EntityReport Field ofInterest Report Scoping Outcome
BSC BTS None In this report the BTSfield is rolled up toBSC level for eachBSC. BSC1 containsthe rolled upcontributions for BTS1 obtained during thefull report period andfrom BTS 2 duringthe report periodfrom report start timeto rehoming time.BSC2 contains therolled upcontributions for BTS3 and BTS 4 duringthe full report periodand from BTS 6during the reportperiod fromrehoming time toreport end time.
BTS BTS Cell None In this report the BTSCell field is rolled upto BTS level for eachBTS. BTS 6 containsthe data loaded whileparented by BTS 6 /BSC 2 and the dataloaded whileparented by BTS 2 /BSC 1.
BTS Cell BTS Cell All BTS Cells withparent BTS 1
Each BTS cellparented by BTS 1contains all data fromthe BTS cellsparented by BTS 1during the reportperiod. The BTS cellsunder BSC 2 arehandled differently.For BTS 6, the BTScells contain the dataloaded whileparented by BTS 6under BSC 2 and thedata loaded whileparented by BTS 2under BSC 1.
Appendix. Rehoming 287

Reporting on Rehomed Data - 09:00At 09:00 the Guildford BTS is added to BSC 1 as illustrated in the figure SeeNetwork Status at 09:00.. This reuses the ID previously used by the Gatwick BTS.Consider the same report discussed in the above examples (time period 00:00 untilthe current time).
Table 133. Network Reporting Information at 09:00
Report Focal EntityReport Field ofInterest Report Scoping Outcome
BSC BTS None In this report the BTSfield is rolled up toBSC level for eachBSC. BSC1 containsthe rolled upcontributions fromBTS 1 during the fullreport period andfrom BTS 2 duringthe report periodfrom report start timeto rehoming time(rehome of Gatwickto BTS 2) and BTS 2over the reportperiod, rehomingtime (addition ofGuildford) to reportend time.
288 IBM Tivoli Netcool Performance Manager: User Guide

Table 133. Network Reporting Information at 09:00 (continued)
Report Focal EntityReport Field ofInterest Report Scoping Outcome
BTS BTS Cell None In this report the BTSCell field is rolled upto BTS level for eachBTS. BTS 2 containsthose cells parentedby the Guildford BTS2. It will include BTScell data prior to therehoming of this BTSto Guildford BTS 2,since this data iscarried over therehoming boundariesthat occur within thereport period.
BTS Cell BTS Cell All BTS Cells withparent BTS 1
Each BTS cellparented by BTS 1contains all data fromthe BTS cellsparented by BTS 1over the reportperiod. The BTS Cellsparented by BTS 2contain those cellsparented by theGuildford BTS 2. Italso includes BTS celldata obtained beforethe rehoming of theBTS to Guildford BTS2; this data is carriedover the rehomingboundaries occurringwithin the reportperiod.
Reporting on Rehomed Data - 10:00At 10:00 the Docklands BTS is rehomed from MSC 1 / BSC 2 to MSC 3 / BSC 1 asillustrated in the following figure. This causes a new instance ID to be allocated.Data loaded after the rehoming operation will be loaded to the new instance id.Now consider the same reports (time period 00:00 until the current time).
Appendix. Rehoming 289

Table 134. Network Reporting Information at 10:00
Report Focal EntityReport Field ofInterest Report Scoping Outcome
BSC BTS NoneIn this report the BTSfield is rolled up toBSC level for eachBSC. MSC 1 / BSC 2,contains the rolledup contributionsfrom BTS 3 obtainedduring the full reportperiod and from BTS4 during the reportperiod, report starttime to rehomingtime (to MSC3 / BSC1) and BTS 6 fromrehoming time(rehome from MSC 1/ BSC 1) to reportend time.
MSC 3 / BSC 1contains the rolledup contributionsfrom BTS 1 obtainedduring the full reportperiod and BTS 2from the rehomingtime (rehome fromMSC 1 / BSC 2) toreport end time.
290 IBM Tivoli Netcool Performance Manager: User Guide

Table 134. Network Reporting Information at 10:00 (continued)
Report Focal EntityReport Field ofInterest Report Scoping Outcome
BTS BTS Cell None In this report the BTSCell field is rolled upto BTS level for eachBTS. BTS 2,Docklands, containsthe data loaded whileparented by BTS 2 /BSC 1 / MSC 3 andalso the data loadedwhile parented byBTS 4 / BSC 2 /MSC 1.
BTS Cell BTS Cell All BTS Cells withparent BTS 1
Each BTS Cellparented by BTS 2 /BSC 1 / MSC 3contains the dataloaded whileparented by BTS 2 /BSC 1 / MSC 3 andalso data loadedwhile parented byBTS 4 / BSC 2 /MSC 1.
Reporting on Rehomed Data - Grouping ConsiderationsWhen considering grouping and rehoming, only data from previously rehomeditems is carried forward if the focal entity is at, or below, the selected rehominglevel (BTS).
Table 135. Network Situation at 08:00
Report Focal EntityReport Field ofInterest Report Scoping Outcome
BSC BTS MSC In this report the BTSfield is rolled up toBSC level for eachBSC. Grouping byMSC means that foreach BTS, thecontribution made tothat BSC is grouped.Rehomed data is nottaken intoconsideration.
Appendix. Rehoming 291
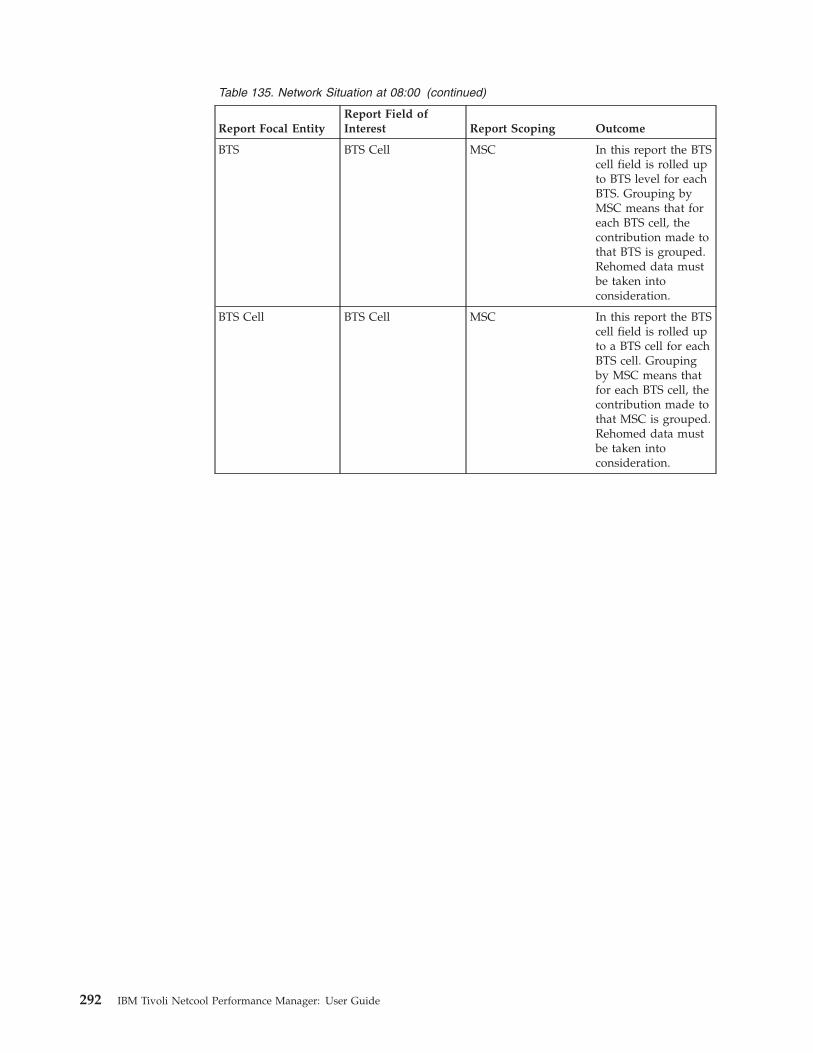
Table 135. Network Situation at 08:00 (continued)
Report Focal EntityReport Field ofInterest Report Scoping Outcome
BTS BTS Cell MSC In this report the BTScell field is rolled upto BTS level for eachBTS. Grouping byMSC means that foreach BTS cell, thecontribution made tothat BTS is grouped.Rehomed data mustbe taken intoconsideration.
BTS Cell BTS Cell MSC In this report the BTScell field is rolled upto a BTS cell for eachBTS cell. Groupingby MSC means thatfor each BTS cell, thecontribution made tothat MSC is grouped.Rehomed data mustbe taken intoconsideration.
292 IBM Tivoli Netcool Performance Manager: User Guide

Notices
This information was developed for products and services that are offered in theUSA.
IBM may not offer the products, services, or features discussed in this document inother countries. Consult your local IBM representative for information on theproducts and services currently available in your area. Any reference to an IBMproduct, program, or service is not intended to state or imply that only that IBMproduct, program, or service may be used. Any functionally equivalent product,program, or service that does not infringe any IBM intellectual property right maybe used instead. However, it is the user's responsibility to evaluate and verify theoperation of any non-IBM product, program, or service.
IBM may have patents or pending patent applications covering subject matterdescribed in this document. The furnishing of this document does not grant youany license to these patents. You can send license inquiries, in writing, to:
IBM Director of LicensingIBM CorporationNorth Castle Drive, MD-NC119Armonk, NY 10504-1785United States of America
For license inquiries regarding double-byte character set (DBCS) information,contact the IBM Intellectual Property Department in your country or sendinquiries, in writing, to:
Intellectual Property LicensingLegal and Intellectual Property LawIBM Japan Ltd.19-21, Nihonbashi-Hakozakicho, Chuo-kuTokyo 103-8510, Japan
The following paragraph does not apply to the United Kingdom or any othercountry where such provisions are inconsistent with local law:INTERNATIONAL BUSINESS MACHINES CORPORATION PROVIDES THISPUBLICATION "AS IS" WITHOUT WARRANTY OF ANY KIND, EITHEREXPRESS OR IMPLIED, INCLUDING, BUT NOT LIMITED TO, THE IMPLIEDWARRANTIES OF NON-INFRINGEMENT, MERCHANTABILITY OR FITNESSFOR A PARTICULAR PURPOSE. Some states do not allow disclaimer of express orimplied warranties in certain transactions, therefore, this statement may not applyto you.
This information could include technical inaccuracies or typographical errors.Changes are periodically made to the information herein; these changes will beincorporated in new editions of the publication. IBM may make improvementsand/or changes in the product(s) and/or the program(s) described in thispublication at any time without notice.
Any references in this information to non-IBM websites are provided forconvenience only and do not in any manner serve as an endorsement of those
© Copyright IBM Corp. 2006, 2015 293

websites. The materials at those websites are not part of the materials for this IBMproduct and use of those websites is at your own risk.
IBM may use or distribute any of the information you supply in any way itbelieves appropriate without incurring any obligation to you.
Licensees of this program who wish to have information about it for the purposeof enabling: (i) the exchange of information between independently createdprograms and other programs (including this one) and (ii) the mutual use of theinformation which has been exchanged, should contact:
IBM CorporationDepartment number/Building numberSite mailing address_City, State; Zip Code_USA (or appropriate country)
Such information may be available, subject to appropriate terms and conditions,including in some cases, payment of a fee.
The licensed program described in this document and all licensed materialavailable for it are provided by IBM under terms of the IBM Customer Agreement,IBM International Program License Agreement or any equivalent agreementbetween us.
Any performance data contained herein was determined in a controlledenvironment. Therefore, the results obtained in other operating environments mayvary significantly. Some measurements may have been made on development-levelsystems and there is no guarantee that these measurements will be the same ongenerally available systems. Furthermore, some measurements may have beenestimated through extrapolation. Actual results may vary. Users of this documentshould verify the applicable data for their specific environment.
Information concerning non-IBM products was obtained from the suppliers ofthose products, their published announcements or other publicly available sources.IBM has not tested those products and cannot confirm the accuracy ofperformance, compatibility or any other claims related to non-IBM products.Questions on the capabilities of non-IBM products should be addressed to thesuppliers of those products.
All statements regarding IBM's future direction or intent are subject to change orwithdrawal without notice, and represent goals and objectives only.
All IBM prices shown are IBM's suggested retail prices, are current and are subjectto change without notice. Dealer prices may vary.
This information is for planning purposes only. The information herein is subject tochange before the products described become available.
This information contains examples of data and reports used in daily businessoperations. To illustrate them as completely as possible, the examples include thenames of individuals, companies, brands, and products. All of these names arefictitious and any similarity to the names and addresses used by an actual businessenterprise is entirely coincidental.
COPYRIGHT LICENSE:
294 IBM Tivoli Netcool Performance Manager: User Guide

This information contains sample application programs in source language, whichillustrate programming techniques on various operating platforms. You may copy,modify, and distribute these sample programs in any form without payment toIBM, for the purposes of developing, using, marketing or distributing applicationprograms conforming to the application programming interface for the operatingplatform for which the sample programs are written. These examples have notbeen thoroughly tested under all conditions. IBM, therefore, cannot guarantee orimply reliability, serviceability, or function of these programs. The sampleprograms are provided "AS IS", without warranty of any kind. IBM shall not beliable for any damages arising out of your use of the sample programs.
Each copy or any portion of these sample programs or any derivative work, mustinclude a copyright notice as follows:
Portions of this code are derived from IBM Corp. Sample Programs.
© Copyright IBM Corp. _enter the year or years_. All rights reserved.
Terms and conditions for product documentationPermissions for the use of these publications are granted subject to the followingterms and conditions.
Applicability
These terms and conditions are in addition to any terms of use for the IBMwebsite.
Personal use
You may reproduce these publications for your personal, noncommercial useprovided that all proprietary notices are preserved. You may not distribute, displayor make derivative work of these publications, or any portion thereof, without theexpress consent of IBM.
Commercial use
You may reproduce, distribute and display these publications solely within yourenterprise provided that all proprietary notices are preserved. You may not makederivative works of these publications, or reproduce, distribute or display thesepublications or any portion thereof outside your enterprise, without the expressconsent of IBM.
Rights
Except as expressly granted in this permission, no other permissions, licenses orrights are granted, either express or implied, to the publications or anyinformation, data, software or other intellectual property contained therein.
IBM reserves the right to withdraw the permissions granted herein whenever, in itsdiscretion, the use of the publications is detrimental to its interest or, asdetermined by IBM, the above instructions are not being properly followed.
You may not download, export or re-export this information except in fullcompliance with all applicable laws and regulations, including all United Statesexport laws and regulations.
Notices 295

IBM MAKES NO GUARANTEE ABOUT THE CONTENT OF THESEPUBLICATIONS. THE PUBLICATIONS ARE PROVIDED "AS-IS" AND WITHOUTWARRANTY OF ANY KIND, EITHER EXPRESSED OR IMPLIED, INCLUDINGBUT NOT LIMITED TO IMPLIED WARRANTIES OF MERCHANTABILITY,NON-INFRINGEMENT, AND FITNESS FOR A PARTICULAR PURPOSE.
TrademarksIBM, the IBM logo, and ibm.com are trademarks or registered trademarks ofInternational Business Machines Corp., registered in many jurisdictions worldwide.Other product and service names might be trademarks of IBM or other companies.A current list of IBM trademarks is available on the web at www.ibm.com/legal/copytrade.shtml.
Adobe, Acrobat, PostScript and all Adobe-based trademarks are either registeredtrademarks or trademarks of Adobe Systems Incorporated in the United States,other countries, or both.
IT Infrastructure Library is a registered trademark of the Central Computer andTelecommunications Agency which is now part of the Office of GovernmentCommerce.
Intel, Intel logo, Intel Inside, Intel Inside logo, Intel Centrino, Intel Centrino logo,Celeron, Intel Xeon, Intel SpeedStep, Itanium, and Pentium are trademarks orregistered trademarks of Intel Corporation or its subsidiaries in the United Statesand other countries.
Linux is a registered trademark of Linus Torvalds in the United States, othercountries, or both
Microsoft and Windows are trademarks of Microsoft Corporation in the UnitedStates, other countries, or both.
ITIL is a registered trademark, and a registered community trademark of TheMinister for the Cabinet Office, and is registered in the U.S. Patent and TrademarkOffice.
UNIX is a registered trademark of The Open Group in the United States and othercountries.
Java and all Java-based trademarks and logos are trademarks orregistered trademarks of Oracle and/or its affiliates.
Cell Broadband Engine is a trademark of Sony Computer Entertainment, Inc. in theUnited States, other countries, or both and is used under license therefrom.
Linear Tape-Open, LTO, the LTO Logo, Ultrium, and the Ultrium logo aretrademarks of HP, IBM Corp. and Quantum in the U.S. and other countries.
296 IBM Tivoli Netcool Performance Manager: User Guide

Glossary
This glossary includes specific terms and definitions for Using Tivoli Netcool Performance Manager - WirelessComponent.
aggregated (rolled-up) data. ranular data that hasbeen aggregated. Granular traffic data can beaggregated at larger units of time or at higher-levels ofthe system hierarchy.
attributes. Attributes describe or further identityindividual network elements (entities). You useattributes to group and display data for your reports.Such as Primary ID, location, name, technology, parent.
busy hour. The hour with the greatest value for anyperformance metric (as represented by a field) for adefined period of time (such as daily or weekly).
daylight saving time rule. A rule that specifies whendaylight saving time begins and ends. Once the TivoliNetcool Performance Manager system administratorassociates a daylight saving time rule with a time zoneregion, the Tivoli Netcool Performance Managersoftware uses the rule to calculate the current time forthe region.
documents. The building blocks for report generation.Documents are used to create, run, schedule, and viewreports.
drill-down totals. Drill-down totals are used to viewtraffic data starting at higher system levels and thenmoving down the system hierarchy levels to view thedata at lower levels (for example: Switch to Cell toAntenna ).
entity type. An entity type represents a type ofnetwork element, such as a cell or antenna. It does notrepresent a specific network element, but rather acategory.
entity. The term entity is the abbreviated form ofentity type.
entity hierarchy. An entity hierarchy shows therelationship between the different entity types. In allhierarchies you have child entities and parent entities.The parent entity is one that is directly above another,and, conversely, the child entity is directly below anentity.
entity instance. Whereas an entity type represents anabstract category, an entity instance is a manifestationof an entity within that category. For example, Cellcould be the entity type, but Cell_1 , Cell_2 , and Cell_3would represent the actual items within the network.
external document. Documents that were createdusing other software than Tivoli Netcool PerformanceManager software and imported into the Browse tab.
field. A field represents any of the following terms:Peg count, Primitive calculation (PCalc), User DefinedCalculation (UDC), Summary, Daily, Weekly, MonthlySBH and Attribute. Aside from Attribute, fieldsrepresent the performance and service measurementsthat you use to analyze parts of your network. Fieldsmay be referred to on other systems using terms suchas metrics, counters, measurements, and networkperformance metrics.
field selections. Options in the Field Selections sectionin the report definition where you select theperformance or service measurements (traffic fields) onwhich you want to measure the performance of yournetwork.
field value. Traffic data contains the actualperformance and service data for a given period.
focal entity type. The focal entity type is the entity inthe entity hierarchy around which the report definitionis built. Generally, the focal entity represents the entitytype on which you want to report. However, this maynot be true for more complex reports, particularlyreports that use customized Group By options.
global object model. The Global Object Model (GOM)is designed to define a base set of vendor-neutralobjects that can be reused across technologies andvendors.
GOM. The Global Object Model (GOM) is designed todefine a base set of vendor-neutral objects that can bereused across technologies and vendors.
granular data. Represents the traffic data that isloaded into the database during regular intervals(generally hourly or sub-hourly).
Group By. Options in the Group By section of thereport definition consist of time and attributecomponents, which when combined, produceaggregated (rolled-up) totals in the report.
higher-level entity. An entity that is above anotherentity in the entity hierarchy is a higher-level entity.
local reports. Reports that are generated by the TivoliNetcool Performance Manager software.
© Copyright IBM Corp. 2006, 2015 297

lower-level entity. An entity that is a beneath anotherentity in the entity hierarchy is a lower-level entity.
nc. Network Configuration (NC) data is data providedby the network that represents one of the networkelements in the database. These are referred to asattributes in the user interface. NC data is stored in thedatabase in NC tables.
network configuration data. Network Configuration(NC) data is data provided by the network thatrepresents one of the network elements in the database.These are referred to as attributes in the user interface.NC data is stored in the database in NC tables.
PCalc. A mathematical expression based on one ormore peg counts, or other PCalc available within theTivoli Netcool Performance Manager system.
peg. Peg count, or peg counter. A raw count of someevent.
permissions. Read and write permissions that affect auser's ability to view, edit, and delete documents andfolders created by other users. Permissions worktogether with privileges. Combined, permissions andprivileges affect the tasks the users can perform usingthe Web client.
personal documents page. Each user has a personaldocuments page in which the user creates documentsand folders. Only the user has full permissions for theitems in this page. Other users cannot view the personaldocuments page of another. This is in contract to thevault page.
Primitive calculation. A mathematical expressionbased on one or more peg counts, or other PCalcavailable within the Tivoli Netcool PerformanceManager system.
privileges. Determines which Web client features ausers is allowed to use. For example, a user may nothave the privilege to open and edit a report definition.Privileges work together with permissions. Combined,permissions and privileges affect the tasks the users canperform using the Web client.
remote server. The server which contains the trafficdata acquired from the network elements.
report results. The output of report definition that hasrun successfully. Also known as report output.
report definition. Ties together all the elementsnecessary to generate a report. At a minimum, itincludes the selection of an entity type, fields(performance measurements), and the days and hoursof the report.
SBH. Stored data for the busiest hour of the day,week, and month based on the designated determiner.The stored busy hour (SBH) data is stored as trafficdata fields in the data base.
stored busy hour. Stored data for the busiest hour ofthe day, week, and month based on the designateddeterminer. The stored busy hour (SBH) data is storedas traffic data fields in the data base.
stored summary. A stored summary is traffic dataaggregated for a day, week, or month and stored in thedatabase as a traffic field.
summary. A stored summary is traffic data aggregatedfor a day, week, or month and stored in the database asa traffic field.
system hierarchy. An entity hierarchy shows therelationship between the different entity types. In allhierarchies you have child entities and parent entities.The parent entity is one that is directly above another,and, conversely, the child entity is directly below anentity.
tech pack. A technology pack is an applicationpackage designed for use with Tivoli NetcoolPerformance Manager. A technology pack providestechnology-related performance management functions.An example is Global System for MobileCommunications (GSM). A technology pack is deployedon the core application platform. A technology packcan be configured to to present wireless datainformation specific to vendors and technology.
technology pack. A technology pack is an applicationpackage designed for use with Tivoli NetcoolPerformance Manager. A technology pack providestechnology-related performance management functions.An example is Global System for MobileCommunications (GSM). A technology pack is deployedon the core application platform. A technology packcan be configured to to present wireless datainformation specific to vendors and technology.
time zone region. A specific area or city that shares acommon time throughout. For example, a region can beAmerica/Denver, where the time zone is eitherMountain Standard Time or Mountain Daylight time.America/Phoenix is a different region, because Arizonadoes not follow Daylight Saving Time. The definition ofa time zone region specifies the region, the offset time(+/-) to GMT in minutes, and the related DaylightSaving Time rule.
traffic data. Traffic data contains the actualperformance and service data for a given period.
traffic fields. Traffic fields represent the performanceand service measurements that you use to analyzeparts of your network.
298 IBM Tivoli Netcool Performance Manager: User Guide

UDC. User-Defined Calculations (UDCs) areperformance measurements that you create. This is incontrast to the other performance measurements thatare created at the time of system setup and not subjectto modification.
vault page. The vault page consists of the documentsand folders that have published with the intent of
sharing. Published items have assigned permissions,which affects which activities users can perform. This isin contrast to The personal documents page. For moreinformation.
Web client. The Web interface used by users to createand generate reports, and to view report results.
Glossary 299

300 IBM Tivoli Netcool Performance Manager: User Guide


����
Printed in USA