ijnddijndd.net/jul-sep2013/2. research article_ijndd jul-sep 2013_130-141... · kotta kranthi kumar...
TRANSCRIPT

Indian Journal of Novel Drug delivery 5(3), Jul-Sep, 2013, 130-141
130
Indian Journal of Novel Drug DeliveryIJNDDAn Official Publication of Karnataka Education and
Scientific Society
Research Article
Formulation and Evaluation of Atorvastatin Calcium Immediate Release Tablets-20 mg, USPKOTTA KRANTHI KUMAR*1, B.SUMA PADMAJA1, T.SRIKRISHNA2
1 Department of Pharmaceutics, S.K.U College of Pharmaceutical sciences S.K.University, Anantapur2 Narayana Pharmacy College, Nellore
A R T I C L E D E T A I L S A B S T R A C T
Article history:Received on 11 July 2013Modified on 02 September 2013Accepted on 10 September 2013
Immediate release tablets are also tool for expanding markets, extending product life cycles and generating opportunities. The main aim of present research work was formulation development, optimization and in vitro evaluation of Atorvastatin calcium immediate release tablets. Preformulation studies and drug excipients compatibility studies were done initially and the results obtained direct the way and method of formulation. All the mentioned batches were done by wet granulation method. Tablets were evaluated for weight variation, thickness, hardness, friability, disintegration and dissolution. In vitro dissolutions were performed in dissolution media and the drug release in 0.05M phosphate buffer of pH 6.8 as medium revealed that the most successful formulation of the study and F9 exhibited satisfactory in-vitro drug release and (F1) and (F2) values were calculated. Dissolution profile of F9 was matched perfectly with marketed (innovator) formulation and F2 value was found to be excellent. Scale up of optimized formulation was done. The kinetic treatment showed that the optimized formulation follow first order kinetics and have good stability as per ICH guidelines.
© KESS All rights reserved
Keywords:Atorvastatin, Lactose,Croscarmellose sodium.
INTRODUCTIONOral Solid Dosage Forms - A Convenient Drug Delivery SystemThe conventional oral drug delivery has been known for decades is the most widely utilized route of administration among all the routes. It remains the preferred route of administration in the discovery and development of new drug candidates and formulation. The popularity of oral route is attributed to patient acceptance, ease of administration [1,2] , accurate dosing, cost effective manufacturing methods, and generally improve shelf life of the product. In fact the development of a pharmaceutical product for oral drug delivery, irrespective of its physical form (solid, semisolid, or liquid dosage form) involves varying contents of optimization of dosage form characteristics within the inherent constraints of gastrointestinal physiology' Oral solid dosage forms such as tablets and capsules has been formulated and developed nowadays since they are most effective routes of administration of a new drug.
*Author for Correspondence:Email: [email protected]
Pharmaceutical products designed for oral delivery and currently available on the prescription and over the counter markets are mostly the immediate release type, which are designed for immediate release of drug for rapid absorption. Many new generations of pharmaceutical products called controlled release and sustained release drug delivery system have been developed. Although these new systems are in fast progression, for many drugs and therapeutic indications, conventional oral solid immediate release drug delivery systems provided satisfactory clinical performance with an appropriate balance of efficacy and safety. The major drawbacks in developing a controlled release and sustained release drug delivery systems are outlined as given below.
Drawbacks in Controlled Release and Sustained Re lease Drug Delivery System Decreased systemic availability when
compared with immediate release conventional dosage forms due to incomplete release [3]
Increased first pass metabolism, increased instability,

Kotta Kranthi Kumar et al / Indian Journal of Novel Drug Delivery 5(3), Jul-Sep, 2013, 130-141
131
Insufficient residence time for complete release, Site-specific absorption and pH- dependant
solubility.
Oral Solid Dosage Forms as Generic Product DevelopmentOral solid dosage forms such as tablets or capsules can be developed into an immediate release or modified release generic product. A generic drug product, is also referred as a multisource Pharmaceutical product, is essentially identical to the brand name drug product in terms of active ingredient, strength, dosage form, route of administration, quality, safety, efficacy, performance characteristics, and therapeutic identification [4]. The development of a single dosage oral tablet requires six key decisions and they are listed below. Reference listed drug (RLD or innovator drug) Active material Non-active ingredients Container- closure system Comparative dissolution procedure Bioequivalence to the RLD
Immediate Release Oral Solid Dosage FormsImmediate release solid oral dosage forms are formulations of tablets, capsules that are designed to disintegrate and release the drug in absence of any controlling features such as coatings or other formulation techniques. Immediate release dosage forms have gained popularity and acceptance as drug delivery system, mainly because they are easy to administer has quick onset of action, economical and lead to better patient compliance. They are also tool for expanding markets, extending product life cycles and generating opportunities[5].
Tablets Compressed tablets are defined as solid-unit dosage forms made by compaction of the formulation containing the drug and certain fillers or excipients selected to aid in the processing and properties of the drug product.
Advantages of tablets They provide an accurately measured dose
and low content variability of the unit dose. They are of low manufacturing cost. They are easy to package and ship. They are simple to identify. Manufacturing processes and techniques
provide tablets certain special release products such as enteric and delayed release products [6].
The aim of present study is to design a robust and stable formulation of high quality and to demonstrate its pharmaceutical equivalence and bio equivalence to the reference product and evaluate Atorvastatin calcium (generic version) with respect to reference sample for getting market approval in European countries.
MATERIALSAll the materials are listed in Table 1 and 2.
Table 1: List of Raw Materials
Sl. No.
Name of the Raw material
Rationale
1 Atorvastatin Calcium API
2 Lactose Monohydrate Diluent
3 Microcrystalline Cellulose Diluent
4 Calcium Carbonate Buffering Agent
5 Polysorbate 80 Solubilizing Agent
6 Acrycoat L 100 D Coating Agent
7 Croscarmellose Sodium Super Disintegrant
8 Hydroxypropyl cellulose Binder
9 Microcrystalline Cellulose Diluent
10 Magnesium Stearate Lubricant
Table 2: List of Equipments
Name of the equipments Model and Manufacturer
Electronic balance Essae DS-852
Electromagnetic sieve shaker
Electro lab, Mumbai
Moisture Analyzer Matter Toledo HG 63
Tap Density Tester USP Electro lab, Mumbai
Tabletting Machine-27Stn Rimek,karnavathi Ahmedabad
Digital Vernier Callipers Mitutoyo, Japan
Hardness Tester Pharmag tester
Disintegration Test Apparatus
USP Electro lab(ED-2AL)
Friabilator USP Electro Lab
Rapid mixer granulator Sacral engineering(RMG5-15)
Tray dryer Millennium equipment Pvt. Ltd(METD-6G)
Mechanical Stirrer Vision labs, Mumbai
Auto coater Neocota,Mumbai
Dissolution Apparatus Agilent technologies, USA
HPLC with Auto sampler Agilent technologies, USA
pH meter Metro HM , Switzerland
Octagonal blender Electrolab
UV-Visible double beam spectrophotometer
Shimadzu corporation, Japan
Fourier Transform InfraredSpectrophotometer
Perkin -Elmer ,Japan

Kotta Kranthi Kumar et al / Indian Journal of Novel Drug Delivery 5(3), Jul-Sep, 2013, 130-141
132
METHODSDrug- Excipient Compatibility StudyIn the Tablet dosage form the drug is in intimate contact with one or more excipients, the later could affect the stability of the drug. Thus, knowledge of drug-excipient interactions is very useful to the formulator in selecting appropriateexcipients. This information may already be in existence for known drugs. For the new drugs or new excipients, the Preformulation scientistmust generate the needed information.
Compatibility studies conducted to investigate and predict Physico chemical interaction between drug substance and excipients and therefore to select suitability of chemically compatible excipients. Compatibility studies were performed by preparing compatibility blends at different ratios of different excipients with drug based on tentative average weight. These blends were stored at accelerated conditions at 40 °C, 75% RH for one month. The control samples were stored at 40 °C. The ratio of drug andexcipient varies from 11 to 110 depending on the purpose of use and samples were kept in double lined poly bags .the samples were evaluated for any change in physical characteristics. Samples were evaluated for any change in physical characteristics with reference to controlled sample stored at 4oc for 7, 14and 30 days. Taken out at one week interval and were subjected to physical and chemical testing and results were noted. Chemical compatibility is tested by FTIR spectrometry, which is most powerful technique to identify functional groups of the drug. In the present study potassium bromide disc (pellet) method was employed(Table 3).
Preparation of Atorvastatin Calcium Tablets1. SiftingAtorvastatin Calcium and Calcium carbonate were co-sifted through # 40 sieve and mixed thoroughly in a poly bag. Lactose Monohydrate, Microcrystalline Cellulose (Accel- 101), Polysorbate 80, Acrycoat L 100 D and Croscarmellose Sodium passed through #40 sieves and collected in poly bag.
2. GranulationDry MixingTransferred the sifted material from step-1 into the RMG and mixed for 15 minutes by setting Impeller at slow rpm and chopper set to “off”.
Binder solution preparationBinder solution was prepared by dissolving Hydroxypropyl cellulose in purified water.
Wet granulationStep-2b binder solution was added slowly to the step-2a dry mix by setting Impeller at slow rpm and chopper set to “off”.
Wet ScreeningAfter completion of addition of binder solution, wet granulate was raked and kneaded till to get wet granulate with desired consistency is reached.
DryingUnloaded the wet granulate into Fluid Bed Drier bowl. And Dried the wet granulate in fluid bed dryer at an inlet temperature of 65° - 70°C till the desired LOD of 2.0 –3.0 %w/w was achieved.
Dry screeningSifted the dried granules through # 20 sieves and collected the oversized granules separately. Milled the oversized granules using 2.5 mm screen at medium speed with knives forward and passed through # 20 sieves.
3. Pre Blending and Final BlendingSiftingPolysorbate 80, Croscarmellose Sodium and Microcrystalline Cellulose (Accel -102) was sifted through # 40 sieve and geometrically mixed in a polybag and collected in a polybag.
Pre BlendingLoad the dried, sized granules in to the Octagonal blender and Blended for 20 minutes.
LubricationMagnesium stearate was sifted through # 60 sieves, added to the step-3b blend and mixed for 5 min.
4. CompressionGranules prepared from above process are subjected for Tablet making. Tablets were compressed using compression machine with lubricated blend, employing appropriate punch tooling. Collect the compressed Tablets in double poly lined bag and proceeded for coating. The compressed tablet parameters are given in Table 4.
5. Tablet CoatingPreparation of coating suspensionTake weighed quantity of Purified water in S.S. vessel and heat the water. Add & dissolve weighed batch quantity of Opadry color sample into the above solution depending upon the tablet strength under stirring to avoid any lump formation.

Kotta Kranthi Kumar et al / Indian Journal of Novel Drug Delivery 5(3), Jul-Sep, 2013, 130-141
133
Table 3: Drug and Excipients Ratio for Compatibility Studies
Ingredients Ratio Initial Colour
After one week
After two weeks
After one month
40 0C 75%RH
40 0C 75%RH
40 0C 75%RH
Atorvastatin calcium+Lactosemonohydrate
1:10 White oralmostwhitecrystallinepowder
Whitepowder
WhitePowder
Whitepowder
Atorvastatin calcium+MCC 1:10 WhitePowder
WhitePowder
WhitePowder
Atorvastatin calcium+Calcium Carbonate
1:10 WhitePowder
Whitepowder
Whitepowder
Atorvastatin calcium+HPC 1:10 WhitePowder
Whitepowder
Whitepowder
Atorvastatincalcium+Croscarmellosesodium
1:10 WhitePowder
Whitepowder
Whitepowder
Atorvastatincalcium+Polysorbate 80
1:10 WhitePowder
Whitepowder
Whitepowder
Atorvastatin calcium sodium+ starch glycolate
1:10 WhitePowder
WhitePowder
Whitepowder
Atorvastatincalcium+Acrycoat L100 D
1:10 Whitepowder
Whitepowder
Whitepowder
Atorvastatincalcium+Crospovidone
1:10 Whitepowder
Whitepowder
Whitepowder
Atorvastatin calcium+opadrywhite13B58802
1:10 Whitepowder
Whitepowder
Whitepowder
Table 5: Different Formulations of Atovastatin Calciumtablets
Ingredients F1 F2 F3 F4 F5 F6 F7 F8 F9 F10 F11
Atorvastatin calcium
21.72 21.72 21.68 20.68 21.68 21.64 20.68 20.68 21.72 21.72 21.72
Lactose monohydrate
113.03 113.03 120.07 125.07 143.07 116.11 90.57 108.03 106.03 106.03 106.03
Microcrystalline Cellulose
87.5 87.5 30 30 - 30 55 37.5 37.5 37.5 37.5
Calcium Carbonate
20 20 20 20 25 21 21 21 21 21 21
Polysorbate 80 - - - - - 1.5 1.5 1.5 1.5 1.5 1.5
Acrycoat L100D - - - - - 2 2 2 2 2 2
Croscarmellose Sodium
5.5. 5.5. 5.5 8 8 - - - 8 8 8
BINDER SOLUTION
Hydroxypropyl cellulose
3.75 3.75 3.75 3.75 3.75 3.75 3.75 3.75 3.75 3.75 3.75
Purified Waters Qs Qs Qs Qs Qs Qs Qs Qs Qs Qs Qs
EXTRA GRANULAR PART
Sepitrap 80 1.5 1.5 2 2 1.5 - 1.5 1.5 1.5 1.5 1.5
Croscarmellose Sodium
5 5 5 8 5 - - 12 5 5 5
Crospovidone - - - - - - 12 - - - -
Sodium starch glycolate
- - - - - 12 - - - - -
Microcrystalline Cellulose
- - 50 38 50 50 50 50 50 50 50
Magnesium Stearate
2 2 2 2 2 2 2 2 2 2 2
Total weight 260 260 260 260 260 260 260 260 260 265 265

Kotta Kranthi Kumar et al / Indian Journal of Novel Drug Delivery 5(3), Jul-Sep, 2013, 130-141
134
Complete the addition within 5-10 min under stirring. Continue stirring for 45 minutes, and filter the solution through 100 meshes. Different formulations were prepared. Complete coating until the average weight gain is 2%of uncoated Table average weight. Prepared tablets quantities are listed in Table 5.
Table 4: Compression Parameters
Parameters Standards
Lower punch 8.73×8.5 mm triangular
Standard concave plain
Upper punch 8.73×8.5 mm triangular
Standard concave plain
Dies 8.73×8.5 mm triangular
Evaluation ParametersThicknessThe thickness of the tablet s was determined by using Digital Vernier calipers. Ten individualtablets from each batch were used and the results averaged. The results were expressed in mm.
Weight variationTwenty tablet s were randomly selected from each batch and individually weighed. The average weight and standard deviation were calculated. The test for weight variation is passed only if not more than two of the individual tablet weights deviate from the average weight by more than the allowed percentage deviation and none deviate by more than twice the percentage shown.
Table 6: Weight Variation Requirements as Per USP
Average weight % Difference
130 mg or less 10
More than 130 mg through 324mg 7.5
More than 324mg 5
FriabilityThe friability values of the tablets were determined using a Roche friabilator. It is expressed in %. 20 tablets were initially weighed (initial weight) and transferred to friabilator. Friabilator Was operated at 25 rpm for 4 min. Percentage friability was calculated using the following Equation.
%Friability =Initial wt - Final wt
× 100Initial wt
Disintegration TestSix tablets were taken randomly from each batch and placed in USP disintegration apparatus baskets, which is repeatedly immersed 30 times per minute into a thermostatically controlled fluid at 37°C and observed over the time described in the individual monograph. To fully satisfy the test the tablets disintegrate completely into a soft mass having no palpably firm core.
DissolutionThe dissolution studies of the prepared tablets were carried using Electro lab apparatus II. Dissolution was performed in 900 ml phosphate buffer of pH 6.8at 37 ±0.5°C at 100 rpm. An auto sampler, coupled to the dissolution apparatus was programmed to withdraw and replace 10 ml of the dissolution media at 0, 5, 10, 15, and 30 min.
Dissolution parametersMedium: Phosphate buffer pH 6.8Volume: 900 mlApparatus: Dissolution apparatus type 11 of USP (paddle)Rotation speed: 75 rpmTemperature: 37 ±0.5°CTime: 30 min.
Drug Release Kinetics (Dependent Model Method) The mathematical models are used to evaluate the kinetics and mechanism of drug release from the tablets. The model that best fits the release data is selected based on the correlation coefficient (r) value in various models. The model that gives high r value is considered as the best fit of the release data.
Mathematical models are1) Zero order release model2) First order release model3) Hixson-crowell release model4) Higuchi release model5) Korsmeyer – peppas release model
To analyze the mechanism of the drug release rate kinetics of the dosage form, the data were plotted as:
Zero order release rate kineticsTo study the Zero order release kinetics the release rate data were fitted to the following equation.
F = K tWhere,’F� is the fraction of drug release,K is the release rate constant, andt is the release time.

Kotta Kranthi Kumar et al / Indian Journal of Novel Drug Delivery 5(3), Jul-Sep, 2013, 130-141
135
When the data is plotted as Cumulative percent drug released versus time, if the plot is linear then the data obeys Zero order release kinetics, with slope equal to K.
First order kineticsA First order release would be predicated by the following equation.
Log C = Log Co – K t2.303
Where, C = Amount of drug remained at time tCo = initial amount of drugK = First order rate constant (hr-1)
When the data is plotted as Cumulative percent drug remaining versus time yields a straight line, indicating that the release follows First order kinetics .The constant K can be obtained by multiplying 2.303 with slope values.
Hixson - Crowell Release EquationThe Hixson - Crowell release equation is
3 √Q0 - 3√Q t = K HC∙ tWhereQ0 = Initial amount of drugQt = Cumulative amount of drug release at time “t”KHC = Hixson Crowell release constantt = Time in hours.
It describes the drug releases by dissolution and with the changes in surface area and diameter of the particles or tablets A linear plot of the cube root of the initial concentration minus the cube root of percent remaining versus time in hours for the dissolution data in accordance with the Hixsoncrowell equation
Higuchi release modelTo study the Higuchi release kinetics, the release rate data were fitted to the following equation.
F = K t½
Where, F is the amount of drug releaseK is the release rate constant, andt is the release time.
When the data is plotted as Cumulative drug released Versus Square root of time, yields a straight line, indicating that the drug was released by diffusion mechanism. The slope is equal to K.
Korsmeyer and peppas release modelThe release rate data were fitted to the following equation.
Mt / M∞ = K. t n
Where, Mt / M∞ is the fraction of the drug release,K is the release rate constant,t is the release time, andn is the diffusional exponent for the drug release that is dependent on the shape of the matrix dosage form.
When the data is plotted as Log of drug released versus log time, yields a straight line with a slope equal to „n� and the K can be obtained from Y-intercept.
Independent Model Method (Data Analysis)Similarity Factor (F2)As the name specifies, it stresses on the comparison of closeness of two comparative formulations. Generally similarity factor in the range of 50-100 is acceptable according to US FDA. It can be computated using the formula:
f2= 50×log {[1+ (1/n) Σ t=1n (Rt-Tt) 2] -0.5 ×100}
Where, n is the number of dissolution sample times,Rt and Tt are the individual or mean percent dissolved at each time point, t, for the reference and test dissolution profiles, respectively.
The similarity factor should be between 0 and 100. It is 100 when two comparative groups of reference and test are identical and approaches 0 as the dissimilarity increases.
Difference Factor (F1)Difference factor focuses on the difference in percent dissolved between reference and test at various time intervals. It can be mathematically computed by using:
f1= {[Σ t=1n |Rt-Tt|] / [Σ t=1n Rt]} ×100
Therefore the factors directly compare the difference between percent drug dissolved per unit time for a test and a reference product.
Similarity factor of 50-100 ensures sameness of two products. Difference factor of 0-15 ensures minor difference between two products.
Prior to in vivo study, comparison of in vitrodissolution profiles using similarity and difference factors may be the promising surrogate.

Kotta Kranthi Kumar et al / Indian Journal of Novel Drug Delivery 5(3), Jul-Sep, 2013, 130-141
136
Table 7: Mechanism of Drug Release
Diffusion exponent (n) Overall solute diffusion mechanism
0.45 Fickian diffusion
0.45 < n < 0.89 Anomalous diffusion
0.89 Case-II transport
n > 0.89 Super case-II transport
Stability StudiesThe design of the formal stability studies for the drug product was based on the knowledge of the behavior and properties of the drug substance and formal stability studies on the drug substance. Specification which is list of tests, reference to the analytical procedures and proposed acceptance criteria, including the concept of different acceptable criteria for release and shelf life specifications, is addressed in ICH. The selected batch was kept at 40°C with 75% RH and the samples were withdrawn at 30, 60 and 90 days for physical and in vitroevaluation of drug release. Standard methods are reported in Table 8.
Table 8: Storage Conditions in Stability Studies
Study Storage condition
Minimum time period covered
by data at submission
Long term 25 ± 2 °C/ 60 ± 5% RH
90 days
Intermediate 30 ± 2 °C/ 60 ± 5% RH
60 days
Accelerated 40 ± 2 °C/ 75 ± 5% RH
30 days
When significant change occurs at any time during 3 months testing at the accelerated storage condition, additional testing at the intermediate storage condition should be conducted and evaluated against significant change criteria.
In general significant change for a drug product is defined as: A 5% change in assay from its initial value or
failure to meet the acceptance criteria for when using biological or immunological procedures. Any degradation products exceeding its
acceptance criterion. Failure to meet the acceptance criterion for
appearance, physical attributes, and functionality test. e.g. hardness, dose delivery per actuation; however some changes in
physical attributes may be accepted under accelerated condition and as appropriate for the dosage form. Failure to meet the acceptance criterion for
pH or Failure to meet the acceptance criterion for
dissolution for 12 dosage units.
RESULTSCompatibility StudiesIt was determined as per procedure given in experimental session. The following table illustrates results in Table 9.
Chemical Compatibility StudiesChemical compatibility is tested by FTIR spectrometry, which is most powerful technique to identify functional groups of the drug. In the present study potassium bromide disc (pellet) method was employed. Results are reported in Table 9 and plotted in Fig. 1.
Figure 1: FT-IR Spectrum of Atorvastatin Calcium
FT-IR SPECTRUM of Atorvastatin calcium pure drug and combination with excipients were concordant. So, polymers were found to be compatible with the drug.
Evaluation of Post Compression ParametersFormulations trials F1, F5, F6, did not achieve required hardness, whereas trials F-9, F10, F11 showed required hardness, friability, thickness. Trial (F9) is taken as optimized formulation batch, since all the parameters are found to be within limits when compared with the innovator. Large scale up of this trial (F-9) was done in two batches (F10) and (F11) and these batches were film coated. All the parameters were found to be satisfactory & listed in Table 10.
Dissolution Profiles of Atorvastatin IR Tablets Trial BatchesWe selected F-9 as best formulation as it showed total drug release in 15 min than all other formulations when compared to reference product as well as greater drug release at all other tested time points when compared with innovator. All the values are listed in Table 11.

Kotta Kranthi Kumar et al / Indian Journal of Novel Drug Delivery 5(3), Jul-Sep, 2013, 130-141
137
Table 9: Results of Drug- Excipient Compatibility Studies
Ingredients Ratio Initial Colour
After one week
After two weeks
After one month
40 0C 75%RH
40 0C 75%RH
40 0C 75%RH
Atorvastatin calcium+Lactosemonohydrate
1:10 White oralmostwhitecrystallinepowder
NC NC Compatible
Atorvastatin calcium+MCC 1:10 NC NC Compatible
Atorvastatin calcium+Calcium Carbonate
1:10 NC NC Compatible
Atorvastatin calcium+HPC 1:10 NC NC Compatible
Atorvastatin calcium+Croscarmellosesodium
1:10 NC NC Compatible
Atorvastatincalcium+Polysorbate 80
1:10 NC NC Compatible
Atorvastatin calcium sodium+ starch glycolate
1:10 NC NC Compatible
Atorvastatincalcium+Acrycoat L100 D
1:10 NC NC Compatible
Atorvastatin calcium+Crospovidone 1:10 NC NC Compatible
Atorvastatin calcium+opadry white13B58802
1:10 NC NC Compatible
NC- No change
Table 10: Evaluation of Post Compression Parameters
S.No Batches Average
Weight (mg)
(±SD)
Thickness
(mm)
Hardness
(Kg/cm2)
Friability
(%)
Disintegration
Time (min)
Assay
(%)
1 F1 263.75±1.44 5.51±0.01 13.02±0.02 0.23±0.05 4.10 98.1
2 F2 260.70±1.38 4.54±0.06 8.12±0.05 0.21±0.06 2.50 99.5
3 F3 260.60±1.35 4.12±0.03 8.23±0.01 0.20±0.05 4.45 98
4 F4 262.50±1.43 4.35±0.09 8.13±0.03 0.17±0.04 3.50 99
5 F5 261.80.±1.43 6.42±0.02 12±0.06 0.19±0.03 3.30 98.2
6 F6 262.70±1.49 4.58±0.08 12.4±0.08 0.20±0.08 2.80 98.5
7 F7 263.55±1.39 4.31±0.19 9.2±0.01 0.23±0.05 2.70 98.7
8 F8 262.90±1.41 4.47±0.11 8.5±0.02 0.21±0.06 2.44 99.9
9 F9 260.75±1.44 4.49±0.14 8.3±0.04 0.20±0.05 2.15 101.8
10 F10 265.80±1.43 4.67±0.17 8.2±0.01 0.17±0.04 2.24 99.4
11 F11 265.32±1.43 4.64±0.15 8.1±0.02 0.19±0.03 2.34 99.8
12 Innovator 304 mg 6.4 11.2 < 1% 2.56 102.2All the values are expressed as mean ± S.D; No. of trails (n) =6
Table 11: Dissolution Profiles of Atorvastatin IR Tablets Trial Batches
Time(min)
Innovator F1 F2 F3 F4 F5 F6 F7 F8 F9 F10 F11
0 0 0 0 0 0 0 0 0 0 0 0 0
5 96.9 90.2 89.2 92.2 90.7 90.1 89.7 90.1 95.2 97.4 96.2 96.6
10 98.8 92.1 92.2s 95.3 93.1 94.4 94.3 94.7 96.1 99.1 98.9 99.2
15 100.1 94.8 93.5 96.8 96.0 95.7 96.5 95.1 99.8 101.3 99.5 99.7
30 101.5 95.9 95.7 97.1 96.4 96 98.8 98.9 99.9 102.7 101.4 101.9

Kotta Kranthi Kumar et al / Indian Journal of Novel Drug Delivery 5(3), Jul-Sep, 2013, 130-141
138
Figure 2: Dissolution profiles of F1-11 with innovator
Figure 3: Dissolution Profile of Optimised Batch (F-9)
Figure 4: Comparative Dissolution Profiles of Optimized Batch (F-9) With Innovator

Kotta Kranthi Kumar et al / Indian Journal of Novel Drug Delivery 5(3), Jul-Sep, 2013, 130-141
139
Table 12: Similarity and Difference Factors
N INNOVATOR
(Rt)
F-9
(Tt)
D=(Rt-Tt) (Rt-Tt)2 f 1 f 2
0 0 0 0 0
1.1.5 84.2910 96.9 97.4 -8.7 75.69
15 98.8 91.3 -4.8 23.04
20 100.1 101.3 -2 4
30 101.5 102.7 -0.7 0.49
Table 13: Stability Studies of Optimised Formulation F-9
Sl.No Assay Conditions
Initial 40c & 75% RH
0 Day 1month 2 month 3month
1 F-9 101.8 101.8 100.6 100.4
2 INNOVATOR 102.2 102.2 101.4 100.8
Table 14: Dissolution Profile of Optimized Batch and Innovator
Time (min) Innovator Initial 1st month 2st month 3st month
0 0 0 0 0 0
5 96.9 97.4 94.8 93.5 93.2
10 98.8 91.3 97.9 96.4 96.2
15 100.1 101.3 99 98.8 98.6
30 101.5 102.7 99.7 99.4 99
Figure 5: Dissolution Profile of Optimized Batch and Innovator
Kotta Kranthi Kumar et al / Indian Journal of Novel Drug Delivery 5(3), Jul-Sep, 2013, 130-141
140
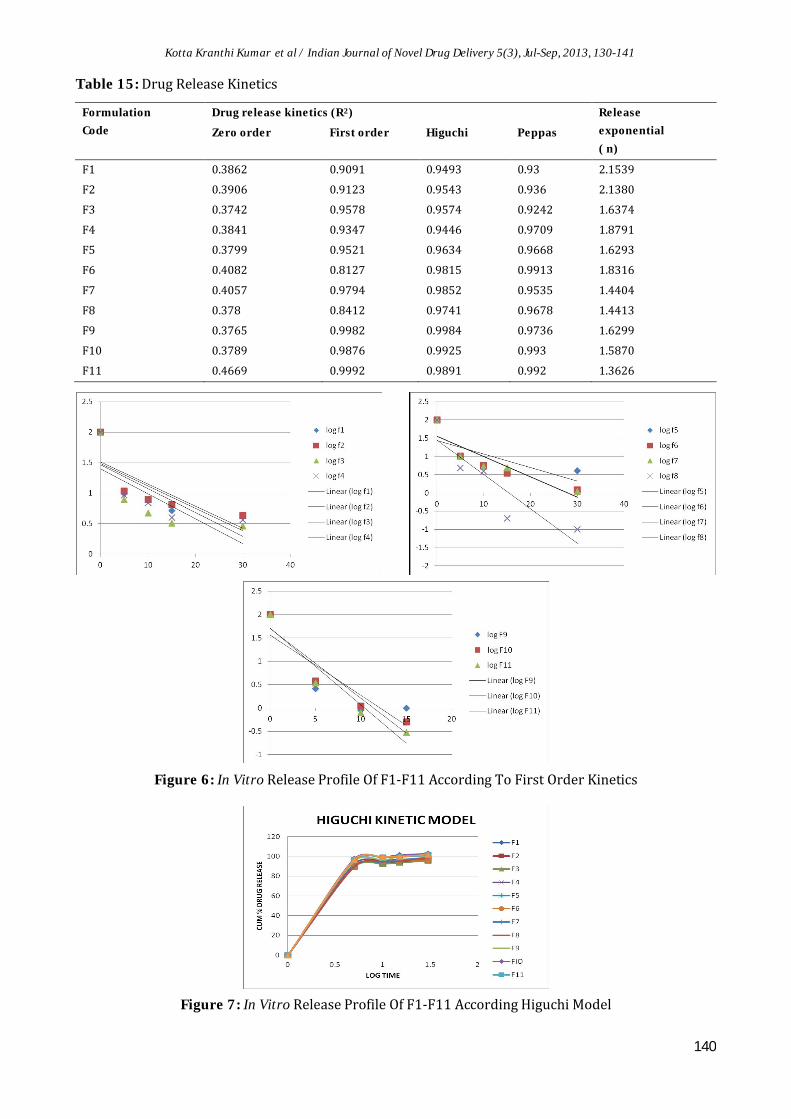
Table 15: Drug Release Kinetics
Formulation
Code
Drug release kinetics (R2) Release
exponential
( n)Zero order First order Higuchi Peppas
F1 0.3862 0.9091 0.9493 0.93 2.1539
F2 0.3906 0.9123 0.9543 0.936 2.1380
F3 0.3742 0.9578 0.9574 0.9242 1.6374
F4 0.3841 0.9347 0.9446 0.9709 1.8791
F5 0.3799 0.9521 0.9634 0.9668 1.6293
F6 0.4082 0.8127 0.9815 0.9913 1.8316
F7 0.4057 0.9794 0.9852 0.9535 1.4404
F8 0.378 0.8412 0.9741 0.9678 1.4413
F9 0.3765 0.9982 0.9984 0.9736 1.6299
F10 0.3789 0.9876 0.9925 0.993 1.5870
F11 0.4669 0.9992 0.9891 0.992 1.3626
Figure 6: In Vitro Release Profile Of F1-F11 According To First Order Kinetics
Figure 7: In Vitro Release Profile Of F1-F11 According Higuchi Model

Kotta Kranthi Kumar et al / Indian Journal of Novel Drug Delivery 5(3), Jul-Sep, 2013, 130-141
141
Figure 8: In Vitro Release Profile Of F1-F11 According Peppas Model
Independent Model Method (Data Analysis)The results of similarity and difference factorsare listed in Table 12.
Stability StudiesDuring the stability studied there is no sigficance changes observed. All the results are listed in Table 13 & 14.
Drug Release KineticsDrug release kinetics data obtained from above models will reveal that the optimized batch (F-9) follows first order kinetics. All the results are listed in Table 15.
CONCLUSIONSFrom the above experimental results it can be concluded that immediate release tablets of Atorvastatin calcium can be prepared by using different proportion & combination of Excipients and we selected F9 as best formulation based on dissolution profile and physical characteristics. Formulation (F9) showed total drug release in 30 min and showed fair flow properties when compared to other formulations. The formulations F9, followed first order kinetics. Finally I conclude the optimized batch (F-9) having more drug release than the innovator.
REFERENCES [1] Brahmanker and Sunil B Jaiswl,
Biopharmaceutics and pharmacokinetics a treatise, 2002, 337.
[2] Leon Shargel, Izzykanfer, Generic Drug Product Development So l id Or a l Dosage Forms, published online in Wiley InterScience, 2010, PP 1-16.
[3] Block JD and Belle D, Handbook of Pharmaceutical Generic Development, 1, P 1-52.
[4] Leon Lachmann, Herbert A Liebermann, Joseph L Kanic, The Theory and Practice of Industrial Pharmacy, Third edition, 293-294 and 325-329.
[5] P.K. Sahoo. Pharmaceutical technology, Delhi Institute of Pharmaceutical Sciences and research. New Delhi: Page no 1-3.
[6] James Swarbrick, Encyclopedia of Pharmaceutical Technololgy, Volume 2, 3rdedition, Informa healthcare, 2007: pp 1242, 1248, 3707-3709.